Correlation between microstructure and electrical conductivity in composite electrolytes containing...
10
Available online at www.sciencedirect.com Journal of the European Ceramic Society 31 (2011) 559–568 Correlation between microstructure and electrical conductivity in composite electrolytes containing Gd-doped ceria and Gd-doped barium cerate MudrikaKhandelwal, A. Venkatasubramanian, T.R.S. Prasanna, P. Gopalan ∗ Department of Metallurgical Engineering and Materials Science, Indian Institute of Technology Bombay, Powai, Mumbai 400 076, India Received 10 December 2009; received in revised form 14 October 2010; accepted 27 October 2010 Available online 8 December 2010 Abstract Composite electrolytes with nominal compositions, Ce 0.8 Gd 0.2 O 1.9 + xBaO (x = 0.2 and 0.3), have been synthesized through the citrate route. Formation of two phases, namely Gd-doped ceria and Gd-doped barium cerate, has been confirmed through XRD and SEM studies. The impedance spectra show three distinct semi-circles, all originating from the composite electrolytes. In the temperature range 175–350 ◦ C, the activation energies for the conductivity values extracted from the high frequency and intermediate frequency parts of the impedance spectra remains the same, irrespective of compositional and micro-structural variation. On the other hand, the activation energies for the conductivity values associated with the low frequency impedance spectra show a significant change with micro-structural variation. Solid oxide fuel cells constructed using these composite electrolytes exhibit a higher open circuit voltage compared to those based on single phase 20 mol% Gd-doped ceria. © 2010 Elsevier Ltd. All rights reserved. Keywords: Composite; Ceria; Impedance spectroscopy; Electrical conductivity; Fuel cell 1. Introduction Solid oxide fuel cells (SOFC) hold a clean, efficient and promising solution for the ever-increasing demands for energy. The electrolyte is one of the key components, which decide the performance of a SOFC. Currently, commercially available SOFCs, using yttria-stabilized zirconia (YSZ) as an electrolyte, have to operate around 1000 ◦ C to meet the required per- formance characteristics. This is essentially because the total conductivity of YSZ based electrolyte reaches the required value 0.1 S cm −1 , only at this temperature. 1 But, such a high operat- ing temperature causes reactions between various components of a SOFC and, thus, limits the choice of materials for the other components. Hence, lowering the operating temperature would widen the range of materials useful in various components of a SOFC. In addition, the lower operating temperatures would also facilitate a faster start up and shut down of a SOFC system. The doped-ceria based electrolytes are noteworthy candi- dates for reducing the operating temperature, as they exhibit the required conductivity 0.1 S cm −1 at 800 ◦ C. 2 Introduction ∗ Corresponding author. Tel.: +91 22 25767635; fax: +91 22 25722545. E-mail address: [email protected] (P. Gopalan). of aliovalent cations, like Gd +3 , into the host lattice of CeO 2 increases the concentration of oxygen vacancies (as shown by Eq. (1)) and results in improved conductivity. Gd 2 O 3 → 2Gd Ce + V •• o + 3O x o (1) However, Gd-doped ceria, under reducing conditions at anode, invoke leakage current in the form of electronic conduc- tivity, and thus diminish the cell output in terms of open circuit voltage (OCV). 3 Another class of electrolytes based on doped-barium cer- ate exhibits proton and oxygen ion conductivity, depending on atmosphere and temperature. 4 Introduction of trivalent dopants like Gd +3 into barium cerate (BaCeO 3 ) results in the formation of oxygen vacancies, subsequently these vacancies react with H 2 O (moisture) present in ambient air to form defects capable of proton conduction, in addition to the oxygen ion conductivity, as described below in Eqs. (2) and (3). 2Ce x Ce + O x o + Gd 2 O 3 → 2Gd Ce + V •• o + 2CeO 2 (2) H 2 O + V •• o + O x o ↔ 2OH • o (3) Moreover, BaCeO 3 based materials are resistant to the elec- tronic leakage conduction. 5 Thus, if a composite electrolyte is made from the combination of doped-ceria and doped-barium 0955-2219/$ – see front matter © 2010 Elsevier Ltd. All rights reserved. doi:10.1016/j.jeurceramsoc.2010.10.027
Transcript of Correlation between microstructure and electrical conductivity in composite electrolytes containing...

A
CFseswc©
K
1
pTtShfc0iocwSf
dt
0d
Available online at www.sciencedirect.com
Journal of the European Ceramic Society 31 (2011) 559–568
Correlation between microstructure and electrical conductivity in compositeelectrolytes containing Gd-doped ceria and Gd-doped barium cerate
Mudrika Khandelwal, A. Venkatasubramanian, T.R.S. Prasanna, P. Gopalan ∗Department of Metallurgical Engineering and Materials Science, Indian Institute of Technology Bombay, Powai, Mumbai 400 076, India
Received 10 December 2009; received in revised form 14 October 2010; accepted 27 October 2010Available online 8 December 2010
bstract
omposite electrolytes with nominal compositions, Ce0.8Gd0.2O1.9 + xBaO (x = 0.2 and 0.3), have been synthesized through the citrate route.ormation of two phases, namely Gd-doped ceria and Gd-doped barium cerate, has been confirmed through XRD and SEM studies. The impedancepectra show three distinct semi-circles, all originating from the composite electrolytes. In the temperature range 175–350 ◦C, the activationnergies for the conductivity values extracted from the high frequency and intermediate frequency parts of the impedance spectra remains the
ame, irrespective of compositional and micro-structural variation. On the other hand, the activation energies for the conductivity values associatedith the low frequency impedance spectra show a significant change with micro-structural variation. Solid oxide fuel cells constructed using theseomposite electrolytes exhibit a higher open circuit voltage compared to those based on single phase 20 mol% Gd-doped ceria.2010 Elsevier Ltd. All rights reserved.
; Fuel
oiE
G
atv
aaloHo
eywords: Composite; Ceria; Impedance spectroscopy; Electrical conductivity
. Introduction
Solid oxide fuel cells (SOFC) hold a clean, efficient andromising solution for the ever-increasing demands for energy.he electrolyte is one of the key components, which decide
he performance of a SOFC. Currently, commercially availableOFCs, using yttria-stabilized zirconia (YSZ) as an electrolyte,ave to operate around 1000 ◦C to meet the required per-ormance characteristics. This is essentially because the totalonductivity of YSZ based electrolyte reaches the required value.1 S cm−1, only at this temperature.1 But, such a high operat-ng temperature causes reactions between various componentsf a SOFC and, thus, limits the choice of materials for the otheromponents. Hence, lowering the operating temperature wouldiden the range of materials useful in various components of aOFC. In addition, the lower operating temperatures would alsoacilitate a faster start up and shut down of a SOFC system.
The doped-ceria based electrolytes are noteworthy candi-ates for reducing the operating temperature, as they exhibithe required conductivity 0.1 S cm−1 at 800 ◦C.2 Introduction
∗ Corresponding author. Tel.: +91 22 25767635; fax: +91 22 25722545.E-mail address: [email protected] (P. Gopalan).
a
2
H
tm
955-2219/$ – see front matter © 2010 Elsevier Ltd. All rights reserved.oi:10.1016/j.jeurceramsoc.2010.10.027
cell
f aliovalent cations, like Gd+3, into the host lattice of CeO2ncreases the concentration of oxygen vacancies (as shown byq. (1)) and results in improved conductivity.
d2O3 → 2Gd′Ce + V
••o + 3Ox
o (1)
However, Gd-doped ceria, under reducing conditions atnode, invoke leakage current in the form of electronic conduc-ivity, and thus diminish the cell output in terms of open circuitoltage (OCV).3
Another class of electrolytes based on doped-barium cer-te exhibits proton and oxygen ion conductivity, depending ontmosphere and temperature.4 Introduction of trivalent dopantsike Gd+3 into barium cerate (BaCeO3) results in the formationf oxygen vacancies, subsequently these vacancies react with2O (moisture) present in ambient air to form defects capablef proton conduction, in addition to the oxygen ion conductivity,s described below in Eqs. (2) and (3).
CexCe + Ox
o + Gd2O3 → 2Gd′Ce + V
••o + 2CeO2 (2)
•• x •
2O + Vo + Oo ↔ 2OHo (3)Moreover, BaCeO3 based materials are resistant to the elec-ronic leakage conduction.5 Thus, if a composite electrolyte is
ade from the combination of doped-ceria and doped-barium
5 ropea
carOchbhCeob
eiptcsboYisscpptbab
archlhTstsa
2
2
c7cwaA9
s(adCtwoacabazap
2
mwBaBC1BmoS
2
iKrtcfws
2
aewpHa
60 M. Khandelwal et al. / Journal of the Eu
erate, it is expected that the doped-barium cerate phase canct as a blocking phase to the leakage current generated by theeduction of the doped-ceria phase. This should increase theCV of the fuel cell as compared to those employing doped-
eria based electrolyte. Furthermore, these composites wouldave the advantage of additional proton conductivity displayedy the doped-barium cerate phase. Hirabayashi et al.6 obtainedigher OCV by growing a layer of BaCexSm(1−x)O3−δ one0.8Sm0.2O1.9 than Ce0.8Sm0.2O1.9 alone as an electrolyte. Zhut al.7 have also reported improvement in OCV for a compositef BaCe0.8Y0.2O2.9 and Ce0.8Sm0.2O1.9 over only doped-ceriaased electrolyte.
Understanding the correlation between microstructure andlectrical behavior of composites of doped ceria and doped bar-um cerate is important from, both, fundamental and applicationoint of view. The impedance spectroscopy has been widely usedo characterize the electrical behavior of single phase doped-eria as well as doped-barium cerate systems.8–11 Impedancepectroscopy has been helpful to separate the grain and grainoundary impedance contributions to the total impedancef the electrolyte. The electrical behavior of YSZ/Al2O3,SZ/MgO, YSZ/Y2O3 and Ce0.8Gd0.2O2−δ/Al2O3 compos-
tes, as electrolyte, has been studied in detail using impedancepectroscopy.12–15 Moreover, the analysis of the impedancepectra can give meaningful insights into many aspects of theomposite conductivity like percolation threshold of the secondhase and blocking effect produced by the lower conductinghase.12,13,16 To our knowledge, no detailed impedance spec-roscopy studies have been done to understand the correlationetween microstructure and electrical behavior of doped ceriand doped barium cerate composite systems; an attempt has thuseen made in the current work.
Composites of Gd-doped ceria and Gd-doped barium cer-te have been synthesized through the citrate (modified Pechini)oute as reported in the literature.17,18 The advantages of this wethemical route over conventional solid state synthesis methodsave been reported in terms of lower calcination temperatures,ower activation energy for the grain boundary conductivity andigher total conductivity obtained for wet chemical route.19,20
he variation in microstructure has been obtained by varying theintering temperature. The effect of these different microstruc-ures on the electrical properties of the composite has beentudied by impedance spectroscopy. The utility of these sampless an electrolyte for a SOFC has also been evaluated.
. Experimental details
.1. Powder preparation
Composites of Gd-doped ceria (CG) and Gd-doped bariumerate (BCG) with nominal molar ratio of 8:2 (B20CG) and:3 (B30CG), along with the compounds 20 mol% Gd-dopederia (CG20) and 15 mol% Gd-doped barium cerate (BCG15),
ere synthesized through the citrate process. Barium carbon-te (BaCO3, 99.99%, Alpha Aesar), gadolinia (Gd2O3, 99.99%,lpha Aesar), cerium nitrate hexahydrate (Ce(NO3)3·6H2O,9% Aldrich) were used as the starting material for the synthe-
stip
n Ceramic Society 31 (2011) 559–568
is. Citric acid (CA) (C6H8O7, Merck, 99%) and ethylene glycolEG) (C2H6O2, Merck, 99%) were used as a chelating agentnd reaction medium, respectively. The Gd2O3 was dissolved inilute nitric acid to obtain a clear solution with constant stirring.e(NO3)3·6H2O and BaCO3 (except for CG20) were added to
he solution subsequently. The molar ratio of EG/CA/metal ionas fixed as 20:5:1.17 The resulting solution was dried in anven at 80 ◦C to promote gelation. The gel obtained was heatedt 300 ◦C for 4 h to obtain polymeric precursor. The CG20 pre-ursor was calcined at 600 ◦C for 2 h, while others were calcinedt 1100 ◦C for 4 h to obtain the required phases. Powders wereall milled in polyethylene terephthalate containers with ethyllcohol for 48 h to reduce the particle size. The yttria stabilizedirconia balls were used as a grinding medium. The particle sizenalysis was performed on Galai CIS-I and sodium pyrophos-hate was used as a dispersant.
.2. Pellet fabrication
Pellets of thickness ranging between 1.1 and 2.6 mm wereade by uni-axial compression in a steel die of diameter 10 mmith a pressure of 100 MPa. The pellets fabricated from CG20,CG15, B20CG and B30CG were sintered at 1550 ◦C for 10 h onn alumina plate, referred now on as CG201550, BCG151550,20CG1550 and B30CG1550, respectively. Pellets from theG20, BCG15 and B20CG were also sintered at 1450 ◦C for0 h and would be identified as CG201450, BCG151450 and20CG1450 in the further discussion. The heating rate wasaintained at 2 ◦C min−1 in the process of sintering. The surface
f the pellet in contact with the alumina plate was polished withiC paper (600 grit) to remove any reaction products.
.3. Phase analysis
X-ray diffraction (XRD) studies were carried out on powdersn a PANanalytical PW3040/60 X’pert PRO diffractometer (Cu
�). A scanning rate of 10−3 degree s−1 was employed. Reitveldefinement of the XRD data was done using software (BRASS)o estimate the composition and the unit cell volume of theomponent phases in the composite samples.21 The parametersor CeO2 (fluorite Fm3m) and BaCeO3 (orthorhombic Pmcn)ere used as the starting structural models for refinement in the
oftware.22,23
.4. Microstructural analysis
The pellets were polished with an emery paper, diamond pastend colloidal silica for scanning electron microscopy (SEM) andnergy dispersive spectroscopy (EDS) studies. Thermal etchingas done at a temperature 100 ◦C lower than the sintering tem-erature of each pellet for 2 h. The SEM was performed on aitachi S3400N. The SEM images of all the composites were
nalyzed to find out the grain size distribution using Olysia m3
oftware (Olympus Corporation, Tokyo, Japan).24 The backscat-ered images, from SEM, were processed using the software tomprove the contrast for grain size analysis. For selecting thehases, manual as well automatic selection method was adopted.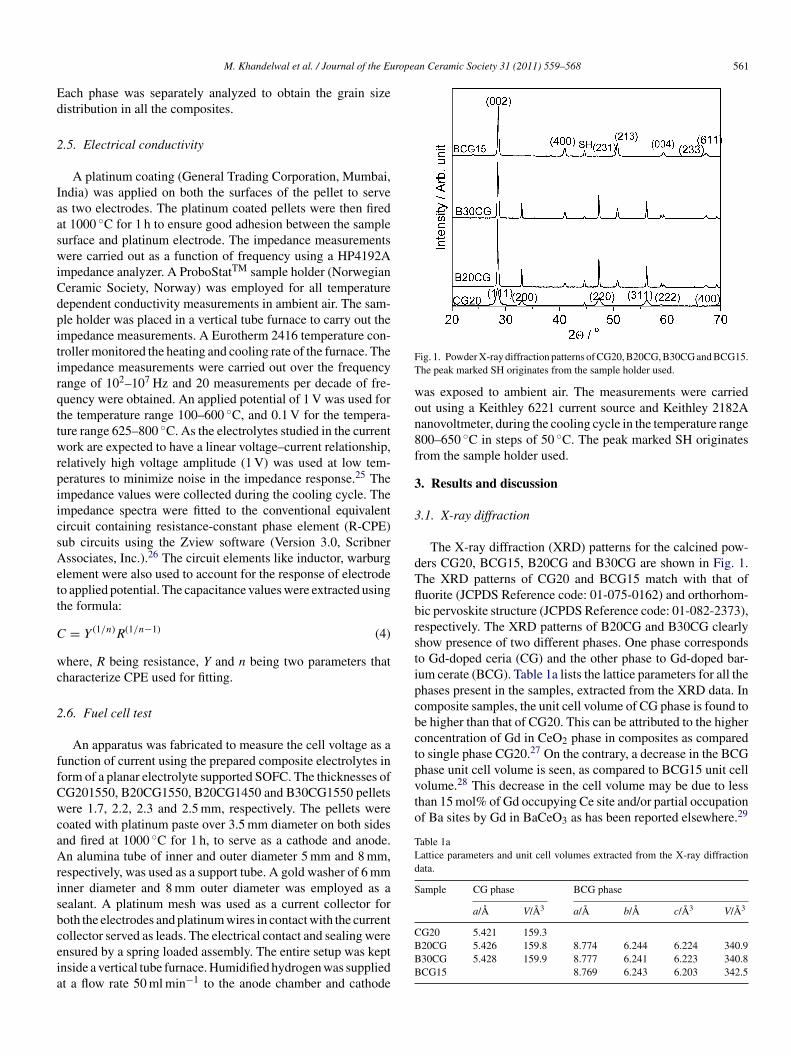
ropean Ceramic Society 31 (2011) 559–568 561
Ed
2
IaaswiCdpitirqttwrpiicsAett
C
wc
2
ffCwcaArisbceia
FT
won8f
3
3
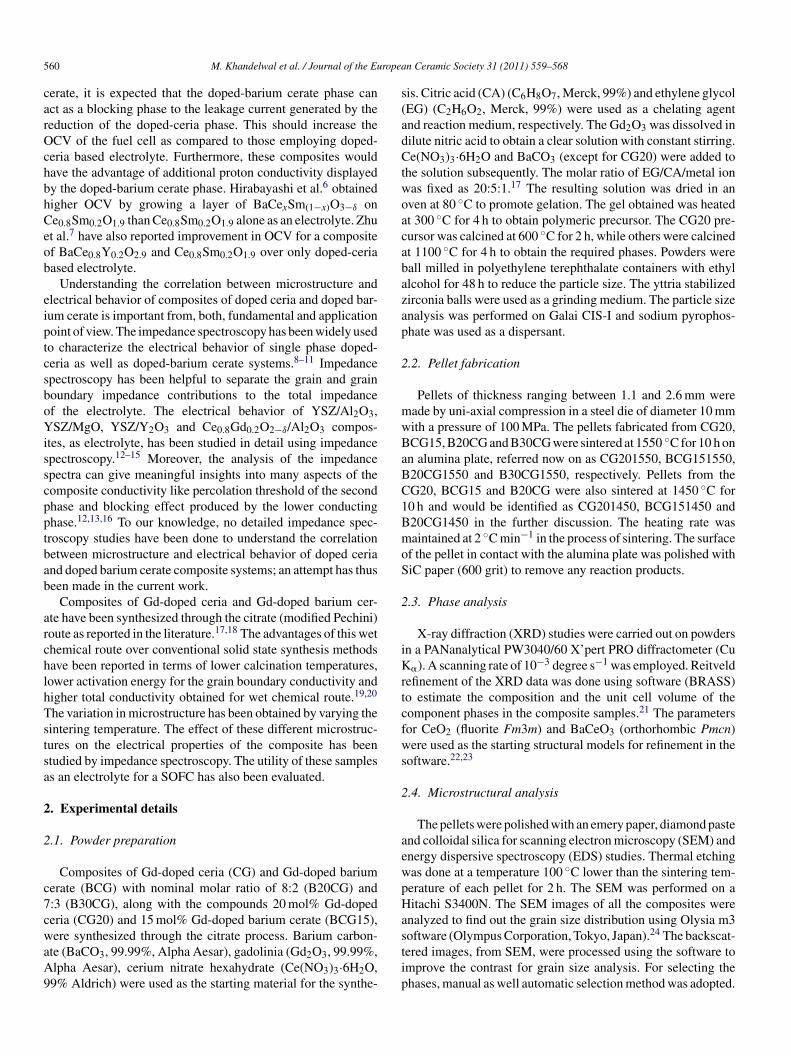
dTflbrstipcbctphase unit cell volume is seen, as compared to BCG15 unit cellvolume.28 This decrease in the cell volume may be due to lessthan 15 mol% of Gd occupying Ce site and/or partial occupationof Ba sites by Gd in BaCeO3 as has been reported elsewhere.29
Table 1aLattice parameters and unit cell volumes extracted from the X-ray diffractiondata.
Sample CG phase BCG phase
a/A V/A3 a/A b/A c/A3 V/A3
M. Khandelwal et al. / Journal of the Eu
ach phase was separately analyzed to obtain the grain sizeistribution in all the composites.
.5. Electrical conductivity
A platinum coating (General Trading Corporation, Mumbai,ndia) was applied on both the surfaces of the pellet to serves two electrodes. The platinum coated pellets were then firedt 1000 ◦C for 1 h to ensure good adhesion between the sampleurface and platinum electrode. The impedance measurementsere carried out as a function of frequency using a HP4192A
mpedance analyzer. A ProboStatTM sample holder (Norwegianeramic Society, Norway) was employed for all temperatureependent conductivity measurements in ambient air. The sam-le holder was placed in a vertical tube furnace to carry out thempedance measurements. A Eurotherm 2416 temperature con-roller monitored the heating and cooling rate of the furnace. Thempedance measurements were carried out over the frequencyange of 102–107 Hz and 20 measurements per decade of fre-uency were obtained. An applied potential of 1 V was used forhe temperature range 100–600 ◦C, and 0.1 V for the tempera-ure range 625–800 ◦C. As the electrolytes studied in the currentork are expected to have a linear voltage–current relationship,
elatively high voltage amplitude (1 V) was used at low tem-eratures to minimize noise in the impedance response.25 Thempedance values were collected during the cooling cycle. Thempedance spectra were fitted to the conventional equivalentircuit containing resistance-constant phase element (R-CPE)ub circuits using the Zview software (Version 3.0, Scribnerssociates, Inc.).26 The circuit elements like inductor, warburg
lement were also used to account for the response of electrodeo applied potential. The capacitance values were extracted usinghe formula:
= Y (1/n)R(1/n−1) (4)
here, R being resistance, Y and n being two parameters thatharacterize CPE used for fitting.
.6. Fuel cell test
An apparatus was fabricated to measure the cell voltage as aunction of current using the prepared composite electrolytes inorm of a planar electrolyte supported SOFC. The thicknesses ofG201550, B20CG1550, B20CG1450 and B30CG1550 pelletsere 1.7, 2.2, 2.3 and 2.5 mm, respectively. The pellets were
oated with platinum paste over 3.5 mm diameter on both sidesnd fired at 1000 ◦C for 1 h, to serve as a cathode and anode.n alumina tube of inner and outer diameter 5 mm and 8 mm,
espectively, was used as a support tube. A gold washer of 6 mmnner diameter and 8 mm outer diameter was employed as aealant. A platinum mesh was used as a current collector foroth the electrodes and platinum wires in contact with the current
ollector served as leads. The electrical contact and sealing werensured by a spring loaded assembly. The entire setup was keptnside a vertical tube furnace. Humidified hydrogen was suppliedt a flow rate 50 ml min−1 to the anode chamber and cathodeCBBB
ig. 1. Powder X-ray diffraction patterns of CG20, B20CG, B30CG and BCG15.he peak marked SH originates from the sample holder used.
as exposed to ambient air. The measurements were carriedut using a Keithley 6221 current source and Keithley 2182Aanovoltmeter, during the cooling cycle in the temperature range00–650 ◦C in steps of 50 ◦C. The peak marked SH originatesrom the sample holder used.
. Results and discussion
.1. X-ray diffraction
The X-ray diffraction (XRD) patterns for the calcined pow-ers CG20, BCG15, B20CG and B30CG are shown in Fig. 1.he XRD patterns of CG20 and BCG15 match with that ofuorite (JCPDS Reference code: 01-075-0162) and orthorhom-ic pervoskite structure (JCPDS Reference code: 01-082-2373),espectively. The XRD patterns of B20CG and B30CG clearlyhow presence of two different phases. One phase correspondso Gd-doped ceria (CG) and the other phase to Gd-doped bar-um cerate (BCG). Table 1a lists the lattice parameters for all thehases present in the samples, extracted from the XRD data. Inomposite samples, the unit cell volume of CG phase is found toe higher than that of CG20. This can be attributed to the higheroncentration of Gd in CeO2 phase in composites as comparedo single phase CG20.27 On the contrary, a decrease in the BCG
G20 5.421 159.320CG 5.426 159.8 8.774 6.244 6.224 340.930CG 5.428 159.9 8.777 6.241 6.223 340.8CG15 8.769 6.243 6.203 342.5
562 M. Khandelwal et al. / Journal of the European Ceramic Society 31 (2011) 559–568
Fig. 2. Back scattered electron images of sintered surfaces of (a) CG201450, (b) CG201550, (c) BCG151450, (d) BCG151550, (e) B20CG1450, (f) B20CG1550a
3
m
c
nd (g) B30CG1450.
.2. Particle size analysis
The powders of the two composites were analyzed to obtainean particle size before and after ball milling. The mean parti-
tmp
le size of B20CG decreased from 1.6 �m to 0.75 �m whereas
hat for B30CG decreased from 1.3 �m to 0.8 �m after ballilling. However, ball milling did not have much effect on thearticles of CG20.

ropean Ceramic Society 31 (2011) 559–568 563
3
CgaCitoB(BtitsHCt
froppttbmX
isig0BaiCg1tsiam3msi
cttI
Table 1bVolume fractions for the composite samples.
Nominal mol fraction/mol% Volume fraction/vol.%
CG phase BCG phase CG phasea BCG phaseb
B20CG1450 80 20 65 35B20CG1550 80 20 65 35B30CG1550 70 30 52 48
a Density of CG phase used in the calculation is 7.24 g cm−3, taken fromJ
J
pvoTfsuipt
3
cdaf(iBaTttc8votHcpms4utoa
M. Khandelwal et al. / Journal of the Eu
.3. SEM
The back scattered electron (BSE) images of CG201450 andG201550 are shown in Fig. 2(a) and (b), respectively. The meanrain sizes of CG201450 and CG201550 are 5.03(±1.74) �mnd 11.29(±4.49) �m, respectively. The mean grain sizes ofG20 exhibit a slightly more than 2-times increase, on increas-
ng the sintering temperature from 1450 ◦C to 1550 ◦C. Thisrend is consistent with the temperature dependent grain sizebtained for CG20 by Christie et al.8 The BSE images ofCG151450 and BCG151550 are shown in Fig. 2(c) and
d), respectively. The mean grain sizes of BCG151450 andCG151550 are 6.77(±1.80) �m and 13.02(±3.28) �m, respec-
ively. The mean grain size of BCG15 shows nearly 2-timesncrease, on increasing the sintering temperature from 1450 ◦Co 1550 ◦C. This observation is consistent with the grain growtheen with the increasing sintering temperature for BCG15 byaile et al.10 Furthermore, large mean grain size of samplesG201550 and BCG151550 implies relatively small contribu-
ion from the grain boundaries towards the total impedance.Fig. 2(e)–(g) shows BSE images of the composite samples
or B20CG1450, B20CG1550 and B30CG1550. These imageseveal no porosities, thus avoiding any possible effect of thesen the impedance response of the samples. The two contrastinghases are distinctly visible in each image. The elemental dis-ersive spectrum (EDS) indicated presence of Gd, Ce, O, Ba inhe dark phase and Gd, Ce, O in the bright phase. This confirmshat the dark phase corresponds to the BCG phase, while theright phase is the CG phase. This observation of a two-phaseicrostructure is consistent with the two phase prediction byRD.The BSE images of B20CG1450 and B20CG1550 are shown
n Fig. 2(e) and (f), respectively. A general increase in the grainize of each of BCG and CG phases has been observed with anncrease in the sintering temperature of the samples. The meanrain sizes of CG phase in B20CG1450 and B20CG1550 are.85(±0.4) �m and 0.95(±0.8) �m respectively, while that ofCG phase in B20CG1450 and B20CG1550 are 1.25(±0.6) �mnd 4.3(±2.0) �m, respectively. Thus, on increasing the sinter-ng temperature from 1450 ◦C to 1550 ◦C, the mean grain size ofG phase experiences a very small increase, whereas the meanrain size of BCG phase at 1550 ◦C is almost 3-times that of at450 ◦C. The indicates that, with increase in sintering tempera-ure, the grain growth of BCG phase in composite resembles theingle phase BCG15, whereas that of CG phase does not; thiss likely to be due to the pinning of CG grains by the presencend simultaneous growth of BCG grain.15,16 In B30CG1550, theean grain size of CG and BCG phase are 1.23(±1.02) �m and
.79(±1.46) �m, respectively (Fig. 2(g)). Thus, increasing theole fraction of BCG phase from 20% to 30% in the composite
ystem did not show a significant change in the grain size ofndividual phases.
The microstructures of composites do not show per-
olation clearly (Fig. 2(e)–(g)). However, percolation inhree-dimensional network can be predicted using volume frac-ion, particle size and grain size of the secondary phase present.n all composites, neither of the phases shows abnormally largeiige
CPDS Reference code: 01-075-0162.b Density of BCG phase used in the calculation is 6.36 g cm−3, taken from
CPDS Reference code: 01-082-2373.
article size (Section 3.2) and grain size distribution. Hence, theolume fraction plays a crucial role in deciding the percolationf BCG phase. The volume fractions of composites are listed inable 1b. According to the symmetric Bruggeman model usedor analyzing random composite mixtures, percolation of theecond phase starts around 33 vol.%.16 In the present study, vol-me fraction of BCG exceeds this percolation limit. Hence, its likely that the composites have three-dimensional percolatingathways of BCG phase. However, this is to be verified usinghe conductivity data in the following section.
.4. Conductivity measurements
Given the composite nature of the electrolyte, three semi-ircles are seen in the impedance spectra, whose visibilityepends on the temperature and limitations of the impedancenalyzer. These semi-circles can be identified in terms of theirrequency range as high frequency (HF), intermediate frequencyIF) and low frequency (LF) semi-circle. Fig. 3(a) shows thempedance spectra of CG201550, BCG151550, B20CG1450,20CG1550, and B30CG1550 at 200 ◦C in air and Fig. 3(b) isn enlarged version of the high frequency region of Fig. 3(a).he two overlapping depressed semi circles are visible for all
he composites, unlike the single phase systems. The capaci-ance values extracted from the HF semi-circle at 200 ◦C for theomposites B20CG1550, B20CG1450 and B30CG1550 are 8,, and 6 pF cm−1, respectively. Such an order of the capacitancealues from the HF semi-circle of the composites, are indicativef the grain response.8,10 Considering the composite nature ofhese samples, both the CG and BCG grain can influence theF semi-circle. However, in this temperature range, the grain
onductivity of the BCG phase is significantly higher than CGhase while their permittivity values are of the same order ofagnitude.10,30 The capacitance values extracted from the IF
emi-circle for B20CG1550, B20CG1450, and B30CG1550 are1, 57, and 117 pF cm−1, respectively. These capacitance val-es are an order of magnitude higher than those associated withhe grains of the BCG and CG phase. In addition, these valuesf capacitance are also an order of magnitude lower than thosettributed to the grain boundaries.8,10,11,30,31 Also, the capac-
tance associated with these IF semi-circle decreases with anncrease in the sintering temperature, which is in contrast to therain boundary response of the single phase systems.8,10 Thisliminates the possibility of origin of the IF semi-circle from the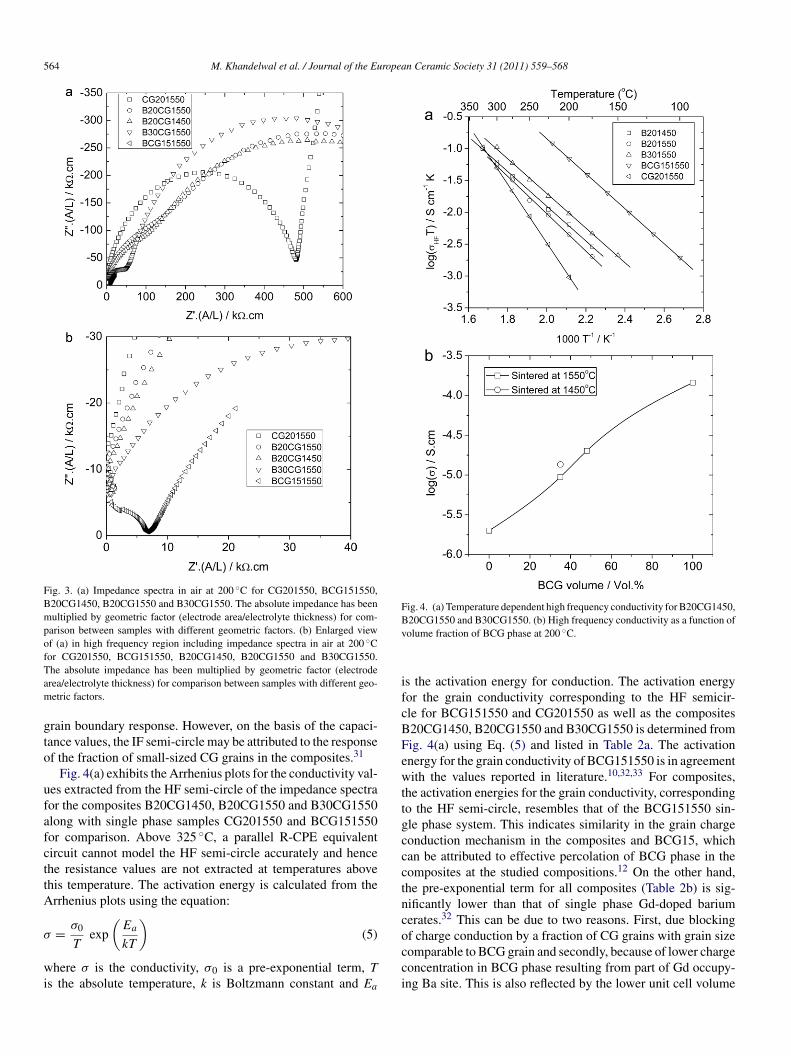
564 M. Khandelwal et al. / Journal of the European Ceramic Society 31 (2011) 559–568
Fig. 3. (a) Impedance spectra in air at 200 ◦C for CG201550, BCG151550,B20CG1450, B20CG1550 and B30CG1550. The absolute impedance has beenmultiplied by geometric factor (electrode area/electrolyte thickness) for com-parison between samples with different geometric factors. (b) Enlarged viewof (a) in high frequency region including impedance spectra in air at 200 ◦Cfor CG201550, BCG151550, B20CG1450, B20CG1550 and B30CG1550.Tam
gto
ufafcttA
σ
wi
Fig. 4. (a) Temperature dependent high frequency conductivity for B20CG1450,Bv
ifcBFewttgccctnc
he absolute impedance has been multiplied by geometric factor (electroderea/electrolyte thickness) for comparison between samples with different geo-etric factors.
rain boundary response. However, on the basis of the capaci-ance values, the IF semi-circle may be attributed to the responsef the fraction of small-sized CG grains in the composites.31
Fig. 4(a) exhibits the Arrhenius plots for the conductivity val-es extracted from the HF semi-circle of the impedance spectraor the composites B20CG1450, B20CG1550 and B30CG1550long with single phase samples CG201550 and BCG151550or comparison. Above 325 ◦C, a parallel R-CPE equivalentircuit cannot model the HF semi-circle accurately and hencehe resistance values are not extracted at temperatures abovehis temperature. The activation energy is calculated from therrhenius plots using the equation:
σ(
E)
= 0
Texp a
kT(5)
here σ is the conductivity, σ0 is a pre-exponential term, Ts the absolute temperature, k is Boltzmann constant and Ea
occi
20CG1550 and B30CG1550. (b) High frequency conductivity as a function ofolume fraction of BCG phase at 200 ◦C.
s the activation energy for conduction. The activation energyor the grain conductivity corresponding to the HF semicir-le for BCG151550 and CG201550 as well as the composites20CG1450, B20CG1550 and B30CG1550 is determined fromig. 4(a) using Eq. (5) and listed in Table 2a. The activationnergy for the grain conductivity of BCG151550 is in agreementith the values reported in literature.10,32,33 For composites,
he activation energies for the grain conductivity, correspondingo the HF semi-circle, resembles that of the BCG151550 sin-le phase system. This indicates similarity in the grain chargeonduction mechanism in the composites and BCG15, whichan be attributed to effective percolation of BCG phase in theomposites at the studied compositions.12 On the other hand,he pre-exponential term for all composites (Table 2b) is sig-ificantly lower than that of single phase Gd-doped bariumerates.32 This can be due to two reasons. First, due blocking
f charge conduction by a fraction of CG grains with grain sizeomparable to BCG grain and secondly, because of lower chargeoncentration in BCG phase resulting from part of Gd occupy-ng Ba site. This is also reflected by the lower unit cell volume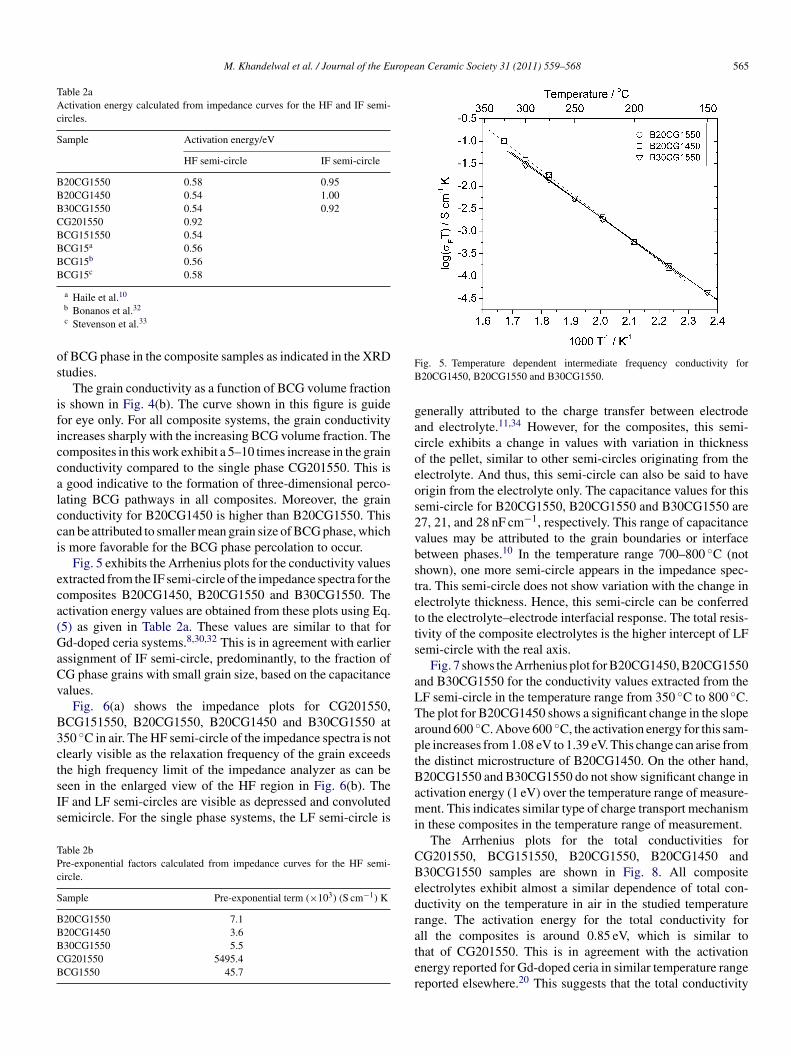
M. Khandelwal et al. / Journal of the European Ceramic Society 31 (2011) 559–568 565
Table 2aActivation energy calculated from impedance curves for the HF and IF semi-circles.
Sample Activation energy/eV
HF semi-circle IF semi-circle
B20CG1550 0.58 0.95B20CG1450 0.54 1.00B30CG1550 0.54 0.92CG201550 0.92BCG151550 0.54BCG15a 0.56BCG15b 0.56BCG15c 0.58
os
ificcalcci
eca(GaCv
B3ctsIs
TPc
S
BBBCB
FB
gacoeos2vbstetts
aLTapt
a Haile et al.10
b Bonanos et al.32
c Stevenson et al.33
f BCG phase in the composite samples as indicated in the XRDtudies.
The grain conductivity as a function of BCG volume fractions shown in Fig. 4(b). The curve shown in this figure is guideor eye only. For all composite systems, the grain conductivityncreases sharply with the increasing BCG volume fraction. Theomposites in this work exhibit a 5–10 times increase in the grainonductivity compared to the single phase CG201550. This isgood indicative to the formation of three-dimensional perco-
ating BCG pathways in all composites. Moreover, the grainonductivity for B20CG1450 is higher than B20CG1550. Thisan be attributed to smaller mean grain size of BCG phase, whichs more favorable for the BCG phase percolation to occur.
Fig. 5 exhibits the Arrhenius plots for the conductivity valuesxtracted from the IF semi-circle of the impedance spectra for theomposites B20CG1450, B20CG1550 and B30CG1550. Thectivation energy values are obtained from these plots using Eq.5) as given in Table 2a. These values are similar to that ford-doped ceria systems.8,30,32 This is in agreement with earlier
ssignment of IF semi-circle, predominantly, to the fraction ofG phase grains with small grain size, based on the capacitancealues.
Fig. 6(a) shows the impedance plots for CG201550,CG151550, B20CG1550, B20CG1450 and B30CG1550 at50 ◦C in air. The HF semi-circle of the impedance spectra is notlearly visible as the relaxation frequency of the grain exceeds
he high frequency limit of the impedance analyzer as can beeen in the enlarged view of the HF region in Fig. 6(b). TheF and LF semi-circles are visible as depressed and convolutedemicircle. For the single phase systems, the LF semi-circle isable 2bre-exponential factors calculated from impedance curves for the HF semi-ircle.
ample Pre-exponential term (×103) (S cm−1) K
20CG1550 7.120CG1450 3.630CG1550 5.5G201550 5495.4CG1550 45.7
Bami
CBedrater
ig. 5. Temperature dependent intermediate frequency conductivity for20CG1450, B20CG1550 and B30CG1550.
enerally attributed to the charge transfer between electrodend electrolyte.11,34 However, for the composites, this semi-ircle exhibits a change in values with variation in thicknessf the pellet, similar to other semi-circles originating from thelectrolyte. And thus, this semi-circle can also be said to haverigin from the electrolyte only. The capacitance values for thisemi-circle for B20CG1550, B20CG1550 and B30CG1550 are7, 21, and 28 nF cm−1, respectively. This range of capacitancealues may be attributed to the grain boundaries or interfaceetween phases.10 In the temperature range 700–800 ◦C (nothown), one more semi-circle appears in the impedance spec-ra. This semi-circle does not show variation with the change inlectrolyte thickness. Hence, this semi-circle can be conferredo the electrolyte–electrode interfacial response. The total resis-ivity of the composite electrolytes is the higher intercept of LFemi-circle with the real axis.
Fig. 7 shows the Arrhenius plot for B20CG1450, B20CG1550nd B30CG1550 for the conductivity values extracted from theF semi-circle in the temperature range from 350 ◦C to 800 ◦C.he plot for B20CG1450 shows a significant change in the sloperound 600 ◦C. Above 600 ◦C, the activation energy for this sam-le increases from 1.08 eV to 1.39 eV. This change can arise fromhe distinct microstructure of B20CG1450. On the other hand,20CG1550 and B30CG1550 do not show significant change inctivation energy (1 eV) over the temperature range of measure-ent. This indicates similar type of charge transport mechanism
n these composites in the temperature range of measurement.The Arrhenius plots for the total conductivities for
G201550, BCG151550, B20CG1550, B20CG1450 and30CG1550 samples are shown in Fig. 8. All compositelectrolytes exhibit almost a similar dependence of total con-uctivity on the temperature in air in the studied temperatureange. The activation energy for the total conductivity for
ll the composites is around 0.85 eV, which is similar tohat of CG201550. This is in agreement with the activationnergy reported for Gd-doped ceria in similar temperature rangeeported elsewhere.20 This suggests that the total conductivity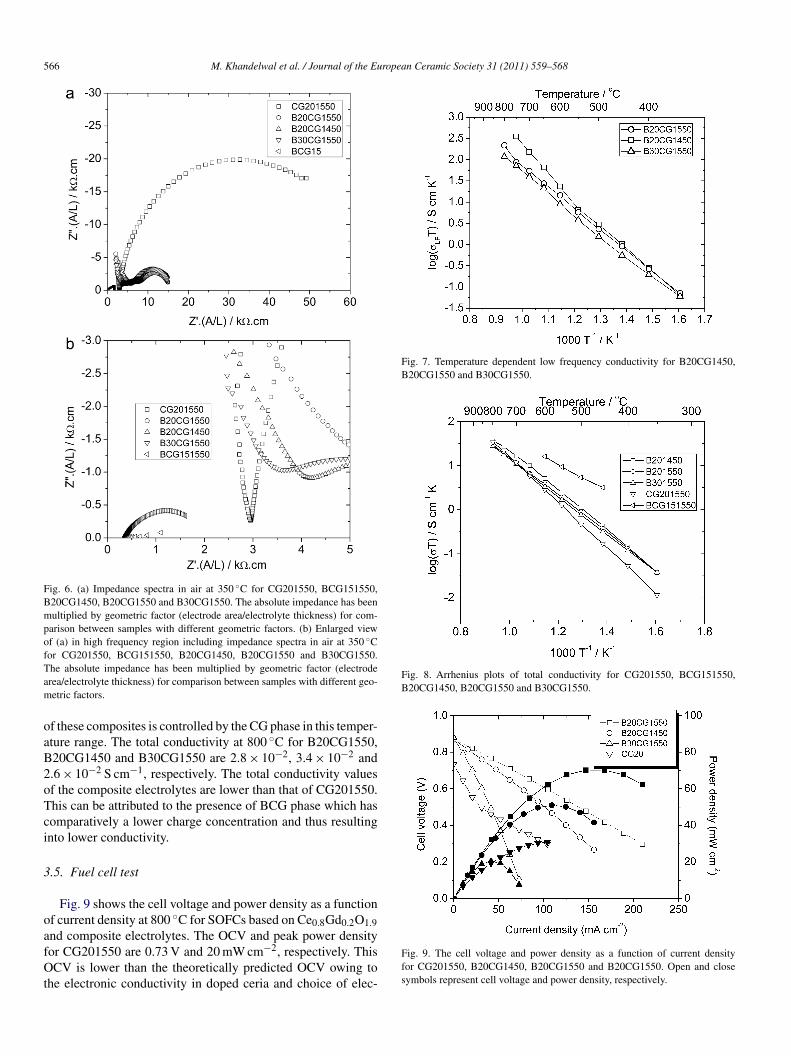
566 M. Khandelwal et al. / Journal of the European Ceramic Society 31 (2011) 559–568
Fig. 6. (a) Impedance spectra in air at 350 ◦C for CG201550, BCG151550,B20CG1450, B20CG1550 and B30CG1550. The absolute impedance has beenmultiplied by geometric factor (electrode area/electrolyte thickness) for com-parison between samples with different geometric factors. (b) Enlarged viewof (a) in high frequency region including impedance spectra in air at 350 ◦Cfor CG201550, BCG151550, B20CG1450, B20CG1550 and B30CG1550.Tam
oaB2oTci
3
oafOt
Fig. 7. Temperature dependent low frequency conductivity for B20CG1450,B20CG1550 and B30CG1550.
Fig. 8. Arrhenius plots of total conductivity for CG201550, BCG151550,B20CG1450, B20CG1550 and B30CG1550.
he absolute impedance has been multiplied by geometric factor (electroderea/electrolyte thickness) for comparison between samples with different geo-etric factors.
f these composites is controlled by the CG phase in this temper-ture range. The total conductivity at 800 ◦C for B20CG1550,20CG1450 and B30CG1550 are 2.8 × 10⁻², 3.4 × 10⁻² and.6 × 10−2 S cm−1, respectively. The total conductivity valuesf the composite electrolytes are lower than that of CG201550.his can be attributed to the presence of BCG phase which hasomparatively a lower charge concentration and thus resultingnto lower conductivity.
.5. Fuel cell test
Fig. 9 shows the cell voltage and power density as a functionf current density at 800 ◦C for SOFCs based on Ce0.8Gd0.2O1.9
nd composite electrolytes. The OCV and peak power densityor CG201550 are 0.73 V and 20 mW cm−2, respectively. ThisCV is lower than the theoretically predicted OCV owing tohe electronic conductivity in doped ceria and choice of elec-
Fig. 9. The cell voltage and power density as a function of current densityfor CG201550, B20CG1450, B20CG1550 and B20CG1550. Open and closesymbols represent cell voltage and power density, respectively.
ropea
twp
ecaipucmicTcOircsssttBretm
4
afXtgcisvcsblawsTcoiic
A
n
R
M. Khandelwal et al. / Journal of the Eu
rode materials.35 The non-linear decrease in the cell voltageith an increase in current density originates from activationolarization.
In general, all SOFC constructed with composite electrolytexhibit a higher OCV than CG201550. The OCV of SOFCsonstructed using B20CG1550, B20CG1450 and B30CG1550re 0.87, 0.87 and 0.89 V, respectively. This increase in OCVs partly due to the blocking of electronic current by BCGhase.36 The similarity in the OCVs for SOFCs constructedsing composite electrolytes B20CG1550 and B20CG1450 indi-ates that the blocking effect by BCG phase is not affecteduch by its grain size. The OCV for SOFC using B30CG1550
s slightly higher than rest of the composite electrolytes. Thisan be attributed to higher mol fraction of BCG phase present.he SOFCs with composite electrolytes show a linear drop inell voltage with an increase in current density. This is due tohmic polarization arising from thick pellets as electrolytes used
n this study. The slope of I–V plot corresponds to the Ohmicesistance predominantly from the composite electrolyte. Theomposite electrolytes B20CG1550 and B20CG1450 show aignificant increase in the total conductivity in fuel cell atmo-phere compared to air. In contrast, B30CG1550 does not showuch an increase. This can be attributed to higher proton conduc-ivity in BCG phase present in B20CG1450 and B20CG1550han B30CG1550.The peak power densities for B20CG1550,20CG1450 and B30CG1550 are 70, 50 and 30 mW cm−2,
espectively. The obtained low power densities are due to thicklectrolytes used in the study. These power densities can be fur-her improved by thinner electrolytes with suitable electrode
aterials.
. Conclusion
In this work, Gd-doped ceria and Gd-doped barium cer-te composites were synthesized through the citrate route. Theormation of two phase microstructure was confirmed through-ray diffraction and electron microscopy. It was revealed that
he presence of Gd-doped barium cerate phase arrested therain growth of Gd-doped ceria phase. The three distinct semi-ircles associated with the electrolyte were observed in thempedance spectra of the composite electrolytes, unlike theingle phase systems. On the basis of capacitance and the acti-ation energy values extracted from the temperature dependentonductivity, the high frequency and intermediate frequencyemi-circles were attributed predominantly to the Gd-dopedarium cerate and Gd-doped ceria phase, respectively. Theow frequency semi-circle was attributed to the grain bound-ry and interfacial response. The activation energy associatedith the conductivity values extracted from the low frequency
emi-circle was found to vary significantly with microstructure.he SOFCs based on composite electrolyte showed appre-
iable improvement in open circuit voltage over those basedn 20% Gd-doped ceria as electrolyte. Further improvementn the performance can be made on the basis of understand-ng developed by this work on the microstructure–conductivityorrelation.n Ceramic Society 31 (2011) 559–568 567
cknowledgement
The authors would like to thank NMRL, Additional Amber-ath for funding this work.
eferences
1. Arachi Y, Sakai H, Yamamoto O, Takeda Y, Imanishai N. Electrical con-ductivity of the ZrO2–Ln2O3 (Ln = lanthanides) system. Solid State Ionics1999;121:133–9.
2. Eguchi K, Setoguchi T, Inoue T, Arai H. Electrical properties of ceria-based oxides and their application to solid oxide fuel cells. Solid StateIonics 1992;52:165–72.
3. Kudo T, Obayashi H. Mixed electrical conduction in the flourite-typeCe1−xGdxO2−x/2. J Electrochem Soc 1976;123:415–9.
4. Iwahara H, Uchida H, Ono K, Ogaki K. Proton conduction in sinteredoxides based on BaCeO3. J Electrochem Soc 1988;135:529–33.
5. Bonanos N. Transport study of the solid electrolyte BaCe0.9Gd0.1O2.95 athigh temperatures. J Phys Chem Solids 1993;54:867–70.
6. Hirabayashi D, Tomita A, Hibino T, Nagao M, Sano M. Design of areduction-resistant Ce0.8Sm0.2O1.9 electrolyte through growth of a thinBaCe1−xSmxO3-δ layer over electrolyte surface. Electrochem Solid State2004;7:A318–20.
7. Zhu B, Liu X, Schober T. Novel hybrid conductors based on doped ceriaand BCY20 for ITSOFC applications. Electrochem Comm 2004;6:378–83.
8. Christie GM, Van Berkel EPF. Microstructure ionic conductivity relation-ships in ceria–gadolinia electrolytes. Solid State Ionics 1996;83:17–27.
9. Zhan Z, Wen TL, Tu H, Lu ZY. AC Impedance investigation of samarium-doped ceria. J Electrochem Soc 2001;148:A427–32.
10. Haile SM, West DL, Campbell J. The role of microstructure and processingon the proton conducting properties of gadolinium-doped barium cerate. JMater Res 1998;13:1576–95.
11. Coors WG, Readey DW. Proton conductivity measurements in yttrium bar-ium cerate by impedance spectroscopy. J Am Ceram Soc 2002;85:2637–40.
12. M’Peko JC, Spavieri Jr DL, da Silva CL, Fortulan CA, de Souza DPF,de Souza MF. Electrical properties of zirconia–alumina composites. SolidState Ionics 2003;156:59–69.
13. Muccillo ENS, Kleitz M. Ionic conductivity of fully stabilized ZrO2: MgOand blocking effects. J Eur Ceram Soc 1995;15:51–5.
14. Fonseca FC, Muccillo R. Impedance spectroscopy analysis of percolationin (yttria-stabilized zirconia)–yttria ceramic composites. Solid State Ionics2004;166:157–65.
15. Zhang T, Zeng Z, Huang H, Hing P, Kilner J. Effect of alumina additionon the electrical and mechanical properties of Ce0.8Gd0.2O2−δceramics.Mater Lett 2002;57:124–9.
16. Bonanos N, Steele BCH, Butler EP. In: Barsoukov E, Macdonald JR, edi-tors. Characterization of Materials in Impedance Spectroscopy TheoryExperiments and Applications. John Wiley & Sons, Inc.; 2005. p. 205–63.
17. Lee DW, Won JH, Shim KB. Low temperature synthesis of BaCeO3 nanopowders by the citrate process. Mater Lett 2003;57:3346–51.
18. Udawatte CP, Kakihana M, Yoshimura M. Low temperature synthesis ofpure SrSnO3 and the (BaxSr1−x)SnO3 solid solution by the polymerizedcomplex method. Solid State Ionics 2000;128:217–26.
19. Flint SD, Slade RCT. Comparison of calcium-doped barium cer-ate solid electrolytes prepared by different routes. Solid State Ionics1995;77:215–21.
20. Torrens RS, Sammes NM, Tompsett GA. Characterization of(CeO2)0.8(GdO1.5)0.2 synthesized using various techniques. SolidState Ionics 1998;111:9–15.
21. Birkenstock J, Fischer RX, Messner T. BRASS 2: The Bremen RietveldAnalysis and Structure Suite. University of Bremen; 2004. www.brass.uni-bremen.de.
22. Makino Y, Uchida S. In: Adachi G, Imanaka N, Kang ZC, editors. BinaryRare Earth Oxides. Kluwer Academic Publishers; 2004. p. 95.
23. Knight KS, Bonanos N. Space group and lattice constants for barium cerateand minor corrections to the crystal structures of BaCe0.9Y0.1O2.95 andBaCe0.9Gd0.1O2.95. J Mater Chem 1994;4:899–901.

5 ropea
68 M. Khandelwal et al. / Journal of the Eu24. Butee S, Kulkarni A, Prakash O, Aiyar R, George S, Sebastian M. High Qmicrowave dielectric ceramics in (Ni1−x Znx)Nb2O6 system. J Am CeramSoc 2009;92:1047–53.
25. Orazem ME, Tribollet B. Electrochemical Impedance Spectroscopy. JohnWiley & Sons, Inc.; 2008. pp. 129–152.
26. Charpentier P, Fragnaud P, Schleich DM, Gehain E. Preparation ofthin film SOFCs working at reduced temperature. Solid State Ionics2000;135:373–80.
27. Bevan DJM, Summerville E. In: Gschneider KA, Eyring L, editors. Hand-book on the Physics and Chemistry on Rare Earth’s, vol. 3. Amsterdam:North-Holland Publishing Company; 1979. p. 423.
28. Taniguchi N, Hatoh K, Niikura J, Gamo T, Iwahara H. Proton conductiveproperties of gadolinium-doped barium cerates at high temperatures. SolidState Ionics 1992;53–56:998–1003 (part 2).
29. Wu J, Li LP, Espinosa WTP, Haile SM. Defect chemistry and transportproperties of BaxCe0.85M0.15O3−δ. J Mater Res 2004;19:2366–76.
30. Duncan H, Lasia A. Influence of the electrode nature on conductiv-ity measurements of gadolinia-doped ceria. Solid State Ionics 2005;176:1429–37.
n Ceramic Society 31 (2011) 559–568
31. Fletcher JG, West AR, Irvine JTS. The AC impedance response of thephysical interface between yttria-stabilized zirconia and YBa2Cu3O7−x. JElectrochem Soc 1995;142:2650–4.
32. Bonanos N, Ellis B, Knight KS, Mahmood MN. Ionic conductiv-ity of gadolinium-doped barium cerate perovskites. Solid State Ionics1989;35:179–88.
33. Stevenson DA, Jiang N, Buchanan RM, Henn FEG. Characterization ofGd, Yb and Nd doped barium cerates as proton conductors. Solid StateIonics 1993;62:279–85.
34. Coll DP, Lopez DM, Numez P, Pinol S, Frade JR. Grain bound-ary conductivity of Ce0.8Ln0.2O2−(ceramics (Ln = Y, La, Gd, Sm)with and without Co-doping. Electrochim Acta 2006;51:6463–9.
35. Zha S, Xia C, Meng G. Effect of Gd (Sm) doping on properties of
ceria electrolyte for solid oxide fuel cells. J Power Sources 2003;115:44–8.36. Mishima Y, Mitsuyasu H, Ohtaki M, Eguchi K. Solid oxide fuel cellwith composite electrolyte consisting of samaria-doped ceria and yttria-stabilized zirconia. J Electrochem Soc 1998;145:1004–7.