Correlates of patient-reported racial/ethnic health care discrimination in the Diabetes Study of...
17
Correlates of Patient-Reported Racial/Ethnic Health Care Discrimination in the Diabetes Study of Northern California (DISTANCE) Courtney A. Rees, PhD 1 , Andrew J. Karter, PhD 1,2 , Bessie A. Young, MD, MPH 1,3 , Clarence Spigner, DrPH 1 , David Grembowski, PhD 1 , Dean Schillinger, MD 4,5 , and Nancy E. Adler, PhD 5 1 University of Washington, Department of Health Services 2 Kaiser Permanente Northern California, Division of Research 3 VA Puget Sound Health Care System 4 San Francisco General Hospital 5 University of California-San Francisco Abstract Objectives—We examined possible determinants of self-reported health care discrimination. Methods—We examined survey data from the Diabetes Study of Northern California (DISTANCE), a race-stratified sample of Kaiser diabetes patients. Respondents reported perceived discrimination, and regression models examined socioeconomic, acculturative, and psychosocial correlates. Results—Subjects (n=17,795) included 20% Blacks, 23% Latinos, 13% East Asians, 11% Filipinos, and 27% Whites. Three percent and 20% reported health care and general discrimination. Health care discrimination was more frequently reported by minorities (ORs ranging from 2.0 to 2.9 compared to whites) and those with poorer health literacy (OR=1.10, 95% CI: 1.04-1.16), limited English proficiency (OR=1.91, 95% CI: 1.32-2.78), and depression (OR=1.53, 95% CI: 1.10-2.13). Conclusions—In addition to race/ethnicity, health literacy and English proficiency may be bases of discrimination. Evaluation is needed to determine whether patients are treated differently or more apt to perceive discrimination, and whether depression fosters and/or follows perceived discrimination. Corresponding Author: Courtney Rees, Department of Health Services, University of Washington School of Public Health, Box 357660, Seattle, WA 98195, [email protected], P: (206) 795-3345, F: (206) 543-3964. Dr. Rees is a post-doctoral fellow at the University of Washington in Seattle, WA. Dr. Karter is an investigator at the Kaiser Permanente Northern California Division of Research and an affiliate professor in the Department of Health Services at the University of Washington. Dr. Young is an associate professor in the Department of Nephrology at the University of Washington and an investigator at the Veterans Affairs Puget Sound Health Care System. Drs. Spigner and Grembowski are professors in the Department of Health Services at the University of Washington. Dr. Schillinger is a professor of Medicine at the University of California San Francisco and director of the Center for Vulnerable Populations at San Francisco General Hospital. Dr. Adler is a professor of Medical Psychology at the University of California San Francisco and director of the Center for Health and Community. Conflict of Interest The authors report no conflicts of interest. NIH Public Access Author Manuscript J Health Care Poor Underserved. Author manuscript; available in PMC 2011 April 13. Published in final edited form as: J Health Care Poor Underserved. 2011 ; 22(1): 211–225. doi:10.1353/hpu.2011.0033. NIH-PA Author Manuscript NIH-PA Author Manuscript NIH-PA Author Manuscript
-
Upload
independent -
Category
Documents
-
view
0 -
download
0
Transcript of Correlates of patient-reported racial/ethnic health care discrimination in the Diabetes Study of...

Correlates of Patient-Reported Racial/Ethnic Health CareDiscrimination in the Diabetes Study of Northern California(DISTANCE)
Courtney A. Rees, PhD1, Andrew J. Karter, PhD1,2, Bessie A. Young, MD, MPH1,3,Clarence Spigner, DrPH1, David Grembowski, PhD1, Dean Schillinger, MD4,5, and Nancy E.Adler, PhD51University of Washington, Department of Health Services2Kaiser Permanente Northern California, Division of Research3VA Puget Sound Health Care System4San Francisco General Hospital5University of California-San Francisco
AbstractObjectives—We examined possible determinants of self-reported health care discrimination.
Methods—We examined survey data from the Diabetes Study of Northern California(DISTANCE), a race-stratified sample of Kaiser diabetes patients. Respondents reported perceiveddiscrimination, and regression models examined socioeconomic, acculturative, and psychosocialcorrelates.
Results—Subjects (n=17,795) included 20% Blacks, 23% Latinos, 13% East Asians, 11%Filipinos, and 27% Whites. Three percent and 20% reported health care and generaldiscrimination. Health care discrimination was more frequently reported by minorities (ORsranging from 2.0 to 2.9 compared to whites) and those with poorer health literacy (OR=1.10, 95%CI: 1.04-1.16), limited English proficiency (OR=1.91, 95% CI: 1.32-2.78), and depression(OR=1.53, 95% CI: 1.10-2.13).
Conclusions—In addition to race/ethnicity, health literacy and English proficiency may bebases of discrimination. Evaluation is needed to determine whether patients are treated differentlyor more apt to perceive discrimination, and whether depression fosters and/or follows perceiveddiscrimination.
Corresponding Author: Courtney Rees, Department of Health Services, University of Washington School of Public Health, Box357660, Seattle, WA 98195, [email protected], P: (206) 795-3345, F: (206) 543-3964.Dr. Rees is a post-doctoral fellow at the University of Washington in Seattle, WA. Dr. Karter is an investigator at the KaiserPermanente Northern California Division of Research and an affiliate professor in the Department of Health Services at the Universityof Washington. Dr. Young is an associate professor in the Department of Nephrology at the University of Washington and aninvestigator at the Veterans Affairs Puget Sound Health Care System. Drs. Spigner and Grembowski are professors in the Departmentof Health Services at the University of Washington. Dr. Schillinger is a professor of Medicine at the University of California SanFrancisco and director of the Center for Vulnerable Populations at San Francisco General Hospital. Dr. Adler is a professor of MedicalPsychology at the University of California San Francisco and director of the Center for Health and Community.Conflict of InterestThe authors report no conflicts of interest.
NIH Public AccessAuthor ManuscriptJ Health Care Poor Underserved. Author manuscript; available in PMC 2011 April 13.
Published in final edited form as:J Health Care Poor Underserved. 2011 ; 22(1): 211–225. doi:10.1353/hpu.2011.0033.
NIH
-PA Author Manuscript
NIH
-PA Author Manuscript
NIH
-PA Author Manuscript
KeywordsRace/ethnicity; discrimination; diabetes care; managed care
One of the explanations for the presence of racial/ethnic health disparities in the U.S. isdiscrimination, both in everyday life and within the health care system.1,2 Understandingperceived discrimination in the health care setting is important to improve quality andsatisfaction, as underscored by a recent study in which respondents reporting health carediscrimination were more likely to report lower quality of care.3 While a growing body ofliterature has explored perceived discrimination and health and/or treatment outcomes(including satisfaction),4-7 fewer studies have examined individual-level characteristics thatmay influence self-reported discrimination.8 Furthermore, previous research ondiscrimination within the health care system may be confounded by insurance status andaccess to care;9 thus, studies in integrated health care systems could provide additionalinsight.
We characterized individuals who reported health care discrimination from their provider(s),focusing on measures of socioeconomic status (SES), acculturation, psychosocial, andhealth-related factors. In addition, we were interested in examining correlates of health carediscrimination after adjusting for reports of discrimination in everyday life to assess if thesedomains were distinct. A broader understanding of how individual-level factors areassociated with self-reported discrimination may provide insight into how and/or whenindividuals are exposed to discriminatory experiences, as well as how they perceive andultimately report these experiences, which may have important implications for health-system interventions.
MethodsStudy population
The study sampling frame was derived from a well-characterized population with diabetes inthe Kaiser Permanente Northern California (n~225,000).10 From May 2005 to December2006, researchers conducted the baseline survey of the Diabetes Study of NorthernCalifornia (DISTANCE) among a racially/ethnically-stratified, random sample of DiabetesRegistry members aged 30-75, targeting 6,871 African American, 11,197 Asian, 4,233Caucasian, 7,018 Latino and 11,417 members of unknown race/ethnicity, and achieving a62% overall response rate (n=20,188).11 Individuals were able to complete the survey inwritten, computer-assisted telephone interview, or web formats in English, Spanish,Chinese, or Tagalog. Further details about the Registry12-14 and the DISTANCE studymethodology15 have been published elsewhere.
A diabetes cohort provided a good model because (a) diabetes disproportionately affectsracial/ethnic minorities,16 (b) significant racial/ethnic disparities in diabetes processes andoutcomes have been well-described,17 (c) this chronic disease yields frequent patient-provider interactions, and (d) reports of discrimination are associated with poorer diabetesoutcomes.18
MeasuresThe DISTANCE survey included 184 questions, covering a wide range of variables (the fullsurvey instrument can be found at http://distancesurvey.org19). The domains of interest weredemographic, socioeconomic, acculturative, psychosocial, and health-related characteristicsoutlined below.
Rees et al. Page 2
J Health Care Poor Underserved. Author manuscript; available in PMC 2011 April 13.
NIH
-PA Author Manuscript
NIH
-PA Author Manuscript
NIH
-PA Author Manuscript

Discrimination—The measures of discrimination were derived from previous studies.20,21
First, individuals were asked about experiences of general discrimination in everyday life:“In the past 12 months, how often have you felt that people have treated you poorly or madeyou feel inferior based on your race or ethnicity?” Later in the survey, individuals wereasked about experiences in the health care setting, where the word “people” was replacedwith “doctors or health care providers at Kaiser.” While the question asked specificallyabout providers, this could include non-physician providers such as nurses, and/orindividuals might have been thinking of staff when responding. Both questions had theresponse categories of never, sometimes, usually, or often, collapsed into never vs. any forthe analyses.
Demographics—The most prevalent self-reported racial/ethnic groups were examined:White, Black, Latino, Asian (including Chinese, Japanese, Vietnamese, and Korean),Filipino, and Other. Filipinos were analyzed separately from the Asian respondents becauseof their large representation in the Kaiser diabetes population and recognized uniquenessfrom other Asian subgroup populations.22 Other racial/ethnic groups not mentioned above(including smaller Asian subgroups) were included in the Other race/ethnicity category.
In addition, patient age (at baseline) and sex were pulled from administrative databases foreach respondent. Age was collapsed into <50, 50-64, and ≥65 for the analyses.
Correlates of interest—SES was first captured by annual income (four quartiles of under$25,000, $25,000-$49,999, or $50,000-$79,999, and $80,000 or more) and education (highschool/GED or less, some college, or college graduate or more). Relative social position wasmeasured with the MacArthur Scale of Subjective Social Status, asking individuals to ratethemselves from 0 to 10 (“worst off” to “best off”) compared to other people in the U.S.23
This measure has been linked to health outcomes even after for adjusting for presumablymore objective measures of SES, such as education and income.24 Finally, we includedhealth literacy because it was strongly linked to other measures of SES and has been shownto be an important predictor among diverse individuals with diabetes.25, 26 Health literacywas assessed by three questions asking about difficulty in reading written information aboutmedical conditions, confidence in filling out medical forms, and how often someone elsehelps in reading health plan materials. These measures have been previously validated,27
and we scored responses from 1 to 15, with 15 representing the most problems with healthliteracy.
Because acculturation influences how individuals integrate into U.S. society and whethergroups perceive events as discriminatory, it was of primary interest. First, we created abinary measure of immigrant status (yes vs. no) based on the respondents’ self-reportedplace of birth. Second, language was captured by limited English proficiency (LEP),categorized as always or often having problems speaking and/or understanding English.
The survey also included several validated psychosocial measures that were previouslylinked to a variety of health outcomes and also hypothesized to be related to how individualsself-report experiences with discrimination. Diabetes-specific locus of control28 assessedhow much control individuals feel that they have over their illness. Locus of control hasbeen shown to be important for health outcomes, specifically outcomes such as healthbehaviors, information seeking, and treatment adherence.29 A summary measure of externallocus of control was examined in these analyses, scored from 1 to 5, with 5 representing thehighest external locus (i.e., believing their health is due almost entirely to outside eventsand/or luck). A measure of perceived stress was also examined, as discrimination is thoughtto influence health outcomes through a variety of stress pathways.8 Specifically, stress wasassessed through a four-item scale that asked individuals to rate how well they handled
Rees et al. Page 3
J Health Care Poor Underserved. Author manuscript; available in PMC 2011 April 13.
NIH
-PA Author Manuscript
NIH
-PA Author Manuscript
NIH
-PA Author Manuscript

problems in their lives, summed into a score from 1 to 20, with high scores representinghigher stress levels.30 The emotional instability (also called neuroticism) component of theso-called Big Five personality measures was also examined.31, 32 This personality factor hasbeen shown to be related to outcomes such as higher levels of anxiety and hostility.33 On thesurvey, individuals were asked to agree or disagree with specific descriptions of theircharacter (e.g., “I see myself as calm, emotionally stable”). The summary score went from 1to 5, with 5 indicating the highest emotional instability.
Finally, there were three health-related factors of interest. First, we adjusted for depressivesymptoms, as depression has been consistently shown to be associated with perceiveddiscrimination7 and varies by race/ethnicity in this population (Karter, personal comment).Ascertainment of depressive symptoms was based on the eight-item Patient HealthQuestionnaire scale,34 where depressive symptoms were categorized into two levels: nodepression (few to no symptoms with a score below 5) vs. mild, moderate, moderatelysevere, or severe symptoms (a score from 5-24). We also adjusted for self-reported physicalhealth status, specifically the physical component score of the SF-8,35 standardized into ascore from 0 to 100. In addition, we examined disability status, given the high rates ofdisability among people with diabetes36 and racial/ethnic minorities,37 as well as its ownassociated stigma. We included a dichotomous measure of inability to work due to illness ordisability (yes vs. no), which may have captured more severe disability compared to othermeasures of broader physical functioning.
Statistical analysesFirst, the unadjusted proportions of reporting both types of discrimination (health care andgeneral) were calculated overall and by race/ethnicity, and the relationship between the tworeports of discrimination was compared using a chi-squared test. In addition, bivariateanalyses were conducted to evaluate relationships between the patient covariates withreports of health care discrimination, using unadjusted logistic regression models in SASversion 9.2, with weights to account for the survey design.
Next, adjusted logistic regression models were specified, examining binary reports of healthcare discrimination (also incorporating survey weighting). The regression models werecompleted in stages. First, SES variables were included, followed by adding acculturation,psychosocial, and health-related characteristics. Finally, reports of general discriminationwere added to the fully adjusted model to try to account for any residual confounding byindividual differences in the likelihood of reporting discriminatory experiences. Allstatistical models were also adjusted for demographics of age, gender, and race/ethnicity,given that they have been previously associated with reports of discrimination. Odds ratiosand their associated 95% confidence intervals identified significant associations.
ResultsOf the 17,795 respondents to the long version of survey that included the discriminationmeasures, there were a total of 16,463 respondents to the general discrimination questionand 12,151 respondents to the health care discrimination question. Respondents to the healthcare discrimination question were well distributed across the major racial/ethnic groups ofinterest: 20% Black, 20% Latino, 12% Asian, 11% Filipino, and 30% White, with 6%reporting another race/ethnicity. Respondents not answering the discrimination questionswere more likely to report Latino, Asian, Filipino, or Other race/ethnicity, and be older, lesseducated, lower income, not born in the U.S., with poor health literacy and LEP.
Rees et al. Page 4
J Health Care Poor Underserved. Author manuscript; available in PMC 2011 April 13.
NIH
-PA Author Manuscript
NIH
-PA Author Manuscript
NIH
-PA Author Manuscript

Descriptive analysesThe majority (66%) of respondents reported no general discrimination in the past year, andan overwhelming majority (95%) reported no discrimination from their health care providerin the past year (Figure 1). However, after accounting for non-proportional samplingfractions (specifically, the oversampling of minorities), the proportions reporting generaland health care discrimination in the overall Kaiser Diabetes Registry population were 20%and 3%. Furthermore, the reports of discrimination were significantly related to one another– that is, individuals who reported general discrimination were more likely also to reporthealth care provider discrimination (p<.01, Table 1).
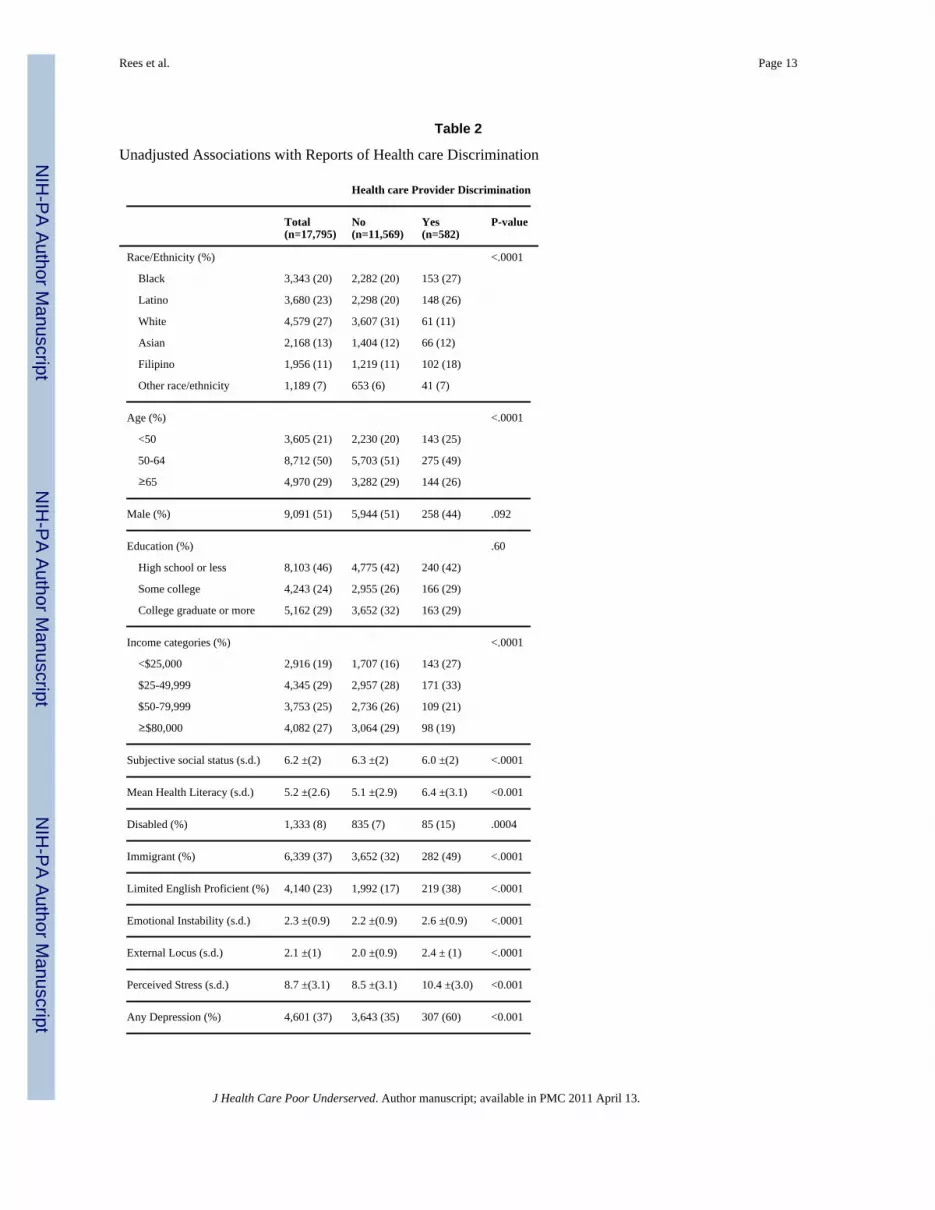
Whites reported discrimination substantially less frequently than any racial/ethnic minoritygroup (9% for general discrimination and 2% for health care discrimination). Blacksreported general discrimination most frequently (52%), and Filipinos reported health careprovider discrimination most frequently (8%). Among the minority group respondents,Latinos reported general discrimination least frequently (35%), and Asians reported healthcare discrimination the least frequently (4%). Table 2 presents the unadjusted associationsbetween the patient characteristics and reported health care discrimination. The majority ofindividual-level characteristics were significantly related to both discrimination outcomes inbivariate comparisons. Minority race/ethnicity, younger age, lower income, disability status,poorer health literacy, immigrant status, LEP, lower subjective social status, higheremotional instability, higher external locus of control, higher perceived stress, worsephysical functioning, and depressive symptoms were significantly associated with higherreports of health care provider discrimination. However, gender and education were notsignificantly associated with health care discrimination in unadjusted analyses.
Adjusted analysesTable 3 reports the adjusted logistic regression model results for health care discrimination,presenting the series of models across the columns. When only including demographic andsocioeconomic variables in the first model, all racial/ethnic minority groups were morelikely than Whites to report discrimination from their health care provider. Black, Latino,Asian, Filipino, and Other race/ethnicity respondents had 3.99 (95% CI: 2.78-5.73), 3.03(95% CI: 2.02-4.53), 2.53 (95% CI: 1.61-3.98), 4.60 (2.96-7.14), and 3.15 (95% CI:1.80-5.51) times the likelihood (respectively) of reporting health care discrimination asWhites. In addition, younger age (OR=1.85 comparing <50 vs. ≥65; 95% CI: 1.28-2.69) andpoorer health literacy (OR=1.16 for a 1-point change; 95% CI: 1.11-1.21) were associatedwith increased reports of discrimination. There were no significant, adjusted associationsbetween income, education, or subjective social status with reported health carediscrimination.
In the next stage, acculturation variables of immigrant status and LEP were added to thelogistic regression model. Those with poor English skills were more likely than thosewithout English limitations to report discrimination from their health care provider(OR=2.03, 95% CI: 1.42-2.91). In addition, younger age, poor health literacy, and minorityrace/ethnicity remained significantly associated with discrimination in this model.
Psychosocial scales of locus of control, emotional instability, and perceived stress wereadded next. Perceived stress (OR=1.11 for a 1-point increase, 95% CI: 1.06-1.15) andemotional instability (OR=1.18 for a 1-point increase, 95% CI: 1.00-1.39) were significantin the adjusted model. Depression, self-reported physical health, and disability status wereadded in the following stage. Depression was significantly associated with reporting healthcare provider discrimination (OR=1.67, 95% CI: 1.20-2.33), but neither the physicalcomponent score nor disability status reached significance. With the addition of these
Rees et al. Page 5
J Health Care Poor Underserved. Author manuscript; available in PMC 2011 April 13.
NIH
-PA Author Manuscript
NIH
-PA Author Manuscript
NIH
-PA Author Manuscript

covariates, the associations of younger age and emotional instability with reporting healthcare discrimination became statistically insignificant, but poorer health literacy and LEPremained associated with reported health care discrimination.
Finally, the binary indicator of reporting general discrimination was added to the model.General discrimination was significantly associated with health care discrimination in thisfully adjusted model (OR=2.42; 95% CI: 1.88, 3.12), and the associations of LEP (OR=1.91,95% CI: 1.32-2.78), depression (OR=1.53, 95% CI: 1.10-2.13), and poorer health literacy(OR=1.10, 95% CI: 1.04-1.16) remained significantly related to reporting health carediscrimination. Furthermore, minority race was significantly associated with reports ofhealth care discrimination in all stages of adjustment. However, in this fully adjusted model,the odd ratios of reporting health care discrimination for Blacks, Latinos, Asians, Filipinos,and Other race/ethnicity decreased substantially to 2.86 (95% CI: 1.93-4.22), 2.17 (95% CI:1.40-3.37), 1.95 (95% CI: 1.20-3.16), and 2.82 (95% CI: 1.72-4.62), and 2.42 (95% CI:1.35-4.34) (respectively) compared with Whites – representing 36%, 22%, 24%, 32%, and22% decreases in the ORs without adjustment for reports of general discrimination.
DiscussionThis study identified significant correlates associated with self-reported racial/ethnic healthcare discrimination in a well-characterized population of insured diabetes patients receivingcare within an integrated delivery system. As expected, all racial/ethnic minority groupswere significantly more likely than Whites to report discrimination. There were alsosignificantly lower rates of reporting health care provider discrimination (3%) than ofgeneral discrimination (20%), likely related to exposure, as general discrimination can occurat any time while discrimination from health care providers occurs within a more limitedcontext. Individuals who reported health care discrimination in our study were likely to alsoreport general discrimination, which has been found previously.18 To examine this in moredepth, we ran models examining health care discrimination as the outcome whilesimultaneously adjusting for reports of general discrimination. While the minority-Whitedifferences in reporting discrimination decreased in this model, the significant associationsof health literacy, LEP, and depressive symptoms persisted. This suggests that the twodomains of discrimination are distinct in that some personal characteristics that predicthealth care discrimination are separate from factors associated with broader reports ofgeneral discrimination, and individuals reporting experiences of health care discriminationmay not simply be more likely to feel discriminated against in any situation.
Overall, the proportions of discrimination reported among these patients at KaiserPermanente were substantially lower than those reported previously in comparablepopulations. After analysis of the publicly available 2005 California Health Interview Studydataset, a random sample of all Californians, we calculated that 40% of individuals withtype 2 diabetes reported general discrimination in everyday life within the past year, and 6%reported health care provider discrimination (results not previously published), comparedwith our observations of 20% and 3%, respectively. Another study of individuals withdiabetes within several health care systems found that 8% reported racial/ethnic health carediscrimination in the previous year.18 The higher reports of discrimination among Filipinothan among other Asian respondents is also similar to previous research.38,39
Perceived stress and depressive symptoms were significantly associated with reports ofhealth care discrimination in this study, which is consistent with the literature.4-8 However,these cross-sectional analyses of the DISTANCE survey data precluded causal inferencesthat would be able to confirm that these factors are responses to, rather than predictors of,discrimination (or perhaps both causes and effects). Furthermore, the mixed results for
Rees et al. Page 6
J Health Care Poor Underserved. Author manuscript; available in PMC 2011 April 13.
NIH
-PA Author Manuscript
NIH
-PA Author Manuscript
NIH
-PA Author Manuscript

acculturation (i.e., a positive association between LEP and discrimination, but a nullassociation for immigrant status) provide support for the idea that lower levels ofacculturation may increase reports of racial/ethnic health care discrimination.40 It has alsobeen hypothesized that a longer time in the U.S. could simultaneously reduce some types ofdiscrimination (e.g., less unfair treatment due to language difficulties) but increaseperceptions of more subtle types of discrimination.41
Lower SES (particularly income and subjective social status) was associated with increasedreports of health care discrimination in unadjusted models. However, only the relationshipof poorer health literacy remained significant in adjusted models, suggesting that it mightmediate the association of SES with reporting health care discrimination. Inadequate healthliteracy impairs a provider’s communication with patients and thus may be associated withreduced satisfaction on the part of the patient regarding the quality of their provider’scommunication,26 potentially leading to perceptions/experiences of health carediscrimination. Additionally, education was not related to reports of health carediscrimination in any model, which was also found in another recent study.40 Our SESfindings are similar to previous work that reported somewhat mixed associations (i.e.,positive, negative, and null) between SES and reports of discrimination.8,42-45 Finally,younger age was associated with increased reports of discrimination, consistent withprevious research, yet men were not more likely to report discrimination as has been shownin prior studies.42,45-47
LimitationsUsing single-item discrimination measures within a limited timeframe is likely tounderreport the true prevalence and variance in the broader population,21,48-49 suggestingour estimates may be conservative. We also were not able to distinguish between the reportsof discrimination from physicians, other providers, or staff. Health care providerdiscrimination reports were relatively uncommon, which may have limited power to detectsignificant associations despite the large sample size. In addition, there were missing data,both for the discrimination outcomes and the covariates of interest (as racial/ethnic minority,less acculturated, and lower SES individuals were less likely to respond to thediscrimination item). While examination of the survey response patterns revealed there wassurvey “fatigue” (particularly for health care discrimination, which was near the end of thequestionnaire), there were no other noticeable patterns suggesting bias. While the missingdiscrimination measures likely influences the marginal estimates of self-reporteddiscrimination in our population, it is unlikely to substantively affect the associations.50 Inaddition, the survey mode (written vs. telephone interview) could have influenced thevalidity of responses if one mode was considered more anonymous. However, we performedmultiple imputation sensitivity analyses for the missing covariates, which did notsubstantively change any findings (data not shown). Finally, because we were interested inliteracy and language-speaking ability as primary covariates, we did not exclude individualson this basis. Although most individuals were able to complete the survey with interviewerassistance in their primary language, problems with literacy and/or language could haveaffected both the interpretation of survey questions and the related responses.
ImplicationsThe current study assessed perceptions of health care provider discrimination in a managedcare organization, among those with chronic illness with a heightened level of interactionwith and dependency on the health care system. Our findings suggest that perceived healthcare provider discrimination was uncommon, especially when compared with generaldiscrimination, and that perceptions of discrimination were associated with greater barriersto receiving care such as health literacy and/or language-speaking ability, which both are
Rees et al. Page 7
J Health Care Poor Underserved. Author manuscript; available in PMC 2011 April 13.
NIH
-PA Author Manuscript
NIH
-PA Author Manuscript
NIH
-PA Author Manuscript

related to communication. These barriers may increase the likelihood that patientsmisunderstand their providers’ intentions or reduce providers’ willingness to offer neededcare. In addition, general and health care discrimination measures were significantly relatedto one another and shared several correlates, yet reports of health care discrimination werenot completely explained by an individual likelihood to perceive discrimination in everydaylife.
While we were only able to examine reported discrimination, these self-reports ofdiscrimination among individuals with diabetes have been shown to be associated withreceiving fewer hemoglobin A1c tests, blood pressure tests, and foot exams,51-53 as well ashave worse disease control, symptom burden, and physical functioning.18 Public healthpractitioners and providers should be aware of the potential health and treatmentimplications for patients reporting discrimination, as perceptions or experiences ofdiscrimination could affect health through several pathways. Importantly, patients whoreport health care discrimination may be unlikely to be satisfied with their health care. Thus,understanding perceptions of health care discrimination will be helpful in our attempt tolessen racial/ethnic disparities in patient satisfaction. Careful attention to factors withpossible interventions in a health care setting–particularly those that may already have anassociated stigma such as limited health literacy and language barriers–may reduce suchperceptions or experiences of health care discrimination.
AcknowledgmentsThis project was supported by a National Research Service Award, grant number HS013853 from the Agency forHealthcare Research and Quality, and funds were provided by National Institute of Diabetes, Digestive and KidneyDiseases R01 DK65664 and National Institute of Child Health and Human Development R01 HD46113. None ofthe authors had conflicts of interest, and the funders had no role in design and conduct of the study; collection,management, analysis, or interpretation of the data; or preparation, review, or approval of the manuscript.
References1. Williams DR, Rucker TD. Understanding and addressing racial disparities in health care. Health
Care Financ Rev. 2000; 21(4):75–90. [PubMed: 11481746]2. van Ryn M, Fu SS. Paved with good intentions: Do public health and human service providers
contribute to racial/ethnic disparities in health? Am J Public Health. 2003; 93(2):248–255.[PubMed: 12554578]
3. Sorkin DH, Ngo-Metzger Q, De Alba I. Racial/Ethnic discrimination in health care: Impact onperceived quality of care. J Gen Intern Med. 2010
4. Williams DR, Neighbors HW, Jackson JS. Racial/ethnic discrimination and health: Findings fromcommunity studies. Am J Public Health. 2003; 93(2):200–208. [PubMed: 12554570]
5. Paradies Y. A systematic review of empirical research on self-reported racism and health. Int JEpidemiol. 2006; 35(4):888–901. [PubMed: 16585055]
6. Ahmed AT, Mohammed SA, Williams DR. Racial discrimination & health: Pathways & evidence.Indian J Med Res. 2007; 126(4):318–327. [PubMed: 18032807]
7. Williams DR, Mohammed SA. Discrimination and racial disparities in health: Evidence and neededresearch. J Behav Med. 2008
8. Clark R, Anderson NB, Clark VR, Williams DR. Racism as a stressor for African Americans. Abiopsychosocial model. Am Psychol. 1999; 54(10):805–816. [PubMed: 10540593]
9. Smedley, BD.; Stith, AY.; Nelson, AR. Unequal treatment: Confronting racial and ethnic disparitiesin health care. National Academy Press; Washington, D.C.: 2002.
10. Karter AJ, Ferrara A, Liu JY, Moffet HH, Ackerson LM, Selby JV. Ethnic disparities in diabeticcomplications in an insured population. JAMA. May 15; 2002 287(19.):2519–27.2002;287:2519-2527. [PubMed: 12020332]
Rees et al. Page 8
J Health Care Poor Underserved. Author manuscript; available in PMC 2011 April 13.
NIH
-PA Author Manuscript
NIH
-PA Author Manuscript
NIH
-PA Author Manuscript

11. Council of American Survey Research Organizations. On the definition of response rates. CASRO;Port Jefferson, NY: 1982. Available from: http://www.casro.org/resprates.cfm
12. Karter AJ, Ackerson LM, Darbinian JA, et al. Self-monitoring of blood glucose levels andglycemic control: The Northern California Kaiser Permanente Diabetes Registry. Am.J.Med.2001; 111:1–9. [PubMed: 11448654]
13. Selby JV, Karter AJ, Ackerson LM, Ferrara A, Liu J. Developing a prediction rule from automatedclinical databases to identify high-risk patients in a large population with diabetes. Diabetes Care.Sep; 2001 24(9.):1547–55. 2001;24:1547-1555. [PubMed: 11522697]
14. Martin TL, Selby JV, Zhang D. Physician and patient prevention practices in NIDDM in a largeurban managed-care organization. Diabetes Care. 1995; 18:1124–1132. [PubMed: 7587847]
15. Moffet HH, Adler N, Schillinger D, et al. Cohort profile: The Diabetes Study of NorthernCalifornia (DISTANCE)--objectives and design of a survey follow-up study of social healthdisparities in a managed care population. Int J Epidemiol.. 2008
16. Centers for Disease Control and Prevention. National diabetes fact sheet: General information andnational estimates on diabetes in the U.S., 2005. U.S. Department of Health and Human Services,CDC; Atlanta, GA: 2005. Accessed March 1, 2008
17. Agency for Healthcare Research and Quality. National healthcare disparities report. Rockville,MD: 2007. Available from: http://www.ahrq.gov/qual/qrdr07.htm
18. Piette JD, Bibbins-Domingo K, Schillinger D. Health care discrimination, processes of care, anddiabetes patients’ health status. Patient Educ Couns.. 2006; 60(1):41–48. [PubMed: 16332469]
19. Kaiser Permanente Northern California Division of Research. Diabetes Study of NorthernCalifornia (DISTANCE). Available at: www.distancesurvey.org
20. Krieger N, Sidney S, Coakley E. Racial discrimination and skin color in the CARDIA study:Implications for public health research. Coronary Artery Risk Development in Young Adults. AmJ Public Health. 1998; 88(9):1308–1313. [PubMed: 9736868]
21. Krieger N, Smith K, Naishadham D, Hartman C, Barbeau EM. Experiences of discrimination:Validity and reliability of a self-report measure for population health research on racism andhealth. Soc Sci Med.. 2005; 61(7):1576–1596. [PubMed: 16005789]
22. U.S. Census Bureau. The American Community - Asians: 2004. Washington, DC: 2007.23. Singh-Manoux A, Adler NE, Marmot MG. Subjective social status: Its determinants and its
association with measures of ill-health in the Whitehall II Study. Soc Sci Med.. 2003; 56(6):1321–1333. [PubMed: 12600368]
24. Adler NE, Epel ES, Castellazzo G, Ickovics JR. Relationship of subjective and objective socialstatus with psychological and physiological functioning: Preliminary data in healthy white women.Health Psychol.. 2000; 19(6):586–592. [PubMed: 11129362]
25. Schillinger D, Grumbach K, Piette J, et al. Association of health literacy with diabetes outcomes.JAMA. Jul 24; 2002 288(4.):475–82. 2002;288:475-482. [PubMed: 12132978]
26. Schillinger D, Bindman A, Wang F, Stewart A, Piette J. Functional health literacy and the qualityof physician-patient communication among diabetes patients. Patient Educ Couns.. 2004; 52(3):315–323. [PubMed: 14998602]
27. Chew LD, Bradley KA, Boyko EJ. Brief questions to identify patients with inadequate healthliteracy. Fam Med.. 2004; 36(8):588–594. [PubMed: 15343421]
28. Peyrot M, Rubin RR. Structure and correlates of diabetes-specific locus of control. Diabetes Care.1994; 17(9):994–1001. [PubMed: 7988321]
29. Wallston BD, Wallston KA. Locus of control and health: A review of the literature. Health EducMonogr.. 1978; 6(2):107–117. [PubMed: 357347]
30. Cohen S, Kamarck T, Mermelstein R. A global measure of perceived stress. J Health Soc Behav..1983; 24(4):385–396. [PubMed: 6668417]
31. Gosling SD, Rentfrow PJ, Swann WB. A very brief measure of the big-five personality domains.Journal of Research in Personality. 2003; 37:504–528.
32. Srivastava S, John OP, Gosling SD, Potter J. Development of personality in early and middleadulthood: Set like plaster or persistent change? J Pers Soc Psychol.. 2003; 84(5):1041–1053.[PubMed: 12757147]
Rees et al. Page 9
J Health Care Poor Underserved. Author manuscript; available in PMC 2011 April 13.
NIH
-PA Author Manuscript
NIH
-PA Author Manuscript
NIH
-PA Author Manuscript
33. Friedman HS. Long-term relations of personality and health: Dynamisms, mechanisms, tropisms. JPers.. 2000; 68(6):1089–1107. [PubMed: 11130733]
34. Kroenke K, Spitzer RL, Williams JB. The PHQ-9: Validity of a brief depression severity measure.J Gen Intern Med.. 2001; 16(9):606–613. [PubMed: 11556941]
35. Ware, JE.; Kosinksi, M.; Dewey, JE.; Gandek, B. How to Score and Interpret Single-Item HealthStatus Measures: A Manual for Users of the SF-8 Health Survey. QualityMetric Incorporated;Lincoln, RI: 2001.
36. Gregg EW, Beckles GL, Williamson DF, et al. Diabetes and physical disability among older U.S.adults. Diabetes Care. 2000; 23(9):1272–1277. [PubMed: 10977018]
37. Bowen ME. Childhood socioeconomic status and racial differences in disability: Evidence fromthe Health and Retirement Study (1998-2006). Soc Sci Med.. 2009; 69(3):433–441. [PubMed:19541400]
38. Mossakowski KN. Coping with perceived discrimination: Does ethnic identity protect mentalhealth? J Health Soc Behav.. 2003; 44(3):318–331. [PubMed: 14582311]
39. Gee GC, Spencer MS, Chen J, Takeuchi D. A nationwide study of discrimination and chronichealth conditions among Asian Americans. Am J Public Health. 2007; 97(7):1275–1282.[PubMed: 17538055]
40. Lauderdale DS, Wen M, Jacobs EA, Kandula NR. Immigrant perceptions of discrimination inhealth care: The California Health Interview Survey 2003. Med Care. 2006; 44(10):914–920.[PubMed: 17001262]
41. Franzini L, Fernandez-Esquer ME. Socioeconomic, cultural, and personal influences on healthoutcomes in low income Mexican-origin individuals in Texas. Soc Sci Med.. 2004; 59(8):1629–1646. [PubMed: 15279921]
42. Kessler RC, Mickelson KD, Williams DR. The prevalence, distribution, and mental healthcorrelates of perceived discrimination in the United States. J Health Soc Behav.. 1999; 40(3):208–230. [PubMed: 10513145]
43. Borrell LN, Jacobs DR Jr, Williams DR, Pletcher MJ, Houston TK, Kiefe CI. Self-reported racialdiscrimination and substance use in the Coronary Artery Risk Development in Adults Study. Am JEpidemiol.. 2007; 166(9):1068–1079. [PubMed: 17698506]
44. Moody-Ayers SY, Stewart AL, Covinsky KE, Inouye SK. Prevalence and correlates of perceivedsocietal racism in older African-American adults with type 2 diabetes mellitus. J Am Geriatr Soc..2005; 53(12):2202–2208. [PubMed: 16398910]
45. Barnes LL, Mendes De Leon CF, Wilson RS, Bienias JL, Bennett DA, Evans DA. Racialdifferences in perceived discrimination in a community population of older blacks and whites. JAging Health. 2004; 16(3):315–337. [PubMed: 15155065]
46. Broman CL, Mavaddat R, Hsu S. The experience and consequences of racial discrimination.Journal of Black Psychology. 2000; 26:165–180.
47. Sellers RM, Caldwell CH, Schmeelk-Cone KH, Zimmerman MA. Racial identity, racialdiscrimination, perceived stress, and psychological distress among African American youngadults. J Health Soc Behav.. 2003; 44(3):302–317. [PubMed: 14582310]
48. Kressin NR, Raymond KL, Manze M. Perceptions of race/ethnicity-based discrimination: A reviewof measures and evaluation of their usefulness for the health care setting. J Health Care PoorUnderserved. 2008; 19(3):697–730. [PubMed: 18677066]
49. Krieger N. Embodying inequality: A review of concepts, measures, and methods for studyinghealth consequences of discrimination. Int J Health Serv.. 1999; 29(2):295–352. [PubMed:10379455]
50. Rothman, KJ.; Greenland, S. Modern Epidemiology. Lippincott-Raven; Philadelphia: 1998.51. Blanchard J, Lurie N. R-E-S-P-E-C-T: Patient reports of disrespect in the health care setting and its
impact on care. J Fam Pract.. 2004; 53(9):721–730. [PubMed: 15353162]52. Ryan AM, Gee GC, Griffith D. The effects of perceived discrimination on diabetes management. J
Health Care Poor Underserved. 2008; 19(1):149–163. [PubMed: 18263991]53. Trivedi AN, Ayanian JZ. Perceived discrimination and use of preventive health services. J Gen
Intern Med.. 2006; 21(6):553–558. [PubMed: 16808735]
Rees et al. Page 10
J Health Care Poor Underserved. Author manuscript; available in PMC 2011 April 13.
NIH
-PA Author Manuscript
NIH
-PA Author Manuscript
NIH
-PA Author Manuscript

Fig 1. Reports of Racial/Ethnic Discrimination, By Race/EthnicityNote: “Weighted” refers to proportions in overall Kaiser Diabetes Registry, “Sample” refersto DISTANCE survey respondents. Denominators are as follows: 16,463 respondents togeneral discrimination item: 3,180 Black, 1,821 Filipino, 3,730 Latino, 2,024 Asian, and4.465 White; 12,151 respondents to health care discrimination item: 2,435 Black, 1,321Filipino, 2,446 Latino, 1,470 Asian, and 3,668 White
Rees et al. Page 11
J Health Care Poor Underserved. Author manuscript; available in PMC 2011 April 13.
NIH
-PA Author Manuscript
NIH
-PA Author Manuscript
NIH
-PA Author Manuscript

NIH
-PA Author Manuscript
NIH
-PA Author Manuscript
NIH
-PA Author Manuscript
Rees et al. Page 12
Table 1
Patient Reports of General Discrimination and Health care Discrimination
N=11,821 Health careDiscrimination
N (%) Yes No
GeneralDiscrimination
Yes 370 (3.1) 3,597 (30.4)
No 185 (1.6) 7,669 (64.9)
p<0.001
Note: Percentages reflect the sample distributions, but p-value incorporates sampling weights. Total N reflects the number of respondents to bothdiscrimination items.
J Health Care Poor Underserved. Author manuscript; available in PMC 2011 April 13.
NIH
-PA Author Manuscript
NIH
-PA Author Manuscript
NIH
-PA Author Manuscript
Rees et al. Page 13
Table 2
Unadjusted Associations with Reports of Health care Discrimination
Health care Provider Discrimination
Total(n=17,795)
No(n=11,569)
Yes(n=582)
P-value
Race/Ethnicity (%) <.0001
Black 3,343 (20) 2,282 (20) 153 (27)
Latino 3,680 (23) 2,298 (20) 148 (26)
White 4,579 (27) 3,607 (31) 61 (11)
Asian 2,168 (13) 1,404 (12) 66 (12)
Filipino 1,956 (11) 1,219 (11) 102 (18)
Other race/ethnicity 1,189 (7) 653 (6) 41 (7)
Age (%) <.0001
<50 3,605 (21) 2,230 (20) 143 (25)
50-64 8,712 (50) 5,703 (51) 275 (49)
≥65 4,970 (29) 3,282 (29) 144 (26)
Male (%) 9,091 (51) 5,944 (51) 258 (44) .092
Education (%) .60
High school or less 8,103 (46) 4,775 (42) 240 (42)
Some college 4,243 (24) 2,955 (26) 166 (29)
College graduate or more 5,162 (29) 3,652 (32) 163 (29)
Income categories (%) <.0001
<$25,000 2,916 (19) 1,707 (16) 143 (27)
$25-49,999 4,345 (29) 2,957 (28) 171 (33)
$50-79,999 3,753 (25) 2,736 (26) 109 (21)
≥$80,000 4,082 (27) 3,064 (29) 98 (19)
Subjective social status (s.d.) 6.2 ±(2) 6.3 ±(2) 6.0 ±(2) <.0001
Mean Health Literacy (s.d.) 5.2 ±(2.6) 5.1 ±(2.9) 6.4 ±(3.1) <0.001
Disabled (%) 1,333 (8) 835 (7) 85 (15) .0004
Immigrant (%) 6,339 (37) 3,652 (32) 282 (49) <.0001
Limited English Proficient (%) 4,140 (23) 1,992 (17) 219 (38) <.0001
Emotional Instability (s.d.) 2.3 ±(0.9) 2.2 ±(0.9) 2.6 ±(0.9) <.0001
External Locus (s.d.) 2.1 ±(1) 2.0 ±(0.9) 2.4 ± (1) <.0001
Perceived Stress (s.d.) 8.7 ±(3.1) 8.5 ±(3.1) 10.4 ±(3.0) <0.001
Any Depression (%) 4,601 (37) 3,643 (35) 307 (60) <0.001
J Health Care Poor Underserved. Author manuscript; available in PMC 2011 April 13.

NIH
-PA Author Manuscript
NIH
-PA Author Manuscript
NIH
-PA Author Manuscript
Rees et al. Page 14
Health care Provider Discrimination
Total(n=17,795)
No(n=11,569)
Yes(n=582)
P-value
Mean PCS score (s.d.) 5.2 ±(2.6) 5.1 ±(2.9) 6.4 ±(3.1) <0.001
Note: Percentages reflect the sample distributions, but p-values incorporate sampling weights. Covariates have varying amounts of missingresponses (i.e., do not always add up to total N for the column)
J Health Care Poor Underserved. Author manuscript; available in PMC 2011 April 13.

NIH
-PA Author Manuscript
NIH
-PA Author Manuscript
NIH
-PA Author Manuscript
Rees et al. Page 15
Tabl
e 3
Serie
s of A
djus
ted
Logi
stic
Reg
ress
ion
Mod
els E
xam
inin
g R
epor
ted
Hea
lth c
are
Dis
crim
inat
ion
Mod
el 1
OR
(95%
CI)
Mod
el 2
OR
(95%
CI)
Mod
el 3
OR
(95%
CI)
Mod
el 4
OR
(95%
CI)
Mod
el 5
OR
(95%
CI)
Rac
e/Et
hnic
ity
W
hite
Ref
Ref
Ref
Ref
Ref
B
lack
3.99
(2.7
8, 5
.73)
*3.
92 (2
.72,
5.6
6)*
4.05
(2.7
9, 5
.88)
*4.
49 (3
.02,
6.6
9)*
2.86
(1.9
3, 4
.22)
*
La
tino
3.03
(2.0
2, 4
.53)
*2.
51 (1
.65,
3.8
3)*
2.50
(1.6
4, 3
.83)
*2.
79 (1
.75,
4.4
4)*
2.17
(1.4
0, 3
.37)
*
A
sian
2.53
(1.6
1, 3
.98)
*2.
13 (1
.35,
3.3
6)*
2.08
(1.3
1, 3
.31)
*2.
58 (1
.55,
4.2
8)*
1.95
(1.2
0, 3
.16)
*
Fi
lipin
o4.
60 (2
.96,
7.1
4)*
4.16
(2.6
2, 6
.60)
*3.
94 (2
.45,
6.3
5)*
4.13
(2.4
9, 6
.85)
*2.
82 (1
.72,
4.6
2)*
O
ther
3.15
(1.8
0, 5
.51)
*2.
89 (1
.64,
5.1
0)*
2.84
(1.6
1, 5
.02)
*3.
11 (1
.72,
5.6
4)*
2.42
(1.3
5, 4
.34)
*
Inco
me
<$
25,0
00R
efR
efR
efR
efR
ef
$2
5,00
0-$4
9,99
90.
97 (0
.69,
1.3
6)1.
00 (0
.71,
1.4
1)1.
04 (0
.73,
1.4
7)1.
19 (0
.82,
1.7
1)1.
16 (0
.80,
1.6
9)
$5
0,00
0-$7
9,99
90.
78 (0
.52,
1.1
6)0.
83 (0
.56,
1.2
4)0.
94 (0
.63,
1.4
1)1.
19 (0
.79,
1.7
9)1.
20 (0
.79,
1.8
2)
≥
$80,
000
0.88
(0.5
5, 1
.40)
0.95
(0.5
9, 1
.52)
1.11
(0.6
9, 1
.78)
1.51
(0.9
3, 2
.44)
1.54
(0.9
3, 2
.54)
Educ
atio
n
≤H
igh
scho
olR
efR
efR
efR
efR
ef
So
me
colle
ge1.
18 (0
.86,
1.6
2)1.
21 (0
.88,
1.6
6)1.
18 (0
.85,
1.6
3)1.
29 (0
.91,
1.8
2)1.
24 (0
.87,
1.7
5)
≥
Col
lege
gra
duat
e1.
19 (0
.82,
1.7
3)1.
20 (0
.83,
1.7
5)1.
16 (0
.78,
1.7
3)1.
33 (0
.88,
2.0
0)1.
26 (0
.83,
1.9
0)
Gen
der
Fe
mal
eR
efR
efR
efR
efR
ef
M
ale
1.28
(0.9
9, 1
.65)
1.27
(0.9
9, 1
.64)
1.22
(0.9
4, 1
.59)
1.10
(0.8
3, 1
.47)
1.12
(0.8
4, 1
.49)
Age
<5
01.
85 (1
.28,
2.6
9)*
1.80
(1.2
3, 2
.63)
*1.
61 (1
.09,
2.3
6)*
1.44
(0.9
1, 2
.27)
1.24
(0.7
8, 1
.98)
50
-64
1.19
(0.8
6, 1
.66)
1.17
(0.8
5, 1
.63)
1.10
(0.7
9, 1
.55)
0.96
(0.6
7, 1
.37)
0.86
(0.6
0, 1
.25)
≥
65R
efR
efR
efR
efR
ef
Hig
her s
ubje
ctiv
eso
cial
stat
us (1
-0.
96 (0
.88,
1.0
4)0.
97 (0
.89,
1.0
5)1.
00 (0
.92,
1.0
9)0.
98 (0
.90,
1.0
7)0.
99 (0
.90,
1.0
8)0.
96 (0
.88,
1.0
4)0.
97 (0
.89,
1.0
5)1.
00 (0
.92,
1.0
9)0.
98 (0
.90,
1.0
7)0.
99 (0
.90,
1.0
8)
J Health Care Poor Underserved. Author manuscript; available in PMC 2011 April 13.

NIH
-PA Author Manuscript
NIH
-PA Author Manuscript
NIH
-PA Author Manuscript
Rees et al. Page 16
Mod
el 1
OR
(95%
CI)
Mod
el 2
OR
(95%
CI)
Mod
el 3
OR
(95%
CI)
Mod
el 4
OR
(95%
CI)
Mod
el 5
OR
(95%
CI)
poin
t cha
nge)
Prob
lem
s with
Hea
lth L
itera
cy (1
-po
int c
hang
e)
1.16
(1.1
1, 1
.21)
*1.
13 (1
.08,
1.1
9)*
1.09
(1.0
4, 1
.15)
*1.
10 (1
.04,
1.1
6)*
1.10
(1.0
4, 1
.16)
*
Imm
igra
nt
N
oR
efR
efR
efR
ef
Y
es0.
87 (0
.62,
1.2
0)0.
90 (0
.65,
1.2
4)0.
99 (0
.71,
1.3
7)0.
92 (0
.66,
1.2
9)
LEP
N
oR
efR
efR
efR
ef
Y
es2.
03 (1
.42,
2.9
1)*
1.94
(1.3
5, 2
.79)
*1.
98 (1
.36,
2.8
7)*
1.91
(1.3
2, 2
.78)
*
Emot
iona
lIn
stab
ility
(1-p
oint
chan
ge)
1.18
(1.0
0, 1
.39)
*1.
10 (0
.92,
1.3
1)1.
07 (0
.90,
1.2
8)
Exte
rnal
Loc
us o
fC
ontro
l (1-
poin
tch
ange
)
1.04
(0.9
2, 1
.19)
1.09
(0.9
5, 1
.24)
1.10
(0.9
6, 1
.26)
Perc
eive
d St
ress
(1-p
oint
cha
nge)
1.11
(1.0
6, 1
.15)
*1.
06 (1
.01,
1.1
0)*
1.05
(0.9
9, 1
.10)
Dep
ress
ion
N
one
Ref
Ref
M
ild o
r abo
ve1.
67 (1
.20,
2.3
3)*
1.53
(1.1
0, 2
.13)
*
Dis
abili
ty
N
oR
efR
ef
Y
es1.
30 (0
.80,
2.1
1)1.
37 (0
.83,
2.2
4)
Phys
ical
Com
pone
nt S
core
(1-p
oint
cha
nge)
0.99
(0.9
7, 1
.00)
0.99
(0.9
7, 1
.00)
Gen
eral
Dis
crim
inat
ion
Non
eR
ef
J Health Care Poor Underserved. Author manuscript; available in PMC 2011 April 13.

NIH
-PA Author Manuscript
NIH
-PA Author Manuscript
NIH
-PA Author Manuscript
Rees et al. Page 17
Mod
el 1
OR
(95%
CI)
Mod
el 2
OR
(95%
CI)
Mod
el 3
OR
(95%
CI)
Mod
el 4
OR
(95%
CI)
Mod
el 5
OR
(95%
CI)
Any
2.42
(1.8
8, 3
.12)
*
All
mod
els i
ncor
pora
ted
surv
ey w
eigh
ting
Hig
her s
core
s on
subj
ectiv
e so
cial
stat
us in
dica
te h
ighe
r per
ceiv
ed so
cial
pos
ition
, and
hig
her s
core
s on
heal
th li
tera
cy in
dica
te w
orse
hea
lth li
tera
cy.
LEP
= Li
mite
d En
glis
h Pr
ofic
ienc
y
* indi
cate
s sig
nific
ance
of p
<0.0
5
J Health Care Poor Underserved. Author manuscript; available in PMC 2011 April 13.