Corpus-based Empirical Research in Software Engineering
260
Ekaterina Pek Corpus-based Empirical Research in Software Engineering Dissertation Koblenz, October 2013 Department of Computer Science Universität Koblenz-Landau
-
Upload
khangminh22 -
Category
Documents
-
view
0 -
download
0
Transcript of Corpus-based Empirical Research in Software Engineering

Ekaterina Pek
Corpus-basedEmpirical Researchin Software Engineering
Dissertation
Koblenz, October 2013
Department of Computer ScienceUniversität Koblenz-Landau

Ekaterina Pek
Corpus-based Empirical Research in Software Engineering

When someone is seeking, it happens quite easily that he only sees thething that he is seeking; that he is unable to find anything, unable to absorbanything, because he is only thinking of the thing he is seeking, becausehe has a goal, because he is obsessed with his goal. Seeking means: tohave a goal; but finding means: to be free, to be receptive, to have no goal.
Herman Hesse, Siddhartha1
1 Translation by Hilda Rosner


Acknowledgments
First of all, I am very grateful to my supervisor, Prof. Dr. Ralf Lämmel, for his guid-ance, support, and patience during these years. I am very glad that I had a chanceto work with Ralf, learn from his experience and wisdom, and grow professionallyunder his supervision, as well as appreciate his friendly personality.
I am grateful to my co-authors: Jean-Marie Favre, Dragan Gaševic, Rufus Linke,Jürgen Starek, and Andrei Varanovich, working with whom was a great intellectualpleasure.
No man is an island: I would like to thank my ex-boyfriend, Vladimir, for hisgreat help and support during my PhD; my then-colleagues at the University ofKoblenz for their company, thoughts, and time: my gratitude goes especially to An-drei Varanovich, Claudia Schon, and Sabine Hülstrunk.
I gratefully acknowledge the support of my work by the Rhineland Palatinate’sResearch Initiative 2008-2011, the ADAPT research focus, and the University ofKoblenz-Landau.
August 2013 Ekaterina Pek


Abstract
In the recent years, Software Engineering research has shown the rise of interestin the empirical studies. Such studies are often based on empirical evidence derivedfrom corpora—collections of software artifacts. While there are established forms ofcarrying out empirical research (experiments, case studies, surveys, etc.), the com-mon task of preparing the underlying collection of software artifacts is typically ad-dressed in ad hoc manner.
In this thesis, by means of a literature survey we show how frequently SoftwareEngineering research employs software corpora and using a developed classificationscheme we discuss their characteristics. Addressing the lack of methodology, wesuggest a method of corpus (re-)engineering and apply it to an existing collection ofJava projects.
We report two extensive empirical studies, where we perform a broad and di-verse range of analyses on the language for privacy preferences (P3P) and on object-oriented application programming interfaces (APIs). In both cases, we are driven bythe data at hand—by the corpus itself—discovering the actual usage of the languages.


Zusammenfassung
In den letzten Jahren gibt es im Bereich Software Engineering ein steigendesInteresse an empirischen Studien. Solche Studien stützen sich häufig auf empirischeDaten aus Corpora—Sammlungen von Software-Artefakten. Während es etablierteFormen der Durchführung solcher Studien gibt, wie z.B. Experimente, Fallstudienund Umfragen, geschieht die Vorbereitung der zugrunde liegenden Sammlung vonSoftware-Artefakten in der Regel ad hoc.
In der vorliegenden Arbeit wird mittels einer Literaturrecherche gezeigt, wiehäufig die Forschung im Bereich Software Engineering Software Corpora benutzt.Es wird ein Klassifikationsschema entwickelt, um Eigenschaften von Corpora zubeschreiben und zu diskutieren. Es wird auch erstmals eine Methode des Corpus(Re-)Engineering entwickelt und auf eine bestehende Sammlung von Java-Projektenangewendet.
Die Arbeit legt zwei umfassende empirische Studien vor, in denen eine umfang-reiche und breit angelegte Analysenreihe zu den Sprachen Privacy Preferences (P3P)und objektorientierte Programmierschnittstellen (APIs) durchgeführt wird. BeideStudien stützen sich allein auf die vorliegenden Daten der Corpora und decken da-durch die tatsächliche Nutzung der Sprachen auf.


Contents
1 Introduction . . . . . . . . . . . . . . . . . . . . . . . . . . . . . . . . . . . . . . . . . . . . . . . . . . . 11.1 Research Context . . . . . . . . . . . . . . . . . . . . . . . . . . . . . . . . . . . . . . . . . . . 11.2 Problem Statement . . . . . . . . . . . . . . . . . . . . . . . . . . . . . . . . . . . . . . . . . 31.3 Outline of the Thesis . . . . . . . . . . . . . . . . . . . . . . . . . . . . . . . . . . . . . . . . 51.4 Contributions of the Thesis . . . . . . . . . . . . . . . . . . . . . . . . . . . . . . . . . . 81.5 Supporting Publications . . . . . . . . . . . . . . . . . . . . . . . . . . . . . . . . . . . . . 9
Part I Prerequisites
2 Essential Background . . . . . . . . . . . . . . . . . . . . . . . . . . . . . . . . . . . . . . . . . . 132.1 Software Linguistics . . . . . . . . . . . . . . . . . . . . . . . . . . . . . . . . . . . . . . . . 14
2.1.1 Stances in Software Language Engineering . . . . . . . . . . . . . . 142.1.2 Examples of Linguistic Sub-disciplines . . . . . . . . . . . . . . . . . . 15
2.2 Actual Usage of Language . . . . . . . . . . . . . . . . . . . . . . . . . . . . . . . . . . . 162.2.1 Prescriptive and Descriptive Linguistics . . . . . . . . . . . . . . . . . 162.2.2 Measuring Actual Usage . . . . . . . . . . . . . . . . . . . . . . . . . . . . . . 17
2.3 Languages Under Study . . . . . . . . . . . . . . . . . . . . . . . . . . . . . . . . . . . . . 212.3.1 Platform for Privacy Preferences . . . . . . . . . . . . . . . . . . . . . . . 212.3.2 Application Programming Interfaces . . . . . . . . . . . . . . . . . . . . 22
2.4 Corpus Engineering . . . . . . . . . . . . . . . . . . . . . . . . . . . . . . . . . . . . . . . . . 242.4.1 Corpora in Natural Linguistics . . . . . . . . . . . . . . . . . . . . . . . . . 242.4.2 Corpora in Software Linguistics . . . . . . . . . . . . . . . . . . . . . . . . 252.4.3 Corpora versus Software Repositories . . . . . . . . . . . . . . . . . . . 28
2.5 Literature Surveys . . . . . . . . . . . . . . . . . . . . . . . . . . . . . . . . . . . . . . . . . . 292.5.1 Systematic Literature Reviews . . . . . . . . . . . . . . . . . . . . . . . . . 292.5.2 Content and Meta-analysis . . . . . . . . . . . . . . . . . . . . . . . . . . . . 302.5.3 Grounded Theory . . . . . . . . . . . . . . . . . . . . . . . . . . . . . . . . . . . . 302.5.4 Survey Process . . . . . . . . . . . . . . . . . . . . . . . . . . . . . . . . . . . . . . 31

XIV Contents
Part II Language Usage
3 A Study of P3P Language . . . . . . . . . . . . . . . . . . . . . . . . . . . . . . . . . . . . . . . 353.1 Introduction . . . . . . . . . . . . . . . . . . . . . . . . . . . . . . . . . . . . . . . . . . . . . . . 363.2 Methodology of the Study . . . . . . . . . . . . . . . . . . . . . . . . . . . . . . . . . . . 36
3.2.1 Research Questions . . . . . . . . . . . . . . . . . . . . . . . . . . . . . . . . . . 363.2.2 Corpus under Study . . . . . . . . . . . . . . . . . . . . . . . . . . . . . . . . . . 383.2.3 Leveraged Analyses . . . . . . . . . . . . . . . . . . . . . . . . . . . . . . . . . . 40
3.3 The Essence of P3P . . . . . . . . . . . . . . . . . . . . . . . . . . . . . . . . . . . . . . . . . 413.3.1 Language versus Platform . . . . . . . . . . . . . . . . . . . . . . . . . . . . . 423.3.2 Syntax of P3P . . . . . . . . . . . . . . . . . . . . . . . . . . . . . . . . . . . . . . . 423.3.3 A Normal Form . . . . . . . . . . . . . . . . . . . . . . . . . . . . . . . . . . . . . 463.3.4 Degree of Exposure . . . . . . . . . . . . . . . . . . . . . . . . . . . . . . . . . . 50
3.4 Analyses of the Study . . . . . . . . . . . . . . . . . . . . . . . . . . . . . . . . . . . . . . . 523.4.1 Analysis of Vocabulary . . . . . . . . . . . . . . . . . . . . . . . . . . . . . . . 523.4.2 Analysis of Constraints . . . . . . . . . . . . . . . . . . . . . . . . . . . . . . . 573.4.3 Analysis of Metrics . . . . . . . . . . . . . . . . . . . . . . . . . . . . . . . . . . 633.4.4 Analysis of Cloning . . . . . . . . . . . . . . . . . . . . . . . . . . . . . . . . . . 733.4.5 Analysis of Extensions . . . . . . . . . . . . . . . . . . . . . . . . . . . . . . . . 81
3.5 Threats to Validity . . . . . . . . . . . . . . . . . . . . . . . . . . . . . . . . . . . . . . . . . . 853.6 Related Work . . . . . . . . . . . . . . . . . . . . . . . . . . . . . . . . . . . . . . . . . . . . . . 863.7 Conclusion . . . . . . . . . . . . . . . . . . . . . . . . . . . . . . . . . . . . . . . . . . . . . . . . 89
4 A Study of APIs . . . . . . . . . . . . . . . . . . . . . . . . . . . . . . . . . . . . . . . . . . . . . . . . 914.1 Introduction . . . . . . . . . . . . . . . . . . . . . . . . . . . . . . . . . . . . . . . . . . . . . . . 924.2 Java APIs . . . . . . . . . . . . . . . . . . . . . . . . . . . . . . . . . . . . . . . . . . . . . . . . . 92
4.2.1 Overview of the Approach . . . . . . . . . . . . . . . . . . . . . . . . . . . . 934.2.2 A Study of SourceForge . . . . . . . . . . . . . . . . . . . . . . . . . . . . . . 944.2.3 Examples of API-usage Analysis . . . . . . . . . . . . . . . . . . . . . . . 97
4.3 .NET framework . . . . . . . . . . . . . . . . . . . . . . . . . . . . . . . . . . . . . . . . . . . 1054.3.1 Methodology . . . . . . . . . . . . . . . . . . . . . . . . . . . . . . . . . . . . . . . . 1064.3.2 Reuse-related Metrics for Frameworks . . . . . . . . . . . . . . . . . . 1084.3.3 Classification of Frameworks . . . . . . . . . . . . . . . . . . . . . . . . . . 1124.3.4 Comparison of Potential and Actual Reuse . . . . . . . . . . . . . . . 116
4.4 Multi-dimensional Exploration . . . . . . . . . . . . . . . . . . . . . . . . . . . . . . . 1194.4.1 An Exploration Story . . . . . . . . . . . . . . . . . . . . . . . . . . . . . . . . . 1204.4.2 Basic Concepts . . . . . . . . . . . . . . . . . . . . . . . . . . . . . . . . . . . . . . 1214.4.3 Exploration Insights . . . . . . . . . . . . . . . . . . . . . . . . . . . . . . . . . . 1244.4.4 Exploration Views . . . . . . . . . . . . . . . . . . . . . . . . . . . . . . . . . . . 1304.4.5 The EXAPUS Exploration Platform . . . . . . . . . . . . . . . . . . . . . 134
4.5 Threats to Validity . . . . . . . . . . . . . . . . . . . . . . . . . . . . . . . . . . . . . . . . . . 1354.6 Related Work . . . . . . . . . . . . . . . . . . . . . . . . . . . . . . . . . . . . . . . . . . . . . . 1364.7 Conclusion . . . . . . . . . . . . . . . . . . . . . . . . . . . . . . . . . . . . . . . . . . . . . . . . 139

Contents XV
Part III Corpus Engineering
5 Literature Survey of Empirical Software Engineering . . . . . . . . . . . . . . 1435.1 Introduction . . . . . . . . . . . . . . . . . . . . . . . . . . . . . . . . . . . . . . . . . . . . . . . 1445.2 Pilot Studies . . . . . . . . . . . . . . . . . . . . . . . . . . . . . . . . . . . . . . . . . . . . . . . 144
5.2.1 Survey on Empirical Language Analysis . . . . . . . . . . . . . . . . . 1455.2.2 Survey on Corpora Usage . . . . . . . . . . . . . . . . . . . . . . . . . . . . . 149
5.3 A Survey on Empirical Software Engineering . . . . . . . . . . . . . . . . . . . 1535.3.1 Methodology . . . . . . . . . . . . . . . . . . . . . . . . . . . . . . . . . . . . . . . . 1535.3.2 Results . . . . . . . . . . . . . . . . . . . . . . . . . . . . . . . . . . . . . . . . . . . . . 154
5.4 Threats to Validity . . . . . . . . . . . . . . . . . . . . . . . . . . . . . . . . . . . . . . . . . . 1685.5 Related Work . . . . . . . . . . . . . . . . . . . . . . . . . . . . . . . . . . . . . . . . . . . . . . 1695.6 Conclusion . . . . . . . . . . . . . . . . . . . . . . . . . . . . . . . . . . . . . . . . . . . . . . . . 172
6 Corpus (Re-)Engineering . . . . . . . . . . . . . . . . . . . . . . . . . . . . . . . . . . . . . . . 1756.1 Introduction . . . . . . . . . . . . . . . . . . . . . . . . . . . . . . . . . . . . . . . . . . . . . . . 176
6.1.1 Benefits of Using an Established Corpus . . . . . . . . . . . . . . . . . 1766.1.2 Obstacles to Corpus Adoption . . . . . . . . . . . . . . . . . . . . . . . . . 177
6.2 A Method for Corpus (Re-)Engineering . . . . . . . . . . . . . . . . . . . . . . . . 1776.2.1 Underlying Concepts . . . . . . . . . . . . . . . . . . . . . . . . . . . . . . . . . 1776.2.2 Method . . . . . . . . . . . . . . . . . . . . . . . . . . . . . . . . . . . . . . . . . . . . 178
6.3 Reengineering Qualitas . . . . . . . . . . . . . . . . . . . . . . . . . . . . . . . . . . . . . . 1796.3.1 Details of Qualitas Content . . . . . . . . . . . . . . . . . . . . . . . . . . . . 1796.3.2 Exploratory Builds . . . . . . . . . . . . . . . . . . . . . . . . . . . . . . . . . . . 1806.3.3 Identifying Core Files and Types . . . . . . . . . . . . . . . . . . . . . . . 1816.3.4 Identifying System Namespaces . . . . . . . . . . . . . . . . . . . . . . . . 1836.3.5 Builds . . . . . . . . . . . . . . . . . . . . . . . . . . . . . . . . . . . . . . . . . . . . . . 1856.3.6 Validation . . . . . . . . . . . . . . . . . . . . . . . . . . . . . . . . . . . . . . . . . . 1876.3.7 Automated Fact Extraction . . . . . . . . . . . . . . . . . . . . . . . . . . . . 188
6.4 Threats to Validity . . . . . . . . . . . . . . . . . . . . . . . . . . . . . . . . . . . . . . . . . . 1886.5 Related Work . . . . . . . . . . . . . . . . . . . . . . . . . . . . . . . . . . . . . . . . . . . . . . 1886.6 Conclusion . . . . . . . . . . . . . . . . . . . . . . . . . . . . . . . . . . . . . . . . . . . . . . . . 190
Part IV Conclusion
7 Conclusion . . . . . . . . . . . . . . . . . . . . . . . . . . . . . . . . . . . . . . . . . . . . . . . . . . . . 1957.1 Summary . . . . . . . . . . . . . . . . . . . . . . . . . . . . . . . . . . . . . . . . . . . . . . . . . 1967.2 Future Work . . . . . . . . . . . . . . . . . . . . . . . . . . . . . . . . . . . . . . . . . . . . . . . 197
Own Publications . . . . . . . . . . . . . . . . . . . . . . . . . . . . . . . . . . . . . . . . . . . . . . . . . . 199
References . . . . . . . . . . . . . . . . . . . . . . . . . . . . . . . . . . . . . . . . . . . . . . . . . . . . . . . . . 201
Curriculum Vitae . . . . . . . . . . . . . . . . . . . . . . . . . . . . . . . . . . . . . . . . . . . . . . . . . . 213

XVI Contents
Appendix . . . . . . . . . . . . . . . . . . . . . . . . . . . . . . . . . . . . . . . . . . . . . . . . . . . . . . . . . . 217A.1 Appendix for Chapter 3 . . . . . . . . . . . . . . . . . . . . . . . . . . . . . . . . . . . . . 217
A.1.1 Additional Information on P3P Corpus . . . . . . . . . . . . . . . . . . 217A.1.2 Additional Information on P3P Semantics . . . . . . . . . . . . . . . . 222
A.2 Appendix for Chapter 4 . . . . . . . . . . . . . . . . . . . . . . . . . . . . . . . . . . . . . 227A.2.1 Additional Information on Java APIs . . . . . . . . . . . . . . . . . . . . 227A.2.2 Additional Information on .NET Framework . . . . . . . . . . . . . 232

1
Introduction
In this chapter, with the means of a motivating example, we identify research areasof interest, briefly discuss their challenges, formulate research goals, devise the planof attack, and, finally, outline the structure of the thesis.
1.1 Research Context
1.1.1 Motivating example
To motivate our research, we use an early example of an empirical study of FOR-TRAN programs [115] done by Knuth and his team in 1971. Knuth studied a sampleof applications “in an attempt to discover quantitatively ‘what programmers reallydo’.” In other words, Knuth’s study discovers the actual usage of the language (asis) in contrast to the recommended usage of the language (as should be). The goal ofthe study was to provide food for thought for compiler writers.
To collect a sample of FORTRAN applications, different strategies were used:
• “rummage in the waste-baskets and the recycling bins” (to obtain punched cardswith programs);
• “probe randomly among the semi-protected files stored on disks looking forsource text”;
• finally, post a man by the card reader asking users for a copy of their decks.
Each of the methods was reported to be unsatisfactory in its own way: waste-basketscontained undebugged programs, asking users for a copy involved a full explanationof the research objectives to each of the users. Nonetheless, a collection emerged, towhich Knuth and his team added some classical benchmarks, well-known libraries,and programs of their own group. They then proceeded to statistically analyze thecollected 250,000 cards (representing 440 programs) in order to get “a fairly clearconception of how FORTRAN is being used, and what compilers can do about it.”
For that, Knuth and his team used a combination of static and dynamic analyses.For instance, they statically calculated how often different types of statements occur
2 Introduction
and what are the specifics of their usage (how deep loops are, what is the nature ofassignments, what is the format of ‘if’ statements, etc.). The results showed that mostof the time, “compilers do surprisingly simple things.” Knuth and his team have alsoprofiled running programs by counting how many times statements were executed:thus, they have refined information on statement usage (e.g., that assignments in thereplacement style, i.e., A = B, occur more often in the initialization sections and notin the loops). Then, for a small subset of 17 random programs, Knuth and his teamhave closely analyzed the most time-consuming parts of the programs and have man-ually translated them into machine language using a collection of optimizations—tofind that in comparison to the original compiled version, they have gained a four- orfive-fold increase in speed.
Altogether, Knuth makes a point that compiler writers should be aware not onlyof the best and the worst cases, but also of an average case of programs. He ar-gues that complimentary to the common point of view—programmers should beinfluenced by what their compilers do—there should be an alternative point of viewstating that the design of compilers (and therefore of languages that they represent)should be strongly influenced by what programmers do.
Generalized, we find this stance logically and practically appealing: the actualusage of a software language should be taken into account when developing it. Pre-scriptive approach (how the language should be used—e.g., documentation and tuto-rials) should go hand in hand with descriptive approach (how the language is actuallyused—e.g., Knuth’s study). Such feedback loop allows language engineers to makeinformed decisions about future course of the language.
In our work, we follow the same motivation when understanding usage of dif-ferent software languages. We identify challenges of such research and the ways toovercome them.
1.1.2 Research areas
Using Knuth’s study as a representative example of the kind of research we report inour thesis, we identify the research areas that our work falls into.
Software Language Engineering
The focus of Knuth’s study is on a programming language, FORTRAN, and itsusers (programmers) as well as engineers (compiler writers). In that, the study be-longs to the research area of Software Language Engineering, which is concernedwith the software languages—artificial languages used in software development. Thedefinition of a software language that we consider in our thesis is intentionally broad:it includes general-purpose programming languages along with domain-specific lan-guages, modeling and metamodeling languages, as well as implicit approaches tolanguage definition such as application programming interfaces (APIs).1
1 Cf. the description of the scope of the International Software Language Engineering con-ference at http://planet-sl.org/sleconf/

1.2 Problem Statement 3
Software Language Engineering is considered to be about the systematic de-sign, implementation, deployment, and evolution of software languages [113]—i.e.,generally, the prescriptive approach dominates in the research area. Such studies asKnuth’s complement the typical approach by providing data about the actual usageof software languages—information essential for insights and reasoning about thecurrent state of affairs.
Empirical Research
Empirical research is usually perceived as taking one of the established forms withwell-defined protocol of the study and applied techniques: controlled and quasi-experiments, exploratory and confirmatory case studies, survey, ethnography, and ac-tion research [167, 170]. In a broader sense, which we consider in our thesis, empir-ical research includes any research based on collected evidence (quoted from [167],emphasis ours): “Empirical research seeks to explore, describe, predict, and explainnatural, social, or cognitive phenomena by using evidence based on observation orexperience. It involves obtaining and interpreting evidence by, e.g., experimentation,systematic observation, interviews or surveys, or by the careful examination of doc-uments or artifacts.”
Knuth’s study falls within such broadly understood, de facto empirical research:it uses collected software artifacts to derive and analyze empirical evidence with thepurpose of exploring and describing the typical use of the FORTRAN language sothat to predict the input for compilers.
1.2 Problem Statement
As Knuth’s example shows, empirical study of a software language involves twodistinct phases: collecting the evidence2 (punch cards) and analyzing it to answer thequestions at hand (how FORTRAN is being used). Below, we discuss each phase,identify its intrinsic challenges, and connect each phase with its research area(s)(see Fig. 1.1).
1.2.1 Phase I – Collecting the evidence
Knuth’s study has a software language as its object of interest and in order todraw conclusions about the language, Knuth analyzes the language instances—programs—obtained via various ways from the programmers. The obstacles thatKnuth had to overcome when collecting the evidence are not exceptional: the moresophisticated and demanding the applied analysis is, the more time the researcherspends preparing the collection of empirical evidence for it. The lack of common
2 The term ‘evidence’ can take one of the two meanings: i) in a stricter sense, data derivedanalytically from the collected artifacts; ii) in a broader sense, it means collected softwareartifacts, too. Throughout the thesis, we imply the second, broader, definition.

4 Introduction
Empirical Research Software
Engineering
Software Language
Engineering
I. Collecting evidence
II. Analysis of actuallanguage usage
Phases of Knuth’s study
Research areas
A
B
Figure 1.1. Phases of the motivating study and their correspondence to research areas
methodology covering this basic step makes researchers to possibly repeat the sameactions collecting possibly the same evidence. Based on the level of existing demand,having public shared collections might be an option.
In Knuth’s study, the phase of collecting the evidence serves the purpose of ana-lyzing actual usage of a programming language. In other words, the evidence is col-lected for an empirical task of Software Language Engineering (area B on Fig. 1.1).Nonetheless, collecting the evidence is often required for empirical tasks of SoftwareEngineering as such (area A on Fig. 1.1), especially when those are of practical kind,explicitly using software in their analyses: program comprehension, maintenance,reverse engineering, and re-engineering.
1.2.2 Phase II – Analyzing the evidence
We have identified Knuth’s study as an empirical task of software language engineer-ing (area B on Fig. 1.1) with the aim to discover the actual usage of the language.Software Language Engineering typically treats languages as software and for thatadopts concepts and techniques from Software Engineering. For the actual usageanalysis, these might not be fully suitable and sufficient as there are intrinsic charac-teristics of a language that are different from that of software. Indeed, in his study,Knuth applied Software Engineering techniques such as statical and dynamic analy-ses to collect the raw data (by parsing, profiling, debugging) but the applied analysesproviding the insights were defined by the structure of the language.

1.3 Outline of the Thesis 5
1.2.3 Research goals of the thesis
Using Knuth’s example, we have shown how generalized phases of such study relateto the research areas. Namely, we have identified collecting empirical evidence asa common task for empirical research in both Software Engineering and SoftwareLanguage Engineering. We have also established that empirical analysis of the actuallanguage usage belongs to Software Language Engineering. Based on the observedchallenges in the identified phases, we pose two main research goals of the thesisthat can be linked back to the phases of the motivating example of Knuth’s study,though in the reversed order:
1. Develop and apply techniques to empirically analyze actual usage of languages.
2. Understand the usage of empirical evidence in Software Engineering research.
Below we break down the goals into the plan of attack.
• To address the first goal, we perform empirical studies on actual language usageso that to understand the necessities of such research and gain hands-on expe-rience. For that, we analyze actual usage of several software languages. In eachcase, the research tasks vary depending on the application domain of the lan-guage. During these studies, we develop and apply different kinds of analysesthat are tailored to the software languages as such.
• To address the second goal, we need to understand how common is the taskof collecting empirical evidence in Software Engineering research and what arethe characteristics of the collected evidence. For that, we analyze the existingresearch by performing literature surveys of published papers.
• To bring the two research goals together, based on our experience gained in theempirical studies of actual language usage, we identify obstacles in the process ofcollecting empirical evidence and ways to overcome them. Namely, we identifyrequirements and obstacles we have encountered during the empirical studieson API usage analysis3 and summarize our knowledge in a method of corpus(re-)engineering.
1.3 Outline of the Thesis
Figure 1.2 shows the structure of the thesis and connections between its components.The main two parts, Part II and Part III, correspond to the research goals of the thesis.Each part consists of two chapters. Arrows between chapters and parts show flow ofknowledge. For instance, the experience gained during studies on actual languageusage influenced our stance on corpus engineering. The developed methodology ofcorpus engineering and its result (a corpus)—in its turn—were used in the advancedstudy of API usage.
3 On the definition of APIs as domain-specific languages see Section 2.3.2.

Part I: Prerequisites
Part II: Language UsagePart III: Corpus Engineering
Part IV: Conclusion
Chapter 2Essential background
Chapter 5Literature surveys
Chapter 3Study of P3P language
Chapter 4Study of APIs
Chapter 6Corpus engineering
Chapter 7Conclusion
Figure 1.2. Connections between the chapters of the thesis

1.3 Outline of the Thesis 7
The detailed break-down of the thesis structure is as follows:
Part I, PrerequisitesChapter 2 provides essential background for the rest of the thesis. We discuss
Software Linguistics and the actual usage of a language. We provide an overview ofthe languages studied in the thesis. We introduce terminology for corpus engineering.We identify and compare possible ways of conducting a literature survey.
Part II, Language UseThis part presents the results of our research on language use. The studies coming
from different application domains and having different motivations demonstrate thesame language-centric approach to a problem.
Chapter 3 presents an empirical study of the P3P language, a domain-specificlanguage for privacy policies. We selected this language because there is growingrecognition that users of web-based systems want to understand, if not to control,which of their data is stored, by whom, for what purpose, for what duration, and withwhom it is shared. We devise and apply methods to study usage profiles, correctnessof policies, metrics, cloning, and language extensions.
Chapter 4 presents an empirical study of API usage. We begin with an initial ex-ploration of the topic in the context of open-source Java projects, where we demon-strate examples of large-scale API usage analysis and detect different styles of us-age (framework-like vs. library-like). We investigate further framework usage bydeveloping a framework profile—a range of reuse-related metrics to measure the as-implemented design and its usage—and applying it to the Microsoft .NET Frame-work. Finally, based on the developed analyses, we introduce a catalogue of explo-ration activities to capture API usage accompanied by a tool.
Part III, Corpus EngineeringThis part describes our study on existing use of software artifacts in empirical
Software Engineering and our method for corpus (re-)engineering. The literaturesurveys assess the existing demand for corpora in contemporary research—whichmotivates our efforts in providing matching supply in the area of our expertise.
Chapter 5 describes literature surveys that we carry out in order to understandthe existing usage of empirical evidence in Software Engineering. We collect andanalyze published papers, extracting signs and characteristics of used empirical evi-dence. We discover that more than 80% of papers in Software Engineering researchuse software projects as empirical evidence.
Chapter 6 describes our effort on corpus (re-)engineering. The discovered de-mand for corpora motivates us to provide matching supply. In this chapter, we iden-tify obstacles to corpus adoption based on our own experience (see Chapter 4) anddevelop a method for comprehending and improving corpus content, producing acomplete, automatically buildable corpus, with extended metadata. We apply themethod to the Qualitas corpus [175], whose adoption is thereby simplified.
Part IV, ConclusionChapter 7 concludes the thesis.
8 Introduction
1.4 Contributions of the Thesis
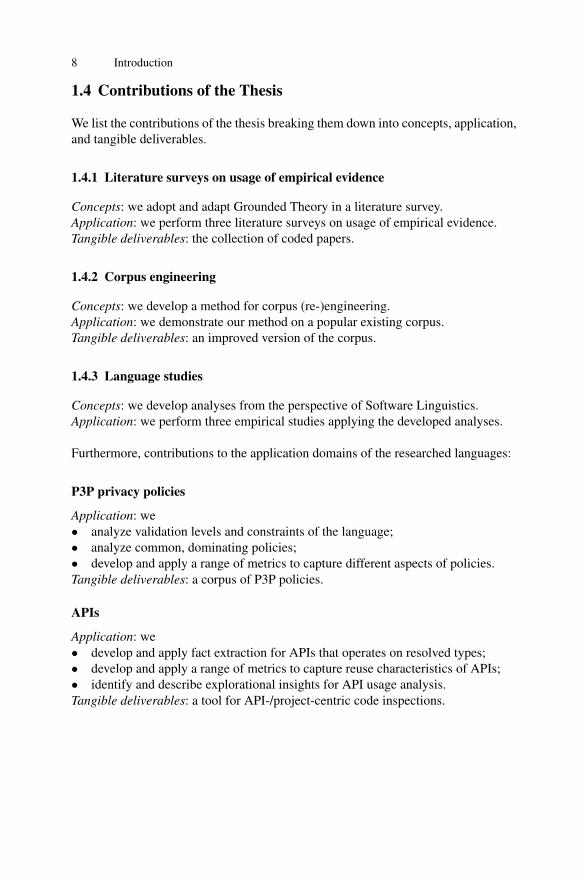
We list the contributions of the thesis breaking them down into concepts, application,and tangible deliverables.
1.4.1 Literature surveys on usage of empirical evidence
Concepts: we adopt and adapt Grounded Theory in a literature survey.Application: we perform three literature surveys on usage of empirical evidence.Tangible deliverables: the collection of coded papers.
1.4.2 Corpus engineering
Concepts: we develop a method for corpus (re-)engineering.Application: we demonstrate our method on a popular existing corpus.Tangible deliverables: an improved version of the corpus.
1.4.3 Language studies
Concepts: we develop analyses from the perspective of Software Linguistics.Application: we perform three empirical studies applying the developed analyses.
Furthermore, contributions to the application domains of the researched languages:
P3P privacy policies
Application: we• analyze validation levels and constraints of the language;• analyze common, dominating policies;• develop and apply a range of metrics to capture different aspects of policies.Tangible deliverables: a corpus of P3P policies.
APIs
Application: we• develop and apply fact extraction for APIs that operates on resolved types;• develop and apply a range of metrics to capture reuse characteristics of APIs;• identify and describe explorational insights for API usage analysis.Tangible deliverables: a tool for API-/project-centric code inspections.

1.5 Supporting Publications 9
1.5 Supporting Publications
The thesis is supported by the following publications, listed in the chronologicalorder:
1 Ralf Lämmel and Ekaterina Pek. Vivisection of a non-executable, domain-specificlanguage - Understanding (the usage of) the P3P language. In Proceedings of the18th International Conference on Program Comprehension (ICPC), pages 104–113. IEEE Computer Society, 2010.
2 Jean-Marie Favre, Dragan Gaševic, Ralf Lämmel, and Ekaterina Pek. Empiricallanguage analysis in software linguistics. In Brian A. Malloy, Steffen Staab, andMark van den Brand, editors, Proceedings of the 3rd International Conference onSoftware Language Engineering (SLE), volume 6563 of Lecture Notes in Com-puter Science, pages 316–326. Springer, 2011.
3 Ralf Lämmel, Rufus Linke, Ekaterina Pek, and Andrei Varanovich. A frameworkprofile of .NET. In Martin Pinzger, Denys Poshyvanyk, and Jim Buckley, editors,Proceedings of the 18th Working Conference on Reverse Engineering (WCRE),pages 141–150. IEEE Computer Society, 2011.
4 Ralf Lämmel, Ekaterina Pek, and Jürgen Starek. Large-scale, AST-based API-usage analysis of open-source Java projects. In William C. Chu, W. Eric Wong,Mathew J. Palakal, and Chih-Cheng Hung, editors, Proceedings of the 26th Sym-posium on Applied Computing (SAC), pages 1317–1324. ACM, 2011.
5 Ralf Lämmel and Ekaterina Pek. Understanding privacy policies - A study in em-pirical analysis of language usage. Empirical Software Engineering, 18(2):310–374, 2013.
6 Coen De Roover, Ralf Lämmel and Ekaterina Pek. Multi-dimensional explorationof API usage. In Proceedings of the 18th International Conference on ProgramComprehension (ICPC), 2013. 10 pages. To appear.
The following work being under submission:
7 Ekaterina Pek and Ralf Lämmel. A literature survey on empirical software engi-neering research. 10 pages.
The relation between publications and chapters is as follows:
• Chapter 3 is supported by publications [1, 5].• Chapter 4 is supported by publications [3, 4, 6].• Chapter 5 is supported by publication [2]. Main part of the chapter (the final
survey) is the work under submission [7].• Chapter 6 is supported by publication [6].


Part I
Prerequisites


2
Essential Background
In this chapter, we provide essential background for the rest of the thesis. We discussSoftware Linguistics and the actual usage of a language. We provide an overview ofthe languages studied in the thesis. We introduce terminology for corpus engineering.We identify and compare possible ways of conducting a literature survey.
Road-map of the chapter
• Section 2.1 discusses Software Linguistics.• Section 2.2 provides terminology for actual usage of languages.• Section 2.3 introduces software languages being analyzed.• Section 2.4 discusses corpus engineering.• Section 2.5 gives an overview of survey methodology.

14 Essential Background
2.1 Software Linguistics
In this section, we discuss Software Linguistics, a research stance complementary tothe one adopted in the community of Software Language Engineering. We discusshow existing science of Natural Linguistics can be inspirational for Software Lin-guistics: we consider examples of sub-disciplines not necessarily exercised in thisthesis but helpful for understanding the spirit in which it is done.
2.1.1 Stances in Software Language Engineering1
Software Language Engineering, or “Software Languages are Software too”
Software language descriptions and processors are pieces of software. Hence, allkinds of Software Engineering concepts and techniques can be adopted to softwarelanguages. Software Language Engineering is about the systematic design, imple-mentation, deployment, and evolution of software languages [113]. Clearly, softwarelanguage descriptions have particular properties, when compared to other kinds of ar-tifacts in software engineering. Hence, traditional software engineering life-cycles,methods, set of qualities and constraints must be genuinely adapted. If we think aboutthe distinction of software languages vs. natural languages, then Software LanguageEngineering can be compared to the established field of Natural Language Engineer-ing [46, 68].
Software Linguistics, or “Software Languages are Languages too”
Software Language Engineering practices should be informed by scientific knowl-edge. In the case of natural languages, linguistics is the science of languages [45].Hence, it is worth to see which concepts, research methods, perhaps even techniquesor results from the field of linguistics could be adopted to the study of softwarelanguages. In this manner, we obtain “Software Linguistics”. The term Software Lin-guistics was introduced by Misek-Falkoff in 1982 [140]. This term and the wholeconcept of adopting linguistics for software (programming) languages has not seenmuch interest. We note that Software Linguistics should not be confused with Com-putational Linguistics—the former is “linguistics for software languages”; the latteris (simply speaking) “computing for linguistics” (for natural languages).
Below, we give examples of the broader understanding and definition of Soft-ware Linguistics—through references to Natural Linguistics. We have found thatthe mature, scientific framework provided by linguistics can be reused for softwarelanguages—even though many techniques related to natural languages may not be(directly) applicable. In fact, one can systematically mine Software Linguistics fromresources such as “The Cambridge encyclopedia of language” [45].
1 This subsection is based on own publication [2].

2.1 Software Linguistics 15
2.1.2 Examples of Linguistic Sub-disciplines2
Comparative linguistics
Comparative linguistics studies, compares and classifies languages according to theirfeatures using either a quantitative or qualitative approach. It aims at identifying pat-terns that are recurrent in different languages, but also differences and relationshipsbetween languages. Comparative linguistics may also be applied to software lan-guages. For instance, “Programming Linguistics” [50] compares programming lan-guages in terms of commonalities, relationships, and differences while discussingbasic matters of syntax, semantics, and styles. “The comparison of programminglanguages: A linguistic approach” [79] goes deeper into linguistic aspects.
444 • B. G. Ryder et al.
Fig. 1. Time line for data abstraction.
layer of semantic checking of a program. Development of strong typing inprogramming languages happened cotemporally with software engineering re-search on reliability and later, software reuse. It seems clear that the conceptsof strong typing and software reliability reinforced each other, especially sincethe early pioneers in imperative language design were also active in softwareengineering research. Further, as type systems for programming languages de-veloped notions of genericity and polymorphism, these were directly related toissues of software reuse.
The main imperative languages designed in the 1960s and 1970s—Algol 60,Pascal, and PL/I—were designed at a time when the software engineering com-munity was worried about the reliability of code. In the mid-1970s, Barry Boehmdefined software engineering to be “the practical application of scientific knowl-edge in the design and construction of computer programs and the associateddocumentation required to develop, operate and maintain them” [Boehm 1976].Peter Wegner [1984] talked of the 1950s as a time of stand-alone programsand the 1960s as a time of development of operating systems and databases.He stated that the 1970s saw the birth of software engineering, referring tosimilarities in the construction of large software systems and large physicalstructures such as bridges. The 1980s, in Wegner’s view, saw the developmentof interface technologies and the personal computer revolution. The 1990s wasa time of knowledge engineering, the use of intelligent components to build sys-tems (e.g., adaptation). In this temporal framework, the 1970s—the era of Algol60 and Pascal—was a key time for software engineering, so that the design ofstrongly typed languages, which were type safe, coincided with the beginningof the discipline of engineering software.
C.A.R. Hoare, a member of the IFIP Working Group in Algol (WG 2.1) activein the original design of Algol 68 [Bergin and Gibson 1996], was the keynote
ACM Transactions on Software Engineering and Methodology, Vol. 14, No. 4, October 2005.
Figure 2.1. Historical linguistics: Time line for data abstraction as presented by Ryder et al.in [19]
Historical linguistics
Historical linguistics studies the history and evolution of languages—often with thegoal of identifying language families, that is, languages that derive from a commonancestor. Part of this research compensates for the lost origin of natural languages.
2 This subsection is based on own publication [2].

16 Essential Background
In the case of software languages, history is often well documented. Consider, forexample, the History of Programming Languages (HOPL) conference series. HOPLfocuses on programming languages rather than software languages in general. Also,HOPL does not stipulate systematic linguistics studies; a typical paper relies on his-torical accounts by the primary language designers. Some reports, though, provide alarge set of qualitative information regarding the evolution of dialects of languages,e.g., see Figure 2.1 showing the time line for data abstraction as presented by Ry-der et al. in [19]. The impact of the evolution of software languages on softwareevolution, though real, is not well understood [62], and deserves more research in-spired by linguistics.
Geo-linguistics
Geo-linguistics studies the intersection of geography and linguistics. Studies can,for example, take into account the distribution of languages or dialects over coun-tries, continents, and regions. In work of Steele and Gabriel [169], for instance, theemergence of dialects of Lisp are considered in terms of geographical zones.
Socio-linguistics
Socio-linguistics studies languages as social and societal phenomena. The designof software languages and dialects is often directly linked to such phenomena, too.For instance, in [169] Steele and Gabriel conclude “Overall, the evolution of Lisphas been guided more by institutional rivalry, one-upsmanship, and the glee born oftechnical cleverness that is characteristic of the hacker culture than by sober assess-ments of technical requirements”. The field of socio-linguistics for software remainslargely unexplored, but see [27] for a related account.
2.2 Actual Usage of Language
In this section, we explore the part of Natural Linguistics related to the actual usageof a language, identify what we can borrow for Software Linguistics, and root theidentified terms and ideas in the research area of our interest.
2.2.1 Prescriptive and Descriptive Linguistics
A part of Natural Linguistics is concerned with developing models of linguisticknowledge; it looks for formalisms that are suited to represent the phenomena ofthe language. The points of view, though, could differ: represent the phenomena asthey are or as they should be. The latter line of practice, called prescriptive linguis-tics, aims to establish a standard language, e.g., for education and mass media. Theformer line of practice, called descriptive linguistics, aims to reveal the actual usageof the language [147].
2.2 Actual Usage of Language 17
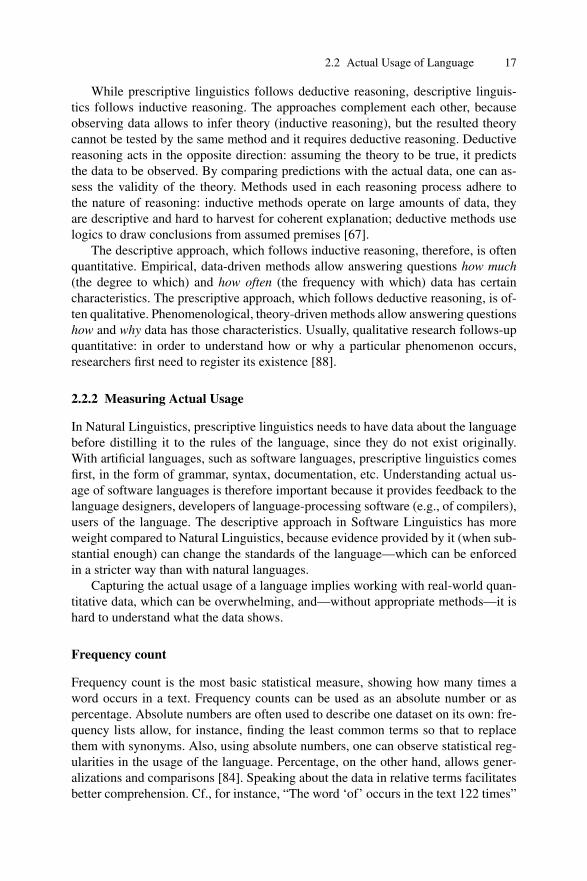
While prescriptive linguistics follows deductive reasoning, descriptive linguis-tics follows inductive reasoning. The approaches complement each other, becauseobserving data allows to infer theory (inductive reasoning), but the resulted theorycannot be tested by the same method and it requires deductive reasoning. Deductivereasoning acts in the opposite direction: assuming the theory to be true, it predictsthe data to be observed. By comparing predictions with the actual data, one can as-sess the validity of the theory. Methods used in each reasoning process adhere tothe nature of reasoning: inductive methods operate on large amounts of data, theyare descriptive and hard to harvest for coherent explanation; deductive methods uselogics to draw conclusions from assumed premises [67].
The descriptive approach, which follows inductive reasoning, therefore, is oftenquantitative. Empirical, data-driven methods allow answering questions how much(the degree to which) and how often (the frequency with which) data has certaincharacteristics. The prescriptive approach, which follows deductive reasoning, is of-ten qualitative. Phenomenological, theory-driven methods allow answering questionshow and why data has those characteristics. Usually, qualitative research follows-upquantitative: in order to understand how or why a particular phenomenon occurs,researchers first need to register its existence [88].
2.2.2 Measuring Actual Usage
In Natural Linguistics, prescriptive linguistics needs to have data about the languagebefore distilling it to the rules of the language, since they do not exist originally.With artificial languages, such as software languages, prescriptive linguistics comesfirst, in the form of grammar, syntax, documentation, etc. Understanding actual us-age of software languages is therefore important because it provides feedback to thelanguage designers, developers of language-processing software (e.g., of compilers),users of the language. The descriptive approach in Software Linguistics has moreweight compared to Natural Linguistics, because evidence provided by it (when sub-stantial enough) can change the standards of the language—which can be enforcedin a stricter way than with natural languages.
Capturing the actual usage of a language implies working with real-world quan-titative data, which can be overwhelming, and—without appropriate methods—it ishard to understand what the data shows.
Frequency count
Frequency count is the most basic statistical measure, showing how many times aword occurs in a text. Frequency counts can be used as an absolute number or aspercentage. Absolute numbers are often used to describe one dataset on its own: fre-quency lists allow, for instance, finding the least common terms so that to replacethem with synonyms. Also, using absolute numbers, one can observe statistical reg-ularities in the usage of the language. Percentage, on the other hand, allows gener-alizations and comparisons [84]. Speaking about the data in relative terms facilitatesbetter comprehension. Cf., for instance, “The word ‘of’ occurs in the text 122 times”
18 Essential Background
Rank Frequency Word
1 2944 the2 2632 of3 1130 to4 1043 a5 1036 in6 833 and7 741 for8 731 is9 631 that
10 566 are
Top 10 most frequent words Zipf’s law
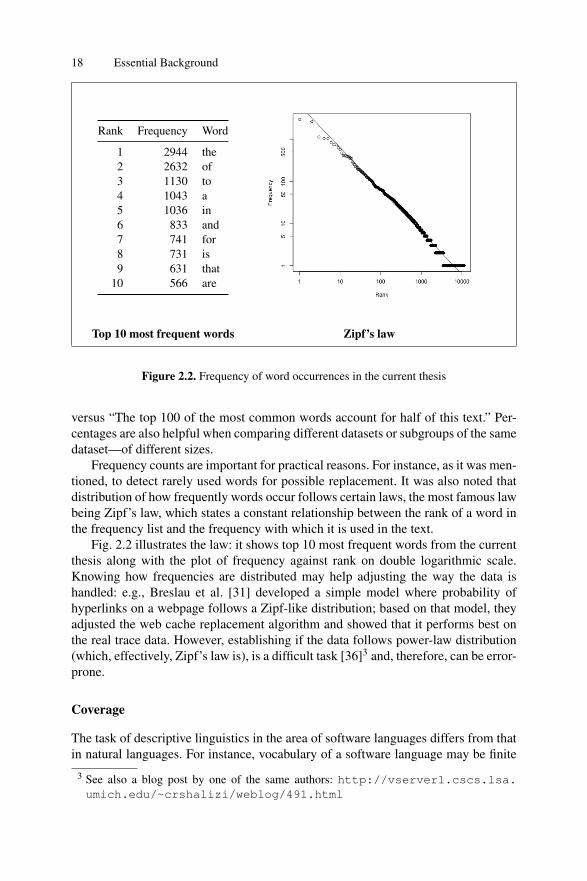
Figure 2.2. Frequency of word occurrences in the current thesis
versus “The top 100 of the most common words account for half of this text.” Per-centages are also helpful when comparing different datasets or subgroups of the samedataset—of different sizes.
Frequency counts are important for practical reasons. For instance, as it was men-tioned, to detect rarely used words for possible replacement. It was also noted thatdistribution of how frequently words occur follows certain laws, the most famous lawbeing Zipf’s law, which states a constant relationship between the rank of a word inthe frequency list and the frequency with which it is used in the text.
Fig. 2.2 illustrates the law: it shows top 10 most frequent words from the currentthesis along with the plot of frequency against rank on double logarithmic scale.Knowing how frequencies are distributed may help adjusting the way the data ishandled: e.g., Breslau et al. [31] developed a simple model where probability ofhyperlinks on a webpage follows a Zipf-like distribution; based on that model, theyadjusted the web cache replacement algorithm and showed that it performs best onthe real trace data. However, establishing if the data follows power-law distribution(which, effectively, Zipf’s law is), is a difficult task [36]3 and, therefore, can be error-prone.
Coverage
The task of descriptive linguistics in the area of software languages differs from thatin natural languages. For instance, vocabulary of a software language may be finite
3 See also a blog post by one of the same authors: http://vserver1.cscs.lsa.umich.edu/~crshalizi/weblog/491.html
2.2 Actual Usage of Language 19
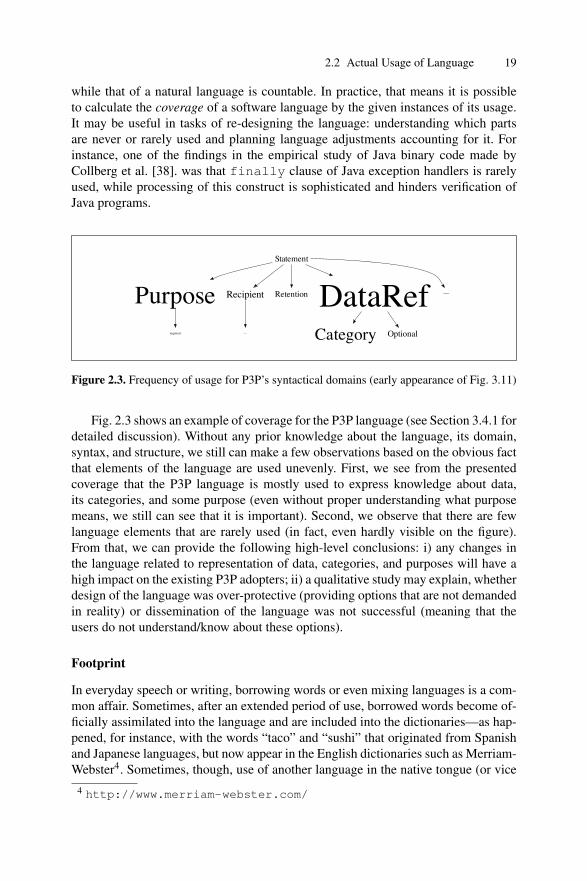
while that of a natural language is countable. In practice, that means it is possibleto calculate the coverage of a software language by the given instances of its usage.It may be useful in tasks of re-designing the language: understanding which partsare never or rarely used and planning language adjustments accounting for it. Forinstance, one of the findings in the empirical study of Java binary code made byCollberg et al. [38]. was that finally clause of Java exception handlers is rarelyused, while processing of this construct is sophisticated and hinders verification ofJava programs.
Statement
Purpose Recipient Retention DataRef Identifiable
required required Category Optional
Figure 2.3. Frequency of usage for P3P’s syntactical domains (early appearance of Fig. 3.11)
Fig. 2.3 shows an example of coverage for the P3P language (see Section 3.4.1 fordetailed discussion). Without any prior knowledge about the language, its domain,syntax, and structure, we still can make a few observations based on the obvious factthat elements of the language are used unevenly. First, we see from the presentedcoverage that the P3P language is mostly used to express knowledge about data,its categories, and some purpose (even without proper understanding what purposemeans, we still can see that it is important). Second, we observe that there are fewlanguage elements that are rarely used (in fact, even hardly visible on the figure).From that, we can provide the following high-level conclusions: i) any changes inthe language related to representation of data, categories, and purposes will have ahigh impact on the existing P3P adopters; ii) a qualitative study may explain, whetherdesign of the language was over-protective (providing options that are not demandedin reality) or dissemination of the language was not successful (meaning that theusers do not understand/know about these options).
Footprint
In everyday speech or writing, borrowing words or even mixing languages is a com-mon affair. Sometimes, after an extended period of use, borrowed words become of-ficially assimilated into the language and are included into the dictionaries—as hap-pened, for instance, with the words “taco” and “sushi” that originated from Spanishand Japanese languages, but now appear in the English dictionaries such as Merriam-Webster4. Sometimes, though, use of another language in the native tongue (or vice
4 http://www.merriam-webster.com/

20 Essential Background
versa) leads to creation of macaronic languages, where words and syntax of differentlanguages are intertwined. This often happens in the context of immigration: for in-stance, a flow of immigrants from Post-Soviet countries to Germany in early 1990sled to creation of Deutschrussisch, or Nemrus. Such languages exist only due to theiruse; they do not have textbooks or grammar rules.
In contrast to natural languages, software languages have clear and strong bound-aries; it is not possible to casually blend one software language into another. Still,software language can be embedded—often, the host language is a general-purposeprogramming language and the embedded language is a domain-specific one. In suchcases, a useful measure as footprint comes to help: measuring “contamination” ofprograms written in the host language—with the embedded language.
Figure 2.4. Footprint of APIs in ANTLR project
For instance, when programming with APIs (application programming inter-faces)5, it is useful to be able to assess API usage within a project. An exampleof footprint with respect to API usage is presented on Fig. 2.4. The figure representsa project-centric view provided by the tool Exapus (see Section 4.4). The view shows“contamination” of the source code of a project with references to APIs. We see thepackage tree of the source code of an example Java project, ANTLR6. Packages thatdo not contain any types are marked with the dotted line, otherwise the width of theborder is based on the total number of references to various APIs found in the pack-age. Such view allows quick assessment of the status of a project, when updatingversions of the used libraries or migrating between APIs. For instance, we observethat there are a few packages with small number of references to APIs. As a more spe-cific and more interesting observation, we notice that subpackages of the same parentpackage reference APIs differently. Within runtime package, subpackage misc
5 On the definition of APIs as domain-specific languages see Section 2.3.2.6 http://www.antlr.org/

2.3 Languages Under Study 21
references various APIs less than subpackages tree and debug: a possible expla-nation (based only on the names of the packages) is that utility for runtime-relatedtasks that misc subpackage contains is most probably internal, project-related func-tionality (therefore, no references to APIs). More intriguing is the situation withgrammar package: its subpackages v2 and v3 (apparently, representing versions)vary significantly in API consumption based on references. Without further inves-tigation, it is hard to suggest an explanation for this phenomenon: it might be, forinstance, that types in the next version of grammar derive from the previous version,therefore, hiding the API consumption via references.
Such footprint of API usage is the simplest (yet powerful) measure. We can fur-ther vary the scope so that to investigate a particular API or even its part. Moresophisticated forms of footprint can be done by considering API types implementedor extended by the project.
2.3 Languages Under Study
In this section we briefly describe the languages that will be the subject of empiricalstudies presented in Part II of the thesis (Chapters 3 and 4).
2.3.1 Platform for Privacy Preferences7
There is growing recognition that users of web-based systems want to understand,if not to control, which of their data is stored, by whom, for what purpose, for whatduration, and with whom it is shared. W3C’s standardization effort on the Platformfor Privacy Preferences (P3P) specifically produced the P3P language [189, 42] forprivacy policies, which can be viewed as a simple, domain-specific language forprivacy concerns of the users.
The P3P effort was started in 1996 and closed in 2006. P3P’s impact in the wildhas been limited [164, 43]: browser developers were slow to support the negotia-tion protocol of P3P so that it was even dropped from the standard; lack of industryparticipation resulted in the discontinuation of the standardization effort for the sec-ond, more matured version of P3P; these days, even major websites have invalid oressentially useless policies and some policies are removed.
There may be several reasons for such limited impact [194, 136]. One may spec-ulate about lack of stable knowledge of the web-privacy domain or lack of incentivefor the industry to support web privacy. (See [164, 43] for the discussion of suchcauses.) We adopt a language engineer’s point of view to better inform the discussionof limited impact of P3P and future language-based developments in the web-privacydomain. For that, we perform a vivisection of P3P.
7 This subsection is based on own publication [5].

22 Essential Background
P3P samples
Let us quickly introduce P3P by means of samples. The following two samples,except for minor variations, are very common in practice.
<POLICY><STATEMENT><NON-IDENTIFIABLE/>
</STATEMENT></POLICY>
Figure 2.5. P3P sample ‘full privacy’
The policy in Fig. 2.5 applies to a website with ‘full privacy’. This policy, withoutany data references and with the special NON-IDENTIFIABLE element, signifiesthat the underlying web-based system does not collect any data.8
Usually a P3P policy consists of any number of statements—each of which sig-nifies data references for the collected data, purposes of collecting data, recipientsthat receive the data, a retention level, which defines how long data is stored, and afew other directives.
The policy in Fig. 2.6 applies to a website which performs ‘logging’ but collectsno other data. More in detail, the specific data reference #dynamic.clickstream sig-nifies that the website collects and stores information for Web-server access logs, and#dynamic.http is about information carried by the HTTP protocol which is not cov-ered by #dynamic.clickstream. User data, in the more narrow sense, is not collectedand stored. The purposes admin and develop mean that (weblog data) is collectedfor the website’s benefit—the user will not be contacted or affected in any way. Thepurpose current is whatever user and system consider the more specific purpose ofthe system—be it filling in and sending out birthday cards. The only recipient of thedata is ’ours’, which essentially corresponds to the website. The data may be storedindefinitely.
2.3.2 Application Programming Interfaces
The term API stands for “application programming interface” and in the broadestsense means bundled code intended for reuse. Code reuse is the way of taking ben-efit of existing solutions: in its primitive form, it manifests itself as copy-and-paste;in its thought-through form, it exists as APIs. APIs are designed to be convenientlyreusable, for that code is grouped into methods, classes, packages —i.e., given astructure that encompasses functionality, part of which is exposed for external con-suming.
8 Please note that the NON-IDENTIFIABLE element can also be used in a statement incombination with data references. In such case, the element signifies that “all of the datareferenced by that STATEMENT will be anonymized upon collection" [189].

2.3 Languages Under Study 23
<POLICY><STATEMENT><PURPOSE><admin/><current/><develop/></PURPOSE><RECIPIENT><ours/></RECIPIENT><RETENTION><indefinitely/></RETENTION><DATA-GROUP><DATA ref="#dynamic.clickstream"/><DATA ref="#dynamic.http"/>
</DATA-GROUP></STATEMENT>
</POLICY>
Figure 2.6. P3P sample ‘logging only’
What we collectively call APIs in this thesis, differ in their style and purpose ofbundling the code for reuse (examples are taken from [171]): they might be libraries(as “standard” library in C), frameworks (as .NET), software development kits (asAndroid SDK), APIs (as Google Map API), to name a few. Libraries can be seen asthe simplest style of reusable code consumption: plain instantiation of appropriateobjects and invocation of the methods. Frameworks leverage inheritance as meansof control and achievement of user’s goals: implementing an interface or extendinga class gives the user opportunity to build-in into the existing frame of functionality.Software development kits provide more than just reuse of functionality, they pro-vide a set of development tools, a platform for creation of the software. APIs in thestrictest sense are the public interfaces of existing software, which allow using thesoftware programmatically.
Typically, the user of an API sees and interacts only with the public part of anAPI, not knowing (or caring) what happens in the hidden implementation or how itis arranged. From this point of view, APIs can be seen as embedded (or internal—according to Fowler’s classification9) domain-specific languages: there is a generalpurpose programming language (a “host” language), like Java or C#, which providesgeneric language constructs (iteration, conditionals, functions, etc.), and there is anAPI, which provides domain-specific primitives. This combination allows softwareengineers to write code in the familiar context, with the language they know, usingAPI primitives to work with the domain that the API represents on a higher level ofabstraction.
There are two complementary points of view on APIs. In the first place, an APIcan be seen as a finite set of public types and public methods exposed for the benefitof the API user. This basic point of view gives an idea of the API structure, its size,and available functionality; it allows understanding what is there to use in the API—i.e., it represents a grammar of the API as a language. Secondly, an API can be seencontinuously, as a sequence of actions: implement or extend an interface or a type,instantiate an object, call a method. This point of view facilitates correct consumption
9 http://martinfowler.com/articles/languageWorkbench.html#InternalDsl

24 Essential Background
of the API; it allows understanding how to use the API—i.e., it represents a protocolof the API as a process.
The first, grammar-like, view on APIs is usually facilitated by public documen-tation, as, for instance, Javadoc generates, where all the types and methods, returntypes and parameters are listed and explained. The second, protocol-like, view onAPIs is usually facilitated by examples, tutorials, or demos provided by the API de-velopers. Research-wise, the first view gives rise to studies on how to reflect theinformation about the usage in the grammar-like representation of APIs (e.g., applyfont scaling in the documentation with respect to popularity of types and methods).The second view gives rise to research that seeks to mine the information about pro-tocol aspect of APIs from their usage (e.g., detect usage patterns).
In our thesis, we are taking the first point of view: we treat APIs as domain-specific languages and we are interested in their usage with respect to their grammar.
2.4 Corpus Engineering
In this section, we introduce terminology necessary to discuss the phase of collectingempirical evidence—once again, referring and borrowing from Natural Linguisticsas we see fit and beneficial for Software Linguistics.
2.4.1 Corpora in Natural Linguistics
In Natural Linguistics, samples of the language under the study are often organizedinto collections that are called corpora. A branch of Natural Linguistics, corpus lin-guistics, deals with all aspects of designing, producing, annotating, analyzing, andsharing corpora. Producing a useful, natural linguistics corpus could be an effort thatgoes far beyond what individual researchers or teams can do. There are internationalassociations who support sharing, e.g., the European Language Resources Associa-tion (ELRA)10. Some of these organizations charge a sum of money for providingtheir corpora.
Using corpora is beneficial for different reasons. From the technical point ofview, it saves time and effort for individual researchers, it increases the quality ofresearch, it makes replication of studies easier. From the research point of view, thecontents of corpora provide evidence that has not been biased by the researcher.Corpora may also make possible discovery of phenomena that otherwise are notobservable [94].
Corpora are usually collected in a systematic way, following certain extra-linguistic principles (certain time span, certain type of texts, etc.). Corpora are alsooften contain metadata that makes it easier to work with the texts: annotations, mark-up, tagging parts of the speech, statistical information.
10 http://www.elra.info/

2.4 Corpus Engineering 25
Types of corpora
Corpora in Natural Linguistics can contain texts written in one or many languages,i.e., be mono- or multilingual. The basic type of a corpus is a sample corpus (othertypes can be seen as the sample type with additional features). A sample corpus issupposed to show the general usage of a language: represent the usage of languagefeatures and elements proportionally to what can actually be found in reality. A ref-erence corpus is supposed to reliably represent all the features of a language (i.e.,reference corpora tend to be quite large). Usually, corpora do not include time dimen-sion into their design explicitly, they are ‘snapshots’ even if they cover a substantialperiod. There are two types of corpora that are designed with time dimension takeninto account: diachronic and monitor corpora. The former contain several snapshotsat different intervals of time (covering altogether a considerably long period); thelatter are continuous and growing with the time. There are also special corpora thatare not intended to represent the general usage of a language, rather to facilitate someknowledge acquisition about a particular phenomenon. Often, corpora are intendedto capture the normal usage of the language, meaning that only accomplished nativespeakers are to be taken into account when gathering the data, in order to represent astandard of the language. Such corpora are called normative. There are further clas-sifications of corpora in Natural Linguistics (see [30]), but we omit them here as theyare outside of the context of our study.
Since it is hard to operate on large collections of plain text, in order to facilitateresearch corpora are marked-up, annotated, or tagged, with additional metadata, as,for instance, part of the speech—verb, noun, etc.—which are hard to detect auto-matically. While having metadata leads to machine-readable corpora and extensibleresearch, queries based on annotations can reveal only the facts that are capturableby the metadata that was identified earlier.
2.4.2 Corpora in Software Linguistics
Software Language Engineering is not the only area of Software Engineering thatmakes use of collections of software artifacts. Often, practical studies concernedwith such topics as program comprehension, maintenance, reverse engineering andre-engineering use collections of software artifacts. Figure 2.7 presents a schematicdepiction of such research.
The process of collecting software artifacts, though frequent in research, doesnot have an explicit methodology. The steps involved are nonetheless easy to distin-guish. The process starts with identifying a set of software artifacts to be collectedand pre-processed; the obtained corpus is then subject to fact extraction; facts areusually extracted once or on a regular basis and stored in a relational database; theextracted facts are then analyzed and the results are interpreted. The specifics of re-search questions influence each step of the process—choice of the type and instancesof software artifacts, extracted data, applied analyses—and it is probably impracticalto generalize the whole process. However, the phase of collection and pre-processingartifacts should be possible to standardize either methodologically or by using estab-lished collections for fact extraction.

26 Essential Background
Software artifacts
.
Corpus
Corpus engineering
.
.
.
.
Data Fact extraction
Results Analyses
Figure 2.7. Simplified depiction of corpus-based Software Engineering research
Terminology
Let us introduce terminology that we will use further throughout the thesis. A corpusis a collection of software artifacts that, generally speaking, can be of any nature.We name corpus engineering the tasks related to the phase of collecting and pre-processing the artifacts. Unit of the corpus captures the term in which contents of thecorpus are described: images, XML files, software projects. Our assumption (thatwe confirm by the literature surveys) is that Software Engineering research oftenmakes use of corpora that consist of software projects (programs, systems). We referto such collections as project-based corpora and will focus on them particularlyin this thesis. Project-based corpora can be mono- or multilingual, when the units(i.e., projects) written accordingly in one or more languages. These corpora containprojects in one of the code forms—source code, binary code, or both. In project-based corpora, projects can be the high-level units, in the context of which researchis concerned with some additional units (terms): tests, bugs, defects, features, etc.
Following the existing classification of corpora in Natural Linguistics, let us callthe project-based corpora that were created to be a diverse representation of projectswritten in a specific language—sample corpora. Often, though, the corpora users areinterested in only well-established, real-world projects—we will call such corporanormative. Those corpora that were created with an additional requirement (e.g.,to cover a specific application domain), we will call special corpora. Corpora thatcontain several versions of the same project(s) we will call evolutional (not distin-guishing between diachronic and monitor corpora for now, as the state of corpusengineering in Software Engineering is not sufficiently developed for finer terminol-ogy).
Historically, corpus engineering is an expensive, time-consuming effort, neitherappreciated nor rewarded by the community. The existing established corpora are

2.4 Corpus Engineering 27
typically a side-effect of research where a corpus was needed to solve the task athand; afterwards the combination of altruism and pragmatism motivated additionaleffort for sharing.
We believe that recently there appeared a growing need for sample normativecorpora, when researchers became interested in large-scale corpus-based or corpus-driven studies. For instance, Baxter et al. analyzed statistically structure of 56 Javaprojects [24] in the corpus-driven style. That study gave rise to the effort of Quali-tas Corpus [175]11, a curated collection of Java code—a sample normative corpus,the first of its kind in our opinion (see other corpus engineering efforts discussed inSection 6.5).
Corpus engineering tasks
There are several corpus engineering tasks that general in their nature when a project-based corpus is concerned, regardless of what other characteristics it should have. Weoutline these tasks and some guidelines how to address them below.Collecting the data. The following are examples of requirements to be consideredbefore identifying appropriate projects:
• What language projects should be written in?• Which code form is needed: source code or binary code?• Should the corpus be diverse along the following characteristics or specific: size,
application domain, maturity, etc.• Are there any additional requirements to the corpus: e.g., should projects be
buildable, runnable, have unit tests, etc.• Is evolution aspect needed?
– if yes: What kind of evolution measure is needed (releases, versions, com-mits, etc.)?
– if no: Which snapshot of projects to consider (latest version, specific date,etc.)?
Providing additional contents. Physically obtaining the needed data can be a multi-step process. In the most simple case, projects in their source or binary code formare downloaded from their repository or homepage. Such distributions may be in-complete with respect to used libraries, identifying and acquiring which is a separateprocess. Initially identified requirements to the contents of the corpus may includebroader context than only code form: e.g., a corpus might also include data aboutbugs, defects, commits, emails, and other artifacts of the project’s ecosystem. Ob-taining such contents is a separate process that includes identifying sources for theadditional contents and ways to collect them (e.g., crawling online sources).Sanitizing the data. While in Natural Linguistics, “actual usage of language” means“as is” (including possible errors and deviations), in Software Linguistics, the defini-tion of a software language is an operational one (involving compilers, interpreters,
11 http://qualitascorpus.com/

28 Essential Background
and other language-processing software), and except for certain instances of re-search, studies mostly are based on the correct usage of the language. Therefore,either the corpus should be filtered to contain only valid samples or there should bemeans of distinguishing different levels of validity.
It is also important for the corpus to be aware of the contents of the projects.For instance, source code form may additionally contain files of non-programmaticnature: documentation, images, and so on. It may contain files directly used inthe project but non-executable or written in other languages: configurations, XMLschemas, etc. Both source and binary code forms usually depend on libraries, i.e.,binary files containing reusable code exercised in the project, which maybe includedinto the project’s distribution or were added on the previous step of corpus engineer-ing. Finally, source code itself may be heterogeneous and contain auxiliary code, fortesting, demo, or other purposes, as well as partial clones of different size from otherprojects (copy-and-paste approach in functionality reuse).Providing metadata. Having metadata in a corpus facilitates fact extraction. Like-wise in Natural Linguistics, using corpus metadata in research has benefit (easierprocessing, delegation of quality, comparability) and drawbacks (restriction of thepossible research questions, lack of details)—i.e., corpus-based versus corpus-drivenapproach.
One example of metadata useful for Software Linguistics can be marking upparts of the projects during the sanitizing phase. Tagging parts of the projects mayinclude any custom needs: identifying and labeling API usage, design-specific partsof the system, etc. A corpus can also provide statistical information: values of dif-ferent metrics for the code (size, complexity, etc.) Metadata also can be fine-grained(specified on the level of individual types or methods) or aggregated (on the level ofpackages, directories).
2.4.3 Corpora versus Software Repositories
One might argue that there is no need to introduce the new terminology as collectionsof software artifacts already exist in different forms, one of which—frequently usedin Software Engineering research—is software repositories.
The main difference that we see between such collections of software artifactsand corpora is their target group, the stakeholders involved. While the softwarerepositories are tailored towards the developers, the corpora are designed for theresearchers—both may contain the same projects but serve completely differentgoals (developing the code vs. investigating the code) which influences greatly theway of representing and maintaining the respective collections. If to use an analogyfrom the field of Natural Linguistics, libraries represent vast collections of bookswritten in natural languages—yet they are not corpora, only the possible raw mate-rial for them. The same is true for software repositories: the contain software artifactsfor the primary use, while corpora contain them for the secondary, meta-use.
In Software Engineering research, software repositories are often the main sourcefor producing throw-away corpora that are used only for the needs of the current

2.5 Literature Surveys 29
publication in the pipeline. This is the tendency that we believe is possible and im-portant to eliminate for the sake of quality and reproducibility of reasearch (if not forthe mere comfort of the researchers).
2.5 Literature Surveys
As discussed in Introduction, Section 1.2.3, we aim to assess the usage of empiri-cal evidence in Software Engineering by discovering the signs of it in the existingresearch—namely, in the published papers, via a literature survey. In this section, wedescribe the possible methods to conduct a literature survey and comment on theirapplicability to our research. In the end, we outline the resulting method that we usein the thesis.
2.5.1 Systematic Literature Reviews
It is often said that science is “standing on the shoulders of giants,” meaning that oneshould be aware of the previous work and use it when possible for further expansionof knowledge. Practical areas of science, such as Software Engineering, have specificchallenges related to this desired continuous flow of research. In order to be able toassess and integrate results obtained by other researchers, one needs to be able toidentify research context, applied methods, used empirical evidence, and so on. Thisnecessity is addressed by the evidence-based paradigm, which provides guidelinesfor systematic collection and analysis of available empirical data w.r.t. some specificphenomenon. Such approach allows getting a broader and deeper knowledge aboutthe phenomenon in question than an individual study. The main method of evidence-based practice is a systematic literature review. It is a literature survey that allowsgathering, extracting, and integrating results existing in the research area in focus.
The evidence-based paradigm originated in medicine, where studies are oftendone in a rigorous statistical manner (experiments, quasi-experiments, etc.). The ap-proach was adopted for Software Engineering by Kitchenham et al. in 2004 [112,109].
Systematic literature reviews usually have a specific research question in focusthat allows to distinguish relevant studies. The search strategy of a systematic re-view usually consists of i) identifying one or more digital libraries along with anappropriate set of keywords/keyphrases; ii) identifying conferences and/or journalsand a time span for the published papers; iii) combination of both. The search strat-egy allows collecting studies—as many as possible—so that to further assess themw.r.t. previously developed inclusion and exclusion criteria. The papers identified asrelevant are then subject to data extraction: collecting the required information tobe synthesized at the final stage. Each step of the review is previously documentedin a review protocol: the research question(s), the search strategy, the inclusion andexclusion criteria, data extraction strategy, and so on. The review is to follow theguidelines of the protocol at all times—such strictness is to reduce the possibility ofresearcher bias.

30 Essential Background
Applicability
The major reason why systematic literature review is not a suitable choice for oursurvey is its rigorousness. The goal of our survey is to discover the existing phe-nomenon of which we yet do not know much. Therefore, it is hard if not impossibleto prepare beforehand an appropriate data extraction strategy that would cover allexisting characteristics of empirical evidence used in Software Engineering.
Nonetheless, we borrow from the method of systematic review the most impor-tant idea of systematically documenting the made decisions for better reproducibili-ty/assessment of the quality of the survey: e.g., used search strategy, applied methods,etc.
2.5.2 Content and Meta-analysis
We also consider two research methods commonly used in social and health sciences,namely, content analysis [117] and meta-analysis [75]. Content analysis is a quali-tative research method commonly used for systematically studying large amountsof communication content such as news, articles, books, videos, or blogs. The keycharacteristic is that the analyzed content is categorized by researchers. Systematicliterature surveys [41] often leverage content analysis.
Meta-analysis is another research method used for a systematic analysis of re-search literature. Unlike content analysis, meta-analysis is a quantitative method,and it is focused on research studies that have highly related research hypotheses.The main goal of a meta-analysis is to aggregate and statistically analyze findingsof several research studies. Meta-analysis uses stricter inclusion criteria than con-tent analysis: measured outcomes, and sufficient data to calculate effect sizes. Thesespecifics of meta-analysis challenge its application to empirical software engineer-ing [110].
Applicability
The subject of our survey is not exclusively of qualitative or quantitative nature: weboth need to be able to detect the categories, in which to speak about used empiricalevidence, and to be able to extract their related structural and countable characteris-tics.
From content and meta-analysis, we borrow the essential idea of coding the pa-pers w.r.t. a coding schema and performing basic statistical measurements on discov-ered quantities.
2.5.3 Grounded Theory
Grounded theory was developed by Glaser and Strauss in their study of death inthe context of patient caring [73]. Their methodology [74], nowadays often used insocial sciences, was primarily tailored towards qualitative studies working on thelarge amounts of data collected from various sources: reports, formal and informal

2.5 Literature Surveys 31
interviews, observations, etc. The data is reviewed and (extensively) coded by the re-searchers; codes are grouped into concepts; concepts are united within categories; thelatter are the basis for a theory—a reverse-engineered hypothesis. This approach isbottom-up, as opposed to a typically used top-down scientific perspective that startswith a hypothesis to be checked. Later, Glaser and Strauss split in their understandingto what extent the coding should be open (on the differences between Glaserian andStraussarian grounded theory see [12]). Following his understanding of openness,Glaser also suggested that grounded theory can be used in quantitative studies [72].
Applicability
Grounded theory is more suited to our needs as in our research task we do not haveexact definitions for the phenomenon that we intend to capture. Grounded theory maybe seen as inexact method, allowing too much freedom, but the general mechanismin its basis—bottom-up direction of the processing of the data that facilitates theemergence of theory—essentially is the same process that leads to an insight andformulation of a research hypothesis “behind the stages” of research.
We use the core idea of grounded theory: we let the coding schema to emergefrom the data. We use our pre-existing knowledge about the domain to form an ideaof the coding scheme for the survey. During the coding phase, we accumulate newknowledge and allow it to influence the development of the schema.
2.5.4 Survey Process12
We describe the main steps in our survey process integrating all borrowings fromdiscussed methodologies (the literature survey itself is reported in Section 5.3). Wealso discuss deviations of the pilot studies that we performed when looking for theright methodology (the pilot studies are reported in Section 5.2). There are two mainreasons to the adjustment followed after the pilot studies. First, we have realizedthat empirical evidence in the form of projects, programs, software is not specific tothe area of Software Language Engineering research; that Software Engineering assuch often makes use of it. Second, we have come to the conclusion that the mostcomplete scheme that we are able to devise can come only after having consideredall the papers; neither theoretical considerations nor expertise can help covering allpossible characteristics—only the data itself can.1. Research questions. Initially, our research goal was to characterize research inSoftware Language Engineering with an objective of streamlining future research byidentifying common characteristics. After the pilot studies we refined our goal to thefollowing: discover and understand the use of empirical evidence in Software Engi-neering with the same objective. More specifically, we seek to understand how oftenit is used and what are the common characteristics. (The refined research questionsare posed in Section 5.3.1)
12 This subsection is based on own publication [2].

32 Essential Background
2. Search strategy. Initially, we used a selection of papers that were gathered viabibliographical references, starting with a seed—a set of hand-picked papers that wehave identified as “appropriate.” For the second pilot study, we decided to collectpapers from the proceedings of certain conferences. We identified the list of the con-ferences from our experience, including those conferences whose topic implies (toour experience) use of empirical evidence. We also decided to take into account onlythe most recent research, because it became apparent that empirical research becamestronger in the community over the years. For the final survey, we adjusted the list tocontain only conferences with proceedings of comparable sizes.3. Inclusion criteria. In both pilot studies, we used inclusion criteria. We startedwith two requirements: i) the paper discusses usage of a software language, and ii)the paper reports empirical results on such usage based on a corpus. After being ex-posed to the papers and after distilling own experience, we decided to remove thefirst requirement, taking into account only the fact of some empirical research (un-derstood broadly) reported in the papers. We did so, because we observed that manypapers in Software Engineering research in general make use of empirical evidence,such as projects, programs, etc. After the second pilot study, it became apparent thatalmost all of the papers make use of empirical evidence. This observation led to thedecision to restrain from using any inclusion criteria, taking all the collected papersinto account.4. Data evaluation. Initially, we were interested in characterizing not only the usedempirical evidence, but also the research—focusing only on Software Language En-gineering. After we made our scope broader, including Software Engineering in gen-eral, it became an overwhelming task, to characterize the research as such, therefore,we have restricted our interest only to the characteristics of the used empirical evi-dence. In the pilot studies, we have followed a pre-defined coding schema that camefrom our experience.5. Data analysis. We use basic statistical methods to represent the results: frequencycounts, percentages, percentiles. The frequencies describe the level of presence ofcertain types of empirical evidence and their characteristics. The quantitative descrip-tion of the current situation in Software Engineering w.r.t. use of empirical evidencehelps to discover common ground. Such analysis can also lead to new insights andallows posing new research questions for possible follow-up quantitative as well asqualitative research.6. Dissemination. The approach to the literature survey, its topic, the developedscheme, and the results—we see our effort as the first of its kind. We strongly be-lieve in the bottom-up approach of discovering the methodology for use of empiricalevidence in Software Engineering.

Part II
Language Usage

3
A Study of P3P Language
In this chapter, we present an empirical study of the P3P language, a domain-specificlanguage for privacy policies. We selected this language because there is growingrecognition that users of web-based systems want to understand, if not to control,which of their data is stored, by whom, for what purpose, for what duration, and withwhom it is shared. We devise and apply methods to study usage profiles, correctnessof policies, metrics, cloning, and language extensions.
Road-map of the chapter
• Section 3.1 briefly introduces P3P language and motivates the study.• Section 3.2 describes the methodology: research questions, corpus, analyses.• Section 3.3 presents the essential language definition of P3P.• Section 3.4 prepares, executes, and interprets analyses on the corpus.• Section 3.5 discusses threats to validity for this empirical study.• Section 3.6 discusses related work.• Section 3.7 concludes the chapter.
Reproducibility
The reported study relies on a P3P corpus obtained from the Internet. The corpus andvarious artifacts related to the performed analyses are available online on a supple-mentary website for reproducibility’s sake and for the benefit of anyone who needsan organized corpus of P3P policies1.
Related publications
Research presented in this chapter underwent the peer-reviewing procedure and waspublished in the proceedings of International Conference on Program Comprehen-sion in 2010 [1] and subsequently in the special issue of Empirical Software Engi-neering journal in 2013 [5].
1 http://softlang.uni-koblenz.de/p3p

36 A Study of P3P Language
3.1 Introduction
(A brief introduction to the language is provided in Part I, Prerequisites, Sec-tion 2.3.1.)
Let us clarify here our general background as well as the reasons for interest inP3P and language usage thereof. Such background provides context for the researchquestions to follow.
That is, initially, we were interested in privacy awareness of web-based systemsor, in fact, enforcement of privacy policies for such systems [105, 17, 13, 86, 142,161, 64, 104, 119, 129, 155]. It quickly became clear that P3P is the most advancedlanguage for privacy policies—most advanced in terms of standardization and adop-tion. Hence, we started to study P3P in a conservative manner—by consulting thespecification, additional documentation, and available examples. We also quicklylearned about empirical studies of P3P [57, 153, 44, 154], which turned out to befocused on language adoption, and, to a lesser degree, syntactical validity of policiesas well as compliance of policies with legislation or human-readable policy descrip-tions.
Not even the combination of all the aforementioned resources helped us to under-stand P3P sufficiently from the perspectives of language design as well as languageand system engineering; neither could we sufficiently grasp the domain of web pri-vacy in this manner. As a result, we embarked on a different kind of empirical studybased on the following research questions: What part of the vocabulary is used? Isthe language correctly used? What is a significant policy? What are common poli-cies? What language extensions circulate?
3.2 Methodology of the Study
The empirical study of P3P language usage is centered around a number of researchquestions that we describe first. The study relies on a corpus of P3P policies in thewild; the corpus’ compilation is described next. The study leverages a number ofanalyses to gather data towards answering the research questions; these analyses arebriefly introduced last. (§3.4 covers all analyses in detail.)
3.2.1 Research Questions
The following questions were designed to help understand P3P from the perspectivesof language design as well as language engineering; better understanding of the web-privacy domain was an objective, too.
What part of the vocabulary is used?
P3P provides a rich vocabulary for the privacy domain. Basic understanding of thedomain may benefit from insight into the coverage of the vocabulary in the wild.
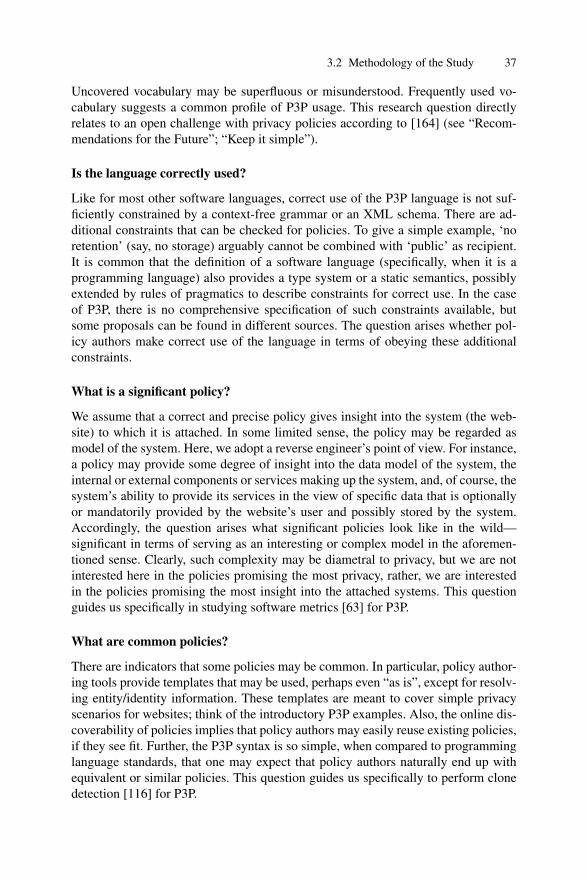
3.2 Methodology of the Study 37
Uncovered vocabulary may be superfluous or misunderstood. Frequently used vo-cabulary suggests a common profile of P3P usage. This research question directlyrelates to an open challenge with privacy policies according to [164] (see “Recom-mendations for the Future”; “Keep it simple”).
Is the language correctly used?
Like for most other software languages, correct use of the P3P language is not suf-ficiently constrained by a context-free grammar or an XML schema. There are ad-ditional constraints that can be checked for policies. To give a simple example, ‘noretention’ (say, no storage) arguably cannot be combined with ‘public’ as recipient.It is common that the definition of a software language (specifically, when it is aprogramming language) also provides a type system or a static semantics, possiblyextended by rules of pragmatics to describe constraints for correct use. In the caseof P3P, there is no comprehensive specification of such constraints available, butsome proposals can be found in different sources. The question arises whether pol-icy authors make correct use of the language in terms of obeying these additionalconstraints.
What is a significant policy?
We assume that a correct and precise policy gives insight into the system (the web-site) to which it is attached. In some limited sense, the policy may be regarded asmodel of the system. Here, we adopt a reverse engineer’s point of view. For instance,a policy may provide some degree of insight into the data model of the system, theinternal or external components or services making up the system, and, of course, thesystem’s ability to provide its services in the view of specific data that is optionallyor mandatorily provided by the website’s user and possibly stored by the system.Accordingly, the question arises what significant policies look like in the wild—significant in terms of serving as an interesting or complex model in the aforemen-tioned sense. Clearly, such complexity may be diametral to privacy, but we are notinterested here in the policies promising the most privacy, rather, we are interestedin the policies promising the most insight into the attached systems. This questionguides us specifically in studying software metrics [63] for P3P.
What are common policies?
There are indicators that some policies may be common. In particular, policy author-ing tools provide templates that may be used, perhaps even “as is”, except for resolv-ing entity/identity information. These templates are meant to cover simple privacyscenarios for websites; think of the introductory P3P examples. Also, the online dis-coverability of policies implies that policy authors may easily reuse existing policies,if they see fit. Further, the P3P syntax is so simple, when compared to programminglanguage standards, that one may expect that policy authors naturally end up withequivalent or similar policies. This question guides us specifically to perform clonedetection [116] for P3P.

38 A Study of P3P Language
What language extensions circulate?
A remarkable feature of the P3P design is that it anticipates the need of extending theP3P language and supports language extension with a designated language mecha-nism. In different terms, P3P is hence prepared for ‘growing a language’ [100]. Theprincipal feasibility of such an extension mechanism follows from the simplicity ofP3P with its emphasis on a vocabulary as opposed to the rich language constructs ofprogramming languages. By studying the usage of said mechanism we gain insightinto language extensions that are proposed in the wild, thereby suggesting potentialimprovements for future policy languages.
3.2.2 Corpus under Study
We carried out our empirical language analysis of P3P on a corpus that was obtainedfrom the Internet. In the following, we identify the source of the corpus, we describethe process of corpus retrieval and list size measures for the corpus and subordinatedartifacts. Please note that we made the corpus readily available online in an open-source project.2
Open Directory Project
We used the Open Directory Project (ODP) as the source for finding websites withpolicies. ODP is a global, openly available, community-moderated, actively main-tained directory of companies, consortia, and other entities with a web presencethat may be reasonably expected to potentially declare a privacy policy.3 For conve-nience’s sake, Appendix A.1.1 provides additional information about ODP’s charac-teristics. We downloaded the ODP as of 7 August 2010. To the best of our knowledge,ODP is the most comprehensive website catalog of its kind, and hence, it suggestsitself as an obvious source for an empirical study like ours. We refer to the threats tovalidity discussion in §3.5 for reflections on the choice of the ODP source.
We extracted all website URLs from (the downloaded) ODP files. Some URLsoccurred more than once. Most URLs used distinct domains; this can be viewed as asimple indicator of diversity. The corresponding numbers are listed in Table 3.1.
# Website URLs 4,009,337# Distinct website URLs 3,860,709# Distinct domains 2,957,657
Table 3.1. Results of URL scraping
2 http://slps.svn.sourceforge.net/viewvc/slps/topics/privacy/p3p/
3 ODP website: http://www.dmoz.org/

3.2 Methodology of the Study 39
Locating and downloading policies
We followed all URLs from ODP to locate policies on the corresponding websitesand to download the located policies. These efforts were performed over Aug–Sep2010 (categories Regional and World), and Dec 2009–Jan 2010 (all other categoriesexcept ‘Kids and Teens’, which is not included in our corpus due to a lately discov-ered omission).
The mechanism of finding out whether a site uses P3P and locating the actualpolicy commences as follows. The site is checked whether a policy reference fileexists. If so, the policy reference file is processed, and all referenced policies arefetched. In fact, the reference file may use URIs to refer to policies (say, policy files),or policies may be embedded into the reference file. All those policies were retrievedby us.4 The corresponding numbers are summarized in Table 3.2. Again, numbers ofreference files and policies are annotated with the number of distinct domains; thiscan be viewed as a simple indicator of diversity.
# Files # Distinct domains
Located policy reference files 50,776 43,195Referenced policy files 13,536 8,736Downloaded policies 8,768 7,746
Table 3.2. Results of policy location and downloading
We note that reference files may directly contain policies; in these cases, weextracted the policies. One can observe that only few entries of ODP have an associ-ated policy reference file: 3,860,709 website URLs vs. 50,776 policy reference files.Numbers are further decreasing as follows. We could not retrieve policy files for eachreference file due to unresolvable references, i.e., failing downloads. Also, there isaliasing involved, i.e., several policy reference files point to the same policy.
Schema-based validation
The extracted policies are still subject to validation. Each policy file is supposed tocontain one or more policies. However, not all policy files contain XML. That is, filesmay happen to be empty or contain non-XML text. Further, not all policy files withXML content are well-formed XML, and not all well-formed XML content frompolicy files are valid with regard to P3P’s XML schema. Counts of files on vary-ing levels of validity are shown in Table 3.3. Again, numbers of files are annotated
4 According to W3C’s P3P specification [189], the policy reference file may be located byeither of the following options. The file may be located in a predefined “well-known” loca-tion, which is essentially [WebSiteURL]/w3c/p3p.xml. Also, the website may containthe HTML/XHTML tag <link> indicating the location of the file. Finally, an HTTP re-sponse from the server may contain the reference.

40 A Study of P3P Language
with the number of distinct domains in an attempt to provide a simple indicator ofdiversity.
Criterion # Files # Policies # Distinct domains
All downloads 8,768 — 7,746XML 7,899 — 7,554Well-formed XML 7,675 — 7,371Schema-validated XML 5,905 6,182 5,673
Table 3.3. Stages towards syntactical validity
We define our P3P corpus to consist only of those 6,182 policies that are validwith regard to P3P’s XML schema. For completeness’ sake, we mention that someP3P tools tolerate ill-formed or schema-invalid XML to some extent. Such toleranceis tool-specific though, and we do not try to use obviously incorrect policies in thisstudy.
For convenience’s sake, Appendix A.1.1 provides additional information aboutthe diversity of the corpus in terms of top-level domains and ODP’s website cate-gories. These considerations are inspired by studies of P3P adoption both geographi-cally and in terms of website categories [57, 153, 44, 154]. Adoption and geographicor categorical diversity are not directly of interest in our study, but we do providesuch extra diversity data so that others can assess the generality of our results.
3.2.3 Leveraged Analyses
Driven by the research questions and our overall background in software languageengineering, we leverage several analyses. These are all original analyses as far asP3P is concerned. Except for the analysis of language extensions, these analyses aregenerally useful in studying language usage in an empirical manner. That is, otherdomain-specific languages may also be subjected to this scheme.
Analysis of vocabulary
We use simple coverage and frequency analysis to determine unused, used, and fre-quently used vocabulary, thereby addressing the research question of §3.2.1. Thisanalysis is applied to the basic enumeration types of P3P, i.e., purposes, recipients,and retention, but also to P3P’s Base Data Schema (BDS).
Analysis of constraints
Various resources, including the (latest but provisional) P3P specification, stipulatedifferent additional constraints. We collect and implement these constraints so that

3.3 The Essence of P3P 41
we can determine violations by the corpus, thereby providing data for the researchquestion on correct use of P3P; see §3.2.1. We select some of these constraints forthe notion of semantical validity, which we require for some of the other analyses inthe study.
Analysis of metrics
We provide different metrics that measure the size of a policy. One metric directlymeasures the size of a suitable syntactical representation. Another metric abstractsfrom the representation, and measures instead the size of a normal form that viewsa policy as the extensional set of facts that it declares. Yet another metric focuseson the size of the data model that is referenced by a policy. Finally, there is met-ric focused on P3P’s finite domains for purposes, recipients, and categories. Thesedifferent metrics help us to identify significant policies according to the researchquestion of §3.2.1.
Analysis of cloning
Clones of complete policies are found using different detection techniques. Textualclones are literally identical policy files, and they are necessarily the result of copy-and-paste behavior because of the entity/identity information that is included intoeach policy. Syntactical clones are policies equal in terms of their essential (say,abstract) syntactical structure. Semantical clones are policies equal in terms of theextensional set of facts that they declare. These clone types help us studying diversityof policies according to the research question of §3.2.1.
Analysis of extensions
We use a simple form of grammar inference to aggregate extensions from the policiesin the corpus. We also study the diversity of the websites that host policies withextensions.
3.3 The Essence of P3P
This section describes the essence of P3P as far as the study is concerned. (We use theterm ‘essence’ here in reference to a common style used elsewhere in programminglanguage research [190, 166, 184, 28].) Some of the details are subjective in thatthey do not directly follow from W3C’s specification. We point out such subjectiveelements clearly when we encounter them.
First, we give a brief summary of P3P’s platform idea as it clarifies the potentialroles of website policies, user preferences, and the process to integrate them. Second,we define an abstract syntax for P3P, which captures the “semantically relevant”part of P3P in a certain sense. This abstract syntax is the foundation for a simple

42 A Study of P3P Language
notion of syntactical equality. Third, we define a normal form for P3P based onprevious work [197]. The normal form of a policy corresponds to the extensional setof facts implied by the policy, thereby giving rise to the notion of semantical equality.Finally, we suggest a partial order on normally formed policies so that policies cannotjust be tested for equality, but, in fact, they can be compared with regard to the degreeof exposure (in the sense of privacy). This is helpful, for example, when we studycommon policies later on.
3.3.1 Language versus Platform
P3P, as a language, is a non-executable, domain-specific, XML-based language forprivacy policies to be declared by websites for the benefit of website users [189, 42].P3P, as a platform, “enables Web sites to express their privacy practices in a standardformat that can be retrieved automatically and interpreted easily by user agents. P3Puser agents will allow users to be informed of site practices (in both machine- andhuman-readable formats) and to automate decision-making.” [189].
Let us provide additional details here. The entity of a website is supposed todefine and publish a privacy policy for the website. The P3P platform suggests thatprivacy policies adhere to the P3P language, and there is the option of generatinghuman-readable descriptions from P3P policies. The basic scenario is that the user isresponsible for consulting a website’s privacy policy in order to understand whetherto use the site and what data to expose. The more advanced scenario is that theuser actually documents privacy preferences in a designated language so that userpreferences and website policy can be checked for compliance by a tool. This processcan be automated and integrated into the browsers experience [90]. The process mayalso involve additional elements of negotiation or dispute resolution, but we skip thisaspect here because not even the basic use of a language for user preferences andthe integration of compliance checking into a browser has seen much adoption inpractice [43].
The P3P specification does not commit to a specific language for user prefer-ences, but W3C’s APPEL [188] is explicitly mentioned as an option; other optionshave been proposed [14, 15]. Fundamentally, languages for policies versus prefer-ences differ as follows. A policy language is assumed to make statements about databeing optionally or mandatorily required by the website for certain purposes, to bestored for a certain duration, and to be shared with certain recipients. In contrast,preferences can be thought of as constraints or rules to be applied to policies whichare hence to be accepted or rejected.
3.3.2 Syntax of P3P
In our study, we are only concerned with the formal statements about data collection,use, storage, and sharing. We are usually not concerned with the entity that issues thepolicy or a policy’s consequences, which are given in natural language. The remain-ing P3P syntax is described in Fig. 3.1; it can be seen as an abstract syntax derived

3.3 The Essence of P3P 43
Figure 3.1. The study’s abstract syntax of P3P
from comprehensive, concrete syntax definitions.5 It is important to note that this ab-stract syntax has no counter part in the P3P specification. Instead, we have designedthis abstract syntax to precisely include those language elements that are of interestfor our purposes.
According to the figure, a P3P policy consists of any number of statements,each of which signifies data references for the collected data, purposes of collect-ing data, recipients that receive the data, a retention level, which defines how longdata is stored, and a few other directives. The figure clarifies that the major syntacti-
5 Comprehensive, concrete syntax definitions of P3P are available in different forms:
• XSD: http://www.w3.org/2002/01/P3Pv1.xsd• Relax NG: http://yupotan.sppd.ne.jp/relax-ng/p3pv1.rng• RDF: http://www.w3.org/TR/p3p-rdfschema/

44 A Study of P3P Language
user|-name| |-prefix| |-given| |-middle| |-family| |-suffix| |-nickname|-bdate| |-ymd.year| ...|-login| |-id| |-password...
The hierarchy on the left shows part of the BaseData Schema (BDS) of P3P—as it is part of theP3P specification. The shown snippet deals withuser data in a narrow sense. Policies typically suf-fice with data items from the BDS, but policies canalso define a Custom Data Schema (CDS) withdata items that are specific to the policy. Suchschemas are defined in XSD (XML Schema) withextensions for P3P. BDS and CDS only definenames and hierarchical organization but no typesare assigned to the data items.
Figure 3.2. P3P data schema hierarchy (sample from Base Data Schema)
<DATA ref="#dynamic.miscdata"><CATEGORIES><political/>
</CATEGORIES></DATA>
The P3P snippet on the left looks like a regular datareference, but the specific data item in question,i.e., ‘#dynamic.miscdata, is a ‘variable-categorydata element’. The category ‘political’ is assignedto it, which proxies for “Membership in or af-filiation with groups such as religious organiza-tions, trade unions, professional associations, po-litical parties, etc.” [189].
Figure 3.3. Variable-category data elements in P3P
cal domains are finite (i.e., enumeration types) and there is no recursion involved. Weshould add that P3P is somewhat prepared to deal with unforeseen concepts. Thereis, for example, a purpose called ‘other-purpose’, and there is a general extensionmechanism that we discuss in §3.4.5.
Data references either refer to the Base Data Schema (BDS) of P3P or a CustomData Schema (CDS), which is provided with the policy. The BDS, which is part ofthe P3P specification6,7, organizes user data, business data, third-party data, and so-called dynamic data (with diverse roles) in a hierarchical manner; see Fig. 3.2 for anillustration.
Data references can be annotated with categories such as ‘purchase’ or ‘health’.In fact, most data references in the BDS are implicitly associated with one or morecategories. For instance, user.name is implicitly associated with category ‘physi-cal’, i.e., physical contact information. Some data elements of the BDS are variablethough—specifically in the #dynamic branch. References to such ‘variable-category
6 http://www.w3.org/TR/P3P11/#base_data_structure7 http://www.w3.org/TR/P3P11/#schema_detail

3.3 The Essence of P3P 45
data elements’ [189] must be explicitly associated with one or more categories whenthey are used in a policy; see Fig. 3.3 for an illustration. The specification furthermotivates this mechanism as follows7: “In some cases, there is a need to specify dataelements that do not have fixed values that a user might type in or store in a repos-itory. In the P3P base data schema, all such elements are grouped under the classof dynamic data. Sites may refer to the types of data they collect using the dynamicdata set only, rather than enumerating all of the specific data elements.” This meansthat the hierarchical refinement of the data element is not specified which impliesthat ‘variable-category data elements’ are fundamentally different from regular dataitems.
A retention level can be anywhere from ‘no retention’ to ‘indefinite retention’.Let us explain a few values for recipients. The entity in charge of the system
is referred to as the recipient ‘ours’. (We simplify here the meaning of ‘ours’, whencompared to the P3P specification.8) Recipients with equal privacy practices as ‘ours’are referred to as ‘same’. The recipient ‘public’ essentially models the fact that col-lected data may be released to a public forum such as a bulletin board or a publicdirectory.
Let us also explain a few values for purposes. The value ‘admin’ signifies thatdata is collected for the purpose of the technical support of the website and its com-puter system. The value ‘telemarketing’ signifies that the collected information maybe used to contact the individual via a voice telephone call for promotion of a productor service.
Purposes and recipients may be qualified by an attribute required which regulateswhether associated data can be used for a given purpose or shared with a given recip-ient. These are the possible values for required: ‘always’, ‘opt-in’ and ‘opt-out’. Forinstance, a purpose with ‘opt-out’ for a certain data reference means that “data maybe used for this purpose unless the user requests that it not be used in this way” [189].The concrete syntax assumes ‘always’ as default.
Data references are qualified by an attribute optional; the values are ‘yes’ versus‘no’—the user of the website may or may not omit the data, respectively. The con-crete syntax assumes ‘no’ (i.e., non-optional) as default. Finally, statements are qual-ified by an attribute identifiable; the values are ‘yes’ versus ‘no’. The concrete syntaxuses as an extra element <NON-IDENTIFIABLE/> to signify non-identifiability;hence, all data is identifiable by default. When the statement is labeled with identifi-able=‘no’, then this means either that “there is no data collected under this STATE-MENT, or that all of the data referenced by that STATEMENT will be anonymizedupon collection.”9
8 “Ourselves and/or entities acting as our agents or entities for whom we are acting as anagent: An agent in this instance is defined as a third party that processes data only onbehalf of the service provider for the completion of the stated purposes. (e.g., the serviceprovider and its printing bureau which prints address labels and does nothing further withthe information.)” [189]
9 http://www.w3.org/TR/P3P11/#NON-IDENTIFIABLE

46 A Study of P3P Language
Data-centric style
<POLICY><STATEMENT><PURPOSE><admin/><current/><develop/></PURPOSE><RECIPIENT><ours/></RECIPIENT><RETENTION><indefinitely/></RETENTION><DATA-GROUP><DATA ref="#dynamic.clickstream"/>
</DATA-GROUP></STATEMENT><STATEMENT><PURPOSE><admin/><current/><develop/></PURPOSE><RECIPIENT><ours/></RECIPIENT><RETENTION><indefinitely/></RETENTION><DATA-GROUP><DATA ref="#dynamic.http"/></DATA-GROUP>
</STATEMENT></POLICY>
Purpose-centric style
<POLICY><STATEMENT><PURPOSE><admin/></PURPOSE><RECIPIENT><ours/></RECIPIENT><RETENTION><indefinitely/></RETENTION><DATA-GROUP><DATA ref="#dynamic.clickstream"/><DATA ref="#dynamic.http"/>
</DATA-GROUP></STATEMENT><STATEMENT><PURPOSE><current/></PURPOSE>... continue as with the previous statement ...
</STATEMENT><STATEMENT><PURPOSE><develop/></PURPOSE>... continue as with the previous statement ...
</STATEMENT></POLICY>
Figure 3.4. Additional representations of the sample ‘logging only’ (refer to Fig. 2.6)
3.3.3 A Normal Form
When we study policies in terms of metrics, cloning, and others, we prefer to use anormal form that neutralizes syntactical diversity. That is, the normal form of a policycorresponds to the extensional set of facts implied by the policy, thereby giving riseto the notion of semantical equality.
Semantical equality
Consider again the ’logging only’ policy in Fig. 2.6. Now consider the two variationsof the same policy in Fig. 3.4. The original formulation used a single statement; thetwo variations use multiple statements. One can consider the original formulation as

3.3 The Essence of P3P 47
• r-purpose(data,purpose,required)• r-recipient(data,recipient,required)• r-retention(data,retention)• r-data(data,optional,identifiable)• r-category(data,category)
Figure 3.5. Relational schema for P3P—adopted from YuLA04
a factored formulation in that two data references and three purposes are groupedtogether in a single statement whereas the first variation maintains the grouping ofpurposes while it splits up the group of data references into multiple statements—likewise for the second variation. We assume that all these three formulations aresemantically equivalent in that they declare the same extensional set of facts; thepolicies admit the same data to be collected, for the same purposes, to be sharedwith the same recipients, and subject to the same retention. The P3P specificationdoes not directly describe such semantical equality, but previous research on theformal semantics of P3P [197] formalizes such an equality based on an appropriatenormal form.
Following [197], the extensional set of facts can actually be represented in P3Psyntax itself. We say that a policy is in normal form, if all statements are restricted tosingle data references, purposes, recipients, and categories; see the “*” cardinalitiesin Fig. 3.1. All the variations on ‘logging only’ are not in normal form becausesome grouping is used; the normal form requires six statements. Normalization (i.e.,derivation of the normal form) is achieved by replacing each statement with one ormore groups by a number of statements exercising all combinations of elements fromthe groups; see [197] for the trivial normalization algorithm.
A relational schema for the normal form
Further following [197], we use a relational schema to specify extensional sets offacts more concisely and to precisely capture key constraints; see Fig. 3.5 for theschema. There are different relations to describe—in a point-wise manner—whatpurposes, recipients, retention levels, and other properties are associated with theindividual data references.
Our schema deviates from the one in [197] only in so far that we take into accountthe possibility of non-identifiable data. Hence, we added a column to r-data thattracks whether a data-reference is identifiable.
The primary keys are underlined in the figure. The key constraints model con-sistency constraints for a policy. We say that a policy is semantically valid if it hasa normal form such that the key constraints are maintained. For instance, within agiven policy, a data reference cannot be both optional and non-optional. That is, op-tionality is a property associated with a data reference; it cannot be specialized perpurpose or recipient.
The P3P specification is not fully conclusive on the appropriateness of key con-straints. On the issue of optionality, we can read, for example: “optional indicates
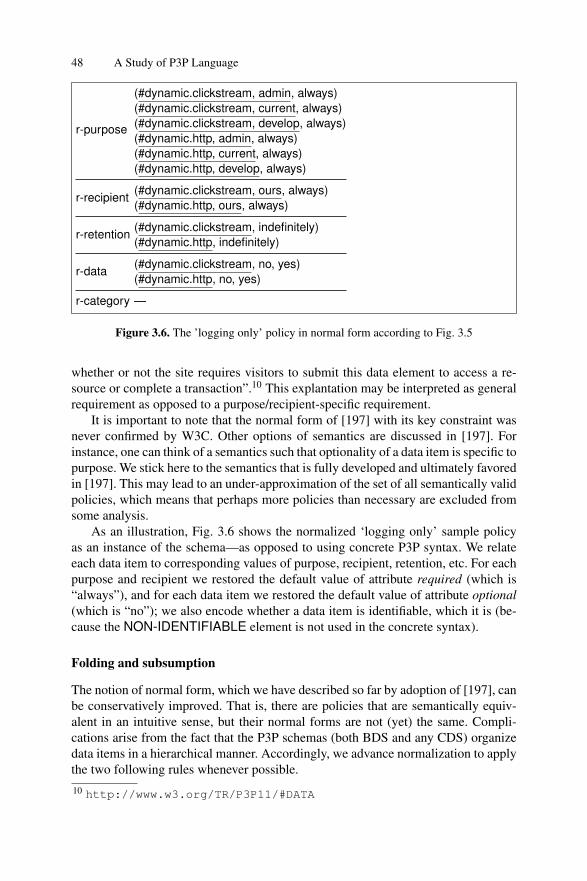
48 A Study of P3P Language
r-purpose
(#dynamic.clickstream, admin, always)(#dynamic.clickstream, current, always)(#dynamic.clickstream, develop, always)(#dynamic.http, admin, always)(#dynamic.http, current, always)(#dynamic.http, develop, always)
r-recipient (#dynamic.clickstream, ours, always)(#dynamic.http, ours, always)
r-retention (#dynamic.clickstream, indefinitely)(#dynamic.http, indefinitely)
r-data (#dynamic.clickstream, no, yes)(#dynamic.http, no, yes)
r-category —
Figure 3.6. The ’logging only’ policy in normal form according to Fig. 3.5
whether or not the site requires visitors to submit this data element to access a re-source or complete a transaction”.10 This explantation may be interpreted as generalrequirement as opposed to a purpose/recipient-specific requirement.
It is important to note that the normal form of [197] with its key constraint wasnever confirmed by W3C. Other options of semantics are discussed in [197]. Forinstance, one can think of a semantics such that optionality of a data item is specific topurpose. We stick here to the semantics that is fully developed and ultimately favoredin [197]. This may lead to an under-approximation of the set of all semantically validpolicies, which means that perhaps more policies than necessary are excluded fromsome analysis.
As an illustration, Fig. 3.6 shows the normalized ‘logging only’ sample policyas an instance of the schema—as opposed to using concrete P3P syntax. We relateeach data item to corresponding values of purpose, recipient, retention, etc. For eachpurpose and recipient we restored the default value of attribute required (which is“always”), and for each data item we restored the default value of attribute optional(which is “no”); we also encode whether a data item is identifiable, which it is (be-cause the NON-IDENTIFIABLE element is not used in the concrete syntax).
Folding and subsumption
The notion of normal form, which we have described so far by adoption of [197], canbe conservatively improved. That is, there are policies that are semantically equiv-alent in an intuitive sense, but their normal forms are not (yet) the same. Compli-cations arise from the fact that the P3P schemas (both BDS and any CDS) organizedata items in a hierarchical manner. Accordingly, we advance normalization to applythe two following rules whenever possible.10 http://www.w3.org/TR/P3P11/#DATA

3.3 The Essence of P3P 49
Before folding After folding
r-purpose (#user.login.id, current, always) (#user.login, current, always)(#user.login.password, current, always)
r-recipient (#user.login.id, ours, always) (#user.login, ours, always)(#user.login.password, ours, always)
r-retention (#user.login.id, indefinitely) (#user.login, indefinitely)(#user.login.password, indefinitely)
r-data (#user.login.id, no, yes) (#user.login, no, yes)(#user.login.password, no, yes)
r-category — —
Figure 3.7. Example of folding in normal form
Before subsumption After subsumption
r-purpose (#user.name, current, always) (#user.name, current, always)(#user.name.given, current, always)
r-recipient (#user.name, ours, always) (#user.name, ours, always)(#user.name.given, ours, always)
r-retention (#user.name, indefinitely) (#user.name, indefinitely)(#user.name.given, indefinitely)
r-data (#user.name, no, yes) (#user.name, no, yes)(#user.name.given, no, yes)
r-category — —
Figure 3.8. Example of subsumption in normal form
We apply folding so that a set of data references with a common parent (in thesense of the hierarchical organization) and the same properties for purposes, recipi-ents, retention, and categories is replaced by a data reference to the parent, if the setis complete, i.e., it contains all children of the given ancestor. Likewise, we applysubsumption so that a data reference is omitted if there is already a data reference tothe ancestor with the same properties.
For instance, in Fig. 3.7, data references user.login.id and user.login.passwordhave the same values in all tuples; furthermore, these two references are the onlyleaves of the node user.login in the BDS. Thus, we can apply folding and reduce thenumber of tuples, introducing the grouping node instead of its leaves. In Fig. 3.8, datareference user.name.given is a leaf of the node user.name in the BDS; furthermore,it has the same properties as the parent node. Thus, we can apply subsumption andreduce the number of tuples by removing redundant ones.

50 A Study of P3P Language
<POLICY><STATEMENT><PURPOSE><admin/><current/><develop/></PURPOSE><RECIPIENT><ours/></RECIPIENT><RETENTION><legal-requirement/></RETENTION><DATA-GROUP><DATA ref="#dynamic.clickstream"/>
</DATA-GROUP></STATEMENT>
</POLICY>
Figure 3.9. A variation on “logging only” with less exposure
3.3.4 Degree of Exposure
By now, we are able to test for semantical equality by checking that the given policieshave the same normal form. If we represent the normal form as relations, then thetest for semantical equality essentially is a test for equality of relations (i.e., sets oftuples). Conceptually, these relations declare exposure in the sense of privacy—whatdata can be collected, for what purposes, with whom can it be shared, and what levelof retention must be provided.
Interestingly, we can compare policies by leveraging (a special variation on) thesubset partial order on the normal-form relations. We refer to this partial order asdegree of exposure. Such a partial order is helpful in comparing similar policies andunderstanding diversity within the corpus; see §3.4.4 in particular.
Consider the policy in Fig. 3.9. It lacks the data reference #dynamic.http; hence,data collection is limited to information typically stored in Web-server access logswithout the additional information from the http protocol as it is specifically coveredby #dynamic.http. The variation also differs with regard to the retention level: itspecifies ‘legal-requirement’ instead of ’indefinitely’; hence, data storage is morelimited. Both differences, by themselves and in combination imply that there is ‘lessexposure’.
The example with the different retention levels gives rise to a more general idea:a partial order can be imposed on the various enumeration types of P3P. The ideais that the different values are partially ordered in terms of degree of exposure. SeeFig. 3.10 for our proposal; exposure increases as one climbs up the Hasse diagrams.We overload the symbol ’≤sem’ to denote these partial orders.
Consider, for example, optionality: if a user is not obliged to provide certain data,then there is less exposure (say, more privacy is maintained), compared to the casewhen such data is required.
The P3P specification does not describe a partial order like ours. The proposal ismeant to be relatively conservative in that we do not impose an order on specific val-ues unless the specification suggests it. In some cases, we pragmatically declare thatsome values imply the same degree of exposure since we could not see that they mustbe incomparable. Some of the specific decisions in our proposal are presumably self-evident; others are more tedious; see Appendix A.1.2 for a more detailed motivation.The impact of our particular definition is very limited in so far that we only use it in

3.3 The Essence of P3P 51
Purpose Recipient
Ret ent ion
Requiredness
Opt ionalit y
Ident if iabilit y
current
admin, develop
tailoring
pseudo-analysis
pseudo-decisionindividual-analysis
individual-decision
contact, historical, telemarketing
ours, same
delivery, other-recipient,
unrelated
public
no-retention
stated-purpose, legal-requirement, business-practices
indefinitely
always
yes
opt-out
opt-in
no
non-identifiable
identifiable
Figure 3.10. Partial orders for the degree of exposure per enumeration type of P3P
our informal discussion of (relationships between) common policies (see §3.4.4 inparticular) and a short summary on remaining diversity among semantically distinctpolicies in Appendix A.1.2.
We define a binary relation ‘≤sem’ on instances of the relational schema for thenormal form. Informally, given two instances i and i′, i.e., two extensional sets offacts, we say that i≤sem i′ if i is a subset of i′ modulo replacing equality of individualfacts by component-wise application of ‘≤sem’ as defined by Fig. 3.10. Clearly, wecompare facts from the same relation (say, table) and with equal data items.
Formally, ‘≤sem’ is defined to be the smallest relation closed under the followingrules. Let i, i′, i′′ range over instances of the relational schema.
[Reflexivity] If i =sem i′, then i≤sem i′.[Transitivity] If i≤sem i′ and i′ ≤sem i′′, then i≤sem i′′.[Subset] If all relations of i are subsets of the corresponding relations of i′, then
i≤sem i′.[Value] If all relations of i are equal to the corresponding relations of i′ except for
tuples t and t ′ (from corresponding relations) of i and i′, respectively such thatt and t ′ differ in values v and v′ for purpose, recipient, retention, identifiability,
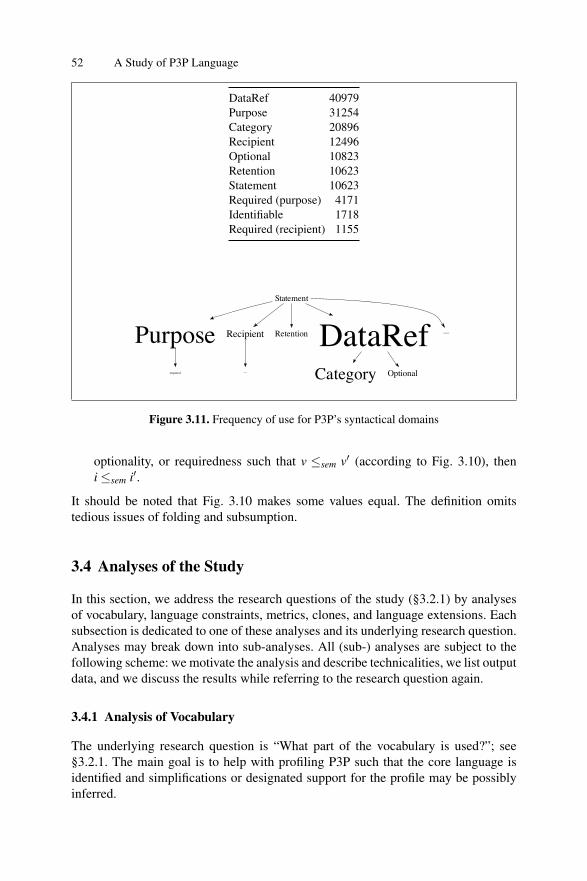
52 A Study of P3P Language
DataRef 40979Purpose 31254Category 20896Recipient 12496Optional 10823Retention 10623Statement 10623Required (purpose) 4171Identifiable 1718Required (recipient) 1155
Statement
Purpose Recipient Retention DataRef Identifiable
required required Category Optional
Figure 3.11. Frequency of use for P3P’s syntactical domains
optionality, or requiredness such that v ≤sem v′ (according to Fig. 3.10), theni≤sem i′.
It should be noted that Fig. 3.10 makes some values equal. The definition omitstedious issues of folding and subsumption.
3.4 Analyses of the Study
In this section, we address the research questions of the study (§3.2.1) by analysesof vocabulary, language constraints, metrics, clones, and language extensions. Eachsubsection is dedicated to one of these analyses and its underlying research question.Analyses may break down into sub-analyses. All (sub-) analyses are subject to thefollowing scheme: we motivate the analysis and describe technicalities, we list outputdata, and we discuss the results while referring to the research question again.
3.4.1 Analysis of Vocabulary
The underlying research question is “What part of the vocabulary is used?”; see§3.2.1. The main goal is to help with profiling P3P such that the core language isidentified and simplifications or designated support for the profile may be possiblyinferred.

3.4 Analyses of the Study 53
Frequency of use for P3P’s syntactical domains
In Fig. 3.11, we list frequency of use for the syntactical domains according to theabstract syntax of Fig. 3.1. We do not count any defaults (such as non-optional dataitems), even if they are specified explicitly. We also visualize these numbers wherewe exploit the fact that P3P has a very simple syntactical structure. There is norecursion. Hence, we can show the compositional structure of policies with a treeand frequencies are translated into node size by using tag cloud-like scaling tech-niques [106].
We observe that most statements do not use a NON-IDENTIFIABLE element.We also observe “popularity” for optionality and opt-in/out. That is, data is said tobe optional in a significant number of cases; purposes are available for opt-in/out ina significant number of cases, but recipients are hardly available for opt-in/out.
Frequency of use for values of P3P’s enumeration types
Given P3P’s reliance on a privacy vocabulary in the form of several finite domains(say, enumeration types), we can get insight into the P3P profile by studying fre-quency of use of the values of those domains; frequencies of usage are summarizedin Fig. 3.12.
We observe that the unspecific purpose ‘current’ is highly frequent and purposesreminiscent of web logging are highly frequent as well. ‘Ours’ dominates the domainof recipients; other purposes are at least a factor two less frequent. The dominanceof ‘ours’ was to be expected because each logically consistent policy must involve‘ours’. There is substantial use of the nonspecific purpose ’other-purpose’, whichsuggests that a richer set of purposes or author-defined purposes may be needed. Wealso observe that indefinite retention is the most popular—which may be explain-able, in part, through the popularity of weblogs, which typically assume indefiniteretention. The retention level ‘business-practices’ is also relatively popular—thesepractices are not specified though in P3P, which suggests that extra language supportcould be useful.
Frequency of use for data items from the BDS
P3P’s Base Data Schema (BDS) expresses the assumptions of the P3P designers as towhat private data website users and policy authors may possibly care about. Fig. 3.13lists frequency of use for popular data references. Fig. 3.14 shows the distribution ofnumbers of references in a double-logarithmic graph.
Discussion
Fig 3.14 confirms that few data items from the BDS account for most of the data ref-erences. The dynamic branch assumes the five most frequent positions in Fig. 3.13.

54 A Study of P3P Language
Purposes Recipients Retentions
develop 6277current 6121admin 5140tailoring 3028pseudo-analysis 2059contact 1779pseudo-decision 1562individual-analysis 1465individual-decision 1405historical 979other-purpose 762telemarketing 677
ours 9635delivery 1571same 583other-recipient 346public 214unrelated 147
indefinitely 4336business-practices 2617stated-purpose 1742no-retention 669legal-requirement 467
Implicitly declared categories Explicitly declared categories
navigation 10247computer 9048demographic 8787physical 8164online 4240interactive 3466uniqueid 594
uniqueid 3675navigation 2328online 2222state 2022physical 1989purchase 1411computer 1396demographic 1289preference 1268interactive 1144content 853other-category 428location 415financial 253government 94health 58political 51
Figure 3.12. Frequency of use for values of P3P’s enumeration types
After 15 positions, frequency is a factor ten reduced. There are several data refer-ences to the dynamic and user branches, and one data reference to the thirdpartybranch among those top 15. The business branch does not show up in Fig. 3.13.
The particular dynamic data references imply that policies in the corpus declarecollection of data such that the highest frequency is about web navigation and inter-action whereas the second and third are about variable-category data elements cook-ies and miscdata. Hence, we see that policies use variable-category data elementsheavily. As a result, policies switch constantly between regular data references with
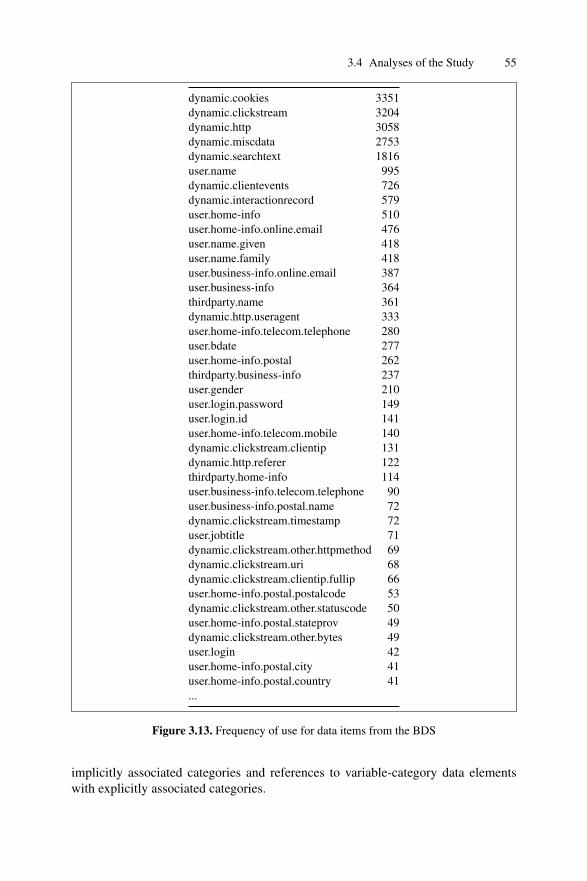
3.4 Analyses of the Study 55
dynamic.cookies 3351dynamic.clickstream 3204dynamic.http 3058dynamic.miscdata 2753dynamic.searchtext 1816user.name 995dynamic.clientevents 726dynamic.interactionrecord 579user.home-info 510user.home-info.online.email 476user.name.given 418user.name.family 418user.business-info.online.email 387user.business-info 364thirdparty.name 361dynamic.http.useragent 333user.home-info.telecom.telephone 280user.bdate 277user.home-info.postal 262thirdparty.business-info 237user.gender 210user.login.password 149user.login.id 141user.home-info.telecom.mobile 140dynamic.clickstream.clientip 131dynamic.http.referer 122thirdparty.home-info 114user.business-info.telecom.telephone 90user.business-info.postal.name 72dynamic.clickstream.timestamp 72user.jobtitle 71dynamic.clickstream.other.httpmethod 69dynamic.clickstream.uri 68dynamic.clickstream.clientip.fullip 66user.home-info.postal.postalcode 53dynamic.clickstream.other.statuscode 50user.home-info.postal.stateprov 49dynamic.clickstream.other.bytes 49user.login 42user.home-info.postal.city 41user.home-info.postal.country 41...
Figure 3.13. Frequency of use for data items from the BDS
implicitly associated categories and references to variable-category data elementswith explicitly associated categories.
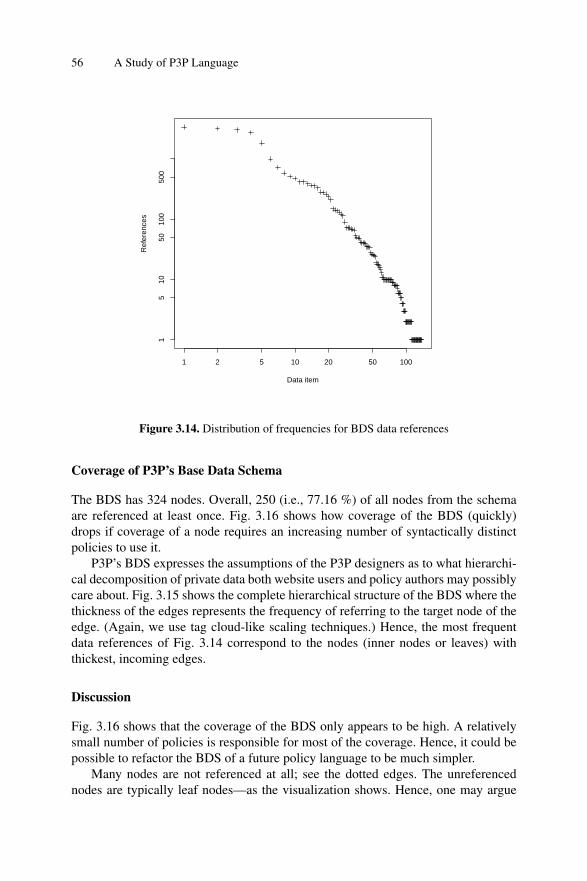
56 A Study of P3P Language
1 2 5 10 20 50 100
15
1050
100
500
Data item
Ref
eren
ces
Figure 3.14. Distribution of frequencies for BDS data references
Coverage of P3P’s Base Data Schema
The BDS has 324 nodes. Overall, 250 (i.e., 77.16 %) of all nodes from the schemaare referenced at least once. Fig. 3.16 shows how coverage of the BDS (quickly)drops if coverage of a node requires an increasing number of syntactically distinctpolicies to use it.
P3P’s BDS expresses the assumptions of the P3P designers as to what hierarchi-cal decomposition of private data both website users and policy authors may possiblycare about. Fig. 3.15 shows the complete hierarchical structure of the BDS where thethickness of the edges represents the frequency of referring to the target node of theedge. (Again, we use tag cloud-like scaling techniques.) Hence, the most frequentdata references of Fig. 3.14 correspond to the nodes (inner nodes or leaves) withthickest, incoming edges.
Discussion
Fig. 3.16 shows that the coverage of the BDS only appears to be high. A relativelysmall number of policies is responsible for most of the coverage. Hence, it could bepossible to refactor the BDS of a future policy language to be much simpler.
Many nodes are not referenced at all; see the dotted edges. The unreferencednodes are typically leaf nodes—as the visualization shows. Hence, one may argue

3.4 Analyses of the Study 57
user
dynamic
business
thirdparty
Figure 3.15. Coverage of P3P’s Base Data Schema
that the BDS could have been kept simpler so that it only focuses on the essentialontology of private data without breaking down all data into ‘primitive’ items.
3.4.2 Analysis of Constraints
The underlying research question is “Is the language correctly used?”; see §3.2.1.The main goal is to understand what correctness issues, if any, exist in the wild, andto find plausible explanations or even to make recommendations for future policylanguages. We investigate correctness here on the grounds of language constraintsfor P3P as they are available from different sources.
We were interested in constraints that add to the basic XML schema-based vali-dation for P3P. We identified two kinds of constraints in the P3P specification. First,each data reference must be resolvable to a data item in a P3P data schema. Second,the (latest and provisional) specification stipulates sanity checking rules11 (say, co-
11 http://www.w3.org/TR/P3P11/#ua_sanity

58 A Study of P3P Language
!
!
!
!
!
!
!
!!!!
!!!!!!!!!!!!!!!!!!!!!!!!!!!!!!!!!!!!!!!!!!!!!!!!!!!!!!!!!!!!!!!!!!!!!!!!!!!!!!!!!!!!!!!!!!!!!!!!!!!!!!!!!!!!!!!!!!!!!!!!!!!!!!!!!!!!!!!!!!!!!!!!!!!!!!!!!!!!!!!!!!!!!!!!!!!!!!!!!!!!!!!!!!!!!!!!!!!!!!!!!!!!!!!!!!!!!!!!!!!!!!!!!!!!!!!!!!!!!!!!!!!!!!!!!!!!!!!!!!!!!!!!!!!!!!!!!!!!!!!!!!!!!!!!!!!!!!!!!!!!!!!!!!!!!!!!!!!!!!!!!!!!!!!!!!!!!!!!!!!!!!!!!!!!!!!!!!!!!!!!!!!!!!!!!!!!!!!!!!!!!!!!!!!!!!!!!!!!!!!!!!!!!!!!!!!!!!!!!!!!!!!!!!!!!!!!!!!!!!!!!!!!!!!!!!!!!!!!!!!!!!!!!!!!!!!!!!!!!!!!!!!!!!!!!!!!!!!!!!!!!!!!!!!!!!!!!!!!!!!!!!!!!!!!!!!!!!!!!!!!!!!!!!!!!!!!!!!!!!!!!!!!!!!!!!!!!!!!!!!!!!!!!!!!!!!!!!!!!!!!!!!!!!!!!!!!!!!!!!!!!!!!!!!!!!!!!!!!!!!!!!!!!!!!!!!!!!!!!!!!!!!!!!!!!!!!!!!!!!!!!!!!!!!!!!!!!!!!!!!!!!!!!!!!!!!!!!!!!!!!!!!!!!!!!!!!!!!!!!!!!!!!!!!!!!!!!!!!!!!!!!!!!!!!!!!!!!!!!!!!!!!!!!!!!!!!!!!!!!!!!!!!!!!!!!!!!!!!!!!!!!!!!!!!!!!!!!!!!!!!!!!!!!!!!!!!!!!!!!!!!!!!!!!!!!!!!!!!!!!!!!!!!!!!!!!!!!!!!!!!!!!!!!!!!!!!!!!!!!!!!!!!!!!!!!!!!!!!!!!!!!!!!!!!!!!!!!!!!!!!!!!!!!!!!!!!!!!!!!!!!!!!!!!!!!!!!!!!!!!!!!!!!!!!!!!!!!!!!!!!!!!!!!!!!!!!!!!!!!!!!!!!!!!!!!!!!!!!!!!!!!!!!!!!!!!!!!!!!!!!!!!!!!!!!!!!!!!!!!!!!!!!!!!!!!!!!!!!!!!!!!!!!!!!!!!!!!!!!!!!!!!!!!!!!!!!!!!!!!!!!!!!!!!!!!!!!!!!!!!!!!!!!!!!!!!!!!!!!!!!!!!!!!!!!!!!!!!!!!!!!!!!!!!!!!!!!!!!!!!!!!!!!!!!!!!!!!!!!!!!!!!!!!!!!!!!!!!!!!!!!!!!!!!!!!!!!!!!!!!!!!!!!!!!!!!!!!!!!!!!!!!!!!!!!!!!!!!!!!!!!!!!!!!!!!!!!!!!!!!!!!!!!!!!!!!!!!!!!!!!!!!!!!!!!!!!!!!!!!!!!!!!!!!!!!!!!!!!!!!!!!!!!!!!!!!!!!!!!!!!!!!!!!!!!!!!!!!!!!!!!!!!!!!!!!!!!!!!!!!!!!!!!!!!!!!!!!!!!!!!!!!!!!!!!!!!!!!!!!!!!!!!!!!!!!!!!!!!!!!!!!!!!!!!!!!!!!!!!!!!!!!!!!!!!!!!!!!!!!!!!!!!!!!!!!!!!!!!!!!!!!!!!!!!!!!!!!!!!!!!!!!!!!!!!!!!!!!!!!!!!!!!!!!!!!!!!!!!!!!!!!!!!!!!!!!!!!!!!!!!!!!!!!!!!!!!!!!!!!!!!!!!!!!!!!!!!!!!!!!!!!!!!!!!!!!!!!!!!!!!!!!!!!!!!!!!!!!!!!!!!!!!!!!!!!!!!!!!!!!!!!!!!!!!!!!!!!!!!!!!!!!!!!!!!!!!!!!!!!!!!!!!!!!!!!!!!!!!!!!!!!!!!!!!!!!!!!!!!!!!!!!!!!!!!!!!!!!!!!!!!!!!!!!!!!!!!!!!!!!!!!!!!!!!!!!!!!!!!!!!!!!!!!!!!!!!!!!!!!!!!!!!!!!!!!!!!!!!!!!!!!!!!!!!!!!!!!!!!!!!!!!!!!!!!!!!!!!!!!!!!!!!!!!!!!!!!!!!!!!!!!!!!!!!!!!!!!!!!!!!!!!!!!!!!!!!!!!!!!!!!!!!!!!!!!!!!!!!!!!!!!!!!!!!!!!!!!!!!!!!!!!!!!!!!!!!!!!!!!!!!!!!!!!!!!!!!!!!!!!!!!!!!!!!!!!!!!!!!!!!!!!!!!!!!!!!!!!!!!!!!!!!!!!!!!!!!!!!!!!!!!!!!!!!!!!!!!!!!!!!!!!!!!!!!!!!!!!!!!!!!!!!!!!!!!!!!!!!!!!!!!!!!!!!!!!!!!!!!!!!!!!!!!!!!!!!!
0 500 1000 1500 2000
02
04
06
08
01
00
Threshold (# syntactically distinct policies)
Cove
rag
e o
f B
DS
(%
)
Threshold BDS coverage
1 77.16 %2 63.88 %3 59.56 %4 50.30 %5 44.44 %6 38.88 %7 35.80 %8 31.79 %9 30.24 %
10 29.93 %
Figure 3.16. Coverage of BDS with a threshold on the number of syntactically distinct policies
herence constraints). We obtained further coherence constraints as well as the keyconstraints of §3.3.3 from Yu et al. article on the ’relational semantics’ of P3P [197].
Key constraints
The key constraints of the relational schema for P3P’s normal form, as of §3.3.3,immediately constrain the abstract syntax of §3.3.2. We check these constraints nat-urally as we normalize policies by deriving relations from the P3P statements. When-ever we insert tuples into the relations, we admit identical tuples, but we do not admittuples that violate key constraints. (This is part of the normalization algorithm [197].)We refer to Table 3.4 for violation counts for the different key constraints. We noteagain that the key constraints are potentially debatable; see the discussion in §3.3.3.
Relation # Policies # Syn. distinct policies
r-data 448 248r-retention 139 104r-purpose 50 33r-recipient 7 7
Any of them 544 (of 6,182) 312 (of 2,304)
Table 3.4. Key-constraint violations

3.4 Analyses of the Study 59
Discussion
Table 3.4 shows that key constraints are violated frequently. For instance, a violationof the key constraint for r-retention would mean that a policy makes different reten-tion promises (such as ‘no retention’ versus ‘indefinite retention’) for the same data,which could be sensible if different purposes or recipients are allowed to provide in-dividual retention. Given the non-standardized status of the normal form, we cannotconclusively rule these violations as definite instances of incorrect use of P3P, butthey definitely indicate a problem with the status of P3P formalization and valida-tion.
Consider also the high number of violations of r-data’s key constraint. Usersseem to assume that a data reference may be used with different optionality val-ues for varying purposes. As we discussed in §3.3.3, the specification may suggestotherwise. This observation suggests that either fine-grained optionality should beexplicitly provided by future policy languages or the specification should be clarifiedand validation should effectively enforce the restriction.
More generally, the lifecycle for P3P policies is too weakly supported. Basicschema-based validation is insufficient to find more subtle issues like the key con-straints at hand or any other key constraints for that matter. The fact that key con-straints are not systematically listed in the specification does not help. Future policylanguage should leverage stronger specifications and a lifecycle with effective vali-dation.
We must say that we are undecided as to whether the r-data key constraint is everto be enforced for variable-category data elements such as #dynamic.miscdata;see §3.3.2. The challenge is here that the same data element could be used multi-ple times in the same policy with different categories for different parts of the datamodel, thereby giving support to the idea that optionality may differ per occasion.This mechanism may need to be reconsidered and more strongly specified in futurepolicy languages.
Hierarchy constraints
There is a natural extension of r-data’s key constraint that takes into account thehierarchical organization of a data schema (typically the BDS), as suggested in [197].That is, given two data references r and r′ such that r is a prefix of r′, then explicitdeclarations of optionality for r and r′ must agree. For example, if a policy declaresuser.name as being non-optional, then user.name.given cannot be declared as beingoptional.
We refer to Table 3.5 for violation counts for the hierarchy constraint. We alsoshow counts for applying the normalization rules for folding and subsumption as of§3.3.3 as these rules are clearly concerned with the hierarchy in a data schema.
Discussion
Hierarchical inconsistency appears to be a small problem. There are considerablymore applications though of the rules for folding and subsumption. While we do not

60 A Study of P3P Language
Issue # Policies # Syn. distinct policies
Inconsistency 17 15
Folding 48 32Subsumption 167 105
Table 3.5. Hierarchy-constraint violations and applications of normalization rules
count these applications as constraint violations, they indicate problems neverthelessbecause they may proxy for redundant or unnecessarily verbose policies, therebysuggesting again reconsideration of the data model as well as the degree of validationso that such verbosity or redundancy may be reduced.
Data-schema constraints
Data references may basically be inconsistent with regard to data schemas (BDS orCDS, if present). This is comparable to ‘undeclared variable’ issues in type checkingfor programming languages. We classify the issues in more detail; see Table 3.6for an itemization. We systematically discovered these issues in developing a nameresolver for P3P. Here we note that resolved P3P policies are needed, for example, tocheck hierarchy constraints (see §3.4.2) and to compute a data-schema-related metric(see §3.4.3).
Issue # Policies # Syn. distinct policies
BDS legacy 580 358Unresolvable data reference 115 85Missing CDS 11 7CDS legacy 203 157
Any of them 848 (of 6,182) 579 (of 2,304)
Table 3.6. Data-schema constraint violations
The ‘BDS legacy’ issue refers to the problem that policies use the obsolete BDSof P3P 1.0 where they are supposed to use BDS of P3P 1.1 instead: “User agentsare only required to validate P3P 1.1 policy data elements according to a P3P 1.1data schema.” 12 The ‘Unresolvable data reference’ issue refers to the problem thatpolicies refer to data references that are simply not declared by the BDS. The ‘Miss-ing CDS’ issue refers to the problem that a linked CDS is non-resolvable, and ‘CDSlegacy’ issue refers to the problem that policies use an obsolete format for CDSwhere they are supposed to XSD: “Web sites using custom data schemas MUSTpublish these schemas in P3P1.1 format only.” 12
12 http://www.w3.org/TR/P3P11/#Data_Schemas_back
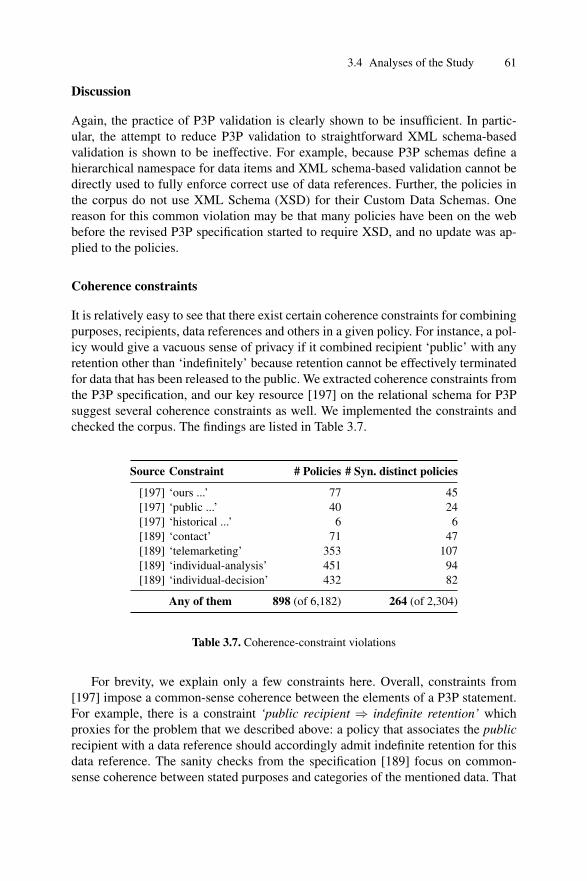
3.4 Analyses of the Study 61
Discussion
Again, the practice of P3P validation is clearly shown to be insufficient. In partic-ular, the attempt to reduce P3P validation to straightforward XML schema-basedvalidation is shown to be ineffective. For example, because P3P schemas define ahierarchical namespace for data items and XML schema-based validation cannot bedirectly used to fully enforce correct use of data references. Further, the policies inthe corpus do not use XML Schema (XSD) for their Custom Data Schemas. Onereason for this common violation may be that many policies have been on the webbefore the revised P3P specification started to require XSD, and no update was ap-plied to the policies.
Coherence constraints
It is relatively easy to see that there exist certain coherence constraints for combiningpurposes, recipients, data references and others in a given policy. For instance, a pol-icy would give a vacuous sense of privacy if it combined recipient ‘public’ with anyretention other than ‘indefinitely’ because retention cannot be effectively terminatedfor data that has been released to the public. We extracted coherence constraints fromthe P3P specification, and our key resource [197] on the relational schema for P3Psuggest several coherence constraints as well. We implemented the constraints andchecked the corpus. The findings are listed in Table 3.7.
Source Constraint # Policies # Syn. distinct policies
[197] ‘ours ...’ 77 45[197] ‘public ...’ 40 24[197] ‘historical ...’ 6 6[189] ‘contact’ 71 47[189] ‘telemarketing’ 353 107[189] ‘individual-analysis’ 451 94[189] ‘individual-decision’ 432 82
Any of them 898 (of 6,182) 264 (of 2,304)
Table 3.7. Coherence-constraint violations
For brevity, we explain only a few constraints here. Overall, constraints from[197] impose a common-sense coherence between the elements of a P3P statement.For example, there is a constraint ‘public recipient ⇒ indefinite retention’ whichproxies for the problem that we described above: a policy that associates the publicrecipient with a data reference should accordingly admit indefinite retention for thisdata reference. The sanity checks from the specification [189] focus on common-sense coherence between stated purposes and categories of the mentioned data. That

62 A Study of P3P Language
is, the constraints express that data of a certain category is needed for a given pur-pose. For example, the ‘contact’ constraint says that a P3P statement with purpose‘contact’ should contain at least one data element from the categories ‘physical’ or‘online’. (Otherwise, it may just be impossible to actually contact the person.)
Discussion
Again, the practice of P3P validation is clearly shown to be insufficient. However, itmust be noted that the P3P specification does not even attempt a comprehensive suiteof coherence constraints. Such constraints would not only be useful for validation;they would also be helpful in understanding the P3P vocabulary as such.
Constraint category # Policies # Syn. distinct policies
Key 544 312Hierarchy 17 15Data-schema 848 579Coherence 898 264
Any of them 2,193 (of 6,182) 1,083 (of 2,304)
Table 3.8. Summary of constraint violations
Summary of constraint violations
All kinds of violations are summarized in Table 3.8. Some of the subsequent analy-ses operate on the normal form. Hence, they can only deal with policies that do notviolate the key constraints of the normal form. We refer to those policies as being se-mantically valid. All the other violations do not limit any of our subsequent analyses.For clarity, we summarize:
• # Syntactically valid policies: 6,182 (i.e., all policies in the corpus)– Syntactically distinct policies thereof: 2,304
• # Semantically valid policies: 4,869 (i.e., all policies with a normal form)– Semantically distinct policies thereof: 1,38513
13 For precision’s sake, this number is based on the semantical equality as introduced in §3.3.3without taking into account extra equations due to ‘≤sem’ as of §3.3.4. However, the differ-ence is insignificant. That is, there is 1 policy that is unequal to any other policy at the levelof normal forms while it is equal to another policy when taking into account Fig. 3.10.

3.4 Analyses of the Study 63
3.4.3 Analysis of Metrics
The underlying research question is “What is a significant policy?”; see §3.2.1. Themain goal is to identify significant policies, that is, policies which provide insightinto the underlying web-based system. We are going to try different, straightforwardmetrics to this end. Ultimately, we consider those metrics to be useful, if they pointto policies that we can manually validate to be significant. We do not use metrics inany sophisticated manner of the kind that we plan to validate hypotheses of corre-lation between metrics and other properties of policies or the underlying web-basedsystems.
Syntactical size
An obvious starting point is a metric for the syntactical size, denoted as SYN(·),which is based on the abstract syntax of P3P as defined in §3.3.2. We comparethis metric with the Lines-of-Code metric (LOC) or its variation without comments(NCLOC) that is a popular, basic size metric for programs. LOC/NCLOC are not di-rectly applicable to P3P because P3P is primarily an XML language. Hence, SYN(·)is defined as a tree-based node count.
Given a policy P, we define SYN(P) as the node count of its tree-based repre-sentation according to P3P’s abstract syntax of Fig. 3.1. That is, we count nodesfor statements, purposes, recipients, retention levels, data references, (explicitly de-clared) values for requiredness, optionality, non-identifiability, and categories. In par-ticular, we do not count the description of the entity and the policy’s consequencesin any way.
For instance, let us determine the syntactical size for different variations on ‘log-ging only’ policy. We have that SYN(Fig. 2.6) equals 8; there is one statement, threepurposes, one recipient, one retention, and two data references. Further:
• SYN(Data-centric style in Fig. 3.4) equals 14.• SYN(Purpose-centric style in Fig. 3.4) equals 18.
Min 1st Q Median Mean 3rd Q Max
2 11 20 25.28 36 245
Table 3.9. The SYN(·) scale
Table 3.9 shows that the distribution of SYN(·) is shifted to small node counts; seemedian and quartiles. We contend that P3P policies are of trivial size, when comparedto program sizes of general purpose or domain-specific programming languages.

64 A Study of P3P Language
Semantical size
Since the abstract syntax is known to enable much representational diversity for se-mantically equivalent policies, we may attempt a metric that abstracts from suchdiversity. Thus, let us consider semantical size, denoted as SEM(·) as follows. Givena policy P with the normal form value P′ (i.e., a set of tuples that populate the rela-tional schema of §3.3.3), we compute the semantical size of P as the straight sum ofthe numbers of tuples in the various relations r-purpose, r-recipient, r-retention,r-data, and r-category.
Conceptually, there is a deeper argument for considering such a metric. That is,we can view the normal form as the most discrete representation of all the privacystatements in a policy (modulo folding and subsumption). Intuitively, we can com-pare such a metric—very roughly—with McCabe’s cyclomatic complexity for pro-gramming languages [132] in so far that both metrics are concerned with countingdecisions.
Let us revisit the ‘logging only’ policy. SEM(Fig. 3.6) equals 12, i.e., there are 12tuples in the tables for the normal form. All syntactical variations on ‘logging only’have the same normal form and hence the same semantical size.
Min 1st Q Median Mean 3rd Q Max
0 10 24 31.75 41 352
Table 3.10. The SEM(·) scale
Table 3.10 shows that the distribution of SEM(·) is equally shifted to small sizes,when compared to SYN(·). However, it is easy to confirm that syntactical and seman-tical sizes of policies do not correlate. The distributions of the two size metrics areshown in Fig. 3.17. Policies are ordered by syntactical size. Both metrics are nor-malized to the [0,1] range. The policies at the tail with low syntactical size have asemantical size of 0. Semantical size is only computed for semantically valid poli-cies. (The invalid policies have scattered syntactical sizes, and hence, their absencecannot be ‘spotted’ in Fig. 3.17.) Such non-correlation should not be surprising; wemerely show it here for illustration.
If we group all policies with the same syntactical size and compare the differentsemantical sizes per syntactical size, then we find that a maximum ratio of 22.08between the smallest and the largest semantical size in the corpus. Hence, syntacti-cal size can translate into very different semantical sizes. This status suggests thatwe should not pay too much attention to syntactical size when we try to determinesignificant policies. Instead, we favor greater semantical sizes.

3.4 Analyses of the Study 65
●●●●
●●●●●●●●●●●●●●●●●●●●●●●●●●●●●●●●●●●●●●●●●●●●●●●●●●●●●●●●●●●●●●●●●●●●●●●●●●●●●●●●●●●●●●●●●●●●●●●●●●●●●●●●●●●●●●●●●●●●●●●●●●●●●●●●●●●●●●●●●●●●●●●●●●●●●●●●●●●●●●●●●●●●●●●●●●●●●●●●●●●●●●●●●●●●●●●●●●●●●●●●●●●●●●●●●●●●●●●●●●●●●●●●●●●●●●●●●●●●●●●●●●●●●●●●●●●●●●●●●●●●●●●●●●●●●●●●●●●●●●●●●●●●●●●●●●●●●●●●●●●●●●●●●●●●●●●●●●●●●●●●●●●●●●●●●●●●●●●●●●●●●●●●●●●●●●●●●●●●●●●●●●●●●●●●●●●●●●●●●●●●●●●●●●●●●●●●●●●●●●●●●●●●●●●●●●●●●●●●●●●●●●●●●●●●●●●●●●●●●●●●●●●●●●●●●●●●●●●●●●●●●●●●●●●●●●●●●●●●●●●●●●●●●●●●●●●●●●●●●●●●●●●●●●●●●●●●●●●●●●●●●●●●●●●●●●●●●●●●●●●●●●●●●●●●●●●●●●●●●●●●●●●●●●●●●●●●●●●●●●●●●●●●●●●●●●●●●●●●●●●●●●●●●●●●●●●●●●●●●●●●●●●●●●●●●●●●●●●●●●●●●●●●●●●●●●●●●●●●●●●●●●●●●●●●●●●●●●●●●●●●●●●●●●●●●●●●●●●●●●●●●●●●●●●●●●●●●●●●●●●●●●●●●●●●●●●●●●●●●●●●●●●●●●●●●●●●●●●●●●●●●●●●●●●●●●●●●●●●●●●●●●●●●●●●●●●●●●●●●●●●●●●●●●●●●●●●●●●●●●●●●●●●●●●●●●●●●●●●●●●●●●●●●●●●●●●●●●●●●●●●●●●●●●●●●●●●●●●●●●●●●●●●●●●●●●●●●●●●●●●●●●●●●●●●●●●●●●●●●●●●●●●●●●●●●●●●●●●●●●●●●●●●●●●●●●●●●●●●●●●●●●●●●●●●●●●●●●●●●●●●●●●●●●●●●●●●●●●●●●●●●●●●●●●●●●●●●●●●●●●●●●●●●●●●●●●●●●●●●●●●●●●●●●●●●●●●●●●●●●●●●●●●●●●●●●●●●●●●●●●●●●●●●●●●●●●●●●●●●●●●●●●●●●●●●●●●●●●●●●●●●●●●●●●●●●●●●●●●●●●●●●●●●●●●●●●●●●●●●●●●●●●●●●●●●●●●●●●●●●●●●●●●●●●●●●●●●●●●●●●●●●●●●●●●●●●●●●●●●●●●●●●●●●●●●●●●●●●●●●●●●●●●●●●●●●●●●●●●●●●●●●●●●●●●●●●●●●●●●●●●●●●●●●●●●●●●●●●●●●●●●●●●●●●●●●●●●●●●●●●●●●●●●●●●●●●●●●●●●●●●●●●●●●●●●●●●●●●●●●●●●●●●●●●●●●●●●●●●●●●●●●●●●●●●●●●●●●●●●●●●●●●●●●●●●●●●●●●●●●●●●●●●●●●●●●●●●●●●●●●●●●●●●●●●●●●●●●●●●●●●●●●●●●●●●●●●●●●●●●●●●●●●●●●●●●●●●●●●●●●●●●●●●●●●●●●●●●●●●●●●●●●●●●●●●●●●●●●●●●●●●●●●●●●●●●●●●●●●●●●●●●●●●●●●●●●●●●●●●●●●●●●●●●●●●●●●●●●●●●●●●●●●●●●●●●●●●●●●●●●●●●●●●●●●●●●●●●●●●●●●●●●●●●●●●●●●●●●●●●●●●●●●●●●●●●●●●●●●●●●●●●●●●●●●●●●●●●●●●●●●●●●●●●●●●●●●●●●●●●●●●●●●●●●●●●●●●●●●●●●●●●●●●●●●●●●●●●●●●●●●●●●●●●●●●●●●●●●●●●●●●●●●●●●●●●●●●●●●●●●●●●●●●●●●●●●●●●●●●●●●●●●●●●●●●●●●●●●●●●●●●●●●●●●●●●●●●●●●●●●●●●●●●●●●●●●●●●●●●●●●●●●●●●●●●●●●●●●●●●●●●●●●●●●●●●●●●●●●●●●●●●●●●●●●●●●●●●●●●●●●●●●●●●●●●●●●●●●●●●●●●●●●●●●●●●●●●●●●●●●●●●●●●●●●●●●●●●●●●●●●●●●●●●●●●●●●●●●●●●●●●●●●●●●●●●●●●●●●●●●●●●●●●●●●●●●●●●●●●●●●●●●●●●●●●●●●●●●●●●●●●●●●●●●●●●●●●●●●●●●●●●●●●●●●●●●●●●●●●●●●●●●●●●●●●●●●●●●●●●●●●●●●●●●●●●●●●●●●●●●●●●●●●●●●●●●●●●●●●●●●●●●●●●●●●●●●●●●●●●●●●●●●●●●●●●●●●●●●●●●●●●●●●●●●●●●●●●●●●●●●●●●●●●●●●●●●●●●●●●●●●●●●●●●●●●●●●●●●●●●●●●●●●●●●●●●●●●●●●●●●●●●●●●●●●●●●●●●●●●●●●●●●●●●●●●●●●●●●●●●●●●●●●●●●●●●●●●●●●●●●●●●●●●●●●●●●●●●●●●●●●●●●●●●●●●●●●●●●●●●●●●●●●●●●●●●●●●●●●●●●●●●●●●●●●●●●●●●●●●●●●●●●●●●●●●●●●●●●●●●●●●●●●●●●●●●●●●●●●●●●●●●●●●●●●●●●●●●●●●●●●●●●●●●●●●●●●●●●●●●●●●●●●●●●●●●●●●●●●●●●●●●●●●●●●●●●●●●●●●●●●●●●●●●●●●●●●●●●●●●●●●●●●●●●●●●●●●●●●●●●●●●●●●●●●●●●●●●●●●●●●●●●●●●●●●●●●●●●●●●●●●●●●●●●●●●●●●●●●●●●●●●●●●●●●●●●●●●●●●●●●●●●●●●●●●●●●●●●●●●●●●●●●●●●●●●●●●●●●●●●●●●●●●●●●●●●●●●●●●●●●●●●●●●●●●●●●●●●●●●●●●●●●●●●●●●●●●●●●●●●●●●●●●●●●●●●●●●●●●●●●●●●●●●●●●●●●●●●●●●●●●●●●●●●●●●●●●●●●●●●●●●●●●●●●●●●●●●●●●●●●●●●●●●●●●●●●●●●●●●●●●●●●●●●●●●●●●●●●●●●●●●●●●●●●●●●●●●●●●●●●●●●●●●●●●●●●●●●●●●●●●●●●●●●●●●●●●●●●●●●●●●●●●●●●●●●●●●●●●●●●●●●●●●●●●●●●●●●●●●●●●●●●●●●●●●●●●●●●●●●●●●●●●●●●●●●●●●●●●●●●●●●●●●●●●●●●●●●●●●●●●●●●●●●●●●●●●●●●●●●●●●●●●●●●●●●●●●●●●●●●●●●●●●●●●●●●●●●●●●●●●●●●●●●●●●●●●●●●●●●●●●●●●●
●●●●●●●●●●●●●●●●●●●●●●●●●●●●●●●●●●●●●●●●●●●●●●●●●●●●●●●●●●●●●●●●●●●●●●●●●●●●●●●●●●●●●●●●●●●●●●●●●●●●●●●●●●●●●●●●●●●●●●●●●●●●●●●●●●●●●●●●●●●●●●●●●●●●●●●●●●●●●●●●●●●●●●●●●●●●●●●●●●●●●●●●●●●●●●●●●●●●●●●●●●●●●●●●●●●●●●●●●●●●●●●●●●●●●●●●●●●●●●●●●●●●●●●●●●●●●●●●●●●●●●●●●●●●●●●●●●●●●●●●●●●●●●●●●●●●●●●●●●●●●●●●●●●●●●●●●●●●●●●●●●●●●●●●●●●●●●●●●●●●●●●●●●●●●●●●●●●●●●●●●●●●●●●●●●●●●●●●●●●●●●●●●●●●●●●●●●●●●●●●●●●●●●●●●●●●●●●●●●●●●●●●●●●●●●●●●●●●●●●●●●●●●●●●●●●●●●●●●●●●●●●●●●●●●●●●●●●●●●●●●●●●●●●●●●●●●●●●●●●●●●●●●●●●●●●●●●●●●●●●●●●●●●●●●●●●●●●●●●●●●●●●●●●●●●●●●●●●●●●●●●●●●●●●●●●
●●●●●●●●●●●●●●●●●●●●●●●●●●●●●●●●●●●●●●●●●●●●●●●●●●●●●●●●●●●●●●●●●●●●●●●●●●●●●●●●●●●●●●●●●●●●●●●●●●●●●●●●●●●●●●●●●●●●●●●●●●●●●●●●●●●●●●●●●●●●●●●●●●●●●●●●●●●●●●●●●●●●●●●●●●●●●●●●●●●●●●●●●●●●●●●●●●●●●●●●●●●●●●●●●●●●●●●●●●●●●●●●●●●●●●●●●●●●●●●●●●●●●●●●●●●●●●●●●●●●●●●●●●●●●●●●●●●●●●●●●●●●●●●●●●●●●●●●●●●●●●●●●
●●●●●●●●●●●●●●●●●●●●●●●●●●●●●●●●●●●●●●●●●●●●●●●●●●●●●●●●●●●●●●●●●●●●●●●●●●●●●●●●●●●●●●●●●●●●●●●●●●●●●●●●●●●●●●●●●●●●●●●●●●●●●●●●●●●●●●●●●●●●●●●●●●●●●●●●●●●●●●●●●●●●●●●●●●●●●●●●●●●●●●●●●●●●●●●●●●●●●●●●●●●●●●●●●●●●●●●●●●●●●●●●●●●●●●●●●●●●●●●●●●●●●●●●●●●●●●●●●●●●●●●●●●●●●●●●●●●●●●●●●●●●●●●●●
●●●●●●●●●●●●●●●●●●●●●●●●●●●●●●●●●●●●●●●●●●●●●●●●●●●●●●●●●●●●●●●●●●●●●●●●●●●●●●●●●●●●●●●●●●●●●●●●●●●●●●●●●●●●●●●●●●●●●●●●●●●●●●●●●●●●●●●●●●●●●●●●●●●●●●●●●●●●●●●●●●●●●●●●●●●●●●●●●●●●●●●●●●●●●●●●●●●●●●●●●●●●●●●●●●●●●●●●●●●●●●●●●●●●●●●●●●●●●●●●●●●●●●●●●●●●●●●●●●●●●●●●●●●●●●●●●●●●●●●●●●●●●●●●●●●●●●●●●●●●●●●●●●●●●●●
●●●●●●●●●●●●●●●●●●●●●●●●●●●●●●●●●●●●●●●●●●●●●●●●●●●●●●●●●●●●●●●●●●●●●●●●●●●●●●●●●●●●●●●●●●●●●●●●●●●●●●●●●●●●●●●●●●●●●●●●●●●●●●●●●●●●●●●●●●●●●●●●●●●●●●●●●●●●●●●●●●●●●●●●●●●●●●●●●●●●●●●●●●●●●●●●●●●●●●●●●●●●●●●●●●●●●●●●●●●●●●●●●●●●●●●●●●●●●●●●●●●●●●●●●●●●●●●●●●●●●●●●●●●●●●●●●●●●●●●●●●●●●●●●●●●●●●●●●●●●●●●●●●●●●●●●●●●●●●●●●●●●●●
●●●●●●●●●●●●●●●●●●●●●●●●●●●●●●●●●●●●●●●●●●●●●●●●●●●●●●●●●●●●●●●●●●●●●●●●●●●●●●●●●●●●●●●●●●●●●●●●●●●●●●●●●●●●●●●●●●●●●●●●●●●●●●●●●●●●●●●●●●●●●●●●●●●●●●●●●●●●●●●●●●●●●●●●●●●●●●●●●●●●●●●●●●●●●●●●●●●●●●●●●●●●●●●●●●●●●●●●●●●●●●●●●●●●●●●●●●●●●●●●●●●●●●●●●●●●●●●●●●●●●●●●●●●●●●●●●●●●●●●●●●●●●●●●●●●●●●●●●●●●●●●●●●●●●●●●●●●●●●●●●●●●●●●●●●●●●●●●●●●●●●●●●●●●●●●●●●●●●●●●●●●●●●●●●●●●●●●●●●●●●●●●●●●●●●●●●●●●●●●●●●●●●●●●●●●●●●●●●●●●●●●●●●●●●●●●●●●●●●●●●●●●●●●●●●●●●●●●●●●●●●●●●●●●●●●●●
●●●●●●●●●●●●●●●●●●●●●●●●●●●●●●●●●●●●●●●●●●●●●●●●●●●●●●●
●●●●
●●●●●●
●●●●●●●●●●●●●●●●●●●●●●●●●●●●●●●●●●●●●●●●●●●●●●●●●●●●●●●●●●●●●●●●●●●●●●●●●●●●●●●●●●●●●●●●●●●●●●●●●●●●●●●●●●●●●●●●●●●●●●●●●●●●●●●●●●●●●●●●●●●●●●●●●●●●●●●●●●●●●●●●●●●●●●●●●●●●●●●●●●●●●●●●●●●●●●●●●●●●●●●●●●●●●●●●●●●●●●●●●●●●●●●●●●●●●●●●●●●●●●●●●●●●●●●●●●●●●●●●●●●●●●●●●●●●●●●●●●●●●●●●●●●●●●●●●●●●●●●●●●●●●●●●●●●●●●●●●●●●●●●●●●●●●●●●●●●●●●●●●●●●●●●●●●●●●●●●●●●●●●●●●●●●●●●●●●●●●●●●●●●●●●●●●●●●●●●●●●●●●●●●●●●●●●●●●●●●●●●●●●●●●●●●●●●●●●●●●●●●●●●●●●●●●●●●●●●●●●●●●●●●●●●●●●●●●●●●●●●●●●●●●●●●●●●●●●●●●●●●●●●●●●●●●●●●●●●●●●●●●●●●●●●●●●●●●●●●●●●●●●●●●●●●●●●●●●●●●●●●●●●●●●●●●●●●●●●●●●●●●●●●●●●●●●●●●●●●●●●●●●●●●●●●●●●●●●●●●●●●●●●●●●●●●●●●●●●●●●●●●●●●●●●●●●●●●●●●●●●●●●●●●●●●●●●●●●●●●●●●●●●●●●●●●●●●●●●
0 1000 2000 3000 4000 5000 6000
0.01
0.02
0.05
0.10
0.20
0.50
1.00
Policy
Nor
mal
ized
siz
e
●
●
●
●
●
●
●
●
●
●●
●
●●
●
●●●
●
●
●
●
●
●
●
●●
●
●
●
●
●
●
●
●
●
●
●
●
●●●
●
●
●●
●●●●
●
●
●●
●●●
●
●
●●
●
●●●
●
●
●
●●
●
●●●●
●●●●●
●
●
●
●●
●
●
●●
●
●
●
●
●
●
●
●
●
●
●
●
●
●
●
●
●
●
●
●
●●●
●
●
●●
●
●●●
●
●●
●
●●
●
●●
●
●
●
●
●●
●
●
●
●
●
●
●
●
●
●
●●
●●●●●●
●
●●●
●
●●●●●●●●
●
●●●●
●
●
●
●●
●
●●●
●
●
●●●●●●
●
●●●●●●●●●●●●●●●●
●
●
●●●
●
●
●
●
●
●
●
●
●
●
●●●●●●●●●
●
●
●●●
●
●●●●
●
●●●●●●●●●●●●●●●●●●●●●●●●●
●
●●●●●●●●●●●●●●●●●●●●●●●●●●●●●●●●●●●●
●
●●●
●
●●●●●●●●●●●●●●●●●●●●●
●
●●●●●●
●
●●●
●
●●●●●●●●●●●
●
●●●●●●●●●
●
●●●●●●●●●●●●●●●
●
●●
●
●●●●●●
●
●●●●●●●●●●●●●●●●●●●
●
●●
●
●●●●●●●●●
●
●
●
●
●
●
●●
●
●
●
●
●
●
●
●
●
●●
●
●●
●
●
●●
●
●
●●
●
●
●
●
●
●
●●
●
●
●
●
●
●
●
●
●●
●
●●
●
●
●
●
●●
●
●
●●●
●
●
●
●
●
●
●
●
●
●
●
●
●
●
●
●
●
●●●
●
●●
●
●
●
●
●
●
●●
●
●●●
●
●
●●●●
●
●
●●
●
●
●
●●●
●
●
●
●●●●●●●●●●●●●●●●●●●●●●●●●●●●●●●●●●●●
●
●●●●●●●●●●●●●●●●●●●●●●●●●●●●●●●●●●●●●●●●●●●●●●●●●●●●●●●●●●●●●●●●●●●●●●●●
●
●●●●●●●●●●●●●●●●●●●●●●●●●●
●
●●●●●●●●●●●●●●●●●●●●●●●●●●●●●●●●●●●●●●●●
●
●●●
●
●●●●●●●●●●●●●●●
●
●●●
●
●●●●●●●●●●●●●●●●●●●●●●●●
●
●●●●●●●●●●●●●●●●●●●●●●●●●●●●●●●●●●●●●●●●●●●●●●●●●●●●●
●
●
●●●●●●●●●●●●●●●
●
●●●
●
●●●●●●●●●●●●●●●●●●●●●●●●●●●●●●●●●●●●●●●●●●●●
●
●
●
●
●
●
●●●
●
●
●●●
●●●
●
●●
●
●
●●
●
●
●●
●
●
●
●
●
●●
●
●
●●
●
●●●●
●
●●
●●
●
●
●
●
●●
●
●●●
●
●
●
●
●
●●●
●
●
●●
●
●
●●
●
●●
●
●
●●●●
●
●
●
●
●
●
●
●
●
●
●●●●●●
●
●
●
●
●●●
●
●
●
●
●
●
●
●
●
●
●●
●
●
●
●
●
●
●
●
●
●
●
●
●
●
●
●
●●
●
●
●
●
●
●
●●
●
●
●
●
●
●
●
●
●
●
●
●
●
●
●
●
●
●
●●
●
●●●
●
●●●●●
●
●
●
●
●
●●●●●●
●
●●
●
●●●●●●
●●●
●
●
●
●●●●●●●●
●
●●
●
●●
●
●
●
●
●
●●●●●●
●●●●
●
●
●●●●●
●●●
●
●●
●
●
●●
●●
●
●
●●●●●●
●
●●●
●
●●●
●
●●●
●
●●●●●
●●●
●
●
●
●
●
●
●
●●
●
●
●
●
●
●
●●
●
●●●
●
●
●
●
●
●
●
●
●●
●
●
●
●
●
●●●
●
●
●
●
●
●●
●●
●●
●
●
●
●
●
●
●
●
●
●
●
●
●●
●
●
●
●
●
●
●
●
●
●
●
●
●
●
●
●
●
●
●
●
●
●
●
●
●●
●
●
●
●
●
●
●
●
●
●
●
●
●
●
●
●
●●
●
●
●●
●
●
●
●
●
●
●
●
●
●
●
●
●
●
●
●
●
●
●
●
●
●
●
●
●
●
●
●
●
●
●
●
●
●
●
●●●
●
●
●
●●
●
●
●
●
●
●
●
●
●
●
●
●
●
●
●
●
●
●●●
●
●
●
●
●
●
●
●
●
●●
●
●
●
●
●●
●
●
●
●
●●
●
●
●
●
●
●
●●
●
●
●●●
●
●●●●
●●●
●
●
●●
●
●●
●
●
●
●
●
●
●
●●
●●●
●
●●
●●●●
●
●
●
●
●●●
●●
●●
●
●
●
●
●
●●
●
●●
●
●
●
●
●●
●
●
●
●
●
●
●
●
●
●
●
●
●●●●●●●
●
●
●
●●
●
●●
●
●●
●
●
●
●●
●
●
●
●●
●
●
●
●
●●
●
●●
●
●
●
●
●
●
●●
●
●
●
●
●●
●
●●●●
●
●
●
●
●●
●
●●
●
●
●
●●
●
●
●
●
●
●●●
●
●
●
●
●
●
●
●
●●●
●●
●
●
●
●
●●
●
●
●
●
●●
●●
●
●
●
●
●●
●
●
●
●
●
●
●
●
●●
●
●
●
●
●
●
●
●●
●
●
●
●
●
●
●●
●
●
●
●●
●
●
●
●
●
●
●
●
●
●
●
●
●
●●
●
●
●
●
●
●
●
●
●
●●
●
●
●
●
●
●
●●
●●
●
●
●
●●
●
●●
●●●●
●
●●
●
●
●
●
●
●
●
●●
●●
●
●
●
●
●
●●
●●●●
●
●
●
●●
●
●
●
●
●
●
●
●
●
●
●
●
●
●
●●●
●
●●
●
●
●
●
●●●
●
●
●
●●●
●
●
●
●
●
●
●
●
●
●
●●
●
●
●
●
●
●●●●
●
●
●
●●
●
●
●
●
●
●
●
●
●
●
●
●
●
●
●
●
●
●
●
●
●
●●
●
●●●
●
●
●
●
●
●●●
●
●
●
●●●●●●●
●
●●●
●
●●●●●●●●●●●●●
●
●●●●●
●●
●●●●●●●●●●●●●●●●●
●
●●●●●●●
●
●
●●●●●●●●●●●●●●●●
●
●●●
●
●
●●●●●
●
●●●
●
●●●●●●●●●●●●●●●●●●
●
●
●
●
●
●●●●●●●●●●●●●●
●
●●
●
●●●●●●
●
●●
●
●
●
●
●●●●
●
●●●●●●●
●
●●●●●
●
●
●
●●●●●
●
●
●●●●●●●●
●
●
●
●
●
●
●
●●●●
●
●
●
●
●●●●●●●
●
●
●●●
●
●
●
●●●●●●●●●●●●
●
●
●
●●●●
●
●
●
●
●●
●
●
●
●●●●●●●●●●
●
●
●●●●●●●●●●
●
●●
●
●●●●
●
●●●●●
●
●●●●●
●
●●●●●●●●●●●●●●
●
●●●●●●●●●●●
●
●●
●●●●
●
●●●●●●●●●●
●
●●●●
●
●●●●●
●
●●
●
●
●
●●
●
●●●●●●
●
●●
●●
●●
●
●●●
●
●●●●●●●●●●●●●
●
●●●●●●
●
●●●●●●●
●
●●●●
●
●●
●
●●●●●●●●●
●
●●●●●●●●●
●
●
●
●●●●●●●●●●●●●●
●
●
●
●
●●
●
●
●
●
●●
●
●●●●
●
●●●●●
●
●●
●
●●●●●●●●●
●
●●
●
●●●●●●●●●●●●●●●●●●
●
●●●●●
●
●●●●●●●●
●
●
●
●
●●●●●●
●
●●
●
●●●●●●●
●
●●●●
●
●●●●
●●
●●
●
●●●
●
●●●●●●●●
●●
●
●●●
●
●●●●
●
●●●●●
●
●●●●
●
●
●
●●●●●●●●●
●
●
●
●
●
●
●●
●●
●
●
●
●
●
●
●
●
●
●
●
●
●
●
●
●
●
●
●
●
●
●●
●
●●
●
●
●
●
●
●
●
●
●
●
●
●●
●●
●
●
●
●
●
●
●●●
●
●
●
●
●
●
●●●
●
●
●
●
●●
●
●
●
●
●
●
●
●●
●
●
●
●
●
●●
●
●
●
●
●
●
●
●
●
●●●●
●
●
●●
●●●
●
●
●
●●
●●●●●●●●
●
●●
●●
●●
●
●●
●
●
●
●
●
●
●
●
●
●
●
●
●
●●
●●
●
●
●
●●
●
●●●●
●
●●●●
●
●●●
●
●
●●
●●●
●
●
●
●
●●●
●
●●
●
●●
●
●●
●
●
●
●
●●
●
●
●
●
●
●
●
●●
●●
●
●●
●●
●●
●
●
●●
●
●●
●
●
●●●
●
●
●
●●
●
●
●●●
●
●
●●
●●
●
●●
●
●
●
●
●
●●●●●
●
●●●
●
●
●
●
●
●
●
●
●
●
●●
●
●●
●
●
●
●●
●
●
●
●
●
●
●
●
●
●
●
●
●
●●
●
●
●
●●
●
●
●
●●
●
●
●●
●
●
●
●
●
●
●●
●
●
●
●
●
●
●
●
●
●
●
●
●
●
●
●
●
●
●
●
●
●
●●
●
●
●
●●●●●
●
●
●
●
●
●
●
●
●
●
●
●
●●
●
●
●
●
●
●
●
●●●
●
●●
●
●
●
●
●●
●
●
●
●
●
●
●
●
●
●●●●
●
●●●●
●
●
●
●
●
●
●
●
●
●
●●●
●
●●
●
●
●
●
●●●●
●
●●
●●
●
●
●●●●
●
●●
●
●●
●
●
●
●●
●●●
●
●●●●
●
●
●
●●●
●
●
●●
●
●
●●
●●●●●●●●●●●●●●
●●
●
●
●
●
●
●
●
●
●
●●
●
●
●
●
●●●●
●
●●●
●
●
●
●
●
●●●●
●
●●●
●
●●●
●
●
●●
●
●
●
●
●
●
●
●
●
●
●
●●
●●
●●●
●
●
●
●
●●●●
●
●
●
●
●
●
●
●
●
●●●
●
●
●
●
●
●
●
●
●
●
●
●
●
●
●
●
●
●●
●
●
●●
●
●●●●
●●
●
●
●
●
●●
●
●
●
●●
●
●
●
●●●
●
●
●
●●
●
●
●
●
●●
●
●●
●
●
●
●
●
●●
●
●
●
●
●●
●
●
●
●
●
●●
●
●
●
●
●
●
●●●●●
●
●
●
●
●●
●
●
●
●
●
●
●●●
●
●
●●
●
●
●●
●●
●
●
●
●●
●
●
●
●
●
●
●
●
●
●●
●
●
●●●●●
●
●
●
●
●
●
●●
●
●
●●●
●
●
●●
●
●
●
●●●●
●
●
●
●
●
●
●
●
●●
●
●
●
●
●
●
●
●●●●●
●
●●
●
●●●
●
●●
●
●
●
●
●
●●●●
●
●●
●
●
●
●
●
●
●
●
●
●
●
●
●
●
●
●
●
●●
●●●●
●
●●
●
●
●
●●
●●
●
●
●
●●●
●
●
●
●
●●
●
●
●
●
●●●
●
●●
●
●
●●
●
●●
●
●
●●●●
●
●
●
●●●
●●
●
●●●
●
●●
●
●●●
●
●
●
●
●
●●●●●●●●●
●
●
●
●
●
●
●
●
●
●●
●
●●●●●
●
●●●
●
●
●●●
●
●
●
●●●
●
●
●●
●
●
●
●
●●
●
●
●
●●●●●
●
●
●
●
●
●●●
●
●●
●
●●
●
●●
●
●
●
●●●●
●
●
●
●
●●
●
●
●
●●
●
●
●
●
●
●
●
●
●●
●
●
●●●●
●
●
●●
●
●●
●
●●
●
●
●●●●●
●
●
●
●
●●
●
●
●
●
●●●
●
●
●
●
●
●
●
●●
●
●
●
●
●
●
●
●
●
●
●
●
●
●●
●
●
●
●
●●
●
●
●
●
●
●
●
●
●
●
●
●
●
●
●
●
●●
●
●
●
●
●
●
●
●
●
●
●
●
●
●
●
●
●
●
●
●
●
●
●●
●
●
●
●
●
●
●
●
●●
●
●●
●
●●
●●●
●
●
●
●
●
●
●
●●
●
●
●
●
●●
●
●
●
●
●
●
●
●
●
●
●
●
●
●
●●
●●
●
●
●●
●
●
●
●
●
●
●
●
●
●
●
●
●
●●
●
●
●
●●
●
●●
●
●
●●
●
●
●●●
●
●
●●●
●
●
●●●
●●
●
●●
●
●
●●
●●●●●
●
●
●
●●●
●
●●●
●
●
●
●●
●
●
●●●
●
●
●●
●
●
●
●
●
●
●
●
●
●
●●●
●●
●●
●
●
●
●
●
●●●
●
●●●●●●
●
●
●●
●
●
●
●
●●
●
●●●
●
●●
●
●
●
●
●
●●
●
●
●
●●●
●
●
●●
●●
●
●
●
●
●
●
●●●●
●
●●
●
●
●
●●
●
●
●
●
●●
●
●
●
●
●
●
●●●
●
●●
●●
●●
●
●●
●
●
●
●
●
●
●
●
●
●●●●●
●
●
●●●
●
●
●
●
●
●●●
●●
●
●●
●
●
●
●
●
●
●
●
●
●
●
●
●
●
●
●
●
●
●
●●●
●
●
●●
●
●
●
●
●●●●
●
●
●
●
●
●●●
●
●
●
●
●
●●
●
●
●●
●
●
●●
●
●
●●●●●●
●
●●●●
●●
●●●
●●
●
●
●●
●
●
●
●●●●●●
●
●
●●
●
●
●
●●
●
●
●
●
●
●
●●●●
●●●
●
●
●
●
●●
●●
●
●
●
●
●
●●
●
●●
●
●
●●●
●
●●
●
●●
●●●
●
●
●●●●●●
●
●
●
●
●
●
●
●●●
●
●●●●
●
●
●●●●●
●
●
●●●●
●
●
●
●
●
●●●●
●
●●
●
●●●●●
●
●
●
●
●
●
●
●●●
●
●●
●
●
●
●●
●
●●●●
●
●
●
●●
●
●●
●●
●
●●●
●
●
●
●●
●
●●●●●●●●
●
●
●●●●●
●
●
●
●●●●
●●
●
●
●
●●●●
●●
●
●
●
●●
●
●
●●●
●●●
●
●●
●
●
●
●
●
●
●
●
●
●●
●
●●
●
●
●
●●●
●
●●●
●
●
●
●
●
●●
●
●●
●
●
●
●
●●
●
●
●
●●●
●
●●
●
●
●
●
●
●●●●
●
●
●
●
●
●
●
●
●●
●
●●
●●
●
●
●
●
●●
●
●●●
●
●
●
●
●●●●
●
●
●
●
●●●●●●●●
●●
●
●
●
●
●
●
●
●
●●●
●
●
●●
●●
●●
●●
●●●
●
●
●●
●
●●
●●●●●
●●
●●●
●●●●
●●●●
●
Figure 3.17. Syntactical versus semantical size (red and green colors respectively)
Vocabulary size
Returning to the view that ‘policies are models’, we may be specifically interested inindicators for different components or services in a web-based systems. To this end,we think of the following correspondence: each purpose could correspond to onecomponent of the web-based system; each recipient could correspond to one serviceport of the web-based system; each category for data in the policy could correspondto a domain or a concern that the system has to cover. A poorly architected systemmay of course not directly reveal those components, services, concerns, and domains,but they are modeling entities anyway.
Fig. 3.18 shows the distribution of these numbers for the policies in the corpus.We can fairly combine the different numbers into one metric as follows. Given a pol-icy P with numbers of distinct purposes #p(P), distinct recipients #r(P) and distinctcategories #c(P), we compute the vocabulary size of P on a [0,1] scale as follows:
VOCA(P) = (#p(P)/12+#r(P)/6+#c(P)/17)/3
Here, 12, 6 and 17 are the numbers of all purposes, recipients and categories inthe vocabulary of P3P. Hence, we measure the degree of coverage of the relevant partof the vocabulary, and we give equal weight to purposes, recipients and categories.Policies with only the NON-IDENTIFIABLE element may have a value of 0.0 forVOCA(·). Otherwise, the minimum value is approximately 0.10—in the case of onepurpose, one recipient, and one category.

66 A Study of P3P Language
0 1000 2000 3000 4000 5000 6000
05
1015
Policy
Dis
tinct
ele
men
ts
PurposesRecipientsCategories
Figure 3.18. Distribution of vocabulary counts
For example, all three different representations of the sample policy ‘loggingonly’ (Fig. 2.6 on p. 23 and Fig. 3.4 on p. 46) have the same value for VOCA(·),namely, it is 0.139: all policies have three distinct purposes and one distinct recipient.
Min 1st Q Median Mean 3rd Q Max
0 0.137 0.19 0.232 0.347 1
Table 3.11. The VOCA(·) scale
Table 3.11 shows that the [0,1] scale of the VOCA(·) metric is fully exercisedby the corpus. When compared to the SYN(·) and SEM(·) metrics, the distributionof VOCA(·) is considerably less shifted to the lower end; compare the ratios ofmaximum to 3rd quartile for the metrics. Hence, even syntactically or semanticallysmaller policies exercise the vocabulary substantially.
Data size
Finally, we introduce the metric data size, denoted as DATA(·). With the data sizewe expect to measure a policy’s footprint in terms of its use of the data schema. In

3.4 Analyses of the Study 67
dynamicclickstream
uriauthoritystemquerystring
timestampymd.yearymd.monthymd.dayhms.hourhms.minutehms.secondfractionsecondtimezone
clientiphostnamepartialhostnamefullippartialip
other.httpmethodother.bytesother.statuscode
dynamichttp
refererauthoritystemquerystring
useragent
Figure 3.19. #dynamic.clickstream and #dynamic.http
this way, we measure degree of exposure quantitatively—while just focusing on dataitems, abstracting from purposes, recipients, and retention level.
Given a policy P, we compute the data size of P as follows. We begin by resolvingany given data reference that is listed in a policy to a subtree in the hierarchical def-inition of the relevant data schema (BDS or CDS). We count all nodes, i.e., leaf andgroup nodes as well as the root node, for the referenced subtree. We equate DATA(P)with the cumulative count of all distinct nodes that we count for the various datareferences in a policy. We should note that variable-category data elements escapea fair counting scheme because their hierarchical breakdown is not specified—bydefinition. Additionally, it is not guaranteed that multiple uses of the same variable-category data reference throughout a policy designate the same type of data. To thebest of our knowledge, there is no automatic way of treating variable-category dataelements more fairly. The applied counting scheme is useful in so far that it providesa lower bound for used data items.
Let us revisit the ‘logging only’ policy. All three different representations use thesame two data references, which do not overlap within P3P base data schema. Thereferenced subtrees of the BDS are shown in Fig. 3.19. The data size is the directsum of nodes in these two subtrees: 28.

68 A Study of P3P Language
Min 1st Q Median Mean 3rd Q Max
0 2 30 36.57 33 286
Table 3.12. The DATA(·) scale
Table 3.12 shows the DATA(·) scale. As a point of reference, we mention thatP3P’s BDS contains a total of 324 nodes. (Additional data items could be referencedin principle because of the CDS in a policy.) Hence, the DATA(·) scale in Table 3.12suggests that there are policies with a data-model size close to the size of the com-plete BDS. The distribution of DATA(·) is shifted though to small node counts, as thequartiles show. (The coverage of P3P’s BDS by the corpus is analyzed in §3.4.1.)
Significant policies
Table 3.13 lists the top-10 policies for all the four metrics in the order of syntactical,semantical, vocabulary, and data sizes. For vocabulary size, we also show the num-bers of purposes, recipients, categories with the (X ;Y ;Z) notation. We only showsemantically valid (and then only semantically distinct) policies because it is other-wise difficult to compare them across metrics (with semantical size being included).Policies are highlighted in bold face, if they are among the top 10 in at least two ofthe four lists. In this manner, we prioritize policies that are ‘large’ in several respects.It turns out that large data size never meets large semantics or large vocabulary (whenfocusing on top 10). Also, we recall that we proposed to de-prioritize syntactical size.The following bold policies remain hence:14
• 50cent.com• kerntrophies.com
By our simple rules, we consider these two policies as most significant and we willreview them below. Let us also add astrodata.ch, which leads the table for VOCA(·);it exposes the maximum vocabulary size. Given that we consider vocabulary size as aproxy for an interesting model, we view maximum size of this kind to be an indicatorof significance, by itself.
Review of http://www.astrodata.ch
The entity of this website is Swiss ASTRODATA AG. The website provides differentkinds of personal horoscopes and diagrams: partnership, health, cosmograms, etc.The site also sells books, CDs, and software. The site has a log-in system. The policy
14 During the lifetime of the effort, some of the policies disappeared from the Internet(see Appendix A.1.1). This is also the case for the bold policies at hand. All policiesare preserved in our online corpus at the http://slps.svn.sourceforge.net/viewvc/slps/topics/privacy/p3p/

3.4 Analyses of the Study 69
Site SYN(·) SEM(·) VOCA(·) DATA(·)
1 taxcollector.com 95 78 0.287 (5; 1; 5) 422 allpar.com 85 109 0.607 (11; 2; 10) 713 strictlyrockymountain.com 78 91 0.553 (9; 3; 7) 674 raleys.com 76 242 0.667 (11; 2; 13) 925 thevacuumcenter.com 76 275 0.613 (9; 2; 13) 1316 4tourist.net 73 80 0.413 (6; 1; 10) 417 ncl.com 72 30 0.610 (11; 1; 13) 28 sigmaaldrich.com 72 29 0.420 (7; 2; 6) 309 atlasdirect.net 69 87 0.363 (7; 1; 6) 111
10 fool.co.uk 69 198 0.610 (11; 1; 13) 137
Site SYN(·) SEM(·) VOCA(·) DATA(·)
1 keepaustinweird5k.com 61 352 0.533 (9; 2; 9) 702 nrc.gov 63 308 0.420 (5; 2; 9) 723 thevacuumcenter.com 76 275 0.613 (9; 2; 13) 1314 medcompnet.com 59 274 0.397 (9; 2; 2) 605 taylorresearch.com 65 274 0.363 (5; 1; 9) 1316 countryfinancial.com 50 265 0.390 (8; 1; 6) 577 atletix.net 52 260 0.250 (3; 2; 3) 1118 50cent.com 57 253 0.843 (10; 6; 12) 1589 raleys.com 76 242 0.667 (11; 2; 13) 92
10 kerntrophies.com 59 240 0.767 (10; 5; 11) 197
Site SYN(·) SEM(·) VOCA(·) DATA(·)
1 astrodata.ch 57 42 1.000 (12; 6; 17) 22 barmans.co.uk 50 20 0.930 (11; 6; 15) 13 kidzworld.com 65 19 0.923 (10; 6; 16) 14 foreclosurenet.net 53 182 0.880 (12; 6; 11) 1335 test.quizz.biz 36 18 0.867 (10; 5; 16) 16 spraci.com 45 19 0.863 (10; 6; 13) 17 50cent.com 57 253 0.843 (10; 6; 12) 1588 kerntrophies.com 59 240 0.767 (10; 5; 11) 1979 argos.co.uk 57 162 0.743 (11; 3; 14) 95
10 ia.rediff.com 38 18 0.717 (11; 4; 10) 1
Site SYN(·) SEM(·) VOCA(·) DATA(·)
1 ASPXSoftware.com 27 92 0.200 (2; 2; 2) 2862 eharmony.com 36 121 0.600 (10; 3; 8) 2703 cashnetusa.com 45 52 0.343 (5; 2; 5) 2684 auto-europe.co.uk 33 97 0.237 (4; 2; 1) 2505 kawasaki.com 46 169 0.497 (8; 4; 3) 2506 bevmo.com 55 170 0.497 (9; 1; 10) 2447 petitesophisticate.com 40 170 0.380 (9; 1; 4) 2448 crutchfield.com 58 197 0.703 (9; 4; 12) 2359 internest.com 39 155 0.400 (7; 2; 5) 236
10 lampsplus.com 47 156 0.447 (8; 1; 9) 236
Table 3.13. Top 10 semantically distinct policies ordered by four different metrics; see thebold column.
is shown in Fig. 3.20.15 The policy enumerates most purposes; further it uses twovariable-category data elements (see §3.3.2) and associates them with all possible
15 http://www.astrodata.ch/w3c/policy-general.xml

70 A Study of P3P Language
<POLICY name = "anything-policy"discuri = "http://www.example.com/privacy/policy.html">...<ENTITY><DATA-GROUP><DATA ref="#business.name">Example Corp.</DATA><DATA ref="#business.contact-info.online.email">[email protected]</DATA>...
</DATA-GROUP></ENTITY>...<STATEMENT><PURPOSE><current/><admin/><develop/><tailoring/><pseudo-analysis/><pseudo-decision/><individual-analysis/><individual-decision/><contact/><historical/><telemarketing/><other-purpose>Any other purpose we want</other-purpose>
</PURPOSE><RECIPIENT><ours/><delivery/><same/><other-recipient/><unrelated/><public/>
</RECIPIENT><RETENTION><indefinitely/></RETENTION><DATA-GROUP><DATA ref="#dynamic.miscdata"><CATEGORIES><physical/><online/><uniqueid/><purchase/><financial/><computer/><navigation/><interactive/><demographic/><content/><state/><political/><health/><preference/><location/><government/><other-category>Any other type of data</other-category>
</CATEGORIES></DATA><DATA ref="#dynamic.cookies"><CATEGORIES><physical/><online/><uniqueid/><purchase/><financial/><computer/><navigation/><interactive/><demographic/><content/><state/><political/><health/><preference/><location/><government/><other-category>Any other type of data</other-category>
</CATEGORIES></DATA>
</DATA-GROUP></STATEMENT>
</POLICY>
Figure 3.20. The privacy policy of astrodata.com
categories. Hence, the policy declares substantial exposure (in terms of privacy).In some sense, the policy declares universal exposure, but this claim cannot easilybe formalized due to the difficult nature of variable-category data elements. Pleaseobserve the name of the policy: “anything policy”.16
Two deficiencies of the policy are worth reporting though. The entity descriptionuses ‘sample data’ rather than genuine data about ASTRODATA AG; see Fig. 3.20.Further, the policy fails in making good use of the BDS in places where it obviouslycould. (That is, a horoscope service is likely to require a birthday date, which is
16 It was suggested by a reviewer during the review phase of this effort to use a new domainterm to cover this sort of policy: ‘NoRightsReserved’ in legal language.

3.4 Analyses of the Study 71
<POLICY name="WebsitePolicy"discuri="http://privacypolicy.umusic.com" opturi="...">...<ENTITY><DATA-GROUP><DATA ref="#business.name">Universal Music Group</DATA>...
</DATA-GROUP></ENTITY>...<STATEMENT><PURPOSE><current/><admin/><develop/><tailoring/><pseudo-analysis/><pseudo-decision/><individual-analysis required="opt-in"/><individual-decision required="opt-in"/><contact required="opt-in"/><historical/>
</PURPOSE><RECIPIENT><ours/><delivery/><same required="opt-in"/><other-recipient required="opt-in"/><unrelated required="opt-in"/><public required="opt-in"/>
</RECIPIENT><RETENTION><indefinitely/></RETENTION><DATA-GROUP><DATA ref="#user.name"/><DATA ref="#user.bdate"/><DATA ref="#user.gender" optional="yes"/><DATA ref="#user.home-info"/><DATA ref="#thirdparty.name" optional="yes"/><DATA ref="#thirdparty.bdate" optional="yes"/><DATA ref="#thirdparty.gender" optional="yes"/><DATA ref="#thirdparty.home-info" optional="yes"/><DATA ref="#dynamic.clickstream"/><DATA ref="#dynamic.http"/><DATA ref="#dynamic.clientevents"/><DATA ref="#dynamic.searchtext"/><DATA ref="#dynamic.interactionrecord"/><DATA ref="#dynamic.cookies"><CATEGORIES><physical/><online/><uniqueid/><purchase/><financial/><computer/><navigation/><interactive/><demographic/><content/><state/><preference/>
</CATEGORIES></DATA-GROUP>
</STATEMENT></POLICY>
Figure 3.21. The privacy policy from the site 50cent.com

72 A Study of P3P Language
<POLICY name="WebsitePolicy"discuri="http://www.pdu-wc.com/policy.html" opturi="...">...<ENTITY><DATA-GROUP><DATA ref="#business.name">Steve Schreiner</DATA><DATA ref="#business.contact-info.online.email">[email protected]</DATA>...
</DATA-GROUP></ENTITY>...<STATEMENT><PURPOSE><current/><admin/><develop/><pseudo-analysis/><pseudo-decision/><individual-analysis/><individual-decision/><contact required="opt-out"/><historical/><telemarketing required="opt-out"/>
</PURPOSE><RECIPIENT><ours><recipient-description>Information is only shared with our partnerswho share our privacy policy.
</recipient-description></ours><delivery/><same/><other-recipient/><unrelated/>
</RECIPIENT><RETENTION><indefinitely/></RETENTION><DATA-GROUP><DATA ref="#user.name"/><DATA ref="#user.bdate" optional="yes"/><DATA ref="#user.gender" optional="yes"/><DATA ref="#user.home-info"/><DATA ref="#user.business-info" optional="yes"/><DATA ref="#thirdparty.name"/><DATA ref="#thirdparty.home-info"/><DATA ref="#dynamic.clickstream"/><DATA ref="#dynamic.http"/><DATA ref="#dynamic.clientevents"/><DATA ref="#dynamic.searchtext"/><DATA ref="#dynamic.interactionrecord"/><DATA ref="#dynamic.cookies"><CATEGORIES><physical/><online/><uniqueid/><purchase/><computer/><navigation/><interactive/><content/><state/><preference/><location/>
</CATEGORIES></DATA><DATA ref="#dynamic.miscdata"><CATEGORIES><physical/><online/><uniqueid/><purchase/><computer/><navigation/><interactive/><content/><state/><preference/><location/>
</CATEGORIES></DATA>
</DATA-GROUP></STATEMENT>
</POLICY>
Figure 3.22. The privacy policy from the site kerntrophies.com

3.4 Analyses of the Study 73
available through BDS; variable-category data elements should not be used in sucha case.)
Review of http://www.50cent.com
The website is dedicated to the American rapper and actor Curtis James Jackson III.The site provides information related to the artist: news, videos, music, photos, andevents. The site has a log-in system and a message board (forum). The log-in sys-tem allows users to sign-in using an account from other social networks (Facebook,Myspace, Twitter, Windows LiveID, etc). The policy is shown in Fig. 3.21.
The entity description does not directly refer to Jackson or 50cent.com, but itidentifies the Universal Music Group17 as the primary entity.
Most purposes are listed, but the less private ones (such as ‘contact’) admit opt-inon the side of the user. Also, several recipients are listed, but again, the less privateones (such as ‘public’) admit opt-in. Detailed data references from three of the fourBDS branches are provided. The use of cookies is specified in detail with regardto the categories that apply. Hence, the policy is really significant in terms of thenumber of included purposes and recipients, subject to opt-in, in several cases, andin terms of the number of data references.
Review of http://kerntrophies.com/
The website is an online shop for trophies, plaques, medals, and awards. The siteallows customizing of the item’s design (including engraving). The site has a log-in system. The policy is shown in Fig. 3.22. The policy is close to the one shownin Fig. 3.21: they declare the same recipients, they cover about the same purposes;see ‘tailoring’ vs. ‘telemarketing’. The site 50cent.com provides more privacy be-cause it declares ‘opt in’ for several purposes and recipients, whereas the site kern-trophies.com uses ‘opt out’ for a few purposes. The sites are likewise close in termsof amounts of collected data, but kerntrophies.com uses the variable-category dataelements #dynamic.misc.
It is striking to observe that nearly the same list of purposes is given in the sameorder in Fig. 3.21 and Fig. 3.22. Common sense may suggest that this cannot be anaccident, and one policy has been derived from the other. More likely, both policieshave been created with a P3P editor. That is, the shown order of purposes agrees withthe order in the P3P specification. Also, only three purposes were omitted—one ofthem being the special purpose ‘other-purpose’. All the omitted purposes happen tobe the least popular ones in the corpus; see §3.4.1.
3.4.4 Analysis of Cloning
The underlying research question is “What are common policies?”; see §3.2.1. Clonedetection is effective in identifying common policies. We will then determine the
17 http://www.universalmusic.com/

74 A Study of P3P Language
characteristics of the most common policies and the relationships between them. Anappreciated side effect is that we discover some authoring and publishing habits ofwebsite entities.
If we compare clone detection for P3P with regular programming languages,then we can emphasize that trying to find ‘common’ Java or C++ programs wouldbe of limited use. Trying to find common P3P policies makes sense for the followingreasons. First, one can expect that policy authors may sometimes reuse entire policiesfrom other websites. Second, P3P tools provide templates which may also stipulatethe use of common policies. Third, the simplicity of the P3P language and ‘typical’policies is such that we may assume to encounter common policies just by accident.
Types of clones
Since we are interested in common policies, our focus is on clone detection acrossdifferent files [103] (i.e., across different policy files). Our research question is notconcerned with cloned policy text within the same policy, but this may be an orthog-onal topic for future work.
Let us consider the classification for types of clones [116]: “Type 1 is an ex-act copy without modifications (except for whitespace and comments). Type 2 is asyntactically identical copy; only variable, type, or function identifiers have beenchanged. Type 3 is a copy with further modifications; statements have been changed,added, or removed.” In some cases, type 4 is considered as well [159]: “Two or morecode fragments that perform the same computation but are implemented by differ-ent syntactic variants.” These types are of limited use when classifying inter-file P3Pclones as we discuss now.
In our study, we are interested in textual, syntactical, and semantical clones. Weuse the term textual clones (abbreviated as ‘txt’) for policy files that are identicalwhen comparing the text-encoded XML content of the files. Arguably, textual clonesare type-1 clones. In order to find textual clones, we compare XML files for theirprecise textual content. If we find textual clones, then we have not just found com-mon policies, but we also face an interesting form of copy and paste behavior. Herewe note again that policies are supposed to identify the entity of the website. Hence,type-1 clones are policies from different websites with the same alleged entity. Ouranalysis will investigate this scenario in more detail by also taking into account do-mains of websites and entity URIs.
We use the term syntactical clones (abbreviated as ‘syn’) for policies that areidentical in terms of the abstract syntax of §3.3.2. Hence, all formatting differencesare neutralized, the entity name is eliminated, other text parts are eliminated, order ofelements in collections become invariant. Arguably, syntactical clones are type-2 ortype-3 clones depending on the mapping of programming language-centric terms inthe above-mentioned definitions to P3P terms. The clone detection at hand is AST-based [26]. If we find syntactical clones, then we have indeed found common policiesthat are obviously used across different websites. Syntactical clones could be theresult of i) using a template of a P3P authoring tool; ii) copy-paste-and-customize;iii) accident—especially in the case of simple policies.

3.4 Analyses of the Study 75
Type #C
lone
grou
ps
#A
dded
clon
egr
oups
#A
dded
clon
edpo
licie
s
#E
nlar
ged
clon
egr
oups
#M
erge
dcl
one
grou
ps
%C
lone
s
txt 296 296 1,941 – – 31.40syn 496 280 1,857 46 114 30.04sem 351 20 69 0 32 1.12
Total – – 3,867 – – 62.55
Table 3.14. Numbers of clones and clone groups
We use the term semantical clones (abbreviated as ‘sem’) for policies that areidentical in terms of the normal form of §3.3.3. The obvious value of the normal formis that we abstract from the representational diversity for policies. If we find semanti-cal clones, then there is evidence that authors exercise the representational diversity.Arguably, semantical clones are type-4 clones—if we accept the relational seman-tics of our normal form as a proper semantics. Here, we note that type-4 clones arevery hard to detect for common programming languages. The relational semanticsof P3P is straightforward though. Our normalization approach can be compared withthe cloning classification of [18] where refactorings are used to detect and possiblyremove clones.
A note on implementation
Overall, it is simple to accommodate clone detection for the chosen clone types be-cause the P3P syntax is trivial, no parameterized clones are considered, policies aretrivially small (compared to programs in mainstream languages), all reported andconceivable P3P corpora are small (compared to, for example, the numbers of pro-grams in mainstream languages that are obtainable from open-source repositories).Hence, implementation of clone detection for textual, syntactical, and semanticalclones is relatively straightforward, and no scalability challenge has to be tackled. Itis hard to detect semantical clones for programming languages, but it is straightfor-ward for P3P’s finite domain-based semantics.
Results of the analysis
Consider Table 3.14 with numbers of clones and clone groups. Column # Clonegroups shows the number of detected clone groups of each type. Column # Addedcloned policies shows the number of newly detected cloned policies for each type,when compared to cloned policies for the prior type. For clarity, we count the repre-sentative of a clone group as being a cloned policy. Hence, % Clones describes thepercentages of all policies of the corpus that are not distinct in the cloning sense.Column # Added clone groups shows the number of new clone groups for each type,

76 A Study of P3P Language
where we do not count groups that are only enlarged or merged. Column # Enlargedclone groups shows the number of clone groups that were obtained solely by addingnewly detected cloned policies of the given type to a clone group of the prior type.Column # Merged clone groups shows the number of clone groups from the priortype that were merged in clone groups of the given type.
It should be noted that the number of clone groups drops from syntactical tosemantical type: this is because some of the syntactically cloned policies are seman-tically invalid. Namely, 143 syntactical clone groups contain semantically invalidpolicies (that is, 28.83 % of all syntactical clone groups). The rest of the differenceis because of groups being merged under the clone type.
We also compared all policies with the 6 templates of IBM’s policy editor be-cause we realized at some point that many policies were obviously edited with thisprominent P3P tool. We found that all but 1 of the templates have an associatedclone group. We encounter and discuss some of these clone groups when we inspectselected clone groups below.
Textual and syntactical clone detection clearly identify a substantial amount ofclones. The contribution of semantic clone detection is small. In Appendix A.1.2,we consider the remaining diversity among the semantically distinct policies on thegrounds of the partial order for degree of exposure as of §3.3.4.
1 2 5 10 20 50 100 200 500
12
510
2050
100
200
500
Clone group
Car
dina
lity
Textual cloningSyntactical cloning
Figure 3.23. Distribution of clone group cardinalities
The distribution of textual and syntactical clone groups in terms of cardinality isshown in Fig. 3.23 and Table 3.15. There are a few huge clone groups; most clone

3.4 Analyses of the Study 77
Type Min 1st Q Median Mean 3rd Q Max
txt 2 2 2 7.609 4 175syn 2 2 2 8.819 4 690
Table 3.15. Cardinalities of textual and syntactical clone groups
groups are of trivial size. More precisely, there are 36 textual clone groups withcardinality > 10. These groups make up 12.16 % of all textual clone groups. Thereare 59 syntactical clone groups with cardinality > 10. These groups make up 11.90 %of all syntactical clone groups. Semantical clone detection is left out here because itadds very little.
Type Min 1st Q Median Mean 3rd Q Max
txt 2 9 16 22.19 37 147syn 2 9 19 23.23 36 245sem 2 9 17 18.78 28 99
Table 3.16. Distribution of SYN(·) over clones
Type Min 1st Q Median Mean 3rd Q Max
txt 0 0 13 28.35 29 253syn 0 0 16 25.78 29 275sem 0 6 20 29.76 34.25 275
Table 3.17. Distribution of SEM(·) over clones
Tables 3.16 and 3.17 summarize the distribution of syntactical and semanticalsizes over clones for all types. (We consider only distinct sizes for clones at a giventype.) Consider Table 3.16. The maximum for SYN(·) first increases from txt to syn,which means that syntactical clone detection finds clones with syntactical size nearthe maximum in the corpus. The maximum for SYN(·) subsequently drops from synto sem, which is implied by the substantial amount of semantically invalid policies,which escape semantical clone detection. In fact, we lose the (syntactically) greaterpolicies in this manner. Median and third quartile co-drop. Now consider Table 3.17.The maximum for SEM(·) first increases slightly from txt to syn, but then it remainsat the same value for type sem, which means that semantical clone detection doesnot make any contribution in terms of finding clones of greater size than those foundby textual or syntactical clone detection.

78 A Study of P3P Language
Discussion of textual cloning
We would like to understand the nature of textual cloning. Therefore we examinethe top-10 clone groups (in terms of cardinality); see Table 3.18. We list the issuingentity, cardinality, values for the metrics of §3.4.3 as well as the ‘average URI dis-tance’, which we explain in a second. A semantical size of 0 indicates representativesof the ‘full privacy’ from the introduction. (This policy has syntactical size 2 becauseit consists of a statement node and a non-identifiable node underneath.) It turns outthat there is one semantically invalid clone group among the top 10: No. 5 uses areference from BDS v.1.0. It also happens to have the largest syntactical size alongwith the group No. 1.
Entity Card. Avg. dist. SYN(·) SEM(·) VOCA(·) DATA(·)
1 John Hensley 175 1.000 42 156 0.650 (9; 3; 12) 1882 CybrHost 139 1.000 2 0 0.000 (0; 0; 0) 03 PhotoBiz 137 1.000 2 0 0.000 (0; 0; 0) 04 Boatventures 96 1.000 15 16 0.163 (2; 1; 3) 35 Real Estate 69 1.000 42 – 0.363 (7; 1; 6) –6 Hilton Hotels 68 0.779 9 6 0.123 (2; 1; 1) 17 NASA 54 0.000 13 29 0.180 (4; 1; 1) 308 Rezidor SAS 51 0.000 12 16 0.163 (2; 1; 3) 299 Bravenet 46 0.000 17 16 0.123 (2; 1; 1) 29
10 Wetpaint 38 0.237 19 24 0.180 (4; 1; 1) 30
Average – 0.602 17.30 26.30 – –
Table 3.18. Top 10 textual clone groups
Intra- versus inter-domain cloning
We would like to understand systematically whether cloning happens within a givendomain (say, an organization) or across domains. These different scenarios corre-spond to different kinds of potential copy-and-paste-like authoring behaviors. We in-troduce the measure of URI distance for a policy; this is the ‘distance’ between siteURI and the entity URI (the so-called discuri). We set this distance to 0 if both URIsappear to be about the same entity—subject to advanced matching of domain names(such as in the case of www.microsoft.com and server1.microsoft.de),and to 1 otherwise. Given a clone group, we can also determine its average URI dis-tance; this is simply the average of the URL distances for the members of the clonegroup; this measure is on a [0,1] scale. Please note that the entity URI would be thesame for all members of a textual clone group; only the site URIs could differ.
Let us illustrate the subtle point of URI distance with a particularly clear examplenot included in the top 10 list. The site p3pedit.com presents a software product,

3.4 Analyses of the Study 79
P3PEdit, of the company codeinfusion.com. Incidentally, P3PEdit is a P3Ptool. The site of the product has a P3P policy embedded into the reference file http://p3pedit.com/w3c/p3p.xml, but the "discuri" attribute points to the siteof the company. This is not against the P3P specification, but demonstrates cross-domain copy and paste.
We have inspected the top 10 clone groups and member websites, and charac-terize them as follows. No. 1 textual clone group is similar to the policies shownin Fig. 3.22 and Fig. 3.21: non-trivial composition of purposes, recipients, and data.According to the website mentioned in the policy, the site offers real estate soft-ware, technology services, and websites for agents, brokers, and realtor associations,which probably explains such high cardinality of the group. It also happens to havethe largest SYN(·) along with the group No. 5.
No. 2 is the ‘full privacy’ policy of a web-site hosting service. An average URIdistance of 1 indicates that all clones appear on domains apparently unrelated to thehosting service. We hypothesize that many hosted web sites reuse (perhaps implic-itly) a default policy without customizing it for their own domains. Several of theother top 10 are about web hosting, too—with similar URI distances. In contrast,No. 7, i.e., the NASA policy, is never cloned outside NASA’s web space.
To summarize, it is common practice to copy and paste policies from elsewhere,as is, without even customizing website-specific information. Copy and paste withinthe same domain or across different domains owned by the same entity makes sense,of course. Only 3 from the top 10 clone groups are clear-cut cases of websites ondomains that can be associated with a single entity.
Discussion of syntactical cloning
We determine the top 10 syntactical clone groups as those with the greatest cardinal-ity after removing all textual clones; see Table 3.19. Thereby we compensate for theeffect that several syntactical clone groups are extensions of textual clone groups. Itturns out that there are two semantically invalid clone groups among the top 10: No. 6has conflicting optionality attributes for one data reference, No. 9 uses a referencefrom BDS v.1.0.
No. 1 describes data collection of these forms: access logs, search strings, cook-ies, and user-related information (name and business email address). This appears tobe an important e-commerce scenario that does not involve online purchasing. It alsohas the biggest SEM(·) amongst these top 10 groups. Hence, our cloning study mayhave detected a domain concept that does not have an explicit domain term. How-ever, it is possible that the policy derives from a template that we are not aware of. Itis also possible that heavy cross-website reuse has happened.
No. 2 shows us that there are even more instances of the ‘full privacy’ policy inthe corpus. If we combine textual and syntactical cloning, then there are 690 occur-rences of this policy in the corpus. This is 11.16 % of all policies. Incidentally, thepolicy is not in the suite of online samples of the primary textbook on P3P [42].18
18 http://p3pbook.com/examples.html

80 A Study of P3P Language
Sample entity Card. Avg. dist. SYN(·) SEM(·) VOCA(·) DATA(·)
1 Accountancy 331 0.000 36 44 0.367 (8; 2; 2) 332 CybrHost 284 0.109 2 0 0.000 (0; 0; 0) 03 IBM tracking 218 0.124 19 24 0.180 (4; 1; 1) 304 Johnston Press 116 0.586 20 24 0.220 (4; 1; 3) 305 IBM logging 102 0.098 9 12 0.137 (3; 1; 0) 286 IBM purchase 67 0.104 51 – 0.363 (5; 2; 6) –7 Beach Suites 64 0.125 31 29 0.353 (6; 2; 4) 308 1066 Pools Ltd 30 0.000 24 10 0.377 (6; 1; 8) 19 Art of War 24 0.083 12 17 0.117 (1; 1; 2) 30
10 WebSolutions 20 0.000 31 – 0.283 (7; 1; 2) –
Average – 0.123 23.50 16.00 – –
Table 3.19. Top 10 syntactical clone groups
IBM’s P3P Policy Editor19 provides 6 templates for P3P authors. The idea is thatthese policies may cover some typical cases, and they could be customized if needed.We use these templates as markers in our clone detection process. We found that allbut 1 of the templates have an associated clone group. Some of them occur in thediscussed table, and hence we discuss them here.
No. 3 is described by IBM’s tool as following: “This template is designed forsites which track users on a non-identifiable basis through use of cookies. It alsoassumes standard server access logs will be collected.” No. 3 is similar to No. 1.More precisely, we have that No. 3 ≤sem No. 1 (see §3.3.4) because No. 1 collectsadditional user data and cookies are admitted in a more general way.
No. 4 is a minor variation on No. 3; both policies differ in terms of categories forcookies. Neither policy is ‘less or equal’ (in terms of ‘≤sem’) than the other policy.
No. 5 is described by IBM’s tool as follows: “A template privacy policy for siteswhich only collect standard server access logs for site operation purposes.” No. 5is similar to No. 3. More precisely, we have that No. 5 ≤sem No. 3 because No. 5describes only data collection for access logs and declares even less data to be col-lected. In §2.3.1, we coined the name ‘logging only’ for this policy.
No. 6 is described by IBM’s tool as following: “This template captures thedata typical sites collect as part of an on-line shopping experience.” This grouphas the biggest SYN(·) among top 10. We count this policy as semantically in-valid because of conflicting optionality attributes for different occurrences of #dy-namic.miscdata; see §3.4.2. No. 6 adds facts about purchase-related data based on#dynamic.miscdata on top of No. 5. (We cannot apply ‘≤sem’ though, since No. 6has no normal form.)
To summarize, there is an extra of 30.04 % of the corpus that is cloned in syntac-tical but not textual sense. We assume that this percentages corresponds to commonneeds of websites combined with the relative simplicity of P3P and the relatively
19 http://www.alphaworks.ibm.com/tech/p3peditor

3.4 Analyses of the Study 81
small size of policies as well as the availability of reusable templates. This kind ofcloning gives hope that a relatively small number of standardized policies could bepotentially sufficient. In the top 10 of Table 3.19, 3 templates of IBM’s Policy Editorappear.
3.4.5 Analysis of Extensions
The underlying research question is “What language extensions circulate?”; see§3.2.1. The main goal is to analyze the use of P3P’s extension mechanism and toinfer candidate language extensions to be considered by future languages for privacypolicies.
<RETENTION><legal-requirement/><EXTENSION optional="no"><use-duration><one-year/>
</use-duration><retention-basis><internal-company-regulation> [Text] </internal-company-regulation>
</retention-basis></EXTENSION>
</RETENTION>
Figure 3.24. Example of EXTENSION usage
The essence of extensions
P3P’s extension mechanism allows P3P tool providers and policy authors to add anduse extra constructs. For instance, one might want to add a more detailed specifica-tion of retention, say in terms of a specific duration for storage of data; see Fig. 3.24for such an example.
Technically, P3P admits extension elements immediately below P3P elements forstatements, purposes, recipient, retention levels (as in the example), and data refer-ences (in fact, data groups). Extensions are effectively named—through designatedXML tags; see legal-requirement in the example. Also, the further structureof each extension element is an XML tree. All XML elements can be qualified bypolicy-specific XML namespaces.
Procedurally, the use of the extension mechanisms is challenging since policytools and website users may need (want) to understand the extensions, and there isno obvious technical solution to that problem. P3P admits this challenge with itsclassification for optional versus mandatory extensions: “A mandatory extension tothe P3P syntax means that applications that do not understand this extension cannotunderstand the meaning of the whole policy (or policy reference file, or data schema)
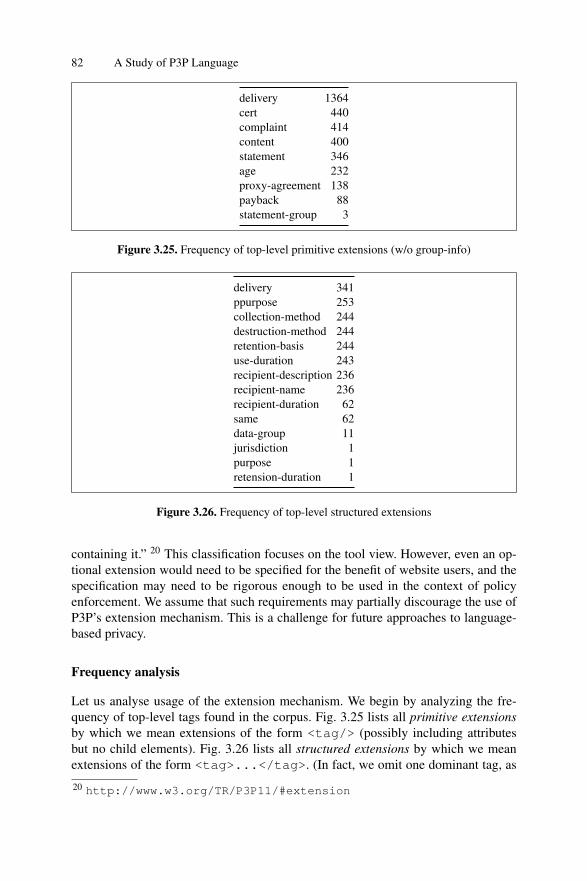
82 A Study of P3P Language
delivery 1364cert 440complaint 414content 400statement 346age 232proxy-agreement 138payback 88statement-group 3
Figure 3.25. Frequency of top-level primitive extensions (w/o group-info)
delivery 341ppurpose 253collection-method 244destruction-method 244retention-basis 244use-duration 243recipient-description 236recipient-name 236recipient-duration 62same 62data-group 11jurisdiction 1purpose 1retension-duration 1
Figure 3.26. Frequency of top-level structured extensions
containing it.” 20 This classification focuses on the tool view. However, even an op-tional extension would need to be specified for the benefit of website users, and thespecification may need to be rigorous enough to be used in the context of policyenforcement. We assume that such requirements may partially discourage the use ofP3P’s extension mechanism. This is a challenge for future approaches to language-based privacy.
Frequency analysis
Let us analyse usage of the extension mechanism. We begin by analyzing the fre-quency of top-level tags found in the corpus. Fig. 3.25 lists all primitive extensionsby which we mean extensions of the form <tag/> (possibly including attributesbut no child elements). Fig. 3.26 lists all structured extensions by which we meanextensions of the form <tag>...</tag>. (In fact, we omit one dominant tag, as
20 http://www.w3.org/TR/P3P11/#extension

3.4 Analyses of the Study 83
we discuss below.) Table 3.20 summarizes some global numbers on the usage of theextension mechanism.
Discussion
The P3P standard illustrates a few proposals for extensions. It turns out that one ofthese proposals, ‘group-info’, accounts for most extension usage in the corpus. Thegroup-info tag lives in an XML namespace by IBM, and it provides a comment fa-cility. There are only 162 policies (of them 151 syntactically distinct) that use exten-sions other than group-info. We suggest that further scrutiny should focus on those162 policies.
# Extensions 7631# Distinct extension tags 23# Policies with extensions 3076 (of all syntactically valid 6,182 policies)# Syntactically distinct policies with extensions 1199 (of all syntactically distinct 2,304 policies)
Table 3.20. Basic numbers about extension usage
Grammar inference
Fig. 3.27 shows an inferred grammar for all the extensions in the corpus. We useEBNF-like notation (as opposed XML-centric XSD notation) for conciseness’ sake.The extensions are grouped by the rooting element (statement, purpose, recipient, re-tention, and data-group); see the first rule in each block in the figure. Grammar rulesfor top-level tags of extensions are collected as iterated choices over extra extensionelements, which are defined by extra productions in each block. Many extensionsuse the standard XML namespace of P3P—as illustrated in Fig. 3.27 with the appro-priate font. (This is a debatable practice because the extending entity does not havecontrol over the namespace.)
Discussion
We observe that the complexity of the inferred grammar suggests that there are moreproposed extensions than baseline language elements. That is, there are 87 differentXML tags introduced by extension elements in the corpus. In contrast, there areonly 50 different XML tags for P3P statements according to its XSD-based syntaxdefinition. Hence, we obtain a ratio of extension : baseline of 1.74.
Several of the proposed extensions extend P3P’s privacy vocabulary in an obvi-ous manner, e.g.:
• How long exactly is information stored?

84 A Study of P3P Language
statement : (collection-method | destruction-method | group-info | statement-group)∗
collection-method = (other-method |delivery |document |purnish |qnaboard | subscription | ...)∗destruction-method = (other-method | format | shatter)∗other-method .
= ε
purpose : (ppurpose | purpose | age | cert | complaint | content |payback |proxy-agreement | statement)∗
ppurpose .= (ACCOUNT | BROWSING |delivery | FEEDBACK |finmgt | government | login |marketing | ...)∗
purpose = (FEEDBACK | government)∗
recipient : (delivery | jurisdiction | recipient-description | recipient-duration | recipient-name | same |delivery)∗
delivery .= ε
jurisdiction = (long-description)∗long-description .
= ε
other-duration .= ε
other-purpose .= ε
recipient-description = (other-purpose | admin | age | agency | cert | complaint | content |delivery | ...)∗recipient-duration = (other-duration |five-year | instance | one-year | six-month)∗
recipient-name .= ε
same .= ε
retention : (retension-duration | retention-basis |use-duration)∗
credit-privacy-law = (one-year)∗
e-trade-law = (five-year)∗
internal-company-regulation .= ε
other-basis .= ε
other-duration .= ε
retension-duration = (other-duration)∗retention-basis .
= (credit-privacy-law | e-trade-law | internal-company-regulation | ...)∗use-duration = (other-duration |five-year | instance | one-month | one-year | ...)∗
data-group : (data-group)∗
categories = (COMPUTER | UNIQUEID)∗category = (COMPUTER | demographic | navigation | purchase | state | UNIQUEID)∗data-group = (datatype)∗datatype = (dynamic | user)∗dynamic = (miscdata)∗home-info = (telecom)∗miscdata = (category)∗telecom = (TELEPHONE)∗user = (home-info)∗
(Some productions had to be cut off for scalability of presentation.) Underlined tags corre-spond to elements without content. For brevity, attributes of extensions are not shown in thegrammar. When ‘ .=’ is used as a rule separator, then text content instead of structured con-tent was encountered for the element in question. All tags that use consistently P3P’s XMLnamespace are shown in boldface. All tags that are used with different XML namespaces areshown in capitals and boldface. All the other tags use a unique XML namespace (differentfrom P3P’s).
Figure 3.27. The (truncated) extension grammar for the corpus

3.5 Threats to Validity 85
• How is information destroyed after the retention period expired?• How to describe recipients in detail?
Appendix A.1.2 provides additional information about the diversity of extensionswith regard to the domains of the policies. Thereby, we have found that most ex-tensions can be traced to Korea. We can only hypothesize about this finding. Onepossible reason could be a particular, national legislation. We mention this findingagain in the threats to validity discussion in §3.5.
3.5 Threats to Validity
Let us discuss several limitations of the trustworthiness of the results of our study.We discuss limitations by their possible origin.
The Corpus
There are several possible approaches to collecting the initial set of websites to bechecked for P3P policies. One way is to aim for most visited or most mentionedwebsites and to collect them from sources such as top-lists and rankings [57, 153].Another option is to obtain “typical” search terms (via logs of search engines) andto collect websites showing up in the results of searching with such terms [44]. Yetanother option is to collect a random sample of websites by Web crawling, startingwith some seed (a list of URLs) and then visiting in a recursive manner all hyperlinksoccurring on retrieved pages. In all cases the idea is to get a somehow characteris-tic set of websites: most visited, typical, or random—later this allows to generalizeresults for that group of websites.
We wanted to collect as many P3P policies as possible, from a single trustworthysource. The Open Directory Project positions itself as “the largest, most comprehen-sive human-edited directory of the Web.”21 We consider this effort to be sufficientfor filtering out abandoned or insignificant websites and also for providing diversity.As language engineers, we do not care if an observed language phenomenon arisesfrom websites that might be not frequently visited or do not show up in top searches.We are curious to investigate any phenomenon if it appears through a reasonableresource like ODP.
Due to a lately discovered omission, we did not retrieve websites and thereforepolicies from ODP’s category ‘Kids and Teens’.
The Tools
We use homegrown tools to run all analyses in the study. While some of the actionsare quite simple (e.g., calculation of a metric based on a provided formula), othersneed an empirical evaluation. Clone detection is probably the most important exam-ple. To address this problem, we manually checked 2 % of cloned policies of each
21 http://www.dmoz.org/docs/en/about.html

86 A Study of P3P Language
type. In that, we followed the procedure of empirical evaluation described by Falkeet al. [61]: a human oracle validates a number of clones selected randomly in anautomated fashion. We did not find any false positives in our check.
Reliability of the Results
Aside the aforementioned technical aspects that might threaten the validity of ourresults, the major threats are in the decisions that we had to make during the processof taming the P3P language. While we argue in favor of our decisions when intro-ducing them, we would like to mention some of them here, without repeating thepro-reasons.
Normal form. According to the assumed normal form, 21.24 % of our corpusis semantically invalid. With a different normal form, we may be able to reduce thenumber of semantically invalid policies, and thereby exclude less policies from someof the analyses. We assume though that we picked the most established normal form,as we discussed in §3.3.3.
Variable-category data elements. In all our analyses, we treat data referenceswith variable categories the same way we treat data references with fixed categories.That is, we count them as single references to specific data items. This may be sub-optimal, as pointed out, for example, in §3.4.3. Hence, the reliability of our resultsfor policies with variable-category data elements is threatened.
Privacy order. We aligned elements of P3P language by their meaning that wediscovered from the specification of the language. While we did our best during thisjudgement, it might be that we failed to understand the nuances of definitions. Forinstance, in a recent work by Ghazinour and Barker, they apply lattice-based struc-ture to P3P elements [70], and, e.g., the resulting chain for retention differs fromour. Ghazinour and Barker start with “legal-requirement” as the bottom element,then place “no-retention”, “stated-purpose”, “business-practices”, and “indefinitely”as the top element. The impact of ill-conceived partial order is very limited becausewe leverage the specific definition only informally when we discuss relationshipsbetween significant and common policies and in the auxiliary discussion of the di-versity of semantically distinct policies in Appendix A.1.2.
Extensions. Most of the found extensions can be traced to Korea. Without anexplanation of this situation, it may be that the observed, substantial use of extensionsis not representative for P3P authoring generally.
3.6 Related Work
We relate our P3P effort to the general area of empirical program analysis. We alsoexplain how our work differs from other P3P studies that are essentially studies onP3P adoption. We briefly mention other literature that critically discusses P3P, andwe comment on the situation in the web-privacy domain more broadly.

3.6 Related Work 87
Empirical Program Analysis
There is early work on simple static and dynamic program analysis for FORTRAN,Cobol, and Pascal with the objective of informing compiler implementors and possi-bly language designers [115, 157, 34, 40]. Static analysis is typically based on simplestructural program properties. Dynamic analysis may examine aspects such as depthof recursion. We also measure structural properties. Dynamic analysis is not directlyrelevant for P3P. We pick up the extra opportunity of semantics-based measurements.Our work may be of interest for P3P tool providers and language designers, and weprovide insights into P3P’s use cases.
In [160], the use of APL language features is found to obey an 80-20 rule. Wehave checked that the use of P3P’s base data schema obeys such a rule, too. That is,about 80 % of all P3P policies in the corpus (in fact, 84.15 %, i.e., 5,202 policies)use only 20 % of all data references.
In recent years, Java programs (or byte-code programs) have been empiricallyanalyzed [71, 24, 38]. The work of [24] makes a laudable effort to deeply study themathematical distribution of simple structural properties. In contrast, our researchquestions are not concerned with the discovery of distributions.
The idea to empirically analyze policies (as opposed to programs) was also in-spired by our earlier work on understanding the usage of XML schemas [120]. Inthis context, we also had to come up with non-classical forms of metrics and usageanalyses for language elements.
Studies of P3P Adoption
Several studies have analyzed P3P’s adoption; we consider the following list as rep-resentative of this line of work: [57, 153, 44, 154]. The studies differ in objective,the method of obtaining a corpus, and analytical techniques. Table 3.21 provides asummary.
In three out of four cases, these earlier studies involved multiple sources suchas ranking lists for websites, and they also used search engines, e.g., by locatingwebsites through ranked lists of search terms. Our reliance on a single source is athreat to validity, but given the size of the corpus and the reputation of ODP, weshould have covered many important websites. Still our distributions may be biasedin that we may look at more unpopular sites than earlier studies.
Previous work, as listed above, has not analyzed metrics, cloning, semantics-based properties, P3P extensions, and language coverage (except for some basicconsiderations in [44]). This is largely a consequence of a focus on adoption as op-posed to our focus on language-usage analysis as well as our background in software-language engineering.
Critical Discussion of P3P
All above-mentioned work on P3P adoption regularly involves simple forms of valid-ity checking, and the reported degrees of invalidity also along evolution of websites

88 A Study of P3P Language
Property [57] [153] [44] [154]
Time stamp 12/2006? 11/2005 12/2006 11/2006Size of corpus 3846? 1482? 3846? 3282Number of sources 11 6 5 1Syntax error rates ◦ ◦ • ◦Boundary breakdown – • – •Website evolution – • • –P3P language coverage – – ◦ –Privacy classification • – ◦ –Legislation – – – •HRPP interpretation – – • –
Question marks in the cells mean that we are not confident that the available descriptions couldbe unambiguously interpreted; ‘•’ means that the study focuses on this issue; ‘◦’ means thatthe study touches upon the issue, but does not focus on it.
Legend of properties:
• ‘Time stamp’—the date when the corpus was determined.• ‘Size of corpus’—number of policies considered by the study.• ‘Number of sources’—number of directories, rankings, etc.• ‘Syntax error rates’—analysis of syntactical validity.• ‘Boundary breakdown’—analysis of geographical or linguistic distribution.• ‘Website evolution’—analysis of changed, corrected, added, and removed policies.• ‘P3P language coverage’—analysis of vocabulary usage as in §3.2.1.• ‘Privacy classification’—analysis of privacy profiles.• ‘Legislation’—analysis of compliance of policy with applicable• ‘HRPP interpretation’—analysis of HRPP (Human Readable Privacy Policy)
Table 3.21. Related work on P3P adoption
can be regarded as one theme of critical discussion of P3P. It may just be necessarythat the deployment process for policies would involve mandatory validation.
From a language engineer’s point of view, a major issue with P3P is the lackof a standardized, sufficiently formal, and comprehensive semantics. One criticallyrelies on such a semantics for complete validation of policies and, even more so, forpolicy enforcement. For instance, W3C’s APPEL language [188] targets the prob-lem of user preferences on top of P3P. Because of the weak specification of P3P,APPEL also ends up querying P3P in an ‘unstable’ manner: Query results differ for‘obviously’ meaning-preserving variations of policies. APPEL’s definition has beencriticized widely [90, 14, 15, 197] and alternative languages for preferences havebeen proposed [14, 15], but ultimately it is P3P that needs to be more strongly de-fined.

3.7 Conclusion 89
Web-privacy Domain
P3P is a machine-readable language allowing to express data collection practices ofwebsites. P3P was designed to make it easier for customers to become aware of andunderstand websites’ policies.
An alternative approach to expressing privacy policies in a human-friendly for-mat uses seals (say, badges or pictograms) placed on pages of websites. These sealprograms, e.g., TRUSTe [183], are meant to guarantee trustworthiness of the websitewhich have to meet certain requirements for different types of seals subject to a certi-fication mechanism. It should be interesting to compare the types of seals consideredby these approaches with our findings of common policies.
The idea of expressing privacy practices of a website with a concise visual formsuch as a pictogram is appealing and inspired other attempts. For example, withinthe community of Mozilla’s users, there is an initiative of reducing the complexityof privacy policies and having visual aids for quick indication. (Likewise, CreativeCommons licenses provide simple, standardized alternatives to the paradigm of tradi-tional copyright [143].) There is also an effort by the law firm Hunton & Williams—layered privacy notices that provide users with a high-level summary of a privacypolicy [178, 179]. Another effort on information design that improves comprehensi-bility of privacy policies exploits the idea of nutrition label that lists facts about theproduct. The authors suggest to present information in a form of a colored grid [107].
3.7 Conclusion
With the possible exception of P3P, there is no widely adopted, language-based ap-proach to privacy in web-based systems. It is very common that web-based systemsaddress privacy essentially by means of human-readable policies, settings dialogs,and perhaps seal programs such as TRUSTe. Nevertheless, language-based solutionsmay be needed to enable flexible, transparent, and enforceable privacy policies forweb-based systems.
Recent communications by P3P advocates and experts [164, 43] made a numberof observations about the adoption issues with P3P as well as design or lifecycleproblems with the language; these communications also made a few proposals onhow the web-privacy domain should proceed and what lessons to learn from P3P. Tosome extent, the communications also take advantage of empirical research, but ourstudy in empirical analysis of language usage for P3P is the first that analyzes thelanguage from a software language engineer’s point of view.
Our analysis of correct use for standardized and provisional language constraintssuggests that future language-based solutions must be more rigorous in specifyingthe language and enforcing correct use effectively. Our analysis of circulating P3Pextensions based on P3P’s extension mechanism has revealed that the mechanismhas not been broadly adopted. However, the available examples of extensions clearlyhint at the need of additional details to be covered by privacy policies. We propose
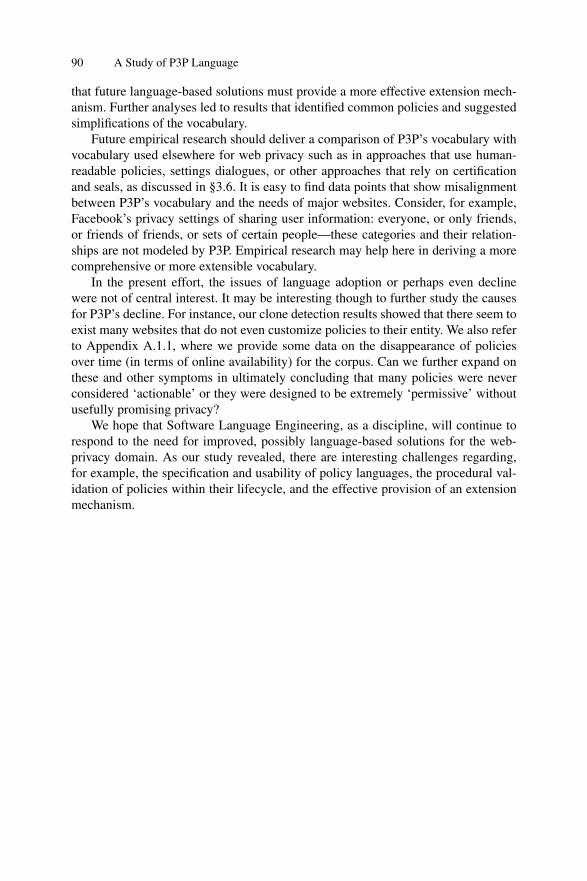
90 A Study of P3P Language
that future language-based solutions must provide a more effective extension mech-anism. Further analyses led to results that identified common policies and suggestedsimplifications of the vocabulary.
Future empirical research should deliver a comparison of P3P’s vocabulary withvocabulary used elsewhere for web privacy such as in approaches that use human-readable policies, settings dialogues, or other approaches that rely on certificationand seals, as discussed in §3.6. It is easy to find data points that show misalignmentbetween P3P’s vocabulary and the needs of major websites. Consider, for example,Facebook’s privacy settings of sharing user information: everyone, or only friends,or friends of friends, or sets of certain people—these categories and their relation-ships are not modeled by P3P. Empirical research may help here in deriving a morecomprehensive or more extensible vocabulary.
In the present effort, the issues of language adoption or perhaps even declinewere not of central interest. It may be interesting though to further study the causesfor P3P’s decline. For instance, our clone detection results showed that there seem toexist many websites that do not even customize policies to their entity. We also referto Appendix A.1.1, where we provide some data on the disappearance of policiesover time (in terms of online availability) for the corpus. Can we further expand onthese and other symptoms in ultimately concluding that many policies were neverconsidered ‘actionable’ or they were designed to be extremely ‘permissive’ withoutusefully promising privacy?
We hope that Software Language Engineering, as a discipline, will continue torespond to the need for improved, possibly language-based solutions for the web-privacy domain. As our study revealed, there are interesting challenges regarding,for example, the specification and usability of policy languages, the procedural val-idation of policies within their lifecycle, and the effective provision of an extensionmechanism.

4
A Study of APIs
In this chapter, we present an empirical study of API usage. We begin with an ini-tial exploration of the topic in the context of open-source Java projects, where wedemonstrate examples of large-scale API usage analysis and detect different stylesof usage (framework-like vs. library-like). We investigate further framework usageby developing a framework profile—a range of reuse-related metrics to measure theas-implemented design and its usage—and applying it to the Microsoft .NET Frame-work. Finally, based on the developed analyses, we introduce a catalogue of explo-ration activities to capture API usage accompanied by a tool.
Road-map of the chapter
• Section 4.1 provides brief motivation for the study.• Section 4.2 analyzes API usage in Java context.• Section 4.3 analyzes API usage on the example of .NET framework.• Section 4.4 illustrates the developed intuitions as exploratory activities.• Section 4.5 discusses threats to validity for this empirical study.• Section 4.6 discusses related work.• Section 4.7 concludes the chapter.
Reproducibility
We provide additional data (details of implementation, source code of the tool, etc.)on the supplementary websites1,2,3.
Related publications
Research presented in this chapter underwent the peer-reviewing procedure and waspublished in the proceedings of Symposium on Applied Computing in 2011 [4],Working Conference on Reverse Engineering in 2011 [3], and International Confer-ence on Program Comprehension in 2013 [6].
1 http://softlang.uni-koblenz.de/sourceforge2 http://softlang.uni-koblenz.de/dotnet/3 http://softlang.uni-koblenz.de/explore-API-usage/

92 A Study of APIs
4.1 Introduction
(A brief introduction to APIs is provided in Part I, Prerequisites, Section 2.3.2.)The use (and the design) of APIs is an integral part of software development.
Projects are littered with usage of easily a dozen APIs; perhaps every third line ofcode references some API [4]. Accordingly, understanding APIs or their usage mustbe an important objective. Much of the existing work focuses on some form of docu-mentation or discovery of API-usage scenarios perhaps by code completion or codesearch [98, 199, 172, 58]. A contrary approach is an exploration-based approach tounderstanding API usage in a systematic manner.
We develop this approach by examining API usage from two complementaryangles of view. Application programming interfaces, APIs4, are intended to exposespecifications for routines, data structures, object classes, variables, and so on. Fromthe point of view of the usage, APIs are essentially languages within languages.From the point of view of the intention, APIs provide reusable pieces of functional-ity. These considerations give rise to the following research directions when investi-gating API usage in the wild:
• Are all “language elements” of an API used? I.e., what is the coverage of the APIby projects. And dually, what are the different “language elements” of APIs thata project makes use of? I.e., what is the footprint of APIs in the project.
• What are the ways of providing reusability? I.e., what is a classification (a profile)of potential reuse of an API. And dually, are those ways used equally in projects?I.e., what is the profile of the actual reuse of the API.
Having followed these two complementary research directions, we develop a cat-alogue of exploratory activities (accompanied by a tool), which can be helpful bothto API developers and API users (i.e., project developers).
4.2 Java APIs
In this study, we follow the first research direction identified in the Section 4.1,namely:
• Are all “language elements” of an API used? I.e., what is the coverage of the APIby projects. And dually, what are the different “language elements” of APIs thata project makes use of? I.e., what is the footprint of APIs in the project.
We place our research in the context of API migration. Given a programmingdomain, and given a couple of different APIs for that domain, it can be challeng-ing to devise transformations or wrappers for migration from one API to the other.The APIs may differ with regard to types, methods, contracts, and protocols so that
4 We use the term API to refer both to a public programming interface and its actual imple-mentation as a software library for reuse.

4.2 Java APIs 93
actual API migration efforts must compromise with regard to automation and cor-rectness [22, 20].
Several researchers, including ourselves, are working towards general techniquesfor reliable and scalable API migration. Because of the complexity of transforma-tions and wrappers for migration as well as the difficulty of proving them correct, itis also advisable to leverage diverse knowledge about actual API usage.
In the current section, we describe an approach to large-scale API-usage anal-ysis for the analysis of open-source Java projects. Our approach covers checkout,building, tagging with metadata, fact extraction, analysis, and synthesis with a largedegree of automation. We describe a few examples of API-usage analysis; they aremotivated by API migration. Overall, API-usage analysis helps with designing anddefending mapping rules for API migration in terms of relevance and applicability.
4.2.1 Overview of the Approach
We rely on methods and techniques that are commonly used in reverse engineeringand program understanding. In particular, we need to set up a corpus of softwareprojects to be used for data mining; we also need to provide a fact-extraction ma-chinery to build a database of program facts. Additionally, we need to add metadataabout APIs—as we operate in the domain of the programming domains and theirAPIs. Any specific form of API-usage analysis is then to be implemented throughqueries on the fact base (database) that is obtained in this manner.
Setting up the corpus
The objectives of a specific effort on API-usage analysis should obviously affect theprovision of a corpus. In this study, we are mainly interested in extracting evidence(facts) about API usage from as many projects as possible. While corpora of dozensof well chosen projects (such as the one of [24]) are well suited for many data min-ing purposes (e.g., for the analysis of simple structural properties (metrics) of Javasoftware), they are potentially limited with regard to API features that they exercise.For this reason, we are interested in large-scale efforts where API-usage data is sys-tematically mined from open-source repositories. In principle, one could still includespecific ‘well-known’ projects manually into the resulting corpus, if this is desired.
Provision of a fact extractor
We need to be able to reliably link facts of API usage to the actual APIs and theirtypes, methods, etc. Hence, fact extraction must be syntax- and type-aware. (Forinstance, the receiver type in a method call must be known in order to associatedcalls with API methods.) We use fact extraction based on resolved ASTs. However,this choice basically implies that we only consider built (‘buildable’) projects, whichmay result in a bias. Therefore, we also incorporate an additional token-based (asopposed to AST-based) fact extractor into the architecture so that some more basicanalyses are still feasible.

94 A Study of APIs
Addition of API metadata
Along with building many projects, one encounters many APIs. In the case of theJava platform, there are Core Java APIs and third-party APIs. Based on package andtypes names, one can identify these APIs, and assign names. For instance, certaintypes in the package java.util account for the ‘Core Java API for collections’.One can also associate programming domains with APIs: GUI, XML, Testing, etc.
Third-party APIs reveal themselves in the process in two principle ways. First,projects may fail to build with ‘class not found’ errors, which are to be manuallyresolved by supplying (and tagging) the corresponding APIs through web searchand download. Second, the corpus can also be analyzed for cross-project reuse. Thatis, one can automatically identify API candidates by querying for packages whosemethods were called (and potentially declared and compiled) in at least two projects.
4.2.2 A Study of SourceForge
We will now describe the instantiation of the above approach for the study of Javalibraries. As a source for Java projects—with the goal of collecting a large-scalecorpus—we have selected SourceForge online repository5, a web-based source coderepository, existing since 1999.
Project selection
Based on available metadata for all SourceForge projects, we determined the listof potential Java projects. In the present study, as a concession to scalability andsimplicity of our implementation, we only downloaded projects with a SourceForge-hosted SVN source repository, and we only considered Java projects with Ant-basedbuild management. We used a homegrown architecture for parallel checkout andbuilding. The selected SourceForge projects were fetched in October 2008.
Resolution of missing API packages
Obviously, SourceForge projects may fail to build for diverse reasons: wrong plat-form, missing configuration, missing JARs, etc. We wanted to bring up the numberof buildable projects with little effort. We addressed one particular reason: ‘class notfound’ compilation errors. To this end, our build machinery compiles a summary ofunresolved class names (package names) for a full build sweep over all projects. Thissummary ranks package names by frequency of causing ‘class not found’ errors sothat the manual effort for supplying missing APIs can be prioritized accordingly. Wesearched the web for API JARs using unresolved package names as search strings.We downloaded these JARs, added them to the build path, and ran the automatedbuild again. We repeated this step until the top of the list of missing packages wouldcontain packages referenced only by 1-2 projects. This process provided us with
5 http://sourceforge.net/

4.2 Java APIs 95
1,476 built projects, where approx. 15 % of these projects were made buildable byour resolution efforts. In the end, we were able to build 90.05 % of all downloadedSourceForge projects that satisfied our initial criteria (Java, SVN, ANT). The processresulted in an API pool of 69 non-Core Java APIs.
Fact extraction
We carried out resolved AST-based fact extraction by means of a compiler plug-infor javac, which is activated transparently as projects are built. In this study, we ex-tracted facts about method declarations, method calls, and subtype relationships. Weinterpret the term method to include instance methods, static methods and construc-tors. All facts were stored in a relational database using a trivial relational schema.
We only used AST-based facts from projects with successful builds. For allprojects, we performed token-based fact extraction to count NCLOC (non-commentlines of code) for Java sources and to determine all package names from imports. Theimporting facts give an indication of, for example, the APIs that are used in projectsthat do not build.
Reference projects
We made an effort to identify a control group of (buildable) reference projects thatcould be said to represent well thought-out, actively developed and usable software.Such a control group allows us to check all trends of the analyses for the full corpusby comparison with the more trusted reference projects. Several charts in this studyshow all projects vs. reference projects for comparison. We automatically identifiedthe reference projects by means of SourceForge’s metadata about maturity status ofthe project, number of commits, and dates of first and last commits. That is, we se-lected projects that rate themselves as ‘mature’ or ‘stable’, have a repository createdmore than two years ago, and have more than 100 commits to the repository. Thisselection resulted in 60 reference projects out of all the 1,476 built projects.
Size metrics for the corpus
Numbers of projects and their NCLOC sizes, and other metrics are summarized inTable 4.1 and Table 4.2. We use the metric MC for the number of method calls.
Figure 4.1 presents the distribution of size metrics (NCLOC, MC) for the corpus(y-axis is normalized w.r.t. the maximum of the metric in each group). As one cansee, both metrics correlate reasonably. The maximum of NCLOC in the whole corpus(incl. unbuilt projects) is 25,515,312, the maximum of NCLOC among built projectsis 1,985,977, which implies a factor 12.85 difference. Hence, we are missing thebiggest projects currently. The maximum of MC among built projects is 228,242.

96 A Study of APIs
Metric Value
Projects 6,286Source files 2,121,688LOC 377,640,164NCLOC 264,536,500Import statements 14,335,066
Table 4.1. Summary of token-based analysis (with all automatically identified Java/SVNprojects on SourceForge)
Metric Value
Projects with attempted builds 1,639Built projects 1,476Packages 46,145Classes 198,948Methods 1,397,099Method calls 8,163,083
Table 4.2. Summary of AST-based analysis
API Domain Core # projects # calls
total distinct
Java Collections Collections yes 1,374 392,639 406AWT GUI yes 754 360,903 1,607Swing GUI yes 716 581,363 3,369Reflection Other yes 560 15,611 154Core XML XML yes 413 90,415 537DOM XML yes 324 52,593 180SAX XML no 310 13,725 156log4j Logging no 254 43,533 187JUnit Testing no 233 71,481 1,011Comm.Logging Logging no 151 21,996 88
Table 4.3. Top 10 of the known APIs (sorted by the number of projects using an API)
Provision of API metadata
Both Core Java APIs and manually downloaded JARs were processed by us to assignmetadata: name of the API, the name of a programming domain, one or more packageprefixes, and potentially a white-list of API types. Table 4.3 lists the top 10 of allthe 77 manually tagged APIs together with some metadata and metrics (full list ofknown APIs is available in Appendix A.2.1). We used a special reflection-basedfact extractor for the visible types and members of the API JARs. (Alternatively,

4.2 Java APIs 97
Figure 4.1. Size metrics (NCLOC, MC) for built and unbuilt projects (thinned out). Theprojects are ordered by the values for the NCLOC metric
one could also attempt to leverage API documentation, but such documentation maynot be available for some of the APIs, and it would take extra effort to establishconsistency between JARs and documentation.) These facts are also stored in thedatabase, and they are leveraged by some forms of API-usage analysis.
4.2.3 Examples of API-usage Analysis
We will introduce a few examples of API-usage analysis. In each case, we will pro-vide a motivation related to API migration and language conversion—before we ap-ply the analysis to our SourceForge corpus.
Admittedly, the statistical analysis of a corpus does not directly help with anyspecific migration project. However, the reported analyses as such are meaningfulfor single projects, too (perhaps subject to refinements). For instance, we will discussAPI coverage below, and such information, when obtained for a specific project,directly helps prioritizing migration efforts. In this study, we take a statistical viewon the corpus to indicate the de-facto range for some of the measures of interest.

98 A Study of APIs
0
5
10
15
20
25
30
1 10 100 1000 10000 1e+05 1e+06 1e+07
Nu
mb
er
of
use
d k
now
n A
PIs
Project Size (in NCLOC)
Unbuilt projectsBuilt projects
Reference projects
Projects Min 1st Q Median Mean 3rd Q Max
Unbuilt 1 2 4 4.4 6 27Built 1 3 4 4.7 6 23Reference 1 4 6 6.9 8 20
Figure 4.2. Numbers of known APIs used in the projects (reference projects are plotted on topof built projects which in turn are plotted on top of unbuilt projects)
API footprint per project
We begin with a very simple, nevertheless informative API-usage analysis for thefootprint of API usage. There are different dimensions of footprint. Below, we con-sider the numbers of used APIs and used (distinct) API methods. In the online ap-pendix, we also consider the ratio of API calls to all calls. In extension of thesenumbers, we could also be interested in the ‘reference projects × API pool’ matrix(showing for each project the combination of APIs that it uses).
The APIs or API methods used in a project provide insight into the API-relatedcomplexity of the project. In fact, such footprint-like data serves as a proxy for theAPI dependence or platform dependence of a project. In [114], we mention suchAPI dependence as a form of software asbestos. In the following, we simply countthe number of APIs used in a project as a proxy for the difficulty of API migration.Ultimately, a more refined analysis is needed such that specific (known to be difficult)

4.2 Java APIs 99
API combinations are counted, and attention is payed to the status of whether theseAPI combos are really exercised in one program scope or only separately.
In this context, we need to define what constitutes usage of an API. One optionwould be to count each method call with an API’s type as static receiver type (in thecase of an instance call), or as the hosting scope (in the case of a static call), or asthe constructed type (in the case of a constructor call). Another option is to countany sort of reference to an API’s types (including the aforementioned positions ofAPI types in method calls, but counting additionally local variable declarations orargument positions of method declarations and method calls). Yet another optionis to consider simply imports in a project. The latter option has the advantage thatwe can measure such imports very easily—even for unbuilt projects. Indeed, thefollowing numbers were obtained by counting imports that were obtained with thetoken-based fact extractor.
Figure 4.2 shows the number of known APIs (y-axis) that are used in the projectsordered by NCLOC-based project size (x-axis). Unbuilt, built, and reference projectsare distinguished. The listed maxima and quartiles give a sense of the API footprint inprojects in the wild. The set of unbuilt projects exercises a higher maximum of usedAPIs than the set of built projects—potentially because of a correlation between thecomplexity of projects in terms of the number of involved APIs and the difficulty tobuild those projects.
We also need to clarify how to measure usage of API methods. That is, howto precisely distinguish distinct methods so that counting uses is well defined. Par-ticularly, in the case of instance method calls, the situation is complicated due toinheritance, overriding, and polymorphism. As a starting point, we may distinguishmethods by possible receiver type—no matter whether the method is overridden orinherited at a given subtype. Then, a method call is counted towards the static re-ceiver type in a call. Additionally, we may also count the call towards subtypes (sub-ject to a polymorphism-based argument: the runtime receiver type may be a subtype)and supertypes (subject to an inheritance-based argument: the inherited implementa-tion may be used, if not inherited). Such inclusion could also be made more preciseby a global program analysis.
Fig. A.6 shows the usage of known API methods relative to all methods in aproject—both in terms of calls. The smaller the ratio (the closer to zero), the lowerthe contribution of API calls. The quartiles show that in most projects, about eachsecond method call is an API call. As far as instance-method calls are concerned, thefigure distinguishes API vs. project-based method calls solely on the grounds of thestatic receiver type of methods.
Figure 4.4 shows the numbers of distinct API methods used in the built projectsof the corpus; reference projects are highlighted. Methods on sub- and supertypesof static receiver types were not included. For simplification, we also consideredoverloaded methods as basically one method.
There is a trend of increasing API footprint with project size. Both axes are loga-rithmic, but project size grows more quickly than the count of distinct API methods.Most projects, even most of the largest ones, use less than 1,000 distinct API meth-ods. As the table with maxima and quartiles shows, there are a few projects with

100 A Study of APIs
0
0.1
0.2
0.3
0.4
0.5
0.6
0.7
0.8
0.9
1
1 10 100 1000 10000 1e+05 1e+06
Ratio
Project Size (in MC)
Projects Min 1st Q Median Mean 3rd Q Max
All 0.02 0.45 0.56 0.56 0.67 1Reference 0.11 0.43 0.5 0.5 0.57 0.99
Figure 4.3. Ratio of API method calls to all method calls
exceptionally high counts. We have verified for these projects that they essentiallyimplement or test large frameworks (such as ofbiz.apache.org). That is, theseoutliers embody large numbers of ‘self-calls’ for a large number of API methods.
Additional results on API usage are provided in Appendix A.2.1
API coverage by the corpus
An important form of API-usage analysis concerns API coverage; see, for example,the discussion of coverage in the API migration project of [22]. That is, coverageinformation is helpful in API migration as means to prioritize efforts, and to leaveout mapping rules for obscure parts of the API. Coverage information is also helpfulin improving API usability [101, 96].
As it is the case with other forms of API-usage analysis, API coverage may beconsidered for either a specific project, or, cumulatively, for all projects in a corpus.For instance, for any given API, we may be interested in the API types (classes andinterfaces) that are exercised in projects by any means: extension, implementation,variable declaration, all kinds of method calls, and other, less obvious idioms (e.g.,instance-of tests). At a more fine-grained level, we may be interested in the exercisedmembers for each given API type. Hence, qualitative measurements focus on types

4.2 Java APIs 101
1
10
100
1000
10000
100000
1 10 100 1000 1e+04 1e+05
Num
ber
of dis
tinct A
PI m
eth
ods
Project size (in MC)
Projects Min 1st Q Median Mean 3rd Q Max
All 1 94 199.5 370.7 423 10,850Reference 20 305.8 611 866.2 948.8 5,351
Figure 4.4. Numbers of distinct API methods used in the projects (without distinguishingAPIs)
and members that are exercised at all, while quantitative measurements rank usageby the number of occurrences of a type or a member or other weights.
Assuming a representative corpus, further assuming appropriate criteria for de-tecting coverage, we may start with the naive expectation that a good API shouldbe covered more or less by the corpus. Otherwise, the API would contain de-factounnecessary types and methods—which is clearly not in the interest of the API de-signer. However, it should not come as a surprise that, in practice, APIs are not cov-ered very well—certainly not by single meaningful projects [22], but—as our resultsshow—not even by a substantial corpus; see below.
We have actually tried to determine two simple coverage metrics for all 77 knownAPIs: i) a percentage-based metrics for the types; ii) another percentage-based met-rics for all methods. However, we do not feel comfortable presenting a chart of thosemetrics for all known APIs here. Unless considerable effort is spent on each API,such a chart may be disputable. The challenge lies in the large number of projects andAPIs, the different characteristics of the APIs (e.g., in terms of their use of subtyp-ing), aspects of cloning, and yet other problems. Some of the issues will be demon-strated for selected APIs below.

102 A Study of APIs
Projects Min 1st Q Median Mean 3rd Q Max
All built 0.16 1.9 2.8 4.9 3.7 59.9Reference 1.9 2.9 3.7 3.4 3.9 4.6
Figure 4.5. Usage of JDOM’s distinct methods
Let us investigate coverage for specific APIs. As our first target, we pick JDOM—a DOM-like (i.e., tree-based, in-memory) API for XML processing. We know thatJDOM is a ‘true library’ as opposed to a framework. Regular client code shouldsimply construct objects of the JDOM classes and invoke methods directly. We men-tion these characteristics because library-like APIs may be expected to show higherAPI coverage than framework-like APIs—if we measure coverage in terms of calledmethods, as we do here. In this study, in the case of a call to an instance method,we only count the method on the immediate static receiver type as covered. Wehave checked that the inclusion of super- and subtypes, as discussed earlier, doesnot change much the charts described below.
Initially, we measured cumulative coverage for the methods of the JDOM APIto be 68.89 %. We decided to study the contribution of the different projects. Thereare 86 projects with JDOM usage among the built projects of the corpus. Figure 4.5shows the percentage-based coverage metrics for the methods of the JDOM API

4.2 Java APIs 103
for those JDOM-using projects. The table with maxima and quartiles gives a goodindication of the relatively low usage of the JDOM API.
Obviously, 3 projects stand out with their coverage. We found that these projectsshould not be counted towards cumulative coverage because these projects containJDOM clones in source form. That is, it the API calls within the API’s implementa-tion imply artificial coverage for more than half of all JDOM methods. Without thoseoutliers, the cumulative coverage is considerably lower, only 24.10 %.
Projects Min 1st Q Median Mean 3rd Q Max
All built 0.33 0.33 0.98 2.22 2.61 27.12Reference 0.33 0.33 1.14 2.37 3.02 11.44
Figure 4.6. Usage of SAX’ distinct methods
Let us consider another specific API. We pick SAX—a push-based XML pars-ing API. The push-based characteristics imply that client code typically extends‘handler’ classes or implements handler interfaces with handler methods such asstartElement and endElement—to which XML-parsing events are pushed.

104 A Study of APIs
As a result, one should be prepared to find relatively low API coverage—if we mea-sure coverage in terms of called methods.
We measured cumulative coverage for the methods of the SAX API to be50.98 %. This relatively high coverage was surprising. There are 310 projects withSAX usage among the built projects of the corpus. Figure 4.6 shows the percentage-based coverage metrics for the methods of the SAX API for those SAX-usingprojects. We found that three of the projects with the highest coverage were in factthe previously discussed projects with JDOM clones in source form. Closer inspec-tion revealed that the JDOM API implements, for example, a bridge from in-memoryXML trees to SAX events, and hence, it pushes itself as opposed to regular SAX-based functionality that is pushed. This is an unexpected but correct use of the SAXAPI within the DOM API which brings up coverage of the SAX API. Even if we re-moved those 3 projects, the cumulative coverage only drops down a little to 49.34 %.
We also found other reasonable reasons for relatively high coverage. There areprojects that use inheritance and composition to define new handlers (e.g., http://corpusreader.sourceforge.net/) so that API methods may get called through‘super’ or delegation. As the quartiles show in the figure, most projects use a smallpercentage of the SAX API. Most of the relevant methods are concerned with pro-cessing the parameters of the handlers. Many of the SAX projects use (largely) pre-defined handlers, e.g., for validation—thereby implying a very low coverage.
Framework-like API usage
Finally, we introduce an analysis for framework-like API usage: What API types aretypically implemented and extended, if any? Also, can we determine whether a givenAPI is presumably more framework-like (less class library-like) than another API?What are the parts of an API that account for framework-like usage? In the context ofAPI migration, proper framework-like usage is very challenging because it impliesan ‘inversion of control’ in applications, which is very hard to come by with mappingrules [20].
API # projects # methods # dist. methods # derived types # API types
impl ext any impl over impl over int cl int cl
Swing 173 381 391 2,512 11,150 305 645 443 1,859 39 92AWT 194 75 225 4,201 756 593 176 651 120 31 24Java Collections 120 0 120 986 0 16 0 208 0 3 0SAX 28 21 42 428 90 85 21 37 29 12 3JUnit 3 38 40 4 344 4 19 3 46 2 2Core XML 11 5 14 89 13 17 4 14 5 9 3SWT 5 8 10 37 86 4 13 25 11 3 3log4j 1 8 8 25 87 7 9 2 9 2 3Reflection 7 0 7 10 0 1 0 7 0 1 0JMF 4 2 6 8 6 6 3 4 3 3 3
Table 4.4. Top 10 of the APIs with framework-like usage (sorted by the sum of numbers ofAPI-interface implementations and API-class extensions; see the first 3 columns)

4.3 .NET framework 105
More specifically, by framework-like usage, we mean any sort of idiomatic evi-dence for refining, configuring, and implementing API types within client code. Inparticular, we may measure i) extensions (i.e., client classes that extend API classes);ii) implementations (i.e., client classes that implement API interfaces); iii) overrides(i.e., client classes that subclass API classes and override inherited API methods).Obviously, there are facets that may be harder to identify generically. For instance, ifa framework would involve plug-in or configuration support based on regular methodcalls, then such framework-like usage would be missed by i)—iii). There is again away of defining framework-like usage in a cumulative way—very similar to cover-age analysis. That is, for a given API, we may determine the set of API types that areever involved in framework-like usage.
In reality, many APIs allow for both—class library-like and framework-like us-age. For instance, the Core Java API DOM is essentially interface-based so that newproviders can be implemented, but there are default implementations for the impor-tant use case of DOM as an in-memory XML API. In contrast, there are other APIsthat are subject to framework-like usage more inevitably. For instance, the Core JavaAPI Swing is often used in a way that the JPanel class is overridden.
In our corpus, 35 out of all 77 known APIs exercise a measurable facet offramework-like usage. Table 4.4 lists the top 10 of these APIs. In the table, we alsoshow the numbers of API methods that are implemented or overridden throughoutthe corpus: we show both absolute numbers of implementations/overrides and thenumbers of distinct methods. Further, we show the number of derived types in clientcode, and the number of API types ever exercised through framework-like usage.
Surprisingly, the table shows that there are only 7 APIs that are used in 10 or moreprojects in a framework-like usage manner. This clearly suggests that our corpus (ofbuilt projects) and our selection of APIs is trivial in terms of framework-like usage.Many APIs do not show up at all in the table—despite heavy usage in the corpus.For instance, DOM-like APIs like JDOM or XOM do not show up at all, whichmeans that they are only used in a class library-like manner. The DOM API itself issubject to API-interface implementations in a number of projects. In Appendix A.2.1,we also break down the numbers of the table to show the types that are commonlyinvolved in framework-like usage: just a hand full of GUI, XML and collection typesaccount for almost all the framework-like usage in the corpus.
4.3 .NET framework
In this study, we follow the second research direction identified in the Section 4.1,namely:
• What are the ways of providing reusability? I.e., what is a classification (a profile)of potential reuse of an API. And dually, are those ways used equally in projects?I.e., what is the profile of the actual reuse of the API.
As we have discussed in Section 4.2.3 (pp. 102 and 104), there are two majorstyles of APIs: library-like vs. framework-like. The former suggests simple construc-

106 A Study of APIs
tion of objects and direct invocation of methods, while the latter implies any sortof refining, configuring, and implementing API types within client code. In otherwords, library-like APIs use the basic form of reuse, while framework-like APIs ex-ercise more sophisticated forms. Therefore, we focus specifically on frameworks inour study.
We place our research in the domain of comprehension. Suppose you need to(better) understand the architecture of a platform such as the Java Standard Edition6,the Microsoft .NET Framework7, or another composite framework. There is no sil-ver bullet for such framework comprehension, but a range of models may be usefulin this context. We suggest the notion of framework profile which incorporates char-acteristics of potential and actual reuse of frameworks. The approach is applied tothe Microsoft .NET Framework and a corpus of .NET projects in an empirical study.
Framework comprehension supports reverse and re-engineering activities. Inquality assessment of designs [182], framework profiles help understanding frame-works in a manner complementary to architectural smells, patterns, or anti-patterns.Also, one can compare given projects with the framework profile. More specifically,in framework re-modularization, framework profiles help summarizing the status ofmodularization and motivating refactorings [54]. In API migration [21], frameworkprofiles help assessing API replacement options with regard to, for example, dif-ferent extensibility characteristics. Finally, framework profiles help in teaching OOarchitecture, design, and implementation [163].
4.3.1 Methodology
Research hypothesis
Platforms such as JSE or .NET leverage programming language concepts in a sys-tematic manner to make those frameworks reusable (say, extensible, instantiatable,or configurable). It is challenging to understand the reuse characteristics of frame-works and actual reuse in projects at a high level of abstraction. Software metricson top of simple static and dynamic program analysis are useful to infer essentialhigh-level reuse characteristics.
Research questions
1. What are the interesting and helpful high-level characteristics of frameworkswith regard to their potential and actual reuse?
2. To what extend can those characteristics be computed with simple metrics sub-ject to simple static and dynamic program analysis?
6 http://www.oracle.com/us/javase7 http://www.microsoft.com/net/

4.3 .NET framework 107
• N N N ∗ ∗ �
• – – � – – – –• – – N – – – –• � N
• ∗ ∗ ∗ ∗ N N ∗• ∗ � N � � N ∗ � N N N � ∗ �
• ∗ � ∗ ∗ ∗ ∗ N ∗ ∗ � ∗ ∗• ∗ ∗ ∗ ∗ ∗ ∗• � � � � � N � � � � � � � � � N � �
• ∗ N ∗
Rows: top-10 .NET namespaces, in terms of number of types.Middle block of columns: actual reuse by project of the corpus.Leftmost column: potential reuse in terms of specializability.Rightmost column: summary of actual reuse.
Figure 4.7. Infographics for an excerpt of a framework profile for .NET
.NET Project Repository LOC Description
3.5 Castle ActiveRecord GitHub 30,303 Object-relational mapper4.0 Castle Core Library GitHub 36,659 Core library for the Castle framework3.5 Castle MonoRail GitHub 58,121 MVC Web framework4.0 Castle Windsor GitHub 50,032 Inversion of control container4.0 Json.NET Codeplex 43,127 JSON framework2.0 log4net Sourceforge 27,799 Logging framework2.0 Lucene.Net Apache.org 158,519 Search engine4.0 Managed Extensibility Framework Codeplex 149,303 Framework for extensible applications and components4.0 Moq GoogleCode 17,430 Mocking library2.0 NAnt Sourceforge 56,529 Build tool3.5 NHibernate Sourceforge 330,374 Object-relational mapper3.5 NUnit Launchpad 85,439 Unit testing framework4.0 Patterns & Practices - Prism Codeplex 146,778 Library to build flexible WPF and Silverlight applications3.5 RhinoMocks GitHub 23,459 Mocking framework2.0 SharpZipLib Sourceforge 25,691 Compression library2.0 Spring.NET GitHub 183,772 Framework for enterprise applications2.0 xUnit.net Codeplex 23,366 Unit testing framework
Table 4.5. .NET projects in study’s corpus (versions as of 19 June 2011)
Research method
We applied an explorative approach such that a larger set of metrics of mainly struc-tural properties was incrementally screened until a smaller set of key metrics andderived classifiers emerged. We use infographics (such as Figure 4.7) to visualizemetrics, classifiers, and other characteristics of frameworks and projects that usethem. The resulting claims are subject to validation by domain experts for the frame-work under study.
Study subject
The subject of study consists of the Microsoft .NET Framework and a corpus ofopen-source .NET projects targeting different versions of .NET (2.0, 3.5, 4.0).

108 A Study of APIs
.NET (4.0) has 401 namespaces in total, but we group these namespaces reason-ably, based on the tree-like organization of their compound names. For instance, allnamespaces in the System.Web branch provide web-related functionality and can beviewed as a single namespace. In this manner, we obtained the manageable numberof 69 namespaces; see Table 4.6.8 In the rest of the chapter, we signify groupingby “*” as in System.Web.*. Grouping is often used in discussions of .NET—also byMicrosoft.9
Table 4.5 collects metadata about the corpus of the study. The following textsummarizes the requirements for the corpus and the process of its accumulation;more information is available from the supplementary website.
One requirement is that the corpus is made up from well-known, widely-usedand mature projects. We assume that such projects make good use of .NET.
Another requirement is that dynamic analysis must be feasible for the projectsof the corpus. This requirement implies practically that we need projects with goodavailable testsuites. The need for testsuites, in turn, implies practically that the cor-pus is made up from frameworks or libraries as opposed to, e.g., interactive tools.Admittedly, advanced test-data generation approaches could be used instead [181].
Yet another requirement is that the corpus is made up from open-source projectsso that our results are more easily reproducible. Also, the instrumentation for staticand dynamic analysis would be problematic for proprietary projects which usuallycommit to signed assemblies.
We searched CodePlex, SourceForge, GitHub, and Google Code applying therepository-provided ranking for popularity (preferably based on downloads). For thetopmost approx. 30 projects of each repository we checked all the requirements, andin this manner we identified a diverse set of projects as shown in Table 4.5. Theseprojects all use C# as implementation language. (In principle, our approach is pre-pared to deal with other .NET languages as well—since the analysis uses bytecodeengineering.)
4.3.2 Reuse-related Metrics for Frameworks
We consider the as-implemented design of a framework—without considering anyclient code (i.e., ‘projects’). We define reuse-related metrics for frameworks andscreen them for .NET. We explain the metrics specifically in the form as they areneeded for a composite framework (such as .NET) which consists of many compo-nent frameworks—to which we refer here as namespaces for better distinction. Weusually consider metrics per namespace. Some of the metrics are specific to .NET’stype system.
8 We also excluded some namespaces that are fully marked as obsolete and an auxiliarynamespace, XamlGeneratedNamespace, used only by the workflow designer tool.
9 http://msdn.microsoft.com/en-us/library/gg145045.aspx

4.3 .NET framework 109
Definition of metrics
The ‘overall potential for reuse’ is described by the following metrics:10 # Types—the number of (visible, say reusable) types declared by a namespace; # Methods—the number of (visible, say reusable) methods declared by a namespace.
The types (say, type declarations) of a namespace break down into percentagesas follows: % Interfaces, % Classes, % Value types, and % Delegate types. If anamespace has relatively few classes, then this may hint at intended, potential reusethat is different from classic, class-oriented OO programming. In the sequel, we referto classes and interfaces as OO types. Further, % Generic types denotes the percent-age of all types that are generic. Relatively many generic types hint at a frameworkfor generic programming. Further, the classes of a namespace break down into per-centages as follows; likewise for methods: % Static classes, % Abstract classes,and % Concrete classes.11 Clearly, abstract classes and methods hint at potentialreuse of the framework by specialization. Static classes hint at non-OO libraries andassociated, different forms of reuse.
There are metrics for ‘specializability and sealedness’ of namespaces: % Spe-cializable classes—the percentage of all classes that are either abstract or concretebut non-sealed, thereby excluding static and sealed classes; % Sealed classes—thepercentage of all concrete classes that are sealed (final). Sealing explicitly lim-its reuse by specialization. The aforementioned metrics can also be taken to themethod level. Further, we can incorporate interfaces into a metric for specializabil-ity: % Specializable types—the percentage of all OO types (i.e., all classes andinterfaces) that are either specializable classes or interfaces—the latter being all spe-cializable by definition. There are OO types that must be specialized before they canbe reused in client code; we refer to them as orphan types subject to the followingmetrics: % Orphan classes—the percentage of all abstract classes that are neverconcretely implemented within the framework; % Orphan interfaces—the percent-age of all interfaces that are never implemented within the framework; % Orphantypes—the percentage of all abstract classes and interfaces that are either orphanclasses or orphan interfaces.
‘Inter-namespace reuse’ is described by these metrics: # Referenced name-spaces—the number of namespaces that are referenced by a given namespace;# Referring namespaces—the number of namespaces that are referring to a given
10 In the case of .NET, non-private, non-internal types and methods are considered. Properties(in the .NET sense) are considered here as methods, which they are indeed at the byte-codelevel. All (visible) method declarations are counted separately. For instance, the initial dec-laration of a method as well as all overrides are counted separately. Overloads are countedseparately, too.
11 In .NET, value types include structs and enum types. Static classes are not considered con-crete classes; neither are they considered abstract classes—regardless of encoding in MSIL; they are counted separately here. A delegate type is essentially a method type; they arecounted separately here—regardless of the encoding in MS IL where delegate types derivefrom class System.Delegate.

110 A Study of APIs
namespace. Obviously, one can also define metrics for ‘inter-namespace specializa-tion’; this is omitted here.
The earlier breakdown of type declarations can be matched by a similar break-down of type references. In particular, type references due to method arguments giverise to % Interface arguments, % Class arguments, % Value type arguments,and % Delegate arguments. These metrics hint at certain forms of reuse. In par-ticular, interface arguments give rise to interface polymorphism whereas delegatearguments give rise to closure-based parametrization.
Finally, there are metrics that relate to the degree of ‘specialization within anamespace’: MAX size class tree and MAX size interface tree—the size of thelargest class or interface inheritance tree in terms of the node count only consideringnodes from the given namespace. (We view a class as a root of an inheritance tree inthe given namespace, if it derives from System.Object or a class in a different name-space; likewise for interfaces.) These are reuse-related metrics because, for example,they hint at polymorphism that can be leveraged for framework reuse in client code.
Measurements for .NET
Table 4.6 lists the various metrics for all the .NET namespaces while sorting name-spaces by # Types. We use an infographics such that most data is not displayed asnumbers, but distribution-based visualization is used instead: ‘blank’ for zero valuesand bullets of increasing size, i.e., ‘•’, ‘•’, ‘•’, ‘•’, for values in the percentage inter-vals (0,25), [25,50), [50,75), [75,100) of the distribution. For each column, the cell(s)corresponding to the maximum value for the column display(s) the value instead of‘•’. Medians as well as 25th and 75th percentiles for all columns are displayed atthe bottom of the table.

4.3 .NET framework 111
Namespace #Ty
pes
#M
etho
ds
MA
Xsi
zecl
ass
tree
MA
Xsi
zein
terf
ace
tree
#R
efer
ence
dna
mes
pace
s#
Ref
erri
ngna
mes
pace
s
%C
lass
es
%In
terf
aces
%V
alue
type
s
%D
eleg
ate
type
s
%G
ener
icty
pes
%C
lass
argu
men
ts%
Inte
rfac
ear
gum
ents
%V
alue
type
argu
men
ts
%D
eleg
ate
argu
men
ts
%Se
aled
clas
ses
%Sp
ecia
lizab
lecl
asse
s
%Sp
ecia
lizab
lety
pes
%O
rpha
ncl
asse
s
%O
rpha
nin
terf
aces
%O
rpha
nty
pes
System.Web.* 2327 29315 • • 43 • • • • • • • • • • • • • • •
System.Windows.* • • • 82 • • • • • • • • • • • • • • • • •
System.ServiceModel.* • • • • 43 • • • • • • • • • • • • • • •System.Windows.Forms.* • • • • • • • • • • • • • • • • • • • •
System.Data.* • • • • • • • • • • • • • • • • • • • • •System.Activities.* • • • • • • • • • • • • • • • • • • • • •System.ComponentModel.* • • • • • • • • • • • • • • • • • • • •System.Workflow.* • • • • • • • • • • • • • • • • • • • •System.Xml.* • • • • • • • • • • • • • • • • • • • •System.Net.* • • • • • • • • • • • • • • • • • • • •System.DirectoryServices.* • • • • • • • • • • • • • • • •System • • • • • 69 • • • • • • • • • • • • • • •
System.Security.Cryptography.* • • • • • • • • • • • • • • •Microsoft.VisualBasic.* • • 38 • • • • • • • • • • • 48 • • • • • •System.Runtime.InteropServices.* • • • • • • • • • • • • • • • • •Microsoft.JScript.* • • • • • • • • • • • • • • • • • •System.Drawing.* • • • • • • • • • • • • • • • • • • • •
System.Runtime.Remoting.* • • • • • • • • • • • 23 • • • • • • • •System.Configuration.* • • • • • • • • • • • • • • • • • • • •System.Diagnostics.* • • • • • • • • • • • • • • • • • • •System.IO.* • • • • • • • • • • • • • • • • • • • •
System.Reflection.* • • • • • • • • • • • • • • • • •
System.EnterpriseServices.* • • • • • • • • • • • • • • • •System.CodeDom.* • • • • • • • • • • • • • • • • •
System.IdentityModel.* • • • • • • • • • • • • • • • • • • •Microsoft.Build.* • • • • • • • • • • • • • • • • • •System.Management.* • • • • • • • • • • • • • • • • • • •
System.Threading.* • • • • • • • • • • • • • • • • • • • •
System.Runtime.Serialization.* • • • • • • • • • • • • • • • • • • •System.Security.AccessControl • • • • • • • • • • • • • • •
System.Security.Permissions • • • • • • • • • • • • 86 • •
System.Runtime.CompilerServices • • • • • • • • • • • • • • • • • • • •
System.Linq.* • • • • • • • • • • • 23 • • • • • • • •System.AddIn.* • • • • • • • • • • • • • • • • •System.Xaml.* • • • • • • • • • • • • • • • • • • •System.Messaging.* • • • • • • • • • • • • • • • • •Microsoft.Win32.* • • • • • • • • • • • • • • • • •System.Security.Policy • • • • • • • • • • • • • • • • •
System.Globalization • • • • • • • • • • • •Microsoft.VisualC.* • • • • • • • 100 • • • • 100 100 • •System.Transactions.* • • • • • • • • • • • • • • • • • 100 •System.Security • • • • • • • • • • • • • • •
System.Collections.Generic • • • • • • • • • • • • • • • • • •System.Runtime.DurableInstancing • • • • • • • • • • • • • • • • •
System.Collections • • • • • • • • • • • • • •System.Text • • • • • • • • • • • • • •System.Deployment.* • • • • • • • • • • • • • • •System.Runtime.Caching.* • • • • • • • • • • • • • • • • • 100 •System.ServiceProcess.* • • • • • • • • • • • •System.Resources.* • • • • • • • • • • • • • • •System.Dynamic • • • • • • • • 91 • • • • • 72 • 70System.Security.Principal • • • • • • • • • • • • • •Microsoft.SqlServer.Server • • • • • • • • • • • • • 100 •System.Security.Authentication.* • • • • • • • • • • • • • • •System.Collections.Specialized • • • • • • • • • • • • • • 100 100System.Device.Location • • • • • • • • • • • • • •System.Text.RegularExpressions • • • • • • • • • • • • 100 100 • •Accessibility • • • • • • 60 • • • • 100 100 • •System.Collections.Concurrent • • • • • • • • • • • • 100 100 • •System.Runtime.Versioning • • • • • • • • • • •
Microsoft.CSharp.* • • • • • • • • • • • •System.Collections.ObjectModel • • • • 100 100 • • • • 100 100 • •System.Runtime.ConstrainedExecution • • • • • • • • •
System.Runtime • • • • • • 100 • • •
System.Timers • • • • • 25 • • • • 100 100System.Media • • • • 100 • • • • • •
System.Runtime.Hosting • • • • 100 • • • • •
System.Runtime.ExceptionServices • • • 100 • • •
System.Numerics • • • • 100 • • •75% 190 1579 8 7 22 26 80 16 23 5 1 66 8 46 5 51 89 90 4 40 10Median 60 543 3 2 17 9 72 6 13 0 0 54 4 34 2 33 67 69 1 0 425% 18 175 0 0 11 3 60 0 6 0 0 37 1 19 0 10 46 50 0 0 0
Table 4.6. Infographics for reuse-related metrics for .NET
112 A Study of APIs
We total some measurements over all .NET namespaces:
# Types = 12611# OO types = 10103# Classes = 9215# Interfaces = 888# Specializable classes = 5750 (62.4 % of all classes)# Specializable types = 6638 (65.7 % of all OO types)
In accordance with our methodology we grew this set of metrics, and we used theinfographics of Table 4.6 and further views (available in Appendix A.2.2) to developintuitions about reuse-related characteristics of namespaces. The following classifi-cation only uses some of the metrics directly, but the other metrics are useful forunderstanding and validation.
4.3.3 Classification of Frameworks
In the following, we use the reuse-related metrics to define categories for reuse char-acteristics of frameworks—in fact, namespaces. See Figure 4.8 for the concise defi-nition of the categories. See Table 4.7 for the application of the classification to a few.NET namespaces that serve as representatives in this section. The section is finishedwith considerations of validation.
Derivation of the categories
Let us start with ‘inter-namespace reuse’. An application namespace is characterizedby the lack of other namespaces referring to it. That is, no reuse potential is realizedfor the given namespace within the composite framework. Instead of namespaceswith zero referring namespaces, we may also consider namespaces with the mostreferring namespaces. These are called core namespaces for obvious reasons.
As the medians and other percentiles at the bottom of Table 4.6 indicate, inter-namespace usage is very common for .NET. (The appendix of the online version evenshows substantial mutual dependencies.) There are these application namespaces.The System.AddIn.* namespace provides a generic framework for framework plug-ins in the sense of client frameworks on top of .NET. The Microsoft.VisualC.* name-space supports compilation and code generation for C++. The System.Device.Locationnamespace allows application developers to access the computer’s location. The Sys-tem.Runtime.ExceptionServices namespace supports advanced exception handlingfor applications.
Perhaps the most obvious representative of a core namespace is System.Collectionsas it provides collection types very much like a library for basic datatypes. Starting atthe top of Table 4.6, the largest core namespace is System.ComponentModel.* withits fundamental support for implementing the run-time and design-time behavior ofcomponents and controls. The next core namespace is System.Xml.* with variousAPIs for XML processing.
Let us consider ‘specializability’. We speak of an open namespace when thepercentage of specializable types is ‘exceptional’. We speak of a closed namespace

4.3 .NET framework 113
Namespace categories with regard to ‘inter-namespace reuse’:
• application if # Referring namespaces = 0.• core if # Referring namespaces is ‘exceptional’.
Namespace categories with regard to ‘specializability’:
• open if % Specializable types is ‘exceptional’.• closed if % Sealed classes is ‘exceptional’.• incomplete if % Orphan types is ‘exceptional’.
Namespace categories with regard to ‘class-inheritance trees’:
• branched if MAX size class tree is ‘exceptional’.• flat if MAX size class tree = 0.
Namespace categories with regard to ‘intensiveness’:
• interface-intensive if % Interface arguments is ‘exceptional’.• delegate-intensive if % Delegate arguments is ‘exceptional’.
A sub-category for delegate-intensive namespaces:
• event-based if % Delegate types is ‘exceptional’.
Occurrences of ‘exceptional’ are essentially configurable. We assume though that “x is ‘ex-ceptional’ for a namespace” proxies for the statement that the metric x for the given name-space is in the [75,100) percentage interval with regard to the distribution for metric x overall namespaces.
Figure 4.8. Definition of (non-mutually exclusive) categories
when the percentage of sealed classes is ‘exceptional’. It will be interesting to seewhether open namespaces are subject to ‘more’ specialization in projects than non-open (or even closed) namespaces. In any case, it is helpful to understand whichnamespaces come wide open and which namespaces limit specialization explicitly.In this context, another category emerges. We speak of an incomplete namespace,when the percentage of orphan types is ‘exceptional’.
Starting at the top of Table 4.6, the largest open namespace is System.Directory-Services.*; it models entities in a network (such as users and printers) and it supportscommon tasks (such as adding users and setting permissions). The next open name-space is System.CodeDom.*; it models an abstract syntax of .NET languages. Thesenamespaces provide rich inheritance hierarchies that are left open for specializationby other frameworks or client code. We mention that System.DirectoryServices.* isnot specialized within the .NET Framework itself while System.CodeDom.* is spe-cialized by several namespaces. Basic knowledge of .NET suggests that CodeDom isspecialized by namespaces that host ‘CodeDom providers’ and regular projects areactually not very likely to contain additional providers.
The largest closed namespace is System.Data.*; it supports data access and man-agement for diverse sources—relational databases specifically. One may expect this

114 A Study of APIs
Namespace App
licat
ion
Cor
eO
pen
Clo
sed
Inco
mpl
ete
Bra
nche
dFl
atIn
terf
ace-
inte
nsiv
eD
eleg
ate-
inte
nsiv
eE
vent
-bas
ed
System.Web.* X X XSystem.Data.* X XSystem.Activities.* X X XSystem.ComponentModel.* X X X X X XSystem.Xml.* XSystem.DirectoryServices.* X XSystem.EnterpriseServices.* X XSystem.CodeDom.* X XSystem.Linq.* X X XSystem.AddIn.* X X X X XMicrosoft.VisualC.* X X X X XSystem.Transactions.* X X X XSystem.Collections X X XSystem.Runtime.Caching.* X X XSystem.Device.Location X X X XSystem.Runtime.ExceptionServices X X
Table 4.7. Classification of selected .NET namespaces. Full list see in Appendix A.2.2
namespace to be open because of the need to define a rich provider interface for di-verse sources. However, many of the classes for data access and management do notdepend on the data source, and hence they are sealed. Also, various providers, suchas SQL Server, Oracle, ODBC, and OleDB, are included into the namespace andaccordingly sealed. The next closed namespace is System.Activities.*; it supports ab-stract syntax and presentation of activities in a workflow sense. One may expect thisnamespace to be open because of the common design to provide extensibility of syn-taxes by inheritance. However, the abstract syntax at hand is effectively constrainedto be non-extensible.
Orphan types are clearly very common in .NET; see again Table 4.6.12 The as-sumption is here that the orphan types model domain-/application-centric conceptsthat cannot be implemented in the framework. Let us review those incomplete .NETnamespaces with all their interfaces being orphans. The System.Transactions.* name-space supports transaction and resource management; it is referenced by several other
12 (Third-party) framework design guidelines for .NET [47] discourage orphan types; a frame-work designer is supposed to provide implementations (say, concrete classes) for all in-terfaces and abstract classes. Still orphan types exist in .NET—presumably because corre-sponding implementations would be illustrative rather than reusable and hence better suitedfor samples than for inclusion into the framework assemblies.

4.3 .NET framework 115
.NET namespaces—without though implementing any of its interfaces. The Sys-tem.Runtime.Caching.* namespace supports caching; this namespace is only usedin the System.Web.* namespace—without though implementing any of its interfaces.
Let us turn to categories related to ‘class-inheritance trees’. There are flat name-spaces without intra-namespace class inheritance. There are branched namespaceswith ‘exceptional’ inheritance trees. Flat namespaces may be thought of as providinga facade for (some of) the referenced namespaces in the broad sense of the designpattern of that name. Branched namespaces stand out with a complex object model—complex in terms of tree size.
Starting at the top of Table 4.6, the largest flat namespace is System.Enterprise-Services.*; it supports component programming with COM+. In particular, .NET ob-jects can be provided with access to resource and transaction management of COM+.One can indeed think of System.EnterpriseServices.* as a facade. There are manybranched namespaces at the top of Table 4.6; the bigger a namespace, the morelikely it contains some sizable tree among its forest of classes. We previously en-countered a ‘small’ branched namespace System.CodeDom.* with its object modelfor .NET-language abstract syntax.
Let us finally consider what we call ‘intensiveness’. An interface-intensivenamespace makes much use of interfaces for method arguments, thereby support-ing reusability in terms of interface polymorphism. (This may be seen as a symptomof interface-oriented programming.) There are also delegate-intensive namespaces,which make much use of delegates for method arguments. Basic knowledge of .NETtells us that delegates are used in .NET for two major programming styles. That is,delegates may be used for either functional (OO) programming or event-based sys-tems. These two styles cannot be separated easily—certainly not by means of simplemetrics. There is a specific form of an event-based namespace that reveals itselfthrough the delegate types that it declares.
A clearcut example of a namespace that is, in fact, both interface- and delegate-intensive is System.Linq.*; it supports functional (OO) programming specificallyfor collections based on the IEnumerable interface and friends. We note that Sys-tem.Linq.* does not declare any delegate type because the fundamental functiontypes are readily provided by the System namespace. There are several namespaceswith ‘exceptional’ percentages of both delegate arguments and delegate-type decla-rations, thereby suggesting themselves as candidates of the aforementioned, specificform of event-based namespaces; see, for example, System.Web.* right at the topof Table 4.6—the namespace provides web-related functionality and uses an event-based style, for example, to attach handlers to user-interface components.
Event-based programming does not necessarily involve designated delegate types.Standard delegate types for functions or designated interface types may be usedas well. For instance, the System.Device.Location namespace uses special interfacetypes to process updates to the device’s location. Hence, more advanced static anal-ysis would be needed to find evidence of event-based programming in the form of,for example, subscription protocols or state-based behavior. Further, a strict sep-aration between functional (OO) and event-based programming is not universallymeaningful. For instance, the use of asynchronous calls is arguably both functional
116 A Study of APIs
and event-based. This is an issue with classifying the System.Activities.* namespace,for example.
Validation of categories
We performed validation to check that the computationally assigned categories(based on Figure 4.8) match with the expectations of domain experts. We discussedeach assigned category in a manner that one researcher had to provide the confir-mative argument for a category, and another researcher had to confirm—both re-searchers (in fact, authors) being knowledgable in .NET.
In this process, we decided to focus on search for false positives and neglectsearch for false negatives on the grounds of the argument that the metrics-basedcategory definitions are designed to find ‘striking’ true positives only. Neverthe-less, we offer an example of a false negative for better understanding. The Sys-tem.Data.* namespace should arguably be classified as a delegate-intensive name-space. In fact, the namespace leverages functional (OO) programming in the waythat data providers are LINQ-enabled. However, the actual percentage of delegateusage does not meet the threshold of the category’s definition.
4.3.4 Comparison of Potential and Actual Reuse
We consider the as-implemented usage of a framework. Our main interest is to inferhow projects ‘typically’ use the framework. We define corresponding metrics andscreen them for .NET and the corpus of .NET projects of this study.
Definition of metrics
The metric % Referenced OO types denotes the percentage of all OO types of agiven namespace (or the entire framework) that are actually referenced (say, reused)in a given project (or the entire corpus). The following metrics are defined ‘relative’to the referenced OO types as opposed to all types.
In §4.3.2, we considered specializable types; the corresponding relative metricis % Specializable types (rel.)—the percentage of all referenced OO types that arespecializable. Likewise, the metric % Specialized types (rel.) denotes the percent-age of specializable, referenced types that were actually specialized in projects. Fi-nally, the metric % Late-bound types (rel.) denotes the percentage of specializable,referenced types that were actually bound late in projects. We say that a frameworktype is bound late in a project, if there is a method call with the framework type asstatic receiver type and a project type as runtime receiver type. (Clearly, said projecttype directly or indirectly specializes said framework type.)
Measurements for .NET
We summarize measurements for the corpus:

4.3 .NET framework 117
• 44 namespaces (out of 69) are referenced.• 22 namespaces are specialized.• 15 namespaces are bound late.• 925 classes (10.0 % of all classes) are referenced.• 105 interfaces (11.8 % of all interfaces) are referenced.• 173 types (2.6 % of all specializable types) are specialized:
– 107 classes (1.9 % of all specializable classes)– 66 interfaces (7.4 % of all interfaces)
· 30 interfaces are inherited.· 66 interfaces are implemented.13
• 611 static receiver types are exercised.• 142 types (2.1 % of all specializable types) are bound late:14
– 116 classes (2.0 % of all specializable classes)15
– 26 interfaces (2.9 % of all interfaces)
An infographics with details is shown in Table 4.8; the figure in the methodologysection was a sketch of this table. We order namespaces again by the number oftypes and we include only those ever referenced by the corpus.
The middle block of columns displays actual reuse for all combinations of name-space and project while using the following indicators: ‘–’ denotes infeasible reuse(in the sense that the namespace is not available for the framework version of theproject); ‘blank’ denotes no reuse; ‘∗’ or ‘∗’ denotes less or more referencing (with-out specialization); ‘N’ or ‘N’ denotes less or more specialization (without late bind-ing); ‘�’ or ‘�’ denotes less or more late binding. Here, ‘less or more’ refers to be-low versus above median non-zero percentages of referenced OO types, specializedtypes (rel.), and late-bound types (rel.). Hence, those cells show whether referenc-ing, specialization, and late binding happen at all, and if so, to what extent (at acoarse-grained level: less versus more).
The columns on the left summarize potential reuse for each namespace in termsof the metrics # Types and % Specializable types from Table 4.6.
The columns on the right summarize actual reuse in terms of a ‘dominator’ (i.e.,the dominating form of reuse) and the actual reuse metrics defined above. The domi-nator is determined as follows—without taking into account extent of reuse (‘less ormore’). If a namespace is not reused by more than half of all projects, then the dom-inator cell remains empty; see, e.g., System.CodeDom.*. Otherwise, if ‘referencing’is more frequent than ‘specialization’ and ‘late binding’ combined, then the domi-nator is ‘∗’; in the opposite case, the dominator is ‘N’ or ‘�’—whatever reuse formis more frequent. For instance, namespace System is used with late binding in mostprojects. Hence, actual reuse is summarized as ‘�’.13 Hence, all .NET interfaces serving as base type in interface inheritance in the corpus are
also implemented in the corpus.14 Our analysis cannot find all forms of late binding, since we observe late binding based
solely on the calls from client code to the framework, while it might also be the case thatthe framework calls into the client code through callbacks.
15 The number of types bound late may indeed be greater than the number of specializedtypes because late binding relates to static receiver types; one project type may have severalancestors in the framework.

118 A Study of APIs
Namespace #Ty
pes
%Sp
ecia
lizab
lety
pes
Act
iveR
ecor
d
Cas
tleC
ore
Mon
oRai
l
Win
dsor
Json
.NE
T
log4
net
ME
F
Moq
NA
nt
NH
iber
nate
NU
nit
Pris
m
Rhi
no.M
ocks
Spri
ng.N
ET
xUni
t
Shar
pZip
Lib
Luc
ene.
Net
Dom
inat
or%
Ref
eren
ced
OO
type
s
%Sp
ecia
lizab
lety
pes
(rel
.)
%Sp
ecia
lized
type
s(r
el.)
%L
ate-
boun
dty
pes
(rel
.)
Framework 3.5 4.0 3.5 4.0 4.0 2.0 4.0 4.0 2.0 3.5 3.5 4.0 3.5 2.0 2.0 2.0 2.0System.Web.* 2327 • N N N ∗ ∗ � • • • •System.Windows.* • • – – � – – – – • • • •System.ServiceModel.* • • – – N – – – – • • •System.Windows.Forms.* • • � N • • • •System.Data.* • • ∗ ∗ ∗ ∗ N N ∗ • • •System.ComponentModel.* • • ∗ � N � � N ∗ � N N N � ∗ � • • • •System.Xml.* • • ∗ � ∗ ∗ ∗ ∗ N ∗ ∗ � ∗ ∗ • • • •System.Net.* • • ∗ ∗ ∗ ∗ ∗ ∗ • •System • • � � � � � N � � � � � � � � � N � � • • • •System.Security.Cryptography.* • • ∗ N ∗ • • •System.Runtime.InteropServices.* • • ∗ ∗ ∗ ∗ ∗ ∗ ∗ ∗ ∗ ∗ ∗ ∗ ∗ ∗ ∗ ∗ ∗ • •
Microsoft.VisualBasic.* • • ∗ ∗ • •
System.Drawing.* • • ∗ ∗ ∗ • •
System.Runtime.Remoting.* • • ∗ ∗ ∗ ∗ ∗ � ∗ � ∗ N ∗ • • • •System.Configuration.* • • N ∗ N N N N N ∗ � N N ∗ N • • • •System.Diagnostics.* • • ∗ ∗ ∗ ∗ ∗ ∗ ∗ ∗ ∗ ∗ ∗ ∗ ∗ ∗ N ∗ ∗ • • •System.IO.* • • ∗ ∗ N ∗ ∗ � ∗ ∗ � ∗ � � ∗ ∗ ∗ � � ∗ • • • •System.Reflection.* • • ∗ ∗ ∗ ∗ ∗ ∗ ∗ ∗ ∗ ∗ ∗ ∗ ∗ ∗ ∗ ∗ ∗ ∗ • •
System.EnterpriseServices.* • • ∗ • •
System.CodeDom.* • • ∗ ∗ ∗ ∗ ∗ ∗ ∗ • •Microsoft.Build.* • • N ∗ • • •System.Threading.* • • ∗ ∗ ∗ ∗ ∗ ∗ ∗ ∗ ∗ ∗ ∗ ∗ ∗ N ∗ ∗ ∗ ∗ • • •System.Runtime.Serialization.* • • ∗ N ∗ N N N N ∗ N N ∗ ∗ ∗ N ∗ ∗ N N • • 75System.Security.Permissions • • ∗ ∗ ∗ ∗ ∗ ∗ ∗ ∗ ∗ ∗ ∗ ∗ ∗ •
System.Runtime.CompilerServices • • ∗ ∗ ∗ ∗ ∗ ∗ ∗ ∗ ∗ ∗ ∗ ∗ ∗ ∗ ∗ ∗ ∗ ∗ • •
System.Linq.* • • ∗ ∗ ∗ ∗ ∗ – ∗ � – � ∗ ∗ – – – – ∗ • • • •System.Messaging.* • • ∗ • 100Microsoft.Win32.* • • ∗ ∗ ∗ ∗ • •
System.Security.Policy • • ∗ ∗ ∗ ∗ ∗ •
System.Globalization • • ∗ ∗ ∗ ∗ ∗ ∗ ∗ ∗ ∗ ∗ ∗ ∗ ∗ ∗ ∗ ∗ ∗ • •
System.Transactions.* • • N ∗ ∗ • • •System.Security • • ∗ ∗ ∗ ∗ ∗ ∗ ∗ ∗ ∗ ∗ ∗ ∗ ∗ ∗ • •
System.Collections.Generic • • � � ∗ � � ∗ � N ∗ � � � � N � � � • • • •System.Text • • ∗ ∗ ∗ ∗ ∗ ∗ ∗ ∗ ∗ ∗ ∗ ∗ ∗ ∗ ∗ ∗ ∗ ∗ • •
System.Collections • • � N � N N � � N � � � N � � � N � � • • • •System.ServiceProcess.* • • ∗ • 100System.Resources.* • • ∗ ∗ ∗ ∗ ∗ ∗ ∗ ∗ � ∗ ∗ ∗ • • • •System.Security.Principal • • ∗ ∗ ∗ ∗ • 100System.Collections.Specialized • 100 N � � ∗ � ∗ ∗ N ∗ � ∗ � 86 100 • •System.Text.RegularExpressions • 100 ∗ ∗ ∗ ∗ ∗ ∗ ∗ ∗ ∗ ∗ ∗ ∗ ∗ ∗ ∗ • 100System.Runtime.Versioning • • ∗ ∗ ∗ ∗ ∗ ∗ •
System.Collections.ObjectModel • 100 � � � � � ∗ � � ∗ ∗ ∗ � � • 100 • 50Microsoft.CSharp.* • • ∗ ∗ ∗ • 100System.Timers • 100 ∗ ∗ • 100# Referenced types 137 301 245 229 277 229 201 174 375 374 437 213 135 604 308 113 193# Specialized types 16 39 28 26 27 20 18 13 26 39 31 29 10 73 19 11 26# Late bound types 6 7 9 10 11 3 6 4 10 12 20 11 8 22 5 2 8
75 % 235 89 33 92 33 8Median 80 73 20 75 6 025 % 36 54 12 50 0 0
Table 4.8. Infographics for comparing potential and actual reuse for .NET

4.4 Multi-dimensional Exploration 119
Discussion
The corpus misses several .NET namespaces totally—including all application name-spaces (see Table 4.7) and various namespaces related to user interfaces—the lattermost likely due to our methodology; see §4.3.1.
The online version determines correlations between various metrics. We stateone interesting correlation here: the percentage of referenced OO types is inverselycorrelated with the size of the namespace (in terms of the number of types). Hence,it may be possible to identify an ‘essential core’ for each of the largest namespaces.
Let us study the metrics by reviewing all those namespaces that are referenced butnot specialized by the corpus. There are 21 namespaces like this and they are all spe-cializable, in principle. Nine of these namespaces are in the upper half of the distribu-tion for % Specializable types. (See, for example, namespaces System.Globalizationand System.Text.RegularExpressions with ‘exceptional’ specializability.) The refer-enced OO types are only slightly less specializable. That is, eight namespaces arein the upper half of the distribution for % Specializable types (rel.). Thus, low (highresp.) specialization is not predicted by low (high resp.) specializability in any obvi-ous sense.
Most namespaces are actually referenced by enough projects to get assigned anactual reuse summary in the form of a dominator. This suggests that the projects ofthe corpus indeed share a ‘profile’ in an informal sense.
Let us compare potential reuse in terms of specializability with actual reusein terms of the dominator. There are eight namespaces with dominator ‘N’ or‘�’. Half of these namespaces contribute to the System.Collections.* hierarchy andthe associated specializability is ‘exceptional’. However, specializability is ‘non-exceptional’ for the remaining cases; specializability is, in fact, in the percent-age interval (0,25) for two cases; see namespaces System.Configuration.* and Sys-tem.Runtime.Serialization.*. This observation further confirms that high specializa-tion is not predicted by high specializability in any obvious sense.
4.4 Multi-dimensional Exploration
We have developed and applied various API usage analyses. In this section, we dis-cuss who and how can benefit from them.
We identify abstract exploration insights as they are expected by API developersand project developers with regard to their overall intention to understand API usage.These expected insights rely on multiple dimensions of exploration, e.g., hierarchicalorganization of scopes and project- versus API-centric perspectives. Existing meth-ods such as code completion and searching API documentation do not serve theseinsights.
We set up QUAATLAS (for QUALITAS API Atlas)—a Java-based corpus for API-usage analysis that builds on top of the existing QUALITAS corpus while revising itsubstantially such that fact extraction can be applied with the level of precision re-quired for API-usage analysis, while also adding metadata that supports exploration
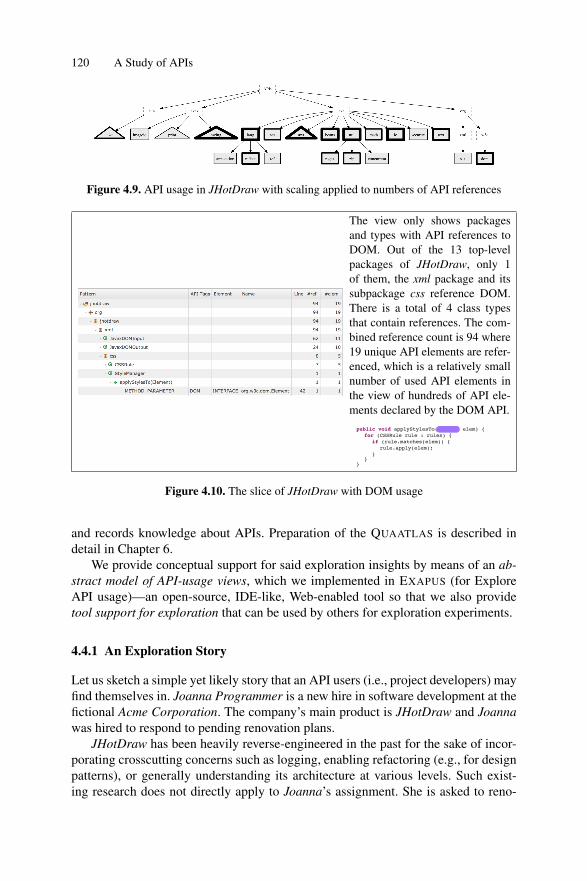
120 A Study of APIs
Figure 4.9. API usage in JHotDraw with scaling applied to numbers of API references
Slice of JHotDrawwith DOM usage
The view only shows packagesand types with API references toDOM. Out of the 13 top-levelpackages of JHotDraw, only 1of them, the xml package and itssubpackage css reference DOM.There is a total of 4 class typesthat contain references. The com-bined reference count is 94 where19 unique API elements are refer-enced, which is a relatively smallnumber of used API elements inthe view of hundreds of API ele-ments declared by the DOM API.
public void applyStylesTo(Element elem) {for (CSSRule rule : rules) {
if (rule.matches(elem)) {rule.apply(elem);
}}
}
Figure 4.10. The slice of JHotDraw with DOM usage
and records knowledge about APIs. Preparation of the QUAATLAS is described indetail in Chapter 6.
We provide conceptual support for said exploration insights by means of an ab-stract model of API-usage views, which we implemented in EXAPUS (for ExploreAPI usage)—an open-source, IDE-like, Web-enabled tool so that we also providetool support for exploration that can be used by others for exploration experiments.
4.4.1 An Exploration Story
Let us sketch a simple yet likely story that an API users (i.e., project developers) mayfind themselves in. Joanna Programmer is a new hire in software development at thefictional Acme Corporation. The company’s main product is JHotDraw and Joannawas hired to respond to pending renovation plans.
JHotDraw has been heavily reverse-engineered in the past for the sake of incor-porating crosscutting concerns such as logging, enabling refactoring (e.g., for designpatterns), or generally understanding its architecture at various levels. Such exist-ing research does not directly apply to Joanna’s assignment. She is asked to reno-

4.4 Multi-dimensional Exploration 121
vate JHotDraw to use JSON instead of XML; to replace native GUI programmingby HTML5 compliance. Further, an Android SDK-based version is needed as well.Joanna is not particularly familiar yet with JHotDraw, but she quickly realizes thatmuch of the challenge lies in the API usage of JHotDraw. This is when Joannaencounters EXAPUS.
Figure 4.11. Minuscule view for DOM usage in JHotDraw: with leaves for methods, eggs fortypes, and the remaining nodes for packages.
Fig. 4.9 summarizes API usage in JHotDraw as analyzed with EXAPUS. The treeview shows all APIs as they are known to EXAPUS and exercised by JHotDraw. Theheavier the border, the more usage. Rectangles proxy for APIs that are packages.Triangles proxy for APIs with a package subtree.
Let us focus on the requirement for replacing XML by JSON. In Fig. 4.9, twoXML APIs show up: DOM and SAX. Joanna begins with an exploration of DOMusage. Fig. 4.11 summarizes DOM usage in JHotDraw as analyzed with EXAPUS.Encouragingly, DOM’s footprint in JHotDraw only covers a few types and methods.
A logical option for continuation of exploration is to examine the distribution ofAPI usage across JHotDraw. In this manner, Joanna gets a sense of locality of APIusage. The corresponding view is shown in Fig. 4.10 and it strikingly reveals goodnews in so far that DOM usage is limited to the JHotDraw package org.jhotdraw.xml,which she shall explore further to prepare a possible XML-to-JSON migration.
4.4.2 Basic Concepts
We set up the basic concepts of this effort: APIs, API usage, and API-usage metrics.We also augment the basic notion of API with extra dimensions of abstraction—API domains and API facets—which are helpful in raising the level of abstraction inexploration.
APIs
We use the term API to refer to the actual interface but also to the underlying imple-mentation. We do not pay attention to any distinction between libraries and frame-works. We simply view an API as a set of types (classes, interfaces, etc.) referable by
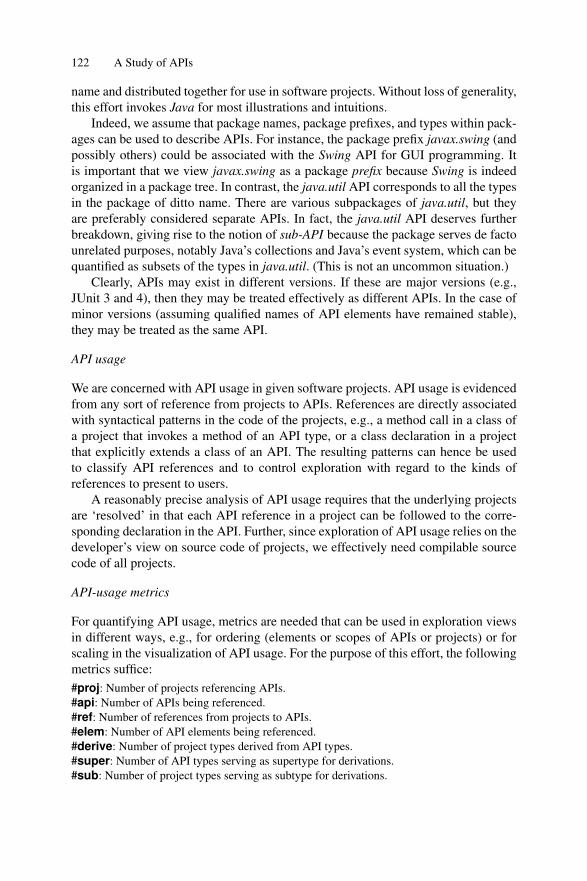
122 A Study of APIs
name and distributed together for use in software projects. Without loss of generality,this effort invokes Java for most illustrations and intuitions.
Indeed, we assume that package names, package prefixes, and types within pack-ages can be used to describe APIs. For instance, the package prefix javax.swing (andpossibly others) could be associated with the Swing API for GUI programming. Itis important that we view javax.swing as a package prefix because Swing is indeedorganized in a package tree. In contrast, the java.util API corresponds to all the typesin the package of ditto name. There are various subpackages of java.util, but theyare preferably considered separate APIs. In fact, the java.util API deserves furtherbreakdown, giving rise to the notion of sub-API because the package serves de factounrelated purposes, notably Java’s collections and Java’s event system, which can bequantified as subsets of the types in java.util. (This is not an uncommon situation.)
Clearly, APIs may exist in different versions. If these are major versions (e.g.,JUnit 3 and 4), then they may be treated effectively as different APIs. In the case ofminor versions (assuming qualified names of API elements have remained stable),they may be treated as the same API.
API usage
We are concerned with API usage in given software projects. API usage is evidencedfrom any sort of reference from projects to APIs. References are directly associatedwith syntactical patterns in the code of the projects, e.g., a method call in a class ofa project that invokes a method of an API type, or a class declaration in a projectthat explicitly extends a class of an API. The resulting patterns can hence be usedto classify API references and to control exploration with regard to the kinds ofreferences to present to users.
A reasonably precise analysis of API usage requires that the underlying projectsare ‘resolved’ in that each API reference in a project can be followed to the corre-sponding declaration in the API. Further, since exploration of API usage relies on thedeveloper’s view on source code of projects, we effectively need compilable sourcecode of all projects.
API-usage metrics
For quantifying API usage, metrics are needed that can be used in exploration viewsin different ways, e.g., for ordering (elements or scopes of APIs or projects) or forscaling in the visualization of API usage. For the purpose of this effort, the followingmetrics suffice:#proj: Number of projects referencing APIs.#api: Number of APIs being referenced.#ref: Number of references from projects to APIs.#elem: Number of API elements being referenced.#derive: Number of project types derived from API types.#super: Number of API types serving as supertype for derivations.#sub: Number of project types serving as subtype for derivations.

4.4 Multi-dimensional Exploration 123
These metrics can be applied, of course, to different selections of projects orAPIs as well as specific packages, types, or methods thereof. For instance, we maybe interested in #api for a specific project. Also, we may be interested in #ref forsome part of an API.
Further, these metrics can be configured to count only specific patterns. It is easyto see now that the given metrics are not even orthogonal because, for example,#derive can be obtained from #ref by only counting patterns for ‘extends’ and ‘im-plements’ relationships.
API domains
We assume that each API addresses some programming domain such as XML pro-cessing or GUI programming. We are not aware of any general, widely adopted at-tempt to associate APIs with domains, but the idea appears to merit further research.We have begun collecting programming domains (or in fact, API domains) and tag-ging APIs appropriately. Let us list a few API domains and associate them withwell-known Java APIs:GUI: GUI programming, e.g., Swing and AWT.XML: XML processing, e.g., DOM, JDOM, and SAX.Data: Data structures incl. containers, e.g., java.util.IO: File- and stream-based I/O, e.g., java.io and java.nio.Component: Component-oriented programming, e.g., JavaBeans.Meta: Meta-programming incl. reflection, e.g., java.lang.reflect.Basics: Basic language support, e.g., java.lang.String.
API domains are helpful in reporting API usage and quantifying API usage of in-terest in more abstract terms than the names of individual APIs, as will be illustratedin §4.4.3.
API facets
An API may contain dozens or hundreds of types each of which has many methodmembers in turn. Some APIs use subpackages to organize such API complexity,but those subpackages are typically concerned with advanced API usage whereas thecore facets of API usage are not distinguished in any operational manner. This makesit hard to understand API usage at a somewhat abstract level.
Accordingly, we propose leveraging a notion of API facets. Each API enjoys amanageable number of facets. In general, we may use arbitrary program analysesto attest use of a facet. We limit ourselves to a simple form of facets, which can beattested on the grounds of specific types or methods being used. Except for the notionof API usage patterns, we are not aware of any general, widely adopted attempt tobreak down APIs into facets, but the idea appears to merit further research. We havebegun identifying API facets and tagging APIs appropriately. As an illustration, webriefly characterize a few API facets of the typical DOM-like API such as DOMitself, JDOM, or dom4j:Input / Output: De-/serialization for DOM trees.Observation: Getter-like access and other ‘read only’ forms.

124 A Study of APIs
Figure 4.12. JDOM’s API Dispersion in QUAATLAS (project-centric table).
Addition: Addition of nodes et al. as part also of construction.Removal: Removal of nodes et al. as a form of mutation.Namespaces: XML namespace manipulation.Nontrivial XML: Use of CDATA, PI, and other XML idiosyncrasies.
We may also designate a facet to ‘Nontrivial API’ usage when it involves ad-vanced types and methods that are beyond normal API usage. For instance, XMLAPIs may provide some framework for node factories or adapters for API integra-tion. API facets are helpful in communicating API usage to the user at a more abstractlevel than the level of individual types and methods, as will be illustrated in §4.4.3.
4.4.3 Exploration Insights
Overall, developers need to understand API usage, when APIs relate to or affect theirdevelopment efforts such as a specific maintenance, migration, or integration task.We assume that an exploration effort can be decomposed into a series of primitiveexploration activities meant to increase understanding via some attainable insights.In this section, we present a catalogue of such expected, abstract insights.
Format of insight descriptions
We use the following format. The Intent paragraph summarizes the insight. TheStakeholder paragraph identifies whether the insight benefits the API developer, theproject developer, or both. The API usage paragraph quantifies API usage of interest,e.g., whether one API is considered or all APIs. The View paragraph describes, in ab-stract terms, how API-usage data is to be rendered. The Illustration paragraph appliesthe abstract insight concretely to APIs and projects of QUAATLAS. We use differentforms of illustrations: tables, trees, and tag clouds. The Intelligence paragraph hintsat the ‘operational’ intelligence supported by the insight.

4.4 Multi-dimensional Exploration 125
The API Dispersion insight
Intent – Understand an API’s dispersion in a corpus by comparing API usage acrossthe projects in the corpus.Stakeholder – API developer.API usage – One API.View – The listing of projects with associated API-usage metrics for quantitativecomparison and API facets for qualitative comparison.Illustration – Fig. 4.12 summarizes JDOM’s dispersion quantitatively in QUAAT-LAS. 6 projects in the corpus exercise JDOM. The projects are ordered by the #refmetric with the other metrics not aligning. Only 2 projects (jspwiki and velocity)exercise type derivation at the boundary of API and project.Intelligence – The insight is about the significance of API usage across corpus. Inthe figure, arguably, project jspwiki shows the most significant API usage becauseit references the most API elements. Project jmeter shows the least significant APIusage. Observation of significance helps an API developer in picking hard and easyprojects for compliance testing along API evolution—an easy one to get started; ahard one for a solid proof of concept. For instance, development of a wrapper-basedAPI re-implementation for API migration relies on suitable ‘test projects’ just likethat [22, 20].
The API Distribution insight
Intent – Understand API distribution across project scopes.Stakeholder – Project developer.API usage – One API.View – The hierarchical breakdown of the project scopes with associated API-usagemetrics for quantitative comparison and API facets for qualitative comparison.Illustration – Remember JHotDraw’s slice of DOM usage in Fig. 4.10 in §4.4.1.This view was suitable for efficient exploration of project scopes that directly dependDOM.Intelligence – The insight may help a developer to decide on the feasibility of an APImigration, as we discussed in §4.4.1.
The API Footprint insight
Intent – Understand what API elements are used in a corpus or varying projectscopes.Stakeholder – Project developer and API developer.API usage – One API.View – The listing of used API packages, types, and methods.Illustration – Remember the tree-based representation of the API footprint for JHot-Draw as shown in Fig. 4.11 in §4.4.1. In a similar manner, while using a table-basedrepresentation, Fig. 4.13 summarizes JDOM usage across QUAATLAS. All JDOMpackages are listed. The core package is heavily used and thus the listing is further

126 A Study of APIs
Figure 4.13. JDOM’s API Footprint in QUAATLAS (api-centric table).
refined to show details per API type. Ordering relies on the #ref metric. Clearly, thereis little usage of API elements outside the core package.Intelligence – Overall, the footprint describes the (smaller) ‘actual’ API that needs tobe understood as opposed to the full (‘official’) API. For instance, many APIs enablenontrivial, framework-like usage [4, 3], but in the absence of actual framework-likeusage, the project developer may entertain a much simpler view on the API. In thecontext of API evolution, an API developer consults an API’s footprint to minimizechanges that break actual usage or to make an impact analysis for changes. In the con-text of wrapper-based API re-implementation for API migration, an API developeror a project developer (who develops a project-specific wrapper) uses the footprintto limit the effort [22, 20].
The Sub-API Footprint insight
Intent – Understand usage of a sub-API in a corpus or project.
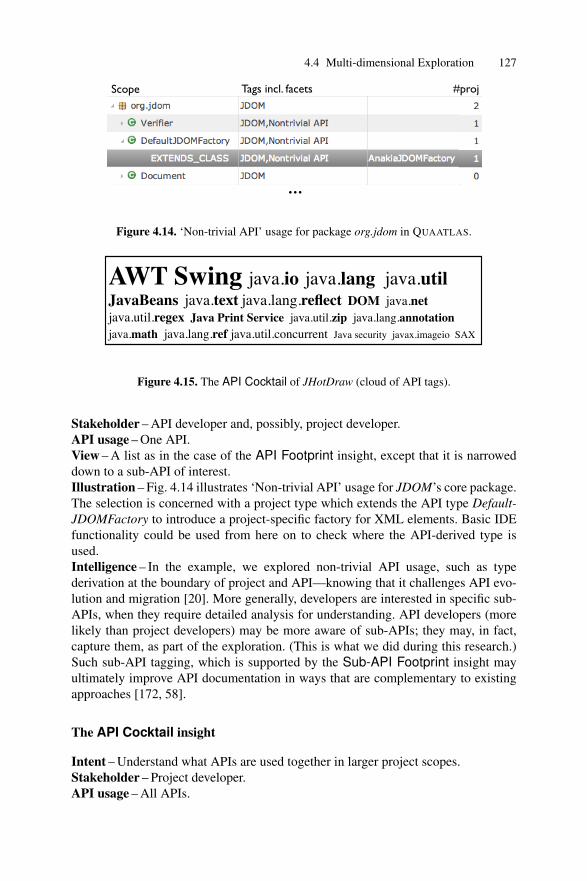
4.4 Multi-dimensional Exploration 127
Nontrivial JDOM API usage in velocityorg.apache.velocity.anakia.AnakiaJDOMFactory
Scope Tags incl. facets #proj
...
Figure 4.14. ‘Non-trivial API’ usage for package org.jdom in QUAATLAS.
Swing!!java.lang!!JavaBeans!!java.io!!AWT!!java.util
Package org.jhotdraw.undo
AWT!!Swing!!java.io java.lang java.util
JavaBeans java.text java.lang.reflect!!DOM!!java.net java.util.regex!!Java Print Service!!java.util.zip!!java.lang.annotation java.math java.lang.ref java.util.concurrent Java security!!javax.imageio!!SAX
JHotDraw’s API Cocktail
Figure 4.15. The API Cocktail of JHotDraw (cloud of API tags).
Stakeholder – API developer and, possibly, project developer.API usage – One API.View – A list as in the case of the API Footprint insight, except that it is narroweddown to a sub-API of interest.Illustration – Fig. 4.14 illustrates ‘Non-trivial API’ usage for JDOM’s core package.The selection is concerned with a project type which extends the API type Default-JDOMFactory to introduce a project-specific factory for XML elements. Basic IDEfunctionality could be used from here on to check where the API-derived type isused.Intelligence – In the example, we explored non-trivial API usage, such as typederivation at the boundary of project and API—knowing that it challenges API evo-lution and migration [20]. More generally, developers are interested in specific sub-APIs, when they require detailed analysis for understanding. API developers (morelikely than project developers) may be more aware of sub-APIs; they may, in fact,capture them, as part of the exploration. (This is what we did during this research.)Such sub-API tagging, which is supported by the Sub-API Footprint insight mayultimately improve API documentation in ways that are complementary to existingapproaches [172, 58].
The API Cocktail insight
Intent – Understand what APIs are used together in larger project scopes.Stakeholder – Project developer.API usage – All APIs.

128 A Study of APIs
GUI!!Data!!Basics!!IO!!Format!!Component!!Meta!!XML!!Distribution!!Parsing!!Control!!Math!!Output!!Security!!Concurrency
JHotDraw’s API Domain Cocktail
GUI!!Basics!!Component!!IO Package org.jhotdraw.undo
Project jhotdraw
Figure 4.16. Cocktail of domains for JHotDraw.
Basics!!Distribution!!GUI!!IO!!Component
java.lang!!java.net!!Swing!!JavaBeans!!java.io!!
APIs
API domains
Coupling in JHotDrawfor the interface org.jhotdraw.app.View
Figure 4.17. API Coupling for JHotDraw’s interface org.jhotdraw.app.View.
View – The listing of all APIs exercised in the project or a project package with API-usage metrics applied to the APIs.Illustration – Remember the tree-based representation of the API cocktail for JHot-Draw as shown in Fig. 4.9 in §4.4.1. The same cocktail of 20 APIs is shown as a tagcloud in Fig. 4.15. Scaling is based on the #ref metric.Intelligence – The cocktail lists and ranks APIs that are used in the correspondingproject scope. Thus, the cocktail proxies as a measurement for system complexity,required developer skills, and foreseeable design and implementation challenges.API usage is part of the software architecture, in the sense of “what makes it hardto change the software”. Chances are that API usage may cause some “software orAPI asbestos” [114]. While a large cocktail may be acceptable and unavoidable for acomplex project, the cocktail should be smaller for individual packages in the interestof a modularized, evolvable system.
APIs versus domains
We can always use API domains in place of APIs to raise the level of abstraction.Thus, any insight that compares APIs may as well be applied to API domains. APIsare concrete technologies while API domains are more abstract software concepts.Consider Fig. 4.16 for illustration. It shows API domains for all of JHotDraw andalso for its undo package. Thus, it presents the API cocktails of Fig. 4.15 in a moreabstract manner.

4.4 Multi-dimensional Exploration 129
Observation!!Input!!Exception!!Package de.nava.informa.parsers
Observation!!Input!!
Nontrivial XML!!Manipulation Exception!!Renaming
Addition Namespaces!!Nontrivial API!!Output!!
Project informa
JDOM’s API Profile for informa
Figure 4.18. JDOM’s API Profile in the informa project (cloud of facet tags).
The API Coupling insight
Intent – Understand what APIs or API domains are used together in smaller projectscopes.Stakeholder – Project developer.API usage – All APIs.View – See §4.4.3 except APIs or domains are listed for smaller project scopes.Illustration – Fig. 4.17 shows API Coupling for the interface org.jhotdraw.app.Viewfrom the JHotDraw’s app package16. According to the documentation, the package“defines a framework for document oriented applications and provides default imple-mentations”. The View type “paints a document on a JComponent within an Applica-tion”. (Application is the main type from the package which “handles the lifecycle ofviews and provides windows to present them on screen”.) The coupled use of APIscan be dissected in terms of the involved types as follows:java.lang: trivial usage of strings.java.net: types for the location to save the view.JavaBeans: de-/registration of PropertyChangeListeners.java.io: exception handling for reading/writing views.Swing: usage of JComponent on which to paint a document; usage of ActionMap for actionson the GUI component.
Intelligence – Simultaneous presence of several domains or APIs in a relatively smallproject scope may indicate accidental complexity and poor separation of concerns.Thus, such exploration may reveal a code smell [60, 149] that is worth addressing.Alternatively, a dissection, as performed for the illustrative example, may help inunderstanding the design and reasonable API dependencies.
The API Profile insight
Intent – Understand what API facets are used in varying project scopes.16 The lifecycle of the interface as explained by its documentation: http://www.randelshofer.ch/oop/jhotdraw/JavaDoc/org/jhotdraw/app/View.html

130 A Study of APIs
Stakeholder – Project developer and, possibly, API developer.API usage – One API with available facets.View – The listing of all API facets exercised in the selected project scope with API-usage metrics applied to the facets.Illustration – Fig. 4.18 shows JDOM profiles for a project and one of its packages.The project, as a whole, exercises most facets of the API. In contrast, the selectedpackage is more focused; it is concerned only with loading XML into memory, read-ing access by getters and friends, and some inevitable exception handling. There is noinvolvement of namespaces, non-trivial XML, or data access other than observation.Intelligence – At the level of a complete project, the profile reveals the API facetsthat the project depends on. As some of the facets are more idiosyncratic than others,such exploration may, in fact, reveal “software or API asbestos” [114], as discussedin §4.4.3. For instance, the JDOM facets ‘Non-trivial API’ and ‘Non-trivial XML’and to a lesser extent also ‘Namespaces’ proxy for development challenges or id-iosyncracies. At the level of smaller project scopes, an API’s profile may characterizean actual usage scenario, as in the case of the profile at the bottom of Fig. 4.18. Sucha facet-based approach to understanding API-usage scenarios complements existingmore code pattern-based approaches [98, 199]. API profiles also provide feedback toAPI developers with regard to ‘usage in the wild’, thereby guiding API evolution ordocumentation.
4.4.4 Exploration Views
Let us systematically conceptualize attainable views in abstract terms. In this man-ner, a more abstract model of exploration arises and a foundation for tool support isprovided.
We approach this task essentially as a data modeling problem in that we describethe structure behind views and the underlying facts. We use Haskell for data model-ing.17
Forests
We begin by modeling the (essential) facts about projects and APIs as well as APIusage. To this end, we think of two forests: one for all the projects in the corpus,another for all the APIs used in the corpus.
−− Forests as collections of named treesdata Forest = Forest [(UqName,PackageTree)]
17 Products are formed with “(...)”. Lists are formed with “[...]”. We use Haskell’s data typesto group alternatives (as in a sum); they are separated by ‘|’. Each alternative groups com-ponents (as in a product) and is labeled by a constructor name. Enums are degeneratedsums where the constructor name stands alone without any components. Other types maysuffice with type aliases on top of existing types.

4.4 Multi-dimensional Exploration 131
Each project or API gives rise to one tree (root) in the respective forest. Sucha tree breaks down recursively into package layers. If a package layer correspondsto an actual package, then it may also contain types. Types further break down intomembers. Thus:
−− Trees breaking down into packages, types, etc.data PackageTree = PackageTree [PackageLayer]data PackageLayer = PackageLayer UqName [PackageLayer] [Type]data Type = Type UqName [Member] [Ref]data Member = Member Element UqName [Type] [Ref]data Element = Interface | Class | InstanceMethod | StaticMethod | ...
−− Different kinds of namestype RName = QName −− qualified names within foreststype QName = [UqName] −− qualified names within treestype UqName = String −− unqualified names
In both forests, we associate types and members with API-usage references; seethe occurrences of Ref . Depending on the forest, the references may be ‘inbound’(from project to API) or ‘outbound’ and each reference may be classified by the(syntactic) pattern expressing it. Thus:
data Ref = Ref Direction Pattern Element RNamedata Direction = Outbound | Inbounddata Pattern = InstanceMethodCall | ExtendsClass | ...
The components of a reference carry different meanings depending on the chosendirection:
Outbound Inbound
Pattern Project pattern Project patternElement API element Project elementRName Name of API element Name of project element
The project forest is obtained by walking the primary representation of projectsand deriving the forest as a projection/abstraction at all levels. The API forest is ob-tained by a (non-trivial) transposition of the project forest to account for the project-specific jars and memory constraints on simultaneously open projects.
View descriptions
We continue with the descriptions of views. These are the executable models that areinterpreted on top of the forests of APIs and projects. Here is the overall structure ofthese descriptions:
type View = (Perspective , −− Project− versus API−centricApiSelection , −− APIs and parts thereof to considerProjectSelection , −− Projects and parts thereof to consider

132 A Study of APIs
Details , −− Details to retainMetrics ) −−Metrics to be applied
data Perspective = ApiCentric | ProjectCentric
The API-centric perspective uses the hierarchical organization of APIs (pack-ages, subpackages, types, members) as the organizational principle of a view. Like-wise, the project-centric perspective uses the hierarchical organization of projects asthe organizational principle of a view.
Selection of projects, APIs, or parts thereof is based on names of APIs andprojects as well as qualified names for the relevant scopes; we do not cover hereselection based on API domain tags and API facet tags, which would require only aroutine extension:
type ApiSelection = Selectiontype ProjectSelection = Selectiondata Selection= UniversalSelection −− Select entire forest| Selection [( UqName, Scope)] −− Select tree scopes
Scopes for selection are described as follows:
data Scope= RootScope −− Select entire tree| PrefixScope [UqName] −− Selection by package prefix| PackageScope [UqName] −− Selection by package name| TypeScope [UqName] −− Selection by type name| MethodScope [UqName] Signature −− Selection by method signature
type Signature = ... −− details omitted
We left out some forms, e.g., scopes for fields or nested types. However, all ofthe above forms have proven relevant in practice. For instance, we have used packagescopes and prefix scopes for API and API domain tagging respectively. Likewise, wehave used type scopes and method scopes for API facet tagging.
Each view description controls details for each selection:
type Details = ([ ProjectDetail ], −− Project elements to retain[ ApiDetail ] ) −− API elements to retain
type ProjectDetail = (Element, Usage)type ApiDetail = (Element, Usage)type Usage = Bool −−Whether to retain only elements with usage
(See above for type Element.) The selection of details is important for usability ofexploration views. For instance, Fig. 4.11 shows only API elements that are actuallyused to summarize an API foot print concisely. In contrast, Fig. 4.14 shows all APItypes to better understand what API types possibly could exercise the the chosen APIfacet.
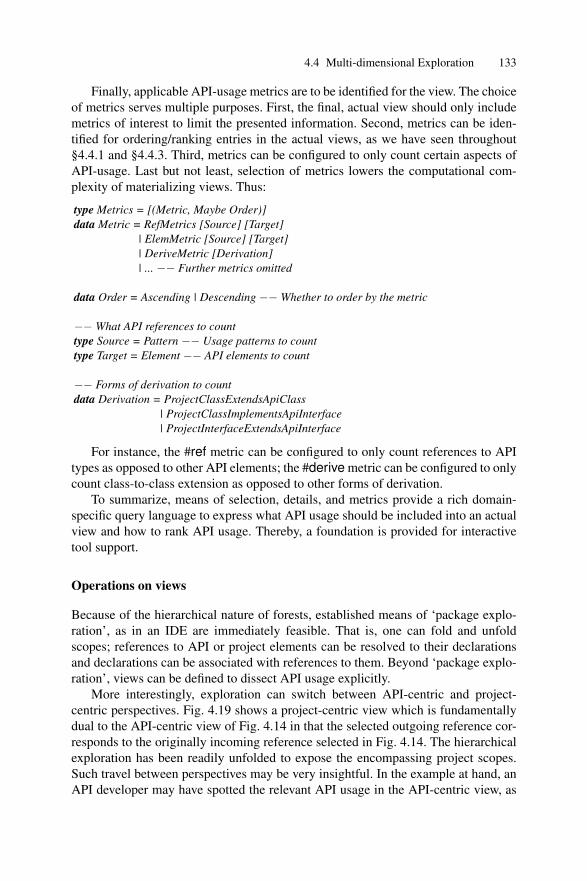
4.4 Multi-dimensional Exploration 133
Finally, applicable API-usage metrics are to be identified for the view. The choiceof metrics serves multiple purposes. First, the final, actual view should only includemetrics of interest to limit the presented information. Second, metrics can be iden-tified for ordering/ranking entries in the actual views, as we have seen throughout§4.4.1 and §4.4.3. Third, metrics can be configured to only count certain aspects ofAPI-usage. Last but not least, selection of metrics lowers the computational com-plexity of materializing views. Thus:
type Metrics = [(Metric, Maybe Order)]data Metric = RefMetrics [Source] [Target]
| ElemMetric [Source] [Target]| DeriveMetric [Derivation]| ... −− Further metrics omitted
data Order = Ascending | Descending −−Whether to order by the metric
−−What API references to counttype Source = Pattern −− Usage patterns to counttype Target = Element −− API elements to count
−− Forms of derivation to countdata Derivation = ProjectClassExtendsApiClass
| ProjectClassImplementsApiInterface| ProjectInterfaceExtendsApiInterface
For instance, the #ref metric can be configured to only count references to APItypes as opposed to other API elements; the #derive metric can be configured to onlycount class-to-class extension as opposed to other forms of derivation.
To summarize, means of selection, details, and metrics provide a rich domain-specific query language to express what API usage should be included into an actualview and how to rank API usage. Thereby, a foundation is provided for interactivetool support.
Operations on views
Because of the hierarchical nature of forests, established means of ‘package explo-ration’, as in an IDE are immediately feasible. That is, one can fold and unfoldscopes; references to API or project elements can be resolved to their declarationsand declarations can be associated with references to them. Beyond ‘package explo-ration’, views can be defined to dissect API usage explicitly.
More interestingly, exploration can switch between API-centric and project-centric perspectives. Fig. 4.19 shows a project-centric view which is fundamentallydual to the API-centric view of Fig. 4.14 in that the selected outgoing reference cor-responds to the originally incoming reference selected in Fig. 4.14. The hierarchicalexploration has been readily unfolded to expose the encompassing project scopes.Such travel between perspectives may be very insightful. In the example at hand, anAPI developer may have spotted the relevant API usage in the API-centric view, as

134 A Study of APIs
Nontrivial JDOM API usage in velocityorg.apache.velocity.anakia.AnakiaJDOMFactory
Figure 4.19. The dual view for Fig. 4.14 (project-centric table).
part of a systematic exploration of non-trivial API usage in the corpus. In an attemptto better understand the broader context of the API reference, the developer needs toconsult the project-centric view for the culprit. Such context switches are laboriouswhen only using basic means of package exploration are available.
4.4.5 The EXAPUS Exploration Platform
The EXAPUS web server processes all Java projects in the Eclipse workspace it ispointed to. Fact extraction proceeds through a recursive descent on the ASTs pro-duced by the Eclipse JDT. Whether an AST node of a project references an APImember is determined on a case-by-case basis. In general, identifiers are resolvedto their corresponding declaration. Identifiers that resolve to a binary rather than asource member are considered an API reference. Hence, we require the workspaceto have been prepared as described in Section 3.2.2. For each reference, EXAPUSextracts the referenced element (e.g., a method declaration), the referencing pattern(e.g., a super invocation) as well as the encompassing project scope in which thereference resides (i.e., a path towards the root of the AST).
Exploration views (cf. Section 4.4.4) are computed by selecting references fromthe resulting fact forest (e.g., only those to a particular sub-API) and superimposingone of either two hierarchical organizations: a project-centric hierarchy of projectmembers and the outbound references within their scope; or an API-centric hierarchyof API members and the inbound references within their scope.
The EXAPUS web interface enables exploring the computed exploration viewsthrough trees (e.g., Fig. 4.9) and tables (e.g., Fig. 4.10). An exploration view can be

4.5 Threats to Validity 135
refined further on the kind of the referenced elements (e.g., a particular type) andthe referencing pattern (e.g., constructor invocation), as well as sorted by a particularmetric. Multiple views can be shown simultaneously and navigated between. Theinterface owes its dynamic and IDE-like feel to the widgets of the Eclipse Rich AjaxPlatform.
4.5 Threats to Validity
There are several limitations to the performed API usage analyses.
External validity
We have analyzed a restricted set of projects. It means, the results of the studies mightnot be generalizable, though we consider the used corpora to be representative.
In the study of Java APIs, we restricted ourselves in at least three ways, namely,the source of picking the projects (SourceForge only), the version control system(SVN only) and the build tool (Apache Ant only). These choices were concessionsto the primary goal of the present research milestone: to prove the feasibility of large-scale, automated, resolved AST-based API-usage analysis.
In the study of .NET framework, on the contrary, we selected the projects of pre-sumably the best quality from several different online repositories. The requirementof sufficiently large test suits was induced by the chosen style of analysis—namely,dynamical analysis.
Internal validity
In both studies, we use homegrown tools, which are though tested and manuallyvalidated during the research, are still a subject to possible technical errors.
In the case of .NET, there are also more subtle threats, due to the modelunder-lying our research. First, while investigating potential and actual .NETreuse, we fo-cus on type specialization—even though frameworks might be alsoconfigured viaattributes (i.e., annotations) or XML files. This applies to a number of .NET name-spaces. Second, we observe late binding based solely on the calls from client code tothe framework, while it might also be the case thatthe framework calls into the clientcode through callbacks. Further, the analysis of late binding relies on the runtimedata gathered from the testsuite execution. Coverage of method-call sites is incom-plete; the tests do not cover 38.96 % of the method-call sites in the projects of thestudy.
In the study of Java APIs, we rely mostly on the results gained from the AST-based fact extractor gathered through a default build. This means, for example, thatwe miss sources that were not build in this manner. We also miss projects whosebuilds fail (and hence fact extraction is not completed).

136 A Study of APIs
4.6 Related Work
We identify several categories of related work.
Analysis of Open-source Repositories
Our work relates to other work on analyzing open-source repositories. For in-stance, there has been work on the analysis of download data, evolution data,metadata (e.g., development status), or user data (e.g., the number of active de-velopers), and simple metrics (e.g., LOC) for open source projects (e.g., on Source-Forge) [95, 126, 83, 192]. In this context, we also refer to the project FLOSSmolehttp://flossmole.org/ and the project FOSSology [77]. Usually, such large-scale efforts do not involve dynamic analysis, which we use in our studies. For in-stance, in [82], the adoption of design patterns is studied in open-source software, butdocumentation (commit messages) as opposed to parse trees are analyzed. In [125],a very large-scale code clone analysis is performed.
API-usage Analysis
There are efforts that we would like to collectively label with API-usage analysis.The kinds of analysis in such related work are different from those considered in thepresent effort.
One important direction is concerned with the analysis of API usage patterns.In [137], data mining is used to determine API reuse patterns, and more specificallyclasses and methods that are typically used in combination. We also refer to [130]for a related approach. In [102], data mining is used, too, to determine frequentlyappearing ordered sets of function-call usages, taking into account their proximalcontrol constructs (e.g., if-statements). In [196], data mining is used, too, to com-pute lists of frequent API usage patterns based on results returned from code-searchengines; the underlying code does not need to be compilable. In [122], a machinelearning-based approach is used to infer protocol specifications for API; see [191]for a related approach. In [10], inter-procedural, control-flow-sensitive static tracesfor C programs are used to mine API-usage patterns as partial orders from sourcecode.
The closest related work to the study of Java APIs is [180]: API hotspots andcoldspots (say, frequently or rarely used classes and methods) are determined. Thiswork is again based on the analysis of data obtained from a code-search engine.Such frequency analysis can be compared to our efforts on coverage analysis (c.f.,Sect. 4.2.3)—except that we are using resolved ASTs. Also, we are specifically in-terested in the large-scale, cumulative coverage. Further, we are interested in in-terpreting analysis results in terms of API characteristics, and with a view on APImigration.
The closest related work to the study of .NET framework is [35, 158] insofar asalignment of static and dynamic receiver types is concerned. In particular, the work

4.6 Related Work 137
of [35] deals with the dynamic measurement of polymorphism in Java and inter-prets it from a reuse-oriented point of view. Bytecode is instrumented and runtimereceiver types are determined by accessing the virtual machine’s stack—similar toour approach. This work is not focused though on reuse of a composite framework.
Type Specialization
In both studies (in the case of Java APIs we have identified the direction, and in thestudy of .NET framework we have advanced it), we pay attention to type specializa-tion, including class and interface inheritance, interface implementation, overriding.Related work that studies related metrics does so without the objective of summariz-ing reuse characteristics at a high of level of abstraction. The work of [38] studiesstructural metrics of Java bytecode; some reuse-related measurements are covered,too, e.g., the number of types that inherit from external framework types, or themost implemented external interfaces. The work of [177, 176] focuses on metrics forinheritance and overriding for Java, and it shows, for example, that programmers ex-tend user-defined types more often than external library or framework types. In thoseworks, depth of inheritance trees is considered relevant whereas our metrics-basedapproach favored size of inheritance trees since we are interested in the number oftypes participating in specialization. The work of [162] analyzes instantiations offrameworks (Eclipse UI, JHotDraw, Struts), though for a purpose of detecting usagechanges in the course of framework evolution. None of the aforementioned effortsinvolve dynamic analysis.
Software Metrics
We define and apply metrics for exploring reuse characteristics and the alignmentbetween potential and actual reuse. Elsewhere, metrics are typically used to under-stand maintainability [48] or quality of the code and design [131, 182, 185]. Thereis also a trend to analyze the distribution characteristics for metrics and the correla-tion between different metrics [39, 25]. In the context of OO programming, work onmetrics typically focuses on Java; the work of [123] targets .NET with a few basicmetrics without focus on reuse.
Exploration of Projects
There are several conceptual styles of project comprehension. An example of in-teractive, human-involving effort can be found in work of Brühlmann et al. [33],where experts annotate project parts to capture human knowledge. They further usethe emerged meta-model to analyze features, architecture, and design flaws of theproject.
Query-driven comprehension can proceed through user-defined queries that iden-tify code of interest, as in the work of Mens and Kellens [135] or De Roover etal. [53], where a comprehensive tool suite facilitates defining and exploring query

138 A Study of APIs
results. Alwis and Murphy in their work [51] identify and investigate pre-definedqueries for exploration of a software system, e.g., “What calls this method.”
Visual summary of projects usually involves some sort of scaling, color coding,and hierarchical grouping, as discussed by Lanza and Ducasse [121]. Visualizationscan be more involved, as in the work of Wettel et al. [193], where a a city metaphoris used to represent a 3D structure of projects based on the value of metrics.
Our tool, EXAPUS, combines these conceptual styles. We allow the user to accu-mulate and refine knowledge about APIs, their facets, and domains. The explorationactivities explained in the paper are intuitive; flexibility in their combination en-ables answering the typical questions like identified by Alwis and Murphy [51]. Tagclouds, tables, and trees accompanied by metrics provide basic and familiar visualaid in exploration.
Exploration of APIs
Measuring usage
Research on API usage often leverages usage frequency, or popularity, of APIs andtheir parts. For instance, Mileva et al. use popularity to identify most commonly usedlibrary versions [138] or to identify and predict API usage trends over time [139].Holmes et al. appeal to popularity as the main indicator: for the API developer, tobe able to prioritize efforts and be informed about consumption of libraries; for theAPI user, to be able to identify libraries of interest and be informed of ways of theirusage [91]. Eisenberg et al. use font scaling w.r.t. popularity of API elements tohelp navigate through its structure [58, 59]. Ma et al. investigate coverage of JavaStandard API to identify which parts are ignored by the API users [128]. In ourwork, we suggest more advanced metrics indicating API usage; their distribution isintegrated in the table and graph views of our tool, providing sorting and scaling.
Understanding usage
Robillard and DeLine discovered in their field study on API learning obstacles thatAPI users prefer to learn from patterns of related calls rather than illustrations of indi-vidual methods [156]. And, indeed, many existing efforts are exercising informationabout API usage to help developers use APIs. E.g., Nasehi and Maurer show that APIunits tests can be used as usage examples [146]. Zhong et al. cluster API calls andmine patterns to recommend useful code snippets to API users [199]. Bruch et al.develop intelligent code completion that narrows down the possible suggestions tothose API elements that are actually relevant [32]. Our tool, EXAPUS, differs in thatit enables navigating both projects and APIs in the familiar IDE-like manner withAPI usage in focus. We also identify a catalogue of possible exploration activities toperform.

4.7 Conclusion 139
4.7 Conclusion
We have performed an exploratory study of API usage, assessing the aspects of APIusage in two different ways: from the point of view of a software language and fromthe point of view of reuse characteristics.
In the study on Java APIs, we have demonstrated a scalable approach to AST-based API-usage analysis for a large-scale corpus of open-source projects. Our im-plementation allows us to answer questions about usage of many well-known JavaAPIs. We have demonstrated this capability, for example, with specific aspects ofXML programming APIs and generic aspects of framework-like API usage.
In the study of .NET framework, we presented a new approach to understand-ing reuse characteristics of composite frameworks. We applied the approach in anempirical study to .NET and a suitable corpus of .NET projects. The reuse charac-teristics include metrics of potential reuse (such as the percentage of specializabletypes), categories related to reuse (such as open or closed namespaces), and metricsof actual reuse (such as the percentage of specialized types). These metrics and theclassification add up to what we call a framework profile. Infographics can be usedto provide different views on framework profiles.
We summarized the developed intuitions into a catalogue of exploratory activi-ties. We described these insights along with the abstract model of API views, iden-tifying the possible exploratory scenarios and involved stakeholders. We have builtthe tool, EXAPUS, enabling the mentioned explorations.


Part III
Corpus Engineering


5
Literature Survey of Empirical Software Engineering
In this chapter, we describe literature surveys that we carry out in order to under-stand the existing usage of empirical evidence in Software Engineering. We collectand analyze published papers, extracting signs and characteristics of used empiricalevidence. We discover that more than 80% of papers in Software Engineering re-search use software projects as empirical evidence. The discovered existing demandin the contemporary research motivates our subsequent effort (presented in the nextchapter) to provide matching supply in our area of expertise.
Road-map of the chapter
• Section 5.1 provides brief motivation for the study.• Section 5.2 describes the two preceding pilot surveys.• Section 5.3 contains methodology and results of the main survey.• Section 5.4 discusses threats to validity for this empirical study.• Section 5.5 discusses related work.• Section 5.6 concludes the chapter.
Reproducibility
We provide additional data (lists of used papers, results of the coding, etc.) on thesupplementary websites1,2.
Related publications
Research presented in this chapter underwent the peer-reviewing procedure and waspublished in the proceedings of International Conference on Software Language En-gineering in 2011 [2]. The main part of the chapter (the final survey) is the workunder submission [7].
1 http://toknow.sourceforge.net/2 http://softlang.uni-koblenz.de/empsurvey/

144 Literature Survey of Empirical Software Engineering
5.1 Introduction
Empirical research is usually perceived as taking one of the established forms withwell-defined protocol of the study and applied techniques: controlled and quasi-experiments, exploratory and confirmatory case studies, survey, ethnography, andaction research [167, 170]. In a broader sense that we consider in our thesis, empir-ical research includes any research based on collected evidence (quoted from [167],emphasis ours): “Empirical research seeks to explore, describe, predict, and explainnatural, social, or cognitive phenomena by using evidence based on observation orexperience. It involves obtaining and interpreting evidence by, e.g., experimentation,systematic observation, interviews or surveys, or by the careful examination of doc-uments or artifacts.”
And, indeed, Software Engineering research often needs corpora (sets of project-s/systems) to test a hypothesis, to validate a tool, or to illustrate an approach. Soft-ware corpora have been, for instance, used to evaluate tools for design pattern detec-tion [65], API method recommendation [87], and refactoring automation [141]—justto mention a few areas and papers.
In general, since Software Engineering is a practical area, it is logical to expectthat most of the SE research is evidence-based, i.e., empirical de facto, and in thepresent effort, we submit to show that. We believe that a bottom-up approach ofdefining forms of research as well as discovering methodology by observing existingresearch complements the prominent top-down approach, when a methodology is de-rived from theoretical considerations or by borrowing from other sciences (medicine,sociology, psychology).
To this end, we are interested in harvesting information from the published papersin the Software Engineering area, driven by the general question
What is the nature of empirical evidence used in Software Engineering?
Our intention is to detect and assess the existing demand in corpora in the contem-porary research. We refine our question through two pilots studies to the followingquestions:
I How often do Software Engineering papers use corpora—collections of empir-ical evidence?
II What is the nature and characteristics of the used corpora?III Does common contents occur in the used corpora?
After a literature survey of the contemporary Software Engineering research, weprovide answers to these questions by developing and applying a coding scheme tothe collected papers.
5.2 Pilot Studies
In this section, we describe the two pilot studies which helped us to explore availablemethods of literature surveys as well as the topic of our interest, the usage of empiri-cal evidence in Software Engineering. (For the brief account of considered methods,
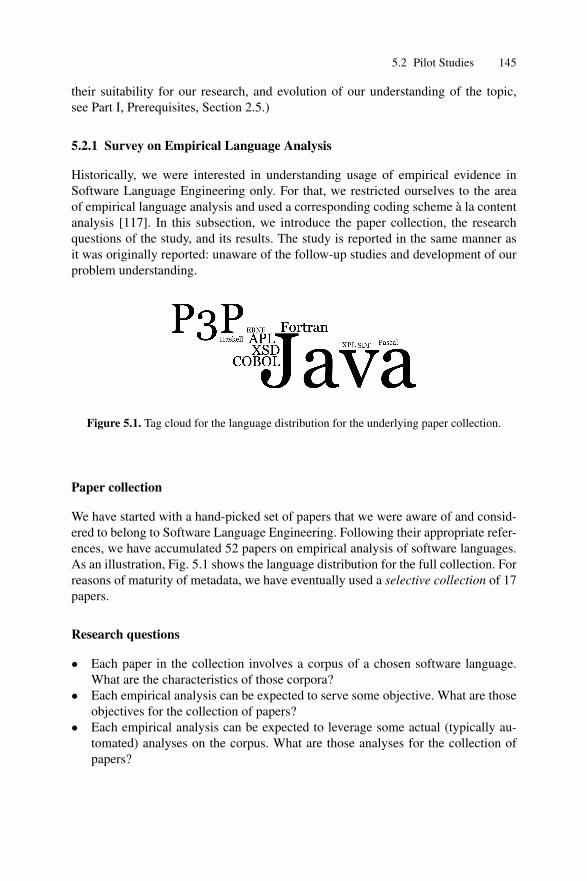
5.2 Pilot Studies 145
their suitability for our research, and evolution of our understanding of the topic,see Part I, Prerequisites, Section 2.5.)
5.2.1 Survey on Empirical Language Analysis
Historically, we were interested in understanding usage of empirical evidence inSoftware Language Engineering only. For that, we restricted ourselves to the areaof empirical language analysis and used a corresponding coding scheme à la contentanalysis [117]. In this subsection, we introduce the paper collection, the researchquestions of the study, and its results. The study is reported in the same manner asit was originally reported: unaware of the follow-up studies and development of ourproblem understanding.
Figure 5.1. Tag cloud for the language distribution for the underlying paper collection.
Paper collection
We have started with a hand-picked set of papers that we were aware of and consid-ered to belong to Software Language Engineering. Following their appropriate refer-ences, we have accumulated 52 papers on empirical analysis of software languages.As an illustration, Fig. 5.1 shows the language distribution for the full collection. Forreasons of maturity of metadata, we have eventually used a selective collection of 17papers.
Research questions
• Each paper in the collection involves a corpus of a chosen software language.What are the characteristics of those corpora?
• Each empirical analysis can be expected to serve some objective. What are thoseobjectives for the collection of papers?
• Each empirical analysis can be expected to leverage some actual (typically au-tomated) analyses on the corpus. What are those analyses for the collection ofpapers?

146 Literature Survey of Empirical Software Engineering
Terminology
In this first pilot study, we were exploring the terminology and used the followingdefinitions. The term (software) corpus refers to a collection of items that are ex-pressed in the language at hand. (These items may be valid or invalid elements of thelanguage in a formal sense.) Items originate from possibly several sources. The termsource refers to different kinds of physical or virtual sources that contribute items.For instance, a corpus may leverage an open-source repository as a source to makeavailable, or to retrieve the items—based on an appropriate search strategy. A papermay provide a corpus description that identifies sources and explains the derivationof the actual corpus (say, item set) from the sources.
Corpus characteristics
Fig. 5.2 provides metadata that we inferred for the corpora of the selective papercollection.3 We capture the following characteristics of the software corpora: thesoftware language of the corpus, numbers of sources and items (with a suitable unit),the online accessibility of the sources (on a scale of none, partial, and full), and thereproducibility of the corpus (on a scale of none, approximate, precise, and trivial).We say that reproducibility is trivial, if the corpus is available online—in one piece;reproducibility is precise, if the sources and the corpus description suffice to repro-duce the corpus precisely by essentially executing the corpus description. Otherwise,we apply a judgment call, and use the tags approximate or none. For instance, theinability to reproduce a ranking list of a past web search may be compensated forby a new web search, and hence, reproducibility can be retained at an approximatelevel. In future work, we would like to go beyond the characteristics that we havesketched here.
Objectives of the papers
Based on our analysis of the paper collection, we propose the following list of ob-jectives for empirical language analysis; see Fig. 5.3 for corresponding metadata forthe selective paper collection.
Language adoption
The objective is to determine whether the language is used, and with what frequency.Typically, some scope applies. For instance, we may limit the scope geographically,or on the time-line.
Language habits
The objective is to understand the usage of the language in terms of syntacticallyor semantically defined terms. For instance, we may study the coverage of the lan-guage’s diverse constructs, or any other, well-defined metrics for that matter. Thisobjective may be addressed with substantial measurements and statistical analysis.
3 A cell with content “?” means that the relevant data could not be determined.

5.2 Pilot Studies 147
language sources items unit accessibility reproducibility
[16] SDF 8 27 grammars partial approximate[24] Java 17 56 projects full precise[34] COBOL 1 50 programs none none[37] Java 1 1132 JAR files full approximate[40] Pascal 1 264 programs none none[44] P3P 3 ? policies full approximate[71] Java 4 14 projects full precise[81] Haskell 1 68000 compilations none approximate[82] Java 1 988 projects full approximate[85] Java ? 9 packages full approximate
[108] Java 2 2 programs full approximate[115] Fortran 7 440 programs none none[120] XSD 2 63 schemas partial none
[1] P3P 1 3227 policies full trivial[154] P3P 1 2287 policies full approximate[160] APL 6 32 workspaces none none[187] XSD 9 9 schemas full approximate
Figure 5.2. Corpus characteristics for selective paper collection
Language taming
The objective is to impose extra structure on language usage so that habits can becategorized in new ways. For instance, we may equip the language with patterns ormetrics that are newly introduced or adopted from other languages. In some cases,the empirical effort towards addressing the objective of language taming may alsoqualify as effort that attests to the objective of language habits.
User feedback
The objective is to compile data of any kind that helps the language user to betterunderstand or improve programs. For instance, we may carry out an analysis to sup-port the proposal of a new pattern that should help with using the language moreeffectively. This objective could be seen as a more specific kind of language taming.
Language evolution
The objective is to gather input for design work on the next version of the language.For instance, we may try to detect indications for missing constructs. Or detect ob-solete language features that could be deprecated in the future versions.
User behavior
The objective is to understand the usage of the language and its tools in a way thatinvolves users or user experiences directly—thereby going beyond the narrow notion
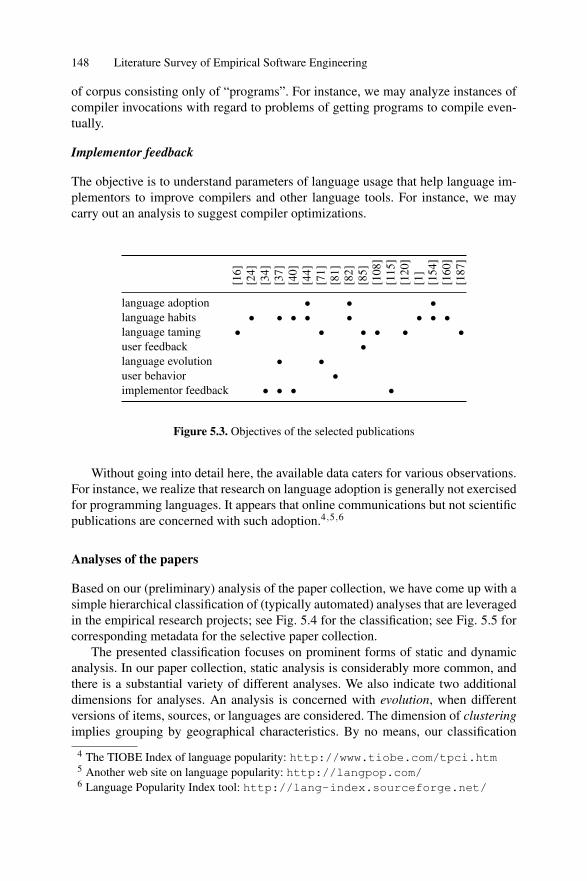
148 Literature Survey of Empirical Software Engineering
of corpus consisting only of “programs”. For instance, we may analyze instances ofcompiler invocations with regard to problems of getting programs to compile even-tually.
Implementor feedback
The objective is to understand parameters of language usage that help language im-plementors to improve compilers and other language tools. For instance, we maycarry out an analysis to suggest compiler optimizations.
[16]
[24]
[34]
[37]
[40]
[44]
[71]
[81]
[82]
[85]
[108
][1
15]
[120
][1
][1
54]
[160
][1
87]
language adoption • • •language habits • • • • • • • •language taming • • • • • •user feedback •language evolution • •user behavior •implementor feedback • • • •
Figure 5.3. Objectives of the selected publications
Without going into detail here, the available data caters for various observations.For instance, we realize that research on language adoption is generally not exercisedfor programming languages. It appears that online communications but not scientificpublications are concerned with such adoption.4,5,6
Analyses of the papers
Based on our (preliminary) analysis of the paper collection, we have come up with asimple hierarchical classification of (typically automated) analyses that are leveragedin the empirical research projects; see Fig. 5.4 for the classification; see Fig. 5.5 forcorresponding metadata for the selective paper collection.
The presented classification focuses on prominent forms of static and dynamicanalysis. In our paper collection, static analysis is considerably more common, andthere is a substantial variety of different analyses. We also indicate two additionaldimensions for analyses. An analysis is concerned with evolution, when differentversions of items, sources, or languages are considered. The dimension of clusteringimplies grouping by geographical characteristics. By no means, our classification
4 The TIOBE Index of language popularity: http://www.tiobe.com/tpci.htm5 Another web site on language popularity: http://langpop.com/6 Language Popularity Index tool: http://lang-index.sourceforge.net/

5.2 Pilot Studies 149
Static analysis Source code or other static entities are analyzed.Validity The validity of items in terms of syntax or type system is analyzed.Metrics Metrics are analyzed.
Size The size of items is analyzed, e.g., in terms of lines of code.Complexity The complexity of items is analyzed, e.g., the McCabe complexity.Structural properties Example: the depth of inheritance hierarchy in OO
programs.Coverage The coverage of language constructs is analyzed.Styles The usage of coding styles is analyzed.Patterns The usage of patterns, e.g., design patterns, is analyzed.Cloning Cloning across items of the corpus is analyzed.Bugs The items are analyzed w.r.t. bugs that go beyond syntax and type errors.
Dynamic analysis Actual program runs are analyzed.Profiles Execution frequencies of methods, for example, are analyzed.Traces Execution traces of method calls, for example, are analyzed.
Dimensions of analysis Orthogonal dimensions applicable to analyses.Evolution An analysis is carried out comparatively for multiple versions.Clustering The corpus is clustered by metadata such as country, team size, or others.
Figure 5.4. Classification of analyses
[16]
[24]
[34]
[37]
[40]
[44]
[71]
[81]
[82]
[85]
[108
][1
15]
[120
][1
][1
54]
[160
][1
87]
validity • • • •metrics • • • • • • • • • • •coverage • • • • • • • • •styles • • • • •patterns • •cloning • •bugs • • •profiles • • •tracesevolution • • •clustering • • •
Figure 5.5. Analyses of the selected publications
scheme is complete. For instance, we currently miss characteristics regarding dataanalysis (e.g., in terms of the involved statistical methods), and the presentation ofresearch results (e.g., in terms of the leveraged tables, charts, etc.).
5.2.2 Survey on Corpora Usage
During the first pilot study, we have realized that focusing only on Software Lan-guage Engineering is an unnecessary restriction, that the usage of empirical evidence
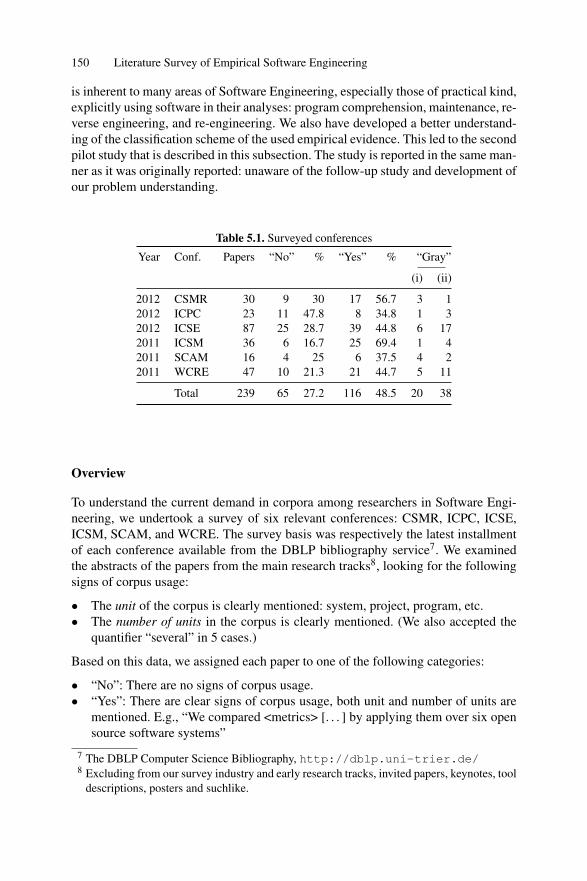
150 Literature Survey of Empirical Software Engineering
is inherent to many areas of Software Engineering, especially those of practical kind,explicitly using software in their analyses: program comprehension, maintenance, re-verse engineering, and re-engineering. We also have developed a better understand-ing of the classification scheme of the used empirical evidence. This led to the secondpilot study that is described in this subsection. The study is reported in the same man-ner as it was originally reported: unaware of the follow-up study and development ofour problem understanding.
Table 5.1. Surveyed conferences
Year Conf. Papers “No” % “Yes” % “Gray”
(i) (ii)
2012 CSMR 30 9 30 17 56.7 3 12012 ICPC 23 11 47.8 8 34.8 1 32012 ICSE 87 25 28.7 39 44.8 6 172011 ICSM 36 6 16.7 25 69.4 1 42011 SCAM 16 4 25 6 37.5 4 22011 WCRE 47 10 21.3 21 44.7 5 11
Total 239 65 27.2 116 48.5 20 38
Overview
To understand the current demand in corpora among researchers in Software Engi-neering, we undertook a survey of six relevant conferences: CSMR, ICPC, ICSE,ICSM, SCAM, and WCRE. The survey basis was respectively the latest installmentof each conference available from the DBLP bibliography service7. We examinedthe abstracts of the papers from the main research tracks8, looking for the followingsigns of corpus usage:
• The unit of the corpus is clearly mentioned: system, project, program, etc.• The number of units in the corpus is clearly mentioned. (We also accepted the
quantifier “several” in 5 cases.)
Based on this data, we assigned each paper to one of the following categories:
• “No”: There are no signs of corpus usage.• “Yes”: There are clear signs of corpus usage, both unit and number of units are
mentioned. E.g., “We compared <metrics> [. . . ] by applying them over six opensource software systems”
7 The DBLP Computer Science Bibliography, http://dblp.uni-trier.de/8 Excluding from our survey industry and early research tracks, invited papers, keynotes, tool
descriptions, posters and suchlike.
5.2 Pilot Studies 151
• “Gray area”, if either:i. only the unit of the corpus is mentioned. E.g., “and evaluated it on large-scale
C/C++ programs”,ii. or a (controlled) experiment, case study, empirical evaluation, assessment,
etc. is mentioned where a corpus has probably been used. E.g., “and furthervalidated with two case studies”.
The results of this classification are shown in Table 5.1: almost half of all papersclearly indicate corpus usage; additionally, about one fifth of the papers are in thegrey area.
Software corpora
The following analysis was carried out on the papers with clear evidence of corpususage. Furthermore, we focus on the six most frequently used corpus units: sys-tem, open-source project (or program), open-source software (or system), applica-tion, project, and program. These represent the largest homogenous group and areused in 82 papers, which is 70.7 % of the papers in the “Yes” category. Terminologi-cally, we unify these units in the following under the umbrella term of a system.
We examined the full texts of those 82 papers, in order to understand the usedcorpora in detail. In particular, we were looking for answers to the following ques-tions:
• System code form: source code or binaries?• What are the software languages of the corpus?• Dependencies: are systems buildable/runnable?• Has an established corpus been used?• What is a typical size of a corpus?• What systems are frequently used across publications?
The results were as follows.Code form. Looking for an explicit mention of code form in the text of the pa-
pers, we discovered that in 63 cases corpora consisted of source code only; in 5 cases,they consisted of bytecode/binaries. From the rest of the papers, we could not extracta clear statement on this account.
Languages. We found that corpora are mostly monolingual, with Java and C/C++being the most popular languages. In 52 cases, Java was mentioned as the only lan-guage of the corpus; in 13 cases, C/C++ was mentioned as the only language of thecorpus; in 9 cases the corpus was said to contain both units written in Java and inC-like languages (C, C++, C#).
Dependencies. We counted towards “resolved dependencies” those cases whenit was explicitly mentioned that: i) systems were run; ii) systems were built/com-piled; iii) libraries were present; iv) the tool(s) used required resolved dependencies(e.g., Eclipse TPTP). In 31 cases corpora were classified as containing needed codedependencies.
Established corpora. In 8 papers, we found explicit mention of one of the fol-lowing established corpora: DaCapo [29], Qualitas [175], SIR [56], Sourcerer [124],

152 Literature Survey of Empirical Software Engineering
SPEC CPU and SPEC JVM [9]. In 6 other papers, the following online repos-itories were mentioned as the source of corpus units: Android Market, GitHub,Google Code, SourceForge, ShareJar.9
Corpus size. Most corpora (57 cases) contain less than ten units. The median ofthe size distribution is 4, and the most frequent size of a corpus is 2 units.
Frequently used systems. We collected the names of used systems as mentionedby the papers and checked if they are provided by our illustrating established corpus,Qualitas. In Table 5.2, we group systems by their frequency of usage (Freq): Foreach group, we list how many systems belong to it (# Sys); how many of them arefound in Qualitas (# In Q.); names of the systems present in Qualitas; and names ofthe systems not found in Qualitas. E.g., the systems lucene, rhino, and xalan areused in four different corpora, but rhino is not present in the Qualitas corpus, whilelucene and xalan are included.
Table 5.2. Frequently used systems
Freq # Sys # In Q. In Qualitas Not in Qualitas
8 1 1 jedit —7 2 2 argouml, eclipse —5 3 3 ant, jhotdraw, pmd —4 3 2 lucene, xalan rhino3 8 4 aspectj, hibernate, hsqldb,
jfreechartfop, jabref, jface, jython
2 20 10 antlr, htmlunit, itext, jmeter,pooka, rssowl, tomcat, vuze, weka,xerces
bloat, chart, compare, debug.core,exvantage, freemind, jdt.core, lexi,quickuml, zxing
Discussion
Our survey shows that corpus usage is popular in Software Engineering: half of thepapers contain clear signs of it. Most of the used corpora consist of systems in sourcecode form with Java as the most popular language. The survey also shows that es-tablished corpora are not widely used, and that home-grown corpora usually are ofmoderate size and consist of hand-picked systems. The available data suggests thatan established corpus (resp. its subset) could have theoretically been used in manycases instead of a home-grown one. In particular, comparison shows that Qualitas,for instance, contains the most popular systems.
Our hypothesis as to why researchers do not embrace established corpora is thatthey consider engineering a home-grown corpus an easier task than adopting an es-tablished one. This may be partly due to the small number of systems used in some
9 https://play.google.com/, https://github.com/, http://code.google.com/, http://sourceforge.net/, http://www.sharejar.com/

5.3 A Survey on Empirical Software Engineering 153
papers, and partly due to the authors’ requirements not being met by the establishedcorpora in their current form.
During our own attempts of adopting established corpora, the most prominentunmet requirement was the absence of unresolved dependencies. The survey showsthat more than a third of potential corpus users also have such a requirement. Thus,we believe that adoption of established corpora is significantly simplified by resolv-ing dependencies.
5.3 A Survey on Empirical Software Engineering
After the two pilot studies, we have developed sufficient knowledge of the literaturesurvey methods as well as the topic of our interest, the usage of empirical evidencein Software Engineering. This section presents the final and the main survey that wascarried out by slightly adjusting our methodology compared to the second pilot study(adjusting the list of conferences, removing inclusion/exclusion criteria, expandingthe coding scheme).
5.3.1 Methodology
Table 5.3. Conferences used in the survey
Year Conference # papers
total long
2012 CSMR 30 302012 ESEM 43 242012 ICPC 23 212011 ICSM 36 362012 MSR 29 182011 SCAM 19 192011 WCRE 47 27
Total 227 175
This survey is particularly concerned with (collections of) empirical evidence.Thus, the following questions guide the research:
I How often do Software Engineering papers use corpora—collections of empir-ical evidence?
II What is the nature and characteristics of the used corpora?III Does common contents occur in the used corpora?
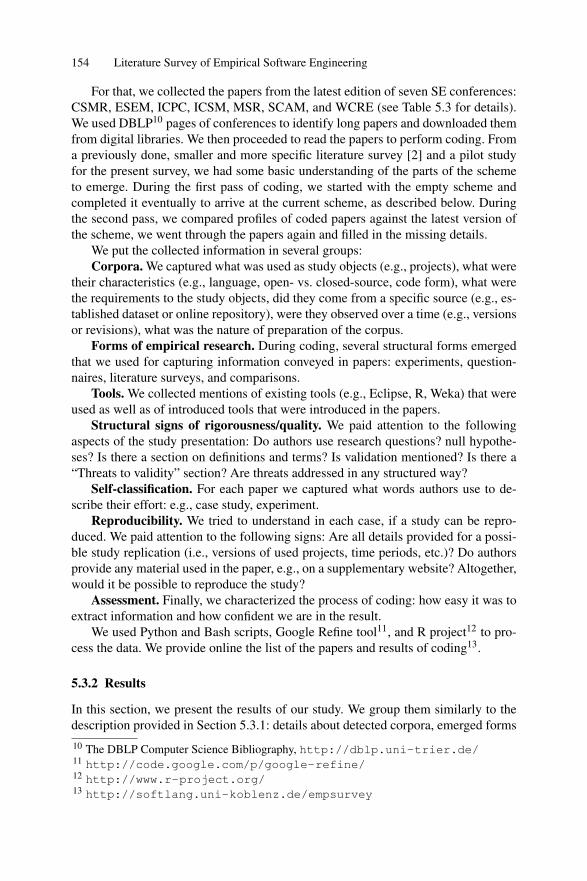
154 Literature Survey of Empirical Software Engineering
For that, we collected the papers from the latest edition of seven SE conferences:CSMR, ESEM, ICPC, ICSM, MSR, SCAM, and WCRE (see Table 5.3 for details).We used DBLP10 pages of conferences to identify long papers and downloaded themfrom digital libraries. We then proceeded to read the papers to perform coding. Froma previously done, smaller and more specific literature survey [2] and a pilot studyfor the present survey, we had some basic understanding of the parts of the schemeto emerge. During the first pass of coding, we started with the empty scheme andcompleted it eventually to arrive at the current scheme, as described below. Duringthe second pass, we compared profiles of coded papers against the latest version ofthe scheme, we went through the papers again and filled in the missing details.
We put the collected information in several groups:Corpora. We captured what was used as study objects (e.g., projects), what were
their characteristics (e.g., language, open- vs. closed-source, code form), what werethe requirements to the study objects, did they come from a specific source (e.g., es-tablished dataset or online repository), were they observed over a time (e.g., versionsor revisions), what was the nature of preparation of the corpus.
Forms of empirical research. During coding, several structural forms emergedthat we used for capturing information conveyed in papers: experiments, question-naires, literature surveys, and comparisons.
Tools. We collected mentions of existing tools (e.g., Eclipse, R, Weka) that wereused as well as of introduced tools that were introduced in the papers.
Structural signs of rigorousness/quality. We paid attention to the followingaspects of the study presentation: Do authors use research questions? null hypothe-ses? Is there a section on definitions and terms? Is validation mentioned? Is there a“Threats to validity” section? Are threats addressed in any structured way?
Self-classification. For each paper we captured what words authors use to de-scribe their effort: e.g., case study, experiment.
Reproducibility. We tried to understand in each case, if a study can be repro-duced. We paid attention to the following signs: Are all details provided for a possi-ble study replication (i.e., versions of used projects, time periods, etc.)? Do authorsprovide any material used in the paper, e.g., on a supplementary website? Altogether,would it be possible to reproduce the study?
Assessment. Finally, we characterized the process of coding: how easy it was toextract information and how confident we are in the result.
We used Python and Bash scripts, Google Refine tool11, and R project12 to pro-cess the data. We provide online the list of the papers and results of coding13.
5.3.2 Results
In this section, we present the results of our study. We group them similarly to thedescription provided in Section 5.3.1: details about detected corpora, emerged forms10 The DBLP Computer Science Bibliography, http://dblp.uni-trier.de/11 http://code.google.com/p/google-refine/12 http://www.r-project.org/13 http://softlang.uni-koblenz.de/empsurvey

5.3 A Survey on Empirical Software Engineering 155
of empirical research, used or introduced tools, signs of rigorousness/quality of re-search, reproducibility of the studies, and, finally, assessment of our effort. When weuse the phrase “on the average”, we imply the median of the appropriate distribution.
Next to the numbers, we provide framed highlights.We use formula “X out of Y papers” to provide feeling for the numbers.
E.g., “one out of three papers” means that in every three surveyed papers thereis one that has the discussed characteristic.
We also provide conference-wise percentage of found characteristics. Thetable below illustrates the format on an artificial example: conferences are listedfrom left to right as the percentage increases. Percentage is always given relativeto the total number of the long papers in the conference.
Artificial exampleCSMR ESEM ICPC ICSM MSR SCAM WCRE
1 % 2 % 3 % 4 % 5 % 6 % 7 %
Corpora
UsageAltogether, we have found 198 corpora in 165 papers (28 papers contain more
than one corpus).We decided that more than one corpus was used, when we met at least two of
the following motivations mentioned in the paper when describing the purpose ofcollected empirical evidence: for benchmark or oracle (6 corpora), for training (6corpora), for evaluation (5 corpora), for investigation (5 corpora), for testing (4 cor-pora), for investigating quality like accuracy or scalability (4 corpora).
We have found that 168 corpora (used in 145 papers), consist of projects (sys-tems, software); in other cases, corpora contain another kind of study object: image,trace, feature, web log, etc. Till the end of the current subsection (5.3.2), we restrictourselves to the project-based corpora.
Almost all papers use a corpus of some sort. One out of six papers has morethan one corpus. Most of the corpora consist of projects.
Project-based corpora usageESEM ICPC WCRE SCAM CSMR MSR ICSM
58 % 81 % 81 % 84 % 87 % 89 % 94 %
Contents We identified the following common characteristics of project-basedcorpora.
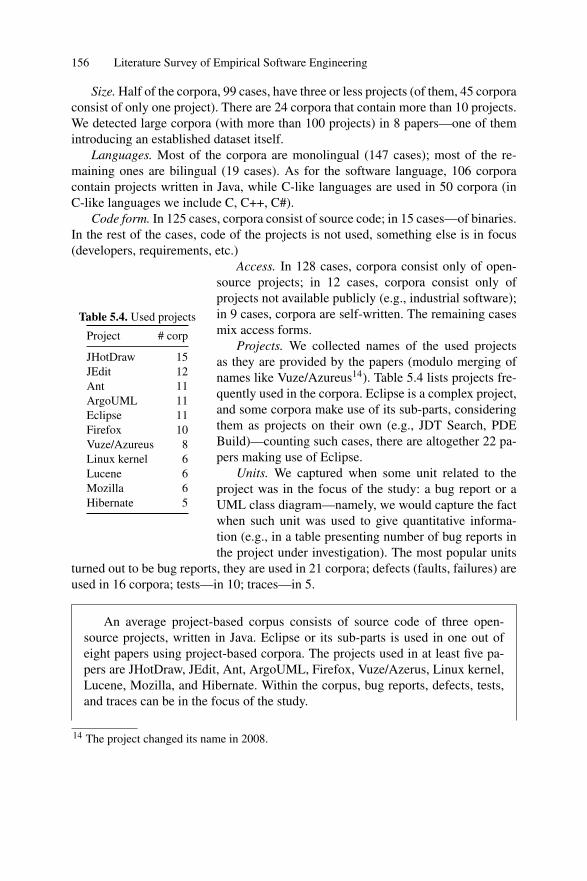
156 Literature Survey of Empirical Software Engineering
Size. Half of the corpora, 99 cases, have three or less projects (of them, 45 corporaconsist of only one project). There are 24 corpora that contain more than 10 projects.We detected large corpora (with more than 100 projects) in 8 papers—one of themintroducing an established dataset itself.
Languages. Most of the corpora are monolingual (147 cases); most of the re-maining ones are bilingual (19 cases). As for the software language, 106 corporacontain projects written in Java, while C-like languages are used in 50 corpora (inC-like languages we include C, C++, C#).
Code form. In 125 cases, corpora consist of source code; in 15 cases—of binaries.In the rest of the cases, code of the projects is not used, something else is in focus(developers, requirements, etc.)
Table 5.4. Used projects
Project # corp
JHotDraw 15JEdit 12Ant 11ArgoUML 11Eclipse 11Firefox 10Vuze/Azureus 8Linux kernel 6Lucene 6Mozilla 6Hibernate 5
Access. In 128 cases, corpora consist only of open-source projects; in 12 cases, corpora consist only ofprojects not available publicly (e.g., industrial software);in 9 cases, corpora are self-written. The remaining casesmix access forms.
Projects. We collected names of the used projectsas they are provided by the papers (modulo merging ofnames like Vuze/Azureus14). Table 5.4 lists projects fre-quently used in the corpora. Eclipse is a complex project,and some corpora make use of its sub-parts, consideringthem as projects on their own (e.g., JDT Search, PDEBuild)—counting such cases, there are altogether 22 pa-pers making use of Eclipse.
Units. We captured when some unit related to theproject was in the focus of the study: a bug report or aUML class diagram—namely, we would capture the factwhen such unit was used to give quantitative informa-tion (e.g., in a table presenting number of bug reports inthe project under investigation). The most popular units
turned out to be bug reports, they are used in 21 corpora; defects (faults, failures) areused in 16 corpora; tests—in 10; traces—in 5.
An average project-based corpus consists of source code of three open-source projects, written in Java. Eclipse or its sub-parts is used in one out ofeight papers using project-based corpora. The projects used in at least five pa-pers are JHotDraw, JEdit, Ant, ArgoUML, Firefox, Vuze/Azerus, Linux kernel,Lucene, Mozilla, and Hibernate. Within the corpus, bug reports, defects, tests,and traces can be in the focus of the study.
14 The project changed its name in 2008.

5.3 A Survey on Empirical Software Engineering 157
Popular projectsWCRE SCAM ESEM ICSM CSMR ICPC MSR11 % 11 % 13 % 14 % 23 % 24 % 28 %
Eclipse Lynx Eclipse ArgoUML Eclipse JEdit FirefoxJEdit Minix Eclipse
Sources. Some papers clearly state the source of their corpora. Table 5.6 lists themost popular types of sources and their distribution across conferences.
Table 5.5. Online repositories and established datasets
Repository # papers
SourceForge1 6Apache.org2 3GitHub3 3Android Market4 2CodePlex5 2
Ref Dataset # papers
[56] SIR 3[144] MSR challenge 2
[80] P-MARt 2[151] PROMISE 2[175] Qualitas 2
1 http://sourceforge.net/2 http://projects.apache.org/3 https://github.com/4 Now known as Google Play, https://play.google.com/store5 http://www.codeplex.com/
Online repositories used in more than one paper are listed in Table 5.5. The restof detected online repositories are used in only one paper each: BlackBerry AppWorld15, Google Code16, Launchpad17, ShareJar18.
Established datasets used in more than one paper are listed in Table 5.5. Some ofthe other datasets that used only in one paper each: Bug prediction dataset [49],CHICKEN Scheme benchmarks 19, CoCoMe20, DaCapo [29], FLOSSMetrics21,iBUGS22, SMG2000 benchmark23, SourcererDB [124], TEFSE challenge24.
15 http://appworld.blackberry.com/webstore16 http://code.google.com/17 https://launchpad.net/18 http://www.sharejar.com/19 https://github.com/mario-goulart/chicken-benchmarks20 http://agrausch.informatik.uni-kl.de/CoCoME21 http://libresoft.es/research/projects/flossmetrics22 http://www.st.cs.uni-saarland.de/ibugs/23 https://asc.llnl.gov/computing_resources/purple/archive/benchmarks/smg/
24 http://www.cs.wm.edu/semeru/tefse2011/Challenge.htm

158 Literature Survey of Empirical Software Engineering
Table 5.6. Sources of corpora
Type # papers
Total CSMR ESEM ICPC ICSM MSR SCAM WCRE
Established dataset 20 5 0 2 6 5 0 2Previous work 13 2 3 2 1 1 2 2Online repository 12 3 0 1 2 2 1 3
Total 43 9 3 5 9 7 3 7Percentage 25 30 13 24 25 39 16 26
One out of four project-based corpora uses an established dataset, previ-ous work, or online repository as a source of the projects. There is no commonfrequently used dataset or repository. Only SourceForge shows moderately fre-quent usage.
Usage of corpora sourcesESEM SCAM ICPC ICSM WCRE CSMR MSR
13 % 16 % 24 % 25 % 26 % 30 % 39 %
EvolutionWe encountered 52 papers that use evolution of the projects in their research,
meaning that they operate on several versions, releases, etc. To describe the evolu-tion measure, the following terms were used: “version” (21 times), “revision” (11),“commit” (10), “release” (11).
On the average, papers mentioning commits use 3,292 commits; papers withrevisions—18,870 revisions; with versions—10 versions; with releases—10 releases.
There are 46 papers that mention a time span of their study. In 36 cases, the unitof the time span is a year and on the average such papers are concerned with a 8-yearspan.
We found 23 papers to mention what version control system was involved in thestudy. CVS is mentioned 11 times, SVN—11 times, Git and Mercurial—4 and 2times respectively.
One out of three papers with project-based corpora uses evolution aspect inits research. In half of the cases, large-scale evolution is involved: several thou-sands commits/revisions or ten versions/releases of projects—often spanningseveral years of a project’s lifetime.

5.3 A Survey on Empirical Software Engineering 159
Evolution usageICPC SCAM ESEM CSMR ICSM WCRE MSR14 % 16 % 21 % 33 % 33 % 33 % 56 %
RequirementsPapers often mention requirements to the used empirical evidence, usually dic-
tated by the research goals,—we collected these requirements to the corpora, explicitas well as implicit. For instance, an implicit requirement for a bug tracking systemis inferred if the paper uses bug reports of the projects under investigation. The mostpopular direction of requirements is the presence of some ‘ecosystem’ (found in 37papers): existence of bug tracking systems, mailing lists, documentation (e.g., usermanuals). Another popular requirement, found in 25 papers, has to do with the sizeof the projects: small, sufficient, large, or of particular size (as specific as “mediumof the sizes of the ten most popular Sourceforge projects”), or the need of diversity ofsizes. In 23 papers, it was stated that the used projects were chosen because they wereused in previous work (of the same or other authors). Language-related requirementswere present in 22 papers for a specific language or for the diversity of languagesin a corpus. In 14 papers, the choice of projects was attributed to either diversityof application domains or to a specific domain. Some aspect of the used projectswas mentioned as essential in 14 papers: active or wide-spread usage, popularity,well-known and established software. Other popular requirements include presenceof development history (15 papers), dependencies (11 papers), or tests (10 papers).
One out of five papers requires the projects of its corpus to have an ecosys-tem: a bug tracker, or a mailing list, or some kind of documentation. Other re-quirements focus on the size and language of the projects, application domain,development history, etc.
Popular requirementsSCAM MSR ICSM ICPC ESEM WCRE CSMR11 % 28 % 14 % 24 % 13 % 11 % 23 %domain ecosys size size ecosys ecosys ecosys
lang prev.work
size
TuningWe captured what kind of action is applied to a corpus during research. In 20
papers, sources or binaries were modified by instrumentation, faults/clones injection,adjusting identifiers, etc. In 15 papers, tests needed to be run against the corpus eitherto verify made modifications or to collect the data. In 10 papers, the corpora had tobe executed in order to perform the needed analysis or to collect data. In 6 papers,

160 Literature Survey of Empirical Software Engineering
some filtering of the contents of the corpus was needed to, e.g., identify the mainsource code/main part of the project.
We have detected few common actions applied to corpora during research:source code/binaries modification; execution of the tests on the corpus or of thecorpus itself; filtering of the corpus contents. Altogether, one out of four paperscontains signs of one of these actions.
Popular actionsESEM MSR SCAM ICPC ICSM WCRE CSMR
8 % 11 % 11 % 14 % 19 % 19 % 20 %tests run modif. modif. tests modif. modif.
We captured manual effort that went into creation of a corpus, e.g., when a papermentions setting up environments and providing needed libraries in order to exe-cute the corpus. For that, we graded each corpus on the following scale. None: nomanual effort mentioned (120 corpora); some: some manual effort mentioned, e.g.,manual detection of design patterns in source code (33 corpora); and all means thatthe corpus is self-written (10 corpora).
One out of four project-based corpora requires some manual effort.
Manual effortCSMR ESEM ICSM SCAM ICPC MSR WCRE
13 % 13 % 22 % 26 % 33 % 33 % 37 %
Emerged forms
We did not use any theoretical definition for what is considered to be a question-naire or an experiment. The developed definitions are structural, composed of thecharacteristics that emerged from the papers, as they were discussed and structurallysupported by the authors.
ExperimentWe have identified 22 experiments in 19 papers. Except for two, they all involve
human subjects. On the average, an experiment has 16 participants. The maximumnumber of participants is 128, the minimum is 2, first and third quartiles are 5 and 34respectively. In 21 cases, an experiment uses a corpus (in 17 cases, a project-basedone); 20 questionnaires are used in 10 experiments.
In two-thirds of the experiments, participants come from one population, theremaining experiments draw participants from two or three populations. The mostcommon source of participants is students; sometimes distinguished by their level—graduate, undergraduate, Bachelor, Master, and PhD students. In one-third of the

5.3 A Survey on Empirical Software Engineering 161
cases, professionals are involved (full-time developers, experts, industry practition-ers, etc.). In half of the cases, participants form the one and only group in the experi-ment. When there is more than one group (usually, two—with a couple of exceptionsof 4 and 5 groups), the group is representing a treatment (a task), or an experiencelevel, or a gender. On the average, an experiment has 4 tasks and lasts for an hour(with a few exceptions when an experiment takes several weeks or even a month).
In 6 cases, it is mentioned that an experiment had a pilot study. In 6 cases, it ismentioned that participants of the experiment were offered compensation: monetaryor another kind of incentive (e.g., a box of candy).
The main requirement for the participants is their experience: basic knowledgeof used technology, or language, or IDE. As for the tasks, they are expected to be ofa certain size (e.g., a method body to fit on one page), or of certain contents (e.g.,contain “if” statements). The usual requirement for an experiment also is either thatthe tested tool or used code is unfamiliar to the participants, or on the contrary thatthe background is familiar (e.g., well-known design patterns).
One out of ten papers contains an experiment. The majority of the experi-ments use project-based corpora; experiments often use questionnaires, usuallytwo per experiment. An average experiment involves 16 students, often in twogroups (by the received treatment or experience level); it consists of four tasksand lasts for an hour. One out of four experiments suggests some compensationto its participants; one out of four experiments is preceded by a pilot study.
ICPC and ESEM are the main source of experiments involving profession-als.
ExperimentsMSR SCAM CSMR WCRE ICSM ESEM ICPC
0 % 0 % 3 % 7 % 8 % 21 % 38 %
QuestionnaireAltogether, we have found 36 questionnaires in 24 papers. As mentioned, 20
questionnaires are used in experiments—to distinguish, we will refer to them asexperiment-related and the other 16 we will qualify as experiment-unrelated.
Sizewise, there is no particular difference between experiment-related and -unrelated questionnaires. On the average, both have 20 questions grouped in onesection. In 6 cases, an experiment-unrelated questionnaire has a corpus.
While experiment-related questionnaires have the same participants as the ex-periments they relate to (i.e., involve mostly students), experiment-unrelated ques-tionnaires involve professionals (testers, managers, experts, consultants, softwareengineers) as participants in two-thirds of the cases. On the average, an experiment-unrelated questionnaire has 12 participants. When it was possible (6 cases), we cal-culated how many participants took part in the experiment-unrelated questionnairecompared to the initial number of invited participants. On the average, 19 % take partin the end, in the worst case the ratio can be as low as 5 %.

162 Literature Survey of Empirical Software Engineering
While experiment-related questionnaires have the same requirements regardingthe participants as the experiments they relate to, experiment-unrelated question-naires have requirements concerned with the participants’ experience (e.g., Java ex-perience) or expertise (specific area of experience such as clone detection or webdevelopment).
When related to experiments, questionnaires are often performed before (referredto as “pretest” in 6 cases) and after the experiment (referred to as “posttest” in9 cases).
In 5 cases, an experiment-unrelated questionnaire was preceded by a pilot study.
More than half of the detected questionnaires are used in experiments—often as pretest and postttest questionnaires. The other half, experiment-unrelated questionnaires, are found in one out of twelve papers. Sizewise, on theaverage there is no difference between experiment-related and -unrelated ques-tionnaires. Experiment-unrelated questionnaires usually involve professionalsas participants—in contrast to experiment-related questionnaires that mostly usestudents. Typical requirements for participants in experiment-unrelated ques-tionnaires have to do with experience or expertise. One out of three experiment-unrelated questionnaires are preceded by a pilot study.
Experiment-unrelated questionnairesMSR CSMR SCAM WCRE ICSM ICPC ESEM
0 % 3 % 5 % 7 % 8 % 19 % 25 %
Literature surveyWe have found 6 literature surveys in 5 papers. Except for one, they provide ex-
tensive details on how the survey was conducted. In particular, the used methodologyis clearly stated: four times it is said to be a “systematic literature review” and oncea “quasi systematic literature review”. In three cases, the systematic literature reviewwas done following the guidelines by Kitchenham [109].
The papers are initially collected either by searching digital libraries or from theproceedings of specific conferences and journals. Among used digital libraries areEI Compendex, Google Scholar, ISI, and Scopus—the latter was used in two papers.As for the conferences and journals, there is no intersection between the lists ofnames—except for ICSE, which was used in two papers.
On the average, a literature survey starts with 2161 papers, its final set contains35 papers, meaning that on the average only 1.6 % papers are taken into account inthe end. The percentage can be as high as 39 % and as low as 0 %.
Requirements for papers to be included into the survey are usually related to thescope of the investigated research. Other requirements are concerned with the paperitself: available online, written in English, a long paper, with empirical validation.
After all the papers are collected, they are filtered based on the titles and abstracts,which are examined manually by the researchers (in one case, also conclusions weretaken into account; in another case, full text of the papers was searched for key-

5.3 A Survey on Empirical Software Engineering 163
words). Then the full text of each paper is read and the final decision is made as towhether to consider the paper relevant.
Literature surveys are quite rare: only one out of 35 papers contains it. On theaverage, a literature survey starts with few thousand papers to be filtered downto few dozens papers that will be analyzed. Usually, the first round of filteringis based on the title and abstract, then the full text of the papers is considered.There is not enough information to conclude about frequently used digital li-braries or conferences/journals. Half of the surveys were following guidelinesof systematic literature reviews by Kitchenham [109].
Literature surveysICSM MSR SCAM WCRE CSMR ICPC ESEM
0 % 0 % 0 % 0 % 3 % 5 % 13 %
ComparisonsDuring the coding phase of the survey, we noticed the recurring motif of compar-
isons in the papers. While we did not assess the scope nor the goal, we have codedthe basic information: what is the nature of the subjects being compared (tools, tech-niques), how many subjects are compared, and is one of them introduced in the paper.
We have found comparisons in 56 papers. Almost all of them (except for 5 pa-pers), use project-based corpora. Half of the time, a comparison includes the tech-nique, approach, or tool that was introduced in the study—with the apparent reasonto evaluate the proposed technique, approach, or tool. On the average, in such evalu-ation was used one other technique, approach, or tool. In the other cases, were com-pared metrics, tools, algorithms, designs, etc. For such comparisons, on the average,the group of compared entities was of size 3.
One out of three papers compares tools, techniques, approaches, metrics,etc.—half of the time, to evaluate what was introduced in the study. On theaverage, such evaluation involves one other entity. In the other half of the cases,the average number of compared entities is 3.
ComparisonsICPC MSR SCAM WCRE ESEM ICSM CSMR19 % 22 % 26 % 30 % 33 % 36 % 47 %
Tools
We have found 46 papers to introduce a tool (where we were able to capture this factonly if the name of the tool was mentioned or it was clearly stated that “a prototype”

164 Literature Survey of Empirical Software Engineering
Table 5.7. Existing tools used in the papers
Tool # papers
Eclipse1 25R project2 16CCFinder3 6Understand4 6Weka5 6ConQAT6 4
Tool # papers
MALLET7 4ChangeDistiller8 3CodeSurfer9 3Evolizer10 3RapidMiner11 3RECODER12 3
1 http://eclipse.org2 http://www.r-project.org/3 http://www.ccfinder.net/4 http://www.scitools.com/5 http://www.cs.waikato.ac.nz/ml/weka/6 https://www.conqat.org/7 http://mallet.cs.umass.edu/8 http://www.ifi.uzh.ch/seal/research/tools/changeDistiller.htm
9 http://www.grammatech.com/products/codesurfer/overview.html
10 http://www.ifi.uzh.ch/seal/research/tools/evolizer.html
11 http://rapid-i.com/content/view/181/190/12 http://sourceforge.net/projects/recoder/
is implemented). In 46 more papers, we detected that additional, helper tooling forthe current purpose of the study is implemented (parsers, analyzers, and so on).
When names of existing tools were explicitly mentioned to be used, we collectedthe names. We have found that in 126 cases, a paper makes use of existing tools. Onthe average, a paper uses 2 tools; the captured maximum is 6. The frequently usedtools are listed in Table 5.7. We counted towards Eclipse usage also cases when apaper used an existing tool that we know to be an Eclipse plug-in. For brevity, weomit names of 19 more tools that were used in two papers.
One out of four papers introduces a new tool; another one out of four papersuses some home-grown tooling. Almost three out of four papers use existingtools.
The most popular standard tool, Eclipse—an IDE and a platform for plug-indevelopment—is used in one out of seven papers. Other popular tools cater forsource code analysis, clone detection, evolution analysis, data mining, statistics,quality analysis, document classification.
Home-grown toolingICPC ESEM CSMR ICSM MSR WCRE SCAM
5 % 17 % 20 % 33 % 33 % 33 % 42 %

5.3 A Survey on Empirical Software Engineering 165
Introduced toolsESEM MSR ICPC SCAM CSMR WCRE ICSM
4 % 11 % 19 % 21 % 30 % 37 % 44 %
Structural signs of rigorousness/quality
We do not aim to assess the quality or rigorousness of the studies. We capture pres-ence of some of the aspects that are taken into account when assessing rigorous-ness/quality of research (cf., [97])—in that, we restrict ourselves only to the struc-tural aspects.
Study presentation aspectsA clear set of definitions for the terms used in the paper is found in 25 papers.
Research questions are adopted in 83 papers. In 22 papers, an approach “Goal-Question-Metric” [23] is used. Explicit mention of null hypothesis or hypothesesis found in 23 papers. Section “Threats to validity” is present in 111 papers; of them,75 discuss threats using classification described, e.g., in [195]: threats to external(mentioned in 73 papers), internal (59 papers), construct (53 papers), and conclusion(26 papers) validity.
If to consider combinations of these signs (definitions, research questions, hy-potheses, and threats), the most popular one is the absence of all of them: demon-strated by 42 papers. The second most popular combination is presence of researchquestions and threats to validity: found in 34 papers. The third most popular—usageof only threats to validity—found in 29 papers. Together, these three combinationsdescribe 60 % of the papers.
Half of the papers use research questions to structure their study. One out ofseven papers use “Goal-Question-Metric” approach and/or formulate (null) hy-potheses to structure their research. One out of seven papers provides an explicitset of definitions of the terms used in the study. Threats to validity are discussedin three out of five papers.
The following three combinations of structural signs describe at least halfof the papers in each conference, except for WCRE, where only 44 % of papersare covered by these combinations.
No structural signsICPC MSR WCRE ESEM ICSM CSMR SCAM14 % 17 % 19 % 21 % 22 % 27 % 53 %
Both research questions and threats to validityICSM WCRE SCAM CSMR MSR ICPC ESEM
8 % 11 % 16 % 20 % 22 % 24 % 42 %
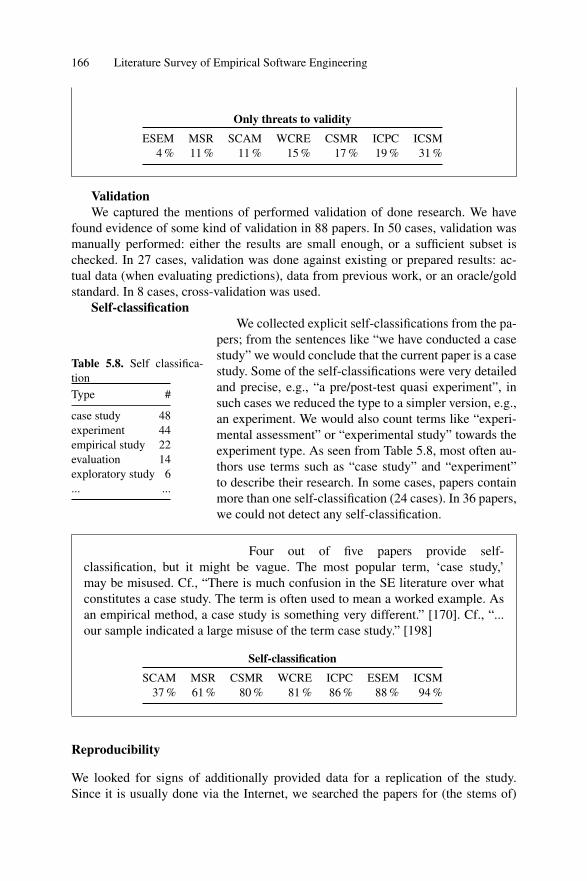
166 Literature Survey of Empirical Software Engineering
Only threats to validityESEM MSR SCAM WCRE CSMR ICPC ICSM
4 % 11 % 11 % 15 % 17 % 19 % 31 %
ValidationWe captured the mentions of performed validation of done research. We have
found evidence of some kind of validation in 88 papers. In 50 cases, validation wasmanually performed: either the results are small enough, or a sufficient subset ischecked. In 27 cases, validation was done against existing or prepared results: ac-tual data (when evaluating predictions), data from previous work, or an oracle/goldstandard. In 8 cases, cross-validation was used.
Self-classification
Table 5.8. Self classifica-tionType #
case study 48experiment 44empirical study 22evaluation 14exploratory study 6... ...
We collected explicit self-classifications from the pa-pers; from the sentences like “we have conducted a casestudy” we would conclude that the current paper is a casestudy. Some of the self-classifications were very detailedand precise, e.g., “a pre/post-test quasi experiment”, insuch cases we reduced the type to a simpler version, e.g.,an experiment. We would also count terms like “experi-mental assessment” or “experimental study” towards theexperiment type. As seen from Table 5.8, most often au-thors use terms such as “case study” and “experiment”to describe their research. In some cases, papers containmore than one self-classification (24 cases). In 36 papers,we could not detect any self-classification.
Four out of five papers provide self-classification, but it might be vague. The most popular term, ‘case study,’may be misused. Cf., “There is much confusion in the SE literature over whatconstitutes a case study. The term is often used to mean a worked example. Asan empirical method, a case study is something very different.” [170]. Cf., “...our sample indicated a large misuse of the term case study.” [198]
Self-classificationSCAM MSR CSMR WCRE ICPC ESEM ICSM
37 % 61 % 80 % 81 % 86 % 88 % 94 %
Reproducibility
We looked for signs of additionally provided data for a replication of the study.Since it is usually done via the Internet, we searched the papers for (the stems of)

5.3 A Survey on Empirical Software Engineering 167
the following keywords: “available,” “download,” “upload,” “reproduce,” “replicate,”“host,”, “URL,” “website,” “http,” “html”. In such manner, we have found links in 61papers. In 6 cases, we could not find any mentioned material, tools or data,—linksled to a general page or to a homepage, which we searched thoroughly but withoutsuccess. In 3 more cases, we have found replication material on the website aftersome searching.
One out of three papers additionally provides online some data from thestudy, though not always to be found.
Additional data providedSCAM ICSM CSMR MSR WCRE ESEM ICPC
26 % 31 % 33 % 33 % 33 % 38 % 48 %
As to the nature of the provided data, in 25 cases, an introduced tool or toolingused in the research is provided. In 15 cases, the used corpus—in full or partially—is provided; the complete description of the corpus (list of used projects with theirversions and/or links) is provided by 6 more papers. Raw data are available for 14papers; the same number of papers provide final or/and additional results of the study.
When the corpus is not provided by the paper, but the names of the used projectsare mentioned, the main aspect of being able to reproduce the corpus is knowingwhich versions of the projects were used. We noticed that in 21 papers versions ofthe used projects are not provided. In 67 papers, versions of the projects are men-tioned explicitly; in 26 more cases, it is possible to reconstruct the version from thementioned time periods that the study spans.
Altogether, we judged 29 papers to be reproducible, meaning that either all com-ponents were provided by the authors or we concluded that the paper contains enoughdetails to collect exactly the same corpus and the same tools. We did not judge if itis possible to follow the provided instructions, specific to the reported research—as,for instance, was done in the work by González-Barahona and Robles [78].
We also note that 8 papers mention that they are doing a replication in their study,of them 3 papers with self-replication.
We judged one out of six papers to be reproducible with respect to the usedcorpus and tools. We did not assess whether enough details were provided tore-conduct the research itself.
Judged to be reproducibleICSM WCRE SCAM ICPC ESEM CSMR MSR
3 % 4 % 16 % 19 % 25 % 27 % 33 %

168 Literature Survey of Empirical Software Engineering
Assessment
Though usually information we extracted from the papers was scattered across dif-ferent sections, half of the papers had tables (listing projects, their names, versions,used releases, and similar information) that helped us during the coding phase of thepapers. We captured our confidence in the end result of the coded profile of eachpaper. For that, we used the following scale: high, moderate, and low levels of confi-dence. The results are as follows: high—81 papers, moderate—78 papers, low—16papers.
We have low confidence in one out of eleven papers that we have coded.In the rest, half of the time we are moderately confident and half of the time—highly confident in the results.
High confidenceWCRE SCAM ICSM ICPC ESEM CSMR MSR
15 % 26 % 42 % 52 % 54 % 60 % 78 %
Moderate confidenceMSR CSMR ESEM ICPC ICSM SCAM WCRE17 % 33 % 33 % 43 % 53 % 58 % 67 %
Low confidenceICPC ICSM MSR CSMR ESEM SCAM WCRE
0 % 6 % 6 % 7 % 13 % 16 % 19 %
5.4 Threats to Validity
Choice of the papers
We did not use journal articles—while they might provide more information or be ofhigher quality, we wanted to capture the state of the common research, of which webelieve conference proceedings to be more representative25. We have chosen confer-ences with proceedings of similar and reasonable size (see Table 5.3): so that not toskew the general results by one larger conference and so that to include all the papersbut still be able to process them within reasonable period of time. Specifically, weexcluded the ICSE conference, which had 87 long papers in the proceedings of 2012edition. Altogether, this means our results might not be generalizable, but we believethem to be representative enough.
25 While we do not aim to define what “common research” is, we find indirect justificationfor such position in the work that compares scientific impact of conference and journalpublications (see, for example, [152] and [66])

5.5 Related Work 169
Choice of the period
Since we perform a snapshot study, it might be that some of the discovered numbersare a coincidental spike. Possible future work, in order to provide more details anddeeper understanding, will have to be a longitudinal study—along the same lines aswe have investigated the health of Software Engineering conferences in [8], observ-ing 11 conferences over a period of more than 10 years.
Data extraction
The coding phase of the papers consisted of the manual effort with occasional searchby specific keywords (mentioned in the appropriate subsections of Section 5.3.2). In5 cases, papers were OCR-scanned (i.e., non-searchable).
Human factor. Coding was done by one researcher, but the results of the firstpass were cross-validated during the second pass as well as during the aggregationphase. When in doubt, the researcher constantly referred back to the surveyed papersto double-check.
Scheme. We do not claim our coding scheme to be complete or advanced. Wecaptured basic data related to the used empirical evidence, often either obvious orstructurally supported. Therefore, we might miss sophisticated or under-specifiedforms of empirical research.
5.5 Related Work
We summarize related work in Table 5.9. We compare our work to other literaturesurveys of SE research.
There are key differences between our survey and previous work. The cited sur-veys start with a predefined schema, while we allow our schema to emerge. Further,the cited surveys focus on SE research in some way, while we are interested in what-ever empirical evidence is used to facilitate SE research. For instance, Kitchenhamand Sjøberg et al. are interested in specific kinds of studies, systematic reviews, andcontrolled experiments respectively; Glass et al. surveyed a sample of all papers,without filtering by types, but their intention was to capture in what areas SE re-search is done and how.
Below we compare the findings of related work where they overlap with ours.As a general remark, we believe that our findings quantitatively differ from previ-ous findings because of several factors: i) the dependence on the choice of venues:even conferences in our study differ considerably; ii) passed time: there is at leasta five-year gap, during which popularity of empirical research and of its particularforms might have grown; iii) the cited papers use mostly journals: this may increasethe aforementioned gap because of the longer process for journal publications; iv)snapshot versus longitudinal approach: we take into account all papers of the latestproceedings while the cited papers focus on a sample across several years.

170 Literature Survey of Empirical Software Engineering
The closest work to ours is by Zannier et al.: they measured quantity and qualityof empirical evaluation in ICSE papers over the years. Our work provides a snapshotstudy aiming to represent SE research broadly across conferences. Zannier et al.when assigning types to the papers, could confirm the self-classification of half ofthe studies. Which agrees with our observation that self-classification is rather weakamong SE papers. They also observe the extremely low usage of hypotheses (onlyone paper) and absence of replications. We do find some adoption of null hypothesesand replications.

5.5 Related Work 171
Tabl
e5.
9.R
elat
edw
ork
Nam
eR
efY
ear
#us
edPe
riod
#pa
pers
Focu
sC
odin
gsc
hem
a
jc
tota
lse
l.re
l.
Gla
sset
al.
[76]
2002
60
1995
–199
9—
369
369
Cha
ract
eris
tics
ofSE
rese
arch
Topi
cs,r
esea
rch
appr
oach
esan
dm
etho
ds,
theo
retic
alba
sis,
leve
lofa
naly
sis
Sjøb
erg
etal
.[1
68]
2005
93
1993
–200
254
5310
310
3C
ontr
olle
dex
peri
men
tsE
xten
t,to
pic,
subj
ects
,tas
kan
den
viro
nmen
t,re
plic
atio
n,in
tern
alan
dex
tern
alva
lidity
Zan
nier
etal
.[1
98]
2006
01
1975
–200
512
2763
44E
mpi
rica
lev
alua
tion:
quan
tity
and
soun
dnes
s
Stud
yty
pe,s
ampl
ing
type
,tar
geta
ndus
edpo
pula
tion,
eval
uato
nty
pe,p
rope
ruse
ofan
alys
is,u
sage
ofhy
poth
eses
Kitc
henh
amet
al.
[111
]20
0910
320
04–2
007
2506
3319
Syst
emat
icre
view
sIn
clus
ion
and
excl
usio
ncr
iteri
a,co
vera
ge,
qual
ity/v
alid
ityas
sess
men
t,de
scri
ptio
nof
the
basi
cda
ta
Our
stud
y20
130
720
11/2
012
227
175
175
Em
piri
cale
vide
nce
Em
erge
dcl
assi
ficat
ion
Leg
end:
jand
cst
and
forj
ourn
als
and
conf
eren
ces;
sel.
and
rel.
stan
dfo
rsel
ecte
dan
dre
leva
nt.

172 Literature Survey of Empirical Software Engineering
According to their classification, Glass et al. have found 1.1 % papers to containliterature reviews and 3 % papers to present “laboratory experiment (human sub-jects).” We also discover that number of literature surveys and experiments is low,but relatively it increased 2-3 times.
Kitchenham et al. considered to be systematic literature reviews only 0.75% ofsurveyed papers. We have found literature surveys in 5 papers, one of which didnot contain a clear methodology—a requirement to be met by Kitchenham’s inclu-sion criteria—leaving 4 papers. Thus, our percentage of detected literature surveysis 2.3 %
According to Sjøberg et al.’s study, only 2 % of the papers contain experiments,while we discover 10 % surveyed papers to contain an experiment. On the average,Sjøberg et al. detected an experiment to involve 30 participants—in 72.6 % casesonly students, in 18.6 % cases only professionals, and in 8 % cases mixed groups. Wehave found that on the average an experiment involves 16 participants—in 57 % casesonly students, in 14 % cases only professionals, and in 29 % cases mixed groups.
5.6 Conclusion
We have presented a literature survey on the current state of empirical research inSoftware Engineering.
Answers to the questions
Coming back to the initial questions that motivated our research (see Section 5.1),we suggest the following answers:
I The overwhelming majority of Software Engineering papers use corpora—collections of empirical evidence.
II The majority of the corpora consist of projects and can be characterized by size,code form, software language, used evolution measures, and others.
III We have detected some recurring projects with low frequency though. (See dis-cussion below.)
“Holy grail” vs. common ground
Though projects are used in the majority of SE papers and characteristics of theused corpora are quite typical (number of used projects, language, etc.), the usage ofestablished datasets is low. We suggest two possible reasons. First, adoption may below only yet: among detected datasets being used (see Table 5.5), the oldest dataset,SIR, was introduced in 2005, the youngest, Qualitas—in 2010. Second, researchersmay prefer to collect and prepare their corpora themselves, because there might notbe a “holy grail” among corpora to suit all possible needs. Partially, this last guess issupported by the fact that even on the level of projects no clear favorite was detectedamong SE papers. On the other hand, we find that three out of seven conferences have

5.6 Conclusion 173
favorite projects, when considered separately—projects that are used by a quarterof the papers within these conferences. This leads to a refined version of the thirdquestion in our study: When it is possible to detect commonly used projects within aconference, would it be useful to provide a curated version of them? This is a topicfor future work.
Top-down vs. bottom-up introduction of methodology
While there is need for adoption of advanced and theoretically specified forms ofempirical research, we believe that there is a certain amount of de facto empiricalresearch that has formed historically. Our position is that by understanding its char-acteristics, its quality can be improved or at least assessed.

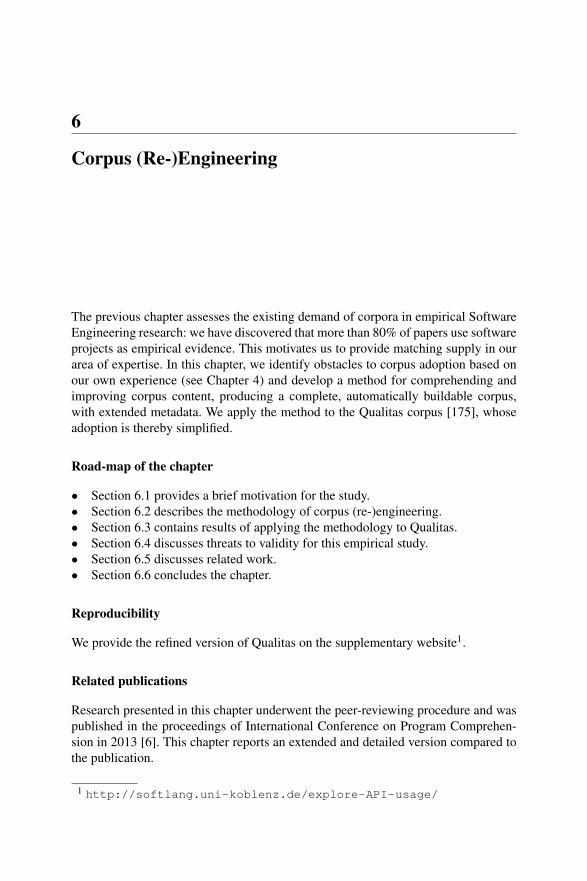
6
Corpus (Re-)Engineering
The previous chapter assesses the existing demand of corpora in empirical SoftwareEngineering research: we have discovered that more than 80% of papers use softwareprojects as empirical evidence. This motivates us to provide matching supply in ourarea of expertise. In this chapter, we identify obstacles to corpus adoption based onour own experience (see Chapter 4) and develop a method for comprehending andimproving corpus content, producing a complete, automatically buildable corpus,with extended metadata. We apply the method to the Qualitas corpus [175], whoseadoption is thereby simplified.
Road-map of the chapter
• Section 6.1 provides a brief motivation for the study.• Section 6.2 describes the methodology of corpus (re-)engineering.• Section 6.3 contains results of applying the methodology to Qualitas.• Section 6.4 discusses threats to validity for this empirical study.• Section 6.5 discusses related work.• Section 6.6 concludes the chapter.
Reproducibility
We provide the refined version of Qualitas on the supplementary website1.
Related publications
Research presented in this chapter underwent the peer-reviewing procedure and waspublished in the proceedings of International Conference on Program Comprehen-sion in 2013 [6]. This chapter reports an extended and detailed version compared tothe publication.
1 http://softlang.uni-koblenz.de/explore-API-usage/
176 Corpus (Re-)Engineering
6.1 Introduction
Empirical software research often needs corpora to test a hypothesis, to validate atool, or to illustrate an approach. Software corpora have been, for instance, used toevaluate tools for design pattern detection [65], API method recommendation [87],and refactoring automation [141]—just to mention a few areas and papers. All suchefforts face the choice as to whether to use a more or less home-grown corpus, whichis the case for the papers just referenced, or instead an established corpus, such asthe Qualitas curated Java code collection [175] comprising over 100 systems writtenin Java.
As we have demonstrated in Chapter 5, there is a common need in corporain the contemporary Software Engineering research. Based on our experience, de-scribed in Chapter 4, in the present effort we identify obstacles of corpus adoptionand corresponding means of corpus (re-)engineering, thereby improving corpora andsimplifying their adoption. More specificallly, we develop a method for corpus (re-)engineering, which we ultimately demonstrate and validate by their application toQualitas.
6.1.1 Benefits of Using an Established Corpus
Creating and using established corpora of experiment subjects offers significant ben-efits to the research field as a whole. Drawing the experiment subjects from an es-tablished corpus increases comparability of approaches as well as reproducibility ofresearch. Both of these goals are highly valued in empirical sciences.
There is also hope that availability of established corpora would entice re-searchers to validate their results on a larger number of experiment subjects, thoughthis outcome is of course subject to individual resource constraints. An establishedcorpus offers furthermore an opportunity to exercise quality control, e.g., by reach-ing a consensus that a collection is, in some sense, representative, free from bias orartifacts.
Apart from the benefits to the field, there are also practical reasons and benefitsfor the individual researcher to use an established corpus. A well-maintained corpusreduces the effort in obtaining, organizing, preparing, and maintaining experimentsubjects. An established corpus provides a stable point of reference to the experimentsubjects used while limiting the documentation-related burden for the researcher. Acorpus may readily provide additional metadata, which can be useful for particularresearch applications.
Of course, in practice, using an established corpus is hardly an all-or-nothing af-fair. While the payoff is highest when a large number of experiment subjects is used,it is already present for research on a small subject populace. Conversely, improv-ing an established corpus benefits many users at once. Nonetheless, the method thatwe propose is an aid to everybody who is interested in setting up a well-engineeredcorpus.

6.2 A Method for Corpus (Re-)Engineering 177
6.1.2 Obstacles to Corpus Adoption
Guided by our experiences in using an established corpus for own research, weaddress two obstacles for corpus adoption. As our pilot study suggests (see Sec-tion 5.2.2), others could also benefit from the improvements.
Obstacle I is ‘unresolved dependencies’. Being able to build and/or run the sys-tem is crucial in many research questions, e.g., when studying API usage [173, 92,148], for code instrumentation [99, 165], or dynamic analysis [150, 69]. A corpusmay include compiled code/binaries as provided by system developers, but this isoften insufficient due to missing dependencies such as libraries.
Obstacle II is ‘insufficient metadata’. System distributions often contain disparatecode content such as unit tests, demos and test cases, and third-party libraries. Failingto discern between these categories in empirical studies may lead to skewed results.Indeed, the metadata of established corpora does not allow one, e.g., to automaticallyidentify and isolate test cases [141], the system core [52], or, conversely, third-partylibraries [174].
6.2 A Method for Corpus (Re-)Engineering
We will now present a method to produce a corpus that i) includes all necessarydependencies, ii) can be built and analyzed automatically, in a uniform way, andiii) contains extended and precise metadata about systems and their components.We submit that the cornerstone of this method for corpus (re-)engineering is thatthe build process for systems in the corpus is managed in a scalable and traceableway such that all dependencies are resolved and metadata about the system scope iscollected.
The method is defined for Java programs, but can be analogously applied to othersimilar languages.
6.2.1 Underlying Concepts
A system is a set of files. We assume a system is available in two forms. First, thesource-code form consists of Java files, libraries, build scripts, documentation, andso on, and we refer to the totality of included Java files as source code. Second, thebinary form usually consists of compiled source code, resources, etc., packed intoJARs; it may also optionally contain a number of library JARs. (For example, theQualitas corpus readily serves both forms.)
A Java file may contain one or more Java types (classes, interfaces, enums, anno-tations) that are distinguished by their qualified names. A build is a process, duringwhich source code is compiled and packed into built JARs, which can be distributedas part of the binary system form. We use the term root to refer to any source direc-tory from which the hierarchy of directories with Java packages descends. Basically,

178 Corpus (Re-)Engineering
one obtains a root by removing from the full path to a source file the suffix corre-sponding to the Java package2.
We use two classifications of Java types to describe system boundaries. The firstone consists of a set of package prefixes containing system types, as suggested by theauthors of Qualitas. System types are part of the system in question—as opposed to,say, third-party types. The second classification is more fine-grained: Java types areclassified as core, test, or demo, reflecting the type’s function within the system. Wewill later see how the second classification may be computed by a heuristic.
6.2.2 Method
Consider the following, partially automated pseudocode:
1. input : corpus,systemCandidateList2. output : corpus3. for each name in systemCandidateList :4. (psrc, pbin) = obtainSystem(name);5. patches = exploratoryBuild(psrc, pbin);6. timestamp = build(psrc,patches);7. (java,classes, jars) = collectStats(psrc);8. java′ = f ilter(java);9. (jarsbuilt, jarslib) =
detectJars(timestamp, java′, jars);10. java′compiled =
detectJava(timestamp, java′,classes, jarsbuilt);11. p′src = (java′compiled, jarslib);12. p′bin = jarsbuilt;13. p′ = (p′src,p
′bin);
14. if validate(p′) :15. corpus = corpus+p′;16. f actExtraction(p′);
The input is a (possibly empty) corpus to be extended and a list of candidatesystems, systemCandidateList, to be added to it. The output is the corpus populatedwith refined systems.
We assume that a system can be obtained both in its source-code and binaryforms (line 4): e.g., by downloading them from the system’s website. During anexploratory build (line 5), the nature of the system is manually investigated by anexpert. We detect how the system is built, what errors occur during the build (if any),and how to patch them. At this stage, we also compare the set of built JARs with the
2 E.g., for a file systemA/src/org/foo/bar/Example.java that contains a typewith qualified name org.foo.bar.Example, the root is systemA/src/

6.3 Reengineering Qualitas 179
JARs in the binary distribution form of the system. If the former set is smaller thanthe latter (e.g., because default targets in build scripts may be insufficient and a seriesof target calls or invocation of several build scripts is needed), we attempt to pushthe build of the system for completeness. Once the exploratory build is successful,we are able to automatically build the system (line 6), if necessary after applyingpatches. (Builds are always done from the initial state of the source code form of thesystem.)
After the build, for all files found in the system (line 7), we collect their full filepath and name, creation and modification times. For Java files we extract qualifiednames of contained top-level types, for class files we detect their qualified names.For JARs we explore their contents and collect information about the contained classfiles.
On line 8, we apply a filter, keeping only the source code that we consider to beboth system and core according to classifications presented in Section 6.2.1.
On line 9, we use the known start time of the build together with informationabout Java types computed on lines 7 and 8 to classify the JARs found after the buildeither as library JARs or built JARs. On line 10, we use the identified built JARs andthe compiled class files to identify Java types that were compiled during the build.Then, (line 11) we refine the system’s source code form p′src to consist only of thecompiled Java types together with the necessary library JARs. The binary form p′binis refined (line 12) to consist of the built JARs.
The refined system p′ (line 13) is validated (line 14) by rebuilding the system ina sandbox, outside its specific setup, while only using the files that have been iden-tified by the method. (In practice, we use an Eclipse workspace with automaticallygenerated configuration files (i.e., .system and .classpath).) If we were ableto correctly filter out source code and detect libraries, the system successfully buildsin this manner. We can add the refined system to the corpus (line 15) and run factextraction on it (line 16).
This pseudocode is, of course, an idealized description of the process. In practice,we would execute line 4 only once per system; line 5 could be repeated several times,if the build coverage is found unsatisfactory in terms of compiled types—somethingthat becomes clear only on line 9. We treat lines 6–10 as an atomic action, call it a“corpus build,” and perform it on regular basis. As additional means of validation,during the step on line 10, we use visual aids to understand the completeness ofbuilds (see Section 6.3.5 for an example).
6.3 Reengineering Qualitas
In this section we provide results of applying our method to the Qualitas corpus.
6.3.1 Details of Qualitas Content
The Qualitas curated Java code collection [175] for each included system providesboth source code and binary form as they are distributed by developers. No additional
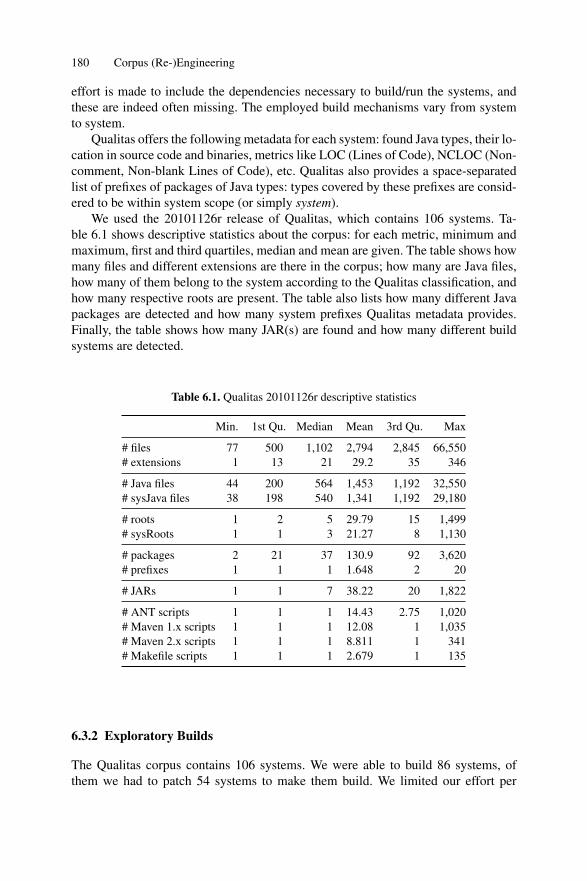
180 Corpus (Re-)Engineering
effort is made to include the dependencies necessary to build/run the systems, andthese are indeed often missing. The employed build mechanisms vary from systemto system.
Qualitas offers the following metadata for each system: found Java types, their lo-cation in source code and binaries, metrics like LOC (Lines of Code), NCLOC (Non-comment, Non-blank Lines of Code), etc. Qualitas also provides a space-separatedlist of prefixes of packages of Java types: types covered by these prefixes are consid-ered to be within system scope (or simply system).
We used the 20101126r release of Qualitas, which contains 106 systems. Ta-ble 6.1 shows descriptive statistics about the corpus: for each metric, minimum andmaximum, first and third quartiles, median and mean are given. The table shows howmany files and different extensions are there in the corpus; how many are Java files,how many of them belong to the system according to the Qualitas classification, andhow many respective roots are present. The table also lists how many different Javapackages are detected and how many system prefixes Qualitas metadata provides.Finally, the table shows how many JAR(s) are found and how many different buildsystems are detected.
Table 6.1. Qualitas 20101126r descriptive statistics
Min. 1st Qu. Median Mean 3rd Qu. Max
# files 77 500 1,102 2,794 2,845 66,550# extensions 1 13 21 29.2 35 346
# Java files 44 200 564 1,453 1,192 32,550# sysJava files 38 198 540 1,341 1,192 29,180
# roots 1 2 5 29.79 15 1,499# sysRoots 1 1 3 21.27 8 1,130
# packages 2 21 37 130.9 92 3,620# prefixes 1 1 1 1.648 2 20
# JARs 1 1 7 38.22 20 1,822
# ANT scripts 1 1 1 14.43 2.75 1,020# Maven 1.x scripts 1 1 1 12.08 1 1,035# Maven 2.x scripts 1 1 1 8.811 1 341# Makefile scripts 1 1 1 2.679 1 135
6.3.2 Exploratory Builds
The Qualitas corpus contains 106 systems. We were able to build 86 systems, ofthem we had to patch 54 systems to make them build. We limited our effort per
6.3 Reengineering Qualitas 181
system during exploratory builds, and in some complex cases, systems could not bebuilt within the time constraints.
We applied the following kinds of build patches (the number of patches appliedof each kind is given in parentheses):
• addJar (197): add a JAR• makeDir (98): create a necessary directory• addFile (76): add a non-Java file• batchBuild (34): execute several build files or targets• moveDir (30): move a directory• patchBuildFile (22): patch an existing build file• changeJDK (8): use a specific Java version• addSettings (8): add a file with properties/settings• patchSettings (7): patch a file with properties/settings• moveFile (6): move a non-Java file• addBuildFile (6): add a build file• patchSrc (5): patch a Java file• changeBuildV (5): use specific build system version• chmod (1): make a file executable
The most common patch operation is addJar: almost 200 JARs were added to30 systems to make them build (not counting libraries that Maven downloads auto-matically). The next two most frequent patches, makeDir and addFile are aimed tocreate the file layout as the build script expects it to be. While creating new directo-ries is needed for 20 systems, only 4 systems are responsible for the sum of addedfiles (missing resources).
Almost half of the patched systems (25 out of 54) needs only one type of fixing,the most popular being patches of build files (6 systems), missing library JARs (5systems), and usage of specific Java version (4 systems). The number of systemsrequiring 2, 3, 4, 5, and 6 kinds of patches was 9, 10, 6, 2, and 2, respectively.
We used ANT to build the majority of systems. Some systems support more thanone build system (e.g., both ANT and Maven)—in such cases we opted for ANT.In total, for building the corpus, ANT was used 69 times, Maven 2.x—11 times,Maven 1.x—3 times, a Bash script—2 times, and Makefile once.
In the rest of the study, we operate only on systems that we were able to build.
6.3.3 Identifying Core Files and Types
We heuristically classify files (and, by extension, types) into core, test, and demo bychecking whether some part of the file path starts or ends with any of the followingterms:
• Category test: test, tests, testcase, testcases, testsuite, testsuites, testing, junit3
3 We did not apply this heuristic to junit, since the application area of this system is testing.Instead, junit types were classified manually.

182 Corpus (Re-)Engineering
• Category demo: demo, demos, tutorial, tutorials, example, examples, sample,samples
For the test category, we additionally check if the file name ends with either “Test,”“TestCase,” or “TestSuite.” By default, source code is considered to be core.
In Fig. 6.1 we show systems that contain code other than core (there are 69 ofthem); they are ordered by the percentage of non-core files. The table below the
0 10 20 30 40 50 60 70
010
2030
40
Systems
% o
f non
−m
ain
files
●
●
●
●
●
●
●
●
●●
●
●
●●●
●●
●
●●
●
●●
●
●●
●
●●
●
●
●●●●
●
●
●
●
●
●●
●
●
●
●
●
●
●●
●
●
●
●●
●●
●
●
●
●●●
●
●
●
●●●●●●●●●●●●●●●●●●●●●●●●●●●●●●●●
●
●●●●●●●●●●●●●●●●●●●●●●●●●●●●●●●●●●●●●
●
●
total (non−main)demotestdemo (fp)test (fp)
% Min. 1st Qu. Median Mean 3rd Qu. Max
total 0.04 5.36 10.73 14.14 19.09 46.2
test 0.04 4.57 9.75 11.81 17.04 41.91demo 0.11 0.91 1.78 5.88 6.66 30.65
Figure 6.1. Distribution of non-core code
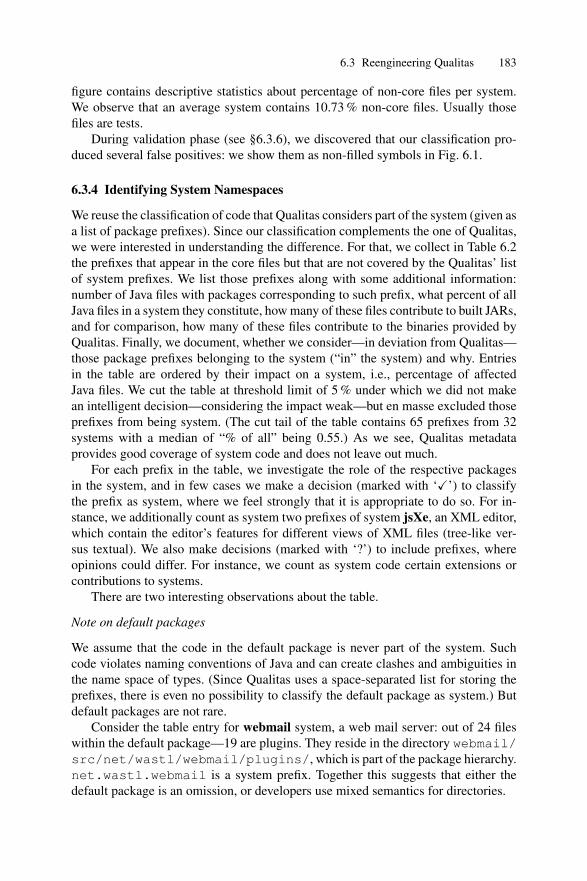
6.3 Reengineering Qualitas 183
figure contains descriptive statistics about percentage of non-core files per system.We observe that an average system contains 10.73 % non-core files. Usually thosefiles are tests.
During validation phase (see §6.3.6), we discovered that our classification pro-duced several false positives: we show them as non-filled symbols in Fig. 6.1.
6.3.4 Identifying System Namespaces
We reuse the classification of code that Qualitas considers part of the system (given asa list of package prefixes). Since our classification complements the one of Qualitas,we were interested in understanding the difference. For that, we collect in Table 6.2the prefixes that appear in the core files but that are not covered by the Qualitas’ listof system prefixes. We list those prefixes along with some additional information:number of Java files with packages corresponding to such prefix, what percent of allJava files in a system they constitute, how many of these files contribute to built JARs,and for comparison, how many of these files contribute to the binaries provided byQualitas. Finally, we document, whether we consider—in deviation from Qualitas—those package prefixes belonging to the system (“in” the system) and why. Entriesin the table are ordered by their impact on a system, i.e., percentage of affectedJava files. We cut the table at threshold limit of 5 % under which we did not makean intelligent decision—considering the impact weak—but en masse excluded thoseprefixes from being system. (The cut tail of the table contains 65 prefixes from 32systems with a median of “% of all” being 0.55.) As we see, Qualitas metadataprovides good coverage of system code and does not leave out much.
For each prefix in the table, we investigate the role of the respective packagesin the system, and in few cases we make a decision (marked with ‘X’) to classifythe prefix as system, where we feel strongly that it is appropriate to do so. For in-stance, we additionally count as system two prefixes of system jsXe, an XML editor,which contain the editor’s features for different views of XML files (tree-like ver-sus textual). We also make decisions (marked with ‘?’) to include prefixes, whereopinions could differ. For instance, we count as system code certain extensions orcontributions to systems.
There are two interesting observations about the table.
Note on default packages
We assume that the code in the default package is never part of the system. Suchcode violates naming conventions of Java and can create clashes and ambiguities inthe name space of types. (Since Qualitas uses a space-separated list for storing theprefixes, there is even no possibility to classify the default package as system.) Butdefault packages are not rare.
Consider the table entry for webmail system, a web mail server: out of 24 fileswithin the default package—19 are plugins. They reside in the directory webmail/src/net/wastl/webmail/plugins/, which is part of the package hierarchy.net.wastl.webmail is a system prefix. Together this suggests that either thedefault package is an omission, or developers use mixed semantics for directories.
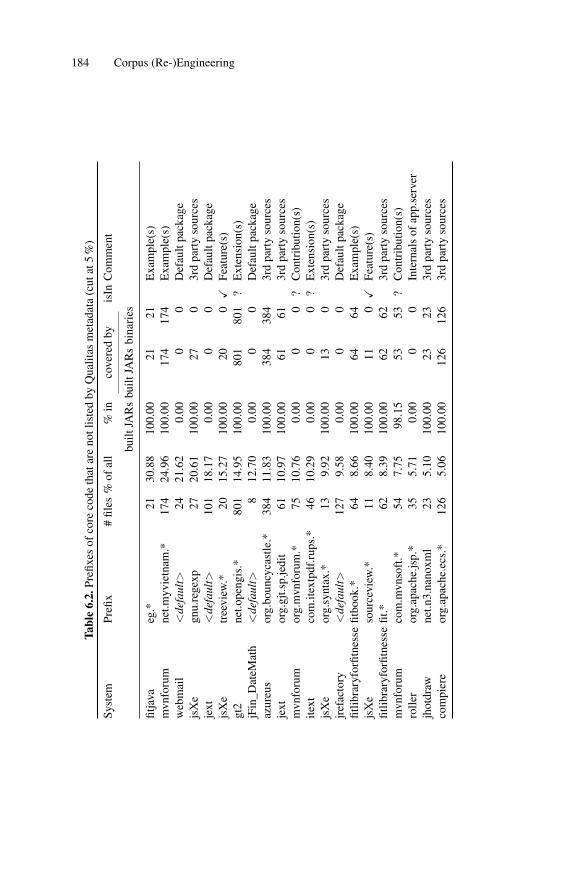
184 Corpus (Re-)Engineering
Tabl
e6.
2.Pr
efixe
sof
core
code
that
are
notl
iste
dby
Qua
litas
met
adat
a(c
utat
5%
)
Syst
emPr
efix
#fil
es%
ofal
l%
inco
vere
dby
isIn
Com
men
t
built
JAR
sbu
iltJA
Rs
bina
ries
fitja
vaeg
.*21
30.8
810
0.00
2121
Exa
mpl
e(s)
mvn
foru
mne
t.myv
ietn
am.*
174
24.9
610
0.00
174
174
Exa
mpl
e(s)
web
mai
l<
defa
ult>
2421
.62
0.00
00
Def
ault
pack
age
jsX
egn
u.re
gexp
2720
.61
100.
0027
03r
dpa
rty
sour
ces
jext
<de
faul
t>10
118
.17
0.00
00
Def
ault
pack
age
jsX
etr
eevi
ew.*
2015
.27
100.
0020
0X
Feat
ure(
s)gt
2ne
t.ope
ngis
.*80
114
.95
100.
0080
180
1?
Ext
ensi
on(s
)jF
in_D
ateM
ath
<de
faul
t>8
12.7
00.
000
0D
efau
ltpa
ckag
eaz
ureu
sor
g.bo
uncy
cast
le.*
384
11.8
310
0.00
384
384
3rd
part
yso
urce
sje
xtor
g.gj
t.sp.
jedi
t61
10.9
710
0.00
6161
3rd
part
yso
urce
sm
vnfo
rum
org.
mvn
foru
m.*
7510
.76
0.00
00
?C
ontr
ibut
ion(
s)ite
xtco
m.it
extp
df.ru
ps.*
4610
.29
0.00
00
?E
xten
sion
(s)
jsX
eor
g.sy
ntax
.*13
9.92
100.
0013
03r
dpa
rty
sour
ces
jref
acto
ry<
defa
ult>
127
9.58
0.00
00
Def
ault
pack
age
fitlib
rary
forfi
tnes
sefit
book
.*64
8.66
100.
0064
64E
xam
ple(
s)js
Xe
sour
cevi
ew.*
118.
4010
0.00
110X
Feat
ure(
s)fit
libra
ryfo
rfitn
esse
fit.*
628.
3910
0.00
6262
3rd
part
yso
urce
sm
vnfo
rum
com
.mvn
soft
.*54
7.75
98.1
553
53?
Con
trib
utio
n(s)
rolle
ror
g.ap
ache
.jsp.
*35
5.71
0.00
00
Inte
rnal
sof
app.
serv
erjh
otdr
awne
t.n3.
nano
xml
235.
1010
0.00
2323
3rd
part
yso
urce
sco
mpi
ere
org.
apac
he.e
cs.*
126
5.06
100.
0012
612
63r
dpa
rty
sour
ces
6.3 Reengineering Qualitas 185
Another example is jext system, a programmer’s text editor. It has 101 fileswithin the default package, of them 99 constitute 11 different plugins. Yet, jext hasone more plugin, which uses non-default packages and is therefore included as sys-tem.
Note on third party sources
We see that it is usual practice among systems to include large amounts of 3rd-partysource code. We do not count it as system code, but without clone detection, onecannot be sure that 3rd-party code was not modified/adjusted and had not become anintegral part of the system.
6.3.5 Builds
In order to understand the result of a build, we measure the percentage of Java types(system and core) found in built JARs. In Table 6.3 we list systems with incom-plete builds, sorted by percentage of types not found in built JARs. Along with basicinformation—number of all Java types, percentage of them non-compiled—the tableincludes the number of roots and packages completely or partially missing in builtJARs. We also show a comparison with coverage of Java types by binaries includedin Qualitas, see column “Compare to Q”: “=” means the same coverage and “>”means that our build result misses more types than the binaries included in Qualitas.We cut the table at 5 % of non-packed types, the tail of the table contains 21 moresystems with median of percentage of non-packed types equal to 1.05 %.
An asterisk next to the system name means that types not found in built JARswere nonetheless compiled (values in columns 3 and 4 differ). Careful reading ofbuild scripts revealed that this is due to white- or blacklisting of files or directoriesdone in ANT scripts.
We tried to identify the reason for missing types. Based on several investigatedcases, we concluded that completely missing packages or roots are an indication ofomitted build goals. These packages or roots then typically correspond to modularcode, like an optional feature. We automatically identify such cases.
For instance, the james system provides libraries for Internet mail communi-cation. All non-built types are in the root hierarchy that starts with a directoryproposals/ and the build script does not compile it.4 A similar situation iswith the checkstyle system providing support for coding standards: all its non-builtsources are in the root hierarchy starting with the directory contrib/, which isalso not compiled by the build script.
4 One partially compiled root upon closer inspection revealed to contain a type with the samequalified name as a type from src/ directory, thus being counted as compiled.

186 Corpus (Re-)Engineering
Tabl
e6.
3.In
com
plet
ebu
ilds
(cut
at5
%)
Syst
emty
pes
Com
pare
toQ
#no
n-pa
cked
root
s#
non-
pack
edpa
ckag
esR
easo
n
#to
tal
%no
n-co
mpi
led
%no
n-pa
cked
com
plet
ely
part
ially
com
plet
ely
part
ially
mvn
foru
m51
036
.08
36.0
8=
30
110
Feat
ure
trov
e*32
0.00
34.3
8=
01
20
Feat
ure
jam
es41
934
.13
34.1
3=
14
43
???
chec
ksty
le35
925
.63
25.6
3=
20
60
Feat
ure
log4
j*24
211
.16
23.1
4>
81
44
???
gt2
5234
17.9
017
.90
>34
812
825
???
jref
acto
ry11
9914
.18
14.1
8>
31
140
Feat
ure
itext
447
10.2
910
.29
=1
010
0Fe
atur
eju
ng35
89.
789.
78>
20
60
Feat
ure
hsql
db*
428
3.27
9.58
>0
13
1??
?na
kedo
bjec
ts21
768.
968.
96=
90
333
Feat
ure
jext
365
8.77
8.77
>1
03
0Fe
atur
ede
rby*
1779
1.41
7.31
=3
517
27??
?ja
g13
06.
156.
15=
10
11
Feat
ure
prog
uard
562
5.87
5.87
>0
20
10??
?

6.3 Reengineering Qualitas 187
info0 / 11
completer0 / 10
popup0 / 13
.
src1028 / 1164
(a) Root forest
popup0 / 13
completer0 / 10
info0 / 11
version0 / 6
elixir0 / 12
action0 / 6
jedit0 / 12
event0 / 3
jbuilder0 / 35
refactor0 / 14
ide
jdeveloper0 / 1
netbeans0 / 42
kawa0 / 1
cafe0 / 4
seguinacmorg
(b) Package forest
Figure 6.2. Non-built types of jrefactory: triangles represent empty packages/directories;squares show how many types are compiled in a directory/package.
Another example is the jrefactory refactoring tool. Fig. 6.2 presents the forestsof the non-built roots and packages. The root forest shows that there are several com-pletely non-built directories, while some code wasn’t built in the main root, src/.Package forest shows that a large part of the non-built packages has a common prefixthat apparently contains the code for integration with IDEs. Inspection of the buildscript reveals conditional builds: if certain classes of different IDEs are not foundin the classpath, the corresponding parts of the code are excluded from compilation.The build script operates only on src/ which explains non-built types outside it.
In such manner we inspected the incomplete builds to decide whether to acceptthe result or to attempt to increase the build coverage.
6.3.6 Validation
To validate our effort, we automatically converted the built and refined systems intoEclipse projects, based on the data collected during the build. Successful compilationof a system in Eclipse shows that the classpath and the filtering of source code arecorrect. In such manner, we successfully validated 79 systems (out of 86 built ones).There are a few cases where validation via export to Eclipse is not possible. Forexample, in case of the nekohtml system, different parts of the code are compiledwith different versions of a library JAR. While in an ANT script it is possible tochange the classpath during compilation, in Eclipse, the classpath is a static globalsetting per system.
In particular, we validated our classification of files: if the exported code wouldnot compile due to its dependencies, we would revise the classification of corecode (see empty squares and circles in Fig. 6.1). In those few cases when a sys-tem’s core code indeed required the non-core code (e.g., to run self tests via a spe-cific command line option), we included the compiled non-core classes into a li-brary JAR with the name <system>-sys.jar. Since some systems use 3rd-partysource code, we also ship those compiled classes in a library JAR with the name<system>-nonSys.jar

188 Corpus (Re-)Engineering
6.3.7 Automated Fact Extraction
To facilitate fact extraction for the corpus user, we offer (on the paper’s website) abasic fact-extractor based on RECODER [89]. The extractor runs automatically onthe whole corpus and checks for absence of syntax errors and unresolved references.It can be easily extended.
6.4 Threats to Validity
From the theoretical point of view, there are two threats: to construct validity and tocontent validity.
For instance, our decisions on what consistutes a system, its core part, are subjectto the threat to construct validity, because, arguably, tests can be considered to bepart of the system. We justify our decisions by taking an operational approach todefinition—a system is what runs in production, which usually excludes tests.
The selection of the projects is subject to the threat to content validity: is thesubset representative? We consider the Qualitas corpus to be a well-thought selectionfrom the group of Java projects that are usually characterized as “well-developed” or“real-world” applications. Therefore, it does not cover the whole spectrum of Javaprojects (for instance, student projects or throw-away prototypes are not included),however, the covered part is usually the main focus of the practical, applied, research.
Technically, we can identify the following threats:
• The exploratory builds are a manual process: In each case we decided, whichbuild scripts to execute, in which order, etc.
• The heuristic underlying our code purpose classification may give false positives(e.g., when the application domain of a system is itself testing) or false negatives(e.g., by relying on the particular file naming convention).
• The accuracy of the data in the refined corpus depends on the correctness of ourtoolchain. The toolchain was tested to eliminate bugs.
6.5 Related Work
Corpora
The related work on corpus engineering is summarized in Table 6.4. We list mainreference for each effort, date of latest release/update, size of the corpus and lan-guages of systems in it; what is the main purpose of the effort and in column Acc.we note, whether the corpus is accessible freely. The bibliographical reference (thefirst column) also include the web links where the corpora can be found.
The DaCapo project facilitates benchmarking: it provides a harness to measurerunning of the corpus. The systems in the binary form are provided within the Da-Capo JAR while sources of the systems come with the tool’s source code. The toolis freely available for download.

6.5 Related Work 189
Table 6.4. Corpus (re-)engineering efforts
Ref. Name Acc. Date Size Lang. Src Bin Depend. Purpose
[29] DaCapo + 12/2009 14 Java + + + Tool for Javabenchmarking
[77] FOSSology ± 10/2012 16 C/C++ + Framework foranalyzing licenses
[175] Qualitas – 04/2012 111 Java + + Collection for empiricalstudies of code artifacts
[56] SIR – 05/2012 73 Java, C, C#, C++ + + Infrastructure forcontrolledexperimentation withtesting techniques
[9] SPEC $ 08/2012 17 Java, C, Fortran, ? + + Collection of realistic,standardizedperformance tests
[124] Sourcerer ± 04/2010 18,826 Java + ± Infrastructure forlarge-scale source codeanalysis
[55] TraceLab + 07/2012 5 Java ± ± Framework for featurelocation research
The FOSSology project focuses on analyzing licenses in source code, providingits tools freely—one can download and use them on one’s systems locally. There isa demo repository available separately5.
Qualitas has two main distribution forms: recent version release contains 111systems and evolution release contains 486 versions of 14 systems that has at least10 versions per system. There is also a complete release containing 661 versions of111 systems. Download links are available upon request.
The Software-artifact Infrastructure Repository (SIR) provides infrastructure tosupport controlled experimentation with testing and regression testing techniques.Access to the tools and the corpus is available after registration with statement ofintent. Systems in the corpus contain real or seeded faults.
Standard Performance Evaluation Corporation is a non-profit organisation pro-viding SPECmarks, standardized suites of source code, for performance testing.There are 17 benchmarks available for a non-profit/educational price ranging from$50 to $900.
The Sourcerer project provides infrastructure for large-scale source code analysisas well as a prepared repository of more than 18,000 systems (of them non-empty13,241 systems). The full corpus is available upon request with statement of intent.
5 https://fossology.ist.unomaha.edu/

190 Corpus (Re-)Engineering
From the description of the process, given in [124] and on the website6, it is not clearwhether it contains resolved dependencies.
TraceLab is a framework for creating, running and sharing experiments using avisual modeling environment. Along with the tool, authors provide datasets contain-ing issues, associated functionality (methods), queries and execution traces. This in-formation was extracted from issue tracking systems, version repositories, and codeitself. According to the description of the process7, compilable source code of thesystems was used during creation of datasets, but datasets themselves do not seem tocontain it.
There are few other corpora like TraceLab that can be seen as meta-corpora, pro-viding metadata about the systems, but not the systems themselves. The FLOSSmoleproject [93] focuses on metadata about systems from different online repositories,such as Sourceforge, GNU Savannah, Google Code, GitHub, and others. Metadataincludes a name of a system, description, programming languages used, number ofdevelopers, date of creation, etc. All the data is freely available as textual files andSQL dumps. The PROMISE repository [151] contains datasets to facilitate researchon defect and effort prediction: extracted bug reports, modification requests and theirimpact on the code, as well as values of various source code metrics. All data in therepository is freely accessible.
Build systems
Research in the area of build systems is diverse. Complexity of build systems andtheir evolution, as well as correlation of these characteristics to the same of sourcecode has been studied for Make, ANT, and Maven build systems [11, 133]. TheMake system was also studied for the variability model it provides [127] and itscorrectness [145]. There are studies on the overhead of maintaining build systemsand its reasons [118, 134]. We are not aware of any effort on understanding what ittakes to make systems build: types of errors, missing libraries, needed patches, etc.Though studying the building process is not a central research question of our effort,we see our work as contributing towards this area of research.
6.6 Conclusion
We presented an approach to (re-)engineering a corpus of software systems. Theapproach transforms a raw source and binary distribution into a uniform and con-solidated representation of each system. Both source-code- and byte-code-based factextraction can be run automatically on the resulting corpus.
The need for the approach was derived from a literature survey on empiricalsoftware engineering efforts.
6 http://sourcerer.ics.uci.edu/tutorial.html7 http://www.cs.wm.edu/semeru/data/benchmarks/

6.6 Conclusion 191
We applied the reengineering approach to the Qualitas corpus, thus validating itseffectiveness as well as potential utility in developing reliable curated code collec-tions and building confidence in these collections with their users and developers.The resulting corpus is available to the public together with a sample fact extractionmechanism.
There are several directions for future work:
• An intelligent and reproducible technique of automatic attempts to build systemswith automatic classification of errors in order to identify patches.
• A refinement of the heuristic for identification of core files based on observationsthat we made, e.g.: discrepancy between Java packages and file path (usually asign of non-core files); imports in test files (indicating usage of a testing frame-work).
• A clone detection analysis of included 3rd-party source code which determineswhether such code was modified and integrated into the host system.
• A deeper analysis of builds for improved confidence in the builds. For instance,How clean is the state that we start from? What modifications occur duringthe build? What is the nature of differences between compiled classes and builtJARs?


Part IV
Conclusion


7
Conclusion
In this chapter, we summarize the outcome of the work presented in the thesis. Werevisit the contributions briefly stated in Introduction, Section 1.4, and substantiatethem based on the reported studies. We also outline open challenges and future work.

196 Conclusion
7.1 Summary
Let us revisit the research goals of the thesis posed in Introduction, Section 1.2.3 andlink them back to the studies reported in the thesis. We submitted in our work to:
1. Develop and apply techniques to empirically analyze actual usage of languages.
Part II of the thesis reports two extensive empirical studies. In a deep and system-atic manner, we have analyzed usage of a privacy language among websites on theInternet and usage of APIs among open-source projects. Despite the significant dif-ferences in the analyzed languages (application domains, language design), we haveshown that the approach for such analysis is essentially the same.
In the study of P3P language, we have utilized a broad and diverse range oftechniques, combining basic measures of language usage (such as footprint and cov-erage) with Software Engineering methods (validity analysis, clone detection), forthe purpose of revealing the status of language adoption.
In the study of APIs, we have applied the same basic measures of language us-age (such as footprint and coverage) to capture and classify features of APIs thatallow profiling and characterizing the projects using APIs. Based on this dual rela-tionship between APIs and projects, we have developed a catalogue of explorationinsights and implemented a tool for navigation of the code base for the benefit ofAPI consumers as well as API designers.
We also submitted in our work to:
2. Understand the usage of empirical evidence in Software Engineering research.
Part III of the thesis describes our effort on establishing the current state of researchin Software Engineering with respect to the usage of empirical evidence; it also op-erationally summarizes our experience in corpus engineering.
We have performed two pilot studies and the main literature survey, to workout the appropriate methodology for the task of analyzing published research withrespect to used empirical evidence. We have developed and adjusted the classificationscheme to capture that usage and summarize it.
We have found that use of project-based corpora is frequent in the practically ori-ented areas of Software Engineering such as program comprehension, maintenance,reverse engineering, and re-engineering. At the same time, we have found that thereis no explicit methodology for the common task of collecting a corpus as well as noapparent adoption of standardized corpora in the research community. Based on ourexperience gained during language studies, we have suggested a method of corpus(re-)engineering and demonstrated its application on an existing collection of Javaprograms.
7.2 Future Work 197
7.2 Future Work
Below we identify several lines of work stemming from the current thesis that wesee both interesting and practically appealing.
In the area of language usage, we see the following possible continuations:
• Active feedback: Turning the findings of language usage analysis into the basisfor close collaboration with language designers: working together on the nextversion of a language (e.g., in the privacy domain) or a new version of a library(e.g., particular Java API).
• Usage profiling: Detecting types of language usage (e.g., with the help of ma-chine learning or statistical inference); linking them with particular user needsbased either on metadata about the application area or via user studies.
• Replication studies: Applying the identified principles in studies of languagesrelatively similar to the analyzed in this thesis (e.g., usage of the SQL languageor Haskell libraries) and relatively distant from them (e.g., languages of real-timesystems like car engine control system or medical systems).
In the area of corpus engineering, we see the following possible continuations:
• Seeking explanations: One of the most intriguing open questions left for us iswhy standardized corpora are not adopted by the community. Testing hypothesesby qualitative studies (e.g., questionnaires) to find out whether researchers areaware of such corpora or by experiments to assess whether the overhead involvedin corpora adoption is impractical in the end.
• Involving community: Obliging authors to use a suggested corpus in their sub-missions to a certain track of a conference—similar to Mining Challenge hostedby the International Working Conference on Mining Software Repositories—butin other areas of Software Engineering, such as program comprehension, main-tenance, reverse engineering, and re-engineering.
Generally, in the area of Empirical Software (Language) Engineering, we stronglybelieve that the time has come to inspect the existing practices and detect com-mon places in research that are being addressed in ad hoc manner and require ex-plicit methodology. We also believe that the missing methodology can be and shouldbe distilled by the inductive approach from the individual solutions of a repetitiveproblem—thus leading to research-driven research.

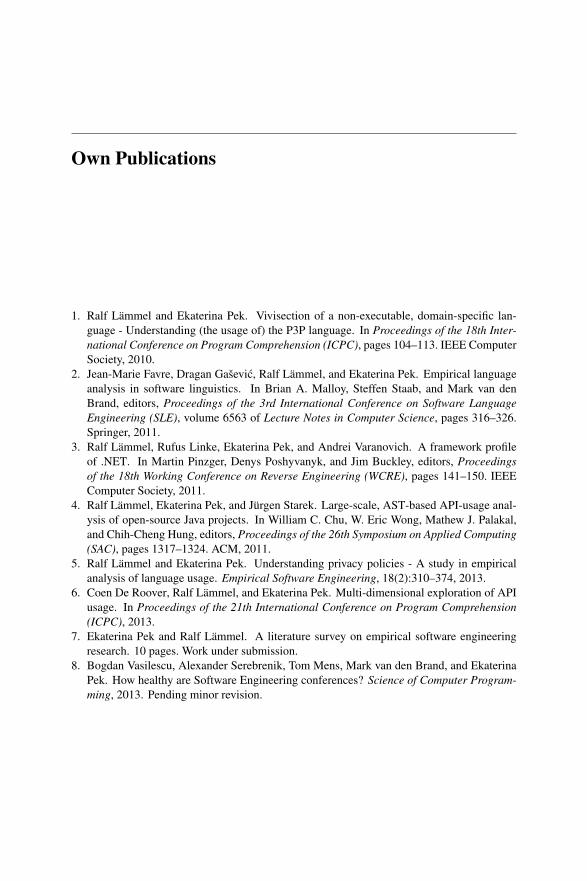
Own Publications
1. Ralf Lämmel and Ekaterina Pek. Vivisection of a non-executable, domain-specific lan-guage - Understanding (the usage of) the P3P language. In Proceedings of the 18th Inter-national Conference on Program Comprehension (ICPC), pages 104–113. IEEE ComputerSociety, 2010.
2. Jean-Marie Favre, Dragan Gaševic, Ralf Lämmel, and Ekaterina Pek. Empirical languageanalysis in software linguistics. In Brian A. Malloy, Steffen Staab, and Mark van denBrand, editors, Proceedings of the 3rd International Conference on Software LanguageEngineering (SLE), volume 6563 of Lecture Notes in Computer Science, pages 316–326.Springer, 2011.
3. Ralf Lämmel, Rufus Linke, Ekaterina Pek, and Andrei Varanovich. A framework profileof .NET. In Martin Pinzger, Denys Poshyvanyk, and Jim Buckley, editors, Proceedingsof the 18th Working Conference on Reverse Engineering (WCRE), pages 141–150. IEEEComputer Society, 2011.
4. Ralf Lämmel, Ekaterina Pek, and Jürgen Starek. Large-scale, AST-based API-usage anal-ysis of open-source Java projects. In William C. Chu, W. Eric Wong, Mathew J. Palakal,and Chih-Cheng Hung, editors, Proceedings of the 26th Symposium on Applied Computing(SAC), pages 1317–1324. ACM, 2011.
5. Ralf Lämmel and Ekaterina Pek. Understanding privacy policies - A study in empiricalanalysis of language usage. Empirical Software Engineering, 18(2):310–374, 2013.
6. Coen De Roover, Ralf Lämmel, and Ekaterina Pek. Multi-dimensional exploration of APIusage. In Proceedings of the 21th International Conference on Program Comprehension(ICPC), 2013.
7. Ekaterina Pek and Ralf Lämmel. A literature survey on empirical software engineeringresearch. 10 pages. Work under submission.
8. Bogdan Vasilescu, Alexander Serebrenik, Tom Mens, Mark van den Brand, and EkaterinaPek. How healthy are Software Engineering conferences? Science of Computer Program-ming, 2013. Pending minor revision.


References
9. Standard Performance Evaluation Corporation benchmark suites.10. Mithun Acharya, Tao Xie, Jian Pei, and Jun Xu. Mining API patterns as partial orders
from source code: from usage scenarios to specifications. In ESEC-FSE ’07: Proceed-ings of the the 6th joint meeting of the European software engineering conference andthe ACM SIGSOFT symposium on The foundations of software engineering, pages 25–34. ACM, 2007.
11. Bram Adams, Herman Tromp, Kris De Schutter, and Wolfgang De Meuter. Designrecovery and maintenance of build systems. In ICSM, pages 114–123, 2007.
12. Steve Adolph, Wendy Hall, and Philippe Kruchten. A methodological leg to stand on:Lessons learned using grounded theory to study software development. In CASCON,pages 13:166–13:178, 2008.
13. Rakesh Agrawal, Paul Bird, Tyrone Grandison, Jerry Kiernan, Scott Logan, and WalidRjaibi. Extending relational database systems to automatically enforce privacy policies.In ICDE ’05: Proceedings of the 21st International Conference on Data Engineering,pages 1013–1022. IEEE Computer Society, 2005.
14. Rakesh Agrawal, Jerry Kiernan, Ramakrishnan Srikant, and Yirong Xu. An XPath-based preference language for P3P. In Proceedings of WWW 2003, pages 629–639.ACM, 2003.
15. Rakesh Agrawal, Jerry Kiernan, Ramakrishnan Srikant, and Yirong Xu. XPref: a pref-erence language for P3P. Computer Networks, 48(5):809–827, 2005.
16. Tiago Alves and Joost Visser. Metrication of SDF grammars. Technical Report DI-PURe-05.05.01, Universidade do Minho, 2005.
17. Paul Ashley. Enforcement of a P3P privacy policy. In Proceedings of the 2nd Aus-tralian Information Security Management Conference, Securing the Future, pages 11–26. School of Computer and Information Science, Edith Cowan University, WesternAustralia, 2004.
18. Magdalena Balazinska, Ettore Merlo, Michel Dagenais, Bruno Laguë, and Kostas Kon-togiannis. Advanced Clone-Analysis to Support Object-Oriented System Refactoring.In Proceedings of the Seventh Working Conference on Reverse Engineering (WCRE’00),pages 98–107. IEEE Computer Society, 2000.
19. Margaret Burnett Barbara G. Ryder, Mary Lou Soffa. The impact of software engi-neering research on modern progamming languages. ACM Transactions on SoftwareEngineering and Methodology, 14(4):431–477, October 2005.

202 References
20. Thiago Tonelli Bartolomei, Krzysztof Czarnecki, and Ralf Lämmel. Swing to SWT andback: Patterns for API migration by wrapping. In ICSM, pages 1–10, 2010.
21. Thiago Tonelli Bartolomei, Krzysztof Czarnecki, and Ralf Lämmel. Swing to SWT andback: Patterns for API migration by wrapping. In 26th IEEE International Conferenceon Software Maintenance (ICSM 2010), pages 1–10. IEEE, 2010.
22. Thiago Tonelli Bartolomei, Krzysztof Czarnecki, Ralf Lämmel, and Tijs van der Storm.Study of an API migration for two XML APIs. In SLE, pages 42–61, 2010.
23. Victor Basili, Gianluigi Caldiera, and H. Dieter Rombach. The goal question metricapproach, 1994.
24. Gareth Baxter, Marcus Frean, James Noble, Mark Rickerby, Hayden Smith, Matt Visser,Hayden Melton, and Ewan Tempero. Understanding the shape of Java software. InProceedings of OOPSLA 2006, pages 397–412. ACM, 2006.
25. Gareth Baxter, Marcus R. Frean, James Noble, Mark Rickerby, Hayden Smith, MattVisser, Hayden Melton, and Ewan D. Tempero. Understanding the shape of java soft-ware. In OOPSLA, pages 397–412, 2006.
26. Ira D. Baxter, Andrew Yahin, Leonardo Moura, Marcelo Sant’Anna, and Lorraine Bier.Clone detection using abstract syntax trees. In Proceedings of ICSM 1998, page 368.IEEE Computer Society, 1998.
27. Lise Jensen Bertil Ekdahl. The difficulty in communicating with computers. In Inter-active Convergence: Critical Issues in Multimedia, chapter 2. Inter-Disciplinary Press,2005.
28. Gavin M. Bierman, Erik Meijer, and Wolfram Schulte. The Essence of Data Access inComega. In ECOOP 2005 - Object-Oriented Programming, 19th European Conference,Proceedings, volume 3586 of LNCS, pages 287–311. Springer, 2005.
29. S. M. Blackburn, R. Garner, C. Hoffman, A. M. Khan, K. S. McKinley, R. Bentzur,A. Diwan, D. Feinberg, D. Frampton, S. Z. Guyer, M. Hirzel, A. Hosking, M. Jump,H. Lee, J. E. B. Moss, A. Phansalkar, D. Stefanovic, T. VanDrunen, D. von Dincklage,and B. Wiedermann. The DaCapo benchmarks: Java benchmarking development andanalysis. In OOPSLA, pages 169–190, 2006. http://dacapobench.org/.
30. E. T. Bonelli and J. Sinclair. Corpora. In Keith Brown, editor, Encyclopedia of languageand linguistics. Elsevier Science, 2006.
31. Lee Breslau, Pei Cao, Li Fan, Graham Phillips, and Scott Shenker. Web caching andZipf-like distributions: Evidence and implications. In INFOCOM, pages 126–134, 1999.
32. Marcel Bruch, Martin Monperrus, and Mira Mezini. Learning from examples to improvecode completion systems. In ESEC/SIGSOFT FSE, pages 213–222, 2009.
33. Andrea Brühlmann, Tudor Gîrba, Orla Greevy, and Oscar Nierstrasz. Enriching reverseengineering with annotations. In MoDELS, pages 660–674, 2008.
34. R. J. Chevance and T. Heidet. Static profile and dynamic behavior of COBOL programs.SIGPLAN Notices, 13(4):44–57, 1978.
35. Kelvin Choi and Ewan D. Tempero. Dynamic measurement of polymorphism. In Pro-ceedings of the Thirtieth Australasian Computer Science Conference (ACSC2007), vol-ume 62 of CRPIT, pages 211–220. Australian Computer Society, 2007.
36. Aaron Clauset, Cosma Rohilla Shalizi, and Mark E. J. Newman. Power-law distributionsin empirical data. SIAM Review, 51(4):661–703, 2009.
37. Christian S. Collberg, Ginger Myles, and Michael Stepp. An empirical study of Javabytecode programs. Technical Report TR04-11, University of Arizona, 2004.
38. Christian S. Collberg, Ginger Myles, and Michael Stepp. An empirical study of Javabytecode programs. Software, Practice & Experience, 37(6):581–641, 2007.

References 203
39. Giulio Concas, Michele Marchesi, Alessandro Murgia, Sandro Pinna, and RobertoTonelli. Assessing traditional and new metrics for object-oriented systems. In Proceed-ings of the 2010 ICSE Workshop on Emerging Trends in Software Metrics, WETSoM’10, pages 24–31. ACM, 2010.
40. Robert P. Cook and Insup Lee. A contextual analysis of Pascal programs. Software,Practice & Experience, 12(2):195–203, 1982.
41. Harris M. Cooper. The integrative research review: A systematic approach, volume 2 ofApplied social research methods series. Sage, 1984.
42. Lorrie Faith Cranor. Web Privacy with P3P. O’Reilly & Associates, 2002.43. Lorrie Faith Cranor. RE: COMMENTS ON FEDERAL TRADE COMMISSION
PRELIMINARY STAFF REPORT. Protecting Consumer Privacy in an Era of RapidChange: A Proposed Framework for Businesses and Policymakers, 2011. Available on-line at http://www.ftc.gov/os/comments/privacyreportframework/00453-58003.pdf.
44. Lorrie Faith Cranor, Serge Egelman, Steve Sheng, Aleecia M. McDonald, and AbdurChowdhury. P3P deployment on websites. Electronic Commerce Research and Appli-cations, 7(3):274–293, 2008.
45. David Crystal. The Cambridge Encyclopedia of Language, Second Edition. CambridgeUniversity Press, 2005.
46. Hamish Cunningham. A definition and short history of language engineering. Journalof Natural Language Engineering, 5:1–16, 1999.
47. Krzysztof Cwalina and Brad Abrams. Framework design guidelines. Conventions, id-ioms, and patterns for reusable .NET libraries. Addison-Wesley, 2009.
48. Melis Dagpinar and Jens H. Jahnke. Predicting maintainability with object-orientedmetrics - An empirical comparison. In Proceedings of the 10th Working Conference onReverse Engineering, WCRE ’03, pages 155–164. IEEE, 2003.
49. Marco D’Ambros, Michele Lanza, and Romain Robbes. An extensive comparison of bugprediction approaches. In MSR, pages 31–41, 2010. http://bug.inf.usi.ch/.
50. Suresh Jagannathan David Gelernter. Programming Linguistics. MIT Press, 1990.51. Brian de Alwis and Gail C. Murphy. Answering conceptual queries with Ferret. In ICSE,
pages 21–30, 2008.52. Antonio Soares de Azevedo Terceiro, Manoel G. Mendonça, Christina Chavez, and
Daniela S. Cruzes. Understanding structural complexity evolution: A quantitative anal-ysis. In CSMR, pages 85–94, 2012.
53. Coen De Roover, Carlos Noguera, Andy Kellens, and Viviane Jonckers. The SOUL toolsuite for querying programs in symbiosis with Eclipse. In PPPJ, pages 71–80, 2011.
54. Jens Dietrich, Catherine McCartin, Ewan D. Tempero, and Syed M. Ali Shah. Barriersto modularity - an empirical study to assess the potential for modularisation of javaprograms. In 6th International Conference on the Quality of Software Architectures,QoSA 2010, Proceedings, volume 6093 of LNCS, pages 135–150. Springer, 2010.
55. Bogdan Dit, Evan Moritz, and Denys Poshyvanyk. A TraceLab-based solution for cre-ating, conducting, and sharing feature location experiments. In ICPC, pages 203–208,2012.
56. Hyunsook Do, Sebastian Elbaum, and Gregg Rothermel. Supporting controlled exper-imentation with testing techniques: An infrastructure and its potential impact. Empir.Softw. Eng., 10(4):405–435, 2005. http://sir.unl.edu/.
57. Serge Egelman, Lorrie Faith Cranor, and Abdur Chowdhury. An analysis of P3P-enabledWeb sites among top-20 search results. In Mark S. Fox and Bruce Spencer, editors,ICEC, volume 156 of ACM International Conference Proceeding Series, pages 197–207. ACM, 2006.

204 References
58. Daniel S. Eisenberg, Jeffrey Stylos, Andrew Faulring, and Brad A. Myers. Using as-sociation metrics to help users navigate API documentation. In VL/HCC, pages 23–30,2010.
59. Daniel S. Eisenberg, Jeffrey Stylos, and Brad A. Myers. Apatite: A new interface forexploring APIs. In CHI, pages 1331–1334, 2010.
60. Eva Van Emden and Leon Moonen. Java quality assurance by detecting code smells. InWCRE, pages 97–108, 2002.
61. Raimar Falke, Pierre Frenzel, and Rainer Koschke. Empirical evaluation of clone detec-tion using syntax suffix trees. Empirical Softw. Engg., 13:601–643, December 2008.
62. Jean-Marie Favre. Languages evolve too! changing the software time scale. In IEEE, ed-itor, 8th Interntational Workshop on Principles of Software Evolution, IWPSE, Septem-ber 2005.
63. Norman E. Fenton and Shari Lawrence Pfleeger. Software Metrics: A Rigorous andPractical Approach. PWS Publishing Co., 2nd edition, 1996.
64. Kathi Fisler, Shriram Krishnamurthi, and Daniel J. Dougherty. Embracing policy engi-neering. In Proceedings of the FSE/SDP workshop on Future of software engineeringresearch, FoSER ’10, pages 109–110. ACM, 2010.
65. Francesca Arcelli Fontana, Andrea Caracciolo, and Marco Zanoni. DPB: A benchmarkfor design pattern detection tools. In CSMR, pages 235–244, 2012.
66. Jill Freyne, Lorcan Coyle, Barry Smyth, and Padraig Cunningham. Relative status ofjournal and conference publications in computer science. Commun. ACM, 53(11):124–132, November 2010.
67. E. Fudge. Glossematics. In Keith Brown, editor, Encyclopedia of language and linguis-tics. Elsevier Science, 2006.
68. Hristo Georgiev. Language Engineering. Continuum, 2007.69. Malcom Gethers, Bogdan Dit, Huzefa H. Kagdi, and Denys Poshyvanyk. Integrated
impact analysis for managing software changes. In ICSE, pages 430–440, 2012.70. Kambiz Ghazinour and Ken Barker. Capturing P3P semantics using an enforceable
lattice-based structure. In Proceedings of the 4th International Workshop on Privacyand Anonymity in the Information Society, PAIS ’11, pages 4:1–4:6. ACM, 2011.
71. Joseph (Yossi) Gil and Itay Maman. Micro patterns in Java code. In Proceedings ofOOPSLA 2005, pages 97–116. ACM, 2005.
72. Barney G. Glaser. Doing Quantitative Grounded Theory. Sociology Press, 2008.73. Barney G. Glaser and Anselm L. Strauss. Awareness of Dying. Aldine Pub., 1965.74. Barney G. Glaser and Anselm L. Strauss. The Discovery of Grounded Theory: Strategies
for Qualitative Research. Aldine Pub., 1967.75. Gene V. Glass, Barry McGaw, and Mary Lee Smith. Meta-analysis in social research.
Sage, Beverly Hills, CA, 1981.76. Robert L. Glass, Iris Vessey, and Venkataraman Ramesh. Research in software engineer-
ing: An analysis of the literature. Inform. Software Tech., 44(8):491–506, 2002.77. Robert Gobeille. The FOSSology project. In MSR ’08: Proceedings of the 2008 inter-
national working conference on Mining software repositories, pages 47–50, New York,NY, USA, 2008. ACM.
78. Jesús M. González-Barahona and Gregorio Robles. On the reproducibility of empiri-cal software engineering studies based on data retrieved from development repositories.Empir. Softw. Eng., 17(1-2):75–89, 2012.
79. J.B. Goodenough. The comparison of programming languages: A linguistic approach.ACM/CSC-ER, 1968.

References 205
80. Yann-Gaël Guéhéneuc. PMARt: Pattern-like micro architecture repository. In Euro-PLoP Focus Group on Pattern Repositories, 2007. http://www.ptidej.net/download/pmart/.
81. Jurriaan Hage and Peter van Keeken. Neon: A library for language usage analysis.In Software Language Engineering, First International Conference, SLE 2008, volume5452 of LNCS, pages 35–53. Springer, 2009.
82. Michael Hahsler. A quantitative study of the adoption of design patterns by open sourcesoftware developers. In Free/Open Source Software Development, IGP, pages 103–123,2004.
83. Michael Hahsler and Stefan Koch. Discussion of a large-scale open source data collec-tion methodology. Hawaii International Conference on System Sciences, 7:197b, 2005.
84. A. Hardie and T. McEnery. Statistics. In Keith Brown, editor, Encyclopedia of languageand linguistics. Elsevier Science, 2006.
85. Edwin Hautus. Improving Java Software Through Package Structure Analysis. In Pro-ceedings of the 6th IASTED International Conference Software Engineering and Appli-cations, 2002.
86. Katia Hayati and Martín Abadi. Language-based enforcement of privacy policies. InPrivacy Enhancing Technologies, 4th International Workshop, PET 2004, Revised Se-lected Papers, volume 3424 of LNCS, pages 302–313. Springer, 2005.
87. Lars Heinemann, Veronika Bauer, Markus Herrmannsdoerfer, and Benjamin Hummel.Identifier-based context-dependent API method recommendation. In CSMR, pages 31–40, 2012.
88. D. Herman. Narrative: Cognitive approaches. In Keith Brown, editor, Encyclopedia oflanguage and linguistics. Elsevier Science, 2006.
89. Dirk Heuzeroth, Uwe Aßmann, Mircea Trifu, and Volker Kuttruff. The COMPOST,COMPASS, Inject/J and RECODER tool suite for invasive software composition: Inva-sive composition with COMPASS aspect-oriented connectors. In GTTSE, pages 357–377, 2005.
90. Giles Hogben, Tom Jackson, and Marc Wilikens. A fully compliant research implemen-tation of the P3P standard for privacy protection: Experiences and recommendations. InProceedings of ESORICS 2002, volume 2502 of LNCS, pages 104–125. Springer, 2002.
91. Reid Holmes and Robert J. Walker. Informing Eclipse API production and consumption.In OOPSLA, pages 70–74, 2007.
92. Daqing Hou and David M. Pletcher. An evaluation of the strategies of sorting, filtering,and grouping API methods for code completion. In ICSM, pages 233–242, 2011.
93. J. Howison, M. Conklin, and K. Crowston. FLOSSmole: A collaborative repository forFLOSS research data and analyses. IJITWE, pages 17–26, 2006.
94. S. Hunston. Corpus linguistics. In Keith Brown, editor, Encyclopedia of language andlinguistics. Elsevier Science, 2006.
95. F. Hunt and P. Johnson. On the Pareto distribution of sourceforge projects. In Proceed-ings Open Source Software Development Workshop, pages 122–129, 2002.
96. John M. Daughtry III, Umer Farooq, Jeffrey Stylos, and Brad A. Myers. API usabil-ity: CHI’2009 special interest group meeting. In Proceedings of the 27th InternationalConference on Human Factors in Computing Systems, CHI 2009, Extended AbstractsVolume, pages 2771–2774. ACM, 2009.
97. Martin Ivarsson and Tony Gorschek. A method for evaluating rigor and industrial rele-vance of technology evaluations. Empir. Softw. Eng., 16(3):365–395, 2011.
98. Juanjuan Jiang, Johannes Koskinen, Anna Ruokonen, and Tarja Systä. Constructingusage scenarios for API redocumentation. In ICPC, pages 259–264, 2007.
206 References
99. Wei Jin and Alessandro Orso. BugRedux: Reproducing field failures for in-house de-bugging. In ICSE, pages 474–484, 2012.
100. Guy L. Steele Jr. Growing a Language. Higher-Order and Symbolic Computation,12(3):221–236, 1999.
101. Uwe Jugel. Generating Smart Wrapper Libraries for Arbitrary APIs. In Software Lan-guage Engineering, Second International Conference, SLE 2009, Revised Selected Pa-pers, volume 5969 of LNCS, pages 354–373. Springer, 2010.
102. Huzefa Kagdi, Michael L. Collard, and Jonathan I. Maletic. An approach to mining call-usage patterns with syntactic context. In ASE ’07: Proceedings of the twenty-secondIEEE/ACM international conference on Automated software engineering, pages 457–460. ACM, 2007.
103. Cory Kapser and Michael W. Godfrey. Toward a Taxonomy of Clones in Source Code:A Case Study. In Proceedings of Evolution of Large Scale Industrial Software Architec-tures, ELISA workshop 2003, pages 67–78, 2003.
104. J. Karat, C.-M. Karat, E. Bertino, N. Li, Q. Ni, C. Brodie, J. Lobo, S. B. Calo, L. F.Cranor, P. Kumaraguru, and R. W. Reeder. Policy framework for security and privacymanagement. IBM J. Res. Dev., 53:242–255, March 2009.
105. Günter Karjoth, Matthias Schunter, and Michael Waidner. Platform for enterprise pri-vacy practices: privacy-enabled management of customer data. In PET’02: Proceedingsof the 2nd international conference on Privacy enhancing technologies, pages 69–84.Springer, 2003.
106. Owen Kaser and Daniel Lemire. Tag-Cloud Drawing: Algorithms for Cloud Visualiza-tion. CoRR, abs/cs/0703109, 2007.
107. Patrick Gage Kelley, Joanna Bresee, Lorrie Faith Cranor, and Robert W. Reeder. A"nutrition label" for privacy. In Proceedings of the 5th Symposium on Usable Privacyand Security, SOUPS ’09, pages 4:1–4:12. ACM, 2009.
108. Miryung Kim, Vibha Sazawal, David Notkin, and Gail Murphy. An empirical study ofcode clone genealogies. SIGSOFT Softw. Eng. Notes, 30(5):187–196, 2005.
109. Barbara Kitchenham. Procedures for undertaking systematic reviews. Technical ReportTR/SE-0401, Keele University and National ICT Australia Ltd., 2004.
110. Barbara Kitchenham, Hiyam Al-Khilidar, Muhammed Ali Babar, Mike Berry, Karl Cox,Jacky Keung, Felicia Kurniawati, Mark Staples, He Zhang, and Liming Zhu. Evaluatingguidelines for reporting empirical software engineering studies. Empirical SoftwareEngineering, 13(1):97–121, 2008.
111. Barbara Kitchenham, O. Pearl Brereton, David Budgen, Mark Turner, John Bailey, andStephen Linkman. Systematic literature reviews in software engineering - A systematicliterature review. Inf. Softw. Technol., 51(1):7–15, 2009.
112. Barbara A. Kitchenham, Tore Dybå, and Magne Jørgensen. Evidence-based softwareengineering. In ICSE, pages 273–281, 2004.
113. Anneke Kleppe. Software Language Engineering: Creating Domain-Specific LanguagesUsing Metamodels. Addison-Wesley Professional, 2008.
114. A. S. Klusener, Ralf Lämmel, and Chris Verhoef. Architectural modifications to de-ployed software. Sci. of Comput. Program., 54(2–3):143–211, 2005.
115. Donald E. Knuth. An empirical study of FORTRAN programs. Software, Practice &Experience, 1(2):105–133, 1971.
116. Rainer Koschke. Identifying and removing software clones. In Software Evolution,pages 15–36. Springer, 2008.
117. Klaus Krippendorff. Content Analysis: an Introduction to Its Methodology 2nd edition.Sage, Thousand Oaks, CA, 2004.

References 207
118. G. Kumfert and T. Epperly. Software in the DOE: The hidden overhead of “The Build”.Technical report, Lawrence Livermore National Laboratory, 2002.
119. Ohbyung Kwon. A pervasive P3P-based negotiation mechanism for privacy-aware per-vasive e-commerce. Decis. Support Syst., 50:213–221, December 2010.
120. R. Lämmel, S. Kitsis, and D. Remy. Analysis of XML schema usage. In ConferenceProceedings XML 2005, November 2005.
121. Michele Lanza and Stéphane Ducasse. Polymetric views - A lightweight visual approachto reverse engineering. Trans. Software Eng., 29(9):782–795, 2003.
122. Zhenmin Li and Yuanyuan Zhou. PR-Miner: automatically extracting implicit program-ming rules and detecting violations in large software code. In ESEC/FSE-13: Proceed-ings of the 10th European software engineering conference held jointly with 13th ACMSIGSOFT international symposium on Foundations of software engineering, pages 306–315, New York, NY, USA, 2005. ACM.
123. Panos Linos, Whitney Lucas, Sig Myers, and Ezekiel Maier. A metrics tool for multi-language software. In Proceedings of the 11th IASTED International Conference onSoftware Engineering and Applications, pages 324–329. ACTA Press, 2007.
124. Erik Linstead, Sushil Bajracharya, Trung Ngo, Paul Rigor, Cristina Lopes, and PierreBaldi. Sourcerer: Mining and searching Internet-scale software repositories. DMKD,pages 300–336, 2009. http://sourcerer.ics.uci.edu/.
125. Simone Livieri, Yoshiki Higo, Makoto Matushita, and Katsuro Inoue. Very-largescale code clone analysis and visualization of open source programs using distributedCCFinder: D-CCFinder. In ICSE ’07: Proceedings of the 29th international conferenceon Software Engineering, pages 106–115, 2007.
126. Luis Lopez-Fernandez, Gregorio Robles, and Jesus M. Gonzalez-barahona. Applyingsocial network analysis to the information in CVS repositories. In Proceedings of theMining Software Repositories Workshop, 2004.
127. Rafael Lotufo, Steven She, Thorsten Berger, Krzysztof Czarnecki, and Andrzej Wa-sowski. Evolution of the Linux kernel variability model. In SPLC, pages 136–150,2010.
128. Homan Ma, Robert Amor, and Ewan D. Tempero. Usage patterns of the Java standardAPI. In APSEC, pages 342–352, 2006.
129. Paul Malone, Mark McLaughlin, Ronald Leenes, Pierfranco Ferronato, Nick Lockett,Pedro Bueso Guillen, Thomas Heistracher, and Giovanni Russello. ENDORSE: a le-gal technical framework for privacy preserving data management. In Proceedings ofthe 2010 Workshop on Governance of Technology, Information and Policies, GTIP ’10,pages 27–34. ACM, 2010.
130. David Mandelin, Lin Xu, Rastislav Bodík, and Doug Kimelman. Jungloid mining: help-ing to navigate the API jungle. In PLDI ’05: Proceedings of the 2005 ACM SIGPLANconference on Programming language design and implementation, pages 48–61. ACM,2005.
131. Radu Marinescu and Daniel Ratiu. Quantifying the quality of object-oriented design:The factor-strategy model. In Proceedings of the 11th Working Conference on ReverseEngineering, WCRE ’04, pages 192–201. IEEE, 2004.
132. Thomas J. McCabe. A complexity measure. IEEE Trans. Software Eng., 2(4):308–320,1976.
133. Shane McIntosh, Bram Adams, and Ahmed E. Hassan. The evolution of Java buildsystems. Empirical Software Engineering, 17(4-5):578–608, 2012.
134. Shane McIntosh, Bram Adams, Thanh H.D. Nguyen, Yasutaka Kamei, and Ahmed E.Hassan. An empirical study of build maintenance effort. In ICSE, pages 141–150, 2011.

208 References
135. Kim Mens and Andy Kellens. IntensiVE, a toolsuite for documenting and checkingstructural source-code regularities. In CSMR, pages 239–248, 2006.
136. Marjan Mernik, Jan Heering, and Anthony M. Sloane. When and how to developdomain-specific languages. ACM Comput. Surv., 37(4):316–344, 2005.
137. Amir Michail. Data mining library reuse patterns using generalized association rules. InICSE ’00: Proceedings of the 22nd international conference on Software engineering,pages 167–176. ACM, 2000.
138. Yana Momchilova Mileva, Valentin Dallmeier, Martin Burger, and Andreas Zeller. Min-ing trends of library usage. In ERCIM Workshops, pages 57–62, 2009.
139. Yana Momchilova Mileva, Valentin Dallmeier, and Andreas Zeller. Mining API popu-larity. In TAIC PART, pages 173–180, 2010.
140. Linda D. Misek-Falkoff. The new field of "software linguistics": An early-bird view. InACM, editor, ACM SIGMETRICS workshop on Software Metrics, 1982.
141. Iman Hemati Moghadam and Mel Ó Cinnéide. Automated refactoring using designdifferencing. In CSMR, pages 43–52, 2012.
142. Marco Casassa Mont and Robert Thyne. Privacy policy enforcement in enterprises withidentity management solutions. In Proceedings of the 2006 International Conference onPrivacy, Security and Trust: Bridge the Gap Between PST Technologies and BusinessServices, PST ’06, pages 25:1–25:12. ACM, 2006.
143. Mozilla’s privacy icons project. https://wiki.mozilla.org/Drumbeat/Challenges/Privacy_Icons. Visited July 2011.
144. MSR mining challenge 2008, 2011. http://msr.uwaterloo.ca/msr2008/challenge/, http://2011.msrconf.org/msr-challenge.html.
145. Sarah Nadi and Richard C. Holt. Make it or break it: Mining anomalies from Linuxkbuild. In WCRE, pages 315–324, 2011.
146. Seyed Mehdi Nasehi and Frank Maurer. Unit tests as API usage examples. In ICSM,pages 1–10, 2010.
147. G. Nelson. Description and prescription. In Keith Brown, editor, Encyclopedia of lan-guage and linguistics. Elsevier Science, 2006.
148. Anh Tuan Nguyen, Tung Thanh Nguyen, Hoan Anh Nguyen, Ahmed Tamrawi,Hung Viet Nguyen, Jafar M. Al-Kofahi, and Tien N. Nguyen. Graph-based pattern-oriented, context-sensitive source code completion. In ICSE, pages 69–79, 2012.
149. Chris Parnin, Carsten Görg, and Ogechi Nnadi. A catalogue of lightweight visualizationsto support code smell inspection. In SOFTVIS, pages 77–86, 2008.
150. Heidar Pirzadeh, Abdelwahab Hamou-Lhadj, and Mohak Shah. Exploiting text miningtechniques in the analysis of execution traces. In ICSM, pages 223–232, 2011.
151. The PROMISE repository of empirical software engineering data. Since 2005. http://promisedata.googlecode.com.
152. Erhard Rahm. Comparing the scientific impact of conference and journal publicationsin computer science. Inf. Serv. Use, 28(2):127–128, April 2008.
153. Ian Reay, Patricia Beatty, Scott Dick, and James Miller. A survey and analysis of the P3Pprotocol’s agents, adoption, maintenance, and future. IEEE Transactions on Dependableand Secure Computing, 4(2):151–164, April-June 2007.
154. Ian Reay, Scott Dick, and James Miller. A large-scale empirical study of P3P privacypolicies: Stated actions vs. legal obligations. ACM Transactions on the Web (TWEB),3(2), 2009.
155. Christoph Ringelstein and Steffen Staab. PAPEL: Provenance-aware policy definitionand execution. IEEE Internet Computing, 15:49–58, 2011.
156. Martin P. Robillard and Robert DeLine. A field study of API learning obstacles. Empir.Softw. Eng., 16(6):703–732, 2011.
References 209
157. S. K. Robinson and I. S. Torsun. An empirical analysis of FORTRAN programs. TheComputer Journal, 19(1):56–62, 1976.
158. Atanas Rountev, Scott Kagan, and Michael Gibas. Static and dynamic analysis of callchains in java. In Proceedings of the ACM/SIGSOFT International Symposium on Soft-ware Testing and Analysis, ISSTA 2004, pages 1–11. ACM, 2004.
159. Chanchal Kumar Roy, James R. Cordy, and Rainer Koschke. Comparison and evalua-tion of code clone detection techniques and tools: A qualitative approach. Science ofComputer Programming, 74(7):470–495, 2009.
160. Harry J. Saal and Zvi Weiss. An empirical study of APL programs. Computer Lan-guages, 2:47–59, 1977.
161. Farzad Salim, Nicholas Paul Sheppard, and Rei Safavi-Naini. Enforcing P3P policies us-ing a digital rights management system. In PET’07: Proceedings of the 7th internationalconference on Privacy enhancing technologies, pages 200–217. Springer, 2007.
162. Thorsten Schäfer, Jan Jonas, and Mira Mezini. Mining framework usage changes frominstantiation code. In Proceedings of the 30th international conference on Softwareengineering, ICSE ’08, pages 471–480. ACM, 2008.
163. Axel Schmolitzky. Teaching inheritance concepts with Java. In Proceedings of the 4thinternational symposium on Principles and practice of programming in Java, PPPJ ’06,pages 203–207. ACM, 2006.
164. Ari Schwartz. Looking back at P3P: Lessons for the future. http://www.cdt.org/files/pdfs/P3P_Retro_Final_0.pdf, 2009. Visited July 2011.
165. Francisco Servant and James A. Jones. WhoseFault: Automatic developer-to-fault as-signment through fault localization. In ICSE, pages 36–46, 2012.
166. Jérôme Siméon and Philip Wadler. The essence of XML. In POPL, pages 1–13, 2003.167. Dag I. K. Sjøberg, Tore Dybå, and Magne Jørgensen. The future of empirical methods
in software engineering research. In FOSE, pages 358–378, 2007.168. Dag I. K. Sjøberg, Jo E. Hannay, Ove Hansen, Vigdis By Kampenes, Amela Kara-
hasanovic, Nils-Kristian Liborg, and Anette C. Rekdal. A survey of controlled experi-ments in software engineering. IEEE Trans. Softw. Eng., 31(9):733–753, 2005.
169. Guy L. Steele, Jr., and Richard P. Gabriel. The evolution of Lisp. In ACM SIGPLANNotices, pages 231–270. Press, 1993.
170. Margaret-Anne Storey Steve Easterbrook, Janice Singer and Daniela Damian. Selectingempirical methods for software engineering research. In Forrest Shull, Janice Singer, andDag I.K. Sjøberg, editors, Guide to Advanced Empirical Software Engineering, pages285–311. Springer, 2008.
171. Jeffrey Stylos. Making APIs More Usable with Improved API Designs, Documentationand Tools. PhD thesis, Carnegie Mellon University, 2009.
172. Jeffrey Stylos, Andrew Faulring, Zizhuang Yang, and Brad A. Myers. Improving APIdocumentation using API usage information. In VL/HCC, pages 119–126, 2009.
173. Chengnian Sun, Siau-Cheng Khoo, and Shao Jie Zhang. Graph-based detection of li-brary API imitations. In ICSM, pages 183–192, 2011.
174. Mark D. Syer, Bram Adams, Ying Zou, and Ahmed E. Hassan. Exploring the develop-ment of micro-apps: A case study on the BlackBerry and Android platforms. In SCAM,pages 55–64, 2011.
175. Ewan Tempero, Craig Anslow, Jens Dietrich, Ted Han, Jing Li, Markus Lumpe, HaydenMelton, and James Noble. Qualitas corpus: A curated collection of Java code for empir-ical studies. In APSEC, pages 336–345, 2010. http://qualitascorpus.com/.
176. Ewan Tempero, Steve Counsell, and James Noble. An empirical study of overridingin open source Java. In Proceedings of the Thirty-Third Australasian Conferenc on

210 References
Computer Science - Volume 102, ACSC ’10, pages 3–12. Australian Computer Society,2010.
177. Ewan D. Tempero, James Noble, and Hayden Melton. How do java programs useinheritance? an empirical study of inheritance in java software. In ECOOP 2008 -Object-Oriented Programming, 22nd European Conference, Proceedings, volume 5142of LNCS, pages 667–691. Springer, 2008.
178. The Center for Information Policy Leadership. Multi-layered notices ex-plained. http://aimp.apec.org/Documents/2005/ECSG/DPM1/05_ecsg_dpm1_003.pdf, 2004. Visited July 2011.
179. The Center for Information Policy Leadership. Ten steps to develop a multilay-ered privacy notice. http://www.informationpolicycentre.com/files/Uploads/Documents/Centre/Ten_Steps_whitepaper.pdf, 2005. Vis-ited July 2011.
180. Suresh Thummalapenta and Tao Xie. SpotWeb: Detecting framework hotspots andcoldspots via mining open source code on the Web. In ASE, pages 327–336, 2008.
181. Nikolai Tillmann and Jonathan de Halleux. Pex-white box test generation for .NET.In Tests and Proofs, Second International Conference, TAP 2008, Proceedings, volume4966 of LNCS, pages 134–153. Springer, 2008.
182. Adrian Trifu and Radu Marinescu. Diagnosing design problems in object oriented sys-tems. In Proceedings of the 12th Working Conference on Reverse Engineering, pages155–164. IEEE, 2005.
183. TRUSTe. http://www.truste.com. Visited July 2011.184. Tarmo Uustalu and Varmo Vene. The Essence of Dataflow Programming. In Program-
ming Languages and Systems, APLAS 2005, Proceedings, volume 3780 of LNCS, pages2–18. Springer, 2005.
185. Stephane Vaucher, Foutse Khomh, Naouel Moha, and Yann-Gael Gueheneuc. Trackingdesign smells: Lessons from a study of god classes. In Proceedings of the 2009 16thWorking Conference on Reverse Engineering, WCRE ’09, pages 145–154. IEEE, 2009.
186. Todd L. Veldhuizen. Software libraries and their reuse: Entropy, Kolmogorov complex-ity, and Zipf’s law. CoRR, abs/cs/0508023, 2005.
187. Joost Visser. Structure Metrics for XML Schema. In Proceedings of XATA 2006, 2006.188. W3C. A P3P preference exchange language 1.0 (APPEL1.0), W3C working draft, 2002.
http://www.w3.org/TR/P3P-preferences/.189. W3C. The platform for privacy preferences 1.1 (P3P1.1) specification, 2006. http:
//www.w3.org/TR/P3P11/.190. Philip Wadler. The Essence of Functional Programming. In POPL, pages 1–14, 1992.191. Westley Weimer and George C. Necula. Mining temporal specifications for error detec-
tion. In In TACAS, pages 461–476, 2005.192. Dawid Weiss. Quantitative analysis of open source projects on SourceForge. In Marco
Scotto and Giancarlo Succi, editors, Proceedings of the First International Conferenceon Open Source Systems, Genova, pages 140–147, 2005.
193. Richard Wettel, Michele Lanza, and Romain Robbes. Software systems as cities: Acontrolled experiment. In ICSE, pages 551–560, 2011.
194. David S. Wile. Lessons learned from real DSL experiments. Sci. Comput. Program.,51(3):265–290, 2004.
195. Claes Wohlin, Per Runeson, Martin Höst, Magnus C. Ohlsson, Bjöorn Regnell, and An-ders Wesslén. Experimentation in software engineering: An introduction. Kluwer Aca-demic Publishers, 2000.

References 211
196. Tao Xie and Jian Pei. MAPO: mining API usages from open source repositories. In MSR’06: Proceedings of the 2006 international workshop on Mining software repositories,pages 54–57, New York, NY, USA, 2006. ACM.
197. Ting Yu, Ninghui Li, and Annie I. Antón. A formal semantics for P3P. In Proceedingsof SWS 2004, pages 1–8. ACM, 2004.
198. Carmen Zannier, Grigori Melnik, and Frank Maurer. On the success of empirical studiesin the international conference on software engineering. In ICSE, pages 341–350, 2006.
199. Hao Zhong, Tao Xie, Lu Zhang, Jian Pei, and Hong Mei. MAPO: Mining and recom-mending API usage patterns. In ECOOP, pages 318–343, 2009.


Curriculum Vitae
Contact Ekaterina Pek,Universität Koblenz-Landau,Universitätsstr. 1,56070 Koblenz,[email protected] • www.uni-koblenz.de/~pek
Education
School1995–1998 Astrakhan Technical Lyceum, Astrakhan, Russia. Honors gradu-
ation (summa cum laude).
1987–1995 Lyceum Nr. 1, Astrakhan, Russia.
University1998–2003 Rostov State University, Rostov-on-Don, Russia. Diploma in
Applied Mathematics. Honors graduation (summa cum laude).
Employment
Academic Experience01/2009– University Koblenz-Landau, Koblenz, Germany.
PhD student and full-time researcher.
Industry Experience05/2012–08/2012 Google, Inc., Munich, Germany.
Intern, CodeSearch project.

214 References
10/2007–10/2008 SoftTech, Ltd., Taganrog, Russia.J2EE Developer; financial mobile platform.
06/2006–10/2007 Inversion, JSC, Rostov, Russia.J2EE Developer; online banking systems.
08/2004–06/2006 Rostov-Clearing, JSC, Rostov, Russia.Java Software Developer; desktop banking systems.
01/2004–08/2004 Pralog, Ltd., Moscow, Russia.Microsoft SQL Database Administrator; retailer systems.
Conference Presentations
01/07/2010 Vivisection of a non-executable, domain-specific language, 18thIEEE International Conference on Program Comprehension (ICPC2010), Braga, Portugal.
11/10/2010 Towards Privacy Policy-Aware Web-Based Systems, 1st Doc-toral Symposium of the International Conference on SoftwareLanguage Engineering (SLE-DS 2010), Eindhoven, The Nether-lands.
13/10/2010 Empirical language analysis in software linguistics, 3rd Inter-national Conference on Software Language Engineering (SLE2010), Eindhoven, The Netherlands.
23/03/2011 Large-scale, AST-based API-usage analysis of open-source Javaprojects, 26th ACM Symposium on Applied Computing (SAC2011), Taichung, Taiwan.
18/10/2011 A Framework Profile of .NET, 18th Working Conference on Re-verse Engineering (WCRE 2011), Limerick, Ireland.
Professional Activities
2003 Microsoft Certified Professional: Microsoft SQL Server 2000Database Administrator.
03/2010 IEEE Student Member.
10/2010 ACM Student Member.
11/2010 SIGAPP Member.
11/2010 Received the Student Travel Award from ACM SIGAPP for trav-elling to Taiwan (SAC 2011).
01/2011 GI (Gesellschaft fuer Informatik) Member.

References 215
04/2011 Local organizer for 2011 edition of the Seminar Series on Ad-vanced Techniques & Tools for Software Evolution.
2011 Received the Google Anita Borg Memorial Scholarship.
2013 A Programm Committee member of ICSM 2013.
2009-2013 Reviewer for the conferences: CADE, CASTA, CSMR, IECCS,ICPC, MODELS, SCAM.

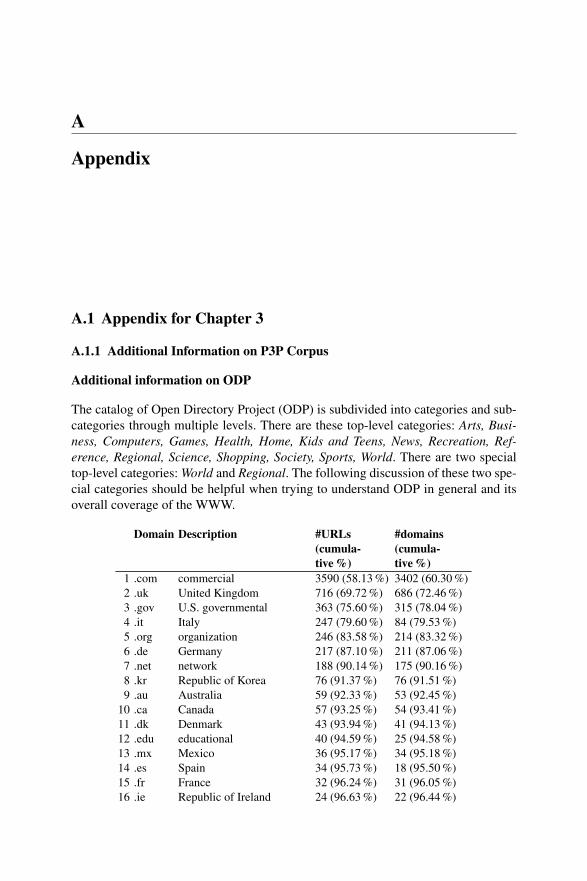
A
Appendix
A.1 Appendix for Chapter 3
A.1.1 Additional Information on P3P Corpus
Additional information on ODP
The catalog of Open Directory Project (ODP) is subdivided into categories and sub-categories through multiple levels. There are these top-level categories: Arts, Busi-ness, Computers, Games, Health, Home, Kids and Teens, News, Recreation, Ref-erence, Regional, Science, Shopping, Society, Sports, World. There are two specialtop-level categories: World and Regional. The following discussion of these two spe-cial categories should be helpful when trying to understand ODP in general and itsoverall coverage of the WWW.
Domain Description #URLs(cumula-tive %)
#domains(cumula-tive %)
1 .com commercial 3590 (58.13 %) 3402 (60.30 %)2 .uk United Kingdom 716 (69.72 %) 686 (72.46 %)3 .gov U.S. governmental 363 (75.60 %) 315 (78.04 %)4 .it Italy 247 (79.60 %) 84 (79.53 %)5 .org organization 246 (83.58 %) 214 (83.32 %)6 .de Germany 217 (87.10 %) 211 (87.06 %)7 .net network 188 (90.14 %) 175 (90.16 %)8 .kr Republic of Korea 76 (91.37 %) 76 (91.51 %)9 .au Australia 59 (92.33 %) 53 (92.45 %)
10 .ca Canada 57 (93.25 %) 54 (93.41 %)11 .dk Denmark 43 (93.94 %) 41 (94.13 %)12 .edu educational 40 (94.59 %) 25 (94.58 %)13 .mx Mexico 36 (95.17 %) 34 (95.18 %)14 .es Spain 34 (95.73 %) 18 (95.50 %)15 .fr France 32 (96.24 %) 31 (96.05 %)16 .ie Republic of Ireland 24 (96.63 %) 22 (96.44 %)

218 Appendix
17 .biz business 21 (96.97 %) 21 (96.81 %)18 .info information 18 (97.26 %) 16 (97.09 %)19 .us United States of America 18 (97.56 %) 18 (97.41 %)20 .at Austria 16 (97.81 %) 15 (97.68 %)21 .jp Japan 16 (98.07 %) 16 (97.96 %)22 .cz Czech Republic 14 (98.30 %) 14 (98.21 %)23 .nz New Zealand 12 (98.49 %) 12 (98.42 %)24 .ch Switzerland 11 (98.67 %) 11 (98.62 %)25 .be Belgium 9 (98.82 %) 9 (98.78 %)26 .mil U.S. military 9 (98.96 %) 8 (98.92 %)27 .nl Netherlands 9 (99.11 %) 8 (99.06 %)28 .il Israel 5 (99.19 %) 5 (99.15 %)29 .bg Bulgaria 4 (99.26 %) 4 (99.22 %)30 .is Iceland 3 (99.30 %) 3 (99.27 %)31 .ru Russia 3 (99.35 %) 2 (99.31 %)32 .za South Africa 3 (99.40 %) 3 (99.36 %)33 .cc Cocos (Keeling) Islands 2 (99.43 %) 2 (99.40 %)34 .cn People’s Republic of China 2 (99.47 %) 2 (99.43 %)35 .eu European Union 2 (99.50 %) 2 (99.47 %)36 .gr Greece 2 (99.53 %) 2 (99.50 %)37 .ma Morocco 2 (99.56 %) 1 (99.52 %)38 .ws Samoa 2 (99.60 %) 2 (99.56 %)39 .ae United Arab Emirates 1 (99.61 %) 1 (99.57 %)40 .ao Angola 1 (99.63 %) 1 (99.59 %)41 .ar Argentina 1 (99.64 %) 1 (99.61 %)42 .bo Bolivia 1 (99.66 %) 1 (99.63 %)43 .br Brazil 1 (99.68 %) 1 (99.65 %)44 .cl Chile 1 (99.69 %) 1 (99.66 %)45 .ee Estonia 1 (99.71 %) 1 (99.68 %)46 .fo Faroe Islands 1 (99.72 %) 1 (99.70 %)47 .hk Hong Kong 1 (99.74 %) 1 (99.72 %)48 .hr Croatia 1 (99.76 %) 1 (99.73 %)49 .im Isle of Man 1 (99.77 %) 1 (99.75 %)50 .in India 1 (99.79 %) 1 (99.77 %)51 .li Liechtenstein 1 (99.81 %) 1 (99.79 %)52 .md Moldova 1 (99.82 %) 1 (99.81 %)53 .my Malaysia 1 (99.84 %) 1 (99.82 %)54 .no Norway 1 (99.85 %) 1 (99.84 %)55 .pk Pakistan 1 (99.87 %) 1 (99.86 %)56 .pl Poland 1 (99.89 %) 1 (99.88 %)57 .sk Slovakia 1 (99.90 %) 1 (99.89 %)58 .sm San Marino 1 (99.92 %) 1 (99.91 %)59 .th Thailand 1 (99.94 %) 1 (99.93 %)60 .tv Tuvalu 1 (99.95 %) 1 (99.95 %)61 .tw Republic of China (Taiwan) 1 (99.97 %) 1 (99.96 %)62 .uy Uruguay 1 (99.98 %) 1 (99.98 %)63 .zm Zambia 1 (100.00 %) 1 (100.00 %)

A.1 Appendix for Chapter 3 219
Table A.1: Top-level domains in policies URLs
Consider the World category: these are “sites in languages other than English”where languages actually serve as subcategories of World.1 Also: “If a site’s con-tent is available in more than one language, the site may be listed in more than onelanguage category. For example, if a site is in English, German, and French, the sitemay be listed in an English-only category, World/Deutsch, and World/Francais”.2
The term ‘English-only category’ refers to the top-level categories other than Worldand Regional.
Consider the Regional category: this “category lists sites specific to a particulargeographic area. The Regional category as a whole organizes sites according to theirgeographic focus and relevance to a particular regional population. To this end, in-dividual Regional categories become mini-web directories in their own right, whileremaining functionally part of the larger Open Directory.”3
There may be multiple occurrences of a URL within the directory. That is, aURL may have more than one associated category.4 However, ODP’s rules seem tostipulate preference of fitting each site into one category, if there is a best match.Special reasons for overlapping apply to the categories World and Regional. That is,World can overlap with the rest of the directory when a site has an English version,and Regional can overlap with the rest of the directory when “sites are relevant to asubject category and a specific local geographic area”.
Additional information on corpus diversity
Table A.1 breaks down all policies in terms of the top-level domain of the policy URL(i.e., the URL found in the policy reference file). The larger part of policies residesin the com domain. The domains gov, org and net are popular, too. The seven firsttop-level domains cover about 90 % of all policies. We show such information heremerely as a short indication of the corpus’ diversity, as it was obtained from ODP.This information must not be misunderstood as being part of the study, which is notconcerned with P3P adoption by domain, country, or other means of breakdown; see§3.6.
Fig. A.1 shows the distribution of policies over ODP’s website categories. Nearlyhalf of all policies are (also) regional policies. Fig. A.2 shows the distribution ofpolicies in terms of the numbers of associated categories; 81.20 % of all policies areassociated with only one category. Table A.2 shows the distribution of policies oversubcategories of World—that is, over languages. Please note the category English
1 http://www.dmoz.org/guidelines/site-specific.html#non-english
2 http://www.dmoz.org/guidelines/site-specific.html#multi-lingual
3 http://www.dmoz.org/guidelines/regional/4 http://www.dmoz.org/guidelines/site-specific.html#multiple
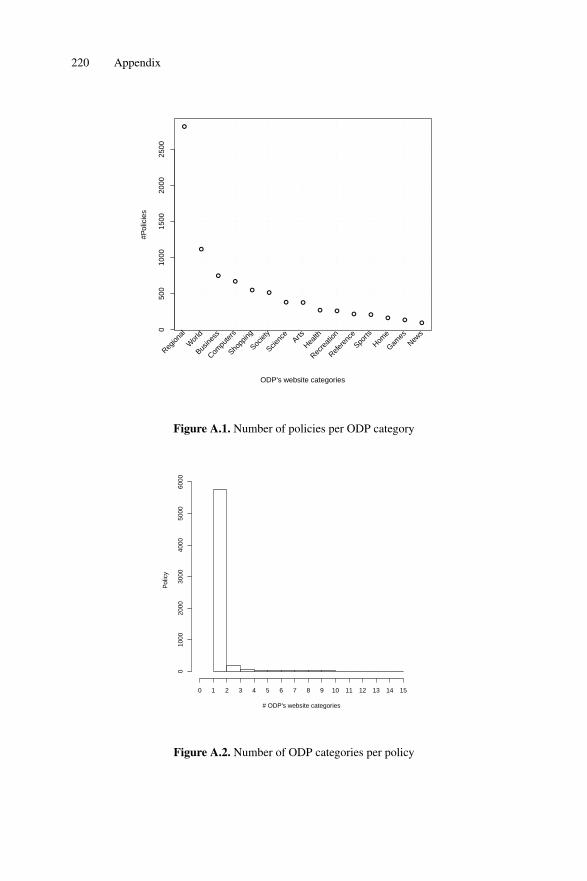
220 Appendix
●
●
●
●
●●
● ●
● ●● ●
● ●●
050
010
0015
0020
0025
00
#Pol
icie
s
Region
al
Wor
ld
Busine
ss
Compu
ters
Shopp
ing
Societ
y
Scienc
eArts
Health
Recre
ation
Refere
nce
Sports
Home
Games
News
ODP's website categories
Figure A.1. Number of policies per ODP category
# ODP's website categories
Pol
icy
010
0020
0030
0040
0050
0060
00
0 1 2 3 4 5 6 7 8 9 10 11 12 13 14 15
Figure A.2. Number of ODP categories per policy

A.1 Appendix for Chapter 3 221
Subcategory # Policies # Websites Percent
Español 1065 151144 0.705 %Deutsch 606 502004 0.121 %Dansk 567 46628 1.216 %Français 527 244261 0.216 %Italiano 506 194942 0.260 %Chinese 156 56295 0.277 %Japanese 116 106869 0.109 %Català 75 36502 0.205 %Arabic 65 6228 1.044 %Esperanto 42 4167 1.008 %Hebrew 42 6379 0.658 %Ceský 29 25307 0.115 %Indonesian 26 2987 0.870 %Greek 21 2194 0.957 %Galego 15 1661 0.903 %Hrvatski 11 5099 0.216 %Euskara 10 1713 0.584 %Hindi 9 493 1.826 %Afrikaans 9 489 1.840 %Gàidhlig 9 127 7.087 %Bulgarian 6 3691 0.163 %Brezhoneg 5 229 2.183 %Azerbaijani 4 1113 0.359 %Melay 4 320 1.250 %Føroyskt 3 65 4.615 %Íslenska 2 419 0.477 %Cymraeg 2 389 0.514 %Gujarati 1 51 1.961 %Armenian 1 1128 0.089 %Eesti 1 1278 0.078 %
Table A.2. Policies by subcategories of ODP’s World category (raw data)
is not included here because it is not a valid subcategory of World in ODP’s sense.Table also shows number of websites and percentage of policies per subcategory.
Additional information on disappeared policies
The corpus was originally downloaded in Dec 2009–Sep 2010. We verified the avail-ability of the corpus’ policies in Jan 2012. We found that 1,578 policies (out of 6,182)cannot be obtained anymore. Those disappeared policies come from 1,395 differentwebsites. We also checked if the sites themselves still exist; it turned out that 173sites disappeared. Such information may be useful in making claims about the po-tential decline of P3P. Such claims are not central though to the contributions of thepresent effort.
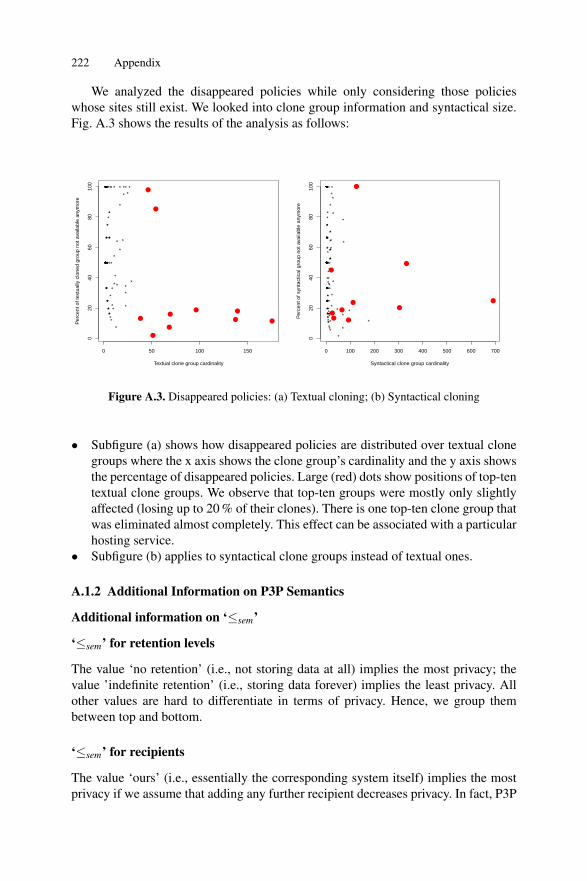
222 Appendix
We analyzed the disappeared policies while only considering those policieswhose sites still exist. We looked into clone group information and syntactical size.Fig. A.3 shows the results of the analysis as follows:
*
***** ** **** ****** **
***** ******** *** **
****** *** ************************************
*
* *********
**
*** *
*
* * ***** ** ** ** **** ****** ********************************
0 50 100 150
020
4060
8010
0
Textual clone group cardinality
Per
cent
of t
extu
ally
clo
ned
grou
p no
t ava
ilabl
e an
ymor
e
●
●
●
●●
●
●
●
●
●
*** **
*** *** **** ***************** ** * ***********
** ******************************
**** **
**************************************************************
********************
*****
****
***
**************************************************
0 100 200 300 400 500 600 700
020
4060
8010
0
Syntactical clone group cardinality
Per
cent
of s
ynta
ctic
al g
roup
not
ava
ilabl
e an
ymor
e●
●
●
●
●
●
●
●●
●
Figure A.3. Disappeared policies: (a) Textual cloning; (b) Syntactical cloning
• Subfigure (a) shows how disappeared policies are distributed over textual clonegroups where the x axis shows the clone group’s cardinality and the y axis showsthe percentage of disappeared policies. Large (red) dots show positions of top-tentextual clone groups. We observe that top-ten groups were mostly only slightlyaffected (losing up to 20 % of their clones). There is one top-ten clone group thatwas eliminated almost completely. This effect can be associated with a particularhosting service.
• Subfigure (b) applies to syntactical clone groups instead of textual ones.
A.1.2 Additional Information on P3P Semantics
Additional information on ‘≤sem’
‘≤sem’ for retention levels
The value ‘no retention’ (i.e., not storing data at all) implies the most privacy; thevalue ’indefinite retention’ (i.e., storing data forever) implies the least privacy. Allother values are hard to differentiate in terms of privacy. Hence, we group thembetween top and bottom.
‘≤sem’ for recipients
The value ‘ours’ (i.e., essentially the corresponding system itself) implies the mostprivacy if we assume that adding any further recipient decreases privacy. In fact, P3P
A.1 Appendix for Chapter 3 223
anticipates recipients that use the ‘same’ policy, and hence we group ‘same’ and‘ours’ together at the bottom.5 The value ‘public’ clearly implies the least privacy.All the other recipients are hard to differentiate in terms of privacy since we simplydo not know anything about their privacy policies. Hence, we group them betweentop and bottom.
‘≤sem’ for purposes
The value ‘current’ implies the most privacy since it models use of the system for itsprimary purpose. We treat the values ‘admin’ and ‘develop’ as equal; these are ac-tivities internal to the corresponding system. The value ‘tailoring’ further decreasesprivacy in that the system is adapted for the user based on data from the current ses-sion. For instance, the website’s content or design may be adapted. There are severalpurposes for ‘analysis’ and ‘decision’ that we all consider to maintain less privacythan ‘tailoring’. A purpose with analysis in the name targets at “research, analysisand reporting” whereas a purpose with decision in the name targets at “a decisionthat directly affects that individual” [189].6 We contend that ‘analysis’ implies lessexposure than ‘decision’, and the prefix ‘pseudo’ provides implies less exposure thanprefix ‘individual’. At the top, we have purposes ‘contact’, ‘historical’, and ‘telemar-keting’, as they are typically the least related to the original purpose of the system.
Additional information on semantically distinct policies
We are left with 1,385 semantically distinct policies of 4,869 semantically valid poli-cies of a total of 6,182 policies in the corpus. This remaining diversity can be furthercharacterized on the grounds of the partial order for the degree of exposure; see§3.3.4. That is, all the semantically distinct policies combined with ‘≤sem’ define aHasse diagram with the ‘full privacy’ policy as bottom element. Alas, the diagram istoo large for inclusion, but we can discuss it in an abstract manner.
• Number of nodes = 1,385 (= number of semantically distinct policies)• Number of edges = 2,102• Number of maximal elements = 983• Longest chain length = 12
As an illustration, Fig. A.4 shows the chains for the policy with the ‘greatestheight’ in the Hasse diagram. (This is the policy with the longest chain length = 12;there happens to be only one such policy.) The nodes either refer to clone groups(specified by number and cardinality) or to specific (say, unique) policies. The edgesare labeled with the relation between smaller and greater element in compliance with‘≤sem’. We propose that an inspection of the Hasse diagram, as exercised here, may
5 One might argue that ‘same’ decreases privacy, when compared to just ‘ours’ since datais shared with another entity. This would mean that we essentially trust the primary entitymore than the other entity.
6 http://www.w3.org/TR/P3P11/#PURPOSE

224 Appendix
crossroadsappliance.com.w3c.default#default
sfondo.it.w3c.sfondo.p3p#primary
plus 2 data refs
Sem.Gr.#26, card=19
plus 1 data refs
certes.net.privacy.policy1.p3p#certesconsulting
contact(opt-in) -> contact(always)
fourpointsinc.com.w3c.mailing.p3p#mailing
delivery(opt-in) -> delivery(always)
Sem.Gr.#2, card=323
plus 1 data refs
ultrex.com.privacy.tconcepts_policy_full#policy1
non-id : true -> false
Sem.Gr.#136, card=3
non-id : true -> falsenon-id : true -> falsenon-id : true -> false
bryophyllum.com.b.bryophyllum.p3p#bryophyllum
no-retention -> business-practices
Sem.Gr.#261, card=2
plus 1 data refs
Sem.Gr.#113, card=3
plus 1 data refs
Sem.Gr.#339, card=2
business-practices -> indefinitelybusiness-practices -> indefinitely
smeter.net.w3c.forums-registered#forums-registered
current(opt-in) -> current(always)current(opt-in) -> current(always)
Sem.Gr.#123, card=3
stated-purpose -> indefinitelystated-purpose -> indefinitely
Syn.Gr.#1, card=690
plus 2 data refs plus 2 data refs plus 2 data refs
Figure A.4. The longest partially ordered chain(s) of semantically distinct policies

A.1 Appendix for Chapter 3 225
be helpful in deciding replacements of uncommon policies by common ones. Thismay be useful for privacy approaches that stipulate a smaller number of ‘commonprivacy scenarios’.
Max chain length
Fre
quen
cy
010
020
030
040
050
060
0
0 1 2 3 4 5 6 7 8 9 10 11 12
Figure A.5. Distribution of longest paths for semantically distinct policies
Fig. A.5 shows the distribution of longest paths from the bottom element no non-bottom elements. About half of all semantically distinct policies are ‘alone’; they arenot approximated by any policies but the bottom element; they do not approximateany policies. One may expect a top element in the Hasse diagram—something like‘no privacy’ (as opposed to ‘full privacy’). This top element is not exercised and thismay be impractical because of P3P’s variable-category data elements. The numberof edges is an indicator that many policies serve as joins because the lowest possiblenumber of edges in a partially ordered set with a bottom element equals the numberof elements− 1. This means that if uncommon policies are close (in terms of ‘≤sem’)to a common policy, then one could decide to adopt the common policy in favor ofthe uncommon one. Future work on the diversity of P3P policies is needed.
Additional information on P3P extensions
To understand the diversity of policies that use extensions other than ‘group-info’,we examined the domains of the underlying websites. All these sites use distinctdomains. Table A.3 lists frequency of top-level domains. Hence, most cases of non-trivial usage of the extension mechanism come from websites of the Republic ofKorea and from commercial websites.

226 Appendix
Entity Top-level domain #
Republic of Korea .kr 76commercial .com 66network .net 6U.S. governmental .gov 5organization .org 4People’s Republic of China .cn 1Germany .de 1Australia .au 1Italy .it 1Pakistan .pk 1
Table A.3. Top-level domains of policies using extensions aside ‘group-info’
We further examined the domains. We observed a few cases of sharedsubdomains: (cii.samsung.co.kr, shi.samsung.co.kr), (cops.usdoj.gov, usdoj.gov),(hoam.samsungfoundation.org, kids.samsungfoundation.org), (ec21.com, ec21.net).Also, we observed the case of a company, Samsung, with several websites using do-mains without shared subdomains: cii.samsung.co.kr, hoam.samsungfoundation.org,kids.samsungfoundation.org, samsungengineering.co.kr, samsungengineering.com,samsungtechwin.com, sem.samsung.com, shi.samsung.co.kr. Further screening ofall domains with top-level domains .kr and .com confirmed that indeed diverseentities appear in those lists. A noticeable number of commercial sites concernedKorean companies. Hence, we found that most non-trivial extension usage concen-trates on Korea while exercising various companies and non-commercial entities. Atthe time of writing, we do not know the reasons for such non-proportional use ofextensions in Korea. One possible reason could be a particular, national legislation.
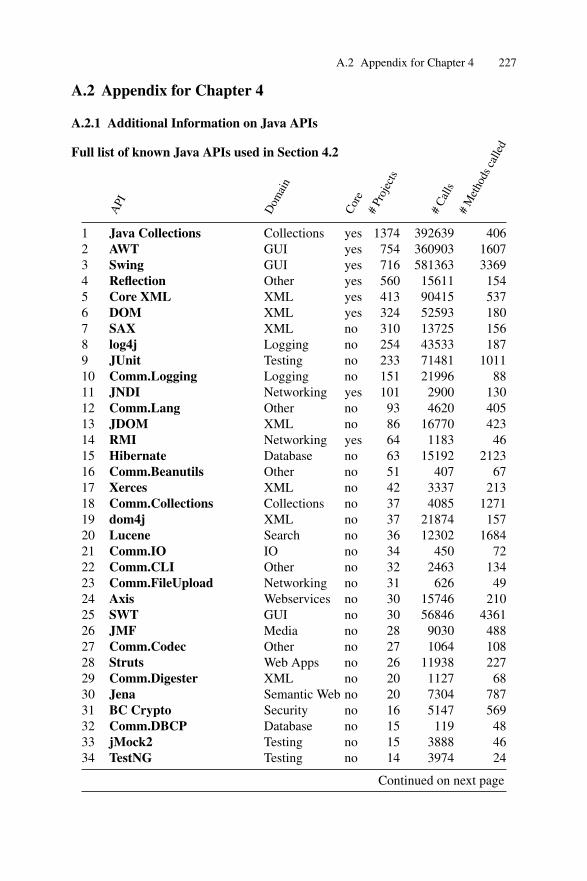
A.2 Appendix for Chapter 4 227
A.2 Appendix for Chapter 4
A.2.1 Additional Information on Java APIs
Full list of known Java APIs used in Section 4.2
API
Dom
ain
Core
#Pr
ojec
ts
#Ca
lls#
Met
hods
calle
d
1 Java Collections Collections yes 1374 392639 4062 AWT GUI yes 754 360903 16073 Swing GUI yes 716 581363 33694 Reflection Other yes 560 15611 1545 Core XML XML yes 413 90415 5376 DOM XML yes 324 52593 1807 SAX XML no 310 13725 1568 log4j Logging no 254 43533 1879 JUnit Testing no 233 71481 101110 Comm.Logging Logging no 151 21996 8811 JNDI Networking yes 101 2900 13012 Comm.Lang Other no 93 4620 40513 JDOM XML no 86 16770 42314 RMI Networking yes 64 1183 4615 Hibernate Database no 63 15192 212316 Comm.Beanutils Other no 51 407 6717 Xerces XML no 42 3337 21318 Comm.Collections Collections no 37 4085 127119 dom4j XML no 37 21874 15720 Lucene Search no 36 12302 168421 Comm.IO IO no 34 450 7222 Comm.CLI Other no 32 2463 13423 Comm.FileUpload Networking no 31 626 4924 Axis Webservices no 30 15746 21025 SWT GUI no 30 56846 436126 JMF Media no 28 9030 48827 Comm.Codec Other no 27 1064 10828 Struts Web Apps no 26 11938 22729 Comm.Digester XML no 20 1127 6830 Jena Semantic Web no 20 7304 78731 BC Crypto Security no 16 5147 56932 Comm.DBCP Database no 15 119 4833 jMock2 Testing no 15 3888 4634 TestNG Testing no 14 3974 24
Continued on next page

228 Appendix
Table A.4 – continued from previous page
API
Dom
ain
Core
#Pr
ojec
ts
#Ca
lls#
Met
hods
calle
d
35 Comm.Pool Other no 14 171 4336 GWT Web Apps no 13 12987 63937 Java 3D GUI no 12 490 8038 JFace GUI no 10 3588 34639 Batik GUI no 10 336 7040 Comm.Net Networking no 10 2016 64641 LWJGL GUI no 10 2988 32542 Berkeley DB Database no 9 769 12843 Comm.Configuration Other no 9 485 5544 JAI GUI no 9 111 5045 XMLBeans XML no 9 9891 15446 jogl GUI no 9 261 4547 MySQL Connector/J Database no 8 17738 128848 JavaHelp GUI no 8 29 1049 XMLPull XML no 7 444 2050 Comm.Math Other no 6 1608 48751 Jaxen XML no 6 93 1952 Comm.Email Networking no 5 64 2853 XOM XML no 5 5801 9854 Comm.DbUtils Database no 5 196 1355 Axis2 Webservices no 5 18794 16456 GNU Trove Collections no 4 105 4457 AXIOM XML no 4 3010 6558 j2ssh Networking no 4 4238 107559 Comm.Betwixt Other no 3 209 2860 OFBiz e-Business no 3 170713 678161 Xalan XML no 3 6 262 Java Expression Language Other no 2 9 663 StAX XML no 2 16 964 Struts2 Web Apps no 2 25 865 Express4J GUI no 2 31331 441766 Guice Other no 2 50 967 Comm.Discovery Other no 2 11 368 WSMO4J Webservices no 2 774 15569 QuickFIX e-Business no 1 62 3070 Comm.Transaction Other no 1 6 471 Comm.Chain Other no 1 12 6
Continued on next page

A.2 Appendix for Chapter 4 229
Table A.4 – continued from previous page
API
Dom
ain
Core
#Pr
ojec
ts
#Ca
lls#
Met
hods
calle
d
72 Comm.EL Other no 0 0 073 Comm.Daemon Other no 0 0 074 Comm.Exec Other no 0 0 075 Comm.Proxy Other no 0 0 076 Comm.Primitives Other no 0 0 077 Comm.Attributes Other no 0 0 0
Table A.4: List of the known Java APIs
0
0.1
0.2
0.3
0.4
0.5
0.6
0.7
0.8
0.9
1
1 10 100 1000 10000 1e+05 1e+06
Ratio
Project Size (in MC)
Projects Min 1st Q Median Mean 3rd Q Max
All 0.02 0.45 0.56 0.56 0.67 1Reference 0.11 0.43 0.5 0.5 0.57 0.99
Figure A.6. Ratio of Java API method calls to all method calls
Additional information on Java API usage in projects
Fig. A.6 shows the usage of known Java API methods relative to all methods in aproject—both in terms of calls. The smaller the ratio (the closer to zero), the lowerthe contribution of API calls. The quartiles show that in most projects, about each

230 Appendix
second method call is an API call. As far as instance-method calls are concerned, thefigure distinguishes API vs. project-based method calls solely on the grounds of thestatic receiver type of methods.
In [186], library reuse is studied at a level of shared objects in the operating sys-tems Sun OS and Mac OS X. One of the observations is that reuse seems to be lowin the sense of Zipf’s law. Thus the most frequent function will be referenced ap-proximately twice as often as the second most frequent function, which occurs twiceas often as the fourth most frequent function, etc. Fig. A.7 shows the distribution offrequency of method calls in the corpus. Only 0.03% of methods are called morethan 10,000 times, while 98.2% of methods are called less than 100 times. The plotsuggests a Zipf-style distribution.
1
10
100
1000
10000
100000
1e+06
1 10 100 1000 1e+04 1e+05
Nu
mb
er
of
ca
lls
Method
API
Non-API
Figure A.7. Frequency of calling Java API vs. non-API methods
Additional information on framework-like usage of Java APIs
Fig. A.8 shows the relative frequency of API-interface implementations for all theknown Java APIs (including Core APIs). The picture is dominated by AWT handlertypes, the interface for iterators, and a few XML-related types.
Fig. A.9 shows the relative frequency of Java API-class extensions. The pictureis entirely dominated by Swing’s types for GUIs. Many other API types are imple-mented or extended, but only with a marginal frequency.
Full list of Java APIs with framework-like usage
Table A.5 provides the complete list of Java APIs with detected framework-like us-age.
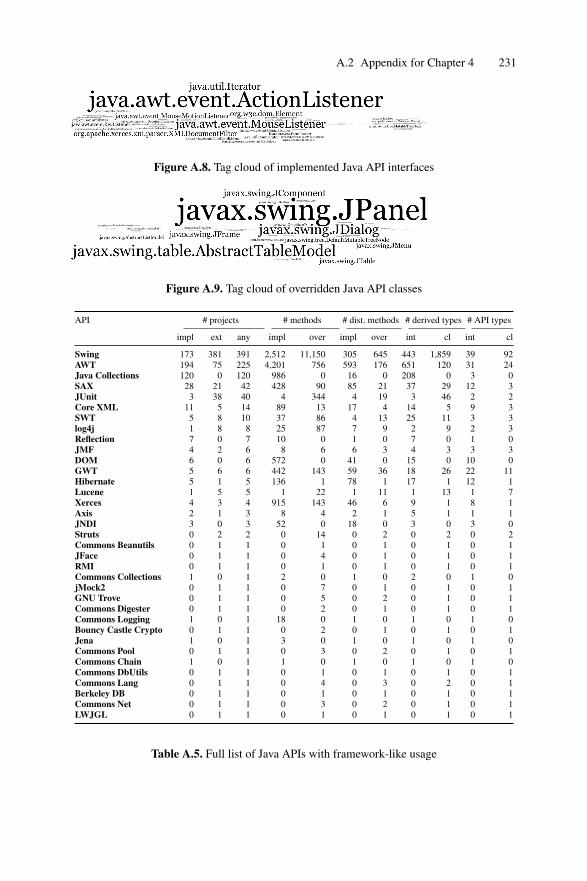
A.2 Appendix for Chapter 4 231
Figure A.8. Tag cloud of implemented Java API interfaces
Figure A.9. Tag cloud of overridden Java API classes
API # projects # methods # dist. methods # derived types # API types
impl ext any impl over impl over int cl int cl
Swing 173 381 391 2,512 11,150 305 645 443 1,859 39 92AWT 194 75 225 4,201 756 593 176 651 120 31 24Java Collections 120 0 120 986 0 16 0 208 0 3 0SAX 28 21 42 428 90 85 21 37 29 12 3JUnit 3 38 40 4 344 4 19 3 46 2 2Core XML 11 5 14 89 13 17 4 14 5 9 3SWT 5 8 10 37 86 4 13 25 11 3 3log4j 1 8 8 25 87 7 9 2 9 2 3Reflection 7 0 7 10 0 1 0 7 0 1 0JMF 4 2 6 8 6 6 3 4 3 3 3DOM 6 0 6 572 0 41 0 15 0 10 0GWT 5 6 6 442 143 59 36 18 26 22 11Hibernate 5 1 5 136 1 78 1 17 1 12 1Lucene 1 5 5 1 22 1 11 1 13 1 7Xerces 4 3 4 915 143 46 6 9 1 8 1Axis 2 1 3 8 4 2 1 5 1 1 1JNDI 3 0 3 52 0 18 0 3 0 3 0Struts 0 2 2 0 14 0 2 0 2 0 2Commons Beanutils 0 1 1 0 1 0 1 0 1 0 1JFace 0 1 1 0 4 0 1 0 1 0 1RMI 0 1 1 0 1 0 1 0 1 0 1Commons Collections 1 0 1 2 0 1 0 2 0 1 0jMock2 0 1 1 0 7 0 1 0 1 0 1GNU Trove 0 1 1 0 5 0 2 0 1 0 1Commons Digester 0 1 1 0 2 0 1 0 1 0 1Commons Logging 1 0 1 18 0 1 0 1 0 1 0Bouncy Castle Crypto 0 1 1 0 2 0 1 0 1 0 1Jena 1 0 1 3 0 1 0 1 0 1 0Commons Pool 0 1 1 0 3 0 2 0 1 0 1Commons Chain 1 0 1 1 0 1 0 1 0 1 0Commons DbUtils 0 1 1 0 1 0 1 0 1 0 1Commons Lang 0 1 1 0 4 0 3 0 2 0 1Berkeley DB 0 1 1 0 1 0 1 0 1 0 1Commons Net 0 1 1 0 3 0 2 0 1 0 1LWJGL 0 1 1 0 1 0 1 0 1 0 1
Table A.5. Full list of Java APIs with framework-like usage

232 Appendix
A.2.2 Additional Information on .NET Framework
This part of the appendix is, unfortunately, not entirely printer-friendly. We urge thereader to view data on the screen, thereby being able to see the details in the tablesand figures. (Please use zooming and rotation features of your PDF viewer.) We doapologize for the inconvenience.
Reuse-related metrics for frameworksWe add definitions of a few metrics that we only hinted at in §4.3.2.
Specializability is taken to the method level as follows. Each namespace can bemeasured in terms of % Specializable methods, i.e., the percentage of all methodsthat are either abstract or non-sealed methods—hence excluding static and sealed aswell as non-virtual methods. A metrics is added for % Sealed methods, i.e., the per-centage of “non-overridable virtual methods”—which is the percentage of all virtual,non-abstract instance method declarations that are sealed (including the case that thehosting class is sealed entirely).
0 10 20 30 40 50 60
System.Runtime.CompilerServicesSystem.Security.Cryptography.*
Microsoft.SqlServer.ServerSystem.Net.*
System.Collections.SpecializedSystem.Collections.Generic
System.Security.PermissionsSystem.Security.Authentication.*
System.Management.*System.Runtime.Caching.*
System.Runtime.Remoting.*System.Runtime.Serialization.*
System.CodeDom.*System.IdentityModel.*
System.Runtime.DurableInstancingSystem.Runtime.InteropServices.*
System.Drawing.*System.Transactions.*
System.Configuration.*System.Windows.Forms.*
System.EnterpriseServices.*System.ServiceModel.*
System.Data.*System.Xml.*
System.Windows.*System.Xaml.*
Microsoft.VisualC.*System.Workflow.*
Microsoft.VsaSystem.Dynamic
Microsoft.JScript.*System.AddIn.*
Microsoft.VisualBasic.*System.Activities.*
System.ComponentModel.*System.Web.*
11111111
2222
333
444
55
66
777
899
1111
1416
1717
4352
Figure A.10. .NET namespaces sorted by the number of orphan types
The notion of orphan types can also be refined as follows. That is, types maybe orphaned in a more inclusive sense if we focus specifically on composite frame-works. There is the variation % Local orphan classes: the percentage of all abstractclasses in a given namespace that are never concretely implemented within the givennamespace. Likewise, there is the variation % Local orphan interfaces. These met-rics show us whether there are namespaces that are incomplete by themselves whilethey are ‘fully illustrated’ by other namespaces so that they do not count as hosting‘global’ orhpans.
More detailed information about orphan types in .NET is provided by Fig-ure A.10.

Nam
espa
ce
System.ServiceModel.*System.Web.*Microsoft.VisualBasic.*System.Workflow.*System.Activities.*System.Data.*System.Windows.Forms.*System.Net.*System.ComponentModel.*SystemSystem.Runtime.Remoting.*System.Xml.*System.IdentityModel.*Microsoft.JScript.*System.DirectoryServices.*System.Configuration.*System.Security.Cryptography.*System.Deployment.*System.Diagnostics.*System.IO.*System.Runtime.Serialization.*System.Resources.*System.Messaging.*System.CodeDom.*System.Security.PolicySystem.RuntimeSystem.EnterpriseServices.*System.Xaml.*System.SecurityMicrosoft.Win32.*System.Threading.*System.AddIn.*System.Management.*System.Reflection.*System.Drawing.*System.Security.PermissionsSystem.ServiceProcess.*System.Runtime.InteropServices.*System.DynamicMicrosoft.CSharp.*System.Security.PrincipalSystem.Security.AccessControlSystem.Linq.*System.Transactions.*System.Runtime.CompilerServicesSystem.GlobalizationSystem.Security.Authentication.*System.Runtime.Caching.*System.Windows.*System.Collections.GenericSystem.Text.RegularExpressionsSystem.Collections.ObjectModelSystem.Collections.ConcurrentMicrosoft.SqlServer.ServerSystem.Collections.SpecializedSystem.Runtime.DurableInstancingSystem.TextSystem.MediaSystem.CollectionsSystem.Runtime.VersioningMicrosoft.VisualC.*System.Runtime.HostingSystem.Device.LocationSystem.TimersSystem.NumericsSystem.Runtime.ConstrainedExecutionSystem.Runtime.ExceptionServices
Syst
em.S
ervi
ceM
odel
.*••
•••
•••
•
••
••••••
••••
••••••
•••
•••
•Sy
stem
.Web
.*
•••••
•••
••••
••
••••
•••••
••••
••••
••••
••
••
Mic
roso
ft.V
isua
lBas
ic.*
•
••••••
•••••
••
••••
••••
••
•••
••
••••
••••
•Sy
stem
.Wor
kflow
.*•
••••••••
•••
••••
••
••
•••
••
•••
•••
••
••
•Sy
stem
.Act
iviti
es.*
••
••
••
•••
••
•••
••
••
••••
•••••
•••
••
Syst
em.D
ata.
*•
•••
••
•••
••
•••
••
••
••••
•••
•
••
•Sy
stem
.Win
dow
s.Fo
rms.
*•••
••
••
•
•••
••
••
••
•••
••••
Syst
em.N
et.*
•
•
•
•••
•••
••
••
••
•••
••
••
Syst
em.C
ompo
nent
Mod
el.*
•
••
••
•
••
•
•
•Sy
stem
Syst
em.R
untim
e.R
emot
ing.
*
•••
•••
•••
••
••
••
••
••
Syst
em.X
ml.*
••
•
•
••
••
••
••
••
••
•Sy
stem
.Iden
tityM
odel
.*•
•••••
•••
•••
••
••••
•••
••
Mic
roso
ft.J
Scri
pt.*
••••
••
••••
••
•••
••
•••
••
•Sy
stem
.Dir
ecto
rySe
rvic
es.*
•••
•
••••
••
••
•••
•••
••
••
•Sy
stem
.Con
figur
atio
n.*
•••
•••
•
•••
••
••
••
Syst
em.S
ecur
ity.C
rypt
ogra
phy.
*
••
••
••
••
••
••
••
•Sy
stem
.Dep
loym
ent.*
•••••
••
•••
••
••
••
••
Syst
em.D
iagn
ostic
s.*
•
•
•
•
••
•
•
•
Syst
em.IO
.*
•
••
••
•Sy
stem
.Run
time.
Seri
aliz
atio
n.*
••
•
•
Syst
em.R
esou
rces
.*•
•
••••
••
•••
••
••
•••
Syst
em.M
essa
ging
.*•
••
•••
•••
••
•••
••
••
••
Syst
em.C
odeD
om.*
•
•••
•
•••
••
••
••
••
••
Syst
em.S
ecur
ity.P
olic
y
•
••
••
••
•
Syst
em.R
untim
e•
•••
••
•••
•••
••
Syst
em.E
nter
pris
eSer
vice
s.*
••••
••••
•••
••
•
••
•Sy
stem
.Xam
l.*••
••••
•
••
••
•
••
••
•Sy
stem
.Sec
urity
•
••
•
Mic
roso
ft.W
in32
.*
••
•
••
•
Syst
em.T
hrea
ding
.*
•
Syst
em.A
ddIn
.*•••
•••
••
•
••
••
••
••
Syst
em.M
anag
emen
t.*••
••••
••
••
••
••
••
•Sy
stem
.Refl
ectio
n.*
•
Syst
em.D
raw
ing.
*
••
•••
••
••
••
••
•Sy
stem
.Sec
urity
.Per
mis
sion
s
•
•
•
••
Syst
em.S
ervi
cePr
oces
s.*
•••
••
••
••••
••
••
Syst
em.R
untim
e.In
tero
pSer
vice
s.*
Syst
em.D
ynam
ic•••
••
••
•
•
••
•M
icro
soft
.CSh
arp.
*•
••
••
••
••
••
Syst
em.S
ecur
ity.P
rinc
ipal
•
•
••
••
••
•Sy
stem
.Sec
urity
.Acc
essC
ontr
ol•
•
•
•
•
••
•Sy
stem
.Lin
q.*
•••
••
•
•••
••
Syst
em.T
rans
actio
ns.*
••
••
•
••
•••
••
Syst
em.R
untim
e.C
ompi
lerS
ervi
ces
•Sy
stem
.Glo
baliz
atio
n
•
•
Sy
stem
.Sec
urity
.Aut
hent
icat
ion.
*••
••
••
••
••
•Sy
stem
.Run
time.
Cac
hing
.*•
••
••
••
•
••
••
Syst
em.W
indo
ws.
*••
••
•
•••
•
••
Syst
em.C
olle
ctio
ns.G
ener
ic
•
Sy
stem
.Tex
t.Reg
ular
Exp
ress
ions
•
•
••
••
•
••
Syst
em.C
olle
ctio
ns.O
bjec
tMod
el
•
••
•
•Sy
stem
.Col
lect
ions
.Con
curr
ent
••
•
••
••
•
•M
icro
soft
.Sql
Serv
er.S
erve
r
•••
••
••
•
•Sy
stem
.Col
lect
ions
.Spe
cial
ized
••
•••
•
••
Syst
em.R
untim
e.D
urab
leIn
stan
cing
••
•
•••
••
•
Syst
em.T
ext
•
•
•
Syst
em.M
edia
•••
••
••
••
Sy
stem
.Col
lect
ions
•
Sy
stem
.Run
time.
Ver
sion
ing
••
••
••
M
icro
soft
.Vis
ualC
.*•
••
••
Sy
stem
.Run
time.
Hos
ting
•
•
Syst
em.D
evic
e.L
ocat
ion
••
••
•
Syst
em.T
imer
s••
••
Sy
stem
.Num
eric
s•
••
Sy
stem
.Run
time.
Con
stra
ined
Exe
cutio
n•
Syst
em.R
untim
e.E
xcep
tionS
ervi
ces
•
Tabl
eA
.6.I
nter
-nam
espa
cere
fere
ncin
gw
ithin
the
.NE
TFr
amew
ork

Nam
espa
ce
System.Web.*System.ServiceModel.*System.Data.*System.Workflow.*System.Net.*System.Activities.*System.Windows.Forms.*Microsoft.VisualBasic.*System.ComponentModel.*System.Messaging.*System.DirectoryServices.*SystemSystem.IO.*System.Configuration.*System.Xaml.*Microsoft.JScript.*System.Runtime.Serialization.*System.Runtime.Remoting.*System.Diagnostics.*System.Management.*System.DynamicSystem.Xml.*System.Security.Authentication.*System.Drawing.*System.Deployment.*System.Threading.*System.Security.Cryptography.*System.ServiceProcess.*System.Transactions.*System.Runtime.InteropServices.*System.Collections.GenericSystem.Security.PolicySystem.Reflection.*System.Collections.ObjectModelSystem.Resources.*System.Security.PrincipalSystem.AddIn.*System.CodeDom.*System.IdentityModel.*System.Runtime.Caching.*System.Windows.*Microsoft.VisualC.*System.SecuritySystem.Runtime.CompilerServicesMicrosoft.Win32.*System.Collections.ConcurrentSystem.GlobalizationSystem.Security.PermissionsSystem.Security.AccessControlSystem.Text.RegularExpressionsSystem.Collections.SpecializedSystem.CollectionsSystem.TextSystem.Linq.*Microsoft.SqlServer.ServerSystem.Device.LocationSystem.EnterpriseServices.*Microsoft.CSharp.*System.RuntimeSystem.MediaSystem.TimersSystem.Runtime.DurableInstancingSystem.Runtime.HostingSystem.Runtime.ConstrainedExecutionSystem.Runtime.ExceptionServicesSystem.Runtime.VersioningSystem.Numerics
Syst
em.W
eb.*
••
•••
••
••
••
•••
••
••••
Syst
em.S
ervi
ceM
odel
.*
•
••••
••
••
••
••
••
••
•Sy
stem
.Dat
a.*
••
••••
••
••
••
••
•Sy
stem
.Wor
kflow
.*•
•
••
•••
••
••
••
Syst
em.N
et.*
•
•••
••
••
••
•
••
Syst
em.A
ctiv
ities
.*•
•
••
••
••
••
••
Syst
em.W
indo
ws.
Form
s.*
••
••
•••
••
•M
icro
soft
.Vis
ualB
asic
.*•••
••
••
••
••
Syst
em.C
ompo
nent
Mod
el.*
•
••
••
•Sy
stem
.Mes
sagi
ng.*
••
••
••
••
••
Syst
em.D
irec
tory
Serv
ices
.*•
•
•••
••
•Sy
stem
Sy
stem
.IO.*
••
•
••
•Sy
stem
.Con
figur
atio
n.*
••
••
••
Syst
em.X
aml.*
••
•
••
••
Mic
roso
ft.J
Scri
pt.*
••
•
••
•Sy
stem
.Run
time.
Seri
aliz
atio
n.*
•
Syst
em.R
untim
e.R
emot
ing.
*•
•••
•Sy
stem
.Dia
gnos
tics.
*•
••
•
••
Syst
em.M
anag
emen
t.*•
••
•
••
Syst
em.D
ynam
ic•
•
••
••
Syst
em.X
ml.*
••
••
Syst
em.S
ecur
ity.A
uthe
ntic
atio
n.*
••
••
•
•Sy
stem
.Dra
win
g.*
•
•
••
•Sy
stem
.Dep
loym
ent.*
••
••
•
Syst
em.T
hrea
ding
.*•
••
•
•Sy
stem
.Sec
urity
.Cry
ptog
raph
y.*
••
•
••
Syst
em.S
ervi
cePr
oces
s.*
••
••
••
Syst
em.T
rans
actio
ns.*
••
•
••
Syst
em.R
untim
e.In
tero
pSer
vice
s.*
•Sy
stem
.Col
lect
ions
.Gen
eric
•
•Sy
stem
.Sec
urity
.Pol
icy
••
•
•Sy
stem
.Refl
ectio
n.*
•
•Sy
stem
.Col
lect
ions
.Obj
ectM
odel
••
Syst
em.R
esou
rces
.*•
••
•
Syst
em.S
ecur
ity.P
rinc
ipal
••
•
•Sy
stem
.Add
In.*
••
•
•Sy
stem
.Cod
eDom
.*•
••
•
Syst
em.Id
entit
yMod
el.*
••
•
•Sy
stem
.Run
time.
Cac
hing
.*•
••
•
Syst
em.W
indo
ws.
*•
••
•
Mic
roso
ft.V
isua
lC.*
••
•
Syst
em.S
ecur
ity
•
•Sy
stem
.Run
time.
Com
pile
rSer
vice
s•
•
•M
icro
soft
.Win
32.*
•
Syst
em.C
olle
ctio
ns.C
oncu
rren
t•
•
•Sy
stem
.Glo
baliz
atio
n•
•
•Sy
stem
.Sec
urity
.Per
mis
sion
s•
•
•Sy
stem
.Sec
urity
.Acc
essC
ontr
ol•
•
•Sy
stem
.Tex
t.Reg
ular
Exp
ress
ions
••
•
Syst
em.C
olle
ctio
ns.S
peci
aliz
ed•
••
Syst
em.C
olle
ctio
ns
Syst
em.T
ext
••
Sy
stem
.Lin
q.*
••
M
icro
soft
.Sql
Serv
er.S
erve
r•
•
Syst
em.D
evic
e.L
ocat
ion
••
Sy
stem
.Ent
erpr
iseS
ervi
ces.
*•
•
Mic
roso
ft.C
Shar
p.*
••
Syst
em.R
untim
e•
•Sy
stem
.Med
ia•
•Sy
stem
.Tim
ers
••
Syst
em.R
untim
e.D
urab
leIn
stan
cing
•
Syst
em.R
untim
e.H
ostin
g•
Syst
em.R
untim
e.C
onst
rain
edE
xecu
tion
•Sy
stem
.Run
time.
Exc
eptio
nSer
vice
s•
Syst
em.R
untim
e.V
ersi
onin
g•
Syst
em.N
umer
ics
•
Tabl
eA
.7.I
nter
-nam
espa
cesp
ecia
lizat
ion
with
inth
e.N
ET
fram
ewor
k
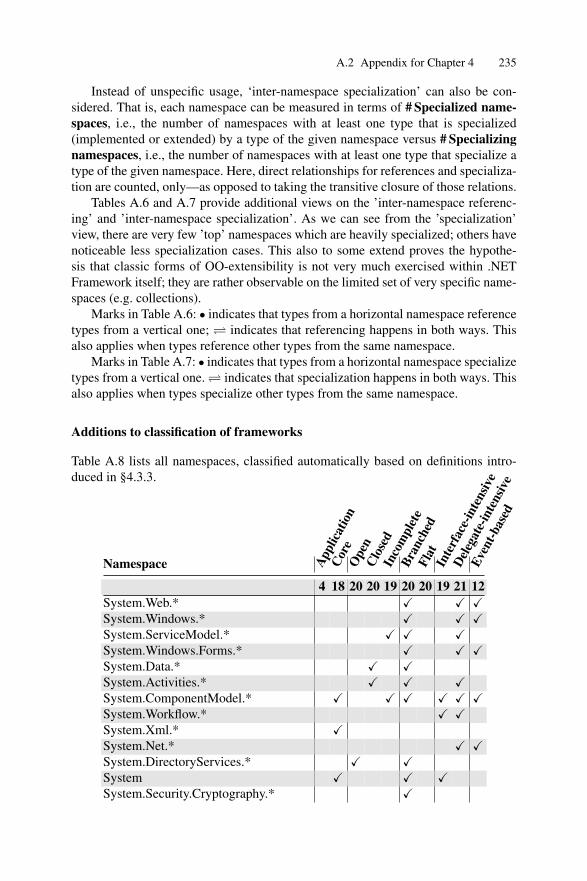
A.2 Appendix for Chapter 4 235
Instead of unspecific usage, ‘inter-namespace specialization’ can also be con-sidered. That is, each namespace can be measured in terms of # Specialized name-spaces, i.e., the number of namespaces with at least one type that is specialized(implemented or extended) by a type of the given namespace versus # Specializingnamespaces, i.e., the number of namespaces with at least one type that specialize atype of the given namespace. Here, direct relationships for references and specializa-tion are counted, only—as opposed to taking the transitive closure of those relations.
Tables A.6 and A.7 provide additional views on the ’inter-namespace referenc-ing’ and ’inter-namespace specialization’. As we can see from the ’specialization’view, there are very few ’top’ namespaces which are heavily specialized; others havenoticeable less specialization cases. This also to some extend proves the hypothe-sis that classic forms of OO-extensibility is not very much exercised within .NETFramework itself; they are rather observable on the limited set of very specific name-spaces (e.g. collections).
Marks in Table A.6: • indicates that types from a horizontal namespace referencetypes from a vertical one; indicates that referencing happens in both ways. Thisalso applies when types reference other types from the same namespace.
Marks in Table A.7: • indicates that types from a horizontal namespace specializetypes from a vertical one. indicates that specialization happens in both ways. Thisalso applies when types specialize other types from the same namespace.
Additions to classification of frameworks
Table A.8 lists all namespaces, classified automatically based on definitions intro-duced in §4.3.3.
Namespace Appl
icatio
nCo
reO
pen
Clos
edIn
com
plet
eBr
anch
edFl
atIn
terf
ace-
inte
nsiv
e
Deleg
ate-
inte
nsiv
e
Even
t-bas
ed
4 18 20 20 19 20 20 19 21 12System.Web.* X X XSystem.Windows.* X X XSystem.ServiceModel.* X X XSystem.Windows.Forms.* X X XSystem.Data.* X XSystem.Activities.* X X XSystem.ComponentModel.* X X X X X XSystem.Workflow.* X XSystem.Xml.* XSystem.Net.* X XSystem.DirectoryServices.* X XSystem X X XSystem.Security.Cryptography.* X
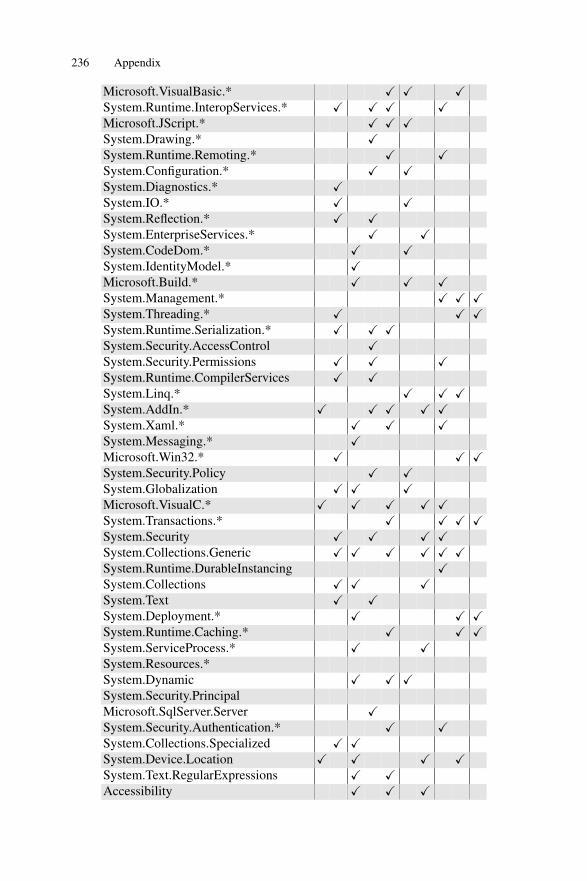
236 Appendix
Microsoft.VisualBasic.* X X XSystem.Runtime.InteropServices.* X X X XMicrosoft.JScript.* X X XSystem.Drawing.* XSystem.Runtime.Remoting.* X XSystem.Configuration.* X XSystem.Diagnostics.* XSystem.IO.* X XSystem.Reflection.* X XSystem.EnterpriseServices.* X XSystem.CodeDom.* X XSystem.IdentityModel.* XMicrosoft.Build.* X X XSystem.Management.* X X XSystem.Threading.* X X XSystem.Runtime.Serialization.* X X XSystem.Security.AccessControl XSystem.Security.Permissions X X XSystem.Runtime.CompilerServices X XSystem.Linq.* X X XSystem.AddIn.* X X X X XSystem.Xaml.* X X XSystem.Messaging.* XMicrosoft.Win32.* X X XSystem.Security.Policy X XSystem.Globalization X X XMicrosoft.VisualC.* X X X X XSystem.Transactions.* X X X XSystem.Security X X X XSystem.Collections.Generic X X X X X XSystem.Runtime.DurableInstancing XSystem.Collections X X XSystem.Text X XSystem.Deployment.* X X XSystem.Runtime.Caching.* X X XSystem.ServiceProcess.* X XSystem.Resources.*System.Dynamic X X XSystem.Security.PrincipalMicrosoft.SqlServer.Server XSystem.Security.Authentication.* X XSystem.Collections.Specialized X XSystem.Device.Location X X X XSystem.Text.RegularExpressions X XAccessibility X X X

A.2 Appendix for Chapter 4 237
System.Collections.Concurrent X X XSystem.Runtime.Versioning X XMicrosoft.CSharp.* X XSystem.Collections.ObjectModel X X X XSystem.Runtime.ConstrainedExecution X XSystem.Runtime X XSystem.Timers X X X X XSystem.Media X XSystem.Runtime.Hosting XSystem.Runtime.ExceptionServices X XSystem.Numerics X
Table A.8: Classification of .NET namespaces
Additions to comparison of potential and actual reuse
The notion of ‘late-bound type’ was only explained very briefly in §4.3.4. Additionaldetails follow.
We start from the most basic form of framework usage: client code references aframework or a namespace thereof. Such a reference could relate to various languageconcepts, e.g., a reference to a class in a constructor call, a reference to a type in thedeclaration of a method argument, or a reference to a base class in a class declaration.
In terms of OO-based reuse of a framework in client code, usage in the sense oftype specialization is of special interest. Yet more advanced usage is resembled bylate binding at the boundary of framework and client code. We are are concerned herewith late binding in the sense that a method call of the client code uses a frameworktype as static receiver type, but the actual runtime receiver type ends up being a typeof the client code which necessarily derives from the static receiver type.
For clarity, consider the following client code:
public class MyList<T> : List<T> { ... }public static Program {
public static void printResult(List<Item> l){
...Console.WriteLine("Count: {0}", l.Count);...
}public static void Main(string[] args){
List<Item> r = new MyList<Item>();...printResult(r);...
}}

Nam
espa
ce
#Types
%Specializabletypes
ActiveRecord
CastleCore
MonoRail
Windsor
Json.NET
log4net
MEF
Moq
NAnt
NHibernate
NUnit
Prism
Rhino.Mocks
Spring.NET
xUnit
SharpZipLib
Lucene.Net
Dominator
%Referencedtypes
%Specializabletypes(rel.)
%Specializedtypes(rel.)%Late-boundtypes(rel.)
Fram
ewor
k3.
54.
03.
54.
04.
02.
04.
04.
02.
03.
53.
54.
03.
52.
02.
02.
02.
0Sy
stem
.Web
.*23
2773
(3,1
,0)
(0,0
,0)
(37,
6,0)
(7,1
,0)
(0,0
,0)
(5,0
,0)
(0,0
,0)
(0,0
,0)
(5,0
,0)
(0,0
,0)
(0,0
,0)
(0,0
,0)
(0,0
,0)
(146
,31,
4)(0
,0,0
)(0
,0,0
)(0
,0,0
)(1
68,3
3,4)
744
.045
5Sy
stem
.Win
dow
s.*
1658
74(0
,0,0
)(0
,0,0
)(0
,0,0
)(0
,0,0
)(0
,0,0
)–
(0,0
,0)
(0,0
,0)
–(0
,0,0
)(0
,0,0
)(3
1,3,
5)(0
,0,0
)–
––
–(3
1,3,
5)2
64.5
1525
Syst
em.S
ervi
ceM
odel
.*11
5368
(0,0
,0)
(0,0
,0)
(0,0
,0)
(0,0
,0)
(0,0
,0)
–(0
,0,0
)(0
,0,0
)–
(3,1
,0)
(0,0
,0)
(0,0
,0)
(0,0
,0)
––
––
(3,1
,0)
066
.750
0Sy
stem
.Win
dow
s.Fo
rms.
*96
389
(0,0
,0)
(0,0
,0)
(0,0
,0)
(0,0
,0)
(0,0
,0)
(0,0
,0)
(0,0
,0)
(0,0
,0)
(0,0
,0)
(0,0
,0)
(128
,11,
7)(0
,0,0
)(0
,0,0
)(0
,0,0
)(7
3,2,
0)(0
,0,0
)(0
,0,0
)(1
40,1
1,7)
1552
.915
10Sy
stem
.Dat
a.*
745
46(5
,0,0
)(0
,0,0
)(2
,0,0
)(0
,0,0
)(1
5,0,
0)(9
,0,0
)(0
,0,0
)(0
,0,0
)(0
,0,0
)(3
7,2,
0)(0
,0,0
)(0
,0,0
)(0
,0,0
)(2
6,2,
0)(8
,0,0
)(0
,0,0
)(0
,0,0
)(5
9,2,
0)8
52.5
70
Syst
em.C
ompo
nent
Mod
el.*
434
77(1
,0,0
)(2
4,9,
2)(4
,1,0
)(1
4,4,
1)(2
8,6,
1)(0
,0,0
)(4
,2,0
)(2
,0,0
)(1
3,1,
1)(8
,1,0
)(2
1,1,
0)(2
5,5,
0)(0
,0,0
)(2
2,3,
2)(9
,0,0
)(0
,0,0
)(0
,0,0
)(8
8,27
,5)
2069
.344
8Sy
stem
.Xm
l.*35
887
(9,0
,0)
(37,
3,1)
(5,0
,0)
(12,
0,0)
(31,
0,0)
(15,
0,0)
(0,0
,0)
(0,0
,0)
(57,
1,0)
(37,
0,0)
(23,
0,0)
(0,0
,0)
(0,0
,0)
(40,
5,4)
(13,
0,0)
(0,0
,0)
(0,0
,0)
(111
,8,5
)31
82.0
96
Syst
em.N
et.*
285
74(0
,0,0
)(5
,0,0
)(6
,0,0
)(0
,0,0
)(0
,0,0
)(1
7,0,
0)(0
,0,0
)(0
,0,0
)(1
5,0,
0)(0
,0,0
)(0
,0,0
)(0
,0,0
)(0
,0,0
)(1
0,0,
0)(0
,0,0
)(0
,0,0
)(9
,0,0
)(4
2,0,
0)15
71.4
00
Syst
em25
779
(51,
7,3)
(74,
7,2)
(72,
10,3
)(7
5,6,
4)(7
6,5,
3)(6
1,7,
0)(6
4,5,
2)(7
4,3,
3)(7
7,9,
4)(9
4,10
,3)
(82,
9,4)
(55,
6,2)
(46,
4,3)
(91,
11,5
)(6
4,4,
3)(4
2,4,
0)(6
9,8,
1)(1
67,1
9,8)
6541
.927
11Sy
stem
.Sec
urity
.Cry
ptog
raph
y.*
250
55(0
,0,0
)(0
,0,0
)(0
,0,0
)(0
,0,0
)(0
,0,0
)(0
,0,0
)(0
,0,0
)(0
,0,0
)(5
,0,0
)(0
,0,0
)(0
,0,0
)(0
,0,0
)(0
,0,0
)(0
,0,0
)(0
,0,0
)(1
4,3,
0)(3
,0,0
)(1
9,3,
0)8
68.4
230
Syst
em.R
untim
e.In
tero
pSer
vice
s.*
235
65(0
,0,0
)(7
,0,0
)(2
,0,0
)(2
,0,0
)(5
,0,0
)(8
,0,0
)(3
,0,0
)(5
,0,0
)(1
1,0,
0)(3
,0,0
)(7
,0,0
)(3
,0,0
)(5
,0,0
)(5
,0,0
)(3
,0,0
)(4
,0,0
)(4
,0,0
)(1
5,0,
0)6
26.7
00
Mic
roso
ft.V
isua
lBas
ic.*
235
69(0
,0,0
)(0
,0,0
)(0
,0,0
)(0
,0,0
)(0
,0,0
)(0
,0,0
)(0
,0,0
)(0
,0,0
)(1
,0,0
)(0
,0,0
)(0
,0,0
)(0
,0,0
)(0
,0,0
)(2
,0,0
)(0
,0,0
)(0
,0,0
)(0
,0,0
)(3
,0,0
)1
33.3
00
Syst
em.D
raw
ing.
*19
147
(0,0
,0)
(0,0
,0)
(0,0
,0)
(0,0
,0)
(0,0
,0)
(0,0
,0)
(0,0
,0)
(0,0
,0)
(0,0
,0)
(0,0
,0)
(28,
0,0)
(0,0
,0)
(0,0
,0)
(2,0
,0)
(17,
0,0)
(0,0
,0)
(0,0
,0)
(31,
0,0)
166.
50
0Sy
stem
.Run
time.
Rem
otin
g.*
190
77(0
,0,0
)(3
,0,0
)(0
,0,0
)(5
,0,0
)(0
,0,0
)(3
,0,0
)(0
,0,0
)(0
,0,0
)(3
,0,0
)(1
,0,0
)(2
1,1,
1)(1
,0,0
)(6
,1,1
)(7
,0,0
)(3
,2,0
)(0
,0,0
)(0
,0,0
)(2
9,3,
1)15
79.3
134
Syst
em.C
onfig
urat
ion.
*18
654
(5,1
,0)
(2,0
,0)
(7,1
,0)
(1,1
,0)
(0,0
,0)
(3,1
,0)
(0,0
,0)
(0,0
,0)
(3,1
,0)
(4,1
,0)
(1,0
,0)
(6,3
,1)
(0,0
,0)
(24,
3,0)
(7,4
,0)
(0,0
,0)
(1,0
,0)
(32,
7,1)
1759
.437
5Sy
stem
.Dia
gnos
tics.
*17
366
(4,0
,0)
(18,
0,0)
(4,0
,0)
(8,0
,0)
(6,0
,0)
(7,0
,0)
(13,
0,0)
(9,0
,0)
(3,0
,0)
(10,
0,0)
(12,
0,0)
(6,0
,0)
(4,0
,0)
(6,0
,0)
(8,1
,0)
(0,0
,0)
(4,0
,0)
(34,
1,0)
2047
.16
0Sy
stem
.IO.*
123
68(6
,0,0
)(1
4,0,
0)(2
0,1,
0)(9
,0,0
)(8
,0,0
)(2
3,3,
2)(4
,0,0
)(1
,0,0
)(2
5,1,
1)(1
3,0,
0)(2
5,2,
3)(9
,0,1
)(1
,0,0
)(2
2,0,
0)(1
6,0,
0)(2
1,1,
2)(2
2,5,
2)(3
5,8,
6)29
68.6
3325
Syst
em.R
eflec
tion.
*11
342
(11,
0,0)
(58,
0,0)
(24,
0,0)
(26,
0,0)
(43,
0,0)
(25,
0,0)
(45,
0,0)
(24,
0,0)
(28,
0,0)
(41,
0,0)
(29,
0,0)
(23,
0,0)
(30,
0,0)
(64,
0,0)
(35,
0,0)
(12,
0,0)
(21,
0,0)
(77,
0,0)
6829
.90
0Sy
stem
.Ent
erpr
iseS
ervi
ces.
*11
144
(0,0
,0)
(0,0
,0)
(0,0
,0)
(0,0
,0)
(0,0
,0)
(0,0
,0)
(0,0
,0)
(0,0
,0)
(0,0
,0)
(0,0
,0)
(0,0
,0)
(0,0
,0)
(0,0
,0)
(19,
0,0)
(0,0
,0)
(0,0
,0)
(0,0
,0)
(19,
0,0)
1710
.50
0Sy
stem
.Cod
eDom
.*10
598
(0,0
,0)
(0,0
,0)
(0,0
,0)
(0,0
,0)
(0,0
,0)
(0,0
,0)
(1,0
,0)
(1,0
,0)
(34,
0,0)
(6,0
,0)
(5,0
,0)
(1,0
,0)
(0,0
,0)
(0,0
,0)
(1,0
,0)
(0,0
,0)
(0,0
,0)
(35,
0,0)
3394
.30
0M
icro
soft
.Bui
ld.*
9692
(0,0
,0)
(0,0
,0)
(0,0
,0)
(0,0
,0)
(0,0
,0)
(0,0
,0)
(0,0
,0)
(0,0
,0)
(20,
1,0)
(0,0
,0)
(0,0
,0)
(0,0
,0)
(0,0
,0)
(0,0
,0)
(4,0
,0)
(0,0
,0)
(0,0
,0)
(23,
1,0)
248.
750
0Sy
stem
.Thr
eadi
ng.*
8076
(4,0
,0)
(5,0
,0)
(6,0
,0)
(3,0
,0)
(3,0
,0)
(11,
0,0)
(6,0
,0)
(1,0
,0)
(3,0
,0)
(3,0
,0)
(10,
0,0)
(5,0
,0)
(2,0
,0)
(9,1
,0)
(8,0
,0)
(2,0
,0)
(5,0
,0)
(21,
1,0)
2633
.314
0Sy
stem
.Run
time.
Seri
aliz
atio
n.*
7449
(2,0
,0)
(8,3
,0)
(2,0
,0)
(5,2
,0)
(15,
2,0)
(5,1
,0)
(4,1
,0)
(2,0
,0)
(5,1
,0)
(7,3
,0)
(4,0
,0)
(2,0
,0)
(2,0
,0)
(8,3
,0)
(2,0
,0)
(2,0
,0)
(6,2
,0)
(23,
6,0)
3134
.875
0Sy
stem
.Sec
urity
.Per
mis
sion
s70
19(0
,0,0
)(4
,0,0
)(0
,0,0
)(2
,0,0
)(4
,0,0
)(2
,0,0
)(2
,0,0
)(3
,0,0
)(6
,0,0
)(4
,0,0
)(1
,0,0
)(2
,0,0
)(2
,0,0
)(6
,0,0
)(0
,0,0
)(0
,0,0
)(0
,0,0
)(1
2,0,
0)17
0.0
00
Syst
em.R
untim
e.C
ompi
lerS
ervi
ces
6951
(6,0
,0)
(5,0
,0)
(6,0
,0)
(7,0
,0)
(6,0
,0)
(5,0
,0)
(7,0
,0)
(5,0
,0)
(6,0
,0)
(7,0
,0)
(4,0
,0)
(4,0
,0)
(10,
0,0)
(8,0
,0)
(3,0
,0)
(4,0
,0)
(5,0
,0)
(14,
0,0)
2028
.60
0Sy
stem
.Lin
q.*
6263
(2,0
,0)
(2,0
,0)
(2,0
,0)
(12,
0,0)
(3,0
,0)
–(1
4,0,
0)(2
9,5,
1)–
(30,
6,1)
(0,0
,0)
(8,0
,0)
(4,0
,0)
––
––
(33,
7,2)
5363
.633
10Sy
stem
.Mes
sagi
ng.*
5290
(0,0
,0)
(0,0
,0)
(0,0
,0)
(0,0
,0)
(0,0
,0)
(0,0
,0)
(0,0
,0)
(0,0
,0)
(0,0
,0)
(0,0
,0)
(0,0
,0)
(0,0
,0)
(0,0
,0)
(12,
0,0)
(0,0
,0)
(0,0
,0)
(0,0
,0)
(12,
0,0)
2375
.00
0M
icro
soft
.Win
32.*
4956
(0,0
,0)
(0,0
,0)
(0,0
,0)
(0,0
,0)
(0,0
,0)
(0,0
,0)
(0,0
,0)
(0,0
,0)
(3,0
,0)
(0,0
,0)
(2,0
,0)
(0,0
,0)
(0,0
,0)
(2,0
,0)
(2,0
,0)
(0,0
,0)
(0,0
,0)
(3,0
,0)
633
.30
0Sy
stem
.Sec
urity
.Pol
icy
4531
(0,0
,0)
(0,0
,0)
(0,0
,0)
(0,0
,0)
(0,0
,0)
(0,0
,0)
(0,0
,0)
(0,0
,0)
(1,0
,0)
(0,0
,0)
(5,0
,0)
(1,0
,0)
(0,0
,0)
(1,0
,0)
(1,0
,0)
(0,0
,0)
(0,0
,0)
(5,0
,0)
110.
00
0Sy
stem
.Glo
baliz
atio
n39
90(1
,0,0
)(1
,0,0
)(4
,0,0
)(4
,0,0
)(4
,0,0
)(4
,0,0
)(2
,0,0
)(1
,0,0
)(6
,0,0
)(3
,0,0
)(2
,0,0
)(1
,0,0
)(0
,0,0
)(8
,0,0
)(1
,0,0
)(2
,0,0
)(6
,0,0
)(1
2,0,
0)31
50.0
00
Syst
em.T
rans
actio
ns.*
3868
(0,0
,0)
(0,0
,0)
(0,0
,0)
(0,0
,0)
(0,0
,0)
(0,0
,0)
(0,0
,0)
(0,0
,0)
(0,0
,0)
(12,
1,0)
(0,0
,0)
(0,0
,0)
(0,0
,0)
(11,
0,0)
(4,0
,0)
(0,0
,0)
(0,0
,0)
(17,
1,0)
4552
.911
0Sy
stem
.Sec
urity
3650
(0,0
,0)
(6,0
,0)
(0,0
,0)
(3,0
,0)
(3,0
,0)
(2,0
,0)
(9,0
,0)
(1,0
,0)
(1,0
,0)
(3,0
,0)
(2,0
,0)
(0,0
,0)
(0,0
,0)
(7,0
,0)
(1,0
,0)
(1,0
,0)
(2,0
,0)
(13,
0,0)
3646
.20
0Sy
stem
.Col
lect
ions
.Gen
eric
3197
(15,
2,2)
(18,
9,1)
(15,
0,0)
(20,
4,3)
(14,
6,5)
(1,0
,0)
(15,
5,1)
(11,
3,0)
(1,0
,0)
(24,
6,4)
(12,
1,1)
(20,
6,1)
(12,
3,2)
(8,3
,0)
(16,
4,1)
(0,0
,0)
(17,
4,1)
(20,
10,6
)65
90.0
5633
Syst
em.T
ext
2546
(2,0
,0)
(2,0
,0)
(2,0
,0)
(1,0
,0)
(2,0
,0)
(2,0
,0)
(1,0
,0)
(1,0
,0)
(3,0
,0)
(2,0
,0)
(2,0
,0)
(1,0
,0)
(1,0
,0)
(3,0
,0)
(1,0
,0)
(2,0
,0)
(2,0
,0)
(3,0
,0)
1266
.70
0Sy
stem
.Col
lect
ions
2592
(10,
5,1)
(8,6
,0)
(15,
7,4)
(11,
7,0)
(7,6
,0)
(11,
8,1)
(7,5
,2)
(2,2
,0)
(14,
10,3
)(1
5,8,
3)(1
4,6,
4)(4
,4,0
)(1
0,2,
2)(1
7,9,
5)(4
,2,1
)(5
,3,0
)(1
3,6,
2)(2
1,13
,8)
8485
.772
44Sy
stem
.Ser
vice
Proc
ess.
*21
92(0
,0,0
)(0
,0,0
)(0
,0,0
)(0
,0,0
)(0
,0,0
)(0
,0,0
)(0
,0,0
)(0
,0,0
)(2
,0,0
)(0
,0,0
)(0
,0,0
)(0
,0,0
)(0
,0,0
)(0
,0,0
)(0
,0,0
)(0
,0,0
)(0
,0,0
)(2
,0,0
)10
50.0
00
Syst
em.R
esou
rces
.*20
74(0
,0,0
)(2
,0,0
)(2
,0,0
)(0
,0,0
)(1
,0,0
)(0
,0,0
)(1
,0,0
)(2
,0,0
)(1
,0,0
)(0
,0,0
)(1
,0,0
)(2
,0,0
)(0
,0,0
)(4
,1,1
)(1
,0,0
)(0
,0,0
)(2
,0,0
)(5
,1,1
)25
80.0
2525
Syst
em.S
ecur
ity.P
rinc
ipal
1875
(0,0
,0)
(0,0
,0)
(2,0
,0)
(0,0
,0)
(0,0
,0)
(4,0
,0)
(0,0
,0)
(0,0
,0)
(0,0
,0)
(0,0
,0)
(1,0
,0)
(0,0
,0)
(0,0
,0)
(0,0
,0)
(4,0
,0)
(0,0
,0)
(0,0
,0)
(6,0
,0)
3310
0.0
00
Syst
em.C
olle
ctio
ns.S
peci
aliz
ed15
100
(0,0
,0)
(2,1
,0)
(4,1
,1)
(1,0
,1)
(0,0
,0)
(2,0
,0)
(0,0
,0)
(0,0
,0)
(7,1
,1)
(5,0
,0)
(5,0
,0)
(4,1
,0)
(2,0
,0)
(8,1
,1)
(0,0
,0)
(0,0
,0)
(2,0
,0)
(13,
4,3)
8784
.636
27Sy
stem
.Tex
t.Reg
ular
Exp
ress
ions
1210
0(6
,0,0
)(0
,0,0
)(7
,0,0
)(6
,0,0
)(2
,0,0
)(4
,0,0
)(0
,0,0
)(2
,0,0
)(9
,0,0
)(7
,0,0
)(2
,0,0
)(0
,0,0
)(1
,0,0
)(6
,0,0
)(5
,0,0
)(2
,0,0
)(3
,0,0
)(9
,0,0
)75
77.8
00
Syst
em.R
untim
e.V
ersi
onin
g8
17(0
,0,0
)(1
,0,0
)(0
,0,0
)(1
,0,0
)(1
,0,0
)(0
,0,0
)(1
,0,0
)(1
,0,0
)(0
,0,0
)(0
,0,0
)(0
,0,0
)(1
,0,0
)(0
,0,0
)(0
,0,0
)(0
,0,0
)(0
,0,0
)(0
,0,0
)(1
,0,0
)13
0.0
00
Syst
em.C
olle
ctio
ns.O
bjec
tMod
el7
100
(0,0
,0)
(1,1
,1)
(1,1
,1)
(2,1
,1)
(3,2
,2)
(0,0
,0)
(2,0
,1)
(1,0
,0)
(0,0
,0)
(2,0
,1)
(0,0
,0)
(2,1
,1)
(1,0
,0)
(1,0
,0)
(1,0
,0)
(0,0
,0)
(2,1
,2)
(4,2
,2)
5710
0.0
5050
Mic
roso
ft.C
Shar
p.*
780
(0,0
,0)
(0,0
,0)
(0,0
,0)
(0,0
,0)
(0,0
,0)
(0,0
,0)
(0,0
,0)
(0,0
,0)
(1,0
,0)
(1,0
,0)
(1,0
,0)
(0,0
,0)
(0,0
,0)
(0,0
,0)
(0,0
,0)
(0,0
,0)
(0,0
,0)
(1,0
,0)
1410
0.0
00
Syst
em.T
imer
s4
100
(0,0
,0)
(0,0
,0)
(0,0
,0)
(0,0
,0)
(0,0
,0)
(0,0
,0)
(0,0
,0)
(0,0
,0)
(0,0
,0)
(0,0
,0)
(3,0
,0)
(0,0
,0)
(0,0
,0)
(0,0
,0)
(2,0
,0)
(0,0
,0)
(0,0
,0)
(3,0
,0)
7566
.70
0
#R
efer
ence
dty
pes
143
307
251
237
280
229
205
178
369
382
453
217
139
605
317
113
198
#Sp
ecia
lized
type
s16
3928
2627
2018
1326
3931
2910
7319
1126
#L
ate
boun
dty
pes
67
910
113
64
1012
2011
822
52
8
75%
235
8933
7833
8M
edia
n80
7320
537
025
%36
5413
330
0
Tabl
eA
.9.U
sage
of.N
ET
inth
eco
rpus
:(nu
mbe
rsof
refe
renc
ing,
spec
ializ
atio
n,la
tebi
ndin
g)

A.2 Appendix for Chapter 4 239
The client code specializes the framework class List for generic collections re-sulting in a subclass MyList. The client code also defines a method printResult thatworks on the framework type List. In the body of that method, List’s virtual memberCount (which is a property, in fact) is invoked. Further, the client code instantiatesMyList and passes that list to printResult. Subject to a dynamic program analysis, itcan be determined that late binding is used on List. In fact, in this specific example,an inter-procedural analysis would be sufficient as opposed to a full-blown dynamicanalysis. The term static receiver type refers the receiver type essentially as it is de-clared in the source code or as the declaration is recoverable from the byte code.Hence, the static receiver type in the call l.Count is List<Item>, but the dynamicreceiver type is MyList<Item>.
NH
ibern
ate
Lu
cen
e.N
et
Sh
arp
Zip
Lib
Sp
rin
g.N
ET
Act
iveR
eco
rd
Win
dso
r
NA
nt
Mon
oR
ail
Json
.NE
T
log
4n
et
Pri
sm
NU
nit
ME
F
Cast
leC
ore
Rh
ino.M
ock
s
Moq
xUn
it
0%
20%
40%
60%
80%
100%
Project Methods
Late binding
Framework Methods
Figure A.11. .NET calls w/ and w/o late binding
Actual reuse of .NET platform by projects is shown in Table A.9, providing num-bers for the infographics of Table 4.8. Figure A.11 shows how often late binding oc-curs. Figure A.12 gives detailed overview of the breakdown of referenced types intolate-bound, specialized, specializable, and non-specializable. Figure A.13 providessuch breakdown per each namespace, for all types, including non-referenced.
Figures A.14 and A.15 provide information about .NET interfaces and classesthat were derived/inherited in the corpus. Figure A.16 shows top 30 .NET interfacesthat were implemented in the corpus. Table A.10 lists .NET orphan types that wereimplemented in the corpus.
The derived .NET classes in Figure A.15 can be classified as follows. Again, col-lections dominate the picture, followed by custom attributes (say, annotations) and

240 Appendix
Non−specializableSpecializableSpecializedLate−bound
Breakdown of referenced types
Namespaces (ordered decreasingly by the number of types)
Perc
enta
ge
020
4060
8010
0
Figure A.12. Breakdown of referenced types
Non−specializable (non−ref)Specializable (non−ref)Non−specializable (ref)Specializable (ref)SpecializedLate−bound
Breakdown of types in terms of usage
Namespaces (ordered decreasingly by the number of types)
Perc
enta
ge
020
4060
8010
0
Figure A.13. Breakdown of types in terms of the actual reuse metrics

A.2 Appendix for Chapter 4 241
0 5 10 15 20 25 30 35 40
System.ComponentModel.IContainerSystem.ComponentModel.ISite
System.ComponentModel.Composition.Primitives.ICompositionElementSystem.Collections.Generic.ICollection`1
System.Collections.IComparerSystem.Linq.IOrderedQueryable`1
System.Linq.IQueryable`1System.Configuration.Internal.IInternalConfigSystem
System.Configuration.Internal.IConfigErrorInfoSystem.Data.IDataReaderSystem.Data.IDataRecord
System.ComponentModel.IEditableObjectSystem.ComponentModel.IRevertibleChangeTracking
System.ComponentModel.IChangeTrackingSystem.ComponentModel.INotifyPropertyChanging
System.ComponentModel.IDataErrorInfoSystem.ComponentModel.Design.IServiceContainer
System.Collections.IListSystem.Collections.IDictionary
System.Linq.IOrderedQueryableSystem.Linq.IQueryable
System.Collections.Specialized.INotifyCollectionChangedSystem.ComponentModel.INotifyPropertyChanged
System.ICloneableSystem.Collections.ICollection
System.IServiceProviderSystem.Collections.Generic.IEnumerable`1
System.Collections.IEnumerableSystem.IDisposable
1111111111122222222222
44
8910
1937
For each interface, the number of sub-interfaces in the corpus are shown.
Figure A.14. All .NET interfaces with sub-interfaces in the corpus
0 20 40 60 80 100 120 140
System.Collections.DictionaryBaseSystem.Collections.Specialized.NameValueCollection
System.Web.UI.PageSystem.Configuration.ConfigurationElementCollection
System.Configuration.ConfigurationElementSystem.Resources.ResourceManager
System.Collections.ObjectModel.KeyedCollection`2System.Linq.Expressions.Expression
System.Web.UI.WebControls.WebControlSystem.Collections.Generic.List`1
System.Collections.Generic.Dictionary`2System.Collections.ArrayList
System.Web.UI.ControlSystem.IO.IOException
System.ComponentModel.EnumConverterSystem.Linq.Expressions.ExpressionVisitor
System.SystemExceptionSystem.IO.TextWriter
System.Collections.HashtableSystem.IO.Stream
System.Windows.Forms.UserControlSystem.Collections.ObjectModel.Collection`1
System.ComponentModel.TypeConverterSystem.Windows.Forms.Form
System.EventArgsSystem.ApplicationException
System.Collections.CollectionBaseSystem.MarshalByRefObject
System.ExceptionSystem.Attribute
223333444555556778
11111112
1717
2325
3851
59135
For each class, the number of subclasses in the corpus are shown.
Figure A.15. Top 30 .NET classes inherited in the corpus

242 Appendix
0 50 100 150 200 250 300 350
System.ComponentModel.IEditableObjectSystem.ComponentModel.IRevertibleChangeTracking
System.ComponentModel.IChangeTrackingSystem.Data.IDataReaderSystem.Web.IHttpHandlerSystem.Web.IHttpModule
System.Runtime.Serialization.IObjectReferenceSystem.ComponentModel.Design.IServiceContainer
System.Collections.Generic.IList`1System.ComponentModel.INotifyPropertyChanged
System.Collections.Generic.IEqualityComparer`1System.Collections.Generic.IDictionary`2
System.Configuration.IConfigurationSectionHandlerSystem.IComparableSystem.IEquatable`1
System.Collections.IDictionaryEnumeratorSystem.Runtime.Serialization.IDeserializationCallback
System.IServiceProviderSystem.Collections.IList
System.Collections.IComparerSystem.Collections.IDictionary
System.Collections.Generic.ICollection`1System.Runtime.Serialization.ISerializable
System.Collections.ICollectionSystem.ICloneable
System.Collections.Generic.IEnumerator`1System.Collections.Generic.IEnumerable`1
System.Collections.IEnumeratorSystem.Collections.IEnumerable
System.IDisposable
5555677791011121314141416181925283338
6583
117578
155196
118176
185256
303
For each interfaces, the number of implementing classes in the corpus are shown. Note: thefull bar counts all implementations whereas the black part excludes classes that can be
reliably classified as being compiler-generated.
Figure A.16. Top 30 .NET interfaces implemented in the corpus
Namespace % I/C Implemented types Count
System 28.57 I IServiceProvider 18I IAsyncResult 1
System.Collections 60.00 C DictionaryBase 2C .CollectionBase 38C ReadOnlyCollectionBase 1
System.Collections.ObjectModel 100.00 C KeyedCollection‘2 4
System.Collections.Specialized 100.00 C INotifyCollectionChanged 5
System.ComponentModel.* 12.77 I IEditableObject 5I IRevertibleChangeTracking 5I INotifyPropertyChanging 4I IDataErrorInfo 4I ITypedList 1I Composition.IPartImportsSatis-
fiedNotification1
System.Configuration.* 20.00 C ApplicationSettingsBase 1
System.Runtime.Serialization.* 50.00 I IDeserializationCallback 16C SerializationBinder 1I ISafeSerializationData 1
System.Xml.* 42.86 C Xsl.XsltContext 1I Xsl.IXsltContextFunction 1I Xsl.IXsltContextVariable 1
Table A.10. .NET orphan types implemented in the corpus

A.2 Appendix for Chapter 4 243
exceptions. Marginally exercised aspects include conversion, remoting, user inter-faces, configuration, I/O, and visitors for LINQ.
The implemented .NET interfaces in Figure A.16 can be classified as follows.The list of interfaces is headed by IDisposable, which is used for the release ofresources; primarily, these are unmanaged resources. 12 of the 30 interfaces deal withcollections. Among the top 10, there are additionally interfaces for serialization andcloning. In the rest of the list, yet other aspects are exercised: comparison, services,streaming, and change tracking.
On correlation
Where appropriate, we calculated Spearman’s rank correlation coefficient, a non-parametric measure of statistical dependence between variables. The sign of the co-efficient indicates the direction of the association: “+” means that when A increases,B increases, too; “-” means that when A increases, B decreases. The value of the coef-ficient indicates the degree of the correlation: “0” means that there is no tendency forB to either increase or decrease when A increases; “1” means that A and B perfectlymonotonically related. (Please note that correlation does not imply causation!)
Spearman’s rank correlation coefficient is calculated for reuse-related metrics(Table A.11), for classification of namespaces (Table A.12), and for actual reusemetrics (Table A.13 and Table A.14). Stars highlight statistically significant results:three stars mean that p-value is less than 0.001, two stars mean that p-value is lessthan 0.01, and one star means that p-value is less than 0.05. P-value in its turn is aprobability to obtain something like what is observed, assuming that null hypothesis(that there is no correlation) is true. So “statistically significant results” mean thatthe null hypothesis can be rejected with low risk of making a type I error (i.e., re-jecting the true null hypothesis) and that the alternative hypothesis (that correlationis present, with such-and-such Spearman’s rho) can be accepted instead.
We neither analyze the results in detail nor interpret them. Let us just mentionsome of the observed (non-trivial) correlations. For instance, there is a positive cor-relation between the number of types in a namespace and the MAX size class treewithin the namespace (Table A.11), meaning that the more types a namespace has,the bigger the maximal inheritance tree of namespace’s classes. According to Ta-ble A.13, there is a positive correlation such that the number of late-bound types in-creases with the number specialized types, which in turn increases with the numberspecializable, referenced types, which in turn increases with the number referencedtypes.

244 Appendixty
pes
met
hods
rCrI
max
CT
max
ITre
fdN
refg
Nsp
ecdN
spec
gNpC
pIpV
TpD
TpG
TpC
ApI
ApV
TApD
ApS
tCpA
CpC
rCpS
tMpA
MpC
rMpS
ldC
pSpC
pSpT
pSld
MpS
pMpO
CpO
IpO
TpL
OC
type
sm
etho
ds0.
95**
*rC
0.93
***
0.87
***
rI0.
76**
*0.
74**
*0.
64**
*m
axC
T0.
77**
*0.
77**
*0.
74**
*0.
50**
*m
axIT
0.67
***
0.67
***
0.49
***
0.86
***
0.41
***
refd
N0.
86**
*0.
81**
*0.
86**
*0.
65**
*0.
73**
*0.
60**
*re
fgN
0.25
*0.
27*
0.20
0.11
0.19
0.17
0.18
spec
dN0.
80**
*0.
77**
*0.
80**
*0.
62**
*0.
70**
*0.
54**
*0.
85**
*0.
15sp
ecgN
0.49
***
0.49
***
0.38
**0.
51**
*0.
30*
0.50
***
0.39
***
0.68
***
0.40
***
pC-0
.06
-0.0
60.
04-0
.22
0.24
*-0
.20
0.07
-0.0
7-0
.04
-0.2
0pI
0.29
*0.
28*
0.15
0.76
***
0.09
0.70
***
0.19
0.02
0.22
0.36
**-0
.38*
*pV
T0.
090.
050.
11-0
.11
-0.0
7-0
.14
0.02
0.05
0.03
0.03
-0.6
3***
-0.1
9pD
T0.
38**
0.37
**0.
47**
*0.
200.
35**
0.13
0.37
**0.
110.
45**
*0.
20-0
.18
-0.0
60.
02pG
T0.
140.
190.
070.
150.
120.
230.
01-0
.07
0.09
0.04
0.03
0.20
-0.2
0-0
.03
pCA
0.29
*0.
170.
29*
0.36
**0.
33**
0.34
**0.
36**
-0.1
10.
30*
0.11
0.25
*0.
33**
-0.3
6**
0.02
-0.0
3pI
A0.
24*
0.24
*0.
180.
40**
*0.
070.
41**
*0.
17-0
.01
0.24
*0.
21-0
.37*
*0.
40**
*-0
.03
0.30
*0.
190.
16pV
TA-0
.11
-0.0
1-0
.13
-0.2
9*-0
.22
-0.2
3-0
.17
0.33
**-0
.12
0.02
-0.2
3-0
.27*
0.44
***
-0.0
7-0
.04
-0.7
0***
-0.2
3pD
A0.
28*
0.30
*0.
38**
0.22
0.29
*0.
160.
30*
-0.0
20.
41**
*0.
140.
110.
04-0
.26*
0.59
***
0.38
**0.
040.
27*
-0.2
1pS
tC0.
24*
0.19
0.30
*0.
26*
0.22
0.26
*0.
39**
*0.
29*
0.18
0.14
0.07
0.20
-0.0
90.
070.
130.
170.
18-0
.08
0.15
pAC
0.28
*0.
29*
0.18
0.11
0.35
**0.
200.
170.
36**
0.23
0.48
***
0.18
0.00
-0.1
50.
060.
130.
12-0
.01
-0.0
60.
07-0
.06
pCrC
-0.0
2-0
.01
0.01
0.10
-0.1
0-0
.02
-0.0
3-0
.31*
*0.
03-0
.23
-0.1
40.
130.
030.
07-0
.17
0.00
0.03
-0.0
60.
01-0
.35*
*-0
.70*
**pS
tM0.
120.
110.
170.
050.
130.
050.
190.
31**
0.01
-0.0
3-0
.09
-0.0
30.
22-0
.01
0.01
-0.0
80.
090.
25*
-0.0
30.
59**
*-0
.12
-0.3
0*pA
M0.
34**
0.26
*0.
200.
63**
*0.
150.
51**
*0.
190.
110.
25*
0.39
**-0
.27*
0.80
***
-0.1
8-0
.07
0.11
0.38
**0.
21-0
.21
-0.0
30.
100.
21-0
.03
-0.1
0pC
rM-0
.07
-0.0
5-0
.04
-0.2
7*0.
01-0
.18
-0.0
4-0
.18
0.06
-0.0
70.
37**
-0.3
9***
-0.1
60.
06-0
.10
0.03
-0.2
1-0
.14
0.05
-0.5
0***
0.16
0.23
-0.7
5***
-0.3
9***
pSld
C0.
180.
070.
170.
170.
070.
130.
130.
12-0
.05
0.10
0.06
0.04
0.18
-0.2
5*-0
.17
0.03
-0.1
4-0
.04
-0.2
8*0.
140.
03-0
.08
0.21
0.03
-0.0
9pS
pC-0
.10
-0.0
3-0
.09
-0.1
1-0
.01
-0.0
7-0
.05
-0.0
70.
13-0
.03
0.02
0.02
-0.2
6*0.
28*
0.20
0.04
0.15
-0.0
40.
34**
-0.0
90.
030.
16-0
.29*
0.04
0.17
-0.9
2***
pSpT
-0.0
7-0
.02
-0.0
8-0
.01
-0.0
50.
02-0
.04
-0.0
70.
130.
00-0
.08
0.18
-0.2
5*0.
24*
0.23
0.07
0.25
*-0
.06
0.32
**-0
.02
-0.0
20.
18-0
.24*
0.17
0.06
-0.8
9***
0.96
***
pSld
M0.
150.
150.
040.
29*
0.11
0.48
***
0.16
0.29
*0.
200.
37**
0.06
0.37
**-0
.28*
0.03
0.25
*0.
27*
0.05
-0.0
50.
100.
050.
24-0
.12
0.00
0.29
*0.
00-0
.08
0.11
0.14
pSpM
0.23
0.20
0.14
0.38
**0.
110.
29*
0.09
0.16
0.15
0.32
**-0
.22
0.40
***
0.00
-0.0
2-0
.31*
0.15
0.06
-0.0
3-0
.26*
-0.0
50.
26*
-0.0
3-0
.25*
0.60
***
-0.0
80.
12-0
.04
0.03
-0.0
7pO
C0.
31**
0.31
**0.
29*
0.17
0.37
**0.
160.
29*
0.23
0.41
***
0.32
**0.
25*
-0.0
1-0
.30*
0.20
0.22
0.17
0.12
-0.1
00.
38**
0.02
0.70
***
-0.4
9***
-0.0
50.
200.
05-0
.11
0.15
0.11
0.19
0.03
pOI
0.48
***
0.43
***
0.49
***
0.65
***
0.41
***
0.40
***
0.39
***
-0.1
10.
46**
*0.
17-0
.13
0.52
***
-0.0
50.
150.
050.
26*
0.19
-0.2
20.
180.
20-0
.01
0.04
0.08
0.52
***
-0.3
5**
0.21
-0.1
7-0
.09
-0.0
90.
43**
*0.
12pO
T0.
27*
0.24
*0.
230.
45**
*0.
210.
26*
0.17
-0.0
10.
36**
0.20
-0.1
00.
48**
*-0
.21
0.11
0.22
0.17
0.27
*-0
.13
0.24
*0.
060.
29*
-0.1
6-0
.02
0.57
***
-0.3
0*-0
.02
0.08
0.16
0.00
0.32
**0.
59**
*0.
67**
*pL
OC
0.19
0.18
0.11
0.13
0.16
0.13
0.10
0.35
**0.
210.
51**
*0.
090.
05-0
.19
0.01
0.16
0.09
0.14
-0.1
00.
160.
040.
81**
*-0
.61*
**-0
.09
0.24
*0.
070.
000.
050.
040.
150.
150.
80**
*0.
000.
46**
*pL
OI
0.44
***
0.41
***
0.43
***
0.66
***
0.28
*0.
43**
*0.
30*
0.07
0.40
***
0.34
**-0
.29*
0.62
***
-0.0
10.
18-0
.01
0.21
0.23
-0.1
40.
120.
170.
040.
040.
060.
59**
*-0
.36*
*0.
19-0
.14
-0.0
5-0
.01
0.51
***
0.07
0.91
***
0.62
***
0.07
Tabl
eA
.11.
Spea
rman
’sra
nkco
rrel
atio
nco
effic
ient
forr
euse
-rel
ated
met
rics

isA
pplic
atio
nis
Cor
eis
Ope
nis
Clo
sed
isIn
com
plet
eis
Bra
nche
dis
Flat
isIn
terf
aceI
nten
sive
isD
eleg
ateI
nten
sive
isA
pplic
atio
nis
Cor
e-0
.15
isO
pen
0.11
-0.0
9is
Clo
sed
-0.0
20.
13-0
.41*
**is
Inco
mpl
ete
0.12
-0.0
70.
18-0
.11
isB
ranc
hed
-0.1
6-0
.09
-0.0
6-0
.06
-0.0
4is
Flat
0.39
***
-0.1
60.
230.
010.
04-0
.41*
**is
Inte
rfac
eInt
ensi
ve0.
120.
08-0
.04
-0.1
10.
27*
-0.1
10.
04is
Del
egat
eInt
ensi
ve-0
.03
-0.1
1-0
.08
-0.3
5**
0.09
0.13
-0.0
80.
09is
Eve
ntB
ased
-0.1
1-0
.01
-0.1
2-0
.29*
-0.0
30.
04-0
.21
0.06
0.69
***
Tabl
eA
.12.
Spea
rman
’sra
nkco
rrel
atio
nco
effic
ient
forc
ateg
orie
s

246 Appendix
types totalRefT spbTAbs spbTRel totalSpdTtypes
totalRefT 0.70***spbTAbs 0.99*** 0.70***spbTRel 0.66*** 0.95*** 0.67***
totalSpdT 0.40** 0.62*** 0.43** 0.62***totalLbT 0.22 0.49*** 0.24 0.54*** 0.84***
Table A.13. Spearman’s rank correlation coefficient for actual reuse metrics (numbers)
pRefT pSpbTAbs pSpbTRel pSpdTAbs pSpdTRel pLBTAbspRefT
pSpbTAbs 0.13pSpbTRel 0.01 0.61***pSpdTAbs 0.39** 0.38* 0.15pSpdTRel 0.26 0.46** 0.17 0.94***pLBTAbs 0.36* 0.34* 0.24 0.83*** 0.75***pLBTRel 0.32* 0.34* 0.22 0.81*** 0.75*** 0.99***
Table A.14. Spearman’s rank correlation coefficient for actual reuse metrics (percentage)