Corporate Recruiters Survey 2009 General Data Report
71
2009 General Data Report
-
Upload
khangminh22 -
Category
Documents
-
view
6 -
download
0
Transcript of Corporate Recruiters Survey 2009 General Data Report

2009 General Data Report

The Corporate Recruiters Survey is a product of the Graduate Management Admission Council® (GMAC®), a global nonprofit education organization of leading graduate business schools and the owner of the Graduate Management Admission Test® (GMAT®). The GMAT exam is an important part of the admissions process for more than 4,600 graduate management programs around the world. GMAC is dedicated to creating access to and disseminating information about graduate management education; these schools and others rely on the Council as the premier provider of reliable data about the graduate management education industry. This year, GMAC partnered with the European Foundation for Management Development (EFMD) and MBA Career Services Council (MBA CSC) in developing questions for the survey and increasing business school participation worldwide.
EFMD is an international membership organization based in Brussels, Belgium. With more than 650 member organizations from academia, business, public service, and consultancy in 75 countries, EFMD provides a unique forum for information, research, networking, and debate on innovation and best practice in management development. EFMD is recognized globally as an accreditation body of quality in management education and has established accreditation services for business schools and business school programs, corporate universities, and technology-enhanced learning programs.
The MBA CSC is an international professional association representing individuals in the field of MBA career services and recruiting. The MBA CSC provides a forum for the exchange of ideas and information and addresses issues unique to the needs of MBA career services and recruiting professionals. They also provide professional development and networking opportunities for their members and develop and promote their Standards for Reporting MBA Employment Statistics.

Corporate Recruiters Survey 2009 Data Report
© 2009 Graduate Management Admission Council®. All rights reserved. i
Contents INTRODUCTION ................................................................................................................... 1
OVERALL SUMMARY OF SURVEY RESULTS ................................................................... 3
Key Findings .................................................................................................................................................. 3
Impact of the Global Economic Slowdown ............................................................................................. 4
Recruitment Strategies .................................................................................................................................. 5
School Selection ........................................................................................................................................ 7
Job Opportunities by Candidate Type ....................................................................................................... 8
Demand for New Hires ........................................................................................................................... 8
Job Areas and Position Levels ................................................................................................................ 9
Compensation ......................................................................................................................................... 12
MBA Job Outlook ....................................................................................................................................... 13
Full-time, Part-time, Executive, and Online Program Graduates.................................................... 13
Characteristics of 2008 Hires with MBA Degrees ............................................................................. 13
MBA Hiring Strategies in 2009 ............................................................................................................. 14
Recruiting MBAs on Campus ........................................................................................................... 15
To Hire or Not to Hire—Employer Feedback .................................................................................. 16
Why Employers Hire MBA Graduates ........................................................................................... 16
Employer Satisfaction with MBA Employees ............................................................................... 18
Why Employers Do Not Hire MBA Graduates ............................................................................ 19
Compensation and Benefits .................................................................................................................. 20
MBA Retention Rates ............................................................................................................................ 22
Recruitment Firm Perspective ................................................................................................................... 23
METHODOLOGY ................................................................................................................. 27
Sample Selection .......................................................................................................................................... 27
Survey Administration ................................................................................................................................ 28
New This Year ............................................................................................................................................. 28
Data Analysis ............................................................................................................................................... 28
Participant Profile ........................................................................................................................................ 31
APPENDIX A: SURVEY PARTICIPANTS ........................................................................... 43 Participating Schools ................................................................................................................................... 43 Participating Companies ............................................................................................................................. 48


Corporate Recruiters Survey 2009 Data Report
© 2009 Graduate Management Admission Council®. All rights reserved. 1
Introduction
he Graduate Management Admission Council® (GMAC®), in cooperation with MBA Career Services Council and EFMD, are pleased to present the results of the eighth annual survey of business graduates’ employers, the 2009 Corporate Recruiters Survey. The primary purposes
of this study are to examine the job market for graduates from MBA and other master’s-level programs specialized in business and management, to identify employer needs and expectations and their evolution over time, and to provide employers with useful statistics on recruitment methods, compensation packages, and retention rates. This survey generated findings that can be used by:
• Individuals in the graduate management education community, including business school professionals, graduate business students, and prospective students, to gauge the job market and better understand employers’ expectations
• Employers of business graduates to help develop their hiring plans and benchmark their practices against hiring practices of similar organizations
• Career management professionals at business schools to better manage students’ expectations and employer relationships
This Comprehensive Data Report, which is available exclusively to participating schools and employers, is part of the 2009 Corporate Recruiters Survey report set. The content consists primarily of tables presenting survey responses by company characteristics that determine recruitment practices. The text that accompanies each major section of the report highlights some of the key findings. The tables, however, are not comprehensively discussed. The reader should consider that where there is a reference to 2008 and 2009, 2008 refer to actual and 2009 to anticipated by the same employers hiring data. When interpreting statistically significant findings, one should exert caution as the large samples may imply slight differences in the population that have little or no practical meaning.
Other publications of the set include: • The Corporate Recruiters Survey 2009 Survey Report—a publicly released executive report that
summarizes the overall significant findings and implications, including year-to-year trends • A complimentary individualized School Benchmarking Report for participating schools that
compares aggregated responses of employers that work with a particular participating school against aggregated responses of other employers
One hundred fifty-seven graduate business schools facilitated the administration of this survey by either submitting employer contact information for companies that hire their graduates or by administering the survey using their internal resources. The survey results are based on responses from 2,825 employers from 2,092 different companies. Detailed participant profile and survey definitions are available in the Methodology section of this report.
GMAC would like to thank MBA Career Services Council and EFMD for their contributions to the questionnaire design and school recruitment for this 2009 Corporate Recruiters Survey. GMAC would also like to thank all the schools and employers that participated. Without you, this report would not have been possible.
T

Corporate Recruiters Survey 2009 Data Report
© 2009 Graduate Management Admission Council®. All rights reserved. 3
Overall Summary of Survey Results
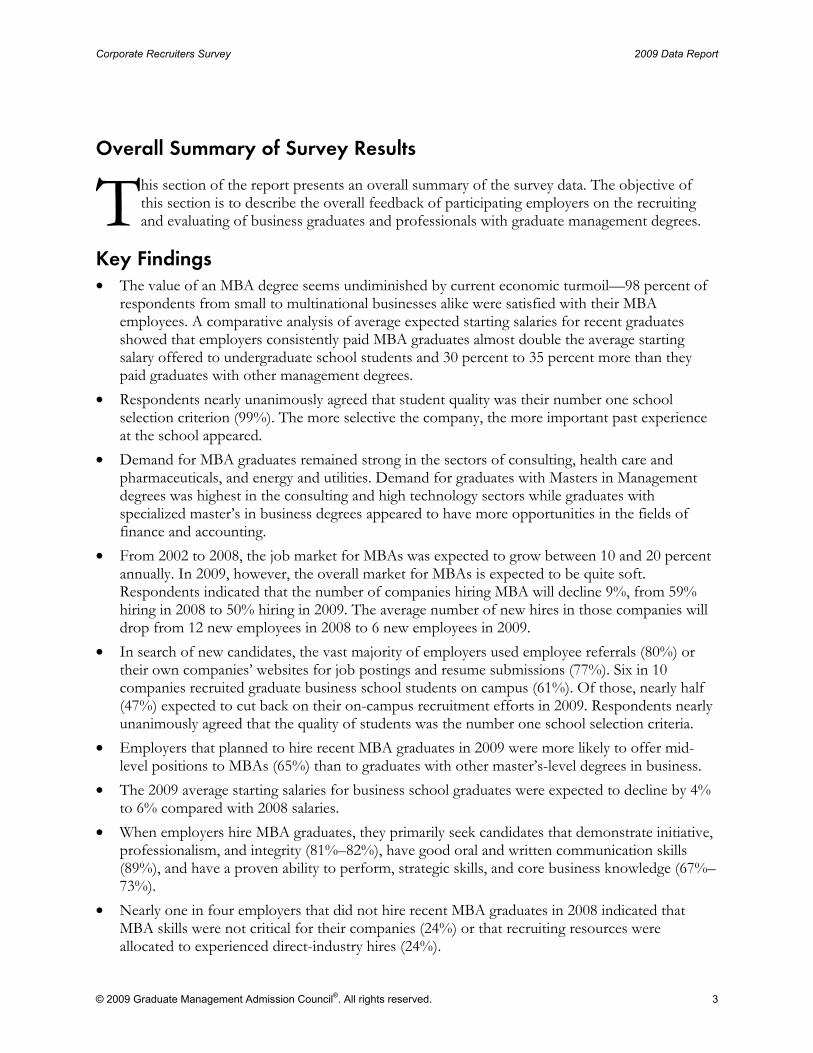
his section of the report presents an overall summary of the survey data. The objective of this section is to describe the overall feedback of participating employers on the recruiting and evaluating of business graduates and professionals with graduate management degrees.
Key Findings • The value of an MBA degree seems undiminished by current economic turmoil—98 percent of
respondents from small to multinational businesses alike were satisfied with their MBA employees. A comparative analysis of average expected starting salaries for recent graduates showed that employers consistently paid MBA graduates almost double the average starting salary offered to undergraduate school students and 30 percent to 35 percent more than they paid graduates with other management degrees.
• Respondents nearly unanimously agreed that student quality was their number one school selection criterion (99%). The more selective the company, the more important past experience at the school appeared.
• Demand for MBA graduates remained strong in the sectors of consulting, health care and pharmaceuticals, and energy and utilities. Demand for graduates with Masters in Management degrees was highest in the consulting and high technology sectors while graduates with specialized master’s in business degrees appeared to have more opportunities in the fields of finance and accounting.
• From 2002 to 2008, the job market for MBAs was expected to grow between 10 and 20 percent annually. In 2009, however, the overall market for MBAs is expected to be quite soft. Respondents indicated that the number of companies hiring MBA will decline 9%, from 59% hiring in 2008 to 50% hiring in 2009. The average number of new hires in those companies will drop from 12 new employees in 2008 to 6 new employees in 2009.
• In search of new candidates, the vast majority of employers used employee referrals (80%) or their own companies’ websites for job postings and resume submissions (77%). Six in 10 companies recruited graduate business school students on campus (61%). Of those, nearly half (47%) expected to cut back on their on-campus recruitment efforts in 2009. Respondents nearly unanimously agreed that the quality of students was the number one school selection criteria.
• Employers that planned to hire recent MBA graduates in 2009 were more likely to offer mid-level positions to MBAs (65%) than to graduates with other master’s-level degrees in business.
• The 2009 average starting salaries for business school graduates were expected to decline by 4% to 6% compared with 2008 salaries.
• When employers hire MBA graduates, they primarily seek candidates that demonstrate initiative, professionalism, and integrity (81%–82%), have good oral and written communication skills (89%), and have a proven ability to perform, strategic skills, and core business knowledge (67%–73%).
• Nearly one in four employers that did not hire recent MBA graduates in 2008 indicated that MBA skills were not critical for their companies (24%) or that recruiting resources were allocated to experienced direct-industry hires (24%).
T
2009 Data Report Corporate Recruiters Survey
4 © 2009 Graduate Management Admission Council®. All rights reserved.
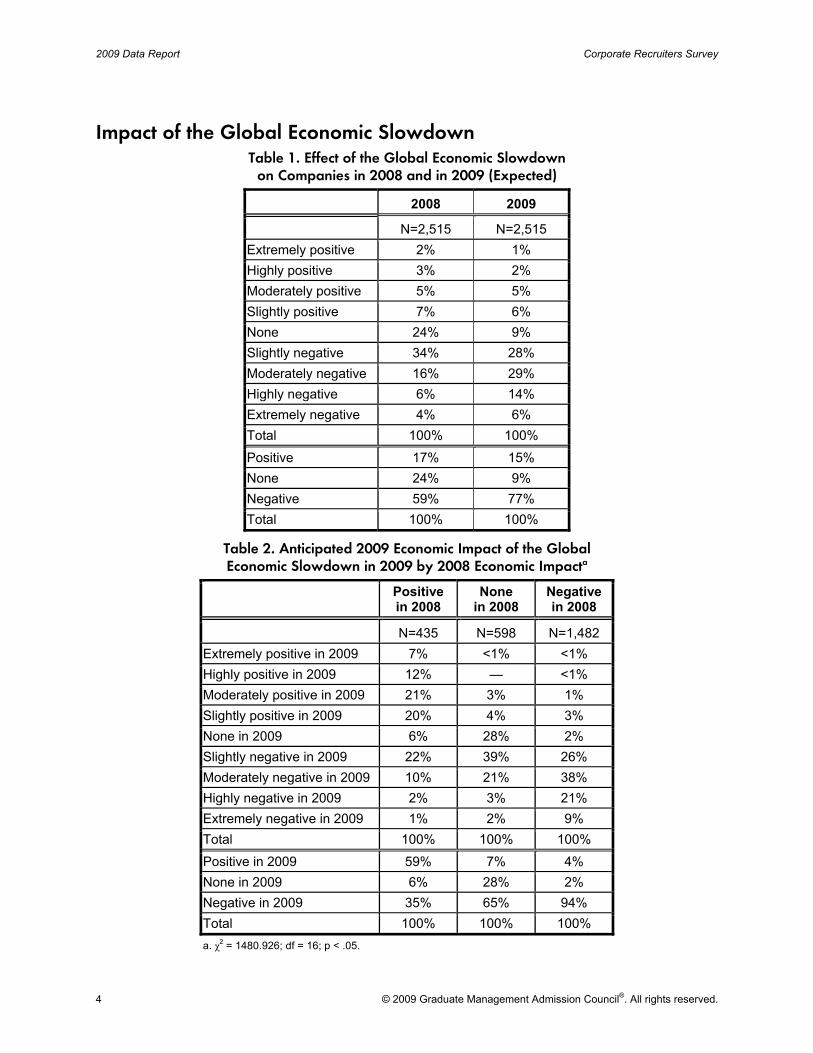
Impact of the Global Economic Slowdown Table 1. Effect of the Global Economic Slowdown
on Companies in 2008 and in 2009 (Expected)
2008 2009
N=2,515 N=2,515 Extremely positive 2% 1% Highly positive 3% 2% Moderately positive 5% 5% Slightly positive 7% 6% None 24% 9% Slightly negative 34% 28% Moderately negative 16% 29% Highly negative 6% 14% Extremely negative 4% 6% Total 100% 100%
Positive 17% 15% None 24% 9% Negative 59% 77% Total 100% 100%
Table 2. Anticipated 2009 Economic Impact of the Global Economic Slowdown in 2009 by 2008 Economic Impacta
Positive in 2008
None in 2008
Negative in 2008
N=435 N=598 N=1,482 Extremely positive in 2009 7% <1% <1% Highly positive in 2009 12% — <1% Moderately positive in 2009 21% 3% 1% Slightly positive in 2009 20% 4% 3% None in 2009 6% 28% 2% Slightly negative in 2009 22% 39% 26% Moderately negative in 2009 10% 21% 38% Highly negative in 2009 2% 3% 21% Extremely negative in 2009 1% 2% 9% Total 100% 100% 100%
Positive in 2009 59% 7% 4% None in 2009 6% 28% 2% Negative in 2009 35% 65% 94% Total 100% 100% 100% a. χ2 = 1480.926; df = 16; p < .05.
Corporate Recruiters Survey 2009 Data Report
© 2009 Graduate Management Admission Council®. All rights reserved. 5
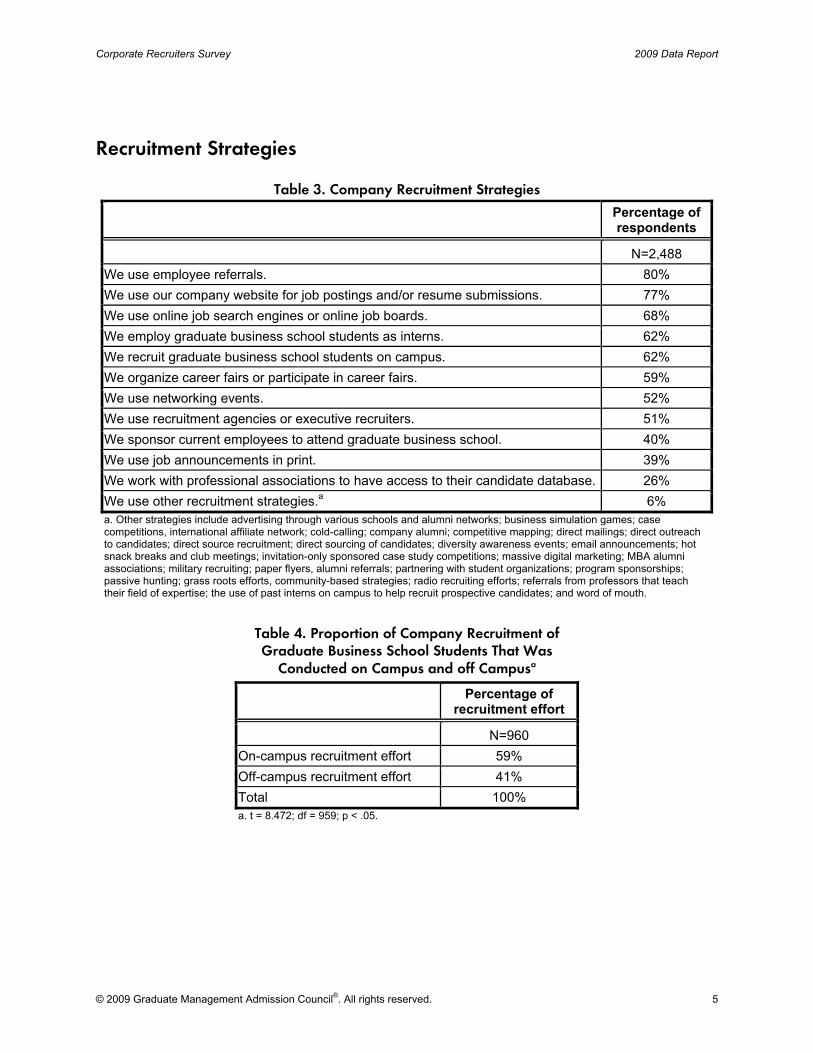
Recruitment Strategies
Table 3. Company Recruitment Strategies
Percentage of respondents
N=2,488 We use employee referrals. 80% We use our company website for job postings and/or resume submissions. 77% We use online job search engines or online job boards. 68% We employ graduate business school students as interns. 62% We recruit graduate business school students on campus. 62% We organize career fairs or participate in career fairs. 59% We use networking events. 52% We use recruitment agencies or executive recruiters. 51% We sponsor current employees to attend graduate business school. 40% We use job announcements in print. 39% We work with professional associations to have access to their candidate database. 26% We use other recruitment strategies.a 6% a. Other strategies include advertising through various schools and alumni networks; business simulation games; case competitions, international affiliate network; cold-calling; company alumni; competitive mapping; direct mailings; direct outreach to candidates; direct source recruitment; direct sourcing of candidates; diversity awareness events; email announcements; hot snack breaks and club meetings; invitation-only sponsored case study competitions; massive digital marketing; MBA alumni associations; military recruiting; paper flyers, alumni referrals; partnering with student organizations; program sponsorships; passive hunting; grass roots efforts, community-based strategies; radio recruiting efforts; referrals from professors that teach their field of expertise; the use of past interns on campus to help recruit prospective candidates; and word of mouth.
Table 4. Proportion of Company Recruitment of Graduate Business School Students That Was
Conducted on Campus and off Campusa
Percentage of recruitment effort
N=960 On-campus recruitment effort 59% Off-campus recruitment effort 41% Total 100% a. t = 8.472; df = 959; p < .05.
2009 Data Report Corporate Recruiters Survey
6 © 2009 Graduate Management Admission Council®. All rights reserved.
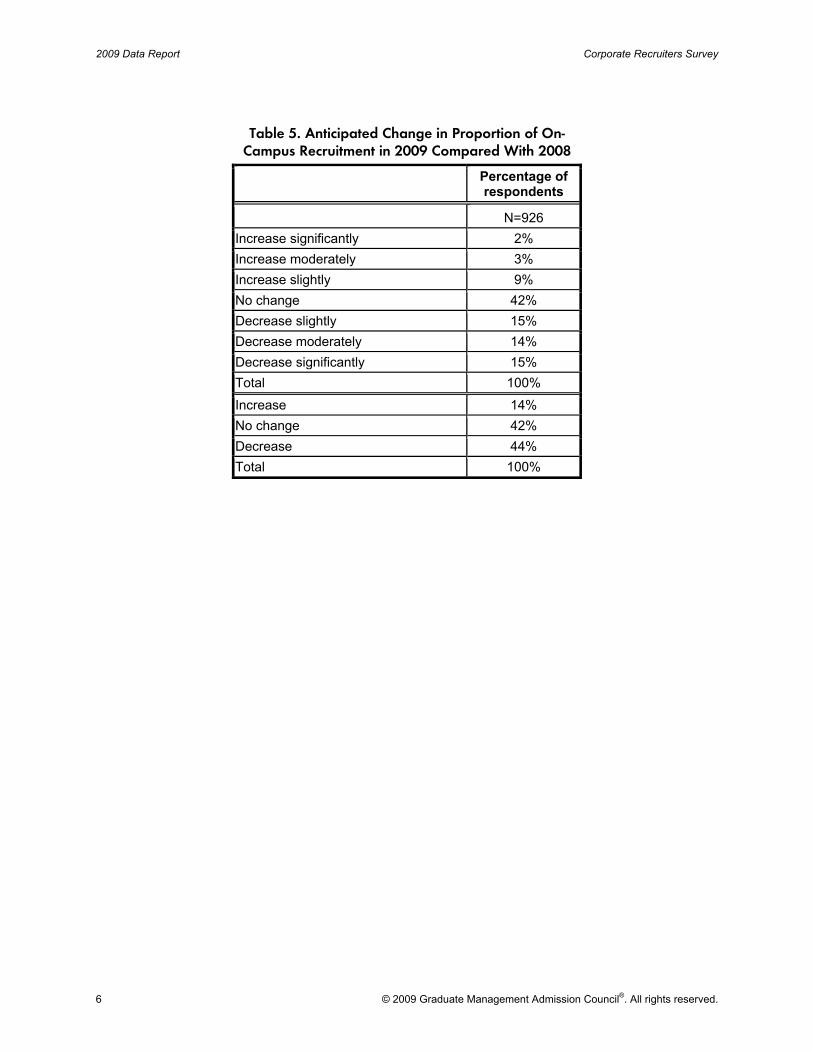
Table 5. Anticipated Change in Proportion of On-Campus Recruitment in 2009 Compared With 2008
Percentage of respondents
N=926 Increase significantly 2% Increase moderately 3% Increase slightly 9% No change 42% Decrease slightly 15% Decrease moderately 14% Decrease significantly 15% Total 100%
Increase 14% No change 42% Decrease 44% Total 100%

Corporate Recruiters Survey 2009 Data Report
© 2009 Graduate Management Admission Council®. All rights reserved. 7
School Selection
Table 6. School Selection Criteria
Extremely important
Very important
Somewhat important
Not very important
Not at all important Total
Average ratinga N
Quality of the students 75% 23% 1% — <1% 100% 4.73 N=487Depth of the talent pool 39% 48% 11% 2% <1% 100% 4.23 N=447Past experience at the
school 40% 42% 15% 3% 1% 100% 4.17 N=465Quality of the curriculum 32% 45% 19% 3% 1% 100% 4.03 N=485Existing relationships at the
school 29% 45% 20% 4% 1% 100% 3.97 N=501School accreditation 29% 39% 24% 5% 3% 100% 3.85 N=485Local reputation 21% 44% 25% 7% 3% 100% 3.72 N=479Retention history of past
hires 21% 41% 28% 8% 2% 100% 3.70 N=517Flexibility of students
(willingness to relocate) 27% 36% 23% 9% 5% 100% 3.70 N=452Quality of the faculty 17% 44% 30% 7% 2% 100% 3.67 N=498Admissions standards of
the school 18% 42% 31% 6% 3% 100% 3.66 N=469Influence of alumni working
at your company 20% 38% 31% 8% 3% 100% 3.65 N=466Global recognition of the
business school 19% 35% 32% 11% 3% 100% 3.57 N=471Offer or hiring yield 13% 39% 35% 9% 3% 100% 3.50 N=483Quality of the career
services office 10% 36% 38% 12% 3% 100% 3.38 N=484High published ranking 13% 31% 39% 15% 3% 100% 3.36 N=496Location of school 15% 26% 30% 20% 9% 100% 3.18 N=493Salary expectations of
graduating students 8% 27% 40% 19% 5% 100% 3.13 N=474Ethnic diversity of the class 10% 30% 33% 16% 12% 100% 3.11 N=471Demand for recent
graduates from the school 9% 25% 38% 20% 7% 100% 3.10 N=492
International diversity of the class 7% 23% 34% 20% 17% 100% 2.83 N=465
a. Average rating: 5 = extremely important; 1 = not at all important.

2009 Data Report Corporate Recruiters Survey
8 © 2009 Graduate Management Admission Council®. All rights reserved.
Job Opportunities by Candidate Type
Demand for New Hires
Table 7. Categories of Candidates Companies Hired in 2008 and Plan to Hire in 2009
2008 2009
All respondents N=2,305 N=2,305 Recent MBA graduates 58% 45% Recent Masters in Management graduates 18% 16% Other specialized master's in business graduates 40% 32% Master’s-level graduates from disciplines other than business 33% 28% Recent graduates with a bachelor's degree 63% 50% Experienced direct-industry hires 63% 51% Did not hire or plan to hire any of the above candidates 6% 14% Do not know hiring plans — 9%
Respondents that knew both 2008 and 2009 hiring plans N=2,088 N=2,088 Recent MBA graduates 59% 50% Recent Masters in Management graduates 19% 17% Other specialized master's in business graduates 41% 35% Master’s-level graduates from disciplines other than business 34% 31% Recent graduates with a bachelor's degree 65% 55% Experienced direct-industry hires 64% 56% Did not hire or plan to hire any of the above candidates 5% 15%
Table 8. Average Number of New Hires per Hiring Company, 2008–2009
2008 (actual)
2009 (anticipated)
Percentage change N
Recent MBA graduatesa 12.0 5.8 -52% N=491 Recent Masters in Management graduatesb 4.7 2.9 -38% N=73 Other specialized master’s in business graduatesc 9.4 8.7 -7% N=221 Master’s-level graduates from disciplines other
than businessd 10.1 6.8 -33% N=162 Recent graduates with a bachelor's degreec 41.6 11.0 -74% N=518 Experienced direct-industry hirese 60.3 22.8 -62% N=472 a. t = 3.908; df = 490; p < .05. b. t = 3.304; df = 72; p < .05. c. The mean difference between subgroups is not statistically significant. d. t = 2.315; df = 161; p < .05. e. t = 3.723; df = 471; p < .05.

Corporate Recruiters Survey 2009 Data Report
© 2009 Graduate Management Admission Council®. All rights reserved. 9
Table 9. Proportion of New Hires in Company’s Hiring Mixa, 2008–2009 (Expected)
2008 2009
N=991 N=581 Recent MBA graduates 10% 13%
Recent Masters in Management graduates 1% 1%
Other specialized master’s in business graduates 4% 9%
Master’s-level graduates from disciplines other than business 3% 5%
Recent graduates with a bachelor’s degree 36% 25%
Experienced direct-industry hires 47% 48%
Total 100% 100% a. Based on respondents that hired (2008) or planned to hire (2009) at least one new employee. Proportion of each category of hires is calculated as a number of hires in this category divided by the total number of hires; zeros are included.
Job Areas and Position Levels
Table 10. Job Areas for Which Employers Plan to Hire Recent Graduates in 2009
MBA
Masters in Management
Other specialized master’s in business
Disciplines other than business
N=921 N=298 N=637 N=554
Accounting 26% 27% 39% 15%
Consulting 28% 23% 19% 19%
Business development 28% 26% 21% 17%
Investment banking 15% 12% 12% 7%
Finance other than investment banking 44% 35% 35% 19%
General management 29% 31% 19% 16%
HR or organization management 14% 22% 15% 14%
Information technology or MIS 16% 21% 26% 29%
Marketing or sales 44% 34% 29% 24%
Operations and logistics 21% 25% 22% 25%
Other job areas 15% 27% 27% 49%
2009 Data Report Corporate Recruiters Survey
10 © 2009 Graduate Management Admission Council®. All rights reserved.
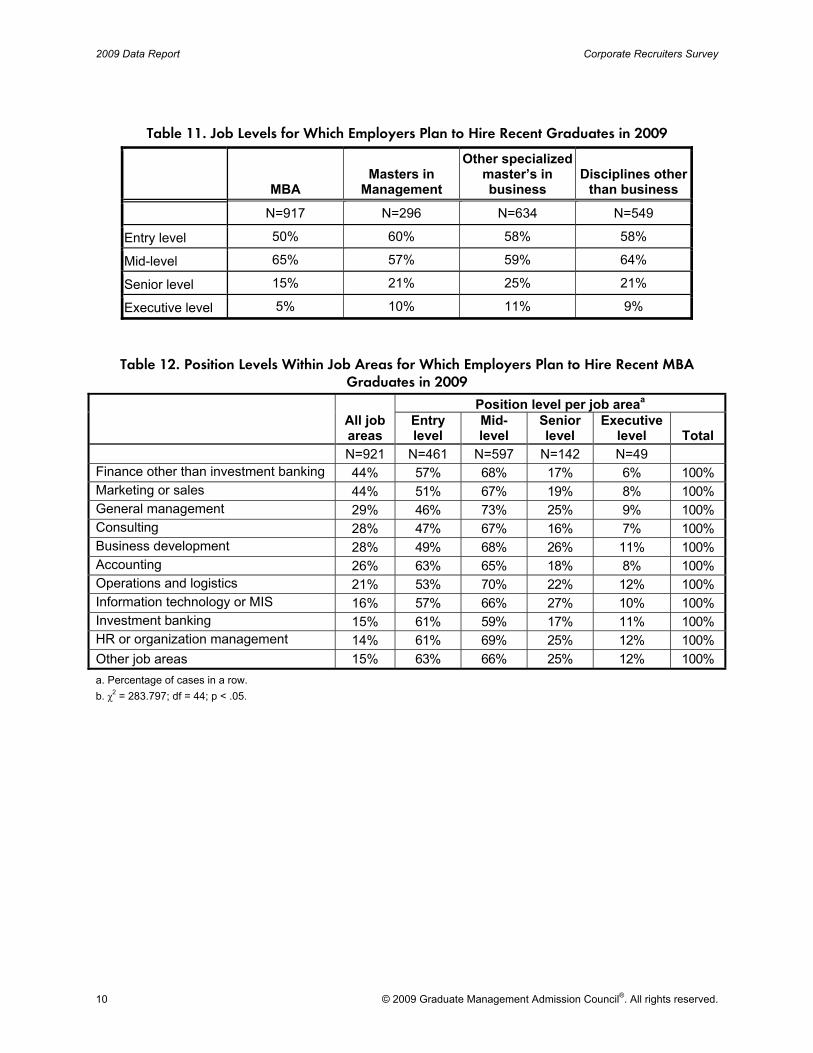
Table 11. Job Levels for Which Employers Plan to Hire Recent Graduates in 2009
MBA
Masters in Management
Other specialized master’s in business
Disciplines other than business
N=917 N=296 N=634 N=549
Entry level 50% 60% 58% 58%
Mid-level 65% 57% 59% 64%
Senior level 15% 21% 25% 21%
Executive level 5% 10% 11% 9%
Table 12. Position Levels Within Job Areas for Which Employers Plan to Hire Recent MBA
Graduates in 2009
All job areas
Position level per job areaa Entry level
Mid-level
Senior level
Executive level Total
N=921 N=461 N=597 N=142 N=49 Finance other than investment banking 44% 57% 68% 17% 6% 100% Marketing or sales 44% 51% 67% 19% 8% 100% General management 29% 46% 73% 25% 9% 100% Consulting 28% 47% 67% 16% 7% 100% Business development 28% 49% 68% 26% 11% 100% Accounting 26% 63% 65% 18% 8% 100% Operations and logistics 21% 53% 70% 22% 12% 100% Information technology or MIS 16% 57% 66% 27% 10% 100% Investment banking 15% 61% 59% 17% 11% 100% HR or organization management 14% 61% 69% 25% 12% 100% Other job areas 15% 63% 66% 25% 12% 100% a. Percentage of cases in a row. b. χ2 = 283.797; df = 44; p < .05.

Corporate Recruiters Survey 2009 Data Report
© 2009 Graduate Management Admission Council®. All rights reserved. 11
Table 13. Position Levels Within Job Areas for Which Employers Plan to Hire Recent Masters in Management Graduates in 2009
All job areas
Position level per job areaa Entry level
Mid-level
Senior level
Executive level Total
N=298 N=177 N=168 N=63 N=31 Finance other than investment banking 35% 66% 63% 25% 11% 100% Marketing or sales 34% 62% 66% 25% 14% 100% General management 31% 58% 65% 34% 19% 100% Accounting 27% 65% 60% 27% 12% 100% Business development 26% 59% 63% 36% 26% 100% Operations and logistics 25% 58% 65% 32% 19% 100% Consulting 23% 65% 59% 33% 19% 100% HR or organization management 22% 64% 76% 38% 21% 100% Information technology or MIS 21% 61% 71% 34% 18% 100% Investment banking 12% 51% 57% 29% 26% 100% Other job areas 27% 61% 61% 27% 13% 100% a. Percentage of cases in a row. b. χ2 = 190.183; df = 44; p < .05.
Table 14. Position Levels Within Job Areas for dhich Employers Plan to Hire Other Specialized
Master’s in Business Graduates in 2009
All job areas
Position level per job areaa Entry level
Mid-level
Senior level
Executive level Total
N=637 N=368 N=374 N=157 N=70 Accounting 39% 68% 57% 26% 13% 100% Finance other than investment banking 35% 63% 63% 29% 13% 100% Marketing or sales 29% 55% 69% 37% 20% 100% Information technology or MIS 26% 58% 70% 33% 15% 100% Operations and logistics 22% 54% 71% 37% 23% 100% Business development 21% 52% 72% 44% 22% 100% Consulting 19% 61% 66% 32% 14% 100% General management 19% 50% 74% 42% 23% 100% HR or organization management 15% 60% 75% 36% 18% 100% Investment banking 12% 52% 62% 39% 22% 100% Other job areas 27% 60% 61% 28% 15% 100% a. Percentage of cases in a row. b. χ2 = 343.426; df = 44; p < .05.
2009 Data Report Corporate Recruiters Survey
12 © 2009 Graduate Management Admission Council®. All rights reserved.
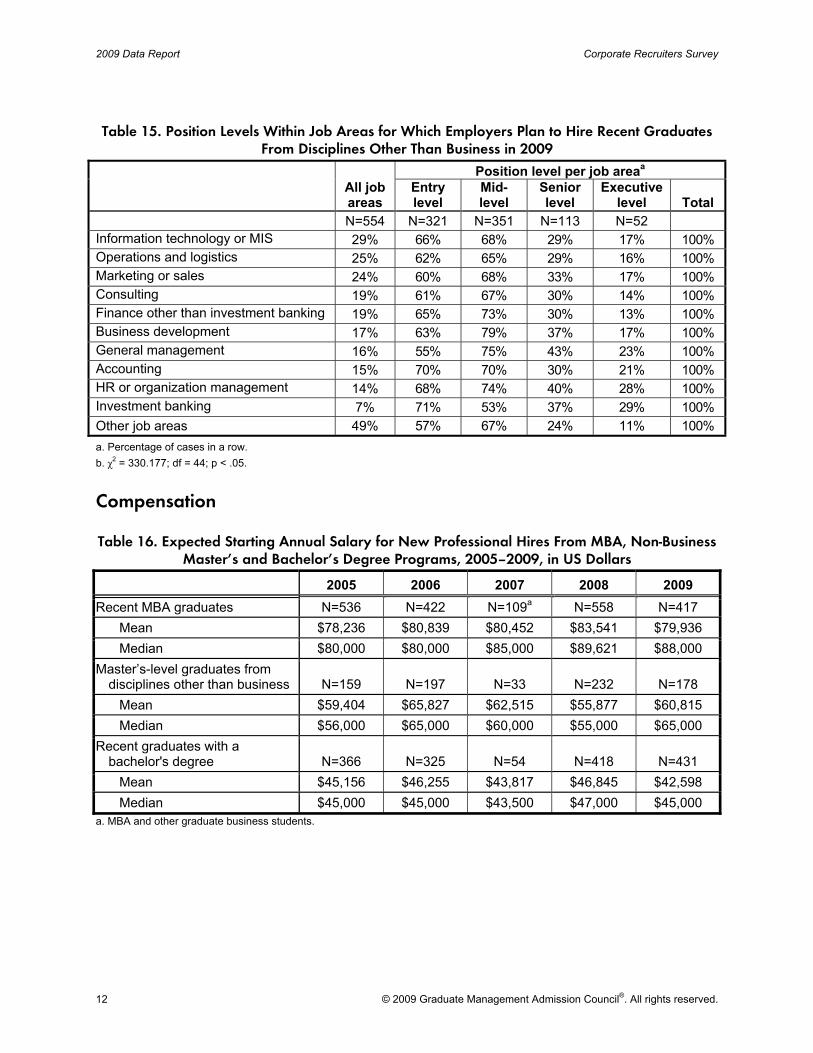
Table 15. Position Levels Within Job Areas for Which Employers Plan to Hire Recent Graduates From Disciplines Other Than Business in 2009
All job areas
Position level per job areaa Entry level
Mid-level
Senior level
Executive level Total
N=554 N=321 N=351 N=113 N=52 Information technology or MIS 29% 66% 68% 29% 17% 100% Operations and logistics 25% 62% 65% 29% 16% 100% Marketing or sales 24% 60% 68% 33% 17% 100% Consulting 19% 61% 67% 30% 14% 100% Finance other than investment banking 19% 65% 73% 30% 13% 100% Business development 17% 63% 79% 37% 17% 100% General management 16% 55% 75% 43% 23% 100% Accounting 15% 70% 70% 30% 21% 100% HR or organization management 14% 68% 74% 40% 28% 100% Investment banking 7% 71% 53% 37% 29% 100% Other job areas 49% 57% 67% 24% 11% 100% a. Percentage of cases in a row. b. χ2 = 330.177; df = 44; p < .05.
Compensation Table 16. Expected Starting Annual Salary for New Professional Hires From MBA, Non-Business
Master’s and Bachelor’s Degree Programs, 2005–2009, in US Dollars
2005 2006 2007 2008 2009Recent MBA graduates N=536 N=422 N=109a N=558 N=417
Mean $78,236 $80,839 $80,452 $83,541 $79,936 Median $80,000 $80,000 $85,000 $89,621 $88,000
Master’s-level graduates from disciplines other than business N=159 N=197 N=33 N=232 N=178
Mean $59,404 $65,827 $62,515 $55,877 $60,815 Median $56,000 $65,000 $60,000 $55,000 $65,000
Recent graduates with a bachelor's degree N=366 N=325 N=54 N=418 N=431
Mean $45,156 $46,255 $43,817 $46,845 $42,598 Median $45,000 $45,000 $43,500 $47,000 $45,000
a. MBA and other graduate business students.

Corporate Recruiters Survey 2009 Data Report
© 2009 Graduate Management Admission Council®. All rights reserved. 13
Table 17. Expected Starting Annual Salary for New Professional Hires From Master’s Programs and Direct-Industry, 2008–2009, in US Dollars
2008 2009
Recent Masters in Management graduates N=117 N=78 Mean $62,528 $58,808 Median $65,000 $65,000
Other specialized master's in business graduates N=204 N=207
Mean $61,969 $59,509 Median $60,000 $57,000
Experienced direct-industry hires N=293 N=315 Mean $74,515 $64,733 Median $75,000 $64,084
MBA Job Outlook
Full-time, Part-time, Executive, and Online Program Graduates Table 18. Employers That Actively Recruit or Employ Candidates From Full-Time, Part-Time,
Executive, or Online MBA Programs, or Sponsor Current Employees to Attend These Programs
Full-time Part-time Executive Online
N=1,319 N=1,321 N=1,320 N=1,319 Actively recruit 77% 29% 22% 9% Employ 77% 55% 45% 20% Sponsor current employees to attend 16% 29% 26% 12% None of the above 10% 31% 40% 71%
Characteristics of 2008 Hires with MBA Degrees Table 19. Characteristics of 2008 Hires with MBA Degrees
Percentage of hires
Experienced direct-industry hires 47% Hold MBA degree 17%
Recent MBA graduates 10% Required additional legal documents (e.g., visa, work permit, etc.) 16% Were interns at the hiring company 21%
All 2008 hires with MBA degree 18%
2009 Data Report Corporate Recruiters Survey
14 © 2009 Graduate Management Admission Council®. All rights reserved.
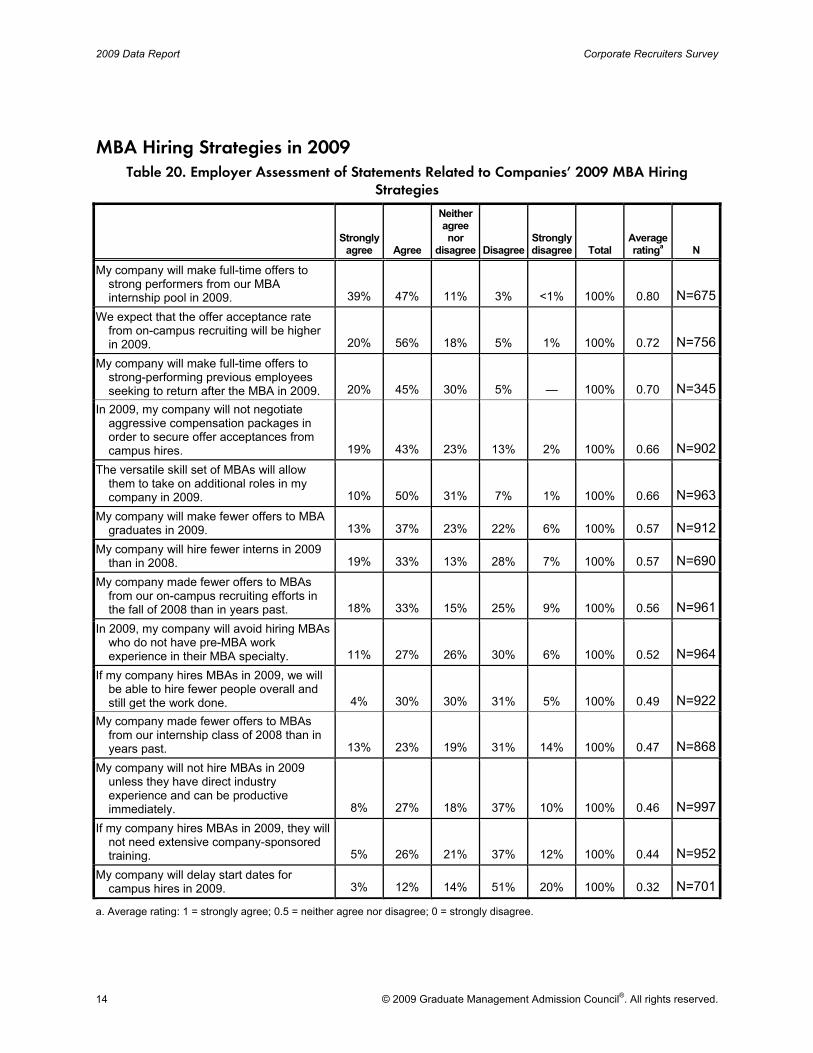
MBA Hiring Strategies in 2009 Table 20. Employer Assessment of Statements Related to Companies’ 2009 MBA Hiring
Strategies
Strongly agree Agree
Neither agree nor
disagree DisagreeStrongly disagree Total
Average ratinga N
My company will make full-time offers to strong performers from our MBA internship pool in 2009. 39% 47% 11% 3% <1% 100% 0.80 N=675
We expect that the offer acceptance rate from on-campus recruiting will be higher in 2009. 20% 56% 18% 5% 1% 100% 0.72 N=756
My company will make full-time offers to strong-performing previous employees seeking to return after the MBA in 2009. 20% 45% 30% 5% — 100% 0.70 N=345
In 2009, my company will not negotiate aggressive compensation packages in order to secure offer acceptances from campus hires. 19% 43% 23% 13% 2% 100% 0.66 N=902
The versatile skill set of MBAs will allow them to take on additional roles in my company in 2009. 10% 50% 31% 7% 1% 100% 0.66 N=963
My company will make fewer offers to MBA graduates in 2009. 13% 37% 23% 22% 6% 100% 0.57 N=912
My company will hire fewer interns in 2009 than in 2008. 19% 33% 13% 28% 7% 100% 0.57 N=690
My company made fewer offers to MBAs from our on-campus recruiting efforts in the fall of 2008 than in years past. 18% 33% 15% 25% 9% 100% 0.56 N=961
In 2009, my company will avoid hiring MBAs who do not have pre-MBA work experience in their MBA specialty. 11% 27% 26% 30% 6% 100% 0.52 N=964
If my company hires MBAs in 2009, we will be able to hire fewer people overall and still get the work done. 4% 30% 30% 31% 5% 100% 0.49 N=922
My company made fewer offers to MBAs from our internship class of 2008 than in years past. 13% 23% 19% 31% 14% 100% 0.47 N=868
My company will not hire MBAs in 2009 unless they have direct industry experience and can be productive immediately. 8% 27% 18% 37% 10% 100% 0.46 N=997
If my company hires MBAs in 2009, they will not need extensive company-sponsored training. 5% 26% 21% 37% 12% 100% 0.44 N=952
My company will delay start dates for campus hires in 2009. 3% 12% 14% 51% 20% 100% 0.32 N=701
a. Average rating: 1 = strongly agree; 0.5 = neither agree nor disagree; 0 = strongly disagree.

Corporate Recruiters Survey 2009 Data Report
© 2009 Graduate Management Admission Council®. All rights reserved. 15
Table 21. Employer Assessment of Statements Related to Companies’ 2009 Employee Sponsorship to MBA Programs
Strongly agree Agree
Neither agree nor
disagree DisagreeStrongly disagree Total
Average ratinga N
In 2009, my company will grant good employees tuition assistance to attend an MBA program 33% 47% 10% 7% 3% 100% 0.75 N=475
My company will grant good employees a leave of absence in 2009 to attend an MBA program full-time 9% 27% 17% 31% 16% 100% 0.45 N=390
My company will not sponsor strong, seasoned employees in 2009 to attend an executive MBA program 6% 14% 15% 43% 22% 100% 0.35 N=436
In 2009, my company will not reimburse good employees to attend part-time MBA programs while they remain employed with the company 4% 10% 10% 42% 33% 100% 0.28 N=456
a. Average rating: 1 = strongly agree; 0.5 = neither agree nor disagree; 0 = strongly disagree.
Recruiting MBAs on Campus
Table 22. Actual 2008 and Expected 2009 On-Campus Recruitment Status, Companies That Recruit MBA Candidates on Campus
2008 2009
N=1,073 N=1,004
Recruited or will recruit on campus 75% 65%
Did not or will not recruit on campus 2% 4%
Do not know 23% 31% Total 100% 100%
Table 23. Number of Graduate Business Schools at Which
Companies Recruit MBA Candidates on Campusa
In 2008 (actual)
In 2009 (expected)
Percentage change
N=634 N=634 N=634 Per company 8.8 8.0 -9% a. t = 5.452; df = 633; p < .05.

2009 Data Report Corporate Recruiters Survey
16 © 2009 Graduate Management Admission Council®. All rights reserved.
To Hire or Not to Hire—Employer Feedback
Why Employers Hire MBA Graduates
Table 24. Primary Traits and Abilities Employers Seek in MBA Graduates
Percentage of respondents
N=1,026
Initiative 82%
Professionalism 81%
Integrity 81%
Achievement and/or goal orientation 78%
Motivation 78% Ability to deal effectively with
pressure or unexpected obstacles 78%
Adaptability 73%
Collaboration 69%
Innovation and/or creativity 68%
Efficiency 61%
Listening ability 57%
Cross-cultural sensitivity 47%
Discipline 46%
Persuasiveness 42%
Diplomacy/tact 40% Capacity and willingness to follow a
leader 33%
Empathy 26%
Delegation skills 23%
Other traits and abilitiesa 11% a. Other traits and abilities include ability to work in teams; attention to detail; competitive nature; courage; drive for results; emotional intelligence; energy; enthusiasm; entrepreneurial spirit; entrepreneurship; good personality; great attitude; humility; humility, resourcefulness, thoroughness; intellectual discipline; intellectual leadership; intellect and intellectual curiosity; passion, assertiveness; passion for our industry; passion for technology; passion for what we do; patience; proactiveness; responsibility; results-oriented; risk-taking, self-starter, able to work independently; etc.
Corporate Recruiters Survey 2009 Data Report
© 2009 Graduate Management Admission Council®. All rights reserved. 17
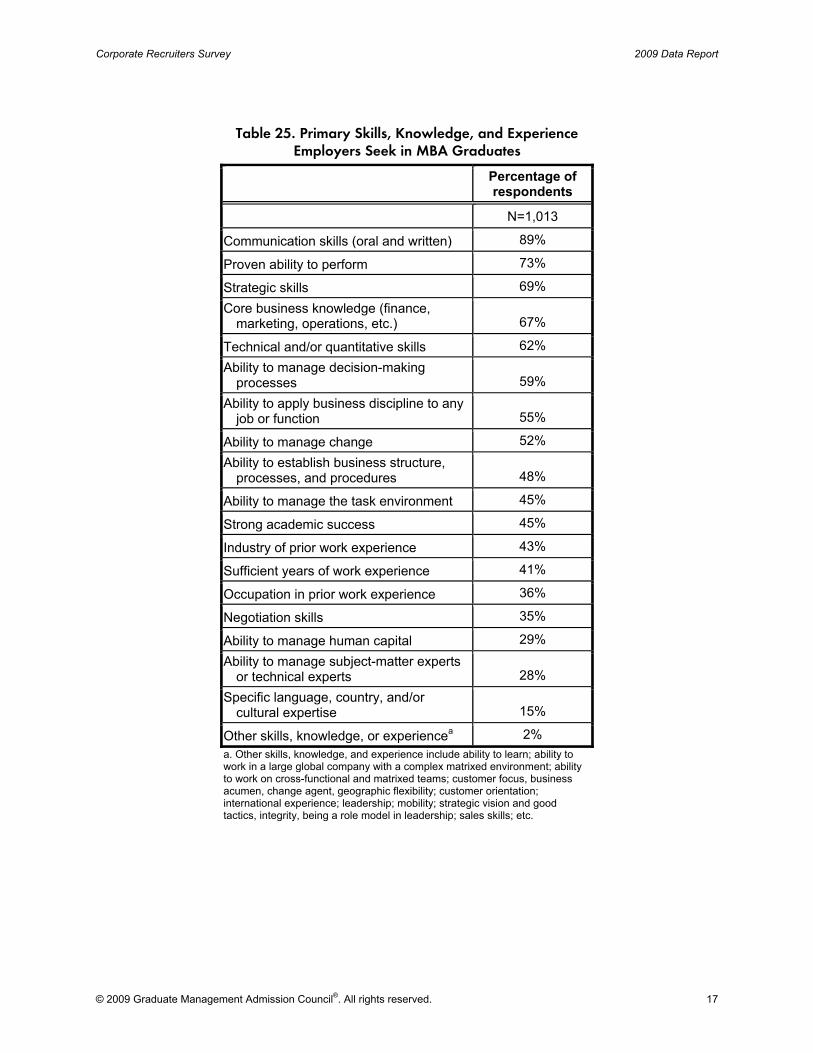
Table 25. Primary Skills, Knowledge, and Experience Employers Seek in MBA Graduates
Percentage of respondents
N=1,013
Communication skills (oral and written) 89%
Proven ability to perform 73%
Strategic skills 69% Core business knowledge (finance,
marketing, operations, etc.) 67%
Technical and/or quantitative skills 62% Ability to manage decision-making
processes 59% Ability to apply business discipline to any
job or function 55%
Ability to manage change 52% Ability to establish business structure,
processes, and procedures 48%
Ability to manage the task environment 45%
Strong academic success 45%
Industry of prior work experience 43%
Sufficient years of work experience 41%
Occupation in prior work experience 36%
Negotiation skills 35%
Ability to manage human capital 29% Ability to manage subject-matter experts
or technical experts 28% Specific language, country, and/or
cultural expertise 15%
Other skills, knowledge, or experiencea 2% a. Other skills, knowledge, and experience include ability to learn; ability to work in a large global company with a complex matrixed environment; ability to work on cross-functional and matrixed teams; customer focus, business acumen, change agent, geographic flexibility; customer orientation; international experience; leadership; mobility; strategic vision and good tactics, integrity, being a role model in leadership; sales skills; etc.

2009 Data Report Corporate Recruiters Survey
18 © 2009 Graduate Management Admission Council®. All rights reserved.
Employer Satisfaction with MBA Employees
Table 26. Employer Satisfaction with MBA Employees, 2008–2009
2008 2009
N=1,001 N=1,287
Extremely satisfied 20% 16%
Very satisfied 63% 61%
Somewhat satisfied 15% 21%
Somewhat dissatisfied 2% 2%
Very dissatisfied — <1%
Extremely dissatisfied — —
Total 100% 100%
Satisfied 98% 98%
Dissatisfied 2% 2% Total 100% 100%

Corporate Recruiters Survey 2009 Data Report
© 2009 Graduate Management Admission Council®. All rights reserved. 19
Why Employers Do Not Hire MBA Graduates
Table 27. Primary Reasons for Not Hiring Recent MBA Graduates in 2008
Percentage of respondents
N=913
MBA skills/resources are not critical in my company. 24%
Recruiting resources were allocated to experienced direct-industry hires. 24%
No job openings were available at my company. 23%
MBA entry-level salary demands were too high. 23%
Available MBA candidates did not match my job requirements. 23%
MBA candidates had unrealistic job role or job level expectations. 18%
There was a hiring freeze in our organization. 16%
My company is in the process of reducing headcount. 15%
Recruiting resources were allocated to new undergraduate hires. 15%
My company anticipated limited growth. 15%
Timing of job openings did not match availability of MBA graduates. 15% Recruiting resources were allocated to hiring business graduates other
than MBAs. 8% We obtained MBA talent by sponsoring current employees in graduate
management programs. 7%
We had difficulty in finding and identifying MBA candidates. 5%
Offers made to MBAs were not accepted. 4% We were unable to obtain the necessary legal documents for
international candidates. 1%
Other reasonsa 6% a. Other reasons include budget restrictions; decided 3 or 4 years ago to hire professionals with degree and experience; hire as interns only for the summer; MBA candidates who apply mainly from countries outside of our region and need a work permit; most of our positions do not require an MBA; must have industry experience plus MBA to be qualified for our opportunities; new graduates often have limited work experience; not ready to grow; overqualified; typically hire with a minimum of 5 years of work experience; we are a nonprofit faith-based organization and usually do not recruit many MBAs; we are a public accounting firm seeking to hire those with enough units in accounting to sit for the CPA exam, MBAs do not have this; we are looking for interns only; we prefer candidates with working experience; etc.
2009 Data Report Corporate Recruiters Survey
20 © 2009 Graduate Management Admission Council®. All rights reserved.
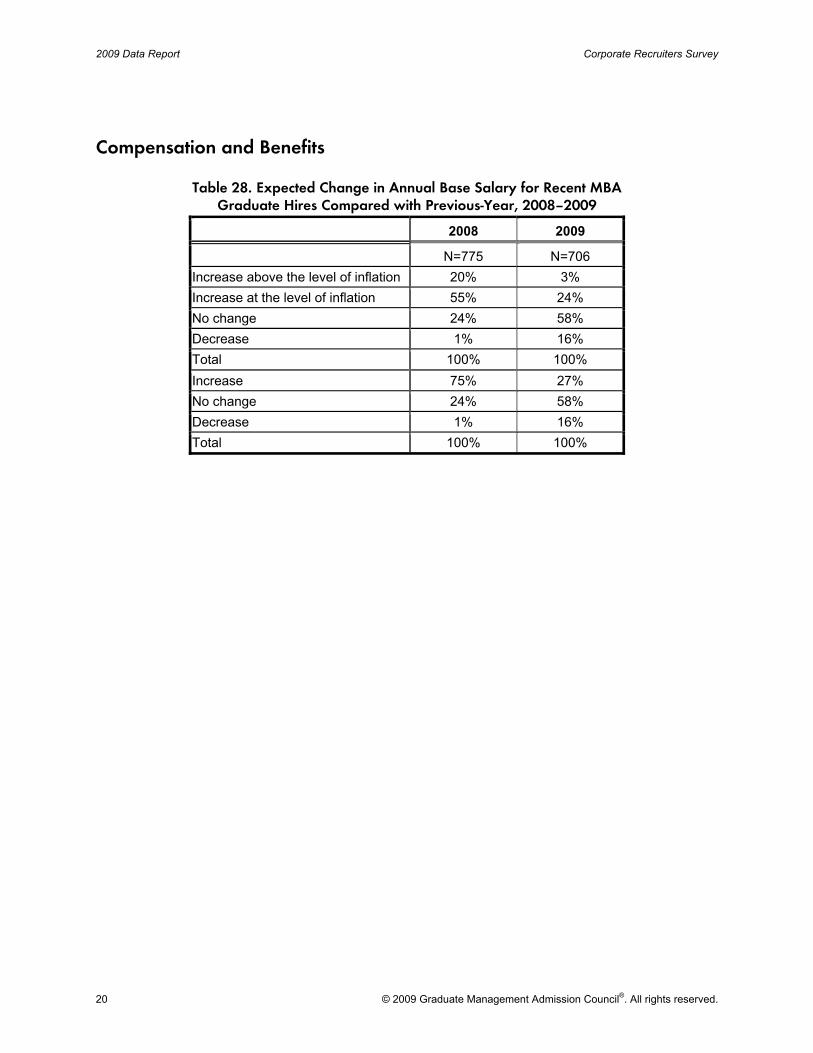
Compensation and Benefits
Table 28. Expected Change in Annual Base Salary for Recent MBA Graduate Hires Compared with Previous-Year, 2008–2009
2008 2009
N=775 N=706 Increase above the level of inflation 20% 3% Increase at the level of inflation 55% 24% No change 24% 58% Decrease 1% 16% Total 100% 100% Increase 75% 27% No change 24% 58% Decrease 1% 16% Total 100% 100%

Corporate Recruiters Survey 2009 Data Report
© 2009 Graduate Management Admission Council®. All rights reserved. 21
Table 29. Expected 2009 Benefits and Additional Compensation for Recent MBA Graduate Hires
Percentage of respondents
N=906 Plan to offer additional compensation and benefits 97%
Benefits package (e.g., health benefits, retirement plan) 85% Performance-based bonus 61% Signing or starting bonus 54% Moving allowance 52% Year-end bonus 37% Tuition reimbursement or scholarship 25% Profit sharing 21% Stock purchase plan 21% Stock options, including restricted stock 14% Housing allowance or reimbursements 13% First-year bonus 10% Commissions 9% Car or car allowance 8% Other compensation or benefitsa 4%
a. Other compensation or benefits include additional time off; adoption benefits, cafeteria plan and transportation plan; paternity and maternity leaves, educational reimbursement, training and development annually; cell phone; club membership, blackberry (sic), discount insurances; credentialing expenses; five-week vacation at the start of employment; flex-time work schedule; flexible work schedules and time off; free flight benefits; gym and social discount, travel and transportation discounts; mobile phone, fitness allowance; life insurance; onsite fitness facility, childcare premium assistance; parking or metro fares, health club membership; personal time off; rail privileges; staff discounts; student loan repayment, public transportation subsidy, health club, child care center; transportation; etc.
Table 30. Expected 2009 Total Annual Compensation and Its Components for Recent MBA Graduate Hires
Mean and median valuesa
and percentage of total compensation
Total compensation N=329 Mean $100,992 Median $105,000 Base salary 82% Signing or starting bonus 6%
Mean $14,990 Median $15,000
Other compensation 12% Total 100%
a. Zeroes are excluded.
2009 Data Report Corporate Recruiters Survey
22 © 2009 Graduate Management Admission Council®. All rights reserved.
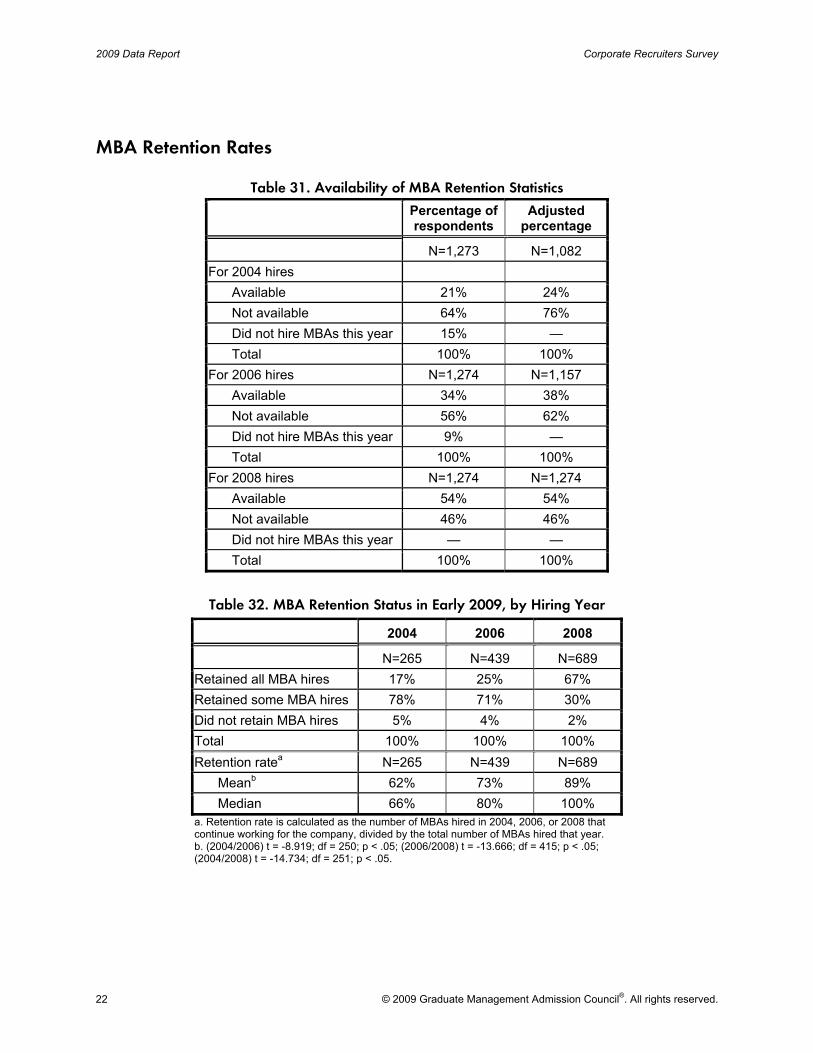
MBA Retention Rates
Table 31. Availability of MBA Retention Statistics
Percentage of respondents
Adjusted percentage
N=1,273 N=1,082 For 2004 hires
Available 21% 24% Not available 64% 76% Did not hire MBAs this year 15% — Total 100% 100%
For 2006 hires N=1,274 N=1,157 Available 34% 38% Not available 56% 62% Did not hire MBAs this year 9% — Total 100% 100%
For 2008 hires N=1,274 N=1,274 Available 54% 54% Not available 46% 46% Did not hire MBAs this year — — Total 100% 100%
Table 32. MBA Retention Status in Early 2009, by Hiring Year
2004 2006 2008
N=265 N=439 N=689 Retained all MBA hires 17% 25% 67% Retained some MBA hires 78% 71% 30% Did not retain MBA hires 5% 4% 2% Total 100% 100% 100% Retention ratea N=265 N=439 N=689
Meanb 62% 73% 89% Median 66% 80% 100%
a. Retention rate is calculated as the number of MBAs hired in 2004, 2006, or 2008 that continue working for the company, divided by the total number of MBAs hired that year. b. (2004/2006) t = -8.919; df = 250; p < .05; (2006/2008) t = -13.666; df = 415; p < .05; (2004/2008) t = -14.734; df = 251; p < .05.
Corporate Recruiters Survey 2009 Data Report
© 2009 Graduate Management Admission Council®. All rights reserved. 23
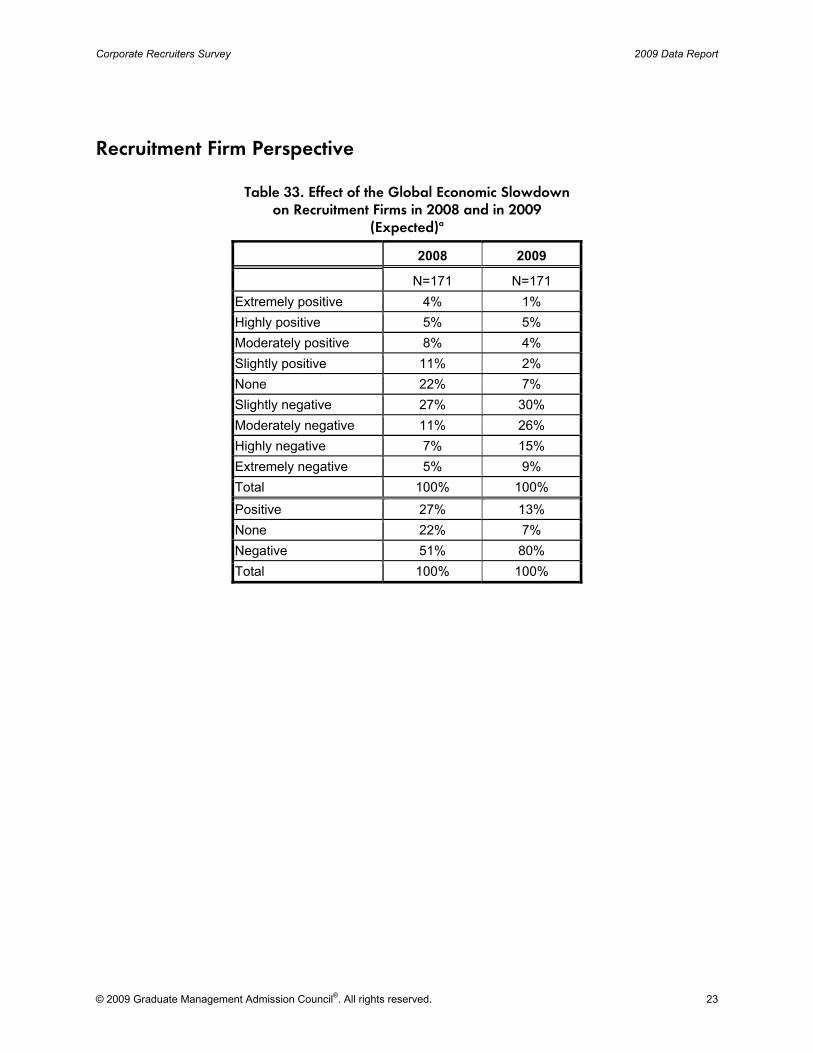
Recruitment Firm Perspective
Table 33. Effect of the Global Economic Slowdown on Recruitment Firms in 2008 and in 2009
(Expected)a
2008 2009
N=171 N=171 Extremely positive 4% 1% Highly positive 5% 5% Moderately positive 8% 4% Slightly positive 11% 2% None 22% 7% Slightly negative 27% 30% Moderately negative 11% 26% Highly negative 7% 15% Extremely negative 5% 9% Total 100% 100%
Positive 27% 13% None 22% 7% Negative 51% 80% Total 100% 100%

2009 Data Report Corporate Recruiters Survey
24 © 2009 Graduate Management Admission Council®. All rights reserved.
Table 34. Categories of Candidates Recruitment Firms Hired in 2008 and Plan to Hire in 2009
2008 2009
All respondents N=160 N=160 Recent MBA graduates 57% 51% Recent Masters in Management graduates 28% 24% Other specialized master's in business graduates 54% 49% Master’s-level graduates from disciplines other than business 36% 29% Recent graduates with a bachelor's degree 55% 45% Experienced direct-industry hires 61% 55% Did not hire or plan to hire any of the above candidates 8% 9% Do not know hiring plans — 9%
Respondents that knew both 2008 and 2009 hiring plans N=146 N=146 Recent MBA graduates 59% 56% Recent Masters in Management graduates 29% 27% Other specialized master's in business graduates 55% 54% Master’s-level graduates from disciplines other than business 37% 32% Recent graduates with a bachelor's degree 57% 49% Experienced direct-industry hires 63% 60% Did not hire or plan to hire any of the above candidates 7% 10%

Corporate Recruiters Survey 2009 Data Report
© 2009 Graduate Management Admission Council®. All rights reserved. 25
Table 35. Primary Traits and Abilities Recruitment Firms Seek in MBA Graduates
Percentage of respondents
N=80
Motivation 79% Ability to deal effectively with
pressure or unexpected obstacles 79%
Professionalism 75%
Achievement and/or goal orientation 75%
Integrity 74%
Initiative 70%
Adaptability 69%
Innovation and/or creativity 66%
Collaboration 59%
Efficiency 58%
Listening ability 54%
Discipline 46%
Cross-cultural sensitivity 45%
Persuasiveness 45%
Empathy 38%
Delegation skills 36% Capacity and willingness to follow a
leader 35%
Diplomacy/tact 34%
Other traits and abilities 6%
2009 Data Report Corporate Recruiters Survey
26 © 2009 Graduate Management Admission Council®. All rights reserved.
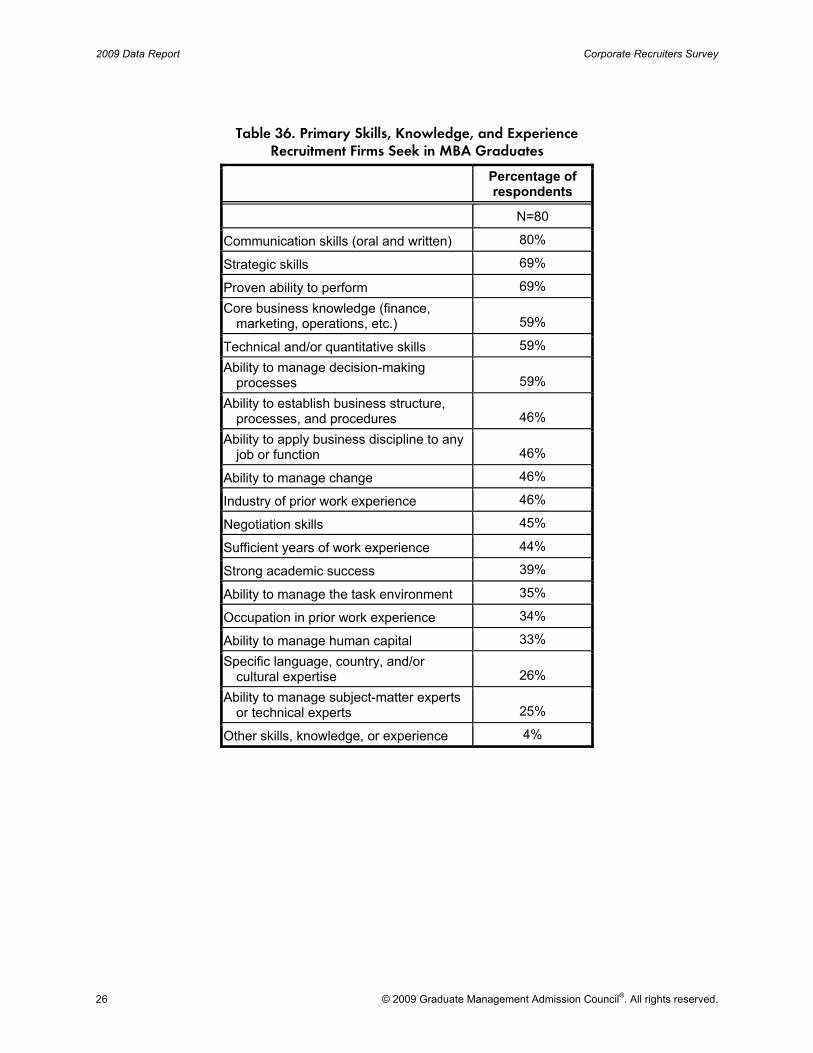
Table 36. Primary Skills, Knowledge, and Experience Recruitment Firms Seek in MBA Graduates
Percentage of respondents
N=80
Communication skills (oral and written) 80%
Strategic skills 69%
Proven ability to perform 69% Core business knowledge (finance,
marketing, operations, etc.) 59%
Technical and/or quantitative skills 59% Ability to manage decision-making
processes 59% Ability to establish business structure,
processes, and procedures 46% Ability to apply business discipline to any
job or function 46%
Ability to manage change 46%
Industry of prior work experience 46%
Negotiation skills 45%
Sufficient years of work experience 44%
Strong academic success 39%
Ability to manage the task environment 35%
Occupation in prior work experience 34%
Ability to manage human capital 33% Specific language, country, and/or
cultural expertise 26% Ability to manage subject-matter experts
or technical experts 25%
Other skills, knowledge, or experience 4%
Corporate Recruiters Survey 2009 Data Report
© 2009 Graduate Management Admission Council®. All rights reserved. 27
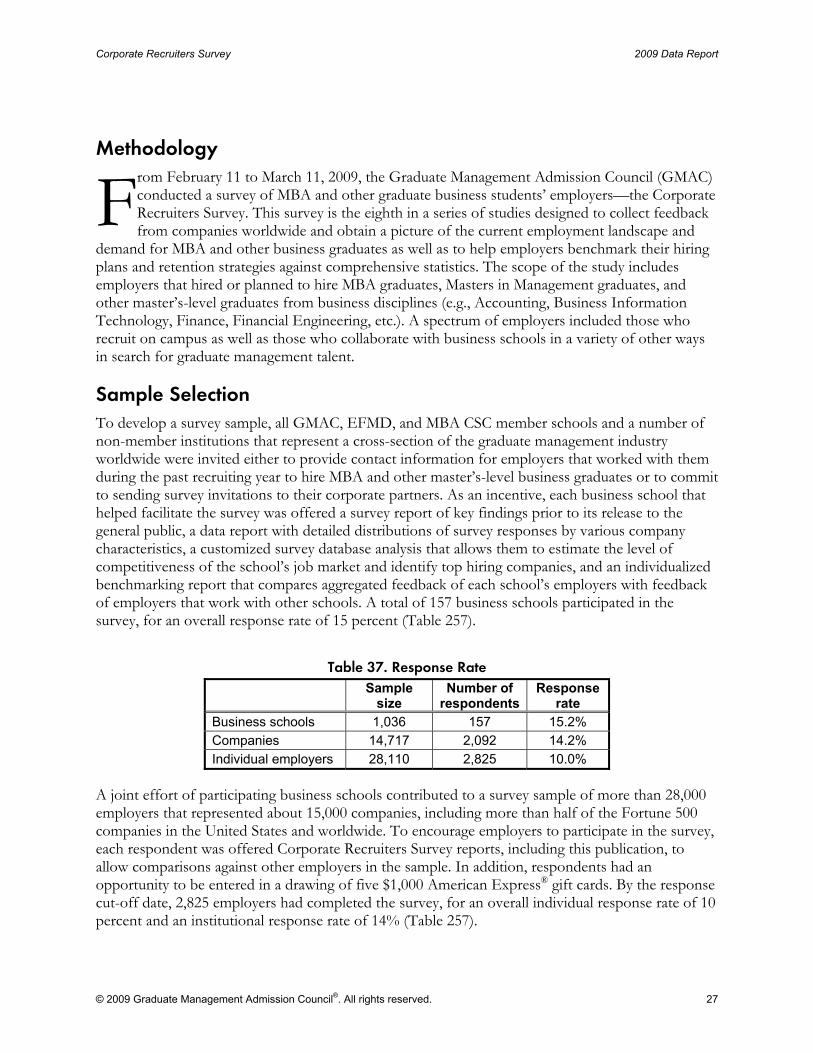
Methodology rom February 11 to March 11, 2009, the Graduate Management Admission Council (GMAC) conducted a survey of MBA and other graduate business students’ employers—the Corporate Recruiters Survey. This survey is the eighth in a series of studies designed to collect feedback from companies worldwide and obtain a picture of the current employment landscape and
demand for MBA and other business graduates as well as to help employers benchmark their hiring plans and retention strategies against comprehensive statistics. The scope of the study includes employers that hired or planned to hire MBA graduates, Masters in Management graduates, and other master’s-level graduates from business disciplines (e.g., Accounting, Business Information Technology, Finance, Financial Engineering, etc.). A spectrum of employers included those who recruit on campus as well as those who collaborate with business schools in a variety of other ways in search for graduate management talent.
Sample Selection To develop a survey sample, all GMAC, EFMD, and MBA CSC member schools and a number of non-member institutions that represent a cross-section of the graduate management industry worldwide were invited either to provide contact information for employers that worked with them during the past recruiting year to hire MBA and other master’s-level business graduates or to commit to sending survey invitations to their corporate partners. As an incentive, each business school that helped facilitate the survey was offered a survey report of key findings prior to its release to the general public, a data report with detailed distributions of survey responses by various company characteristics, a customized survey database analysis that allows them to estimate the level of competitiveness of the school’s job market and identify top hiring companies, and an individualized benchmarking report that compares aggregated feedback of each school’s employers with feedback of employers that work with other schools. A total of 157 business schools participated in the survey, for an overall response rate of 15 percent (Table 257).
Table 37. Response Rate
Sample size
Number of respondents
Response rate
Business schools 1,036 157 15.2% Companies 14,717 2,092 14.2% Individual employers 28,110 2,825 10.0%
A joint effort of participating business schools contributed to a survey sample of more than 28,000 employers that represented about 15,000 companies, including more than half of the Fortune 500 companies in the United States and worldwide. To encourage employers to participate in the survey, each respondent was offered Corporate Recruiters Survey reports, including this publication, to allow comparisons against other employers in the sample. In addition, respondents had an opportunity to be entered in a drawing of five $1,000 American Express® gift cards. By the response cut-off date, 2,825 employers had completed the survey, for an overall individual response rate of 10 percent and an institutional response rate of 14% (Table 257).
F
2009 Data Report Corporate Recruiters Survey
28 © 2009 Graduate Management Admission Council®. All rights reserved.
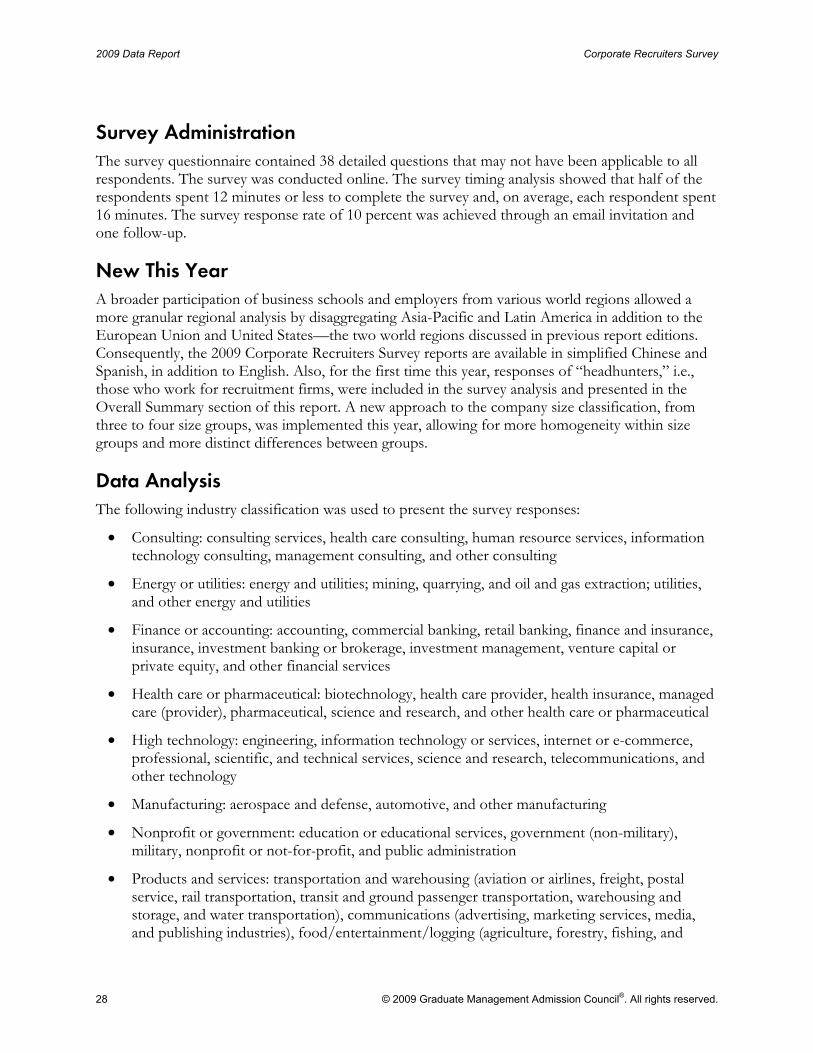
Survey Administration The survey questionnaire contained 38 detailed questions that may not have been applicable to all respondents. The survey was conducted online. The survey timing analysis showed that half of the respondents spent 12 minutes or less to complete the survey and, on average, each respondent spent 16 minutes. The survey response rate of 10 percent was achieved through an email invitation and one follow-up.
New This Year A broader participation of business schools and employers from various world regions allowed a more granular regional analysis by disaggregating Asia-Pacific and Latin America in addition to the European Union and United States—the two world regions discussed in previous report editions. Consequently, the 2009 Corporate Recruiters Survey reports are available in simplified Chinese and Spanish, in addition to English. Also, for the first time this year, responses of “headhunters,” i.e., those who work for recruitment firms, were included in the survey analysis and presented in the Overall Summary section of this report. A new approach to the company size classification, from three to four size groups, was implemented this year, allowing for more homogeneity within size groups and more distinct differences between groups.
Data Analysis The following industry classification was used to present the survey responses:
• Consulting: consulting services, health care consulting, human resource services, information technology consulting, management consulting, and other consulting
• Energy or utilities: energy and utilities; mining, quarrying, and oil and gas extraction; utilities, and other energy and utilities
• Finance or accounting: accounting, commercial banking, retail banking, finance and insurance, insurance, investment banking or brokerage, investment management, venture capital or private equity, and other financial services
• Health care or pharmaceutical: biotechnology, health care provider, health insurance, managed care (provider), pharmaceutical, science and research, and other health care or pharmaceutical
• High technology: engineering, information technology or services, internet or e-commerce, professional, scientific, and technical services, science and research, telecommunications, and other technology
• Manufacturing: aerospace and defense, automotive, and other manufacturing
• Nonprofit or government: education or educational services, government (non-military), military, nonprofit or not-for-profit, and public administration
• Products and services: transportation and warehousing (aviation or airlines, freight, postal service, rail transportation, transit and ground passenger transportation, warehousing and storage, and water transportation), communications (advertising, marketing services, media, and publishing industries), food/entertainment/logging (agriculture, forestry, fishing, and

Corporate Recruiters Survey 2009 Data Report
© 2009 Graduate Management Admission Council®. All rights reserved. 29
hunting; arts, entertainment, and recreation; food, beverage, and tobacco; hotel, gaming, leisure, and travel; and sports and recreation), and other products and services (architecture, construction and installation, consumer goods, customer services, management of companies and enterprises, real estate and rental or leasing, waste management and remediation services, wholesale trade, and other products and services).
In addition, survey responses were divided into four groups based on company size:
• Fewer than 100 employees
• 100 to 999 employees
• 1,000 to 9,999 employees and
• 10,000 or more employees
Employers were also grouped geographically, based on the following world regional classifications:
• United States: United States of America and its territories;
• European Union: Austria, Belgium, Denmark, France, Germany, Greece, Ireland, Italy, Liechtenstein, Lithuania, Luxembourg, Netherlands, Norway, Portugal, Spain, Sweden, Switzerland, and United Kingdom
• Asia-Pacific (APAC): Australia, Cambodia, China, Fiji, India, Indonesia, Japan, Korea (South), Singapore, Solomon Islands, Taiwan, Thailand, and Vietnam
• Latin America: Argentina, Brazil, Chile, Colombia, Costa Rica, Dominican Republic, Ecuador, El Salvador, Guatemala, Honduras, Mexico, Nicaragua, Panama, and Peru
• Other regions: Africa (Kenya and Zimbabwe), Canada, Middle East (Afghanistan, Bahrain, Kuwait, Pakistan, Saudi Arabia, Turkey, and United Arab Emirates) other European countries (Albania, Bosnia and Herzegovina, Russia, and Ukraine), as well as Mongolia and Nepal
In addition, US employers were grouped into the following regions using the US Census Bureau classification:
• Northeast: Connecticut, Maine; Massachusetts, New Hampshire, Vermont, Rhode Island, Vermont [New England], New Jersey, New York, and Pennsylvania [Middle Atlantic]
• Midwest: Indiana, Illinois, Michigan, Ohio, Wisconsin [East North Central], Iowa, Kansas Minnesota, Missouri, Nebraska, North Dakota, and South Dakota [West North Central]
• South: Delaware, District of Columbia, Florida, Georgia, Maryland, North Carolina, South Carolina, Virginia, West Virginia [South Atlantic], Alabama, Kentucky, Mississippi, Tennessee [East South Central], Arkansas, Louisiana, Oklahoma, and Texas [West South Central]
• West: Arizona, Colorado, Idaho, New Mexico, Montana, Utah, Nevada, Wyoming [Mountain], Alaska, California, Hawaii, Oregon, Washington, and Puerto Rico [Pacific]
Participating employers were grouped by their level of selectiveness in terms of the tier of full-time MBA programs of business schools where they hire graduates. Partner school tiers are based on the

2009 Data Report Corporate Recruiters Survey
30 © 2009 Graduate Management Admission Council®. All rights reserved.
average media rankings of their full-time MBA programs across those published by Business Week, Financial Times, and US News & World Report. For the purposes of this report, the level of employer selectiveness is defined as follows:
• First-tier: employers that work only with business schools with the top 50 MBA programs (1st through 50th)
• Second tier: employers that work only with business schools with the next 50 MBA programs (51st through 100th)
• Third tier: employers that work only with business schools with MBA programs that either have a lower rank (101st or lower) or are not considered for rankings by the above publications
The following probability tests were conducted to determine that the observed differences between the selected groups were statistically significant, i.e., that they were not the results of pure chance:
• Chi-square test—to compare difference between subgroups formed by categorical variables in cross-classification tables
• Paired-sample t-test—to compare means of the same measurement under different conditions (e.g., 2008 and estimated 2009 data provided by the same respondent)
• Analysis of variance (ANOVA)—to compare means of several groups of cases
For all the tests above, the null hypothesis (H0), which assumes that the differences resulted from pure chance, was rejected if p < .05. Please note that in some cases, the survey data do not meet all test assumptions. Therefore, test results should be viewed in relative rather than absolute terms.
When interpreting statistical tests, readers should distinguish between statistical and practical significance. For large samples, such as those used in many cases of this study, even minor differences between subgroups may lead to the rejection of the null hypothesis. Conversely, when sample sizes are small, large differences may show no statistical significance. Therefore, in each particular case, we recommend using practical judgment rather than solely relying on statistical analysis.
Findings reported in this publication are based on survey responses of participating employers and not a census of all employers of graduate business students; therefore, the data may be a subject of error, including sampling error and nonresponse error.
Percentages in tables may not add to 100 either due to multiple responses provided by respondents or due to rounding. Averages are not reported if the number of observations in a cell is less than 10. Percentages are not reported if the number of observations in a column is less than 10. Unless otherwise specified, responses “don’t know,” “prefer not to say,” or “not applicable” are not included.
The opinions and evaluations contained in this publication represent those of individual contributors and are not necessarily the views of the Graduate Management Admission Council.
Corporate Recruiters Survey 2009 Data Report
© 2009 Graduate Management Admission Council®. All rights reserved. 31
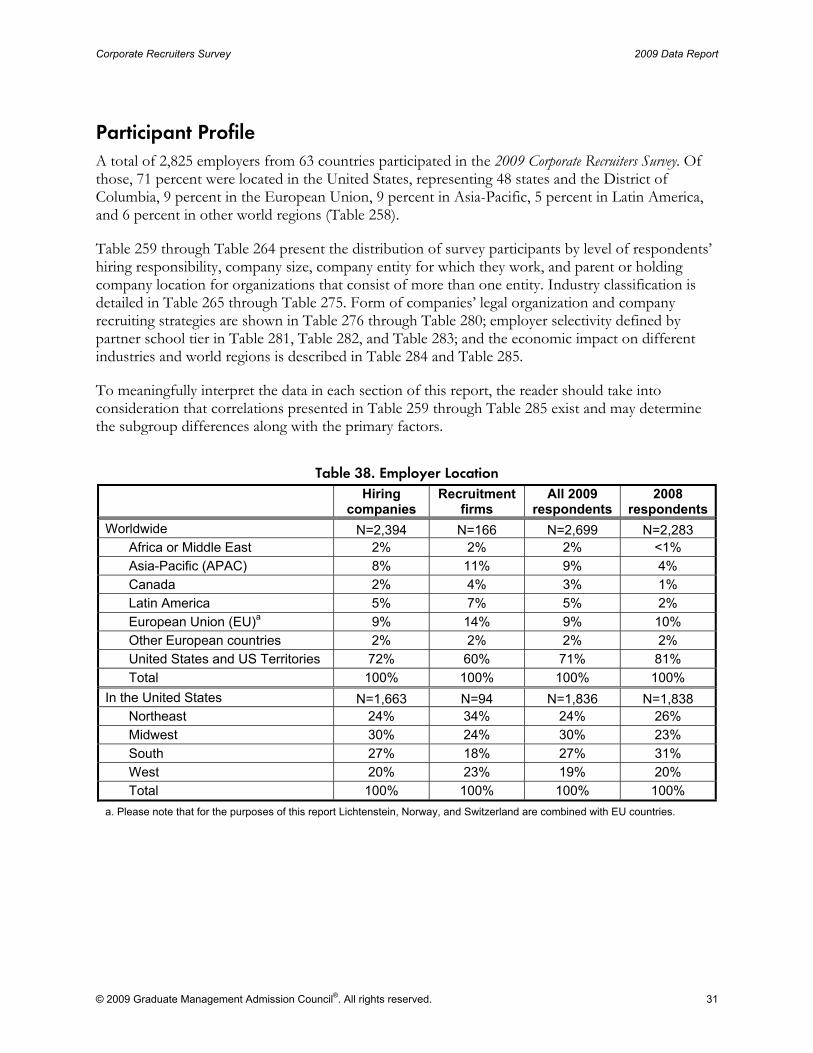
Participant Profile A total of 2,825 employers from 63 countries participated in the 2009 Corporate Recruiters Survey. Of those, 71 percent were located in the United States, representing 48 states and the District of Columbia, 9 percent in the European Union, 9 percent in Asia-Pacific, 5 percent in Latin America, and 6 percent in other world regions (Table 258).
Table 259 through Table 264 present the distribution of survey participants by level of respondents’ hiring responsibility, company size, company entity for which they work, and parent or holding company location for organizations that consist of more than one entity. Industry classification is detailed in Table 265 through Table 275. Form of companies’ legal organization and company recruiting strategies are shown in Table 276 through Table 280; employer selectivity defined by partner school tier in Table 281, Table 282, and Table 283; and the economic impact on different industries and world regions is described in Table 284 and Table 285.
To meaningfully interpret the data in each section of this report, the reader should take into consideration that correlations presented in Table 259 through Table 285 exist and may determine the subgroup differences along with the primary factors.
Table 38. Employer Location
Hiring
companies Recruitment
firmsAll 2009
respondents 2008
respondentsWorldwide N=2,394 N=166 N=2,699 N=2,283
Africa or Middle East 2% 2% 2% <1% Asia-Pacific (APAC) 8% 11% 9% 4% Canada 2% 4% 3% 1% Latin America 5% 7% 5% 2% European Union (EU)a 9% 14% 9% 10% Other European countries 2% 2% 2% 2% United States and US Territories 72% 60% 71% 81% Total 100% 100% 100% 100%
In the United States N=1,663 N=94 N=1,836 N=1,838 Northeast 24% 34% 24% 26% Midwest 30% 24% 30% 23% South 27% 18% 27% 31% West 20% 23% 19% 20% Total 100% 100% 100% 100%
a. Please note that for the purposes of this report Lichtenstein, Norway, and Switzerland are combined with EU countries.
2009 Data Report Corporate Recruiters Survey
32 © 2009 Graduate Management Admission Council®. All rights reserved.
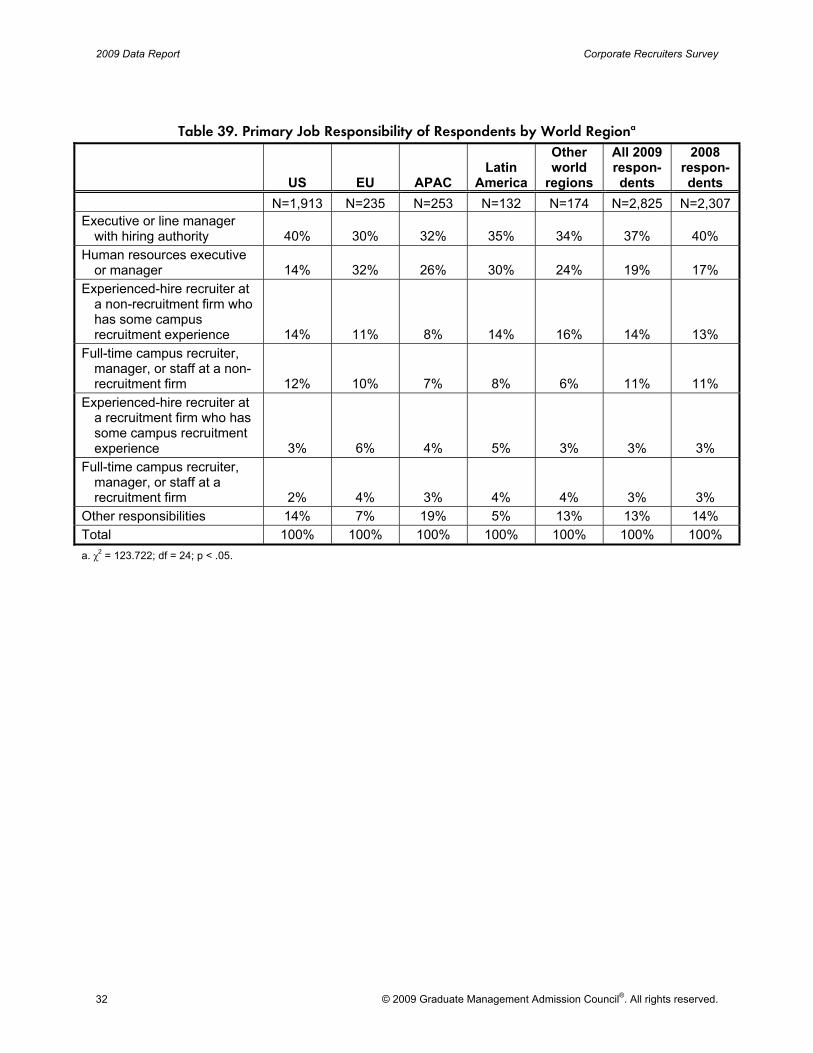
Table 39. Primary Job Responsibility of Respondents by World Regiona
US EU APAC Latin
America
Other world
regions
All 2009 respon-dents
2008 respon-dents
N=1,913 N=235 N=253 N=132 N=174 N=2,825 N=2,307 Executive or line manager
with hiring authority 40% 30% 32% 35% 34% 37% 40% Human resources executive
or manager 14% 32% 26% 30% 24% 19% 17% Experienced-hire recruiter at
a non-recruitment firm who has some campus recruitment experience 14% 11% 8% 14% 16% 14% 13%
Full-time campus recruiter, manager, or staff at a non-recruitment firm 12% 10% 7% 8% 6% 11% 11%
Experienced-hire recruiter at a recruitment firm who has some campus recruitment experience 3% 6% 4% 5% 3% 3% 3%
Full-time campus recruiter, manager, or staff at a recruitment firm 2% 4% 3% 4% 4% 3% 3%
Other responsibilities 14% 7% 19% 5% 13% 13% 14% Total 100% 100% 100% 100% 100% 100% 100% a. χ2 = 123.722; df = 24; p < .05.
Corporate Recruiters Survey 2009 Data Report
© 2009 Graduate Management Admission Council®. All rights reserved. 33
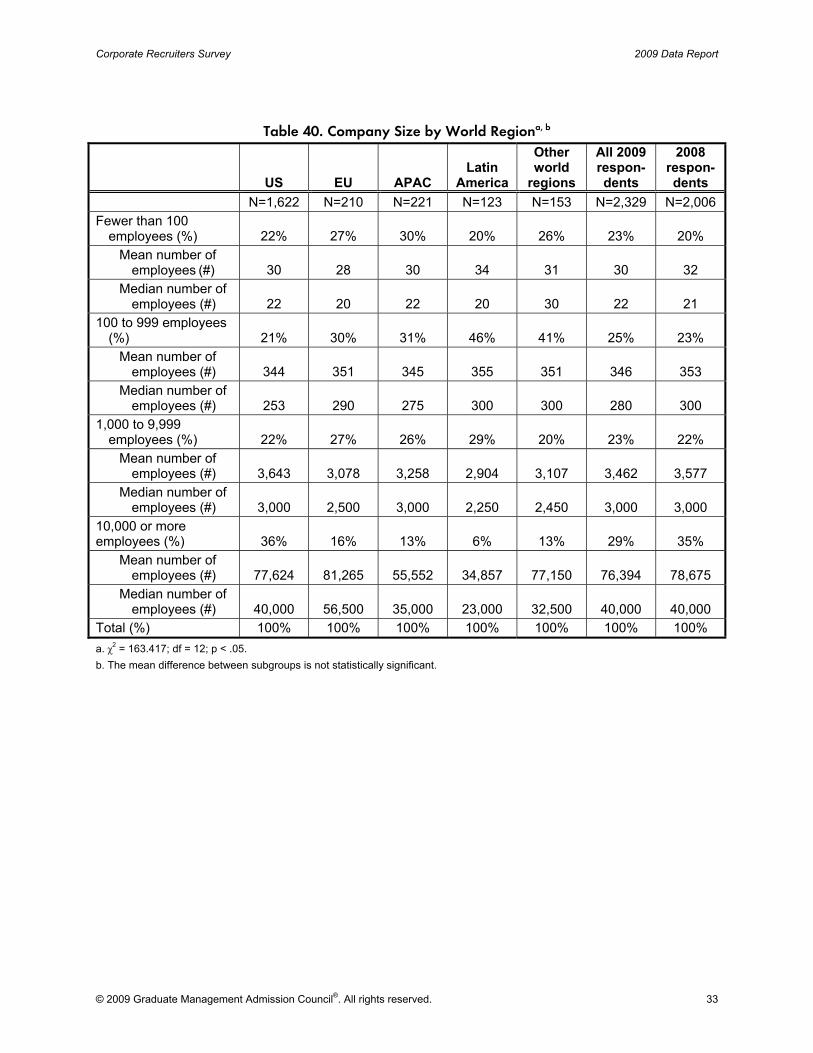
Table 40. Company Size by World Regiona, b
US EU APAC Latin
America
Other world
regions
All 2009 respon-dents
2008 respon-dents
N=1,622 N=210 N=221 N=123 N=153 N=2,329 N=2,006 Fewer than 100
employees (%) 22% 27% 30% 20% 26% 23% 20% Mean number of
employees (#) 30 28 30 34 31 30 32 Median number of
employees (#) 22 20 22 20 30 22 21 100 to 999 employees
(%) 21% 30% 31% 46% 41% 25% 23% Mean number of
employees (#) 344 351 345 355 351 346 353 Median number of
employees (#) 253 290 275 300 300 280 300 1,000 to 9,999
employees (%) 22% 27% 26% 29% 20% 23% 22% Mean number of
employees (#) 3,643 3,078 3,258 2,904 3,107 3,462 3,577 Median number of
employees (#) 3,000 2,500 3,000 2,250 2,450 3,000 3,000 10,000 or more employees (%) 36% 16% 13% 6% 13% 29% 35%
Mean number of employees (#) 77,624 81,265 55,552 34,857 77,150 76,394 78,675
Median number of employees (#) 40,000 56,500 35,000 23,000 32,500 40,000 40,000
Total (%) 100% 100% 100% 100% 100% 100% 100% a. χ2 = 163.417; df = 12; p < .05. b. The mean difference between subgroups is not statistically significant.

2009 Data Report Corporate Recruiters Survey
34 © 2009 Graduate Management Admission Council®. All rights reserved.
Table 41. Company Size by US Regiona
Northeast Midwest South West N=379 N=478 N=446 N=323 Fewer than 100 employees (%) 16% 20% 24% 28%
Mean number of employeesb (#) 30 32 30 29 Median number of employees (#) 24 25 20 25
100 to 999 employees (%) 21% 23% 19% 20% Mean number of employeesc (#) 367 355 283 375 Median number of employees (#) 300 300 200 333
1,000 to 9,999 employees (%) 23% 22% 20% 22% Mean number of employeesb (#) 3,546 3,667 3,761 3,544 Median number of employees (#) 3,000 3,000 3,000 2,600
10,000 or more employees (%) 41% 35% 37% 30% Mean number of employeesb (#) 75,910 63,688 89,868 83,435 Median number of employees (#) 38,000 37,000 40,000 50,000
Total (%) 100% 100% 100% 100% a. χ2 = 22.758; df = 9; p < .05. b. The mean difference between subgroups is not statistically significant. c. F = 2.839; df1 = 3; df2 = 332 ; p < .05.
Table 42. Company Entity by World Regiona
United States
European Union APAC
Latin America
Other world
regions
All respond
ents N=1,833 N=228 N=250 N=131 N=168 N=2,612 Parent or holding company 34% 39% 39% 22% 32% 34% Division, subsidiary, or branch 30% 33% 41% 41% 42% 32% Company consists of one entity 37% 28% 20% 37% 26% 34% Total 100% 100% 100% 100% 100% 100% a. χ2 =53.856; df = 8; p < .05.
Table 43. Company Entity by Company Sizea
Fewer than 100
employees 100 to 999 employees
1,000 to 9,999
employees
10,000 or more
employees N=543 N=583 N=532 N=671 Parent or holding company 19% 24% 35% 53% Division, subsidiary, or branch 24% 42% 41% 20% Company consists of one entity 57% 34% 24% 28% Total 100% 100% 100% 100% a. χ2 = 307.830; df = 6; p < .05.
Corporate Recruiters Survey 2009 Data Report
© 2009 Graduate Management Admission Council®. All rights reserved. 35
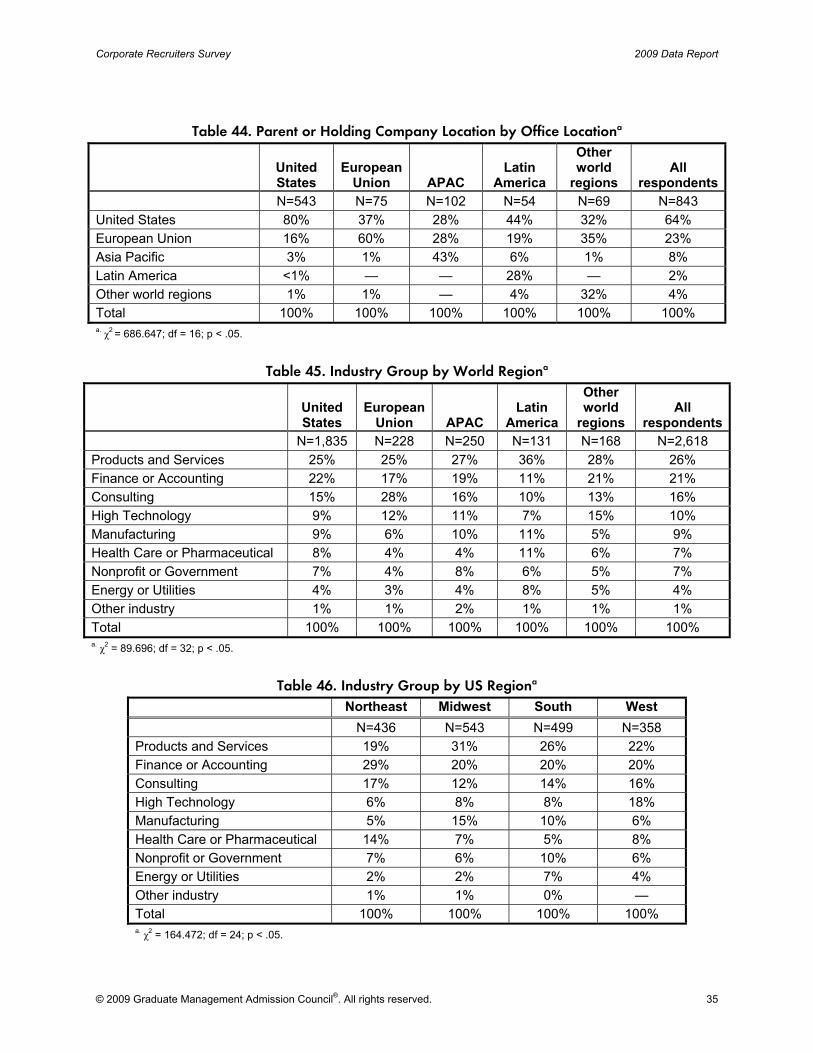
Table 44. Parent or Holding Company Location by Office Locationa
United States
European Union APAC
Latin America
Other world
regions All
respondents N=543 N=75 N=102 N=54 N=69 N=843 United States 80% 37% 28% 44% 32% 64% European Union 16% 60% 28% 19% 35% 23% Asia Pacific 3% 1% 43% 6% 1% 8% Latin America <1% — — 28% — 2% Other world regions 1% 1% — 4% 32% 4% Total 100% 100% 100% 100% 100% 100% a. χ2 = 686.647; df = 16; p < .05.
Table 45. Industry Group by World Regiona
United States
European Union APAC
Latin America
Other world
regions All
respondents N=1,835 N=228 N=250 N=131 N=168 N=2,618 Products and Services 25% 25% 27% 36% 28% 26% Finance or Accounting 22% 17% 19% 11% 21% 21% Consulting 15% 28% 16% 10% 13% 16% High Technology 9% 12% 11% 7% 15% 10% Manufacturing 9% 6% 10% 11% 5% 9% Health Care or Pharmaceutical 8% 4% 4% 11% 6% 7% Nonprofit or Government 7% 4% 8% 6% 5% 7% Energy or Utilities 4% 3% 4% 8% 5% 4% Other industry 1% 1% 2% 1% 1% 1% Total 100% 100% 100% 100% 100% 100% a. χ2 = 89.696; df = 32; p < .05.
Table 46. Industry Group by US Regiona
Northeast Midwest South West N=436 N=543 N=499 N=358 Products and Services 19% 31% 26% 22% Finance or Accounting 29% 20% 20% 20% Consulting 17% 12% 14% 16% High Technology 6% 8% 8% 18% Manufacturing 5% 15% 10% 6% Health Care or Pharmaceutical 14% 7% 5% 8% Nonprofit or Government 7% 6% 10% 6% Energy or Utilities 2% 2% 7% 4% Other industry 1% 1% 0% — Total 100% 100% 100% 100% a. χ2 = 164.472; df = 24; p < .05.
2009 Data Report Corporate Recruiters Survey
36 © 2009 Graduate Management Admission Council®. All rights reserved.
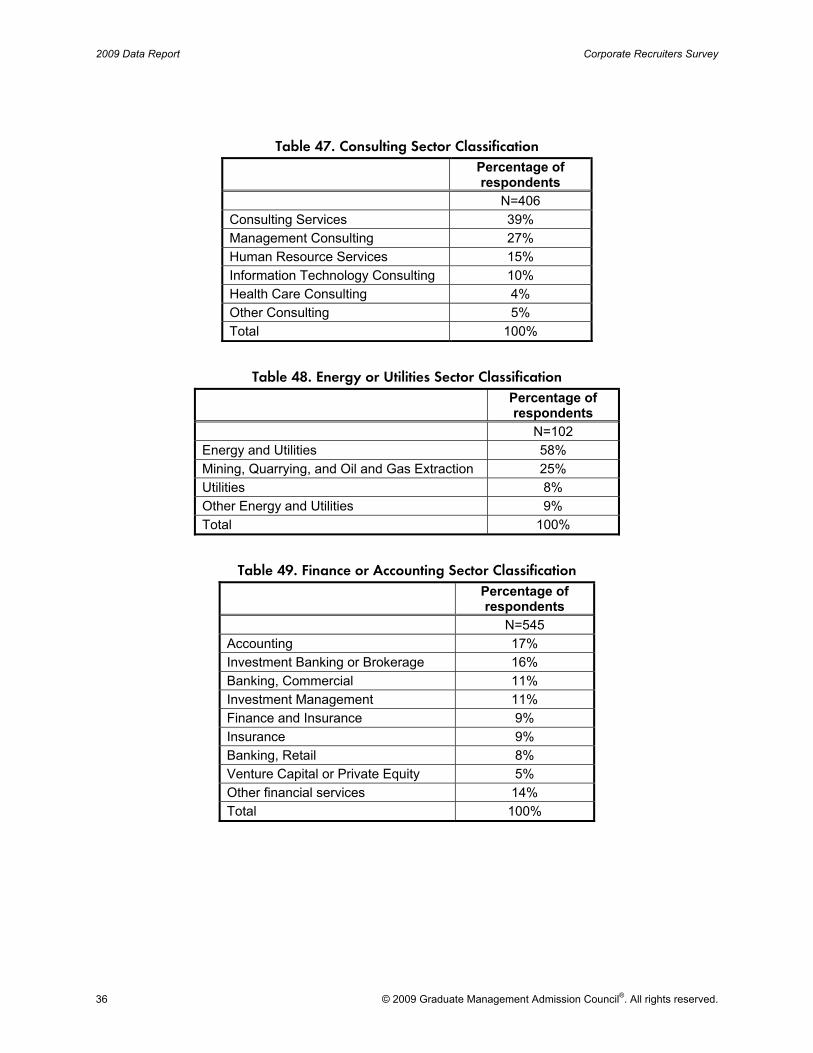
Table 47. Consulting Sector Classification
Percentage of respondents
N=406 Consulting Services 39% Management Consulting 27% Human Resource Services 15% Information Technology Consulting 10% Health Care Consulting 4% Other Consulting 5% Total 100%
Table 48. Energy or Utilities Sector Classification
Percentage of respondents
N=102 Energy and Utilities 58% Mining, Quarrying, and Oil and Gas Extraction 25% Utilities 8% Other Energy and Utilities 9% Total 100%
Table 49. Finance or Accounting Sector Classification
Percentage of respondents
N=545 Accounting 17% Investment Banking or Brokerage 16% Banking, Commercial 11% Investment Management 11% Finance and Insurance 9% Insurance 9% Banking, Retail 8% Venture Capital or Private Equity 5% Other financial services 14% Total 100%
Corporate Recruiters Survey 2009 Data Report
© 2009 Graduate Management Admission Council®. All rights reserved. 37
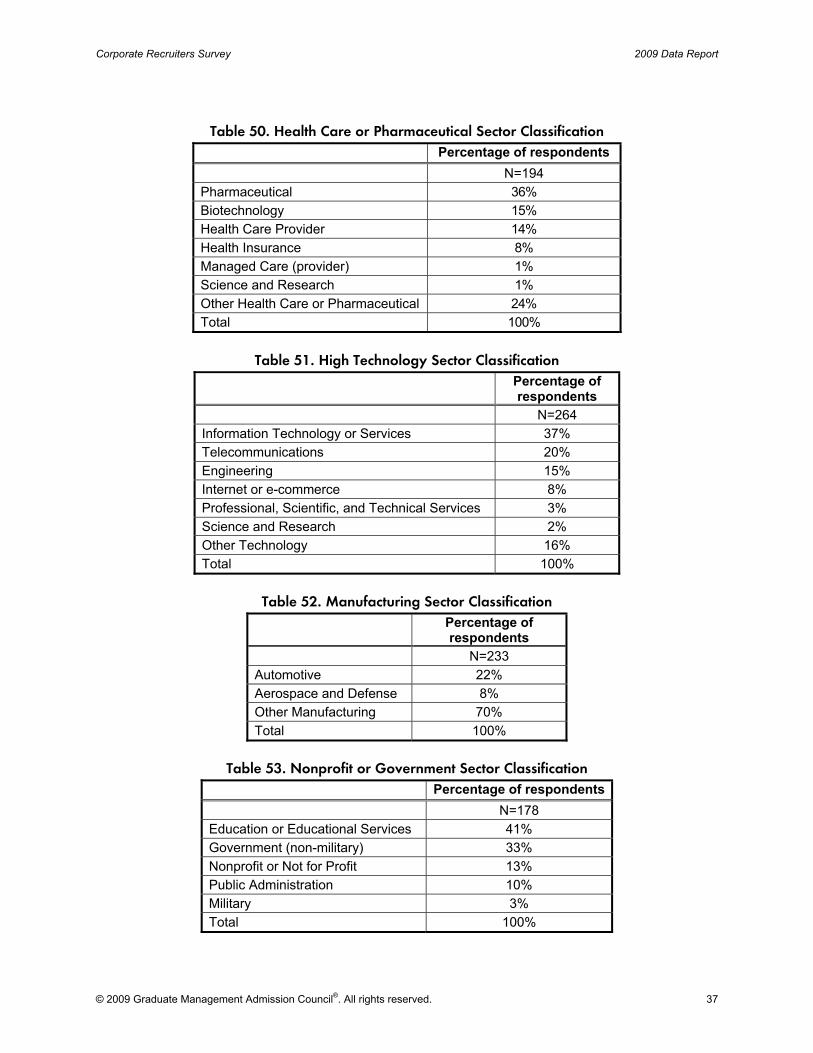
Table 50. Health Care or Pharmaceutical Sector Classification
Percentage of respondents N=194 Pharmaceutical 36% Biotechnology 15% Health Care Provider 14% Health Insurance 8% Managed Care (provider) 1% Science and Research 1% Other Health Care or Pharmaceutical 24% Total 100%
Table 51. High Technology Sector Classification
Percentage of respondents
N=264 Information Technology or Services 37% Telecommunications 20% Engineering 15% Internet or e-commerce 8% Professional, Scientific, and Technical Services 3% Science and Research 2% Other Technology 16% Total 100%
Table 52. Manufacturing Sector Classification
Percentage of respondents
N=233 Automotive 22% Aerospace and Defense 8% Other Manufacturing 70% Total 100%
Table 53. Nonprofit or Government Sector Classification
Percentage of respondents N=178 Education or Educational Services 41% Government (non-military) 33% Nonprofit or Not for Profit 13% Public Administration 10% Military 3% Total 100%

2009 Data Report Corporate Recruiters Survey
38 © 2009 Graduate Management Admission Council®. All rights reserved.
Table 54. Products and Services Sector Classification
Percentage of respondents
N=675 Transportation and Warehousing 10%
Aviation and Airlines 49% Freight 23% Warehousing and Storage 14% Postal Service 4% Rail Transportation 4% Transit and Ground Passenger Transportation 4% Water Transportation 1% Total 100%
Communications 12% Marketing Services 41% Media 30% Publishing Industries 16% Advertising 13% Total 100%
Food/Entertainment/Lodging 22% Food, Beverage, and Tobacco 58% Hotel, Gaming, Leisure, and Travel 14% Arts, Entertainment, and Recreation 13% Agriculture, Forestry, Fishing and Hunting 11% Sports and Recreation 4% Total 100%
Other Products and Services 55% Consumer Goods 32% Retail or Wholesale 17% Real Estate and Rental and/or Leasing 7% Construction and Installation 7% Wholesale Trade 5% Customer Services 2% Waste Management and Remediation Services 1% Architecture 1% Management of Companies and Enterprises <1% Other Products and Services 29% Total 100%
Total 100%

Corporate Recruiters Survey 2009 Data Report
© 2009 Graduate Management Admission Council®. All rights reserved. 39
Table 55. Industry Group by Company Sizea,b
Fewer than 100
employees100 to 999 employees
1,000 to 9,999
employees
10,000 or more
employees Total N Consulting 40% 24% 16% 19% 100% N=372 Energy or utilities 8% 27% 35% 30% 100% N=84 Finance or accounting 25% 25% 22% 28% 100% N=479 Health care or pharmaceutical 7% 22% 32% 39% 100% N=173 High technology 20% 24% 23% 33% 100% N=240 Manufacturing 8% 19% 28% 44% 100% N=212 Nonprofit or government 38% 38% 14% 9% 100% N=159 Products and services 21% 26% 23% 30% 100% N=596 Other industry 14% 7% 36% 43% 100% N=14 a. χ2 = 216.009; df =24; p < .05. b. Percentage of cases in a row.
Table 56. Form of Legal Organization of Hiring Company by World Regiona
United States
European Union APAC
Latin America
Other world
regions All
respondents N=1,834 N=228 N=250 N=131 N=162 N=2,610 Publicly held corporation 51% 23% 32% 34% 33% 45% Privately held corporation 26% 51% 31% 48% 40% 31% Partnership 10% 14% 14% 6% 16% 11% Nonprofit or not-for-profit 6% 2% 4% 2% 4% 5% Public service or government 3% 4% 7% 6% 3% 4% Sole proprietorship 1% 2% 10% 2% 1% 2% Other 3% 4% 3% 2% 3% 2% Total 100% 100% 100% 100% 100% 100% a. χ2 = 241.699; df = 28; p < .05.
Table 57. Recruitment Strategy Groupa
Percentage of respondents
N=2,825 Low-cost 30% High-touch 31% Sophisticated 39% Total 100% a. Based on two-step cluster analysis of company recruitment strategies.
2009 Data Report Corporate Recruiters Survey
40 © 2009 Graduate Management Admission Council®. All rights reserved.
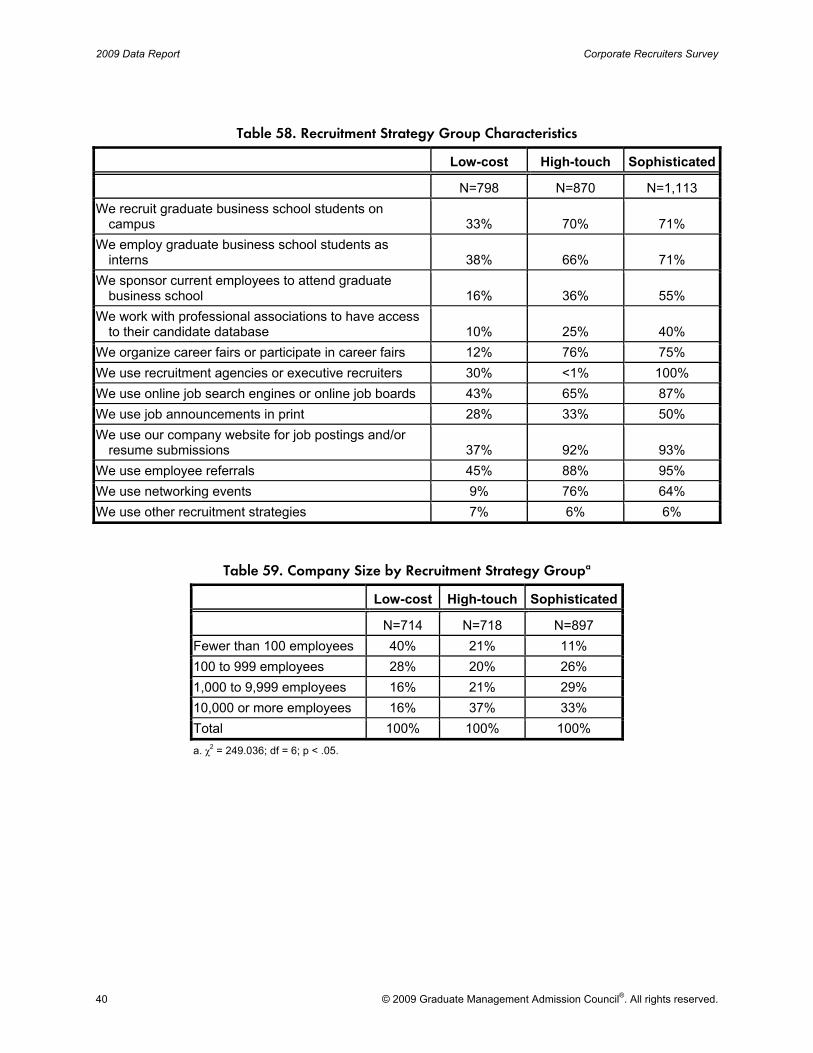
Table 58. Recruitment Strategy Group Characteristics
Low-cost High-touch Sophisticated
N=798 N=870 N=1,113 We recruit graduate business school students on
campus 33% 70% 71% We employ graduate business school students as
interns 38% 66% 71% We sponsor current employees to attend graduate
business school 16% 36% 55% We work with professional associations to have access
to their candidate database 10% 25% 40% We organize career fairs or participate in career fairs 12% 76% 75% We use recruitment agencies or executive recruiters 30% <1% 100% We use online job search engines or online job boards 43% 65% 87% We use job announcements in print 28% 33% 50% We use our company website for job postings and/or
resume submissions 37% 92% 93% We use employee referrals 45% 88% 95% We use networking events 9% 76% 64% We use other recruitment strategies 7% 6% 6%
Table 59. Company Size by Recruitment Strategy Groupa
Low-cost High-touch Sophisticated
N=714 N=718 N=897 Fewer than 100 employees 40% 21% 11% 100 to 999 employees 28% 20% 26% 1,000 to 9,999 employees 16% 21% 29% 10,000 or more employees 16% 37% 33% Total 100% 100% 100% a. χ2 = 249.036; df = 6; p < .05.
Corporate Recruiters Survey 2009 Data Report
© 2009 Graduate Management Admission Council®. All rights reserved. 41
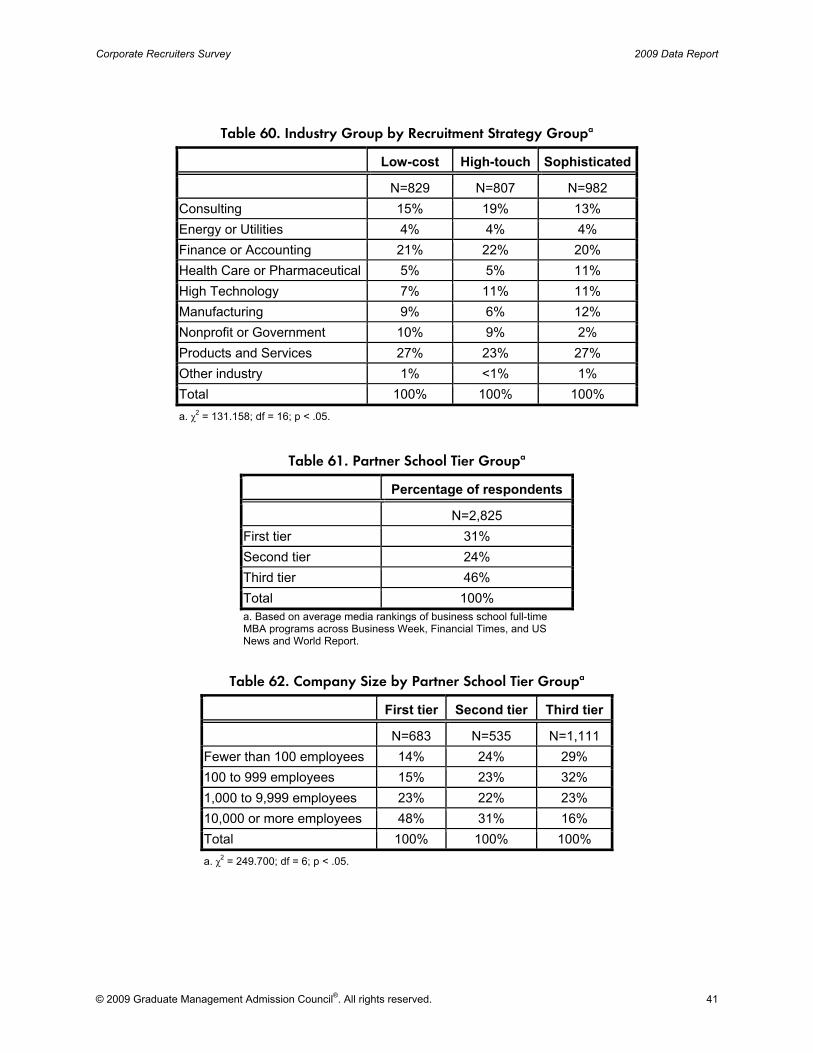
Table 60. Industry Group by Recruitment Strategy Groupa
Low-cost High-touch Sophisticated
N=829 N=807 N=982 Consulting 15% 19% 13% Energy or Utilities 4% 4% 4% Finance or Accounting 21% 22% 20% Health Care or Pharmaceutical 5% 5% 11% High Technology 7% 11% 11% Manufacturing 9% 6% 12% Nonprofit or Government 10% 9% 2% Products and Services 27% 23% 27% Other industry 1% <1% 1% Total 100% 100% 100% a. χ2 = 131.158; df = 16; p < .05.
Table 61. Partner School Tier Groupa
Percentage of respondents
N=2,825 First tier 31% Second tier 24% Third tier 46% Total 100% a. Based on average media rankings of business school full-time MBA programs across Business Week, Financial Times, and US News and World Report.
Table 62. Company Size by Partner School Tier Groupa
First tier Second tier Third tier
N=683 N=535 N=1,111 Fewer than 100 employees 14% 24% 29% 100 to 999 employees 15% 23% 32% 1,000 to 9,999 employees 23% 22% 23% 10,000 or more employees 48% 31% 16% Total 100% 100% 100% a. χ2 = 249.700; df = 6; p < .05.

2009 Data Report Corporate Recruiters Survey
42 © 2009 Graduate Management Admission Council®. All rights reserved.
Table 63. Industry Group by Partner School Tier Groupa
First tier Second tier Third tier
N=802 N=602 N=1,214 Consulting 19% 20% 11% Energy or Utilities 5% 3% 4% Finance or Accounting 22% 20% 20% Health Care or Pharmaceutical 8% 10% 6% High Technology 9% 9% 11% Manufacturing 12% 7% 8% Nonprofit or Government 3% 9% 8% Products and Services 21% 21% 31% Other industry 1% 1% 1% Total 100% 100% 100% a. χ2 = 110.683; df = 16; p < .05.
Table 64. Industry Group by 2008 Economic Impacta,b
Positive None Negative Total N Consulting 20% 31% 49% 100% N=406 Energy or utilities 15% 39% 46% 100% N=102 Finance or accounting 17% 19% 65% 100% N=545 Health care or pharmaceutical 16% 25% 58% 100% N=194 High technology 16% 24% 60% 100% N=264 Manufacturing 13% 15% 73% 100% N=233 Nonprofit or government 24% 41% 35% 100% N=178 Products and services 17% 20% 63% 100% N=675 Other industry 19% 33% 48% 100% N=21 Total 18% 24% 58% 100% N=2,825 a. χ2 = 110.727; df =16; p < .05. b. Percentage of cases in a row.
Table 65. World Region by 2008 Economic Impacta,b
Positive None Negative Total N United States 16% 22% 62% 100% N=1,913 European Union 19% 29% 52% 100% N=235 Asia Pacific 22% 32% 46% 100% N=253 Latin America 31% 27% 42% 100% N=132 Other world regions 19% 32% 49% 100% N=174 a. χ2 = 59.349; df = 8; p < .05. b. Percentage of cases in a row.

Corporate Recruiters Survey 2009 Data Report
© 2009 Graduate Management Admission Council®. All rights reserved. 43
Appendix A: Survey Participants
Participating Schools (sorted by university name)
A American University, Kogod School of Business Arizona State University, W.P. Carey School of Business Athens University of Economics and Business Auburn University, College of Business
B Babson College, F.W. Olin Graduate School of Business Baruch College, City University of New York, Zicklin School of Business Baylor University, Hankamer School of Business Bentley University, Elkin B. McCallum Graduate School of Business Binghamton University—State University of New York, School of Management Boston University, Boston University School of Management Brock University, Faculty of Business
C Carnegie Mellon University, Tepper School of Business Case Western Reserve University, Weatherhead School of Management Central Queensland University Centre Franco-Vietnamien de Formation à la Gestion (CFVG) CENTRUM Católica, Pontificia Universidad Católica del Perú China Europe International Business School (CEIBS) Chulalongkorn University, Sasin Graduate Institute of Business Administration Clarkson University, School of Business College of Business Administration Saudi Arabia College of William and Mary, Mason School of Business Concordia University, John Molson School of Business Copenhagen Business School Cornell University, Johnson Graduate School of Management
D DePaul University, Charles H. Kellstadt Graduate School of Business Drexel University, LeBow College of Business Duke University, The Fuqua School of Business

2009 Data Report Corporate Recruiters Survey
44 © 2009 Graduate Management Admission Council®. All rights reserved.
E Eastern Michigan University, College of Business EGP - University of Porto Business School Emory University, Goizueta Business School Escuela de Alta Dirección y Administración (EADA) Escuela Superior Politécnica Del Litoral (ESPOL), ESPAE Graduate School of Management
F Florida International University, College of Business Administration Fordham University, Fordham Graduate School of Business Administration FORE School of Management Fudan University, School of Management FUNDESEM Business School
G George Washington University, GW School of Business Georgetown University, The Robert Emmett McDonough School of Business Georgia Institute of Technology, Georgia Tech College of Management GISMA Business School Graduate School of International Business (GSIB) of the Academy of National Economy under the
Government of the Russian Federation (Высшая Школа Международного Бизнеса (ВШМБ) Академии народного хозяйства при Правительстве РФ)
Grenoble Graduate School of Business (Grenoble Ecole de Management)
H HEC Paris
I IAE Aix-en-Provence IAE Business School ICFAI Business School (IBS®) Illinois Institute of Technology, Stuart Graduate School of Business IMD (International Institute for Management Development) INCAE Business School Indian School of Business Indiana University, Kelley School of Business (Bloomington) INSEAD Institute of International Business Education (Институт международного бизнес образования) Instituto Panamericano de Alta Dirección de Empresa (IPADE), IPADE Business School International Management Institute (MIM-Kyiv) Iowa State University, College of Business ISM University of Management and Economics
K Kennesaw State University, Michael J. Coles College of Business Koç University, Graduate School of Business

Corporate Recruiters Survey 2009 Data Report
© 2009 Graduate Management Admission Council®. All rights reserved. 45
L Loyola University Chicago, Graduate School of Business
M MIB School of Management Michigan State University, The Eli Broad Graduate School of Management Moscow State University, Graduate School of Business Administration
N Nanyang Technological University, Nanyang Business School National University of Singapore, NUS Business School New Jersey Institute of Technology, NJIT School of Management New York University, Leonard N. Stern School of Business North Carolina State University, Jenkins Graduate School of Management Northeastern University, Graduate School of Business Administration Northwestern University, Kellogg School of Management
O Ohio State University, Fisher College of Business
P Pepperdine University, Graziadio School of Business and Management Plekhanov International Business School Portland State University, School of Business Administration Purdue University, Krannert School of Management
Q Queen’s University, Canada, Queen’s School of Business
R Rice University, Jones Graduate School of Business Rockhurst University, Helzberg School of Management Rutgers, the State University of New Jersey, Rutgers Business School
S Sabanci Universitesi, Faculty of Management Saint Ambrose University, H.L. McLaughlin One-Year MBA Program Saint Louis University, John Cook School of Business Saint Mary’s University, Sobey School of Business San Francisco State University, College of Business San Jose State University, Lucas Graduate School of Business Sarajevo Graduate School of Business Simmons College, Simmons School of Management Southern Methodist University, Cox School of Business Syracuse University, Whitman School of Management

2009 Data Report Corporate Recruiters Survey
46 © 2009 Graduate Management Admission Council®. All rights reserved.
T Temple University, Fox School of Business and Management Texas AandM University, Mays Business School Texas Christian University, M.J. Neeley School of Business Thunderbird School of Global Management Tulane University of Louisiana, A.B. Freeman School of Business
U Universidad de Belgrano, Escuela de Negocios Universidad del Norte, School of Business Universiteit Antwerpen, Management School (UAMS) University at Buffalo/State University of New York, School of Management University of Alabama, Culverhouse College of Commerce and Business Administration University of Alberta, School of Business University of Arizona, Eller College of Management University of Arkansas, Fayetteville, Sam M. Walton College of Business University of British Columbia, Sauder School of Business University of California, Davis, Graduate School of Management University of California, Irvine, the Paul Merage School of Business University of California, Los Angeles, UCLA Anderson School Of Management University of California, Riverside, A. Gary Anderson Graduate School of Management University of California, San Diego, the Rady School of Management University of Cambridge, Judge Business School University of Cincinnati, College of Business University of Denver, Daniels College of Business University of Florida, Hough Graduate School of Business at the Warrington College of Business
Administration University of Houston, University Park, C.T. Bauer College of Business University of Houston, Victoria, School of Business Administration University of Illinois at Chicago, Liautaud Graduate School of Business University of Iowa, Henry B. Tippie School of Management University of Kentucky, Carol Martin Gatton College of Business and Economics University of Leeds, Leeds University Business School University of London, London Business School University of Melbourne, Melbourne Business School University of Miami School of Business Administration University of Michigan Stephen M. Ross School of Business University of Minnesota, Carlson School of Management University of Missouri–Columbia, Robert J. Trulaske, Sr. College of Business University of Missouri–St. Louis, College of Business Administration University of Navarra, IESE Business School University of New South Wales, Australian School of Business, AGSM MBA Programs University of North Carolina at Chapel Hill, Kenan-Flagler Business School University of North Carolina at Charlotte, Belk College of Business University of Notre Dame, Mendoza College of Business University of Oklahoma, Price College of Business
Corporate Recruiters Survey 2009 Data Report
© 2009 Graduate Management Admission Council®. All rights reserved. 47
University of Oregon, Lundquist College of Business University of Rochester, Simon Graduate School of Management University of South Carolina, Moore School of Business University of South Florida, College of Business University of Southern California, USC Marshall School of Business University of Tennessee, College of Business Administration University of Texas at Austin, McCombs School of Business University of Texas at Dallas, School of Management University of Texas at San Antonio, College of Business University of the Pacific, Eberhardt School of Business University of Toledo, The; College of Business Administration University of Toronto, Rotman School of Management University of Virginia, Darden School of Business University of Warwick, Warwick Business School University of Wisconsin-Madison, Wisconsin School of Business University of Wisconsin-Milwaukee, Sheldon B. Lubar School of Business
V Vanderbilt University, Owen Graduate School of Management
W Wake Forest University, Babcock Graduate School of Management Washington State University, College of Business Washington University in St. Louis, Olin Business School Wayne State University, School of Business Administration Webster University, Missouri Welingkar Institute of Management Development and Research West Virginia University, College of Business and Economics Willamette University, Atkinson Graduate School of Management
2009 Data Report Corporate Recruiters Survey
48 © 2009 Graduate Management Admission Council®. All rights reserved.
Participating Companies 321 Marketing 3i PLC 3M Company A.T. Kearney, Inc. AAFES AARP ABACO Abbott International Ltd. Abel Ribeiro da Silva SGPS SA ABF Freight System, Inc. Abroad China Abu Dawood Accelero Health Parnters Accenture Accor Accountemps Accredo Accretive Solutions Aceralia ACI Worldwide Acorn Hong Kong Acquirent LLC Acquis Consulting Action Consulting Adecco Adecco Perú Adidas ADM Adobe Rent a Car Adobe Systems Adobe Systems Incorporated Advance Auto Parts Advanced Sterilization Products Advantech Media Advertising Specialty Institute (ASI) Aegon USA Aequitas Capital Management, Inc. Aeropuertos Argentina 2000 S.A. AeroStrategy Aerotek AES Corporation Affinion Group Affton School District Administration AgFirst Farm Credit Bank Agilent Agilent Technologies, Inc.
AIG Global Investment AIG United Guaranty AIJU Air Canada Air Products and Chemicals, Inc. AirTran Airways AIT Worldwide Logistics Ak Asset Akcros Chemicals Akkök Sanayi Yatirim Gelistirme AS Aladdin Capital Management LLC Alberto-Culver Albis Plastic GmbH ALCATEL Alcatel Lucent Alcoa Inc. Aldesa Servicios PSCO, S. A. Alexander Group, Inc. Alfagres Alghanim Industries Aliant ALICO All Phase Electric Allegis Group Inc. Allen Trust Company Allete/Minnesota Power Alliance Data Systems Allianz Insurance Management Asia Pacific Pte
Ltd Allied Irish Bank Allstate Corporation / Allstate Investments LLC Allstate Insurance Co. Allsteel Inc. Almacen Storage Almirall Alpine Bank Alticor Alvarez & Marsal, LLC Alzheimer’s Association Amazon.com, Inc. AMB Property Corporation Amba Research Ambar AMBEC / US Department of Commerce Amdocs Ameren Corporation

Corporate Recruiters Survey 2009 Data Report
© 2009 Graduate Management Admission Council®. All rights reserved. 49
American American Airlines American Analyst American Express – AZ American Express Company American Financial Grp. (AFG) American Greetings American International Group American Lung Association of the Atlantic Coast American Red Cross American Society for Quality American TV AmeriGas Amgen Amplify Systems AMROP Amstar Group, LLC Amtrak Andersen Corporation Anheuser-Busch, Inc. Anklesaria Group Anteater Web Design and Marketing Inc. Anton Collins Mitchell LLP ANZ Bank AOL APC, Inc. Apollo Global AppLabs Apple Europe Ltd Apple Inc. Applied Materials, Inc. Arçelik A.S. Arcstone Partners ARES Systems Group Arizona Federal Credit Union Arizona Public Safety Personnel Retirement
System ARSgroup ARTAAJ Arthur D. Little Arthur D. Little S.L. ArvinMeritor Ascendas PTE Ltd Ascension Health, Inc. Ashland Partners Aspen Institute, The Aspen Marketing Services Assay Designs, Inc. Assurant AstenJohnson
AT&T, Inc. ATB Financial Atco Engineering ATCO Gas Atel Athena Health Atlas Copco Atradius Audiotel S.A. Aurora Health Care Autoliv Gebze Mühendislik Merkezi Avaya Argentina SRL Avaya Inc. Avenue A | Razorfish Avery Dennison AVIO Avon AXA Australia AXA Group, The AXA Seguros Mexico AYUDA Azalea Capital, LLC B/E Aerospace, Inc. Babcock Power Inc. BAC Credomatic Bacardi USA, Inc. BAE Systems Bain & Company Bain & Company SE Asia, Inc. Balearia Balyasny Asset Management Banc of America Securities LLC Banco Industrial Banco Multisectorial de Inversiones Bank for Foreign Trade of Vietnam Bank Gutmann AG Bank of America Bank of New York Mellon, The Bank of Scotland Corporate Bapepam Barbour Logan Executive Search Barclays Capital Barco Barfield, Murphy, Shank & Smith, P.C. Bassich & Associates, Inc. Batteries Plus 119 Baxter Healthcare Corporation Bayco Management Bayer Türk Kimya San. Ltd. Sti. BB&T

2009 Data Report Corporate Recruiters Survey
50 © 2009 Graduate Management Admission Council®. All rights reserved.
BBVA bcIMC BD BDO Seidman LLP BE Accord LLC BearingPoint, Inc. Becker CPA Review Corp. Becker Professional Review Beiersdorf AG BellSouth Berdon LLP Bertelsmann Best Buy Bethel College BigPond BioReference Bisk Education BJC HealthCare BKD, LLP Black & Decker Black & Veatch Blackboard Blade, The Blalock Machinery Blaupunkt GmbH (Bosch) Blockbuster, Inc. Bloomberg BLT Blue Cross Blue Shield of Massachusetts BMO Capital Markets Boehringer Ingelheim Boehringer Ingelheim Pharmaceuticals Inc. Boeing Company Bonadio Group, The Bond & Company Executive Recruiting Booz & Company Booz Allen Hamilton Bosch Group Boston Consulting Group, The Boston Scientific Boston Scientific CRM Boston Ventures Boy Scouts of America, The Boyden BP Brambles Industries/CHEP Bravo! Vail Valley Music Festival Brickell Capital Management, LLC Bridge Strategy Group Bridgestone
Bridgestone de Costa Rica, S.A. Brighton Jones Brinkmann Constructors Brisbane Girls Grammar School Bristol-Myers Squibb Bristol-Myers Squibb Canada Broadcom Corporation Brocade Brown and Bird Brown, Smith, Wallace, LLC BT PLC BTS USA, Inc. (SMG) Bunge Sa Bureau of Reclamation Pacific Northwest
Regional Office Burke , Inc. Busch Gardens Tampa Business Executives for National Security Business First, Baton Rouge Business Octane Solution Pvt. Ltd. C+ía. Minera Aurífera Santa Rosa S.A. Cadac Holdings Limited Cadbury Schweppes California Franchise Tax Board Calinda Software Callaway Golf CalPERS CalSTRS Calvary Silver Circle Calvert Group, The Câmara Municipal do Porto Cambridge Investment Research Advisors Cameron Campbell Alliance Campbell Soup Company CampusPoint Canadian Tire Financial Services Canon Business Solutions – West Capgemini Capgemini Canada Capital Group Companies Capital Group, The Capital IQ Capital One Capstone Capstone Partnership Cardinal Health, Inc. CareCredit (a GE Money Company) Career Management Associates CareerShift

Corporate Recruiters Survey 2009 Data Report
© 2009 Graduate Management Admission Council®. All rights reserved. 51
CareFlight Medical Services Ltd Cargill Asia Pacific Cargill International Trading Pte Ltd Cargill, Inc. Carlos A. Bianchi y Associados Carlsberg Group Carnival Cruise Lines, Inc. Carpen Company (Holding) Carrier CARSTAR Automotive Canada Cartier CASA Construcción Cass Information Systems Inc. Castle Metals Aerospace Cates Consulting Catholic Charities St. Louis Catholic Relief Services Causeway Capital Management, LLC CB&I CCA Global Partners CDW Canada CEDEI Ceiling Systems, Inc. Celanese Cementos Pacasmayo SAA Centacare Centene Corporation CenterPoint Energy Centex Homes Centocor Centocor Ortho Biotech Services, LLC Central Central Transport International, Inc. Centric Business Systems Cerner Corporation CEVA Logistics CGI Group Inc. CH2M Hill Charming Shoppes, Inc. Charoen Pokphand Foods PCL. Charter Charter Communications Cheesecake Factory, The Chemonics International CHEP Chevron Corporation CHIIC China Nuclear Power Engineering Company LTD Chong Pang CC Chronim
Chrysler Corporation LLC Chubb & Son Federal Insurance Group Church & Dwight Co., Inc. Cía. Industrial Nuevo Mundo S.A. Cía. Internacional de Seguros, S.A. Ciba (China) Ltd. Cigna Corporation Cintas Corporation Cisco Mexico, S.A. de C.V. Cisco Systems, Inc. Citi’s Operations and Technology CITI (Consumer and Corporate Center) Citi Markets and Banking Asia Pacific Citibank Citigroup Citrix City of Clayton, Missouri; The City of Des Peres City of New York Office of Management and
Budget City of New York, The City of St. Louis City of Stafford City of Woodburn CJ Clark, Schaefer, Hackett & Co. Clarkston Consulting Classified Ventures Clasus Clayton Capital Partners Clearlight Partners LLC Clerestory Consulting LLC Cleveland Clinic Foundation Clorox Clorox Company, The CME Group CMG Partners CNotes LLC Co-operative Group, The Coach Coaching and Consulting Coca-Cola Coca Cola FEMSA Cognizant Technology Colgate-Palmolive Company Colliers Turley Martin Tucker Collins Barrow Colonial Life Comareg Comcast Cable Communications

2009 Data Report Corporate Recruiters Survey
52 © 2009 Graduate Management Admission Council®. All rights reserved.
Comerica Comfort Shoe Specialists Commercial Resources, Inc. Commonwealth Fund, The Compañía Minera Antamina S. A. Computer People ConAgra Foods Lamb Weston ConAgra Foods, Inc. Conexant Systems Inc. Confecciones Textimax S.A. Conforama Connect Logistics Connektia ConocoPhillips Consolidated Electrical Distributors Constant Contact Constellation Brands, Inc. Constructora ANG S.A.C. Consultoría en Desarrollo Empresarial Consumer Reports Continental Airlines, Inc. Continental Properties Company, Inc. Continuum Health Partners, Inc Conway MacKenzie & Dunleavy Cook Medical Cool Earth Solar Cooper A. Consulting Cooper Industries Coors Brewing Company Core Capital Management, LLC. Cormark Securities Inc. Cornerstone University Professional and Graduate
Studies Corning Incorporated Coro Leadership Center – St. Louis CORPAQ Corporación Infarmasa Corporate Value Associates Corporation for a Skilled Workforce Cortal Consors Country Foods Countrywide Financial CPM Group CQ University CRA International Crave Entertainment Group, Inc Credit Agricole Asset Mgnt Alternative Invest Credit Suisse First Boston Credit Suisse Group Credit Suisse USA
Cree, Inc. Critical Outcome Technologies Inc. (COTI) Critical Path, Inc. Crocs Crossborder Coaching Crown Equipment CSAV CSC Consulting Group CTMT CTPartners CTS Cummins, Inc. CUNY Institute for Software Design and
Development (CISDD) Curry Company Executive Search Curtis Boyer Racing Cushman & Wakefield, Inc. D&B D.B.E. Service Finance D.F. King & Co., Inc. Daiichi Sankyo, Inc. Daimler Daley Group Danaher Corporation DANONE Darden Restaurants Data-Tronics Corp. Davenport Hotel and Tower, The David Fockler & Associates., Inc. Davidson Companies Davis Langdon & Seah International DBS Bank Ltd dCap Advisors Decathlon Del Monte Foods DeLap White Caldwell & Croy, LLP Delaware Consulting Dell, Inc. Delo Logistik Deloitte Deloitte & Touche Deloitte & Touche LLP Deloitte Australia Deloitte Consulting Deloitte Consulting, LLP Deloitte Consultores Deloitte Denmark Deloitte Luxembourg Deloitte Services LP Delta Air Lines, Inc.

Corporate Recruiters Survey 2009 Data Report
© 2009 Graduate Management Admission Council®. All rights reserved. 53
Delta Partners Group Denberg & Low, PA Dendrite International Department of the Navy – FMH Dept of Education (Qld), Australia DePuy Spine, Inc. Design Forum Deutsche Bank Deutsche Lufthansa AG DevEx DexCom DHL DHL International GmbH DHL Logistics Diageo Dial/Henkel of America Diamond Management and Technology
Consultants Diesel USA Digitex DirecTV Group, Inc. Discover Financial Services, LLC Discovery Insititute Disneyland Resort Ditas Dogan Dixon Hughes DnB NOR Doeren Mayhew Dofasco (ArcelorMittal) Dong Energy Dow Chemical Company, The Dow Corning Corporation Doxus DRA Advisors, LLC Dreyer’s Grand Ice Cream Inc. DSB International Dstl DTE Energy Company DTN Duff & Phelps B.V. Duff & Phelps, LLC dunnhumby DunnhumbyUSA DuPont Dyanet Inc. e+ Healthcare LLC Eagle Bank & Trust Company of Missouri Eastman Chemical Company Eaton Corporation Ec-red
ECADE ECG Management Consultants EchoStar Communications Economy League of Greater Philadelphia Ecount Eczacibasi Girisim Pazarlama Eczacibasi Ilaç Editrice La Stampa Edmunds Inc. EDP World, Inc. EDS Corporation Education Pioneers Edward Jones Edwards Executive Search Edwards Lifesciences Corp. Effective Brands Efficient Capital Management, LLC EGASA XXI, S.A. Eisner LLP EKS&H El Paso Corporation Electrificadora Del Caribe S.A. E.S.P. Electrocomponents Plc Electrolux Professional North America Eli Lilly & Company Elinvar Elsevier B.V. Embarq Emerson Emerson Climate Technologies Emerson Electric Co. Emerson Network Power Empresa Editora El Comercio Encore Capital Group, Inc. ENSCO International Entegra Power Group LLC. Enterprise Rent-A-Car Entrepreneurs Edge, The Environmental Working Group Epilady USA, Inc. Equifax Inc. Ergon Energy ERICO Ericsson Global Ericsson, Inc. Ernst & Young Ernst & Young LLP Ernst & Young Transaction Advisory Service Essential Entertainment Ethicon, Inc. – a Johnson & Johnson Company

2009 Data Report Corporate Recruiters Survey
54 © 2009 Graduate Management Admission Council®. All rights reserved.
Euler Hermes Kreditforsikring Eurocopter Euromonitor International Europ Assistance Europraxis Atlante, S.L. Evalueserve Evergreen Investments Everis Spain, S.L. Executive Financial Group Exel Exervio Management Consulting Expectra Experian Experian Consumer Direct Experience Engineering Express Scripts, Inc. Expressor Software Corporation ExxonMobil Corporation Fanscape Farm Credit Farm Credit Financial Partners, Inc. Farmers Insurance Group Faruk FASA FCF Fox Corporate Finance GmbH Federal-Mogul Corporation Federal Aviation Administration Federal Bureau of Investigation (FBI) Federal Express Corporation Federal Home Loan Bank of New York Federated Insurance Company FedEx LAC Division Fellows Group, The Fender Fichtner India Fidelity Consulting Group Fidelity Investments Fifth Third Bancorp Fifth Third Bank Finansbank Fiorio Management First Annapolis Consulting First Book First Citizens Bank First REIT First Securities Fisher Scientific Fitch Ratings Five Sprockets, Inc. Five Star Bank
Fluor Corporation FMC Corporation FMC Technologies Food for the Hungry For Love of Children Forca Ford Motor Company – Information Technology Ford Motor Company Forte (Group) International Inc. Forum One Communications Corporation Foster Mckay Group Foundation for International Community
Assistance Fountainhead Staffing Fox College Sports Fox Lawson & Associates LLC FOX Sports Detroit FPT Telecom Frank, Rimerman & Co. LLP Franklin Templeton Investor Svcs, LLC Free Software Foundation Freedom From Hunger Freeman Health System Friedrich Software Resources, LLC Frito-Lay North America, Inc. Frito-Lay, Inc. FTI Consulting Fundación temaiken Fundesem Business School Fur-Get Me Not Future Group G & K Services G.T.H. Peru S.A. G4S Peru Sac Galloway Group Gallup Organization Gardiner Thomsen, Certified Public Accountants Gartner, Inc. Gaviota Simbac GCG Financial GCHQ GE Commercial Finance Fleet Services GE Healthcare GE Real Estate Europe Geico Gen-Probe General Electric Company General Electric International General Mills, Inc. General Motors (Thailand) Ltd.
Corporate Recruiters Survey 2009 Data Report
© 2009 Graduate Management Admission Council®. All rights reserved. 55
General Motors Corp. – New York Treasurer’s Office
General Motors Corporation Generics [UK] Limited Genesco Genesis 10 Genesis Advisors Genus Capital Management Genworth Financial, Inc. Geolog SA Geomagic Georgia Pacific GEOTUR Germaine De Capuccini GFK Mode Ghostly International GIC GigaTech Consulting GlaxoSmithKline Global Association of Risk Professionals Global Crossing Global Reach Internet Productions, LLC Global Recovery Group Global Source Mfg. Global Sources Global Tech Services GMAC-General Motors Acceptance Corporation GMAC Financial Services GMD S.A. GMP Gobi Partners Goedecke Company Gogi Design Golding Capital Partners Goldman Sachs & Co. Goodyear Tire & Rubber Gorton’s Seafoods Government of Canada GPI Group Grace Construction Products Graduate Leverage Grainger, Inc. Grandwood Capital LLC Graniou Grant Thornton, LLP Grap Consulting Graphic Packaging International Great-West Life and Annuity Insurance Company Great American Insurance Group
Greater Newark Business Development Consortium, Inc.
Greater Spokane Incorporated Grimco, Inc. GRISI Se Natural Groupe Genoyer Growthink Grünenthal Grup Pons Grupo Eulen Grupo TMM Grupo Trebol Celima Roca GSB Capital GTC Guardian Life Insurance Company of America,
The Gucci America, Inc. Guidestone Financial Resources Guitar Center, Inc. Gumlink A/S Gund Company, The; Inc. Gustin Partners H.J. Heinz Company, LP Haivenu Tours Hajoca Corporation Halliburton Hamilton Lane Advisors Hanesbrands Inc. Harbor Behavioral Healthcare Harris Williams & Co. Hartford Financial Services Group, The Harvard Pilgrim Health Care Hasbro Haskins Steel Co., Inc. Hay Group Hays Hazelwood Power HCL Australia Services Pty Limited Health Management Associates, Inc. Health Support Services Healthcare Communications Group HealthClaim Review (a Considine & Associates
Company) Healthwise Incorporated Healy Hunt Heinz Heliopolis Henkel Henry Ford Community College Henry Schein

2009 Data Report Corporate Recruiters Survey
56 © 2009 Graduate Management Admission Council®. All rights reserved.
Herron Todd White Hershey Hershey Company, The Hewitt Associates LLC Hewlett-Packard (HP) Türkiye Hewlett-Packard Company Hewlett-Packard Development Company, L.P. Hewlett-Packard Teknoloji Cozumleri Ltd. Sti. Highway Technologies, Inc. Hilti Hilti France Hilti Japan Hines Hire & Trust Hitachi Consulting HNI Corporation Hoffman-La Roche Inc. HOK Group, Inc. Hollywood Video HomeStar Painting Honeywell Honeywell International Inc. Hospira, Inc. Hoteles Argentinos SA – Sheraton Libertador
Hotel Howard & Co., LLP Howe & Rusling Inc. HRnet One Pte Ltd HSBC HSBC Mexico HSM, Inc. Hudson Humana Humes & Barrington, LLP Huntsman Huxley Associates Hygieia Biological Laboratories Hyundai Motor Manufacturing Alabama, LLC I Did Better I Search Worldwide I. Salsman PR, LLC Ibexi IBM Belgium nv IBM Canada Ltd. IBM China IBM Consulting IBM Corporation IBM Global Services IBM UK IBM United States
ICAEW—institute of chartered accountants in England and Wales
ICAP Human Capital Consultants ICF Consulting ICF Consulting Associates, Inc. Ideal Industries, Inc. IESE Business School IHG IIE Latin America IKEA Illuminera Strategic Market Research Consultancy ILM Professional Services IMAS IMC Chicago IMPACT Group IMS Consulting InBev InBev NV Independence Blue Cross INDITEX IndyMac Bank Ineum Consulting InfiLaw System, The Information Gateways Inc. Infosys Consulting ING – US Financial Services ING Direct ING Group Ingersoll-Rand Company InnovaTek, Inc. Insight Inspiration Consulting Institute for Competitiveness and Prosperity Integra Telecom Intel Corporation Interbrand China Intercasting Internal Revenue Service (IRS) International Amateur Sports Inc. International Biometric Group International Game Technology International Link Recruitment Services International Paper Company International Rescue Committee Intesa Sanpaolo InTheAirNet LLC Intrinzic Marketing and Design Inc. Intuitive Surgical Invitrogen Corp. Irdeto

Corporate Recruiters Survey 2009 Data Report
© 2009 Graduate Management Admission Council®. All rights reserved. 57
Irvine Company ISGN IST Plus Istithmar World Itesm Campus Sonora Norte IXE J. Cain & Co. J.B. Hunt Transport Services, Inc. J.D. Power & Associates Jacobson Companies, Inc. Jaeger-LeCoultre, Richemont Group Janssen Ortho McNeil Pharmaceutical Jarden Corporation Jet Video Services Inc. Job Centres Hellas SA John Deere John Hancock Financial Services John L. Underwood Company, Inc. Johnson & Johnson – Istanbul Johnson & Johnson Johnson & Johnson Australia Johnson & Johnson Family of Companies Johnson & Johnson Global Johnson & Johnson, Personal Products Company Johnson & Johson Espagne Johnson Controls, Inc. Joinstock investment company NobleCapital JPMorgan Chase & Co. Kaiser Permanente Kaltim Prima Coal Kamsky Associates Kapelusz Editora Karmann USA, Inc. Katzenbach Partners LLC KDHX Community Media Kellogg Company Kellogg NA Co. Kemin Industries, Inc. Kendle International Inc. Kenrich Group LLC, The Keuka College KeyBank Real Estate Capital KeyCorp Keyspan KForce Professional Staffing – Executive Search
Firm KHDA Kiesling Associates, LLP Kiewit Energy – Houston Kilpatrick Executive Search
Kimberly-Clark Corporation Kimberly Clark – Latin American Operations Kimmel & Associates Kimpton Hotels and Restaurants Kinetix King County Kingland Systems Corporation Kings Bay YM-YWHA KLA-Tencor Kline Hawkes & Co. KMD Knob Noster R8 School District Kohler Co. Kopali Organics Koplar Communications International Kordsa Global Korn/Ferry International KPMG LLP Kraft Canada Inc. Kraft Foods Kreischer Miller Kroger Company, The Kuehne + Nagel Ltd Kurt Salmon Associates Kurt Salmon Associates (KSA) L’Oreal (Thailand) Ltd. L’Oreal Switzerland L. J. Altfest & Co., Inc. L.E.K. Consulting La Tienda LaBarge Products, Inc. Laboratorios Poen Laboratorios Raffo Laboratorios Stiefel Lafarge LAKO Performance Group Lamitech LAN Airlines Land O’Lakes, Inc. Landscentret Langley Search and Selection Lanier Parking Systems Largent & Associates Larson Allen, LLP LaVERDAD Marketing & Media Lazard Middle Market League, The Lear Corporation Lee Hecht Harrison LEGO Group

2009 Data Report Corporate Recruiters Survey
58 © 2009 Graduate Management Admission Council®. All rights reserved.
Lenati Lennox International LG Electronics LG Electronics Mexico Liberty Mutual Group Liberty Mutual Insurance Company Liberty Mutual Insurance Group Liberty Property Trust Lima Caucho S.A. Limited Brands Lincoln International LLC Linde Lindo Systems LINK Finanzas LJ Wine Products, Inc. Local Initiatives Support Corp. LockeBridge LLC Lockton Companies, Inc. Lone Star New Markets LP Los Angeles Community College District Loughlin Meghji + Company Lowe’s Companies, Inc. Lowe Worldwide LPK Lucas Group Lux Research Luxottica Group Luz del Sur LVMH M&T Bank Corporation Macquarie Group Limited Magma Leasing Management Planning, Inc Manhattan GMAT Manpower Manpower Professional CARD Manpower S.A. Manufacturing Resource Professionals Manulife Financial Maritz Inc. MarketBridge Corp. marketRx Marriott International, Inc. Marrone Organic Innovations Mars & Co. Mars North America Marsh & McLennan Martin Investment Management, LLC Martinez US Customs Brokers/Bordertec Inc. Masco Corporation
Mason Street Advisors Mass Mutual (First Financial Group) Massachusetts Convention Center Authority MasTec, Inc. MasterCard International MasterCard, Inc. Mattel, Inc. Maxim Maycar SA McAfee, Inc. McBee Associates, Inc. McCain Foods Limited, Inc. McCormack & Farrow McDonalds Corporation MCG Engineering McGraw-Hill Companies, The McKesson Corporation McKinsey & Company Mead Johnson & Company Media Genesis Media Intelligence MedImmune Medtronic, Inc. Meijer MERC Partners Limited Mercado Salarial Mercer Mercer Consulting Merck Merck & Co., Inc. Merck & CP., Inc. Meredith Mergis Group, The Meridian Consulting International Merit Solutions, Inc. Merrill Lynch & Company, Inc. Metalloinvest-Steel MetLife MFS Investment Management MHT Partners, LP Michael Brandstetter & Associates Microsoft Corporation Midwest Family Broadcasting Miles Technologies Miller Brewing Company Miller Consulting Services Milliken & Company Mind Fire Inc. MindTree Consulting Ministry of Finance (MOF) Vietnam

Corporate Recruiters Survey 2009 Data Report
© 2009 Graduate Management Admission Council®. All rights reserved. 59
Missouri Botanical Garden (MBG) Mitre Corp. MLT MMC Group Moark Modern Holdings Incorporated Modern Woodmen of America Molten Group Momentum Market Intelligence Moneta Group, LLC Mongolian Stock Exchange Monitor Group Monsanto Company Montagu Newhall Associates, Inc. Morey’s Piers Morgan Hunt Group Morgan Joseph Morgan Stanley Morris & Associates, Inc. Moss Adams, LLP Mothers Work, Inc. Motorola, Inc. Mount Sinai Medical Center MPM Engineering Mubea North America Muehlstein Municipalidad de Miraflores Muscatine Foods Corporation Museum Of Modern Art Moma MV Transportation, Inc. MySpace.com India NAB National Alliance for Public Charter Schools National City Corporation National Fuel National Kidney Foundation, Inc. National Multiple Sclerosis Society – Georgia
Chapter National Oilwell Varco National Ventures Nationwide Nationwide Mutual Insurance Navigant Consulting, Inc. NB Web Express NCR Corporation NCS Pearson Nebraska Book Company (NBC) Neighborhood Housing Services of Chicago NeoStrata Company, The Nestle-Purina
Nestlé Nestle USA, Inc. Net Impact NetEffects Inc. Network Liquidators, Inc. NetZero, Inc. Neumann International AG. New England Financial New Teacher Project, The New York Life Insurance Co. News 163 News America Marketing Newsource Bell NIH Office of Technology Transfer Nike, Inc. NISA Investment Advisors, L.L.C. NorCal Produce Nordson Corporation Norfolk Southern Corp. Nortel Northern Technologies International Corp. Northern Trust Corporation Northside Cardiology Northstar Travel Media, LLC. Northwest Airlines, Inc. Northwestern Mutual Northwestern Mutual Financial Network Northwestern Mutual Life Insurance Company,
The Norton Novartis Novartis Animal Health US Inc Novo Nordisk Novogradac & Company LLP Novozymes Nubody’s Fitness Centres NuStar L.P. Nutraceutical nxtMOVE NYC Department of Consumer Affairs NYC Department of Health and Mental Hygiene NYC Department of Small Business Services NYC Office of Labor Relations NYC Office of Management and Budget NYS Department O’Neal O-I Observer Alternative Investments, LLC (OAI) Occasions, Inc. Ocean Tomo, LLC

2009 Data Report Corporate Recruiters Survey
60 © 2009 Graduate Management Admission Council®. All rights reserved.
OCTFCU OECD OEPS Office of Government Commerce (OGC), The;
UK OgdenBancShares Inc. Ohio University Olin Brass Olive Group OmniCapital Group LLC ON Semiconductor Corporation OnCURE Medical Corp One-On-One Marketing Inc. One Acre Fund One Point Three Limited OneChicago Onyx Pharmaceuticals Opera Solutions LLC Opera Solutions UK Opus West Oracle Corporation Singapore Pte Ltd Oracle Retail Orc Software Organización Radial Olimpica Oriflame Original ORIX USA Osborn & Barr. Oticon A/S Otokoç Outsource Partners International Overseas Private Investment Corporation Owens Corning Ozburn-Hessey Logistics, LLC Pacific Alternative Asset Management Company Pact Padbury Sky Limited Páginas Amarelas Panda Restaurant Group Panduit Corporation Panera Bread Paragon Solutions Group Inc. Parker & Lynch Parks Associates Partners Group Paul Hynes/Burns Advisory Group Payless ShoeSource Peabody Energy Peachtree Settlement Funding Pearl Meyer & Partners
Pelican Life Science People’s Trust Insurance Company People Search PepsiCo Beverages International PepsiCo International PepsiCo QTG PepsiCo, Inc. Performance Food Group Permal Group, Inc Perot Systems Persianas Persax, S.A. Peter Brett Associates LLP Petrinovich Pugh & Company, LLP Petroperú S.A. Pew Forum on Religion and Public Life, The Pfizer Canada Pfizer, Inc. PFK Inc. PharmaVoxx Phasient Learning Technologies Philadelphia Gas Works Philip Morris International Management SA Philip Morris Sabanci Philips Philips Electronics Philips International Nv Phillips Phoenix Marketing International Pilgrim Software, Inc. PIMCO Pine River Capital Management LP Pioneer Hi-Bred Piper Jaffray & Co. Polaris Industries Polaris World Portrans S.A. Positive Coaching Alliance Positive Energy Potomac Tutors Powder Springs Insurance PPG Industries Pratt & Whitney Praxair Services Inc. Praxair, Inc. Precision Practice Management PricewaterhouseCoopers PricewaterhouseCoopers LLP PricewaterhouseCoopers UK Princeton Review, The Principal Financial Group
Corporate Recruiters Survey 2009 Data Report
© 2009 Graduate Management Admission Council®. All rights reserved. 61
Private Wealth Management Procter & Gamble Progressive Insurance ProHR international Project House Project Professionals Search Group Promigas S.A. E.S.P. Protex Technologies Protiviti ProVisions, LLC PRTM Management Consultants Putnam Investments PVS Chemicals Inc. Qantas Quad/Graphics, Inc. Quaker Qualified Staffing Services Quality Assurance and Testing Center 3 Quicken Loans Qwest Communications R.J. Reynolds Tobacco Company R.V. Kuhns & Associates, Inc. Radio Rivadavia Ranko Group, The Raymond James Financial, Inc. RBC Capital Markets Realization Technologies, Inc. Reburn Partners Reckitt Benckiser Group Red Oxygen Red Zebra Broadcasting REDF Regan Campbell Ward Rehmann Group, The Reliance Mutual Fund Renaissance Capital Renfrew Center, The Renuance Aesthetic Care ResMed Resolve Group Resource Development Company Resurgent Capital Services RGA Architects Ricardo Strategic Consulting Richey, May & Co., LLP Right People USA RightThing, The RIS & Insulation Supply RK International Inc. RLG International
Road Runner Holding Co. LLC Robert Bosch LLC Robert Half Finance and Accounting Robert Half International Inc. Robert Walters Robodynamics Corp. Rock Bottom Restaurants, Inc. Rock Creek Group, The Rockwool A/S Roger CPA Review Rogers Wireless Express Rohm & Haas Colombia S.A. Roland Berger Strategy Consultants Roll International Corporation Rolls-Royce Rolls-Royce PLC Rood Research, Inc. Room to Read Rosemount Analytical Inc. Rosetta Rothschild, Inc. Royal Bank of Canada Royal Bank Of Scotland, The Royal Caribbean International RSM International RSM McGladrey RTE RubinBrown LLP Russell Investment Group Russell Reynolds Associates Rutgers University, The CRM Research Center Ruukki RYA Co. IT Consultants Ryder System, Inc. S.C. Johnson & Son, Inc. Sabanci Holding Sabre Airline Solutions Sabre Holdings Safeway Inc. Sagent Advisors Inc. Saint-Gobain Argentina Saint-Gobain Containers Salem Enterprise Solutions Samsung Samsung Electronics Mexico Sandisk Corporation Sanofi-Aventis Argentina S.A. Sanofi-Aventis Inc. Sansiveri, Kimball & McNamee, L.L.P. Santander Consumer Bank
2009 Data Report Corporate Recruiters Survey
62 © 2009 Graduate Management Admission Council®. All rights reserved.
Sanut SAP SAP AG SAP Asia Pte Ltd SAPO Sara Lee Corporation SAS Institute Inc. Savage Services Corporation SC&H Group SCA Americas Scheduline, Inc. Schering-Plough Corporation Schering Plough del Perú SAC Schlumberger Business Consulting Schlumberger Limited Schnall Advisory Services Schneider Schneider Electric (China) Investment Co. Ltd. SCI Consulting Group Scotia Capital Scotiabank Group ScottMadden, Inc. Scottrade, Inc. Seabury Group Seagate Technology LLC Sealed Air Corporation Sears Secretary of State Audits Division Segal Company, The Segula Technologies Seguros América SEI Select Leaders Self-Help for the Elderly Self Help Sellers, Richardson, Watson, Haley & Dunn LLP Serkin Public Relations Serpost S.A. Servicio de Administración Tributaria – SAT Servicios Administrativos Adecco Seymour & Associates Shakespeare Theatre Company Shared-Ideas Shaw Contract Group Shell Shell Exploration and Production Company Shell International Shell Oil Company Shell Pakistan (Pvt.) Ltd. Shell United States
Shepard Associates Sherwin-Williams Co. Shinsei Technology Services SHL Portugal Shockfish SA ShopKo Stores Inc. SHUAA Capital Siam City Cement, PCL Sibur Siegfried Group, LLP Siemens Siemens Canada Limited Siemens Management Consulting Siemens Medical Solutions USA, Inc. Sigma-Aldrich Co. Sila Solutions Group Simply Ideas, LLC Sindicatum Carbon Capital Singapore Tourism Board SiRF Technology, Inc. Sixto Recruiting SK C&C SK Telecom Skanska Smart Connections Inc. Smarthome, A SmartLabs Inc. Company SMS Management and Technology SMUD SN Servicing Corporation Société Générale (Canada) Societe Generale Singapore Solatube International, Inc. Solomon Islands College of Higher Education Solon Sonoco Sony Electronics, Inc. Sony Pictures Sony USA Southern California Edison Sparkle Sign Co. Speedway SuperAmerica Speedy Spencer Gulf Rural Health School Spilman, Hills & Heidebrink, Ltd. Spinnaker Energy Spinter Spokane Industries Spokane Valley Chamber of Commerce Spokesman-Review, The Sports Travel Plus

Corporate Recruiters Survey 2009 Data Report
© 2009 Graduate Management Admission Council®. All rights reserved. 63
SPX Corporation SPX Corporation China SS&C Technologies, Inc. St. Louis Public Schools Staffing Solutions, Inc. Stamats Standard & Poor’s Corporation Standard Fruit de Honduras Stantec Inc. Staples Starbucks Coffee Company Stark Investments State Farm Insurance State of Oregon State of Queensland, The; Department of Main
Roads State Street State Street Global Advisors Staubach Company Steinbachs & Chapelle Chartered Accountants Stelton Steppingstone Foundation, The; Boston Sterling Savings Bank Stifel, Nicolaus & Company, Inc. STIHL Incorporated Strada Properties, Inc. Strategic Planning—Export and Investment
Development Stratego Consulting / Latin Top Jobs Stryker Corporation Stryker Orthopaedics Student Conservation Association Sun Microsystems, Inc. SunGard SunTrust Banks, Inc. SunTrust Robinson Humphrey SuperFlow Supplemental Staffing Susquehanna International Group Sutter Health Suva Private Hospital SVP Advisors SWIPCO Swiss Medical S.A. Swiss Re Swisslog Symantec Corporation Symcor Syngenta Syngenta Crop Protection AG
Sysco Food Service of Cleveland Sysco Food Services of Detroit Systegration, Inc. TAC Worldwide Companies Taco Bell – YUM! Brands, Inc. Tactical Global Management Taitra Talent Fishers Talentworks Inc. Tango Management Consulting, LLC Targanta Therapeutics Tauri Group, The Taylor-DeJongh TCF National Bank Teach For America, Inc. Teacher Retirement System of Texas Tech Data Corporation Technomic Asia Techquity Capital Management LLC Techtronic Industries Tecnologia de Materiales Tecnositaf Tecoloco.com Tefeken Holding A.S. TEKsystems Telefonica Tellurex Corporation TELUS Tempo, S.A. Terasen Terex Terra Networks Perú, S.A. Terralliance Tesoro Therma Tru Doors Thomson Corporation Thomson Financial Thomson Reuters Thunderbird Learning Consulting Network ThuyDuong Investment JSC ThyssenKrupp Automotive Italia Tia Foundation, The TIBCO Software Inc. Time Out Chicago Titan Cement Co TLC For Kids, Inc. Toolbox.com Top-Co Total HR Solutions TOTTUS

2009 Data Report Corporate Recruiters Survey
64 © 2009 Graduate Management Admission Council®. All rights reserved.
TowerGroup Consulting Services Towers Perrin Toyota-Ricardo Pérez S.A. Toyota Motor Sales, U.S.A., Inc. Toys R US, Inc. Trading Technologies International, Inc. TrailBlazers Tranportes Modasa, S.L. Trans States Airlines Transcom Colombia S.A. Travel & Teach Travelers Companies, The Travelex TriZetto Group, Inc. True Value Company TrustWay Insurance Tudor Pickering Tudor, Pickering, Holt & Co., LLC Türk Henkel A.S., Istanbul Two Degrees, LLC TXU Energy Tyco International Tyson Deli, Inc. Tyson Foods, Inc. U-Haul International U.S. Air U.S. Department of Health and Human Services U.S. Department of State U.S. General Services Administration U.S. Government Accountability Office (GAO) UBS UBS Financial Services, PA UBS Financial Services Inc. UBS Investment Bank UGL Services UHS, Inc UHY Advisors, MO UHY Advisors, Inc. Ultimus, Inc. Ultra Electronics Maritime Systems Under Armour Underwriters Laboratories Inc. Unifrax Unilever Unilever Asia Pte Ltd Unilever HPC NA Unilever Pakistan United Airlines United Commercial Bank (UCB) United States Postal Service
United Stationers Supply Company United Technologies Corporation UnitedHealth Group Universal Truckload Services, Inc. Universidad Veritas University Directories University of Miami – Office of Special Programs
and Resource Strategy University of Notre Dame University Readers Univision Television Group Unum UOB Upromise Urban Outfitters, Inc. Urban Pathways, Inc. US Airways US Cellular US Department of Commerce US Government USA Truck, Inc. USG People Belgium USO of Missouri, Inc. UTC – United Technologies Corporation UTC Carrier UTC Power UTi Worldwide UTI Worldwide Group Valassis Valcon A/S Management Consultants Valsan Valspar Corporation Vancouver Coastal Health Vanguard Varde Partners, Inc. Vardetun Vault Veritas DGC, Inc. Verizon Verizon Wireless Vestas VF Corporation Victoria’s Secret Vilcom Properties VIP Community Services Virchow, Krause & Company Virtusa VisionPoint Marketing VistaPrint Vitric Media

Corporate Recruiters Survey 2009 Data Report
© 2009 Graduate Management Admission Council®. All rights reserved. 65
Vivid Marketing VMware Vnesheconombank Vogel Consulting Volk Optical, Inc. Vornado Realty Trust VQ Wealth Vulcan Materials W.W. Grainger, Inc. Wachovia Bank, N.A. Wachovia Securities Waddell & Reed Wagner, Eubank & Nichols, Llp Wal-Mart Stores, Inc. Walt Disney Company, The Wandering WiFi, LLC Warner Bros. Entertainment Inc. Warren Douglas Washington CORE LLC Washington Trust Bank Waste Management Waterstone Capital Management Watson Wyatt HK Ltd. Watson Wyatt Worldwide WAY2B WD-40 Web Direct Brands Inc. WebMD WebTrends WeChange Weeks WellPoint Wells Fargo & Company Wells Fargo Bank Wells Fargo Card Services, Inc Wentzville, Missouri City Government Western and Southern Financial Group Westport International Weyerhaeuser WGBH Whirlpool Corporation Whirlpool, U.S.A. Whit-Com Sales, Inc. Whitehorse Capital Partners, L.P. William Blair & Company, L.L.C.
William Penn University William Vaughan Company Willis Re Inc. Wilton Industries Wipro Technologies Wm. Wrigley Jr. Company Wolseley Wolverine World Wide, Inc. Wood Group World Wide Technology, Inc. World Wildlife Fund (WWF) WSP Civils Wyeth Xcel Energy Xerox Xerox del Perú S.A. Yahoo! Yeo & Yeo PC, CPAs and Business Consultants Young and Rubicam Yum! Brands ZAO “Datagroup” ZERO Zions Bancorporation Zirous Zook Dinon ZS Associates Zweig White Information Services, Llc ZymoGenetics
Companies listed in Russian and in Chinese: Дело Логистик ЗАО “Датагруп” ОАО “Визит” (Vizit) ООО “СОРГ” Центел 上海紫光机械有限公司 中国移动通信集团上海有限公司 今日资本 奥锐万嘉创业投资有限公司 远东国际租赁有限公司 TCL多媒体科技控股有限公司中国业务中心
Contact Information For questions or comments regarding the study findings, methodology, or data, please contact the GMAC Research and Development department at [email protected].
Authorship The following individual made significant contributions to the concept and design or analysis and interpretation of data and the drafting/revising of the manuscript for intellectual content:
Marina Murray, Manager, Applied Research, Research and Development Department, Graduate Management Admission Council (GMAC).
Acknowledgements Dr. Lawrence M. Rudner, Vice President, Research and Development, GMAC, manuscript review; Rachel Edgington, Director, Market Research and Analysis, GMAC, survey questionnaire development; Tacoma Williams, Coordinator, Research, GMAC, research and production support, Veronica Sinz, Research Publications Manager, GMAC, editorial services.
The following individuals provided expert advice and contributed to questionnaire development: Martine Plompen, Director, Knowledge Services Unit, EFMD; Christophe Terrasse, Project Advisor, EFMD; Joyce Rothenberg, Director Career Management Center, Vanderbilt Owen Graduate School of Management; Kip Harrell, Associate Vice President, Professional and Career Development, Thunderbird School of Global Management.
Special thanks go to the following organizations for contributing to the project success: • EFMD, an international membership organization, based in Brussels, Belgium, for the
expert advice of its staff, assistance with questionnaire and sample design; and efforts for increasing survey participation among business schools in Europe and worldwide.
• MBA Career Services Council, an active and growing professional association for individuals in the MBA career services and recruiting professions, for the expert advice of its staff, assistance with questionnaire and sample design, and efforts for increasing survey participation among business schools in the United States and worldwide.
GMAC extends sincere appreciation to business schools career management professionals who made this survey happen either by generously providing contact information for their employers to help develop a sample for the study or by designating their internal resources to administer the survey.
This survey would not have been possible without the graduate business student employers that contributed both time and information to the 2009 Corporate Recruiters Survey. Their participation in this extensive research ensures the continued availability of comprehensive statistics on the demand for business graduates.

© 2009 Graduate Management Admission Council® (GMAC®). All rights reserved.
No part of this publication may be reproduced, stored in a retrieval system, distributed or transmitted in any form by any means, electronic, mechanical, photocopying, recording or otherwise, without the prior written permission of GMAC. For permission contact the GMAC legal department at [email protected].
Creating Access to Graduate Business Education®, GMAC®, GMAT®, Graduate Management Admission Council®, and Graduate Management Admission Test® are registered trademarks of the Graduate Management Admission Council in the United States and other countries. American Express® is a registered trademark of American Express Company.