Corporate Presentation - Redington
23
Sep 2021 Corporate Presentation
-
Upload
khangminh22 -
Category
Documents
-
view
0 -
download
0
Transcript of Corporate Presentation - Redington

Sep 2021
Corporate Presentation
2
This presentation contains “forward looking statements” including, but without limitation, statements relating to
the implementation of strategic initiatives, and other statements relating to Redington India Limited’s future
business developments and economic performance.
While these forward looking statements indicate our assessment and future expectations concerning the
development of our business, a number of risks, uncertainties and other unknown factors could cause actual
developments and results to differ materially from our expectations.
These factors include, but are not limited to, general market, macro-economic, governmental and regulatory trends,
movements in currency exchange and interest rates, competitive pressures, technological developments, changes in
the financial conditions of third parties dealing with us, legislative developments, and other key factors that could
affect our business and financial performance.
Redington India Limited undertakes no obligation to periodically revise any forward looking statements to reflect
future / likely events or circumstances.
Disclaimer
MSCI DISCLAIMER STATEMENTTHE USE BY REDINGTON (INDIA) LTD OF ANY MSCI ESG RESEARCH LLC OR ITS AFFILIATES (“MSCI”) DATA, AND THE USE OF MSCI LOGOS, TRADEMARKS, SERVICE MARKS OR INDEX NAMESHEREIN, DO NOT CONSTITUTE A SPONSORSHIP, ENDORSEMENT, RECOMMENDATION, OR PROMOTION OF REDINGTON (INDIA) LIMITED BY MSCI. MSCI SERVICES AND DATA ARE THEPROPERTY OF MSCI OR ITS INFORMATION PROVIDERS, AND ARE PROVIDED ‘AS-IS’ AND WITHOUT WARRANTY. MSCI NAMES AND LOGOS ARE TRADEMARKS OR SERVICE MARKS OF MSCI.
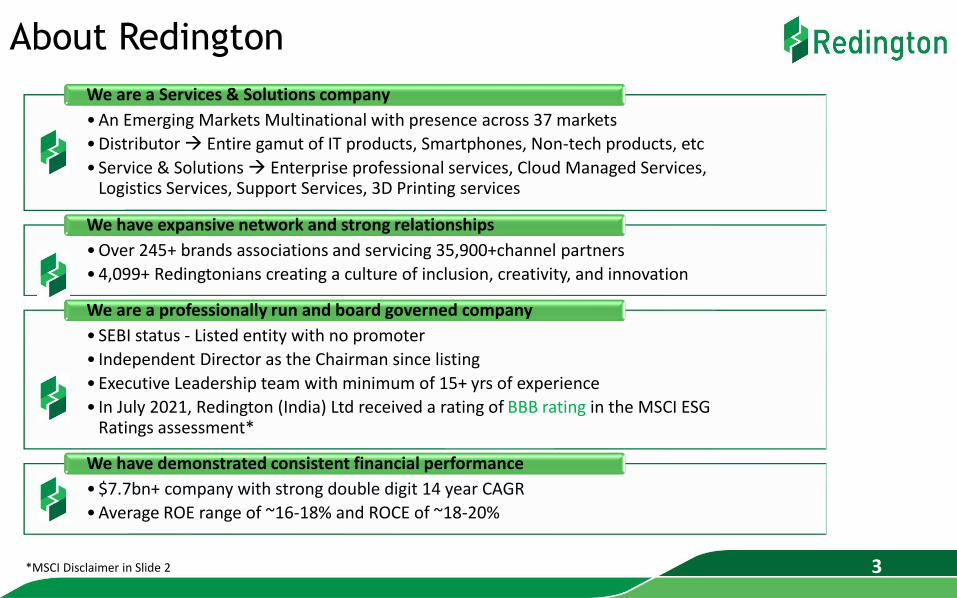
• An Emerging Markets Multinational with presence across 37 markets
• Distributor → Entire gamut of IT products, Smartphones, Non-tech products, etc
• Service & Solutions → Enterprise professional services, Cloud Managed Services, Logistics Services, Support Services, 3D Printing services
We are a Services & Solutions company
• Over 245+ brands associations and servicing 35,900+channel partners
• 4,099+ Redingtonians creating a culture of inclusion, creativity, and innovation
We have expansive network and strong relationships
• SEBI status - Listed entity with no promoter
• Independent Director as the Chairman since listing
• Executive Leadership team with minimum of 15+ yrs of experience
• In July 2021, Redington (India) Ltd received a rating of BBB rating in the MSCI ESG Ratings assessment*
We are a professionally run and board governed company
• $7.7bn+ company with strong double digit 14 year CAGR
• Average ROE range of ~16-18% and ROCE of ~18-20%
We have demonstrated consistent financial performance
About Redington
3*MSCI Disclaimer in Slide 2
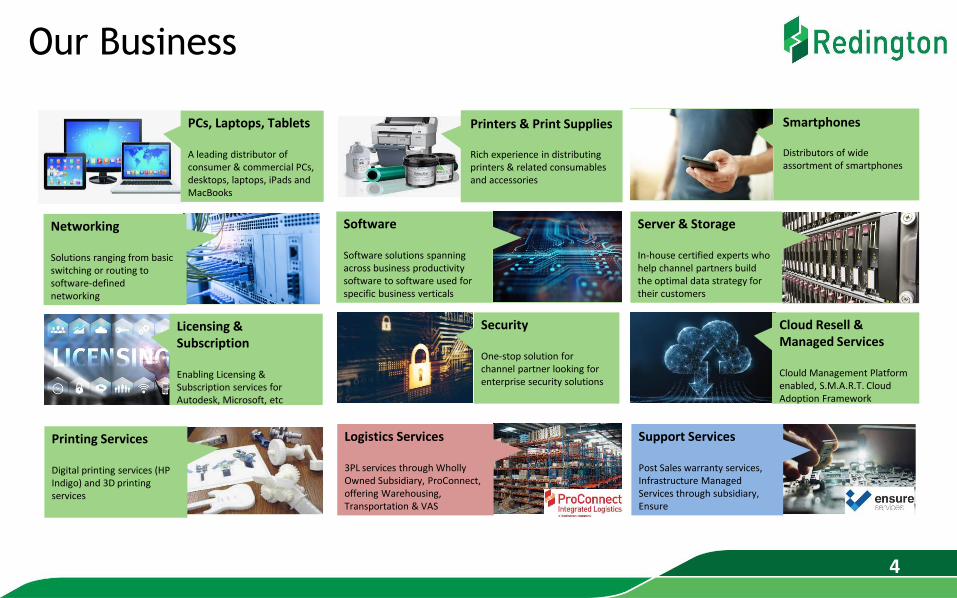
Networking
Solutions ranging from basic switching or routing to software-defined networking
Server & Storage
In-house certified experts who help channel partners build the optimal data strategy for their customers
Software
Software solutions spanning across business productivity software to software used for specific business verticals
Security
One-stop solution for channel partner looking for enterprise security solutions
Licensing & Subscription
Enabling Licensing & Subscription services for Autodesk, Microsoft, etc
Cloud Resell & Managed Services
Clould Management Platform enabled, S.M.A.R.T. Cloud Adoption Framework
Our Business
PCs, Laptops, Tablets
A leading distributor of consumer & commercial PCs, desktops, laptops, iPads and MacBooks
Smartphones
Distributors of wide assortment of smartphones
Printers & Print Supplies
Rich experience in distributing printers & related consumables and accessories
Support Services
Post Sales warranty services, Infrastructure Managed Services through subsidiary, Ensure
Logistics Services
3PL services through Wholly Owned Subsidiary, ProConnect, offering Warehousing, Transportation & VAS
Printing Services
Digital printing services (HP Indigo) and 3D printing services
4

Our Presence
Enviable “In country” presence in
37 markets
No.1 or No.2 position across all markets
“High potential” markets
Presence across product categories
Portfolio of Marquee brands
MIDDLE EAST8 markets
INDIA1 market
AFRICA22 markets
TURKEY1 market
SSA5 markets
5
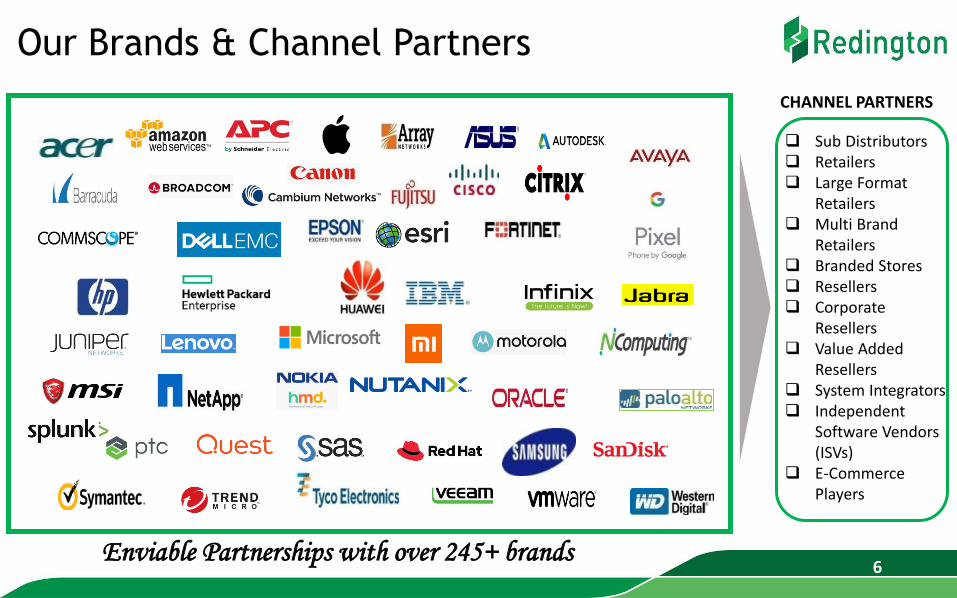
Enviable Partnerships with over 245+ brands11
6
Our Brands & Channel Partners
❑ Sub Distributors❑ Retailers❑ Large Format
Retailers❑ Multi Brand
Retailers❑ Branded Stores❑ Resellers❑ Corporate
Resellers❑ Value Added
Resellers❑ System Integrators❑ Independent
Software Vendors (ISVs)
❑ E-Commerce Players
CHANNEL PARTNERS

Our Board Of DirectorsIndependent Directors
Executive Directors
Prof. RamachandranProfessor, Corporate
Policy & StrategyIIM, Bengaluru
Keith WF BradleyEx.President,
Ingram Micro, North America
V. S. HariharanEx. Vice President,Hewlett-Packard,
Singapore
Raj ShankarVice Chairman
S V KrishnanWhole time Director
Non-Executive Directors
Chen, Yi-JuVice Director, Finance
Planning & MgmtSynnex Tech, Taiwan
Tu, Shu-ChyuanVP, Group Business
Strategy & DevelopmentSynnex Tech, Taiwan
B RamaratnamProfessional
Director
CHAIRMAN
Anita P BelaniSr Business & Human
Capital Leader
Rajiv SrivastavaAdditional Director
VICE CHAIRMAN
7
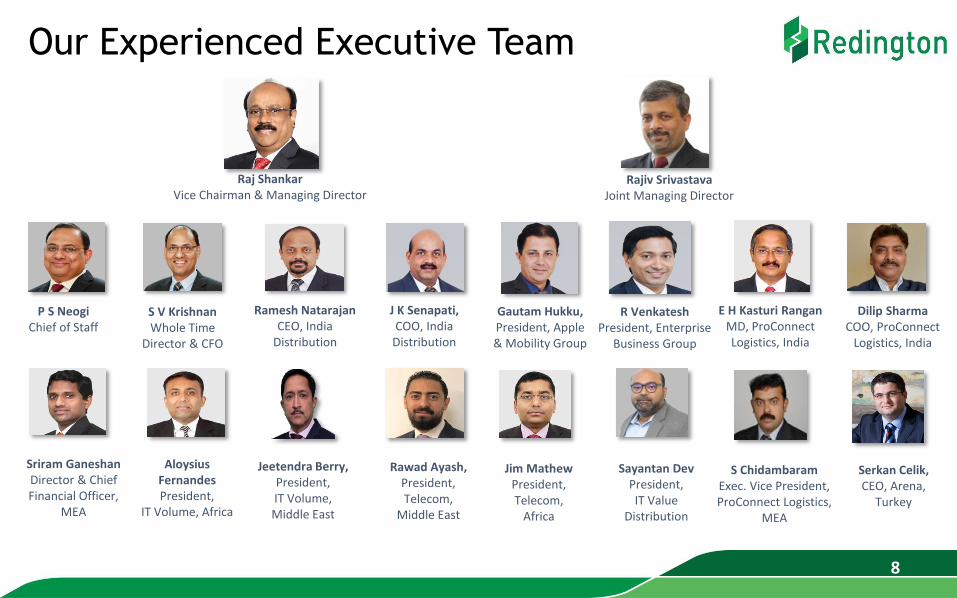
Our Experienced Executive Team
Raj ShankarVice Chairman & Managing Director
Serkan Celik, CEO, Arena,
Turkey
Jim MathewPresident,Telecom,
Africa
Ramesh NatarajanCEO, India
Distribution
J K Senapati,COO, India
Distribution
Gautam Hukku,President, Apple & Mobility Group
R VenkateshPresident, Enterprise
Business Group
Dilip SharmaCOO, ProConnect
Logistics, India
P S NeogiChief of Staff
Sriram GaneshanDirector & Chief Financial Officer,
MEA
S V KrishnanWhole Time
Director & CFO
S ChidambaramExec. Vice President,ProConnect Logistics,
MEA
Jeetendra Berry,President,IT Volume, Middle East
Rawad Ayash,President,Telecom,
Middle East
Sayantan DevPresident,IT Value
Distribution
Aloysius FernandesPresident,
IT Volume, Africa
E H Kasturi RanganMD, ProConnect Logistics, India
Rajiv SrivastavaJoint Managing Director
8

Our Shareholders
HDFC Mutual Fund
Fidelity Management & Research (FMR)
ICICIPru Life Insurance
Massachusetts Institute Of Technology Investment Management Company
Franklin Templeton Investments
The Vanguard Group
Ruane, Cunniff & GoldFarb
TATA Mutual Fund
33
Synnex
Mauritius
Ltd, 24.1%
Affirma
Capital, 14.2%Foreign
Institutional
Investors &
FPIs, 35.0%
Mutual
Funds, 10.9%
Others,
15.8%
9

Our Strategy

Technology Trends in the future
11
Ranking of the
technology trends
in the future by
Respondents
Note: GTDC commissioned Vation Ventures who surveyed and interviewed key constituents from distributors and their OEM vendor partners. The majority of studyparticipants – nearly 69% – possess greater than a decade of experience working with technology distributors. Those new to distribution also represented a sizable 10% of the respondents, and approximately 21% indicated between 5-10 yrs of distribution-related experience

Key Tech trends and Redington possibility
In 2022 : Global ICT spend growth at 5.5%, India $98Bn @ 6% and MENA $177Bn @ 4%.
12Source: Gartner, Ernst & Young, OliverWyman, Datatechvibe, ZDNet, BusinessWire, Mordor Intelligence, GlobalNewsWire, Redington
Technology Trends
Tech Growth CAGR % (2021-26)
What does it mean for
Redington
Hybrid Cloud 5G Cyber Security Digital economy Emerging Tech
• Adopt Emerging Tech for internal Automation
• Product distribution opportunities
• Solutions & Services offerings
• Tech Refresh projects to suit 5G environment
• Telecom, media & entertainment. Healthcare focus
• Increased device demand
• High growth in Security products & solutions
• Opportunity to scale Managed Security Services Practice (MSSP)
• Digital platform and Digital Payment Solutions
• Assess leverage of Turkey product Paynet for quick roll out
IND: 25.0%META: 17.2%
IND: 26.0%META: 15.3%
IND: 20.0%META: 7.9%
IND: 20.2%META: 25.0%
META: 10.4 M Subs (2021 Est.)
• Capability creation – competency and digital - required for high growth
• Focus on alliances, partnerships, ISV’s and service delivery
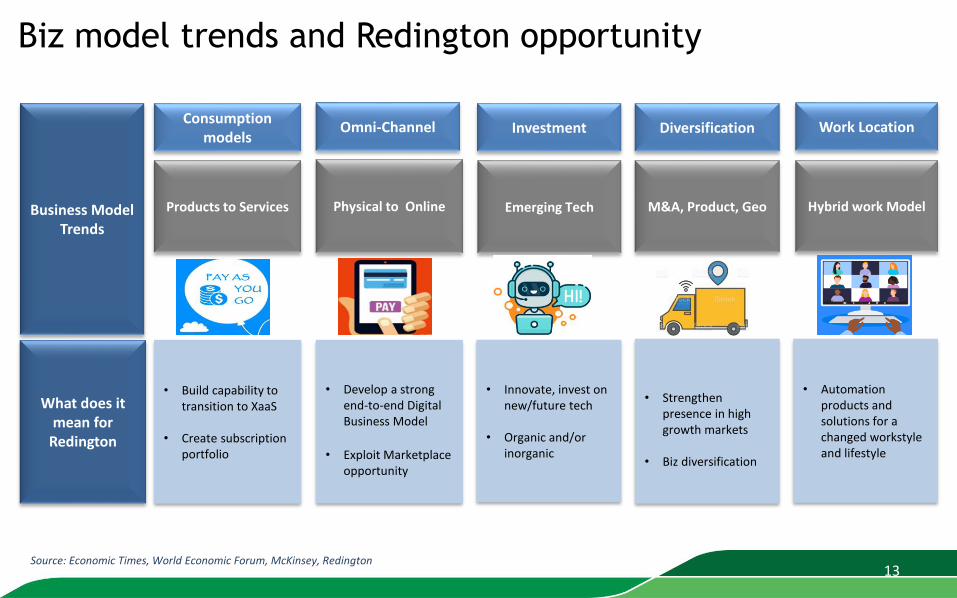
Biz model trends and Redington opportunity
Business Model Trends
What does it mean for
Redington
Products to Services Physical to Online Emerging Tech M&A, Product, Geo Hybrid work Model
• Strengthen presence in high growth markets
• Biz diversification
• Automation products and solutions for a changed workstyle and lifestyle
• Build capability to transition to XaaS
• Create subscription portfolio
• Develop a strong end-to-end Digital Business Model
• Exploit Marketplace opportunity
• Innovate, invest on new/future tech
• Organic and/or inorganic
Source: Economic Times, World Economic Forum, McKinsey, Redington
Consumption models
Omni-Channel Investment Diversification Work Location
13

Changing Distribution needs & our preparedness
Respondents
ranked the need
for the following
distribution go-to-
market services in
the future
✓✓ ✓
✓✓ ✓ ✓
✓ ✓ ✓✓ ✓
✓
✓Redington’s preparedness
14
Note: GTDC commissioned Vation Ventures who surveyed and interviewed key constituents from distributors and their OEM vendor partners. The majority of studyparticipants – nearly 69% – possess greater than a decade of experience working with technology distributors. Those new to distribution also represented a sizable 10% of the respondents, and approximately 21% indicated between 5-10 yrs of distribution-related experience
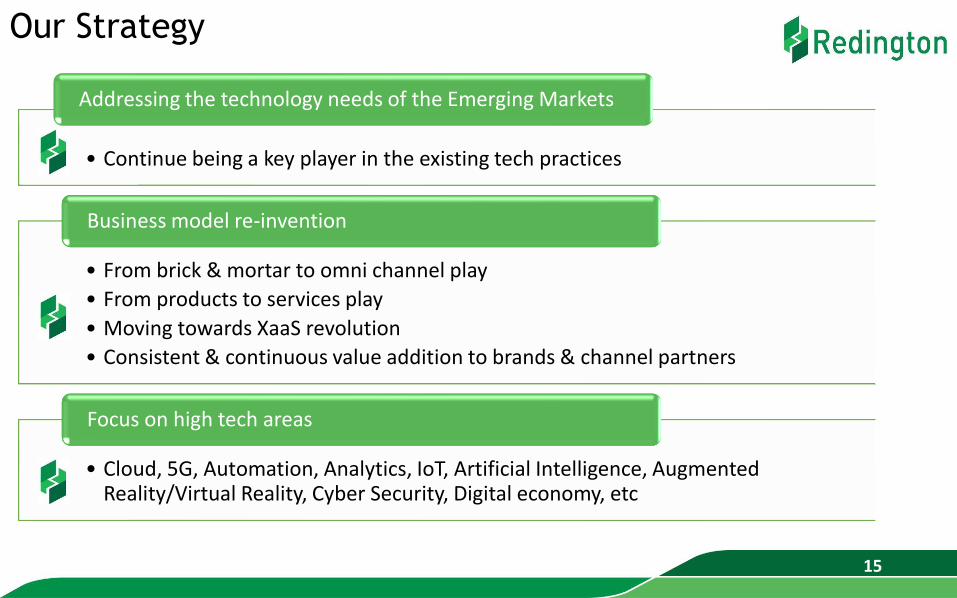
Our Strategy
• Continue being a key player in the existing tech practices
Addressing the technology needs of the Emerging Markets
• From brick & mortar to omni channel play
• From products to services play
• Moving towards XaaS revolution
• Consistent & continuous value addition to brands & channel partners
Business model re-invention
• Cloud, 5G, Automation, Analytics, IoT, Artificial Intelligence, Augmented Reality/Virtual Reality, Cyber Security, Digital economy, etc
Focus on high tech areas
15

Our growth vectors & objectives
16
GROWTH VECTORS KEY OBJECTIVES
Strengthening our Services & Solutions capabilities
Being No.1 distributor across products, brands & markets
Making Redington a digital organization
Being a Great Place to Work
Emerging as an ESG Leader

Financial Performance

REVENUE EBITDA PAT
*Post acquisition of Easyaccess Financial Services in FY 08 and Arena in FY 11. ^ Post sale of Easyaccess Financial Services
₹ in mn
86
,67
2
1,0
3,6
99
1,1
9,1
86
1,3
1,6
22
1,6
3,7
34
2,0
7,7
99
2,3
4,4
62
2,7
2,4
41
3,0
7,3
61
3,4
4,1
98
3,9
7,3
62
4,1
6,4
17
4,6
5,9
94
5,1
5,1
38
5,7
0,4
16
FY
07
FY
08
*
FY
09
FY
10
FY
11
*
FY
12
FY
13
FY
14
^
FY
15
FY
16
FY
17
FY
18
FY
19
FY
20
FY
21
1,9
85
2
,59
0
3,2
96
3
,65
7
4,7
17
6
,33
4
6,8
42
7
,19
6
7,6
19
8
,17
6
8,6
62
8,5
55
9
,61
9
10
,71
4
14
,39
0
FY
07
FY
08
*
FY
09
FY
10
FY
11
*
FY
12
FY
13
FY
14
^
FY
15
FY
16
FY
17
FY
18
FY
19
FY
20
FY
21
1,0
17
1,3
61
1,5
97
1,8
43
2,2
60
2,9
27
3,2
31
3,3
66
3,8
65
4,2
35
4,6
42
4,8
16
5,0
78
5,1
52
7,5
83
FY
07
FY
08
*
FY
09
FY
10
FY
11
*
FY
12
FY
13
FY
14
^
FY
15
FY
16
FY
17
FY
18
FY
19
FY 2
0
FY
21
CAGR 15%CAGR 15%CAGR 14%
Performance Since Listing
Surpassed Rs.500 bn milestone mark in Revenues
18
₹ in mn₹ in mn
FY21 PAT has been restated to provide RCS merger effect
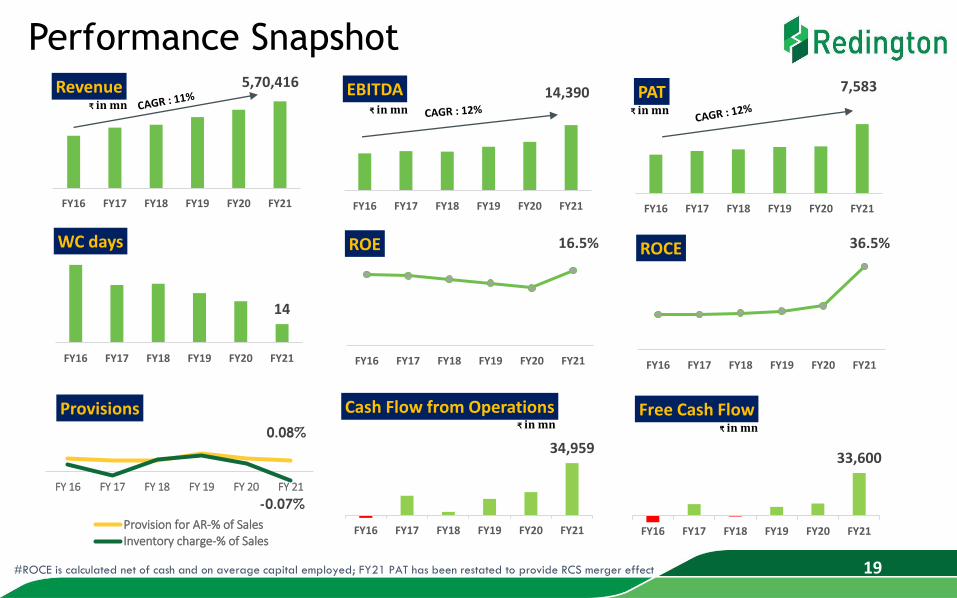
14
FY16 FY17 FY18 FY19 FY20 FY21
WC days
14,390
FY16 FY17 FY18 FY19 FY20 FY21
EBITDA
16.5%
FY16 FY17 FY18 FY19 FY20 FY21
ROE
7,583
FY16 FY17 FY18 FY19 FY20 FY21
PAT
36.5%
FY16 FY17 FY18 FY19 FY20 FY21
ROCE
34,959
FY16 FY17 FY18 FY19 FY20 FY21
Cash Flow from Operations
Performance Snapshot
33,600
FY16 FY17 FY18 FY19 FY20 FY21
Free Cash Flow
#ROCE is calculated net of cash and on average capital employed; FY21 PAT has been restated to provide RCS merger effect
5,70,416
FY16 FY17 FY18 FY19 FY20 FY21
Revenue
19
₹ in mn₹ in mn₹ in mn
₹ in mn ₹ in mn0.08%
-0.07%
FY 16 FY 17 FY 18 FY 19 FY 20 FY 21
Provisions
Provision for AR-% of SalesInventory charge-% of Sales

20
%
37
%
20
%
*53
%
32
%
60
%
FY 16 FY 17 FY 18 FY 19* FY 20 FY 21
67
79
88
10
0 11
0 1
26
FY 16 FY 17 FY 18 FY 19 FY 20 FY 21
10
.6
11
.6
12
.0
12
.8
13
.2
19
.5
FY 16 FY 17 FY 18 FY 19 FY 20 FY 21
EPS BOOK VALUE/SHARE PAYOUT TO SHAREHOLDERS*
In ₹ In ₹
*Includes both dividend & buybackNote: Bonus issue of 1:1 declared in FY22, in recognition of superior performance Note: Special dividend declared in FY21, in recognition of superior performance Note: Special dividend declared in FY17, to commemorate 10 years of listingNote: FY21 EPS has been restated to provide RCS merger effect
Value Creation for our Shareholders
CAGR 13% CAGR 13%Avg Payout @ ~39%
of profits earned
20
BONUS ISSUE 1:1
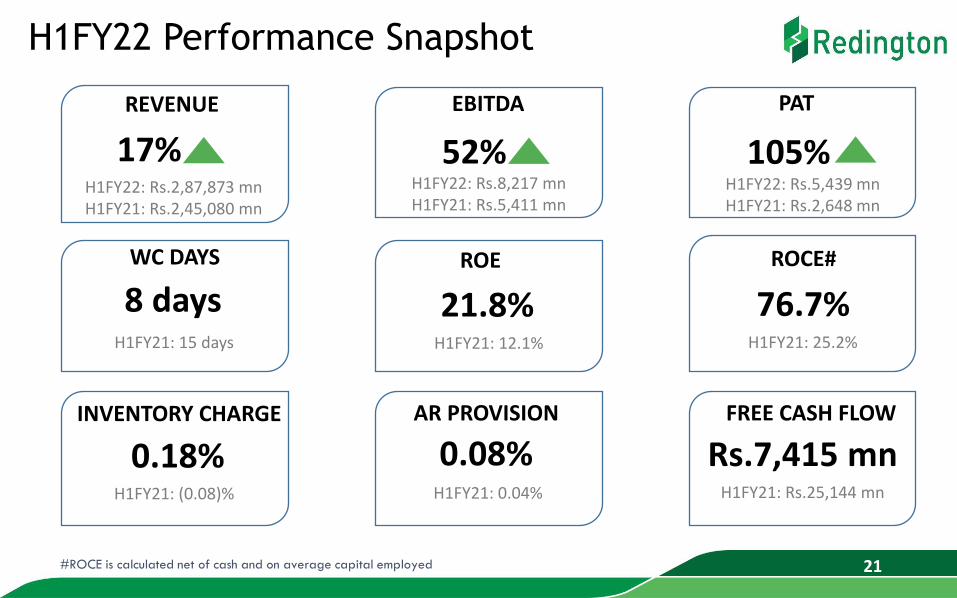
H1FY22 Performance Snapshot
#ROCE is calculated net of cash and on average capital employed
REVENUE EBITDA PAT
WC DAYS ROE ROCE#
INVENTORY CHARGE FREE CASH FLOW
17% 52% 105%H1FY22: Rs.2,87,873 mnH1FY21: Rs.2,45,080 mn
8 daysH1FY21: 15 days
H1FY22: Rs.8,217 mnH1FY21: Rs.5,411 mn
H1FY22: Rs.5,439 mnH1FY21: Rs.2,648 mn
21.8%H1FY21: 12.1%
76.7%H1FY21: 25.2%
0.18%
AR PROVISION
0.08%H1FY21: (0.08)% H1FY21: 0.04%
Rs.7,415 mnH1FY21: Rs.25,144 mn
21

22
Compliance OfficerM. MuthukumarasamyRedington (India) LimitedRedington House, Centre Point, Plot No. 11 (SP), Thiru. Vi. Ka. Industrial Estate, Guindy, Chennai 600 032https://www.redingtongroup.com
CIN - L52599TN1961PLC028758
Investor Contact
Sowmiya MSenior Manager – Investor [email protected]
IR Materials - https://redingtongroup.com/india/financials-and-reports/
CONTACT US

THANK YOU
23