Coronal mass ejections observed during the solar maximum mission: Latitude distribution and rate of...
8
JOURNAL OF GEOPHYSICAL RESEARCH, VOL. 89, NO. A5, PAGES 2639-2646, MAY 1, 1984 Coronal Mass Ejections Observed During the Solar Maximum Mission' Latitude Distribution and Rate of Occurrence A. J. HUNDHAUSEN, C. B. SAWYER, L. HOUSE,R. M. E. ILLING, AND W. J. WAGNER Hi•7h Altitude Observatory, National Center for Atmospheric Research Sixty-five coronal mass ejections have been identified in a systematic examination of white-light coronal imagesobtained betweenMarch and September1980 by the coronagraph/polarimeter flown on the solar maximum mission spacecraft. These ejections weremore uniformly distributed in position angle (or "projected, solarlatitude)than the similarevents observed during the Skylabmission in 1973-1974; 27% of the solar maximum missionmass ejectionswere centeredat positionsmore than 45 ø from the solar equator. The averagerate of occurrence of the observed massejections for the entire solar maxi- mum mission epoch, based on the assumptionthat one coronagraphimage per spacecraft orbit is sufficient for detection, was 0.9 ___ 0.15 per 24-hour day. Application of the samesamplingassumption to the Skylabdata setleads to a rate of 0.75 per 24-hourday and thus a change in this rate from the Skylab era (o.n the declining phase of sunspot cycle20) to solarmaximum mission (near the maximum of sunspot cycle 21) of only ,-,20%. 1. INTRODUCTION Coronal "transients" have been studiedintensively over the past decade,largely on the basis of observations made with spacecraft-borne coronagraphs(see the reviews by Gosling [1975], Hildner [1977], and MacQueen [1980]). These studies have establishedsome of the basic properties of transients, suggested relationshipsto other forms of solar activity (e.g., sunspots, flares, and eruptive prominences), and raised in- triguing questions as to their interplanetary manifestations and solar-terrestrial consequences. In particular, analysisof the coronal transients observed with the Skylab coronagraph in 1973-1974 led to the suggestionthat their rate of oc- currence was proportional to Zurich sunspot number and would thus change by a substantial factor over a sunspot cycle [Hildne;• et al., 1976]. The contribution of "coronal mass ejections"--those transientsthat involve outward motion of bright coronal material--to the total mass flux in the solar wind was roughly estimated at --• 3% for the Skylab epoch.A change in the rate of occurrence of massejections proportion- al to sunspotnumber would then imply that as much as 10- 16% of the solar wind might originatein mass ejectionevents near sunspot maximum [Hildner, 1977]. The instrument packageflown on the solar maximum mis- sion (SMM) spacecraft included a coronagraph/polarimeter designed to observe temporal changes in the structureof the solar corona (see MacQueenet al. [1980], Csoeke-Poeckh et al. [1982], House et al. [1981], Wagner et al. [1981] for detailed descriptions of this instrument and its operation). During the March to September1980 epoch of operation of the instru- ment, numerous massejections were detected. We report here the rate of occurrenceof coronal mass ejections and their distribution in projected solar latitude for the SMM epoch. The similarity of the SMM coronagraph to that flown on the Skylab mission permits comparison of the occurrence rates and latitude distributions for this classof coronal activity at two different phases in the l 1-year sunspotcycle.This com- parisonwill lead us to several tentativeconclusions regarding the significance of mass ejection events as sources of or pertur- bations of the solar wind. Copyright 1984 by theAmerican Geophysical Union. Paper number 3A1943. 0148-0227/84/003 A- 1943505.00 2. IDENTIFICATION OF CORONAL MASS EJECTIONS IN THE SMM CORONAGRAPH DATA SET The -,-30,000coronagraph images obtainedduring the 1980 epoch of SMM operations reveal a great variety of temporal changes in coronal structure.These changes ranged from the spectacular to the subtleand occurred on time scales of min- utesto months. We will concentrate here on a single class of such changes, "coronal mass ejections." We define a coronal mass ejectionto be an observable change in coronal structure that (1) occurs on a time scale between a few minutes and severalhours and (2) involvesthe appearance of a new, dis- crete, bright, white-light feature in the coronagraph field of view. This definition is virtually identical to that used by Munro et al. [1979] in their description of "mass ejection events" observed with the Skylab coronagraph ("... changes in apparent coronal structureon the time scaleof a few tens of minutesmdistinguished by increased brightness within the in- strumentsfield of view"). Use of a simple set of criteria to identify a classof coronal transients similar to that discussed by Munro et al. is greatly facilitatedby the basic similarity of the Skylab and SMM coronagraphs. This similarity is important in any comparison of Skylab and SMM coronal observations.In particular, the rates of occurrence of coronal massejections determinedwith these(or any) two coronagraphs can be comparedonly with some un- derstanding of the sensitivities of the two instruments in de- tectingsuchevents. The fieldsof view of the Skylab and SMM coronagraphs are similar, extending over heliocentric dis- tances from 1.9 to 6 Rs (solarradii) for Skylab and from 1.6 to between 4.8 and 6.5 Rs (the edges of a square field of view) for SMM. The stray light background in both coronagraphs is again similar,with slightlylower levels for the SMM corona- graph over most of the field of view. For both instruments, this background is an order of magnitudeor more below the observed brightness of the corona (including both electron and dust scattering) over the entire field of view and thus is not an important factor in determining the visibility of a coro- nal feature such as the bright region in a mass ejection. The background noise level in the SEC Vidicon systemused on SMM is about 3 timeshigher than on the film used by Skylab. However, this background level is significant only in the outer part of the field of view, beyond --•4 Rs. We thus expectthe optical and detector systemsof these two coronagraphsto 2639
-
Upload
independent -
Category
Documents
-
view
4 -
download
0
Transcript of Coronal mass ejections observed during the solar maximum mission: Latitude distribution and rate of...
JOURNAL OF GEOPHYSICAL RESEARCH, VOL. 89, NO. A5, PAGES 2639-2646, MAY 1, 1984
Coronal Mass Ejections Observed During the Solar Maximum Mission' Latitude Distribution and Rate of Occurrence
A. J. HUNDHAUSEN, C. B. SAWYER, L. HOUSE, R. M. E. ILLING, AND W. J. WAGNER
Hi•7h Altitude Observatory, National Center for Atmospheric Research
Sixty-five coronal mass ejections have been identified in a systematic examination of white-light coronal images obtained between March and September 1980 by the coronagraph/polarimeter flown on the solar maximum mission spacecraft. These ejections were more uniformly distributed in position angle (or "projected, solar latitude) than the similar events observed during the Skylab mission in 1973-1974; 27% of the solar maximum mission mass ejections were centered at positions more than 45 ø from the solar equator. The average rate of occurrence of the observed mass ejections for the entire solar maxi- mum mission epoch, based on the assumption that one coronagraph image per spacecraft orbit is sufficient for detection, was 0.9 ___ 0.15 per 24-hour day. Application of the same sampling assumption to the Skylab data set leads to a rate of 0.75 per 24-hour day and thus a change in this rate from the Skylab era (o.n the declining phase of sunspot cycle 20) to solar maximum mission (near the maximum of sunspot cycle 21) of only ,-, 20%.
1. INTRODUCTION
Coronal "transients" have been studied intensively over the past decade, largely on the basis of observations made with spacecraft-borne coronagraphs (see the reviews by Gosling [1975], Hildner [1977], and MacQueen [1980]). These studies have established some of the basic properties of transients, suggested relationships to other forms of solar activity (e.g., sunspots, flares, and eruptive prominences), and raised in- triguing questions as to their interplanetary manifestations and solar-terrestrial consequences. In particular, analysis of the coronal transients observed with the Skylab coronagraph in 1973-1974 led to the suggestion that their rate of oc- currence was proportional to Zurich sunspot number and would thus change by a substantial factor over a sunspot cycle [Hildne;• et al., 1976]. The contribution of "coronal mass ejections"--those transients that involve outward motion of bright coronal material--to the total mass flux in the solar wind was roughly estimated at --• 3% for the Skylab epoch. A change in the rate of occurrence of mass ejections proportion- al to sunspot number would then imply that as much as 10- 16% of the solar wind might originate in mass ejection events near sunspot maximum [Hildner, 1977].
The instrument package flown on the solar maximum mis- sion (SMM) spacecraft included a coronagraph/polarimeter designed to observe temporal changes in the structure of the solar corona (see MacQueen et al. [1980], Csoeke-Poeckh et al. [1982], House et al. [1981], Wagner et al. [1981] for detailed descriptions of this instrument and its operation). During the March to September 1980 epoch of operation of the instru- ment, numerous mass ejections were detected. We report here the rate of occurrence of coronal mass ejections and their distribution in projected solar latitude for the SMM epoch. The similarity of the SMM coronagraph to that flown on the Skylab mission permits comparison of the occurrence rates and latitude distributions for this class of coronal activity at two different phases in the l 1-year sunspot cycle. This com- parison will lead us to several tentative conclusions regarding the significance of mass ejection events as sources of or pertur- bations of the solar wind.
Copyright 1984 by the American Geophysical Union.
Paper number 3A1943. 0148-0227/84/003 A- 1943505.00
2. IDENTIFICATION OF CORONAL MASS EJECTIONS
IN THE SMM CORONAGRAPH DATA SET
The -,-30,000 coronagraph images obtained during the 1980 epoch of SMM operations reveal a great variety of temporal changes in coronal structure. These changes ranged from the spectacular to the subtle and occurred on time scales of min- utes to months. We will concentrate here on a single class of such changes, "coronal mass ejections." We define a coronal mass ejection to be an observable change in coronal structure that (1) occurs on a time scale between a few minutes and several hours and (2) involves the appearance of a new, dis- crete, bright, white-light feature in the coronagraph field of view. This definition is virtually identical to that used by Munro et al. [1979] in their description of "mass ejection events" observed with the Skylab coronagraph ("... changes in apparent coronal structure on the time scale of a few tens of minutesmdistinguished by increased brightness within the in- struments field of view"). Use of a simple set of criteria to identify a class of coronal transients similar to that discussed by Munro et al. is greatly facilitated by the basic similarity of the Skylab and SMM coronagraphs.
This similarity is important in any comparison of Skylab and SMM coronal observations. In particular, the rates of occurrence of coronal mass ejections determined with these (or any) two coronagraphs can be compared only with some un- derstanding of the sensitivities of the two instruments in de- tecting such events. The fields of view of the Skylab and SMM coronagraphs are similar, extending over heliocentric dis- tances from 1.9 to 6 Rs (solar radii) for Skylab and from 1.6 to between 4.8 and 6.5 Rs (the edges of a square field of view) for SMM. The stray light background in both coronagraphs is again similar, with slightly lower levels for the SMM corona- graph over most of the field of view. For both instruments, this background is an order of magnitude or more below the observed brightness of the corona (including both electron and dust scattering) over the entire field of view and thus is not an important factor in determining the visibility of a coro- nal feature such as the bright region in a mass ejection. The background noise level in the SEC Vidicon system used on SMM is about 3 times higher than on the film used by Skylab. However, this background level is significant only in the outer part of the field of view, beyond --•4 R s. We thus expect the optical and detector systems of these two coronagraphs to
2639
2640 HUNDHAUSEN ET AL.' CORONAL MASS EJECTIONS
produce images with very similar capabilities for detection of coronal features in the 2-4 R s range of heliocentric distances where most coronal mass ejections have been seen by both instruments. This expectation is borne out by visual compari- son of the coronal structure seen by the two instruments. Sev- eral differences in the operation of the two instruments (e.g., imaging of about one fourth of the corona in SMM rather than the whole corona in Skylab, and the greater "commanda- bility" of the SMM instrument in response to reports of local- ized solar activity) do exist and must be taken into account in comparing rates of occurrence of mass ejections.
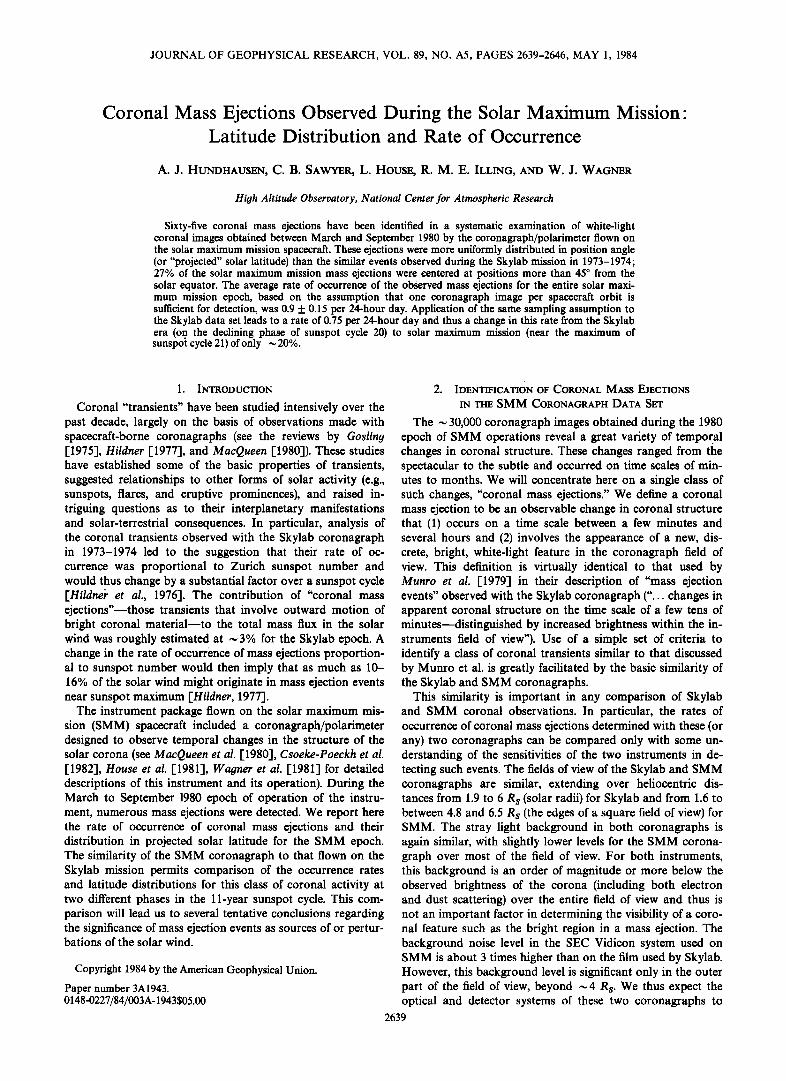
Figure 1 shows an example of a coronal mass ejection ob- served with the SMM coronagraph. This looplike event was seen over the north polar region of the sun on April 14, 1980.
The outermost loop was within the instrumental field of view on three coronagraph images (of the "quadrant" centered on the north solar pole) obtained during the daylight portions of two spacecraft orbits; its speed of outward motion could thus be determined to be 270 km s-•. The inner loop was observed to be emitting in H•z and thus may be material from a promi- nence.
A systematic examination of the set of white-light images obtained during routine operation of the SMM coronagraph has revealed several hundred distinct changes in coronal struc- ture on time scales of less than 1 day. A new discrete, bright feature appeared in the field of view in 65 of these identified changes; it is this group of events that satisfies the criterion stated above for coronal mass ejections and that will be the
Fig. 1. A coronal mass ejection observed by the SMM coronagraph on April 14, 1980. The axis of solar rotation runs from the upper left (north) to lower right (south) corner of the image; the dark sun-centered occulting disc has a radius of 1.6 R s .
HUNDHAUSEN ET AL.' CORONAL MASS EJECTIONS 2641
topic of this paper. In six of these, the bright feature was seen on a single image; in 59, the outward motion of the bright feature could be followed on a sequence of images and inter- pretation as mass ejection directly justified. We believe that this group of 65 events is comparable to the "mass ejection events" found in Skylab coronagraph data and described by Munro et al. [-1979]. Let us remind the reader, however, that these coronal mass ejections are but a small subset of all observable changes in the corona, and but • 20-30% of the changes are specifically identified in our systematic survey of the SMM data.
3. SAMPLING OF THE TRUE POPULATION
OF CORONAL MASS EJECTIONS
BY THE SMM CORONAGRAPH
Interpretation of the latitude distribution of the mass ejec- tions identified in the SMM data set and estimation of their
rate of occurrence during the SMM epoch both require con- sideration of the sampling of the true population achieved in these observations. Several sampling effects are crucial to this discussion. First, SMM coronagraph images were taken with the sun near one corner of an approximately square field of view (see Figure 1). Images of four such "quadrants" were required to observe the corona at all position angles about the sun. Second, these solar observations were regularly interrup- ted by the "night" portion of each spacecraft orbit. Third, the acquisition of white-light coronagraph images was com- promised by several instrumental problems and interrupted, even during "daylight" intervals of normal operation, by H0•, green line, or calibration observing sequences. The "duty cycle" of the coronagraph, or the effective time of observation for which mass ejections could be identified from the white- light images, thus depends on the detailed pattern of spatial and temporal sampling in which these images were obtained.
Preliminary values of the radial speeds of the coronal mass ejections under discussion here yield an average speed near 450 km s-•. The average speed of outward motion for tran- sients observed during the Skylab mission was 470 _+ 50 krfi s- • [Gosling et al., 1976]. Thus an outward propagation speed of 450 km s -• appears to be typical for the mass ejections observed during both the SMM and Skylab epochs. If such an event were to occur within the • 90 ø range of position angles covered by a single SMM coronagraph image, it would be visible between the occulting disc (at a heliocentric distance of 1.6 solar radii or Rs) and the outer edge of the field of view (at a heliocentric distance of 4.8 R s near the side of an image, •6.5 R s at the corner of an image). At a speed of 450 km s- •, the typical mass ejection would be in the field of view for 86-130 min. Any image obtained during this time interval should lead to "direct detection" of the event.
We will base our estimate of the effective observing time of the SMM coronagraph on this time scale for a typical coronal mass ejection to pass through the instrumental field of view. That is, if images of a given quadrant are made every • 100 rain, virtually all mass ejections occurring in that region of the corona will be detected; if observations are made less fre- quently, an appreciable fraction of the ejections will go unde- tected. We will simplify implementation of this criterion by making use of the near coincidence of this time scale with the 96-rain orbital period of the SMM spacecraft. Thus any orbit of the spacecraft will be taken as effective observing time for mass ejections occurring in a given quadrant if a single image is obtained in that quadrant. We will further assume that images of the four different quadrants about the sun are inde-
o.$
o.2
o.I
o.o
0.$-
0.2 -
0.1 -
0.0
I • I • I • I • I
SMM 65 Coronal Mass Ejections
I I I I I I I I
Skylab 7 Mass Ejection Events
I
-60* -$0' O* $0' 60*
I
PROJECTED SOLAR LATITUDE
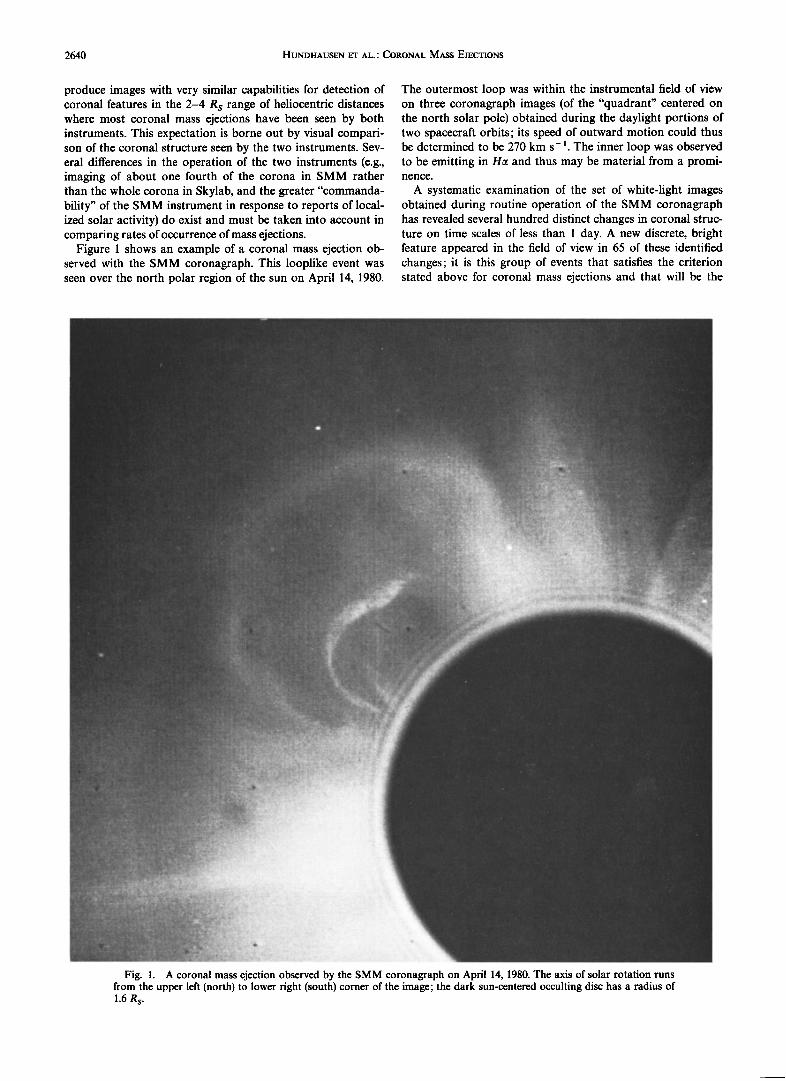
Fig. 2. The projected solar latitudes of coronal mass ejections. The top frame shows the distribution of projected latitudes for the 65 SMM mass ejections under discussion. The bottom frame shows the distribution for 77 mass ejection events observed during the Skylab Mission, as reported by Munro et HI. [1979].
pendent of One another (there is in fact a small overlap of the images) and that all four images must be obtained to detect events at all possible position angles. This assumption allows us to evaluate the relative efficiency with which events at dif- ferent solar latitudes (or more precisely, position angles) have been sampled and to estimate a total observing time for all coronal transients during the SMM mission.
The following analysis of latitude distribution and rate of occurrence of mass ejections will be based on the one image per orbit sampling assumption justified in the previous para- graph. In our forthcoming discussion of the rate of occurrence of these events, we will both test the self-consistency of this assumption and examine the sensitivity of our results to changes in our sampling assumption. Nonetheless, the reader should recall that our justification is based on the speed of a typical event. Any very fast events would be less effectively detected than our "typical" mass ejection, and we may thus have missed a portion of any such population.
4. LATITUDE DISTRIBUTION
The position angle of the top of the bright region seen in each coronal mass ejection has been measured with an accu- racy of + 5 ø. This measurement has been made on the corona- graph image that showed the bright region at the greatest distance from the sun. For events that occur directly above the solar limb, the displacemeM in position angle from the solar equator is a direct measure of the solar latitude of the bright region. For mass ejections away from the limb, this displace- ment is projected on the plane passing through the limb (at right angles to the line of sight) and gives an overestimate of the actual solar latitude of the bright region. With this geo- metric limitation in mind, consider the distribution of "pro- jected" solar latitudes for the 65 coronal mass ejections under discussion, as shown at the top of Figure 2. Mass ejection have been identified in the SMM data set with projected solar latitudes from -75 ø to + 90 ø, the entire range over which the
2642 HUNDHAUSEN ET AL.' CORONAL MASS EJECTIONS
corona is not obscured by the shadow of the occulting disc support.
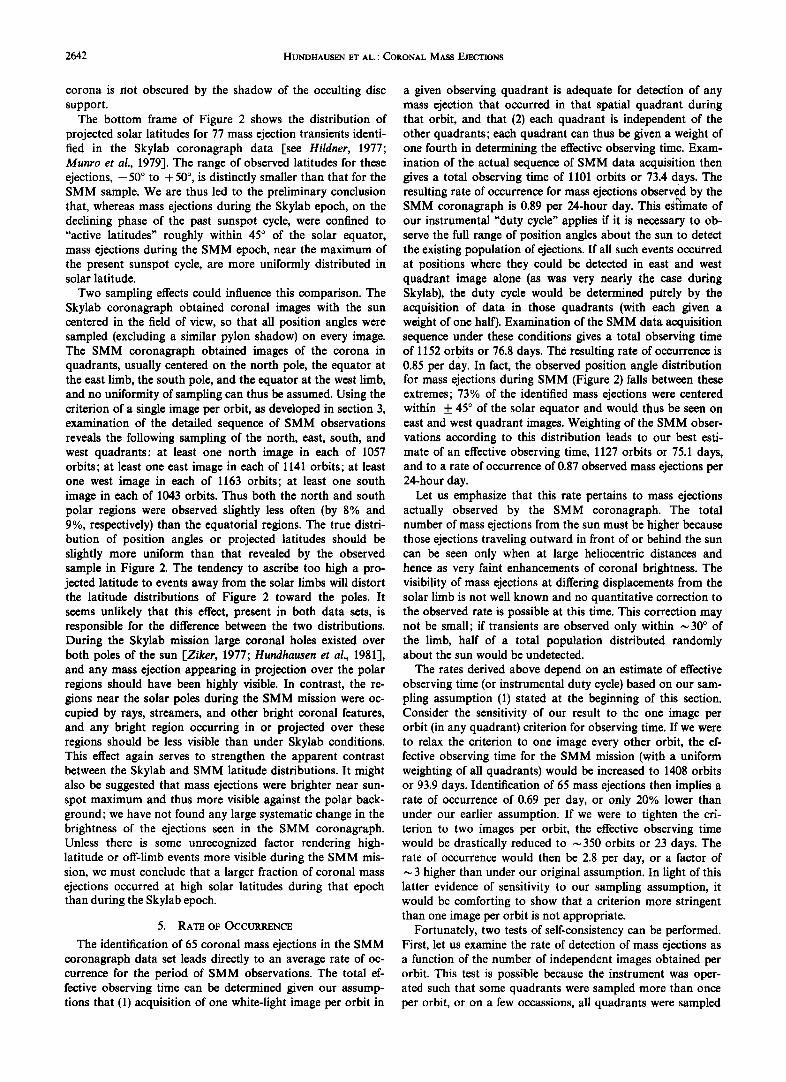
The bottom frame of Figure 2 shows the distribution of projected solar latitudes for 77 mass ejection transients identi- fied in the Skylab coronagraph data [see Hildner, 1977; Munro et al., 1979]. The range of observed latitudes for these ejections, -50 ø to + 50 ø, is distinctly smaller than that for the SMM sample. We are thus led to the preliminary conclusion that, whereas mass ejections during the Skylab epoch, on the declining phase of the past sunspot cycle, were confined to "active latitudes" roughly within 45 ø of the solar equator, mass ejections during the SMM epoch, near the maximum of the present sunspot cycle, are more uniformly distributed in solar latitude.
Two sampling effects could influence this comparison. The Skylab coronagraph obtained coronal images with the sun centered in the field of view, so that all position angles were sampled (excluding a similar pylon shadow) on every image. The SMM coronagraph obtained images of the corona in quadrants, usually centered on the north pole, the equator at the east limb, the south pole, and the equator at the west limb, and no uniformity of sampling can thus be assumed. Using the criterion of a single image per orbit, as developed in section 3, examination of the detailed sequence of SMM observations reveals the following sampling of the north, east, south, and west quadrants' at least one north image in each of 1057 orbits; at least one east image in each of 1141 orbits; at least one west image in each of 1163 orbits; at least one south image in each of 1043 orbits. Thus both the north and south polar regions were observed slightly less often (by 8% and 9%, respectively) than the equatorial regions. The true distri- bution of position angles or projected latitudes should be slightly more uniform than that revealed by the observed sample in Figure 2. The tendency to ascribe too high a pro- jected latitude to events away from the solar limbs will distort the latitude distributions of Figure 2 toward the poles. It seems unlikely that this effect, present in both data sets, is responsible for the difference between the two distributions. During the Skylab mission large coronal holes existed over both poles of the sun [Ziker, 1977; Hundhausen et al., 1981], and any mass ejection appearing in projection over the polar regions should have been highly visible. In contrast, the re- gions near the solar poles during the SMM mission were oc- cupied by rays, streamers, and other bright coronal features, and any bright region occurring in or projected over these regions should be less visible than under Skylab conditions. This effect again serves to strengthen the apparent contrast between the Skylab and SMM latitude distributions. It might also be suggested that mass ejections were brighter near sun- spot maximum and thus more visible against the polar back- ground; we have not found any large systematic change in the brightness of the ejections seen in the SMM coronagraph. Unless there is some unrecognized factor rendering high- latitude or off-limb events more visible during the SMM mis- sion, we must conclude that a larger fraction of coronal mass ejections occurred at high solar latitudes during that epoch than during the Skylab epoch.
5. RATE OF OCCURRENCE
The identification of 65 coronal mass ejections in the SMM coronagraph data set leads directly to an average rate of oc- currence for the period of SMM observations. The total ef- fective observing time can be determined given our assump- tions that (1) acquisition of one white-light image per orbit in
a given observing quadrant is adequate for detection of any mass ejection that occurred in that spatial quadrant during that orbit, and that (2) each quadrant is independent of the other quadrants; each quadrant can thus be given a weight of one fourth in determining the effective observing time. Exam- ination of the actual sequence of SMM data acquisition then gives a total observing time of 1101 orbits or 73.4 days. The resulting rate of occurrence for mass ejections observed by the SMM coronagraph is 0.89 per 24-hour day. This e•lmate of our instrumental "duty cycle" applies if it is necessary to ob- serve the full range of position angles about the sun to detect the existing population of ejections. If all such events occurred at positions where they could be detected in east and west quadrant image alone (as was very nearly the case during Skylab), the duty cycle would be determined purely by the acquisition of data in those quadrants (with each given a weight of one half). Examination of the SMM data acquisition sequence under these conditions gives a total observing time of 1152 orbits or 76.8 days. Th• resulting rate of occurrence is 0.85 per day. In fact, the observed position angle distribution for mass ejections during SMM (Figure 2) falls between these extremes; 73% of the identified mass ejections were centered within _+ 45 ø of the solar equator and would thus be seen on east and west quadrant images. Weighting of the SMM obser- vations according to this distribution leads to our best esti- mate of an effective observing time, 1127 orbits or 75.1 days, and to a rate of occurrence of 0.87 observed mass ejections per 24-hour day.
Let us emphasize that this rate pertains to mass ejections actually observed by the SMM coronagraph. The total number of mass ejections from the sun must be higher because those ejections traveling outward in front of or behind the sun can be seen only when at large heliocentric distances and hence as very faint enhancements of coronal brightness. The visibility of mass ejections at differing displacements from the solar limb is not well known and no quantitative correction to the observed rate is possible at this time. This correction may not be small; if transients are observed only within • 30 ø of the limb, half of a total population distributed randomly about the sun would be undetected.
The rates derived above depend on an estimate of effective observing time (or instrumental duty cycle) based on our sam- pling assumption (1) stated at the beginning of this section. Consider the sensitivity of our result to the one image per orbit (in any quadrant) criterion for observing time. If we were to relax the criterion to one image every other orbit, the ef- fective observing time for the SMM mission (with a uniform weighting of all quadrants) would be increased to 1408 orbits or 93.9 days. Identification of 65 mass ejections then implies a rate of occurrence of 0.69 per day, or only 20% lower than under our earlier assumption. If we were to tighten the cri- terion to two images per orbit, the effective observing time would be drastically reduced to • 350 orbits or 23 days. The rate of occurrence would then be 2.8 per day, or a factor of • 3 higher than under our original assumption. In light of this latter evidence of sensitivity to our sampling assumption, it would be comforting to show that a criterion more stringent than one image per orbit is not appropriate.
Fortunately, two tests of self-consistency can be performed. First, let us examine the rate of detection of mass ejections as a function of the number of independent images obtained per orbit. This test is possible because the instrument was oper- ated such that some quadrants were sampled more than once per orbit, or on a few occassions, all quadrants were sampled
HUNDHAUSEN ET AL.' CORONAL MASS EJECTIONS 2643
i- 0.10
oo
• • 0.05
- (74) (77) (57) (206) (444) (205) (139)
I 2 3 4 5 6 7 8
QUADRANTS SAMPLED PER ORBIT
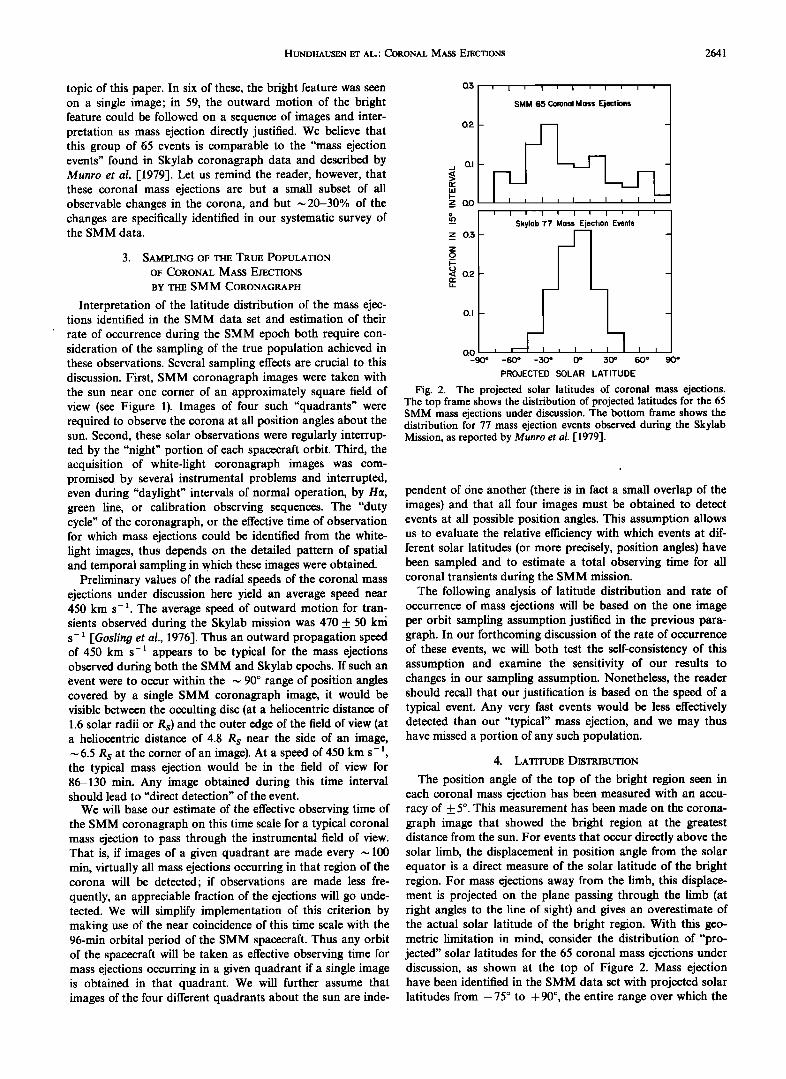
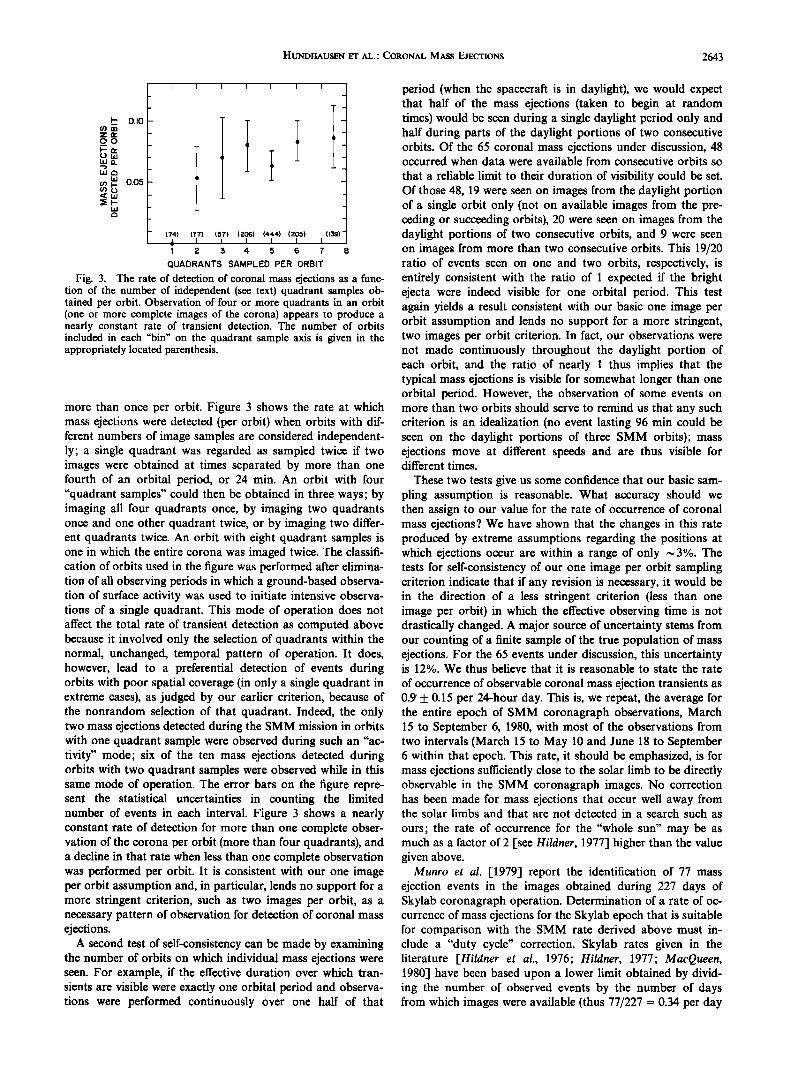
Fig. 3. The rate of detection of coronal mass ejections as a func- tion of the number of independent (see text) quadrant samples ob- tained per orbit. Observation of four or more quadrants in an orbit (one or more complete images of the corona) appears to produce a nearly constant rate of transient detection. The number of orbits included in each "bin" on the quadrant sample axis is given in the appropriately located parenthesis.
more than once per orbit. Figure 3 shows the rate at which mass ejections were detected (per orbit) when orbits with dif- ferent numbers of image samples are considered independent- ly; a single quadrant was regarded as sampled twice if two images were obtained at times separated by more than one fourth of an orbital period, or 24 min. An orbit with four "quadrant samples" could then be obtained in three ways; by imaging all four quadrants once, by imaging two quadrants once and one other quadrant twice, or by imaging two differ- ent quadrants twice. An orbit with eight quadrant samples is one in which the entire corona was imaged twice. The classifi- cation of orbits used in the figure was performed after elimina- tion of all observing periods in which a ground-based observa- tion of surface activity was used to initiate intensive observa- tions of a single quadrant. This mode of operation does not affect the total rate of transient detection as computed above because it involved only the selection of quadrants within the normal, unchanged, temporal pattern of operation. It does, however, lead to a preferential detection of events during orbits with poor spatial coverage (in only a single quadrant in extreme cases), as judged by our earlier criterion, because of the nonrandom selection of that quadrant. Indeed, the only two mass ejections detected during the SMM mission in orbits with one quadrant sample were observed during such an "ac- tivity" mode; six of the ten mass ejections detected during orbits with two quadrant samples were observed while in this same mode of operation. The error bars on the figure repre- sent the statistical uncertainties in counting the limited number of events in each interval. Figure 3 shows a nearly constant rate of detection for more than one complete obser- vation of the corona per orbit (more than four quadrants), and a decline in that rate when less than one complete observation was performed per orbit. It is consistent with our one image per orbit assumption and, in particular, lends no support for a more stringent criterion, such as two images per orbit, as a necessary pattern of observation for detection of coronal mass ejections.
A second test of self-consistency can be made by examining the number of orbits on which individual mass ejections were seen. For example, if the effective duration over which tran- sients are visible were exactly one orbital period and observa- tions were performed continuously over one half of that
period (when the spacecraft is in daylight), we would expect that half of the mass ejections (taken to begin at random times) would be seen during a single daylight period only and half during parts of the daylight portions of two consecutive orbits. Of the 65 coronal mass ejections under discussion, 48 occurred when data were available from consecutive orbits so
that a reliable limit to their duration of visibility could be set. Of those 48, 19 were seen on images from the daylight portion of a single orbit only (not on available images from the pre- ceding or succeeding orbits), 20 were seen on images from the daylight portions of two consecutive orbits, and 9 were seen on images from more than two consecutive orbits. This 19/20 ratio of events seen on one and two orbits, respectively, is entirely consistent with the ratio of 1 expected if the bright ejecta were indeed visible for one orbital period. This test again yields a result consistent with our basic one image per orbit assumption and lends no support for a more stringent, two images per orbit criterion. In fact, our observations were not made continuously throughout the daylight portion of each orbit, and the ratio of nearly 1 thus implies that the typical mass ejections is visible for somewhat longer than one orbital period. However, the observation of some events on more than two orbits should serve to remind us that any such criterion is an idealization (no event lasting 96 min could be seen on the daylight portions of three SMM orbits); mass ejections move at different speeds and are thus visible for different times.
These two tests give us some confidence that our basic sam- pling assumption is reasonable. What accuracy should we then assign to our value for the rate of occurrence of coronal mass ejections? We have shown that the changes in this rate produced by extreme assumptions regarding the positions at which ejections occur are within a range of only • 3%. The tests for self-consistency of our one image per orbit sampling criterion indicate that if any revision is necessary, it would be in the direction of a less stringent criterion (less than one image per orbit) in which the effective observing time is not drastically changed. A major source of uncertainty stems from our counting of a finite sample of the true population of mass ejections. For the 65 events under discussion, this uncertainty is 12%. We thus believe that it is reasonable to state the rate
of occurrence of observable coronal mass ejection transients as 0.9'_+ 0.15 per 24-hour day. This is, we repeat, the average for the entire epoch of SMM coronagraph observations, March 15 to September 6, 1980, with most of the observations from two intervals (March 15 to May 10 and June 18 to September 6 within that epoch. This rate, it should be emphasized, is for mass ejections sufficiently close to the solar limb to be directly observable in the SMM coronagraph images. No correction has been made for mass ejections that occur well away from the solar limbs and that are not detected in a search such as
ours; the rate of occurrence for the "whole sun" may be as much as a factor of 2 [see Hildner, 1977] higher than the value given above.
Munro et al. [1979] report the identification of 77 mass ejection events in the images obtained during 227 days of Skylab coronagraph operation. Determination of a rate of oc- currence of mass ejections for the Skylab epoch that is suitable for comparison with the SMM rate derived above must in- clude a "duty cycle" correction. Skylab rates given in the literature [Hildner et al., 1976; Hildner, 1977; MacQueen, 1980] have been based upon a lower limit obtained by divid- ing the number of observed events by the number of days from which images were available (thus 77/227 = 0.34 per day
2644 HUNDHAUSEN ET AL.' CORONAL MASS EJECTIONS
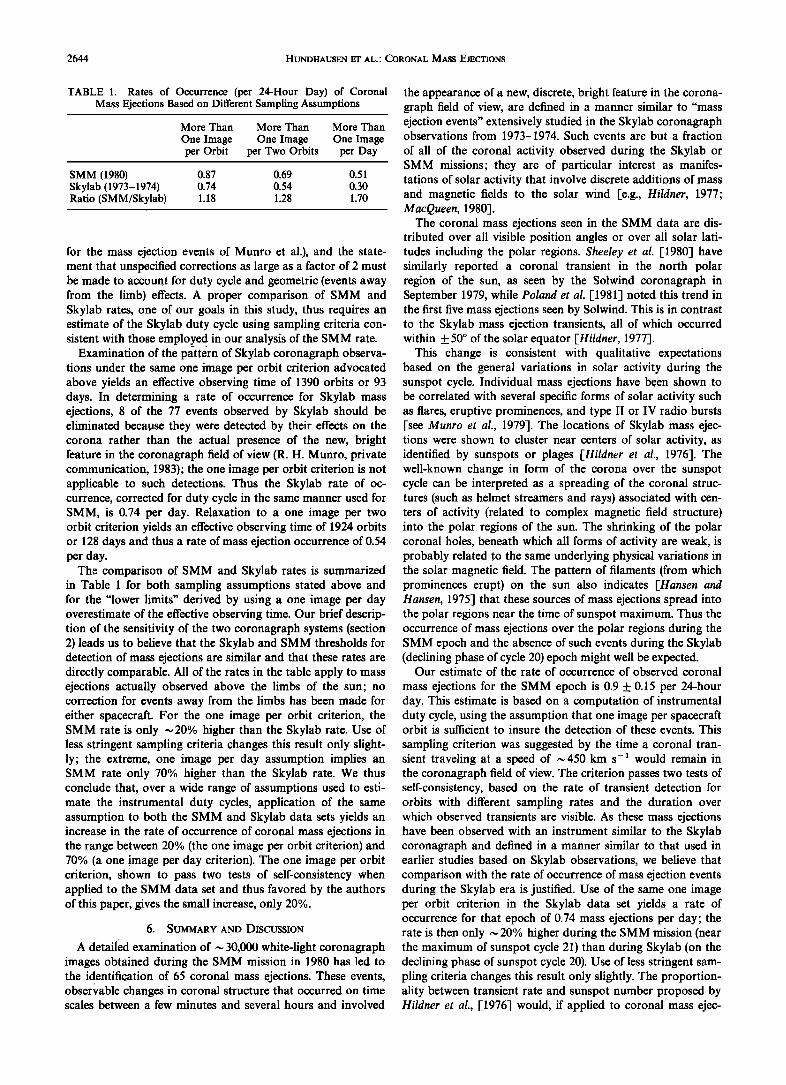
TABLE 1. Rates of Occurrence (per 24-Hour Day) of Coronal Mass Ejections Based on Different Sampling Assumptions
More Than More Than More Than
One Image One Image One Image per Orbit per Two Orbits per Day
SMM (1980) 0.87 0.69 0.51 Skylab (1973-1974) 0.74 0.54 0.30 Ratio (SMM/Skylab) 1.18 1.28 1.70
for the mass ejection events of Munro et al.), and the state- ment that unspecified corrections as large as a factor of 2 must be made to account for duty cycle and geometric (events away from the limb) effects. A proper comparison of SMM and Skylab rates, one of our goals in this study, thus requires an estimate of the Skylab duty cycle using sampling criteria con- sistent with those employed in our analysis of the SMM rate.
_ .
Examination of the pattern of Skylab coronagraph observa- tions under the same one image per orbit criterion advocated above yields an effective observing time of 1390 orbits or 93 days. In determining a rate of occurrence for Skylab mass ejections, 8 of the 77 events observed by Skylab should be eliminated because they were detected by their effects on the corona rather than the actual presence of the new, bright feature in the coronagraph field of view (R. H. Munro, private communication, 1983); the one image per orbit criterion is not applicable to such detections. Thus the Skylab rate of oc- currence, corrected for duty cycle in the same manner used for SMM, is 0.74 per day. Relaxation to a one image per two orbit criterion yields an effective observing time of 1924 orbits or 128 days and thus a rate of mass ejection occurrence of 0.54 per day.
The comparison of SMM and Skylab rates is summarized in Table 1 for both sampling assumptions stated above and for the "lower limits" derived by using a one image per day overestimate of the effective observing time. Our brief descrip- tion of the sensitivity of the two coronagraph systems (section 2) leads us to believe that the Skylab and SMM thresholds for detection of mass ejections are similar and that these rates are directly comparable. All of the rates in the table apply to mass ejections actually observed above the limbs of the sun; no correction for events away from the limbs has been made for either spacecraft. For the one image per orbit criterion, the SMM rate is only •20% higher than the Skylab rate. Use of less stringent sampling criteria changes this result only slight- ly; the extreme, one image per day assumption implies an SMM rate only 70% higher than the Skylab rate. We thus conclude that, over a wide range of assumptions used to esti- mate the instrumental duty cycles, application of the same assumption to both the SMM and Skylab data sets yields an increase in the rate of occurrence of coronal mass ejections in the range between 20% (the one image per orbit criterion) and 70% (a one image per day criterion). The one image per orbit criterion, shown to pass two tests of self-consistency when applied to the SMM data set and thus favored by the authors of this paper, gives the small increase, only 20%.
6. SUMMARY AND DISCUSSION
A detailed examination of • 30,000 white-light coronagraph images obtained during the SMM mission in 1980 has led to the identification of 65 coronal mass ejections. These events, obsemable changes in coronal structure that occurred on time scales between a few minutes and several hours and involved
the appearance of a new, discrete, bright feature in the corona- graph field of view, are defined in a manner similar to "mass ejection events" extensively studied in the Skylab coronagraph observations from 1973-1974. Such events are but a fraction
of all of the coronal activity observed during the Skylab or SMM missions; they are of particular interest as manifes- tations of solar activity that involve discrete additions of mass and magnetic fields to the solar wind [e.g., Hildner, 1977; MacQueen, 1980].
The coronal mass ejections seen in the SMM data are dis- tributed over all visible position angles or over ali solar lati- tudes including the polar regions. Sheeley et al. [1980] have similarly reported a coronal transient in the north polar region of the sun, as seen by the Solwind coronagraph in September 1979, while Poland et al. [1981] noted this trend in the first five mass ejections seen by Solwind. This is in contrast to the Skylab mass ejection transients, all of which occurred within _+ 50 ø of the solar equator [Hildner, 1977].
This change is consistent with qualitative expectations based on the general variations in solar activity during the sunspot cycle. Individual mass ejections have been shown to be correlated with several specific forms of solar activity such as flares, eruptive prominences, and type II or IV radio bursts [see Munro et al., 1979]. The locations of Skylab mass ejec- tions were shown to cluster near centers of solar activity, as identified by sunspots or plages [Hildner et al., 1976]. The well-known change in form of the corona over the sunspot cycle can be interpreted as a spreading of the coronal struc- tures (such as helmet streamers and rays) associated with cen- ters of activity (related to complex magnetic field structure) into the polar regions of the sun. The shrinking of the polar coronal holes, beneath which all forms of activity are weak, is probably related to the same underlying physical variations in the solar magnetic field. The pattern of filaments (from which prominences erupt) on the sun also indicates [Hansen and Hansen, 1975] that these sources of mass ejections spread into the polar regions near the time of sunspot maximum. Thus the occurrence of mass ejections over the polar regions during the SMM epoch and the absence of such events during the Skylab (declining phase of cycle 20) epoch might well be expected.
Our estimate of the rate of occurrence of observed coronal
mass ejections for the SMM epoch is 0.9 _+ 0.15 per 24-hour day. This estimate is based on a computation of instrumental duty cycle, using the assumption that one image per spacecraft orbit is sufficient to insure the detection of these events. This
sampling criterion was suggested by the time a coronal tran- sient traveling at a speed of •450 km s- • would remain in the coronagraph field of view. The criterion passes two tests of self-consistency, based on the rate of transient detection for orbits with different sampling rates and the duration over which observed transients are visible. As these mass ejections have been observed with an instrument similar to the Skylab coronagraph and defined in a manner similar to that used in earlier studies based on Skylab observations, we believe that comparison with the rate of occurrence of mass ejection events during the Skylab era is justified. Use of the same one image per orbit criterion in the Skylab data set yields a rate of occurrence for that epoch of 0.74 mass ejections per day; the rate is then only • 20% higher during the SMM mission (near the maximum of sunspot cycle 21) than during Skylab (on the declining phase of sunspot cycle 20). Use of less stringent sam- pling criteria changes this result only slightly. The proportion- ality between transient rate and sunspot number proposed by Hildner et al., [1976] would, if applied to coronal mass ejec-
HUNDHAUSEN ET AL.: CORONAL MASS EJECTIONS 2645
tions, imply a change in rate of occurrence by a factor of 4 from Skylab to SMM. We have argued (section 2) that the sensitivities of the Skylab and SMM coronagraphs for the detection of mass ejections are similar, so that no major cor- rection for the relative sensitivity of the instruments is neces- sary. Unless there are major, unrecognized differences in the sensitivity of the Skylab and SMM coronagraphs that invali- date any computation of rates, our results are not consistent with the Hildner et al. prediction.
The rate of occurrence of coronal mass ejections determined above and compared with the rate for the Skylab epoch is an average over the entire time of SMM coronagraph data acqui- sition. This time is sufficiently brief that the result could be influenced by short-term, nonrandom fluctuations in the pat- tern of mass ejection occurrence, as found for the Skylab epoch by Hildner et al. [1976] and perhaps for the SMM epoch by Wagner and Wagner [1984]. If the two intervals in which most SMM coronagraph data were obtained, March 15 to May 10 and June 18 to September 6, 1980, are treated separately, mass ejection rates of 1.1 and 0.7 per day are ob- tained. The difference between these two rates is slightly great- er than the statistical uncertainty of • 20% in each value given by the smaller number of events in each epoch and may indicate some variation. In any case, we cannot rule out an error in our rate of occurrence if significant variations on the time scale of a few months were present in 1980.
Sheeley et al. •1982] report the observation of coronal mass ejections with the Solwind coronagraph in 1979-1981 at an average rate "... of at least two events per day." On the surface, this rate is appreciably higher than the value found here for a subset of this long interval. This difference may be real and a result of a fluctuation in rate as discussed in the previous paragraph. However, any comparison of Solwind and SMM rates without careful consideration of instrumental sensitivities
would be premature, as important differences in both the cor- onagraph systems and data analysis techniques do exist. For example, coronal transients have been found in the Solwind data by examination of differences between successive images rather than the direct images used in SMM (or Skylab) analy- sis. This could lead to a significantly different threshold for the detection of faint mass ejections and hence a different sensitivi- ty in sampling the entire population of mass ejections. Indeed, Howard et al. [1982] have reported the discovery in Solwind data of a faint "halo" of enhanced coronal brightness sur- rounding the sun and interpreted this observation in terms of a coronal mass ejection directed toward or away from the sun. No such events have yet been found in the SMM (or Skylab) examination of direct images. It is thus probable that the Sol- wind sample includes mass ejection fainter and farther from the solar limb than have been seen by either SMM or Skylab.
The small change in mass ejection rate of occurrence sug- gested by this analysis has interesting implications with regard to the significance of coronal mass ejections as a source of the solar wind. Hildner [1977] and MacQueen [1980] have, for example, suggested that the fractional contribution of mass ejections to the total mass flux carried away from the sun by the solar wind, estimated at 3% for the Skylab epoch, might be as high as 10-15% near sunspot maximum. General dis- cussions of the sunspot cycle variations in the solar wind [e.g. Crooker, 1982] have considered changes in average solar wind properties near sunspot maximum that might be caused by an increased number of mass ejections. Effects of a changing number of ejections on cosmic ray modulation have been sug- gested [Newkirk et al., 1981]. A change by only •20% in the
rate of occurrence of coronal mass ejections reported here would, of itself, imply that little more of the mass in the solar wind at sunspot maximum could be attributed to mass ejec- tions than was the case near sunspot minimum. A fractional contribution as high as 10-15% would require large con- current increase in the masses of individual ejections (or a similar error in the estimates made during the Skylab epoch). The typical extent in position angle or inferred solar latitude of a mass ejection is less than •60 ø. Although the mass ejec- tions observed during Skylab tended to converge slightly toward the equator, it is not unreasonable to assume that the center of an ejection must be within • 30 ø of the solar equator to influence the solar wind in the ecliptic. Examination of Figure 2 reveals that 85% of the mass ejections in the Skylab era were observed with position angles within 30 ø of the equa- torial plane; 55% of the mass ejections seen during SMM were so located. Thus the change in rate of occurrence of mass ejections within 30 ø of the equator between these two epochs is virtually nil. Any change in the importance of mass ejections to the in-ecliptic solar wind must be small if based only upon the change in their rate of occurrence.
Acknowledgments. We thank R. H. Munro for his helpful com- ments on this manuscript. The National Center for Atmospheric Re- search is sponsored by the National Science Foundation. This work was supported by NASA under contracts S55989 and S55989A.
REFERENCES
Crooker, N. U., Solar cycle variations of the solar wind, Sol. Wind Proc. Conf., 5th, 303, 1982.
Csoeke-Poekh, A., R. H. Lee, W. J. Wagner, L. House, E. Hildner, and C. Sawyer, Coronal observations from the Solar Maximum Mission satellite, Spacecr. Rockets, 19, 345, 1982.
Gosling, J. T., Large-scale inhomogeneities in the solar wind of solar origin, Rev. Geophys. Space Phys, 13, 1953, 1975.
Gosling, J. T., E. Hildner, R. M. MacQueen, R. H. Munro, A. I. Poland, and C. L. Ross, The speeds of coronal mass ejection events, Sol. Phys., 48, 389, 1976.
Hansen, R. T., and S. F. Hansen, Global distribution of filaments during solar cycle 20, Sol. Phys., 44, 225, 1975.
Hildner, E., Mass ejections from the corona into interplanetary space, in Study of Travelling Interplanetary Phenomenon, 1977, edited by M. A. Shea et al., p. 3, D. Reidel, Hingham, Mass., 1977.
Hildner, E., J. T. Gosling, R. M. MacQueen, R. H. Munro, A. I. Poland, and C. L. Ross, Frequency of coronal transients and solar activity, Sol. Phys., 48, 127, 1976.
House, L. L., W. J. Wagner, E. Hildner, C. Sawyer, and H. U. Schmidt, Studies of the corona with the Solar Maximum Mission Coronagraph/Polarimeter, Astrophys. J. Lett., 244, Ll17, 1981.
Howard, R. A., D. J. Michels, N. R. Sheeley, Jr., and M. J. Koomen, The observation of a coronal transient directed at earth, Astrophys. J. Lett., 203, L101, 1982.
Hundhausen, A. J., An interplanetary view of coronal holes, in Coro- nal Holes and Hi•Th-Speed Wind Streams, edited by J. B. Zirker, p. 225, Colorado Associated University Press, Boulder, Colo., 1977.
Hundhausen, A. J., R. T. Hansen, and S. F. Hansen, Coronal evolu- tion during the sunspot cycle: Coronal holes observed with the Mauna Loa K-coronameters, J. Geophys. Res., 86, 2079, 1981.
MacQueen, R. M., Coronal transients: A summary, Philos. Trans. R. Soc. London Set. A, 297, 605, 1980.
MacQueen, R. M., A. Csoeke-Poeckh, E. Hildner, L. House, R. Reyn- olds, A. Stanger, H. Tepoel, and W. Wagner, The High Altitude Observatory coronagraph/polarimeter on the Solar Maximum Mission, Sol, Phys., 65, 91, 1980.
Munro, R. H., J. T. Gosling, E. Hildner, R. M. MacQueen, A. I. Poland, and C. L. Ross, The association of coronal mass ejection transients with other forms of solar activity, Sol. Phys., 61, 201, 1979.
Newkirk, G. A., A. J. Hundhausen, and V. Pizzo, Solar cycle modula- tion of galactic cosmic rays: Speculation on the role of coronal transients, J. Geophys. Res., 86, 5387, 1981.
Poland, A. I., R. A. Howard, M. J. Koomen, D. J. Michels, and N. R.
2646 HUNDHAUSEN ET AL..' CORONAL MASS EJECTIONS
Sheeley, Jr., Coronal transients near sunspot maximum, Sol. Phys., 69, 169, 1981.
Sheeley, N. R., Jr., R. A. Howard, M. J. Koomen, D. J. Michels, and A. I. Poland, The observation of a high-latitude coronal transient, Astrophys. J. Lett., 238, L161, 1980.
Wagner, W. J., and J. J. Wagner, Coronal mass ejection recurrence studies indicating global activity and local suppression, Astron. Astrophys., in press, 1984.
Wagner, W. J., E. Hildner, L. L. House, C. Sawyer, K. V. Sheridan, and G. A. Dulk, Radio and visible light observations of matter ejected from the sun, Astrophys. J. Lett., 244, L123, 1981.
Zirker, J. B., Coronal Holes and High-Speed Wind Streams, Colorado Associated University Press, Boulder, Colo., 1977.
L. House, A. J. Hundhausen, R. M. E. Illing, C. B. Sawyer, and W. J. Wagner, National Center for Atmospheric Research, High Altitude Observatory, P.O. Box 3000, Boulder, CO 80307.
(Received July 21, 1983; revised December 8, 1983;
accepted December 9, 1983.)