
core networks, social isolation, and new media - CiteSeerX
46
CORE NETWORKS, SOCIAL ISOLATION, AND NEW MEDIA: HOW INTERNET AND MOBILE PHONE USE IS RELATED TO NETWORK SIZE AND DIVERSITY Keith N. Hampton, Lauren F. Sessions, and Eun Ja Her Annenberg School for Communication, University of Pennsylvania 3620 Walnut Street Philadelphia, PA 19104 Reference: Hampton, Keith N., Lauren F Sessions, and Eun Ja Her (2011). Core Networks, Social Isolation, and New Media: How Internet and Mobile Phone Use is Related to Network Size and Diversity. Information, Communication & Society 14(1). This is a preprint of an article that has been accepted for publication in the journal INFORMATION, COMMUNICATION & SOCIETY 2011 © Taylor & Francis; INFORMATION, COMMUNICATION & SOCIETY is available online at http://www.tandf.co.uk/journals/rics 1
-
Upload
khangminh22 -
Category
Documents
-
view
2 -
download
0
Transcript of core networks, social isolation, and new media - CiteSeerX
CORE NETWORKS, SOCIAL ISOLATION, AND NEW MEDIA:
HOW INTERNET AND MOBILE PHONE USE IS RELATED TO NETWORK SIZE
AND DIVERSITY
Keith N. Hampton, Lauren F. Sessions, and Eun Ja Her
Annenberg School for Communication, University of Pennsylvania
3620 Walnut Street Philadelphia, PA 19104
Reference: Hampton, Keith N., Lauren F Sessions, and Eun Ja Her (2011). Core Networks, Social Isolation, and New Media: How Internet and Mobile Phone Use is Related to Network Size and Diversity. Information, Communication & Society 14(1). This is a preprint of an article that has been accepted for publication in the journal INFORMATION, COMMUNICATION & SOCIETY 2011 © Taylor & Francis; INFORMATION, COMMUNICATION & SOCIETY is available online at http://www.tandf.co.uk/journals/rics
1

2
BIOGRAPHY
Keith N. Hampton is an assistant professor in the Annenberg School for Communication at the
University of Pennsylvania. He received his Ph.D. and M.A. in sociology from the University of
Toronto and a B.A. in sociology from the University of Calgary. His research interests focus on
the relationship between new information and communication technologies, social networks, and
the urban environment.
Lauren F. Sessions is a doctoral student at the Annenberg School for Communication at the
University of Pennsylvania. She received an M.A. in Communication from the University of
Pennsylvania and a B.A. in Sociology from Tufts University.
Eun Ja Her is a doctoral student at the Annenberg School for Communication at the University
of Pennsylvania. She received her M.A and B.A. in Communication from Seoul National
University.
3
ACKNOWLEDGEMENTS
The authors would like to thank Lee Rainie (Pew), John Horrigan (Pew), Barry Wellman
(University of Toronto), and Evans Witt (Princeton Survey Research Associates International),
who assisted in the design and administration of the project survey. We would also like to
acknowledge the support of the Annenberg School for Communication at the University of
Pennsylvania. For more information on this and related projects, visit
www.mysocialnetwork.net.
4
ABSTRACT
Evidence from the U.S. General Social Surveys (GSS) suggests that during the past twenty years,
people have become increasingly socially isolated and their core discussion networks have
become smaller and less diverse. One explanation offered for this trend is the use of mobile
phones and the Internet. This study reports on the findings of a 2008 survey that replicates and
expands on the GSS network methodology to explore the relationship between the use of new
technologies and the size and diversity of core networks. The findings conflict with the results of
the 2004 GSS, i.e., we find that social isolation has not increased since 1985. However, the
current study supports the conclusions that the size of core networks has declined and the
number of nonkin in core networks has diminished. Mobile phone and Internet use, especially
specific uses of social media, were found to have a positive relationship to network size and
diversity. In discussing these trends, we speculate that specific social media provide for a
“pervasive awareness” within personal networks that has increased the specialization of close
ties. We argue that this same pervasive awareness provides for heightened surveillance of
network members, the result of which is a higher level of perceived diversity within networks
based on metrics that include political affiliation.
Key words: social networks, social support, social media, Web 2.0, pervasive awareness
5
CORE NETWORKS, SOCIAL ISOLATION, AND NEW MEDIA:
HOW INTERNET AND MOBILE PHONE USE IS RELATED TO NETWORK SIZE
AND DIVERSITY
People are increasingly socially isolated. The size of core networks has declined and these
relations are increasingly comprised of similar others. A likely culprit, for this unexpected
change in the structure of affiliation, is the rise of the Internet and mobile phones. These are the
findings of a 2006 article that compared data from the 1985 and 2004 U.S. General Social
Surveys (GSS) (McPherson, Smith-Lovin, & Brashears, 2006). The implications of such a trend
are alarming. They indicate a decline in the availability of broad social support within social
networks in the form of companionship and instrumental and emergency aid and an increased
likelihood that important matters are discussed only within small, closed groups. The findings
suggest outcomes that are felt at the individual level in terms of fellowship and opinion quality
and at the societal level in terms of aggregate levels of trust, tolerance, and the values of a
deliberative democracy.
This paper challenges the findings that social isolation has increased and the use of new
technology is associated with smaller or less diverse core networks. Reporting the findings of a
2008 national survey that replicated and expanded on the GSS module of core discussion
networks, this paper concludes that, although core networks are more insular than in the past,
social isolation has not spiked over the last twenty years. In addition, no negative relationship
between Internet or mobile phone use and core network size and diversity was found. Indeed, we
found that specific uses of new media were associated with larger and more diverse core
networks. In discussing these trends, we speculate that social media provide for a “pervasive
awareness” within personal networks that has increased the specialization of close ties, in terms
6
of the types of support that they provide. We argue that this same pervasive awareness provides
for heightened surveillance of network members, the result of which is a higher level of
perceived diversity within networks based on metrics that include political affiliation.
CAUSES AND CONSEQUENCES
In a comparison of the 2004 and 1985 GSS, when asked to look back over the previous six
months and enumerate the names of those with whom they “discussed important matters,” the
number of names Americans supplied dropped by about one-third, from 2.94 in 1985 to 2.08 in
2004 (McPherson et al., 2006). The percentage of participants who were socially isolated – those
who provided no names at all – increased from 10.0% to 24.6% (McPherson et al., 2006). The
number of ties to neighbors and those from voluntary associations also declined, such that the
percentage of Americans with at least one nonkin confidant dropped from 80.1% to 57.2%
(McPherson et al., 2006).
If we are to believe the findings of the 2004 GSS, the implications of such large-scale
social change are far reaching. Although core discussion networks are a small subset of peoples’
full social networks, they are of principal importance. Comprised primarily of strong ties, core
networks provide broad forms of social support, including emotional aid and companionship and
help during a crisis (Wellman & Wortley, 1990).
An extensive literature has documented the positive relationship between the presence of
close confidants and success in coping with adverse events, dealing with existing health issues,
and reducing susceptibility to additional health problems (Cohen, 2004). For example, having a
close confidant has been shown to reduce the likelihood of further cardiac events after an initial
myocardial infarction (Dickens et al., 2004). The informal support of core network members is
also important during emergency situations, such as a heat wave, hurricane or other disaster
7
(Hurlbert, Haines, & Beggs, 2000; Klinenberg, 2002). Individuals with poor or absent core
networks are not only less likely to benefit from potentially life-saving informal support, but, as
a result of their higher risk, they are more likely to need professional medical attention. In a
crisis, they are more likely to rely on formal support from government sources.
Core networks are also highly influential in attitude and opinion formation (Erickson,
1997; Katz & Lazarsfeld, 1955). The act of formal deliberation, or even informal conversation
about mundane matters, is important for the formation of mutual understanding and exposure to
issues, ideas, and opinions (Dewey, 1927; Habermas, 1984; Wyatt, Katz, & Kim, 2000).
However, higher levels of trust and tolerance come only from heterogeneity within networks.
Core discussion networks that are low in diversity are less likely to be Hearing the Other Side
(Mutz, 2006) and more likely to experience the reverberation of an Echo Chamber (Jamieson &
Cappella, 2008), where accordant opinions and beliefs shield one from questioning personal
ideology. If the number and diversity of those with whom we discuss important matters are
threatened, the foundation for an informed and deliberative democracy may also be threatened.
McPherson et al. (2006) focus on three likely causes for the change in size and
composition of core discussion networks that were observed in the 2004 GSS (McPherson et al.,
2006; McPherson, Smith-Lovin, & Brashears, 2008; McPherson, Smith-Lovin, & Brashears,
2009). They include:
1) use of the Internet and mobile phones replacing ties to core confidants;
2) a historical shift in how people interpret the term “discuss” important matters. They may
interpret “discuss” literally and omit core ties that they maintain whole or in-part through
new forms of communication, such as the Internet and mobile phones;
8
3) a cultural shift in what people consider an “important” matter, so that they believe they
have nothing important to say;
New Technologies and Social Networks
At the time of the 1985 GSS, the infrastructure that would become the Internet was alien to most
Americans, and the first domestic commercial cellular network had been launched only two
years earlier. By 2004, more than 60% of adult Americans were Internet users (Rainie &
Horrigan, 2005) and there were more than 159 million cell phone subscribers in the United States
(United States Census Bureau, 2005). Whereas the rise of these new media has clearly
transformed the global economy and the nature of interpersonal communication (Castells, 1996),
is there evidence that the Internet or mobile phone have had the negative effect on social
networks suggested by McPherson et al. (2006)?
McPherson et al. (2006) suggest that the Internet allows social networks to spread out
geographically, detracting from encounters with friends and neighbors in local spaces. The
Internet, they argue, substitutes a large array of geographically dispersed weak ties for strong,
more localized, core confidants. This argument is neither unique nor new. Jacqueline Olds and
Richard Schwartz (2009), in their book The Lonely America, similarly argue that the Internet
detracts from local, physical relationships, and that online activities may weaken traditional
forms of solidarity. Sigman (2009) calls the use of new communication technologies the “most
significant contributing factor” in a historic decline in face-to-face interaction.
While pronouncements about the negative consequences of new media are popular,
empirical evidence in support of such a connection is limited. Perhaps the most well known is
the study where this connection was first proposed, a paper by Robert Kraut et al. (1998). In a
study of new Internet users in Pittsburgh, Kraut et al. (1998) found that home Internet use was
9
associated with a reduction in the size of one’s local social circles. Similar findings were also
reported in a series of surveys by Norman Nie, who found that time spent online displaces time
spent with friends and family (Nie & Erbring, 2000). However, these findings from a time when
the Internet was truly a new technology could not be replicated with a similar population, even a
few years later (Kraut et al., 2002).
More recent research confirms that close social relations do not attrite with Internet use
and that Internet users tend to have larger personal networks. Omitting contacts at work and
family at home, Internet users who participated in the 2000 GSS reported that they had contact
with a higher number of friends and relatives than did nonusers (Zhao, 2006). This finding was
particularly strong among heavy users of social as opposed to passive media (Zhao, 2006).
Similarly, a 2004, national survey found that Internet users “feel very close” to the same number
of people as nonusers, but maintain relationships with 20% more people to whom they “feel
somewhat close” (Boase, Horrigan, Wellman, & Rainie, 2006). Wang and Wellman (2010)
found that the number reported when people were asked how many “friends outside of [their]
household” they “see or speak to at least once a week” increased by 20% between 2002 and
2007. The increase was higher for those who used the Internet the most. Mok, Carrasco, and
Wellman (2010), in a follow-up to Wellman’s classic study of personal networks from East York
(Wellman, 1979) also found that intimate ties saw each other in-person as often in 2005 as they
did in 1978 – regardless of Internet use.
In addition to those with whom people “see” and “speak” in the literal sense, a substantial
number of Internet users also form new social ties that remain online (Gennaro & Dutton, 2007).
Other specific Internet activities, including blogging and the use of social networking services
10
(e.g., Facebook), have also been associated with having more diverse networks (Marlow, 2005;
Steinfield, Ellison, & Lampe, 2008).
It is incorrect to maintain that the Internet benefits distant relationships at the expense of
local ties. The Internet affords personal connections at extreme distances but also provides the
opportunity for new and supplemental local interaction. Hampton and Wellman (2003) in their
study of Netville and Hampton (2007) in his study of four Boston neighborhoods found that
Internet users and nonusers had a larger number of local weak ties. Hampton (2007) found that
the longer people had been using the Internet, the more weak ties they formed over time at the
neighborhood level. In a study of 1,300 wireless Internet users observed in seven public parks in
the United States and Canada, Hampton, Livio, and Sessions (in press) found that Internet use
attracted new people to local public spaces and that nearly one-quarter of public space visits by
wireless Internet users resulted in serendipitous interaction with strangers. One in six reported
that such serendipitous encounters resulted in a new, long-term social tie.
Existing research does provide some support for McPherson et al. (2006) by suggesting
that the use of mobile phones may be concentrated on a limited, small set of intimates. Studies
have repeatedly found that most people use the mobile phone to keep in regular contact with a
small number – less than half a dozen – strong, highly transitive, social ties (Ling, 2008). In
addition, the situational demands of the mobile phone typically require disengagement from both
co-present strangers and existing acquaintances (Humphreys, 2005). It has been speculated that
ready access to a small number of close intimates, as provided by the mobile phone, may reduce
the need to maintain a larger and more diverse circle of confidants (Gergen, 2008). Such a
pattern might be similar to that which was observed by McPherson et al. (2006).
11
It is possible to extend to other new media this argument about use of a technology for
intensive access and participation with a small, closed network of ties. Research on the use of
instant messaging (IM) has shown that IM is typically used to maintain an intimate network of
three to five ties (Kim, Kim, Park, & Rice, 2007). If the boost in communication afforded by
mobile phones and other new technologies is more narrowly focused than has been previously
reported, i.e., if connectivity is concentrated among only a couple of intimates and this
connectivity replaces the need to maintain a larger and more diverse core discussion network,
then it is conceivable that the pattern observed by McPherson et al. (2006) may exist among
those who use new technologies in a very specific way. Then again, if the mobile phone or
specific social media do provide intense, immediate access to close social ties, it is also possible
that this interaction may free time or provide opportunity for a modest expansion in the number
of core confidants.
The existing research findings on the use of new technologies and social networks does
not specifically address the size of and diversity of “core confidants.” It does, however, provide
considerable evidence about the relationship between online activity and ties of various strengths
and at various distances. The research does not show that Internet users prefer distant over local
ties, or weak over close ties. If anything, the research suggests relative stability or an increase in
the number of both moderately close and weak ties across all distances. Research on mobile
phone use and some specific technologies (e.g., instant messaging) does suggest that they are
used intensively with a small group of close ties, but it is only speculation that intensive use of a
specific communication technology with a small intimate network leads to the narrowing of
networks.
Other Explanations
12
The two remaining possibilities, suggested by McPherson et al (2006) as partial or full
explanations for the spike in social isolation and decline in core network size and diversity focus
on other large-scale social changes. They relate to historical variation in how people may have
interpreted the question, “Who are the people with whom you discussed matters that are
important to you?” One possibility is that historical events related to the adoption of new
technologies have altered how people interpret the word “discuss.” That is, when asked about
their “discussion” networks, respondents may exclude certain close confidants because the
wording of the question implies an omission of communication about important matters that do
not take place in-person, such as what occurs over mobile phones or the Internet. Another
possibility is that people have changed their understanding of what is an “important matter.”
McPherson et al. (2006) largely exclude these possibilities, based on previous research that
suggests that many people interpret the “discuss-important-matters” name generator in terms of
intimacy rather than specific social exchange (Bailey & Marsden, 1999). McPherson et al. (2006)
suggest that even if there has been a cultural change in the meanings of “discuss” or “important
matters,” it probably would not have had much influence on the number and composition of
names elicited.
We are not so sure, while we agree that when asked about discussion networks people are
likely to think broadly and not limit themselves to face-to-face encounters, we question if the use
of new media has not changed how people structure social relationships to respond to “important
matters.” The increased accessibility of social ties, through the use of mobile phones and other
technologies, combined with the “pervasive awareness” that people have of their network
members activities and interests, based on what is broadcast through social media, may allow
people to specialize more in the exchange of support within core networks. People may no longer
13
discuss important “matters” (emphasis on the plural), but engage with core network members
around very specific issues. The anytime, anywhere connectivity of new communication media,
combined with the pervasive awareness of social media may be responsible for a fundamental
shift in the structure of community toward more specialized nodes of support.
Replicating a Trend? Testing a Conclusion.
This paper reports on the findings of a 2008 survey that replicated the “important matters” social
network question from the 2004 GSS. We question the likelihood of an extreme increase in
social isolation over the previous two decades. As explored by Fischer (2009), the finding of
increased social isolation in the 2004 GSS data is most likely the result of contextual effects and
possibly an undiscovered random error related to survey administration. We believe that a trend
of reported smaller core networks is real, but that it is at least in part explained by cultural
changes in how people respond to the “important matters” name generator that has been used to
enumerate these networks. We are less skeptical of McPherson et al. (2006) finding of less
diverse core discussion networks, because it seems consistent with existing research supporting a
trend toward privatism; reduced socialization with diverse others outside the home in exchange
for intensive interactions with similar others in the home (Lofland, 1998; Putnam, 2000). If such
a trend is validated, we do not believe that it is associated with the use of new media. In fact, the
opposite is expected to be true. The Internet and mobile phones are not isolating technologies;
they are communication media that afford people the opportunity to maintain contact with a
higher number of diverse, close confidants. This pattern is expected to be particularly strong
among those who use “social media,” such as social networking services (e.g., Facebook),
blogging, instant messaging, or uploading digital photos to share online. We argue that:
14
H1. There has been little or no change in the level of social isolation in America (the number
of people who report no discussion confidants).
H2. The average number of reported core discussion confidants has declined. However,
Internet and mobile phone use is not associated with having a smaller number of core
confidants. The use of Internet-based “social media” and a mobile phone is associated
with having a larger core discussion network.
H3. The diversity of core discussion confidants has declined. However, use of the Internet
and mobile phone is not associated with having less diverse core discussion networks.
Rather, the use of “social media” and a mobile phone is associated with having a more
diverse core discussion network.
H4. A decline in the number of core discussion confidants reported can partially be
explained by a change specific to how people utilize their networks to discuss
“important matters”.
METHOD
Survey
In July and August 2008, in partnership with the Pew Internet & American Life Project, we
conducted a random-digit, dial survey of 2,512 adults living in households in the continental
United States. A combination of landline (2,007 interviews) and mobile phone (505 interviews)
samples was used to represent all adults with access to a telephone. A separate mobile phone
sample was included to account for any potential bias that might result from the growing number
of households that have only a mobile phone and no landline. Studies suggest that about 15% of
adults live in households that have only a wireless phone (Blumberg & Luke, 2009). A two-stage
weighting procedure was used to weight this dual-frame sample. A first-stage weight was
15
assigned to account for dual-users (landline and mobile phone) and that they were included in
both sample frames. The second stage of weighting balanced sample demographics to population
parameters. The sample was balanced to match national population parameters for sex, age,
education, race, Hispanic origin, region (US Census definitions), population density, and
telephone usage. The basic weighting parameters were taken from a special analysis of the
Census Bureau’s 2007 Annual Social and Economic Supplement (ASEC) that included all
households in the continental United States that had a telephone. The mobile phone usage
parameter was from an analysis of the July-December 2006 National Health Interview Survey.
Measures and Analyses
Core discussion networks were measured using the same question that was used in the 1985 and
2004 GSS. Participants were asked:
From time to time, most people discuss important matters with other people.
Looking back over the last six months, who are the people with whom you
discussed matters that are important to you?
Unlike the GSS, this question was followed by a second name generator:
Now let’s think about people you know in another way. Looking back over the last
six months, who are the people especially significant in your life?
When participants were read the second name generator, they were reminded that the names they
provided “may be the same people you just mentioned or they may be other people.” In response
to each name generator, participants could list the first name or initials of up to five people (up to
ten unique names in total). Unlike the GSS, this survey did not note if participants continued to
list additional names after the interviewer had recorded the maximum of five names per
generator. The lists of names from the two generators were combined, and, like the GSS,
16
participants were asked a series of question about each name they listed. To minimize any bias
from the context of previous survey questions, fatigue, or noncooperation, the name generators
were located close to the start of the survey and after a small number of questions about Internet
use.
Our operationalization of network size, based on the “important matters” name generator,
is consistent with previous studies. This question elicits the names of a “close set of confidants
who are probably routinely contacted for talk about both mundane and serious issues, whatever
those might be for a given respondent” (McPherson et al., 2006). The network question does not
measure discussion about a specific “important matter,” indeed there is considerable diversity in
the “important matters” people discuss with core confidants (Bearman & Parigi, 2004). Network
questions of this nature tend to provide a measure of the participant’s core interpersonal network
of strong, highly clustered, close ties, rather than whatever was specifically asked (Bailey &
Marsden, 1999; Brewer, 1995; Burt, 1986; Burt, 1997; Marin, 2004). Those individuals listed in
response to the “important matters” name generator tend to be the same people listed in response
to a name generator that asks for “political discussants” (Klofstad, McClurg, & Rolfe, 2009) or
even “significant people” (Straits, 2000). This tendency was relied on to test our hypothesis that
there has been a change in how people respond to a name generator about their discussion
networks. Specifically, if the meaning of “discuss” has changed, then a shift is expect to be
observed, such that Internet and mobile phone users are more likely than nonusers to have people
in their lives who are “especially significant,” but with whom they do not discuss important
matters. If Internet and mobile phone users are no more likely to list additional names in the
second name generator, then one can conclude that there has been no significant change in how
technology use influences response to the “important matters” name generator. However, if
17
people in general provide an unusually high number of unique names to the “especially
significant” name generator, this may be evidence of a cultural shift in how people respond to a
name generator about “important matters”. Important “matters” (plural) may be too broad to
represent the specific issues discussed with close social ties.
Previous analyses of the GSS social network data pertaining to the diversity of core
discussion networks have focused on the kin/nonkin composition of the networks (Marsden,
1987; McPherson et al., 2006). This operationalization of diversity, which is replicated here, is
based on the finding that core networks tend to be highly homophilous, but that kin are likely to
be more similar across a range of measures than are nonkin (McPherson, Smith-Lovin, & Cook,
2001). For each name provided in response to the two name generators, participants were asked
an open-ended question to describe how each person was connected to them. The connection was
coded by the interviewer into the categories used in the 1985/2004 GSS to indicate a kinship or
nonkinship tie (e.g., parent, workmate, neighbor, etc.). In the work of McPherson et al. (2006),
they coded any name given by a respondent as a “nonkin” if the person were identified by the
participant as having a connection classified as “co-worker,” “friend,” “advisor,” “neighbor,” or
“group member,” even if she/he was also identified by the respondent as being a spouse, parent,
sibling, child, or other family member.i A stricter interpretation was used in our analysis for
who could be nonkin; if a name given by a participant was identified as a spouse, parent, sibling,
child or other family relationship, that name could not also be coded as nonkin. In addition to
established measure of diversity based on the presence of nonkin, a second measure was
introduced that examined variation in perceived political homophily of core discussion networks.
The analysis is limited to only those respondents who consider themselves a Republican or a
Democrat. Those who considered themselves to be Independent were excluded. A cross-party
the
18
confidant existed if a respondent who self-identified as a Republican said that at least one of the
people they listed as a discussion confidant was a Democrat, or vice-versa.
Previous studies have identified variation in social network size based on Internet use at
home and work (Nie, Hillygus, & Erbring, 2002), very frequent use (Mesch, 2003; Mesch,
2001), and type of use (Zhao, 2006). For this reason, use of new information and communication
technologies were conceptualized as more than a simple dichotomy of use/non-use. Participants
reported whethere they were Internet users (76.5%), mobile phone users (81.6%), frequent users
at home (22.1%) and work (24.5%), as well as whether they used specific technologies that were
classified as ”social media.” These are Internet technologies with some sort of interactive
component, which stand in contrast to “traditional” or “passive” media. The specific social
media examined included social networking services (29.5%) (e.g., Facebook, Linkedin,
MySpace), instant messaging (30.9%) (e.g., AIM, ICQ, Yahoo! Messenger) uploading photos to
share online (34.8%) (e.g., Flickr), and blogging (10.0%) (e.g., Blogger, Wordpress).
A series of regression analyses were conducted to test the relationship between the use of
new media and network size and diversity. These models controlled for a number of
demographic variables that are known to be related to network size and diversity: age, race,
ethnicity, educational attainment, marital status, and the presence of children in the home
(Kalmijn, 2003; Marsden, 1987; McPherson et al., 2006). Because of the nonlinear relationship
among age, network size and diversity, the square of age was also entered in the models in this
study. Poisson regression, appropriate when the outcome variable is count data (e.g., ranges from
0 to 5 ties), was used to model the outcome variable of network size. The ratio of the deviance to
the degrees of freedom was 1.01; suggesting a strong fit between the Poisson distribution and the
19
data. Logistic regression, appropriate when the outcome variable is a dichotomy, was used to
model the two outcome measures pertaining to network diversity.
Unlike the GSS, which was administered face-to-face in participants’ homes, this survey
was administered to participants on a land line or cellular telephone. In general, telephone
surveys have a lower response rate than face-to-face interviews. The response rate for this survey
was 21% for the sample interviewed on a land line telephone and 22% for the sample
interviewed on a mobile phone. This compares with a response rate of 70% for the 2004 GSS. It
is not known how variation in response rate influences the reliability of the measures presented
in this paper. However, it is known that higher levels of nonresponse can lead to bias in related
measures, such as estimates of volunteer activity that are too high. However, in the case of
measures of volunteer activity, it is also known that these inflated measures do not affect
inferences about individual characteristics (Abraham, Helms, & Presser, 2009). Again, it is not
known if the number of core network member participants reported is subject to the same
inflation as a result of nonresponse. It is possible that people have an easier time recalling names
in the context of a longer personal interview in the home than when talking on the telephone.
However, the experience of the 2004 GSS, in which 22% of interviews were completed on the
telephone with hard-to-reach participants, suggests that this is not the case. In the 2004 GSS,
there was no zero-order difference in the percentage of respondents who reported having no
discussion confidants when in-person and telephone interviews were compared (Fischer, 2009).
Therefore, although there is no evidence of a response bias in this survey, if one exists, it is
expected to have little influence on the size of core networks that participants reported and to
introduce no bias into the inferences drawn, based on individual characteristics.
20
FINDINGS
Social Isolation
It was hypothesized that in comparison to the 1985 GSS, there has been little or no change in the
level of social isolation in America. That is, people today are no more likely than they were in
1985 to report that they have no one with whom they discuss important matters. Our findings,
reported in Table 1, are that 12.0% of the population has no core discussion ties. This compares
to 8.1% from the 1985 GSS and 22.5% from the 2004 GSS.ii A two-proportion z-test suggests
that the number of people who reported no confidants in 2008 is statistically higher than was
reported in the 1985 GSS (p<.001). A 50% increase in social isolation over two decades
represents a substantive change, but it is not nearly as notable as the report by McPherson et al.
(2006) that social isolation has “nearly tripled.”
[Table 1]
Network Size
For comparative purposes, in Table 1, data are reported from the 1985 and 2004 GSS that have
been structured to match our measure of network size; the number of core discussion ties has
been capped at 5 (removing the small, but ambiguous category from the GSS of “more than 5”).
We found that the average American has a mean discussion network of 1.93 ties, remarkably
similar to the 2.06 derived from the 2004 GSS.iii Although the mean is nearly identical, most
respondents to the Pew survey maintained that they had one discussion partner; the modal
response to the 2004 GSS was zero. Like McPherson et al. (2006), findings show that there has
been a decline in the average number of reported core discussion confidants since 1985, in the
order of one confidant. It is also interesting to note that the smaller proportion of isolates
21
identified in the 2008 survey, when compared to the 2004 GSS, does not account for the drop in
mean discussion partners.
To test the hypothesis that Internet and mobile phone use are not associated with having a
smaller number of core discussion confidants, in Table 2 the relationship between the number of
discussion partners and different uses of new media are modeled, using a Poisson regression
analysis.
The regression reveals a significant, positive relationship between the size of core
discussion networks, mobile phone ownership, and the use of two types of social media: instant
messaging and uploading photos to share online. No relationship between network size, frequent
Internet use at home or work, or other Internet activities was found.
• Mobile phone ownership is associated with a network that averages 12% additional
confidants.
• Those who uploaded photos to a website to share online tend to have core discussion
networks that are 9% larger.
• Those who utilized instant messaging tend to have networks with 9% more confidants.
[Table 2]
Combined, those who have a mobile phone and use the Internet for instant messaging and
photo sharing have core discussion networks that average 34% larger than those who do not use
these technologies. The magnitude of the relationship between the use of these technologies and
the size of core discussion networks is particularly impressive when compared to the relationship
between network size and known network “boosters,” such as educational attainment. Nine years
of education would be required to account for an equivalent boost in network size. For example,
an average 45-year-old, white, or African-American female with a high school diploma has 1.67
22
confidants. If this hypothetical individual owns a mobile phone, uses instant messaging, and
shares photos online, their average network size would be 2.23 ties. A similar hypothetical
person who does not use this technology but has the equivalent of four years of graduate level
education would average 2.25 ties.
As hypothesized, Internet and mobile phone use are not associated with having a smaller
number of core confidants. Quite the contrary, mobile phone users and those who use “social
media,” specifically instant messaging and uploading photos to share online, tend to have larger
core discussion networks.
Network Diversity
Analysis of the GSS, reported in Table 1, reveals that in 1985, 63.8% of the population had at
least one nonkin confidant. In the 2004 GSS, this number dropped to 47.7%, suggesting a
significant decline in the diversity of American’s core discussion networks.iv This survey closely
replicates the findings of the 2004 GSS; we found that only 44.7% of the population had at least
one nonkin confidant.
[Table 3]
In Table 3 logistic regression is used to model the likelihood that those who use new
information and communication technologies have at least one nonkin confidant. As with the
previous regression, a number of standard demographic variables are controlled for. As
hypothesized, we did not find a negative relationship between mobile phone ownership or
Internet use and the likelihood of having a nonkin confidant. In fact, findings show that the
Internet users were 55% more likely than nonusers to discuss important matters with someone
outside of their family. We did not find any significant variation in the likelihood of having a
nonkin discussion confidant and frequency of use at home or at work or use of any “social
23
media.” Existing research findings suggests that education is a strong predictor of network
diversity. When the relative importance of Internet use is compared to education level, findings
show that Internet use has the same effect on the likelihood of having a discussion confidant
outside the family as having approximately nine years of education.
[Table 4]
Table 4 reports the results of a logistic regression that predicts perceived political
homophily – the likelihood of a reported cross-party core discussion confidant. This measure
goes beyond a simple kin/nonkin comparison and captures a more direct measure of discussion
diversity. As hypothesized, there is no negative relationship between the use of new information
and communication technologies and this second measure of diversity. We did find that the use
of social media, specifically uploading photos to share online, was associated with a higher
likelihood of reporting a cross-party discussion confidant. Those who use the Internet to share
digital photographs are 61% more likely to report a cross-party discussion tie.
Important Matters
It has been suggested that the introduction of the Internet or mobile phones may have changed
how people respond to a question about “discussion” confidants; that is, the use of computer or
tele-mediated communication may lead them to exclude close social ties with whom they have
significant communication that does not involve face-to-face “discussion.” If this is the case, it
would be expected that those who use new technologies are more likely to list unique names in
response to the “especially significant” question, i.e., names that they do not list in response to
the “discuss-important-matters” question.
We found that a large number of American’s reported “especially significant” ties that
were not discussion partners. Twenty-six percent of participants listed one, 16% listed two, and
24
18% listed between three and five people who were especially significant, but with whom they
did not “discuss” important matters. Table 5 reports the results of a logistic regression predicting
the likelihood of listing an especially significant tie who was not also a discussion confidant. As
hypothesized, we found no relationship between the use of a mobile phone or any type of
Internet use and the likelihood of listing especially significant ties that were not also discussion
partners. As a result, we conclude that it is unlikely that a large scale cultural change in the
meaning of “discuss” among those who use new information and communication technologies
has altered responses to the important matters name generator. However, there is some evidence
of a large-scale change in how people in general tend to respond to the important matters
question.
[Table 5]
The finding that 60% of respondents listed “especially significant” social ties who were
not discussion partners is surprising; given that existing research suggests that there should be a
high degree of overlap between names elicited from the “important matters” name generator and
the alternative “especially significant” generator. The low explained variance (R2 = 0.015) points
to what little success our model had in explaining the likelihood of listing additional ties as a
result of both new media and traditional demographic predictors. Some of the extra names are
likely explained by an implicit social pressure for respondents to provide interviewers with new
names in response to a new question (even though the wording of the question explicitly
instructed respondents that they could provide the same or no names). However, we do not
believe that this alone accounts for the number of unique names. Unfortunately, nationally
representative, historical data on how people respond to a name generator that elicits core ties
based on a question about “especially significant” does not exist. In our own analysis, the names
25
elected from the “important matters” question cannot simply be substituted with names from the
“especially significant” generator to replicate the analysis of McPherson et al. (2006). Given that
in the 2008 Pew survey the “especially significant” question was asked second in a series of
name generators, there is likely to be a degree of respondent fatigue that reduced the likelihood
that respondents listed names provided in response to the first name generator. However, by
combining the names elicited from both name generators, we can still offer some comparisons.
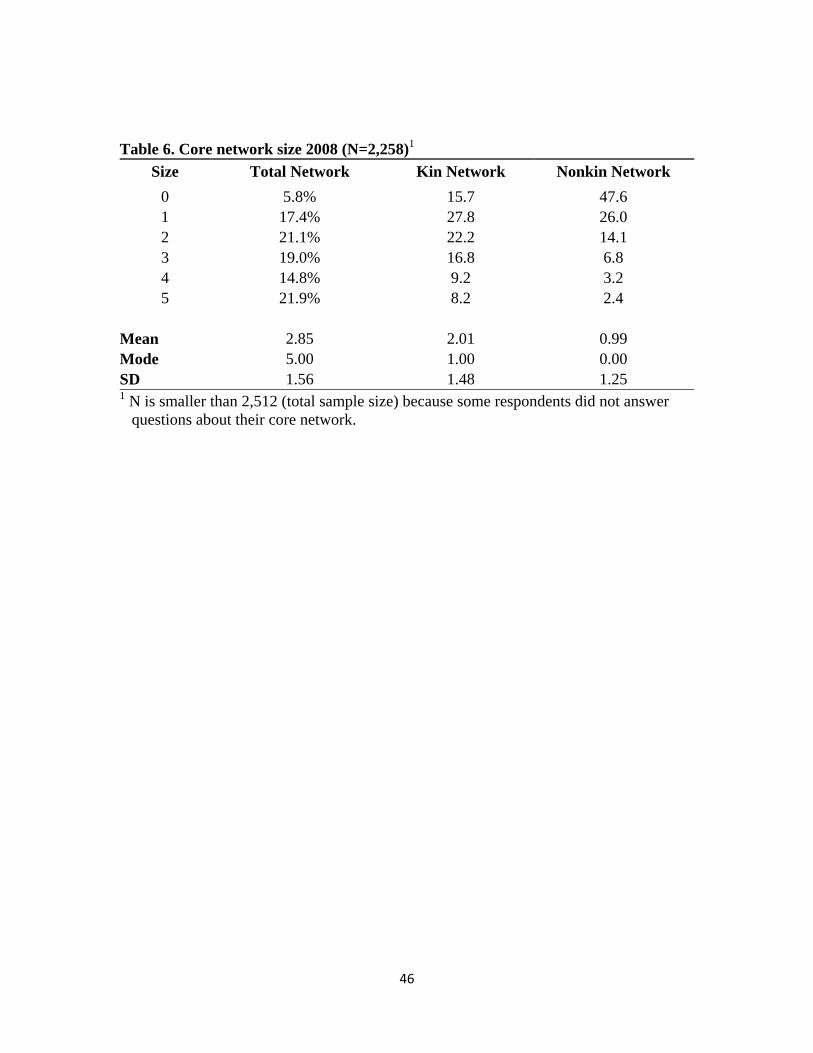
[Table 6]
Table 6 combines the unique names that were elicited in response to the “important
matters” and the “especially significant” name generators. The data have been structured to
match our measure of network size, which is capped at 5 ties. We find that the mean core
network size, 2.85, is nearly identical to the mean of 2.98 from the GSS “important matters”
generator in 1985 (Table 1). The model response of 5 is also identical to 1985. The combined
core network measure from 2008 suggests that there is slightly less, not more social isolation,
5.8% of the population compared to 8.1% in 1985. The 2008 distribution of network size is
modestly skewed in comparison to 1985, with more people who have networks of only 1 or 2
core ties at the expense of networks of 3 or more. Using the combined core network measure
from 2008, only half (52.4%) of Americans had anyone outside of their family who was a
member of their core network. Although this is a slight improvement over the 47.7% generated
by the 2004 GSS (Table 1), it still represents a substantial decline in core network diversity when
compared to the 63.8% of the population that had at least one nonkin confidant in 1985.
Our combined measure of core networks is not directly comparable to the “important
matters” generator from the 1985 and 2004 GSS. It likely inflates network size. However,
because of the expected overlap in names between the “important matters” and “especially
26
significant” generators, the measure of social isolation should be less biased. A finding that the
combined measure shows less social isolation than in 1985 cannot be ignored.v
DISCUSSION
This study tested the relationship between Internet and mobile phone use and the size and
diversity of people’s core networks. We respond to the conclusions of McPherson et al. (2006),
who found that since 1985, people have become increasingly socially isolated and that the
average size and diversity of core discussion networks has declined. McPherson et al. argue that
one likely cause for this network contraction is the use of the Internet and mobile phone.
In support of our hypotheses, findings reveal that neither Internet nor mobile phone use is
associated with having fewer core discussion confidants, or having less diverse ties with whom
to discuss important matters. As predicted, mobile phone ownership and specific Internet
activities – the use of certain “social media” – were found to be associated with having a larger
number of confidants. Although we expected a broad spectrum of social media to be associated
with larger core discussion networks our findings were more specific. Most social media offer
either no affordances for core social ties, or affordances that might be specific to weaker social
relations (Hampton, Lee, & Her, 2010). Only sharing photos online and instant messaging were
found to be associated with having a larger number of discussion confidants. No positive
relationship between mobile phone ownership and the likelihood of having nonkin or cross-
political discussion confidants was found. Yet, Internet use in general was found to be positively
related to the likelihood of having a confidant who is not a family member. Among the various
“social media,” only the specific activity of uploading photos to share online was found to be
associated with a higher likelihood of reporting a discussion confidant from a different political
party. Although the relationship between Internet and mobile phone use and network size and
27
diversity was more specific than expected, all of our findings related to the use of new
technology are neutral or in the positive direction. The magnitude of these relationships is very
strong in comparison to other factors, such as education, that are known to contribute to network
size and diversity.
Based on the “important matters” name generator, it was found that social isolation had
increased from 8.1% in 1985 to 12.0% in 2008, much less than the 22.5% reported by
McPherson et al. (2006). This finding is consistent with speculation by Fischer (2009) that 15-
20% of all 2004 GSS respondents were incorrectly scored as having listed zero names, in place
of 1-5 discussion confidants. In addition, we suspect that there are substantive measurement
differences between the 1985 GSS, 2004 GSS, and the 2008 Pew surveys. These differences
include nonresponse bias in the 1985 GSS (which was adjusted for in the weighting of the GSS
from 2004 forward, but cannot be adjusted for surveys before 2004) ; unknown but possible
response bias in the 2008 Pew survey (related to the use of telephone in place of face-to-face
interviews); and variation between the 1985 and 2004 surveys in respondent fatigue and
contextual effects to which the “important matters” question is highly susceptible (Fischer,
2009). The hypothesis that the level of social isolation found by the 2008 Pew survey and the
2004 GSS is equivalent (p.>05) could not be rejected if as few as 15 additional cases out of
1,531 in 1985 had reported no discussion confidants and 20 cases out of 2,162 in 2008 had
reported at least one confidant. Such modest variation as a result of measurement error seems
possible, if not certain. This is further complicated if one considers evidence of a large-scale
change in how people respond to a name generator about “important matters.” An alternative
measure of social isolation based on a combination of discussion confidants and others who are
especially significant suggests a reversed trend; isolation may have declined. As such, the overall
28
evidence supports a conclusion that there has not been a substantive change in the level of social
isolation over the past two decades.
While we found that there has been little change in social isolation, the mean number of
discussion confidants reported in the Pew 2008 survey and the 2005 GSS is lower than what was
reported in 1985, core discussion networks of about two people, a loss of one person. We present
some evidence to suggest that a change in how people think about “important matters” may
partially explain this decline. However, even with this consideration, it is possible that there has
been at least a modest decline in reported core network size.
The findings of McPherson et al. (2006) as they pertain to the diversity of core discussion
networks were also verified. Our stricter measure of what constitutes “nonkin” suggests that the
decline in network diversity is not as steep as had been previously reported (McPherson et al.,
2006). Yet the number of people who report that they discuss important matters with someone
outside of their family has declined from 63.8% of the population in 1985 to about 44.7% in
2008. Our analysis, even when considering the possibility of a change in how people interpret
the meaning of “important matters,” suggests that this decline in reported diversity is real and
substantive.
The Internet and mobile phones play a role within core networks that they did not in the
1980s. But, there is no evidence that use of these technologies diminishes the size or diversity of
core networks. Quite the opposite is true: mobile phone users and those who use the Internet,
especially specific social media, are more likely to have larger and more diverse core networks.
However, this does not imply causation. It cannot be concluded definitively that technology use
leads to larger and more diverse networks – although we believe this to be true. New media users
may simply be experiencing network attrition at a slower rate than the remainder. Given what we
29
know about the relationship between digital inequality and traditional inequalities – those
without the technology tend to have lower levels of social engagement (DiMaggio, Hargittai,
Celeste, & Shafer, 2006; Hampton, 2007) – this possibility cannot be dismissed. There is also a
third possibility that may also explain some of the findings about the use of social media and
core network diversity: “pervasive awareness.”
On the surface, the finding that the use of specific social media is related to higher
network diversity seems difficult to interpret, possibly even spurious. For example, uploading
photos online to share with others was found to be associated with reporting a cross-party
discussion confidant. However, we argue that those media that offer ongoing and possibly
unexpected glimpses into the characteristics of network members, such as what can be provided
through the regular exchange of digital photographs, increases awareness of personal attributes
that were already present but unobserved. The pervasive awareness offered by certain social
media, i.e., the push of personal information through social media about and from network
members, may simply provide information that was always there but never before transmitted.
Unlike the past, when core network members primarily exchanged information through planned
and synchronous encounters, new media affords pervasive and primarily asynchronous
exchanges. Pervasive awareness affords frequent, short, asynchronous exchanges that are
ambient, or otherwise integrated into everyday life. Contrary to concerns that new media lack
social presence (Short, Williams, & Christie, 1976) and media richness (Daft & Lengel, 1984),
the pervasive and persistent nature of some new media may allow for more information to be
shared overtime than through traditional encounters. Whether as a result of a general tendency to
assume that we share more in common with core network members than we truly do (Baldassarri
& Berman, 2007; Goel, Mason, & Watts, 2010), taboos about the discussion of specific topics
30
(such as religion and politics), reluctance to reveal differences between strong ties, or simply
inopportunity to explore specific opinions or affiliations, the use of new media makes some
personal characteristics more observable than in the past. New technologies may not increase
diversity as much as they increase awareness of diversity that was always there.
This same pervasive awareness may also explain a cultural shift in how people respond to
a question that enumerates those with whom people discuss “important matters.” The increased
social interaction afforded by the Internet and mobile phones may exaggerate an existing trend of
social specialization that started with other large-scale technological and social changes
(Durkheim, 1893). We do not discuss “important matters” because we have nothing to say, but
rather because “matters” (emphasis on the plural) is too broad a category to capture the
specialized nature of interaction with members of our core network. Close ties may be as
intimate and as “especially significant” as they were in the past, but the matters that we discuss,
both serious and mundane, may be more specialized with each individual – possibly as a result of
the extra information we glean about network members through our use of new technologies.
This may explain why other studies that measure the number of close social ties have found little
change in social isolation, such as the 1998 GSS question about “good friends you feel close to”
(Fischer, 2009), or even found an increase in network size (Wang & Wellman, 2010). While our
study did not find that users of new media were more likely to have especially significant others
with whom they did not discuss important matters, this may be because the network externalities
of nonuser’s networks sweeps them into the same trend of network specialization, such that
differentiation is not possible based on individual usage patterns. The long-term implications of
this trend, in terms of how it will influence the provision of everyday and emergency social
support, political deliberation, and exposure to diverse ideas and opinions are not immediately
31
32
clear. Most likely, we will discover, that we continue to give and receive support, although
perhaps not from the same people or places, and we will continue to participate in a deliberative,
although perhaps as a result of increased specialization, a more polarized democracy. That is,
unless the affordances of pervasive awareness are significant and broad enough to increase our
overall network diversity (Hampton et al., 2010), or at least increase awareness of diversity
within our core networks.
i This approach is consistent with how McPherson et al. (2006) presented “nonkin network size,”
but inconsistent with how the “at least one nonkin confidant” variable was presented.
ii All cases are weighted to reflect the population. Cases from the 1985 GSS are weighted as a
function of the number of adults in the household (ADULTS). Cases from the 2004 GSS are
weighted using the variable WTSSNR.
iii As a result of recoding the “more than 5” category from the GSS data, and minor coding errors
that have been corrected in the 2004 GSS dataset (Smith, 2008), the means and standard
deviations reported in Table 1 are slightly different than those reported by McPherson et al.
(2006).
iv When the 1985 and 2004 GSS were reanalyzed with our stricter interpretation of “nonkin,” the
difference between the 1985 and 2004 GSS in the number of Americans who report at least one
nonkin confidant was considerably smaller. Previously, the percent of Americans with at least
one nonkin confidant in 1985 was reported as 80.1% and in 2004 as 57.2% (Marsden 1987;
McPherson et al. 2006).
v To test the possibility that the relationship between new technology use and network size and
diversity does not hold based on the combined core network measure from 2008, the earlier
analysis of network size based on the single “important matters” name generator was replicated.
Because the findings of this analysis largely replicate the pattern found based on “important
matters” alone, they are not shown here, but can be found at URL:
http://www.mysocialnetwork.net/ics/supplement.pdf.
33
REFERENCES
Abraham, K., Helms, S., & Presser, S. (2009). How Social Processes Distort
Measurement. American Journal of Sociology, 114(4), 1129-1165.
Bailey, S., & Marsden, P. V. (1999). Interpretation and Interview Context. Social
Networks, 21, 287-309.
Baldassarri, D., & Berman, P. (2007). Dynamics of Political Polarization. American
Sociological Review, 72(5), 784-811.
Bearman, P., & Parigi, P. (2004). Cloning Headless Frogs and Other Important Matters.
Social Forces, 83(2), 535-557.
Blumberg, S. J., & Luke, J. V. (2009). Wireless Substitution. Hyattsville, MD: U.S.
Department of Health & Human Services.
Boase, J., Horrigan, J., Wellman, B., & Rainie, L. (2006). The Strength of Internet Ties.
Washington, DC: Pew Internet & American Life Project.
Brewer, D. D. (1995). Patterns of Recall of Persons in a Department of a Formal
Organization. Journal of Quantitative Anthropology, 282-284.
Burt, R. (1986). A Note on Sociometric Order in the General Social Survey Network
Data. Social Networks, 8, 149-174.
Burt, R. S. (1997). A Note on Social Capital and Network Capital. Social Networks, 19,
355-373.
Castells, M. (1996). The Rise of the Network Society. Oxford: Blackwell.
34
Cohen, S. (2004). Social Relationships and Health. American Psychologist, 59(8), 676-
684.
Daft, R., & Lengel, R. (1984). Information Richness. In L. L. Cummings & B. M. Staw
(Eds.), Research in Organizational Behavior (pp. 191-233). Greenwich, CT: JAI.
Dewey, J. (1927). The Public and Its Problems. New York: Holt.
Dickens, C. M., McGowen, L., Percival, C., Douglas, J., Tomensen, B., Cotter, L., et al.
(2004). Lack of Close Confidant, but Not Depression, Predicts Further Cardiac
Events after Myocardial Infraction. Heart, 90(5), 518-522.
DiMaggio, P., Hargittai, E., Celeste, C., & Shafer, S. (2006). From Unequal Access to
Differentiated Use. In D. B. Grusky & S. Szelényi (Eds.), The Inequality Reader
(pp. 549-565).
Durkheim, E. (1893). The Division of Labor in Society (1993 Edition) (1993 ed.). New
York: Macmillan.
Erickson, B. (1997). The Relational Basis of Attitudes. In B. Wellman & S. D. Berkowitz
(Eds.), Social Structures: A Network Approach (pp. 99-122). Greenwich, CT: JAI
press.
Fischer, C. (2009). The 2004 GSS Finding of Shrunken Social Networks: An Artifact?
American Sociological Review, 74(4), 657-669.
Gennaro, C. D., & Dutton, W. H. (2007). Reconfiguring Friendships. Information,
Communication & Society, 10(5), 591 - 618.
35
Gergen, K. J. (2008). Mobile Communication and the Transformation of the Democratic
Process. In J. E. Katz (Ed.), Handbook of Mobile Communication Studies (pp.
297-310). Cambridge, MA: MIT Press.
Goel, S., Mason, W., & Watts, D. (2010). Real and Perceived Attitude Homophily in
Social Networks. Yahoo! Research.
Habermas, J. (1984). The Theory of Communicative Action. Boston: Beacon Press.
Hampton, K. N. (2007). Neighborhoods in the Network Society: The E-Neighbors Study.
Information, Communication and Society, 10(5), 714-748.
Hampton, K. N., Lee, C. J., & Her, E. J. (2010). How New Media Afford Network
Diversity: Direct and Mediated Access to Social Capital through Participation in
Local Social Settings. Unpublished working paper. Annenberg School for
Communication, University of Pennsylvania.
Hampton, K. N., Livio, O., & Sessions, L. F. (in press). The Social Life of Wireless
Urban Spaces: Internet Use, Social Networks, and the Public Realm. Journal of
Communication.
Hampton, K. N., & Wellman, B. (2003). Neighboring in Netville: How the Internet
Supports Community and Social Capital in a Wired Suburb. City and Community,
2(3), 277-311.
Humphreys, L. (2005). Cellphones in Public. New Media & Society, 7(6), 810-833.
Hurlbert, J. S., Haines, V. A., & Beggs, J. J. (2000). Core Networks and Tie Activation.
American Sociological Review, 65, 598-618.
Jamieson, K. H., & Cappella, J. N. (2008). Echo Chamber. Oxford: Oxford.
36
Kalmijn, M. (2003). Shared Friendship Networks and the Life Course. Social Networks,
25, 231-249.
Katz, E., & Lazarsfeld, P. (1955). Personal Influence. Glencoe, IL: Free Press.
Kim, H., Kim, G. J., Park, H. W., & Rice, R. E. (2007). Configurations of Relationships
in Different Media. Journal of Computer-Mediated Communication, 12(4), article
3[URL: http://jcmc.indiana.edu/vol12/issue14/kim.html].
Klinenberg, E. (2002). Heat Wave. Chicago: The University of Chicago Press.
Klofstad, C. A., McClurg, S. D., & Rolfe, M. (2009). Measurement of Political
Discussion Networks. Public Opinion Quarterly, 73(3), 462-483.
Kraut, R., Kiesler, S., Boneva, B., Cummings, J., Helgeson, V., & Crawford, A. (2002).
Internet Paradox Revisited. Journal of Social Issues, 58(1), 49-74.
Kraut, R., Patterson, M., Lundmark, V., Kiesler, S., Mukhopadhyay, T., & Scherlis, W.
(1998). Internet Paradox: A Social Technology That Reduces Social Involvement
and Psychological Well-Being? American Psychologist, 53(9), 1017-1031.
Ling, R. S. (2008). New Tech, New Ties. Cambridge, MA: MIT Press.
Lofland, L. (1998). The Public Realm. New York: Aldine de Gruyter.
Marin, A. (2004). Are Respondents More Likely to List Alters with Certain
Characteristics? Social Networks, 26(4), 289-307.
Marlow, C. (2005). The Structural Determinants of Media Contagion. Unpublished
Doctoral dissertation, MIT, Cambridge, MA.
Marsden, P. (1987). Core Discussions Networks of Americans. American Sociological
Review, 52(1), 122-131.
37

McPherson, M., Smith-Lovin, L., & Brashears, M. E. (2006). Social Isolation in
America. American Sociological Review, 71(3), 353-375.
McPherson, M., Smith-Lovin, L., & Brashears, M. E. (2008). The Ties That Bind Are
Fraying. Contexts, 7(3), 32-36.
McPherson, M., Smith-Lovin, L., & Brashears, M. E. (2009). Models and Marginals:
Using Survey Evidence to Study Social Networks. American Sociological Review.
McPherson, M., Smith-Lovin, L., & Cook, J. M. (2001). Birds of a Feather. Annual
Review of Sociology, 27, 415-444.
Mesch, G. (2003). The Family and the Internet. Social Science Quarterly, 84, 1039-1050.
Mesch, G. S. (2001). Social Relationships and Internet Use Among Adolescents in Israel.
Social Science Quarterly, 82(2), 329-339.
Mok, D., Carrasco, J.-A., & Wellman, B. (2010). Does Distance Still Matter in the Age
of the Internet? Urban Studies, 47.
Mutz, D. (2006). Hearing the Other Side. Cambridge: Cambridge University Press.
Nie, N., & Erbring, L. (2000). Internet and Society: A Preliminary Report: Stanford
Institute for the Quantitative Study of Society, Stanford University.
Nie, N., Hillygus, D. S., & Erbring, L. (2002). Internet Use, Interpersonal Relations and
Sociability: A Time Diary Study. In B. Wellman & C. Haythornthwaite (Eds.),
The Internet in Everyday Life: Oxford: Blackwell.
Olds, J., & Schwartz, R. S. (2009). The Lonely America. Boston, MA: Beacon.
Putnam, R. (2000). Bowling Alone. New York: Simon & Schuster.
38
Rainie, L., & Horrigan, J. (2005). How the Internet Has Woven Itself into American Life.
Washington, DC: Pew Internet & American Life Project.
Short, J., Williams, E., & Christie, B. (1976). The Social Psychology of
Telecommunications. London: Wiley.
Sigman, A. (2009). Well Connected? Biologist, 56(1), 14-20.
Smith, T. (2008). 2004 Social-Network Module, Draft 9/08. Memorandum, National
Opinion Research Center.
Steinfield, C., Ellison, N. B., & Lampe, C. (2008). Social Capital, Self-Esteem, and Use
of Online Social Network Sites. Journal of Applied Developmental Psychology,
29, 434-445.
Straits, B. (2000). Ego's Important Discussants or Significant People. Social Networks,
22(2), 123-140.
United States Census Bureau. (2005). Statistical Abstract of the United States: 2004-
2005. Washington, DC: U.S. Census Bureau.
Wang, H., & Wellman, B. (2010). Social Connectivity in America. American Behavioral
Scientist, 53(8), 1148-1169.
Wellman, B. (1979). The Community Question. American Journal of Sociology, 84,
1201-1231.
Wellman, B., & Wortley, S. (1990). Different Strokes from Different Folks. American
Journal of Sociology, 96(3), 558-588.
39
Wyatt, R. O., Katz, E., & Kim, J. (2000). Bridging the Spheres: Political and Personal
Conversation in Public and Private Spaces. Journal of Communication, 50(1), 71-
92.
Zhao, S. (2006). Do Internet Users Have More Social Ties? A Call for Differentiated
Analyses of Internet Use. Journal of Computer-Mediated Communication, 11(3),
article 8[URL: http://jcmc.indiana.edu/vol11/issue13/zhao.html].
40
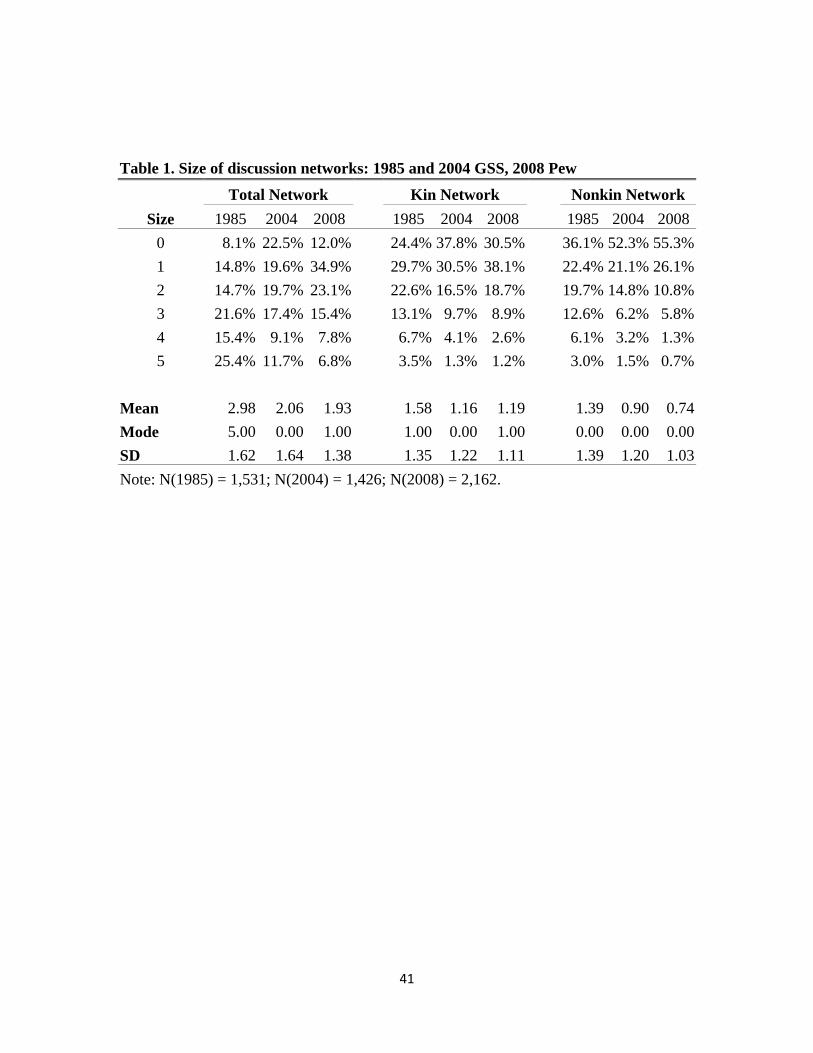
Table 1. Size of discussion networks: 1985 and 2004 GSS, 2008 Pew
Total Network Kin Network Nonkin Network Size 1985 2004 2008 1985 2004 2008 1985 2004 2008
0 8.1% 22.5% 12.0% 24.4% 37.8% 30.5% 36.1% 52.3% 55.3%1 14.8% 19.6% 34.9% 29.7% 30.5% 38.1% 22.4% 21.1% 26.1%2 14.7% 19.7% 23.1% 22.6% 16.5% 18.7% 19.7% 14.8% 10.8%3 21.6% 17.4% 15.4% 13.1% 9.7% 8.9% 12.6% 6.2% 5.8%4 15.4% 9.1% 7.8% 6.7% 4.1% 2.6% 6.1% 3.2% 1.3%5 25.4% 11.7% 6.8% 3.5% 1.3% 1.2% 3.0% 1.5% 0.7%
Mean 2.98 2.06 1.93 1.58 1.16 1.19 1.39 0.90 0.74Mode 5.00 0.00 1.00 1.00 0.00 1.00 0.00 0.00 0.00SD 1.62 1.64 1.38 1.35 1.22 1.11 1.39 1.20 1.03Note: N(1985) = 1,531; N(2004) = 1,426; N(2008) = 2,162.
41
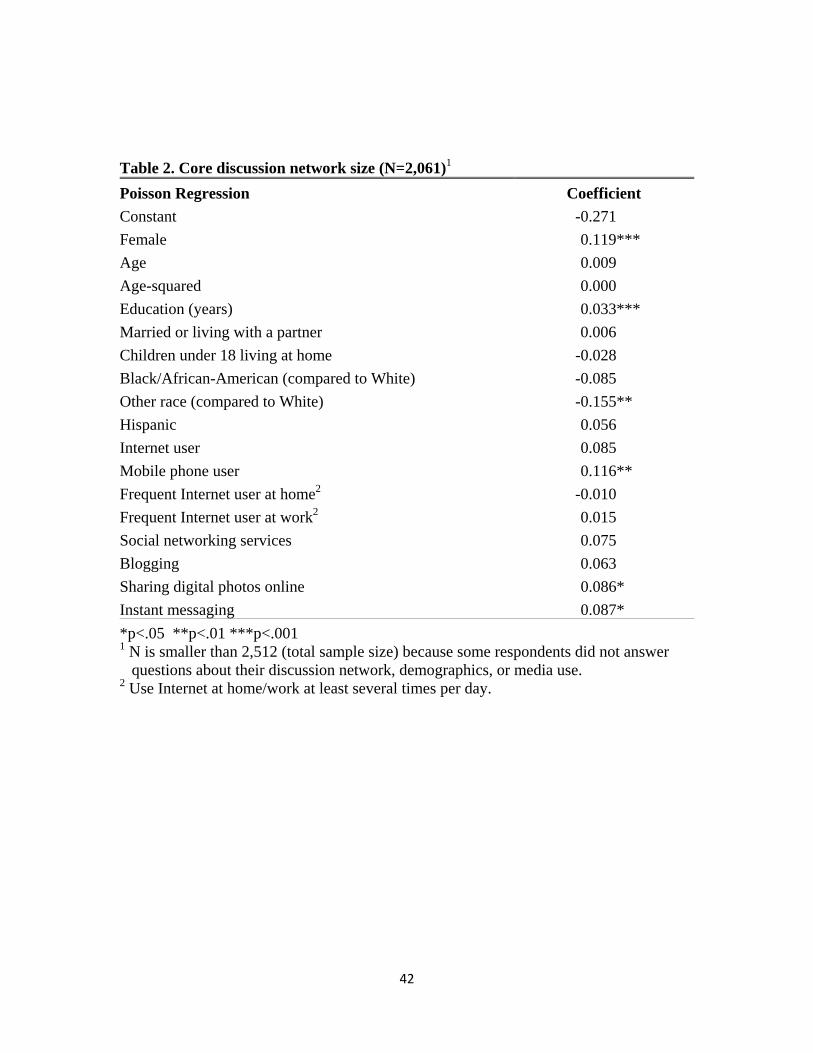
Table 2. Core discussion network size (N=2,061)1 Poisson Regression Coefficient Constant -0.271 Female 0.119*** Age 0.009 Age-squared 0.000 Education (years) 0.033*** Married or living with a partner 0.006 Children under 18 living at home -0.028 Black/African-American (compared to White) -0.085 Other race (compared to White) -0.155** Hispanic 0.056 Internet user 0.085 Mobile phone user 0.116** Frequent Internet user at home2 -0.010 Frequent Internet user at work2 0.015 Social networking services 0.075 Blogging 0.063 Sharing digital photos online 0.086* Instant messaging 0.087* *p<.05 **p<.01 ***p<.001 1 N is smaller than 2,512 (total sample size) because some respondents did not answer
questions about their discussion network, demographics, or media use. 2 Use Internet at home/work at least several times per day.
42
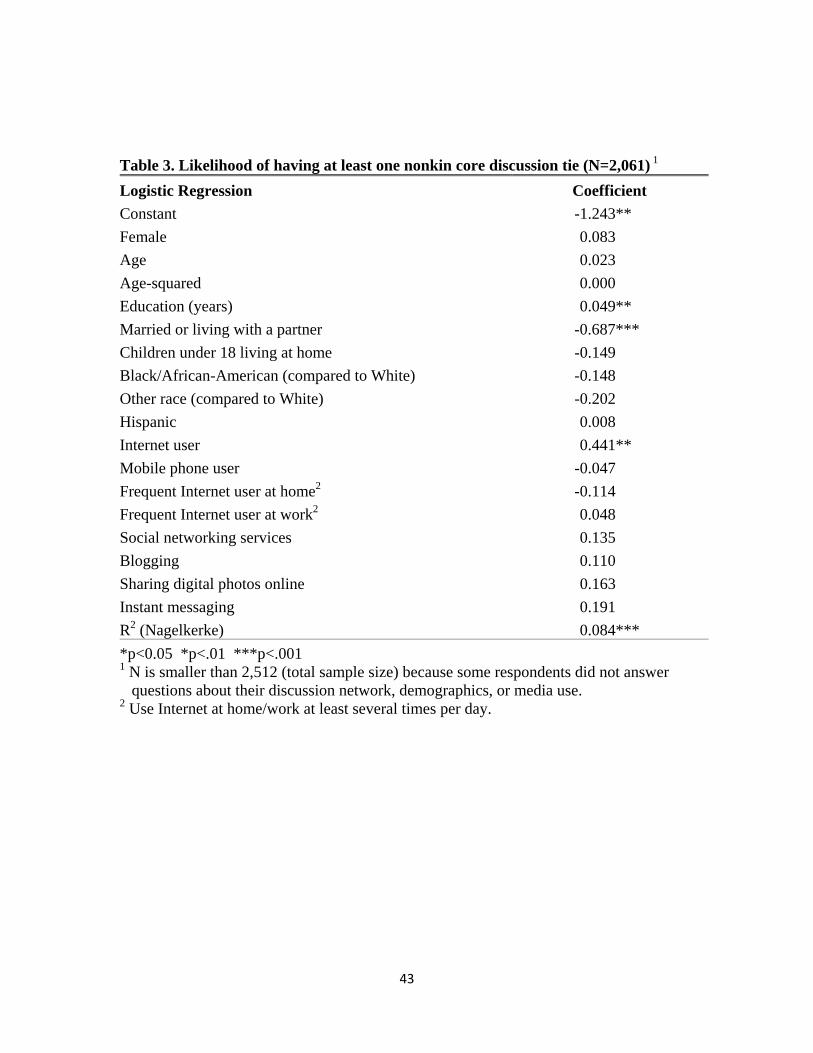
Table 3. Likelihood of having at least one nonkin core discussion tie (N=2,061) 1 Logistic Regression Coefficient Constant -1.243** Female 0.083 Age 0.023 Age-squared 0.000 Education (years) 0.049** Married or living with a partner -0.687*** Children under 18 living at home -0.149 Black/African-American (compared to White) -0.148 Other race (compared to White) -0.202 Hispanic 0.008 Internet user 0.441** Mobile phone user -0.047 Frequent Internet user at home2 -0.114 Frequent Internet user at work2 0.048 Social networking services 0.135 Blogging 0.110 Sharing digital photos online 0.163 Instant messaging 0.191 R2 (Nagelkerke) 0.084*** *p<0.05 *p<.01 ***p<.001 1 N is smaller than 2,512 (total sample size) because some respondents did not answer
questions about their discussion network, demographics, or media use. 2 Use Internet at home/work at least several times per day.
43
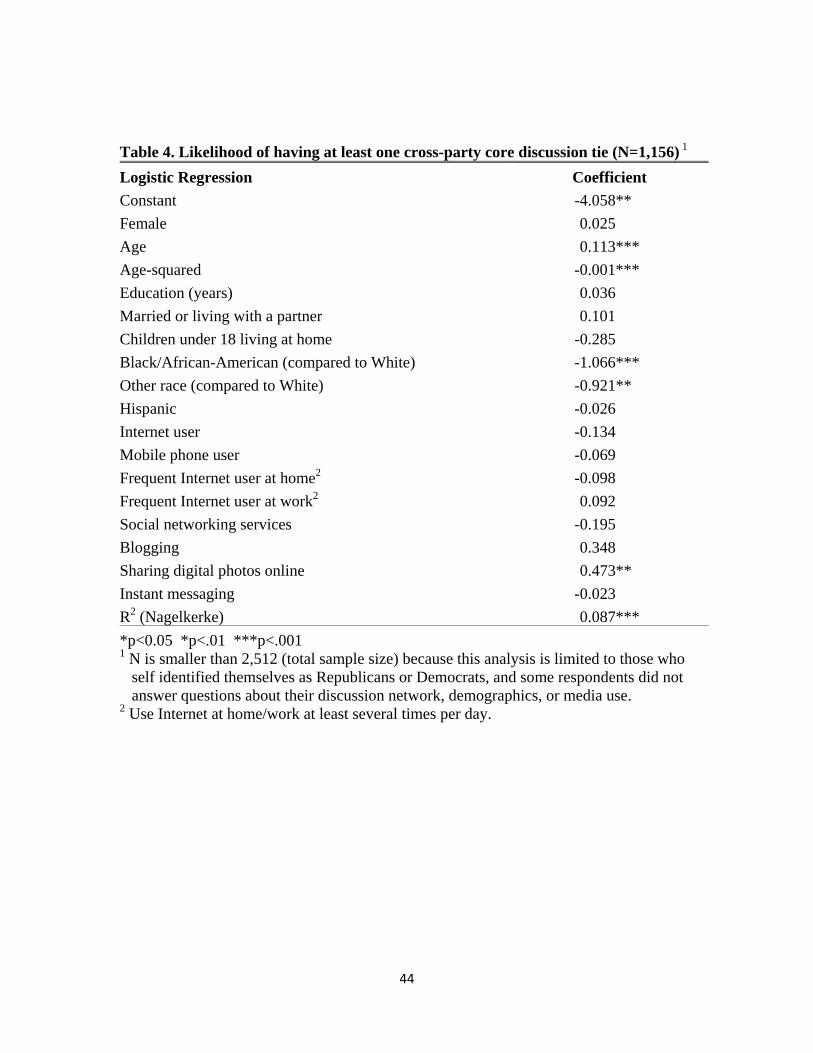
Table 4. Likelihood of having at least one cross-party core discussion tie (N=1,156) 1 Logistic Regression Coefficient Constant -4.058** Female 0.025 Age 0.113*** Age-squared -0.001*** Education (years) 0.036 Married or living with a partner 0.101 Children under 18 living at home -0.285 Black/African-American (compared to White) -1.066*** Other race (compared to White) -0.921** Hispanic -0.026 Internet user -0.134 Mobile phone user -0.069 Frequent Internet user at home2 -0.098 Frequent Internet user at work2 0.092 Social networking services -0.195 Blogging 0.348 Sharing digital photos online 0.473** Instant messaging -0.023 R2 (Nagelkerke) 0.087*** *p<0.05 *p<.01 ***p<.001 1 N is smaller than 2,512 (total sample size) because this analysis is limited to those who
self identified themselves as Republicans or Democrats, and some respondents did not answer questions about their discussion network, demographics, or media use.
2 Use Internet at home/work at least several times per day.
44
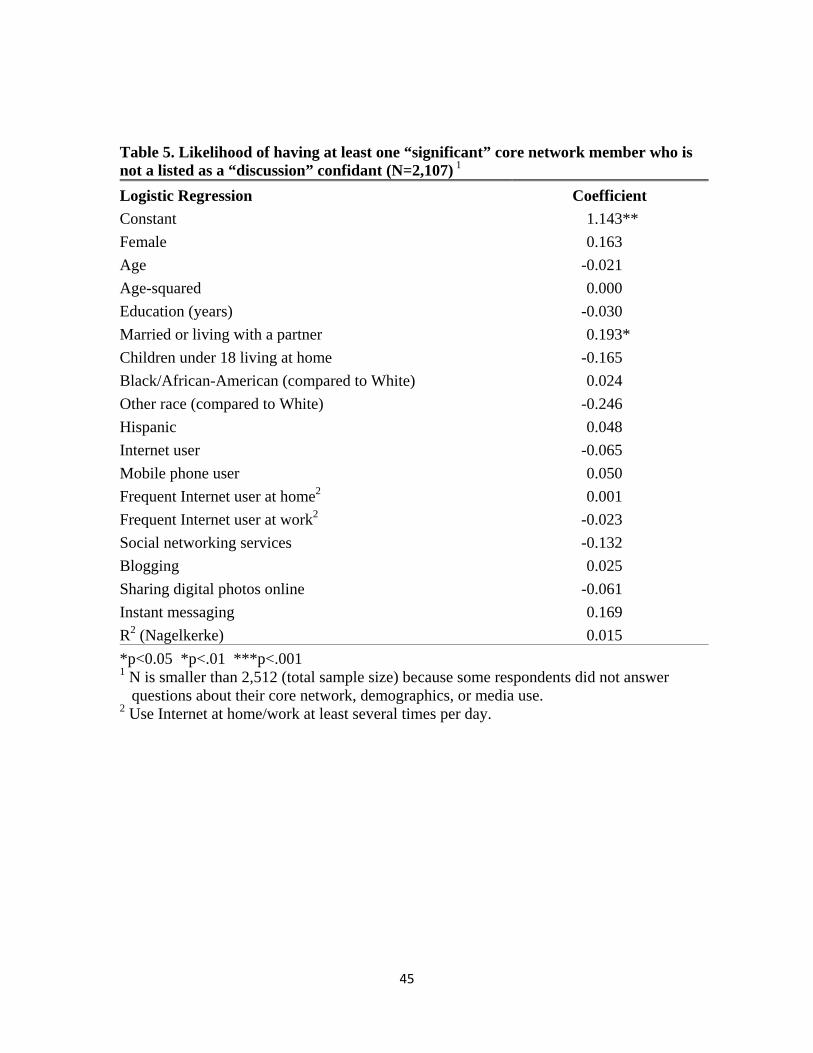
Table 5. Likelihood of having at least one “significant” core network member who is not a listed as a “discussion” confidant (N=2,107) 1 Logistic Regression Coefficient Constant 1.143** Female 0.163 Age -0.021 Age-squared 0.000 Education (years) -0.030 Married or living with a partner 0.193* Children under 18 living at home -0.165 Black/African-American (compared to White) 0.024 Other race (compared to White) -0.246 Hispanic 0.048 Internet user -0.065 Mobile phone user 0.050 Frequent Internet user at home2 0.001 Frequent Internet user at work2 -0.023 Social networking services -0.132 Blogging 0.025 Sharing digital photos online -0.061 Instant messaging 0.169 R2 (Nagelkerke) 0.015 *p<0.05 *p<.01 ***p<.001 1 N is smaller than 2,512 (total sample size) because some respondents did not answer
questions about their core network, demographics, or media use. 2 Use Internet at home/work at least several times per day.
45
46
Table 6. Core network size 2008 (N=2,258)1
Size Total Network Kin Network Nonkin Network 0 5.8% 15.7 47.6 1 17.4% 27.8 26.0 2 21.1% 22.2 14.1 3 19.0% 16.8 6.8 4 14.8% 9.2 3.2 5 21.9% 8.2 2.4
Mean 2.85 2.01 0.99 Mode 5.00 1.00 0.00 SD 1.56 1.48 1.25 1 N is smaller than 2,512 (total sample size) because some respondents did not answer
questions about their core network.