Polyvocality and Forgotten Proverbs (and Persons): Ravi Shankar, George Harrison and Shambhu Das
Upload
khangminh22Category
view
0download
0
Copyright
by
Shankar Venkataraman
2008

The Dissertation Committee for Shankar Venkataraman Certifies that this is the
approved version of the following dissertation:
The Joint Impact of Commitment to Disclosure and Prior Forecast
Accuracy on Managers’ Forecasting Credibility
Committee:
Lisa L. Koonce, Co-Supervisor
D. Eric Hirst, Co-Supervisor
Keith C. Brown
Steven J. Kachelmeier
Arthur B. Markman
The Joint Impact of Commitment to Disclosure and Prior Forecast
Accuracy on Managers’ Forecasting Credibility
by
Shankar Venkataraman, B.Com., P.G.D.M., M.I.M.
Dissertation
Presented to the Faculty of the Graduate School of
The University of Texas at Austin
in Partial Fulfillment
of the Requirements
for the Degree of
Doctor of Philosophy
The University of Texas at Austin
August, 2008
iv
Acknowledgements
I thank my dissertation co-chairs — Eric Hirst and Lisa Koonce for their guidance
and support throughout the doctoral program. I also thank Steve Kachelmeier, but for
whose early encouragement, I would not have made it this far in the program. I thank my
other committee members — Keith Brown and Art Markman for their useful suggestions.
I appreciate the assistance and friendship provided by my fellow doctoral students
at the University of Texas at Austin. Every single doctoral student in the accounting
program, at some time or the other, has contributed to this dissertation by providing
helpful comments on the experimental materials and / or early versions of the paper. This
dissertation benefited greatly from the comments of seminar participants at the University
of Alberta, Cornell University, Georgia Tech University, University of Illinois, Nanyang
Business School, National University of Singapore, and the University of Texas. I
gratefully acknowledge the financial support from the Eugene and Dora Bonham
Memorial Fund and the Department of Accounting at the University of Texas at Austin.
I am also thankful to Vijaysree Venkataraman, Subash Pereira, Balaji Koka, and
Rangaraj Ramanujam, who provided counsel and encouragement, whenever needed. I
thank my wife Malavika and my daughter Aditi for their unwavering love, for believing
in me, and for sharing all the highs and lows of the dissertation experience. Above all, I
thank my parents Arunachalam Venkataraman and Lakshmi Venkataraman for their
unconditional love and for placing their children’s education above their personal
comfort at all times. To them, I dedicate this dissertation.
v
The Joint Impact of Commitment to Disclosure and Prior Forecast
Accuracy on Managers’ Forecasting Credibility
Publication No._____________
Shankar Venkataraman, Ph.D.
The University of Texas at Austin, 2008
Supervisors: Lisa L. Koonce and D. Eric Hirst
Abstract: Although managers rate concerns about being seen as committed
disclosers as an important consideration in their voluntary disclosure decisions, prior
research has paid limited attention to how investors view commitment to disclosure. This
study experimentally tests two competing perspectives relating to how managers’
commitment to disclosure and prior forecast accuracy jointly influence managers’
forecasting credibility. The first perspective (the normative perspective) draws on
economic theory and the second perspective (the omission bias perspective) draws on
theory from psychology. The normative perspective suggests that commitment to
disclosure and prior forecast accuracy will independently influence managers’ forecasting
credibility. In contrast, the omission bias literature suggests that the influence of
commitment to disclosure on managers’ forecasting credibility depends on managers’
prior forecast accuracy. In other words, the normative perspective suggests two main
effects, whereas the omission bias perspective suggests a commitment to disclosure ×
accuracy interaction. To test the competing predictions relating to the joint impact of

vi
commitment to disclosure and prior forecast accuracy on managers’ forecasting
credibility, I conduct an experiment. Results of this experiment support the omission bias
perspective. Participants in the role of investors rate more (less) committed managers as
more (less) credible, but only when they are also accurate. When managers are
inaccurate, however, this relationship reverses. That is, more committed managers are
viewed as less credible relative to their less committed peers. These results suggest that
managers’ concerns about commitment to disclosure are indeed valid, but only when they
are accurate. When managers are less accurate, commitment to disclosure hurts, rather
than helps, managers’ credibility. Participants’ valuation judgments as well as their
judgments relating to a current disclosure are positively associated with their judgments
of managers’ forecasting credibility, suggesting that their assessment of managers’
credibility may have significant valuation consequences. This study contributes to the
voluntary disclosure literature and has implications for managers who provide earnings
forecasts and for investors who use these forecasts in their investment decisions.
vii
Table of Contents
List of Tables ......................................................................................................... ix
List of Figures ......................................................................................................... x
Chapter 1: Introduction ............................................................................................1
Chapter 2: A Framework to Evaluate Management Earnings Forecasts .................7
What are Management Earnings Forecasts? ...................................................7
Why are Management Earnings Forecasts Important? ...................................7
Management Earnings Forecasts: A Framework............................................8
Chapter 3: The Joint Impact of Commitment to Disclosure and Prior Forecast Accuracy on Managers’ Forecasting Credibility ..........................................13
Introduction...................................................................................................13
Managers’ Forecasting Credibility ...............................................................14
What is Managers’ Forecasting Credibility? .......................................14
Why is Managers’ Forecasting Credibility Important? .......................14
Commitment to Disclosure: Main Effects ....................................................15
Prior forecast accuracy: Main Effects...........................................................19
The Joint Impact of Commitment to Disclosure and Prior Forecast Accuracy ..............................................................................................21
Overview..............................................................................................21
Normative Perspective .........................................................................21
Omission Bias Perspective...................................................................24
Summary of Predictions................................................................................26
Experiment....................................................................................................27
Design and Participants........................................................................27
Materials, Manipulations, and Questions.............................................29
Results...........................................................................................................33
Manipulation and Other Checks ..........................................................33
Tests of Hypotheses .............................................................................36
Judgments of Managers’ Trustworthiness ..................................37
viii
Judgments of Managers’ Forecasting Competence ....................38
Judgments of Managers’ Forecasting Credibility .......................40
Other Judgments .........................................................................41
Additional Analyses: Structural Equation Model .......................44
Chapter 4: Conclusion............................................................................................64
Appendices.............................................................................................................67
Appendix A: Commitment To Disclosure: Illustration ................................68
Appendix B: Experimental Materials ...........................................................71
Appendix C: Pre-Manipulation Questions....................................................74
Appendix D: Manipulations..........................................................................77
Appendix E: Post-Manipulation Questions ..................................................82
Appendix F: Current Earnings Forecast .......................................................85
Appendix G: Process-Related Questions ......................................................87
References..............................................................................................................93
Vita .....................................................................................................................102
ix
List of Tables
Table 1: Judgments of Managers’ Trustworthiness .......................................................... 50 Table 2: Judgments of Managers’ Forecasting Competence ............................................ 52 Table 3: Judgments of Managers’ Forecasting Credibility............................................... 54 Table 4: Judgments of Disclosure Credibility .................................................................. 56 Table 5: Price-to-Earnings (P/E) Judgments..................................................................... 58
x
List of Figures
Figure 1: A Framework to Study Management Earnings Forecasts (Hirst et al. 2008)... 12 Figure 2: Managers’ Forecasting Credibility: Normative Versus Omission Bias Perspective ........................................................................................................................ 60 Figure 3: Sequence of Experimental Procedures .............................................................. 61 Figure 4: Graphical Summary of Results.......................................................................... 62 Figure 5: Structural Equation Model: Commitment to Disclosure and Perceptions of Norm-Consistency ............................................................................................................ 63
1
Chapter 1: Introduction
Managers who choose to provide earnings forecasts face a choice. Should they
provide such forecasts frequently and predictably in an effort to be viewed as more
committed disclosers or can they provide forecasts in some periods and remain silent in
others and thus risk being viewed as less committed disclosers? Managers maintain that
investors value commitment to disclosure and, therefore, being seen as more committed
to disclosure is important (Graham et al. 2005). Consistent with this position, prior
research shows that less committed disclosers pay more for their capital relative to more
committed disclosers (Brown et al. 2004) and are more likely to lose analyst coverage
(Houston et al. 2006). Yet, prior research also shows that managers are selective about
the periods in which they provide earnings forecasts (Cotter et al. 2006). One reason for
this selectivity could be that managers may be inclined to forecast only when they believe
that they will be accurate (Waymire 1985). This study investigates the joint impact of
commitment to disclosure and prior forecast accuracy on managers’ forecasting
credibility. Specifically, it examines whether there are conditions when commitment to
disclosure may hurt, instead of help, managers’ forecasting credibility. 1
Understanding the credibility consequences of commitment to disclosure is
important for at least two reasons. First, economic theory posits that proprietary costs and
litigation concerns are two important factors that influence voluntary disclosures
(Verrecchia 2001, Skinner 1994). Yet, managers rank concerns about setting a disclosure
precedent that cannot be maintained as more important than both proprietary cost and
1 Following prior research, I define managers’ forecasting credibility as investors’ beliefs about managers’ trustworthiness and forecasting competence (Mercer 2005).
2
litigation cost concerns in influencing their disclosure decisions (Graham et al. 2005).2 In
other words, managers appear to be apprehensive about being viewed as less committed
disclosers because periods of silence punctuated by periods of disclosure could be
interpreted negatively by investors. Thus, understanding the credibility consequences of
being more (or less) committed to disclosure under varying levels of accuracy is
important to managers who determine voluntary disclosure policies.
Second, the results of this study are important to researchers interested in
improving their understanding of the factors that influence managers’ reporting
credibility. Prior research has relied primarily on forecast-accuracy based measures to
infer managers’ credibility (Williams 1996, Atiase et al. 2006), where accuracy is defined
as the difference between reported earnings and managers’ earnings forecasts. In this
study, I argue that commitment to disclosure is another important factor that influences
managers’ reporting credibility, both individually and jointly with prior forecast
accuracy. Drawing on theories from economics and psychology, I generate and test
competing hypotheses about how commitment to disclosure and accuracy jointly
influence managers’ reporting credibility.
To test the joint impact of commitment to disclosure and prior forecasting
accuracy on managers’ forecasting credibility, I conduct a 2 × 2 between-subjects
experiment where I vary managers’ commitment to disclosure (more versus less
committed) and prior forecast accuracy (high versus low). Participants in the role of
2 Graham et al. (2005) ask their survey respondents to rank the reasons for limiting their voluntary financial communications. The study provides several reasons and asked respondents to indicate the extent to which they agreed with these reasons. Seventy percent of respondents agreed (or strongly agreed) that “avoid(ing)
setting a disclosure precedent that may be difficult to continue”, was a factor influencing their voluntary disclosure decisions. Fifty nine percent of respondents agreed (or strongly agreed) that proprietary concerns were a factor. Forty six percent agreed (or strongly agreed) that litigation concerns were a factor influencing their voluntary disclosure decisions. These responses suggest that managers’ concern about setting a disclosure precedent that cannot be maintained is an important factor that influences their voluntary disclosure decisions.
3
potential investors provide their assessment of managers’ trustworthiness, managers’
forecasting competence, and manager’s forecasting credibility (the primary dependent
variable) based on experimental materials relating to a hypothetical company. I also
obtain participants’ valuation judgments for this company to ensure that managers’
forecasting credibility is associated with substantive economic consequences.
My experiment tests two competing perspectives about the joint impact of
commitment to disclosure and forecast accuracy on managers’ forecasting credibility.
The first perspective (hereafter, the normative perspective) draws on economic theory
(Dye 2001, Verrecchia 2001, Stocken 2000) which suggests that managers’ reporting
credibility will be jointly influenced by commitment to disclosure and prior forecast
accuracy. The implication of this perspective is that both commitment to disclosure and
prior forecast accuracy exert independent main effects on managers’ forecasting
credibility. In other words, the effect of commitment to disclosure and prior forecast
accuracy on managers’ forecasting credibility is additive.
The second perspective draws on the omission bias literature from psychology
and posits that stronger inferences are made about an individual based on action rather
than inaction (Baron and Ritov 1994, Spranca et al. 1991). To the extent that more
committed disclosers are viewed as taking more actions relative to their less committed
peers, the omission bias perspective would suggest that investors will make stronger
inferences about managers’ forecasting credibility when managers are more committed to
disclosure than when they are less committed to disclosure. Specifically, when managers
are more committed to disclosure, investors will distinguish between more accurate
forecasters and less accurate forecasters (with respect to their forecasting credibility). In
contrast, when managers are less committed to disclosure, although investors may still
4
distinguish between more and less accurate forecasters, the distinction is likely to be
weaker.
Although both perspectives suggest that commitment to disclosure and forecast
accuracy will jointly influence investors’ assessment of managers’ forecasting credibility,
they differ with respect to whether the two factors interact. The normative perspective
suggests that the two factors are additive. That is, holding constant accuracy, more
commitment to disclosure always increases managers’ forecasting credibility. In contrast,
the omission bias perspective suggests that managers will be better off (with respect to
forecasting credibility) by being more committed disclosers only when prior forecast
accuracy is high and worse off when prior forecast accuracy is low. In other words, the
omission bias perspective suggests a commitment × accuracy interaction effect on
managers’ forecasting credibility.
Using an experiment to study the joint impact of commitment to disclosure and
prior forecast accuracy is advantageous for several reasons. First, over time, companies
change forecast form and other attributes of their forecasts (e.g., forecast content),
rendering longitudinal comparisons difficult (King et al. 1990, Hirst et al. 1999). By
holding constant such forecast attributes, an experiment allows me to focus on the
treatment of interest. Second, prior research documents that forecast accuracy is likely to
be confounded with bias in a natural setting. For instance, Chen (2004) finds that
quarterly earnings forecasts are systematically pessimistically-biased.3 An experiment
allows me to hold constant the forecast bias and focus on accuracy. Third, an experiment
allows me to directly measure participants’ perceptions relating to commitment to
3 For the period 1994-2003, Chen (2004) finds that the likelihood of missing quarterly forecasts (16%) is substantially lower than the likelihood of beating forecasts (39%), suggesting that quarterly forecasts are, on average, pessimistically biased.
5
disclosure, thereby, potentially improving our understanding of the underlying
mechanisms via which commitment to disclosure influences credibility.
I find support for the omission bias perspective on how commitment to disclosure
and prior forecast accuracy jointly influence investors’ judgments of managers’
forecasting credibility. Specifically, more committed forecasters are judged as more
credible relative to less committed forecasters, but only when forecast accuracy is high.
This relationship, however, reverses when prior forecast accuracy is low — more
committed forecasters are judged to be less credible relative to less committed
forecasters.
Results of additional tests provide some evidence on the mechanism underlying
this result. The omission bias literature proposes two alternative mechanisms by which
acts of commission lead to stronger judgments relative to acts of omission. The first
mechanism posits that acts of commission are seen as more deliberate decisions relative
to acts of omission, and it is this decision versus non-decision dichotomy that makes
people react more strongly to acts of commission (Baron and Ritov 1994, Niedermayer
and Chapman 2001, Kordes-de Vaal 1996). A second explanation suggests that in
contexts where the default option or the norm is inaction, omissions will be viewed as
consistent with the norm whereas commissions will be viewed as inconsistent with the
norm (Prentice and Koehler 2003).4 Both negative and positive outcomes associated with
norm-inconsistent behavior elicit stronger reactions compared to identical outcomes
resulting from norm-inconsistent behavior. According to this perspective, it is not the
decision versus non-decision dichotomy, but the norm-consistent versus norm-
inconsistent dichotomy that drives the omission bias.
4 Baron and Ritov (1994) also posit and test norm-based explanations for the omission bias, but they find only limited support for a norm-based explanation of the omission bias.
6
My results suggest that participants distinguish between more and less committed
forecasters, not based on whether or not commitment to disclosure corresponds to a
decision, but based on whether commitment to disclosure is viewed as norm-consistent or
inconsistent behavior. Participants’ judgments of managers’ credibility suggest that
behavior that is above and beyond the norm (high commitment to disclosure) leads to
stronger reactions compared to behavior that is in line with the norm (low commitment to
disclosure). I also discuss the implication of these findings for the voluntary disclosure
and the omission bias literatures.
The rest of this dissertation is organized as follows. Chapter 2 provides an
introduction to management earnings forecasts and discusses a framework to evaluate
management earnings forecasts. More specifically, it explains the elements of the
framework that form the focus of this study. Chapter 3 outlines how commitment to
disclosure and prior forecast accuracy influence perceptions of trustworthiness and
competence, both individually and jointly. Drawing on an economic theory as well as on
theory from psychology, this section generates competing predictions about the joint
impact of commitment to disclosure and prior forecast accuracy on managers’ forecast
credibility. Chapter 3 also describes an experiment designed to test these competing
predictions and discusses the results of the experiment. Chapter 4 concludes with a
discussion of the study’s findings.

7
Chapter 2: A Framework to Evaluate Management Earnings Forecasts
WHAT ARE MANAGEMENT EARNINGS FORECASTS?
Management earnings forecasts are voluntary managerial disclosures predicting
earnings prior to the expected reporting date (King et al. 1990). The term earnings
guidance is often used synonymously with earnings forecasts, both in the popular press
(Zuckerman 2005) and in the academic literature (Atiase et al. 2005, Hutton 2005).
Although earnings forecasts are commonly issued well in advance of quarterly and
annual earnings releases, they are sometimes provided after the accounting period has
ended but before the earnings are announced.5 These latter forecasts are typically referred
to as earnings preannouncements.6 When management forecasts indicate substantial
shortfall from expected earnings, they are commonly termed earnings warnings (Kasznik
and Lev 1995).
WHY ARE MANAGEMENT EARNINGS FORECASTS IMPORTANT?
Management earnings forecasts are important because they are associated with
several market outcomes that managers care about. For example, earnings forecasts can
be used to mitigate litigation concerns (Skinner 1994), influence managers’ reputation for
transparent and accurate reporting (Hutton and Stocken 2007), influence stock prices
(Pownall et al. 1993), analysts’ forecasts (Baginski and Hassell 1990), and bid-ask
spreads (Coller and Yohn 1997). In addition, management earnings forecasts represent
one of the most direct means by which managers can influence the markets’ earnings
5 Earnings guidance represents any manager-provided information that guides outsiders in their assessment of a firm’s future earnings, both directly and indirectly (Miller 2002). Thus, earnings guidance might include, but need not be limited to, earnings forecasts. For instance, a firm’s comments on its prospects in a new product market might be construed as indirect earnings guidance. 6 Even though preannouncements are technically earnings forecasts, most of the literature treats them as early earnings announcements rather than late earnings forecasts.
8
expectations. Particularly after Regulation Fair Disclosure (Reg. FD), managers can no
longer selectively disseminate their expectations about earnings to analysts or other select
individuals and thus expect to influence the markets’ earnings expectations. Arguably,
Reg. FD has made management earnings forecasts even more relevant to managers as a
tool to set and manage market earnings expectations. Managers should care about setting
(or recalibrating) market earnings expectations because the adverse consequences of
failing to meet market earnings expectations are well documented (Matsumoto 2002,
Brown and Caylor 2005). Overall, the empirical evidence clearly shows that management
earnings forecasts are an important voluntary disclosure and are associated with
significant economic consequences.
MANAGEMENT EARNINGS FORECASTS: A FRAMEWORK
In a survey of the management earnings forecasts literature, Hirst et al. (2008)
provide a framework in which to review management earnings forecasts. This framework
categorizes earnings forecasts as having three components — antecedents, characteristics,
and consequences — that roughly correspond to the timeline associated with an earnings
forecast.7 They note that much of the prior research on management earnings forecasts
focuses on how one forecast antecedent or characteristic influences forecast
consequences, and does not study potential interactions among the three components of
the framework. In this study, I address their call to study potential interactions among
components of this framework. Specifically, I examine the joint impact of impact of two
forecast antecedents — managers’ commitment to disclosure and prior forecasting
accuracy on managers’ forecasting credibility — a consequence in the framework. I first
7 The discussion relating to the framework presented here is a condensed version of the discussion in Hirst et al. (2008).
9
provide a brief description of the framework and then explain how the current study
contributes to the management earnings forecast literature.
Figure 1 provides a pictorial representation of a framework provided by Hirst et
al. (2008) to analyze management earnings forecasts. Antecedents are precursors to the
actual forecast decision. Because earnings forecasts are voluntary disclosures, the first
question confronting managers is whether to issue a forecast. The answer to this question
is shaped by a combination of the environment faced by the firm and firm-specific
characteristics. Hirst et al. (2008) classify antecedents into two broad categories: (1)
forecast environment — that is, features of the legal and regulatory environment and
features of the analyst and investor environment, and (2) forecaster characteristics — that
is, information asymmetry, pre-commitment to disclosure, firm-specific litigation,
managerial incentives, prior forecasting behavior, and proprietary costs. Firms often have
little or no control over certain antecedents in the short term, although they can influence
some of those antecedents in the longer term. For example, a firm’s prior forecasting
accuracy is an antecedent. A reputation for accuracy is normally built over an extended
time and is generally not quickly changeable.
Having chosen to issue an earnings forecast, the manager then faces a broad array
of choices regarding the attributes of that forecast. These choices involve, for example,
the form of the forecast (e.g., point, range, qualitative, etc.), the horizon (e.g., quarterly
versus annual), and the information to accompany the forecast (e.g., the presence or
absence of attributions). These choices are termed forecast characteristics because they
are attributes associated with the forecast.
The third component of the framework — forecast consequences — captures
events and reactions that occur after the forecast is issued, such as the stock market
reaction to the forecasted earnings information. Not surprisingly, these consequences are
10
a function of the antecedents and forecast characteristics. For example, management
forecasts lead to greater earnings forecast revisions by analysts — a consequence, when
they originate from firms with high prior forecast accuracy — an antecedent (Williams
1996). This study examines two forecast antecedents — managers’ commitment to
disclosure and prior forecast accuracy, and examines how these antecedents jointly
impact managers’ forecasting credibility — a consequence.
This study makes several contributions to the voluntary disclosure literature. First,
it tests competing hypotheses based on theory from economics and psychology about
how commitment to disclosure and prior forecast accuracy jointly influence managers’
forecasting credibility. Second, this study adds to the literature on how investors react to
managers’ historical disclosure behavior. Prior studies document an inverse relationship
between commitment to disclosure and cost of capital (Leuz and Verrecchia 2002,
Botosan and Harris 2000). These studies, however, are not designed to examine the
mechanism by which these valuation consequences arise. In this study, I show that the
valuation consequences reported in these earlier studies may be mediated by investors’
perceptions of managers’ credibility — the primary dependent variable in this study.
Finally, this study also has implications for managers and investors. The study
corroborates managers’ claims about the value that investors place on commitment to
disclosure. Consistent with managers’ claims, more committed disclosers are, indeed,
seen as more credible relative to less committed disclosers, but only when they are
generally accurate with respect to their forecasts. When managers are inaccurate,
commitment to disclosure hurts, rather than helps their credibility. From investors’
standpoint, given that the results support the predictions of the omission bias literature, it
appears that investors tend to focus more on outcomes of managers’ actions or
commissions (disclosures) rather than the strategic implications of managers’ inactions or

11
omissions (non-disclosures). Although this study cannot comment on whether or not such
behavior is sub optimal, investors may wish to more carefully consider the reasons for
managers’ disclosures as well as those for managers’ non-disclosures.

12
Figure 1: A Framework to Study Management Earnings Forecasts (Hirst et al. 2008)
Decision to issue
forecast
• Legal and Regulatory Environment
• Analyst and Investor Environment
FORECAST ANTECEDENTS
FORECAST
CHARACTERISTICS
FORECAST
CONSEQUENCES
Forecaster Characteristics
Forecast Environment
• Information Asymmetry Pre-commitment to Disclosure
• Firm-specific Litigation Risk
• Managerial Incentives
• Prior Forecasting Behavior
• Proprietary Costs
• Earnings Forecast News
• Accuracy versus Bias
• Forecast Form
• Attributions Accompanying Forecasts
• Stand-alone vs. Bundled Forecasts
• Forecast Disaggregation
• Forecast Horizon and Timeliness
• Stock Market Reaction
• Information Asymmetry / Cost of Capital
• Earnings Management
• Litigation Risk
• Analyst and Investor Behavior
• Reputation for Accuracy and Transparency
13
Chapter 3: The Joint Impact of Commitment to Disclosure and Prior Forecast Accuracy on Managers’ Forecasting Credibility
INTRODUCTION
In this chapter, I draw on the framework described in the previous chapter and test
whether and how two antecedents from the framework jointly impact a consequence
described in the framework. Specifically, I examine how commitment to disclosure and
prior forecast accuracy (two antecedents) jointly impact managers’ forecasting credibility
(a consequence), holding constant other forecast characteristics.
This chapter proceeds as follows. First, I define managers’ forecasting credibility
and outline why it is important. Second, I posit how commitment to disclosure and prior
forecast accuracy independently and jointly impact managers’ forecasting credibility. I
draw on economic theory as well as theory from psychology to motivate competing
predictions relating to the joint impact of commitment to disclosure and prior forecast
accuracy on managers’ forecasting credibility. Specifically, I draw on the voluntary
disclosure literature from economics and the omission bias literature from psychology to
generate competing interaction predictions. I then describe an experiment that tests these
competing predictions as well as the underlying mechanisms by which commitment to
disclosure and prior forecast accuracy potentially impact managers’ forecasting
credibility. In this experiment, I vary managers’ commitment to disclosure (more versus
less committed) and prior forecast accuracy (high versus low) and measure participants’
perceptions of managers’ forecasting credibility as well as managers’ trustworthiness and
forecasting competence. Finally, I present the results of the experiment and describe the
theoretical and practical implications of my results.
14
MANAGERS’ FORECASTING CREDIBILITY
What is Managers’ Forecasting Credibility?
Drawing on prior research (Fogg and Tseng 1999, Mercer 2005), I define
managers’ forecasting credibility as investors’ beliefs in managers’ trustworthiness and
forecasting competence. By trustworthiness, I mean investors’ belief that managers will
act with integrity when providing earnings forecasts. For example, if a company
consistently provides pessimistically-biased earnings forecasts and reported earnings
always exceeds forecasts, investors may question the trustworthiness of managers who
provide such forecasts. By forecasting competence, I mean investors’ assessment of the
manager’s ability with respect to forecasting earnings. Managers who have a record of
consistently meeting their earnings forecasts are likely be viewed as more competent.
Perceptions of trustworthiness and competence, in turn, positively influence managers’
forecasting credibility by reducing uncertainty and, therefore, the risk associated with an
investment.
Why is Managers’ Forecasting Credibility Important?
Managers’ forecasting credibility is important because investors’ assessment of
the credibility of a specific disclosure (disclosure credibility) is positively influenced by
managers’ credibility (Mercer 2004). By definition, credible disclosures are more
believable and managers who want their financial disclosures to have an impact seek
more credible disclosures. Prior research shows that the market reaction to management
earnings forecasts is a function of the information content of the forecast and the
believability (credibility) of the forecast (Jennings 1987).8
8 “The reaction of investors’ beliefs to the release of a manager’s earnings forecast depends on the unexpected component (surprise) of the forecast and its believability. Two management projections with the same surprise (relative to contemporaneous investor beliefs) but with different levels of believability will elicit different responses from investors.” (Jennings 1987, p.91)

15
Prior research using proxies for managers’ credibility suggests that market
reactions to managers’ financial disclosures is conditioned on managers’ credibility. For
example, research using managers’ prior forecasting accuracy as a proxy for managers’
credibility finds that analysts update their earnings forecasts to be more in line with that
of managers’ when managers have been accurate in the past (Williams 1996, Atiase et al.
2006). More generally, prior research finds a positive relationship between analysts’
ratings of firm disclosures and analyst coverage (Healy et al. 1999) and negative relation
between analysts’ ratings of firms’ disclosures and bid-ask spreads (Welker 1995). Taken
together, the evidence suggests that the market reaction to managers’ earnings forecasts
will be influenced by the managers’ forecasting credibility. In the following sections, I
outline theoretical arguments relating to why (and how) commitment to disclosure and
prior forecast accuracy individually and jointly impact managers’ forecasting credibility.
COMMITMENT TO DISCLOSURE: MAIN EFFECTS
Prior research on voluntary disclosures suggests that more-committed disclosers
will be viewed favorably by markets relative to their less-committed peers. In prior
studies, commitment to disclosure is typically inferred from increased disclosure (Leuz
and Verrecchia 2000), or from increased frequency of disclosures (Botosan and Harris
2000, Brown et al. 2004).
In the context of management earnings forecasts, I define commitment to
disclosure as a combination of frequent and predictable forecasting. Frequent forecasters
are those who provide a greater quantity of forecasts during a given time period. For
example, a firm that provides 12 forecasts over a three-year period is a more committed
discloser, ceteris paribus, relative to a firm that provides three forecasts over the same
time period. Predictable forecasters are those who provide forecasts periodically such that
outsiders (e.g., analysts and investors) can reliably anticipate the issuance of such
16
forecasts.9 For example, a firm that issues three forecasts over a three-year period and
does so every year in December is a more committed discloser relative to a firm that
issues three forecasts in a random fashion over that same time period. Thus, in my
setting, more committed disclosers are those who provide earnings forecasts both
frequently and predictably. Less committed disclosers, in contrast, provide earnings
forecasts neither frequently nor predictably.
Defining the commitment to disclosure construct in terms of both frequency and
predictability is important because it recognizes the multi-dimensional nature of the
underlying construct. This approach to defining constructs (using more than one
dimension) has been used previously in prior accounting research (e.g., Hackenbrack and
Nelson 1996), and strengthens the power of the construct of interest.10 Defining
commitment to disclosure solely in terms of either frequency or predictability would
minimize the strength of the disclosure commitment construct in my study. I discuss my
approach in greater detail in Appendix A and also in the experimental design section.
Managers appear to value being viewed as more committed disclosers (Graham et
al. 2005), yet commitment to disclosure has received limited attention in previous studies.
I first present some empirical evidence on how markets respond to more committed
disclosers and then present theoretical arguments relating to how commitment to
disclosure influences the two components of credibility — namely, trustworthiness and
competence. Brown et al. (2004) find that firms that host conference calls regularly
reduce their annual cost of capital by 15 basis points relative to firms that host such calls
9 Note that predictability relates to the provision of the forecasts on a periodic basis and does not imply predictability about the content of the forecast. 10 Specifically, Hackenbrack and Nelson (1996) use multiple dimensions to define engagement risk in an auditing setting.
17
occasionally.11 More frequent management earnings forecasts are also associated with
higher institutional ownership (Ajinkya et al. 2005). Managers generally prefer higher
levels of institutional ownership because higher institutional ownership is generally
associated with lower levels of stock mispricing (Jiambalvo et al. 2002). Firms that
choose to provide earnings forecasts, but subsequently stop providing such forecasts
experience a reduction in analyst coverage (Houston et al. 2006). Taken together, these
findings suggest that market participants respond positively to more committed
disclosers. These findings are consistent with the idea that more frequent disclosures
reduce uncertainty in anticipated cash flows (Lambert et al. 2007) and reduce risk by
minimizing stock price volatility (Diamond and Verrecchia 1991).
Although the number of firms providing earnings forecasts has increased over
time, prior research suggests that, on average, managers appear to be less committed to
providing earnings forecasts.12 That is, firms often provide forecasts in some periods,
stay silent for several periods, and then resume their forecasts (Houston et al. 2006,
Rogers and Stocken 2005). This behavior is puzzling for two reasons. First, a significant
majority of managers express concern about being viewed as less committed disclosers.
Managers rank concerns about commitment to disclosure ahead of proprietary cost and
litigation cost concerns in influencing their voluntary disclosure decisions (Graham et al.
2005). Yet, their behavior appears to be at odds with this stated concern. Second, prior
research on conference calls (Brown et al. 2004) and quarterly segment disclosures
(Botosan and Harris 2000) suggests that voluntary disclosures, once initiated, tend to be
sticky. Unlike these disclosures, management earnings forecasts do not appear to be
11 Brown et al. (2004) define a firm as a regular caller in a particular calendar quarter if the firm had at least two calls in conjunction with its quarterly earnings announcements over the previous three calendar quarters. Firms that do not meet this criterion are categorized as occasional callers. 12 Firms issuing earnings forecasts now represent approximately 50 percent of Compustat on a value-weighted basis, up from 10-15 percent in the mid-1990’s (Anilowski et al. 2007).

18
sticky. That is, most firms continue to be ad hoc disclosers of forecasts (Houston et al.
2006, Rogers and Stocken 2005, Cotter et al. 2006).
I argue that managers who are more committed to disclosure are likely to be
viewed as both more trustworthy and more competent relative to less committed peers.
Underlying this argument is the expectation that investors react not just to disclosures,
but also to non-disclosures (Nagar et al. 2003, Verrecchia 1983). First, investors are
likely to place greater trust in managers who are more committed to providing disclosures
predictably relative to their less committed peers. Supporting this idea, prior studies
across a variety of domains show that predictability is an important determinant of trust.13
For example, predictability is an important determinant of trust in buyer-supplier
relationships (Zaheer et al. 1998) as well as in superior-subordinate relationships
(Cunningham and McGregor 2000). More predictable buyers and superiors are trusted
more relative to less predictable buyers and superiors. Predictable behavior over time and
across situations increases trust by reducing uncertainty about the trustee’s actions
(Whitener et al. 1998). In the earnings forecast context, investors who expect managers to
provide regular earnings forecasts are more likely to trust the manager because of the
reduced uncertainty about information availability.
Second, more committed forecasters are also likely to be viewed by investors as
more able to anticipate and communicate changes in their firm’s economic environment
(Trueman 1986). In contrast, less committed forecasters may be viewed as less able to
either anticipate or communicate changes in the firm’s economic environment to
investors.14 Thus, more committed forecasters are likely to be viewed as higher in
13 Predictability, per se, does not guarantee trust. Managers who always issue good-news earnings forecasts just before selling their shares are predictable, but they are also likely to be seen as self-serving. In such cases, the relationship between predictability and trust may be negative. 14 Ad hoc forecasting may also be construed as managers’ unwillingness (and not just inability) to communicate regularly with investors, which could negatively impact trustworthiness.

19
forecasting competence relative to less predictable forecasters. In sum, both empirical
evidence and theory suggest that more committed forecasters are likely to be viewed as
both more trustworthy and more competent (and therefore, more credible) relative to less
committed forecasters.
PRIOR FORECAST ACCURACY: MAIN EFFECTS
Investors appear to value and reward prior forecast accuracy. Current earnings
forecasts from managers are generally viewed as more believable when managers have
been more accurate in the past (Atiase et al. 2006, Hutton and Stocken 2007). Two
illustrations from prior research underscore the value of prior forecast accuracy. First, the
extent to which analysts update their earnings forecasts to be in line with a manager’s
earnings forecast is positively related to the manager’s prior forecast accuracy (Williams
1996). Second, although the market generally under-reacts to good news management
earnings forecasts, the extent of this under-reaction is lower for more accurate forecasters
implying that investors assess the believability of a forecast conditional on prior forecast
accuracy (Ng et al. 2006).
Substantial variation exists in the accuracy of managers’ earnings forecasts
(Hassell and Jennings 1986, Chen 2004). For a sample of quarterly forecasts between
1994 and 2003, Chen (2004) finds that managers meet their forecasts 45 percent of the
time, miss them 16 percent of the time and exceed them 39 percent of the time. Based on
a sample of 1,039 annual forecasts during the period 2000-04, Hribar and Yang (2006)
find that managers meet their annual forecasts six percent of the time whereas they miss
them 46 percent of the time and exceed them 48 percent of the time.
I argue that accurate forecasts positively influence a manager’s forecast credibility
by influencing perceptions of the manager’s trustworthiness as well as perceptions of
forecasting competence. First, I expect that managers’ prior forecast accuracy is
20
positively related to investors’ perceptions of managers’ trustworthiness. Because high
accuracy implicitly denotes lack of bias, managers who are highly accurate are likely to
be seen as unbiased, and therefore, more trustworthy.15 Although low accuracy does not
necessarily denote bias, if managers are inaccurate over a long period of time, investors’
negative perceptions of managerial competence (for reasons outlined below) could
spillover to trustworthiness judgments as well (Rozin and Royzman 2001). Therefore, in
general, I expect managers who are more accurate to be viewed as more trustworthy
relative to their less accurate peers.
Second, consistently accurate forecasts suggest that a manager is able to anticipate
changes in the firm’s business environment (Trueman 1986). On the contrary, if a
manager consistently misses self-imposed earnings forecasts, the manager is likely to be
perceived as less capable. Thus, more accurate managers are also likely to be viewed as
more competent at forecasting relative to their less accurate peers. Consistent with this
expectation, Hirst et al. (2003) find that investors judge more accurate forecasters to be
more skilled and their financial reports to be of higher quality.
To summarize, I expect that both commitment to disclosure and prior forecast
accuracy are positively related to investors’ perceptions of managers’ trustworthiness and
forecasting competence — and thus, to managers’ forecasting credibility. Managers’
forecasting credibility, in turn, is positively related to how investors assess the credibility
of a current disclosure from managers (disclosure credibility) and also to investors’
valuation judgments (Mercer 2004). I do not, however, make any main effect predictions
for commitment to disclosure or accuracy in light of the competing predictions about how
15 Prior research shows that high forecast accuracy is positively associated with perceptions of integrity (Tan et al. 2002), as well as with perceptions of forthcomingness (Mercer 2005) — both constructs closely related to trustworthiness.
21
these two factors jointly influence manager’s forecasting credibility. The competing
arguments are outlined in greater detail in the following section.
THE JOINT IMPACT OF COMMITMENT TO DISCLOSURE AND PRIOR FORECAST
ACCURACY
Overview
Drawing on the voluntary disclosure literature from economics (the normative
perspective) and the omission bias literature from psychology (the omission bias
perspective), I generate competing predictions about how investors jointly evaluate
managers’ commitment to disclosure and forecast accuracy to form inferences about
managers’ forecasting credibility. Although both perspectives suggest that commitment
to disclosure and accuracy will jointly influence perceptions of managers’ forecasting
credibility, they make different predictions relating to whether the two factors interact. In
the following sections, I first describe the normative perspective followed by the
competing prediction based on the omission bias perspective.
Normative Perspective
Economic theory suggests that while assessing voluntary disclosures, investors
evaluate both what managers say and what managers choose not to say (Dye 2001,
Verrecchia 2001). Consistent with this literature, accounting studies of disclosure in
single-period settings show that investors generally interpret managers’ choice to
withhold certain information (or to withhold the disclosure itself) as evidence that the
undisclosed information is likely to be negative (Kennedy et al. 1998, Hobson and
Kachelmeier 2005). That is, investors appear to recognize that silence represents a
disclosure choice, and thus, react, both to disclosures and to non-disclosures in single-
period settings. Over multiple periods, managers make choices with respect to voluntary
disclosures. They disclose in some periods and choose to remain silent in others. Drawing
22
on the economic literature on voluntary disclosure, I argue that investors make inferences
about managers and react to managers’ (current) disclosures based on these historical
disclosure choices.
The voluntary disclosure literature posits that by voluntarily committing to
increased disclosure, managers bind themselves, albeit weakly, to future disclosures.
More important, managers maintain that once they commit to a voluntary disclosure, they
set a precedent that binds them to future disclosures (Graham et al. 2005). For instance,
managers who voluntarily list their firms on a stock exchange that requires increased
levels of disclosure are deemed to be more committed to disclosure relative to their peers
who choose not to do so (Leuz and Verrecchia 2000). In this study, I argue that
managers who provide earnings forecasts both frequently and predictably commit
themselves to a higher disclosure standard. Clearly, this commitment is tenuous in that it
can be broken relatively easily. Managers can simply choose to stop providing earnings
forecasts or they may provide forecasts only when they believe that the market earnings
expectations need to be modified. Nonetheless, I argue that investors value commitment
to disclosure, even when this commitment may be relatively less binding.
The belief that commitment to disclosure is valued by investors is reflected in
investor reaction to more- versus less-committed disclosers outlined earlier. Recall that,
ceteris paribus, managers who hold conference calls more frequently pay less for their
capital relative to managers who hold such calls less frequently (Brown et al. 2004).
Recall, also, that managers who display lower commitment to disclosure by discontinuing
earnings guidance lose analyst coverage (Houston et al. 2006). Economic theory as well
as models of voluntary disclosure suggests that managers who are less committed to
disclosure will be viewed as less credible by investors (Stocken 2000). More important,
23
prior research does not posit whether commitment to disclosure will interact with other
aspects of the disclosure (such as prior accuracy of the disclosures).
Based on the discussion above, the normative perspective would predict that
commitment to disclosure exerts an independent main effect that operates in concert with
other attributes of managers’ disclosures. That is, when commitment to disclosure is high,
more accurate managers will be viewed as more credible relative to less accurate
managers. When commitment to disclosure is low, again, more accurate managers will be
viewed as more credible relative to less accurate managers, but the overall level of
credibility will be lower because investors value commitment to disclosure. In other
words, I argue that commitment to disclosure and prior forecast accuracy will jointly, but
independently, influence managers’ forecasting credibility. Figure 2 (panel A) provides a
graphical representation of this prediction.
Economic theories of voluntary disclosure suggest that the primary
mechanism by which commitment to disclosure and prior forecast accuracy jointly affect
investor perceptions is through reduced information risk. That is, when managers are
more committed to disclosure and the disclosures are reliable, the information risk
associated with owning a stock decreases (Easley et al. 2002). The likelihood that
investors may be forced to liquidate their investments during periods of sparse
information when stock prices are volatile (Diamond and Verrecchia 1991) also
decreases when managers are more committed to disclosure. In contrast, when managers
are less committed to disclosure or less accurate (or both), the information risk associated
with owning a stock increases. Investors will demand a premium to bear this increased
information risk. Thus, risk is the primary mechanism that makes commitment to
disclosure desirable from investors’ standpoint. I test whether investors’ perceptions of

24
information risk are systematically related either to commitment to disclosure or to prior
forecast accuracy, or to both.
Omission Bias Perspective
An alternative prediction about the interaction of commitment to disclosure and
prior forecast accuracy is suggested by the omission bias literature. This literature posits
that stronger inferences are made about a person based on action rather than inaction
(Spranca et al. 1991, Baron and Ritov 1994). More committed disclosers are likely to be
viewed as more active compared to less committed disclosers.16 Thus, the omission-bias
literature would suggest that investors are likely to draw stronger (weaker) inferences
about managers’ trustworthiness and competence when managers are more-committed to
disclosure than when they are less-committed to disclosure.
The omission bias literature predicts that outcomes that follow action
(commissions) generally lead to much stronger reactions than outcomes that follow
inaction (omissions). This finding has been documented both for both positive and for
negative outcomes.17 For example, holding constant a negative outcome (number of
deaths per 1000 people), participants judged deaths resulting from administering a
vaccine to be a lower-quality decision compared to deaths resulting from non-vaccination
(Baron and Ritov 1994). In other words, an act of commission leading to a negative
outcome was judged more severely relative to an act of omission leading to an identical
negative outcome.
16 Arguably, the distinction between action and inaction may not always be clear. Yet, participants in numerous studies (Baron and Ritov 1994, Landman 1987) appear to systematically distinguish between commissions and omissions. More important, in the context of the present study, the distinction is not between action and inaction per se, but between relative levels of action. I expect that more-committed forecasters will be seen as more active relative to less-committed forecasters. I test this expectation and find that it is supported in my setting. 17 The omission bias has largely been explored in the domain of negative outcomes. Baron and Ritov (1994) find only limited support for the omission bias in the domain of positive outcomes. However, see Landman (1987) for a replication of the omission bias for positive outcomes.

25
To the extent that a company’s high (low) forecast accuracy is viewed as a
positive (negative) outcome, I expect that investors’ assessment of managers’ forecasting
credibility will differ depending on whether the high or low accuracy is associated with
more commitment to disclosure (high action) or less commitment to disclosure (low
action). This expectation leads to the predictions outlined below.
When managers are more committed to disclosure, more accurate forecasters will
be rated significantly higher in forecasting credibility compared to less accurate
forecasters. In contrast, when managers are less committed to disclosure, the distinction
in credibility assessments between more and less accurate forecasters will be less
pronounced. Based on the omission bias literature, two corollaries follow this prediction.
More committed disclosers will be viewed as significantly more credible relative to less
committed disclosers when forecast accuracy is high. In contrast, more committed
disclosers will be viewed as significantly less credible relative to less committed
disclosers when forecast accuracy is low. Figure 2 (panel B) presents a graphical
summary of these predictions.
Further research has posited two mechanisms by which the omission bias may
operate. The first perspective suggests that acts of commission are more likely to be seen
as decisions relative to acts of omission (Niedermayer and Chapman 2001, Kordes-de
Vaal 1996) and therefore lead to stronger reactions. Because decisions are seen as more
deliberate compared to non-decisions, stronger inferences will be drawn about a person
based on their decisions. In other words, people will make stronger judgments about
more committed disclosers because more committed disclosers are seen as making more
deliberate decisions. In contrast, less committed disclosers are likely to be seen as
passively accepting the default option of non disclosure. Thus, the decision versus non-
decision dichotomy drives the omission bias.
26
Some research suggests that in contexts where the default option or the norm is
inaction, omissions will be viewed as consistent with the norm whereas commissions will
be viewed as inconsistent with the norm (Prentice and Koehler 2003). Both positive and
negative outcomes produced by norm-inconsistent behaviors attract much stronger
reactions from people compared to identical outcomes resulting from norm-consistent
behavior (Kahneman and Miller 1986). According to this perspective, it is not the
decision versus non-decision dichotomy, but he norm-consistent versus norm-
inconsistent dichotomy that drives the omission bias. A subsequent section outlines
details of how I measure and test these alternative explanations.
SUMMARY OF PREDICTIONS
Figure 2 summarizes the competing predictions about the joint impact of
commitment to disclosure and accuracy on judgments of managers’ forecasting
credibility. Although both perspectives — the normative perspective and the omission
bias perspective suggest that commitment to disclosure and prior forecast accuracy will
jointly influence managers’ forecasting credibility, the perspectives differ in terms of how
investors will combine the two factors in arriving at their judgments of managers’
forecasting credibility. The normative perspective suggests that commitment to disclosure
and prior forecast accuracy exert additive, but independent effects, on managers’
forecasting credibility. In contrast, the omission bias literature suggests a commitment ×
accuracy interaction effect on managers’ forecasting credibility. That is, more committed
disclosers will be viewed as more credible, but only when prior forecast accuracy is high.
When prior forecast accuracy is low, more commitment to disclosure hurts, rather than
helps, managers’ forecasting credibility.
As discussed previously, I also predict that investors’ judgment of managers’
forecasting credibility will be positively related to their judgments about the credibility of
27
a current disclosure (disclosure credibility) and to their valuation judgments (Mercer
2004). Finally, I test alternative mechanisms by which commitment to disclosure and
prior forecast accuracy potentially impacts managers’ forecasting credibility based on the
normative perspective (risk-based mechanism) and the omission bias perspective (the
decision / norm based mechanism).
EXPERIMENT
Design and Participants
To test the competing predictions relating to the joint impact of commitment to
disclosure and prior forecast accuracy on managers’ forecasting credibility as well as my
additional predictions, I conduct an experiment that employs a 2 × 2 full-factorial,
between-participants design. Ninety three Masters of Business Administration (MBA)
students participate in the experiment, which takes about 20 minutes to complete.
Participants are paid a sum of $10 for their participation. On average, participants have
4.94 years of work experience, and have taken 3.47 courses in finance and 3.13 courses
in accounting. Although participants’ work experience and the number of finance courses
does not differ by experimental condition, the number of accounting courses taken differs
across conditions (F = 3.147, p = .03). Results of an ANOVA confirm that the number of
accounting courses, however, has neither a main effect nor does it interact with either of
the primary independent variables (commitment to disclosure and accuracy) in explaining
managers’ forecasting credibility. Therefore, I do not expect the differential number of
accounting courses taken by participants across conditions to materially impact the
reported results.
The objective of this study is to examine how non-professional investors make
judgments about managers’ forecasting credibility based on information about managers’
28
commitment to disclosure and prior forecast accuracy. I use MBA student-participants as
a proxy for non-professional investors. Two factors drive this choice. The first reason I
use MBA student-participants in the current study is because I wanted participants who
have: (a) some investment experience and (b) some knowledge of the incentives faced by
managers, both for disclosure and for non-disclosure. Given that the typical MBA student
has at least a few years of work experience, I fully expect my participants to fulfill both
criteria. Choosing less-sophisticated participants (say undergraduates) would require me
to screen participants to ensure that they meet the two criteria before administering the
study. Second, based on a framework advocated by Elliot et al. (2007), this study would
be categorized as one that is relatively low in integrative complexity. Elliot et al. find
that, for tasks that are relatively low in integrative complexity, MBA student-participants’
judgments are an appropriate proxy for judgments by non-professional investors.
It is important to recognize that are about half of all equity investors, or 28.4
million households (non-professional investors) invest directly in the stock market
(Securities Industry Association 2005). Non-professional investors, therefore, represent
an important investment population whose investment judgments and decisions should be
of interest to regulators. Although the size of the potential population of non-professional
investors is a good reason to examine their investment judgments and decisions, any
claims about the generalizability of this study’s results to such a large population must be
tempered with caution.
In this paper, I examine quarterly management earnings forecasts for two reasons.
First, in a survey of 654 of its members, the National Investor Relations Institute (NIRI
2006) reported that more than half of the firms surveyed provide quarterly earnings
forecasts. Quarterly earnings forecasts provide a stronger setting to examine commitment
to disclosure — one of the two independent variables in this study. Managers who
29
provide only annual earnings forecasts are unlikely to be viewed as committed to
disclosure, particularly when a majority of firms provide quarterly earnings forecasts.
Second, prior research in other disclosure contexts (for example, segment reporting)
documents strong investor demand for quarterly reporting (Botosan and Harris 2000).18
Consistent with stronger investor demand, prior research shows that quarterly earnings
forecasts are more informative in that they lead to stronger stock price reactions relative
to annual earnings forecasts (Pownall et al. 1993).
Materials, Manipulations, and Questions
The experiment is administered in three parts. Figure 3 provides an overview of
the information provided and the questions asked in each of the three parts. The first part
of the experiment contains background information and three prior years’ summarized
financial data for Zeta — a hypothetical company in the electrical equipment industry.
Participants are informed that Zeta has provided management earnings forecasts
voluntarily in some prior periods. At this stage, no information is provided to participants
either about Zeta’s commitment to disclosure or about the accuracy of these forecasts.
To minimize the possibility that participants might make inferences that historical
forecasts may be biased, participants are told that Zeta’s earnings forecasts (compared to
reported earnings) were not systematically biased in one direction. Participants are also
told that Zeta’s prior forecasts include a mix of good and bad news. This information is
provided to address the concern that participants may assume that managers
systematically provide earnings forecasts only when there is a particular type of news.
For instance, if participants assume that managers provide forecasts only when there is
bad news, they may not view fewer forecasts as a sign of lack of commitment to
18 Underscoring investor demand for more frequent reporting, Botosan and Harris (2000) report, based n a FASB study that “users contended that, to be timely, segment information is needed more often than annually…” (p. 330)
30
disclosure. They may, instead, view fewer disclosures as reflecting a systematic policy of
communicating only a particular type of news. This assumption, if made, is a concern
because it weakens the commitment to disclosure manipulation. Framing the news-
content of prior forecasts as a mix of good and bad news should mitigate this concern.
Based on this information, participants assigned to the role of potential investors
provide their initial assessment of managers’ forecasting credibility — the primary
dependent variable in the study. Participants also provide their assessment of managers’
trustworthiness and forecasting competence and provide a price – earnings (P/E) multiple
for Zeta. Participants are told that other firms in Zeta’s industry trade at multiples of
trailing earnings between 15 and 25 times. Because all participants view the same
information, systematic differences in their initial judgments are not expected.
Following part one, the manipulations are then introduced. Participants are
assigned to one of four conditions. The four conditions are obtained by crossing two
levels of managers’ commitment to disclosure (more versus less committed) and two
levels of managers’ prior forecast accuracy (high versus low). The only new information
provided in part two is information about Zeta’s commitment to disclosure and prior
forecast accuracy. Given that the objective of the experiment is to measure how
participants react to information about commitment to disclosure and prior forecast
accuracy (and not whether or not they attend to this information), I use a two-stage design
that increases the likelihood that participants will notice the manipulations (Libby et al.
2002). I use the scores obtained in the first part of the experiment as covariates in
subsequent analyses.
Participants assigned to the condition in which managers are more (less)
committed to disclosure are informed that managers provide voluntary earnings forecasts
31
in twelve (four) of the preceding twelve quarters.19 Importantly, participants are told that
the twelve forecasts are provided one in each quarter (i.e. predictably in each quarter for
the past three years). In contrast, participants in the less committed condition are told that
the four forecasts were provided in different quarters in each of the three years (i.e.
apparently at random and therefore unpredictably).
Consistent with my definition of commitment to disclosure, my manipulation is
designed to capture the idea that more committed managers provide disclosures both
frequently and predictably (cf. Hackenbrack and Nelson 1996).20 In contrast, less
committed managers are neither frequent nor predictable. I manipulate the two extremes
(high frequency and high predictability compared to low frequency and low
predictability) to maximize the likelihood that I should detect an effect for the treatment,
should one exist. I do not examine cases where managers provide (a) highly frequent, but
unpredictable forecasts or (b) highly predictable, but infrequent forecasts. Managers who
issue highly frequent, but unpredictable earnings forecasts are unlikely to be seen as more
committed to disclosure. That is, they sacrifice an important ingredient that makes
disclosures more relevant — predictability. Similarly, managers who are highly
predictable, but infrequent disclosers, are also unlikely to be viewed as more committed
to disclosure. That is, they sacrifice an important ingredient that makes disclosures more
19 The basis for the choice of twelve versus four quarterly forecasts in a three year period is the following: for a sample of quarterly management earnings forecasts during the period 2001 to 2003 (12 quarters), Cheng et al. (2005) find that dedicated forecasters (the top one-third of their sample) provide forecasts in 10 out of 12 quarters, whereas occasional forecasters (comprising the bottom one-third of their sample) provide forecasts in only one out of the 12 quarters. The levels chosen in the experiment are, therefore, (a) adequately separate to detect a treatment effect, should one exist, and (b) correspond to real-world conditions (Libby et al. 2002). Although I could choose less than four quarters to operationalize the less committed to disclosure condition, I choose four quarters to ensure that my predictions can be meaningfully tested. For instance, if I chose just one quarter (out of twelve) to operationalize low commitment to disclosure, the main effect for commitment to disclosure could overwhelm any other effects. 20 Specifically, Hackenbrack and Nelson (1996) manipulate auditor engagement risk in an audit setting using multiple dimensions of risk. The three specific dimensions they use are: (1) pressure from lenders, (2) impending initial public offering and (3) age of audit client. They simultaneously manipulate all three of these variables to create a more powerful manipulation of engagement risk.
32
relevant — frequency. Therefore, my operationalization of commitment to disclosure
varies both frequency and predictability.
Turning next to the accuracy manipulation, participants in the high (low) forecast
accuracy condition are informed that Zeta is ranked in the top (bottom) 10 percent of its
peers in terms of forecasting accuracy over the past three years. There are two advantages
to providing a relative rank for accuracy. First, if I were to require participants to
compute accuracy, this procedure has the potential to divert their attention away from the
question of interest. In contrast, providing accuracy rankings minimizes this possibility.
Second, ranking managers’ forecast accuracy relative to peers rather than providing an
absolute measure of accuracy (say, managers were accurate in 8 of 12 quarters) ensures
that participants do not have to make assumptions about general levels of accuracy for
management forecasts. Following this information, participants respond to the same
questions asked at the end of part one of the experiment. That is, participants provide
their revised assessment of managers’ forecasting credibility, manager’s trustworthiness,
forecasting competence, and a P/E ratio for Zeta.
Part three of the experiment has two objectives. First, it seeks to verify whether
participants’ perceptions of managers’ forecasting credibility (obtained in the previous
parts of the experiment) is related to how they view a current earnings forecast from Zeta.
In other words, it tests the claim that managers’ forecasting credibility is positively
related to disclosure credibility — the credibility of a specific disclosure (Mercer 2004).
Second, participants are asked several questions to see how they reasoned through the
experimental material to better understand the process by which the treatments influence
participant judgments. Recall that the normative perspective and the omission bias
perspective suggest two alternative mechanisms by which commitment to disclosure and
prior forecast accuracy might influence managers’ forecasting credibility. Part three
33
provides a current earnings forecast from Zeta. This forecast states that Zeta expects
earnings per share (EPS) will be $ 0.31 for the upcoming quarter. Participants are also
told that this estimate is four cents above the latest consensus analyst EPS forecast of $
0.27.
Following the current earnings forecast provided in part three, I ask participants
several questions to accomplish the two objectives listed above. The first set of questions
seeks participants’ responses to the current earnings forecast. Participants provide their
assessment of the credibility of the current earnings forecast and answer several
additional questions relating to the current forecast. The second set of questions seeks to
capture the underlying mechanisms that drive the relationship between commitment to
disclosure, prior forecast accuracy, and managers’ forecasting credibility. Specifically, I
ask participants about their perceptions of information risk, the extent to which Zeta’s
forecasts represent decision making by Zeta’s managers, and whether Zeta’s forecasting
behavior is consistent with norms. In addition to these questions, I ask questions to check
that participants understand the manipulations as intended. A final set of questions
obtains demographic information to verify whether participant responses vary
systematically based on any specific demographic variable. The complete experimental
materials are reproduced in Appendices B through G.
RESULTS
Manipulation and Other Checks
I first present participant responses to questions that check the primary
manipulations — managers’ commitment to disclosure and prior forecast accuracy. I also
discuss participants’ responses to several other questions to check that participants
interpret the experimental materials as intended. To check that participants view the

34
commitment to disclosure manipulation as intended, I ask participants to rate their beliefs
about Zeta’s managers’ commitment to disclosure relative to their peers on a scale where
0 indicates below average and 10 indicates above average. As expected, participants
assigned to the condition where managers are more committed to disclosure rate
managers’ commitment to disclosure significantly higher than participants assigned to the
condition where managers are less committed to disclosure ( X more committed = 6.87, X less
committed = 4.75, t = 5.89, p < .01). 21
For the forecaster accuracy manipulation, participants check one of three response
options. The options are whether Zeta’s earnings forecast accuracy is: (a) in the top 10%
of its industry (b) in the bottom 10% of its industry and (c) cannot recall. Ninety eight
percent (93%) of the participants in the high- (low-) accuracy condition respond correctly
to this question. Responses are significantly associated with the experimental condition
(χ12 = 30.57, p < .01) indicating that the accuracy manipulation is effective.22
To invoke the omission bias, it is important to verify that participants believe that
more committed disclosers are more active whereas less committed disclosers are
(relatively) less active. Participants respond to a question that asks whether Zeta’s
forecasting history reflects low or high levels of forecasting activity on part of Zeta’s
managers. Scale endpoints are 0 denoting low levels of forecasting activity and 10
denoting high levels of forecasting activity. As expected, participants rate more
committed disclosers as more active relative to less committed disclosers ( X more committed
= 5.7, X less committed = 4.1, t = 3.22, p = .002).
21 Note that all questions relating to the manipulations are asked towards the end of the experiment to minimize the possibility of hypothesis-guessing. For the exact location of the questions, please see Appendices B through G. 22 One participant did not answer any of the manipulation check questions. Excluding responses from this participant or from participants who failed one or more of the manipulation checks does not alter any of the inferences.
35
Participants respond to additional questions aimed at checking for assumptions
that could impact the observed results. Two specific concerns are: (a) participants may
confound accuracy and bias, and (b) participants may assume that managers
systematically provide earnings forecasts only when they have a specific type of news
(e.g., bad news). If participants across conditions make systematically different
assumptions about managers’ bias, these assumptions could impact participants’
credibility judgments via their judgments of managers’ trustworthiness. Also, if
participants assigned to the condition in which managers are less committed to disclosure
assumed that managers always communicated a specific type of news, they may not view
infrequent disclosers as less committed to disclosure, thereby weakening the commitment
to disclosure manipulation.
Participants check one of four response options with respect to their perceptions
of Zeta’s forecast bias. The options are whether Zeta’s forecast errors are mostly: (a)
positive – forecasts are mostly lower than reported earnings, (b) negative – forecasts are
mostly higher than reported earnings, (c) neutral, or (d) cannot recall. Ninety three
percent of the participants across conditions respond that forecast errors are neutral.
Responses are not significantly associated with experimental condition (χ12 = 0.13, p =
.72) indicating that the participants across conditions appeared to believe that, on
average, Zeta’s forecast errors were neutral, and therefore, did not connote systematic
bias.
Similarly, participants check one of four response options with respect to their
perceptions of the news content of Zeta’s earnings forecasts. The options are whether
Zeta’s earnings forecasts mostly conveyed: (a) good news, (b) bad news, (c) a mix of
good and bad news, or (d) cannot recall. Ninety three percent of the participants across
conditions indicate that Zeta’s forecasts represent a mix of good and bad news.
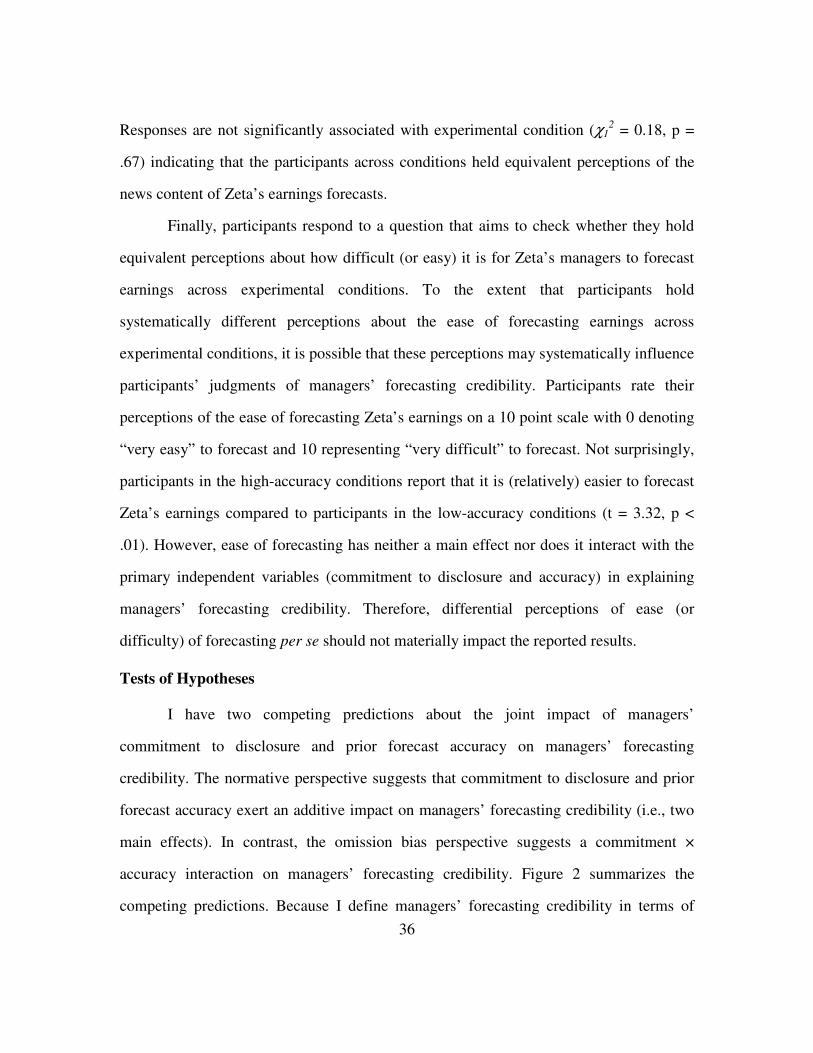
36
Responses are not significantly associated with experimental condition (χ12 = 0.18, p =
.67) indicating that the participants across conditions held equivalent perceptions of the
news content of Zeta’s earnings forecasts.
Finally, participants respond to a question that aims to check whether they hold
equivalent perceptions about how difficult (or easy) it is for Zeta’s managers to forecast
earnings across experimental conditions. To the extent that participants hold
systematically different perceptions about the ease of forecasting earnings across
experimental conditions, it is possible that these perceptions may systematically influence
participants’ judgments of managers’ forecasting credibility. Participants rate their
perceptions of the ease of forecasting Zeta’s earnings on a 10 point scale with 0 denoting
“very easy” to forecast and 10 representing “very difficult” to forecast. Not surprisingly,
participants in the high-accuracy conditions report that it is (relatively) easier to forecast
Zeta’s earnings compared to participants in the low-accuracy conditions (t = 3.32, p <
.01). However, ease of forecasting has neither a main effect nor does it interact with the
primary independent variables (commitment to disclosure and accuracy) in explaining
managers’ forecasting credibility. Therefore, differential perceptions of ease (or
difficulty) of forecasting per se should not materially impact the reported results.
Tests of Hypotheses
I have two competing predictions about the joint impact of managers’
commitment to disclosure and prior forecast accuracy on managers’ forecasting
credibility. The normative perspective suggests that commitment to disclosure and prior
forecast accuracy exert an additive impact on managers’ forecasting credibility (i.e., two
main effects). In contrast, the omission bias perspective suggests a commitment ×
accuracy interaction on managers’ forecasting credibility. Figure 2 summarizes the
competing predictions. Because I define managers’ forecasting credibility in terms of

37
managers’ trustworthiness and managers’ forecasting competence, I present the results
for trustworthiness and competence first before presenting the results for participants’
perceptions of managers’ forecasting credibility.
Based on Zeta’s management earnings forecasts and other background
information, I first ask participants about the credibility of Zeta’s managers’ forecasts.
Scale endpoints are 0 (not at all credible) and 10 (highly credible). Second, participants
provide their assessment of the trustworthiness of Zeta’s managers. Scale endpoints are 0
(not at all trustworthy) and 10 (highly trustworthy). Third, participants provide their
assessment of the forecasting competence of Zeta’s managers. Scale endpoints are 0 (not
at all competent) and 10 (highly competent). Results of a MANOVA (not tabulated) on
all three dependent variables — managers’ trustworthiness, managers’ forecasting
competence, and managers’ forecasting credibility, shows a significant commitment ×
accuracy interaction (Wilks Lambda F = 7.80, p < .01), a non-significant main effect for
commitment to disclosure (Wilks Lambda F =.39, p = .76), and a significant main effect
for prior forecasting accuracy (Wilks Lambda F = 95.98, p < .01). I present the results of
the related ANOVA’s for trustworthiness and competence first before presenting the
results for managers’ forecasting credibility.
Judgments of Managers’ Trustworthiness
Panel A of Table 1 presents participants’ assessment of managers’ trustworthiness
before and after the manipulations of managers’ commitment to disclosure and accuracy.
Participants’ initial judgments of managers’ trustworthiness do not vary across conditions
(F = 1.34, p = 0.27) as expected. Panel B of Table 1 presents the results of an ANCOVA
model with participants’ initial judgment of managers’ trustworthiness as a covariate,
commitment to disclosure and accuracy as independent variables and participants’ final
perceptions of managers’ trustworthiness as the dependent variable. The ANCOVA
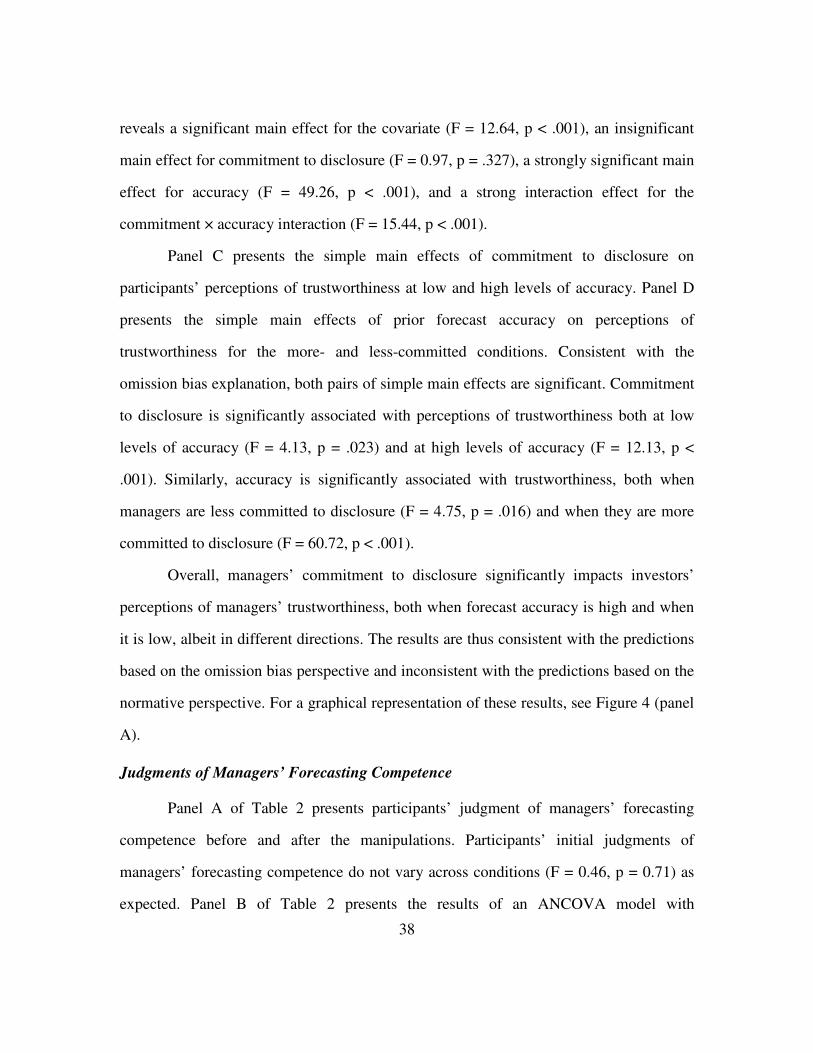
38
reveals a significant main effect for the covariate (F = 12.64, p < .001), an insignificant
main effect for commitment to disclosure (F = 0.97, p = .327), a strongly significant main
effect for accuracy (F = 49.26, p < .001), and a strong interaction effect for the
commitment × accuracy interaction (F = 15.44, p < .001).
Panel C presents the simple main effects of commitment to disclosure on
participants’ perceptions of trustworthiness at low and high levels of accuracy. Panel D
presents the simple main effects of prior forecast accuracy on perceptions of
trustworthiness for the more- and less-committed conditions. Consistent with the
omission bias explanation, both pairs of simple main effects are significant. Commitment
to disclosure is significantly associated with perceptions of trustworthiness both at low
levels of accuracy (F = 4.13, p = .023) and at high levels of accuracy (F = 12.13, p <
.001). Similarly, accuracy is significantly associated with trustworthiness, both when
managers are less committed to disclosure (F = 4.75, p = .016) and when they are more
committed to disclosure (F = 60.72, p < .001).
Overall, managers’ commitment to disclosure significantly impacts investors’
perceptions of managers’ trustworthiness, both when forecast accuracy is high and when
it is low, albeit in different directions. The results are thus consistent with the predictions
based on the omission bias perspective and inconsistent with the predictions based on the
normative perspective. For a graphical representation of these results, see Figure 4 (panel
A).
Judgments of Managers’ Forecasting Competence
Panel A of Table 2 presents participants’ judgment of managers’ forecasting
competence before and after the manipulations. Participants’ initial judgments of
managers’ forecasting competence do not vary across conditions (F = 0.46, p = 0.71) as
expected. Panel B of Table 2 presents the results of an ANCOVA model with
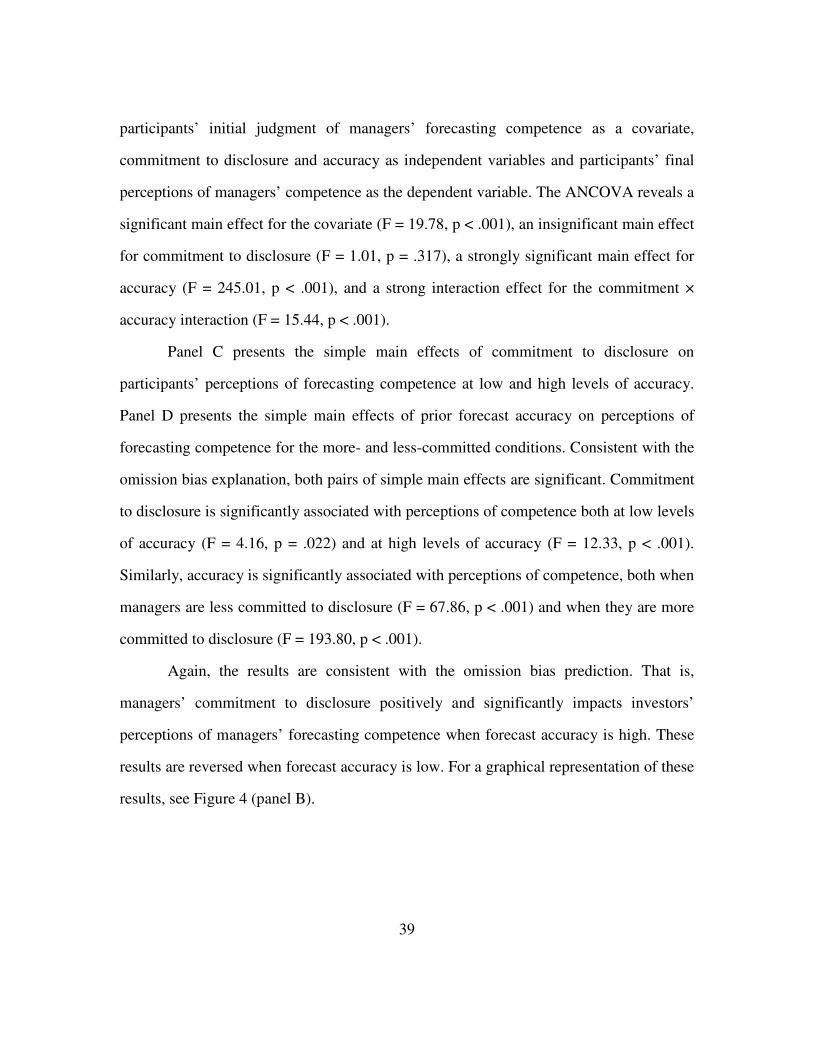
39
participants’ initial judgment of managers’ forecasting competence as a covariate,
commitment to disclosure and accuracy as independent variables and participants’ final
perceptions of managers’ competence as the dependent variable. The ANCOVA reveals a
significant main effect for the covariate (F = 19.78, p < .001), an insignificant main effect
for commitment to disclosure (F = 1.01, p = .317), a strongly significant main effect for
accuracy (F = 245.01, p < .001), and a strong interaction effect for the commitment ×
accuracy interaction (F = 15.44, p < .001).
Panel C presents the simple main effects of commitment to disclosure on
participants’ perceptions of forecasting competence at low and high levels of accuracy.
Panel D presents the simple main effects of prior forecast accuracy on perceptions of
forecasting competence for the more- and less-committed conditions. Consistent with the
omission bias explanation, both pairs of simple main effects are significant. Commitment
to disclosure is significantly associated with perceptions of competence both at low levels
of accuracy (F = 4.16, p = .022) and at high levels of accuracy (F = 12.33, p < .001).
Similarly, accuracy is significantly associated with perceptions of competence, both when
managers are less committed to disclosure (F = 67.86, p < .001) and when they are more
committed to disclosure (F = 193.80, p < .001).
Again, the results are consistent with the omission bias prediction. That is,
managers’ commitment to disclosure positively and significantly impacts investors’
perceptions of managers’ forecasting competence when forecast accuracy is high. These
results are reversed when forecast accuracy is low. For a graphical representation of these
results, see Figure 4 (panel B).
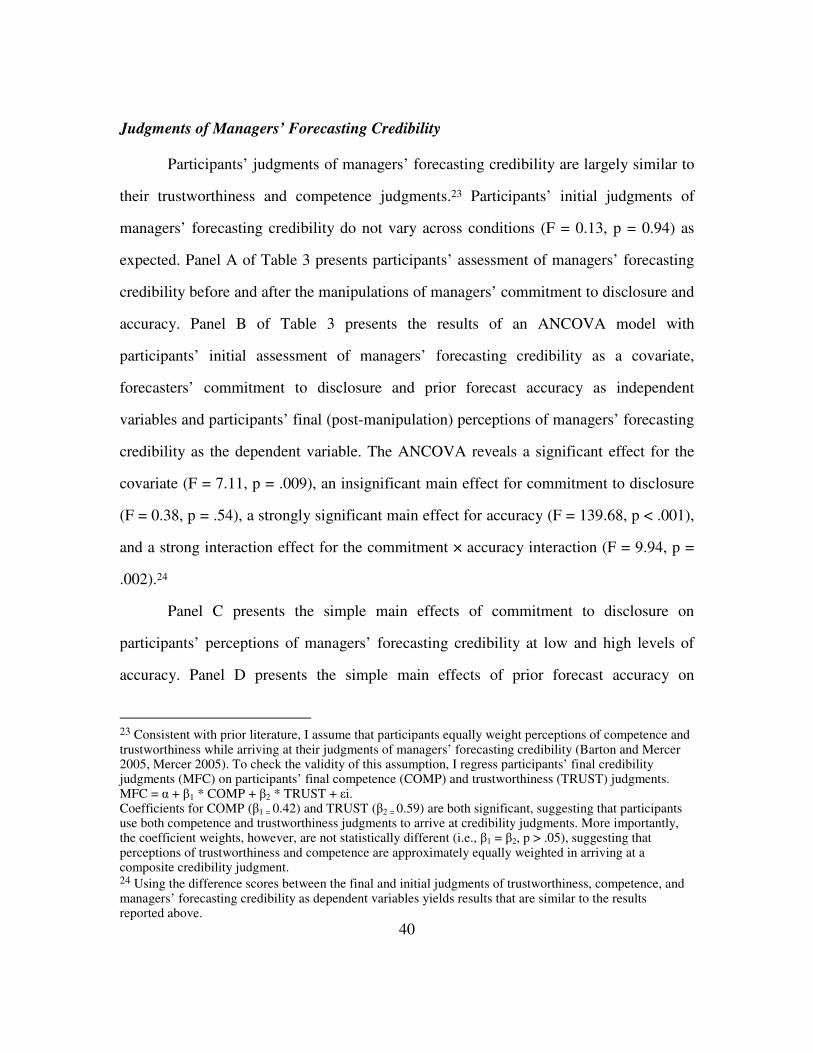
40
Judgments of Managers’ Forecasting Credibility
Participants’ judgments of managers’ forecasting credibility are largely similar to
their trustworthiness and competence judgments.23 Participants’ initial judgments of
managers’ forecasting credibility do not vary across conditions (F = 0.13, p = 0.94) as
expected. Panel A of Table 3 presents participants’ assessment of managers’ forecasting
credibility before and after the manipulations of managers’ commitment to disclosure and
accuracy. Panel B of Table 3 presents the results of an ANCOVA model with
participants’ initial assessment of managers’ forecasting credibility as a covariate,
forecasters’ commitment to disclosure and prior forecast accuracy as independent
variables and participants’ final (post-manipulation) perceptions of managers’ forecasting
credibility as the dependent variable. The ANCOVA reveals a significant effect for the
covariate (F = 7.11, p = .009), an insignificant main effect for commitment to disclosure
(F = 0.38, p = .54), a strongly significant main effect for accuracy (F = 139.68, p < .001),
and a strong interaction effect for the commitment × accuracy interaction (F = 9.94, p =
.002).24
Panel C presents the simple main effects of commitment to disclosure on
participants’ perceptions of managers’ forecasting credibility at low and high levels of
accuracy. Panel D presents the simple main effects of prior forecast accuracy on
23 Consistent with prior literature, I assume that participants equally weight perceptions of competence and trustworthiness while arriving at their judgments of managers’ forecasting credibility (Barton and Mercer 2005, Mercer 2005). To check the validity of this assumption, I regress participants’ final credibility judgments (MFC) on participants’ final competence (COMP) and trustworthiness (TRUST) judgments. MFC = α + β1 * COMP + β2 * TRUST + εi. Coefficients for COMP (β1 = 0.42) and TRUST (β2 = 0.59) are both significant, suggesting that participants use both competence and trustworthiness judgments to arrive at credibility judgments. More importantly, the coefficient weights, however, are not statistically different (i.e., β1 = β2, p > .05), suggesting that perceptions of trustworthiness and competence are approximately equally weighted in arriving at a composite credibility judgment. 24 Using the difference scores between the final and initial judgments of trustworthiness, competence, and managers’ forecasting credibility as dependent variables yields results that are similar to the results reported above.
41
perceptions of forecasting credibility for the more- and less-committed conditions.
Consistent with the omission bias explanation, both pairs of simple main effects are
significant. Commitment to disclosure is significantly associated with perceptions of
credibility both at low levels of accuracy (F = 3.18, p = .039) and at high levels of
accuracy (F = 7.15, p < .001). Similarly, accuracy is significantly associated with
perceptions of credibility, both when managers are less committed to disclosure (F =
37.18, p < .001) and when they are more committed to disclosure (F = 113.26, p < .001).
Overall, the results for participants’ perceptions of managers’ forecasting
credibility are again consistent with the omission bias perspective and inconsistent with
the normative perspective.25 Commitment to disclosure exerts a significant positive
influence on participants’ assessments of managers’ forecasting credibility for highly
accurate managers. In contrast, commitment to disclosure exerts a significant negative
influence on participants’ assessments of managers’ forecasting credibility for managers
whose prior forecast accuracy is low. For a graphical representation of these results, see
Figure 4 (panel C).
Other Judgments
Participants’ judgment of managers’ forecasting credibility based on historical
forecasting behavior is important to the extent that it influences (a) their assessment of
the credibility of a current disclosure and (b) their valuation judgments. Participants
answer additional questions that shed some light on these questions. First, to test whether
25 Participants assigned to the conditions where managers are less committed to disclosure might respond around the midpoint of the scale on the three key variables because they did not have sufficient data to reach stronger conclusions (see, for example the flat-line results for participants’ perceptions of trustworthiness in the less-committed conditions). If, indeed, participants’ responses clustered around the midpoint – it is plausible that the reported results reflect insufficient data rather than strongly held beliefs. Analysis of participants’ responses on all three variables suggests that fewer than 20% of participants responded in or around the midpoint of the scale (i.e., between 4.5 and 5.5), allaying any concerns that the results are driven by participants’ ambivalence.
42
participants’ judgments of the credibility of a current disclosure is positively associated
with their judgments of managers’ forecasting credibility, they are presented with an
earnings forecast disclosure for an upcoming quarter for Zeta and asked to provide their
assessment of the credibility of that specific earnings forecast. Response scale endpoints
are 0 (not at all credible) and 10 (highly credible). Consistent with expectations,
participants’ assessment of disclosure credibility (i.e., the believability of a specific
earnings forecast) is positively and significantly correlated with participants’ (final)
judgments of managers’ forecasting credibility (r = 0.67, p < .001). More important, an
ANOVA with disclosure credibility as the dependent variable, commitment to disclosure
and accuracy as independent variables reveals an insignificant main effect for
commitment to disclosure (F = 2.18, p = .143), a significant main effect for accuracy (F =
80.20, p < .001), and a significant interaction effect for the commitment × accuracy
interaction (F = 6.50, p = .0125) reinforcing the idea that managers’ forecasting
credibility influences how investors are likely to view additional disclosures from
managers. Table 4 presents descriptive statistics (panel A) and the results of this
ANOVA (panel B).
Second, to answer the question whether participants’ valuation judgments are
affected by the experimental treatments, participants are asked to provide a price to
earnings ratio (P/E) for Zeta, both before and after the manipulations. Participants are
informed that other firms in Zeta’s industry trade at multiples of trailing earnings of
between 15 and 25 times. A few participants provided P/E ratios that were unusable.
Participants who provided P/E ratios that were greater than 35 or lower than 5 were
excluded from the analysis. This rule resulted in the exclusion of P/E ratios provided by 5
43
participants. Therefore, the data reported below relate to 88 participants (93 participants
less 5 unusable responses).26
Panel A of Table 5 presents participants’ P/E judgments before and after the
manipulations. As expected, participants’ initial P/E judgments do not vary across
conditions (F = 0.83, p = 0.483). Participants’ final P/E judgments, however, do vary
across conditions, consistent with participant judgments for the other dependent
measures. Panel B of Table 5 presents an ANCOVA with participants’ initial P/E
judgment as a covariate, commitment to disclosure and accuracy as independent
variables, and participants’ final P/E judgments as the dependent variable. The ANCOVA
shows a significant effect for the covariate (F = 71.04, p < .001), an insignificant main
effect for commitment to disclosure (F = 2.57, p = 0.113), a significant main effect for
accuracy (F = 54.51, p < .001), and a significant interaction effect for the commitment ×
accuracy interaction (F = 8.36, p = .005). In other words, the multiple that participants are
willing to pay for Zeta’s earnings varies systematically, following the pattern for the
other dependent variables. Therefore, participants’ valuation judgments appear to
correspond with their judgment of managers’ forecasting credibility.
Panel C presents the simple main effects of commitment to disclosure on
participants’ P/E judgments at low and high levels of accuracy. Participants appear to
distinguish between more- and less-committed managers with respect to P/E only when
managers are highly accurate (F = 10.00, p = .001). When managers are less accurate,
participants’ P/E judgments do not differ significantly based on commitment to
disclosure (F = 0.83, p = .18). In other words, the omission bias prediction is not fully
supported. Panel D presents the simple main effects of prior forecast accuracy on
participants’ P/E judgments for the more- and less-committed conditions. Accuracy is 26 Re-running the analyses for the main dependent variables — perceptions of trustworthiness, competence, and credibility — excluding responses from these 5 participants does not alter the results.
44
significantly associated with participants’ P/E judgments, both when managers are more
committed to disclosure (F = 52.74, p < .001) and when they are less committed to
disclosure (F = 9.95, p = .001). It is important to note that the lack of support for the
omission bias perspective does not automatically imply that the normative perspective is
supported. If the normative perspective was supported, we should not expect to see the
commitment × accuracy interaction. The results for participants’ P/E judgments,
however, are less strongly supportive of the omission bias perspective compared to the
results for the other dependent variables.
Additional Analyses: Structural Equation Model
To better understand how commitment to disclosure and prior forecast accuracy
jointly influence managers’ forecasting credibility, I also test the mechanisms suggested
by the normative and the omission bias perspectives. Recall that the normative
perspective suggests a risk-based mechanism whereas the omission bias perspective
suggests a decision or a norm-based mechanism. I test the risk-based mechanism first
before turning to the mechanisms proposed by the omission bias perspective.
To measure participants’ perceptions of risk related to Zeta’s stock, I ask three
questions. The first question asks participants whether they believe Zeta’s stock is more
or less risky relative to its peers. Participants respond on a scale with endpoints of 0
denoting less risky and 10 denoting more risky. The second question asks whether Zeta’s
stock price is likely to be volatile. Participants respond on a scale with endpoints of 0
denoting highly volatile and 10 denoting not at all volatile. A third question asks how
much effort participants expect to spend monitoring their investment in Zeta (assuming
they choose to invest). Participants respond on a scale with endpoints of 0 denoting a lot
45
of effort and 10 denoting very little effort.27 This question aims to capture the information
risk associated with owning Zeta’s stock. Based on a Cronbach’s alpha score of 0.70, it
appears that all three questions appear to be measuring a common underlying construct
(Peterson 1994). Additionally, the results of a factor analysis conducted on participants’
responses to these three questions suggests a single underlying factor as well, with the
factor loadings on individual questions well above 0.40 — a generally accepted cutoff for
a meaningful factor loading (Hatcher 1994). I therefore use a composite score averaging
participants’ responses on these three questions as a proxy for participants’ risk
perceptions about Zeta.
As expected, participants’ composite risk scores are systematically associated
with the prior forecast accuracy treatment. That is, participants assigned to the high
accuracy condition rate risk to be systematically lower compared to participants assigned
to the low accuracy condition (t = 5.61, p < .01). Contrary to the prediction of the
normative perspective, however, participants’ composite risk scores are not
systematically associated with the commitment to disclosure treatment. That is,
participants assigned to condition in which managers are more committed to disclosure
do not rate risk to be different compared to participants assigned to the condition in
which managers are less committed to disclosure (t = .72, p = .47).28 Not surprisingly,
results of a structural equation model (not tabulated) confirm that the path between
commitment to disclosure and the risk-based measure is not significant regardless of
accuracy (High accuracy t = -.63, p = .14; Low accuracy t = .04, p =.92). In addition, the
overall fit of a model incorporating the risk-based measure as a mediator reveals a
poorly-fitting model (χ213 = 24.62, p = .03). One potential explanation for this result is the
27 Responses to the second and third question relating to risk are reverse-scored to ensure that endpoints consistently capture low and high risk. 28 Using participants’ scores on individual questions, instead of the composite score, leads to the same results.

46
possibility that the case materials do not provide adequate information for participants to
make a meaningful assessment of risk. Subject to this caveat, it does not appear that
participants are making differential assessment of information risk based on commitment
to disclosure.
The omission bias literature posits that people will make stronger judgments
about more committed disclosers because more committed disclosers are likely to be seen
as making more deliberate decisions. In contrast, less committed disclosers are likely to
be seen as passively accepting the default option of non disclosure and thus likely to be
seen as making less deliberate decisions. Thus, according to this perspective, the decision
versus non-decision dichotomy drives the interaction between commitment to disclosure
and prior forecast accuracy predicted by the omission bias. To test the validity of this
claim, I obtain participants’ perceptions of whether more committed disclosers are indeed
seen as engaging in more deliberate decision making relative to less committed
disclosers. Participants respond to a question that asks them to rate whether Zeta’s
managers choose to provide earnings forecasts every quarter after careful deliberation.
Scale endpoints are 0 denoting very little deliberation and 10 denoting a great deal of
deliberation. Contrary to expectations, participants assigned to the condition where
managers are more committed to disclosure rate managers as less deliberate relative to
participants assigned to the condition where managers are less committed to disclosure (t
= 3.75, p < .01 ). In other words, more commitment to disclosure (or action, in omission
bias terms) appears to be associated with less, rather than more deliberate decision-
making. A structural equations model with participants’ perceptions of (deliberate)
decision-making mediating the relationship between commitment to disclosure, prior
forecast accuracy, and managers’ forecasting credibility fits the data well (χ213 = 11.74 , p
= .55), but the results are in the opposite direction from that predicted by the omission
47
bias literature. Thus, it appears unlikely that the decision versus non-decision distinction
drives the interaction results reported in the previous sections.
As noted earlier, another explanation for the observed pattern of results is
suggested by Prentice and Koehler (2003). They argue that people demarcate observed
behavior not along the lines of decision versus non-decision (as generally suggested by
omission bias), but along the lines of whether the behavior is norm-consistent versus
norm-inconsistent. Further, they argue that people react more strongly to outcomes that
arise from norm-inconsistent rather than norm-consistent behaviors.
In the context of this study, more committed disclosers should be viewed as norm-
inconsistent because management earnings forecasts are voluntary disclosures. That is,
more committed disclosers are likely to be viewed as exceeding disclosure norms. In
contrast, less committed disclosers to disclosure should, on average, be viewed as norm-
consistent. Therefore, commitment to disclosure should be negatively related to
perceptions of norm-consistency. The relationship between perceptions of norm-
consistency and managers’ forecast credibility, in turn, should be moderated by prior
forecast accuracy.
To test this norm-based explanation, I conduct a structural-equations analysis that
simultaneously estimates the relationships between my manipulated variables
(commitment to disclosure and prior forecast accuracy), a mediating variable
(participants’ perceptions of norm-consistency), and my dependent variable — managers’
forecasting credibility. Figure 5 presents the results of this analysis. I first confirm the
model’s goodness of fit with a conventional χ2 test (χ213 = 17.96, p = .16) and an
incremental fit index (IFI) of 0.90.29 To obtain a measure that estimates the proposed
mediating variable, I ask participants to rate whether Zeta’s earnings forecast frequency 29 Incremental Fit Index (IFI) values range between 0 and 1 with values close to 1 indicating a well fitted model (Arbuckle and Wothke 1995).
48
is consistent with the norm for its industry. Scale endpoints are 0 denoting much lower
than the norm and 10 denoting much higher than the norm. Consistent with expectations,
more committed disclosers are viewed as norm-inconsistent and less committed
disclosers are viewed as norm-consistent. That is, the relationship between commitment
to disclosure and perceptions of norm-consistency (Link 1) is negative and significant (t
= -3.97, p < .01). Next, consistent with the idea that participants will react more strongly
to an outcome if it is norm-inconsistent than if it is norm-consistent, I expect that the
relationship between perceptions of norm consistency and managers’ forecast credibility
(Link 2) will be moderated by prior forecast accuracy. As expected, there is a significant
interaction between perceptions of norm consistency and prior forecast accuracy on
managers’ reporting credibility (χ21 = 7.29, p < .01). The effect of perceptions of norm-
consistency, albeit significant for both high and low accuracy, works in opposite
directions (Link 3: High accuracy t = -.1.64, p = .05; Low accuracy t = 2.51, p < .01)
which is consistent with the interaction between commitment to disclosure and prior
forecast accuracy reported earlier. Finally, as expected, I find a positive relationship
between perceptions of managers’ forecasting credibility and participants’ P/E judgments
(Link 3: t = 2.76, p < .01).
Of the three proposed mechanisms (risk-based, decision-based, and norm-based)
by which commitment to disclosure and prior forecast accuracy impact managers’
forecast credibility, I find the strongest support for the norm-based mechanism. This
result suggests that people’s perceptions of actions and decisions may not always
coincide, thus contradicting a common assumption in the omission bias literature
(Niedermayer and Chapman 2001, Kordes-de Vaal 1996). Instead, in settings such as the
voluntary disclosure context in which the present study is set — people appear to be

49
evaluating actions based on whether they appear to be consistent with norms or not and
their eventual judgments appear to be related to perceptions of norm-consistency.
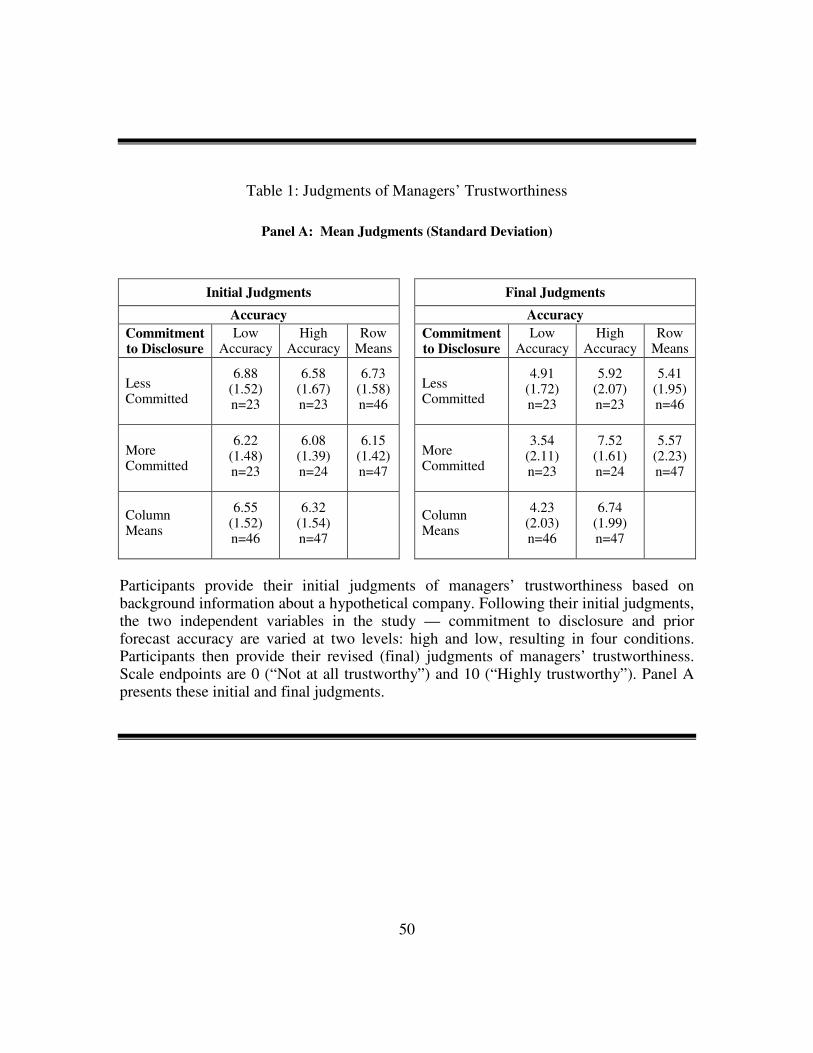
50
Table 1: Judgments of Managers’ Trustworthiness
Panel A: Mean Judgments (Standard Deviation)
Initial Judgments Final Judgments
Accuracy Accuracy
Commitment to Disclosure
Low Accuracy
High Accuracy
Row Means
Commitment to Disclosure
Low Accuracy
High Accuracy
Row Means
Less Committed
6.88 (1.52) n=23
6.58 (1.67) n=23
6.73 (1.58) n=46
Less Committed
4.91 (1.72) n=23
5.92 (2.07) n=23
5.41 (1.95) n=46
More Committed
6.22 (1.48) n=23
6.08 (1.39) n=24
6.15 (1.42) n=47
More Committed
3.54 (2.11) n=23
7.52 (1.61) n=24
5.57 (2.23) n=47
Column Means
6.55 (1.52) n=46
6.32 (1.54) n=47
Column Means
4.23 (2.03) n=46
6.74 (1.99) n=47
Participants provide their initial judgments of managers’ trustworthiness based on background information about a hypothetical company. Following their initial judgments, the two independent variables in the study — commitment to disclosure and prior forecast accuracy are varied at two levels: high and low, resulting in four conditions. Participants then provide their revised (final) judgments of managers’ trustworthiness. Scale endpoints are 0 (“Not at all trustworthy”) and 10 (“Highly trustworthy”). Panel A presents these initial and final judgments.
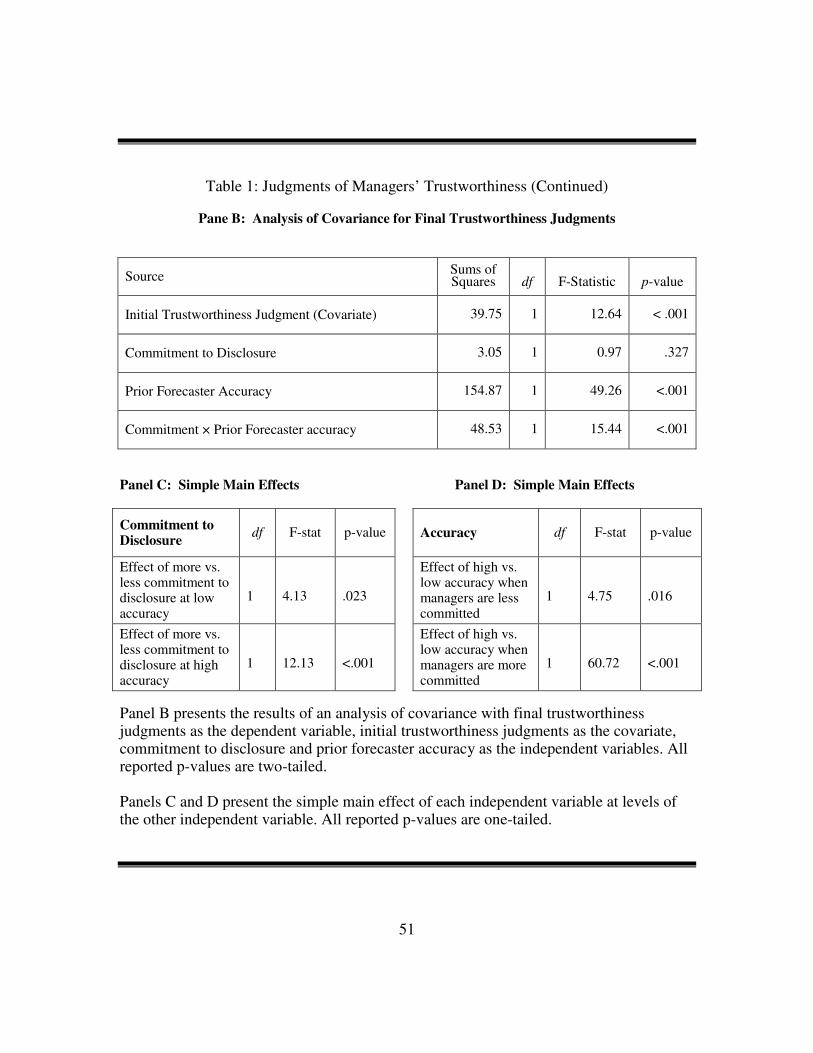
51
Table 1: Judgments of Managers’ Trustworthiness (Continued)
Pane B: Analysis of Covariance for Final Trustworthiness Judgments
Source Sums of Squares
df
F-Statistic
p-value
Initial Trustworthiness Judgment (Covariate) 39.75 1 12.64 < .001
Commitment to Disclosure 3.05 1 0.97 .327
Prior Forecaster Accuracy 154.87 1 49.26 <.001
Commitment × Prior Forecaster accuracy 48.53 1 15.44 <.001
Panel C: Simple Main Effects Panel D: Simple Main Effects
Commitment to Disclosure
df F-stat p-value Accuracy df F-stat p-value
Effect of more vs. less commitment to disclosure at low accuracy
1
4.13
.023
Effect of high vs. low accuracy when managers are less committed
1
4.75
.016
Effect of more vs. less commitment to disclosure at high accuracy
1
12.13
<.001
Effect of high vs. low accuracy when managers are more committed
1
60.72
<.001
Panel B presents the results of an analysis of covariance with final trustworthiness judgments as the dependent variable, initial trustworthiness judgments as the covariate, commitment to disclosure and prior forecaster accuracy as the independent variables. All reported p-values are two-tailed. Panels C and D present the simple main effect of each independent variable at levels of the other independent variable. All reported p-values are one-tailed.
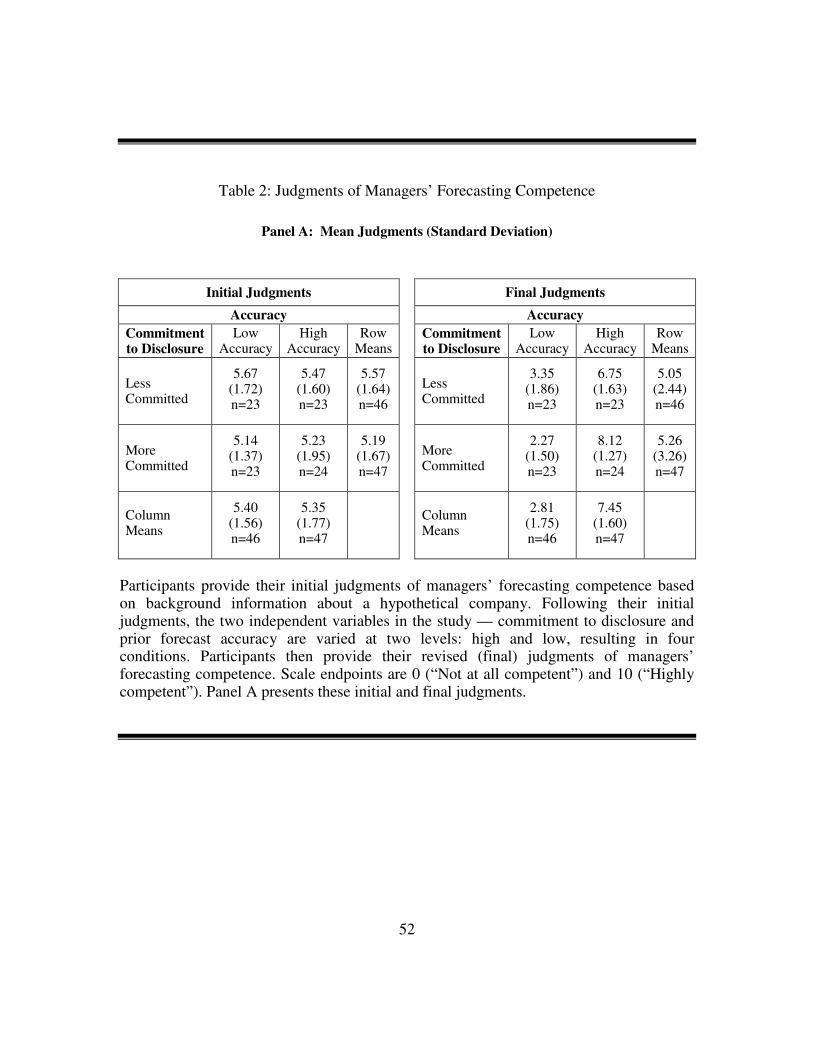
52
Table 2: Judgments of Managers’ Forecasting Competence
Panel A: Mean Judgments (Standard Deviation)
Initial Judgments Final Judgments
Accuracy Accuracy
Commitment to Disclosure
Low Accuracy
High Accuracy
Row Means
Commitment to Disclosure
Low Accuracy
High Accuracy
Row Means
Less Committed
5.67 (1.72) n=23
5.47 (1.60) n=23
5.57 (1.64) n=46
Less Committed
3.35 (1.86) n=23
6.75 (1.63) n=23
5.05 (2.44) n=46
More Committed
5.14 (1.37) n=23
5.23 (1.95) n=24
5.19 (1.67) n=47
More Committed
2.27 (1.50) n=23
8.12 (1.27) n=24
5.26 (3.26) n=47
Column Means
5.40 (1.56) n=46
5.35 (1.77) n=47
Column Means
2.81 (1.75) n=46
7.45 (1.60) n=47
Participants provide their initial judgments of managers’ forecasting competence based on background information about a hypothetical company. Following their initial judgments, the two independent variables in the study — commitment to disclosure and prior forecast accuracy are varied at two levels: high and low, resulting in four conditions. Participants then provide their revised (final) judgments of managers’ forecasting competence. Scale endpoints are 0 (“Not at all competent”) and 10 (“Highly competent”). Panel A presents these initial and final judgments.

53
Table 2: Judgments of Managers’ Forecasting Competence (Continued)
Pane B: Analysis of Covariance for Final Competence Judgments
Source Sums of Squares
df
F-Statistic
p-value
Initial Competence Judgment (Covariate) 40.49 1 19.78 < .001
Commitment to Disclosure 2.08 1 1.01 .317
Prior Forecaster Accuracy 501.58 1 245.01 <.001
Commitment × Prior Forecaster accuracy 31.61 1 15.44 <.001
Panel C: Simple Main Effects Panel D: Simple Main Effects
Commitment to Disclosure
df F-stat p-value Accuracy df F-stat p-value
Effect of more vs. less commitment to disclosure at low accuracy
1
4.16
.022
Effect of high vs. low accuracy when managers are less committed
1
67.86
<.001
Effect of more vs. less commitment to disclosure at high accuracy
1
12.33
<.001
Effect of high vs. low accuracy when managers are more committed
1
193.80
<.001
Panel B presents the results of an analysis of covariance with final competence judgments as the dependent variable, initial competence judgments as the covariate, commitment to disclosure and prior forecaster accuracy as the independent variables. All reported p-values are two-tailed. Panels C and D present the simple main effect of each independent variable at levels of the other independent variable. All reported p-values are one-tailed.
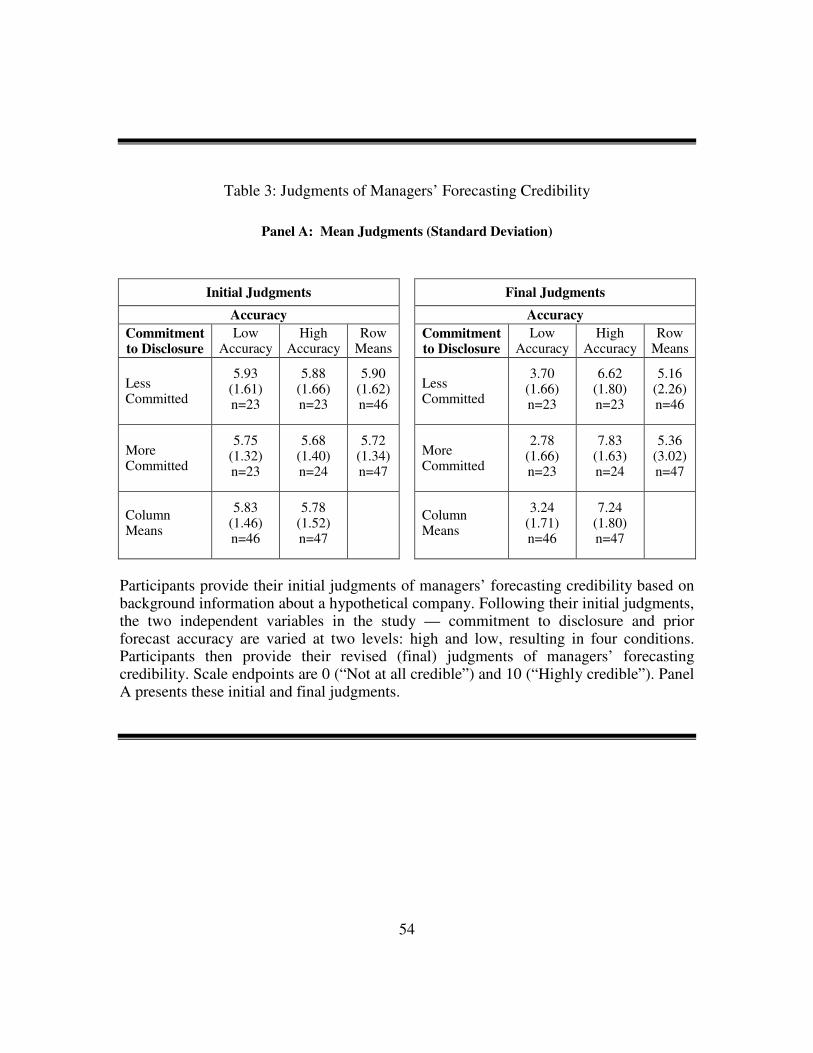
54
Table 3: Judgments of Managers’ Forecasting Credibility
Panel A: Mean Judgments (Standard Deviation)
Initial Judgments Final Judgments
Accuracy Accuracy
Commitment to Disclosure
Low Accuracy
High Accuracy
Row Means
Commitment to Disclosure
Low Accuracy
High Accuracy
Row Means
Less Committed
5.93 (1.61) n=23
5.88 (1.66) n=23
5.90 (1.62) n=46
Less Committed
3.70 (1.66) n=23
6.62 (1.80) n=23
5.16 (2.26) n=46
More Committed
5.75 (1.32) n=23
5.68 (1.40) n=24
5.72 (1.34) n=47
More Committed
2.78 (1.66) n=23
7.83 (1.63) n=24
5.36 (3.02) n=47
Column Means
5.83 (1.46) n=46
5.78 (1.52) n=47
Column Means
3.24 (1.71) n=46
7.24 (1.80) n=47
Participants provide their initial judgments of managers’ forecasting credibility based on background information about a hypothetical company. Following their initial judgments, the two independent variables in the study — commitment to disclosure and prior forecast accuracy are varied at two levels: high and low, resulting in four conditions. Participants then provide their revised (final) judgments of managers’ forecasting credibility. Scale endpoints are 0 (“Not at all credible”) and 10 (“Highly credible”). Panel A presents these initial and final judgments.
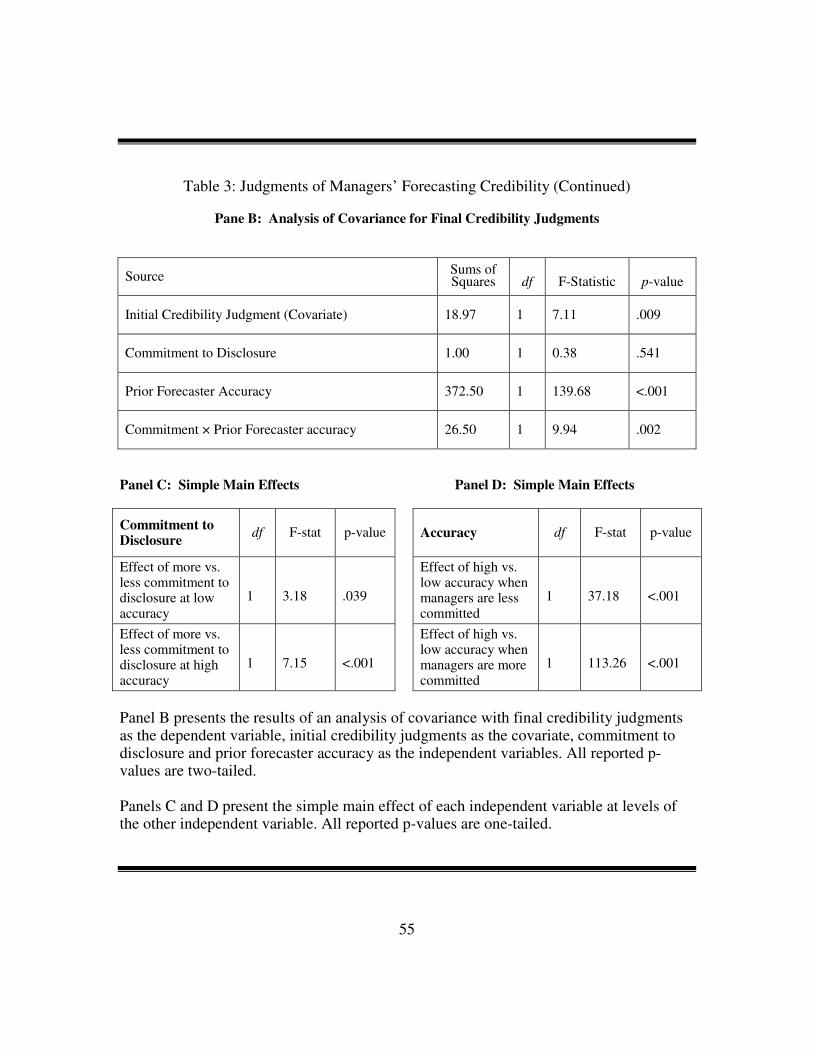
55
Table 3: Judgments of Managers’ Forecasting Credibility (Continued)
Pane B: Analysis of Covariance for Final Credibility Judgments
Source Sums of Squares
df
F-Statistic
p-value
Initial Credibility Judgment (Covariate) 18.97 1 7.11 .009
Commitment to Disclosure 1.00 1 0.38 .541
Prior Forecaster Accuracy 372.50 1 139.68 <.001
Commitment × Prior Forecaster accuracy 26.50 1 9.94 .002
Panel C: Simple Main Effects Panel D: Simple Main Effects
Commitment to Disclosure
df F-stat p-value Accuracy df F-stat p-value
Effect of more vs. less commitment to disclosure at low accuracy
1
3.18
.039
Effect of high vs. low accuracy when managers are less committed
1
37.18
<.001
Effect of more vs. less commitment to disclosure at high accuracy
1
7.15
<.001
Effect of high vs. low accuracy when managers are more committed
1
113.26
<.001
Panel B presents the results of an analysis of covariance with final credibility judgments as the dependent variable, initial credibility judgments as the covariate, commitment to disclosure and prior forecaster accuracy as the independent variables. All reported p-values are two-tailed. Panels C and D present the simple main effect of each independent variable at levels of the other independent variable. All reported p-values are one-tailed.
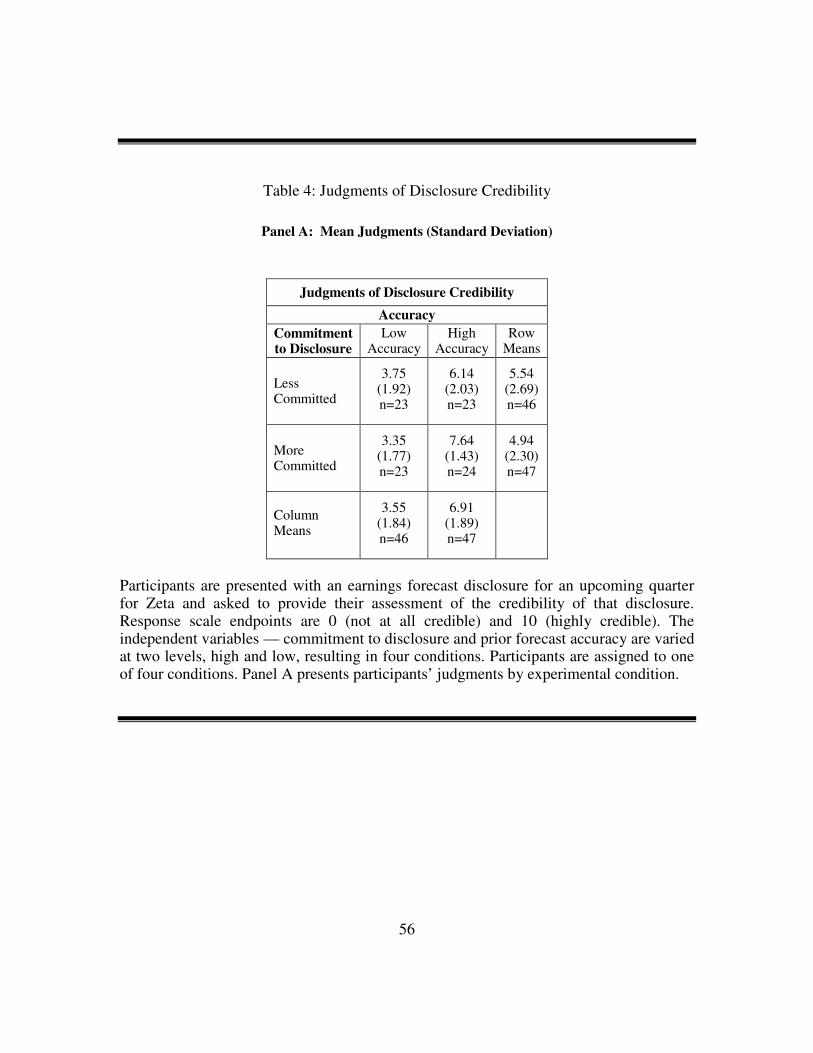
56
Table 4: Judgments of Disclosure Credibility
Panel A: Mean Judgments (Standard Deviation)
Judgments of Disclosure Credibility
Accuracy
Commitment to Disclosure
Low Accuracy
High Accuracy
Row Means
Less Committed
3.75 (1.92) n=23
6.14 (2.03) n=23
5.54 (2.69) n=46
More Committed
3.35 (1.77) n=23
7.64 (1.43) n=24
4.94 (2.30) n=47
Column Means
3.55 (1.84) n=46
6.91 (1.89) n=47
Participants are presented with an earnings forecast disclosure for an upcoming quarter for Zeta and asked to provide their assessment of the credibility of that disclosure. Response scale endpoints are 0 (not at all credible) and 10 (highly credible). The independent variables — commitment to disclosure and prior forecast accuracy are varied at two levels, high and low, resulting in four conditions. Participants are assigned to one of four conditions. Panel A presents participants’ judgments by experimental condition.

57
Table 4: Judgments Disclosure Credibility (Continued)
Pane B: Analysis of Variance for Disclosure Credibility Judgments
Source Sums of Squares
Df
F-Statistic
p-value
Commitment to Disclosure 7.06 1 2.18 .143
Prior Forecaster Accuracy 259.68 1 80.20 <.001
Commitment × Prior Forecaster accuracy 21.03 1 6.50 .013
Panel B presents the results of an ANOVA with participants’ disclosure
credibility judgments as the dependent variable, commitment to disclosure and prior forecaster accuracy as the independent variables. All reported p-values are two-tailed.

58
Table 5: Price-to-Earnings (P/E) Judgments
Panel A: Mean Judgments (Standard Deviation)
Initial Judgments Final Judgments
Accuracy Accuracy
Commitment to Disclosure
Low Accuracy
High Accuracy
Row Means
Commitment to Disclosure
Low Accuracy
High Accuracy
Row Means
Less Committed
19.70 (3.20) n=23
19.02 (2.50) n=21
19.38 (2.87) n=44
Less Committed
16.78 (3.45) n=23
18.79 (3.04) n=21
17.74 (3.38) n=44
More Committed
18.28 (4.09) n=22
18.86 (1.93) n=22
18.57 (3.17) n=44
More Committed
14.91 (4.98) n=22
21.23 (2.43) n=22
18.07 (5.02) n=44
Column Means
19.00 (3.69) n=45
18.94 (2.20) n=43
Column Means
15.87 (4.33) n=45
20.03 (3.00) n=43
Participants provide their initial judgments of Zeta’s P/E based on background information and condensed financial statements for three years. Following their initial judgments, the two independent variables in the study — commitment to disclosure and prior forecast accuracy are varied at two levels: high and low, resulting in four conditions. Participants then provide their revised (final) P/E judgments. Participants are told that other firms in Zeta’s industry trade at multiples of trailing earnings of between 15 and 25 times. Five participants provided P/E ratios that were unusable. Participants who provided P/E ratios that were greater than 35 or lower than 5 were excluded from the analysis. This rule resulted in the exclusion of P/E ratios provided by 5 participants. Therefore, the data reported in this table relate to 88 participants (93 participants less 5 unusable responses).
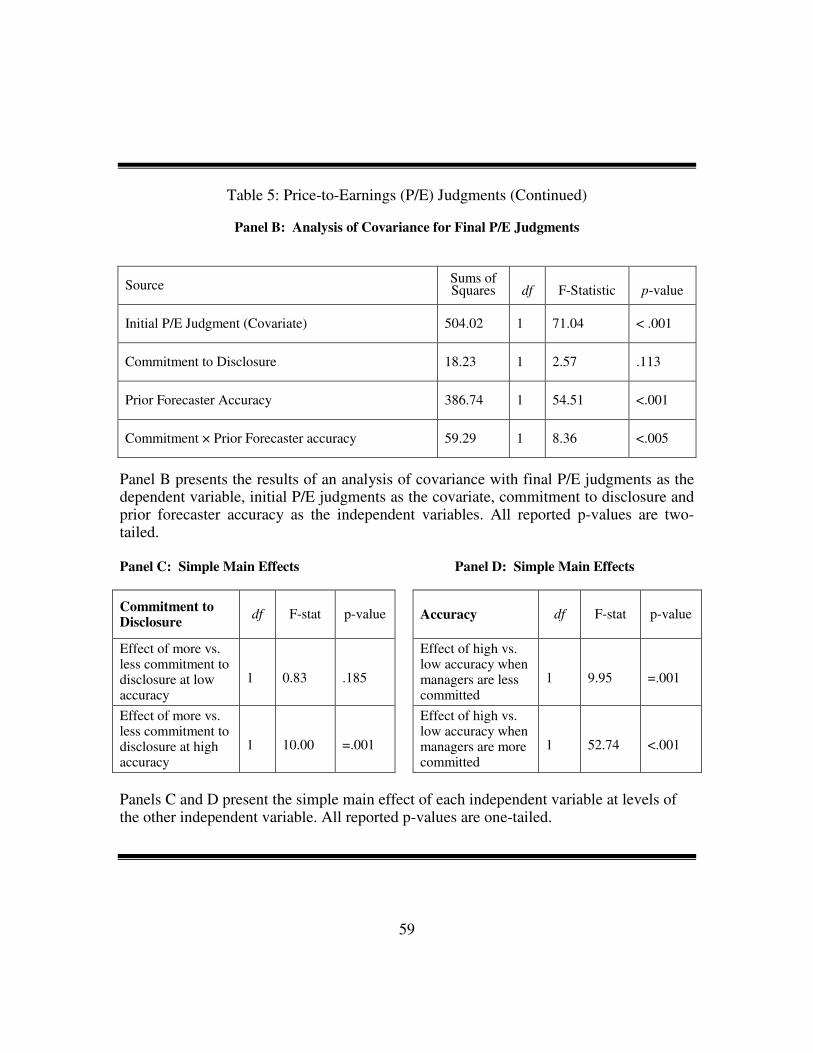
59
Table 5: Price-to-Earnings (P/E) Judgments (Continued)
Panel B: Analysis of Covariance for Final P/E Judgments
Source Sums of Squares
df
F-Statistic
p-value
Initial P/E Judgment (Covariate) 504.02 1 71.04 < .001
Commitment to Disclosure 18.23 1 2.57 .113
Prior Forecaster Accuracy 386.74 1 54.51 <.001
Commitment × Prior Forecaster accuracy 59.29 1 8.36 <.005
Panel B presents the results of an analysis of covariance with final P/E judgments as the dependent variable, initial P/E judgments as the covariate, commitment to disclosure and prior forecaster accuracy as the independent variables. All reported p-values are two-tailed. Panel C: Simple Main Effects Panel D: Simple Main Effects
Commitment to Disclosure
df F-stat p-value Accuracy df F-stat p-value
Effect of more vs. less commitment to disclosure at low accuracy
1
0.83
.185
Effect of high vs. low accuracy when managers are less committed
1
9.95
=.001
Effect of more vs. less commitment to disclosure at high accuracy
1
10.00
=.001
Effect of high vs. low accuracy when managers are more committed
1
52.74
<.001
Panels C and D present the simple main effect of each independent variable at levels of the other independent variable. All reported p-values are one-tailed.
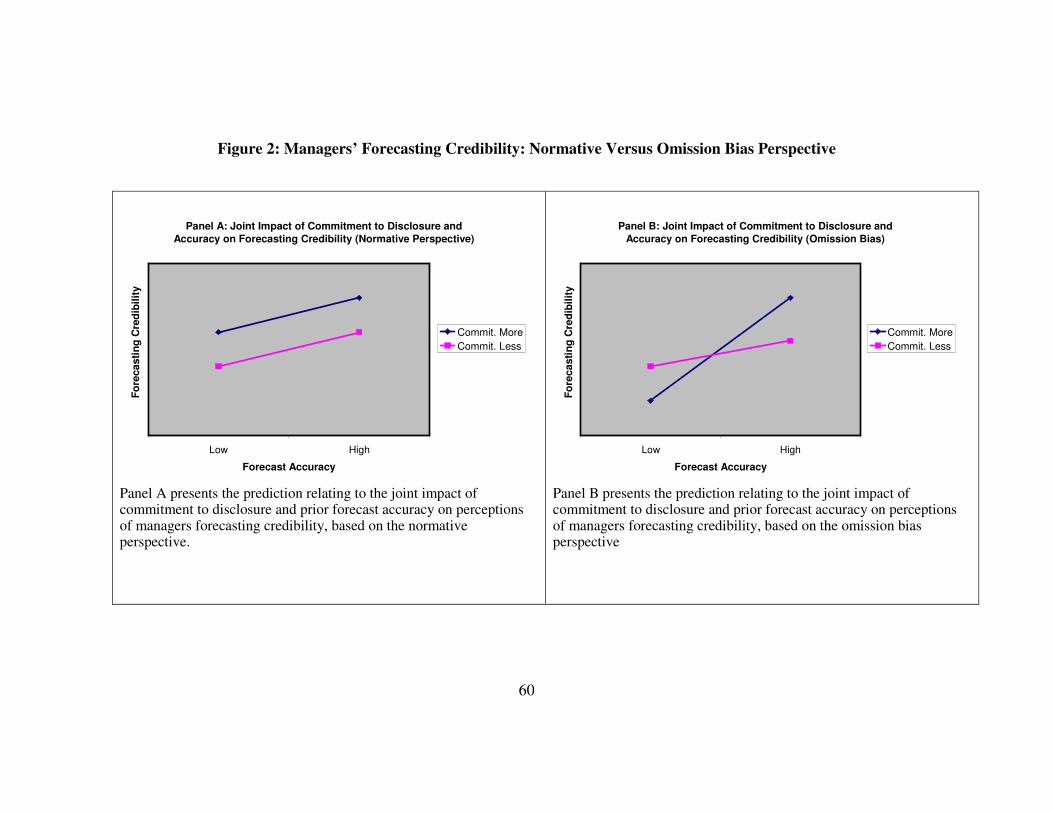
60
Figure 2: Managers’ Forecasting Credibility: Normative Versus Omission Bias Perspective
Panel A: Joint Impact of Commitment to Disclosure and
Accuracy on Forecasting Credibility (Normative Perspective)
HighLow
Forecast Accuracy
Fo
recasti
ng
Cre
dib
ilit
y
Commit. More
Commit. Less
Panel A presents the prediction relating to the joint impact of commitment to disclosure and prior forecast accuracy on perceptions of managers forecasting credibility, based on the normative perspective.
Panel B: Joint Impact of Commitment to Disclosure and
Accuracy on Forecasting Credibility (Omission Bias)
HighLow
Forecast Accuracy
Fo
recasti
ng
Cre
dib
ilit
y
Commit. More
Commit. Less
Panel B presents the prediction relating to the joint impact of commitment to disclosure and prior forecast accuracy on perceptions of managers forecasting credibility, based on the omission bias perspective
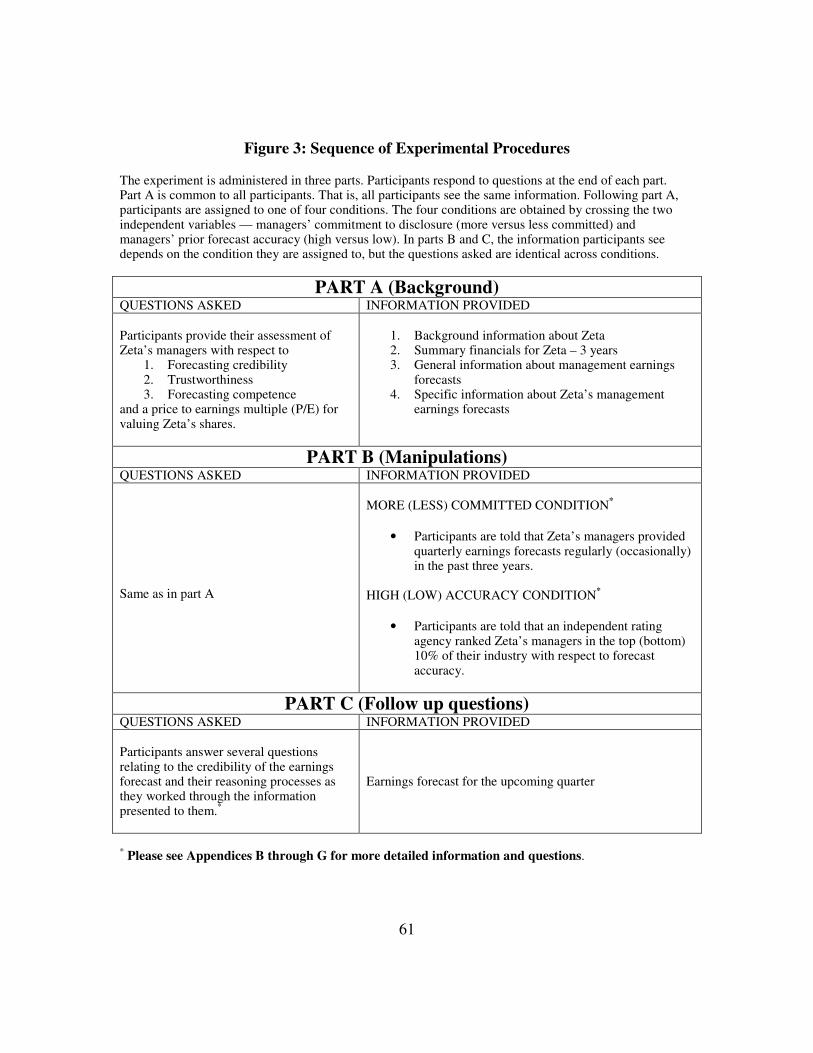
61
Figure 3: Sequence of Experimental Procedures
The experiment is administered in three parts. Participants respond to questions at the end of each part. Part A is common to all participants. That is, all participants see the same information. Following part A, participants are assigned to one of four conditions. The four conditions are obtained by crossing the two independent variables — managers’ commitment to disclosure (more versus less committed) and managers’ prior forecast accuracy (high versus low). In parts B and C, the information participants see depends on the condition they are assigned to, but the questions asked are identical across conditions.
PART A (Background) QUESTIONS ASKED INFORMATION PROVIDED Participants provide their assessment of Zeta’s managers with respect to
1. Forecasting credibility 2. Trustworthiness 3. Forecasting competence
and a price to earnings multiple (P/E) for valuing Zeta’s shares.
1. Background information about Zeta 2. Summary financials for Zeta – 3 years 3. General information about management earnings
forecasts 4. Specific information about Zeta’s management
earnings forecasts
PART B (Manipulations) QUESTIONS ASKED INFORMATION PROVIDED Same as in part A
MORE (LESS) COMMITTED CONDITION*
• Participants are told that Zeta’s managers provided quarterly earnings forecasts regularly (occasionally) in the past three years.
HIGH (LOW) ACCURACY CONDITION*
• Participants are told that an independent rating agency ranked Zeta’s managers in the top (bottom) 10% of their industry with respect to forecast accuracy.
PART C (Follow up questions) QUESTIONS ASKED INFORMATION PROVIDED Participants answer several questions relating to the credibility of the earnings forecast and their reasoning processes as they worked through the information presented to them.*
Earnings forecast for the upcoming quarter
* Please see Appendices B through G for more detailed information and questions.
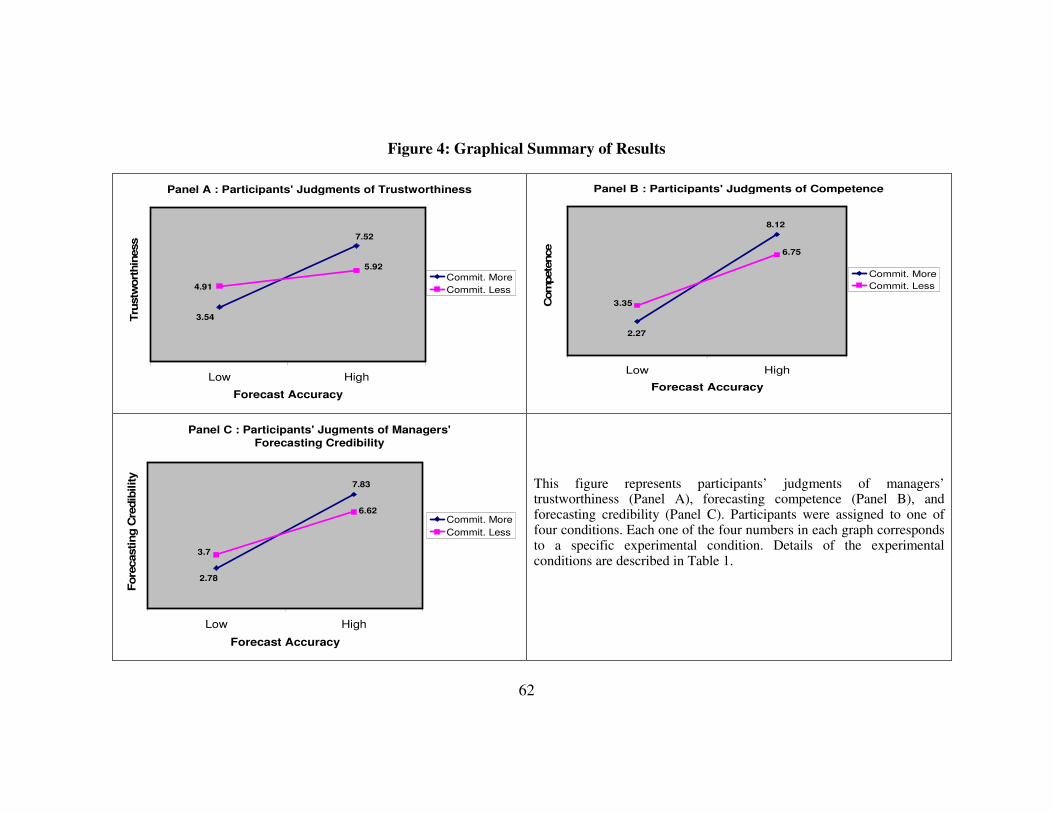
62
Figure 4: Graphical Summary of Results
Panel A : Participants' Judgments of Trustworthiness
3.54
7.52
4.91
5.92
HighLow
Forecast Accuracy
Tru
stw
ort
hin
ess
Commit. More
Commit. Less
Panel B : Participants' Judgments of Competence
2.27
8.12
6.75
3.35
HighLow
Forecast Accuracy
Com
pete
nce
Commit. More
Commit. Less
Panel C : Participants' Jugments of Managers'
Forecasting Credibility
2.78
7.83
6.62
3.7
HighLow
Forecast Accuracy
Fore
casting C
redib
ility
Commit. More
Commit. Less
This figure represents participants’ judgments of managers’ trustworthiness (Panel A), forecasting competence (Panel B), and forecasting credibility (Panel C). Participants were assigned to one of four conditions. Each one of the four numbers in each graph corresponds to a specific experimental condition. Details of the experimental conditions are described in Table 1.
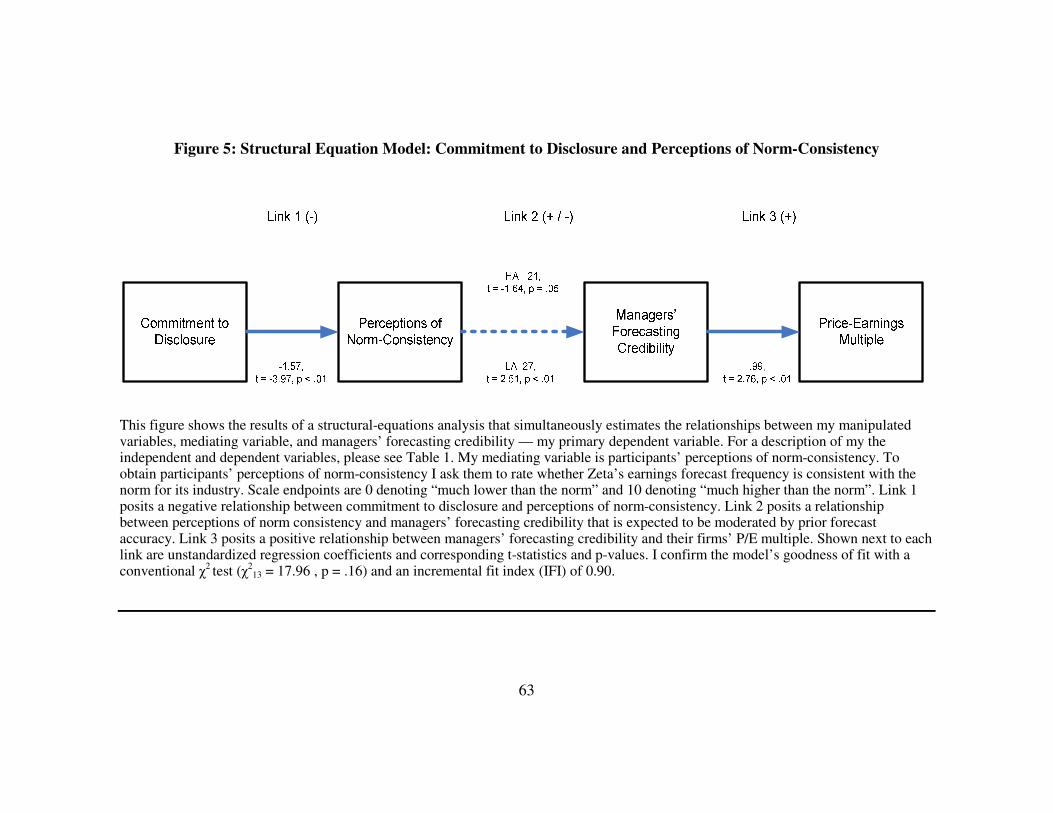
63
Figure 5: Structural Equation Model: Commitment to Disclosure and Perceptions of Norm-Consistency
This figure shows the results of a structural-equations analysis that simultaneously estimates the relationships between my manipulated variables, mediating variable, and managers’ forecasting credibility — my primary dependent variable. For a description of my the independent and dependent variables, please see Table 1. My mediating variable is participants’ perceptions of norm-consistency. To obtain participants’ perceptions of norm-consistency I ask them to rate whether Zeta’s earnings forecast frequency is consistent with the norm for its industry. Scale endpoints are 0 denoting “much lower than the norm” and 10 denoting “much higher than the norm”. Link 1 posits a negative relationship between commitment to disclosure and perceptions of norm-consistency. Link 2 posits a relationship between perceptions of norm consistency and managers’ forecasting credibility that is expected to be moderated by prior forecast accuracy. Link 3 posits a positive relationship between managers’ forecasting credibility and their firms’ P/E multiple. Shown next to each link are unstandardized regression coefficients and corresponding t-statistics and p-values. I confirm the model’s goodness of fit with a conventional χ2 test (χ2
13 = 17.96 , p = .16) and an incremental fit index (IFI) of 0.90.
64
Chapter 4: Conclusion
This paper experimentally examines the joint impact of commitment to disclosure
and prior forecast accuracy on managers’ forecasting credibility. I find that commitment
to disclosure amplifies the impact of accuracy on investors’ judgments of managers’
credibility. That is, more committed forecasters are judged to be more credible relative to
less committed forecasters, but only when prior forecast accuracy is high. In contrast,
when prior forecast accuracy is low, more committed forecasters are judged to be less
credible relative to their less committed peers. Although managers have expressed
concerns about being viewed as less committed disclosers, the voluntary disclosure
literature has not examined the credibility consequences of commitment to disclosure,
either in isolation or jointly with other disclosure antecedents. Results of this study
contribute to the voluntary disclosure literature by increasing our understanding of how
disclosure antecedents interact to influence managers’ forecasting credibility.
The study tests competing hypotheses about the joint impact of commitment to
disclosure and prior forecast accuracy on managers’ credibility based on economic theory
as well as psychology theory. The findings in the study support the predictions based on
omission bias over those based on economic theory. One of the propositions in the
omission bias literature is that because actions are more likely to be seen as decisions,
people make stronger judgments based on action rather than inaction (Spranca and Baron
1991). Consistent with omission bias, managers who are more committed to disclosure
are indeed seen as more active relative to less predictable forecasters. Participants,
however, did not view that higher levels of action also correspond with higher levels of
decision making. In fact, more committed (active) forecasters are seen as less engaged in
decision-making, whereas less committed (active) forecasters are seen as more engaged

65
in decision-making. In a management earnings forecast setting, managers who are more
committed to disclosure (and therefore more active) may be viewed as routinely
providing such forecasts. Therefore, acts of commission may be viewed as involving less
deliberate decisions. In contrast, managers who are less committed to disclosure may be
viewed as making a deliberate choice relating to the provision (or non-provision) of
forecasts. Therefore, acts of omission may be viewed as more deliberate decisions.
Additional tests that examine how participants react to commitment to disclosure
provide insight into an alternative mechanism by which commitment to disclosure
influences credibility. Because management earnings forecasts are voluntary disclosures,
managers who are more committed are viewed as acting above the norm, whereas
managers who are less committed are viewed as acting in line with the norm. Participants
appear to be distinguishing between more and less committed forecasters not along the
lines of whether they represent active decision-making, but more along the lines of
whether commitment represents norm-consistent versus norm-inconsistent behavior.
Norm-inconsistent behaviors elicit much stronger reactions relative to norm-consistent
behaviors for both positive and negative outcomes, which could explain the pattern of
interaction observed between commitment to disclosure and accuracy.
The results of the study also provide one explanation for the apparent disconnect
between what managers say and what they do with respect to commitment to disclosure.
Although managers have a stated preference for being viewed as committed disclosers,
this preference may not translate into actual disclosures because study participants in the
role of investors appear to react strongly to behavior that is above and beyond the norm
(high commitment to disclosure) compared to behavior that is in line with the norm (low
commitment to disclosure). Participants’ P/E judgments suggest that commitment to
disclosure could have adverse valuation consequences unless managers are also highly
66
accurate. Therefore, managers who are tentative about accuracy may prefer to adhere to
the norm rather than risk getting penalized if their forecast turns out to be inaccurate ex
post.
The findings from this study should be interpreted subject to some limitations.
First, participants are told that managers are either in the top 10 percent or the bottom 10
percent of their peer group with respect to accuracy. In real-world investment settings,
information about managers’ forecast accuracy (or commitment to disclosure) may not be
so readily available. Second, for experimental considerations, I hold constant the specific
content of the earnings forecast. Prior research, however suggests that managers widely
vary forecast content on an annual or even quarterly basis (Hirst et al. 2007). To the
extent that forecast content overrides considerations of accuracy or predictability, results
of the study must be interpreted with caution. Finally, participants are provided only a
limited set of information based on which they make their judgments. Whether additional
information interacts systematically with the variables considered in this study is an open
question.
Opportunities for future research come from two directions. First, this study
examines commitment to disclosure in terms of disclosure versus non-disclosure of
forecasts and abstracts away from the specific content of the disclosure. How investors
would react if managers were unpredictable about the content of their disclosures (rather
than the disclosure itself) remains an open question for future research. Second, results of
this study suggest that investors’ perceptions of trustworthiness and competence appear
to be closely aligned across experimental conditions. Future research that investigates
situations where trustworthiness judgments and competence judgments diverge (i.e.,
move in opposite directions) will help us better understand how participants combine
those divergent factors in assessing managers’ credibility.

67
APPENDICES

68
APPENDIX A: COMMITMENT TO DISCLOSURE: ILLUSTRATION
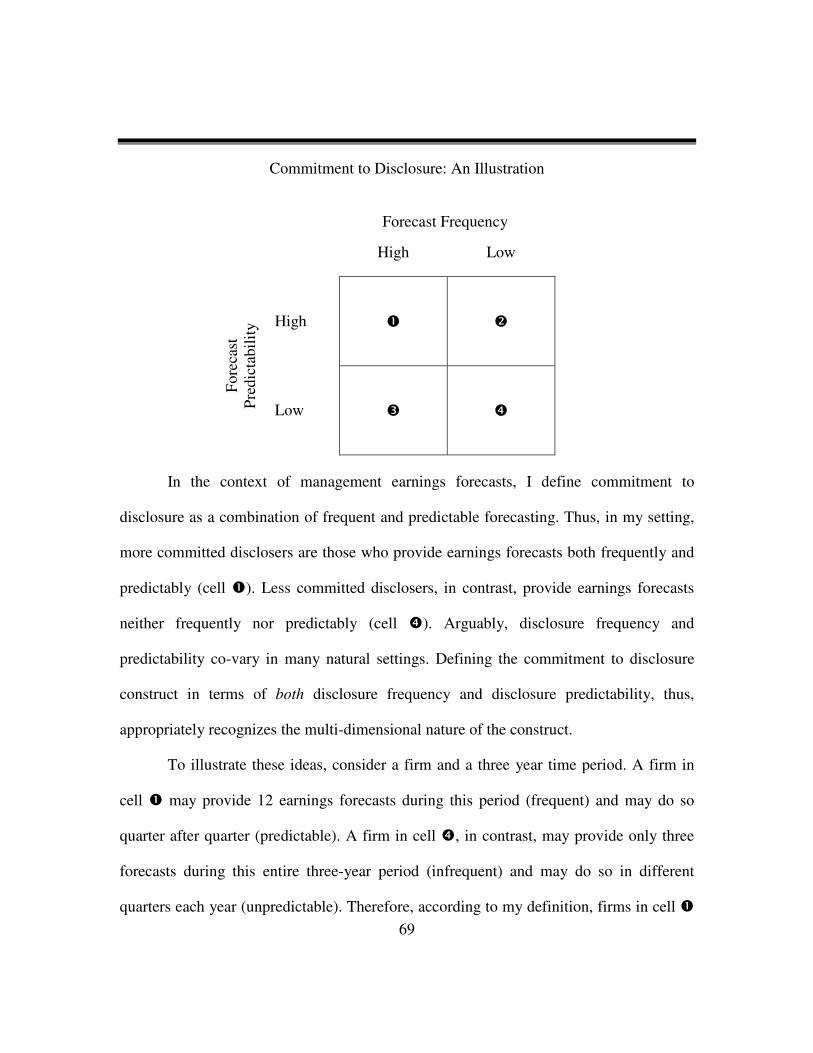
69
Commitment to Disclosure: An Illustration
Forecast Frequency
High Low
High
�
�
Fore
cast
P
redic
tabil
ity
Low
�
�
In the context of management earnings forecasts, I define commitment to
disclosure as a combination of frequent and predictable forecasting. Thus, in my setting,
more committed disclosers are those who provide earnings forecasts both frequently and
predictably (cell �). Less committed disclosers, in contrast, provide earnings forecasts
neither frequently nor predictably (cell �). Arguably, disclosure frequency and
predictability co-vary in many natural settings. Defining the commitment to disclosure
construct in terms of both disclosure frequency and disclosure predictability, thus,
appropriately recognizes the multi-dimensional nature of the construct.
To illustrate these ideas, consider a firm and a three year time period. A firm in
cell � may provide 12 earnings forecasts during this period (frequent) and may do so
quarter after quarter (predictable). A firm in cell �, in contrast, may provide only three
forecasts during this entire three-year period (infrequent) and may do so in different
quarters each year (unpredictable). Therefore, according to my definition, firms in cell �
70
represent firms that are unambiguously more committed to disclosure whereas firms in
cell � are unambiguously less committed to disclosure. Because the primary focus of this
study is on understanding the consequences of commitment to disclosure, I focus on the
cases where commitment to disclosure (or lack thereof) is clear.
I choose not to examine firms in cells � and � in this study for two reasons.
First, manipulating predictability and frequency simultaneously, but in opposite
directions weakens my manipulation of commitment to disclosure. By definition, firms
that are high in forecast predictability, but low in forecast frequency (cell �) will be
viewed as less committed to disclosure. Similarly, firms that are high in forecast
frequency, but low in forecast predictability (cell �) will also be viewed as less
committed to disclosure. Thus, in both cases, I weaken the manipulation of commitment
to disclosure. Second, if I choose to manipulate either frequency or predictability (and am
silent about the other), again, I will potentially reduce the strength of the commitment to
disclosure manipulation. Information about disclosure frequency or predictability (with
no details about the other) presents an incomplete picture based on which making
inferences about commitment to disclosure will be difficult. Therefore, simultaneously
varying both forecast frequency and forecast predictability in the same direction is critical
to ensure the most powerful manipulation of the commitment to disclosure construct.

71
APPENDIX B: EXPERIMENTAL MATERIALS

72
INSTRUCTIONS Thank you for participating in this study. The purpose of this study is to investigate how investors make judgments based on financial and non-financial information. There are no right or wrong answers to the questions you will be asked in this study. You should be able to complete this study in approximately 30 minutes. For purposes of this study, assume that you are a potential investor evaluating the common stock of a company called Zeta. This study consists of three parts. Part A contains selected financial information and background information about Zeta. Parts B and C contain additional information about Zeta. After each part, you will be asked to provide several judgments about Zeta and its management. The case information you will receive is not intended to include all the information that would be available if you were evaluating the common stock of Zeta. However, for purposes of this study, base your judgments on the information provided. Should you have any questions during the study, please do not hesitate to ask. However, please do not discuss this study with other University of Texas students during the next two weeks. Discussing the study with others could invalidate the study. Your input is very important to this study. Thank you again for your participation.
Shankar Venkataraman PhD Candidate, Department of Accounting McCombs School of Business UNIVERSITY OF TEXAS AT AUSTIN
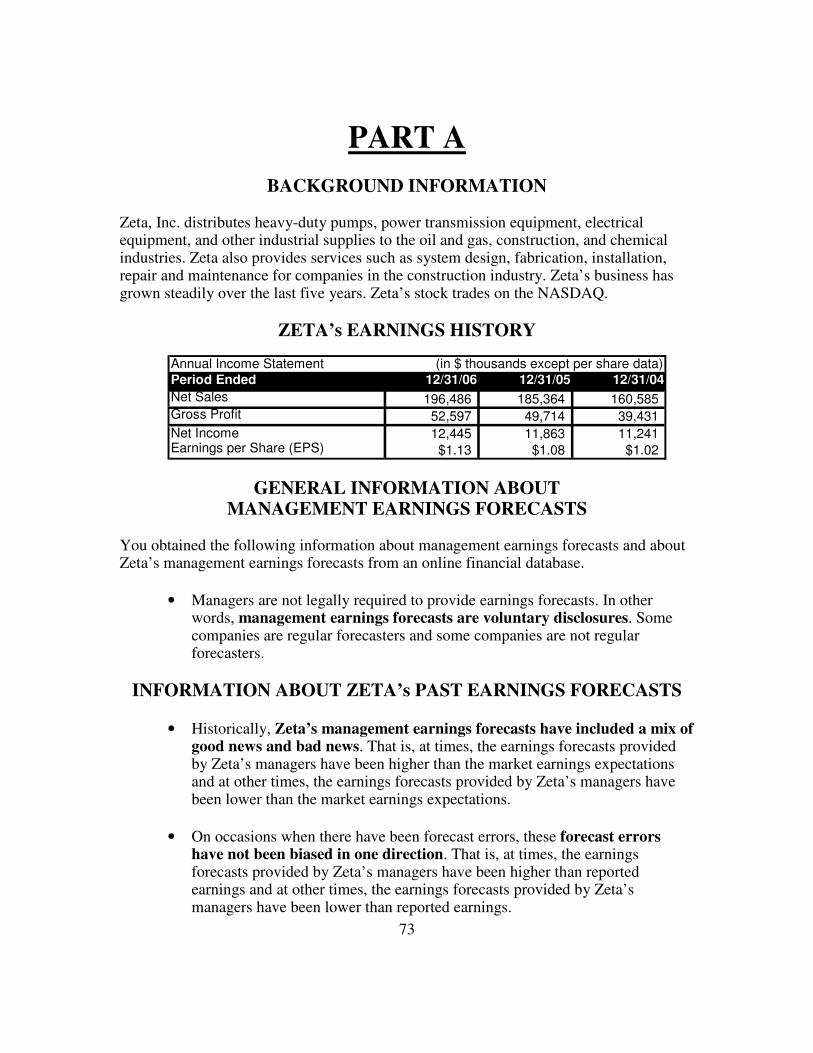
73
PART A
BACKGROUND INFORMATION Zeta, Inc. distributes heavy-duty pumps, power transmission equipment, electrical equipment, and other industrial supplies to the oil and gas, construction, and chemical industries. Zeta also provides services such as system design, fabrication, installation, repair and maintenance for companies in the construction industry. Zeta’s business has grown steadily over the last five years. Zeta’s stock trades on the NASDAQ.
ZETA’s EARNINGS HISTORY
Annual Income StatementPeriod Ended 12/31/06 12/31/05 12/31/04
Net Sales 196,486 185,364 160,585 Gross Profit 52,597 49,714 39,431
Net Income 12,445 11,863 11,241 Earnings per Share (EPS) $1.13 $1.08 $1.02
(in $ thousands except per share data)
GENERAL INFORMATION ABOUT MANAGEMENT EARNINGS FORECASTS
You obtained the following information about management earnings forecasts and about Zeta’s management earnings forecasts from an online financial database.
• Managers are not legally required to provide earnings forecasts. In other words, management earnings forecasts are voluntary disclosures. Some companies are regular forecasters and some companies are not regular forecasters.
INFORMATION ABOUT ZETA’s PAST EARNINGS FORECASTS
• Historically, Zeta’s management earnings forecasts have included a mix of good news and bad news. That is, at times, the earnings forecasts provided by Zeta’s managers have been higher than the market earnings expectations and at other times, the earnings forecasts provided by Zeta’s managers have been lower than the market earnings expectations.
• On occasions when there have been forecast errors, these forecast errors have not been biased in one direction. That is, at times, the earnings forecasts provided by Zeta’s managers have been higher than reported earnings and at other times, the earnings forecasts provided by Zeta’s managers have been lower than reported earnings.

74
APPENDIX C: PRE-MANIPULATION QUESTIONS
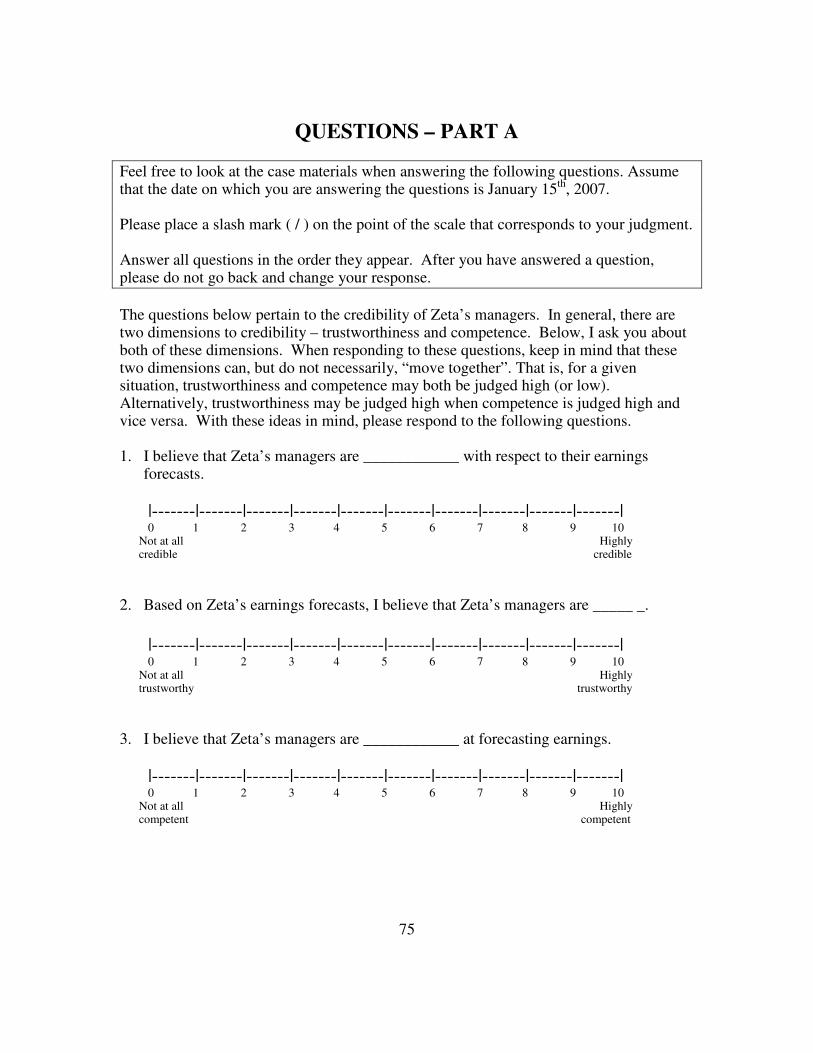
75
QUESTIONS – PART A
Feel free to look at the case materials when answering the following questions. Assume that the date on which you are answering the questions is January 15th, 2007. Please place a slash mark ( / ) on the point of the scale that corresponds to your judgment. Answer all questions in the order they appear. After you have answered a question, please do not go back and change your response.
The questions below pertain to the credibility of Zeta’s managers. In general, there are two dimensions to credibility – trustworthiness and competence. Below, I ask you about both of these dimensions. When responding to these questions, keep in mind that these two dimensions can, but do not necessarily, “move together”. That is, for a given situation, trustworthiness and competence may both be judged high (or low). Alternatively, trustworthiness may be judged high when competence is judged high and vice versa. With these ideas in mind, please respond to the following questions. 1. I believe that Zeta’s managers are ____________ with respect to their earnings
forecasts.
|-------|-------|-------|-------|-------|-------|-------|-------|-------|-------| 0 1 2 3 4 5 6 7 8 9 10 Not at all Highly credible credible
2. Based on Zeta’s earnings forecasts, I believe that Zeta’s managers are _____ _.
|-------|-------|-------|-------|-------|-------|-------|-------|-------|-------| 0 1 2 3 4 5 6 7 8 9 10 Not at all Highly trustworthy trustworthy
3. I believe that Zeta’s managers are ____________ at forecasting earnings.
|-------|-------|-------|-------|-------|-------|-------|-------|-------|-------| 0 1 2 3 4 5 6 7 8 9 10 Not at all Highly competent competent
76
Judgments about Zeta’s Stock 4. You decide to determine a fair price for Zeta’s shares. To do this, assume that you
think about the price – earnings (P/E) multiple that should be applied to Zeta’s earnings for 2006. What would that number be?
Assume that other firms in Zeta’s industry trade at multiples of trailing (i.e., prior year) earnings of between 15 and 25 times earnings.
NOTE: A low multiple means that you would not be willing to pay much for Zeta, while a high multiple means that you would be willing to pay more for Zeta.
P/E = ______________________ times Fill in a P/E Multiple (number) here
PLEASE DO NOT TURN AHEAD TO PART B OF THIS STUDY UNTIL YOU COMPLETE THIS SECTION.
77
APPENDIX D: MANIPULATIONS

78
High Commitment to Disclosure, High Accuracy Condition
PART B
ADDITIONAL INFORMATION ABOUT ZETA
You search for additional information about Zeta and find the following:
• Zeta’s managers have provided quarterly earnings forecasts regularly in the past three years. Zeta provided twelve earnings forecasts in the years 2004, 2005, and 2006 (one in each quarter).
• An independent rating agency ranked Zeta’s managers in the top 10% of their industry with respect to forecast accuracy. That is, in general, Zeta’s
earnings forecasts are highly accurate.
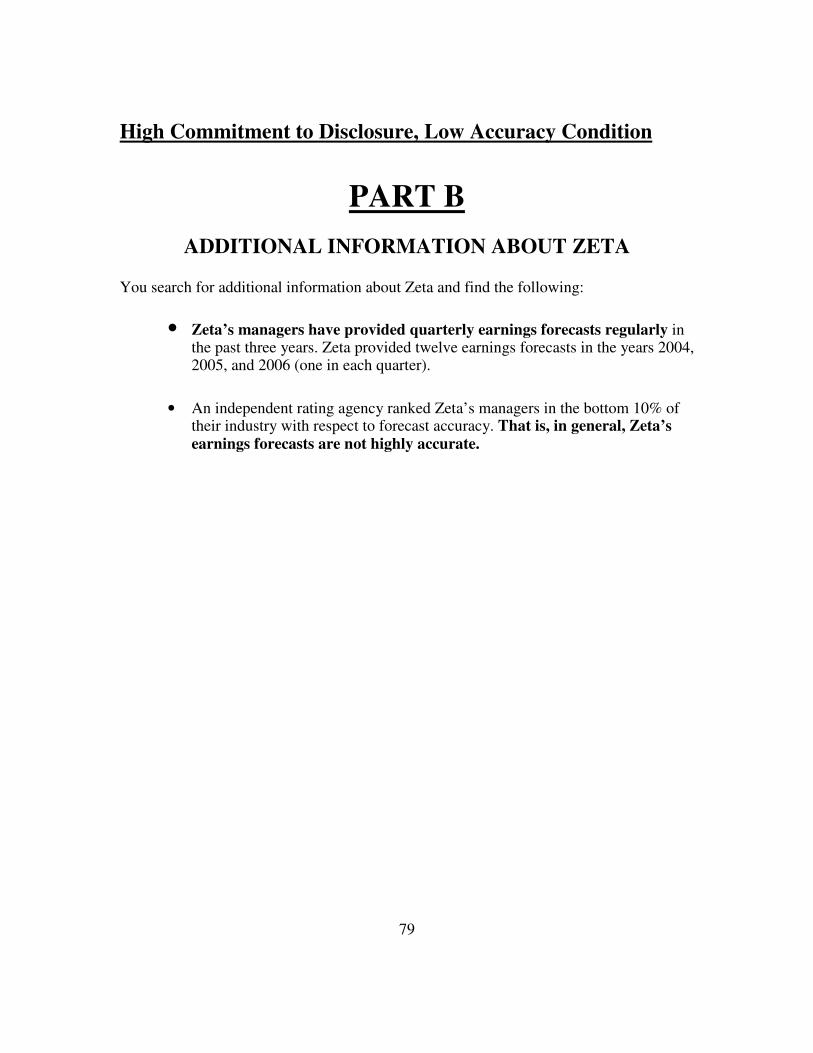
79
High Commitment to Disclosure, Low Accuracy Condition
PART B
ADDITIONAL INFORMATION ABOUT ZETA
You search for additional information about Zeta and find the following:
• Zeta’s managers have provided quarterly earnings forecasts regularly in the past three years. Zeta provided twelve earnings forecasts in the years 2004, 2005, and 2006 (one in each quarter).
• An independent rating agency ranked Zeta’s managers in the bottom 10% of
their industry with respect to forecast accuracy. That is, in general, Zeta’s
earnings forecasts are not highly accurate.
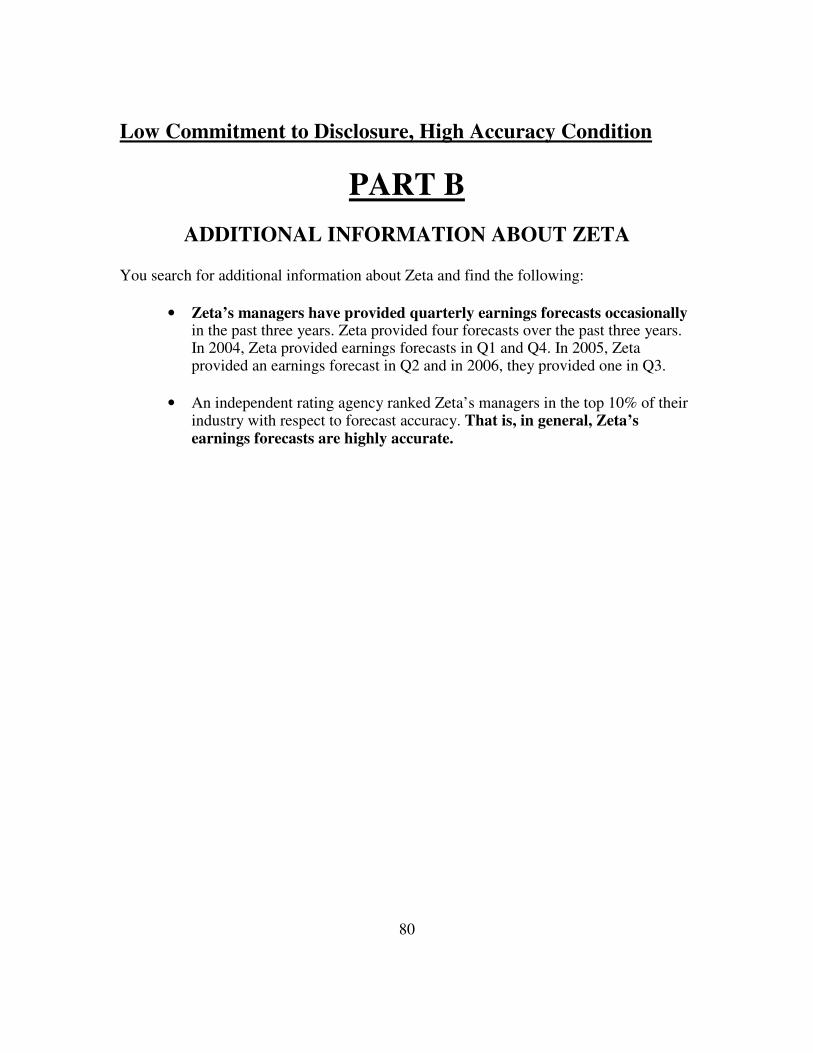
80
Low Commitment to Disclosure, High Accuracy Condition
PART B
ADDITIONAL INFORMATION ABOUT ZETA
You search for additional information about Zeta and find the following:
• Zeta’s managers have provided quarterly earnings forecasts occasionally in the past three years. Zeta provided four forecasts over the past three years. In 2004, Zeta provided earnings forecasts in Q1 and Q4. In 2005, Zeta provided an earnings forecast in Q2 and in 2006, they provided one in Q3.
• An independent rating agency ranked Zeta’s managers in the top 10% of their industry with respect to forecast accuracy. That is, in general, Zeta’s earnings forecasts are highly accurate.
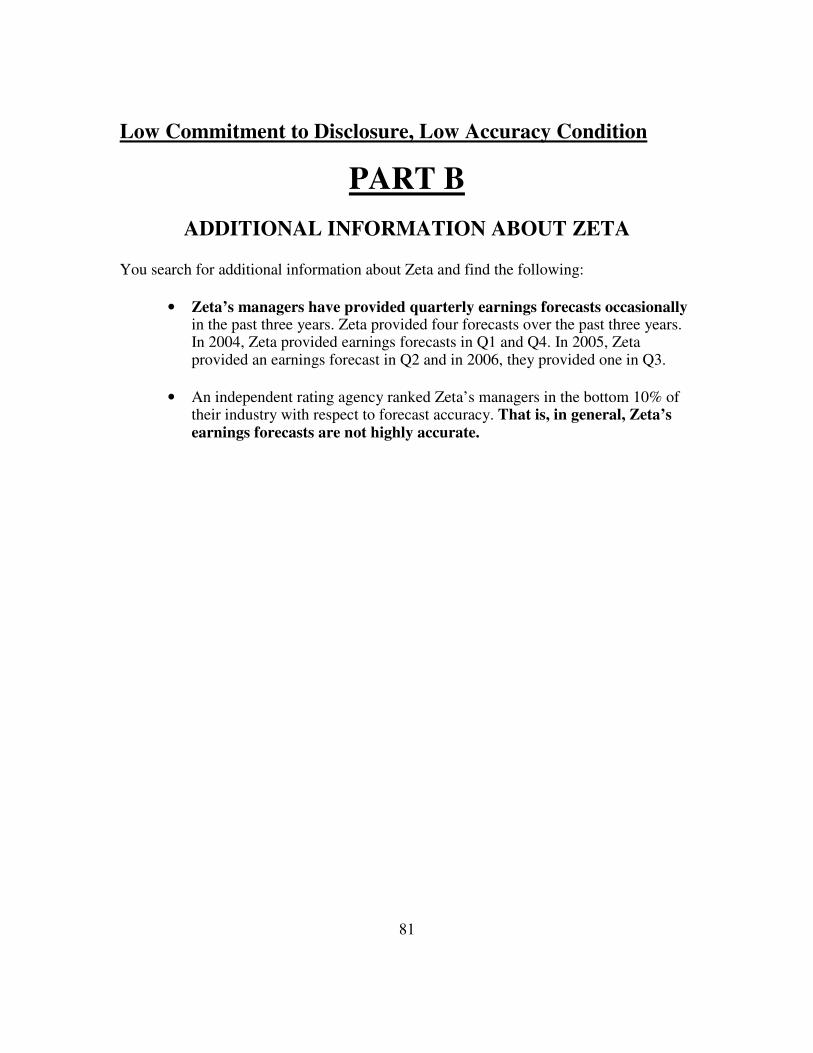
81
Low Commitment to Disclosure, Low Accuracy Condition
PART B
ADDITIONAL INFORMATION ABOUT ZETA
You search for additional information about Zeta and find the following:
• Zeta’s managers have provided quarterly earnings forecasts occasionally in the past three years. Zeta provided four forecasts over the past three years. In 2004, Zeta provided earnings forecasts in Q1 and Q4. In 2005, Zeta provided an earnings forecast in Q2 and in 2006, they provided one in Q3.
• An independent rating agency ranked Zeta’s managers in the bottom 10% of their industry with respect to forecast accuracy. That is, in general, Zeta’s earnings forecasts are not highly accurate.
82
APPENDIX E: POST-MANIPULATION QUESTIONS
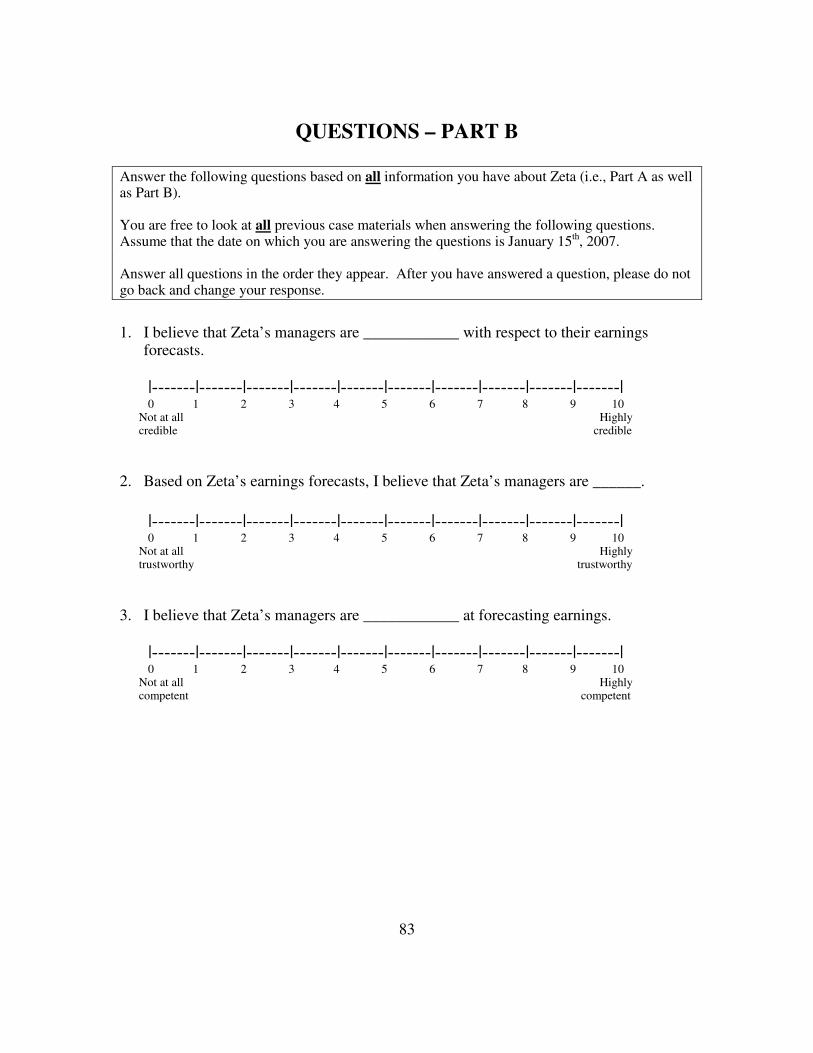
83
QUESTIONS – PART B
Answer the following questions based on all information you have about Zeta (i.e., Part A as well as Part B). You are free to look at all previous case materials when answering the following questions. Assume that the date on which you are answering the questions is January 15th, 2007. Answer all questions in the order they appear. After you have answered a question, please do not go back and change your response.
1. I believe that Zeta’s managers are ____________ with respect to their earnings
forecasts.
|-------|-------|-------|-------|-------|-------|-------|-------|-------|-------| 0 1 2 3 4 5 6 7 8 9 10 Not at all Highly credible credible
2. Based on Zeta’s earnings forecasts, I believe that Zeta’s managers are ______.
|-------|-------|-------|-------|-------|-------|-------|-------|-------|-------| 0 1 2 3 4 5 6 7 8 9 10 Not at all Highly trustworthy trustworthy
3. I believe that Zeta’s managers are ____________ at forecasting earnings.
|-------|-------|-------|-------|-------|-------|-------|-------|-------|-------| 0 1 2 3 4 5 6 7 8 9 10 Not at all Highly competent competent

84
Judgments about Zeta’s Stock
4. You decide to re-estimate the price – earnings (P/E) multiple that should be applied to Zeta’s earnings for 2006 based on all information you now have. What would that number be?
Assume that other firms in Zeta’s industry trade at multiples of trailing (i.e., prior year) earnings of between 15 and 25 times earnings. NOTE: A low multiple means that you would not be willing to pay much for Zeta, while a high multiple means that you would be willing to pay more for Zeta.
P/E = ______________________ times
Fill in a P/E Multiple (number) here
PLEASE DO NOT TURN AHEAD TO PART C OF THIS STUDY UNTIL YOU COMPLETE THIS SECTION.

85
APPENDIX F: CURRENT EARNINGS FORECAST
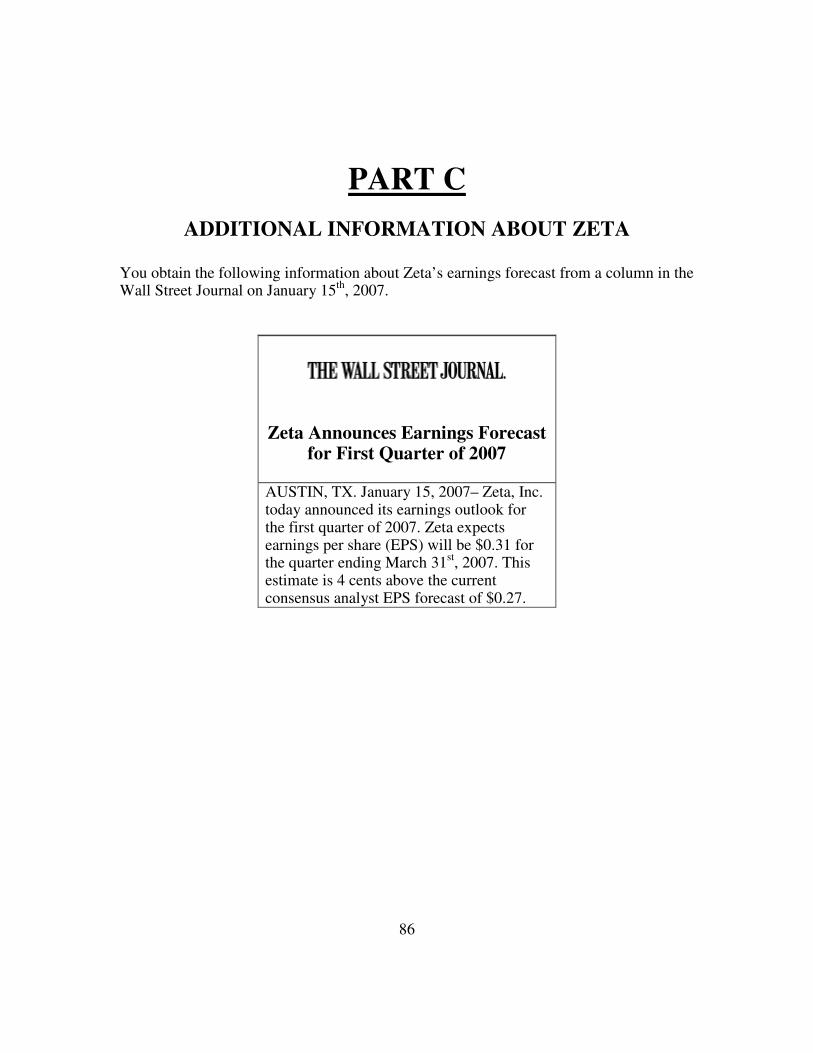
86
PART C
ADDITIONAL INFORMATION ABOUT ZETA
You obtain the following information about Zeta’s earnings forecast from a column in the Wall Street Journal on January 15th, 2007.
Zeta Announces Earnings Forecast for First Quarter of 2007
AUSTIN, TX. January 15, 2007– Zeta, Inc. today announced its earnings outlook for the first quarter of 2007. Zeta expects earnings per share (EPS) will be $0.31 for the quarter ending March 31st, 2007. This estimate is 4 cents above the current consensus analyst EPS forecast of $0.27.

87
APPENDIX G: PROCESS-RELATED QUESTIONS
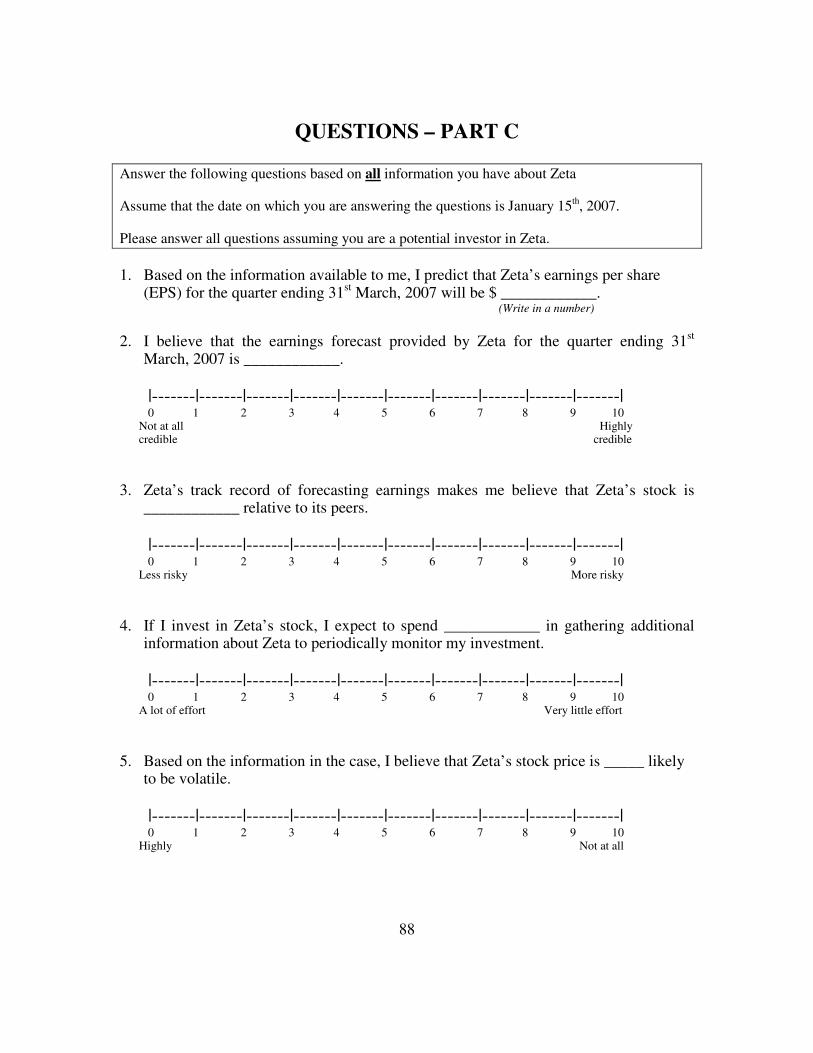
88
QUESTIONS – PART C
Answer the following questions based on all information you have about Zeta Assume that the date on which you are answering the questions is January 15th, 2007. Please answer all questions assuming you are a potential investor in Zeta.
1. Based on the information available to me, I predict that Zeta’s earnings per share
(EPS) for the quarter ending 31st March, 2007 will be $ ____________. (Write in a number)
2. I believe that the earnings forecast provided by Zeta for the quarter ending 31st
March, 2007 is ____________.
|-------|-------|-------|-------|-------|-------|-------|-------|-------|-------| 0 1 2 3 4 5 6 7 8 9 10 Not at all Highly credible credible
3. Zeta’s track record of forecasting earnings makes me believe that Zeta’s stock is
____________ relative to its peers.
|-------|-------|-------|-------|-------|-------|-------|-------|-------|-------| 0 1 2 3 4 5 6 7 8 9 10 Less risky More risky
4. If I invest in Zeta’s stock, I expect to spend ____________ in gathering additional information about Zeta to periodically monitor my investment.
|-------|-------|-------|-------|-------|-------|-------|-------|-------|-------| 0 1 2 3 4 5 6 7 8 9 10 A lot of effort Very little effort
5. Based on the information in the case, I believe that Zeta’s stock price is _____ likely to be volatile.
|-------|-------|-------|-------|-------|-------|-------|-------|-------|-------| 0 1 2 3 4 5 6 7 8 9 10 Highly Not at all
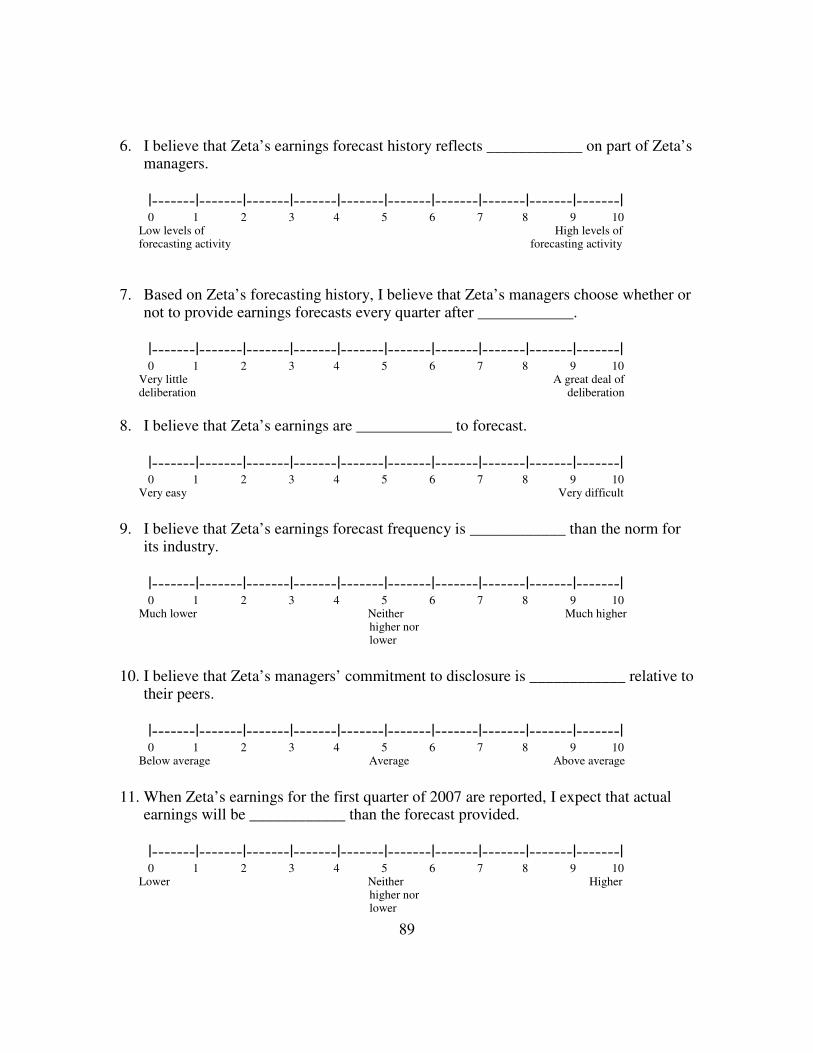
89
6. I believe that Zeta’s earnings forecast history reflects ____________ on part of Zeta’s
managers.
|-------|-------|-------|-------|-------|-------|-------|-------|-------|-------| 0 1 2 3 4 5 6 7 8 9 10 Low levels of High levels of forecasting activity forecasting activity
7. Based on Zeta’s forecasting history, I believe that Zeta’s managers choose whether or
not to provide earnings forecasts every quarter after ____________.
|-------|-------|-------|-------|-------|-------|-------|-------|-------|-------| 0 1 2 3 4 5 6 7 8 9 10 Very little A great deal of deliberation deliberation
8. I believe that Zeta’s earnings are ____________ to forecast.
|-------|-------|-------|-------|-------|-------|-------|-------|-------|-------| 0 1 2 3 4 5 6 7 8 9 10 Very easy Very difficult
9. I believe that Zeta’s earnings forecast frequency is ____________ than the norm for
its industry.
|-------|-------|-------|-------|-------|-------|-------|-------|-------|-------| 0 1 2 3 4 5 6 7 8 9 10 Much lower Neither Much higher higher nor lower
10. I believe that Zeta’s managers’ commitment to disclosure is ____________ relative to
their peers.
|-------|-------|-------|-------|-------|-------|-------|-------|-------|-------| 0 1 2 3 4 5 6 7 8 9 10 Below average Average Above average
11. When Zeta’s earnings for the first quarter of 2007 are reported, I expect that actual
earnings will be ____________ than the forecast provided.
|-------|-------|-------|-------|-------|-------|-------|-------|-------|-------| 0 1 2 3 4 5 6 7 8 9 10 Lower Neither Higher higher nor lower
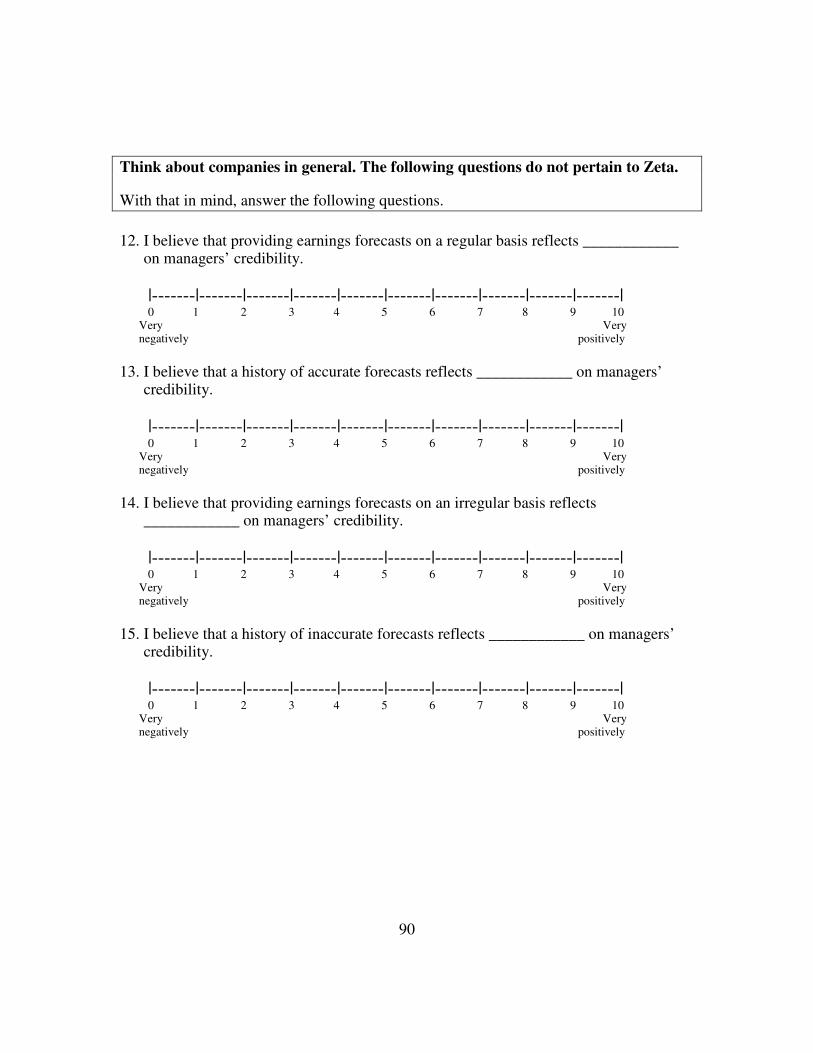
90
Think about companies in general. The following questions do not pertain to Zeta.
With that in mind, answer the following questions.
12. I believe that providing earnings forecasts on a regular basis reflects ____________
on managers’ credibility.
|-------|-------|-------|-------|-------|-------|-------|-------|-------|-------| 0 1 2 3 4 5 6 7 8 9 10 Very Very negatively positively
13. I believe that a history of accurate forecasts reflects ____________ on managers’
credibility.
|-------|-------|-------|-------|-------|-------|-------|-------|-------|-------| 0 1 2 3 4 5 6 7 8 9 10 Very Very negatively positively
14. I believe that providing earnings forecasts on an irregular basis reflects
____________ on managers’ credibility.
|-------|-------|-------|-------|-------|-------|-------|-------|-------|-------| 0 1 2 3 4 5 6 7 8 9 10 Very Very negatively positively
15. I believe that a history of inaccurate forecasts reflects ____________ on managers’
credibility.
|-------|-------|-------|-------|-------|-------|-------|-------|-------|-------| 0 1 2 3 4 5 6 7 8 9 10 Very Very negatively positively
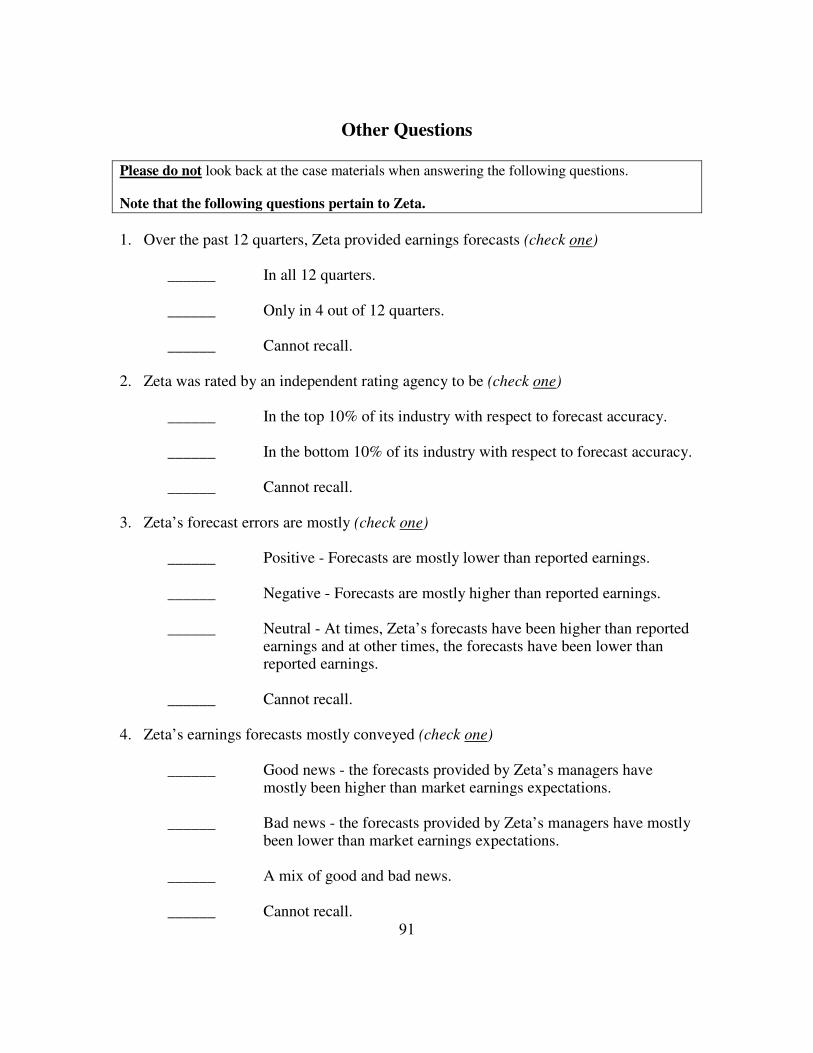
91
Other Questions
Please do not look back at the case materials when answering the following questions. Note that the following questions pertain to Zeta.
1. Over the past 12 quarters, Zeta provided earnings forecasts (check one)
______ In all 12 quarters. ______ Only in 4 out of 12 quarters. ______ Cannot recall.
2. Zeta was rated by an independent rating agency to be (check one)
______ In the top 10% of its industry with respect to forecast accuracy. ______ In the bottom 10% of its industry with respect to forecast accuracy. ______ Cannot recall.
3. Zeta’s forecast errors are mostly (check one)
______ Positive - Forecasts are mostly lower than reported earnings.
______ Negative - Forecasts are mostly higher than reported earnings.
______ Neutral - At times, Zeta’s forecasts have been higher than reported earnings and at other times, the forecasts have been lower than reported earnings. ______ Cannot recall.
4. Zeta’s earnings forecasts mostly conveyed (check one)
______ Good news - the forecasts provided by Zeta’s managers have mostly been higher than market earnings expectations.
______ Bad news - the forecasts provided by Zeta’s managers have mostly
been lower than market earnings expectations. ______ A mix of good and bad news. ______ Cannot recall.

92
IN ORDER TO UNDERSTAND WHY YOUR RESPONSES MIGHT DIFFER FROM THOSE OF
YOUR COLLEAGUES, PLEASE ANSWER THE FOLLOWING QUESTIONS.
1. Have you ever made investments in the common stock of a company? YES NO
If yes, approximately how many times? ___________ times
2. Do you plan to invest in the common stock of a company at some time in the future?
YES NO
3. Have you ever made investments in a common stock mutual fund? YES NO
4. How many undergraduate and graduate finance and accounting courses have you
taken, including those that you are taking this semester?
Finance ____________ Accounting ____________
5. How many years of full-time work experience do you have? ____________ years
6. Have you ever worked in the following capacities?
If yes, fill in the number of years. If no, leave blank.
Corporate finance ______ years
Corporate Accounting ______ years
Engineering, Operations, or other technical position ______ years
Public Accounting ______ years
Management ______ years
Other ____________________________________________ ______ years
THANK YOU FOR PARTICIPATING IN THIS STUDY
93
References
A.I.M.R. 2000. Corporate Disclosure Survey.
A.I.M.R. 2003. Member Survey of Global Corporate Financial Reporting Quality and
Corporate Communications and Disclosure Practices.
Ajinkya, B., S. Bhojraj, and P. Sengupta. 2005. The Association between Outside
Directors, Institutional Investors and the Properties of Management Earnings
Forecasts. Journal of Accounting Research 43 (3): 343-376.
Anilowski, C., M. Feng, and D. Skinner. 2007. Does Earnings Guidance Affect Market
Returns? The Nature and Information Content of Aggregate Earnings Guidance.
Journal of Accounting and Economics 44: 36-63.
Arbuckle, J.L. and W. Wothke. 1995. Amos 4.0 User’s Guide ; SmallWaters Corporation, Chicago, IL, 1995.
Atiase, R. K., H. Li, S. Supattarakul, and S. Tse. 2005. Market Reaction to Multiple
Contemporaneous Earnings Signals: Earnings Announcements and Future
Earnings Guidance. Review of Accounting Studies 10:497–525.
Atiase, R. K., S. Suppattarakul, and S. Tse. 2006. Price and Volume Reaction to
Management Earnings Forecasts: The Incremental Effect of Managements' Prior
Forecasting Reputation. Working Paper, University of Texas..
Baginski, S. P., and J. M. Hassell. 1990. The market interpretation of management
earnings forecasts as a predictor of subsequent financial analyst forecast revision.
The Accounting Review 65 (1): 175–90.
94
Baron, J., and I. Ritov. 1994. Reference Points and Omission Bias. Organizational
Behavior and Human Decision Processes 59: 475-498.
Barton, J., and M. Mercer. 2005. To Blame or Not to Blame: Analysts’ Reactions to
External Explanations for Poor Financial Performance. Journal of Accounting and
Economics 39: 509-533.
Bhojraj, S., R. Libby, and H.Yang. 2008. Practice Makes Perfect: Do Firms and Markets
Learn From Past Earnings Guidance Behavior? Working Paper, Cornell
University
Botosan, C. A. 1997. Disclosure Level and the Cost of Equity Capital. The Accounting
Review 72 (3): 323-349.
Botosan, C. A., and M. S. Harris. 2000. Motivations for a change in Disclosure
Frequency and its Consequences: An Examination of Voluntary Segment
Disclosures and its Consequences. Journal of Accounting Research 38 (2): 329-
353.
Brown, S., S. Hillegeist, and K. Lo. 2004. Conference Calls and Information Asymmetry.
Journal of Accounting and Economics 37: 343-366.
Brown, L. D., and M. L. Caylor. 2005. A temporal analysis of quarterly earnings
thresholds: Propensities and valuation consequences. The Accounting Review 80
(2): 423–40.
Chen, S. 2004. Why Do Managers Fail to Meet Their Own Forecasts? Working Paper,
University of Washington.

95
Cheng, M., K.R.Subramanyam, and Y. Zhang. 2005. Earnings Guidance and Managerial
Myopia. Working Paper, University of Southern California.
Coller, M., and T. L. Yohn. 1997. Management Forecasts and Information Asymmetry:
An Examination of Bid-Ask Spreads. Journal of Accounting Research 35 (2):
181–91.
Cotter, J., I. Tuna, and P. Wysocki. 2006. Expectations Management and Beatable
Targets: How Do Analysts React to Public Earnings Guidance? Contemporary
Accounting Research 23 (3): 593-624.
Cunningham, J.B., and J. McGregor, (2000), "Trust and the Design of Work:
Complementary Constructs in Satisfaction and Performance", Human Relations,
Vol. 53 No.12, pp.1575-91
Diamond, D., and R. Verrecchia. 1991. Disclosure, Liquidity and the Cost of Capital.
Journal of Finance 46: 1325–59.
Dye, R. 2001. An Evaluation of “Essays on Disclosure” and the Disclosure Literature in
Accounting. Journal of Accounting and Economics 32: 181-235.
Easley, D., S. Hvidkjaer, and M. O'Hara. 2002. Is Information Risk a Determinant of
Asset Returns? Journal of Finance LVII (5): 2185-2221.
Einhorn, H.J., and R.M. Hogarth. 1975. Unit Weighting Schemes for Decision Making.
Organizational Behavior and Human Performance 13: 171-192.
Elliot, B.W., F.D. Hodge, J.J. Kennedy, and M. Pronk. 2007. Are M.B.A. Students a
Good Proxy for Nonprofessional Investors? The Accounting Review 82 (1): 139-
168.
96
Fogg, B.J., and H. Tseng. 1999. Credibility and Computing Technlogy. Communications
of the ACM 42 (5): 39-44.
Frederickson, J. R., and J. S. Miller. 2004. The Effects of Pro Forma Earnings
Disclosures on Analysts' and Nonprofessional Investors' Equity Valuation
Judgments. The Accounting Review 79 (3): 667-686.
Graham, J., C. R. Harvey, and S. Rajagopal. 2005. The Economic Implications of
Corporate Financial Reporting. Journal of Accounting and Economics 40: 3-73.
Hackenbrack, K. and M. Nelson. 1996. Auditors' Incentives and Their Application of
Financial Accounting Standards. The Accounting Review 71 (1): 43-59.
Hassell, J. M., and R. H. Jennings. 1986. Relative Forecast Accuracy and the Timing of
Earnings Forecast Announcements. The Accounting Review 61 (1): 58-75.
Hatcher, L. 1994. Using SAS for Factor Analysis and Structural Equation Modeling .
Cary, NC: SAS Institute, Inc., 1994.
Hirst, D. E., L. Koonce, and J. Miller. 1999. The Joint Effect of Management's Prior
Forecast Accuracy and the Form of Its Financial Forecasts on Investor Judgment.
Journal of Accounting Research 37: 101-124.
Hirst, D. E., K. E. Jackson, and L. Koonce. 2003. Improving Financial Reports By
Revealing the Accuracy of Prior Estimates. Contemporary Accounting Research
20 (1): 169–93.
Hirst, D. E., L. Koonce, and S. Venkataraman. 2008. Management Earnings Forecasts: A
Review and Framework. Forthcoming, Accounting Horizons.
97
Hobson, J.L., and S. Kachelmeier. 2005. Strategic Disclosure of Risky Prospects: A
Laboratory Experiment. The Accounting Review 80 (3): 825-846.
Houston, J., B. Lev, and J. Tucker. 2006. To Guide or Not to Guide? Causes and
Consequences of Stopping and Subsequently Resuming Earnings Guidance.
Working paper, University of Florida.
Hribar, P., and H. Yang. 2006. CEO Overconfidence, Management Earnings Forecasts,
and Earnings Management. Working Paper, Cornell University.
Hsieh, P., T. Koller, and S. R. Rajan. 2006. The Misguided Practice of Earnings
Guidance. The McKinsey Quarterly Spring [ Web Supplement: McKinsey on
Finance]: 1-6.
Hutton, A. P. 2005. Determinants of Managerial Earnings Guidance Prior to Regulation
Fair Disclosure and Bias in Analysts' Earnings Forecasts. Contemporary
Accounting Research 22 (4): 867–914.
Hutton, A., G. S. Miller, and D. J. Skinner. 2003. The Role of Supplementary
Statements with Management Earnings Forecasts. Journal of Accounting
Research 41 (5): 867-890.
Hutton, A., and P. Stocken. 2007. Effect of Reputation on the Credibility of Management
Forecasts. Working Paper, Dartmouth College.
Jiambalvo, J., S. Rajgopal, and M. Venkatachalam. 2002. Institutional Ownership and the
Extent to Which Stock Prices Reflect Future Earnings. Contemporary Accounting
Research 19 (1): 117-145.
98
Jennings, R. 1987. Unsystematic security price movements, management earnings
forecasts, and revisions in consensus analyst earnings forecasts. Journal of
Accounting Research 25 (1): 90–110.
Kasznik, R., and B. Lev. 1995. To Warn or Not to Warn: Management Disclosures in the
Face of an Earnings Surprise. The Accounting Review 70 (1): 113–34.
Kennedy, J., T. Mitchell, and S.E. Sefcik. 1998. Disclosure of Contingent Environmental
Liabilities: Some Unintended Consequences? Journal of Accounting Research
36: 257-277.
King, R., G. Pownall, and G. Waymire. 1990. Expectations Adjustments via Timely
Management Forecasts: Review, Synthesis, and Suggestions for Future Research.
Journal of Accounting Literature 9: 113-144.
Kordes-de Vaal, J.H. 1996. Intention and the Omission Bias: Omissions Perceived as
Non-Decisions. Acta Psychologica. 93: 161-172.
Lambert, R, C. Leuz, and R. Verrecchia, 2007. Accounting Information, Disclosure, and
the Cost of Capital, Journal of Accounting Research 45 (2): 385-420.
Leuz, C., and R. Verrecchia. 2000. The Economic Consequences of Increased Disclosure.
Journal of Accounting Research 38:91–124.
Landman, J. 1987. Regret and Elation Following Action and Inaction: Affective
Responses to Positive Versus Negative Outcomes. Personality and Social
Psychology Bulletin 13 (4): 524-536.
99
Lang, M. H., and R. J. Lundholm. 2000. Voluntary Disclosure and Equity Offerings:
Reducing Information Asymmetry or Hyping the Stock? Contemporary
Accounting Research 17 (4): 623–62.
Libby, R., R. Bloomfield, and M. W. Nelson. 2002. Experimental Research in Financial
Accounting. Accounting, Organizations and Society 27: 775-810.
Mercer, M. 2005. The Fleeting Effects of Disclosure Forthcomingness on Management’s
Reporting Credibility. The Accounting Review 80 (2): 723-744.
Miller, G. 2002. Earnings Performance and Discretionary Disclosure. Journal of
Accounting Research 40 (1): 173–204.
Nagar, V., D. Nanda, and P. Wysocki. 2003. Discretionary Disclosure and Stock-based
Incentives. Journal of Accounting and Economics 34: 283-309.
National Investor Relations Institute (NIRI). 2006. NIRI issues 2006 survey results on
earnings guidance practices. Vienna, VA.
Ng, J., I. Tuna, and R. Verdi. 2006. Management Forecasts, Disclosure Quality, and
Market Efficiency. Working Paper: The Wharton School, University of
Pennsylvania.
Niedermayer, L. Y., and G. Chapman. 2001. Action, Inaction, and Factors Influencing
Perceived Decision Making. Journal of Behavioral Decision Making 14: 295-
308.
Pownall, G., C. Wasley, and G. Waymire. 1993. The Stock Price Effects of Alternative
Types of Management Earnings Forecasts. The Accounting Review 68 (4): 896–
912.
100
Prentice, R. A., and J. J. Koehler. 2003. A Normality Bias in Legal Decision Making.
Cornell Law Review 88: 583-650.
Rogers, J. L., and P. C. Stocken. 2005. Credibility of Management Forecasts. The
Accounting Review 80 (4): 1233-1260.
Securities Industries Association. (SIA). 2005. Equity Ownership in America. New York
NY : SIA.
Skinner, D.J. 1994. Why Firms Voluntarily Disclose Bad News. Journal of Accounting
Research 32 (1): 38-60.
Spranca, M., E. Mink, and J. Baron. 1991. Omission and Commission in Judgment and
Choice. Journal of Experimental Social Psychology 27: 76-105.
Stocken, P. C. 2000. Credibility of Voluntary Disclosure. Rand Journal of Economics 31
(2): 359–74.
Tan, H.T., R. Libby, and J.E. Hunton. 2002. Analysts' Reactions to Earnings
Preannouncement Strategies. Journal of Accounting Research 40(1): 223-246.
Trueman, B. 1986. Why do Managers Voluntarily Issue Earnings Forecasts? Journal of
Accounting and Economics: 53-72.
Verrecchia, R. 1983. Discretionary Disclosure. Journal of Accounting and Economics 5:
179-194.
Verrecchia, R. 2001. Essays on Disclosure. Journal of Accounting and Economics 32: 97-
180.
101
Waymire, G. 1985. Earnings Volatility and Voluntary Management Forecast Disclosure.
Journal of Accounting Research 23 (1): 268-295.
Welker, M., 1995. Disclosure Policy, Information Asymmetry and Liquidity in Equity
Markets. Contemporary Accounting Research11, 801–828.
Whitener, E., S.Brodt, M. Korsgaard, and J. Werner. 1998. Managers as Initiators of
Trust: An Exchange Relationship Framework for Understanding Managerial
Trustworthy Behavior. The Academy of Management Review 23 (3): 513-530
Williams, P. A. 1996. The Relation between a Prior Earnings Forecast by Management
and Analyst Response to a Current Management Forecast. Accounting Review 71
(1): 103-115.
Zaheer, A, B. McEvily, and V. Perrone. 1998. Does Trust Matter? Exploring the Effects
of Interorganizational and Interpersonal Trust on Performance. Organization
Science 9(2): 141-15
Zuckerman, G. 2005. CEOs Turn Mum About Projecting Earnings. The Wall Street
Journal Online, 03/01/2005, C1.
102
Vita
Shankar Venkataraman was born in Madras, India on March 25, 1969, the son of
Lakshmi and Arunachalam Venkataraman. In May 1989, he graduated with a Bachelor’s
degree in Commerce from the University of Madras. In May 1991, he received a Post
Graduate Diploma in Management from the Indian Institute of Management,
Ahmedabad, following which he worked for three years in India in the banking industry.
In May 1997, he received a Masters degree in International Management from
Thunderbird – The American Graduate School of International Management, Glendale,
AZ, following which he worked as an information technology consultant implementing
financial applications until 2002. He entered the Graduate School at the University of
Texas at Austin in 2002. After completing his degree, he will join the faculty of Georgia
Tech College of Management at Atlanta, GA.
Permanent address: 6/29, Gopalakrishna Road, Apt. B1, Malles Yoga Villa, T. Nagar,
Chennai 600 017, India.
This dissertation was typed by the author.
Copyright © 2022 FDOKUMEN