Cooperative Spectrum Sensing for Cognitive Radios under Bandwidth Constraints
31
Cooperative Spectrum Sensing for Cognitive Radio Networks under Limited Time Constraints Saud Althunibat a,* , Marco Di Renzo b , Fabrizio Granelli a a University of Trento, DISI, Via Sommarive 14, I-38123, Trento, Italy b Laboratory of Signals and Systems (L2S), CNRS – SUPELEC - Univ. Paris-Sud, 3 rue Joliot–Curie, 91192 Gif–sur–Yvette (Paris), France Abstract User cooperation for spectrum sensing in cognitive radios has been proposed in order to improve the overall performance by mitigating multi-path fad- ing and shadowing experienced by the users. However, user cooperation results in high energy consumption, extra time for results exchange, as well as delay and security risks. In this paper, we investigate the effects of co- operative spectrum sensing (CSS) on energy consumption and achievable performance. Our analysis is based on a limited time resources assumption. This implies that the time resources dedicated for CSS process are limited and shared between spectrum sensing and results reporting, which depend on the number of sensing users. Our results show that cooperation among large number of users not only causes high energy consumption, but it also degrades the performance. Motivated by these considerations, the number of sensing users is optimized for different setups: throughput maximization, energy consumption minimization, and energy efficiency maximization. The optimal number of the sensing users is computed in a closed-form for both throughput maximization and energy minimization setups, while a simple iterative algorithm is proposed for obtaining the optimal number of sensing users for maximizing energy efficiency. Moreover, a novel energy efficient approach is presented that is able to significantly improve energy efficiency without degrading achievable throughput. * Corresponding author Email addresses: [email protected] (Saud Althunibat ), [email protected] (Marco Di Renzo), [email protected] (Fabrizio Granelli) Preprint submitted to Computer Communication January 22, 2014
-
Upload
independent -
Category
Documents
-
view
0 -
download
0
Transcript of Cooperative Spectrum Sensing for Cognitive Radios under Bandwidth Constraints
Cooperative Spectrum Sensing for Cognitive Radio
Networks under Limited Time Constraints
Saud Althunibata,∗, Marco Di Renzob, Fabrizio Granellia
aUniversity of Trento, DISI, Via Sommarive 14, I-38123, Trento, Italyb Laboratory of Signals and Systems (L2S), CNRS – SUPELEC - Univ. Paris-Sud, 3 rue
Joliot–Curie, 91192 Gif–sur–Yvette (Paris), France
Abstract
User cooperation for spectrum sensing in cognitive radios has been proposedin order to improve the overall performance by mitigating multi-path fad-ing and shadowing experienced by the users. However, user cooperationresults in high energy consumption, extra time for results exchange, as wellas delay and security risks. In this paper, we investigate the effects of co-operative spectrum sensing (CSS) on energy consumption and achievableperformance. Our analysis is based on a limited time resources assumption.This implies that the time resources dedicated for CSS process are limitedand shared between spectrum sensing and results reporting, which dependon the number of sensing users. Our results show that cooperation amonglarge number of users not only causes high energy consumption, but it alsodegrades the performance. Motivated by these considerations, the numberof sensing users is optimized for different setups: throughput maximization,energy consumption minimization, and energy efficiency maximization. Theoptimal number of the sensing users is computed in a closed-form for boththroughput maximization and energy minimization setups, while a simpleiterative algorithm is proposed for obtaining the optimal number of sensingusers for maximizing energy efficiency. Moreover, a novel energy efficientapproach is presented that is able to significantly improve energy efficiencywithout degrading achievable throughput.
∗Corresponding authorEmail addresses: [email protected] (Saud Althunibat ),
[email protected] (Marco Di Renzo), [email protected](Fabrizio Granelli)
Preprint submitted to Computer Communication January 22, 2014
Keywords: Cognitive Radio, Cognitive Radio Networks, CooperativeSpectrum Sensing, Energy efficiency
1. Introduction
Recent results have shown that most of the licensed spectrum is notefficiently used, and that unlicensed users suffer from a spectrum shortage [1].As a solution, cognitive radio (CR) has been proposed [2]. Two well-knownapproaches of CR, namely, underlay and overlay. In underlay CR, unlicensedusers can simultaneously use the spectrum with the licensed users [3], whilein overlay CR, the unlicensed users can access the licensed spectrum whenit is not occupied by the licensed users [4]. In this paper we focus on theoverlay approach. To identify the used/unused status of the spectrum, theunlicensed users have to detect the activity of the licensed users over thefrequency spectrum. This process is called spectrum sensing (SS).
Since SS is the first stage of cognitive communications, it plays a signif-icant role in the success of the whole process. Therefore, SS has received alot of attention in order to perform it efficiently. A very promising solutionto enhance the reliability of SS is the so-called cooperative spectrum sensing(CSS) [5–8], where the sensing users, after their individual sensing, collabo-rate to make a final decision about the used/unused status of the frequencyspectrum under analysis. Cooperation is enabled by reporting the results ofthe local sensing to a central entity, called fusion center (FC), where the re-sults are combined and a final decision is taken [9]. The performance of CSSis evaluated through two indicators: the detection probability and the falsealarm probability. The former is defined as the probability of identifying theused spectrum as used, while the latter is the probability of identifying theunused spectrum as used. Notice that lower detection probability results in ahigher interference at the licensed users, whereas high false alarm probabilityleads to inefficient usage of the available spectrum.
Although CSS considerably decreases the error probability of identifyingthe correct status of the spectrum, by mitigating the effects of multi-pathfading and shadowing [10, 11] , it has some important limitations, such asthe increased energy consumption, a larger delay to make a decision aboutthe status of the spectrum, as well as security risks [12, 13]. In particular,the energy inefficiency is due to the need to report local decisions to theFC, and, as such, it increases with the number of cognitive users (CUs) and
2
the amount of information to be reported by each of them. Therefore, theanalysis of the energy efficiency of CSS must be investigated before makingany conclusions on the actual benefits of CSS.
In fact, the energy efficiency of CSS has been investigated in many papers.However, the results available in the literature are not often directly compara-ble since the analysis is performed under different assumptions. In [6,14–16],it is proposed to reduce the amount of information to be reported as a meansof saving energy. In [6], the local results are quantized by using only one bit,which is known as hard-based scheme. In [14], an optimal quantizer for thesensing users is proposed. In [15], a confidence-voting scheme is introduced,where each user sends its sensing result only if it has a given confidencelevel. The confidence level is computed from the history of the local resultcompared to the final result. In [16], only informative test statistics arereported to the FC. However, all these protocols foresee that all the usersstill sense the spectrum, which consumes a considerable amount of energy.In [17], the rule for making the decision is optimized in order to maximizeenergy efficiency. In [18], an alternative approach is proposed, which is calledcluster-based spectrum sensing. It foresees that each group of users selects acluster-head to process their results and to report just one decision on behalfof all of them. However, also in this case all users still sense the spectrum. Inaddition, extra energy is consumed due to the information exchange betweenthe cluster-head and cluster-members. From these considerations, it followsthat reducing the number of sensing users represents a favored approach, asit reduces both sensing energy and reporting energy. Such approach can befound in [19–21].
As mentioned above, the detection performance of CSS increases withthe number of sensing users, but the required overhead (energy, delay, sens-ing and reporting times, etc) also increases accordingly. Therefore, manyworks have investigated the optimization of the number of sensing users forseveral objectives. The problem was firstly formulated by [22], where thenumber of users is optimized to maximize a target function combining thedetection performance and the usage efficiency of the resources. In [23], thetarget function is defined as the network utility, which is a function of de-tection accuracy and number of sensing users. In [9], the number of users isoptimized to minimize error rate in CSS. A trade-off between sensing perfor-mance and throughput is investigated in [24]. In [25], two different setups arepresented, energy efficient setup and throughput maximization setup. In the
3

first setup, the number of sensing users is minimized to reduce energy con-sumption while achieving predefined constraints on detection accuracy, whilein throughput maximization setup, throughput is maximized by minimizingthe number of users while attaining a predefined threshold in detection ac-curacy. In [26], an iterative algorithm which jointly optimizes the thresholdand sensing time together to decrease the effect of the error and to increasethe achievable throughput. However, these works either do not provide ananalytical solution of the optimal number of users [9, 22, 25], or the opti-mization is performed without taking into account overhead load or properlimited time resources constraint. [22,23,26].
In this paper, we investigate the problem of optimizing the number ofsensing users for CSS under three different setups: throughput maximiza-tion, energy minimization, and energy efficiency maximization, while satis-fying a predefined constraint on the detection probability. The optimizationproblems are based on a pragmatic limited time resources constraint. Morespecifically, we assume that the total frame has a finite and fixed duration.A fixed part of it is dedicated for data transmission, while the rest is dis-tributed between local sensing and results’ reporting as a function of thenumber of sensing users. With this finite frame duration assumption, if thenumber of users increases, the reporting time has to be longer, and, thus, ashorter time is left for local sensing. Compared with the above-mentionedstate-of-the-art papers, we assume that the time duration of data transmis-sion is kept fixed and sensing/reporting times are variable. State-of-the-artpapers sometimes assume a fixed sensing time and a variable data/reportingtimes [22], [23], [25]. Our assumption does not affect data transmission, and,thus, makes CSS a less invasive process.
Although the work in [25] is related to ours, there are three main dif-ferences between both works : (i) Different time distribution mechanismsare assumed, where in [25] the sensing time is fixed so that the overheadload affects the transmission time, while we fix the transmission time andthe overhead load affects the sensing time, (ii) No closed form expressionare presented in [25] for the two considered setups, while we present simpleclosed forms for the optimal number of sensing users that maximizes through-put and minimizes energy consumption, (iii) Unlike our work, neither energyminimization nor energy efficiency maximization are tackled in [25]. Never-theless, since both works are based on different assumptions, our approachcan be considered as parallel contribution to those presented in [25]. Another
4

related work is [24], where the sensing time is optimized for throughput max-imization. However, the optimal number of CUs has not been investigatedin [24], and the optimization is confined on throughput maximization setup.Moreover, the time distribution assumption is different form ours, where thetransmission time is left variable and the reporting time has not been con-sidered.
The contributions of our work can be summarized as follows:
• Deriving, in closed-form, the optimal numbers of sensing users thatmaximize the achievable throughput and minimize energy consump-tion, while limiting the resulting interference by satisfying a predefinedconstraint on detection probability.
• Proposing a simple iterative algorithm that is able to find the optimalnumber of sensing users that maximizes the energy efficiency whilelimiting the resulting interference by satisfying a predefined constrainton detection probability
• Proposing a novel scheme that is able to improve energy efficiencyby finding the optimal number of sensing users that minimizes energyconsumption while keeping the same throughput as when all availableusers cooperate, and satisfying a predefined threshold on the detectionprobability.
The rest of this paper is organized as follows, Section 2 describes thesystem model. In Section 3, the optimization of the number of sensing users ispresented for the three different objectives, throughput maximization, energyconsumption minimization and energy efficiency maximization, followed byproposing a suboptimal energy efficient approach. In Section 4, performanceevaluation is discussed using analytic and simulation results. Finally, Section5 concludes the paper.
2. System Model
A CR network with NT CUs is considered. The CUs try to use a specificspectrum without affecting the licensed user. Hence, they have to sense thespectrum and detect the unused portions of it in order to be able to starttheir own transmission. The simplest SS technique, and the most efficientwhen no prior information is available, is the energy detection [7]. In the
5

energy detection method, SS is performed by collecting a number of energysamples S by each CU. The signal observed by each CU is as follows:
y(t) =
{x(t) + n(t) if the channel is busyn(t) if the channel is free
(1)
where n(t) is the additive white Gaussian noise with variance σ2n, and x(t) is
the Primary User (PU) signal which is assumed to be circularly symmetriccomplex Gaussian (CSCG) distributed with variance σ2
x. This assumptionis reasonable for signals with rich inter-symbol interference, for orthogonalfrequency division multiplexing (OFDM) signals with linear precoding [24],and under the assumption that the PUs are operating close to capacity [27][28].
After local sensing, in CSS the decision is cooperatively made by reportingthe local decisions to the FC. This is useful to mitigate multi-path fadingand shadowing. We assume that the local results are reported to the FC indifferent time slots based on a time division multiple access scheme (TDMA)[25]. To this end, many reporting schemes, such as hard and soft, can beused [29]. In this paper, we choose the soft scheme: each CU sends theaverage of the observed samples (i.e., the outcome of the energy detector) tothe FC. At the FC, the average of all the received data from the CUs (Av) iscompared with a predefined threshold (λ), and a decision is made as follows:
Decision =
{1 (busy) if Av ≥ λ0 (free) if Av < λ
(2)
2.1. Detection Accuracy
Two metrics are usually used to assess the performance of CSS: the de-tection probability PD and the false alarm probability PF . The detectionprobability is the probability that the FC identifies a used channel as busy,and the false alarm probability is the probability that the FC identifies anunused channel as busy. In formulas, PD and PF are given as follows [30]
PD = Q
(λ− (σ2
x + σ2n)
(σ2x + σ2
n)/√
NS
)(3)
PF = Q
(λ− σ2
n
σ2n
/√NS
)(4)
6

where Q(x) = 1√2π
∫∞xexp(−t2
2
)dt, and N is the actual number of sensing
users with 1 ≤ N ≤ NT .
Let us assume that the threshold λ is chosen in order to guarantee agiven detection probability P th
D . Therefore, using (3), λ can be computed asfollows:
λ =Q−1(P th
D )(σ2x + σ2
n)√NS
+ σ2x + σ2
n (5)
The constraint P thD is employed in order to limit the resulting interference
at the primary users, caused when a missed detection occurs. According to(5), PF , given in (4), can be rewritten as:
PF = Q
(Q−1(P th
D )(1 + ζ) + ζ√NS
)(6)
where ζ = σ2x
σ2n.
The transmission is organized in frames of fixed time duration. Theframe duration (T ) is divided into three sub-frames: i) the sensing sub-frameof duration Ts, during which local sensing is performed; ii) the reportingsub-frame of duration Tr, where local results are reported to the FC; andiii) the data transmission sub-frame of duration Tt, where data transmissionoccurs if the channel is identified as free according to (2). As a consequence,T = Ts + Tr + Tt.
1
As discussed in Section 1, we assume that Tt is given and fixed, whileTs and Tr are chosen in order to trade-off sensing and reporting reliabilities,respectively, such that T is kept fixed. If we consider τ is the time neededby each CU to report the sensed result to the FC, then the total reportingtime for all CUs is Tr = Nτ . Since Tt is assumed fixed, the duration of thesensing sub-frame can be expressed as a function of the number of sensingusers as follows:
Ts(N) = T − Tt −Nτ (7)
Hence, the maximum number of collected samples per user as a functionof the number of sensing users is:
S(N) =(T − Tt −Nτ
)fs (8)
1Notice that the energy consumed during the idle state is small compared to the totalenergy consumption in CSS, thus we neglect it [17], [25].
7
where fs is the sampling frequency.Likewise, the total number of collected samples of all sensing users (ST )
is given:ST (N) = NS(N) =
(T − Tt
)fsN − fsτN2 (9)
It can be observed that as N increases, Tr increases, and, consequently,Ts and S decrease.
2.2. Energy Consumption
The energy consumed for CSS by all CUs is made of three contributions:i) the energy consumed during local sensing (Es); ii) the energy consumedduring results’ reporting (Er); and iii) the energy consumed during datatransmission (Et). While Es and Er are always non–zero, Et is equal to zeroif no data is transmitted. In this paper, we adopt opportunistic cognitiveradio access [31], where the spectrum is exploited only if it has been identifiedas free in CSS process. Hence, the probability of transmitting data is givenby the probability of identifying the spectrum as free during CSS, regardlessthe actual status of the spectrum. We denote this probability by Pfree, andit can be computed as follows:
Pfree = P1(1− PD) + P0(1− PF ) (10)
where P0 is the probability that the spectrum is actually unused, and P1 isthe probability that the spectrum is actually used. The first term representsthe probability of identifying the used spectrum as free, and the second termrepresents the probability of identifying the unused spectrum as free.
Since PD = P thD , according to (5), and P0 + P1 = 1, then Pfree can be
rewritten as follows:Pfree = 1− P1P
thD − P0PF (11)
Therefore, the energy consumed as a function of N is given as follows:
E(N) = Es(N) + Er(N) + PfreeEt (12)
where the energies Es, Er and Et are expressed as follow:
Es(N) = NTs(N)ρs (13)
Er(N) = Nτρr (14)
Et = Ttρt (15)
8
where ρs, ρr and ρt are the powers consumed per each CU for local sensing,results’ reporting, and data transmission, respectively.
It is worth mentioning that increasing N does not necessarily increase thetotal energy consumption. This is due to the contrasting effects on Es, Erand Pfree.
2.3. Achievable Throughput
The achievable throughput of CSS can be defined as the average amountof the successfully-delivered transmitted bits. A successful transmission oc-curs only in the case of correct identification of the unused spectrum. Inother words, the transmitted bits are successfully delivered if the channelis unused and it is correctly identified as free [26]. Hence, the achievablethroughput (Th), measured in bits, is given in terms of N as :
Th(N) = P0(1− PF (N))DtTt (16)
where the factor P0(1 − PF (N)) represents the probability of correct iden-tification of the unused spectrum, and Dt is the data transmission rate inbits/s.
Finally, the energy efficiency is defined as the average throughput overthe average consumed energy as follows [31]
µ(N) =P0(1− PF (N))DtTt
Es(N) + Er(N) + PfreeEt(17)
3. Optimization of the Number of Sensing Users
The number of CUs that participate in CSS plays a significant role inthe overall performance of the cognitive radio network. This role is initiateddue to the effect of the number of sensing users on time resources distribu-tion, Eqn.(7), detection accuracy performance, Eqn.(6), energy consumption,Eqn.(12), and transmitted data, Eqn.(16). In this section, we optimize thenumber of sensing users for three different setups, throughput maximization,energy consumption minimization, and energy efficiency maximization.
3.1. Throughput Maximization
Increasing the number of sensing users leads to a higher diversity in thereceived sensing results, which improves the achievable throughput. On the
9

other hand, larger number of sensing users consumes more time for report-ing process, which, consequently, decreases the number of collected samplesby each CU. This influences the false alarm probability, and hence, lowerthroughput will be achieved. Therefore, it is necessary to optimize the num-ber of sensing users so that the throughput is maximized.
Using (16), the throughput maximization problem can be expressed asfollows
maxN
P0(1− PF )DtTt (18)
since P0, Dt and Tt are independent of N , and using (6), the problem can besimplified to
maxN−PF = min
NQ
(Q−1(P th
D )(1 + ζ) + ζ√NS
)(19)
The optimal N that maximizes Th can be obtained by setting ∂PF∂N
= 0.However, Q(·) is an integral, therefore, we should use Leibniz integral rule [32]to find its derivative as follows:
∂PF∂N
=−1√2π
ζfs(T − 2Nτ − Tt)2√Nfs(T −Nτ − Tt)
e−(Q−1(PthD )(1+ζ)+ζ
√NS)2
2 (20)
Since√NS 6=∞, i.e., the total number of samples is limited, (20) will equal
zero only if the following condition is satisfied 2:
T − 2Nτ − Tt = 0 (21)
that can be solved to obtain the optimal number of sensing users that max-imizes throughput (N optTh) as follows
N optTh =⌊T − Tt
2τ
⌋(22)
where b·c is the flooring operator. Since the number of sensing users is limitedby the total available CUs (NT ), then N optTh can be rewritten as follows
N optTh = min
{⌊T − Tt2τ
⌋, NT
}(23)
2It is possible to employ the fact that the Q-function is a monotonic decreasing functionof its argument, and hence, maximizing (21) is equivalent to (19).
10

According to (23), if the number of available users is NT >T−Tt2τ
, then themaximum throughput is achieved by dividing the time resources dedicatedfor CSS equally between local sensing (Ts) and reporting (Tr). Also, noticethat for NT >
T−Tt2τ
, the optimal number of users that achieve the maximumthroughput is independent of NT .
3.2. Energy Consumption Minimization
Another important objective for optimizing the number of sensing usersis energy consumption minimization. Different numbers of sensing users leadto different time distribution between sensing and reporting, and hence dif-ferent energy consumption. Besides, increasing N results in a lower PF whichincreases the energy consumed during the data transmission subframe. Inthis subsection we optimize the number of sensing users for the minimumenergy consumption.
The energy minimization problem can be formulated as follows:
minN
E(N) = minN
Es(N) + Er(N) + PfreeEt (24)
by substituting the values of Es, Er and Pfree that are given in (13), (14)and (11), we get
minN
N(ρsTs(N) + ρrτ) + (1− P0PF − P1PthD )ρtTt (25)
It is easy to prove that ET is a concave function3 of N ∈ [1, NT ]. Hence,the local minimum values occur at the bounds of the interval, i.e., N =1, NT . Then, the optimal number of sensing users that minimizes energyconsumption can be expressed as follows
N optE =
{1 if ET (1) ≤ ET (NT )NT if ET (1) > ET (NT )
(26)
where E(1) and E(NT ) the total energy consumption when the N =1, NT , respectively, and can be obtained using (12).
Notice that the number of the available CUs is bounded by Nmax sincethe time resources are limited, the maximum number of sensing users can beexpressed as follows:
Nmax =⌈T − Tt
τ− 1⌉
(27)
3The concavity of ET can be shown using the second derivative test (∂2ET
∂N2 < 0)
11

where d·e is the ceiling operator. Using (7), we can obtain that Ts(Nmax) = τ ,and using (8) we can find the number of samples collected by each CU asS(Nmax) = fsτ . Hence, the total number of samples that can be obtained bythe maximum number of users is given by
ST (Nmax) = S(Nmax)Nmax = fs(T − Tt − τ) (28)
Likewise, in the case of the minimum number of sensing users, i.e., N = 1,(7) gives Ts(1) = T − Tt − τ , and (8) gives S(1) = fs(T − Tt − τ). Then, thetotal number of samples that can be collected is expressed as follows
ST (1) = S(1) = fs(T − Tt − τ) (29)
As a result, ST (Nmax) = ST (1) which implies that Pfree(Nmax) = Pfree(1).According to this, we conclude that the energy consumed during data trans-mission is equal whether N = Nmax or N = 1. Therefore, since the energyconsumed in CSS is less when only one user is participated, we can obtainthat E(1) < E(Nmax). By applying this to (26), it can be reformulated tobe as follows
N optE = 1 (30)
Similar to throughput maximization setup, the optimal number that min-imizes energy consumption is independent of the number of available usersand the time distribution between sensing and reporting.
3.3. Energy Efficiency Maximization
As we have optimized the number of sensing users into two differentsetups, throughput maximization and energy minimization, it is clear thatoptimizing each one of them may lead to high degradation on the othermetric. e.g., maximizing the achievable throughput results in a high energyexpenditure and vice versa. Therefore, since energy efficiency is defined asthe ratio of throughput to energy consumption, maximizing it attains thebalance point between the two contrasting performance indexes.
Energy efficiency, as defined in (17), could be maximized by the optimalnumber of sensing users using the following problem
maxN
µ = maxN
P0(1− PF )DtTtEs(N) + Er(N) + (1− P0PF − P1P th
D )Et(31)
It is clear that obtaining the optimal N from (31) in a closed form ex-pression is too hard. However, since N is bounded by the available time
12

resources, i.e., Nmax = T−Ttτ− 1, we propose a simple iterative bisection
algorithm [33] to find the optimal number of users that maximizes energyefficiency, as described in Algorithm 1.
Algorithm 1 Proposed bisection algorithm to find N optµ
Initialization: Set Nmin = 1 and Nmax = T−Ttτ− 1.
Define i = 1while i6= 0do
N = Nmin+Nmax2
compute µ(N − 1), µ(N) and µ(N + 1)if µ(N + 1) > µ(N) > µ(N − 1) then
Nmin = Nendif µ(N + 1) < µ(N) < µ(N − 1) then
Nmax = Nendif µ(N + 1) ≤ µ(N) & µ(N) ≥ µ(N − 1) then
N optµ = N , i = 0end
end
3.4. Sub-Optimal Energy-Efficient Approach
Since the optimal number of sensing users that maximizes energy effi-ciency can not be extracted in a closed mathematical form, we present inthis subsection an energy-efficient approach that provides a suboptimal so-lution.
The idea is based on the fact that the achievable throughput is a symmet-ric function around the optimal value that maximizes throughput. There-fore, for large number of available users, the throughput achieved by thetotal available number of users can be attained by a less number of sensingusers. Therefore, a huge amount of the consumed energy can be saved, andconsequently, we can improve the overall energy efficiency.
Let us denote the number of sensing users that can achieve the samethroughput as the total number of users by N ′. In order to quantify N ′,we equalize the achievable throughput using all the available users (Th(NT ))
13

and the achievable throughput using (Th(N ′), as follows
Th(NT ) = Th(N ′) (32)
using (16), this can be rewritten as follows
P0(1− PF (NT ))DtTt = P0(1− PF (N ′))DtTt (33)
since P0, Dt, and Tt are independent of the number of sensing users, (33) canbe simplified as
PF (NT ) = PF (N ′) (34)
According to (6), (34) can be rewritten as follows:
Q
(Q−1(P th
D )(1 + ζ) + ζ√NTS
)= Q
(Q−1(P th
D )(1 + ζ) + ζ√N ′S
)) (35)
in order to achieve the equality between the two sides, we must equalize
NTS(NT ) = N ′S(N ′) (36)
where S(NT ) and S(N ′) are the number of collected samples per user whenthe number of sensing users is NT and N ′, respectively. By substituting thenumber of collected samples, given in (8), we get
NT
(T − Tt −NT τ
)fs = N ′
(T − Tt −N ′τ
)fs (37)
which is simplified as a quadratic equation of N ′ as:
τN ′2 − (T − Tt)N ′ +
(T − Tt −NT τ
)NT = 0 (38)
where the two solutions (N ′1, N′2) of this equation are computed as follows
N ′1 = NT (39)
N ′2 =T − Tt −NT τ
NT τNT =
Ts(NT )
Tr(NT )NT (40)
14

Thus, the number of sensing users that minimizes energy consumptionwhile achieving the same throughput when all available users participate inCSS, is given as follows:
N ′ = min{NT ,Ts(NT )
Tr(NT )NT} (41)
Following this energy-efficient approach, a large reduction on the con-sumed energy can be achieved without degrading the achievable throughput,therefore, the overall energy efficiency of the network will be improved. Also,notice that the improvement in the energy efficiency mainly depends on thenumber of available users.
4. Analytical and Simulation Results
A Cognitive radio of NT CUs is assumed. The probability that the targetspectrum is used by a licensed user is 0.5. The ratio of the signal power of thelicensed user to the noise power is assumed ζ = −20 dB. The total frame isassumed to be T = 100ms. During local sensing, each CU collects sampleswith sampling frequency fs = 1MHz and consumes power ρs = 0.1W .During results’ reporting, each CU spends τ = 0.2ms and consumes powerρr = 1W . In Data transmission, the data rate is assumed Dt = 200Kbpsand the transmit power is assumed ρt = 1W . The number of available usersis set to the maximum, i.e., NT = Nmax given in (27), unless otherwise isstated. These simulation parameters are summarized in Table I. In all nextfigures, the markers represent the simulation results, while the analyticalresults obtained by the derived equations are represented by solid lines.
Fig. 1 shows the average total energy consumption versus the number ofsensing users at a fixed predefined threshold in detection probability P th
D =0.8. Four different curves in Fig. 1 are corresponding to four different values of
Parameter Value Parameter value
P0 0.5 ζ −20 dBfs 1MHz ρt 1Wρs 0.1W ρr 1Wτ 0.2ms Dt 200KbpsT 100ms
Table I: Simulation Parameters
15
Ts+Tr which represents the time dedicated for CSS. For all curves, the totalenergy consumption is a concave function of N , and the minimum energyconsumption always occurs at N = 1. Increasing the number of CUs willincrease the energy consumption, but at the same time, the energy consumedin local sensing and data transmission will be less due to the limited timeconstraint, which results in a concave curve of the energy consumption.
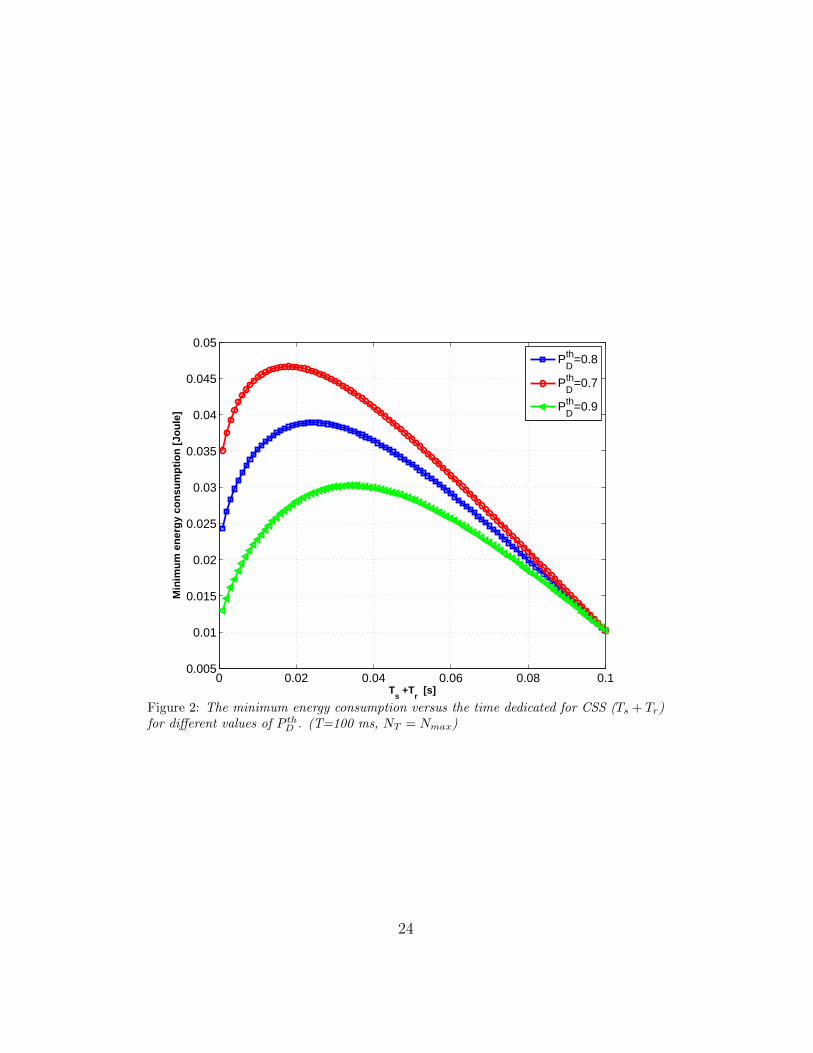
Fig. 2 plots the minimum energy consumption versus Ts+Tr for differentvalues of P th
D . Increasing Ts+Tr increases the minimum energy consumptionbecause of the increased energy during CSS process. However, after a spe-cific value of Ts + Tr, the minimum energy consumption decreases since theenergy consumed during the data transmission subframe decreases. Anotherobservation that can be derived from Fig. 2 is the decrease in the minimumenergy consumption as P th
D increases, which is due to increasing PF as P thD
increases, leading to lower energy consumed during the data transmissionsubframe.
The average achievable throughput versus the number of sensing usersis plotted in Fig. 3 for multiple values of Ts + Tr. The concave shape ofthe curves can be interpreted as a result of two contrasting effects on thesensing performance caused by increasing N . In first part of each curve,the total number of collected samples increases as N increases, while in thesecond, the total number of samples decreases since the number of samplesper CU decreases. The total number of samples affects PF , as indicated in(6), which directly affects the average achievable throughput, as indicatedin(16). Notice that the theoretical results, represented by the solid lines,exactly match the simulation results represented by markers.
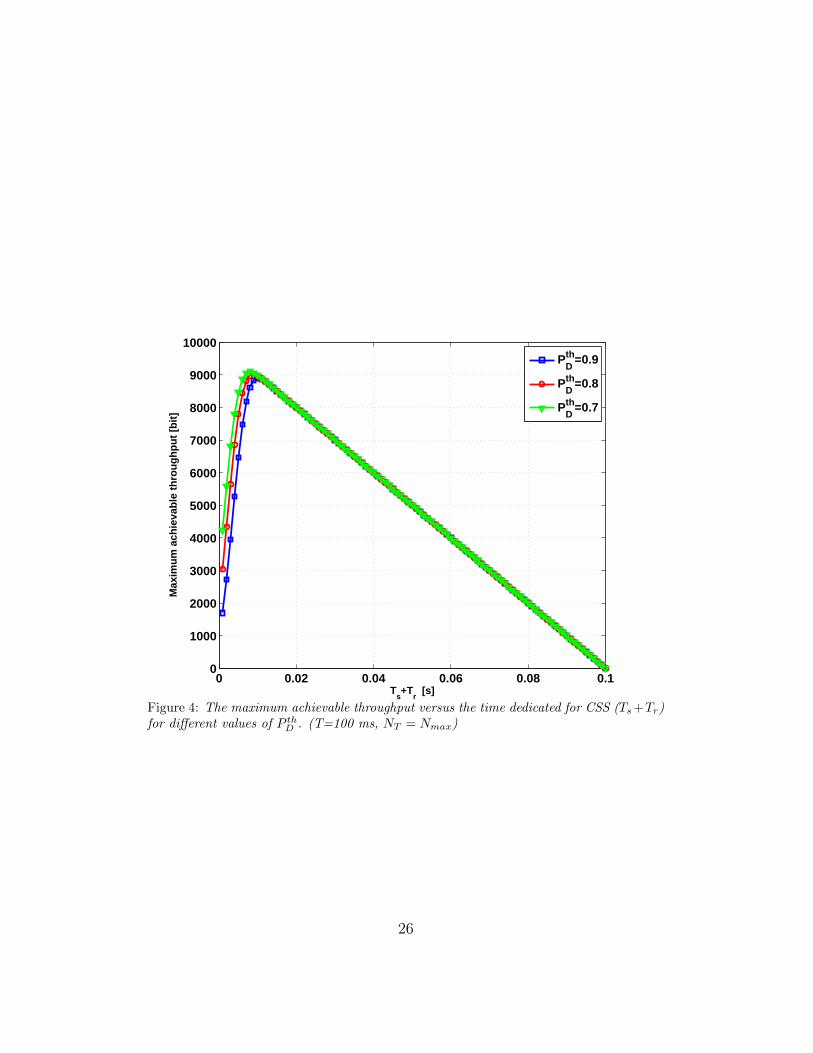
The maximum achievable throughput is shown in Fig. 4 versus Ts + Trfor P th
D = 0.9, 0.8 and 0.7. Clearly, for a fixed total frame duration T ,the increase in the time dedicated for CSS (Ts + Tr) increases the detectionaccuracy. On the other hand, increasing TS +Tr yields in lower transmissiontime Tt in view of the limited frame duration. Therefore, the maximumachievable curve follows a concave shape as appears in Fig. 4 regardless of P th
D .Notice that for low values of Ts +Tr, the maximum achievable throughput islower for higher P th
D due to the higher PF , while, for the high range of Ts+Tr,PF can be reached to zero for all the considered values of P th
D , implying equalmaximum achievable throughput.
In Fig. 5 the energy efficiency versus the number of sensing users is plot-ted for multiple values of Ts+Tr. Notice that the maximum energy efficiency
16

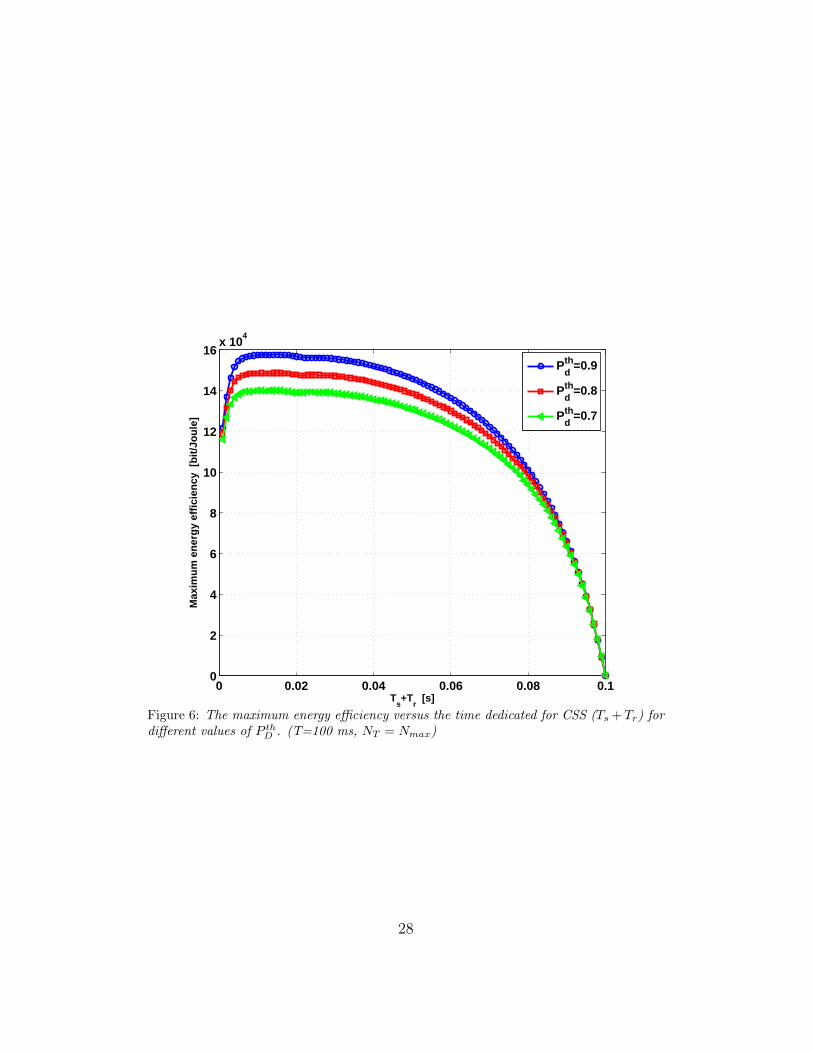
is achieved at a low value of N , usually < NT/2, and it decreases as Ts + Trincreases. The maximum energy efficiency is plotted versus Ts + Tr for mul-tiple values of P th
D in Fig. 6. Clearly, as Ts + Tr increases the detectionaccuracy improves, which enhances the maximum energy efficiency. On theother hand, high values of Ts+Tr decreases the transmission time, and conse-quently degrades the maximum energy efficiency. The theoretical results forthe optimal number of users that maximizes energy efficiency are obtainedusing Algorithm1.
In Fig. 7, we compare the performance of the proposed sub-optimalenergy-efficient approach presented in Section 3.4 to the optimal energy-efficient approach presented in Section 3.3. In Fig. 7 the energy efficiency ofboth approaches is shown versus the number of the available users (NT ) fordifferent values of Ts + Tr. For each curve, NT varies on the range [1, Nmax].The optimal approach uses the optimal number of sensing users that max-imizes energy efficiency, while the sub-optimal approach uses the optimalnumber of sensing users that minimizes energy consumption without affect-ing the achievable throughput, given in (41). The energy efficiency by theoptimal approach, the red curves in Fig.7, increases while NT ≤ N optµ, then itkeeps constant for the rest of the range N optµ ≤ NT ≤ Nmax. In contrast, theenergy efficiency in the sub-optimal approach is equal to the energy efficiencyachieved by NT while NT ≤ N optTh. After that, for the range NT > N optTh,the energy efficiency will show a symmetric curve a round N optTh. For ex-ample, on the curve Ts + Tr = 5ms, the energy efficiency of the sub-optimalapproach for NT ≤ 13 equals to the energy efficiency achieved by NT , seeFig. 5. Notice that for Ts + Tr = 5ms, N optTh = 12.5 is obtained by (23) sothat the achieved energy efficiency should be symmetric around NT = 12.5,as exactly appears in Fig. 7. The maximum deviation of the sub-optimal ap-proach from the optimal approach occurs when NT = Nmax and it is within2%− 9% for the considered values.
Also, for the purpose of comparison, in Fig 8 we compare the achiev-able energy efficiency by our proposal and by the approach proposed in [25].Briefly, in [25], they propose an energy efficient algorithm based on minimiz-ing the number of sensing users while achieving two constraints on detectionprobability and false alarm probability. As mentioned in Section 1, in [25] thereporting time affects the transmission time while the sensing time is fixed.In Fig. 8, the total frame length is considered 100ms for both proposals. Weconsider Ts = 1ms for the proposed approach in [25], and Ts + Tr = 5ms in
17
our approach. The constraint on the detection probability is set to a fixedvalue regardless of the number of users, as shown in the figure, while the con-straint on the false alarm probability that should be satisfied by the otherapproach is tuned to be equal to the false alarm probability achieved by ourapproach. The circles on the two curves of the other approach indicate thatthe approach cannot satisfy the false alarm probability achieved by our pro-posal, so that the energy efficiency that is corresponding to the minimumfalse alarm probability is considered. Apparently, our proposal outperformsthe approach presented in [25], this refers to the fact that in their proposalthe number of sensing users is minimized without considering the achievablethroughout, whereas in our approach we minimize the number of sensingusers while keeping the achievable throughput above a threshold.
The effect of the constraint on detection probability (P thD ) on the three
approaches, the optimal energy efficient, Section 3.3, the proposed subopti-mal energy efficient in Section 3.4, and the energy efficient approach proposedin [25], is shown in Fig. 9 for NT = 24. As P th
D increases, PF increases, Th de-creases, E decreases, and µ improves. This is because the effect on reducingE is higher than the effect on reducing Th. Our approach can achieve higherenergy efficiency, up to 3.5%, than that of the approach proposed in [25].
5. Conclusions
Optimization of cooperative spectrum sensing is investigated in this pa-per for different setups under limited time assumption. This assumptionimplies that the total frame length is limited, where data transmission occu-pies a fixed part of it, and the the rest of the frame is distributed betweenlocal sensing and results’ reporting. Our results can be summarized into thefollowing main conclusions:
• The optimal number of sensing users that maximizes the achievablethroughput while satisfying a predefined threshold in detection prob-ability should consume time for results’ reporting equal to the timespent during local sensing.
• The optimal number of sensing users that minimizes energy consump-tion while satisfying a predefined threshold in detection probability is1.
18

• A simple bisection algorithm is proposed to find the optimal numberof sensing users that maximizes energy efficiency while satisfying apredefined threshold in detection probability.
• A sub-optimal energy-efficient approach is presented that is able toachieve energy efficiency near to the optimal solution, while satisfyinga predefined threshold in detection probability and attaining the samethroughput when all the available users are participated in CSS.
Acknowledgments
This work is funded by the Research Project GREENET (PITN-GA-2010-264759).
References
[1] Federal Communications Commission, Spectrum Policy Task Force,Rep. ET docket no. 02-135, Nov. 2002.
[2] J. Mitola and G. Q. Maguire, Cognitive radio: making software radiosmore personal, IEEE Personal Communications, vol. 6, August 1999,pp. 13-18.
[3] H.Y. Huang, Z. Li, J.B. Si and Rui Gao, “Outage Analysis of UnderlayCognitive Multiple Relays Networks with a Direct Link,” IEEE Com-munications Letters , vol.17 (8), August 2013, pp.1600,1603.
[4] A. Mesodiakaki, F. Adelantado, L. Alonso, and C. Verikoukis, Energy-Efficient Contention-Aware Channel Selection in Cognitive Radio Ad-Hoc Networks, Proc. IEEE CAMAD 2012, Sep. 2012.
[5] G. Ganesan and Y. G. Li, Cooperative Spectrum Sensing in Cogni-tive Radio, Part II: Multiuser Networks, IEEE Transactions on WirelessCommunications, vol. 6 (6), June 2007, pp. 2214-2222.
[6] A. Ghasemi and E. S. Sousa, Collaborative spectrum sensing for op-portunistic access in fading environments,IEEE Symp. New Frontiersin Dynamic Spectrum Access Networks (DySPAN05), Baltimore, USA,November 2005, pp. 131-136.
19

[7] S. M. Mishra, A. Sahai, and R. Brodersen, Cooperative sensing amongcognitive radios, IEEE International Conference in Communications(ICC06), Turkey, June 2006, vol. 4, pp. 1658-1663.
[8] W. Ejaz, and H.S. Kim, Distributed Cooperative Spectrum Sensing inCognitive Radio for Ad Hoc Networks.” Computer Communications 36(2013) 13411349.
[9] W. Zhang, R. K. Mallik, and K. B. Letaief, Optimization of CooperativeSpectrum Sensing with Energy Detection in Cognitive Radio Networks,IEEE Transactions on Wireless Communications, vol. 8 (12), December2009.
[10] M. Di Renzo, F. Graziosi, F. Santucci, Cooperative Spectrum Sensingin Cognitive Radio Networks over Correlated Log-Normal Shadowing,IEEE Vehicular Technology Conference Spring, Barcelona, Spain, April2009.
[11] H. Sun, D. I. Laurenson, J. S. Thompson, and CX Wang, A novel cen-tralized network for sensing spectrum in cognitive radio, IEEE ICC’08,pp. 4186-4190. 2008.
[12] I.F. Akyildiz, B.F. Lo, and R. Balakrishnan, Cooperative spectrum sens-ing in cognitive radio networks: A survey, Physical Communication, vol.11, pp. 40-62, 2011.
[13] Sh. Bhattacharjee, S. Sengupta, and M. Chatterjee. Vulnerabilities inCognitive Radio Networks: A Survey, Computer Communications. 36(2013) 1387-1398.
[14] Y. Tani and T. Saba, Quantization Scheme for Energy Detector ofSoft Decision Cooperative Spectrum Sensing in Cognitive Radio, IEEEGLOBECOM, 2010.
[15] C. Lee and W. Wolf, Energy Efficient Techniques for Cooperative Spec-trum Sensing in Cognitive Radios, IEEE CCNC, 2008.
[16] J. Lunden, V. Koivunen, A. Huttunen, H. Poor, Collaborative cyclosta-tionary spectrum sensing for cognitive radio systems, IEEE Transactionson Signal Processing, vol. 57 (11), 2009, 4182-4195.
20

[17] S. Althunibat, S. Narayanan, M. Di Renzo and F. Granelli, On theEnergy Consumption of the Decision-Fusion Rules in Cognitive RadioNetworks, IEEE CAMAD 2012, pp.125,129, 17-19 Sept. 2012
[18] C. Sun, W. Zhang, K. Ben, Cluster-based cooperative spectrum sensingin cognitive radio systems, IEEE ICC-2007, 2007, 2511-2515.
[19] H.N. Pham, Y. Zhang, P. Engelstad, T. Skeie, F. Eliassen, Energy min-imization method for optimal cooperative spectrum sensing in sensor-aided cognitive radio networks, ICST WiCON, 2010, 19.
[20] S. Althunibat, R. Palacios, and F. Granelli, Energy-Efficient spectrumsensing by coordinated reduction of the sensing users, IEEE ICC, Ot-tawa, Canada, June 2012.
[21] F. Adelantado, A. Juan and C. Verikoukis, Adaptive Sensing User Selec-tion Mechanism in Cognitive Wireless Networks, IEEE CommunicationsLetters, vol.14 (9), September 2010.
[22] Y. Chen, Optimum Number of Secondary Users in Collaborative Spec-trum Sensing Considering Resources Usage Efficiency, IEEE Communi-cation Letters, vol.12 (12), December 2012.
[23] S. Wu, M. Zhao and J. Zhu, Optimal Number of Secondary Usersthrough Maximizing Utility in Cooperative Spectrum Sensing, IEEEVTC-Fall 2009, September 2009.
[24] Y.C. Liang, Y. Zeng, E. Peh, and A.T. Hoang, Sensing-ThroughputTradeoff for Cognitive Radio Networks, IEEE ICC, June 2007.
[25] S. Maleki, S. Pr.Chepuri, G. Leus, Energy and Throughput EfficientStrategies for Cooperative Spectrum Sensing in Cognitive Radios, IEEE12th International Workshop on Signal Processing Advances in WirelessCommunications, 2011.
[26] W. Zhang, and Ch.K. Yeo, Joint iterative algorithm for optimal cooper-ative spectrum sensing in cognitive radio networks, Computer Commu-nications 36 (2012) 80-89.
[27] G. J. Foschini, Private conversation, AT&T Labs-Research, May 2007.
21

[28] P.C. Pinto and M.Z. Win, Communication in a Poisson Field of In-terferersPart I: Interference Distribution and Error Probability, IEEETransactions on Wireless Communications, vol. 9 (7), July 2010, pp.2176-2186.
[29] S. Althunibat, R. Palacios, and F. Granelli, Performance Optimisationof Soft and Hard Spectrum Sensing Schemes in Cognitive Radio, IEEECommunication Letters, vol. 16 (7), July 2012.
[30] E.C.Y. Peh, Y.-C. Liang, Y. L. Guan, and Y. Zeng, Optimization ofcooperative sensing in cognitive radio networks: a sensing-throughputtradeoff view, IEEE Transactions on Vehicular Technology, vol. 58, no.9, pp. 5294 - 5299, 2009.
[31] E.C.Y. Peh, Y. C. Liang, Y. L. Guan and Y. Pei, Energy-Efficient Co-operative Spectrum Sensing in Cognitive Radio Networks, IEEE Globe-Com, 2011.
[32] T.J. Osler, Leibniz rule for fractional derivatives generalized and anapplication to infinite series, SIAM Journal on Applied Mathematics,18.3 (1970): 658-674.
[33] L.R. Burden and J.D. Faires. Numerical analysis PWS. (1989).
22

1 2 3 4 5 6 7 8 9 10 11 12 13 14 15 16 17 18 19 20 21 22 23 240.025
0.03
0.035
0.04
0.045
0.05
0.055
Number of sensing users (N)
Ave
rag
e en
erg
y co
nsu
mp
tio
n [
Jou
le]
Ts+Tr = 5 msTs+Tr = 4 msTs+Tr = 3 msTs+Tr = 2 ms
Figure 1: The total consumed energy (ET ) versus the the number of sensing users (N) fordifferent time distributions.(T=100 ms, Pd=0.8)
23
0 0.02 0.04 0.06 0.08 0.10.005
0.01
0.015
0.02
0.025
0.03
0.035
0.04
0.045
0.05
Ts +T
r [s]
Min
imu
m e
ner
gy
con
sum
pti
on
[Jo
ule
]
PDth=0.8
PDth=0.7
PDth=0.9
Figure 2: The minimum energy consumption versus the time dedicated for CSS (Ts + Tr)for different values of P th
D . (T=100 ms, NT = Nmax)
24

1 2 3 4 5 6 7 8 9 10 11 12 13 14 15 16 17 18 19 20 21 22 23 243000
3500
4000
4500
5000
5500
6000
6500
7000
7500
8000
Number of sensing users (N)
Ave
rag
e th
rou
gh
pu
t [b
its]
Ts+Tr = 5 msTs+Tr = 4 msTs+Tr = 3 msTs+Tr = 2 ms
Figure 3: The achievable throughput (Th) versus the the number of sensing users (N) fordifferent time distributions. (T=100 ms, Pd=0.8)
25
0 0.02 0.04 0.06 0.08 0.10
1000
2000
3000
4000
5000
6000
7000
8000
9000
10000
Ts+T
r [s]
Max
imu
m a
chie
vab
le t
hro
ug
hp
ut
[bit
]
PDth=0.9
PDth=0.8
PDth=0.7
Figure 4: The maximum achievable throughput versus the time dedicated for CSS (Ts+Tr)for different values of P th
D . (T=100 ms, NT = Nmax)
26

1 2 3 4 5 6 7 8 9 10 11 12 13 14 15 16 17 18 19 20 21 22 23 241.15
1.2
1.25
1.3
1.35
1.4
1.45
1.5x 10
5
Number of sensing users (N)
En
erg
y E
ffic
ien
cy [
bit
/Jo
ule
]
Ts+Tr = 2 msTs+Tr = 3 msTs+Tr = 4 msTs+Tr = 5 ms
Figure 5: The energy efficiency (µ) versus the the number of sensing users (N) for differenttime distributions. (T=100 ms, Pd=0.8)
27
0 0.02 0.04 0.06 0.08 0.10
2
4
6
8
10
12
14
16x 10
4
Ts+T
r [s]
Max
imu
m e
ner
gy
effi
cien
cy [
bit
/Jo
ule
]
Pdth=0.9
Pdth=0.8
Pdth=0.7
Figure 6: The maximum energy efficiency versus the time dedicated for CSS (Ts +Tr) fordifferent values of P th
D . (T=100 ms, NT = Nmax)
28

Figure 7: The efficiency metric (µ) by the optimal number of of sensing users and bythe proposed energy efficient approach versus the the number of available users (N) fordifferent time distributions.(T=100 ms, Pd=0.8)
29

2 4 6 8 10 12 14 16 18 20 22 241.15
1.2
1.25
1.3
1.35
1.4
1.45
1.5
1.55
1.6
1.65x 10
5
The number of available users
En
erg
y E
ffic
ien
cy [
Bit
/Jo
ule
]
Proposed approach at PD=0.9
Proposed approach at PD=0.8
Proposed in [25] at PD=0.8
Proposed in [25] at PD=0.9
Figure 8: The efficiency metric by the proposed energy efficient approach (Ts+Tr = 5ms)and the approach proposed in [25] (Ts = 1ms) versus the the number of available users.(T=100 ms)
30

0 0.1 0.2 0.3 0.4 0.5 0.6 0.7 0.8 0.90.9
1
1.1
1.2
1.3
1.4
1.5
1.6x 10
5
PDth
En
erg
y E
ffic
ien
cy [
bit
/Jo
ule
]
Optimal energy efficient Proposed suboptimal energy efficient Proposed in [25]
9.3 %
3.5 %
Figure 9: The efficiency metric (µ) using the optimal number of sensing users, the energyefficient approach proposed in Section 3.4, and the energy efficient approach proposedin [25] versus the predefined threshold in detection probability (P th
D ) for different timedistributions.(T=100 ms, N=24)
31