Cooperative molecular motors moving back and forth
18
arXiv:0908.0617v1 [cond-mat.soft] 5 Aug 2009 Cooperative molecular motors moving back and forth David Gillo 1† , Barak Gur 2† , Anne Bernheim-Groswasser 1 and Oded Farago 3 1 Department of Chemical Engineering, 2 Department of Physics, 3 Department of Biomedical Engineering Ben Gurion University, Be’er Sheva 84105, Israel February 23, 2013 Abstract We use a two-state ratchet model to study the cooperative bidirectional motion of molecular motors on cytoskeletal tracks with randomly alternating polarities. Our model is based on a previously proposed model [Badoual et al., Proc. Natl. Acad. Sci. USA 99, 6696 (2002)] for collective motor dynamics and, in addition, takes into account the cooperativity effect arising from the elastic tension that develops in the cytoskeletal track due to the joint action of the walking motors. We show, both computationally and analytically, that this additional cooperativity effect leads to a dramatic reduction in the characteristic reversal time of the bidirectional motion, especially in systems with a large number of motors. We also find that bidirectional motion takes place only on (almost) a-polar tracks, while on even slightly polar tracks the motion is unidirectional. We argue that the origin of these observations is the sensitive dependence of the cooperative dynamics on the difference between the number of motors typically working in and against the instantaneous direction of motion. † Authors with equal contributions 1
Transcript of Cooperative molecular motors moving back and forth

arX
iv:0
908.
0617
v1 [
cond
-mat
.sof
t] 5
Aug
200
9
Cooperative molecular motors moving back and forth
David Gillo1†, Barak Gur2†,Anne Bernheim-Groswasser1 and Oded Farago3
1Department of Chemical Engineering, 2Department of Physics,3Department of Biomedical Engineering
Ben Gurion University, Be’er Sheva 84105, Israel
February 23, 2013
Abstract
We use a two-state ratchet model to study the cooperative bidirectional motion ofmolecular motors on cytoskeletal tracks with randomly alternating polarities. Our model isbased on a previously proposed model [Badoual et al., Proc. Natl. Acad. Sci. USA 99, 6696(2002)] for collective motor dynamics and, in addition, takes into account the cooperativityeffect arising from the elastic tension that develops in the cytoskeletal track due to the jointaction of the walking motors. We show, both computationally and analytically, that thisadditional cooperativity effect leads to a dramatic reduction in the characteristic reversaltime of the bidirectional motion, especially in systems with a large number of motors. Wealso find that bidirectional motion takes place only on (almost) a-polar tracks, while oneven slightly polar tracks the motion is unidirectional. We argue that the origin of theseobservations is the sensitive dependence of the cooperative dynamics on the differencebetween the number of motors typically working in and against the instantaneous directionof motion.
† Authors with equal contributions
1
1 Introduction
Many cellular processes such as cell motility and mitosis require the cooperative work of manymotors in order to preserve continuous motion and force generation [1]. Muscle contraction, forexample, involves the simultaneous action of hundreds of myosin II motors pulling on attachedactin filaments and causing them to slide against each other [2]. Groups of myosin II motorsare also responsible for the contraction of the contractile ring during cytokinesis [3]. In certainbiological systems, cooperative behavior of molecular motors produces oscillatory motion. Insome insects, for instance, cooperative behavior of molecular motors leads to oscillations of theflight muscles [4]. Another example is the oscillatory motion of axonemal cilia and flagella,which is believed to be generated by a large number of interacting dynein motors [5,6]. Finally,cooperative action of motors is required for the extraction of membrane tubes from vesicles [7,8]
One of the more interesting outcomes of cooperative action of molecular motors is their abilityto induce bidirectional motion. “Back and forth” dynamic has been observed in various motilityassays including: (i) myosin II motors walking on actin tracks with randomly alternating po-larities [9], (ii) NK11 (kinesin related Ncd mutants which individually exhibit random motionwith no preferred directionality) moving on microtubules (MTs) [10], (iii) mixed population ofplus-end (kinesin-5 KLP61F) and minus-end (Ncd) driven motors acting on MTs [11], and (iv)myosin II motors walking on actin filaments in the presence of external stalling forces [12]. Re-versible transport of organelles through the combined action of kinesin II, dynein, and myosinV has been also observed in Xenopus melanophores [13]. In the latter example, the kinesin anddynein move the organelle in opposite directions along MTs, while the myosin motors (whichtake the organelle on occasional “detours” along the actin filaments) function as “molecularratchets”, controlling the directionality of the movement along the MT transport system. Froma theoretical point of view, cooperative dynamics of molecular motors and, in particular, bidi-rectional movement, have been investigated using several distinct models. These models include:(i) lattice and continuum asymmetric exclusion models [14–20], (ii) ratchet models of interacting
particles moving in the presence of a periodic potential [16,21–24], and (iii) the tug-of-war modelwhich has been recently proposed for describing the transport of cargo by the action of a fewmotors [25–28]. The common theme in these experimental and theoretical studies is the asso-ciation of bidirectionality with the competition between two populations of motors that workagainst each other to drive the system in opposite directions. The occasional reversals of thetransport direction reflect the “victory” of one group over the other during the respective timeintervals. The balance of power is shifting between the two motor parties as a result of stochas-tic events of binding and unbinding of motors to the cytoskeletal track. Without going into thedetails of the various existing models of cooperative bidirectional motion, we note that most ofthem assume that the motors interact mechanically but act independently, i.e., their binding toand unbinding from the track are uncorrelated. By further assuming that the attachment anddetachment events of individual motors are Markovian, the distribution of “reversal times” (i.e.,the durations of unidirectional intervals of motion) can be shown to take an exponential form
p(δt) = exp(−δt/τrev), (1)
where τrev is the characteristic reversal time of the bidirectional motion.The magnitude of τrev can be taken as a measure for the degree of cooperativity between
2
the motors. The more cooperative the motors are, the more persistent is the movement and thelonger are the periods of unidirectional transport. The run lengths (in each direction) of highlycooperative motors may be of a few microns even for non-processive motors like myosin II [9].As noted above, the mechanical coupling between the motors is sufficient for the generation ofhighly cooperative bidirectional motion, even if the motors attach to/detach from the track inan uncorrelated fashion. This has been demonstrated theoretically by Badoual et al. some yearsago [23]. A slightly modified version of this model is illustrated schematically in Fig. 1. Themodel considers the one-dimensional motion of a group of N point particles (representing themotors) connected (mechanically coupled) to a rigid rod with equal spacing q. The cytoskeletaltrack is represented by a periodic saw-tooth potential, U(x), with period l and height H . Themodel requires that q is larger than and incommensurate with l. The motors are identical andwalk on a track which is globally a-polar and, thus, does not permit net transport to the rightor left over large time scales. The temporal direction of motion is determined by the net forcegenerated by all the motors. The local polarity of the track is represented by an additional forceof size fran (denoted by a horizontal arrow in each periodic unit in Fig. 1) which, within eachunit of the periodic potential, points to the right or to the left. The globally a-polar nature ofthe track is ensured by requiring that the sum of these random forces vanishes.
The instantaneous force between the track and the motors is given by the sum of all theforces acting on the individual motors:
Ftot =
N∑
i=1
fmotori =
N∑
i=1
[
−∂U (x1 + (i − 1) q)
∂x+ fran (x1 + (i − 1) q)
]
· Ci(t), (2)
where xi = x1 +(i−1)q is the coordinate of the i-th motor. The two terms in the square bracketsrepresent the forces due to the symmetric saw-tooth potential and the additional random localforces acting in each periodic unit. The function Ci(t) takes two possible values, 0 or 1, dependingon whether the motor i is detached from or attached to the track, respectively, at time t. Themotors change their binding states (0 - detached; 1 - attached) independently of each other,according to the following rules: We define an interval of size 2a < l centered around thepotential minima (the gray shaded area in Fig. 1). If located in one of these regions, an attachedmotor may become detached (1 → 0) with a probability per unit time ω1. Conversely, a detachedmotor may attach to the track (0 → 1) with transition rate ω2 only if located outside this regionof size 2a.
At each instance, the group velocity of the motors is proportional to the total force exertedby the motors (Eq. 2)
v(t) = Ftot(t)/λ, (3)
where the friction coefficient, λ, depends mainly on motors attached to the track and is, there-fore, taken proportional to the number of connected motors, Nc ≤ N at time t: λ = λ0Nc.Because the track is globally a-polar, it is clear that the motors exhibit “back and forth” motionwith vanishing mean velocity and displacement. The characteristic time of movement in eachdirection, τrev, may nevertheless be macroscopically large. The origin of this feature (which re-flects the cooperative character of the motors’ action) can be explained as follows: The stochasticequations of motion of our model system have two identical (except for sign reversal) steady statesolutions corresponding to right and left motion of the mechanically coupled motors. Each of
3

these solutions is characterized by Nc = N ·P (P ≤ 1) connected motors. The connected motorsare partitioned to N+ and N− = Nc − N+ ≤ N+ motors that, respectively, support and objectthe motion. Let us define the excess number of motors working in the direction of the motion asN ·∆ = N+−N−, where ∆ will be termed the “bias parameter”. Notice that P and ∆ denote theaverages of quantities (which we, respectively, denote by P (t) and ∆(t)) whose values fluctuatein time due to the stochastic binding and unbinding of motors. To switch the direction of mo-tion, ∆(t) must vanish, and the occurrence probability of this event, Π(∆(t) = 0) ∼ (τrev)
−1. Insection 3 we derive an approximate expression for Π(∆(t) = 0) and show that the mean reversaltime of the bidirectional motion increases exponentially with the size of the system:
τrev ∼[
1 − P +√
P 2 − ∆2]−N
. (4)
Thus, for sufficiently large N , the characteristic reversal time of the bidirectional motion becomesmacroscopically large. In the “thermodynamic limit” (N → ∞), τrev diverges and the motionpersists in the direction chosen at random at the initial time.
The validity of Eq. 4 was recently tested using a motility assay in which myosin II motorsdrive the motion of globally a-polar actin bundles [9]. In contrast to the predicted exponentialdependence of τrev on the number of working motors, the experimentally measured reversal timesshowed no dependence on N . The apparent disagreement between the theoretical model and theexperimental results can be reconciled by noting that Eq. 4 describes exponential growth of τrev
with N only when P and ∆ are themselves independent of N . This is indeed the case in theoriginal model presented by Badoual et al. [23], where both the on (ω2) and off (ω1) rates do notdepend on N . In ref. [9] we introduced a slightly modified version of Badoual’s model, which toa large extent explains the experimentally observed independence of τrev on N . We argued thatthe origin of this behavior can be attributed to the tension developed in the actin track due tothe action of the attached myosin II motors. An increase in the number of attached motors leadsto an increase in the mechanical load which, in turn, leads to an increase in the detachmentrate of the motors, as already suggested in models of muscle contraction [29–32]. But unlikemost previous studies where the myosin conformational energy was calculated, in ref. [9] weconsidered the elastic energy stored in the actin track. Within a mean field approximation, thisenergy scales as E ∼ 〈F 2
tot〉/ksp, where ksp is the effective spring constant of the track and Ftot isthe total force exerted by the motors (see Eq. 3). The total force is the sum of Nc random forcesworking in opposite directions. Therefore, the mean force 〈Ftot〉 = 0, while 〈F 2
tot〉 scales linearlywith Nc. The spring constant is inversely proportional to the length of the track, i.e. to the sizeof the system and to the total number of motors N . We thus conclude that the mean elasticenergy of the actin scales like E/kBT ∼ NNC , which means that the detachment of a motor(Nc → Nc − 1) leads, on average, to an energy gain dE/kBT = −αN (α is some dimensionlessnumber). This effect can be incorporated within the model by introducing an additional off rate,ω3 = ω0
3 exp(αN), outside the gray shaded area in Fig. 1 (i.e., around the potential maxima).Thus, in the modified model, the on and off rates within each unit cell (−l/2 ≤ x ≤ +l/2) ofthe periodic potential are given by
ω on(x) =
{
0 |x| ≤ aω2 a < |x| ≤ l/2
(5)
4
and
ω off(x) =
{
ω1 |x| ≤ aω0
3 exp(αN) a < |x| ≤ l/2.(6)
The dependence of ωoff(x) on N is another, indirect, manifestation of cooperativity between themotors which is mediated through the forces that the motors jointly exert on the actin track.Notice, however, that the cooperative action of the motors does not lead (within the modifiedmodel) to correlations between attachment and detachment events of different motors. Moreover,the attachment/detachment rates do not depend on the number of connected motors and, thus,are fixed over time. In ref. [9] we compared the predictions of the original and modified modelsfor model parameters corresponding to the myosin II-actin motility assay. In the former, thereversal times grew exponentially with N from τrev ∼ 1 sec for N ∼ 1000, to τrev ∼ 103 secfor N ∼ 3000. The modified model showed a much better agreement with the experimentalresults [9]. Specifically, the reversal time did not grow exponentially with N but rather showeda weak maximum around N ∼ 2000, where τrev ∼ 10 sec.
In this paper we present a more detailed account of the theoretical model. Several aspectsof the model not studied in ref. [9] will be discussed in section 2, including the dynamics onnon-random and slightly polar tracks. The steady state solutions of the bidirectional motionare derived analytically in section 3. We use these solutions to estimate the reversal times andcompare our analytical predictions with the computational results. We summarize and discussthe results in section 4.
2 Computational results
The model has been presented in details in ref. [9], as well as above in section 1. The modelparameters used in this paper are summarized in Table 1. The choice of these values whichrepresent various chemical and physical parameters of the myosin II-actin system is explainedin detail in ref. [9]. The model features two new parameters which do not appear in the originalmodel [23]. The off rate ω0
3 represents the probability of a motor to detach from the trackwithout completing a unit step, and its value was estimated in ref. [9] by noting that in theabsence of an elastic load, the probability of such an event is 1-2 orders of magnitude smallerthan the complementary probability that the attached motor will execute the step. The constantα depends on the effective elastic spring constant of the basic actin unit (monomer) as well ason the magnitude of the forces that the motors typically apply on the track (see Eq. 5 inref. [9]). The best fit to the experimental data is achieved with α = 0.0018 [9], which gives aweak non-monotonic dependence of τrev on N . Here we set α = 0.002, which gives somewhatpoorer agreement with the experimental results but which highlights the differences betweenBadoual’s model [23] and the newly proposed model that takes the elasticity of the actin trackinto account. As noted above, the consideration of the elastic properties of the actin and thecooperative nature of the action of the working motors considerably improves the results of theoriginal model by replacing the very strong exponential dependence of τrev on N with a muchweaker non-monotonic dependence.
To simulate conditions corresponding to dynamics on a-polar tracks, we randomly chose thedirection of random force (the force representing the local polarity of the track, see horizontal
5
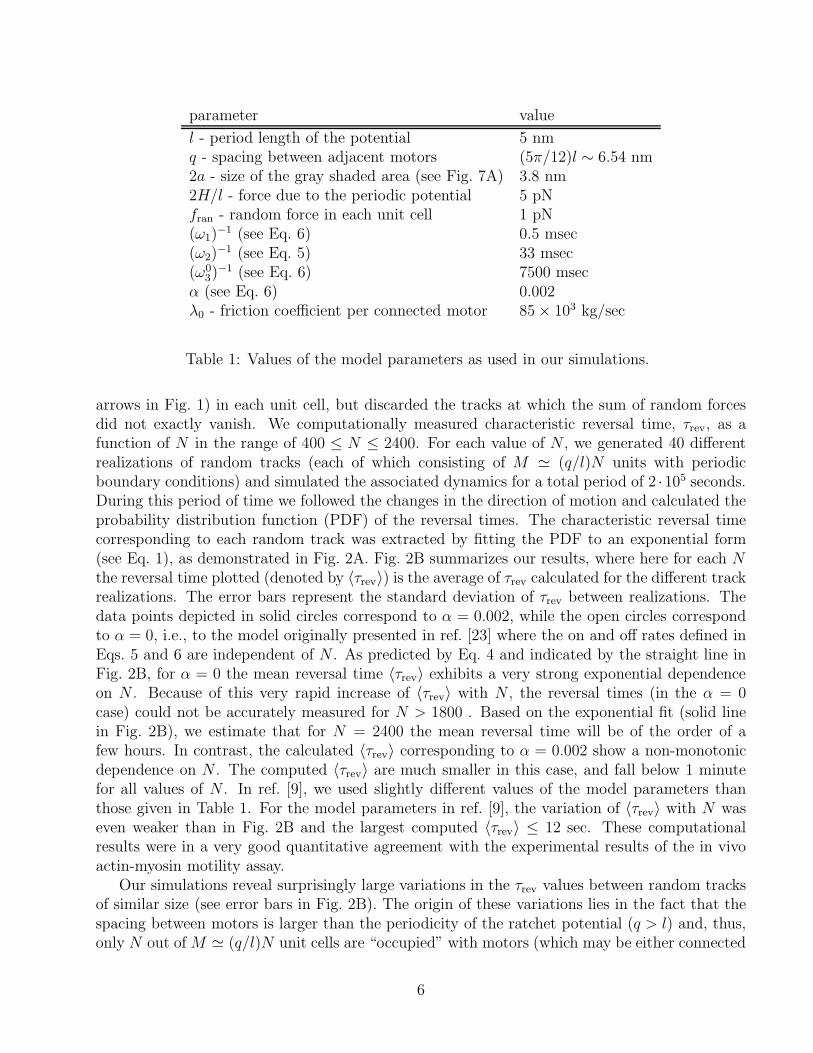
parameter value
l - period length of the potential 5 nmq - spacing between adjacent motors (5π/12)l ∼ 6.54 nm2a - size of the gray shaded area (see Fig. 7A) 3.8 nm2H/l - force due to the periodic potential 5 pNfran - random force in each unit cell 1 pN(ω1)
−1 (see Eq. 6) 0.5 msec(ω2)
−1 (see Eq. 5) 33 msec(ω0
3)−1 (see Eq. 6) 7500 msec
α (see Eq. 6) 0.002λ0 - friction coefficient per connected motor 85 × 103 kg/sec
Table 1: Values of the model parameters as used in our simulations.
arrows in Fig. 1) in each unit cell, but discarded the tracks at which the sum of random forcesdid not exactly vanish. We computationally measured characteristic reversal time, τrev, as afunction of N in the range of 400 ≤ N ≤ 2400. For each value of N , we generated 40 differentrealizations of random tracks (each of which consisting of M ≃ (q/l)N units with periodicboundary conditions) and simulated the associated dynamics for a total period of 2 ·105 seconds.During this period of time we followed the changes in the direction of motion and calculated theprobability distribution function (PDF) of the reversal times. The characteristic reversal timecorresponding to each random track was extracted by fitting the PDF to an exponential form(see Eq. 1), as demonstrated in Fig. 2A. Fig. 2B summarizes our results, where here for each Nthe reversal time plotted (denoted by 〈τrev〉) is the average of τrev calculated for the different trackrealizations. The error bars represent the standard deviation of τrev between realizations. Thedata points depicted in solid circles correspond to α = 0.002, while the open circles correspondto α = 0, i.e., to the model originally presented in ref. [23] where the on and off rates defined inEqs. 5 and 6 are independent of N . As predicted by Eq. 4 and indicated by the straight line inFig. 2B, for α = 0 the mean reversal time 〈τrev〉 exhibits a very strong exponential dependenceon N . Because of this very rapid increase of 〈τrev〉 with N , the reversal times (in the α = 0case) could not be accurately measured for N > 1800 . Based on the exponential fit (solid linein Fig. 2B), we estimate that for N = 2400 the mean reversal time will be of the order of afew hours. In contrast, the calculated 〈τrev〉 corresponding to α = 0.002 show a non-monotonicdependence on N . The computed 〈τrev〉 are much smaller in this case, and fall below 1 minutefor all values of N . In ref. [9], we used slightly different values of the model parameters thanthose given in Table 1. For the model parameters in ref. [9], the variation of 〈τrev〉 with N waseven weaker than in Fig. 2B and the largest computed 〈τrev〉 ≤ 12 sec. These computationalresults were in a very good quantitative agreement with the experimental results of the in vivoactin-myosin motility assay.
Our simulations reveal surprisingly large variations in the τrev values between random tracksof similar size (see error bars in Fig. 2B). The origin of these variations lies in the fact that thespacing between motors is larger than the periodicity of the ratchet potential (q > l) and, thus,only N out of M ≃ (q/l)N unit cells are “occupied” with motors (which may be either connected
6
or disconnected) at each instance. Thus, although the track is perfectly a-polar and contains anequal number of cells with random forces pointing in both directions, the subset of occupied cellsmay have net polarity which constantly changes with time as the motors move collectively alongthe track. The direction of the net polarity of the occupied cells is also the instantaneous preferreddirection of motion. Therefore, the temporal variations in the net polarity must be correlatedwith the changes in the directionality of the motion. We thus expect tracks on which the netpolarity changes more frequently to have smaller τrev. The effect of net polarity fluctuationsdoes not occur when the motion takes place on periodic a-polar tracks, because in this case theequally spaced motors occupy equal number of cells with left- and right-pointing random forces.Therefore, the reversal times on periodic a-polar tracks are expected to be (i) independent ofthe periodicity of the track, and (ii) larger than the reversal time on random a-polar tracks.These predictions are fully corroborated by the results from simulations with two very distinctperiodic tracks - one with period 2 (i.e., where the local random force changes its sign everyunit cell) and one with period M (i.e., when the track is divided into two equal domains ofopposite polarities). The results from these two sets of simulations are denoted by triangles inFig. 2B. The reversal times of both periodic tracks are nearly indistinguishable from each other(the differences between them are smaller than the size of the symbols) and are larger than thereversal times measured for all the random tracks of similar size.
What happens when the simulated track is not perfectly a-polar and the number unit cellsin which the random force is pointing in one direction is slightly larger than in the oppositedirection? Obviously, the nature of motion is expected to gradually change from bidirectionalto unidirectional. In order to investigate this transition between two types of dynamics, wesimulated the dynamics of motors on tracks in which the fraction of random forces pointing inone direction, pl, is slightly larger than 0.5. In the simulations, we fixed the number of motors toN = 1000 and varied the difference D = pl − (1− pl) = 2pl − 1 between the fractions of randomforces pointing in the favored and disfavored directions. For each track, the simulation datawas analyzed in a manner similar to that described above for a-polar tracks, i.e., by fitting thePDF of time intervals of unidirectional motion to an exponential function. There is one notabledifference, however, between the analysis of the results for a-polar and for slightly polar tracks.In the latter case, two PDFs, one corresponding for each direction of motion, must be generatedwith different characteristic reversal times. The motion in the preferred direction is characterizedby the larger reversal time, τrev−l, which increases with D. Conversely, the smaller reversal time,τrev−s, corresponding to the motion in the opposite unpreferred direction decreases with D. Theseobservations are summarized in Figs. 3 and 4. In Fig. 3, the PDFs corresponding to tracks withD values varying from 0 to 0.05 are shown. In the a-polar case D = 0, the two PDFs coincidewith each others, and the velocity histogram (see inset) is bimodal. As D increases, the twoPDFs become increasingly different - the one corresponding to the preferred direction of motionbecomes flatter (due to the increase in τrev−l), while the other one gets more peaked at the origin(as a result of the decrease in τrev−s ). The fact that the motors spend larger time intervalsmoving in one direction is also reflected in the corresponding velocity histograms which becomeless and less symmetric. The results presented in Fig.3 are obtained from simulations of sixdifferent track realizations, one for each different value of D. The mean reversal times, 〈τrev−l〉and 〈τrev−s〉, obtained by averaging the reversal times computed for 8 track realizations for eachvalue of D, are shown in Fig. 4. For D = 0.05, 〈τrev−l〉 ∼ 10〈τrev−s〉. For even larger values of D,
7
the dynamics are essentially unidirectional, as intervals of motion in the unpreferred directionbecome very rare and short. We, thus, conclude that bidirectional motion can be observed onlyon a-polar or slightly polar tracks. This conclusion is directly related to the cooperativity of themotors which causes persistent motion that cannot be easily reversed.
3 Analytical treatment
In the following section we use mean field master equations to analyze the bidirectional motionexhibited by our computational model. The mean field approach corresponds to the limit N ≫ 1where one can introduce the probability densities patt(x) and pdet(x) of finding a motor in theattached or detached state, respectively, at position −l/2 < x ≤ l/2 within the unit cell of theperiodic potential. These probability densities are the steady-state solutions of the following setof coupled master equations which govern the transitions between the two connectivity states:
{
∂tpatt(x, t) + v∂xpatt(x, t) = −ωoff(x)patt(x, t) + ωon(x)pdet(x, t)∂tpdet(x, t) + v∂xpdet(x, t) = −ωon(x)pdet(x, t) + ωoff(x)patt(x, t).
(7)
In Eq. 7, ωon(x) and ωoff(x) denote the space-dependent on and off rates, and v is the groupvelocity of the motors. Because the spacing between the motors is incommensurate with theperiodicity of the potential, the total spatial distribution is uniform in x for N ≫ 1:
patt(x, t) + pdet(x, t) =1
l. (8)
Using Eq. 8, together with Eqs. 5 and 6 to define the on and off rates in Eq. 7, the followingsteady-state equation (∂tp = 0) can be derived for patt(x):
lvdpatt(x)
dx=
{
−lω1patt(x) for |x| ≤ aω2 − l (ω2 + ω0
3 exp (αN)) patt(x) for a < |x| ≤ l/2.(9)
Eq 9 should be solved subject to the boundary condition that patt(−l/2) = patt(l/2) and therequirement that patt(x) is continuous anywhere in the interval −l/2 ≤ x ≤ l/2, including atx = ±a. Several solutions are plotted in Fig. 5 for 2a = 0.76l (see Table 1), ω0
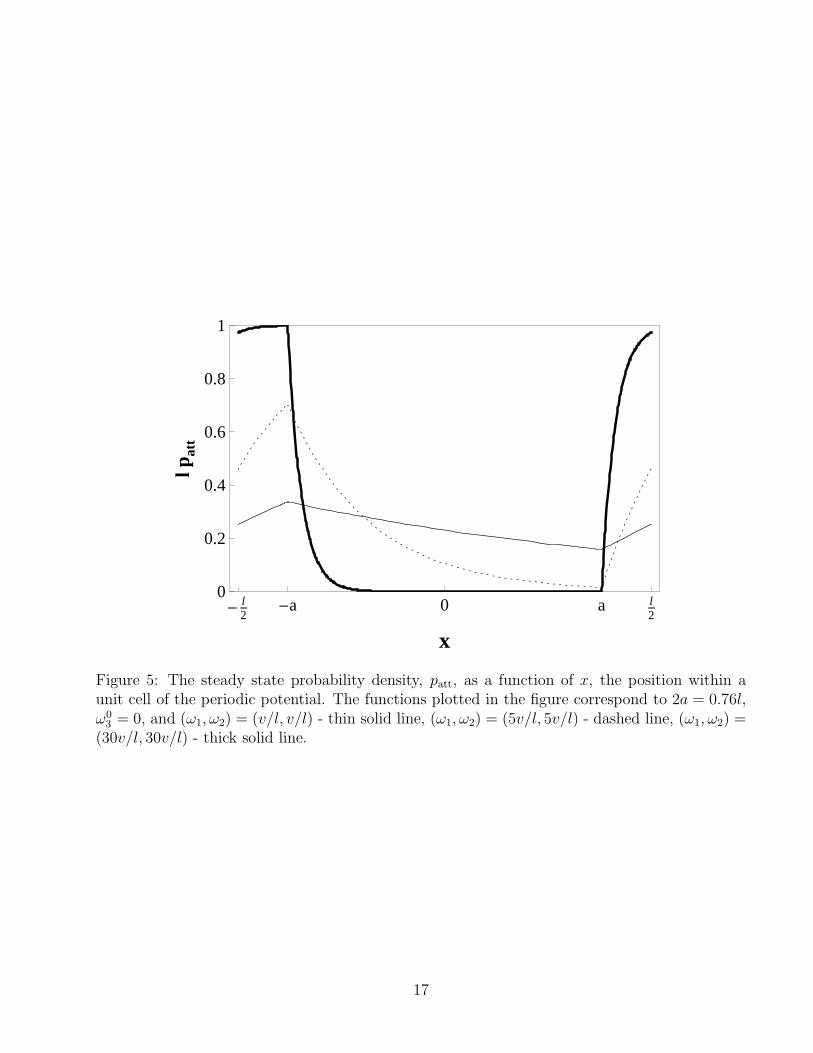
3 = 0, and(ω1, ω2) = (v/l, v/l) (thin solid line), (5v/l, 5v/l) (dashed line), and (30v/l, 30v/l) (thick solidline). The solutions correspond to the case when the motors move to the right (v > 0) and,therefore, it is easy to understand why patt reaches its maximum at x = −a [just before themotors enter, from the left, into the central gray-shaded detachment interval (−a < x < a)]and its minimum at x = a [just before leaving the central detachment interval through the rightside]. We also notice that when the off rate ω1 ≫ v/l, patt drops very rapidly (exponentially)to near zero in the detachment interval. When the attachment rates ω2 ≫ v/l, patt increasesexponentially fast for x > a and rapidly reaches the maximum possible value patt = 1/l. Thesecond steady state solution corresponding to the case when the motors move to the left (v < 0)is simply a mirror reflection of the first solution with respect to x = 0.
The mean fraction of connected motors, P , can be obtained by integrating the function patt(x)over the interval −l/2 ≤ x ≤ l/2
P =
∫ l/2
−l/2
patt(x) dx. (10)
8
The population of connected motors can be divided into two groups: The connected motorswhich are located left to the minimum of the periodic potential (−l/2 < x < 0) experienceforces pushing them to the right, i.e., forces directed in their direction of motion. Conversely,attached motors which are located right to the minimum experience forces directed opposite totheir direction of motion. Thus, the bias parameter ∆, previously defined as the excess meanfraction of motors supporting the motion, can be related to patt by
∆ =
∫ 0
−l/2
patt(x) dx −∫ l/2
0
patt(x) dx. (11)
In order to derive an expression for the reversal time of the dynamics, we now consider thefluctuations of the instantaneous bias parameter, ∆(t), around the mean value ∆. The motorsmay switch their direction of motion when ∆(t) = 0, i.e., when the motion momentarily stops.The occurrence probability of such an event can be related to the mean reversal by:
τrev ∼ [Π (∆ (t) = 0)]−1 . (12)
To estimate Π (∆ (t) = 0) we proceed by noting that the probability of finding a motor attachedleft to the minimum of the potential, i.e. a motor experiencing a force directed in the direction ofmotion, is P+ = (P+∆)/2. The probability that a motor is experiencing a force directed oppositeto the direction of motion is P− = (P − ∆)/2. The probability of having N+ and N− ≤ N+
motors which, respectively, support and object to the motion can thus be approximated by thetrinomial distribution function
π(N+, N−) =N !
N+!N−!(N − N+ − N−)!
(
P + ∆
2
)N+(
P − ∆
2
)N−
(1 − P )(N−N+−N−
). (13)
The instantaneous bias is given by ∆(t) = (N+ −N−)/N , and the probability that ∆(t) = 0 canbe expressed as sum over the relevant terms in Eq. 13 for which N− = N+
Π(∆(t) = 0) =
N/2∑
i=0
π(i, i) =
N/2∑
i=0
N !
(i!)2(N − 2i)!
(
P 2 − ∆2
4
)i
(1 − P )(N−2i). (14)
Replacing the sum in Eq. 14 by an integral, using Sterling’s approximation for factorials, expand-ing the logarithm of the integrand in a Taylor series (up so second order) around the maximumwhich is at imax = (N/2)
√P 2 − ∆2/(1−P +
√P 2 − ∆2) and then exponentiating the expansion,
and finally extending the limits of integration to ±∞ (which has a negligible effect on the resultfor N ≫ 1) - leads to:
Π(∆(t) = 0) =[
1 − P +√
P 2 − ∆2]N
×∫ +∞
−∞
dy exp
[
− 2
C(1 − C)N(y − imax)
2
]
, (15)
where C =√
P 2 − ∆2/(1 − P +√
P 2 − ∆2). This yields
τrev =2τ0
Π (∆ (t) = 0)= 2τ0
√
2
πC(1 − C)N
[
1 − P +√
P 2 − ∆2]−N
, (16)
9
where τ0 is some microscopic time scale. (The factor of 2 in the numerator in Eq. 16 is due tothe fact that once the motors stop, they have equal probability to move in both directions.) Asnoted before (see section 1), Eq. 16 predicts an almost exponential dependence of τrev on N onlyfor constant values of P and ∆, which was the case in ref. [23]. In the more general case, thedependence of τrev on N can be derived by calculating the values of P and ∆ as a function of Nand substituting these values into Eq. 16.
To test the validity and accuracy of the analytical expression for τrev, we take the followingsteps: (i) set the model parameters l, a, ω1, ω2, ω0
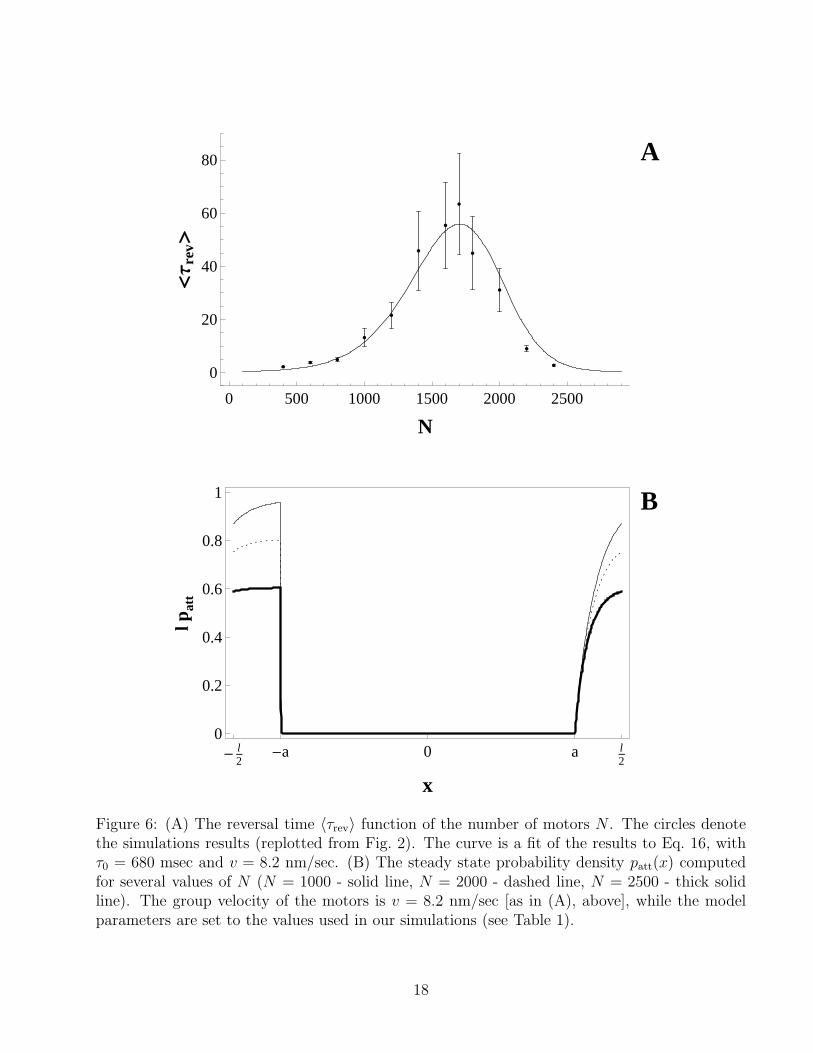
3, and α to the values used in our computersimulations which are given in Table 1, (ii) calculate the probability density patt corresponding tothese values (Eq. 9) and use Eqs. 10 and 11 to calculate P and ∆ over the range of N studied inthe simulations, (iii) substitute the values of P and ∆ into Eq. 16, to obtain τrev as a function ofN , (iv) fit the analytical expression for τrev(N) to the simulation results plotted in Fig. 2B. Thisprocedure involves two fitting parameters: the microscopic time scale τ0 appearing in Eq. 16,and the group velocity v appearing in the steady-state equation (Eq. 9). A seemingly reasonablechoice for the latter would be v = 20 nm/sec, which is where the velocity histogram of thebidirectional motion is peaked (see inset of Fig. 3A). However, the motors slow down beforeeach change in their direction of the motion; and because these changes in the directionality arefairly rare events, their occurrence probability is likely to be strongly influenced by the shortperiods of slow motion preceding them. Thus, it can be expected that the best fit of Eq. 16 tothe simulation results is achieved for v < 20 nm/sec. Indeed, for v = 8.2 nm/sec and τ0 = 680msec, we obtain the fitting curve shown in Fig. 6A, which is an excellent agreement with ourcomputational results for the reversal times (plotted in Fig. 2B and replotted here in Fig. 6A)over the whole range of values of N investigated (400 < N < 2400). The steady state probabilitydensity, patt(x), on the basis of which τrev was calculated is shown in Fig. 6B for several differentvalues of N (N = 1000 - solid line, N = 2000 - dashed line, N = 2500 - thick solid line). As canbe seen from the figure, the detachment rate ω1 in our simulations is so large that the centraldetachment interval of the unit cell (−a < x < a) is completely depleted of motors. IncreasingN leads to a decrease in the effective attachment rate around the potential maximum, whichreduces both the number of motors supporting (−l/2 < x < −a) and objecting (a < x < l/2)the motion and leads to the non-monotonic dependence of τ on N . The fitting value of τ0 = 680msec is very close to τ ∗ = l/v = 5 nm/(8 nm/sec) = 625 msec, which is the traveling time of themotors within a unit cell of the potential (once we set v = 8.2 nm/sec) and, therefore, is alsothe characteristic time scale at which the motors change their “states” (detached, connected andsupporting the motion, connected and objecting the motion). The remarkable agreement betweenthe analytical and simulation results for τrev should not, however, be allowed to obscure the factthat Eq. 16 is based on a mean field approximation which, in principle, is not suitable for thecalculating the probabilities of rare fluctuation events (such as velocity reversals in cooperativebidirectional movement). The agreement is achieved with effective velocity (v = 8.2 nm/sec)which is significantly smaller than the typical velocity measured in the simulations (v = 20nm/sec). Therefore, one should not expect the steady state probability density patt(x) plottedin Fig. 6B to perfectly match the simulations data.
10
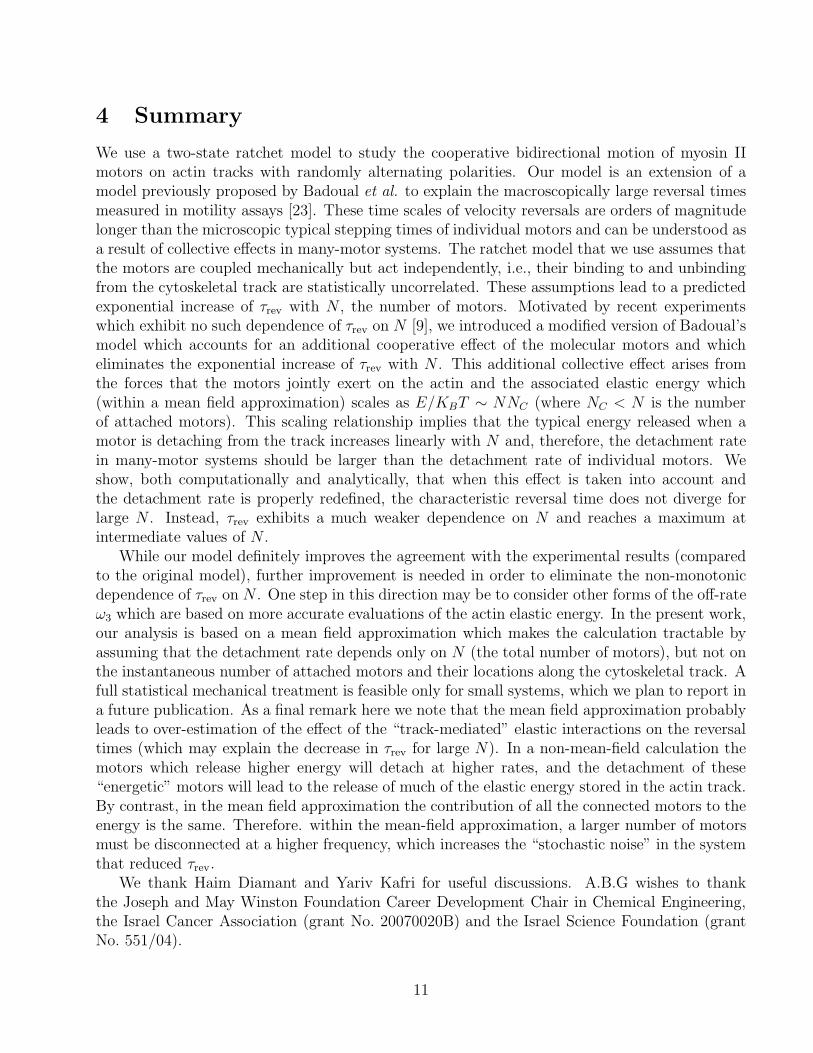
4 Summary
We use a two-state ratchet model to study the cooperative bidirectional motion of myosin IImotors on actin tracks with randomly alternating polarities. Our model is an extension of amodel previously proposed by Badoual et al. to explain the macroscopically large reversal timesmeasured in motility assays [23]. These time scales of velocity reversals are orders of magnitudelonger than the microscopic typical stepping times of individual motors and can be understood asa result of collective effects in many-motor systems. The ratchet model that we use assumes thatthe motors are coupled mechanically but act independently, i.e., their binding to and unbindingfrom the cytoskeletal track are statistically uncorrelated. These assumptions lead to a predictedexponential increase of τrev with N , the number of motors. Motivated by recent experimentswhich exhibit no such dependence of τrev on N [9], we introduced a modified version of Badoual’smodel which accounts for an additional cooperative effect of the molecular motors and whicheliminates the exponential increase of τrev with N . This additional collective effect arises fromthe forces that the motors jointly exert on the actin and the associated elastic energy which(within a mean field approximation) scales as E/KBT ∼ NNC (where NC < N is the numberof attached motors). This scaling relationship implies that the typical energy released when amotor is detaching from the track increases linearly with N and, therefore, the detachment ratein many-motor systems should be larger than the detachment rate of individual motors. Weshow, both computationally and analytically, that when this effect is taken into account andthe detachment rate is properly redefined, the characteristic reversal time does not diverge forlarge N . Instead, τrev exhibits a much weaker dependence on N and reaches a maximum atintermediate values of N .
While our model definitely improves the agreement with the experimental results (comparedto the original model), further improvement is needed in order to eliminate the non-monotonicdependence of τrev on N . One step in this direction may be to consider other forms of the off-rateω3 which are based on more accurate evaluations of the actin elastic energy. In the present work,our analysis is based on a mean field approximation which makes the calculation tractable byassuming that the detachment rate depends only on N (the total number of motors), but not onthe instantaneous number of attached motors and their locations along the cytoskeletal track. Afull statistical mechanical treatment is feasible only for small systems, which we plan to report ina future publication. As a final remark here we note that the mean field approximation probablyleads to over-estimation of the effect of the “track-mediated” elastic interactions on the reversaltimes (which may explain the decrease in τrev for large N). In a non-mean-field calculation themotors which release higher energy will detach at higher rates, and the detachment of these“energetic” motors will lead to the release of much of the elastic energy stored in the actin track.By contrast, in the mean field approximation the contribution of all the connected motors to theenergy is the same. Therefore. within the mean-field approximation, a larger number of motorsmust be disconnected at a higher frequency, which increases the “stochastic noise” in the systemthat reduced τrev.
We thank Haim Diamant and Yariv Kafri for useful discussions. A.B.G wishes to thankthe Joseph and May Winston Foundation Career Development Chair in Chemical Engineering,the Israel Cancer Association (grant No. 20070020B) and the Israel Science Foundation (grantNo. 551/04).
11
References
[1] R. Vale, Cell 112, 467 (2003).
[2] M. A. Geeves and K. C. Holmes, Annu. Rev. Biochem. 68, 687 (1999).
[3] B. Feierbach and F. Chang, Curr. Opin. Microbiol. 4, 713 (2001).
[4] K. E. Machine and J. W. S. Pringle, Proc. R Soc. Lond. B Biol. Sci.151, 204 (1959).
[5] S. Camalet and F. Julicher New J. Phys., 2, 1 (2000).
[6] C. J. Brokaw, Proc. Natl. Acad. Sci. USA 72, 3102 (1975).
[7] G. Koster, M. VanDuijn, B. Hofs and M. Dogterom, Proc. Natl. Acad. Sci. USA 100, 15583(2003).
[8] C. Leduc, O. Campas, K. B. Zeldovic, A. Roux, P. Jolimaitre, L. Bourel-Bonnet, B. Goud,J.-F. Joanny, P. Bassereau and J. Prost, Proc. Natl. Acad. Sci. USA 101, 17096 (2004).
[9] B. Gilboa, D. Gillo, O. Farago and A. Bernheim-Groswasser, Soft Matter 5, 2223 (2009).
[10] S. A. Endow and H. Higuchi, Nature 406, 913 (2000).
[11] L. Tao, A. Mogliner, G. Civelekoglu-Scholey, R. Wollman, J. Evans, H. Stahlberg and J. M.Scholey, Curr. Bio. 16, 2293 (2006).
[12] D. Riveline, A. Ott, F. J??icher, D. A. Winklemann, O. Cardoso, J. J. Lacap??e, S.Magnusdottir, J. L. Viovy, L. Gorre-Talini and J. Prost, Eur. Biophys. J. 27, 403 (1998).
[13] S. P. Gross, M. Carolina Tuma, S. W. Deacon, A. S. Serpinskaya, A. R. Reilein and V. L.Gelfand, J. Cell Biol. 156, 855 (2002).
[14] D. Chowdhury, Phys.ScriptaT106, 13 (2003).
[15] A. Parmeggiani, T. Franosch and E. Frey, Phys. Rev. Lett. 90, 086601 (2003).
[16] O. Campas, Y. Kafri, K. B. Zeldovich, J. Casademunt and J.-F. Joanny, Phys. Rev. Lett.
97, 038101 (2006).
[17] S. Muhuri and I. Pagonabarraga, Europhys. Lett. 84, 58009 (2008).
[18] D. Chowdhury, A. Garai and J. S. Wang, Phys. Rev. E 77, 050902(R) (2008).
[19] D. G. Lichtenthaler and C. Goldman, preprint cond-mat:0803.2732 (2008).
[20] M. Ebbinghaus, L. Santen, preprint cond-mat:0901.0183 (2009).
[21] F. Julicher and J. Prost, Phys. Rev. Lett. 75, 2618 (1995).
[22] F. Julicher and J. Prost, Phys. Rev. Lett. 78, 4510 (1997).
12
[23] M. Badoual, F. Julicher and J. Prost, Proc. Natl. Acad. Sci. USA 99, 6696 (2002).
[24] R. M. da Silva, C. C. de Souza Silva and S. Coutinho, Phys. Rev. E 78, 061131 (2008).
[25] S. Klumpp and R. Lipowsky, Proc. Natl. Acad. Sci. USA 102, 17284 (2005).
[26] M. J. I. Muller, S. Klumpp and R. Lipowsky, Proc. Natl. Acad. Sci. USA 105, 4609 (2008).
[27] Y. Zhang, preprint cond-mat:0901.0350 (2009).
[28] D. Hexner and Y. Kafri, preprint cond-mat:0903.0312 (2009).
[29] D. A. Smith and M. A. Geeves, Biophys. J. 69, 524- (1995).
[30] T. A. J Duke, Proc. Natl. Acad. Sci. USA 96, 2770 (1999).
[31] G. Lan and S. X. Sun, Biophys. J. 88, 4107 (2005).
[32] R. E. L De Ville and E. Venden-Eijnden, Bull. Math. Bio. 70, 484 (2008).
13
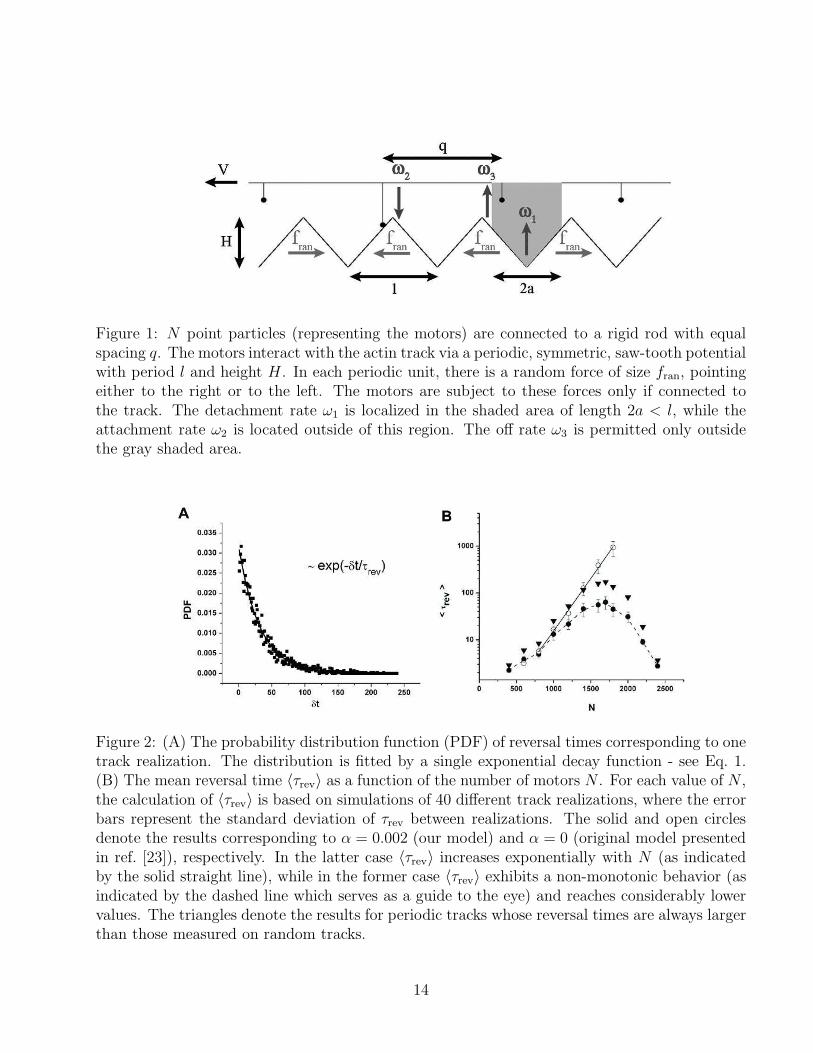
Figure 1: N point particles (representing the motors) are connected to a rigid rod with equalspacing q. The motors interact with the actin track via a periodic, symmetric, saw-tooth potentialwith period l and height H . In each periodic unit, there is a random force of size fran, pointingeither to the right or to the left. The motors are subject to these forces only if connected tothe track. The detachment rate ω1 is localized in the shaded area of length 2a < l, while theattachment rate ω2 is located outside of this region. The off rate ω3 is permitted only outsidethe gray shaded area.
Figure 2: (A) The probability distribution function (PDF) of reversal times corresponding to onetrack realization. The distribution is fitted by a single exponential decay function - see Eq. 1.(B) The mean reversal time 〈τrev〉 as a function of the number of motors N . For each value of N ,the calculation of 〈τrev〉 is based on simulations of 40 different track realizations, where the errorbars represent the standard deviation of τrev between realizations. The solid and open circlesdenote the results corresponding to α = 0.002 (our model) and α = 0 (original model presentedin ref. [23]), respectively. In the latter case 〈τrev〉 increases exponentially with N (as indicatedby the solid straight line), while in the former case 〈τrev〉 exhibits a non-monotonic behavior (asindicated by the dashed line which serves as a guide to the eye) and reaches considerably lowervalues. The triangles denote the results for periodic tracks whose reversal times are always largerthan those measured on random tracks.
14
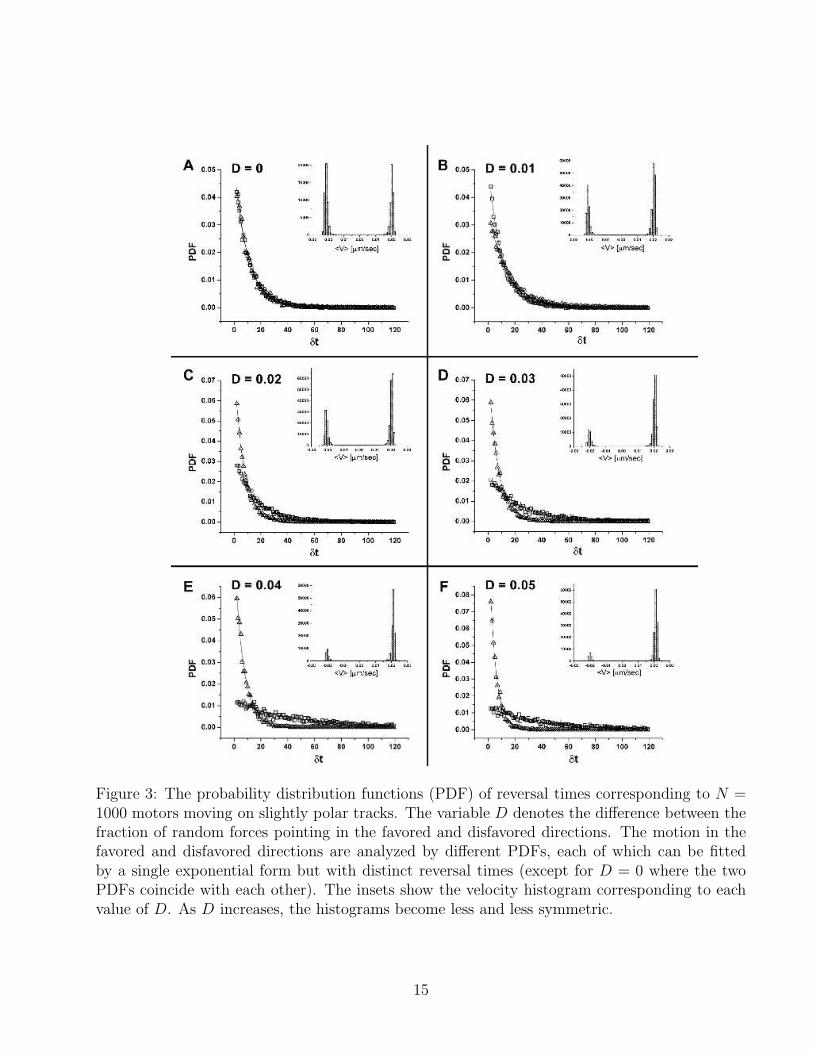
Figure 3: The probability distribution functions (PDF) of reversal times corresponding to N =1000 motors moving on slightly polar tracks. The variable D denotes the difference between thefraction of random forces pointing in the favored and disfavored directions. The motion in thefavored and disfavored directions are analyzed by different PDFs, each of which can be fittedby a single exponential form but with distinct reversal times (except for D = 0 where the twoPDFs coincide with each other). The insets show the velocity histogram corresponding to eachvalue of D. As D increases, the histograms become less and less symmetric.
15
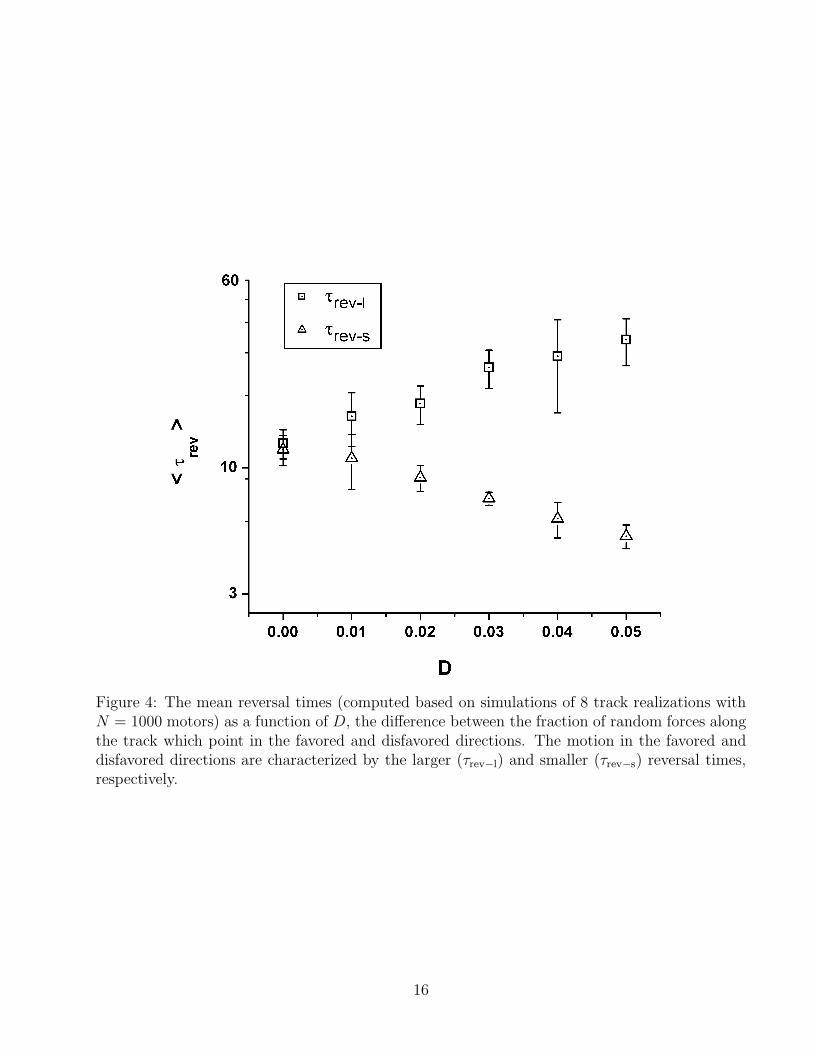
Figure 4: The mean reversal times (computed based on simulations of 8 track realizations withN = 1000 motors) as a function of D, the difference between the fraction of random forces alongthe track which point in the favored and disfavored directions. The motion in the favored anddisfavored directions are characterized by the larger (τrev−l) and smaller (τrev−s) reversal times,respectively.
16
-
l2
-a 0 a l2
0
0.2
0.4
0.6
0.8
1
x
lpat
t
Figure 5: The steady state probability density, patt, as a function of x, the position within aunit cell of the periodic potential. The functions plotted in the figure correspond to 2a = 0.76l,ω0
3 = 0, and (ω1, ω2) = (v/l, v/l) - thin solid line, (ω1, ω2) = (5v/l, 5v/l) - dashed line, (ω1, ω2) =(30v/l, 30v/l) - thick solid line.
17
0 500 1000 1500 2000 2500
0
20
40
60
80
N
<Τ
rev>
-
l2
-a 0 a l2
0
0.2
0.4
0.6
0.8
1
x
lpat
t
B
A
Figure 6: (A) The reversal time 〈τrev〉 function of the number of motors N . The circles denotethe simulations results (replotted from Fig. 2). The curve is a fit of the results to Eq. 16, withτ0 = 680 msec and v = 8.2 nm/sec. (B) The steady state probability density patt(x) computedfor several values of N (N = 1000 - solid line, N = 2000 - dashed line, N = 2500 - thick solidline). The group velocity of the motors is v = 8.2 nm/sec [as in (A), above], while the modelparameters are set to the values used in our simulations (see Table 1).
18