Conventional Arms Transfers to Developing Nations, 1991-1998
30
Conventional Arms Transfers to Developing Nations, 1991-1998 By Richard F. Grimmett Congressional Research Service The Library of Congress [The following are extracts from an unclassified report of conventional arms transfers to developing nations as published under the above title by the Library of Congress on July 31, 1999. Macro data on worldwide arms transfer agreements and deliveries are also included. The selections included herein begin with a discussion of major research findings regarding the dollar value of both arms transfer agreements and arms deliveries to the developing countries from 1991 through 1998. These findings are all cross-referenced to comparative data tables which are presented following the textual material. Special attention is given to the roles of the United States, the former Soviet Union, and China as arms suppliers, and to identification of the leading Third World arms recipient nations. The report concludes with a listing of the type and quantity of weapons delivered to developing nations by major arms suppliers in the 1991-1998 time period. Copies of the complete document are available from the Foreign Affairs and National Defense Division, Congressional Research Service, The Library of Congress, Washington DC 20540.] Introduction This report provides unclassified background data from U.S. government sources on transfers of conventional arms to developing nations by major suppliers for the period 1991 through 1998. It also includes some data on world-wide supplier transactions. It updates and revises the report entitled "Conventional Arms Transfers to Developing Nations, 1990-1997," published by the Congressional Research Service (CRS) on July 31,1998 (CRS Report 98-647F). The data in the report illustrate how global patterns of conventional arms transfers have changed in the post-Cold War and post-Persian Gulf War years. Relationships between arms suppliers and recipients continue to evolve in reaction to changing political, military, and economic circumstances. Despite global changes since the Cold War's end, the developing world continues to be the primary focus of foreign arms sales activity by conventional weapons suppliers. The developing nations category, as used in this report, includes all countries except the United States, Russia, European nations, Canada, Japan, Australia, and New Zealand. During the period of this report, 1991-1998, conventional arms transfers to developing nations have comprised 69.4% of the value of all international arms transfers. In 1998, arms transfer agreements, which represent orders for future delivery, with developing nations fell notably from 1997 totals, but still comprised 57.3% of the value of all such agreements globally. The portion of agreements with developing countries constituted 66.4% of all agreements globally from 1995- LEGISLATION AND POLICY The DISAM Journal, Fall 1999 15
-
Upload
khangminh22 -
Category
Documents
-
view
6 -
download
0
Transcript of Conventional Arms Transfers to Developing Nations, 1991-1998
Conventional Arms Transfers to DevelopingNations, 1991-1998
By
Richard F. GrimmettCongressional Research Service
The Library of Congress
[The following are extracts from an unclassified report of conventional arms transfers todeveloping nations as published under the above title by the Library of Congress on July 31,1999. Macro data on worldwide arms transfer agreements and deliveries are also included. Theselections included herein begin with a discussion of major research findings regarding the dollarvalue of both arms transfer agreements and arms deliveries to the developing countries from 1991through 1998. These findings are all cross-referenced to comparative data tables which arepresented following the textual material. Special attention is given to the roles of the UnitedStates, the former Soviet Union, and China as arms suppliers, and to identification of the leadingThird World arms recipient nations. The report concludes with a listing of the type and quantityof weapons delivered to developing nations by major arms suppliers in the 1991-1998 timeperiod. Copies of the complete document are available from the Foreign Affairs and NationalDefense Division, Congressional Research Service, The Library of Congress, Washington DC20540.]
Introduction
This report provides unclassified background data from U.S. government sources ontransfers of conventional arms to developing nations by major suppliers for the period 1991through 1998. It also includes some data on world-wide supplier transactions. It updates andrevises the report entitled "Conventional Arms Transfers to Developing Nations, 1990-1997,"published by the Congressional Research Service (CRS) on July 31,1998 (CRS Report 98-647F).
The data in the report illustrate how global patterns of conventional arms transfers havechanged in the post-Cold War and post-Persian Gulf War years. Relationships between armssuppliers and recipients continue to evolve in reaction to changing political, military, andeconomic circumstances. Despite global changes since the Cold War's end, the developing worldcontinues to be the primary focus of foreign arms sales activity by conventional weaponssuppliers. The developing nations category, as used in this report, includes all countries except theUnited States, Russia, European nations, Canada, Japan, Australia, and New Zealand. During theperiod of this report, 1991-1998, conventional arms transfers to developing nations havecomprised 69.4% of the value of all international arms transfers. In 1998, arms transferagreements, which represent orders for future delivery, with developing nations fell notably from1997 totals, but still comprised 57.3% of the value of all such agreements globally. The portionof agreements with developing countries constituted 66.4% of all agreements globally from 1995-
LEGISLATION AND POLICY
The DISAM Journal, Fall 199915

Report Documentation Page Form ApprovedOMB No. 0704-0188
Public reporting burden for the collection of information is estimated to average 1 hour per response, including the time for reviewing instructions, searching existing data sources, gathering andmaintaining the data needed, and completing and reviewing the collection of information. Send comments regarding this burden estimate or any other aspect of this collection of information,including suggestions for reducing this burden, to Washington Headquarters Services, Directorate for Information Operations and Reports, 1215 Jefferson Davis Highway, Suite 1204, ArlingtonVA 22202-4302. Respondents should be aware that notwithstanding any other provision of law, no person shall be subject to a penalty for failing to comply with a collection of information if itdoes not display a currently valid OMB control number.
1. REPORT DATE 1999 2. REPORT TYPE
3. DATES COVERED 00-00-1999 to 00-00-1999
4. TITLE AND SUBTITLE Conventional Arms Transfers to Developing Nations, 1991-1998
5a. CONTRACT NUMBER
5b. GRANT NUMBER
5c. PROGRAM ELEMENT NUMBER
6. AUTHOR(S) 5d. PROJECT NUMBER
5e. TASK NUMBER
5f. WORK UNIT NUMBER
7. PERFORMING ORGANIZATION NAME(S) AND ADDRESS(ES) Defense Institute of Security Assistance Management(DISAM),DISAM/DR,2475 K Street,Wright-Patterson AFB,OH,45433-7641
8. PERFORMING ORGANIZATIONREPORT NUMBER
9. SPONSORING/MONITORING AGENCY NAME(S) AND ADDRESS(ES) 10. SPONSOR/MONITOR’S ACRONYM(S)
11. SPONSOR/MONITOR’S REPORT NUMBER(S)
12. DISTRIBUTION/AVAILABILITY STATEMENT Approved for public release; distribution unlimited
13. SUPPLEMENTARY NOTES The DISAM Journal, Fall 1999, Volume 22, Issue 1, p.15-43
14. ABSTRACT
15. SUBJECT TERMS
16. SECURITY CLASSIFICATION OF: 17. LIMITATION OF ABSTRACT Same as
Report (SAR)
18. NUMBEROF PAGES
29
19a. NAME OFRESPONSIBLE PERSON
a. REPORT unclassified
b. ABSTRACT unclassified
c. THIS PAGE unclassified
Standard Form 298 (Rev. 8-98) Prescribed by ANSI Std Z39-18

1998. In the period from 1995-1998, deliveries of conventional arms to developing nationsrepresented 76.7% of the value of all international arms deliveries. In 1998, arms deliveries todeveloping nations constituted over 77.8% of the value of all such arms deliveries worldwide.
The data in this new report completely supersede all data published in previous editions.Since these new data for 1991-1998 reflect potentially significant updates to and revisions in theunderlying databases utilized for this report, only the data in the most recent edition should beused. The data are expressed in U.S. dollars for the calendar years indicated, and adjusted forinflation. U.S. commercially licensed arms exports are noted separately. Excluded are armstransfers by any supplier to subnational groups.
Calendar Year Data Used
All arms transfer and arms delivery data in this report are for the calendar year or calendaryear period given. This applies to both U.S. and foreign data alike. United States governmentdepartments and agencies publish data on U.S. arms transfers and deliveries but generally use theUnited States fiscal year as the computational time period for these data. (A U.S. fiscal yearcovers the period from October 1 through September 30). As a consequence, there are likely tobe distinct differences noted in those published totals using a fiscal year basis and those providedin this report which uses a calendar year basis for its figures. Details regarding data used areoutlined in footnotes at the bottom of Tables 1, 2, 8 and 9.
Constant 1998 Dollars
Throughout this report values of arms transfer agreements and values of arms deliveries forall suppliers are expressed in U.S. dollars. Values for any given year generally reflect theexchange rates that prevailed during that specific year. In many instances, the report convertsthese dollar amounts (current dollars) into constant 1998 dollars. Although this helps to eliminatethe distorting effects of U.S. inflation to permit a more accurate comparison of various dollarlevels over time, the effects of fluctuating exchange rates are not neutralized. The deflators usedfor the constant dollar calculations in this report are those provided by the Department of Defenseand are set out at the bottom of Tables 1, 2, 8 and 9. Unless otherwise noted in the report, all dollarvalues are stated in constant terms. Because all regional data tables are composed of four-yearaggregate dollar totals (1991-1994 and 1995-1998), they must be expressed in current dollarterms. Where tables rank leading arms suppliers to developing nations or leading developingnation recipients using four-year aggregate dollar totals, these values are expressed in currentdollars.
Major Findings
General Trends in Arms Transfers Worldwide
The value of all arms transfer agreements worldwide (to both developed and developingnations) in 1998 was nearly $23 billion. This is an increase in arms agreements values over 1997.This total, however, is substantially lower than most years since 1991 – the period overlappingthe end of the Cold War and the years of post-Persian Gulf war rearmament (Chart 1)(Table 8A).
In 1998, the United States led in arms transfer agreements worldwide, making agreementsvalued at $7.1 billion (30.8% of all such agreements), up from $5.7 billion in 1997. Germany
The DISAM Journal, Fall 1999 16

ranked second with $5.5 billion in agreements (23.9% of these agreements globally), upsignificantly from about $600 million in 1997. France ranked third, as its arms transferagreements worldwide dropped notably from $5 billion in 1997 to $3 billion in 1998. The UnitedStates, Germany, and France, collectively, made agreements in 1998 valued at $15.6 billion,67.8% of all international arms transfer agreements made by all suppliers (Tables 8A and 8B).
For the period 1995-1998, the total value of all international arms transfer agreements (about$100.3 billion) has been notably less than the worldwide value during 1991-1994 ($130.6 billion),a decline of 23.2%. As the worldwide arms transfer agreement totals have declined, so have thoseto the developing world. During the period 1991-1994, developing world nations accounted for71.7% of the value of all arms transfer agreements made worldwide. During 1995-1998developing world nations accounted for 66.4% of all arms transfer agreements made globally. In1998, developing nations accounted for 57.3% of all arms transfer agreements made worldwide(Table 8A).
In 1998, the United States ranked first in the value of all international arms deliveries,making $10.5 billion in such deliveries or 35.3%. This is the eighth year in a row that the UnitedStates has led in global arms deliveries, reflecting, in particular, implementation of arms transferagreements made during and in the aftermath of the Persian Gulf war. France ranked second inworldwide arms deliveries in 1998, making $6.5 billion in such deliveries. The United Kingdomranked third in 1998, making $5.3 billion in such deliveries. These top three suppliers of arms in
The DISAM Journal, Fall 199917
1991 1992 1993 1994 1995 1996 1997 19980
5
10
15
20
25
30
35
40
Bill
ion
s o
f co
nst
an
t 1
99
8 d
olla
rs
Developed World
Developing World
Chart 1
Arms Transfer Agreements Worldwide 1991-1998Developed and Developing Worlds Compared

1998 collectively delivered over $22.3 billion, 74.9% of all arms delivered worldwide by allsuppliers in that year.
The value of all international arms deliveries in 1998 was over $29.8 billion. This is a notabledecrease in the total value of arms deliveries from the previous year ($37.8 billion). The totalvalue of all such arms deliveries worldwide from 1995-1998 ($131.2 billion) was a notableincrease in the value of arms deliveries by all suppliers worldwide from 1991-1995 (about $120.4billion) (Tables 9A and 9B).
Developing world nations from 1995-1998 accounted for 76.7% of the value of allinternational arms deliveries. In the earlier period, 1991-1994, developing world nationsaccounted for 69.4% of the value of all arms deliveries worldwide. Most recently, in 1998,developing nations collectively accounted for 77.8% of the value of all international armsdeliveries (Tables 2A, 9A and 9B).
Competition for available arms sales continues to intensify among major weapons suppliers.The limited resources of most developing nations to expend on weapons and the need of manyselling nations to secure cash for their weapons continue to place constraints on significantexpansion of the arms trade. Developed nations are likely to continue to seek to protect importantelements of their own national military industrial bases and consequently, are likely to limit theirweapons purchases from one another. In these circumstances, those nations that have effectivelyrestructured and consolidated their defense industries seem most likely to be the key players inthe international arms marketplace emerging in the post-Cold War era. Some traditional armssupplying nations may feel compelled to engage in more joint production ventures to maintaintheir defense industries. A continuing trend is the effort by various weapons exporters to maintain
The DISAM Journal, Fall 1999 18
China2.0%
U.S.42.2%
Russia13.2% Major W. European*
32.8%
All Others9.8%
China3.6%U.S.
28.3%
Russia18.4%
Major W. European*31.2%
All Others18.5%
1991-1994 1995-1998
* (France, United Kingdom, Germany and Italy)
Chart 2Arms Transfer Agreements Worldwide
(Supplier Percentage of Value)

and expand arms sales to nations and regions where they have competitive advantages due toprior political/military ties to the prospective buyers. New arms sales opportunities may developwith some European nations in the new century due to the expansion of NATO, although, to date,marketing efforts have not resulted in major weapons sales to new NATO member states. The costof new weaponry and the limited financial resources of these new NATO members have beenimportant impediments to significant new purchases. Such nations, therefore, may focus in thenear term on upgrading their existing weapons systems in various ways that require fewer majorfinancial outlays.
It is possible that some significant arms sales may develop in the Near East, Asia and LatinAmerica, as individual countries attempt to replace older military equipment. However, much ofthe developing world has not recovered from recent major international financial problems. The1997-1998 fall in the price of crude oil, which has only recently abated, created great financialdifficulties for some Persian Gulf states. Saudi Arabia, in particular, has found itself in significantfinancial straits, given the various obligations it undertook during and after the 1990-1991 PersianGulf War, domestic spending priorities, and the magnitude of the costs associated with its armsprocurement program. Most recently, Saudi Arabia has even had problems meeting its monthlypayments to the United States for existing weapons contracts, a situation that would have notseemed possible in the 1980s and early 1990s. Although in 1999 the price of crude oil has risensignificantly, this fact does not necessarily mean that major oil producing nations in thedeveloping world, in particular Saudi Arabia, will soon launch new and expensive weaponspurchasing programs, given the debts they have accrued. Other Persian Gulf nations, mostnotably, the United Arab Emirates (U.A.E.), have made measured, but significant, purchases ofadvanced weapons systems. The sound financial situation of the U.A.E. has made it a key targetfor major arms suppliers, and has also given that nation significant leverage in bargaining overnew arms contracts in the current environment. The Asian financial crisis of 1997 led to a majorcurtailment of planned weapons purchases by several nations in that region. While the economicsituation in Asia appears to have stabilized somewhat, there does not yet appear to be a financialenvironment that would lead to resumption of most of the arms procurement plans that had beenunder way in several Asian nations when the financial crisis struck.
Despite interest by some Latin American states in modernizing older military equipment,domestic budget constraints have so far curtailed implementation of such plans. The lack ofsufficient national funds and/or the scarcity of financing credits has also led other developingnations to defer or curtail purchases of weapons. This general international economicenvironment suggests that, in the near term, major weapons purchases will be by the few moreaffluent developing countries, and that much of the remainder of the weapons trade will be basedon the upgrading and maintenance of existing weapons systems and related equipment.
General Trends in Arms Transfers to Developing Nations
The value of all arms transfer agreements with developing nations in 1998 was nearly $13.2billion. This was the lowest total, in real terms, since 1991. The total value of new arms transferagreements with developing nations has generally declined since 1993 (Table 1A). In 1998, thevalue of all arms deliveries to developing nations ($23.2 billion) was a substantial decrease fromthe value of 1997 deliveries values ($30.3 billion) (Table 2A).
Recently, from 1995-1998, the United States, Russia and France have dominated the armsmarket in the developing world, with the United States and Russia making nearly the same level
The DISAM Journal, Fall 199919

of arms transfer agreements. From 1995-1998, the United States made nearly $15.6 billion inarms transfer agreements with developing nations, 23.4% of all such agreements. Russia, thesecond leading supplier during this period, made nearly $15.6 billion in arms transfer agreementsor 23.4%. France, the third leading supplier, made $11.1 billion or 16.7% of all such agreementswith developing nations during these years. In the earlier period, (1991-1994) as the Cold Warwas ending, the United States ranked first with nearly $31 billion in arms transfer agreementswith developing nations or 33.1%, France made nearly $26.2 billion in agreements or about 28%.Russia made $15.2 billion in arms transfer agreements during this period or 16.2% (Table 1A).
Throughout the 1990s, most arms transfers to developing nations were made by two to threemajor suppliers in any given year. The United States has ranked either first or second among thesesuppliers every year from 1991-1998, with the sole exception of 1997. France has been the mostconsistent competitor for the lead in arms transfer agreements with developing nations, rankingfirst in 1992, 1994 and 1997. As competition over a shrinking international arms marketintensifies, France seems more likely to rank higher in arms deals with developing nations thanRussia, a supplying nation with seemingly more significant limitations in its prospective armsclient base than other major western suppliers. Major arms suppliers like the United Kingdom andGermany may from time to time conclude significant orders with developing countries. Yet itseems that, at the turn of the new century, the United States is best positioned to lead in new armsagreements with developing nations. At the same time it seems likely that very large weaponsorders from individual developing nations will be less frequent in the near term. As aconsequence, the overall level of the arms trade is likely to remain fairly static in the foreseeablefuture, not approaching the sales levels of the Cold War or Persian Gulf War periods.
Nations in the tier of suppliers below the United States, France, Russia, and the UnitedKingdom, such as Germany, China, other European, and non-European suppliers, have beensporadic participants in the arms trade with developing nations. Most of their annual arms transferagreements totals during 1991-1998 are at relatively low levels. Few of these countries are likelyto be major suppliers of advanced weaponry on a sustained basis. With some exceptions, most ofthem are much more likely to make sales of less sophisticated and less expensive militaryequipment (Tables 1A, IF, 1G, 2A, 2F and 2G).
United States
In 1998, the total value, in real terms, of U.S. arms transfer agreements with developingnations rose significantly to about $4.6 billion from $2.6 billion in 1997. The U.S. share of thevalue of all such agreements was 34.7% in 1998, a substantial increase from 15.7% in 1997(Tables 1A and 1B).
The increase in United States arms transfer agreements with developing nations in 1998 isprimarily attributable to a large number of less costly purchases by key U.S. clients in the NearEast. U.S. arms transfers to developing nations in 1998 reflect the continuation of establisheddefense support arrangements, including weapons systems upgrades, training and supportservices, and the purchase of air-to-air, air-to-ground, and anti-ship missile systems, helicopters,spare parts and ammunition. Among such items sold by the United States in 1998 to Saudi Arabiawere AIM-9L missile upgrades, 90mm weapons systems for armored vehicles, various supportservices to upgrade the capabilities of the Saudi Arabia National Guard (SANG), and the SaudiC3 system, among others. Egypt purchased CH-47D Chinook helicopters, support for co-production of M88A2 recovery vehicles, and AGM-84G Harpoon missiles. The Kuwait
The DISAM Journal, Fall 1999 20

government ordered 2 Paladin artillery battalions, and a Patriot air defense system. Israel orderedAGM-142D missiles, AIM-120B AMRAAM missiles, and Harpoon missiles. The United ArabEmirates ordered RGM-84G Harpoon missiles. In Asia, South Korea purchased MK-41 verticallaunch missiles systems and support, MLRS-ER rocket pods, MLRS spare parts, and F-16 aircraftmodification kits. Taiwan purchased Harpoon missiles and MK-46 torpedoes. Singapore orderedKC-135 tanker upgrades and support services. Although new arms sales involving major weaponssystems may develop for the United States as international economic conditions improve, in thenear term it appears likely that an important component of U.S. arms transfers will continue to beupgrades, spare parts, missiles, ammunition, and training related to major weapons systems theUnited States has previously provided to its clients.
Russia1
The total value of Russia's arms transfer agreements with developing nations fell from about$3.2 billion in 1997, to $1.4 billion in 1998, placing it fourth in such agreements with thedeveloping world. Russia's share of all developing world arms transfer agreements decreased aswell, falling from 18.9% in 1997 to 10.6% in 1998 (Tables 1A, 1B and 1G).
Russia's arms transfer agreements totals with developing nations declined every year from1995 until 1998, although during this four-year period it actually ranked second among all majorsuppliers to developing countries, making $15 billion in agreements. Its arms agreements valuesranged from a high of $8.3 billion in 1991 to a low of $1.3 billion in 1993 (in constant 1998dollars). This decline in arms sales reflects the continuing effect of the economic and politicalproblems of the former Soviet Union as the Cold War drew to a close. Many of Russia's traditionalarms clients have been less wealthy developing nations that were once provided generous grantmilitary assistance and deep discounts on arms purchases. The breakup of the Soviet Union at theend of 1991 terminated that practice. Russia now actively seeks to sell weapons as a means ofobtaining hard currency. Some of Russia's former arms clients in the developing world continueto express interest in obtaining additional weaponry from it but have been restricted in this effortby a lack of funds to pay for these armaments.
Russia has confronted significant difficulties in making lucrative new sales of conventionalweapons because most potential cash-paying arms purchasers have been longstanding customersof the United States or major West European suppliers. These prospective arms buyers are notlikely to replace their weapons inventories with unfamiliar non-Western armaments when newerversions of existing equipment are readily available from traditional suppliers, even in an era ofheightened competition. The difficult transition Russia has been making from the state supportedand controlled industrial model of the former Soviet Union has also led some prospective armscustomers to question whether Russian defense companies can be reliable suppliers of the spareparts and support services needed to maintain weapons systems they sell.
But because Russia has had a wide range of armaments to sell, from the most basic to thehighly sophisticated, and despite the internal problems evident in the Russian defense industrial
The DISAM Journal, Fall 199921
1Russia is used throughout the text, tables and charts, although data for all years prior to 1992 represent transactionsof the former Soviet Union as a whole. Russia was by far the principal arms producer and exporter of all the formerSoviet republics, and the political center for decision-making by the former Soviet Union. Data for 1992-1998 arefor Russia exclusively.

sector, various developing countries view Russia as a potential source of their military equipment.Accordingly, Russia has made strong efforts to gain arms agreements with developing nations thatcan pay cash for their purchases, and the figures from 1994 through 1997 suggest Russia has hadsome success in doing so. During this period, Russia also made small arms deals with Kuwait andthe United Arab Emirates for armored fighting vehicles and with Malaysia for MiG-29 fighteraircraft. Iran, primarily due to its own economic problems, as well as U.S. pressure on Russia,recently has ceased to be a major purchaser of arms from the Russians. Before the Cold Warended, Iran was a primary purchaser of Russian armaments, receiving such items as MiG-29fighter aircraft, Su-24 fighter-bombers, T-72 tanks and Kilo class attack submarines. Syria, deeplyin debt to Russia for earlier large-scale arms purchases from the former Soviet Union, is seekingnewer Russian equipment but may not be able to afford it without financial assistance.
Since 1994, Russia's principal arms clients have been China and India. Among Russia's mostnotable arms deals during these years were the sale of 40 new Su-30MK fighter aircraft to India,a longstanding arms client. Russia's arms supplying relationship with China has also maturedsince 1994. By 1996, Russia had sold China at least 72 Su-27 fighter aircraft as well as four Kiloclass attack submarines. Subsequently, a licensing agreement was finalized between Russia andChina, permitting China to co-produce as many as 200 Su-27 aircraft. Russia also sold China twoSovremenny-class destroyers. Although there were no large new arms agreements with China orIndia in 1998, others may be in prospect as it appears that China, in particular, is a key componentin Russia's arms export calculus for the immediate future.
China
China emerged as an important arms supplier to developing nations in the 1980s, primarilydue to arms agreements made with both combatants in the Iran-Iraq war. In the period of thisreport, the value of China's arms transfer agreements with developing nations peaked in 1997 at$1.6 billion. From 1991 through 1998 the value of China's arms transfer agreements withdeveloping nations has averaged about $720 million annually. In 1998, the value of China's armstransfer agreements with developing nations was $500 million. China has become, more recently,a major purchaser of arms, primarily from Russia (Tables 1A).
Since the end of the Iran-Iraq war, few clients with financial resources have sought topurchase Chinese military equipment, much of which is less advanced and sophisticated thanweaponry available from Western suppliers and Russia. China does not appear likely to be a majorsupplier of conventional weapons in the international arms market in the foreseeable future.Reports have persisted in various publications that China has sold surface-to-surface missiles toa longstanding arms client, Pakistan. Iran and North Korea have also reportedly received Chinesemissile technology. Such reports raise important questions about China's expressed commitmentto the restrictions on missile transfers set out in the Missile Technology Control Regime (MTCR).With a need for hard currency and products (missiles) that some developing nations would like toobtain, China may pose an important problem for those seeking to stem proliferation of advancedmissile systems into volatile areas of the developing world.
Major West European Countries
The four major West European suppliers (France, United Kingdom, Germany, and Italy), asa group, registered a slight decrease in their collective share of all arms transfer agreements withdeveloping nations between 1997 and 1998. This group's share fell from 36.7% in 1997 to 35.7%
The DISAM Journal, Fall 1999 22

in 1998. The collective value of this group's arms transfer agreements with developing nations in1998 was $4.7 billion compared with a total of over $6.1 billion in 1997. Of these four, Francewas the principal supplier with $2.4 billion in agreements, a notable decline from $4.7 billion in1997. However, in 1994 and 1997, France did rank first among all suppliers to developingnations. The French agreements total in 1998 was primarily based on a contract for the sale to theUnited Arab Emirates of 30 Mirage 2000-9 fighter aircraft. The United Kingdom registered anotable decline in arms agreements from over $1 billion in 1997 to $200 million in 1998. Italyregistered a decline from $300 million in 1997 to $100 million in 1998. In 1997, Germany'sagreements with developing nations were about $100 million, but in 1998 they rose significantlyto $2 billion, based in part on a contract with Malaysia to build jointly the first six of 27 offshorepatrol vessels (Tables 1A and 1B).
As a group, the major West European suppliers held a 34.5% share of all arms transferagreements with developing nations during the period from 1991-1998. Since the end of the ColdWar, the major West European suppliers have generally maintained a notable share of armstransfer agreements. For the 1995-1998 period, they collectively held 28.6% of all arms transferagreements with developing nations (over $19 billion). Individual suppliers within the major WestEuropean group have had notable years for arms agreements, especially France in 1992, 1993,1994 and 1997 ($9.8 billion, $4.3 billion, $8.5 billion and $4.7 billion respectively). The UnitedKingdom also had large agreement years in 1993 ($2.6 billion) and 1996 ($2.1 billion) (inconstant 1998 dollars). For both nations, these totals have reflected the conclusion of a few largearms contracts with one or more major purchasers in a given year (Tables 1A and 1B ).
Major West European suppliers have had their competitive standing in weapons exportsenhanced by historically strong government marketing support for foreign arms sales. Becausethey can produce both advanced and basic air, ground, and naval weapons systems, the four majorWest European suppliers have proven capable of competing successfully with the United Statesand Russia for arms sales contracts with developing nations. Nonetheless, a declining globalmarketplace for conventional weapons may make it more difficult for individual West Europeansuppliers to secure large new weapons contracts with developing nations. Accordingly, some ofthese suppliers may decide not to compete for sales of some weapons categories, reducing oreliminating some categories they currently produce. Instead, they may seek joint productionventures with other key European weapons suppliers or purchasers in an effort to sustain keyelements of their respective defense industrial bases.
Regional Arms Transfer Agreements
In the Near East, the Persian Gulf War from August 1990-February 1991 played a major rolein stimulating high levels of arms transfer agreements with nations in that region. The war creatednew demands by key Near East nations such as Saudi Arabia, the United Arab Emirates, and othermembers of the Gulf Cooperation Council (GCC), for a variety of advanced weapons systems.These demands were not only a response to Iraq's aggression against Kuwait, but an effort toaddress concerns regarding perceived threats from a potentially hostile Iran. In Asia, effortsfocused on upgrading and modernizing defense forces in several countries have led to importantnew conventional weapons sales in that region. Russian has also developed a significant role asprincipal supplier of advanced conventional arms to China. Data on regional arms transferagreements from 1991-1998 continue to reflect the primacy of developing nations in the NearEast and Asian regions as consumers of conventional weaponry.
The DISAM Journal, Fall 199923

Near East
The Near East has generally been the largest arms market in the developing world. In 1991-1994 it accounted for 60.8% of the total value of all developing nations arms transfer agreements($50.5 billion in current dollars). During 1995-1998, the region accounted for 44.2% of all suchagreements ($28.6 billion in current dollars).
The United States has dominated arms transfer agreements with the Near East during the1991-1998 time period with 42.3% of their total value ($33.5 billion in current dollars). Francewas second during these years with 27.8% ($22 billion in current dollars). Recently, from 1995-1998, the United States accounted for 35.1% of arms agreements with this region (over $10billion in current dollars), while France accounted for 31.1% of the region's arms agreements($8.9 billion in current dollars), representing most of the arms transfer agreements by the majorWest European suppliers with the Near East.
Asia
Asia has generally been the second largest developing world arms market. In the earlierperiod (1991-1994), Asia accounted for 32.5% of the total value of all arms transfer agreementswith developing nations (nearly $27 billion in current dollars). During 1995-1998, the regionaccounted for 44.4% of all such agreements ($28.7 billion in current dollars), which wasfractionally higher than the 44.2% share ($28.6 billion) held by Near East region during thesesame four years.
In the earlier period (1991-1994), France ranked first in the value of arms transferagreements with Asia with over 35.9%. Russia ranked second with 25.2%. The major WestEuropean suppliers, as a group, made 48.5% of this region's agreements in 1991-1994. In the laterperiod (1995-1998), Russia ranked first in Asian agreements with 40% on the strength of majoraircraft sales to China and India. The United States ranked second with 15.8%. The major WestEuropean suppliers, as a group, made about 23.7% of this region's agreements in 1995-1998.
Leading Developing Nations Arms Purchasers
Saudi Arabia has been, by a clear margin, the leading developing world arms purchaser from1991-1998, making arms transfer agreements totaling $32.2 billion during these years (in currentdollars). In the 1991-1994 period, the value of its arms transfer agreements was high ($24.3billion). From 1995-1998, however, the total value of Saudi Arabia's arms transfer agreementsdropped significantly to $7.9 billion (in current dollars). This decline resulted from Saudi debtobligations stemming from the Persian Gulf War era, coupled with a significant fall in Saudirevenues caused by the notable decline in the market price of its oil. The total value of all armstransfer agreements with developing nations from 1991-1998 was about $147.8 billion (in currentdollars). Saudi Arabia alone was responsible for over 21.8% of all developing world arms transferagreements during these eight years. In the most recent period-1995-1998, Saudi Arabia aloneaccounted for 12.3% of all developing world arms transfer agreements ($7.9 billion out of $64.4billion in current dollars) (Table 1).
The values of the anns transfer agreements of the top ten developing world recipient nationsin both the 1991-1994 and 1995-1998 time periods accounted for the major portion of the totaldeveloping nations arms market. During 1991-1994 the top ten collectively accounted for 91.9%
The DISAM Journal, Fall 1999 24

of all developing world arms transfer agreements. During 1995-1998 the top ten collectivelyaccounted for 72.4% of all such agreements. Arms transfer agreements with the top tendeveloping world recipients, as a group, totaled $11.2 billion in 1998 or 85% of all arms transferagreements with developing nations in that year. This reflects the continued concentration ofmajor arms purchases in a few nations. (Tables 1 and 1I).
Saudi Arabia ranked first among all developing world recipients in the value of arms transferagreements in 1998, concluding $2.7 billion in such agreements. The United Arab Emirates(U.A.E.) ranked second in agreements in 1998 at $2.5 billion. Malaysia ranked third with $2.1billion in agreements.
Saudi Arabia was the leading recipient of arms deliveries among developing world recipientsin 1998, receiving $8.7 billion in such deliveries. Saudi Arabia alone received 37.5% of the totalvalue of all arms deliveries to developing nations in 1998. Taiwan ranked second in armsdeliveries in 1998 with $5 billion; Singapore ranked third with $1.6 billion (Table 2).
Arms deliveries to the top ten developing nation recipients, as a group, constituted $23billion, or 99.1 % of all arms deliveries to developing nations in 1998. Six of the top ten recipientswere in the Near East region (Table 2).
Weapon Types Recently Delivered to Near East Nations
Regional weapons delivery data reflect the diverse sources of supply of conventionalweaponry available to developing nations. Even though Russia, the United States and the fourmajor West European suppliers dominate in the delivery of the fourteen classes of weaponsexamined, it is also evident that the other European suppliers and some non-European suppliers,including China, are capable of being leading suppliers of selected types of conventionalarmaments to developing nations (Table 3).
Weapons deliveries to the Near East, the largest purchasing region in the developing world,reflect the substantial quantities and types delivered by both major and lesser suppliers. Thefollowing is an illustrative summary of weapons deliveries to this region for the period 1995-1998.
United States
• 817 tanks and self-propelled guns
• 69 artillery pieces
• 2,727 APCs and armored cars
• 13 minor surface combatants
• 126 supersonic combat aircraft
• 90 helicopters
• 1,284 surface-to-air missiles (SAMs)
• 287 anti-ship missiles
The DISAM Journal, Fall 199925
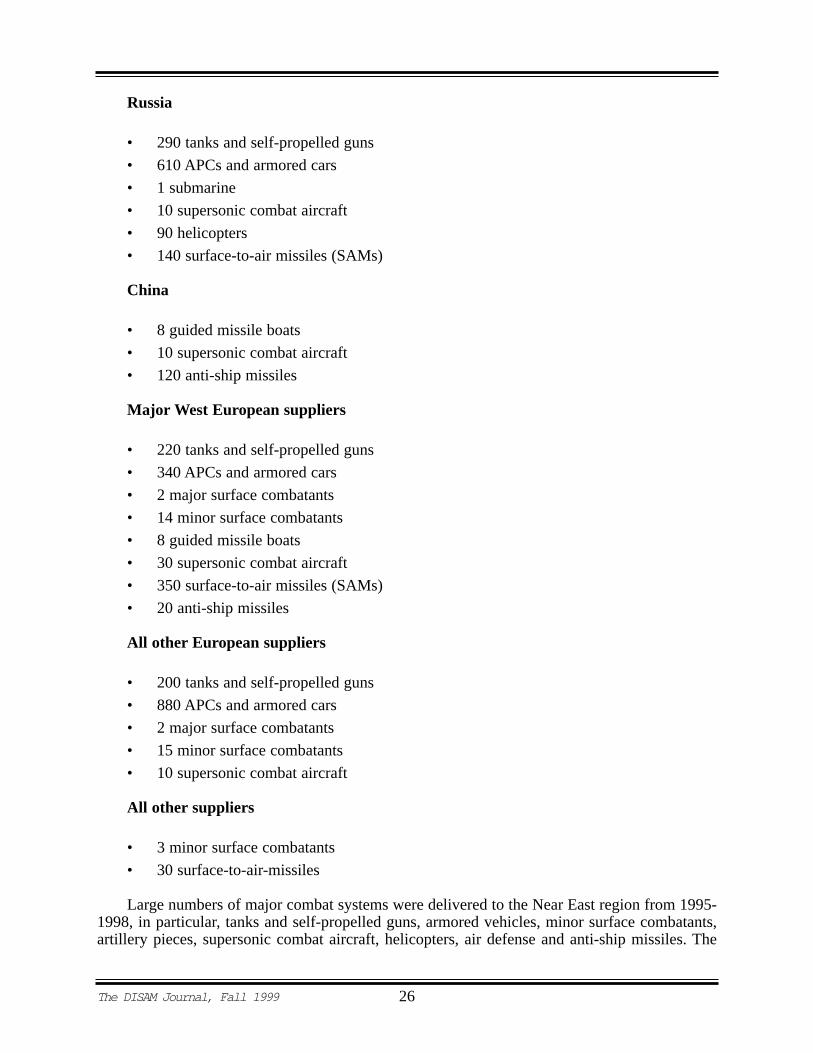
Russia
• 290 tanks and self-propelled guns
• 610 APCs and armored cars
• 1 submarine
• 10 supersonic combat aircraft
• 90 helicopters
• 140 surface-to-air missiles (SAMs)
China
• 8 guided missile boats
• 10 supersonic combat aircraft
• 120 anti-ship missiles
Major West European suppliers
• 220 tanks and self-propelled guns
• 340 APCs and armored cars
• 2 major surface combatants
• 14 minor surface combatants
• 8 guided missile boats
• 30 supersonic combat aircraft
• 350 surface-to-air missiles (SAMs)
• 20 anti-ship missiles
All other European suppliers
• 200 tanks and self-propelled guns
• 880 APCs and armored cars
• 2 major surface combatants
• 15 minor surface combatants
• 10 supersonic combat aircraft
All other suppliers
• 3 minor surface combatants
• 30 surface-to-air-missiles
Large numbers of major combat systems were delivered to the Near East region from 1995-1998, in particular, tanks and self-propelled guns, armored vehicles, minor surface combatants,artillery pieces, supersonic combat aircraft, helicopters, air defense and anti-ship missiles. The
The DISAM Journal, Fall 1999 26

United States made significant deliveries of supersonic combat aircraft to the region. Russia, theUnited States, and European suppliers generally were the principal suppliers of tanks and self-propelled guns. These two weapons categories-supersonic combat aircraft and tanks and selfpropelled guns-are especially costly and are an important part of the dollar values of armsdeliveries of Russia and the United States to the Near East region during the 1995-1998 period.The cost of naval combatants is generally high, and suppliers of such systems during this periodhad their deliveries values totals notably increased due to these transfers. Some of the lessexpensive weapons systems delivered to the Near East are deadly and can create importantsecurity threats within the region. In particular, from 1995-1998, the United States delivered 287anti-ship missiles; China delivered 120. China also delivered 8 guided missile boats, as did themajor West European suppliers collectively.
Table 1. Arms Transfer Agreements with Developing Nations, by Supplier, 1991-1998(in millions of current U.S. dollars)
TOTAL1991 1992 1993 1994 1995 1996 1997 1998 1991-1998
United States 6,927 2,183 12,761 5,795 2,867 5,153 2,569 4,569 42,824
U.S.S.R./Russia* 7,100 1,400 1,200 3,700 5,300 4,600 3,100 1,400 27,800
France 3,100 8,600 3,900 7,800 2,400 1,400 4,600 2,400 34,200
United Kingdom 300 1,800 2,300 700 600 2,000 1,000 200 8,900
China 600 500 500 700 200 800 1,600 500 5,400
Germany 1,500 200 1,000 0 300 0 100 2,000 5,100
Italy 100 500 300 200 800 300 300 100 2,600
All Other European 1,500 1,200 500 1,800 2,400 2,800 2,000 1,000 13,200
All Others 500 1,100 600 500 1,300 1,700 1,100 1,000 7,800
TOTAL 21,627 17,483 23,061 21,195 16,167 18,753 16,369 13,169 147,824
**Dollar inflationindex: (1998=1.00) 0.8604 0.8768 0.9021 0.9227 0.9407 0.9604 0.9801 1.0000
Source: U.S. Government. Note: Developing nations category excludes the U.S., former U.S.S.R., Europe, Canada, Japan,Australia and New Zealand. All data are for the calendar year given except for U.S. MAP (MilitaryAssistance Program) and IMET (International Military Education and Training) data which areincluded for the particular fiscal year. All amounts given include the values of weapons, spare parts,construction, all associated services, military assistance and training programs. Statistics forforeign countries are based upon estimated selling prices. U.S. commercial sales contract valuesare excluded. All foreign data are rounded to the nearest $100 million. *Prior to 1992 reflects data for the former Soviet Union.**Based on Department of Defense Price Deflator.
The DISAM Journal, Fall 199927

UNITED STATES COMMERCIAL ARMS EXPORTS
U.S. commercial sales and deliveries data are excluded from the main data tables.This is done because the data maintained on U.S. commercial sales agreementsand deliveries are incomplete, and not collected or revised on an on-going basis,making them significantly less precise than those for the U.S. Foreign MilitarySales (FMS) program, which account for the overwhelming portion of U.S.conventional arms transfer agreements and deliveries involving weapons systems.There are no official compilations of commercial agreement data comparable tothat for the FMS program maintained on an annual basis. Once an exporterreceives from the State Department a commercial license approval–valid for fouryears–there is no current requirement that the exporter provide the StateDepartment, on a systematic and on-going basis, with comprehensive detailsregarding any sales contract that may result from the license approval, including ifany such contract is reduced in scope or canceled. Annual commercial deliveriesdata are obtained from shipper's export documents and completed licensesreturned from ports of exit by the U.S. Customs Service to the Office of DefenseTrade Controls (PM/DTQ of the State Department, which makes the finalcompilation.) This approach to obtaining commercial deliveries data is also muchless systematic and much less timely than that taken by the Department of Defensefor government-to-government transactions.
The annual rank of the United States in deliveries to developing nations in theperiod from 1991-1998 has possibly been affected–in a couple of prior years–byexclusion of the existing data on U.S. commercial arms deliveries to those nations(see Table 2). Since the total values of all U.S. deliveries are understated byexclusion of commercial arms deliveries figures, those commercial data areprovided here to complete this element of the available record. It should be notedthat the U.S. is the only major arms supplier that has two distinct systems for theexport of weapons, the government-to-government (FMS) system and the licensedcommercial export system. The values of U.S. commercial arms deliveries todeveloping nations for fiscal years 1991-1998, in current dollars, according to theState Department, were as follows:
FY 1991 $1,644,000,000
FY 1992 $627,000,000
FY 1993 $701,000,000
FY 1994 $818,000,000
FY 1995 $908,000,000
FY 1996 $461,000,000
FY 1997 $276,000,000
FY 1998 $151,000,000
The DISAM Journal, Fall 1999 28

Table 1A. Arms Transfer Agreements with Developing Nations, by Supplier, 1991-1998(in millions of constant 1998 U.S. dollars)
TOTAL1991 1992 1993 1994 1995 1996 1997 1998 1991-1998
United States 8,051 2,490 14,146 6,280 3,048 5,365 2,621 4,569 46,570
U.S.S.R./Russia 8,252 1,597 1,330 4,010 5,634 4,790 3,163 1,400 30,176
France 3,603 9,808 4,323 8,453 2,551 1,458 4,693 2,400 37,289
United Kingdom 349 2,053 2,550 759 638 2,082 1,020 200 9,651
China 697 570 554 759 213 833 1,632 500 5,758
Germany 1,743 228 1,109 0 319 0 102 2,000 5,501
Italy 116 570 333 217 850 312 306 100 2,804
All Other European 1,743 1,369 554 1,951 2,551 2,915 2,041 1,000 14,124
All Others 581 1,255 665 542 1,382 1,770 1,122 1,000 8,317
TOTAL 25,135 19,940 25,564 22,971 17,186 19,525 16,700 13,169 160,190
Table 1B. Arms Transfer Agreements with Developing Nations, by Supplier, 1991-1998(expressed as a percent of total, by year)
1991 1992 1993 1994 1995 1996 1997 1998
United States 32.03% 12.49% 55.34% 27.34% 17.73% 27.48% 15.69% 34.70%
U.S.S.R./Russia 32.83% 8.01% 5.20% 17.46% 32.78% 24.53% 18.94% 10.63%
France 14.33% 49.19% 16.91% 36.80% 14.85% 7.47% 28.10% 18.22%
United Kingdom 1.39% 10.30% 9.97% 3.30% 3.71% 10.66% 6.11% 1.52%
China 2.77% 2.86% 2.17% 3.30% 1.24% 4.27% 9.77% 3.80%
Germany 6.94% 1.14% 4.34% 0.00% 1.86% 0.00% 0.61% 15.19%
Italy 0.46% 2.86% 1.30% 0.94% 4.95% 1.60% 1.83% 0.76%
All Other European 6.94% 6.86% 2.17% 8.49% 14.85% 14.93% 12.22% 7.59%
All Others 2.31% 6.29% 2.60% 2.36% 8.04% 9.07% 6.72% 7.59%
[ Major West European* 23.12% 63.49% 32.52% 41.05% 25.36% 19.73% 36.65% 35.69%]
TOTAL 100.00% 100.00% 100.00% 100.00% 100.00% 100.00% 100.00% 100.00%
*Major West European category includes France, United Kingdom, Germany, and Italy.
The DISAM Journal, Fall 199929

Table 1F. Arms Transfer Agreements with Developing Nations, 1991-1998: Leading Suppliers Compared (in millions of current U.S. dollars)
Rank Supplier Agreements Value 1991-1994
1 U.S. 27,6662 France 23,4003 U.S.S.R./Russia 13,4004 U.K. 5,1005 Germany 2,7006 China 2,3007 Italy 1,1008 Spain 9009 Netherlands 700
10 Israel 70011 Czech Republic 500
Rank Supplier Agreements Value 1995-1998
1 U.S. 15,1482 Russia 14,4003 France 10,8004 U.K. 3,8005 China 3,1006 Germany 2,4007 Israel 1,7008 Ukraine 1,6009 Italy 1,500
10 Belarus 1,50011 South Africa 1,200
Rank Supplier Agreements Value 1991-1998
1 U.S. 42,8142 France 34,2003 U.S.S.R./Russia 27,8004 U.K. 8,9005 China 5,4006 Germany 5,1007 Italy 2,6008 Israel 2,4009 Ukraine 1,700
10 Belarus 1,60011 South Africa 1,200
Source: U.S. Government. Note: All foreign data are rounded to the nearest $100 million. Where data totals are the same, the actual rank order is maintained.
The DISAM Journal, Fall 1999 30

Table 1G. Arms Transfer Agreements with Developing Nations in 1998:Leading Suppliers Compared
(in millions of current U.S. dollars)
AgreementsValue
Rank Supplier 1998
1 U.S. 4,5692 France 2,4003 Germany 2,0004 Russia 1,4005 Israel 5006 China 5007 Belarus 5008 U.K. 2009 Bulgaria 200
10 Italy 10011 Ukraine 100
Source: U.S. Government
Note: All foreign data are rounded to the nearest $100 million.Where data totals are the same, the actual rank order is maintained.
The DISAM Journal, Fall 199931

Table 1I. Arms Transfer Agreements of Developing Nations, 1991-1998 Agreements by the Leading Recipients
(in millions of current U.S. dollars)
Rank Recipient Agreements Value 1991-1994
1 Saudi Arabia 24,3002 Taiwan 15,8003 U.A.E. 7,6004 Kuwait 5,8005 South Korea 4,8006 Egypt 4,5007 Iran 4,3008 Israel 3,9009 China 3,100
10 Malaysia 2,500
Rank Recipient Agreements Value1995-1998
1 Saudi Arabia 7,9002 U.A.E. 7,3003 China 6,9004 India 6,3005 Egypt 5,0006 South Korea 3,6007 Malaysia 3,2008 Israel 2,9009 Kuwait 1,900
10 Indonesia 1,700
Rank Recipient Agreements Value1991-1998
1 Saudi Arabia 32,2002 Taiwan 15,8903 U.A.E. 15,0004 China 10,0005 Egypt 9,5006 South Korea 8,4007 Kuwait 7,7008 India 7,5009 Israel 6,800
10 Malaysia 5,700
Source: U.S. Government. Note: All foreign data are rounded to the nearest $100 million. Where data totals are the same, the rank order is maintained.
The DISAM Journal, Fall 1999 32

Table 2. Arms Deliveries to Developing Nations, by Supplier, 1991-1998(in millions of current U.S. dollars)
TOTAL1991 1992 1993 1994 1995 1996 1997 1998 1991-1998
United States 4,395 5,854 6,474 4,618 7,584 5,769 10,787 7,805 53,286U.S.S.R./Russia* 6,000 2,500 1,900 1,400 2,800 2,200 1,800 1,700 20,300France 1,500 1,100 800 2,000 3,000 2,900 5,600 6,200 23,100United Kingdom 3,900 5,400 3,800 4,700 4,900 5,800 5,800 4,800 39,100China 1,400 1,000 1,100 700 700 600 1,000 500 7,000Germany 1,200 200 600 800 800 400 100 500 4,600Italy 100 100 0 100 200 100 600 0 1,200All Other European 1,000 1,800 1,300 2,200 2,300 2,500 3,200 1,100 15,400All Others 1,000 1,100 1,100 1,100 1,100 1,100 800 600 7,900
TOTAL 20,495 19,054 17,074 17,618 23,384 21,369 29,687 23,205 171,886
Dollar inflationindex(1998=100.00)** 0.8604 0.8768 0.9021 0.9227 0.9407 0.9604 0.9801 1
Source: U.S. Government.
Note: Developing nations category excludes the U.S., Russia, former U.S.S.R., Europe, Canada,Japan, Australia and New Zealand. All data are for the calendar year given. All amounts giveninclude the values of weapons, spare parts, construction, all associated services, military assistanceand training programs. Statistics for foreign countries are based upon estimated selling prices. U.S.commercial sales delivery values are excluded. All foreign data are rounded to the nearest $100million.
*Prior to 1992 reflects data for the former Soviet Union.**Based on Department of Defense Price Deflator.
Table 2A. Arms Deliveries to Developing Nations, by Supplier, 1990-1997(in millions of constant 1998 dollars)
TOTAL1991 1992 1993 1994 1995 1996 1997 1998 1991-1998
United States 5,108 6,677 7,177 5,005 8,062 6,007 11,006 7,805 56,847U.S.S.R./Russia 6,974 2,851 2,106 1,517 2,977 2,291 1,837 1,700 22,253France 1,743 1,255 887 2,168 3,189 3,020 5,714 6,200 24,176United Kingdom 4,533 6,159 4,212 5,094 5,209 6,039 5,918 4,800 41,964China 1,627 1,141 1,219 759 744 625 1,020 500 7,635Germany 1,395 228 665 867 850 416 102 500 5,023Italy 116 114 0 108 213 104 612 0 1,267All Other European 1,162 2,053 1,441 2,384 2,445 2,603 3,265 1,100 16,453All Others 1,162 1,255 1,219 1,192 1,169 1,145 816 600 8,558
TOTAL 23,820 21,733 18,926 19,094 24,858 22,250 30,290 23,205 184,176
The DISAM Journal, Fall 199933

Table 2B. Arms Deliveries to Developing Nations, by Supplier, 1991-1998(expressed as a percent of total, by year)
1991 1992 1993 1994 1995 1996 1997 1998
United States 21.44% 30.72% 37.92% 26.21% 32.43% 27.00% 36.34% 33.63%U.S.S.R./Russia 29.28% 13.12% 11.13% 7.95% 11.97% 10.30% 6.06% 7.33%
France 7.32% 5.77% 4.69% 11.35% 12.83% 13.57% 18.86% 26.72%United Kingdom 19.03% 28.34% 22.26% 26.68% 20.95% 27.14% 19.54% 20.69%China 6.83% 5.25% 6.44% 3.97% 2.99% 2.81% 3.37% 2.15%
Germany 5.86% 1.05% 3.51% 4.54% 3.42% 1.87% 0.34% 2.15%Italy 0.49% 0.52% 0.00% 0.57% 0.86% 0.47% 2.02% 0.00%All Other European 4.88% 9.45% 7.61% 12.49% 9.84% 11.70% 10.78% 4.74%All Others 4.88% 5.77% 6.44% 6.24% 4.70% 5.15% 2.69% 2.59%
Major West 32.69% 35.69% 30.46% 43.14% 38.06% 43.05% 40.76% 49.56%European*
TOTAL 100.00% 100.00% 100.00% 100.00% 100.00% 100.00% 100.00% 100.00%
*Major West European category includes France, United Kingdom, Germany, Italy.
The DISAM Journal, Fall 1999 34

Table 2F. Arms Deliveries to Developing Nations, 1991-1998:Leading Suppliers Compared (in millions of current U.S. dollars)
Rank Supplier Deliveries Value 1991-1994
1 U.S. 21,3412 U.K. 17,8003 U.S.S.R./Russia. 11,8004 France 5,4005 China 4,2006 Germany 2,8007 Israel 1,9008 Sweden 1,5009 Canada 700
10 North Korea 60011 Spain 600
Rank Supplier Deliveries Value 1995-1998
1 U.S. 31,9452 U.K. 21,3003 France 17,7004 Russia 8,5005 China 2,8006 Sweden 2,2007 Germany 1,8008 Israel 1,5009 Ukraine 1,30010 Netherlands 1,00011 South Africa 900
Rank Supplier Deliveries Value 1991-1998
1 U.S. 53,2862 U.K. 39,1003 France 23,1004 U.S.S.R./Russia 20,3005 China 7,0006 Germany 4,6007 Sweden 3,7008 Israel 3,4009 Canada 1,500
10 South Africa 1,50011 Ukraine 1,300
Source: U.S. Government.
Note: All foreign data are rounded to the nearest $100 million. Where data totals are the same, the actual rank order is maintained.
The DISAM Journal, Fall 199935

Table 2G. Arms Deliveries to Developing Nations in 1998: Leading Suppliers Compared(in millions of current U.S. dollars)
Rank Supplier Deliveries Value1998
1 U.S. 7,8052 France 6,2003 United Kingdom 4,8004 Russia 1,7005 Germany 5006 China 5007 Ukraine 4008 Israel 2009 Bulgaria 200
10 Netherlands 20011 South Africa 100
Source: U.S. Government
Note: All foreign data are rounded to the nearest $100 million. Where data totals are the same, the actual rank order is maintained.
The DISAM Journal, Fall 1999 36

Table 3. Number of Weapons Delivered by Major Suppliersto Developing Nations
Weapons Category U.S. Russia China Major West All Other AllEuropean European Others
1991-1994
Tanks and Self-Propelled Guns 1429 1040 470 130 520 240Artillery 257 650 880 7760 1290 270APCs and Armored Cars 1334 1050 20 270 700 350Major Surface Combatants 0 2 4 28 5Minor Surface Combatants 34 14 16 68 23 47Guided Missile Boats 0 0 9 4 0 2Submarines 0 3 0 6 0 0Supersonic Combat Aircraft 224 80 90 20 10 170Subsonic Combat Aircraft 104 0 60 80 0 20Other Aircraft 87 50 90 80 170 100Helicopters 180 200 0 200 70 30Surface-to-Air Missiles 1467 1030 310 2230 490 330Surface-to-Surface Missiles 0 150 110 0 0 150Anti-Ship Missiles 87 60 90 40 0 0
1995-1998
Tanks and Self-Propelled Guns 1202 320 280 290 1000 50Artillery 178 40 180 160 150 180APCs and Armored Cars 2843 680 160 870 1260 70Major Surface Combatants 3 0 0 32 3 0Minor Surface Combatants 48 4 16 23 28 29Guided Missile Boats 0 0 14 1 '2 0 3Submarines 0 5 0 5 0 2Supersonic Combat Aircraft 365 100 100 10D 90 30Subsonic Combat Aircraft 43 0 0 60 30 30Other Aircraft 24 40 60 70 160 60Helicopters 187 260 40 100 20Surface-to-Air Missiles 1465 1470 330 1740 2330 160Surface-to-Surface Missiles 0 0 0 0 0 10Anti-Ship Missiles 390 70 160 50 0 10
Source: U.S. Government.
Note: Developing nations category excludes the U.S., Russia, former U.S.S.R., Europe, Canada,Japan, Australia and New Zealand. All data are for calendar years given. Major West Europeanincludes France, United Kingdom, Germany, and Italy totals as an aggregate figure.
Data relating to surface-to-surface and anti-ship missiles by foreign suppliers are estimates basedon a variety of sources having a wide range of accuracy. As such, individual data entries in thesetwo weapons delivery categories are not necessarily definitive.
The DISAM Journal, Fall 199937
Worldwide Arms Transfer Agreements and DeliveriesValues, 1991-1998
The six tables below, Tables 8, 8A and 8B and Tables 9, 9A and 9B, provide the total dollarvalues of arms transfer agreements and arms deliveries worldwide in the same format and detailas do Tables 1, 1A and 1B and Tables 2, 2A and 2B for arms transfer agreements with armsdeliveries to developing nations.
Total Worldwide Arms Transfer Agreements Values, 1991-1998
Table 8 shows the annual current dollar values of arms transfer agreements worldwide. Sincethese figures do not allow for the effects of inflation, they are, by themselves, of limited use. Theyprovide, however, the data from which Tables 8A (constant dollars) and 8B (supplier percentages)are derived. Some of the more notable facts reflected by these data are summarized below. Unlessotherwise noted dollar values are expressed in constant 1998 dollars.
• The United States ranked first among all suppliers to the world in the value of armstransfer agreements from 1995-1998, and first for the entire period from 1991-1998.
• Russia ranked second among all suppliers to the world in the value of arms transferagreements from 1995-1998, and third from 1991-1998.
• France ranked third among all suppliers to the world in the value of arms transferagreements from 1995-1998, and second from 1991-1998.
• The United Kingdom ranked fourth among all suppliers to the world in the value of armstransfer agreements from 1995-1998, and fourth from 1991-1998.
• In 1998, the value of all arms transfer agreements worldwide was nearly $23 billion.This is the second lowest total for arms transfer agreements in any year since 1991, although anincrease over the lowest total in 1997 which was $21.4 billion.
• In 1998, the United States was the leader in arms transfer agreements with the world,making about $7.1 billion in such agreements, or 30.8% of all arms transfer agreements. Germanyranked second with $5.5 billion in arms transfer agreements, or 23.9% of all such agreements.France ranked third with $3 billion or 13.1%. United States agreements increased notably fromabout $5.7 billion in 1997 to about $7.1 billion in 1998. France's arms transfer agreements fellsignificantly from about $5 billion in 1997 to $3 billion in 1998.
• The United States, Germany and France, the top three arms suppliers to the world in1998 respectively-ranked by the value of their arms transfer agreements-collectively madeagreements in 1998 valued at nearly $15.6 billion, 67.8% of all arms transfer agreements madewith the world by all suppliers.
• The total value of all arms transfer agreements worldwide from 1995-1998 ($100.3billion) was notably less than the value of arms transfer agreements by all suppliers worldwidefrom 1991-1994 ($130.6 billion), a decline of 23.2%.
The DISAM Journal, Fall 1999 38

• During the period from 1991-1994, developing world nations accounted for 71.7% of allarms transfer agreements made worldwide. During 1995-1998, developing world nationsaccounted for 66.4% of all arms transfer agreements made worldwide.
• In 1998, developing nations were recipients of 57.3% of all arms transfer agreementsmade worldwide.
Total Worldwide Arms Delivery Values, 1991-1998
Table 9 shows the annual current dollar values of arms deliveries (items actually transferred)worldwide by major suppliers from 1991-1998. The utility of these data is that they reflecttransfers that have occurred. They provide the data from which Tables 9A (constant dollars) and9B (supplier percentages) are derived. Some of the more notable facts illustrated by these data aresummarized below. Unless otherwise noted the dollar values noted are expressed in constant 1998dollars.
• In 1998, the United States ranked first in the value of arms deliveries worldwide, makingover $10.5 billion in such deliveries. This is the eighth year in a row the United States has led insuch deliveries, largely reflecting implementation of arms agreements concluded during andimmediately after the Persian Gulf war.
• France ranked second in arms deliveries worldwide in 1998, making $6.5 billion in suchdeliveries.
• The United Kingdom ranked third in arms deliveries worldwide in 1998, making $5.3billion each in such deliveries.
• In 1998, the top three suppliers of arms to the world, the United States, France and theUnited Kingdom, collectively delivered over $22.3 billion, 74.9% of all arms deliveries madeworldwide by all suppliers.
• The U.S. share of all arms deliveries worldwide in 1998 was 35.3%, down from its38.7% share in 1997. France's share in 1998 was 21.8%, its highest percentage of deliveries inany year from 1991-1998. Russia's share of all arms deliveries to the world in 1998 was 6.7%, upfrom 6.2% in 1997.
• In 1998 the value of all arms deliveries worldwide was over $29.8 billion. This is asignificant decline in the total value of arms deliveries from the previous year (nearly $37.8billion), measured in constant 1998 collars.
• During the period from 1991-1994, developing world nations accounted for 69.4% of allarms of all arms deliveries received worldwide. During 1995-1998, developing world nationsaccounted for 76.7% of all arms deliveries worldwide.
• In 1998, developing nations were recipients of arms accounted for 77.8% of all armsdeliveries received worldwide.
• The total value of all arms deliveries by all suppliers worldwide from 1995-1998($131.2 billion) was a notable increase from the value of arms deliveries by all suppliers
The DISAM Journal, Fall 199939

worldwide from 1991-1994 (nearly $120.4 billion)(in constant 1998 dollars), an increase of 9%(Table 9A).
Description of Items Counted in Weapons Categories,1991-1998
Tanks and Self-propelled Guns: This category includes light, medium, and heavy tanks; self-propelled artillery; self-propelled assault guns.
Artillery: This category includes field and air defense artillery, mortars, rocket launchers andrecoilless rifles-100 mm and over; FROG launchers-100 mm and over.
Armored Personnel Carriers (APCs) and Armored Cars: This category includes personnelcarriers, armored and amphibious; armored infantry fighting vehicles; armored reconnaissanceand command vehicles.
Major Surface Combatants: This category includes aircraft carriers, cruisers, destroyers,frigates.
Minor Surface Combatants: This category includes mine sweepers, subchasers, motor torpedoboats, patrol craft, motor gunboats.
Submarines: This category includes all submarines, including midget submarines.
Guided Missile Patrol Boats: This category includes all boats in this class.
Supersonic Combat Aircraft: This category includes all fighter and bomber aircraft designed tofunction operationally at speeds above Mach 1.
Subsonic Combat Aircraft: This category includes all fighter and bomber aircraft, includingthose propeller driven, designed to function operationally at speeds below Mach 1.
Other Aircraft: This category includes all other fixed-wing aircraft, including trainers,transports, reconnaissance aircraft, and communications/utility aircraft.
Helicopters: This category includes all helicopters, including combat and transport.
Surface-to-air Missiles: This category includes all ground-based air defense missiles.
Surface-to-surface Missiles: This category includes all surface-to-surface missiles withoutregard to range, such as SCUDS and CSS-2s. It excludes all anti-tank missiles and all anti-shipmissiles.
Anti-ship Missiles: This category includes all missiles in this class such as the Harpoon,Silkworm, Styx and Exocet.
The DISAM Journal, Fall 1999 40

Table 8. Arms Transfer Agreements with the World, by Supplier, 1991-1998(in millions of current U.S. dollars)
TOTAL1991 1992 1993 1994 1995 1996 1997 1998 1991-1998
United States 10,150 8,753 19,363 10,967 6,771 8,117 5,586 7,081 76,788
U.S.S.R./Russia* 7,100 1,800 2,400 3,900 7,600 5,100 3,300 1,700 32,900
France 3,500 9,000 5,000 8,400 2,600 2,800 4,900 3,000 39,200
United Kingdom 400 1,800 2,800 700 800 4,700 1,000 1,200 13,400
China 600 500 500 700 200 1,000 1,600 700 5,800
Germany 1,500 1,300 1,300 1,200 500 100 600 5,500 12,000
Italy 300 500 400 200 1,100 400 300 1,000 4,200
All Other European 2,000 2,200 900 2,600 2,900 3,700 2,200 1,600 18,100
All Others 700 1,200 1,100 700 1,900 2,900 1,500 1,200 11,200
TOTAL 26,250 27,053 33,763 29,367 24,371 28,817 20,986 22,981 213,588
Dollar inflation index(1998=1.00)** 0.8604 0.8768 0.9021 0.9227 0.9407 0.9604 0.9801 1
Source: U.S. Government.
Note: All data are for the calendar year given except for U.S. MAP (Military Assistance Program)and IMET (International Military Education and Training) data which are included for theparticular fiscal year. All amounts given include the values of weapons, spare parts, construction,all associated services, military assistance and training programs. Statistics for foreign countriesare based upon estimated selling prices. U.S. commercial sales contract values are excluded. Allforeign data are rounded to the nearest $100 million. *Prior to 1992 reflects data for the former Soviet Union.**Based on Department of Defense Price Deflator.
Table 8A. Arms Transfer Agreements with the World, 1991-1998(in millions of constant 1998 dollars)
TOTAL1991 1992 1993 1994 1995 1996 1997 1998 1991-1998
United States 11,797 9,983 21,464 11,886 7,198 8,452 5,699 7,081 83,560
U.S.S.R./Russia 8,252 2,053 2,660 4,227 8,079 5,310 3,367 1,700 35,648
France 4,068 10,265 5,543 9,104 2,764 2,915 4,999 3,000 42,658
United Kingdom 465 2,053 3,104 759 850 4,894 1,020 1,200 14,345
China 697 570 554 759 213 1,041 1,632 700 6,167
Germany 1,743 1,483 1,441 1,301 532 104 612 5,500 12,715
Italy 349 570 443 217 1,169 416 306 1,000 4,471
All Other European 2,325 2,509 998 2,818 3,083 3,853 2,245 1,600 19,429
All Others 814 1,369 1,219 759 2,020 3,020 1,530 1,200 11,930
TOTAL 30,509 30,854 37,427 31,827 25,907 30,005 21,412 22,981 230,923
The DISAM Journal, Fall 199941

Table 8B. Arms Transfer Agreements with the World, by Supplier, 1991-1998(expressed as a percent of total, by year)
1991 1992 1993 1994 1995 1996 1997 1998
United States 38.67% 32.36% 57.35% 37.34% 27.78% 28.17% 26.62% 30.81%
U.S.S.R./Russia 27.05% 6.65% 7.11% 13.28% 31.18% 17.70% 15.72% 7.40%
France 13.33% 33.27% 14.81% 28.60% 10.67% 9.72% 23.35% 13.05%
United Kingdom 1.52% 6.65% 8.29% 2.38% 3.28% 16.31% 4.77% 5.22%
China 2.29% 1.85% 1.48% 2.38% 0.82% 3.47% 7.62% 3.05%
Germany 5.71% 4.81% 3.85% 4.09% 2.05% 0.35% 2,86% 23.93%
Italy 1.14% 1.85% 1.18% 0.68% 4.51% 1.39% 1.43% 4.35%
All Other European 7.62% 8.13% 2.67% 8.85% 11.90% 12.84% 10.48% 6.96%
All Others 2.67% 4.44% 3.26% 2.38% 7.80% 10.06% 7.15% 5.22%
[ Major West European* 21.71% 46.58% 28.14% 35.75% 20.52% 27.76% 32.40% 46.56%]
TOTAL 100.00% 100.00% 100.00% 100.00% 100.00% 100.00% 100.00% 100.00%
*•Major West European category includes France, United Kingdom Germany, and Italy.
Table 9. Arms Deliveries to the World, by Supplier, 1991-1998(in millions of current U.S. dollars)
TOTAL1991 1992 1993 1994 1995 1996 1997 1998 1991-1998
United States 7,077 8,075 9,183 7,672 9,762 8,897 14,311 10,531 75,508
U.S.S.R./Russia* 6,200 2,500 3,200 1,700 3,500 3,000 2,300 2,000 24,400
France 2,100 2,100 1,500 2,600 3,800 3,500 5,900 6,500 28,000
United Kingdom 4,900 6,100 4,600 5,200 5,300 6,200 6,500 5,300 44,100
China 1,400 1,000 1,200 700 700 600 1,000 600 7,200
Germany 2,400 1,200 1,700 1,600 1,700 1,900 700 1,600 12,800
Italy 300 500 400 200 200 100 700 100 2,500
All Other European 2,200 3,900 2,400 3,500 3,600 3,700 4,000 1,800 25,100
All Others 1,800 1,700 1,900 2,300 2,000 2,000 1,600 1,400 14,700
TOTAL 28,377 27,075 26,083 25,472 30,562 29,897 37,011 29,831 234,308
Dollar inflationindex (1998=1.00)** 0.8604 0.8768 0.9021 0.9227 0.9407 0.9604 0.9801 1
Source: U.S. Government.
Note: All data are for the calendar year given. All amounts given include the values of weapons,spare parts, construction, all associated services, military assistance and training programs.Statistics for foreign countries are based upon estimated selling prices. U.S. commercial salesdelivery values are excluded. All foreign data are rounded to the nearest $100 million. *Prior to 1992 reflects data for the former Soviet Union.**Based on Department of Defense Deflator.
The DISAM Journal, Fall 1999 42

Table 9A. Arms Deliveries to the World, by Supplier, 1991-1998(in millions of constant 1998 U.S. dollars)
TOTAL1991 1992 1993 1994 1995 1996 1997 1998 1991-1998
United States 8,225 9,210 10,180 8,315 10,377 9,264 14,602 10,531 80,703
U.S.S.R./Russia 7,206 2,851 3,547 1,842 3,721 3,124 2,347 2,000 26,638
France 2,441 2,395 1,663 2,818 4,040 3,644 6,020 6,500 29,520
United Kingdom 5,695 6,957 5,099 5,636 5,634 6,456 6,632 5,300 47,409
China 1,627 1,141 1,330 759 744 625 1,020 600 7,846
Germany 2,789 1,369 1,884 1,734 1,807 1,978 714 1,600 13,876
Italy 349 570 443 217 213 104 714 100 2,710
All Other European 2,557 4,448 2,660 3,793 3,827 3,853 4,081 1,800 27,019
All Others 2,092 1,939 2,106 2,493 2,126 2,082 1,632 1,400 15,871
TOTAL 32,981 30,880 28,914 27,606 32,489 31,130 37,762 29,831 251,593
Table 9B. Arms Deliveries to the World, by Supplier, 1991-1998(expressed as a percent of total, by year)
1991 1992 1993 1994 1995 1996 1997 1998
United States 24.94% 29.82% 35.21% 30.12% 31.94% 29.76% 38.67% 35.30%
U.S.S.R./Russia 21.85% 9.23% 12.27% 6.67% 11.45% 10.03% 6.21% 6.70%
France 7.40% 7.76% 5.75% 10.21% 12.43% 11.71% 15.94% 21.79%
United Kingdom 17.27% 22.53% 17.64% 20.41% 17.34% 20.74% 17.56% 17.77%
China 4.93% 3.69% 4.60% 2.75% 2.29% 2.01% 2.70% 2.01%
Germany 8.46% 4.43% 6.52% 6.28% 5.56% 6.36% 1.89% 5.36%
Italy 1.06% 1.85% 1.53% 0.79% 0.65% 0.33% 1.89% 0.34%
All Other European 7.75% 14.40% 9.20% 13.74% 11.78% 12.38% 10.81% 6.03%
All Others 6.34% 6.28% 7.28% 9.03% 6.54% 6.69% 4.32% 4.69%
[ Major West 34.18% 3657% 31.44% 37.69% 35.99% 39.13% 37.29% 45.25%]European*
TOTAL 100.00% 100.00% 100.00% 100.00% 100.00% 100.00% 100.00% 100.00%
*Major West European category includes France, United Kingdom, Germany, Italy.
The DISAM Journal, Fall 199943