CONVECTIVE HEAT TRANSFER IN A ROTARY KILN by ...
291
CONVECTIVE HEAT TRANSFER IN A ROTARY KILN by SHONG HSIUNG TSCHENG B.E., National Taiwan University, Taiwan, 19 6 8 M.S., West Virginia University, U.S.A., 1972 A THESIS SUBMITTED IN PARTIAL FULFILMENT OF THE REQUIREMENTS FOR THE DEGREE OF DOCTOR OF PHILOSOPHY in the Department of CHEMICAL ENGINEERING We accept this thesis as conforming to the required standard THE UNIVERSITY OF BRITISH COLUMBIA September, 1978 © Shong-Hsiung Tscheng, 1978
-
Upload
khangminh22 -
Category
Documents
-
view
0 -
download
0
Transcript of CONVECTIVE HEAT TRANSFER IN A ROTARY KILN by ...

CONVECTIVE HEAT TRANSFER
IN A ROTARY KILN
by
SHONG HSIUNG TSCHENG
B.E., National Taiwan University, Taiwan, 19 6 8
M.S., West V i r g i n i a University, U.S.A., 1972
A THESIS SUBMITTED IN PARTIAL FULFILMENT OF
THE REQUIREMENTS FOR THE DEGREE OF
DOCTOR OF PHILOSOPHY
in the Department
of
CHEMICAL ENGINEERING
We accept t h i s thesis as conforming to the
required standard
THE UNIVERSITY OF BRITISH COLUMBIA
September, 1978
© Shong-Hsiung Tscheng, 1978

In presenting th i s thes is in p a r t i a l fu l f i lment of the requirements for
an advanced degree at the Un ivers i t y of B r i t i s h Columbia, I agree that
the L ibrary shal l make i t f ree l y ava i lab le for reference and study.
I fur ther agree that permission for extensive copying of th is thes is
for scho lar ly purposes may be granted by the Head of my Department or
by his representat ives . It is understood that copying or pub l i ca t ion
of th is thes is fo r f i n a n c i a l gain sha l l not be allowed without my
wr i t ten permission.
Department of (^$C*n< £VL^<y? -e^r> \PJ
The Univers i ty of B r i t i s h Columbia 2075 Wesbrook Place Vancouver, Canada V6T 1W5
Date Skjde.r*t*r ^ 9 j /97#

ABSTRACT
Convective heat transfer i n a rotary k i l n was studied
as a function of operating parameters. The experiments were
carried out in a steel k i l n of 0.19 m i n diameter and 2.44 m.
in length. The operating parameters covered included gas flow
rate, s o l i d throughput, r o t a t i o n a l speed, degree of s o l i d hold
up, i n c l i n a t i o n angle, p a r t i c l e size and temperature. To mini
mize radiation e f f e c t s , a i r was used as the heating medium and
maximum i n l e t a i r tempera'tures were limited to 650 K. Ottawa
sand was used i n a l l the runs except i n the study of the e f f e c t
of p a r t i c l e size where limestone was employed. The experiments
v/ere conducted under conditions where the bed height along the
k i l n was maintained constant and the bed was i n the r o l l i n g
mode.
Both • the heat transfer c o e f f i c i e n t s from the gas to the
solids bed and the gas to the rotating wall were found to be
s i g n i f i c a n t l y influenced by gas flow rate. Increasing rotation
a l speed increases the gas to bed heat transfer, but decreases
the gas to wall heat transfer. The former e f f e c t i s r e l a t i v e l y
small. The e f f e c t of degree of f i l l was s l i g h t l y negative i n
the gas to sol i d s bed heat transfer, and i n s i g n i f i c a n t i n the
heat transfer from the gas to wall. The effects of i n c l i n a t i o n
angle , solid-throughput , p a r t i c l e size and- temperature were

found n e g l i g i b l e over the range tested. One of the major
findings i n t h i s study i s that contrary to suggestions i n the
l i t e r a t u r e , the c o e f f i c i e n t s for gas to bed heat transfer are
about an order of magnitude higher than those for gas to wall.
The higher c o e f f i c i e n t s for gas to sol i d s bed are attributed
to two factors, the underestimation of the true area by basing
c o e f f i c i e n t s on the plane chord area and the e f f e c t on the gas
fi l m resistance of the rapid p a r t i c l e v e l o c i t y on the bed sur
face.
The experimental data were correlated i n a form suitable
for design purposes, and the res u l t s compared with meager data
available i n the l i t e r a t u r e .
A mathematical model was developed for convective heat
transfer from the gas to a r o l l i n g solids bed. The mode] re
quires the knowledge of the gas to p a r t i c l e heat transfer co
e f f i c i e n t and the r o l l i n g v e l o c i t y of the aerated p a r t i c l e s .
The model gives a reasonable prediction of the gas to bed
c o e f f i c i e n t i n a rotary k i l n using values of the gas to p a r t i
c l e c o e f f i c i e n t taken from the l i t e r a t u r e . The' required data
on the surface v e l o c i t y of p a r t i c l e s was obtained i n a l u c i t e
k i l n of the same siz e . Residence time d i s t r i b u t i o n of p a r t i c l e s
was also studied b r i e f l y to v e r i f y that so l i d s were nearly i n
ax i a l plug flow.
A simple mathematical model of a rotary k i l n -'heat ex
changer i s presented. This model predicts gas, sol i d s and wall-
temperatures i n a k i l n as a function of the k i l n design and

o p e r a t i n g p a r a m e t e r s u s i n g t h e ho.at t r a n s f e r c o r r e l a t i o n s
d e v e l o p e d i n t h i s w o r k .

TABLE OF CONTENTS
ABSTRACT , i i
ACKNOWLEDGEMENTS x v i
L 1ST "OF TABLES" "" i x-
LIST OF .FIGURES x i
1. INTRODUCTION 1
2. LITERATURE REVIEW , 8
2.1 Mechanism of Charge Movement 8
2.2 Retention Time and Holdup 15
2.3 Residence Time D i s t r i b u t i o n 21'
2.4 Surface Time . . . I 28
2.5 Heat Transfer 31.
a. Conduction 3 2
b. Convection 40
c. Radiation » 44
3. SCOPE OF PRESENT WORK 47
4. APPARATUS AND MATERIALS 49
4.1 Apparatus 49
a. Kilns 49
b. Feeding System 54

v i .
c. Receiving System . . . . . 4 i
d. A i r Heating System 56 1
e. Thermocouples 56
4.2 Materials 6 0
5. EXPERIMENTAL PROCEDURE 6 4
5.1 Retention Time and Solid Throughput . . . 4
5.2 Residence Time D i s t r i b u t i o n 65
5.3 Surface Time 6 7
5.4 Heat Transfer 6 9
a. Experimental Procedure 7 0
b. Preliminary Test 71
c. Operating Conditions . , , 6. RESULTS AND DISCUSSION 7 3
6.1 Types of Bed Movement 7 3
6.2 Lateral and Radial V e l o c i t y 7 3
6.3 Surface Time 7 8
6.4 S o l i d Throughput and Retention Time . . . 85
6.5 Residence Time D i s t r i b u t i o n , . 9 3
in? 6.6 Gas and Bed Temperatures J
6.7 Ax i a l Temperature D i s t r i b u t i o n
6.8 Calculation Method for Heat Transfer C o e f f i c i e n t s , 1 2
6.9 Bed to Wall Heat transfer 1 2 0
6.in Heat Transfer C o e f f i c i e n t s "1 o o
a. Local Heat Transfer C o e f f i c i e n t s . . .

v i i .
b. E f f e c t of A i r Temperature 127
c. F f f e c t of Gas Flow 1 2 7
d. E f f e c t of Rotational Speed 130
e. E f f e c t of degree of F i l l , 135
f. Ef f e c t of Solid Throughput and Incli n a t i o n Angle 137
g. E f f e c t of P a r t i c l e Size 1 4 0
h. Comparison with Previous Work 144
6:111Correlation of Heat Transfer C o e f f i c i e n t s . 151
6.12 Scaleup 153
7. A MODEL FOR GAS TO BED HEAT TRANSFER 161
7.1 True Surface Area 161
7.2 Individual P a r t i c l e Heat Transfer 165
7.3 Gas to Bed Heat Transfer C o e f f i c i e n t . . . 168
7.4 Gas to P a r t i c l e Heat Transfer
C o e f f i c i e n t 171
7.5 Comparison with Experimental Data 174
3. MODELLING OF ROTARY KILN HEAT EXCHANGER . . . . 182
9. CONCLUSIONS 200
10. RECOMMENDATION FOR FUTURE WORK 202
NOMENCLATURE 204
REFERENCES 2 09
APPENDIX
A Ca l i b r a t i o n of Equipment 215
B Surface Area and Surface Veloci t y 223
C Sample Calculations . • 233

v i i i
D Computer Programs
E Data
244 - J '
257

i x
LIST OF TABLES
Table 2-1 E f f e c t of K i l n Length on D and Pe . . . .
2-2 Radiant Heat Transfer C o e f f i c i e n t . . . .
4-1 Key to Figure 4-1
4- 2 Physical Properties of Ottawa Sand
and Limestone
5- 1 K i l n Operating Conditions
6- 1 Relationship of V,/V vs N
6-2 Operating Conditions and Calculation Results of RTD Experiments .
6-3 Local Heat Flows and Heat Transfer C o e f f i c i e n t s
6-4 E f f e c t of Degree of F i l l on Heat Transfer -Rate and Bed Surface . . .
6-5 Gas to Solids Heat Transfer C o e f f i c i e n t -Limestone
6-6 Comparison of Air-Wall Heat Transfer C o e f f i c i e n t i n Empty Kilns
6-7 Result of Regression Analysis for Nu g to
6- 8 Result of Regression Analysis for Nu„„ 3 -1 gw
7- 1 Input Data for Equation 7-14 7-2 Calculation for Gas-Particle Heat
Transfer C o e f f i c i e n t
7-3 Calculation of h „ from Equation 7-14 . . gs
29
46
51
63
72
84
94
124
138
143
148
154
156
176
177
180

X
8-1 Co e f f i c i e n t s for Equations 8-5 and 8-6 . . . . 186
8-2 Parameters i n Figure 8-2 1 9 0
Appendix
A - l C a l i b r a t i o n of Thermocouples . . . 219
A-2 Thermocouple Data 220
C-l Tabulation of Calculation for RTD run (R2) . . 2 3 4

TABLE OF FIGURES
Figure
1-1 Basic Components of Rotary K i l n 2
1- 2 Heat Transfer Modes i n Rotary K i l n 5
2- 1 Types of P a r t i c l e Movement i n Rotary K i l n . . 10
2-2 Mechanism of Slumping Charge i n a Rotary K i l n 11
2-3 Path of a P a r t i c l e i n an Ideal Rotary K i l n 11
2-4 Relationship of A x i a l Dispersion C o e f f i c i e n t and Rotational Speed 27
2-5 ' Bed-Wall; Keat Transfer by Conduction . . . . .33
2-6 Penetration Model for Bed-Wall Heat Transfer Proposed by Wachters and Kramers 3 3
2-7 Two-region Penetration Model for Ball-Wall Heat Transfer Proposed by Lehmberg et a l . . 39
2-8 Convective Heat Transfer C o e f f i c i e n t from Bed to A i r , Data of Wes et a l 4 3
4-1 Schematic Diagram of Apparatus 50
4-2 End Box and Seal System 53
4-3 Conical Receiver 55
4-4 Schematic Diagram of Thermocouple Arrangement 57
4-5 Diagram of Suction Thermocouple 59
4-6 Typical Response of Suction Thermocouple . . 59
4-7 Commutator Copper Rings 61

x i i
6-1 Photographs of Bed Motions -74
6-2 Trace of Individual P a r t i c l e i n K i l n 7 5
6-3 P a r t i c l e V e l o c i t y i n a Rotary K i l n 77
6-4 Retention Time and Surface Time vs. Rotational speed 8 0
6-5 Ratio of Surface Time to Retention Time vs. N/N 81
6-6 Surface Veloci t y vs. Rotational Speed . . . . 82
6-7 E f f e c t of Rotational Speed on Solid Throughput i n a Uniform Bed Depth Rotary K i l n 86
6-8 . E f f e c t of K i l n I n c l i n a t i o n on Solid Throughput i n a Uniform Bed Depth Rotary K i l n . . . . 87
6-9 Relationship of Solid Throughput and Degree of F i l l i n a Uniform Bed Depth Rotary K i l n . . 88
6-10 E f f e c t of Rotational Speed and In c l i n a t i o n Angle on Retention Time i n a Uniform Bed Depth Rotary K i l n 91
6-11 E f f e c t of Degree of F i l l on Retention Time in a Uniform Bed Depth Rotary K i l n 9 2
6-12 Cumulative Response Curve i n a Rotary K i l n . . 95
6-13 Residence Time D i s t r i b u t i o n (Pe=404) 9 7
6-14 Residence Time D i s t r i b u t i o n (Pe=371) 9 8
6-15 Residence Time D i s t r i b u t i o n (Pe=567) 9 9
6-16 Residence Time D i s t r i b u t i o n (Pe=382) l ° n
6-17 Relationship of D and N/Nc 101
6-18 Radial Solid Temperatures in Rotary K i l n Bed . 103
6-19 Radial Gas Temperature P r o f i l e 105

x d i i
6-20 Typical A x i a l Temperature P r o f i l e s along a Rotary K i l n 107
6-21 Reproducibility of A x i a l Temperature P r o f i l e s along Rotary K i l n
6-22 E f f e c t of A i r Flow Rate on A x i a l Temperature P r o f i l e s along K i l n 110
6-23 E f f e c t of Solid Throughput and Rotational Speed on A x i a l Temperature P r o f i l e s along Rotary K i l n I l l
6-24 E f f e c t of A i r Inlet Temperature on Ax i a l Temperature P r o f i l e 113
6-25 D i f f e r e n t i a l Section of Rotary K i l n H5
6-26 Correlation of Solids Bed to Wall Heat
Transfer C o e f f i c i e n t . . . . 121
6-27 Local Heat Transfer C o e f f i c i e n t 1 2 6
6-28 E f f e c t of Gas Temperature on Heat Transfer C o e f f i c i e n t 128
6-29 E f f e c t of Gas Flow Rate on Heat Transfer C o e f f i c i e n t 129
6-30 E f f e c t of Rotational Speed on Heat Transfer C o e f f i c i e n t 131
6-31 E f f e c t of N on h i n Both Slumping and Rolli n g Beds . ? . . . . . 1 3 3
6-32 E f f e c t of Degree of F i l l on Heat Transfer C o e f f i c i e n t 136
6-33 Ef f e c t s of Solid Throughput and Inc l i n a t i o n Angle on Gas-Solids Bed Heat Transfer C o e f f i c i e n t 139
6-34 Ef f e c t s of Solids Throughput and Inc l i n a t i o n Angle on Gas-Wall Heat Transfer C o e f f i c i e n t . 141
6-35 Comparison of Experimental Data with Literature 145
x i v
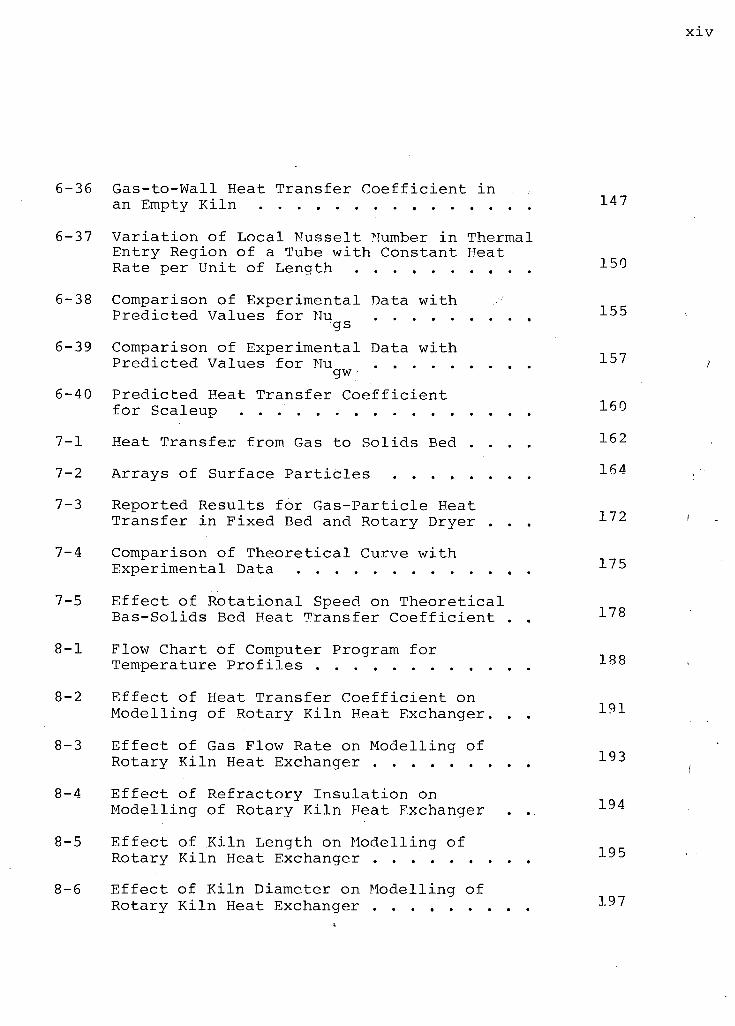
6-36 Gas-to-Wall Heat T r a n s f e r C o e f f i c i e n t i n an Empty K i l n 1 4 7
6-37 V a r i a t i o n of L o c a l N u s s e l t Number i n Thermal E n t r y Region of a Tube w i t h Constant Heat Rate per U n i t of Length 1 5 0
7-5 E f f e c t of R o t a t i o n a l Speed on T h e o r e t i c a l B a s - S o l i d s Bed Heat T r a n s f e r C o e f f i c i e n t ,
155
157
6-38 Comparison of Experimental Data w i t h P r e d i c t e d Values f o r Nu
gs 6-39 Comparison of Experimental Data w i t h
P r e d i c t e d Values f o r Nu gw •
6- 40 P r e d i c t e d Heat T r a n s f e r C o e f f i c i e n t
f o r Scaleup
7- 1 Heat T r a n s f e r from Gas to S o l i d s Bed . . . . 1 6 2
7-2 A r r a y s of Surface P a r t i c l e s -*- 4
7-3 Reported R e s u l t s f o r G a s - P a r t i c l e Heat T r a n s f e r i n F i x e d Bed and Rotary Dryer . . . 112
7-4 Comparison of T h e o r e t i c a l Curve w i t h 1 7 5
Experimental Data
178
8-1 Flow Chart of Computer Program f o r Temperature P r o f i l e s
8-2 E f f e c t of Heat T r a n s f e r C o e f f i c i e n t on M o d e l l i n g of Rotary K i l n Heat Exchanger. . .
8-3 E f f e c t of Gas Flow Rate on M o d e l l i n g of T O T
Rotary K i l n Heat Exchanger • L J J
8-4 E f f e c t of R e f r a c t o r y I n s u l a t i o n on M o d e l l i n g of Rotary K i l n Heat Exchanger . .
8-5 E f f e c t of K i l n Length on M o d e l l i n g of Rotary K i l n Heat Exchanger
8-6 E f f e c t of K i l n Diameter on M o d e l l i n g of 1 Q7
Rotary K i l n Heat Exchanger
XV
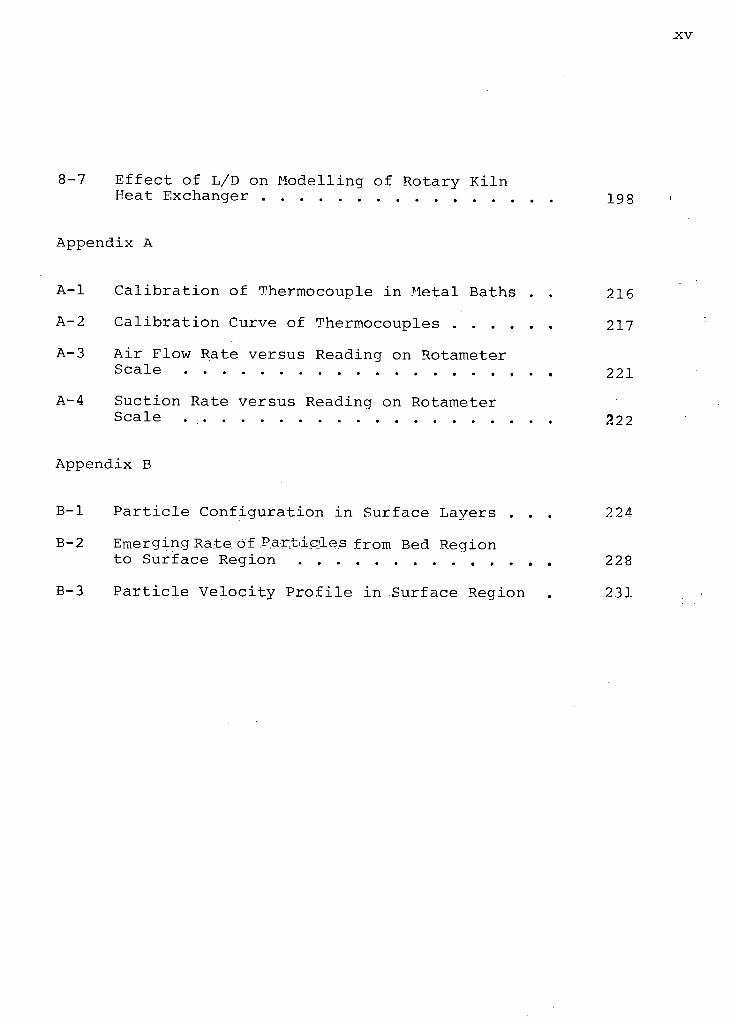
8-7 E f f e c t of L/D on Modelling of Rotary K i l n Keat Exchanger 19 8
Appendix A
A - l C a l i b r a t i o n of Thermocouple i n Metal Baths . . 216
A-2 C a l i b r a t i o n Curve of Thermocouples 217
A-3 A i r Flow Rate versus Reading on Rotameter Scale 221
A-4 Suction Rate versus Reading on Rotameter Scale 222
Appendix B
B-l P a r t i c l e Configuration i n Surface Layers . . . 224
B-2 Emerging Ra-teof Pa-rtiieles from Bed Region to Surface Region 228
B-3 P a r t i c l e Velocity P r o f i l e i n Surface Region . 231

ACKNOWLEDGEMENTS
The author wishes to thank Dr. Paul Watkinson f o r h i s
guidance and advice throughout the course of t h i s study. The
author would l i k e to thank the f a c u l t y members of Chemical
E n g i n e e r i n g Department and the s t a f f o f the Chemical Engineer
i n g Workshop f o r t h e i r u s e f u l suggestions and h e l p .
F i n a n c i a l a s s i s t a n c e was r e c e i v e d from the N a t i o n a l
Research C o u n c i l of Canada, and from the Standard O i l Company
of B r i t i s h Columbia L t d . i n the form of f e l l o w s h i p , f o r which
the author i s r e a l l y g r a t e f u l .
The author i s a l s o indebted to h i s w i f e , J i n j y , f o r
her p a t i e n c e and c o n t i n u a l support throughout t h i s work.

1
CHAPTER 1
INTRODUCTION
The rotary k i l n i s one of the most widely used
i n d u s t r i a l reactors for high temperature processes involving
s o l i d s . I t consists of a metal cylinder, l i n e d with brick,
rotated about i t s i n c l i n e d axis as shown i n Figure 1-1. The
s o l i d feed i s introduced into the upper end of the k i l n by
various methods, including i n c l i n e d chutes, overhung screw
conveyors and sl u r r y pipes. The charge then tra v e l s down
along the k i l n by a x i a l and circumferential movements, due to
the k i l n ' s i n c l i n a t i o n and rotation.
K i l n i n c l i n a t i o n depends on the process with a t y p i c a l
range of values from 0.02-0.063 m/m. Different r o t a t i o n a l
speeds are used depending on the process and k i l n size from
very low, i . e . , a p e r i p h e r i a l speed of 0.015 m/s, for a TiO^
pigment k i l n , to 0.227 m/s for a cement k i l n , to 0.633 m/s for
a unit c a l c i n i n g phosphate material. The sizes of i n d u s t r i a l
k i l n s range from 1.7 m.I.D. x 11.8 m long for f i r i n g l i g h t
weight aggregate, to 5.9 m x 12 5 m for iron ore d i r e c t reduction.
Rotary k i l n s are v e r s a t i l e reactors i n that p a r t i c l e size and
s o l i d density are not r e s t r i c t e d as i n the case of f l u i d i z e d
or spouted beds, d i r e c t f i r i n g or i n d i r e c t heating may be used,
and the k i l n can operate i n either cocurrent or counter-current

2
INCLINED WITH HORIZONTAL
Figure 1-1 Basic Components o f Rotary K i l n

3
flow. The l a t t e r feature i s important where high extent of
s o l i d conversion i s required. Solids may be fed either i n the
dry state, or as a wet paste.
The main uses of rotary k i l n s are i n the processes of
c a l c i n i n g , fusing, nodulizing, roasting, incinerating, and
reducing of s o l i d materials. Lime, magnesia and alumina are
calcined to release carbon dioxide and water, at temperatures
in the ranges of 1260-1500 K. The nodulizing process i s applied
to phosphate rock and certain iron ores with temperatures, 1500
to 1600 K. Roasting occurs at temperatures between 800 K and
1600 K, to oxidize and drive o f f sulfur and arsenic from
various ores, including gold, s i l v e r , iron, etc. The rotary
k i l n i s successfully used as a pre-combustion reactor for
incineration of p l a s t i c s wastes (1). The temperatures i n t h i s
process are i n the range of 570-970 K. Iron ore reduction i s
t y p i c a l of reducing processes c a r r i e d out i n rotary k i l n s .
The reaction temperatures are around 1300 K. Other major
applications of rotary k i l n s include production of expanded
aggregate, production of activated carbon (in two stages,
carbonizing 670-770 K, and a c t i v a t i o n , 1170-1270 K), recovery
of zinc from other metals (1200 K, Waelz process), and pro
duction of plaster of paris (382 to 404 K).
A considerable portion of the k i l n length may be used
to dry solids and bring them up to reaction temperature. In a
t y p i c a l wet process cement k i l n , 60% of the 137 meter k i l n
length i s required to dry the s l u r r y and heat s o l i d s to 1100 K,
whereas the c a l c i n i n g zone and burning zones occupy 22% and

18% of the length, respectively. Stelco reported (2) perfor
mance data for i t s f i r s t commercial iron ore d i r e c t reduction
k i l n i n the SL/RN process. About 70% of the 125 meter k i l n
length i s used to preheat the solids up to 1120 K, leaving
only 30% for reduction. The thermal design of a rotary k i l n
i s thus obviously important.
To design a k i l n one should calculate the length of
each in d i v i d u a l zone for drying, heating, and chemical reaction
based on heat transfer and k i n e t i c data. Unfortunately there
are few detailed data-available in the l i t e r a t u r e for the c a l
culation of heat flow.
The heat transfer process i s complex, p a r t i c u l a r l y i n a
f i r e d k i l n i n which radiation, convection and conduction a l l
provide contributions to the transfer of heat from and to the
gas, the wall and the s o l i d s . The modes of heat transfer i n
a f i r e d k i l n are shown i n Figure 1-2. The gas, a heat source,
provides heat to the s o l i d s , a heat sink, and the wall, a
regenerator. The wall, a f t e r receiving heat from the gas,
transmits i t by d i r e c t r a d i a t i o n to the sol i d s bed surface,
and by conduction when i t rotates to the underside of the bed.
A portion of the heat the wall receives passes to the sur
roundings through i t s outer s h e l l as a heat loss. In a d i r e c t
f i r e d k i l n of large diameter the major amount of heat that
reaches the s o l i d bed i s transferred by radiatio n from the hot
gas. Radiation from the exposed wall to the charge usually
ranks next i n importance. Convection from the gas and con
duction from the underside wall provides less than one quarter
of the t o t a l heat received by the s o l i d charge. However, i n

5
Hot Gases
— Conduction
Figure 1-2 Heat Transfer Modes i n Rotary" K i l n .

6
k i l n s used for bicarbonate c a l c i n a t i o n (3) where the tempera
tures are around 450-470 K, and i n the drying and parts of
the heating sections of f i r e d k i l n s , convection and conduction
contributions are expected to outweigh that of radiation.
Also, Brimacombe and Watkinson (4) have shown that i n d i r e c t
f i r e d k i l n s of small diameter operating at s o l i d temperatures
up to 1100 K convection from the gas i s the primary mode of
heat transfer to the s o l i d s . However, there i s no information
available to determine under what conditions convection can
be ignored i n a f i r e d k i l n .
Recent investigators have attempted to simulate and
model the performances of alumina k i l n s (5,6), cement k i l n s
(7,8), iron ore reduction k i l n s (9,10), aggregate k i l n s (11)
and simple heat exchanger k i l n s (12-17, 54). In these studies
a number of d i f f e r e n t i a l equations were formulated to predict
gas and s o l i d temperature p r o f i l e s along the k i l n . The
important parameters of the models included heat transfer
c o e f f i c i e n t s for gas to s o l i d s , wall to s o l i d s , and gas to
wall. Unfortunately there are no detailed data on heat transfer
c o e f f i c i e n t s to incorporate into the models. The values of
the c o e f f i c i e n t s were either calculated by using equations the
r e l i a b i l i t y of which i s to be v e r i f i e d , or values of the
c o e f f i c i e n t s were assumed without further j u s t i f i c a t i o n . The
paucity of data for rotary k i l n s was also recognized by a
working party report of the Ins t i t u t e of Chemical Engineers
in 1971 (18). The report c a l l e d for a comprehensive study of
heat transfer processes over wide temperature ranges between
soli d s bed, gas and wall i n rotary k i l n s .

7
T h e p u r p o s e o f t h e p r e s e n t w o r k was t o make a n e x p e r i
m e n t a l i n v e s t i g a t i o n o f c o n v e c t i o n h e a t t r a n s f e r i n t h e
r e a c t i o n - f r e e s y s t e m o f a n o n - f i r e d r o t a r y k i l n . T h e s t u d y
was t o c o v e r t h e e f f e c t s o f a v a r i e t y o f o p e r a t i n g p a r a m e t e r s
o n h e a t t r a n s f e r c o e f f i c i e n t s . T h e s e p a r a m e t e r s i n c l u d e d g a s
v e l o c i t y a n d t e m p e r a t u r e , s o l i d t h r o u g h p u t , i n c l i n a t i o n a n g l e ,
r o t a t i o n a l s p e e d , s o l i d b e d h o l d u p , a n d p a r t i c l e s i z e . The
a i m was t o d e t e r m i n e w h i c h o f t h e s e f a c t o r s w e r e i m p o r t a n t i n
g o v e r n i n g h e a t t r a n s f e r f r o m t h e g a s t o t h e s o l i d s i n r o t a r y
k i l n s , a n d t o r e p o r t t h e r e s u l t s i n a m a n n e r s u i t a b l e f o r
d e s i g n p u r p o s e s .

8
CHAPTER 2
LITERATURE REVIEW
To investigate the heat transfer mechanisms from the
gas to the s o l i d s bed, i t i s e s s e n t i a l to understand bed
behavior and how i t i s affected by k i l n operating parameters.
During the movement of free flowing material i n a rotating
k i l n , two v e l o c i t y components appear: the r a d i a l motion of
p a r t i c l e s of the charge material due to the k i l n ' s rotation
and the a x i a l motion of p a r t i c l e s along the k i l n mainly due
to i n c l i n a t i o n . The l a t t e r type of p a r t i c l e motion determines
the residence time of s o l i d material i n the k i l n , whereas the
former type of p a r t i c l e motion provides s o l i d mixing.
2.1 Mechanism of Charge Movement
An excellent description of circumferential motion of
the s o l i d bed i n a rotary drum was given by Rutgers (19). In
a rotating cylinder a s o l i d p a r t i c l e i s taken up the wall to
a p a r t i c u l a r height, depending on wall f r i c t i o n , s p e c i f i c
gravity and shape. A mass of granules may be taken up higher
on account of the i n t e r a c t i o n between the p a r t i c l e s and the
r e s t r i c t e d r e l a t i v e movements of the i n d i v i d u a l grains within
the mass. The center of gravity of the whole mass of the
p a r t i c l e s i s displaced to a position eccentric to the axis of

9
the c y l i n d e r . The e c c e n t r i c i t y decreases w i t h i n c r e a s i n g
l o a d i n g and i t becomes somewhat g r e a t e r w i t h h i g h e r speeds of
r o t a t i o n .
For each drum r a d i u s t h e r e i s a c r i t i c a l angular speed
of r o t a t i o n where c e n t r i f u g i n g s t a r t s and a p a r t i c l e i s taken
along w i t h the moving w a l l . T h i s i s gi v e n by
= /g :/R or N c = 42.3//!) (2-1)
where R, D i n meter. Below N , the c r i t i c a l rpm, s e v e r a l
types of movement of d e c r e a s i n g i n t e n s i t y may be d i s c e r n e d .
F i g u r e 2-1 g i v e s a c r o s s - s e c t i o n a l p i c t u r e o f these types of
r a d i a l motion. In c a t a r a c t i n g , which takes p l a c e about 0.55
to 0.6 N c depending somewhat on p a r t i c l e shape, some of the
p a r t i c l e s are showered through the upper s e c t i o n of the
c y l i n d e r and f a l l downwards. At lower speeds of 0.1<N/N c< 0.6
cascading o c c u r s . Here the c r o s s - s e c t i o n a l f r e e s u r f a c e has
the t y p i c a l l u n a r or kidney shape of F i g u r e 2 - l a . At speeds
below 0.1 N , a r e l a t i v e l y t h i n l a y e r of p a r t i c l e s r o l l s down
the l i n e a r s u r f a c e as shown i n F i g u r e 2-lb. I f the speeds are
c o n s i d e r a b l y lower a slumping motion may occur where the
p a r t i c l e s no lo n g e r r o l l down the s u r f a c e c o n t i n u o u s l y .
The slumping phenomena, as d e p i c t e d i n F i g u r e 2-2, was
d e s c r i b e d by Zablotny (20) and Pearce (16). During r o t a r y
motion of the c y l i n d e r the s u r f a c e of the.charge g r a d u a l l y

(a)
42.3 Nc (rpm) =
(b)
D ( m )
1. CENTRIFUGING
N > Nc
2. CATARACTING
Nc > N > 0 . 6 Nc
3 CASCADING
0.6 N c > N > 0.1 Nc
4 ROLLING
0.1 Nc > N
gure 2-1 Types of P a r t i c l e Movement i n Rotary K i l n (19).

Figure 2-2 Mechanism of Slumping of Charge in a Rotary K i l n (20) .
Figure 2-3 Path of a P a r t i c l e i n an Ideal Rotary K i l n (20) •

moves from position C-C into the position marked by the
straight l i n e A-A, forming the angle, A, with the horizontal,
which was defined as the angle of repose by Sulli v a n (21) , or
s t a t i c angle of s l i d e by Zablotny. In t h i s thesis the term
s l i d i n g w i l l be r e s t r i c t e d to motion related to slippage at
the wall of the k i l n and Zablotny's angle of s l i d e w i l l be
ca l l e d the angle of repose. At the moment when the surface
of the charge attains position A-A the surface layer of the
charge i s detached in the upper part of the segment and then
slumping of the material begins. The quantity of slumping
material i s shown schematically i n Figure 2-2 by the A-O-B,
which simultaneously forms the angle (J> , c a l l e d the shearing
angle. After rapid slumping of that part of the material, the
surface of the charge i s i n dynamic equilibrium, as i t i s
situated under an angle defined as the dynamic angle of repose.
A new surface B-O-B i s then moved up to A-O-A, which r e s u l t s
in a second slumping. The shearing angle must be determined
experimentally. It depends on the physical properties of the
charge material as well as the r o t a t i o n a l speed. The shearing
angle diminishes to zero as the r o t a t i o n a l speed increases
u n t i l a continuous rather than periodic slumping occurs. This
action i s referred to as r o l l i n g .
Henein, Brimacombe and Watkinson (22) reported experi
mental results on slumping and r o l l i n g beds i n a 0.4 meter
diameter rotary cylinder and k i l n . They indicated that the
tr a n s i t i o n between slumping to r o l l i n g not only depends on
rot a t i o n a l speed, but also on the l o c a l holdup r a t i o of material

i n the k i l n , and on the size and shape of p a r t i c l e s . They
have suggested that the mode of the bed behaviour may strongly
influence the transfer of heat i n the k i l n . The c r i t e r i a for
t r a n s i t i o n from slumping to r o l l i n g have not yet been well
defined.
In d u s t r i a l rotary k i l n s are rotated at speeds ranging
from 0.4 to 3 rpm depending on processes and sizes. The
diameters of t y p i c a l i n d u s t r i a l k i l n s are 1.8 to 5.9 m which,
in turn, have apparent c r i t i c a l speeds N c of 32 to 17 rpm.
Most i n d u s t r i a l k i l n s are thus operated at speeds of 0.1 > N/N c >. 0.01, where the surface of the bed i s expected to be
in r o l l i n g motion. For instance the 5.9 m diameter Stelco
k i l n (2) operates at a r o t a t i o n a l speed of 0.44 rpm or N/Nc =
0.0257.
Themelis, et a l (23) stated that r o t a t i o n a l speed was
the major factor of dynamic s i m i l a r i t y for scale-up. In view
of the types of motion of p a r t i c l e s i n a k i l n described above,
i t would be appropriate to say the f r a c t i o n of the c r i t i c a l
speed instead of the r o t a t i o n a l speed may be a better factor
to use, so that s i m i l a r i t y of bed motion be preserved i n
scale-up. According to the l a t t e r c r i t e r i o n , to scale-up a
laboratory k i l n of diameter 0.19 m with a r o t a t i o n a l speed of
3 rpm to an i n d u s t r i a l scale k i l n of 3.0 m diameter, the
rot a t i o n a l speed has to be reduced to 0.75'r.pm, according to
N = N 1 /ITyD" (2-2)

This should maintain the same pattern of bed motion. Details
of bed behaviour, s o l i d s motion, e f f e c t of p a r t i c l e size
d i s t r i b u t i o n and shape i n k i l n sections of various diameters
are under study by Henein, Brimacombe and Watkinson (22).
Kilns used i n i n d u s t r i a l processes have i n c l i n a t i o n o
angles of about 1-4 , that i s , considerably less than the
dynamic angle of repose, which i s about 30-40 for most s o l i d
materials. Thus the mass of material does not s l i d e a x i a l l y .
During rotation of the k i l n , i n d i v i d u a l p a r t i c l e s of free-
flowing material are reportedly (20) s h i f t e d along the axis
of the k i l n i n flattened h e l i c a l motion, the components of
which are the path of a p a r t i c l e i n the depth of the bed i n
the plane of rotation and a path on the surface of the charge
as shown i n Figure 2-3. A p a r t i c l e of material located i n the
bottom layer of the charge at point 1, during rotation, moves
together with the charge along the path arc 1-1'. Then by the
ef f e c t of the force of gravity, that p a r t i c l e r o l l s a short
a x i a l distance from point 1' along the slanting surface to
point 2, from which i t again t r a v e l s together with the charge
along the path 2-2', and emerges on the surface at point 2',
etc. The progressive a x i a l transport of the entire charge
re s u l t s , therefore, from the sum of the r o l l s of i n d i v i d u a l
p a r t i c l e s over the surface ( i . e . , 1-1' and 2-2') along the k i l n
However, t h i s picture i s probably v a l i d only for an i d e a l l y
r o l l i n g bed.

2.2 Retention Time and Holdup
One of the most important factors i n design of rotary
k i l n s i s the retention time or residence time of the charge
for heating or chemical reaction. As early as 1927, S u l l i v a n ,
Maier and Ralston (21) pioneered an extensive experimental
study of the e f f e c t s of operating parameters on retention time
in rotary k i l n s . The experiments were conducted i n 2.13 meter
long k i l n s with varying diameters of 0.076, 0.152, 0.292 and
0.5 meters. The parameters covered i n c l i n a t i o n angle,
ro t a t i o n a l speed, angle of repose, s o l i d feed rate, k i l n
diameter, temperature, and discharge co n s t r i c t i o n s . A wide
range of materials was employed i n t h e i r study, including
Ottawa sand, coal, sawdust, and copper slag. They found that
the retention time i s proportional to the square root of the
s t a t i c repose angle of the s o l i d , and inversely proportional
to k i l n diameter, r o t a t i o n a l speed, and i n c l i n a t i o n angle of
k i l n . As expected the time of passage i s independent of
temperature at least up to 1170 K. At fixed r o t a t i o n a l speed
and i n c l i n a t i o n angle the retention time for a given material
and k i l n size i s independent of the s o l i d feed rate over a
considerable range. Under these conditions increasing feed
rate r e s u l t s i n increasing hold-up of s o l i d s . The following
empirical relationship was presented for a k i l n with no d i s
charge co n s t r i c t i o n s ,
t = 1.77 L /§Z a Q n D (2-3)
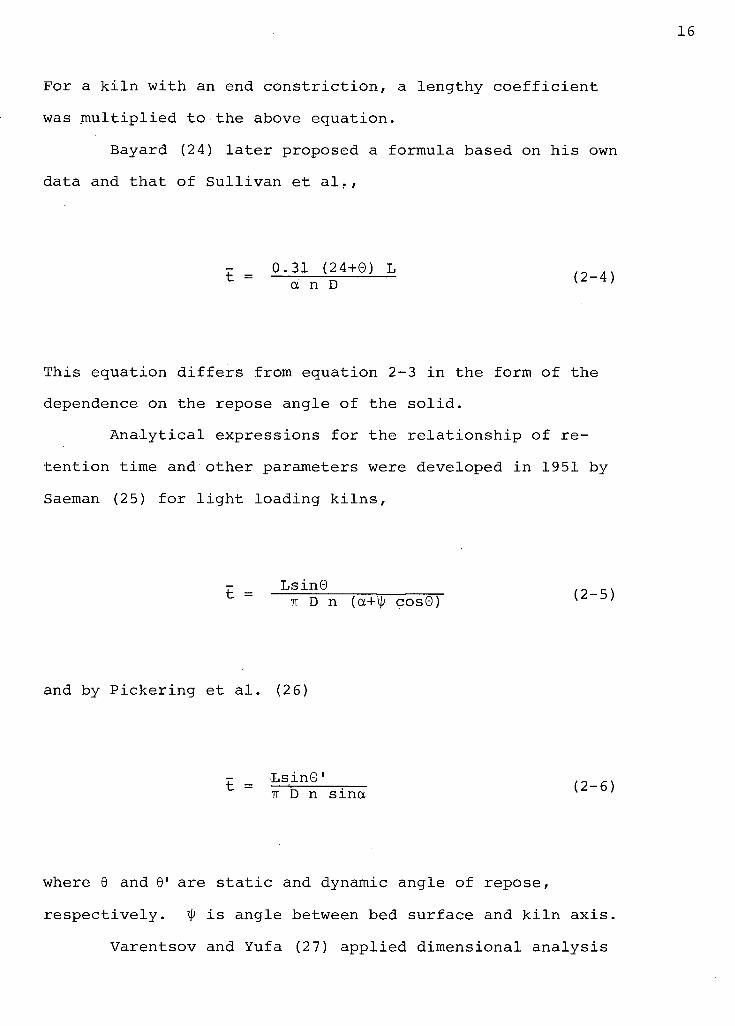
For a k i l n with an end c o n s t r i c t i o n , a lengthy c o e f f i c i e n t
was mul t i p l i e d to the above equation.
Bayard (24) l a t e r proposed a formula based on his own
data and that of Sullivan et a l . ,
t - °-31 ( ^ 4 + e ) L (2-4) a n D v '
This equation d i f f e r s from equation 2-3 i n the form of the
dependence on the repose angle of the s o l i d .
A n a l y t i c a l expressions for the relationship of re
tention time and other parameters were developed i n 1951 by
Saeman (25) for l i g h t loading k i l n s ,
L s i n 9 (2-5) IF D n (a+ty cos0) K D >
and by Pickering et a l . (2 6)
•LsinG' IT D n sma (2-6)
where 0 and 0' are s t a t i c and dynamic angle of repose,
respectively. i s angle between bed surface and k i l n axis.
Varentsov and Yufa (27) applied dimensional analysis

to investigate role of various factors a f f e c t i n g the moving
rate of s o l i d s i n a rotary k i l n . A series of experiments was
conducted i n k i l n s 6 m long with inside diameters of 0.3 and
0.55 m. S o l i d material used i n these tests included marble
chips, sand, coke and p y r i t e . Four p a r t i c l e size ranges were
investigated: 0.35-0.56, 1.51-1.70, 3.81-4.40 and 7.07-7.28 mm
The following equation was proposed:
r J U L 0. 01 -0.33 ,6.0.66 ,4^, 0.08 /*D.0.93 (2-7)
where m* i s a c o e f f i c i e n t depending on the k i l n diameter. The
value of m* was correlated by u t i l i z i n g the data of Sul l i v a n
et a l . for various diameters. For D= 0.5 m, the value of m*
i s 1.7 x 10~ 3; 0.75 x 10~ 3 for D = 1.0 m; 0.25 x 10~ 3 for
D = 2.0 m. Gas v e l o c i t y , i n equation 2-7, has l i t t l e e f f e c t
on retention time (t a Re^*^), and p a r t i c l e size doesn't
exercise a s i g n i f i c a n t influence as seen i n the equation since
the sum of the powers of p a r t i c l e s i z e , d , appearing i n Ga 1?
(-d •3 ) , 4d 2 /TT D2 Y| and d /D, i s 0.1. I t was also concluded that p p ' P gas temperature doesn't a f f e c t the s o l i d throughput i n the k i l n
The holdup, n , although appearing i n 4d 2/^D2"n, does not have
a s i g n i f i c a n t e f f e c t on retention time either.
Zablotny (20) also employed dimensional analysis and
carried out experiments i n a k i l n of 3.55 m long and 0.352 m
diameter. The following equation was presented,

The retention time, obtained from the r a t i o of bed
weight/discharge rate, gives the average time of sol i d s re
siding i n the k i l n by assuming uniform bed depth and constant
a x i a l volumetric rate of sol i d s along the k i l n . These
assumptions are not always v a l i d i n i n d u s t r i a l k i l n s where
the bed depths along the k i l n are not uniform or the p a r t i c l e s
change i n physical properties due to reaction or drying.
Vahl and Kingma (2 8) showed that d i f f e r e n t i a l s i n bed
height ex i s t along a horizontal rotating cylinder and thus
solids can be transported continuously through i t . This
contradicts the empirical equation of Su l l i v a n et a l . , according
to which the transport would be n i l in horizontal rotary k i l n s .
Vahl and Kingma derived a d i f f e r e n t i a l equation which related
the s o l i d throughput to the bed height T with distance x from
the feed for a horizontal cylinder. Based on t h i s equation
Kramers and Croockewit (2 9) introduced the i n c l i n a t i o n angle
and gave the following equation for rotary k i l n s :
F 4 * (tana _ dr x _ j | V* ( 2 _ 9 )
3 sinB dx R R
By approximation of
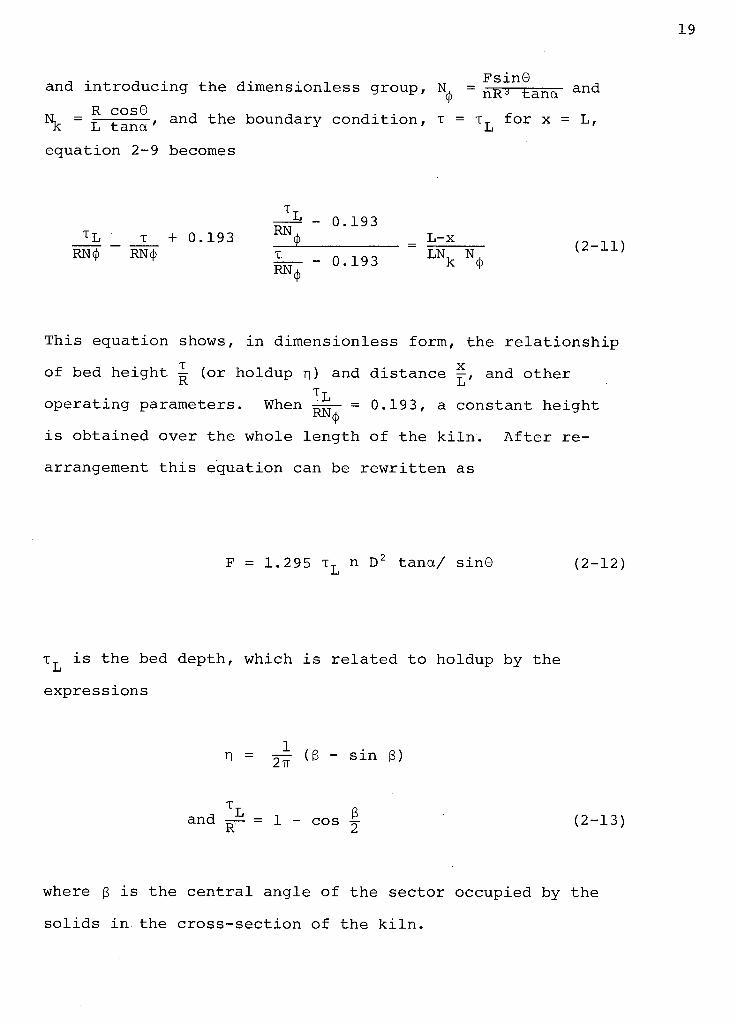
-,. . FsinG and introducing the dimensionless group, = n R 3 - ) - a n a and
®k ~ L tana ' a n c^ t^ i e boundary condition, x = x L for x = L, equation 2-9 becomes
- 0.193 + 0.193 L-x
RN<J> RN(j> X _ 0 _ 1 9 3 LN k (2-11)
RN^
This equation shows, i n dimensionless form, the relat i o n s h i p
of bed height =- (or holdup n) and distance —, and other K Li
operating parameters. When ^ = 0.19 3, a constant height
i s obtained over the whole length of the k i l n . After re
arrangement t h i s equation can be rewritten as
F = 1.295 x L n D2 tana/ sin9 (2-12)
x T i s the bed depth, which i s related to holdup by the L expressions
n = ^ (3 - si n 3)
and = i - cos % (2-13)
where 3 i s the central angle of the sector occupied by the
solids i n the cross-section of the k i l n .

The retention time can be derived from the r a t i o of
bed weight/solid throughput,
IL 4" D2 Ln (2-14)
Substitution of equations 2-12 and 2-13 into equation 2-14
and approximation of tan a - a yields
- = LsinG n D a 1-cos f
The retention time for a uniform bed depth i s thus not
only a function of the group, LsinO/nDa, but also depends on
holdup n.
Saeman (25) obtained a sim i l a r a n a l y t i c a l expression
for an i n c l i n e d k i l n with various degrees of loading,
F = 4- n D 3 s i n 3 £ (i^cosG + a) / sinQ (2-16) b 2
For uniform bed depth, cos6 = o, and substitution
of equation 2-13 into equation 2-11 gives
- = LsinG _ n _ ^ ( 2 _ 1 7 )
nDa s i n 3 |
The retention time i n t h i s equation has a d i f f e r e n t
dependence of holdup term from equation 2-12. (Note that 3
i s function of n).
From equation 2-9 one w i l l note that there are four
operating parameters, which are i n t e r r e l a t e d i n a rotary
k i l n operated at uniform bed depth: s o l i d throughput,
holdup, r o t a t i o n a l speed and i n c l i n a t i o n angle. For example,
at constant holdup and i n c l i n a t i o n angle, r o t a t i o n a l speed
can not be increased without s o l i d throughput being increased.
Thus, three of the four operating variables i n a uniform bed
depth k i l n are independent.
2.3 Residence Time D i s t r i b u t i o n
The conversion of so l i d s i n a rotary k i l n reactor
depends not only on chemical parameters and the mean residence
time of p a r t i c l e s i n the reactor but also, i n general, on
the spread i n residence times and the way the spread i s
brought about. It i s therefore important to know what
spread in residence time d i s t r i b u t i o n i s caused by the flow
pattern of the solids i n the k i l n . As indicated above, the
p a r t i c l e s i n a rotary k i l n have v e l o c i t y components i n both
the longitudinal (axial) d i r e c t i o n and the transverse (radial)
d i r e c t i o n . Due to t h e i r more or less random behaviour, the
movements are often described mathematically by a type of
d i f f u s i o n or mixing c o e f f i c i e n t , i n the a x i a l and r a d i a l
d irections. The a x i a l v e l o c i t y p r o f i l e as well as the a x i a l
mixing c o e f f i c i e n t w i l l contribute to a spread i n residence

time. Conversely, the r a d i a l mixing c o e f f i c i e n t w i l l
diminish the e f f e c t of the a x i a l v e l o c i t y p r o f i l e and
thereby reduce the spread i n residence time. In a rotary
k i l n the r a d i a l mixing c o e f f i c i e n t causes a more or less
uniform d i s t r i b u t i o n of element p a r t i c l e s over the cross-
section of the k i l n , which tends to make the r a d i a l gradient
of s o l i d concentration i n a reacting system zero.
A survey of the mixing of granular materials i n
rotary cylinders has been given by Rutgers (19) together
with some experimental data on a x i a l dispersion. A 0.16 x
0.50 meter rotary cylinder was equipped with varying dimen
sions and shapes of the i n l e t and outlet sections, which
resulted i n various holdups of the s o l i d s . His r e s u l t s
showed that a x i a l dispersion c o e f f i c i e n t i s d i r e c t l y pro
portional to the square root of r o t a t i o n a l speed at constant
residence time i n a horizontal cylinder, and approximately
inversely proportional to the square root of holdup at
constant r o t a t i o n a l speed. The Peclet number i n his work
i s i n the order, of magnitude of two to three.
Tracer methods are usually used to study residence time
d i s t r i b u t i o n . In rotary k i l n tests tracer p a r t i c l e s i d e n t i c a l
to the feed except for color are rea d i l y prepared by use of
food dyes. If c , the i n i t i a l concentration of tracer par
t i c l e s , represents the number of tracer p a r t i c l e s injected
divided by the t o t a l weight of p a r t i c l e s i n the holdup volume, x t -and c (C,z) i s the concentration at z = — and <; = — (t, L t
average residence time), then the a x i a l dispersion model for

the tracer i n dimensionless form i s (30, 31, 32):
3C(g,z) 3C(g, z) = 1 8 2C(g,z) (2-15) 3'C 9? Pe 9 z 2
where C(e.,z) = c ( e , z ) / c Q
and Pe = uL/n Peclet number
For an impulse input of tracers injected into the
i n l e t of the rotary cylinder, which i n i t i a l l y contained no
tracer, Abouzeid et a l . (30) presented the following set of
i n i t i a l and boundary conditions
C(o,z) = o
' a c ( c i ) =
9z
where 6 (?) = 1 £ = o
= o 5 > o
Moriyama and Suga (32) replaced the second boundary condition,
(2-16a)
(2-16b)
(2-16c)
equation 16c, with
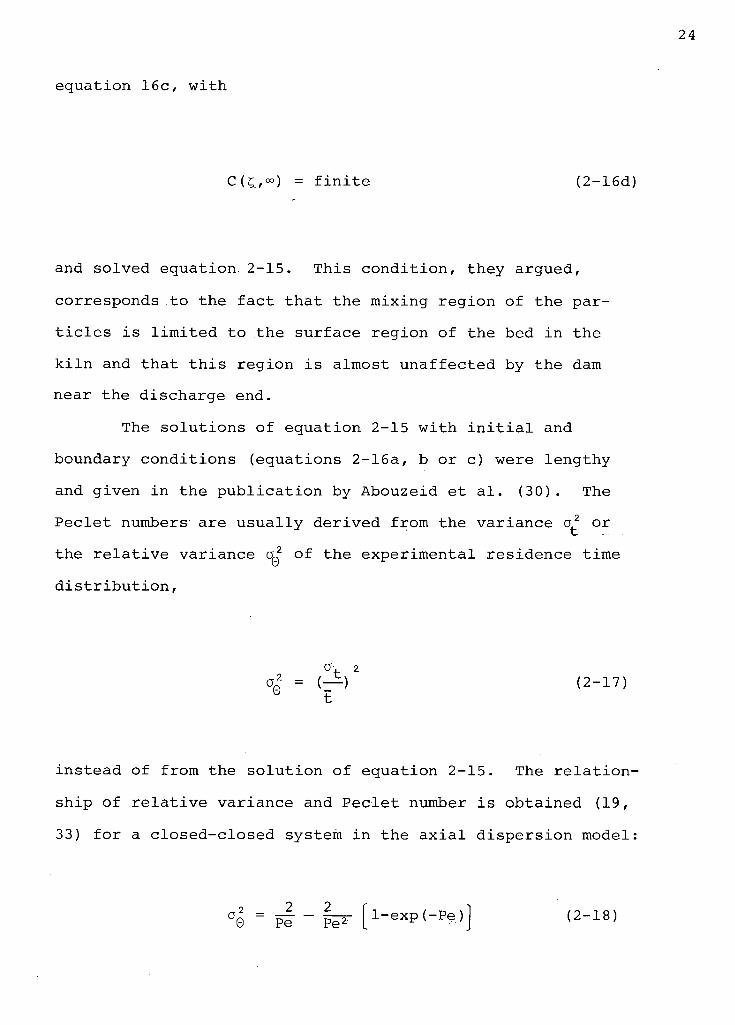
C(C,°°) = f i n i t e (2-16d)
and solved equation 2-15. This condition, they argued,
corresponds to the fact that the mixing region of the par
t i c l e s i s lim i t e d to the surface region of the bed i n the
k i l n and that t h i s region i s almost unaffected by the dam
near the discharge end.
boundary conditions (equations 2-16a, b or c) were lengthy
and given i n the publication by Abouzeid et a l . (30). The
Peclet numbers are usually derived from the variance o 2 or
the r e l a t i v e variance OQ of the experimental residence time
d i s t r i b u t i o n ,
instead of from the solution of equation 2-15. The r e l a t i o n
ship of r e l a t i v e variance and Peclet number i s obtained (19,
33) for a closed-closed system i n the a x i a l dispersion model:
The solutions of equation 2-15 with i n i t i a l and
0 (2-17)
(2-18)

The values of Pe, i n rotary k i l n s , are large enough that
the following approximation i s v a l i d .
Pe - — - (2-19) 0-
Moriyama and Suga (32) applied dimensional analysis
to obtain the relationship of Pe and other operating variable
Based on t h e i r data on a p l a s t i c horizontal cylinder (0.20 x
2.0 meter) and that of Matsui (34), the following equation
was presented,
i ,w^3^0.516 , T _ 0.524 ,„ ^ 5.55-0.604f Pe = 1.06 x 10 4 (F/D n) J J- U ( L / D ) u ' - ^ (&./D) (2-20)
where f i s f r i c t i o n c o e f f i c i e n t (= tanO 1). The Peclet number
in t h e i r studies are i n the range of 250-5000. A x i a l d i s
persion c o e f f i c i e n t s were found to be d i r e c t l y proportional
to r o t a t i o n a l speed.
The ef f e c t s of operating parameters i n addition to
rot a t i o n a l speed on residence time d i s t r i b u t i o n were reported
by Abouzeid, et a l . (30). The experiments were conducted i n
a small scale cylinder of 0.08 x 0.24 m. It was found that
the a x i a l dispersion c o e f f i c i e n t increases with increasing
i n c l i n a t i o n angle, r o t a t i o n a l speed and s o l i d feed rate, but

26
i s independent of particle s i z e . Lu, et a l . (35) applied a
multi-stage combined model to describe the mixing condition
of p a r t i c l e s i n a rotating cylinder with cross a i r flow.
The model consisted of a series of stages, each stage com
p r i s i n g a plug-flow reactor, a complete-mixing reactor with
back flow and a dead volume. Although the model was claimed
to f i t t h e i r experimental data well, the resultant equation
i s probably too complicated to be p r a c t i c a l and requires too
many parameters to be sp e c i f i e d .
A study of the e f f e c t of p a r t i c l e segregation on
p a r t i c l e motions was presented by Sugimota and co-workers
(36-38). The e f f e c t of cross a i r flow was shown by Lu, et
a l . (35).
The transport of sol i d s i n rotary cylinder devices i s
well represented by the a x i a l dispersion model according to
several investigators, (30-32). Unfortunately there are no
detailed data to predict the values of D except the co r r e l a
t i o n equation of Moriyama and Suga (equation 2-2 0) . This
equation was established from the data obtained from
laboratory scale horizontal cylinders of L/D - 10.
The re s u l t s of several investigations on the r e l a t i o n
ship of a x i a l dispersion c o e f f i c i e n t and r o t a t i o n a l speed are
compared i n Figure 2-4. As shown i n the figure there i s
s t i l l no agreement on how the a x i a l dispersion c o e f f i c i e n t i s
related to r o t a t i o n a l speed, i . e . whether D N or D <* / N or other
types. As well, the dispersion c o e f f i c i e n t s d i f f e r by an
order of magnitude depending on the physical properties of the

CM E
x o
U J
o
X <
60
4 0
30
20
10
— i — i — i i n n 1 1 — i — i i t i n
Matsui ,0.2m Dx 1.86 m. L , dp = 11.2 mm. Sugimoto,et a l , 0.255 x 0.6m, dp =13mm. Rutgers, 0.16 x 0.50m, dp = 1.9 mm. Moriyama a Suga, 0.20 x 2.0m., dp =2.87 mm. Abouzeid , et a l , 0.08 x 0.24 m., dp =.35 mm.
UJ 8 8.0
6.0 •z. o
2 4.0 U J
a- 3.0 CO o
20
1.0
0.8
0.6
•
A
V / •
J__J L 3 5 10 20 30
ROTATIONAL SPEED, rpm.
M M . 50 100
Figure 2-4 Relationship o f . A x i a l Dispersion C o e f f i c i e n t and Rotational Speed.

particulate material (par t i c l e s i z e , i n t e r n a l f r i c t i o n ,
shape), k i l n dimensions, degree of f i l l , and s o l i d through
put. There are very few data points i n the r o t a t i o n a l speed
region t y p i c a l of the rotary k i l n . As indicated i n equation
2-20 the r a t i o of L/D has a s i g n i f i c a n t e f f e c t on Peclet
number. In t y p i c a l i n d u s t r i a l k i l n s (39) the r a t i o of L/D
ranges from 14 for petroleum coke k i l n s to 30 for long lime
k i l n s . However the experimental k i l n s used for the RTD
experiments have a smaller L/D r a t i o , about 3 for cylinders
of Rutgers, Abouzeid et a l . and Sigumoto et a l . , and about
10 for Matsui and Moriyama and Suga. These investigators
did not study the influence of L/D.
Wes et a l . (31) used an i n d u s t r i a l scale drum, 0.6 m
I.D. x 9.0 m long to study the RTD. In t h e i r experiments
the samples were taken at 3.65 m from the entrance and at the
end of the rotating drum, which may represent two d i f f e r e n t
L/D r a t i o s . The re s u l t s of t h e i r experiments are given i n
Table 2-1. Pe increases from 55 to 204 at N=6 rpm, and from
46.9 to 145 at N=2 rpm, when L/D increases from 6.09 to 15.
This suggests that the Peclet number i n i n d u s t r i a l k i l n s may
be even higher. This high Peclet number then characterizes
the s o l i d flow i n a rotary k i l n as e s s e n t i a l l y plug flow (33).
2.4 Surface Time
The surface time i s the time the i n d i v i d u a l p a r t i c l e
spends on the aerated surface layer before i t returns to the
bed. After residing i n the bed and moving along with the wall,

29
TABLE 2-1
Ef f e c t of K i l n Length on D and Pe (Wes, et. al.)
L L/D N n t D p e
(m) (-) (rpm) (%) (s) (m2/s) (-)
3. 65* 6.08 6 20.1 2.33xl0 3 10.4xl0~ 5 55.1 6 20.0 2.26 12.3 47.9 2 35.4 3.97 7.15 46.9
9 15 6 19. 8 5. 63 7.05 204 6 19. 8 5.65 7.59 189 2 31.4 8.94 6.24 145
*The midway distance where samples were taken.

i t returns to the surface layer. The time t h i s p a r t i c l e
resides i n the bed i s referred as bed time. The sum of
surface time and bed time i s c a l l e d the cycle time. Cycle
time, surface time and bed time are functions of r o t a t i o n a l
speed, holdup, k i l n diameter, p a r t i c l e physical properties
and r a d i a l p o sition i n the k i l n . Since the p a r t i c l e travels
along the k i l n i n a h e l i c a l motion, cycle time, surface time
and bed time are defined as averages taken over a certain
length of the k i l n .
Surface time i s expected to be important i n heat
transfer processes where p a r t i c l e s i n the surface layers are
exposed to hot gases. Heat transferred from the gas phase
to the surface layer of the so l i d s i s d i s t r i b u t e d to the bulk
material by s o l i d mixing taking place i n the c i r c u l a t o r y bed.
In a d i r e c t f i r e d k i l n i t has been estimated (18) that sur
face temperature w i l l r i s e by 8 0 K i n 0.1 seconds, and by
270 K i n one second, i n which l a t t e r period the surface i s
renewed. At a depth of 1 mm below the surface layer the heat
supply may account to only one percent of that radiated to
the surface. Surface time i s also believed to play an im
portant role i n the convective heat transfer process. The
experimental r e s u l t s of Wes et a l . (31) showed that some sort
of penetration mechanism might exi s t for convection from the
gas to the downflowing p a r t i c l e s . Thus, according to
penetration theory, a short surface time gives a higher
average heat transfer c o e f f i c i e n t . In addition a short time
yiel d s more p a r t i c l e s flowing down the surface that c e r t a i n l y
increases the heat flux.
Although heat transmission by r a d i a t i o n and convection
to the aerated surface layer i s important, there i s very
l i t t l e information i n the l i t e r a t u r e about surface time
except from the work of Hogg, Shoji and Austin (40). They
reported that i n t h e i r rotary cylinder, 0.095 m i n diameter
and 0.248 m long the f r a c t i o n of surface time to cycle time
i s 0.49 at a rotating speed of 90 rpm or N/Nc =0.64. In
a rotary k i l n where rotating speeds are operated below 6 rpm,
the f r a c t i o n of surface time to cycle time i s far below 0.49.
There i s also lack of information i n the l i t e r a t u r e
about the thickness of the surface layer. It i s believed that
the thickness depends on r o t a t i o n a l speed, i n t e r n a l p a r t i c l e
f r i c t i o n , i n c l i n a t i o n angle, holdup, etc. In rotary soda
calciners (3) the thickness of the layer was stated t h e o r e t i
c a l l y equal to the diameter of the p a r t i c l e s at 4 rpm where
the r o l l i n g pattern s t a r t s . No sizes of the calciners and
the p a r t i c l e s were given.
In the present work some experiments are c a r r i e d out
to study the influence of operating variables on surface time,
and a f i l m study on the thickness of the surface layer i s
reported.
2.5 Heat Transfer
Bowers and Reed (41) correlated heat transfer data
from four i n d u s t r i a l k i l n s : limestone c a l c i n a t i o n , dry cement
burning, dolomite c a l c i n a t i o n and shale expansion. From the

former two kilns-they concluded that the o v e r a l l gas-bed
heat transfer c o e f f i c i e n t has the following rel a t i o n s h i p
with k i l n diameter,
U q = 18.6 D (2-21)
where U q : o v e r a l l gas-solid heat transfer
c o e f f i c i e n t (W/m3K)
D : k i l n diameter (m)
Equation 2-21 i s obviously unsatisfactory for design purposes
and can only show the order of magnitude of heat transfer
c o e f f i c i e n t s , because the co r r e l a t i o n was based on a lim i t e d
number (6) of scattered data. It also excludes the ef f e c t s
of r o t a t i o n a l speed, s o l i d and gas throughput, i n c l i n a t i o n
angle, p a r t i c l e size and does not r e f l e c t the complexity of
the actual process that occurs i n the k i l n .
2.5a Conduction
Heat transmission by conduction occurs at the under
side of the bed which i s i n contact with the rotating wall.
At the moment when the p a r t i c l e s return from the surface
layer to the bed, i n which they become at rest r e l a t i v e to
the wall and to t h e i r neighbours, the p a r t i c l e s adjacent to
the wall receive heat from the wall (Point A i n Figure 2-5),

N
A R E A 0, =AREA 0 2
Tw i . AREA
0 2
I
Ts
I
y = 0 y=d
Figure 2-6 Penetration Model for Bed-to-Wall Heat Transfer Proposed by Wachters and Kramers (3).

u n t i l they move up to the point (B i n Figure 2-5) and r o l l
on the surface again. Therefore, Wachters and Kramers (3),
Wes et a l . (42), Lehmberg et a l . (43) and Nikitenko (44)
proposed an unsteady state penetration model for heat con
duction. The following assumptions were made:
a) The temperature of the bulk material far from the
wall i s constant during the contact time t c .
b) The region at the wall i n which heat conduction
takes place i s thin compared with the radius of
the cylinder, so that the curvature may be neglected.
c) Tangential heat conduction can be neglected.
d) At t - o the contents of the wall layer are mixed
with the bulk material.
A heat balance for a circumferential element consisting
of p a r t i c l e s adjacent to the wall y i e l d s
where a i s the heat d i f f u s i v i t y of p a r t i c l e s , m2/s. The
i n i t i a l and boundary conditions used by Wes et a l . were
9 2T (2-22) — = a at
T(o,y) = T s
T(t,o) = T w (2-23)
T(t,°°) = T ' s

Experimental measurements were made by Wes et a l . i n an
i n d u s t r i a l scale drum of 0.6 x 9.0 m. Potato starch and
yellow dextrine so l i d s with p a r t i c l e sizes of 15~100 ym,
were used i n the heating process to determine heat transfer
c o e f f i c i e n t s , h from the wall to the s o l i d s . The experi-ws mental re s u l t s were claimed to be i n agreement with the
following equation, which i s derived from the simple
penetration model with equation 2-2 3.
2 k ws h = - or 2 k /~"n~ (2-24)
/uat b v a3 c
Nikitenko (44) used the following set of i n i t i a l
and boundary conditions.
T (0,y) = T s
T (t,0) = T (2-25) w dT (t,°°) = T (0,y)
dy
and obtained the following rel a t i o n s h i p .
(2-26)

No explanation was made of the use of the l a s t boundary
condition, and no experimental re s u l t s were displayed i n
his paper.
In a study by Wachters and Kramers ( 3 ), experiments
were conducted i n a 0.152 x 0.475 m copper cylinder and
values of hi, were reported to be 1/3 to 1/2 of those ws c ' predicted from equation 2-24. They assumed that whereas
the bulk of the granular bed has a uniform temperature there
i s a thin layer at the wall always consisting of the same
p a r t i c l e s arid that when these r o l l back, they only mix
among themselves. Based on these assumptions, the wall
layer d' i n thickness, was proposed that was i n i t i a l l y at
a temperature T^ for o<y<d" as given i n Figure 2-6. The
average temperature of the layer was assumed to not change
during the time of contact, etc. Thus the following boundary
conditions were used,
T (o, o<y<d) =
T (o, y>d) = T s
T (t,o) = T w
T (t,°°) = T„
Their experimental re s u l t s indicated that at higher speed
(or lower t ) where d'> 4/at , the wall layer reduces the

heat transfer c o e f f i c i e n t s by a factor of 3 with respect
to that obtained from a simple penetration model,
h 2 k.
ws 3 /irat. 10 rpm < N < 40 (2-28)
At r e l a t i v e l y low speed (high contact time, t c ) , h>-
gradually changed according to
h ws /iTatc
2 k. 2 k. d' -1
N < 10 (2-29)
The^wall layer thickness, d', was obtained by extrapolating
the experimental data from the above equation,
d' = 1.12 x 10~ 3 /3 (2-30)
The values of d' were 1.8 mm and 1.5 mm with 6=2.53 and
1.83 radians, respectively i n t h e i r experiments. However
the dependence of d 1 in equation 2-30 on 3, the central angle

of the s o l i d s bed, can not be p h y s i c a l l y explained.
Recently Lehmberg et a l . (43) introduced the concept
of the presence of a gas f i l m between the wall and the
solids into the penetration model. The presence of a
gas f i l m was also recognized by Epstein and Mathur (45)
for wall to bed heat transfer i n the annulus of a spouted
bed. In order to f i t t h e i r own experimental data Lehmberg
et a l . proposed two heat transfer regions near the wall.
The simple penetration model as given i n equation 2-24 was
applied i n the region between the wall and 6 , the thickness
at the contact point between wall and p a r t i c l e . The basis
of the model i s i l l u s t r a t e d i n Figure 2-7. In the second
region, bounded by 6^ and the p a r t i c l e radius, the gas f i l m
was added to the model. In addition to the f i r s t parameter
6 , they introduced a second parameter h 1 , (termed the r e l a
t i v e heat transfer c o e f f i c i e n t ) , which i s the r a t i o of the
gas f i l m heat transfer c o e f f i c i e n t h_' to the e f f e c t i v e
thermal conductivity of s o l i d s , k . The o v e r a l l wall-bed J s
heat transfer c o e f f i c i e n t s across these two regions was
given i n lengthy form as follows:
g
h ws 1 +
h'1/atT
2 2 exp (h1 at ) erfc (h' at ) c c
where h 1 = h g (2-31) k s

39
I
9 ^ — i
Figure 2-7 Two-region Penetration Model for Wall-Bed Heat Transfer Proposed by Lehmberg et a l . ( 43)

By adjusting the values of h 1 and .6 equation 2-31
was reported i n good agreement with t h e i r own experimental
data. 6^ was found equal to 9ym, compared to the p a r t i c l e
sizes of 157, 323, 794 and 1038 um. The mean thickness of
the gas f i l m ( V h 1 ) increases with increasing p a r t i c l e
sizes; The parameters, h 1 and 6. were determined
experimentally, therefore equation 2-31 for wall to bed
heat transfer c o e f f i c i e n t i s not r e a d i l y used for design
purpose. For long contact time, <$u was also reported to
be a function of time. In addition equation 2-31 can not
f i t the data of Wes et a l . unless h' -> °° (or Vh'-*- 0).
Since no model yet proposed could s a t i s f a c t o r i l y
represent a l l the published experimental data, an attempt
was made in t h i s work to correlate a l l the available data
within the frame of the penetration model. This c o r r e l a t i o n
i s discussed i n Chapter 6.
2.5b Convection
The following empirical rel a t i o n s h i p
h = 0.0981 G ° ' 6 7 (2-32) gw g
where G = gas mass flux kg/hr m2 (cross section kiln)
i s recommended by Porter et a l . (46) for the convective heat
transfer c o e f f i c i e n t from gas to wall i n a rotary k i l n , and
i s also used to predict the gas to bed c o e f f i c i e n t . In an

e a r l i e r publication (47) the same authors used an equation
with a smaller exponent on gas mass flux, and which included
the e f f e c t of k i l n diameter:
h = 0.0608 G °' 4 6/D gw g '
(2-33)
A t h i r d expression used for convective heat transfer
c o e f f i c i e n t i n k i l n s i s a modified Nusselt type equation for
heat transfer i n tubes,
2 k Du P u C n7Rfi /->o/i\ h = 5 . 2 x 1 0 " < _ i L - a . ^L_£g_)0-786 (2-34) gw VD ' u k g g
Gygi (48) used t h i s expression to calculate convective heat
transfer c o e f f i c i e n t for cement k i l n i n the preheating zone.
However, no expression has been reported to evaluate
heat transfer c o e f f i c i e n t from the gas to the s o l i d bed.
Several investigators (5, 12) have used equation 2-32 for gas
to wall convection to calculate heat flow from gas to charge.
The area i s taken to be the chord length times the k i l n length
This convective c o e f f i c i e n t i s apparently independent of the
speed of rotation, p a r t i c l e s i z e , and i n c l i n a t i o n of the k i l n
The equations h = h = 0.023 ^ R 0 - 8 P °' 4 were also used gs gw D e r for modelling iron ore reduction (9) and h = h = c(k D)^*
gs gw g

0 8 (U /C ) for an alumina k i l n (6). In other modelling g pg studies s p e c i f i c values were used with no reported j u s t i f i cation including h =22.8 W/m2K, h =28.4 W/m2K for wet
^ gs ' gw ' ' process cement k i l n s (7,8); h = h = 14.0 W/m2K for a ^ gs gw li g h t weight aggregate k i l n (11); and h =1.5 W/m2K for
gs a rotary k i l n heat exchanger (15).
Wes et a l . (42) published experimental values of 5.1
and 4.9 W/m2K for wall to a i r heat transfer c o e f f i c i e n t i n
an empty drum equipped with f l i g h t s , with 550 and 336 kg/hr
m2 a i r mass flux, respectively. They also reported l o c a l
convective heat transfer c o e f f i c i e n t s from potato starch
and yellow dextrine to cool a i r i n a horizontal rotating drum.
The results are given i n Figure 2-8. Wes et a l . claimed
there might exi s t a kind of penetration mechanism for the
heat transfer to the down flowing so l i d s on the surface be
cause of a li n e a r r e l a t i o n s h i p of nS g . a between 3 rpm
to 6.5 rpm. One can conclude from the work of Wes et a l .
that the gas to so l i d s convection c o e f f i c i e n t i s roughly 12
to 2 5 times the magnitude of the gas to wall convection
c o e f f i c i e n t i n a rotary k i l n with low f l i g h t s . Friedman and
Marshall (49) gave h g g of 26.5 W/m2K at G g = 782 kg/hr m2
a i r mass rate, and of 20.4 and 38.2 W/m2K at G g = 15.60 kg/
hr m2 .
Brimacombe and Watkinson (4) recently reported
experimental data of 120 to 240 W/m2K for gas to solids
convection c o e f f i c i e n t s . The experiments were conducted i n
a p i l o t scale f i r e d rotary k i l n , which has 0.406 m I.D. and

4 3
LJ r r CM R £
Li- \ L U ^
O -
o or LU u_ CO 2 <
Q
L U
or co "~ Q ^ d L U C O
X
s g
150
100 9 0 80
70
60
50
4 0
Wg:
Wes et al .
Distance from Air Entrance:
3 0 1 1 15 2 3 4 5 6
ROTATIONAL SPEED N, rpm
8
Figure 2-8 Convective Feat Transfer C o e f f i c i e n t from Bed to A i r , Data of Wes, et a l (42)

5.5 m long. The gas flow rates ranged 545 to 820 kg/hr m2
with average temperature, 675 to 830 K, and the s o l i d
throughput were 70 to 135 kg/hr. Their data show that heat
transfer c o e f f i c i e n t increases with increasing gas tempera
ture and gas flow rate, and the e f f e c t of s o l i d throughput
i s i n s i g n i f i c a n t .
Chen et a l . (50) studied the e f f e c t of a i r cross
flow on the gas to p a r t i c l e heat transfer i n a rotary dryer.
The dryer was constructed with two concentric cylinders.
The inside cylinder was o.l5 m in diameter and made of per
forated plate with 1.5 mm holes, 10 mm square p i t c h , covered
by a screen of 150 mesh. Hot a i r was allowed to flow through
the annualar space into the inside cylinder. The heat
transfer c o e f f i c i e n t s between gas and p a r t i c l e s were found .
to be i n the same range of the data i n the fixed bed.
2.5c Radiation
The Stefan-Boltzmann equation has been widely used
for the thermal analysis of a rotary k i l n , due to the lack
of reported data. The radiative heat transfer c o e f f i c i e n t
i s strongly dependent on the form, (1\ "*-T_. k ) / (T\-Tj ) .
Table 2-2 l i s t s equations used for radiant heat transfer by
several investigators who were modelling rotary k i l n s . A
similar table was drawn up by Venkateswaren (54). The
temperature dependence of Lyon et a l . was s i m p l i f i e d to
2(T^ 3 + T j 3 ) . These sets of equations have d i f f e r e n t values
of factors which are dependent on e m i s s i v i t i e s of gas, s o l i d

and wall. Kaiser and Lane (51) have recommended i n Saas 1
equations that the term fe i n h should be replaced by S W S / J*T
the expression of Eckert and Drake (52) given i n Table 2-2
which take's into-account re-radiat'ion •.from- s o l i d s . T g , the sol
bed temperature, was used i n the equations shown i n Table
instead of the bed surface temperature. The l a t t e r may be
larger than T g by a few hundred degrees as indicated by
Luethge (53). Since radiation takes place to the aerated
charge surface, the calculated value of h r based on the
equations i n Table 2-1 would appear to overestimate the
radiation contribution.

TABLE 2-2 Radiant Heat Transfer C o e f f i c i e n t
I n v e s t i g a t o r s h gw,r gs,r ws, r
Saas (12)
Lyons et a l . (7)
Toyama et a l . (11)
Manitius et a l . (6)
Riffaud et a l . (5)
pe (T -T h)/(T -T ) g g w " v g w'
2pe e (T 3+T 3) g w s w
[ l+(l-e J (1-e J -M**£w£s L g 3'A-
g w T - T g w
4.96xl0~8 e f e T "-E (T" )T "1 w ^ g g g w w J
pe (T "-T ")/(T -T ) 9 9 w g w'
pe (T -T ")/(T -T ) 9 9 s 9 s'
2pe e (T 3+T 3) p g s g s
£ e e 1+(1-e )(1-e M s g L_ w A , _9 s_ T -T -
9 s
4.96x10 e f e T s I g g g
pe (T ' ' - T " ) / ( T - T ) g g s " s s
<Ts)Ts*'
2 ( > ~ - z e (T 3+T 3) A s w w s ' s A T —T 4
£ e„e (1-e )--s- w s
M S Wv g'A T - T 3 w w s
4.96x10 e e s w
P E * ( T ; - T S - ) / ( W
Wingfield et a l . (9) pe (T 1*-T ")/(T--T ) g s w • 1 g w Pe g(T g*-T sV(T g-T s) pe (T - T ) / (T -T ) s v w s ' w s'
( A £ s f i s recommended (47) by substitution of ^- + (— - 1) 1 ~ 1
** M = 1 - (1-e ) (1-e )' w g , 1- (e + .e - e e ) s g s g A * e. function of e and e 1 s w

CHAPTER 3
SCOPE OF PRESENT WORK
As has been shown above few experimental data on heat
transfer c o e f f i c i e n t s have been published for convection i n
rotary k i l n s . No systematic study of the e f f e c t s of
operating parameters on convective heat transfer could be
found i n the l i t e r a t u r e . Some equations (46,4 7,48) have
been proposed for the convection process, but none have had
experimental v e r i f i c a t i o n , and included e f f e c t s of
operating parameters other than gas v e l o c i t y .
It was the objective of the present work, therefore,
to make an experimental study of the influence of k i l n
operating parameters on convective heat transfer c o e f f i c i e n t s
i n a non-fired rotary k i l n . Conditions were chosen to mini
mize radiative e f f e c t s . The parameters to be studied
included k i l n r o t a t i o n a l speed, i n c l i n a t i o n angle, gas v e l o c i
s o l i d charge feed rate, degree of f i l l , p a r t i c l e size and tem
perature.
In order to understand the heat transfer process,
knowledge of the p a r t i c l e motion i n the k i l n i s required.
The secondary objective, therefore, was to study the r e l a t i o n
ship of s o l i d charge feed rate, charge load, k i l n r o t a t i o n a l
speed and i n c l i n a t i o n angle, e s p e c i a l l y under conditions of

uniform bed depth along the k i l n . I t was also intended to
investigate the factors influencing the time p a r t i c l e s
spend on the surface of the bed. A b r i e f study of residence
time d i s t r i b u t i o n i n the k i l n was also included i n t h i s work.
With t h i s experimental information, a model of the
convection process i n a rotary k i l n was to be formulated
and design equations presented.

49
CHAPTER 4
APPARATUS AND MATERIALS
4.1 Apparatus
A schematic diagram of the experimental system used
for heat transfer and p a r t i c l e motion experiments i s shown
in Figure 4-1. I t consists of f i v e primary components:
the rotary k i l n , the s o l i d feeding system, the receiving
system, the a i r heating system and the instrumentation and
recording system. Two k i l n s of the same size were used.
A l u c i t e cylinder was primarily used i n the investigation
of p a r t i c l e motion i n the k i l n , and a steel cylinder was used
for the heat transfer experiments.
4.1a Kilns
The transparent l u c i t e rotary cylinder was 2.44 m i n
length, 0.1905 m I.D. and 6.35 mm i n wall thickness, and
provided with end flanges of 0.2 54 m diameter. The sol i d s
i n l e t flange had an opening of 0.076 m diameter, whereas
three d i f f e r e n t flanges with openings of 0.133, 0.114 and
0.089 meters were used at the sol i d s outlet end to maintain
the desired bed depths. During the i n i t i a l experiments s l i p
was found between the smooth k i l n wall and the sol i d s bed.

Figure 4-1 Schematic Diagram of Apparatus.

TABLE 4-1
to Figure 4-1
Rotameter
End box
Temperature c o n t r o l l e r
Variable speed drive
Soli d receiving cone
Screw feeder
Chain and sprocket
E l e c t r i c furnace
Rotary k i l n
Funnel and chute
Dam
Suction pump
Temperature recorder
S l i p ring
A i r temperature probe
Solids bed temperature probe
Wall temperature probe
2.54 cm s t e e l pipe
Suction l i n e
Potential transmitting l i n e

Eight equally spaced s t r i p s were then glued along the i n t e r i o r
surface of the cylinder, p a r a l l e l to i t s longitudinal axis.
The s t r i p s were 4.80 mm wide and 3.2 mm high. The cylinder
sat on six metal 0.067 m x 0.10 m long r o l l e r s , equipped with
rubber 0-rings. The cylinder was rotated on the r o l l e r s by
a f r i c t i o n b e l t driven by a h horsepower variable speed
motor. The k i l n with the accessories was supported by a
steel frame which could be adjusted to a desired i n c l i n a t i o n
angle to the horizontal.
The k i l n used for the heat transfer experiments was
constructed of seamless, cold drawn mild s t e e l pipe. I t
was the same size as the l u c i t e cylinder, 0.1905 m I.D. x
2.44 m long x 6.35 mm wall thickness. The L/D r a t i o was thus
12.8. The i n t e r i o r surface of the tube was coated with 1 mm
thick layer of refractory cement, and was roughened to
prevent the solids bed from s l i p p i n g during rotation. The
outside wall was insulated with two layers of 3.2 mm thick
ceramic paper, then covered with 0.2 08 m diameter, 0.076 m
thick fiberglass pipe i n s u l a t i o n . The opening of the s t e e l
i n l e t end plate was 0.076 m diameter. Three outlet plates
with openings of 0.133, 0.114 and 0.089 m diameter allowed
holdups of 6.5%, 11% and 17%, respectively. Both ends of the
rotating k i l n were sealed with carbon rings i n 0.254 m dia
meter x 0.2 54 m long end boxes. The construction of the end
boxes and carbon rings i s shown i n Figure 4-2. The k i l n was
rotated on four metal r o l l e r s by a sprocket and chain driven
by a h horsepower variable speed motor. The support for the

CARBON RING
ROTATING KILN
END BOX
Figure 4-2 End Box and Seal System
(JO

steel k i l n was the same construction as that for the l u c i t e
cylinder.
4.1b Feeding System
The feeding system consisted of a bulk material
storage hopper, a screw feeder with a constant rate c o n t r o l l e r ,
and a feed chute. The feeding equipment was manufactured
by Mechanical Development Corporation, Wisconsin, Model
#400 SCR. The hopper capacity was 0.035 m3, and the maximum
feed rate was 0.142 m3/hr. The feed rate was controlled
manually by an adjustable c o n t r o l l e r capable of achieving an
accuracy of 1 - 2% for most dry materials. The c a l i b r a t i o n
of t h i s equipment for Ottawa sand and polystyrene i s given
in the appendix. The material delivered by the feeder was
dropped e s s e n t i a l l y instantaneously into the rotary k i l n
through a feed chute, which was made of a funnel and a 4 5
degree 0.013 m diameter copper tube, bent into the end of
the k i l n .
4.1c Receiving System
For the heat transfer experiments a cone of about
0.04 m3 volume was attached to the discharge end box. The
construction i s shown i n Figure 4-3. The bottom side of the
discharge box was welded with a 0.102 m diameter short pipe
with a flange at the other end of the pipe. The cone was
sealed and clamped to the discharge flange. Under the average
s o l i d throughput the cone became f u l l every t h i r t y minutes.


Then the cone was replaced with another empty one. The
interchange took only a few seconds so that i t would not
disturb the system. For residence time d i s t r i b u t i o n studies,
the conical receivers were not used.
4.Id A i r Heating System
An e l e c t r i c furnace was used to heat a i r before i t
entered the k i l n . The furnace was constructed of a 0.0635 m
diameter and 0.62 m long stai n l e s s s t e e l tube, packed with
0.0177 m ceramic Berl saddles. The tube was heated by two
semi-cylinder heating elements, each having 3.6 kW capacity.
The system, then, was insulated i n a 0.30 m x 0.30 m x 0.76 m
long f i r e brick box. The furnace was controlled by an on-off
temperature c o n t r o l l e r which had a temperature deviation = 2K.
4.1e Thermocouples
Twenty thermocouples were used to measure the tempera
tures of so l i d s bed and a i r at f i v e a x i a l locations along
the k i l n - three for solids bed and one for a i r at each
location. The arrangement of the thermocouples i s shown
schematically in Figure 4-4. The o r i g i n a l purpose of the
i n s t a l l a t i o n of the three thermocouples for s o l i d s bed at
one location was to measure r a d i a l temperature d i s t r i b u t i o n
in the bed.
The thermocouples were constructed of 3 0 gauge iro n -
constantan, and supported by a 0.012 7 m diameter, 2.54 m
long s t e e l tube. The probes were situated at the distances,

|«0.2I m * | - « — 0 . 5 1 m » * f * - 0 . 5 3 m — s * | -« * -0 .53 m * * f « — 0 . 5 3 m — * - |
RECORDER
5 0 8 m m
7 6 . 2 m m TO RECORDER
Figure 4-4 Schematic Diagram of Thermocouples Arrangement

0.21, 0.72, 1.25, 1.78 and 2.32 meters from the s o l i d feed
end of the k i l n . A l l the probe wires were extended through
the supporting tube out of i t s two ends to the recorder.
The supporting tube was passed through the center of the
rotary k i l n .
The thermocouples were calibrated in a white o i l
constant temperature bath up to 400 K. They were also c a l i
brated i n freezing t i n (504.8 K) and zinc (692.4 K) baths.
The c a l i b r a t i o n data given, i n the appendix showed a maximum
deviation of 1.8 K against the ASTM standard table (55).
The a i r temperature probe was shielded, and a i r was sucked
through i t by a pump located outside the k i l n . The construction
of the s h i e l d and suction system i s shown i n Figure 4-5.
The design of the shi e l d suction thermocouples was modified
from the design of H i l l s et a l . (56). In t h e i r study the
minimum suction rate for the e f f i c i e n t operation of a 1.5 mm — 6
pt - pt/Rh thermocouple was 15 x 10 m3/s at an a i r flow
rate of about 1.5 x 10 m3/s. A similar curve was obtained
for the iron-constantan thermocouples used i n t h i s study. -6 q
The minimum necessary suction rate was about 25 x 10 m /s,
as shown i n Figure 4-6. At a t y p i c a l k i l n operation i n t h i s
study the suction rate was about 0.6% of the a i r flow rate
through the k i l n . The wall temperatures were measured by
four iron-constantan thermocouples which were i n s t a l l e d on
the k i l n wall at positions, 0.31 m, 0.91 m, 1.52 m and 2.13 m
from the s o l i d charge end. Since t h e . k i l n rotated i t was
necessary to construct commutator rings to transmit the
thermocouple potentials to a suitable measuring device. The

f*-*| 6.4 mm
TJM G A S S U C T I O N
r-¥-i T H E R M O C O U P L E
S U C T I O N
12.7 mm
B E D T H E R M O C O U P L E
gure 4-5 Diagram of S u c t i o n Thermocouple
5 0 0 i
JO-Q. •o-
UJ QC Z> < or UJ a. UJ
4 5 0
4 0 0 2 0 0
SUCTION RATE slO® m 3 / s
gure 4-6 Typical Response of Suction Thermocouple

construction of commutator rings i s shown i n Figure 4-7.
Eight suitable rings, 0.254 m O.D., made of 6.35 mm diameter
copper wire, were constructed and mounted i n e l e c t r i c a l and
thermally i n s u l a t i n g p l a s t i c rings attached to the k i l n wall.
Copper s t r i p s were then used to connect the commutator r i n g
and iron-constantan wires to a multipoint recorder. C a l i
bration of t h i s device indicated i t s error within -2 K.
The v a r i a t i o n which was noted was believed to be caused by
thermal and e l e c t r i c a l e f f e c t s i n the commutator assembly.
Four additional thermocouples were i n s t a l l e d i n the ins u l a t i o n
layer at the same a x i a l locations as the wall thermocouples.
The thermocouples were located at 6.35 mm from the outside
wall. The temperature measurements by these thermocouples
permit a c a l c u l a t i o n of the wall heat loss.
4.2 Materials
In the residence time d i s t r i b u t i o n (RTD) experiments
transparent STYRON polystyrene p a r t i c l e s supplied by Dow
Chemical of Canada Ltd were used. These p a r t i c l e s are of
e l l i p t i c cylinder shape with dimensions of 1.9 x 3.1 x 3.6 mm
and apparent density of 653 kg/m3. Tracer p a r t i c l e s were
colored by a red food dye and thus w e r e n o t d i f f e r e n t in
physical properties from the bulk material.
Alumina was used i n a f i l m study of p a r t i c l e l a t e r a l
and r a d i a l v e l o c i t y . To obtain the p a r t i c l e v e l o c i t y an
individual p a r t i c l e was i d e n t i f i e d at a location in the k i l n ' s
cross section and was traced for a certain time. Thus large

F i g u r e 4-7 Commutator Copper Rings
62
p a r t i c l e s o f opaque alumina of 6.35 m i n diameter were used.
In the major p a r t of the heat t r a n s f e r study i n e r t
Ottawa sand was used. The p a r t i c l e s i z e was 20-30 mesh
(average diameter 0.73 mm). The p h y s i c a l p r o p e r t i e s of
Ottawa sand have been r e p o r t e d by others (46, 57) and are
l i s t e d i n Table 4-2.
Limestone was used to study the e f f e c t of p a r t i c l e
s i z e on heat t r a n s f e r . Limestone was s i e v e d i n t o three
s i z e s , 10-20 mesh, 20-28 mesh and 28-35 mesh. The average
p a r t i c l e s i z e s were 1.26, 0.73 and 0.51 mm, r e s p e c t i v e l y .
P h y s i c a l p r o p e r t i e s are a l s o given i n Table 4-1.
No gas flow was used d u r i n g the p a r t i c l e motion study,
s i n c e the e f f e c t of gas flow on the p a r t i c l e throughput i n
a r o t a r y k i l n was r e p o r t e d (21, 27) to be n e g l i g i b l e .
In the heat t r a n s f e r experiments where c o n v e c t i o n i s
of primary i n t e r e s t preheated a i r was used r a t h e r than
combustion gases because o f i t s t r a n s p a r e n t p r o p e r t y to
r a d i a t i o n . Since a i r c o n t a i n s o n l y minimal amount o f water
vapor and carbon d i o x i d e , gas to w a l l and gas to s o l i d s
r a d i a t i o n can be n e g l e c t e d . Measurement o f moisture i n the
incoming a i r showed a p a r t i a l p r e s s u r e of water of 0.004 atm.
At the temperatures o f the p r e s e n t study, g a s / w a l l r a d i a t i o n
c o e f f i c i e n t s were about 0.07 W/m2K, a f a c t o r of 35 to 70 times
l e s s than the c o n v e c t i v e c o e f f i c i e n t s measured. A i r t r a n s p o r t
and thermodynamic p r o p e r t i e s are g i v e n i n the l i t e r a t u r e (46,
58, 59) .

TABLE 4-2
Physical Properties of Ottawa Sand and Limestone
Ottawa sand (49, 59)
Thermal conductivity
Bulk density
P a r t i c l e density
S p e c i f i c heat
0.268
1650
2627
0.775
0. 821
W/m K
kg/m3
kg/m3
kJ/kg K at 3 73 K
kJ/kg K at 44 8 K
Limestone
Thermal conductivity (58)
Bulk density*
S p e c i f i c heat*
0.692 W/m K
1680 kg/m3
0.914 kJ/kg K at 373 K
0.966 at 423 K
1.018 at 473 K
*Measured

CHAPTER 5
EXPERIMENTAL PROCEDURE
5.1 R e t e n t i o n Time and S o l i d Throughput
P o l y s t y r e n e p a r t i c l e s were used f o r s o l i d throughput runs
i n the l u c i t e c y l i n d e r , w h ile Ottawa sand was used i n the s t e e l
c y l i n d e r . In t h e ? l a t t e r runs the end boxes and the long tube f o r
thermocouples were removed.
Before s t a r t i n g , the c y l i n d e r was set a t a predetermined
i n c l i n a t i o n angle. Then the end p l a t e s were a t t a c h e d a t the
both ends of the c y l i n d e r . The c y l i n d e r was r o t a t e d a t a f i x e d
r o t a t i o n a l speed. The s o l i d m a t e r i a l was then f e d i n t o the cy
l i n d e r through the screw feeder u n t i l the d e s i r e d holdup was
reached. Mass throughput was measured by c o l l e c t i n g and weigh
i n g the m a t e r i a l l e a v i n g the d i s c h a r g e end i n a d e f i n i t e time
i n t e r v a l (1~5 minutes depending on flow r a t e ) . R o t a t i o n was <
continued u n t i l a steady s t a t e c o n d i t i o n was a t t a i n e d . T h i s
was achieved when the constant d i s c h a r g e r a t e became equal to
the feed r a t e from the screw feeder. About 30~60 minutes were
r e q u i r e d to reach steady s t a t e i n most cases.
To ensure t h a t a uniform bed depth was o b t a i n e d the bed
depth had to be c o n s t a n t l y monitored a t both ends o f the c y l i n
der. I f the bed depth was not uniform, adjustments were made

to the feed rate. When the uniform bed depth at steady state
condition was obtained, the feeder was switched o f f and the ma
t e r i a l in the cylinder was removed, and weighed to determine the
holdup. The retention time was then calculated by di v i d i n g the
bed weight by the s o l i d throughput.
5.2 Residence Time D i s t r i b u t i o n
P r i o r to introduction of tracer material steady state
flow conditions for the uniform bed depth were assured as des
cribed i n the previous section. A known number of colored t r a
cer p a r t i c l e s was injected into the feed chute at an a r b i t r a r y
zero time and samples were taken as soon as the f i r s t tracer
arrived at the end of the cylinder. It was assumed that the
tracer was injected over a s u f f i c i e n t l y small time i n t e r v a l
that the i d e a l i z e d impulse stimulus was r e a l i z e d . Separate
samples were taken over t h i r t y seconds in t e r v a l s u n t i l a l l the
tracer material had discharged from the k i l n . The rotation was
then stopped and the material holdup was determined.
Tracer concentration i n each of the discharge samples was
evaluated by d i r e c t counting of the colored p a r t i c l e s and weigh
ing of the t o t a l sample. This gave information on the concentra
tion c ( t ^ ) , at a number of discrete times, tj_, i = 1,2, . . . .M,
where M denotes the l a s t sampling i n t e r v a l i n which tracer
appeared in the discharge.
The relationships are given below of the mean, t, and 2
variance, a^, of the residence time d i s t r i b u t i o n for the tracer
as functions of the e x i t age d i s t r i b u t i o n function E. Thus,

t = j'Q t E ( t ) d t (5-1)
and
.' 2 a t = f " (t - t) E ( t ) d t (5-2)
The above equations can be approximated (30) f o r the d i s c r e t e
system
M t = I t . E ( t i ) A t (5-3)
i = l
and
2 M - 2
a t ~ X ( t i - t ) E ( t i ) A t (5-4) i = l
where
E(t±) = C ( t i }
"S (5-5) E c ( t i ) A t i
i = l
About 1.0 g t r a c e r was used i n a 0.08 m x 0.24 m drum^of
Abouzeid e t a l (30) a t a s o l i d throughput of 8.64 kg/hr and
r o t a t i o n a l speed o f 42 rpm. In t h i s study the t r a c e r weight was
13.7 g. Only one of the runs used 115 g of t r a c e r m a t e r i a l .

The r e l a t i v e variance and Peclet number were then c a l
culated as outlined i n Chapter 2:
2 a"* t _ z. t
(2-17)
and
Pe T (2-19) a,
The second equation allowed the ca l c u l a t i o n of a x i a l
dispersion c o e f f i c i e n t , n , according to
_ uL D ~
Pe
where u i s the average a x i a l v e l o c i t y , u = ^ t
5.3 Surface Time
Steady state flow was f i r s t achieved as described i n
Section 5.1. A limited number of colored p a r t i c l e s were dropped
into the cylinder through the feed chute. A length of 0.2 m in
the middle of.the lucite cylinder was chosen as the test- section. When the
colored p a r t i c l e reached the test section, the time count was
started and the number of the cycles which t h i s colored p a r t i c l e

reappeared on the surface was noted u n t i l i t passed the other
end of the test section. The above procedure was repeated at
leas t f i v e times and the average value was taken.
The average a x i a l distance the p a r t i c l e advanced on the
surface for each cycle was
(5-6)
the length of test section
the t o t a l number of cycles in the section
and the cycle time, t f c , i . e . the time the p a r t i c l e spent for
each cycle was calculated by d i v i d i n g the t o t a l time in the
test section by n _. To obtain the surface time t s , the time the
p a r t i c l e residing i n the bed,t^,' must be known > and t h i s was ob
tained with the following equation
t b = 3/2Trn (5-7)
where "t "
where 6 i s the central angle the solids bed occupied. The
surface time, therefore, was obtained by
t s = t t - t b (5-8)
The p a r t i c l e a x i a l speed on the surface was calculated
as:
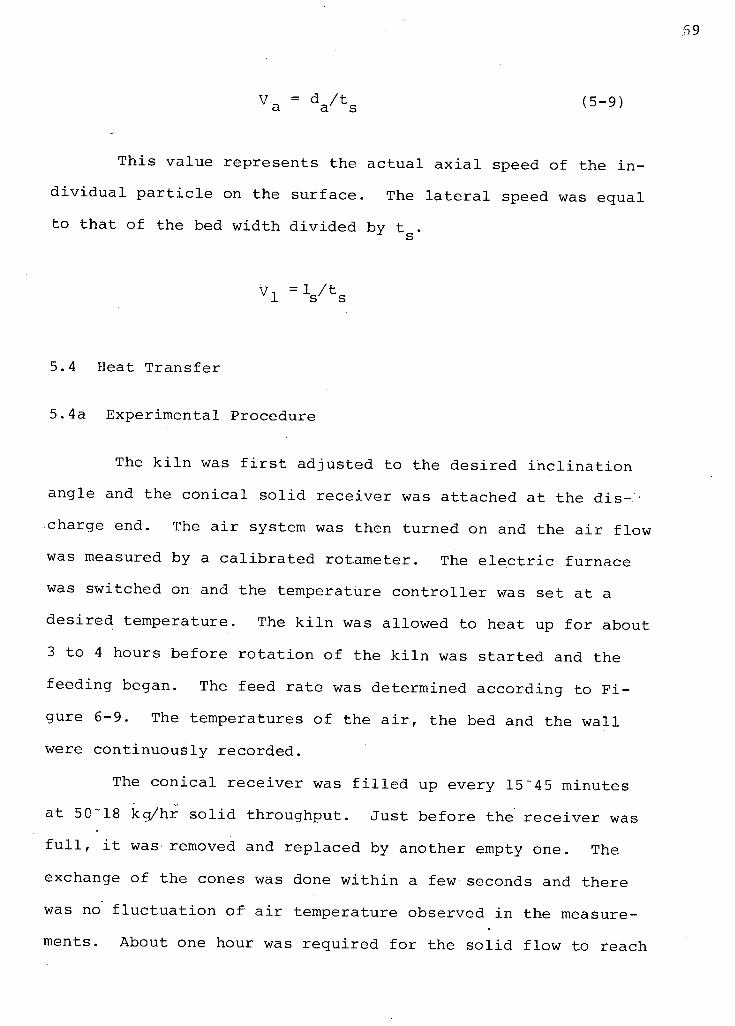
v = d / t a a s (5-9)
This value represents the actual a x i a l speed of the i n
di v i d u a l p a r t i c l e on the surface. The l a t e r a l speed was equal
to that of the bed width divided by t .
V n =l./t 1 s s
5.4 Heat Transfer
5.4a Experimental Procedure
The k i l n was f i r s t adjusted to the desired i n c l i n a t i o n
angle and the conical s o l i d receiver was attached at the d i s - •
charge end. The a i r system was then turned on and the a i r flow
was measured by a calib r a t e d rotameter. The e l e c t r i c furnace
was switched on and the temperature c o n t r o l l e r was set at a
desired temperature. The k i l n was allowed to heat up for about
3 to 4 hours before rotation of the k i l n was started and the
feeding began. The feed rate was determined according to F i
gure 6-9. The temperatures of the a i r , the bed and the wall
were continuously recorded.
The conical receiver was f i l l e d up every 15~45 minutes
at 50~18 kg/hr s o l i d throughput. Just before the receiver was
f u l l , i t was removed and replaced by another empty one. The
exchange of the cones was done within a few seconds and there
was no fl u c t u a t i o n of a i r temperature observed i n the measure
ments. About one hour was required for the s o l i d flow to reach

the steady state condition. Then the material i n the conical
receiver was emptied and weighed, and the s o l i d discharge rate
calculated. The s o l i d flow was assumed to be at steady state
i f both the feed rate and the discharge rate were equal.
The recordings of the temperature readings were continued
u n t i l the steady conditions prevailed. Then the suction pump
was switched on and the readings of a i r temperature taken once
the temperatures l e v e l l e d o f f .
A complete run usually took 5 to 8 hours.
5.4b Preliminary Tests
In early heat transfer tests, the k i l n was insulated with
6.35 mm ceramic insul a t i o n paper, and covered with 3.2 mm asbes
tos c l o t h and 25.4 mm thick f i b e r g l a s s i n s u l a t i o n material.
Heat balances on these tests indicated that as much as 50% of
the heat given up by the a i r was l o s t through the k i l n wall. To
reduce these large heat losses from the k i l n , f i b e r g l a s s was
replaced with 0.203 m fibred asbestos pipe in s u l a t i o n , 51 mm
thick. The k i l n end boxes and discharge system were also insu
lated. By t h i s procedure the heat loss under most operating
conditions was reduced to less than 20% of the t o t a l heat given
up by the a i r i n passing through the k i l n . A similar problem
was indicated by Friedman and Marshall (49) for heat transfer
experiments in a rotary cylinder. In addition the heat loss was
found to be non-uniform along the k i l n making interpretation of
the data subject to some error. This was due to the presence
of the sprocket, r o l l e r s and s l i p rings which could not be i n -

s u l a t e d . The commutator was l o c a t e d between 1.0 2 and 1.22 meter
from the charge end. The c e n t r a l s e c t i o n o f the k i l n between
1.25 m and 1.78 m was chosen as the t e s t s e c t i o n of the k i l n
s i n c e t h i s s e c t i o n was f a r enough away from the two ends of
the k i l n to minimize the end e f f e c t s on heat t r a n s f e r and par
t i c l e motion, and d i d not s u f f e r from non-uniform heat l o s s
because of the presence o f sprocket, r o l l e r or s l i p r i n g .
5.4c Operating Range
Table 5-1 shows the range of o p e r a t i n g v a r i a b l e s covered
i n t h i s study. A i r throughput ranged from 18.6 to 95 kg/hr.
On an empty k i l n b a s i s the a i r f l u x was from 650 to 3300 kg/hr-m
which i s about i n the range of i n d u s t r i a l k i l n s . The i n l e t a i r
temperature was v a r i e d from 373 K to 650 K. The s o l i d feed r a t e 2
was i n the range o f 11~66 kg/hr o r 400~1750 kg/hr-m . The r a t i o
of a i r / s b l i d feed r a t e ranges from 0.5 to 5 which compares with
1~2 t y p i c a l f o r i n d u s t r i a l k i l n s . R o t a t i o n a l speeds covered a
range o f 0.9 to 6.0 rpm. The k i l n bed was always in. the r o l l i n g
mode a t these r o t a t i o n a l speeds. One run was c a r r i e d out a t
0.4 rpm d u r i n g which the bed was i n the slumping s t a t e . The
slope o f the k i l n was v a r i e d from 1.36° to 4.1° and the degree
of f i l l was s e t i n the range o f 6.5 to 17% .

Table 5-1 K i l n Operating Conditions
A i r throughput
A i r mass v e l o c i t y *
A i r i n l e t temperature
Solids used
p a r t i c l e sizes
solids throughput
solids mass v e l o c i t y *
Rotational speed
K i l n slope
percent f i l l
18.6 - 95 kg/hr
650 - 3300 kg/m2 hr
373 - 650 K
wa - sand and limestone
0.51 - 1.26 mm
11 - 50 kg/hr
400 - 1750 kg/hr m2
0.9- 6 rpm
1.36°-4.1°
6.5 - 17%
S u p e r f i c i a l empty k i l n
- based on cross-sectional area of
73
CHAPTER 6
RESULTS AND DISCUSSIONS
P a r t i c l e Motion
6.1 Type of Bed Movement
F i g u r e 6.1 g i v e s a s e r i e s of photographs showing d i f f e r e n t
types o f bed movement i n the c r o s s s e c t i o n o f r o t a t i n g c y l i n d e r .
The photographs were made u s i n g a bed of p o l y s t y r e n e p a r t i c l e s
a t v a r i o u s r o t a t i o n a l speeds. As shown i n the f i g u r e the r o l l i n g
type o f movement i s seen a t a r o t a t i o n a l speed of N/N l e s s
than 0.1.. Showering of p a r t i c l e s i s observed a t r o t a t i o n a l
speeds above N/N c = 0.6. The r e s u l t s are i n agreement with the
o b s e r v a t i o n and d e s c r i p t i o n by Rutgers (19). The f i r s t t h ree
photographs f o r the r o l l i n g type of p a r t i c l e movement give a
measured value of the dynamic angle of repose of 27° f o r p o l y
styrene .
6.2 L a t e r a l and R a d i a l V e l o c i t y
A f i l m study of p a r t i c l e movement i n the c r o s s s e c t i o n
was made. Alumina spheres of 6.35 mm diameter were used. The
r o t a t i o n a l speed was s e t at 4.78 rpm, which gave a r o l l i n g bed
at the holdup r a t i o of 26%. F i g u r e 6-2 shows t r a c e s o f the p o s i
t i o n s o f two i n d i v i d u a l p a r t i c l e s with time. The f i r s t p a r t i c l e
was taken on the aerated s u r f a c e about 0.06 m from P o i n t A as

N/Nc=0.031 0.056
R o l l i n g
0.091
N/Nc=0.135
N/N =0.684 c
0.387
Cascading
0.747
Cataracting
0.526
0.808
Figure 6-1 Photographs of Bed Motions
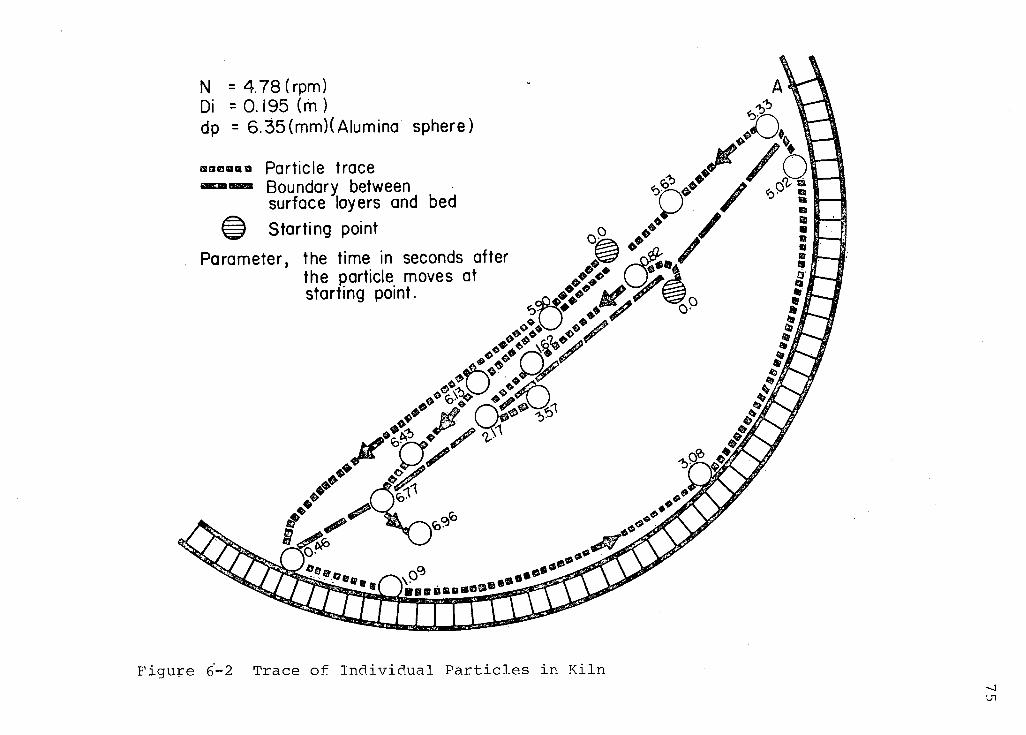
Figure 6-2 Trace of Individual P a r t i c l e s in K i l n U1

shown i n the figure. It took 0.4 6 seconds to r o l l a distance
of 0.11 m down the surface (at a speed of 0.24 m/s) before i t
returned to the bed. Once in the bed, adjoining the wall i t
rotated at the same angular speed as did the k i l n . It spent
almost 5 seconds to t r a v e l a distance of 0.23 m (at a speed of
0.046 m/s) before i t returned to the bed surface. It stayed
on the top of the surface layers for a while, then entered a
second layer, i n which i t t r a v e l l e d at a lower v e l o c i t y than i t
did i n the f i r s t layer. However i t did not return to the bed
at the same location as the f i r s t time. The l a t e r a l v e l o c i t y
of p a r t i c l e s decreased from 0.24 m/s i n the f i r s t layer to
0.107 m/s i n the second layer. Thus i t i s i n t e r e s t i n g to see
the p a r t i c l e v e l o c i t y p r o f i l e across the surface layers. A
second p a r t i c l e was traced which t r a v e l l e d i n the surface layer
near the boundary between the surface layers and the bed as
seen i n Figure 6-2. It took more time to t r a v e l even a shorter
distance than the f i r s t one. The v e l o c i t y was 0.042 m/s.
Figure 6-3 plots both r a d i a l and l a t e r a l v e l o c i t y pro
f i l e s against k i l n radius position. The ordinate i s the k i l n
radius along the centerline, OB, of the bed as shown i n F i g
ure 6-3. There are two regions, evident i n Figure 6-2 and i n
Figure 6-3, the surface region i n which p a r t i c l e s r o l l down
the i n c l i n e d bed, and the bed region where p a r t i c l e s move as
a r i g i d body with the k i l n rotation. The boundary between
them i s defined as the d i v i d i n g l i n e , beyond which the p a r t i
cles on both sides move in opposite d i r e c t i o n s . The boundary
i s shown in Figure 6-2 and Figure 6-3, and i s approximated by

T
RADIAL POSITION , (m )
Figure 6-3 P a r t i c l e Velocity i n a Rotary K i l n .

2.5 p a r t i c l e diameters below the surface. The p a r t i c l e v e l o c i t i e s
i n the surface region and the bed region are referred as l a t e r a l
v e l o c i t y and r a d i a l v e l o c i t y , respectively. In the region of
surface layers the v e l o c i t y drops s i g n i f i c a n t l y from the aerated
surface to the boundary. This is attributed to "the. internal, friction of
surface layer particles. The f r i c t i o n a l force exerted on the p a r t i c l e
increases substantially with the distance down from the aerated
surface. Inside the bed the p a r t i c l e s move together with neigh
bouring p a r t i c l e s at the angular speed. Their l i n e a r r a d i a l
speeds are represented by
V = 2ir-nr (6-1) r
which agrees with the measured speed as given i n Figure 6-3.
6.3 Surface Time
It has been postulated above, that the surface time or
p a r t i c l e v e l o c i t y on the surface plays an important role on
heat transfer and- chemical reaction. Inasmuch as the r e l a t i o n
ship of retention time with the operating parameters i s well
established, i t i s worthwhile to obtain a rela t i o n s h i p of re
tention time and surface time.
A set of experiments using colored polystyrene as tracers
in a bed of the same material was carried out by v i s u a l obser
vation using a stopwatch. The r o t a t i o n a l speed was varied and
the s o l i d flow rate also varied in such a way that the holdup
r a t i o was maintained constant. Retention time and surface time

79
were c a l c u l a t e d by the procedures d e s c r i b e d i n Chapter 5. The
r e s u l t s p l o t t e d i n F i g u r e 6-4 show the r e l a t i o n s h i p o f r e t e n t i o n ,
time and s u r f a c e time to r o t a t i o n a l speed. Re t e n t i o n time, as
expected v a r i e s as N--*-, whereas s u r f a c e time i s p r o p o r t i o n a l to
r o t a t i o n a l speed to the power -0.5.
I t i s a l s o o f i n t e r e s t to know the e f f e c t o f r o t a t i o n a l
speed on the r a t i o of s u r f a c e time to r e t e n t i o n time. F i g u r e
6-5 shows the r e p l o t o f F i g u r e 6-4 and i n c l u d e s the data of
Hogg e t a l (40) f o r comparison. Hogg e t a l c a l c u l a t e d a value
of 0.49 f o r the r a t i o o f s u r f a c e time t o r e t e n t i o n time a t a
much high e r r o t a t i o n a l speed, 90 rpm, which r e s u l t e d i n a c a t a -
r a c t i n g type of bed i n t h e i r 0.09 5 x 0.248 m r o t a r y cyM-ncLer.
The data of the prese n t study were ob t a i n e d i n both r o l l i n g and
cascading types o f beds. As seen i n F i g u r e .6,-5 an i n c r e a s e of
r o t a t i o n a l speed r e s u l t s i n a higher f r a c t i o n o f time the i n d i
v i d u a l p a r t i c l e s are exposed,.to the f l u i d f o r heat t r a n s f e r and •
chemical r e a c t i o n . However, i t a l s o reduces r e t e n t i o n time and
s u r f a c e time i n a given l e n g t h o f the k i l n as a t t e s t e d by F i g
ure 6-4. The i m p l i c a t i o n o f t h i s r e s u l t i s important f o r a n a l
y s i s o f chemical r e a c t i o n and heat t r a n s f e r .
F i g u r e 6-6 g i v e s a p l o t of l a t e r a l v e l o c i t y and a x i a l
v e l o c i t y o f the p a r t i c l e s on the aerated s u r f a c e versus r o t a
t i o n a l speed. The l a t e r a l v e l o c i t y i n F i g u r e 6-6 r e p r e s e n t s an
average v a l u e . The slo p e s f o r both of l a t e r a l v e l o c i t y and a x i a l
v e l o c i t y vs. r o t a t i o n speed i n the l o g - l o g p l o t are about 0.5.
L a t e r a l v e l o c i t y , shows much high e r v a l u e s than a x i a l v e l o c i t y ,
V . However, the r a t i o o f V /V i s l i t t l e a f f e c t e d by r o t a t i o n a l
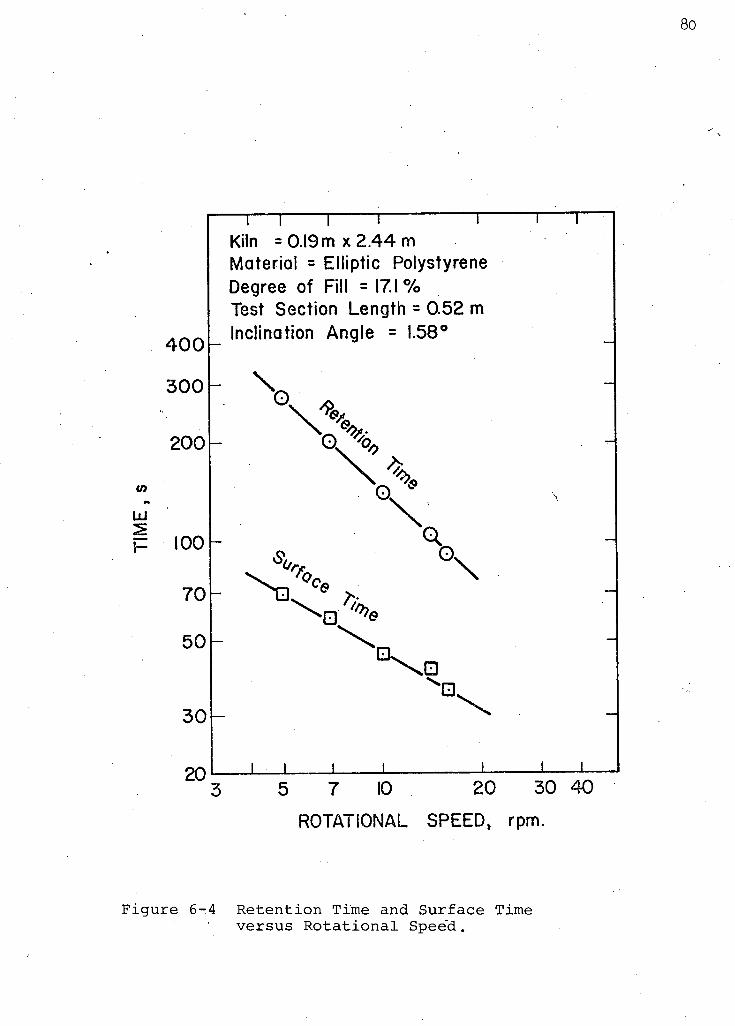
4 0 0
3 0 0
2001
— i — i 1 1 r
Kiln = 0.19m x 2.44 m Material = Elliptic Polystyrene Degree of Fill = 17.1% Test Section Length = 0.52 m Inclination Angle = 1.58°
- \
100
70
50
30 |
O. w
\
•
20 1
5 7 10 20 30 40
ROTATIONAL SPEED, rpm.
Figure 6-4 Retention Time and Surface Time versus Rotational Speed.

6 0
5 0
4 0
' - 3 0 U J
o
U J •\—
U J
or \ U J
U J
8 DC ZD CO
20
A
O This Experiment , Nc = 96.9 (rpm)
A Hogg et al (38) , Nc =137 (rpm)
J_ .03 .05 .07 0.1 0.2
N/Nc
0.3 0.4 0.5 1.0
Figure 6-5 The Ratio of Surface Time to Rotation Time versus N/N 0 0

0.31 " I — I — ' I ' M
E
>-H O O _ J U J >
0.2
0.15
0.1
0.08
0.06
0.041
0
Kiln = 0.19m x 2.44m Material = Elliptic Polystyrene
Degree of Fill = 17.1 % Inclination Angle = L58°
0 0 2
0.01
0.006
G
o
i _ I I - L - J .
5 7 10 20 30
ROTATIONAL SPEED, rpm.
50
Figure 6-6 Surface Velocity versus Rotational Speed.

speed as given in Table
a n a l y t i c a l r e s u l t (25),
6- 1. This i s in agreement with the
sine
V a a-+ iJ;cos( (6-2)
where 0 i s the dynamic angle of repose, a the angle of i n c l i
nation and i> the angle between the surface of the p a r t i c l e and
the cylinder axis.
For the present experiments the dynamic angle of repose
i s 2 7° and a i s 1.5 8°. By assuming ^ = 0, a value of V /V , J. a
16,5 i s obtained. This value i s a l i t t l e higher than the values given in Table 6-1.
Equation 6-2 gives the e f f e c t of i n c l i n a t i o n angle, a,
on the r a t i o of V j _ / v a ' The i n c l i n a t i o n angle, the angle of the
k i l n axis to the horizontal i s obviously a major factor for
a x i a l transport of p a r t i c l e s , V^. The e f f e c t of a on i s
expected to be i n s i g n i f i c a n t .

Table 6-1 Relationship of V./V vs. N
N V./V 1 a
(rpm) ( - )
5 16.3
6.9 16.0
10 15.1
14 14.5
15.4 13.8

85
6.4 S o l i d Throughput and R e t e n t i o n Time
Although the e f f e c t s of r o t a t i o n a l speed and i n c l i n a t i o n
angle on s o l i d throughput were s t u d i e d t h e o r e t i c a l l y and e x p e r i
mentally 'in .the' literature,- none-of these studies reported the' effects'.on- solid
throughput i n a system i n which the bed h e i g h t or degree of f i l l
i s uniform along the k i l n . The degree of f i l l i s thought to
be one of major f a c t o r s i n f l u e n c i n g the heat t r a n s f e r processes
s i n c e i t r e l a t e s to the s u r f a c e area f o r heat t r a n s f e r . One
i n d u s t r i a l k i l n was r e p o r t e d (2) to have 5% f i l l a t the charge
end up to 31% a t the d i s c h a r g e end. The l o c a l heat t r a n s f e r
processes are t h e r e f o r e expected to be a f f e c t e d by the degree
of f i l l a long the k i l n . rIn o rder to e l i m i n a t e t h i s e f f e c t the bed h e i g h t should
be maintained as uniform as p o s s i b l e along the k i l n . An attempt
was made i n a s e r i e s of experiments to determine the throughput
with v a r y i n g i n c l i n a t i o n angle and r o t a t i o n a l speed. The ex
periments were c a r r i e d out under c o n d i t i o n s of uniform bed
h e i g h t along the k i l n by c a r e f u l l y m o n i t o r i n g bed depth a t the
two ends of the k i l n . In a l l experiments the angle, \\>, between
the bed s u r f a c e and the k i l n a x i s was no l a r g e r than 0.0014
ra d i a n s or about 0.1 degree. Ottawa sand was used.
The experimental r e s u l t s under these c o n d i t i o n s are de
p i c t e d i n F i g u r e s 6-7, 8, and 9. F i g u r e 6-7 i l l u s t r a t e s the
e f f e c t of r o t a t i o n a l speed with varying i n c l i n a t i o n angle. The
e x t r a p o l a t i o n of the l i n e to a r o t a t i o n a l speed of zero g i v e s
no throughput of s o l i d s . The l i n e a r r e l a t i o n s h i p of the through-

1 1 1 1 — Kiln = 0.19 m x 2.44m Material = Ottawa sand 2 0 - 3 0 mesh Degree of Fill 11% \\f < 0.0014
KILN ROTATIONAL SPEED, rpm.
Figure 6-7 E f f e c t of Rotational Speed on S o l i d Throughput i n a Uniform Bed Depth Rotary K i l n .

Kiln = 0.19 x 2.44 m Ottawa sand 2 0 - 3 0 mesh
KILN INCLINATION, degree.
Figure 6-8 E f f e c t of I n c l i n a t i o n Angle on S o l i d Throughput i n a Uniform Bed Depth Rotary K i l n .

SOLID FEED RATE, kg/hr
Figure 6-9 Relationship of S o l i d Throughput and Degree of F i l l i n a "Uniform Bed Depth Rotary K i l n .

put and r o t a t i o n a l speed i s in agreement with previous work
(19-21, 24-29, 40, 60-62). It has been shown above that i n
creasing r o t a t i o n a l speed increases the frequency.of the s o l i d
p a r t i c l e appearing on the bed surface. Since a x i a l movement of
parti c u l a t e material takes place only on the bed surface, the
increasing frequency of appearance of p a r t i c l e on the bed sur
face increases a x i a l movement i n a given time, which increases
a x i a l v e l o c i t y . Since the s o l i d throughput i s equal to a x i a l
v e l o c i t y m u l t i p l i e d by the cross section area which i s uniform
along the k i l n , the s o l i d throughput correspondingly increases
in a way that i t i s l i n e a r l y proportional to ro t a t i o n a l speed.
The s o l i d l i n e s i n Figures 6-7 and 6-8 represent the
following equation (25)
3 Q W = t nD pasin^B / sine (2-16)
S 6
The experimental data are found in good agreement with the
theory.
The e f f e c t of i n c l i n a t i o n angle on the s o l i d throughput
i s given i n Figure 6-8. The l i n e a r i t y of the relat i o n s h i p can
be explained as follows. Increasing i n c l i n a t i o n angle increases
the a x i a l displacement of the p a r t i c l e while i t i s on the surface.
It also means that a x i a l v e l o c i t y increases i n proportion.
Degree of f i l l i s plotted against s o l i d throughput i n
Figure 6-9 for a uniform bed-depth k i l n at various r o t a t i o n a l
speeds and i n c l i n a t i o n angles. In order to operate at a higher

degree of f i l l , the s o l i d feed r a t e must be i n c r e a s e d to maintain
the uniform bed depth.
In p r e v i o u s work (19-21, 24-29, 40, 60-62) the s o l i d
throughput was determined by s e t t i n g two o p e r a t i n g v a r i a b l e s ,
r o t a t i o n a l speed and i n c l i n a t i o n angle. In doing so the degree
of f i l l might vary s i g n i f i c a n t l y from one end of the k i l n to the
other. The average degree of f i l l was u s u a l l y e x p e r i m e n t a l l y
determined by removing the holdup out of the k i l n and d i v i d i n g
the volume of holdup by the k i l n volume. Although a t h e o r e t i c a l
a n a l y s i s was done (29), the equation f o r the degree of f i l l was
lengthy and complex.
By o p e r a t i o n under c o n d i t i o n s f o r uniform bed depth i n
the heat t r a n s f e r study, four independent o p e r a t i n g v a r i a b l e s ,
s o l i d throughput, r o t a t i o n a l speed, degree o f f i l l , and i n c l i n a
t i o n angle, are reduced to three through equation 2-16. There
f o r e i f one s e t s r o t a t i o n a l speed and feed r a t e , t here i s o n l y
one i n c l i n a t i o n angle t h a t w i l l g i ve a c e r t a i n uniform bed
depth. The r e t e n t i o n time was simply o b t a i n e d by d i v i d i n g the
bed weight by s o l i d throughput. The r e s u l t s f o r the same s e r i e s
of experiments are g i v e n i n F i g u r e 6-10. As expected the r e t e n
t i o n time i s i n v e r s e l y p r o p o r t i o n a l to the r o t a t i o n speed. How
ever degree of f i l l has l i t t l e impact on r e t e n t i o n time f o r a
uniform bed k i l n as shown i n F i g u r e 6-11. I n c r e a s i n g degree of
f i l l r e q u i r e s an i n c r e a s e of feed r a t e to maintain the bed a t
the same h e i g h t . As a r e s u l t , r e t e n t i o n time, as a r a t i o o f
bed weight to s o l i d throughput remains constant.

91
o I-z: IxJ P 0.75 h LL!
0.25 h
0 0.4 0.6
l /N . r p m - 1
Figure 6-10 E f f e c t of Rotational Speed and In c l i n a t i o n Angle on Retention Time i n a Uniform Bed Depth Rotary K i l n .

O N =1.5 (rpm) , a = 1.36°
A N =30 (rpm) , a = 1.36°
• N =3.0 (rpm) , a = 2.62°
9.2 14.2 •O O —
Parameter = Ws (kg/hr)
18.0 25.2 A -A-
19.8 34.3 51-3
8 12 16 20
DEGREE OF FILL, (%)
igure 6-11 E f f e c t of Degree of F i l l on Retention Time i n a Uniform Bed Depth Rotary K i l n .

6.5 Residence Time D i s t r i b u t i o n
For modelling of heat transfer and/or chemical reaction
in a rotary k i l n i t i s generally assumed that s o l i d moves i n
plug flow i n the a x i a l d i r e c t i o n and i s completely mixed i n the
r a d i a l d i r e c t i o n . The v a l i d i t y of the former assumption can be
examined by the use of the a x i a l dispersion model. The Peclet
number was reportedly (30, 31, 38) high enough (above 50) that
the s o l i d flow i n a x i a l d i r e c t i o n can be considered as plug flow
In t h i s study four RTD runs were conducted i n the l u c i t e
cylinder. The impulse stimulus method was used. The experiment
a l conditions are l i s t e d i n Table 6-2 and the r e s u l t s are given
in Figure 6-12, plotted as the F-curve versus time. The tracer
of 115 g was used i n Run Rl whereas about 13.7 g was used i n
other runs. Based on the experimental r e s u l t s the standard
deviation, Peclet number and a x i a l dispersion c o e f f i c i e n t were
calculated and also are given i n Table 6-2. The r e s u l t s i n d i
cate the Peclet numbers are i n the range 371 to 567 and increase
with decreasing r o t a t i o n a l speed. However decreasing r o t a t i o n a l
speed decreases a x i a l dispersion c o e f f i c i e n t .
Now i t i s of in t e r e s t to compare the experimental data
with that calculated from the a x i a l dispersion model with the
obtained Peclet numbers.
The a x i a l dispersion model was represented by equation
2-15. Moriyama and Suga (32) solved t h i s equation with i n i t i a l
and boundary conditions as given in equations 2-16a, b and d.
The l a s t boundary condition describes a rotary k i l n having

Table 6-2
Operating Conditions and Calculation Results
of RTD Experiments
Run No. Rl R2 R3 R4
Tracer weight (kg)
Bed Weight (kg)
Rotation speed (rpm)
Solid Throughput kg/hr
Inclination angle (degree)
0.115 0.0137 0.0138 0.0136
8.7
28.7
1.5
9.4
6.87 15.6
61. 2
1.5
8.4
5.5
19.8
1.5
9.3
4.8
19. 8
1.5
a Qx 1 0 + 2 (-) 7.04 7. 34 5.94 7.24
Pe (-) 404 371 567 382
D x 10 5 (m.2/s). ,.r:28 2.91 0.69 0.90

1001
TIME AFTER TRACER FED, min. 8 9 10 II 12
g
tt j —
z: O
o o
Lul >
8 0
6 0
& 4 0
3 O
20
I ?
J L 16 17 18 19 20 22 24 26 28 30 32 34 36
TIME AFTER TRACER FED, min.
Figure 6-12 Cumulative Respon.se Curve i n a Rotary K i l n .

96
c o n s t r i c t i o n at the discharge end more reasonably than equation
2-16c proposed by Abouzeid et a l (30). The solution of Moriyama
and Suga for large Pe ( >50 ) i s given i n equation 6-3.
C(£) = 5_ 1 Peg Exp 1+5 V T
- (1-g) zPe 4£
(6-3)
In t h i s equation Pe, the only parameter in the model,
i s determined from the experimental data and i s given i n Table
6-2. Figures 6-13, 14, 15 and 16 compare the experimental data
and equation 6-3. The figures show a reasonable agreement, how
ever the peak concentration i s underestimated i n each case.
Since s o l i d transport through a rotary k i l n can be repre
sented by the a x i a l dispersion model, i t i s useful to i n v e s t i
gate the e f f e c t s of k i l n operating parameters on Peclet number
or the a x i a l dispersion c o e f f i c i e n t D. The e f f e c t of operating
parameters, e s p e c i a l l y r o t a t i o n a l speed, on n has been studied
by many investigators (19,30-32, 34, 36, 62). The rel a t i o n s h i p
between D and N/Nc based on the present experiments i s shown
in Figure 6-17, along with the experimental re s u l t s of other i n
vestigators. D i s plotted against N/N , instead of N, because
N/Nc i s able to indicate the flow pattern of p a r t i c l e s i n a
rotary cylinder, as described i n Section 2-1. As discussed i n
Section 2-3 and seen i n Figure 2-4 there has been l i t t l e agree
ment on the relationship between D and N. The experimental
res u l t s of Abouzeid, et a l (30), Rutgers (19) and Sugimoto et

Figure 6-13 Residence Time Di s t r i b u t i o n (Pe = 404)
vO

0 . 7 0 . 8 0 . 9 1.0 1.1 1.2 1.3
DIMENSIONLESS TIME
Figure 6-14 Residence Time Distribution (Pe = 371)

9 L
1 . 4
DIMEN5I0NLE55 TIME
Figure 6-15 Residence Time Dist r i b u t i o n (Pe = 567). -o

9 L
CX
O
CE
LU (_) o CJ CO CO
o I—i CO LLJ
i—i a
8 L
7
6
5
4
3
2
1
0 0.7
<!> PECLET N0.= 382 ^ EXPERIMENTAL DflTfl
EQURTION 6- 3 0
0.8 0.9 1.0 DIMENSIONLESS TIME
Figure 6-16 -Residence Time Dist r i b u t i o n (Pe = 382)
1 .3 1 . 4
Cr O

<=> 30
l -2 20
10
6
4
© This work a Sugimoto et al x Rutgers o Morigama 8t Suga A Abouzeid, et al v Matsui
< 2
0.6 h
0.01 0.02 0.04 0.07 Ql 0.2
N / N c
0.4 0.7
Figure 6-17 Relationship of D and N/N .

a l (36-38) indicated that D was proportional to the square root
of rotation speed, however those of Matsui (34) and Moriyama
and Suga (32) reported D was d i r e c t l y proportional to rotation
speed. The r e s u l t of the present experiments agree with Matsui,
and Moriyama and Suga. The discrepancy in slopes seems to be
related to differences i n flow regimes of bed p a r t i c l e s . Figure
6-17 c l e a r l y indicates that D i s d i r e c t l y proportional to N at
N/Nc < 0.1 where the r o l l i n g type of bed movement was obtained,
whereas for the cascading bed, N/Nc > 0.1, D i s proportional to
the square root of N.
The high Peclet numbers obtained indicate that the s o l i d
flow can be considered as plug flow i n k i l n s of the size used
in t h i s study.
Heat Transfer
6.6 Solid and Gas Temperature
6.6a Soli d Temperature
The bed temperature i n r a d i a l d i r e c t i o n i s usually as
sumed uniform i n the modelling of a rotary k i l n although the
surface temperature i s l i k e l y to be higher. The former assump
tion was confirmed i n t h i s study by measurements with three
r a d i a l l y spaced thermocouples inserted into the bed. The r a d i a l
bed temperatures along the k i l n i n two sets of data are given
i n Figure 6-18. Temperatures at d i f f e r e n t bed depths are within
+ 2 K, and the bed can be taken as radially isothermal-in the bulk.
E f f e c t i v e r a d i a l mixing i s a major contribution to uni-

103
550
5 0 0
4 5 0
Distance below Bed Surface
A 4.6 mm O I 6.3 mm • 29.0 mm
Bed Height = 4 3 mm
4 0 0
350
30Q
© ® t o
0.5 1.0 1.5 2.0
DISTANCE FROM CHARGE END, m
2.5
Figure 6-18 Radial Solid Temperature i n the Bed

104
formity of r a d i a l bed temperatures. The r a d i a l s o l i d flows
are i n the r o l l i n g pattern under conditions tested. Heat i s
transferred from a i r to the exposed surface layer which i s well
mixed when r o l l i n g down to the foot of the bed surface. Immed
i a t e l y a new fresh layer repeats the same phenomena as the
previous layer. With such fast turnover of s o l i d material and
short exposure time on the surface, the material appears to be
thermally mixed when i t emerges into the bed. Thus, a single
bed temperature can adequately represent the s o l i d temperature
at a given a x i a l p o s i t i o n .
6.6b Gas Temperature
The calculations of heat balance and heat transfer require
the average gas temperature at a given a x i a l p o s i t i o n . To de
termine a true bulk temperature both r a d i a l gas temperature and
ve l o c i t y p r o f i l e s would be required along the k i l n .
Figure 6-19 shows a r a d i a l gas temperature p r o f i l e taken
at 1.7 m from the gas entrance using a portable shielded probe.
In the absence of gas v e l o c i t y data, the average gas temperature
was calculated assuming plug flow of gas using the following
equation:
T (x) = "I T (x,r) A./EA. g . g. I I (6-3a
For the present test, the average gas temperature was 409.2 K,
compared to the centerline gas temperature of 412.5 K. If a
ve l o c i t y d i s t r i b u t i o n that accounted for the v e l o c i t y decrease
near the wall were used to calculate a bulk temperature, the value
would be even closer to the centerline temperature. The wall and
solids temperatures are shown as 347K and 376K respectively. The

105
U J
or
tr LU o_ L U I -co <
4 3 0
420
410
4 0 0
390
380
370
Wg = 50 kg/hr
-Tg =420.8 K x O , J Q 3 4 kg/hr ^ \ Q |
G ^ 4 1 2 . 5 K
-o-18.6 kg/hr
•o —o-
386.8 K
1 1
O i l <
1 Q \
Q
0 10 20 30 40 50 60 70 80 90 100
RADIAL POSITION , mm
Figure 6-19 Average Radial Temperature P r o f i l e

106
appropriate d r i v i n g forces for heat transfer are thus AT^ w =
409.2-347=66.2 K and AT = 409.2-376=33.2 K. Experimental gs
d i f f i c u l t i e s precluded the routine measurement of both r a d i a l
arid a x i a l temperatures. Instead the temperature 25.4 mm from
the centerline was used to approximate the average temperature
at a given a x i a l p o s i t i o n . This w i l l give a s l i g h t l y larger c a l
culated AT for both gas/solids and gas/wall c o e f f i c i e n t s . In the present case the AT -412.5-376=36.5 K, and AT = 412.5-367= c gs gw 65.5 K. Thus reported heat transfer c o e f f i c i e n t s w i l l be conserv
at i v e . The e f f e c t of using the near-centerline temperature rather
than the bulk temperature w i l l be small since on average AT^s~67K and AT =70 K. However a 3K deviation i n T w i l l make c o e f f i c i e n t s gw g about 10% low at low percentage f i l l , and low solids throughputs
where AT^ s are about 30-40 K. On average the reported c o e f f i c i e n t s
w i l l be about 4% low. 6.7 Axial Temperature D i s t r i b u t i o n
Figure 6-20 i s a t y p i c a l curve of the a x i a l temperature
d i s t r i b u t i o n s found along the k i l n . A i r temperatures and sand
temperatures were taken at f i v e locations, whereas wall tempera
tures were taken at four locations. The smooth curves along
experimental curves were obtained by the use of spline functions.
For most runs the sand temperature i s higher than the wall temp
erature u n t i l they approach each other near the discharge end.
This r e f l e c t s the greater rate of heat transfer to the bed than
to the wall, and the r e l a t i v e l y high heat loss through the wall.
In t h i s t y p i c a l run as shown i n Figure 6-20 the temperature pro
f i l e s are not l i n e a r and the temperature difference between gas
and solids temperature i s f a i r l y constant along the k i l n at
about 55 K. The temperature d r i v i n g force w i l l be reduced to
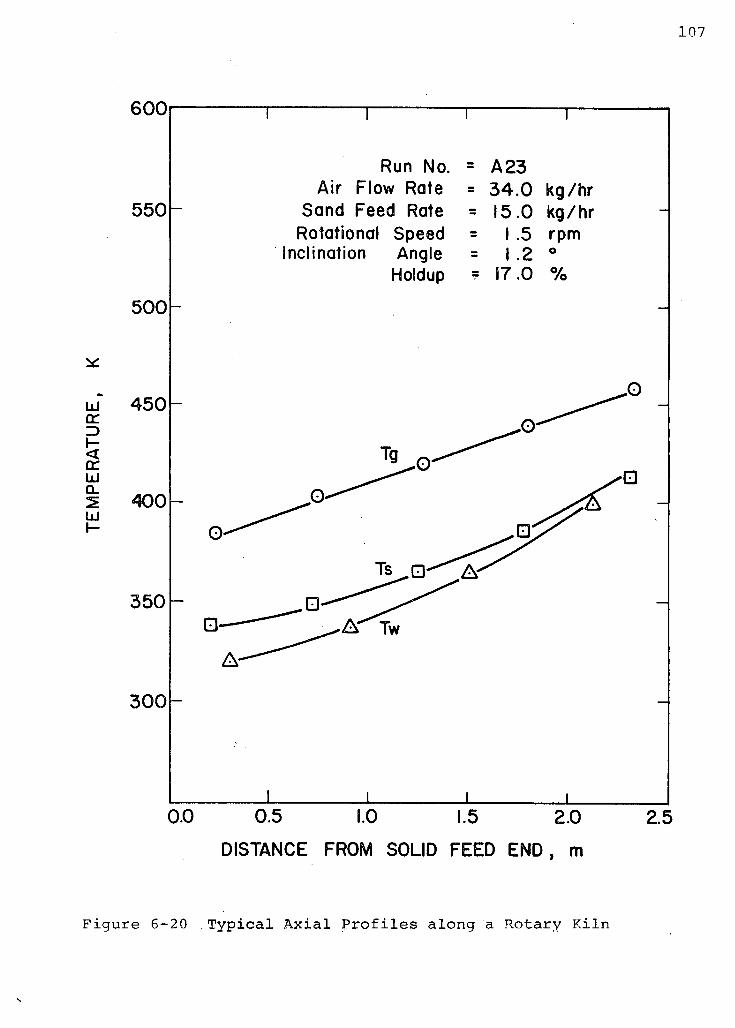
107
6 0 0
5 5 0 h
500
UJ or ZD \-< tr
UJ o_ U J I -
4 5 0 h
400
350
3 0 0 h
Run No. = A23 Air Flow Rate = 3 4 . 0
Sand Feed Rate = 15.0 Rotational Speed = I .5
Inclination Angle = I .2 Holdup = 17.0
Tg
Ts A-
A ^ T w
kg/hr kg/hr rpm o
%
_L 0.0 0.5 1.0 1.5 2.0
DISTANCE FROM SOLID FEED END, m
2.5
Figure 6-20 .Typical A x i a l P r o f i l e s along a Rotary K i l n

108
53 K i f the average gas temperature as d i s c u s s e d i n the p r e v i o u s
s e c t i o n i s used. T h i s r e s u l t s o n l y i n 4% i n c r e a s e of heat trans
f e r c o e f f i c i e n t i f the average gas temperature i s used i n s t e a d
of the c e n t e r l i n e temperature.
F i g u r e 6-21 shows the r e p r o d u c i b i l i t y of temperature
readings f o r two runs a t the same o p e r a t i n g c o n d i t i o n s c a r r i e d
out two days a p a r t . The data were r e p r o d u c i b l e w i t h i n 2.5 K
f o r s o l i d s temperature, 1.5 K f o r w a l l temperature and 1.0 K f o r
gas temperature. The e f f e c t of a i r f l o w r a t e on temperature
d i s t r i b u t i o n i s d e p i c t e d i n F i g u r e 6-22. The a i r e n t e r i n g the
k i l n f o r these two runs was kept at the same temperature. The
temperatures of a i r , sand and w a l l f o r h i g h a i r f l o w r a t e were
found t o be h i g h e r than those f o r lower f l o w r a t e . The reason
can be e x p l a i n e d as f o l l o w s . The heat t r a n s f e r c o e f f i c i e n t
from gas to s o l i d s i s a f u n c t i o n of gas f l o w r a t e as h <* W .
where n i s l e s s than u n i t y . Then an i n c r e a s e of gas f l o w r a t e
i n c r e a s e s the heat flow r a t e from gas to s o l i d s a c c o r d i n g l y i f
T - T remains about the same. Since Q W C AT , thus AT , g s g pg g g
the gas temperature drop, becomes depending on gas f l o w r a t e i n — ( 1 — n )
a form of w . T h e r e f o r e i n c r e a s i n g gas f l o w r a t e decrease g
the gas temperature drop.
The e f f e c t of r o t a t i o n a l speed and sand throughput on
the temperature p r o f i l e s i s given i n F i g u r e 6-23. The tempe
r a t u r e s of a i r , sand and w a l l f o r a h i g h e r r o t a t i o n a l speed were
found to be lower than those f o r a low speed. These e f f e c t s
are e x p l a i n e d below. As noted i n S e c t i o n 6.4, i n order to main-

109
550
5 0 0 h
Run No. A21 Run No. A 23
Air Flow Rate Sand Feed Rate
Rotational Speed Inclination Angle
Degree of Fi l l
34.0 kg/hr 15.0 kg/hr
1.5 rpm 1.2 degree
17.0 %
450 U J c e
ZD
U J
a . U J
4 0 0 k
3 5 0 h
300r-
I I I I I I 0.0 0.5 1.0 1.5 2.0 2.5
DISTANCE FROM SOLID FEED END, m
F i g u r e 6-21 R e p r o d u c i b i l i t y of A x i a l Temperature P r o f i l e s along Rotary K i l n

110
1 1
Air Flow Rate 81 kg/hr
Air Flow Rate 34 kg/hr 550
500
Sand Throughput Rotational Speed
Inclination Angle Degree of Fill
= 3 6 kg/hr = 3 .0 rpm = 2 . 0 degree = 11.0 %
* 450
L x J QC
or UJ a .
4 0 0
UJ h-
350
3 0 0
1 0.0 0.5 1.0 1.5 2.0
DISTANCE FROM CHARGE END, m
2.5
F i g u r e 6-22 E f f e c t o f A i r Flow Rate on A x i a l Temperature P r o f i l e s along Rotary K i l n

I l l
550
5 0 0
( Sand Throughput Rotational Speed
Sand Throughput Rotational Speed
15 kg/hr 1.5 rpm
3 4 kg/hr 3.0 rpm
Air Flow Rate Inclination Angle
Degree of Fil l
= 3 4 kg/hr = 1.36 degree = 17 %
Ixl or z> $ DC IxJ Q. UJ
4 5 0
400
350
300
1 0.0 0.5 1.0 L5 2.0
DISTANCE FROM CHARGE END , m
2.5
F i g u r e 6-23 E f f e c t of Sand Throughput and R o t a t i o n a l Speed on Temperature D i s t r i b u t i o n

tain a uniform bed depth along the k i l n , doubling r o t a t i o n a l
speed requires a double sand feedrate. Meanwhile an increase
of r o t a t i o n a l speed increases the gas to solids heat transfer
c o e f f i c i e n t as w i l l be demonstrated i n Section 6.10, which re
sults in an increase in heat flow from gas to sands accordingly.
Since Q « w AT , the gas temperature drop i s expected to be g q
higher for a higher r o t a t i o n a l speed at a constant gas flowrate,
W . Thus the s o l i d temperature i s also expected to be lower for
a high r o t a t i o n a l speed. Figure 6-24 shows the e f f e c t of a i r
i n l e t temperature. A i r temperature near the discharge end drops
much more quickly for the high i n l e t temperature run than for
the low temperature run.
6.8 Calculation Method for Heat Transfer C o e f f i c i e n t
The c a l c u l a t i o n of heat transfer c o e f f i c i e n t s was based
on a simple but r e a l i s t i c equation with the following assumptions
1. The gas phase i s i n plug flow and at uniform temperature
at each a x i a l position.
2. Since the s o l i d bed temperature i s r a d i a l l y uniform,
therefore, the s o l i d temperature i s a function of a x i a l
distance only. Solids move i n plug flow.
3. The wall temperature i s taken to be independent of angle
and time. The experimental re s u l t s show i n s i g n i f i c a n t
fluctuations of wall temperature under conditions used.
4. The bed surface i s assumed f l a t , and i n the c a l c u l a t i o n
of gas/bed c o e f f i c i e n t s i t s area i s taken equal to the
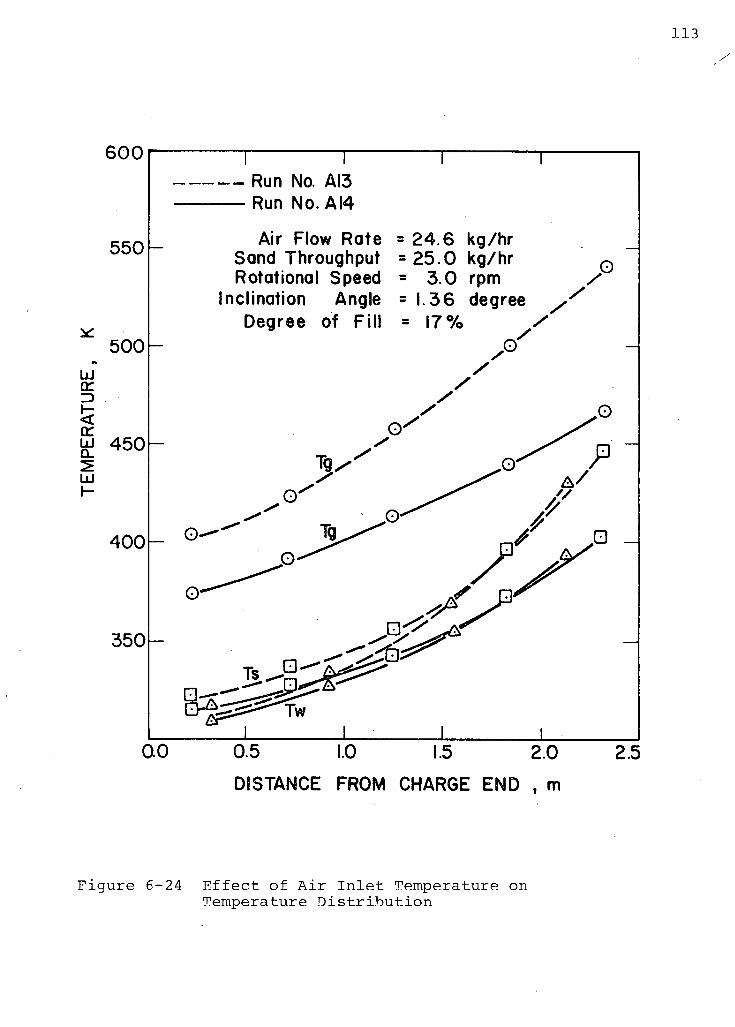
113
6 0 0
550 h
500
UJ or ZD -
or w 450
U J
H
400
350
n r Run No. AI3 Run No. AI4
Air Flow Rate = 24 .6 kg/hr Sand Throughput = 2 5 . 0 kg/hr Rotational Speed
Inclination Angle Degree of Fill
= 3.0 rpm = 1.36 degree
. 0
0.5 1.0 1.5 2.0
DISTANCE FROM CHARGE END , m
2.5
Figure 6-24 E f f e c t of A i r Inlet Temperature on Temperature D i s t r i b u t i o n

chord l e n g t h times the bed l e n g t h .
The above assumptions are v a l i d f o r the whole l e n g t h o f
the k i l n except the zone of the s o l i d i n l e t , where the p a r t i c l e
f a l l from the fe e d i n g chute and shower through the a i r stream.
In t h i s r e g i o n the temperature of the p a r t i c l e s r i s e s r a p i d l y .
From an enthalpy balance taken over an incremental a x i a l
l e n g t h of k i l n as i l l u s t r a t e d i n F i g u r e 6-25, the f o l l o w i n g
equations can be e a s i l y derived: 1/.
Gas phase
dH
= <WX> + qgw(K) ( 6 ' 4 )
S o l i d phase
dH = ^ g s ( x ) " q s w ( x ) <6-5>
The second term i n equation 6-5 i s w r i t t e n w i t h the s i g n
a p p r o p r i a t e to the case where T g > T . H i s the enthalpy and
i s d e f i n e d as
and
H = W C (T - T ) (6-6)
9 g pg. g g r
H s = W s CP s ( T s - T s r ' <6-7>

zzzzzzzzzzz n w » ) f { m u m n in
GAS
f SOLIDS
'//////////. Tviyi I I 11 I 1 TTTT I
Figure 6-25 D i f f e r e n t i a l Section of Rotary K i l n .

116
where T g r , T S r are r e f e r e n c e temperatures f o r gas and s o l i d
r e s p e c t i v e l y and q r e p r e s e n t s a heat flow per u n i t l e n g t h . The
s u b s t i t u t i o n o f equations 6-6 and 6-7 i n t o equations 6-4 and
6-5 r e s p e c t i v e l y , g i v e s
dH : C W dT _ g = p g . g _ a , f i _„x dx dx ( 6 8 )
dH C W dT S = ^ -PS- s s air P dx~ ( 6- 9)
The heat t r a n s f e r terms, q (x), q (x) and q (x) are ^gs ^gw ^sw
d e f i n e d i n terms of heat t r a n s f e r c o e f f i c i e n t s ,
V ( x ) = V ( x ) V T g " Tw } ( e - 1 1 )
*sw ( x ) = h s w ( x ) V ( T's " Tw) < 6" 1 2>
With equations 6-8 to 6-12, equations 6-4 and 6-5 become
C W c\ T pg g g = h ( x ) i (T - T )+h ( x ) i (T - - T , 7 < )
dx gs s g s' gw w s w'
(6-13)

C p s W S d T s =h ( x ) l ( T - T . ' ) - h ( x ) l , (T • -T. ) * — gs s g s sw w1 s w dx
(6-14)
I n t h e s e two e q u a t i o n s , T^, Ts a r e o b t a i n e d f r o m e x p e r i m e n t a l dTcj d T s
measurements and t h e a x i a l g r a d i e n t s , — — and -=— a r e c a l c u -x
l a t e d f r o m t h e t e m p e r a t u r e d i s t r i b u t i o n a l o n g t h e k i l n by use o f s p l i n e f u n c t i o n s . However, t h e r e a r e t h r e e unknown v a r i a b l e s
h ( x ) , h (x) and h (x) i n e q u a t i o n s 6-13 and 6-14. I n o r d e r gs gw sw ^ t o e v a l u a t e t h e h e a t t r a n s f e r c o e f f i c i e n t s f r o m gas t o s o l i d ,
and gas t o w a l l , one must know h ( x ) , t h e h e a t t r a n s f e r c o -^ sw
e f f i c i e n t f r o m s o l i d t o w a l l . F o r t u n a t e l y t h e s o l i d b e d - w a l l
h e a t t r a n s f e r c o e f f i c i e n t s a r e a v a i l a b l e i n t h e l i t e r a t u r e and
t h e s e e x p e r i m e n t a l d a t a have been c o r r e l a t e d u n d e r t h e frame o f
p e n e t r a t i o n m o d e l . The r e s u l t i s g i v e n i n t h e n e x t s e c t i o n .
Once h (x) i s known, t h e n h e a t t r a n s f e r r a t e f r o m gas t o s o l i d sw b ed i s c a l c u l a t e d by
q a s ( x ) = + q q w ( x ) (6-i5) gs d x sw
t h a t , i n t u r n , i s u s e d t o c a l c u l a t e h e a t t r a n s f e r r a t e f r o m gas
t o w a l l , q (x) by ' ^sw 1
V ( x ) = ^ - q g s ( x ) ( 6 - 1 6 )
q ( x ) , q (x) a r e l o c a l h e a t t r a n s f e r r a t e s . The a v e r a g ^gs ^gw ^ h e a t t r a n s f e r r a t e p e r u n i t l e n g t h o f k i l n c a n be c a l c u l a t e d as

11H
<3gs = ) * g s( X ) d X 7 U 2 " X l } (6-17)
X l
and
V = / X \ w ( x ) d X / ( X2 " Xl> ( 6 " 1 8 )
The logarithmic mean heat transfer c o e f f i c i e n t s for gas to sol i d s
and gas to wall are represented by
h • = q / 1 (T - T-) , (6-19) gs ^gs ' s g s' lm
h = q / 1 (TCT - T w ) . (6-20) gw gw w y v / lm
respectively, where
(VTs>lm " ( V ^ x z " <Tg " Vx,; In ( Tg~ Ts)x2
(T -T )
and
(VTw)lm (T -TV) - (T J-T' •) v x g 'W x,, v ± g V ' x i
In-' 9 W x ? ( T g - T w ) x -

119
The heat l o s t through the k i l n wall to the surroundings can be
estimated by the heat conduction equation for the i n s u l a t i o n
material
2 k.(T -T. ) , , a. v in q-^x) = In (D. /D) (6-21) m w
where k.: thermal conductivity of i n s u l a t i o n material. D , l J w D^n, diameters where temperature probes for wall and i n s u l a t i o n
material. - ,.-..>.
From experimental measurements of wall temperature and
the temperature of i n s u l a t i o n material the heat loss through
the wall may be calculated.
A heat balance over a section of the wall y i e l d s
q l ( x ) = V ( X ) + q s w ( x ) ( 6 " 2 2 )
The subtraction of equation 6-4 from equation 6-5 also gives the
sum of q ix) + q (x) ^gwx ^sw
^ " = q ^ i X ) + q S w U ) ( 6 " 2 3 )
These two equations are used to check the heat loss through
the wall. A l o c a l heat balance deviation was defined:

120
L o c a l D e v i a t i o n = 100 q s (x)+q 1 (x)-q„(x) / q g ( x )
Thus negative d e v i a t i o n s i n d i c a t e d t h a t more heat was l o s t from
the gas than was gained by the s o l i d s and l o s t through the w a l l .
6.9 Bed to Wall Heat T r a n s f e r
In o r d e r to eva l u a t e heat t r a n s f e r from gas to s o l i d s
bed and w a l l , heat t r a n s f e r from s o l i d s bed to w a l l or v i c e
v e r s a must be known. Although some experimental data f o r w a l l
to s o l i d s bed heat t r a n s f e r (3, 42, 43), together w i t h proposed
models are a v a i l a b l e i n the l i t e r a t u r e , ,.as d e s c r i b e d i n Chapter
2 no proposed model y e t s a t i s f a c t o r i l y r e p r e s e n t s a l l the p u b l i s h
ed experimental data. An attempt was made to c o r r e l a t e the data
w i t h i n the frame of the p e n e t r a t i o n model. The simple p e n e t r a
t i o n model wi t h I.C. and B.C. as given i n equations 2-23 leads
to the f o l l o w i n g dimensionless equation
= 2 /nR^32_ ( 6 _ 2 4 , k ^ a
s
F i g u r e 6-26..plots the p u b l i s h e d data (3, 42, 43) i n terms of
h 1 , nR 2g sw w k s
versus • The c o r r e l a t i o n i n the f i g u r e shows
a very i n t e r e s t i n g r e s u l t . The Nusselt number, h 1 , increases 3 sw w
k s

A W a c h t e r s & K r a m e r s
v Wes e t a l d p = 15 - 1 0 0 vm
L e h m b e r g e t a l
9 s o d a
o s a n d
•
m "•
d « = 137 v m
1 5 7
3 2 3
7 9 4
1038
A A A M A A A
_ B g B g s C i B B B
o •
3 0
10' 10* n R 2 ^
10 10" 6 x 1 0
Figure 6-26 Correlation of Solids Bed-to-Wall Heat Transfer C o e f f i c i e n t .

122
2 with increasing nR B/a according to the following equation,
h 1 , sw w' k = l x - 6
s
nR 2B n
0.3 2 nR I < 10 4 (6-25)
2 4 At values of nR B/a > 10" the dependence of h 1 ,/k on ^ sw w* s 2
nR 3/a becomes stronger, then ns w - ' - w i / - c
s approaches a l i m i t i n g value which depends on p a r t i c l e sizes. The data with coarse
2 4 p a r t i c l e s tend to l e v e l o f f quickly beyond nR B/a = 10", whereas with fine p a r t i c l e s , h 1 ,/k continues to increase. The
^ sw w1 s values of h 1 ,/k estimated from equation 6-25 are lower than sw w' s ^ those from the simple penetration model from-which equation
6-24 i s derived. The negative deviation can be re a d i l y ex
plained by the presence of a gas f i l m near the -wall, as postu
lated by B o t t e r i l l et a l (63) for the f l u i d i z e d bed, Epstein
and Mathur (4 5) for the spouted bed and Lehmberg et a l (43)
for the rotary k i l n .
Ernest (64) carried out experiments on moving beds with
d e f i n i t e contact time, t , using p a r t i c l e sizes 100 pm - 700 p .
A l i m i t i n g value of heat transfer c o e f f i c i e n t between wall and
bed was found at very short contact time, t < 0.1 second. The
l i m i t i n g value depended on p a r t i c l e s i z e . The contact time bet
ween the wall and the p a r t i c l e s near the wall i s approximately
of the order of ten seconds under conditions of t h i s study. The 2 3 4 range of nR B/a i s from 10 to 10 . Therefore equation 6-25
i s used to calculate the heat transfer c o e f f i c i e n t s for the solids

bed and the wall.
6.10 Heat Transfer C o e f f i c i e n t s
6.10a Local Heat Transfer C o e f f i c i e n t
The length of the k i l n taken to be the test section i n
t h i s study i s the central 0.53 meters which gives a x/D r a t i o
of 2.78. The test section i s situated between 1.25 m (L/D
= 6.56) from the s o l i d charge end and 0.66 m (L / n = 3.46) from
the discharge end of the k i l n .
The l o c a l heat flow per unit length from the gas and to
the solids was calculated as described i n Section 6.8. Table
6-3 shows the re s u l t s of heat flow determination within the
test section from a t y p i c a l experiment. In the test section
the gas gives up the o v e r a l l heat of 211.2 W of which about
73% goes to heat up the s o l i d s . The heat flow from the solids
to the wall accounts for the one t h i r d of the heat l o s t through
the wall. The l o c a l heat balance deviation varies from -5,9%
towards the charge end to +5.1% i n the middle of the test sec
tion, then to -12.4% near the hot end. However the o v e r a l l
heat balance i n the test section deviates only -1.4%. In th e i r
high temperature experiment i n the p i l o t k i l n , Brimacombe and
Watkinson (4) reported the l o c a l heat balance deviation of +20%
near the charge end to -20% near the hot end. mhe change i n
deviation, i n th e i r r e s u l t , from negative to posi t i v e was
thought to be due to the neglect of downstream ra d i a t i o n .
The l o c a l heat transfer c o e f f i c i e n t s from the gas to

124
Table 6-3
Local Heat Flows and Heat Transfer C o e f f i c i e n t s
x (m) 1. 25 1. 30 1. 40 1.50 1. 60 1. 71
T g (K) 462. 0 464 . 3 469 . 3 474.6 480. 4 492. 0
T s (K) 374. 0 377. 0 384 . 1 392.2 400. 9 417. 0
T w (K) 369 . 2 372. 9 380. 3 388.0 395 . 7 410. 5
T c (K) 343. 6 346. 1 351. 5 357.7 364 . 7 380. 5
q (W/m) ^sw ' 57. 2 50. 0 45. 1 50.1 61. 4 77. 9
q s (W/m) 169 . 2 190. 8 226. 5 252.1 267 . 3 26 8 . 1
q g s (W/m) 226. 4 240. 8 271. 7 302.2 328 . 7 345. 9
q g (W/m) 322. 6 335. 0 361. 5 390.6 422. 2 485. 3
q g w (W/m) 96. 3 94. 1 89. 9 88.4 93. 4 139. 4
c3gw + (3 Sw ( W / m ) 153. 6 144. 1 135. 0 138.5 154. 8 217 . 3
q 1 (W/m) 134. 0 140. 2 150. 7 158.6 162. 2 157
l o c a l deviation, ( % )
-5. 9 -1.. 2% A. 3 5.1 1. 3 -12. 4
h (W/m2
y l o c a l h (W/m 9 w l o c a l
K)
K)
16.
2.
13
53
... 17..
2.
3
51
'20 J
2.
0
47
.' 2 300
2.49
25.
2.
9
69
28 .
4.
9
1'

the solids and to the wall were calculated based on equations
6-10 and 6-11. The ca l c u l a t i o n r e s u l t s are included i n Table
6-3 and shown i n Figure 6-27' i n which the l o c a l heat transfer
c o e f f i c i e n t s are plotted against x, the distance from the charge
end and against the r a t i o of x/F). As shown i n Figure 6-27 both
h (x) and h (x) increase as x increases towards the hot end. gs gw 2 2
The h g s ( x ) gradually increases from 16.1 w/m K to 28.9 W/m K.
The same trend was also obtained hy Brimacombe and Watkinson
(4) i n t h e i r p i l o t k i l n . In a t y p i c a l run of t h e i r experiments
the l o c a l heat flow received by the sol i d s doubled from one end
of the test section to the another end. Since the temperature
difference, (T^-T^) remained the same over the test section i n
thei r study, the l o c a l heat transfer c o e f f i c i e n t s , thus, doubled
from one end of the test section to another end. The shape of
the increasing h g w ( x ) as shown i n Figure 6-26 i s found consistent
with that for hot gas flowing through a tube near the entry
region. As reported by Rohsenow and Hartnett(65) the l o c a l Nus-
s e l t number increases sharply towards the gas entry region.
Comparisons of the present re s u l t s with those i n the l i t e r a t u r e
are given i n section 6-10h.
The logarithmic mean heat transfer c o e f f i c i e n t s h and gs h over the test section are calculated by equations 6-19 and gw -r
6-20. The values of h and h are 22.4 W/m2K and 3.0 W/m?'K gs gw '
respectively for the t y p i c a l run as given i n Table 6-3.

126
<NJ 4 0 E
* 3 0 H Z Ul o 2 0 U_ U. 8 O
o r
it! 1 0
CO z
<
5 X
< o Q
D I S T A N C E F R O M GAS E N T R A N C E , L - X
D I S T A N C E F R O M GAS E N T R A N C E , D
12 10 8 6 4 2 0
l | i i i l 1 1 1 1 1 1 1 -
— s —
— —
y
— Test Sect ion / / —
_ RUN AI6 / /
/
—
—
/ /
/ —
—
— — Q
>
I i i 1 i I 1 1 1 1 1 1 2 4
1 1
6
1
8
X / D
1
10
1
12
!
0 0.5 1.0 15 2 0 2
D ISTANCE F R O M SOLID C H A R G E E N D X , m
Figure 6-27 Local Heat Transfer C o e f f i c i e n t
127
6.10b E f f e c t o f A i r T e m p e r a t u r e
F i g u r e .6-28 shows t h e e f f e c t o f a v e r a g e a i r t e m p e r a t u r e
on h e a t t r a n s f e r c o e f f i c i e n t . A i r t e m p e r a t u r e s , i n t h i s i n v e s
t i g a t i o n , r a n g e f r o m 350 F. t o 570 K. The a i r t e m p e r a t u r e has
no e f f e c t on t h e gas t o s o l i d s bed h e a t t r a n s f e r c o e f f i c i e n t .
W a t k i n s o n and Brimacombe (63) r e p o r t e d a s i g n i f i c a n t e f f e c t o f
gas t e m p e r a t u r e , r a n g i n g 650 K t o 830 K, i n a d i r e c t - f i r e d r o
t a r y k i l n . The a v e r a g e c o n v e c t i v e g a s - s o l i d c o e f f i c i e n t s , i n
2 t h e i r r e s u l t s , a r e i n t h e r a n g e o f 120 t o 240 W/m K. T h e s e
2 v a l u e s a r e much h i g h e r t h a n t h e v a l u e s , 18-53 W/m K o b t a i n e d
i n t h e p r e s e n t s t u d y f o r a n o n - f i r e d k i l n . F i g u r e 6-28 a l s o
shows t h a t a i r t e m p e r a t u r e has l i t t l e e f f e c t on h . The v a l u e s gw o f h a r e a b o u t an o r d e r o f m a g n i t u d e h i g h e r t h a n h . T h i s gs •' ^ gw
d i f f e r e n c e i s d i s c u s s e d below.
6-10c E f f e c t o f Gas F l o w r a t e
The e f f e c t o f gas f l o w r a t e on h e a t t r a n s f e r c o e f f i c i e n t s
f o r b o t h g a s - s o l i d s and g a s - w a l l was s t u d i e d a t c o n s t a n t s o l i d s
t h r o u g h p u t , r o t a t i o n a l s p e e d and i n c l i n a t i o n a n g l e , w h i c h , i n
t u r n , r e s u l t s i n c o n s t a n t d e g r e e o f f i l l . The gas f l o w r a t e was v a r i e d o v e r t h e r a n g e o f 18.6 t o 95 k g / h r , o r 653 t o 3334
2 kg/hr-m ( k i l n c r o s s s e c t i o n ) . The R e y n o l d s number i n t h e gas phase v a r i e d f r o m 1600 t o 7800. The h e a t t r a n s f e r c o e f f i c i e n t s , h and h , a r e p l o t t e d a g a i n s t gas f l o w r a t e i n F i g u r e 6-29. gs gw f -a
As e x p e c t e d , r a i s i n g t h e gas f l o w - r a t e i n c r e a s e s b o t h gas t o
s o l i d s and gas t o w a l l h e a t t r a n s f e r c o e f f i c i e n t s .

128
CM £ v.
CM E
JC
30
20
10
10
0
o
• • o • •
• Wg = 186 kg/hr Ws =36.0 kg/hr
O Wg =24.6 kg/hr Ws =14.2 kg/hr
A Wg =24.6 kg/hr Ws =25.0 kg/hr
• • O
350 400 450 500 550 600
AVERAGE GAS TEMPERATURE, K
Figure 6-28 E f f e c t of Gas Temperature on Heat Transfer C o e f f i c i e n t

129
1.0 2 0 40 60
GAS RATE Wg, kg/hr
Figure 6-29 E f f e c t of Gas Flow Rate on Heat Transfer C o e f f i c i e n t

130
As was noted above the valu e s of h are about an order gs
of magnitude higher than h . The higher v a l u e s of h are gw ^ gs
a t t r i b u t e d to two r e l a t e d f a c t o r s . ^he c o e f f i c i e n t f o r the gas
to s o l i d s heat t r a n s f e r i s based on the chord l e n g t h of a plane
bed s u r f a c e . However the t o t a l s u r f a c e area o f p a r t i c l e s on
top of a s t a t i c bed can be more than twice the plane s u r f a c e
area depending on p a r t i c l e arrangement. The other s i g n i f i c a n t
f a c t o r c o n t r i b u t i n g to higher h g S; i s r a p i d p a r t i c l e motion i n
l a t e r a l d i r e c t i o n , which would p r o h i b i t the development of a
v i s c o u s l a y e r t h a t would e x i s t even on a rough p l a t e , or on the
k i l n w a l l s , and would pres e n t an even l a r g e r s u r f a c e area f o r
heat t r a n s f e r .
I f the thermal r e s i s t a n c e of the gas/bed i n t e r f a c e i s
p i c t u r e d as c o n s i s t i n g of two r e s i s t a n c e s i n s e r i e s , one on the
gas s i d e , and the other on the s o l i d bed s i d e , then the strong
dependence of h g g on gas flow r a t e suggests the major r e s i s t a n c e
f o r heat flow from the gas phase to the bed i s on the gas s i d e .
Any means t h a t c o u l d reduce t h i s r e s i s t a n c e would d e f i n i t e l y
i n c r e a s e the heat flow. At the normal r o t a t i o n a l speed of the
r o t a r y k i l n the p a r t i c l e s r o l l on the s u r f a c e a t speeds much
g r e a t e r than the c i r c u m f e r e n t i a l speed of the k i l n . Thus, the
i n t e r f a c e c o n s i s t s of a r o l l i n g mass of p a r t i c l e s which would
c r e a t e t u r b u l e n c e i n the gas phase near the bed s u r f a c e .
6.10d E f f e c t o f R o t a t i o n a l Speed
F i g u r e 6-30 shows the e f f e c t of r o t a t i o n a l speed on the

131
to J C
in m d
5 CP JC
I f )
d
8
6
0.8
0.6
f 0.4
0.2
Degree of Fill •• A 6 .5% O 11.0%
Ws : 5 8 - 66 kg/hr
A X 0
J I JL I l 0.4 0.6 08 I 2 4 6
ROTATIONAL SPEED, rpm
Figure 6-30 E f f e c t of Rotational Speed on Heat Transfer C o e f f i c i e n t .

132
heat transfer c o e f f i c i e n t s , h and h . The e f f e c t of gas flow gs gw ^ 0575 o 1 7 ^ rate i s excluded by div i d i n g h and h with W " and W gs gw g g
respectively.
As seen i n the figure r o t a t i o n a l speed has a s l i g h t l y
p o s i t i v e e f f e c t on h , and a s i g n i f i c a n t negative e f f e c t on gs J 3
h . The s l i g h t l y p o s i t i v e e f f e c t of N on h _ can be explained gw u It gg tr
as follows. When heat i s transferred from the gas to a sta t i o n
ary bed, heat f i r s t has to reach the bed surface by convection
through a gas f i l m and then penetrate into the bed by conduction.
The convective heat transfer c o e f f i c i e n t to a stationary bed
can be estimated by the equations (66,67) developed for gas
flowing over a rough f l a t plate or through a rough empty tube.
As the k i l n starts to rotate at low speed, the bed slumps as
described i n Chapter 2 . In a slumping bed the bed surface
remains tranquil between slumps. On the tranquil surface heat
i s transferred to the exposed burden surface from the gas to
create a thin hot layer of pa r t i c u l a t e material. When the bur
den slumps the gas "f i l m " near the bed surface i s suddenly
agitated and the hot s o l i d layer would mix with a layer mass
of cooler material, leaving a fresh top surface to absorb heat
during the next slump period. mhe periodic function of gas
"fil m " disturbance and s o l i d mixing c e r t a i n l y increases the
heat transfer rate from the gas to the s o l i d bed compared with
that i n a stationary bed. Under the slumping condition, the
bed mixing i s then expected to control the heat uptake by the
bed. Figure 6-31 i l l u s t r a t e s the expected e f f e c t of N on h _

13 3
Figure 6-31 E f f e c t of FI on h i n Both Slumping and Rolling Beds g

with several types of bed movement. The c o e f f i c i e n t h i s J ^ gs expected to increase substantially with increasing M u n t i l at
a speed i s reached where r o l l i n g s t a r t s . Once r o l l i n g begins
the dominating thermal resistance i s thought to s h i f t to the
gas side. P a r t i c l e l a t e r a l v e l o c i t y on the bed surface i s high
enough to convey any heat received through the gas " f i l m " as
described before. In the r o l l i n g bed an increase of r o t a t i o n a l
speed increases the l a t e r a l v e l o c i t y of surface p a r t i c l e as
<* N
as shown i n Figure 6-6. Since r o t a t i o n a l speeds i n t h i s study
range from 1 to 6 rpm, the l a t e r a l v e l o c i t y increases by about
2.5 times, which apparently does not a l t e r the gas side r e s i s t
ance markedly. As a r e s u l t increasing r o t a t i o n a l speed i n the
r o l l i n g bed increases the heat transfer c o e f f i c i e n t s from gas
to s o l i d s bed only s l i g h t l y .
The negative e f f e c t of increasing the r o t a t i o n a l speed
on the gas to wall c o e f f i c i e n t appeared somewhat surprising.
However, Cannon (68) reported the same e f f e c t of r o t a t i o n a l
speed on convective gas-wall beat transfer. His experiments
were carried out with a i r flowing through an 1.52 m long empty
rotating pipe, 0.0254 m i n diameter. Laminar and t r a n s i t i o n
regions of gas flow were investigated. The most s i g n i f i c a n t
e f f e c t of rotation was found to be i n the t r a n s i t i o n region.
He concluded that pipe rotation tends to s t a b i l i z e the laminar
flow so that t r a n s i t i o n occurs at higher Reynolds numbers.
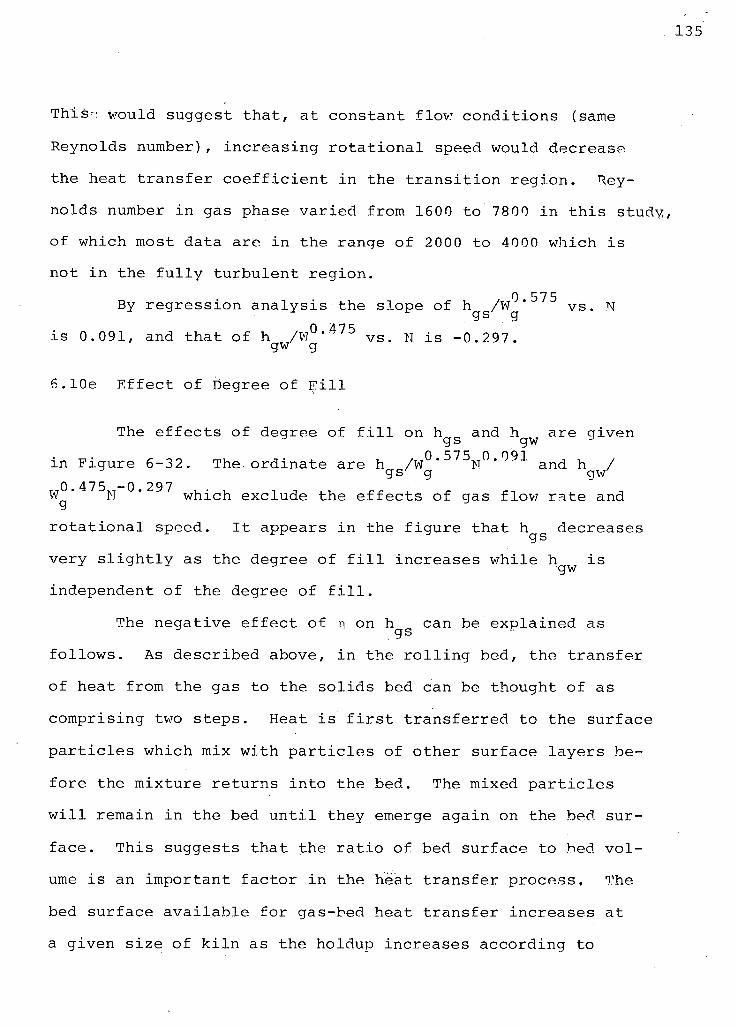
135
This-: would suggest t h a t , a t constant flow c o n d i t i o n s (same
Reynolds number), i n c r e a s i n g r o t a t i o n a l speed would decrease
the heat t r a n s f e r c o e f f i c i e n t i n the t r a n s i t i o n r e g i o n . Rey
nolds number i n gas phase v a r i e d from 1600 to 7800 i n t h i s study,
of which most data are i n the range of 2000 to 4000 which i s
not i n the f u l l y t u r b u l e n t r e g i o n . 0.575
By r e g r e s s i o n a n a l y s i s the slope of n g S / ^ g * v s - N i s 0.091, and t h a t of h /w 0 , 4 7 5 vs. N i s -0.297.
gw' g
6.10e E f f e c t of Degree of F i l l
The e f f e c t s of degree of f i l l on h and h are q i v e n ^ gs gw 0 575 0 091 i n F i g u r e 6-32. The.ordinate are h /W ' N and h / ^ gs' g gw
0 4 7 5 — 0 2 9 7 W ' M " which exclude the e f f e c t s of gas flov; r a t e and g J
r o t a t i o n a l speed. I t appears i n the f i g u r e t h a t h ^ s decreases
very s l i g h t l y as the degree of f i l l i n c r e a s e s w h i l e h ^ w i s
independent o f the degree of f i l l . The n e gative e f f e c t of n on h can be e x p l a i n e d as J gs
f o l l o w s . As d e s c r i b e d above, i n the r o l l i n g bed, the t r a n s f e r
of heat from the gas to the s o l i d s bed can be thought of as
comprising two s t e p s . Heat i s f i r s t t r a n s f e r r e d to the s u r f a c e
p a r t i c l e s which mix w i t h p a r t i c l e s of other s u r f a c e l a y e r s be
f o r e the mixture r e t u r n s i n t o the bed. The mixed p a r t i c l e s
w i l l remain i n the bed u n t i l they emerge again on the bed s u r
f a c e . T h i s suggests t h a t the r a t i o of bed s u r f a c e to bed v o l
ume i s an important f a c t o r i n the heat t r a n s f e r p r o c e s s . The
bed s u r f a c e a v a i l a b l e f o r gas-bed heat t r a n s f e r i n c r e a s e s a t
a g i v e n s i z e of k i l n as the holdup i n c r e a s e s a c c o r d i n g to

en
6.0 5.0 —
o d z 4.0 —
1 0
8 . 30 —
o OJ d i
2.0
1.0 0.9 0.8 0.7 0.6
0.4
0.3
Gas to Solid Bed
o o o N
a Ws
18.6 ~ 95.5 kg/hr. 0.9 ~ 6.0 rpm I. 4 ^ 4 . | °
II. 3 — 66.3 kg/hr
Gas to Wall
8
o 8
8
12 18
DEGREE OF FILL, %
Figure 6-32 E f f e c t of Degree of . F i l l on Heat Transfer C o e f f i c i e n t .

137
0. 27 A a n 0.04 < n < 0.30
however, the r a t i o of bed surface to bed volume decreases
s i g n i f i c a n t l y as
Bed surface _ n -. QC U • / J
Bed volume
Although the heat transfer rate, qg S, i s d i r e c t l y pro
portional to the bed surface area, experimental data i n Table
6-4 for' various degrees of f i l l at the same operating conditions
show a much weaker dependence of q g g on A g. In addition, the
temperature differences, (T - Ts ) l m " / were found about the same
in these three runs. Thus, the heat transfer c o e f f i c i e n t s ,
according to
q -gs h —!S«.
A AT, s lm
have a s l i g h t l y negative dependence on the degree of f i l l . The
slope of hgS/Wg* ^^N^" 9''" vs. n i n the log-log p l o t as shown i n
Figure 6-32 i s -0.171.
It i s expected that the gas to wall heat transfer coef
f i c i e n t s are independent of the degree of f i l l ,
6.10f E f f e c t o f . S o l i d Throughput and Incl i n a t i o n Angle
e oo n 4. 4- u / r 70. 575 -0 .171 0. 091 Figure 6-33 plots the term, h /W n N
against s o l i d s throughput with i n c l i n a t i o n angle as parameter,

Table 6-4
Ef f e c t of Degree of F i l l on
Heat Transfer Rate and Bed Surface
A22 A36 A47
n, % 17 11 6.5
A s(m 2) 0.084 0.075 0.065
q r T C (W) 165 150 147 gt>
AT l m( K) 65 63 66
h„„ 30.2 31.7 34.4
W 34 ~ 36 kg/hr g
N 3 rpm
W 34 ~ 36 kg/hr

139
o
8.0
6.0
4.0
m m en _ _
2.0
inclination Angle
A 1.36° O 2.6° • 4.1°
•
•
10 20 40 60 80
Ws , kg/hr
Figure 6-33 F f f e c t s of S o l i d Throughput and In c l i n a t i o n Angle on Gas-Solids Bed Heat Transfer C o e f f i c i e n t

0 ^75 -0 297 while the plot of n
g w / wg " ~ N " ' vs. s o l i d throughput i s
given i n Figure 6-34. The res u l t s of regression analysis show
that both s o l i d throughput and i n c l i n a t i o n angle have i n s i g n i -
cant effects on h „ and h In a r o l l i n g bed, i n c l i n a t i o n gs gw 3 '
angle would be expected to have no e f f e c t on heat transfer.
Solid p a r t i c l e s move through a rotary k i l n as a r e s u l t of cont
inuous a x i a l movements of p a r t i c l e s on the bed surface. A x i a l
v e l o c i t y of p a r t i c l e s i s about one order of magnitude less that
l a t e r a l v e l o c i t y as seen i n Figure 6-6 when p a r t i c l e s r o l l on
the bed surface,. The e f f e c t of t h i s slow a x i a l movement on heat
transfer i s ne g l i g i b l e compared with rapid l a t e r a l movements
of p a r t i c l e s , which are caused by the k i l n s rotation.
The regression analysis leads to the following equations
for gas-solids heat transfer, h = 2.44 W 0.575n-0.171N0.091 ( 6 _ 2 6 )
gs g
and for gas to wall,
h = 0.822 W °' 4 7 5N 0 , 2 9 7 (6-27) gw g
6.10g E f f e c t of P a r t i c l e Size
Limestone with three d i f f e r e n t p a r t i c l e sizes was used
to study the e f f e c t of p a r t i c l e s i z e . The three sizes used
were 10-20, 20-38 and 28-35 Tyler mesh which corresponds to

141
1 — r
sz
C M b i
m
b
2.0
1.0
0.8
0.6
Inclination Angle
A 1.36° O 2.6° V 4.1 °
o o o
0.4
0.251 10 20 30 40
Ws , kg/hr
60 100
Figure 6-34 E f f e c t of Solid Throughput and I n c l i n a t i o n Angle on Gas-Wall Heat Transfer C o e f f i c i e n t

average p a r t i c l e s i z e s o f 1.26, 0.72 and 0.51 mm, r e s p e c t i v e l y .
Three runs of experiments were c a r r i e d out f o r each of two d i f
f e r e n t a i r flow r a t e s , 18.6 kg/hr and 34.0 kg/hr. The e x p e r i
ments were c a r r i e d out a t temperatures much below c a l c i n i n g
c o n d i t i o n s . During the experiments a l a r g e amount of f i n e dust
was c r e a t e d when limestone was fed i n t o the k i l n . The s o l i d
feed r a t e was o r i g i n a l l y s e t a t 34 kg/hr, however the s o l i d out
put a t d i s c h a r g e end was measured o n l y 24-27 kg/hr. The dust
accounts f o r 20-30% of feed r a t e . Most of t h i s dust was im
mediately c a r r i e d away when limestone dropped i n t o the bed from
the chute and then d i d not enter the k i l n . Over the range co
vered, the e f f e c t of p a r t i c l e s i z e on heat t r a n s f e r i s i n s i g n i
f i c a n t as seen i n Table 6-5. The narrow s i z e range of p a r t i c l e s
may be the reason f o r the i n s i g n i f i c a n t p a r t i c l e s i z e e f f e c t .
However Brimacombe and Watkinson (69) have a l s o r e p o r t e d l i t t l e
e f f e c t on heat flow to limestone i n a r o t a r y k i l n c a l c i n e r over
p a r t i c l e s i z e range of 0.75 to 2.65 mm. Change i n p a r t i c l e s i z e
by a f a c t o r of 2.5 ap p a r e n t l y n e i t h e r generates f u r t h e r t u r b u
lence i n the gas " f i l m " , nor produces s i g n i f i c a n t i n c r e a s e i n
a c t u a l s u r f a c e area per plane chord s u r f a c e area a v a i l a b l e f o r
heat t r a n s f e r i n a closed-packed a r r a y . The B i o t numbers f o r
the three s i z e s of p a r t i c l e s are very s m a l l , 0.036, 0,021 and 2 2 0.015 (h = 20 W/m K, k = 0.692 W/m K assumed), t h e r e f o r e the p s
temperature w i t h i n the p a r t i c l e s becomes uniform a f t e r about
one second of exposure to heat t r a n s f e r .
Heat t r a n s f e r c o e f f i c i e n t s from a i r to the limestone bed

143
Table 6-5
Gas to Solids Heat Transfer C o e f f i c i e n t
- Ottawa Sand Limestone
d P
(mm) 0.7 3 1.26 0.73 0.5
Wg (kg/hr)
18.6 20.6-21.6 * 28.9 23.7 22.4
34 30.6-34.6 34.1 34.7 31.4
Wg (limestone) 24.4 -27 kg/hr
Ws (Ottawa Sand) 34 -36 kg/hr
N : 3 rpm
* W/m2K

are about the same as the case of Ottawa sand.
6.10h Comparison with Previous Work
A comparison was made of the experimental data i n the
present study on the ef f e c t of gas flowrate with two equations
recommended i n Perry's Chemical Engineering Handbook:
h = 0.0981 G 0 , 6 7 (2-32) g
and h = 0.0608 G g ° ' 4 6 / D (2-33)
G g r e p r e s e n t s the gas f l o w r a t e per c r o s s s e c t i o n area
of the k i l n . Equations 2-32 and 2-33 are p l o t t e d i n F i g u r e
6-35 wit h the experimental data obtained i n t h i s study.- In
cluded i n F i g u r e 6-35 are the data of Friedman and M a r s h a l l
(49) i n a r o t a r y d r y e r . The data were f o r the c o n d i t i o n s t h a t
no f l i g h t s were used.
The heat t r a n s f e r c o e f f i c i e n t s p r e d i c t e d by equations
2-32 and 2-33 l i e between the experimental data f o r h g s and
h g w> Equation 2-32 was giv e n based on the assumption t h a t a t
high temperature the w a l l - f i l m r e s i s t a n c e to c o n v e c t i o n heat
t r a n s f e r from the gas to the w a l l i s l i m i t i n g and t h a t a t any
p o i n t the bed temperature approaches the w a l l temperature.
Although equations 2-32 and 2-33 were recommended f o r gas to
w a l l heat t r a n s f e r , these equations have been used f o r gas to
s o l i d s bed. In f a c t , the presen t work shows t h a t h g g i s about

Figure 6-35 Comparison of Experimental Data on Heat Transfer C o e f f i c i e n t s .

one o r d e r o f m a g n i t u d e h i g h e r t h a n h g w as s e e n i n F i g u r e 6-35.
A l t h o u g h h g W shows more s c a t t e r t h a n h g S ' t h e m a g n i t u d e o f h g w
i s t h e same as t h a t f o r a i r f l o w i n g t h r o u g h a n o n - r o t a t i n g t u b e .
F i g u r e 6-36 d e p i c t s t h e h e a t t r a n s f e r d a t a by K r e i t h (55) f o r
a i r f l o w i n g t h r o u g h a 25.4-mm-ID, 1.52-m-long t u b e . The r a t i o
o f L/D o f t h e t u b e he u s e d was 60. I n a t y p i c a l c a s e an a i r
f l o w r a t e o f 34 k g / h r a t t e m p e r a t u r e 400 K t h r o u g h an empty
k i l n o f 0.19 m ID (G = 1200 k g / h r - m 2 ) , t h e s i z e u s e d i n t h i s
s t u d y , r e s u l t s i n a g a s - t o - w a l l h e a t t r a n s f e r c o e f f i c i e n t 2
1.7 W/m K a c c o r d i n g t o F i g u r e 6-36 (Nu = 10, Re = 2900). T h i s c a l c u l a t e d v a l u e o f h i - s t h e same o r d e r o f m a g n i t u d e a s , how-
gw 2
e v e r , l o w e r t h a n t h e e x p e r i m e n t a l h g w , 2~4.7 W/m K, as g i v e n i n
F i g u r e 6-35. The h i g h e r e x p e r i m e n t a l v a l u e s may r e s u l t f r o m
t h e s h o r t l e n g t h o f t h e t e s t s e c t i o n (L/D =2.8) i n t h e k i l n ,
compared w i t h t h e l o n g t u b e (L/D = 60) u s e d by K r e i t h .
To r a t i o n a l i z e t h e e f f e c t o f t h e s h o r t l e n g t h on h e a t t r a n s
f e r t h r e e r u n s were c a r r i e d o u t i n t h e empty k i l n . T a b l e 6-6
shows t h e r e s u l t s f r o m t h e s e t h r e e r u n s , t o g e t h e r w i t h t h e d a t a
from Wes, e t a l f o r a 0.6-m-ID, 9.0-m-long empty drum. The
h e a t t r a n s f e r c o e f f i c i e n t s i n t h i s work were c a l c u l a t e d o v e r
a t e s t s e c t i o n o f 0.53 m l o n g , 0.66 m f r o m t h e gas e n t r y e n d.
Thus, t h e t e s t s e c t i o n was l o c a t e d between t h e d i s t a n c e o f
x/D = 3.47 and x/D =6.25 f r o m t h e end o f t h e k i l n . The a i r
f l o w r a t e s f o r t h e t e s t r u n s o f t h i s s t u d y and Wes e t a l were
i n t h e t r a n s i t i o n r e g i o n w i t h R e y n o l d s number, r a n g i n g f r o m 2160
4140. The t r a n s i t i o n f l o w may c o m p l i c a t e t h e e x p l a n a t i o n o f

3.0xl0 2 5 7 i o 5 2 3 4 5 6 7 8 I 0 4 2 3
Re
Figure 6-36 Gas-to-Wall Heat Transfer Coefficient in an Empty K i l n

Table 6-6 Comparison of Air-Wall Heat Transfer Coefficients in Empty Kilns
W G
This work***
kg/hr kg/hr-m'
Re
( - )
gw
W/m2K
Nu
gw
( - ) 34.0 1193
34.0 1193
50.5 1772
2647
2980
4140
5.40
5,66
6,67
32,2
34 .2
39.8
Nu f
( - )
8.2
10.2
15.0
Nu gw Nu,
3.9
3.4
2.7
Wes et a l * * 95.0
155.0
336. 3
548 . 5
2160 3520
4.9 '
5.1
80.1
83.4
5.5
12.5
14.6
6.7
Taken from Kreith (58) for a i r flowing through a 25.4-mm-IP, 1.52-m-long heated tube (L/D = 60)
For a 0.6-m-ID, 9-m-long empty drum (L/D = 15)
For a test section of 0.53-m-long
0 0
t h e e f f e c t o f t h e e n t r y s e c t i o n . The g a s t o w a l l h e a t t r a n s
f e r c o e f f i c i e n t s were f o u n d a b o u t t h e same f o r Wes, e t a l and
t h i s s t u d y , however Wes e t a l had t h e much h i g h e r N u s s e l t num
b e r b e c a u s e o f l a r g e r v a l u e o f k i l n d i a m e t e r . The v a l u e s o f
NUj i n T a b l e 6-6 a r e c o n s i d e r e d f o r a f u l l y - d e v e l o p e d f l o w and
t a k e n f r o m F i g u r e 6-36. The N u s s e l t numbers i n t h i s s t u d y were
f o u n d a b o u t 2.7 t o 3.9 t i m e s Nu^. The r e a s o n f o r t h i s h i g h e r
number i s m a i n l y due t o t h e e n t r a n c e e f f e c t . F i g u r e 6-37 p l o t s
t h e v a r i a t i o n o f t h e l o c a l N u s s e l t number v e r s u s x/D i n t h e
combined t h e r m a l and h y d r o d y n a m i c e n t r y r e g i o n o f a t u b e w i t h
c o n s t a n t h e a t r a t e p e r u n i t o f l e n g t h . The c u r v e i s f o r l a m i
n a r f l o w (Re = 2100). The t e s t s e c t i o n o f t h e k i l n u s e d i n
t h i s s t u d y f a l l s between x/D = 3.47 and 6.25 shown i n F i g u r e
6-37. T h i s r e g i o n g i v e s an a v e r a g e N u s s e l t number o f 11.3 2
W/m K w h i c h i s 2.6 t i m e s t h e N u s s e l t number, N u f = 4.36, f o r
t h e f u l l y - d e v e l o p e d f l o w i n a t u b e . T h i s number, 2.6, o f
Nu /Nu, i s f o r t h e l a m i n a r f l o w however, i t may w e l l be t h a t «-gw f . -t h e same m u l t i p l e e x i s t s , f o r t h e t r a n s i t i o n f l o w .

X / D
"Figure 6-37 Variation of Local Nusselt Number i n Thermal Entry Region of a Tube with Constant Heat Rate Per Unit of Length (65)

151
6.11 Correlation of Heat Transfer C o e f f i c i e n t s
Cannon (68) studied the heat transfer from f l u i d flow
ing through a rotating pipe. In his analysis the heat trans
fer c o e f f i c i e n t i s a function of the variables l i s t e d i n the
following equation
h = fl ( a,, - L, u g, y g , p g, C p g, D, k g)
Dimensional analysis of t h i s group of variables y i e l d s
Nu = f2 (Re, Re w, L/D, Pr)
2 where Re = D Wp /y , the r o t a t i o n a l Reynolds number.
y y
In a rotary k i l n heat transfer i s more complicated than
that in an empty tube. The heat transfer c o e f f i c i e n t i s expected
to depend on the following group of variables
h = f 3 (D, L, N, Wg, y g f C p g, k g, p g , Ws, d p, k s, C p s , p s , n , a )
Dimensional analysis leads to the following equation,
2 hD _ jr / D p.t* VI L C y W k p • C \ _® - fl*l_B. _2 > __r Pg 9, n , a , _s, _ s , l s , _^s \ ( 6 _ 2 8 )
k V D y D k W k p C g g e g g g g g p g
where D g i s the equivalent diameter

152
4A-- ." . . , , 2 T T - 3 + s i n 3 D _ c r o s s s e c t i o n - H ( j (6-29)
e Wetted Perimeter g . . g
T T - y + s i n | -
Operating v a r i a b l e s are of major i n t e r e s t i n t h i s study.
Since o n l y one f l u i d ( a i r ) and s o l i d s (Ottawa sand and limestone)
of s l i g h t l y d i f f e r e n t k /k. , C /C and p / p were used i n the ^ 2 s g ps pg K s g experiments, the terms, C u /k , k /k , p / p ' and C /C can
pg g g s g s g ps pg
be n e g l e c t e d i n equation 6-28. In a d d i t i o n , the experiments
were c a r r i e d out i n a k i l n o f s i n g l e s i z e , and the r e s u l t s show
th a t Wg and a have no e f f e c t s on heat t r a n s f e r . T h e r e f o r e
equation 6-28 i s s i m p l i e d to equation 6-30.
Nu = a oRe a. 1Re> a 2T 1
a 3 (6-30)
where a Q , a l f a 2 , a 3 • are c o e f f i c i e n t s to be determined. Equa
t i o n 6-30 i s a p p l i c a b l e to both g a s - s o l i d and gas-wall heat
t r a n s f e r .
M u l t i p l e l i n e a r r e g r e s s i o n was used to c o r r e l a t e the
experimental data. The data of N u g S y i e l d the f o l l o w i n g equa
t i o n f o r gas to s o l i d bed,
In Nu = -0.777+0.535.'lnRe+0.104 InRe -0.341 l n n (6-31) gs a) •
t h a t i s
n ACT, 0.535,, 0.104 -0.341 Nu •= 0.46Re Re n (6-32) gs ui

153
"The r e s u l t of r e g r e s s i o n a n a l y s i s f o r Hu i s gi v e n i n
Table 6-7. F i g u r e 6-38 shows the comparison of the experimental
data w i t h c a l c u l a t i o n s based on equation 6-32 f o r g a s - s o l i d s
bed heat t r a n s f e r .
The same procedure was c a r r i e d out f o r the c o r r e l a t i o n
of g a s - t o - w a l l N u s s e l t number. The r e s u l t a n t equation i s
, _ 0.575 _ -0.292 ,, 1.54 Re Re (6-33) w
The r e g r e s s i o n a n a l y s i s f o r equation 6-33 i s given i n Table 6-8.
The degree of f i l l i s i n s i g n i f i c a n t f o r a 95% conf i d e n c e l i m i t .
The comparison of the experimental data w i t h equation 6-33 i s
giv e n i n F i g u r e 6-39. The data f o r N u g W i s r e l a t i v e l y s c a t t e r e d .
T h i s i s not s u r p r i s i n g f o r experiments i n a flow range c o v e r i n g
the t r a n s i t i o n r e g i o n .
6.12 Scaleup
For purposes of design and m o d e l l i n g , i t i s of i n t e r e s t
to examine p r e d i c t e d heat t r a n s f e r c o e f f i c i e n t s f o r l a r g e r
s i z e k i l n s u s i n g equations 6-32 and 6-33. Both equations were
obtained from experimental r e s u l t s i n a k i l n of s i n g l e s i z e ,
0.191m. . i n diameter. The p r e d i c t i o n of the e f f e c t of k i l n
s i z e from these two equations should be c o n s i d e r e d as a pro
j e c t i o n only, and i s s u b j e c t to experimental v e r i f i c a t i o n i n
l a r g e r s i z e k i l n s .
Equation 6-32 f o r Nu may be r e w r i t t e n i n the form, g s
Nu gw

Table 6-7 Result of Regression Analysis for Nu J 1 gs
Equation 6-31
In Nu „ = bn+bi lnRe+b2lnRe tb ^ l n tbi+lna gs u 1 u).
95% confidence i n t e r v a l
1. For In Nu gs
R 2 = 0.9185 Standard error = 0.1063
F - pr o b a b i l i t y = 0.00
2. For independent variables
S i g n i f i c a n t variables
C o e f f i c i e n t s Standard F-ratio F-probability '•' "• .... terror ./
constant -0.777 0.356 4.769 0.033
In Re 0.535 0.039 185.4 0.000
In Re 0.104 0.031 11.25 0.002
In n -0.341 0.057 35.8 0.000
Ins i g n i f i c a n t variable
P a r t i a l c o r r e l a t i o n
In a 0.054
F-ratio F-probability
0.1137 0.7344

155
^ 0 60 70 80 90100 150 200 250 300 400 500
NUSSELT NUMBER. PREDICTED
Figure 6-38 Comparison of Experimental Data with Predicted Values for N
ugs

156
Table 6-8 Result of Regression Analysis for Nu gw
Equation 6-33
In Nu = a n+aiInRe+aolnRe +a^ln n +a uln a gw u i 0) 3 • H
For In Nu gw
R 2 = 0.6390 Standard error = 0.2624
F - p r o b a b i l i t y = 0.00
Si g n i f i c a n t variables
C o e f f i c i e n t Standard F-ratio F-probability error
constant
In Re
In Re
0.432
0.575
-0.292
0.8779
0.0807
0.0731
0.2426
50.79
15.91
0.6303
0.000
0.003
Ins i g n i f i c a n t variables
In n
In a
P a r t i a l c o r r e l a t i o n F-ratio
0.1322 0.7118
0.1465 0.8769
F-probability
0.4085
0. 3575

157
NUSSELT NUMBER. PREDICTED
Figure 6-39 Comparison of Experimental Data with Predicted Values for N
ugw

whence the dependence of h .-on D i s ^ gs e
. ^ -0.257 ... hgs " D e ( f i " 3 4 )
S i m i l a r l y the dependence of h g w on D g i s given as
hgw « D e _ 1 ( 6" 3 5)
Since the equivalent diameter i s d i r e c t l y proportional
to the k i l n diameter,
D G 2TT - 3 + sing — = = constant for fixed n
D T T - J + s i n f
therefore, the predicted dependence of h and h on the k i l n L ^ gs gw diameter are
. n-0.257 n • cc D gs
h - D - 1 gw
For forced convection i n an empty non-rotating tube, the

heat transfer c o e f f i c i e n t s are dependent on the tube diameter as
-0 2 h « D for turbulent flow (6-36)
— 0 67 h oc D " for laminar flow (6-37)
Figure 6-40 plots h g s- and h g w versus D based on equations
6-32 and 6-33 at constant mass flux and temperature. The gas
mass flux i s t y p i c a l of i n d u s t r i a l k i l n s , where with larger
diameters, the gas flow i s i n the f u l l y turbulent region. In
cluded i n the plo t are the equations recommended i n Perry's
handbooks (14, 15)
h = 0.0981 G g ° ' 6 7 (2-33)
and n A f. h = 0.0608 G / D (2-32) y
The above two equations were given to predict the heat
transfer c o e f f i c i e n t from gas to refractory wall i n i n d u s t r i a l
k i l n s , and have subsequently been used for gas to s o l i d bed by
many investigators. As seen i n Figure 6-40 equation 2-33 i s
about one order higher than equation 2-32 for i n d u s t r i a l scale
k i l n s . The predicted gas to so l i d s c o e f f i c i e n t s by equation
2-32 and by equation 2-33 are close to each other at large diameter,
The predicted gas to wall c o e f f i c i e n t by equation 6-33 are
about one half those predicated by equation 6-32.

160
0.2 0.5 1.0 2.0 5.0
KILN DIAMETER, m
Figure 6-40 Predicted Heat Transfer C o e f f i c i e n t s for Scaleup

CHAPTER 7
A MODEL FOR GAS TO BED HEAT TRANSFFR
The experimental results show that the convective heat
transfer c o e f f i c i e n t from the gas to so l i d s i s about one order
of magnitude higher than that from gas to wall. The higher
c o e f f i c i e n t s are attributed to two factors: the motion of
p a r t i c l e s on the bed surface and the use of a plane surface area
rather than the true surface used i n the c a l c u l a t i o n of the heat
transfer c o e f f i c i e n t .
7.1 True Surface Area
Figure 7-1 shows the heat transfer path from the gas to
the s o l i d bed. The heat transfer rate i s defined as
Q = h A (T -T ) (7-1) vgs. gs s g s'
where A i s the plane area of bed surface and. T i s the bed s s temperature. In t h i s equation T g and T g are measurable and
A g i s only function of k i l n radius and the degree of s o l i d f i l l ,
Therefore, hg g i s calculated i f Q g s can be measured. However,
t h i s equation expresses only an i n d i r e c t representation of the
actual heat transfer mechanism. A d i r e c t expression for gas-
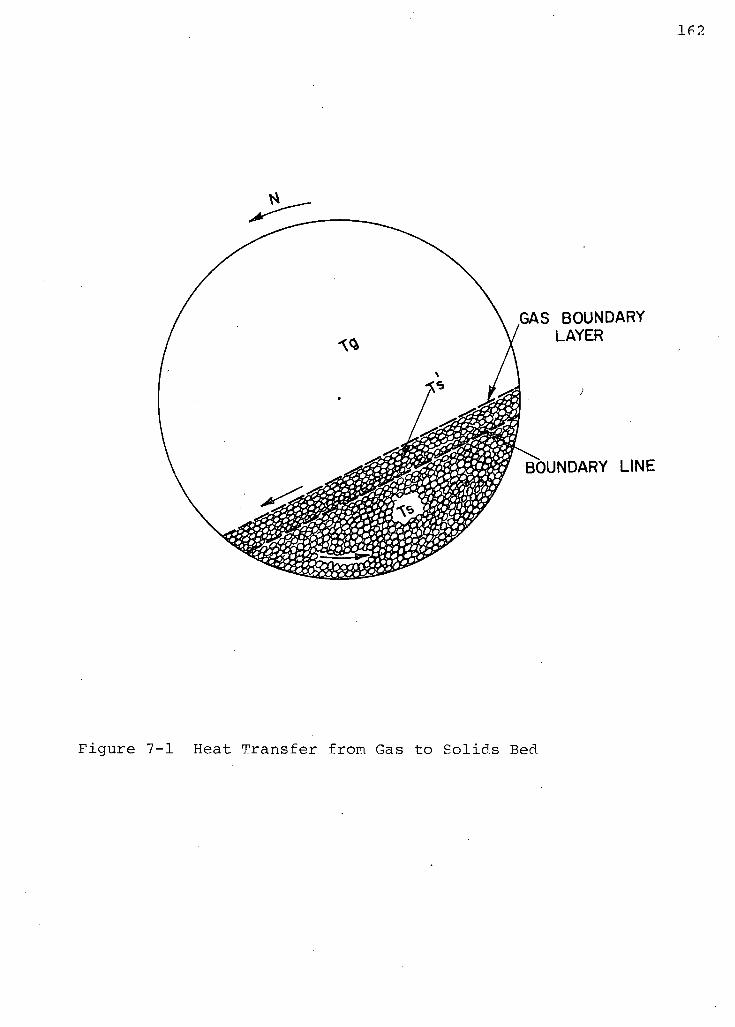
.162
Figure 7-1 Heat Transfer from Gas to Solids Bed

s o l i d heat t r a n s f e r r a t e should be
• i i Q = h A (T -T ) (7-1A) gs gs s v g s' v ;
where A g i s the t r u e exposed s u r f a c e area of the bed, which i s i
f u n c t i o n o f p a r t i c l e s i z e , shape and a r r a y , and T g i s the bed
su r f a c e temperature. Since T g i s about the same as T g i n the
present experiments as w i l l be seen l a t e r , the r e l a t i o n s h i p of •
h „ and h „ becomes gs gs •
i A h = h — (7-2) gs gs
s
i The r a t i o of A /A i n equation 7-2 i s o b v i o u s l y important s s
•
i n determining heat t r a n s f e r c o e f f i c i e n t . The va l u e s o f A /A s s
depend on the types o f p a r t i c l e a r r a y s , and i s about 1.78 f o r a c u b i c a r r a y as i n F i g u r e 7-2A to 2.42 f o r a s t r u c t u r e as shown i n F i g u r e 7-2B. The f i l m study ( S e c t i o n 5.2) shows t h a t F i g u r e 7-2B can bes t d e s c r i b e the a r r a y of l a r g e r alumina part i c l e s o f d =6.35 mm. However a c u b i c a r r a y mav be used to
p
approximate the c o n d i t i o n f o r Ottawa sand of 0.7 3 mm.
The second f a c t o r which c o n t r i b u t e s t o the higher gas-
s o l i d heat t r a n s f e r c o e f f i c i e n t i s the motion of s u r f a c e p a r t i
c l e s . As d e s c r i b e d i n Chapter 6, the p a r t i c l e s r o l l down on
the s u r f a c e a t a speed much higher than the k i l n c i r c u m f e r e n t i a l
v e l o c i t y . The moving p a r t i c l e s not o n l y a g i t a t e the gas boundary
l a y e r adjacent to the bed s u r f a c e , but a l s o c o n t i n u o u s l y remove

If
(a)
Side View
Figure 7-2 Array of Surface P a r t i c l e s

the heat received by the p a r t i c l e s themselves. These phenomena
are expected to increase the heat transfer c o e f f i c i e n t from the
gas to the bed over that of a f l a t plate for example.
7.2 Individual P a r t i c l e Feat Transfer
F i r s t consider an in d i v i d u a l p a r t i c l e i n the f i r s t layer,
just coming out of the bed with a temperature, T . It receives
heat from the gas while i t i s r o l l i n g on the surface. Part of
the received heat may be transferred by conduction to the par
t i c l e s of the adjacent layers. In a low temperature process
the conduction heat may compose only a small f r a c t i o n of the
t o t a l heat received by the p a r t i c l e .
The equation governing the heat balance of a single
p a r t i c l e r o l l i n g down the surface i s given,
dT ' V P C • — = h S. (T -T) - h,S, (T-T ) (7-3) p p p p d t p i g d i v s ;
where V , p , C are volume, densitv and s p e c i f i c heat of P yP P p
p a r t i c l e , respectively. •
S- and S^ are exposed and covered surface area of par
t i c l e i n the f i r s t layer,
The l a s t term of Equation (7-3) accounts for heat trans
fer to p a r t i c l e s below. Since the experiments i n t h i s study
were carried out at low temperature, the conduction term i s

neglected r e l a t i v e to the gas to p a r t i c l e convection.
It i s of inter e s t to know whether the temperature within the p a r t i c l e becomes uniform afte r the p a r t i c l e surface temperature suddenly changes. The thermal d i f f u s i v i t y of Ottawa sand
— 6 2 i s 0.277 x 10 m /s and the p a r t i c l e diameter i s 0.73 mm. The time (surface time, t_ ) for the p a r t i c l e exposed to the gas
s l stream i s about one second. Thus, the value of Fourier modulus
2 a t
s l / r p i s 2.08. This value shows the p a r t i c l e center tempera
ture i s immediately raised to the surface temperature according
to Carslaw and Jaeger (70). ^Let T'! : be the p a r t i c l e temperature before i t returns
"Sl . c
i
to the bed, and t i s the surface time of the p a r t i c l e s in s i
the f i r s t layer. Integration of equation 7-3 with the following
conditions,
t = 0 T = T s
t T = T s i s i (7-4)
gxves
= 1 " exp - t (7-5) T - T V V p C 1 ' g s P ^ P P P
-3 Ottawa sand used for the experiments has a diameter of o.73x10 m which gives V = 0.204xl0~ 9 m3 and ST = 0.837xl0~ 6 m2. The
P 1 3
values of C , and p for the sand are 0.603 J/gK and 2527 kg/m , P P

respectively. The gas to p a r t i c l e heat transfer c o e f f i c i e n t
hp, and the surface time, t g i are reasonably assumed at 15 W/m
(Section 7.4) and 1 second respectively. The substitution of
the above values y i e l d s
h S, P 1
p p Pp t. s i
s 0.04
Thus, equation 7-5 can be approximated as
T - T h S,t si s = p 1 si (7-6) T - T V p C-o g s P P
and equation 7-6 i s rewritten as
V p C n (T - T ) = h S,t (T - T ) (7-7) p pp Pp' si s' p 1 si g s ; v ;
The left-hand side of t h i s equation represents the heat
accumulated by a p a r t i c l e while i t stays on the aerated bed
surface, and the right-hand side represents the heat received
by the p a r t i c l e by convection from the gas. For a temperature
driving force, T g ~ Ts = 50 K, the p a r t i c l e temperature i s
raised only 2 K. Considering the low thermal conductivity of
Ottawa sand and the temperature difference of 2 K heat transfer
to the p a r t i c l e s underneath by conduction w i l l be i n s i g n i f i c a n t
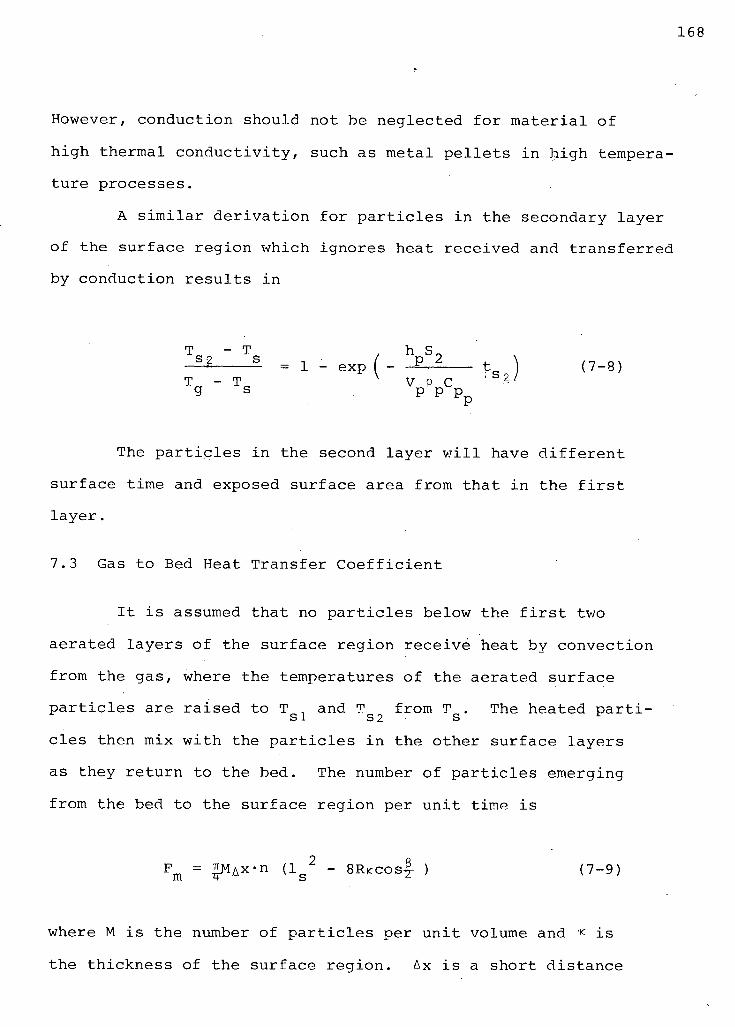
1 6 8
However, c o n d u c t i o n s h o u l d n o t be n e g l e c t e d f o r m a t e r i a l o f
h i g h t h e r m a l c o n d u c t i v i t y , s u c h a s m e t a l p e l l e t s i n h i g h t e m p e r a
t u r e p r o c e s s e s .
A s i m i l a r d e r i v a t i o n f o r p a r t i c l e s i n t h e s e c o n d a r y l a y e r
o f t h e s u r f a c e r e g i o n w h i c h i g n o r e s h e a t r e c e i v e d and t r a n s f e r r e d
by c o n d u c t i o n r e s u l t s i n
T - T h S_ §• = 1 - exp ( - -2-1 t ( 7 - 8 )
T - T V P C ? /
g s P P p
tr
The p a r t i c l e s i n t h e s e c o n d l a y e r w i l l have d i f f e r e n t
s u r f a c e t i m e and e x p o s e d s u r f a c e a r e a f r o m t h a t i n t h e f i r s t
l a y e r .
7 . 3 Gas t o Bed Heat T r a n s f e r C o e f f i c i e n t
I t i s assumed t h a t no p a r t i c l e s b elow t h e f i r s t two
a e r a t e d l a y e r s o f t h e s u r f a c e r e g i o n r e c e i v e h e a t by c o n v e c t i o n
f r o m t h e g a s , where t h e t e m p e r a t u r e s o f t h e a e r a t e d s u r f a c e
p a r t i c l e s a r e r a i s e d t o T , and T f r o m T . The h e a t e d p a r t i -^ S 1 S2 S ^
c l e s t h e n mix w i t h t h e p a r t i c l e s i n t h e o t h e r s u r f a c e l a y e r s
as t h e y r e t u r n t o t h e b e d . The number o f p a r t i c l e s e m e r g i n g
f r o m t h e bed t o t h e s u r f a c e r e g i o n p e r u n i t t i m e i s
Fm = ^ A X - n ( l s2 - 8 R K C O S | ) ( 7 - 9 )
where M i s t h e number o f p a r t i c l e s p e r u n i t volume and •< i s
t h e t h i c k n e s s o f t h e s u r f a c e r e g i o n . Ax i s a s h o r t d i s t a n c e

of k i l n length.
The detailed derivation of equation 7-9 i s given in the
appendix. If the r o l l i n g rates of p a r t i c l e s i n the f i r s t and
second layers respectively are expressed as,
and
F = m 1A 3cV 1 1
F~= m.AxVn 2 2 12
(7-10)
then a thermal balance of the mixing process can be expressed
as
F (T - T ) = F,(T - T ) + F„(T - T ) (7-11) m sm s 1 s i s 2 s 2 s
where T i s the temperature of the mixture before i t returns sm c
to the bed. After rearrangement, equation 7-11 becomes,
F F 1 2 T - T •= — ( T -T ) + — (T -T ) sm s „ v s i s ; _ V S 2 S ;
F F m m
The following equation i s obtained after substituting equations
7-4 and 7-8 i n the above equation,
T -T sm s
T -T g s m
1-exp , h S1
V p c p p pr
.0 h S_
fi P 2 + | l-exp.(f rm k W p C
P P PT
(7-12)

Therefore, the heat absorbed by the r o l l i n g p a r t i c l e s
i s represented by
Q „ = F p C V (T - T ) gs nrp Pp P sm s (7-13)
Combining equations 7-1, 7-9, 7-12 and 7-13, and l e t t i n g A£
Ax'l , one w i l l obtain
h = P P P p m-V. gs 1 [ 1 l i s
1-exp ^ h S. _ P 1 V p Cp p p p p
'si
+ m 2 V l 2 1-exp ^ h S.
_ P 2
V p C D p p Pp S2
(7-14)
In order to evaluate h , V. (or t„) and h must be gs I s p
determined. Unfortunately there i s no information i n the
l i t e r a t u r e on the r e l a t i o n s h i p of to other operating para
meters. For an i d e a l system the following equation i s derived
(see Appendix)
K V l l = ^~ n ( 1s " 8 R K C O £ 4 ) (7-15)
where < i s the thickness of surface region. The v e l o c i t y , ,
of p a r t i c l e s i n the second layer can be approximated by
d V l 2 = ( 1 - -£ ) V 1 1 (7-16)
K

according to Figure 5-2. In equation 7-15, K and V are related
to r o t a t i o n a l speed N and the degree of f i l l . Furthermore, the
experimental results in Figure 5-5 show
V]_1 - JN (7-17)
However, there i s s t i l l a need to know K , which i s also unavail
able in the l i t e r a t u r e . Based on the f i l m study V^1= 0.24 m/s
was observed for alumina sphere at 4.78 rpm. It seems reason
able to assume V,, n o r i , . _ - _ , , . .11 = 0.20 m/s at 3 rpm for Ottawa sand and t h i s
value w i l l be used to calculate K and h gs
7.4 Gas to P a r t i c l e Heat Transfer C o e f f i c i e n t
No information on the heat transfer c o e f f i c i e n t from gas
to r o l l i n g p a r t i c l e s , h p, for a system similar to rotary k i l n
was reported i n the l i t e r a t u r e . Since the bed i n rotary k i l n
i s close to the fixed bed system, heat transfer data for the
fixed bed w i l l be used as a guide, although the gas flow pat
tern i s d i f f e r e n t as described below.
Kunii and Levenspiel (71) reported a c o r r e l a t i o n of
heat transfer data for fixed bed i n terms of Nu versus Re , P P
which i s reproduced i n Figure 7-3. Nu^ and Re p are defined as,
u p d o. g p
Re = P

Figure 7-3 Reported Results for Gas-to-Particle Heat Transfer i n Fixed Bed. (Kunii & Levenspiel, 71).

and Nu = - i £- (7-18) p k
g
respectively. U q i s the r e l a t i v e v e l o c i t y between the p a r t i c l e
and the f l u i d . To use t h i s approach for the surface of the bed
in the k i l n where the aerated p a r t i c l e s are r o l l i n g perpendi
cular to the gas flow, U q i n equation 7-18 i s defined as
2 . 2 Uo V U g + V l i ( 7 " 1 9 )
where u g i s the gas s u p e r f i c i a l v e l o c i t y through the empty space of the k i l n .
G TTR2(1 - n )
The value of u i s expected to be higher than that of the true y gas v e l o c i t y near the bed surface.
The gas i s flowing over the bed i n the rotary k i l n
whereas in the fixed bed the gas i s flowing through the bed.
So, the effectiveness of gas-particle heat transfer i n a rotary
k i l n i s expected to be lower than that i n a fixed bed. ^he
value of t h i s effectiveness i s not known. In a fixed bed each
p a r t i c l e has adjacent p a r t i c l e s surrounding i t , however, in
rotary k i l n about the half surface area of the aerated p a r t i c l e s
i s exposed to the gas stream. It i s , therefore, l i k e l y that

hp for the aerated p a r t i c l e i n a rotary k i l n i s roughly a
fr a c t i o n of h , i n a fixed bed. pf Chen et a l (50) reported the gas to p a r t i c l e heat trans
fer in a rotary dryer. In the i r experiments hot a i r , instead
of flowing through the dryer, was passed through the bed from
the wall which was made of plate with holes and pitch covered
with a screen. The data of the heat transfer c o e f f i c i e n t s bet
ween gas and p a r t i c l e s were found to be i n the range of .fixed
bed. The data are also shown i n Figure 7-3.
7.5 Comparison with Experimental Data
The comparison of the experimental data with equation
7-14 i s given i n Figure 7-4 where h^ s i s plotted versus W .
A l l the experimental data are included. The input data for
ca l c u l a t i o n for equation 7-14 are given i n able 7-1 and the
calculated r e s u l t s are given i n Table 7-2. Three curves with
h are taken as h, h and 1 times that for a fixed bed. The P curve with % h c f i t s the data better than the other two. The Pf value of h taken as one half of h c seems reasonable since P Pf only half of surface area of the aerated p a r t i c l e i s exposed
to the gas stream. If the value of h^ for the aerated p a r t i c l
i s taken from Nu g = 2 which corresponds to an is o l a t e d sphere
at low Reynolds number thi s results i n a much higher value of
heat transfer c o e f f i c i e n t than h c, and the prediction of h pf r gs
would be considerably higher. In equation 7-14 the exponential terms are found to be

— I 1 — I I I I I 20 30 4 0 50 60 80
W g , k g / h r
Comparison of Theoretical Curve with Experimental Data.

Table 7-1
Input data for Equation 7-14
For P a r t i c l e (Ottawa sand)
d — 0.73 x 10 3 m P PP '
- 2527.3 kg/m3
CPP = 0.603 J/gK
CPP -9 3 V — 0.204 x 10 m P -6 2
S l 0.837 x 10 m
S2 - 0.042 x 10"~6 2
m l = m2 - 2.17 x 10 6 no. of pa r t i c l e s / i
For a i r (at 422 K)
Operating conditions
N
n
v l i =
2.369 x 1 0 _ J kg/m-s
0.833 kg/m3
0.031 W/m-K
3 rpm
.11%
0.20 m/s

Table 7-2
Calculations for Gas-Particle Heat Transfer
Wg kg/hr 18.6 34 50 7 0
V g m/s 0.245 0.447 0.657 0.92
V 1+ m/s 0.20 0.20 0.20 0.20
V Q m/s 0.316 0.490 0.687 0.942
Re 8.1 12.6 17.6 24.2
N U p = N U p 0 , 4 4 ° ' 6 2 ° - 9 0 1-4 h p W/m2K 9.3 13.1 19.1 29.3 hgs W / m 2 R 1 7 • 7 24.8 35.8 55,2
Nu - JsNu * 0.22 0.31 0.45 0.70
h p W/m2K 4.65 6.55 9.55 14,65
h W/m2K 8.85 12.4 17.9 27.6 y &
Nu p = i;Nup* 0.11 0.16 0.23 0.35 2
h p W/m K 2.33 3.28 4.28 7.33 hgs w / m 2 R 4 - 4 3 6.2 8.95 13.8
3 K x 10- m 0.369 0.369 0.369 0.369
+ assumed
* taken from Figure 7-3

quite small. Thus,
V
1
11 = 0.042
1 = 0.005
p p Pp V 12
for '= 0.20 m/s at N= 3 rpm. The r a t i o of these two terms
indicates that the top layer probably receives about 8 times
as much as heat from the gas than does the second layer, and
the second layer could probably be ignored i n the above analy
s i s .
equation 7-14 i s shown i n Figure 7-5. The calculated r e s u l t s
are given i n Table 7-3. The slope of h versus N i s 0.1 gs
which coincides roughly with the experimental data.
The mathematical model for gas-solid heat transfer has
been established from a single p a r t i c l e . In the model two fac
tors which s i g n i f i c a n t l y a f f e c t the gas to s o l i d bed heat trans
fer are the p a r t i c l e array on the top bed layer and the gas
to r o l l i n g p a r t i c l e heat transfer c o e f f i c i e n t . The cubic
packing array was assumed for Ottawa sand bed. The gas-to-
r o l l i n g p a r t i c l e heat transfer c o e f f i c i e n t , taken as one-half
value of that for fixed bed, yi e l d s a reasonable prediction for
the rotary k i l n . To make the model more adaptable further
The e f f e c t of r o t a t i o n a l speed on h gs calculated from

179
CVI E
10 9
8
7
6
50
40
30 t o
? 2.5
2.0h
1.5
.0
T
A Calculated from Equation 7—14
Tf = 11%
Wg = 34 kg/hr hp =1/2 h p f
1 1 1 2 3 4 5 6
ROTATIONAL SPEED, rpm
Figure 7-5 E f f e c t of Rotational Speed on Theoretical Gas-Solids 'Bed Heat Transfer C o e f f i c i e n t

Table 7-3
Calculation of h gs
from Equation 7-14
N (rpm) 1.0 3.0 6 . 0
V m/s g
0.447 0.447 0.447
V1 m/s 0.116 0.20+ 0.283
V m/s o ' 0.462 0 . 490 0.529
Re P
11.8 12.6 13.6
Nu * P
0.60 0.62 0.66
Nu = h Nu * P P 0.30 0.31 0. 33
h W/m2K P 12.7 13.1 14 . 0
K x 10" , m 0.221 0.369 0.5 04
h W/m2K gs 23.8 2 4.8 26.5
+ assumed
* taken from Figure 7-3
n = 11%
W =34.0 kg/hr

181
, work on the thickness of the mixing zone and the p a r t i c l e l a t e r a l
v e l o c i t y i s required. Both K and are used to determine the
temperature of the mixing p a r t i c l e s i n the surface region.

182
CHAPTER 8
MODELLING OF ROTARY KILN HEAT EXCHANGER
As noted i n the f i r s t two chapters a number of studies
on rotary k i l n modelling have been published (5-14), however,
there was a lack of experimental data on heat transfer to i n
corporate into the models. Although Watkinson and Brimacombe
(4) reported some res u l t s on heat transfer i n a d i r e c t - f i x e d
k i l n , 0.406 m inside diameter, their data are s t i l l not i n a
form r e a d i l y adapted for scaleup to i n d u s t r i a l size k i l n s .
Kern (15) established a model for heat transfer i n a
rotary heat exchanger. In his model , the rotating wall temp
erature i s formulated i n terms of gas and s o l i d temperatures
by taking into account the periodic cooling and heating of the
wall. By eliminating the wall temperature, he obtained
dT "g _ dx
a i T s + a 2 T g + a 3
dT,
dx = b i T s + b 2 T g + b 3

183
where a and b are functions of the mass flow rates, r o t a t i o n a l n n speed and the heat transfer c o e f f i c i e n t s . The heat transfer co-
21 _ 2 e f f i c i e n t s were assumed, h Q = 5 W/m'K , h g g _ 1.5 W/m K (for
s o l i d bed to gas), and h /h =3. The assumed values of heat ^ ' sw' wg transfer c o e f f i c i e n t s do not seem to be r e l i a b l e i n terms of
the measured values reported in the present study.
A model of a rotary k i l n heat exchanger i n the low temp
erature range where radiation effects can be neglected i s pre
sented here. The heat transfer c o e f f i c i e n t s ' e s t a b l i s h e d i n
Chapter 6 can be used i n the model. Thus, the equations used
e a r l i e r to calculate heat transfer c o e f f i c i e n t s from temperature
p r o f i l e s are just inverted to calculate temperature p r o f i l e s
from heat transfer c o e f f i c i e n t s . The equations governing the
heat balances on gas and s o l i d phases over a small d i f f e r e n t i a l
distance are given as
dT W C — a = h 1 (T -T ) + h 1 (T -T ) (8-1) g pg d x gs s v g s' gw wv g w;
dT - , W C = h 1 (T -T ) - h 1 (T -T ) (8-2) s ps d x gs s v g s ; sw w s wy
The heat capacities, C and C , are assumed constant over the pg P s
temperature range of i n t e r e s t . The wall temperature, T , i s
assumed circumferentially constant at a p a r t i c u l a r location.
This simplifying assumption i s j u s t i f i e d by the experimental
res u l t s given i n Chapter 6, and by those of reference (4).

The inside refractory temperature ( i f there i s a l i n i n g
material in the k i l n ) , T , i n eguations 8-1 and 8-2 must be w
known in order to obtain the gas and s o l i d temperature p r o f i l e s
Therefore a heat balance over the wall i s set up to obtain Tt "v/
Gas to Wall Solids to Wall Feat loss through +
convection convection Wall by Conduction 2irk (T -T )
h i (T -T ) + h 1 (T -T ) = W W (8-3) gw w g w' sw w s w ( R ^ )
where T w Q i s the outside l i n i n g temperature. It i s further
assumed that there i s no temperature drop across the metal
k i l n s h e l l . Therefore, the heat loss through the k i l n s h e l l
to the surroundings i s given by
2fTk (T -T ) w w wo In (R2/R±)
= h 1 (T - T ) o o wo o (8-4)
Substitution of equations 8-3 and 8-4 into equations
8-1 and 8-2 yi e l d s two f i r s t order li n e a r equations for gas
and so l i d s temperatures which can be rewritten as;
dT - 2 . = D l T g - D 2T s - D 3T o (8-5)
and = E,T - E„T + E„T (8-6)

1 8 5
where z = x/L, and the c o e f f i c i e n t s D and E are f u n c t i o n s of n n
mass flow r a t e and heat t r a n s f e r c o e f f i c i e n t s as given i n Table
8-1. Kern (15) o b t a i n e d somewhat s i m i l a r equations f o r the gas
and s o l i d s temperature.
Equations 8-5 and 8-6 can be s o l v e d i f a s e t of boundary
c o n d i t i o n s are gi v e n . In t h i s study both the i n l e t gas and s o l i d
temperatures are f i x e d as
z = 0 T s = T s o
z = 1 T = T _ ( 8 " 7 )
g gL
The heat t r a n s f e r c o e f f i c i e n t s used i n Table 8-1 are
c a l c u l a t e d from the f o l l o w i n g equations,
i , n AC R g r, ° - 5 4 T> ° - 1 0 - 0 . 3 4 ,, h = 0 . 4 6 —a- Re Re ri ( 6 - 3 1 ) gs D w 1
e
i CA g „ n - 5 8 „ - 0 . 2 9 h„ i T = 1.54 Re Re gw w e
( 6 - 3 2 )
k nR 2B °' 3
and h s w = 11. e - 3 - , ( ) ( 6 - 2 6 ) w a
I t i s f u r t h e r assumed t h a t the bed h e i g h t along the k i l n
i s uniform. For a non-uniform bed system, Kramers and Croockewit
(29) developed a formula f o r bed he i g h t along the k i l n as f u n c t
i o n of o p e r a t i n g parameters. Since the g a s - s o l i d heat t r a n s f e r
c o e f f i c i e n t s depend on the degree of f i l l , the assumption of

186
where
Table 8-1
The C o e f f i c i e n t for Equations 8-5 and 8-6
D l - = B l + B2 ~ B 2 A 5 D 2 = B ] l + A 2A 5B 2
D 3 = A 4A 5B 2
E x = B 3 + B 4A 5
E2 = B3 + B4 " A 2 A 5 B 4 E3 = B 4 A 4 A
5 '
h o l Q l n ( R 2 / R l ) A l A 3
A3 h 1 ln(R„/R, ) gw w T 1'
1 A4
2 k 1 + A-w 1
h i ' 1
' 1 V ' A2 + *4
2 k w
v, i T h 1 L h a s 1 s L 9S s B = - S 2 - § _ B 3 = w c w c g pg s ps
h 1 L , . gw. v/ h 1' L
B2 = 2 — B4 SW w
W C WsCps g pg *>^\?o

187
u n i f o r m bed d e p t h makes t h e p r o b l e m s i m p l e r . Once t h e o p e r a t i n g
p a r a m e t e r s (N, a, n , D) a r e f i x e d , t h e s o l i d t h r o u g h p u t f o r a
u n i f o r m bed s y s t e m c a n be c a l c u l a t e d f r o m t h e f o l l o w i n g e q u a t i o n :
W =.77. 7i, ND 2p ; tana/sanO (2-12) s •L s -
where TT = 5- ( 1 - cos-t- )
and n = 1 ( 3 - s i n g ) (2-13) 2 IT
The gas and s o l i d t e m p e r a t u r e p r o f i l e s c a n be o b t a i n e d
by s o l v i n g e q u a t i o n s 8-5 and 8-6 w i t h e q u a t i o n 8-7. E q u a t i o n
8-7 g i v e s t h e b o u n d a r y c o n d i t i o n s a t o p p o s i t e ends o f t h e k i l n ,
w h i c h makes an a n a l y t i c a l s o l u t i o n d i f f i c u l t . T h e r e f o r e , Runge
K u t t a method w i t h t r i a l and e r r o r was u s e d . F i r s t , T was ' go
assumed a t z = 0 and e q u a t i o n s 8-5 and 8-6 were s o l v e d w i t h
b o u n d a r y c o n d i t i o n s T = T . T^ = T„„ a t z = 0. Gas t e m p e r a -s so g go L
t u r e a t z = 1 was t h e n c a l c u l a t e d and compared w i t h T g L as
g i v e n i n e q u a t i o n 8-7. I f t h e c a l c u l a t e d gas t e m p e r a t u r e was
n o t e q u a l t o Tg L ' a n o t h e r v a l u e f o r T g o was assumed and t h e ,
p r o c e d u r e r e p e a t e d u n t i l t h e c a l c u l a t e d gas t e m p e r a t u r e e q u a l
t o T g L - A f l o w c h a r t f o r computer p r o g r a m i s g i v e n i n F i g u r e
8-1. I f b o t h t h e b o u n d a r y c o n d i t i o n s a r e s e t a t t h e same
end o f t h e k i l n , e q u a t i o n s 8-5 and 8-6 c a n be s o l v e d a n a l y t i c
a l l y .
A k i l n , 3 m I.D. by 80 m l o n g w i t h 0.15 m t h i c k r e f r a c t -

Figure 8-1 Flow Chart of Computer Program
for Temperature P r o l i l e s
( START )
T assumed go
Calculate W s
Equation 2-12 Calculate D , 1
e w 1', l e . Re, Re w s w
h assumed o
Calculate h's equations 6-31,32,33
Calculate D & E n n in Table 8-1
[Solve equations 8-5 8-6 by KK method
obtain T' 9l±
Yes PRINT T , T
g s, vs x
T = T + T go go - go
( STOP ~~)

o r y l i n i n g i s s e l e c t e d t o i l l u s t r a t e t h e m o d e l . The r o t a t i o n a l
s p e e d , i n c l i n a t i o n a n g l e and t h e d e g r e e o f f i l l a r e c h o s e n so
t h a t t h e s o l i d s t h r o u g h p u t i s a b o u t t h e same o r d e r as an i n d u s
t r i a l l i m e k i l n . The n e c e s s a r y p a r a m e t e r s f o r m o d e l l i n g a r e
c o l l e c t e d i n T a b l e 8-2. The i n l e t gas t e m p e r a t u r e i s k e p t a t
500° K, w h i l e t h e i n l e t s o l i d t e m p e r a t u r e a t t h e o t h e r end o f
t h e k i l n i s f i x e d a t 350 K.
E q u a t i o n s 8-5 and 8-6 f o r t e m p e r a t u r e p r o f i l e a r e s o l v e d
w i t h t h e a i d o f T a b l e 8-1 f o r t h e c o e f f i c i e n t s . H e a t t r a n s f e r
c o e f f i c i e n t s a r e c a l c u l a t e d f r o m e q u a t i o n s 6-26, 31 and 32,
w h i l e s o l i d t h r o u g h p u t i s c a l c u l a t e d f r o m e q u a t i o n 2-12. The
r e s u l t s f o r gas and s o l i d t e m p e r a t u r e p r o f i l e s a r e d e p i c t e d i n
s o l i d l i n e s i n F i g u r e 8-2. The t e m p e r a t u r e s a r e e x p r e s s e d i n
d i m e n s i o n l e s s f o r m , (T-T ) / ( T .-T ) . ou y i bu
I n c l u d e d i n F i g u r e 8-2 a r e t h e t e m p e r a t u r e p r o f i l e s
w i t h h e a t t r a n s f e r c o e f f i c i e n t s c a l c u l a t e d f r o m t h e e q u a t i o n s
recommended i n P e r r y ' s C h e m i c a l E n g i n e e r i n g Handbook (46, 47).
h = 0.0981 ( -3- ) (.2-32) A
c -
and h = 0.061 I -3- j / (2-33) 1 A / c
As e x p e c t e d t h e l o c a l s o l i d s t e m p e r a t u r e i n c r e a s e s
c o n s i d e r a b l y as t h e h e a t t r a n s f e r c o e f f i c i e n t s i n c r e a s e . The
gas t e m p e r a t u r e d r o p s a c c o r d i n g l y .

Table 8-2 Modelling Parameters
Solid phase : Ottawa sand
Gas phase : A i r
D = 3 m L = 80 m
T _ = 500 K T 350 K gL so h = 10 W/m2K k = 0.043 W/m2K o ' w '
N = 1 rpm a =. 0.7°
n =" 11% W S A — = 2130 kg/hr-m (kil n cross section)

191
hgs =11.1 (W/m2 K) hgw = 1.84 (W/m 2 K) from Equations 6 - 3 1 and 6 - 3 2
hgs = hgw = 16.6 (W/m2 K) from Equation 2 - 3 2
X / L
Figure 8-2 E f f e c t of Heat Transfer C o e f f i c i e n t on Temperature P r o f i l e s

Figure 8-3 gives the e f f e c t of gas flow rate on the i :
temperature p r o f i l e . The res u l t s are also as expected. In
creasing gas flow rate increases both gas-solid and gas-wall
heat transfer c o e f f i c i e n t . As a r e s u l t , the s o l i d temperature
increases repidly, however, the gas temperature drops are small
due to the high gas flow rate.
The wall temperature for the operating conditions given
in Table 8-2 i s i l l u s t r a t e d i n Figure 8-4. Wall temperatures
are consistently higher than the s o l i d temperatures along the
k i l n due to the presence of the thick refractory l i n i n g , and
low heat los s . For comparison, a rotary k i l n of the same
dimension having no refractory l i n i n g i s assumed. The k i l n wal
i s 0.051 m i n thickness, made of mild steel having thermal
conductivity 45.2 W/m-K. In t h i s case, the wall temperature
drops below the s o l i d temperature, and the gas temperature
also drops due to high heat loss through the wall. This type
of behaviour was found i n the present experimental study.
The e f f e c t of k i l n length on the temperature p r o f i l e i s given
i n Figure 8-5 . For a lime k i l n equipped with a preheater,
the k i l n length of the 3 m I.D. k i l n i s t y p i c a l l y about 50 m.
For a short k i l n , the e x i t gas temperature i s expectedly,
higher than that for a long k i l n i f the entering gas tempera
tures are maintained the same for, both cases.
The e f f e c t of k i l n diameter i s of most i n t e r e s t to the
designer of the k i l n . The switch of k i l n diameter involves a
change of heat transfer c o e f f i c i e n t s and s o l i d throughput. It
may also a l t e r the flow pattern i f the ro t a t i o n a l speeds are

193
X / L
Figure 8-3 E f f e c t of Gas Flow Rate on Modelling of Rotary K i l n .

X / L
Figure 8-4 E f f e c t of Refractory Insulation on Modelling of Rotary K i l n .
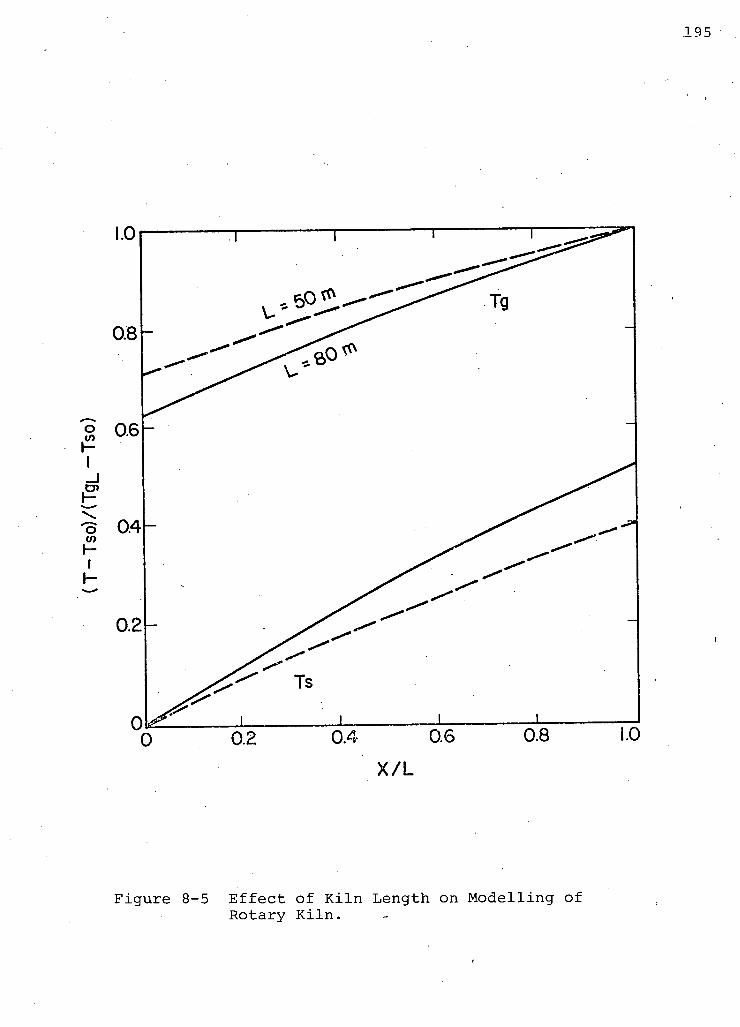
X / L
Figure 8-5 E f f e c t of K i l n Length on Modelling of Rotary K i l n .
maintained the same. In order to compare the e f f e c t of k i l n
diameter the s o l i d flow pattern i n k i l n s of d i f f e r e n t diameters
should be kept the same, which can be accomplished by maintain
ing the same Froude number,
N N1 . , - = — = constant or N N 1
c c
D1 ^ ^ : constant
D
Therefore, the r o t a t i o n a l speed must be adjusted accordingly
i f the change of the k i l n size i s necessary. The second fac
tor that should be taken into account i s the s o l i d throughput
per k i l n cross area. This factor w i l l govern the residence
time in k i l n s of the same length. In t h i s calculaton, the s o l i d
throughputs per k i l n cross section are maintained constant at
varying k i l n diameters. According to equation 2-12, the i n c l i n
ation angle must be adjusted to keep the same degree of s o l i d
f i l l . Fortunately, the e f f e c t of i n c l i n a t i o n angle on heat
transfer i s n i l .
Figure 8-6 shows the e f f e c t of three d i f f e r e n t k i l n
diameters, 3 m, 2 m and 1 m for a 50 m long k i l n . Both the r a t i o
of N/N and s o l i d residence time are kept constant. As seen
in the figure, small diameter k i l n s show high heat transfer
e f f i c i e n c y . This i s due to higher heat transfer c o e f f i c i e n t s
for small k i l n s . Figure 8-7 gives the e f f e c t of k i l n diameter
at fixed L/D r a t i o . Although small k i l n s have a shorter k i l n

igure 8-6 E f f e c t of K i l n Diameter on Modelling of Rotary K i l n Heat Exchanger

X / L
Figure 8 - 7 F f f e c t of K i l n Diameter on Temperature P r o f i l e at Fixed L/D r a t i o

length, the strong e f f e c t on heat transfer c o e f f i c i e n t s over
comes the negative e f f e c t of short length.
The model of the rotary k i l n heat exchanger has been
developed for low temperature and non-reacting systems. The
high temperature process requires a radiative term added into
Equations 8-1 and 8-2 which w i l l r e s u l t i n non-linear f i r s t -
order equations. For a reaction system an additional term,
the heat of reaction, should be added, and the equation for
material balance should be supplemented as well.

CHAPTER 9
CONCLUSIONS
Convective heat transfer from gas to so l i d s bed and wall
has been studied experimentally as a function of operating para
meters. The parameters covered included temperature l e v e l , gas
flow rate, s o l i d throughput, i n c l i n a t i o n angle, r o t a t i o n a l
speed, degree of f i l l and p a r t i c l e s i z e . Tests were done on
both limestone and Ottawa sand. It was found that the heat
transfer c o e f f i c i e n t from the gas to solids bed based on the
plane chord area i s roughly an order of magnitude higher than
that from gas to wall. The experimental results show that both
s o l i d throughput and i n c l i n a t i o n angle have no influence on heat
transfer c o e f f i c i e n t s and the e f f e c t of degree of f i l l on the
gas to wall heat transfer c o e f f i c i e n t i s i n s i g n i f i c a n t . The
e f f e c t of p a r t i c l e size i s n e g l i g i b l e , which possibly r e s u l t s
from the narrow range of p a r t i c l e sizes tested. The following
dimensional equations have been obtained for the c o r r e l a t i o n
of experimental data for Ottawa sand.
. 0 T 7 0 . 575 ...0.091 -0.171 h = 2.44 W N gs g . n

and v, - n w 0-475. -0.297 hgw - ° - 8 2 W g N
The higher gas to s o l i d s bed heat transfer c o e f f i c i e n t s
partly r e s u l t from the underestimation of the true surface area
used in the c a l c u l a t i o n of the c o e f f i c i e n t . The actual exposed
surface area i s about^ twice as much as the plane chord area.
Rapid p a r t i c l e v e l o c i t y on the bed surface contributes s i g n i f i
cantly to high gas-solids bed heat transfer. It not only a g i t
ates the gas adjacent to the bed surface, but also convects heat
by v i r t u e of mixing of the f a s t - r o l l i n g p a r t i c l e s into the. bed.
A mathematical model has been developed to describe the i n
fluence of p a r t i c l e movement for a r o l l i n g bed.
Since the motion of aerated p a r t i c l e s was thought to be
important for heat transfer, exploratory experiments on measure
ments of surface time and surface v e l o c i t y were made. In the
r o l l i n g bed the l a t e r a l v e l o c i t y of p a r t i c l e s on the bed surface
increases with the square root of the r o t a t i o n a l speed.
Residence time d i s t r i b u t i o n i n a rotary k i l n was studied
b r i e f l y . The results show that the s o l i d flow i n a rotary k i l n
,can be assumed as. a plug flow a x i a l l y and-well-mixed r a d i a l l y .
A simple model of a rotary k i l n heat exchanger was cons
tructed to i l l u s t r a t e the e ffects of k i l n parameters on tempera
ture p r o f i l e s i n a low temperature k i l n .

CHAPTER 10
RECOMMENDATION FOR FUTURE WORK
F u t u r e work on c o n v e c t i v e h e a t t r a n s f e r i n a r o t a r y k i l n
s h o u l d e n t a i l g a t h e r i n g more d a t a r e l a t i n g t o p a r t i c l e m e c h a n i c s
- p a r t i c u l a r l y p a r t i c l e v e l o c i t y on t h e bed s u r f a c e . B e s i d e s
r o t a t i o n a l s p e e d , d e g r e e o f f i l l may a l s o be a m a j o r f a c t o r on
s u r f a c e t i m e , r a t i o o f s u r f a c e t i m e t o r e t e n t i o n t i m e and t h i c k
n e s s o f s u r f a c e l a y e r s . The t h i c k n e s s o f s u r f a c e l a y e r s and
i t s a s s o c i a t e d p a r t i c l e v e l o c i t y i n e a c h l a y e r s h o u l d be i n v e s
t i g a t e d t o t h o r o u g h l y u n d e r s t a n d t h e h e a t t r a n s f e r mechanism, •
p a r t i c u l a r l y i n h i g h t e m p e r a t u r e p r o c e s s e s s u c h as t h e d i r e c t -
f i r e d k i l n . The e x p e r i m e n t s c o u l d be c a r r i e d o u t i n a l u c i t e
k i l n u s i n g a h i g h s p e e d camera.
I n i n d u s t r i a l k i l n s t h e s l u m p i n g t y p e o f p a r t i c l e move
ment may a l s o o c c u r . S i n c e i t has been i n d i c a t e d t h a t i n c r e a s e d
bed s u r f a c e v e l o c i t y i s one o f t h e m a j o r f a c t o r s t h a t e n h a n c e s
h e a t t r a n s f e r c o e f f i c i e n t s , i t i s t o be e x p e c t e d t h a t gas t o
s o l i d s bed h e a t t r a n s f e r w i l l i n c r e a s e s i g n i f i c a n t l y as t h e
s l u m p i n g f r e q u e n c y o f p a r t i c l e mass i n c r e a s e s u n t i l t h e bed
r e a c h e s t h e r o l l i n g mode. F u r t h e r work i s a l s o s u g g e s t e d t o
i n v e s t i g a t e t h e h e a t t r a n s f e r i n t h e s l u m p i n g b ed, p a r t i c u l a r l y
t h e i n f l u e n c e o f s l u m p i n g f r e q u e n c i e s w h i c h i n t u r n a r e a f f e c t e d

by r o t a t i o n a l speed.
Although the c o r r e l a t i o n equations for convective heat
transfer c o e f f i c i e n t s for both gas to bed and gas to wall have
been obtained i n the present study, i t i s s t i l l inadequate for
scaleup and design for i n d u s t r i a l k i l n s . It i s thus, suggested
that the k i l n s of at least two sizes larger than one used i n
the present study be tested, so that the effects of diameter,
and length to diameter r a t i o can be demonstrated.

204
NOMENCLATURE
A area 2 m
A s plane area of bed s u r f a c e 2 m
A ' s
a c t u a l area of bed s u r f a c e m 2
A n c o n s t a n t s , d e f i n e d i n Table 8-1 -a heat d i f f u s i v i t y m 2/s B n c o n s t a n t s , d e f i n e d i n Table 8-1 -C dimensionless c o n c e n t r a t i o n -Cp s p e c i f i c heat j/gK c number of p a r t i c l e s per u n i t weight k g " 1
D k i l n diameter m constan t s , d e f i n e d i n Table 8-1 -
D a x i a l d i s p e r s i o n c o e f f i c i e n t m 2/s d a
d i s t a n c e per c y c l e m dp p a r t i c l e diameter m d' t h i c k n e s s of w a l l l a y e r m E e x i t gas d i s t r i b u t i o n s - 1
E n c o n s t a n t s , d e f i n e d i n Table 8-1 -F s o l i d v o l u m e t r i c flow r a t e m^/s F m
emerging r a t e of p a r t i c l e s from bed r e g i o n to s u r f a c e r e g i o n s-1
G g gas mass f l u x based on empty k i l n kg/h: g a c c e l e r a t i o n of g r a v i t y m/s 2
H heat flow r a t e W h heat t r a n s f e r c o e f f i c i e n t W/m2]
conductive heat t r a n s f e r c o e f f i c i e n t W/m2] hgs' gas-to-bed heat t r a n s f e r c o e f f i c i e n t
based on a c t u a l s u r f a c e area W/m2] h' r e l a t i v e heat t r a n s f e r c o e f f i c i e n t m-1 k thermal c o n d u c t i v i t y W/mK L k i l n l e n g t h m I t l e n g t h of t e s t s e c t i o n m Is bed s u r f a c e area per u n i t l e n g t h m2/m 1 w
exposed w a l l area per u n i t l e n g t h m2/m

205
V covered wall area per unit length m /m M number of p a r t i c l e s per unit volume m~3 m number of p a r t i c l e s per unit area m~2 N ro t a t i o n a l speed rpm N C c r i t i c a l r o t a t i o n a l speed rpm n r o t a t i o n a l speed rps Q heat transfer rate W q heat transfer rate per unit length W/m R k i l n radius m r radius position m S exposed area of p a r t i c l e surface m2 S' covered area of p a r t i c l e surface m2
T temperature K Tgo entering gas temperature K T g i e x i t gas temperature K sm p a r t i c l e mixing temperature K
t retention time or residence time S t b bed time s t c contact time s t s surface time. s t t cycle time s t x retention time s U average a x i a l v e l o c i t y m/s
v e l o c i t y defined i n equation 7-19 m/s Uo o v e r a l l gas-solid heat transfer
c o e f f i c i e n t W/m3K v a a x i a l v e l o c i t y on bed surface m/s V l l a t e r a l v e l o c i t y on bed surface m/s V r r a d i a l v e l o c i t y i n the bed region m/s w mass flowrate kg/hr X distance m z x/L -

206
Greek l e t t e r s
a K i l n i n c l i n a t i o n angle radian a 0 K i l n i n c l i n a t i o n angle degree 3 Central angle of the sector occupied
by the s o l i d bed radian e s t a t i c angle of repose radian e • dynamic angle of repose radian e 0
dynamic angle of repose degree ? dimensionless time -n degree of s o l i d f i l l -X Angle between i n c l i n e d bed & horizontal radian Ug gas absolute v i s c o t i y Ns/m2
vg gas kinematic v i s c o s i t y m2/s Ps p a r t i c l e bulk density kg/m^
P P p a r t i c l e true density kg/m^ p g gas density kg/m^ T bed height m TL bed height at x=L m a Stefan-Boltzmann constant W/m2K4 , (5.67xl0 - 8)
absolute variance s ° e r e l a t i v e variance -
shearing angle radian Angle between bed surface and
k i l n axis radian angular v e l o c i t y radian/s
u c c r i t i c a l angular v e l o c i t y radian/s 6 U parameter defined i n Equation 2-31 m e g gas emissivity -e s s o l i d emissivity -ew wall emissivity -K Thickness of surface region m
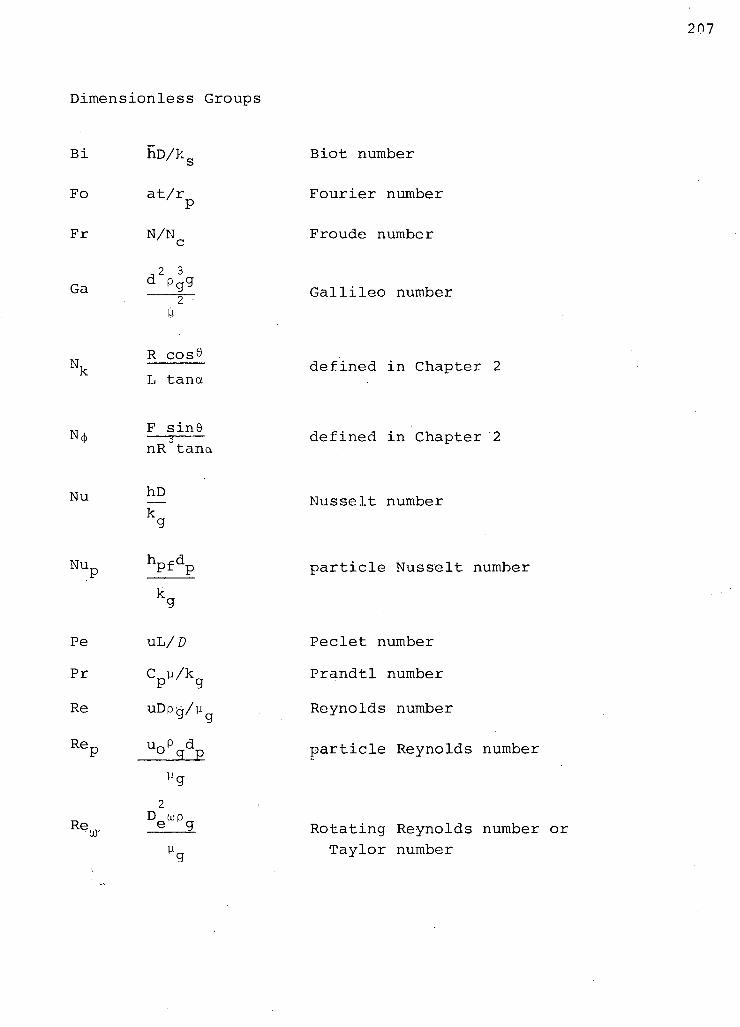
Dimensionless Groups
Bi hD/ks Biot number
Fo at/r Fourier number P
Fr N / N c Froude number
d p ag G a 1— G a l l i l e o number
y
R cos 9
Nj, defined i n Chapter 2 L tana
N,
Nu
F sm0 — 3 nR tana
hD k~
defined i n Chapter 2
Nusselt number
NUp ^Pf^P p a r t i c l e Nusselt number
Pe uL/D Peclet number
Pr C y/k Prandtl number P 9 Re uDp^/y g Reynolds number
R e p uo Pg^p p a r t i c l e Reynolds number
2 D ojp
Re^, _J;—9 Rotating Reynolds number y Taylor number y

208
Subscripts:
g gas p p a r t i c l e s bulk s o l i d material, bed w exposed wall w1 covered wall gs gas to s o l i d bed gw gas to wall sw s o l i d bed to covered wall
p a r t i c l e in the f i r s t exposed layer p a r t i c l e i n the second layer

209
REFERENCES
1. Sugishima, W., ' P l a s t i c s Wastes I n c i n e r a t i o n by Rotary K i l n ' , F u e l S o c i e t y of Japan, 51 (4), 233 (1972).
2. Wilson, K., 'The SL/RN Process at the G r i f f i t h Mine', presented a t 16th Conference of M e t a l l u r g i s t s , Vancouver, Canada, August 22-24, 1977.
3. Wachters, L.H.J, and Kramers, H., 'The C a l c i n i n g of Sodium Bicarbonate i n a Rotary K i l n ' , Proc. 3rd European Symposium Chemical Reaction E n g i n e e r i n g , 77 (1964).
4. Brimacombe, J.K. and Watkinson, A.P., 'Heat T r a n s f e r i n a D i r e c t - F i r e d Rotary K i l n : I, P i l o t P l a n t and Experimentation, I I , Heat Flow R e s u l t s and T h e i r I n t e r p r e t a t i o n ' . Accepted f o r P u b l i c a t i o n Trans. A.I.M.E.. (1978) .
5. R i f f a u d , J.B., Koehret, B. and Coupal, B., 'Modelling and S i m u l a t i o n of an Alumina k i l n ' , B r i t . Chem. Engr. & Proc. Tech., 17_ (5) , 413-418 (1972).
6. M a n i t i u s , A., Kurcyuse, E., and Kawecki, W. ,• 'Mathematical Model of the Aluminum Oxide Rotary K i l n ' . IF.C, Process Des. Develop., 13(2), 132-142 (1974).
7. Lyons, J.W., Min, H.S., P a r i s o t , P.E., and P a u l , J.F., ' 'Experimentation w i t h a Wet-Process Rotary Cement K i l n v i a the Analog Computer', I & EC Proc. Design and Development, 1 (1), 29-33 (1962).
8. Min, H.S., P a r i s o t , P.E., Paul, J.F., and Lyons, J.W. 'Computer S i m u l a t i o n of Wet-process Cement K i l n O p eration', N o m e t a l l i c M i n e r a l s P r o c e s s i n g , 35-39, September 1962.
9. W i n g f i e l d , S.L., Prothero, A. and Auld, J.B. 'A Mathematical .Model of a Rotary K i l n f o r the P a r t i a l Reduction of Iron Ore'. J o u r n a l of the I n s t i t u t e of F u e l , 64-72 March, 1974.
10. Tukamoto, T., Simada, S., Taguchi, T., and H i g u c h i , J . 'A Mathematical Model of the S i n t e r i n g P r ocesses'. Tetsu-to-Hagane, 5_6, 661 (1970), A l s o BISI 9050.
11. Toyama, S. and Sugeta, T. 'Simulation and Design Study on Rotary K i l n of F i r i n g L i g h t Weight Aggregate'. Togako Kogako, 3_3 (10) , 1019-1023 (1969) .
12. Sass, A., 'Simulation of the Heat-Transfer Phenomena i n a Rotary K i l n ' , I & EC Process Design and Development, 6 (4), 532-535 (1967).

210
13. Imber, M. Ph.D. Thesis 1A Mathematical Analysis of the Rotary K i l n Heat Exchanger 1, Columbia University (1958).
14. V a i l l a n t , A., Ph.D. Thesis 'Thermal Analysis of the Direct F i r e d Rotary K i l n ' . Columbia University (1965).
15. Kern, J., 'Heat Transfer i n a Rotary Heat Exchanger'. Int. J. Heat Mass Transfer, 17, 981-990 (1974).
16. Pearce, K.W., 'A Heat Transfer Model for Rotary Ki l n s ' , Journal of the Institute of Fuel, 362, December, 1973.
17. Rosa Von J., 'Mathematical Formulation of the Heat Transfer in the Rotary K i l n ' , Zement-Kalk-Gips, Val 2 3 (8), 368 (1970) .
18. Roberts, F., Taylor, R.F. and Jenkins, T.R., 'High Temperature Chemical Reaction Engineering', The Institute of Chemical Engineers, London, 1971.
19. Rutgers, R., 'Longitudinal Mixing of Granular Material Flowing through a Rotating Cylinder', Chemical Engineering Science, 20_ (1965), Part I. Descriptive and Theoretical, p. 1079, Part II. Experimental, p. 1089.
20. Zablotny, W.W., 'The Movement of the Charge in Rotary Ki l n s ' , International Chemical Engineering, _5 (2), 360 (1965).
21. Sullivan, I.D., Maier, CG. and Ralston, D.C., 'Passage of Soli d P a r t i c l e s through Rotary Cylinder K i l n s ' , U.S. Bureau Mines Technical Report, No. 384, (1972).
22. Henein, H., Brimacombe, J.K. and Watkinson, A.P., The University of B r i t i s h Columbia, unpublished research.
23. Themelis, N.J., Donaldson, J.W., and Udy, M.C., 'Use of the S i m i l a r i t y P r i n c i p l e i n Predicting the Optimum Performance of Iron Reduction K i l n s ' , The Canadian Mining and M e t a l l u r g i c a l , B u l l e t i n , p. 434, A p r i l , 1964.
24. Bayard, R.A., 'New Formula Developed for K i l n Time', Chemical and Met a l l u r g i c a l Engineering, 5_2, 100 March 1945.
25. Saeman, W.C., 'Passage of Solids through Rotary K i l n s ' , Chemical Engineering Progress, 4_7 (10) , 508 (1951) .

211
26. Pickering, R.W., Feakes, F. and Fi t z g e r a l d , M.L., 'Time for Passage of Material through Rotary K i l n s ' , Journal of Applied Chemistry, 1(1) A7 (1951).
27. Varentsor, P.V., Yufa, M.S., 'The Movement of a Bed of Sol i d P a r t i c l e s i n Rotary K i l n s ' , International Chemical Engineering, 1(1), 88 (1961).
28. Vahl, L. and Kingma, W.G., 'Transport of Solids through Horizontal Rotary Cylinders', Chemical Engineering Science, 1(6), 253 (1952).
29. Kramers, H. and Croockewit, P., 'The Passage of Granular Solids Through Inclined Rotary Ki l n s ' , Chemical Engineering Science, 1(6), 259 (1952).
30. Abouzeid, A.Z.M.A., Mika, T.S., Sastry, K.V. and Fuerstenau, D.W., 'The Influence of Operating Variables on the Residence Time D i s t r i b u t i o n for Material Transport in a Continuous Rotary Drum', Powder Technology, 10, 273 (1974).
31. Wes, G.W.J., Drinkenburg, A.A.H., and Stemerding, S., Solids Mixing and Residence Time D i s t r i b u t i o n i n a Horizontal Rotary Drum Reactor', Powder Technology, 13, 177 (1976).
32. Moriyama, A., and Suga, T., 'Axial Dispersion and Residence Time Di s t r i b u t i o n of Spherical P a r t i c l e s i n Rotary K i l n ' , Tetsu-to-Hagane, £0(9), 1283 (1974).
33. Levenspiel, 0., Chemical Reaction Engineering, Wiley, N.Y., 2nd Edition, 1972, Chapter 9.
34. Matsui, Graduation Thesis from Nagoya Institute of Technology, Japan, 1972.
35. Lu, W.M., Shiau, C.Y. and Chen, C.C., 'Study on Mixing of Solid P a r t i c l e s i n a Rotary Cylinder with Cross A i r Flow', Journal of Chinese Institute of Chemical. Engineering, 4_, 52 (1973).
36. Sugimoto, M., Endoh, K., and Tanaka, T., 'Behavior of Granular Materials Flowing through a Rotary C y l i n der - Eff e c t s of Segregation Zones on the Residence Time Di s t r i b u t i o n of P a r t i c l e s ' , Kagaku Kogaku, 3_1 (2) , 145 (1967) .
37. Sugimoto, M., 'Effect of the B a l l i n g F i l l i n g on the Residence Time Distributions of P a r t i c l e s Flowing through a Rotary Cylinder' , Kagaku Kogaku, 32 (2) , 196 (1968) .

212
38. Suginioto, M., 'An Estimation of the Residence Time Dis t r i b u t i o n of P a r t i c l e s Flowing through a Rotary Cylinder'. Kagaku Kogaku 32 (3), 291 (1968).
39. Kennedy Van Saun Corporation, Danville, Pa., 'Rock Talk Manual', 1974.
40. Hogg, R., Shoji, K. and Austin, L.G., 'Axial Transport of Dry Powders i n Horizontal Rotating Cylinders', Powder Technology, 9_, 99 (1974) .
41. Bowers, T.G. and Read, H.L., 'Heat Transfer i n Rotary K i l n ' , Chemical Engineering Progress Symposium ser ie s . 6_1(57) , 340 (1968) .
42. Wes, G.W.J., Drinkenburg, A.A.H., and Stemerding, S. 'Heat Transfer i n a Horizontal Rotary Drum Reactor', Powder Technology, 13_, 185 (1976).
43. Lehmberg, J., Hehl, M., and Schugerl, K., 'Transversal Mixing and Heat Transfer i n Horizontal Drum Reactors', presented at the International Conference SPIRE i n Arad, I s r a e l , November 30, December 5, 1975.
44. Nikitenko, G.N. 'Heat Transfer from the wall to the Loose Material i n Rotary Drum-Type Ki l n s ' , Khimicheskaia Promyshlennost Ukrainy 5_, 29-32 (1969) .
45. Epstein, N. and Mathur, K.B., 'Heat and Mass Transfer i n Spouted Beds - A Review', Canadian Society of Chemical Engineering, 4_9, 467 (1971) .
46. Perry & Chilton (Editors-in-Chief) Chemical Engineering Handbook, 4th Edit i o n , p. 20-36, 1973.
47. Perry, J.H. (Editor-in-Chief) Chemical Engineering Handbook, 3rd Ed i t i o n , p. 831, McGraw-Hill, New York 1950.
48 :, Gygi, H. , 'The Thermal E f f i c i e n c y of the Rotary Cement K i l n ' . Cement and Lime Manufacture, p. 82, A p r i l , 1938.
49. Friedman, S.J. and. Marshall, W.R.J., 'Studies i n Rotary Drying, Part II Heat and Mass Transfer', Chemical Engineering Progress, 45(9), 573 (1949).
50. Chen, C.C., Lu, W.M. and Teng, L.T., 'Heat Transfer i n the Through Flow Rotary Dryer', J. of Chinese Institute of Chemical Engineers, 5, 1-6 (1974).

213
51. Kaiser, V.A. and Lane,J.W., correspondence to Saas 'Simul a t i o n of the Heat Transfer Phenomena in a Rotary K i l n ' , I & EC Process Design and Development, 1_ (2) 318 (1968).
52. Eckert, E.R.G., and Drake,. R.M., 'Heat and Mass Transfer', McGraw H i l l , New York, 1959, p. 405.
53. Luethge, J.A., 'Measurement and Control of Temperatures i n Rotary Ki l n s ' , Instrumentation Technology, 46, March 1968.
54.- Venkateswaran,V.,. M.A.Sc. Thesis, 1976, The University of B r i t i s h Columbia.
55. 1974 ASTM Standard book, E-220 and E-230.
56. H i l l s , A.W.D. and Paulin, A., 'The Construction and Calibrat i o n of an Inexpensive Microsuction Pyrometer', Journal of S c i e n t i f i c Instruments (J. of Physics E) 2, 713 (1969).
57. Brinn, M.S., Friedman, S.J., Gluckert, F.A. and Pigford, L.R., 'Heat Transfer to Granular Materials', Ind. Eng. Chem., 4£, 1050 (1948).
58. Kreith, F., 'Principles of Heat Transfer 1, International Textbook Co., Scranton, Pa. (1969).
59. Irvine, T.F. J r . and Hartnett, J.P., 'Steam and A i r Tables in SI Units', Hemisphere Pub. Co., Washington (1976)
60. Friedman, S.J. and Marshall, J r . , W.R., 'Studies i n Rotary Drying - Part I - Holdup"arid;Dusting', Chemical Engineering Progress, 45(3), 482 (1949).
61. Shevtsov, B.I., Kubyshev, N.N., Cherepivskii, A.A. and Bogdanov, Yu.Yu., 'Determination of the Rate of Movement of the Charge i n Rotary K i l n by means of Radioactive Isotopes', International Chemical Engineering, .11(2) , 252 (1971) .
62. M i s k e l l , F., and Marshall, J r . , W.R., 'A Study of Retention Time in a Rotary Dryer', Chemical Engineering Progress, 5_2(1) , 35 (1956).
63. B o t t e r i l l , J.S., Butt, M.H.D., Cain, G.L. and Redish, K.A., Proc. Eindhoven F l u i d i z a t i o n Symposium, p.442 (1967) .
64. Ernest, R. , 'Warmeubergang anJ'.Warmeaustauschern i n Moving Bed', Chem, Ing. Techn. 3j2, 17 (1960).

214
65. Rohsenow W.M. and Hartnett, J.P. (Editors-in-Chief), 'Handbook of Heat Transfer', McGraw-Hill Inc., N.Y., N.Y. (1973).
66. McAdams, 'Heat Transmission', McGraw-Hill Book Co., 1954.
67. Schlichting, H., 'Boundary Layer Theory', p. 407, McGraw-H i l l Book Co. Inc., N.Y., 1957.
68. Cannon, J.N'.., 'Heat Transfer from a f l u i d flow inside .a Rotating Cylinder', Ph.D. di s s e r t a t i o n , Stanford University, 1965.
69. Brimacombe and Watkinson, 'Calcination of Limestone i n a Rotary K i l n ' , 17th Conference of Metallurgists, CIM, Vancouver, August,•1977.
70. Carslaw, H.S. and Jaeger, J . c , 'Conduction of Heat i n Solids'. 1947, Oxford.
71. Kunii D. & Levenspiel, O, ' F l u i d i z a t i o n Engineering', Hohn Wiley & Sons, Inc., New York. 1969.

APPENDIX A
CALIBRATION OF EQUIPMENT
1.. T h e r m o c o u p l e C a l i b r a t i o n
The i r o n - c o n s t a n t a n t h e r m o c o u p l e s were c a l i b r a t e d i n
an o i l b a t h e q u i p p e d w i t h Haake thermo r e g u l a t o r (Model FS)
f o r t e m p e r a t u r e s up t o 400 K. The m i l l i v o l t r e a d i n g s were
r e c o r d e d on Watanabe M u l t i c o r d e r r e c o r d e r (Model 641) . I n
a d d i t i o n , t h e t h e r m o c o u p l e s were a l s o c a l i b r a t e d a t two temp
e r a t u r e s , t h e m e l t i n g p o i n t s f o r t i n and z i n c (504.8 K and
692.75 K ) . The m e t a l g r a n u l e s were f i r s t h e a t e d i n t h e b a t h
u n t i l t h e y m e l t e d and t h e h e a t was t h e n s h u t o f f . The thermo
c o u p l e was t h e n d i p p e d i n t o t h e m e t a l b a t h . The m i l l i v o l t
r e a d i n g s were t a k e n and r e c o r d e d . The r e s u l t s were shown i n
F i g u r e A - l . The r e a d i n g s 12.60 mV and 23.00 mV, were o b t a i n e d
f o r t i n and z i n c r e s p e c t i v e l y .
F i g u r e A-2 shows t h e r e s u l t s o f t h e r m o c o u p l e c a l i b r a t i o n
i n t h e c o n s t a n t t e m p e r a t u r e b a t h s o v e r t h e t e m p e r a t u r e r a n g e
o f 300 t o 700 K. The m i l l i v o l t r e a d i n g s f o r e a c h t h e r m o c o u p l e
were f i t t e d by l e a s t s q u a r e s t o a q u a d r a t i c e q u a t i o n o f t h e
form,
T = a + b ( m i l l i v o l t s ) + c ( m i l l i v o l t s )

Figure A - l Ca l i b r a t i o n of Thermocouple i n Metal Baths.

217
Figure A-2 C a l i b r a t i o n of Iron-Constantan Thermocouples.

The constants for the above equation are given i n Table A - l ,
along with the deviations of the calibrated values from meas
ured values at two temperatures. The measured values were also
compared with those tabled i n the ASTM Standard manual (55)
with the maximum deviation of + 1.8 F. The thermocouple data
in the manual are given i n Table A-2.
2. C a l i b r a t i o n of Rotameter
The rotameters were calibr a t e d against gas meters,
The c a l i b r a t i o n curves are given i n Figures A-3 and A - k .

\
219
Table A - l
C a l i b r a t i o n of Thermocouples
THERMOCOUPLE D e v i a t i o n K NO. a b c
34 3°K 504.
A 279.21 17.9 61 o.oooo . 0.36 0.70
B 279.55 17.935 0.0003 0.08 0.79
C 278.11 18.187 -0.0111 0.29 0 .35
D 277.72 18.197 -0.0108 0.30 0.39
E 277.75 18.425 -0.0224 0.27 0. 65
F 280.03 17.875 0.0020 -0.53 0.78
G 278.08 18.158 0.0005 0.30 0 .33
H 280.32 17.327 0.0324 0.32 0.80
I 279.87 17.553 0.0062 0.17 0.87
J 277.55 18.189 -0.0101 0.29 0.33
K 279.12 17.681 0.0266 -0.03 0.41
L 276.28 18.736 -0.0346 0.14 0.28
M 278.38 18.047 -0.0022 0.71 0.61
N 269.60 20.980 -0.1348 0.23 -0>.-81
0 282.91 16.707 - 0.0367 0.71 0.92
P 277.70 18.104 -0.0034 0.58 0 . 47
Q 284.13 16.078 0.0910 0.54 0.98
R 273.89 19.869 -0.0529 0.61 -0.10
S 277.80 17.931 0.0108 0.06 0.65
T 268.41 20.874 -0.1174 -0.11 -1.00
T (K) = a + b ( m i l l i v o l t s ) + c ( m i l l i v o l t s )

Table A-2
Thermocouple Data
Voltage m i l l i v o l t
1. 019
1.536
2. 058
2.585
3.116
3.649
4.186
4.725
5.268
6 . 359
7.457
8.560
9.667
10.777
12.998
15.217
16.325
18.537
Temperature C
20 30
40
50
60
70
80
90
100
120
140
160
180
200
240
280
300
340
Reference Temperature at 0 ' C.
Temperature K
293.15
303.15
313.15
323.15
333.15
343.15
353.15
363.15
373.15
393.15
413.15
433.15
453.15
473.15
513.15
553.15
573.15
613.15

SCALE OF ROTAMETER, %
gure A-3 A i r Flow Rate versus Reading on Rotameter Scale (Rotameter 2854).

0 20 40 60 80 100 120 140 160 180 200 220 240 260
READINGS
Figure A-4 Suction Rate versus Reading on Rotameter Scale (Rotameter 2487).

APPENDIX B
SURFACE AREA AND SURFACE VELOCITY
1. D e t e r m i n a t i o n o f A'/A s/ s
The r a t i o o f A 1 / A i s i m p o r t a n t i n d e t e r m i n i n g h e a t
t r a n s f e r c o e f f i c i e n t . The s u r f a c e r e g i o n c o m p r i s e s s e v e r a l
s u r f a c e l a y e r s . However, o n l y t h e f i r s t two l a y e r s seem t o
be e x p o s e d t o gas s t r e a m . I n o r d e r t o c a l c u l a t e t h e r a t i o
o f A g / A s , t h e e x p o s e d s u r f a c e a r e a o f i n d i v i d u a l p a r t i c l e s
i n e a c h o f t h e f i r s t two l a y e r s have t o be d e t e r m i n e d . The
d i f f e r e n t i a l s u r f a c e a r e a o f a s p h e r i c a l p a r t i c l e i s
d 2
dS = -P— d e s i n c dt, ( B - l ) 4
The a r r a y o f p a r t i c l e s i n t h e f i r s t two l a y e r s i s e i t h e r
a c u b i c a r r a n g e m e n t a s g i v e n i n F i g u r e 7-2B, o r a s t r u c t u r e a s
g i v e n i n F i g u r e 7-2A. In t h e l a t t e r a r r a y , t h e p a r t i c l e s i n
t h e f i r s t l a y e r s a r e shown i n F i g u r e B - l . T h e r e f o r e , t h e e x p o s e d
s u r f a c e o f i n d i v i d u a l p a r t i c l e c a n be o b t a i n e d by i n t e g r a t i n g
t h e f o l l o w i n g e q u a t i o n .


225
S, = 2 r 2TT 5
f V* d e sin? d.c,
0 J 0
TTd 1 + I T (R-2)
Sim i l a r l y , the exposed area of the second layer part i c l e i s
d 2ir
2 r2-n r T
S-, = 4 J
d e 0 J 0
sin? d?
3 ir , 2 — • d 8 P (B-3)
Consider a plane surface with dimension 3d^ by ( 1 + -Jf_ )d 2 P
as shown i n Figure 7-2A. There are two p a r t i c l e s i n the
f i r s t layer and 6 p a r t i c l e s i n the second layer. Thus, the
r a t i o of A ' / A i s s s
A J 3
A o 3d (1- ") d s P v T' p
2S 1 + 6S 2
= 2.42 (B-4)
In a cubic array as shown i n Figure 7-2A the aerated
area of in d i v i d u a l p a r t i c l e i n the f i r s t layer i s represented by

Sn = L d 2 1 2 p (B-5)
It i s assumed that a l l the space other than that occupied
by the f i r s t layer p a r t i c l e s are aerated by the second layer
p a r t i c l e s . Therefore, the t o t a l exposed area of the f i r s t layer
p a r t i c l e s i n a plane area, 4 d x 4d i s P P
^ d p2 x 16 = 8 i r d p
2 CB-6)
and that of the second layer p a r t i c l e s are
4d x 4d - 16 - d 2 = 4(4 - TT )d 2 (B-7) P P 4 P P
The r a t i o of A /A for a cubic array i s s s J
A' 8ird + 4 (4 - IT ) d -2. = P. P_ = 1 > 7 8 ( B _ 8 )
A e 16 d 2 s p
2. P a r t i c l e exchange rate between the bed region and the surface region
The temperature of the aerated surface p a r t i c l e s w i l l
be raised from T g to T before they return into the bed re
gion. Just before they return to the bed the heated p a r t i c l e s

227
mix with the p a r t i c l e s i n the other surface layers, which
receive no heat from the gas stream. In order to f i n d the
temperature of the mixture the rate of the p a r t i c l e s emerging
out of the bed region must be determined.
Assume the k i l n rotates at a speed, JI, as shown in F i g
ure B-2. The angular v e l o c i t y w i l l be w = 2im (radians/s).
The v e l o c i t y of the p a r t i c l e s normal to the bed surface i s
V N = ur sin? (B-9)
Let l s ' be the length of the boundary between the sur
face region and the bed, and M, the number of p a r t i c l e s per 1'
unit volume. For a plane area, Ax — s , the emerging rate of 2
the p a r t i c l e s i s represented by
V/2 V dy (B-10)
0
where y i s the distance from the central l i n e , OA1 as shown 1
in Figure B-2. Let h , be equal to OA'. Then
y = h R ' tan? •
and r = h R ' sec? (B-ll)
The f i r s t equation i s derived with respect to ? and the
following equation i s obtained

Figure B-2 Emerging Rate of P a r t i c l e s from Bed Region to Surface Region

229
dy = h ' s e c ? d? (B-12)
T h e r e f o r e , e q u a t i o n B-10 i s r e w r i t t e n and i n t e g r a t e d as f o l l o w s :
F_ = MAx m f 2 7 2 wh'" t a n ? s e c t, d?
= MAxuh
0 ,2 B 3s s e c ?
= JsMAxcjh' 2 tan 2-^-' B o
-T£1AXUV1s
1 7 . / . A T ' 2 — nMAxlc 4 S (B-13)
The term, l s ' , i s t h e l e n g t h o f t h e b o u n d a r y l i n e , and r e l a t e d
t o k i l n d i a m e t e r and d e g r e e o f f i l l . L e t K be t h e t h i c k n e s s
o f t h e s u r f a c e r e g i o n . Then
hg = h B + K
By t a k i n g s q u a r e on b o t h s i d e s , e q u a t i o n B-14 i s o b t a i n e d
' 2 2
(B-14)

Since
v., 2 2
and
equation B-14 can be rewritten as
l s ' 2 = Is - 8 R K C O S - | + K 2 (B-15)
2 By neglecting K , equation B-13 for F m becomes-
F M = - MAxn(l 2 - 8 R K C O S | - ) ( B - 1 6 ) 4
As indicated i n Figure 6-3, the p a r t i c l e v e l o c i t y i n
the surface region can be approximated by a lin e a r function
as
V = V, (B-17) < x
where t, i s the distance outv/ard from the boundary between two
region as shown i n Figure B-3, and i s the surface v e l o c i t y
of p a r t i c l e s i n the f i r s t layer. For a width Ax of the k i l n
the rate of the p a r t i c l e s r o l l i n g on the bed surface i s re
presented by

Figure B-3 P a r t i c l e V e l o c i t y P r p f i l e i n Surface Region.

2 . 3 2
F,. = MAx m
K f
0
= kMAxKV x (B-18)
By e q u a t i n g e q u a t i o n B-16 and e q u a t i o n B-18, one o b t a i n
a r e l a t i o n s h i p o f K and as f u n c t i o n s o f n.
K V = - n ( l s2 - 8 R K C O S | ) (B-19)
2
I n a d d i t i o n , - t h e s u r f a c e v e l o c i t y , was f o u n d as
a f u n c t i o n o f s q u a r e r o o t o f r o t a t i o n a l s p e e d , t h e t h i c k n e s s
i s t h e n d e p e n d i n g on t h e r o t a t i o n a l s p e e d and d e g r e e o f f i l l
by t h e f o l l o w i n g e q u a t i o n
1 K — + 8Rcos^
l s U n

APPENDIX C
SAMPLE CALCULATIONS
1. Calculation of residence time d i s t r i b u t i o n
The sample calculations for mean residence time, v a r i
ance, Peclet number and dispersion c o e f f i c i e n t are presented.
The experimental data for run R2 i s given i n the f i r s t two
columns i n Table C - l . The concentration, C(t^) represents
no. of tracer i n the sample no. of t o t a l tracer used
C ( t ± ) = wt. of sample wt. of bed
In t h i s run, the weight of t o t a l color tracer used was 13.7 gm
(939 i n d i v i d u a l t r a c e r s ) . The f i r s t sample was c o l l e c t e d at
t = 8 minute. After the tracers were fed. The weight of the
sample was 243.9 g i n which 5 tracers were found. The bed
weight was 9.4 kg. Thus C(t^) for the f i r s t sample i s
C(t.) = — 5 / 9 3 9 = 0.205 1 243.9/9^00
With the same procedure the values of C ( t . ) , i = 2, 3 M

234
Table C-l
Tabulation of Calculation for RTD run (R2)
t. 1
c ( t i ) F ( t ± ) F ( t . ) t . A t . 1 1 l E ( t i ) ( t ± -
(min) ( - ) (min)" 1
8. 00 0.205 2.09xl0 - 2 0.042 0.0072
8. 25 2. 300 23.40 0.483 0 . 0 4 9 5
8.50 5.159 54.58 1.158 0.0612
8 . 75 6.731 6 8.47 1.498 0.0302
9. 00 9 . 571 97.37 2.190 0.0703
9 . 25 5.924 60.26 1. 394 0.OHIO
9.50 3.543 36.04 0.859 0.0098
9. 75 1.582 16.09 0.392 0.0135
10.00 1.360 13.84 0 . 346 0.0238
10.25 0.622 6.33 0.162 0.0185
10.50 0.580 5.9 0 0.155 0.0261
10.75 0.402 4.09 0.102 0.0255
11. 00 0 . 360 3.66 n. i n i 0.0307
11.25 0.345 3.51 0.099 0,0380
11.50 0.268 2.73 0.079 0.0371
11. 75 0.194 1.97 0.058 0.0328
12. 00 0.160 1.63 0.041 0.0326
9.17 (min) 0.453 (min)

are calculated and the r e s u l t s are l i s t e d i n Table C - l . From
equation 5-5, the e x i t age d i s t r i b u t i o n function E(t^) i s
defined as
C(t. ) E ( t i ) = = —
EC (t.)At. 1 l l
where
EC(t.)At = 9.83 (min) i
Therefore F(t.) for the f i r s t sam.Dle i s I
E(t.) = 0 , 2 0 5 = 0.0209 (min) 1
1 9.83
and E(t^) for a l l the samples are calculated and tabulated
in the second column in Table C - l . Then the mean residence
time and variance can be calculated from
M t - E t.E(t.)At (5-3)
i = l 1 1
and M
a t2 = Z ( t ± - t ) 2F, ( t ± ) At (5-4)
i = l
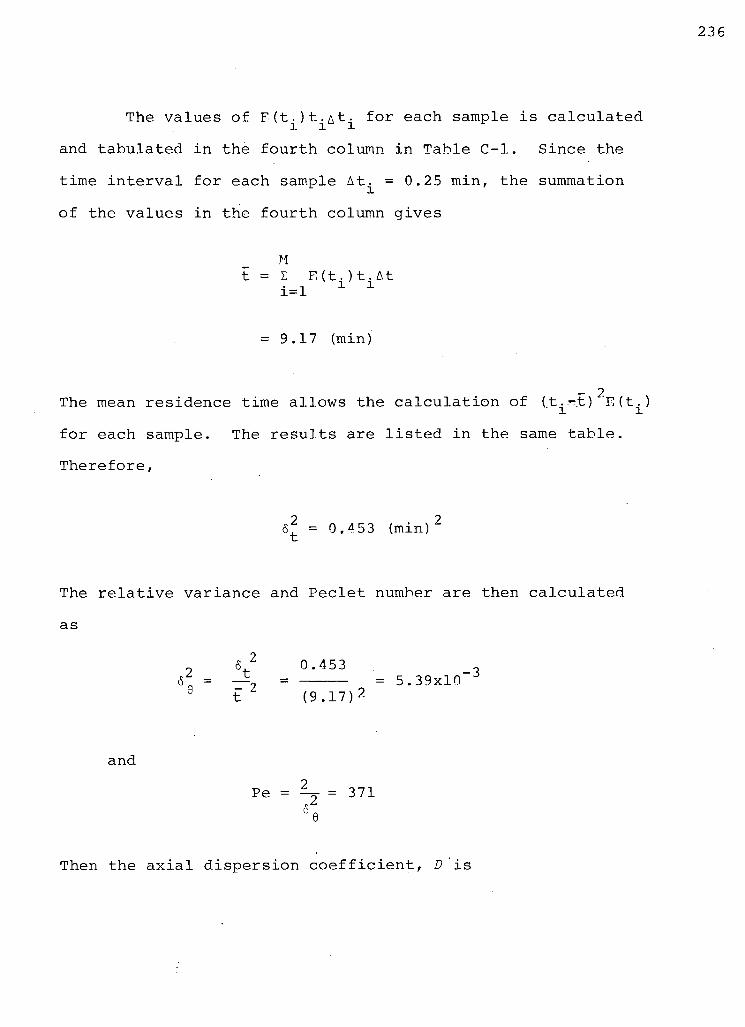
The values of E ( t ^ ) t ^ A t ^ for each sample i s calculated
and tabulated i n the fourth column in Table C - l . Since the
time i n t e r v a l for each sample At^ = 0.25 min, the summation
of the values in the fourth column gives
n
t = E F, (t. ) t. At i=l 1 1
= 9.17 (min)
_ 2
The mean residence time allows the ca l c u l a t i o n of (t^-.t) E(t^)
for each sample. The res u l t s are l i s t e d i n the same table.
Therefore,
6 2 = 0.453 (min) 2
The r e l a t i v e variance and Peclet number are then calculated
as
j 6 2 0.453 6 „ = -A, = = 5.39x10
(9.17) 2
and
Pe = ^ = 371
Then the a x i a l dispersion c o e f f i c i e n t , D i s

Pe tPe
2 44^" -S 2 = = 2.91x10 m/s 9.17x60x371
2. Calculation of the heat transfer C o e f f i c i e n t
The computer program that was used routinely for these
calculations i s appended. The sample c a l c u l a t i o n i s done for
run A16.
The a i r flow rate and the s o l i d feed rate for the run
were 24.6 kg/hr and 14.2 kg/hr respectively. The r o t a t i o n a l
speed was 1.5 rpm, the i n c l i n a t i o n angle was 1.2 degree and
the s o l i d holdup was 17%. The temperatures of a i r , sand and
wall were measured at x= 1.25 m and 1.78 m from the solid,
entrance .end. The temperature were then interpolated and given
i n the table i n Appendix E. The l o c a l heat flows for so l i d s
to wall, gas to so l i d s and gas to wall at a given a x i a l loca
t i o n are calculated. The determination of heat flow from
solids to bed requires the knowledge of so l i d s to bed heat
transfer c o e f f i c i e n t which are obtained from Figure 6-26. The -6 2
d i f f u s i v i t y of Ottawa sand, a = 0.225x10 m /s, the thermal
conductivity of Ottawa sand, k g = 0.268 W/mK. The center
angle for occupied solids i s g = 1.98 radians. Thus, the
value of

238
2 ^ r 5 - x ( 0 . 0 9 5 2 5 ) 2 x 1 . 9 8
= 22 1 = 1 9 8 7
a 0 . 2 2 6 x 1 0
From equation 6-25, the Nusselt number i s
h i ' sw w 0 3 = 11.6 (1987) J' J = 113.2 k s
and 1 = BR = 0.189 m. Thus, the value of h i s w ' sw
h g w = 113.2 x 0.268/0.189 = 160.5 W/m2K
Since there i s a layer of cement about 1 mm thick on the wall, and i t s thermal conductivity i s 0.294 W/mK the equivalent heat transfer c o e f f i c i e n t across t h i s layer i s 0.294/
-3 2
1.0x10 = 294 W/m K. The o v e r a l l heat transfer c o e f f i c i e n t
i s
h = = 103.8 W/m2K sw,o 1 1
1605 2940
Then the l o c a l heat flow from so l i d s bed can be calculated
at a given a x i a l location by
< W x ) = w^w ( T s - V

239
For instance at x = 1.25 m, T g = 374.0 K and = 369.2 K,
the value of q (x) at x = 1.25 ni i s 57.2 W/m. The heat re-
ceived by the sol i d s i s calculated by
dH (x) C W dT s _ ps s s j dx dx
where C = 0.653 + 0.215xlO"3T (J/gK) ps Thus C p = 0.733. . ' The value of
dT g/dx was obtained by the Spline function
dT --S- = 57.3 K/m dx
Therefore, the heat received by the solids i s
dH (x) kg 1000 |L — - = 14.2 — x x 0.733 J/gK x 57.3 K/m dx hr 3600 =-
hr
= 16 6. W/m
From equation 6-15, the heat transferred from the gas
to the sol i d s i s
dH (x) g (x) = " " 5 " + q (x) -gs d x

240
= 223.2 W/m
Then, the heat which the gas gives up i s calculated from
equation 6-8
dH (x) G W dT g _ pg g g
dx dx
where C = 1.0017 + 0.042 T/lfffco pg . '
C =1.0 21 J/gK pg
and by the Spline function,
dT —2- = 4 5.9 K/m dx
Therefore,
dH (x) , 1000 — 2 = 24.6^ x : £2. x 1.021 J/gK x 45.9 K/m dx n r 3600 p r
= 320.4 W/m

From equation 6-16, the l o c a l heat flow from the gas to the
wall at x = 1.25 m i s
q gw dH g(x)
dx - q (x)
^gs
= 320.4-223.2=97.2 W/m
With the same procedures, the l o c a l heat flows at x = 1.30,
1.40, 1.50, 1.60 and 1.78 m are also calculated. The re s u l t s
are given i n the table on page 261.
The average heat transfer rate per unit length for the
test section, q and q can be calculated from equations ^gs gw ^ 6-17 and 18, respectively.
r x 2
= 291.5 W/m
and r x 2 q = q (x)dx/(x~ - x, ) Mgw I Jgw ' 2 1
J x i
= 10 7.0 W/m
where x^, x 2 are locations for two ends of the tes t section.
x 0 - x-, = 0.53 m.

Therefore, the logarithmic mean heat transfer c o e f f i
cients for gas to sol i d s and gas to wall are represented by
h = q / l (T - T J , gs ^gs s g s lm
and h = q / l (T - T ) n gw ^gw w g w lm
respectively, where
(462.0 - 374.0) - (492.0 - 417.0) ( T g T s ; l m 462.0 - 374.0
492.0 - 417.0
= 81.3 K
and _ . _ (462.0 - 369.2) - (492.0 - 410.5)
1 g w'lm 462.0 - 369.2 492.0 - 410.5
8 7.0 K
In addition,
1 = 2R sin-?-
1 no = 2 x 0.09525 s i n i ^ 2 - =0.175 m

243
and
1 = (2TT -g)R w
= (6.28 - 1.98)x0.09525 = 0.410 m
Thus, the heat transfer c o e f f i c i e n t s from gas to sol i d s and gas
to wall are
h g s = 291.5/0.175/81.3 = 22.5 W/m2K
and
h = 107.0/0.41/87.0 =3.0 W/m2K

COMPUTER PROGRAMS

THIS PROGRAM MODELS THE ROTARY KUN BASED ON EQUATIONS 8-1 AND 8-2, USING THE CORRELATED HEAT TRANSFER COEFFICIENTS.
N U ( G S I = 0 . 4 6 « R E * * { 0 . ! 3 5 ) * R E W * * ( 0. 104)*FI L L * * (-0.341) NU(GWI=1.54*RE**(0.575)*REW**(-0.292)
THE CHARGE TEMPERATURE IS FIXED AT 350 K WHILE AIR INLET TEMPERATURE IS 500 K
DIMENSION Y(3) ,F(31,0(3) ,TG(100) ,TSt100) ,TW(10C),Z(IOC I COMMON D1,02,D3,E1,E2,E3,T0 REAL L , K W , K S , N , L l . L 2 , L S , L 0 PI=3.14159
Y(1)=0.0 JJ = 10 STFP=0.01 M=10 11*0.0 NN = 3 J = 0
KILN DIMENSION
R0=1.15 RI=1.0 D=2.C*Rl . L=r /3 .0*50.
KS SOLID THERMAL CONDUCTIVITY, W/M K. KW REFRACTORY THERMAL CONDUCTIVITY.
DIFF DIFFUSIVITY, M2/SEC DENS SCLIO BULK DENSITY, KG/M3
KS=0.268 KW=0.043 0TFF=0.225E-C6 0ENS=1.602E+03
N ROTATIONAL SPEED, RFM. FILL OEFREE OF F I L L . ALPH INCLINATICN ANGLE, DEGREE. BETA CENTRAL ANGLE OF THE OCCUPIED BED, RADIAN.
N=1.225 FILL=0.11 ALFH=0.B570
BETA=1.68 WRITE(6,149)
149 FCPVATP READY FOR TGO, TSO IN FCRMAT 2F5.1 ' ) P F » ( M 5 . 1 5 1 > Y (2) ,Y(3) TS1=Y(3)
151 F O F « A T ( 2 F 5 . 1 l « lPt-» = ALPH/57.32 BEE=BETA/2. BE E=COS(BEE• HP=RI*(1.0-BEE)
C C WS : SOLID THROUGHPUT, CALCULATED BY C C WS=1.295*HB*D**2*ALPHA*DENS*N/SIN(THETA) C
WS*1.295*HB*D**2.0 VS = t«S*ALPHA/0.454 KS=WS*nENS*60.*N APE»=PT*R1 *RI WG = WS PPf=PFTA/2.0 BP E = SIN(BBE)
C C CE: EOUIVALENT DIAMETER. C
DE-(2 . *PI-BETAI*RI*2 . *RI*BBE DF=P!*RI*Rt*(1.0-FILL)/DE DE=4.*DE T0=2S3.
C C CALCULATE THE CCNTACT AREA PER UNIT LENGTH. C L i : EXPOSED AREA. C 12: COVERED AREA. C LS: BED SURFACE AREA.
C L1-(2 . *PI-RETA)*R! L2=PET8*RI LS=2.0*RI*eEE
C C CALCULATE OF HEAT TRANSFER COEFFICIENTS C
HOMC.O c-c c NNNN=3
24 IF(NNNN-IO) 21.21,22 21 T=(Y(2)-273.)/10C0.
TT=(Y(3)-273.1/1000.
NO

n x o z
II •-4 0 •»t LU U- CJ LU 3: LU t
• a * * w * • to 0 * tn tl z II IL II », CO 0 a Ul • CO X — »-*
Ul z m • fSJ — z 1-
a II UJ . II <I 0 z • CO X • =3
O - 0 » n •• • P-4 PvJ LU
• P I 0 LU CD • 00 • to • m *• •> • 0 jr O UJ in
• z LU — «-i • m 0 > < * u. UJ * 3: • II CC 0 LU LU LU * rvi * P I c * • » to • UJ z CJ - J • • PI II O Li-i in UJ w <r to 0 • II gj • LO j * CD < LU m ul » *. II
_ J u. CL LU * _J • m » • x x Ul JE u * u. O I <I X. » ro u> UJ t- -a-
• •> » LO » a — X LU 0, ^: CC
H • II -J cr • rg •v. O - z « + • • • • a - •M II » X LL. <i * z
ft m pi P I * *v LU O » > • < * * a •. X z * * * * O • o et I/) •. Ul LU 1- *
(-0 a z 0 - J C"i U. or rvj » e L.« LU • Ui a Ul a D. O- a » > z * LU O X LJ cr 0 2. Ul MM o o o o or o to • LU 1— — t- • • • KI * K . "V. v. >s. * * a Cf • v- II LU O LU LU <r to • eg
o e Ul ui IT* <\J j z n • (_> UJ • I < zr X CL »- _1 < JE 2 * Jt QU m LU • 0. O a: a. <i LU m • K 0 * + v. "N. * # * m — X o • «— 0 «-< — LU _j — a — < ~- II => -3 • a _ J - J * o LL 0 CC LU O CL 0 <x O in O LLl O UJ : —) U- LU # * « # CP <i CD < < pi o o • 0 a • O O O a O • O X O a » B K —
Ul CM 1 « * * l * to • ru • m •«• in X CC LU - > CO (NI - J —1 (M •4- II II <NJ O It — * —
* « * » a) < < a" < II «e tn O w • *c 0 w 0 — *0 z w V ) 3 Ul + + * • + # o — K CC C w ^ • w *- w K >— < CC KI II 11 II o o o t/i m Pi LU <2 - J U. LU «t LU «l LU <k u, <i LU < • 0: tJ a. II — X X X cu ca < a; CD cu -> 2 3L • k- 2' t— 3'. X 1- 2 0 ^ —J + -> — to-. H H n II I I it I I li It I I «-> t— (X U. «— CC ^ ~ CL »—• u. iX- • a. "-• LU 11
pi t—i rsj p. <M pi UL a o • Ct LJ a. 0 U. Ql U cx l _ a 0 O. LJ UJ UJ 11 —' c; Ui JK CC CO a. o c UJ Hi LU ^* 2 U- • LL. LL 3E LL 2 LL V u. 3 LL • 0 u - j Ki K! • -
P> o O c O O 0 O m o O 0 O O 0 O m
»4 CM m >f tn «o CD
u u u u u
UJ
<
o I
X u 3 (- > M l / l < t/> C K C I U U VJ c/1 =) (/) o — > 2 » c UJ « t- t- - J
3 « « Q u i V
z u. C I « x: t-v i t/i < < < c u e
. V ) * o — fc- JJt
> > <
rg — O
# • 1. • • z * * O ~ O « 0 — * » LL O
* * * X ># t U- O CM 00 U l • •v * Jt II rg p- 9-1 0 0 Z U J U J O JE
- * CD 3 z # # CC CL Ul rg • • 2 < UJ * * <l X < 4 0 £ *3" 00 *-1 + + » Ul • m m • CD K- UJ
l ~ l - « JK O m LU • • 0 O CC tn * a * * ru # LU X ^ 0 0 0 0 0 in l • rg * 0
•4" Ct UJ # # * • cr • •-• + 0 u> go 0 LU CO 0 O *r UJ © •-•«•« 0 * 0 O CC LU rg <\ 1 v f~ 1 Ul 0 1 • CL LU LU # * * • * I * CJ rg
• UJ c * u* •v. « LU X • LU « l to-• cc a LU LU » 0 0 m • —1 m 0 it tr 0 r\l O V . • CC _ J CL • # * O O 0 - J * JK a • • 4 • + • X + 4 ">V "V JT •—• * * * O • lO - r — . r~ ^ 4 m 4 Pi LU l_> Ul gj m Ul * *. LL z • * n * 1- « »~ rg •It rg 1- -J *v • • C) O « « ("g * 0 * « O • r* ui •-• P 1 i_> m <I «t • > O <-> ^ tn Ul u> CG 0 JC • 7 • z • z • ^ z " • • - J CJ • II II -1 z • O O • O Ul Ul Ul
> 3 — -> =1 rg <. z> CD U) 3 0 rg X X X ^ I X W; X II (1 II tl I I 11 It c z JX n o w II II II II II II 11 II It II X I I
to 1/1 U l at ac u- O c? Ul —1 UJ II JE X St U l JC Ul V I u« JE .JL JC JE JK
*— X . a CL 4 X UJ LU k. Z 0 O O Ul Ul Ul u. Ul > > ^ > > > < < u u U H CC Ct < « X X O X X X X X X X X X
31 ^ ^ • ~* • -v -J »- 1 "V — a - J JX — -4-
N» O < < • J I + 4-
(M O N • rg S I J < « X • * rg » •
' < CJ - J • — P I — . _j • a. *s
a o # J t t v 1 V O u Wi • • . O -J X X CM <l ~* •
a. - i it tt 11 it 11 I II l) rt IM CI 4 <f> I < < <1 <t < < <I
O O O O O o o o o 0 0 0 0 0 0 0 0

WRTTF(6,7C0) Z U l . T G t H ,TS(I»tTH ( t» IF f I . N E . J J ) GO TO 24
700 FCOWMI IX,F10.3,3(5X,F10.2>) 10 CONTIK'U?
T T T » T G ( J J ) - T S 1 or 11 1=1,JJ Zt I » = ZtI>/L TC(TI=(TG(I)-TS1)/TTT T S ( I I » ( T S ( I I - T S l ) / T T T T W » I ) = ( T W ( I 1 - T S 1 ) / T T T V.PITF (6,701 ) It 1 ).TG( I ) , T S U J .TWU)
701 F O B M A T ( I X , « F 1 0 . « » 11 CTNTINUE
STOP ENO
SUBRCUTIKE AUXRKs EQUATIONS FOR RK CALAUIATION
SURfCUTTNE AUXRKtY.F) DIHEKSICN Y(3) ,F<3> COMMON 0 1 , D 2 , D 3 i E l . E 2 , F 3 , T 0 F ( 2 ) « D 1 * Y ( 2 » - D 2 * Y < 3 ) - D 3 * T 0 F ( 3 > « E l * Y < 2 ) - E 2 * Y ( 3 > * E 3 * T O FETUfN FNC
EXECUTIC* TERMINATED
*SIGNCFF

c C THIS PROGRAM IS WRITTEN FOR HEAT TRANSFER IN ROTARY C KILN. A KILN OF 8 INCHES 00, T .5 ID IS USEO FOR C EXPFRIMENT TO OBTAIN TEMPERATURE PROFILES OF AIR C SANC AND WALL ALONG THE KILN. C THE MAIN OBJECTIVE IS TO EVALUATE HEAT TRANSFE C COEFFICIENTS RASED ON EXPERIMENTAL DATA. C NU SSELT AND REYNOLDS NUMBERS ARE ALSO CALULATED. C C C INPUT CATA: C RUN,WA,ROT,WS.RIN,HCLDUP C MEASURED TEMPERATURES. C C THE INTERPOLATED TEMPERATURES ARE CALCULATED BY C THE USE OF SPLINE FUNCTIONS. C c
01 MENS ION X(30),LW(7),L<(7) , T WE ( 7 J , T ! E« 7) ,T SE (7) . TAE (7) DIMENSION TWI30),T!t30) ,TS(30) ,TAt30l .TSOI30) ,TA0I30I OIMENSION 51(30),S2<30),S3(30 I DIMENSION QSW(3C),0GS(30),0GW(30) DIMENSION OA(30),0S(30I,HTCGS(30),HTCGW(30) EOUIVALENCEISl,0A) ECUIVALENCEtS2,0S) ECU I VALENCE(S3,CGW) COMMON /A/LW,LS»TWE»TIE«TSE«TAE REAL K,LW,LS,NU EXTERNAL FCT TATA D f l T / l H . / , C0R/1HI/
C C RUN RUN NUMBER C WA AIR FLOW RATE THROUGH KILN, KG/HR C VS SAND FEED RATE, KG/HR C ROT ROTATATtONAL SPEED, RPM C BIN INCLI NAT ICNAL ANGLE, DEGREE C HCLDUP T C
DC 1111 1111=1,44 R E A D I S . l l l ) RUN,WA,ROT,WS , R IN , HCLDUP
111 FORMAT( I X , A 4 , F 5 . 1 , F 6 . 2 . F 4 . I , ? X , F 4 . 2 , F 4 . I » WRITE(6,112) RUN»WA,ROT,WS»"IN,HOLDUP
112 FCPMAT(1H1//////22X,7HRUN NO.,2X,A5//4X,16HAIR FLOW RATE 1.F5.1.6H KG/HR, 10X, 17HR0TAT IONA L SPEED ,F4 .1 ,4H RPM/4X, 216HSAN0 FEED RATE .F5 .1 .6H KG/HR,10X,19HINCLI NATION ANGLE 3.F4.1.7H DEGREE/4X.16HHCLDUP , F5 .1 , IX , 1H J/)
PER=H0LDUP/100. C C LW THERMOCOUPLE LOCATION FOR WALL TEMPERATURE FROM C CHARGE END, M.
C LS THERMOCOUPLE tOCATlCN FOR AIR AND SOLIDS C TEMPERATURES, M C TfcE MEASURED WALL TEMPERATURE C TIE MEASURED INSULATION TEMPERATURE C TSE MEASURED SANO TEMPERATURE C TAE MEASURED AIR TEMPERATURE C
LW(2)=0.31 LW(3)=0.91 L W » 4 ) = 1 . 5 2 LW<5)=2.13 LSt2) = 0.21 IS(3)=0.72 LS(4I=1.25 LS(5) = 1.78 LS(6I=2.32
C C READ MEASURED TEMPERATURES . C
RFADI5.10) (TWE(I),1=2,5),(TIE(I) ,1=2,5 I PEAC(5,10) (TSF(I) . I=? ,6) , tTAE(I) , I=2.6) RE AD(5,10) TA0.TA6.TSO,TS6.TW0.TW5 00 16 l=?,6 WRITE(6, 171) LSI I) ,DOR,TAE(I),TSE(I),DOR
171 FCRM6T(7X,F4.2,2X,A1,2(F6.0,2X1,16X,A1) I F d . E 0 . 6 t GO TO 16 WRITFI6.172) LW(I) ,DOR,TWE( I) ,T IE( I l.DOR
172 FCRMAT(7X,F4.2 ,2X,Al ,16X,2(F6.0 ,2Xl f Al> 16 CCNTINUE
WRITE(6,173) 173 FORMAT!/)
Xtl)=0.0 X125I=2.4 11 = 24 -IM=II+I DO 200 1=1,5 52 tIt = L St 1*1)
200 TAC(I)=TAE(I*1) DO 201 1=1,5
201 TSniIt=TSE(1*1) TAEtl )=TAO TSEtl)=TSO TSE(7)=TS6 T « E ( 7 ) = T A 6 DO 202 1=1,4 53 (I ) = LH (1 + 1 >
202 ThCl I I= TWE( 1*1 ) 00 2C3 1=1,4
203 TSOtI)=TIF(1*1 ) TfcE(l)=TWO
ho -P> 0 0
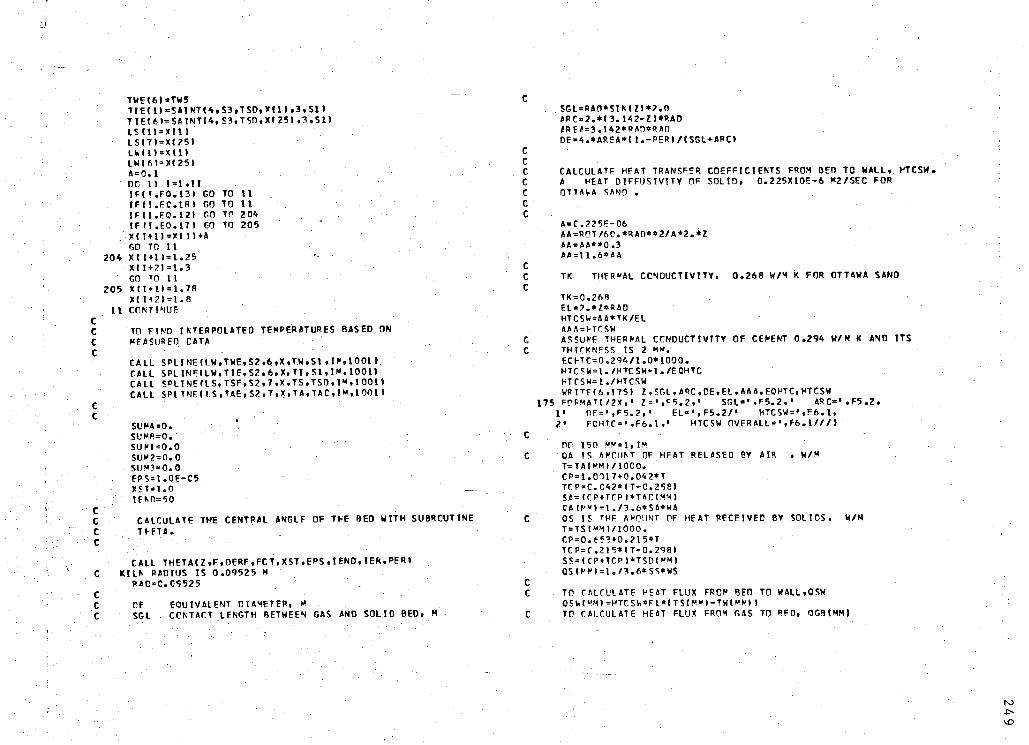
TWE(6)=»TW5 TIE( l )=SAINT(4 ,S3 .T$D,X l l ) , 3 , S l ) TIE161=SAINTI4,S3,TSD,XI25) ,3,S1> LSI1I=XI1 ) LSI7)=XI25) LM1)=XI1I LWI6) = XI25> A = 0 . l DC 11 1=1,11 IFIt .EO.13) GO TO 11 IFI I .EC . l f l ) GO TO 11 1FM.E0 .12) 00 TO 204 IF II .E0 . 1 7 ) GO TO 205 " X I I » I ) = X I I I * A GO TO 11
204 XI 1*1 ) = 1.25 • • XI1*2)=1.3
GO TO 11 205 XII*1I=1.78
XII*2)=1.8 II CONTINUE
C C TO FIND INTERPOLATED TEMPERATURES BASED ON C MEASURED DATA C
CALL SPLINE(LW,TWE,S2.6,X,TW,S1 ,If,1001 I CALL SPLINE(LW,TIE,S2.6,X,TI ,S1,IM,1001) CALL SPLINEILS,TSF,S2,7,X,TS,TSD,IM,1001) CALL SPLINEILS .TAE,S2 .7 ,X ,TA,TAC, IM, 1 001 I
C C
SLNA=0. ' SUMB=0. SUf1=0.0 SUM2=0.0 SUM3=0.0 EPS=l.0E-C5 XST=1.0 IFND=50
C C CALCULATE THE CENTRAL ANGLF OF THE BED WITH SUBROUTINE C THETA. C
CALL THETAIZ tFiDERF,FCT,XST,EPS,IEND.IER,PER> C KILN RADIUS IS 0.09525 M
RAC=C.CS525 C C CE EQUIVALENT DIAMETER, M C SGI CONTACT LENGTH BETWEEN GAS ANO SOLIO BED, M
C .SGL=RA0*SINIZ)*2.0
ARC=2.*I3.142-Z)*RA0 *RE*=3.142*RA0*RAD DE=4.*AREA*I1.-PER I/1SGL+ARC)
C C C CALCULATE HEAT TRANSFER COEFFICIENTS FROM BED TO WALL» HTCSW. C A HEAT DIFFUSIVITY OF SOLID, 0.225X10E-6 M2/SEC FOR C OTTAWA SAND . C c
A=C.225E-06 AA = R0T/6C. *RAD**2 /A*2 . *Z AA = AA**0 .3 AA=11.6*AA
C C TK THERMAL CONDUCTIVITY, 0.268 W/M K FOR OTTAWA SAND C
TK=0.268 EL=?.*Z*RA0 HTCSW=AA*TK/EL AAA=HTCSW
C ASSUME THERMAL CONDUCTIVITY OF CEMENT 0.294 W/M K ANO ITS C THICKNESS IS 2 MM.
ECHTC=0.294/1.0*1000. HTCSW=1./HTCSW*1./ECHTC HTCSW=1./HTCSW WRITEI6.175) Z.SGL,ARC,OE,EL,AAA,EOHTC,HTCSW
175 FORMAII^X , 1 l = ',*S.2,' SGL = ' .F5 .2 .< ARC='.F5.2, 1' nE=',F5.2,< E L = ' , F 5 . 2 / ' HTCSW=',F6.1, 2« F O H T C - ' , F 6 . 1 , • HTCSW OVER ALL = ' , F 6 . 1 / / / )
C -DC 150 MM=1,IM
C OA IS AMOUNT OF HEAT RELASED BY AIR , W/M T=TAIMM»/1000. CP=1.0017*0.042*T T C P = C . C 4 2 » ( T - 0 . 2 S 8 ) SA=(CP*TCP)*TAi:(MM) CA (MV ) = 1 . / ? . 6 * S « * W A
C OS IS THF AMOUNT OF HEAT RECEIVED BY SOLIDS. W/M T=TS(MM)/1000. CP=0.t?3*0.?15*T TCP=C2l5*!T-0.298> SS=ICP*TCPI*TSD ( M M | 0S(MMI=1./3.6*SS*WS
C C TO CALCULATE HEAT FLUX FROM BED TO WALL.OSW
OSMMM)=HTCSW*FL*(TS(MMI-TWIMM) ) C TO CALCULATE HE'T FLUX FROM GAS TO BED, 0G3IMM)
K3

OGS|MM»=OSWIMM»*OSIMM1 C TO CALCULATE HEAT FLUX FROM GAS TO WALL. OGW(MM)
OGWI»<M)=QAIMM|-QGS(MM) C C TO CALCULATE HTC C HTCGS LCCAL HEAT TRANSFER COEFFICIENTS. W/M2 K C HTCGW HEAT TRANSFER COEFFICIENT, W/M2 K
HTCGS(MM)=QGSIMM)/SGL/(TA(MM)-TSIMM)I HTCGW|MM)=QGW(MMI/ARC/(TAI MM)-TW(MM II J = MM WPITE(6,115> XIJI,TA1JI,TS< J),TW( J) ,TIC J l . Q S W U I ,
K S ( J ) ,OGS(JI l . C M J l . C G W U )
115 FCPMATI2X.F4. 2, 4(F6 .1 .2X1,51-0PF7. 1,2X11 C
150 CONTINUE 10 FORMAT!10F8.31
C 11 = 1 JJ = 25 *PITEt6,1831
183 FCRMATI1H1///1 00 500 1 = 11 .JJ TSDII l=OS(I>/<TAUt-TSt l l l /SGL T « P ( I 1 = 0 A I I l - Q S I I I TAC! I ) = T A D ( I » / ( T A ( I)-Twmi / A R C W P I T E ( 6 , 1 1 6 » X ! I t .HTCGS(I l ,HTCGWCI) ,TSOII l ,TAOUl
500 CCNTINUE 116 FrFMATI2X,F4.2.4F12.2l
KK=IE 11 = 13 KKK=KK-1 SUM4=0.0 SU*5=0.0 SUM6 = C.C CO 153 I=II,KKK
C S E G = » t 1 * 1 1 - X ! I 1 « V G = ( H T C G S I I I + H T C G S I 1 * 1 1 1 / 2 . 0 SUM«=SUMA*AVG*SEG AVG = (HTCGW(II*HTCGW(l + lI 1/2.0 SUM6=SUME*AVG*SEG AVC=(0GS(Il+OGS!1*111/2.0 SLM1=SUM1*AVG*SEG AVG=IOGW!Il+QGW!1*1(1/2.0 SUM2=SUM2*AVC*SEG AVG = (CSU) *CSI 1*11 I/2.0 SUM4=SUM4*AVC*SEG C=(CMII*Oa(I + l ) 1/2. SL'M5 = SUM5*C.*SEG
A « O A ( I l - O S ! 1 1 B=0ACl+l l-OSI 1 *1» A V G = ( A » P » / 2 . 0 SUM3=SUM3+AVG*SEG
153 CCNTINUF OSWT = HTCSW*EL*(TSU 6 »-TW(16 11*0.53 SU«7=QSV.T*SUM4 SUM8=SUM5-SUM7 WRITE!6,176 1 QSViT,SUM4,SUMT,SUM5,SUV8
176 FCRMAT!/2X, ,0SWT=',E10.4,> OST= • ,E 10.4, ' O G S T » » , 1E10.4, ' O G T = - , E 1 0 . 4 , » OGWT=«.E10.4)
*EAN PAS/SCLID HTC DERIVED FROM INTEGRATION OF LOCAL HTC DIVIOEO BY KILN TEST SECTION LENGHT. MEAN GAS/WALL HTC DERIVED FROM INTEGRATION CF LOCAL HEAT TRANSFER COEFFICIENTS.
JJ = KK PP = X( J J1-XHI) AHA=SUMA/BB AHP=SUMR/9B A = T A ! U I - T S f i l l B=TA( J J l -TS! JJ1 C * « - P D = A/B IF1A.E0.BI GO TO 161 T=C/«LOGID) GC TC 162
161 T= A HRS LOGARITHM MEAN GAS/SOLID HTC HBW LOGARITHM MEAN GAS/WALL HTC.
162 HPS=SUM1/T/SGL/BB HP S2=SUM4/1/SGL/BB HBS7=SUM7/T/SGL/BB WRITE(6,177) A.B.T.HBS7
177 FCRMAT(/2X,'AIR - SCLIO: DEL T l - ' . F S . l , * DEL T 2 » « , F 5 . 1' LOG T * » , F 5 . 1 , » AIP-SCLIO H T C = « . F 5 . 2 1 A=TA(JJ)-TW(JJ) R=TMI! l-TW! II 1 C = A-B c=A/e IFfA.EO.BI GO TO 163 T=C/ALOG(D» GC TO 164
163 T = A 164 HBW3=SUM3/T/ARC/BB
HPV=SUM2/T/ARC/BB
AHA
AHB

PATSUM=SUM4/SUM5 HPW8=SUH8/T/ARC/BB WRITEI6.178) A,8,T,HBH8
178 FCPMATI/2X,*AIR - WALL I OEF T l = • f F 5 . 1 , • OEL T 2 » « , F 5 . 1 1' LCG T = ' , F 5 . l , « AIR - WALL H T C » ' , F 5 . 2 )
WRITEI6.173) WRTTFI6.10I HBS,HBW,«HA,AHB,HBS2,H8W3,RATSUM,HBS7,HBW8
C C C TFE FOLLCWING IS TO CALCULATE NUSSELT NUMBER C ANC PFYNCLCS NUMBER. C C AK AIR THERMAL CONDUCT!VITY, J/S M K C VIS AIR VISCOSITY, N S/M2 C T AIR AVERAGE TEMPERATURE IN TEST SECTION C PE REYNOLDS NO., V*OEN*DE/VIC C = WA/VIC/DE/4./PIE/1600. C NU NUSSELT NC. , HETRA*OE/AK C DE EQUIVALENT DIAMETER OF KILN, M C C
T=(TA( JJ (*TA(II M / 2 . 0 TAA = T TSS = (TS<H) + TS( J J ) ) /2 .0 TWW=tTW(11)*TW(JJ I I /2 .C T=ITAA*TSS)/2.0 CALL PROPTYtT,AK.VIS.OEN)
C PIE=3.142
REW=E./6C.*PIE*DE *OE *ROT*DEN/V!S RE = WA/VIS/P !E/OE/3*600.*4. NU = I-PS*CE/AK TTT=(TAA*TWW»/2.0 CALL PRrPTY(TTT,AK,VIS,DENl WNU=HBW*OE/AK WRITEI6.126I P.E.NU.WNU
126 FCPMAT(///5X,12HREYNOLOS N0. .1PE12.3/ 15X,12HNUSSELT NO.,1PE12.3,1PE12.31 WPITEIIO,121) RUN,WA,ROT,WS.RIN,HCLDUP
121 F O P « A T ( l X , A 5 , F 5 . 1 , F 6 . 2 , 3 X . 3 F ? . l ) WP.ITFI 11,122) RUN,HBS7,HBW8,RE,NU,WN'U,REW
122 F0PMAT(1X,A5,6F12.2) 1111 CONTINUE
WRITEI6.129) 129 FORMAT 11H1)
C C C PICT TEMPERATURE PROFILES VS. KILN LENGTH. C
CALL KILNPLOT(RUN,WA,ROT.WS,RIN,HOLOUP) C
1001 STOP END
C c C SUBROUTINE THETA TO CALCULATE CENTRAL ANGLE OF THE BED. C c
SUBROUTINE THETAIX,F,DERF.FCT,XST,EPS,I END,IER,PER) IFR = 0 X=XST TCL=X CALL FCTITOL,F,OERF,PER I TOLF=100.*EPS CC 6 I=1,1END IF(F) 1,7,1
1 IF(DERF)2,8,2 2 C X = F/PER F
X=X-0X TOL = X CALL FCT(TCL,F,DERF,PER) TCl=EPS A=A8<(X ) IF (A- l .O) 4,4,3
3 TCl=TCL*A 4 !FtARS(nx>-TOL) 5,5,6 5 IFI«eS(F)-TOLF) 7,7,6 6 CCNTINUE
IFR=1 . 7 RETURN
8 IFR = ? RETURN END
C C C FUNCTION FOR CENTRAL ANGLE CALCULATION. C C
SUBROUTINE FCTIX,F,DERF,PER) PIE=3.14159 F=X-SIN(2.*X)/2.0-PER*P!E DERF=1.-C0S(2.*X) RETURN END
C C C SUBROUTINE PROPTY TO CLACULATE AIR PROPERTY. C c
NO

SUBROUTINE PROPTYIX,AKK,AVIS,ADEN I DI»"ENSICN TI2Ol,OENI2O),CPGI2OI,VIS(20l,VKS(20) CIMENSION PI2O),AKl20l,PRI2C>.YF(2O) DC 20 1=1,11
20 REACI7,22I TI I 1 ,DE M J ) ,CPG (f I , VIS I I» ,VKS I I ) , AK (I » , PR 22 FCFMATI7F10.4)
DC 25 1=1,11 VI S(It = VI SI I l » 1 . 0 E - C 5 VKS( I )=VKS(I)*l .0E-03
25 CONTINUE CO 3C 1=1,12 Tl H = (T( I 1*460.1/1.8 OEM T)=OEN(ll*16.018 CPCII)=CPG(I)*0.41B68E*C4 V IS II I = VIS111*1.4882 VKSI II =V*S( I )*0.C929C3 AK 11 )= AK 11 1*1.7308
30 CONTINUE AKK=5A!NT{11,T,AK,X,5,YF1 AV!S=SAINTI l l ,T ,VIS ,X ,5 ,YFI ADEN=SA!NTI11,T,DEN,X.5.YF) RETURN . END
C C c C THIS SUBROUTINE PLOTS THE TEMPERATURE PROFILES C FOR AIR, SANO AND WALL VS. KILN LENGTH POSITION.
SUBROUTINE KILNPLOT(RUN,WA.ROT,WS,RIN.HOLDUPI C C .
DIMENSION XI301,TAI301,TSI30I.TWI301,T!1301 CCMMCN /A/LW,LS,TWE,TIE,TSE,TAE DI"ENSIGN TAEI 81 ,TSE181,TWE18 I,TIEI 81,LSI 81,LWI 8 I DIMENSION S1I30I ,521301 REAL LS.LW ILM = 1
1002 A=2.C B = 0.0 CCC=7.0 CCC=CCC+A CALL PLOT (8 .0 ,0 .0 ,-31 CALL PLOTIC.C ,2 .0 , *1 I CALL PL0TI5.0.A.+21 CALL F L C T ( 5 . C , C C C , * l I CALL PL0T(B,CCC, + 1 I CALL PL0TIR,A,*11 C 00 111=1,6 XX=I-1
CALL SYMBOL IXX,A,0.14,14,180.0,-11 Z=XX*0.5 *>*=XX-0.15 CALL NUMBER IXXX, I .7 ,0 .14 ,Z .0 .0 .1 )
11 CONTINUE C C
Z=250. DC 20 1=1,7 Y=t*l CALL SYMBOL 10.0,Y,0.14,15,180.0,-11 Z=Z+50. IFI I . F O . l 1 GO TO 20 Y=Y-0.14 CALL NUMBER(-0.15,Y,0.14,Z.90. .-11
20 CONTINUE C
CALL PL0TIC.40,1 .5 , *3) CALL SYMBOL 10.40,1.2.C.14, 'DISTANCE FROM SOLID FEED END,'
1' METER',0.0,351 CALL SPLINE(LS,TSE,S2,7,X,TS,S1,IP,10011 CALL SPL!NF(LS,TAE,S2,7,X,TA,S1,IM,10011
C AAAA=3CC. DC 5C 1 = 1.25 XII ) = X ( I ) « X ( I ) TAII ) = (TAU )-AAAA)/50.*A TS 111=(TS!I1-AAAA1/50.+A TMI > = ( TWII I-AAAA1/50. + A T i l I l = ITI( I l -AAAAI/50 . + A
50 CONTINUE C c
OC 40 1=2,6 LSIII=LS(I)+LSII1 TAE I 11 = 1TAEI 1 l-AAAA I/50.+A TSE 111=(TSEI Il-AAAA1/50.*A CALL SYVBOLILSI11,TAE(11,0.14,30,0.0,-1 I CALL SYMROLILSIIl.TSEII 1.0.14,3,0.0,-11 IFII.EQ.6I GO TO 40 LW(II=LW(I)*LW(I) TWEI 11=1TWEIIl-AAAA1/50.*A CALL SYMBOL(LWII 1 .TWEII 1,0.14,2,0.0,-1)
40 CONTINUE C c
CALL PL0T(0.0,TA(l) ,+3) CALL LINE(X,TA,25 , - l ) CALL PLOT(0.0,TS(11,+3) CALL L!NEIX,TS,25,-1)
N3

CALL PLOT(0.0,TW(1),*3) CALL LlNF(X,TW,25,-l)
WWW=B.S CALL SYMPOL(0.5,WWW,0.14,'RUN N O . 1 , 0 . 0 , 3 1 )
CALL SYMBOL(2.96,WWW, 0.14.RUN,0.0,4) www*www-o.2 C A I L SY"BCL(C.5,WWW,0.14 , 'AIR FLCW RATE l . C . 0 , 3 1 )
CALL MJMBER(2.96.WWW.0.14,WA,0.0.1I WWW=WWW-0.2 CALL SY*ROL(0 .5 ,WWW,0.14 , 'SAND THROUGHPUT 1.0 .C.31)
CALL NUMBER I 2. <36, WWW. 0. 14 . VS ,0. C , I ) WWV=WWW-0.2 CAIL SY"B0L(0 .5.WWW,0.14, 'ROTATICKAL SPEED 1 , 0 . 0 , 3 1 )
CALL MIMRER(2.96,WWW,0.14,ROT,0.0,1) WWV<=WWW-0. 2 CALL SYMPOHO.5,WWW,0.14,'INCLINATION ANCLE 1.0 .C31 )
CALL N ,UMBFR(2.96,WWW, 0. 14 , RI N , 0 .0 , I ) WWW=WWW-0.2 CALL JYWBOL (0.5,WWW,0.14, 'DEGREE CF F I L L
1 . C . C . 3 1 I CALL Nll»PER (2.96,WWW, 0. 14, HOLDUP, 0.0, 11 WH.-WWW-0.4 V V V ' C . 5 VVW=0.9 CALL SYMROL(VVV,WWW,0.14,30,0.0,-1) CALL SYMBOL ( W W , WNW.O. 14, 'A IR ',0.0,41 VWW=WWW-0.2 CALL SYMBOL!VVV,WWW,0.14,3,0.0,-1) CALL SYMROL(VVW,WWW,0.14.'SANO',0.0,4) WWW»WV>W-0.2 CAIL SYMBOL!VVV,WVW,0.14,2,0.0,-11
. CALL SYMBOLIVVW.WWW.O.H.'WALL'fO.O,*) C c c c
IF(ILH.EC.4( GO TO 1001 1LP«ILM*1 CC TO 1002
1001 CALL PLOTNO STOP ENO ' • '
EXECUTION TERMINATED
KC/HR •
KG/HR •
RPM •
DEGREE'
X •
tSIGNOFF
K3
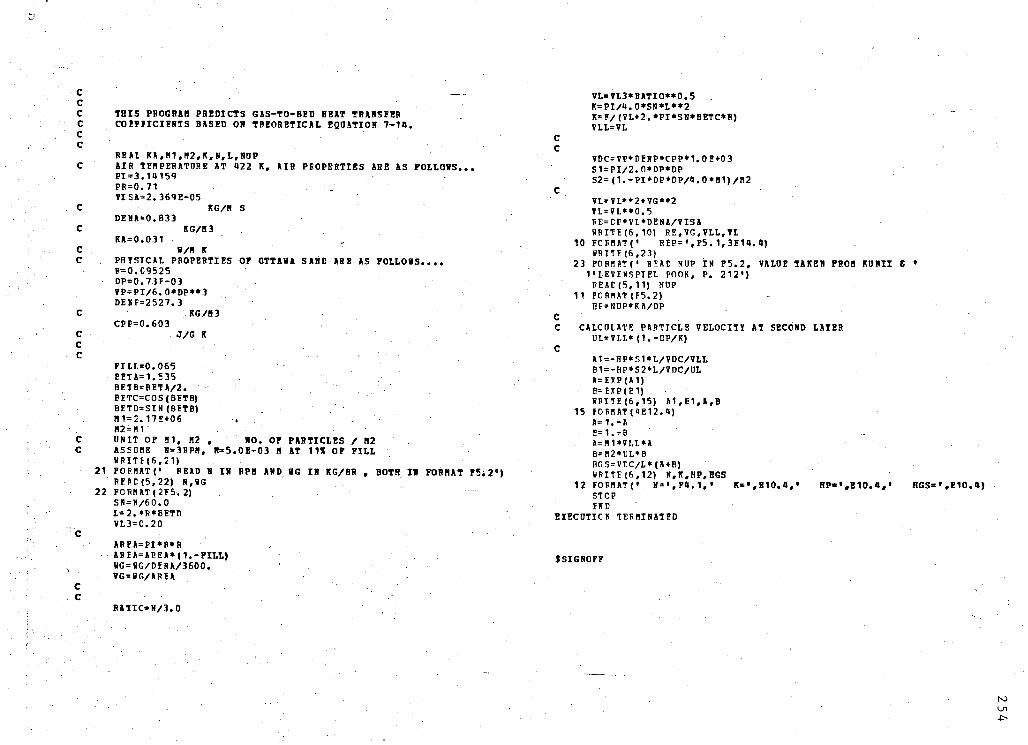
THIS PBCGBAB PREDICTS GAS-TO-BED BEIT TRAHSFER COIPIICIEHTS BASED OR TBEOHETICAL EQOATIOH 7-14.
PEJI KA,H1,B2,K,»,L,R0P AIR TEN PERATORE AT 422 K, AIR PEOPERTIES ARE AS FOLLOWS... PI = 3.14159 PR=0.71 VISA=2. 369E-05
KG/B S DE»A=0.833
KG/H3 KA=0.O31 ,
W/fl K PHTSTCAL PROPERTIES OP OTTAWA SARC ARE AS FOLLOBS.... F=0.09525 DP=0.73E-03 VP=PI/6.0*DP**3 DEKF=2527.3
KG/B3 CPP=0.603
J/G K
FItI.=0.065 EETA=1.535 BETB=BETA/2. BETC=COS(BETB) BETD=SIN (BETB) . H1=2.17E*06 . B2 = BT DBIT OP B1, B2 , RO. OP PARTICLES / H2 ASSURE B=3BPS, R=5.0E-03 B AT 11* OP FILL WRITE(6,21) FORMAT {• BEAD B Ig RPfl ARD RG IH KG/HR , BOTH If FORHAT P5i READ (5, 22) N.SG FORB AT ( 2F5. 2) SR=N/60.0 I=2.*R*8ETD VL3=0.20
AREA=PI*R*R AREA=AREA*( 1 .-FILL) HG=SG/DESA/3600. VG=»G/ARIA
RAlIC=H/3.0
VL=VL3*BATIO**0.5 . K=PI/4.0»SN*L**2 K=F/(VL*2.*PI*SN*BETC*R) VLL=VL
C c
VDC=VP*DEHP*CPP*1.0E*03 S1=PI/2.0*DP*DP S2= (1.-PI*DP*DP/«.0*B1)/B2
C VL=VL**2+VG**2 VL=VL**0.5 RE=CF*VL*DENA/VISA SRITE(6,10) RE,VG,VLL,VL
10 FCFBATf REP=',F5. 1,3E14.4) KRITE (6,23)
23 FOBBATC RHAC NOP IN F5.2, VALUE TAKER FROH KBHII S • 1'LEVENSPIET. BOOK, P. 212') PEAC(5,11) NOP
11 FCRHAT(F5.2) HF=NOP*KA/DP
C C CALCOIATE PARTICLE VELOCITY AT SECOHD LATER
UI=VLL* (1.-DP/K) C
A1=-HP*S1*L/VDC/VLL B1=-HP*S2*L/VDC/OL A=EXP(A1) B=EXP(P1) «BITE(6,15) A1,E1,A,B
15 EORHAT(HE12.U) A=1.-A E=1.TB A=B1*VLL*A B=B2*0L*B HGS=VDC/L*(A+B)
') WRITE(6,12) N.K.BP.HGS 12 FOBBATC H=',F4.1,« ^'.EIO.*,' HP« • ,E10. 4 , • HGS=« ,E10.4)
STOP END
EXECOTICK TERBINATED
SSIGHOF?
to

c c C THIS PHOGHAH IS POH & PLOT OF MtJGS(EXP) VS. HOGS(PRBD) C AND FOB HUGH(EXP) VS. NUGW (PP.ED) . C THB PLOTS ARE SHOIIH IB FIGURES 6-34 6 6-35. C
DI HENSION Y (50) ,X (50) , AA (50) , SS (50) BEAD<5,11) (Y (I) ,X(I) .1=1,44)
11 FORMAT(6X,E12. 4, 12X,B12. 4) CC=2.0 A=0.0 B=5.757 C=0.0 D=5.757 C=C*CC D=D+CC CALL PL0T{3.0,2.0.-3) CAIL PLOT(»,C,*3) CALL PLOT(B,C,*2) CALL PLOT(B,D,*2) CALL PLOT (A, D,*2) CALL PLOT(A,C,»2) AA(1)=5.0 DO 21 1=1,15 AA (1*1) = AA(I) • 1. 0
21 CONTINUE A» ( 17) =25.0 AA (18)=30.0 AA(19) = 40.0 AA(20) = 50.0 AA(21) = 60.0 AA(22)=70.0 DO 85 1=1,»a T(I)=I<I)/50. Y (I) =ALOG (Y (I) ) *2. 5*CC X(I)=X(I)/50. 1(1) =ALOG (X (I)) »2.5
85 CONTINUE C
DO 80 1=1,20 SS(I)=AA(I)/AA(1) SS(I)=AL0G(SS(I))*2.5
80 CONTINUE c
DO 90 1=1,20 CALL SIBBOL(SS(I),C,O. ia,ia,180.0,-1) ZZ = »A(I)*10. GO TO (2,2,2,2,2.2.4,4,4,4,2,4,4,4,4,2,2,2.2.2>.I
4 GO TO 7 2 TX=SS(I)-0. ia
TT=CC-0.20 CALL BOBBER (TX.TY.O. 14,ZZ,0.0,-1)
7 SS (I)-SS(I) »CC CALL STHBOL(A,SS (I) ,0. 14,15,180.0,-1) GO TO (3,3,3,3,3,3,5,5,5,5,3,5,5,5,5,3,3,3,3.3) ,I
5 GO TO 90 3 TX=A-0.14
TY = SS(I)-0.14 CALL NUMBER (TX,TY,0. 14,ZZ, 90. ,-1)
90 CONTINUE CALL SYHBOL(-0. 60,3.0,0.11,'NUSSELT NUMBER, EXPERIMENTAL' 1,90.,28) CALL SYMBOL (1.0,1.2,0. 11,'NUSSELT BOMBER, PHEDICTED',0. 0 ,25)
AA(1)=AA(1) *10.0 DO 95 1=1,15 CALL SYMBOL (X(I) ,1(1) ,0. 14, 1,0. 0,-1)
95 CONTINUE DO 96 1=16,34 CALL SYMBOL (X (I ),Y(I),0.14,0,0.0,-1)
96 CONTINUE DO 97 1=35,44 CALL SYMBOL(X(I) ,Y(I) ,0. 14,2,0.0,-1)
97 CONTINUE CALL PLOT(A,C, »3) CALL PLOT(B,D,*2) DD=C»2.0 BB=B-2.0 EE=EB»0.20 CALL SYMBOL(BB.DD.O.14,1,0.0,-1) CALL SYHBOL.(EE, DD,0. 14, • 17X FILL ',0.0,10) DD=DD-0.25 CALL SYNBOL(BB,DD,0. 14,0,0.0,-1) CALL SYMBOL (EE,DD,0. 14 , ' 1 U • ,0.0,3) DD=DD-0.25 CALL SYMBOL(BB,DD,0.14,2,0.0,-1) CALL SYMBOL (EE, DD, 0. 1 4, ' 6. 5* ' , 0. 0, 4) CALL SYMBOL(0.5,6.8,0. 14,'GAS/SOLID HEAT TR ANSFER " , 0. 0, 23 ) FEAD(5,12) (Y (I) ,X (I) ,1=1,44)
12 FORHAT(42X,E12. 4, 12X.E12.4) ' C C
CC=2.0 A=0.0 B=6.2 C=0.0 D=6.2 C=C*CC D=D*CC
NO

c 99 CONTINUE CALL PLOT(3.0,2.0,-3) CALL PLOT (A, C, • 3) CALL PLOT(B.C.*2) CALL PLOT(B,D, *2) CALL PLOT (A,D,+ 2) CALL PLOT (A.C, *2) AA (1) =5.0
CALL PLOT(A,C,*3) CALL PLOT(B, D,*2) CALL SYBBOL (0.5,6. 8,0.11,'GAS/WALL HEAT TBAHSPEB'.0. 0,23) CALL PLOTND STOP END
EXECUTION TERMINATED DO 22 1=1,15
22 AA (I*1)=AA(I)+1.0 CONTINUE AA (17)=25.0 $COPY *SKIP AA(18) = 30.0 AA (19)=«0.0 AA(20)=50.0 AA (21) =60.0 AA(22)=70.0
DO 91 1=1,20 ZZ=AA(I) CA LL SYBBOL (SS (I),C,0.11,11,180.0,-1) GOTO (1, 1, 1, 1, 1, 1, 6,6,6*6, 1,6,6,6,6,1,1,1,1,1) ,I
6 GO TO 10 1 TI=SS(I) TY=CC-0.20 CALL NUMBER(TI,TY,0.14,ZZ,0.0,-1)
10 SS (I) =SS (I) *CC . CALL SY NBOL (A,SS(I) ,0. 14,15,1 80.0,-1) GO TO (8,8,8,8,8,8,9,9,9,9,8,9,9,9,9,8,8,8,8,8),I
8 GO TO 91 8 TX=A-0. 14 TY = SS(I) CALL NUBBBR(TX,TY,0.14,ZZ,90. ,-1)
91 CONTINUE CALL SYBBOL (-0. 60,3.0,0. 14,'NUSSELT HOHBEB, EXPERIMENTAL' 1,90.,28) CALL SYMBOL (1.0,1.2,0. 14,' NL3SELT BDHBEH, PBEDICTED', 0. 0, 25) DO 94 1=1,44 X(I)=X (I)/AA(1) Y(I)=Y(I)/AA(1) X (I)=ALOG (X (I) ) *2.5 I (I) = ALOG (Y (I) ) *2. 5+CC
94 CONTINUE DO 99 1=1,44 CALL SYBBOL (X(I) ,1(1), 0.14,2,0.0,-1)
C
81
DO 81 1=1,20 SS (I) =AA (I) /AA (1) SS (I) = ALOG(SS(I)) * 2 .5 CONTINUE
C

EXPERIMENTAL DATA
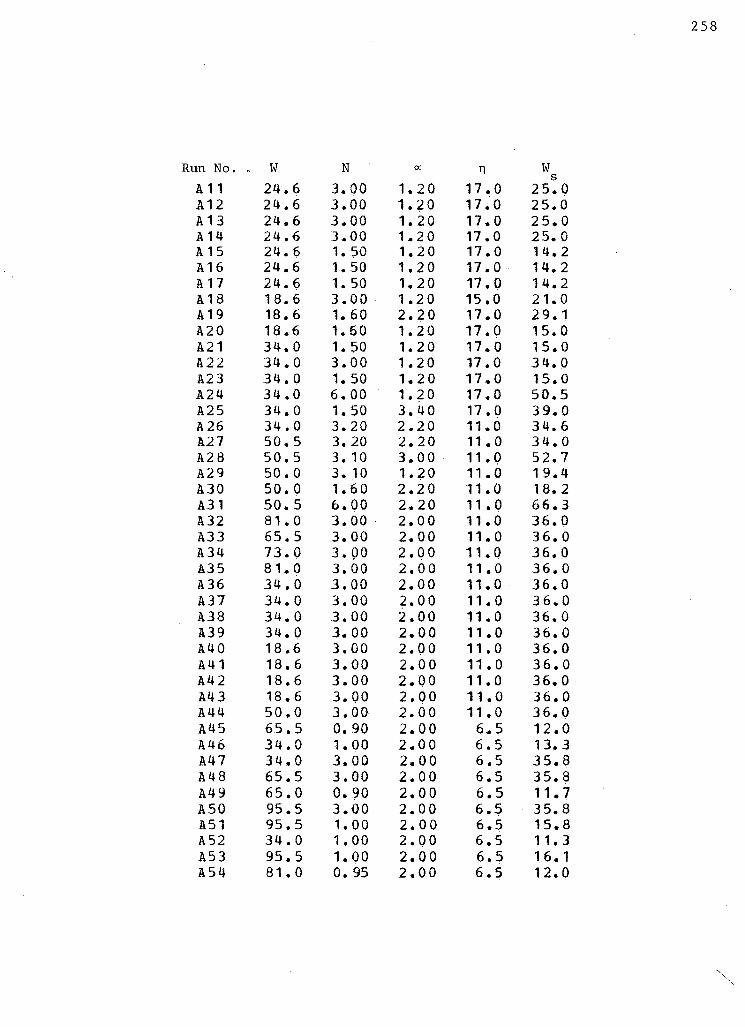
Run No. . A 1 1 A 1 2 A 1 3 A 1 4 A 1 5 A 1 6 A 1 7 A 1 8 A 1 9 A 2 0 A 2 1 A 2 2 A 2 3 A 2 4 A 2 5 A 2 6 A 2 7 A 2 8 A 2 9 A 3 0 A 3 1 A 3 2 A 3 3 A 3 4 A 3 5 A 3 6 A 3 7 A 3 8 A 3 9 A 4 0 A 4 1 A 4 2 A 4 3 A 4 4 A 4 5 A 4 6 A 4 7 A 4 8 A 4 9 A 5 0 A 5 1 A 5 2 A 5 3 A 5 4
W 2 4 . 6 2 4 . 6 2 4 . 6 2 4 . 6 2 4 . 6 2 4 . 6 2 4 . 6 1 8 . 6 1 8 . 6 1 8 . 6 3 4 . 0 3 4 . 0 3 4 . 0 3 4 . 0 3 4 . 0 3 4 . 0 5 0 . 5 5 0 . 5 5 0 . 0 5 0 . 0 5 0 . 5 8 1 . 0 6 5 , 5 7 3 . 0 8 1 . 0 3 4 . 0 3 4 . 0 3 4 . 0 3 4 . 0 1 8 . 6 1 8 . 6 1 8 . 6 1 8 . 6 5 0 . 0 6 5 . 5 3 4 . 0 3 4 . 0 6 5 . 5 6 5 . 0 9 5 . 5 9 5 . 5 3 4 . 0 9 5 . 5 8 1 . 0
N 3 . 0 0 3 . 0 0 3 . 0 0 3 . 0 0 1 . 5 0 1 . 5 0 1 . 5 0 3 . 0 0 1 . 6 0 1 . 6 0 1 . 5 0 3 . 0 0 1 . 5 0 6 , 0 0 1 . 5 0 3 . 2 0 3 . 2 0 3 . 1 0 3 . 1 0 1 . 6 0 6 . 0 0 3 . 0 0 3 . 0 0 3 . 0 0 3 . 0 0 3 . 0 0 3 . 0 0 3 , 0 0 3 . 0 0 3 . 0 0 3 . 0 0 3 . 0 0 3 . 0 0 3 . 0 0 0 . 9 0 1 . 0 0 3 . 0 0 3 . 0 0 0 . 9 0 3 . 0 0 1 . 0 0 1 . 0 0 1 . 0 0 0 . 9 5
1 . 2 0 1 . 2 0 1 . 2 0 1 , 2 0 1 . 2 0 1 . 2 0 1 . 2 0 1 . 2 0 2 . 2 0 1 . 2 0 1 , 2 0 1 . 2 0 1 . 2 0 1 . 2 0 3 . 4 0 2 . 2 0 2 . 2 0 3 . 0 0 1 . 2 0 2 . 2 0 2 . 2 0 2 . 0 0 2 . 0 0 2 . 0 0 2 . 0 0 2 . 0 0 2 . 0 0 2 . 0 0 2 . 0 0 2 . 0 0 2 . 0 0 2 . 0 0 2 . 0 0 2 . 0 0 2 . 0 0 2 . 0 0 2 . 0 0 2 . 0 0 2 . 0 0 2 . 0 0 2 . 0 0 2 . 0 0 2 . 0 0 2 . 0 0
n
1 7 . 0 1 7 . 0 1 7 . 0 1 7 . 0 1 7 . 0 1 7 . 0 1 7 . 0 1 5 . 0 1 7 . 0 1 7 . 0 1 7 . 0 1 7 . 0 1 7 . 0 1 7 . 0 1 7 . 0 1 1 . 0 1 1 . 0 1 1 . 0 1 1 . 0 1 1 . 0 1 1 . 0 1 1 . 0 1 1 . 0 1 1 . 0 1 1 . 0 1 1 . 0 1 1 . 0 1 1 . 0 1 1 . 0 1 1 . 0 1 1 . 0 1 1 . 0 1 1 . 0 1 1 . 0 6 . 5 6 . 5 6 . 5 6 . 5 6 . 5 6 . 5 6 . 5 6 . 5 6 . 5 6 . 5
W 2 5 . 0 2 5 . 0 2 5 . 0 2 5 . 0 1 4 . 2 1 4 . 2 1 4 . 2 2 1 . 0 2 9 . 1 1 5 . 0 1 5 . 0 3 4 . 0 1 5 . 0 5 0 . 5 3 9 . 0 3 4 . 6 3 4 . 0 5 2 . 7 1 9 . 4 1 8 . 2 6 6 . 3 3 6 . 0 3 6 . 0 3 6 . 0 3 6 . 0 3 6 . 0 3 6 , 0 3 6 . 0 3 6 . 0 3 6 . 0 3 6 . 0 3 6 . 0 3 6 . 0 3 6 . 0 1 2 . 0 1 3 . 3 3 5 . 8 3 5 . 8 1 1 . 7 3 5 . 8 1 5 . 8 1 1 . 3 1 6 . 1 1 2 . 0

P u n . N o . A l l A12 A13 A 14 A15 A16 A17 A18 A19 A20 A21 A22 A23 A24 A25 A26 A27
• A28 A29 A 30 A31 A3 2 A33 A34 A35 A36 A37 A38 A39 A40 A41 A42 A 43 A44 A45 A46 A47 A48 A49 A50 A51 A52 A53 A54
Ta]_ 450.0 425.0 '402.0 372.0 330.6 414.0 470.0 351.5 350. 0 365. 0 380.0 368. 0 383.0 357.0 361.0 370.0 369.0 361.0 376.0 378. 0 353.0 407.0 393.0 396.2 396. 8 366. 7 420.0 395. 0 420.6 385.6 358.3 351.7 375. 6 3 98.0 412.0 382. 1 367.8 400.0 419.0 404.0 406. 6 384. 0 403,3 419.0
Ta 2
486.0 460.0 423.0 392.0 340.0 438.0 505.0 378.9 3 75.1 392.8 393 .0 388.0 400.8 374.0 377.2 385.0 380. 0 371.0 386 .0 388. 0 365.0 417 407 412 411 380 446 .4 417.0 446.5 417.0 376. 0 360.0 400.0 416.7 425.0 397.2 332.2 408.0 427.0 410.2 412 3 98 409 42 7
T a 3 524.0 489.0 457.0 411.0 348.3 462.0 543. 0 412.2 405.0 427.2 418.0 407.0 418.0 390 391 393 388 381 396 .0 399. 0 375.6 426.1 418. 3 423.3 422.2 395.6 476.7 44 0.6 475.0 461 .1 410. 6 384.4 440.0 433.9 434.4 413.3 398.9 420.6 435. 0 417.2 41 7.6 416.7 414.4 434.4
T3^ 574.0 535.0 493.0 436.0 358.8 494 594 44 5 44 3 464 435 428.0 437.0 407 .0 410.0 414.0 401 .0 395.0 405 .0 410.0 387.5 437 .5 431.0 436.0 433 .0 415.0 513.3 471 .0 512.3 510.0 447. 0 413.5 473 .3 452.5 441.1 427.3 416.0 432 .3 442.3 424.0 422 .3 428.0 413.5 442 .0
T a 5 635.3 592.0 538.0 457.3 372.0 535 .0 652. 0 488.0 497 .3 507. 0 455.0 455.3 456.0 430.0 430.0 43 7.0 4L3.3 41 0.0 417.0 420.5 404. 5 45 0.0 445.0 44 8.9 4 4 4.4 441 .0 560.0 535.3 55 9. 0 550.0 505. 0 460.0 5 3 5.3 475.0 44 8.3 4*4.3 441. 0 447.0 44 8.0 431.0 42 7 .0 443. 0 422.8 45 0.0
T S 1 334.0 323.0 321.0 314.0 306. 7 341.0 364. 0 313.9 312.2 330.5 335.0 320.6 337. 8 308.3 305.6 313.8 316.7 312.8 328.9 329.4 308. 3 333 .3 326.1 3 31.7 326.7 311. 1 322.8 318.9 32 3.9 318.3 308.9 306. I 313.3 323.9 361. 1 333.3 312. 8 327.8 368.9 375.0 370.6 335.5 374.4 37 3.3
Ts 2
356.0 3 39.0 3 37.0 3 2 7.0 3 08.9 356.0 3 83.0 325. 6 322.2 3 40.3 346. 1 331.1 348.9 3 15.0 313.6 323. 3 326.1 318.9 339.4 341.1 3 13.9 350.6 341 .7 347. 2 348.9 322. 2 343. 3 334.4 343. 3 331.7 317.8 312. 2 325.0 3 38. 9 373.9 345.6 322.8 341.1 378.3 3 77. 8 3 77.2 348.9 375. 6 381.7
T S 3 378.3 356.0 354.0 341.3 312.8 374.0 410.3 338. 9 332.2 352.8 360. 3 341 .7 365. 0 322.2 322 .2 333.3 334.4 327.9 353.9 357.2 321. 5 366.7 358 .3 362. 7 366.7 3 34.4 369.4 355 .0 369.4 352.0 3 32.2 321.7 345.0 360. 0 391.7 361.7 336.1 360 .0 397 .3 391. 7 390.6 368. 3 388.9 397 .2
Ts 4
431.0 397. 0 392.0 368.0 326. 7 417.0 473.3 363. 9 355.5 3 83.3 384.4 363.3 385.6 3 36.7 333.9 350. 0 351.7 341. 370. 373, 331. 391.1 383. 6 385. 8 388.9 352.2 399.7 3 80.0 400.0 377.8 343.3 336. 1 365.0 384.2 416.7 385.7 352 . 8 332.0 419.4 407. 2 402.7 391.7 4 04.4 413.9
T s 5 521.0 473.3 447.0 405 .0 34S.3 473.0 554.0 402.8 391 .7 4 2 4 . i 411.1 393 .0 412.3 360.0 352.1 376. 1 373 .9 358.9 391.1 394 .4 350.0 417.3 407 .2 412.2 414.2 378 .1 443.0 415.3 44 5.> 428.0 387 .2 366.7 412 .2 419.4 434.4 411.1 380.0 409.4 433 .3 418. 9 418.3 418.9 415.6 435 .3
320.0 3 14 313 308 331 324 341.3 308.0 304.0 315.5 319.4 311.0 321.3 302. 0 330.0 306.0 3 06 . 8 304 320 323 332 321.1 3 13.3 315.8 3 15.8 304.5 312.6 312.4 312.3 311.0 333 .4 299.0 306.0 312.3 339.8 3 14.0 335.3 318.0 349 .6 355. 0 351.4 3 19.3 347.0 351.3
TW2
351.0 333.3 333.0 326.0 305 .3 347.0 373.3 3 2 3.0 317.0 331.3 336. 0 326.6 338 .3 311.6 313.4 321 .6 323.0 315.5 338.8 339.0 313.6 347.4 338 .4 344.0 345.0 321 .7 341 .1 335.4 344.0 333. 0 317.6 312.6 325.0 338 .3 365.0 338.4 323.6 340.2 374.4 374.0 372 .2 341 .5 369. 0 364.4
0V3
397.0 372 .3 353. 0 352.0 316.0 387. 5 425.0 349.0 341.0 363.0 355 .8 349. 6 365 . 3 330. 0 331.0 340.0 341.6 333.3 350.0 363.0 326.0 3 75. 5 367.4 370.0 375. 5 339.3 380. 4 361. 0 383.0 364. 0 335.0 3 2 7.0 352.0 371.3 400.0 369.4 344.2 369. 0 402 .5 395.0 393. 3 373.0 395.0 400.0
TW4
500.0 445 .3 429.3 395. 0 333 .0 447. 0 520.0 335 .3 377. 0 407.0 431 .3 378.0 43 0.0 355.0 360.0 354 .8 366. 0 353.0 330.0 387. 0 346.5 407.0 395.0 402 .3 404. 0 368.0 425. 5 401. 0 425 .5 413.0 372.8 35 5 .8 397. 5 437.0 428 .0 400. 370. 395. 430. 415 .0 413. 0 435.0 413.3 430.0
N3

260
RUN NO. A l l dT dT g s V * > T s ( x ) V X ) dx~ d l T q « C X > q g s ( K ) q a ( x ) qgw ( x )
1.25 520.0 378.0 373.2 34.8 65.1 339.5 446.5 598.4 151.3 1.30 524.4 381.5 377.0 91.9 73.0 381.9 481.1 649.0 167.3 1.40 534.2 389.5 385.4 103.0 87.6 460.3 552.8 728.0 175.1 1.50 544.9 398.9 394.9 109.9 100.4 530.2 619.6 777.4 157.8 1.60 556.0 409.5 405.9 112.6 111.3 591.4 671.2 797.1 125.3 1. 7 8 5 7 6 . 0 4 3 1 . 0 4 3 0 . 4 1 0 6 . 8 1 2 6 . 4 6 7 9 . 5 6 9 3 . 5 7 5 7 . 4 6 3 . 9
I Z = 0.99 SGL= 0.16 ARO 0.41 DE= 0.17 EL= 0.19 \ QSWT=0.4739E+02 QST=0.2801E+03 QGST=0.3275E+03 Q3T=0.3939E+03 0GWT=0.6641E+02 HTCGS=27.0 HTCGW= 2.1 ) RE=2.013F+03 NU=1.202E*02 NUW=1.048E+01 /
RUM NO. A12
1.25 489.0 356. 0 353.9 66.9 48. 3 248. 7 1.30 4Q2.5 35 8. 5 356.8 71.4 53.2 274. 7 314. 3 5C2.9 188. 6 1 . 40 500.0 364. 4 363. 1 79.6 63.7 329.7 359. 1 561.1 202. 0 1.50 503.4 3 71.3 370.4 8 6.9 74. 8 389.0 409. 2 6 12.3 203. 5 1.60 517.4 3 79.4 378.9 93.2 86.7 452. 6 46 1.9 657.9 195. 9 1.78 535.0 397. 0 397. 5 102.2 109.7 578.5 566. 5 722.0 155.. 5
Z= 0. 99 SGL = 0.16 ARC = 0.41 0E= 0. 17 EL= 0. 19 1
QSWT = 0. 1072F+02 QST=0.2141E+03 QGST=0.2248E+03 QGT =0.3 240E+03 QGWT-0. 9912F+02 HTCGS = 1 9. 6 HTCGW= 3.4 1 RE=2. 108E+03 NU=9 .350E+01 NUW=1.630E+01
RUN NO. A13
1.25 452.0 354.0 349.9 66.5 48.3 248.6 341.2 466.4 125.2 1.30;455. 4 3 56. 5 3 5 2 . 9 6 9 . 1 5 3 . 5 2 7 5 . 9 3 58. 5 435.C 12 6.5 1.40 462.5 362.4 359.3 73.8 63.2 326.7 395.4 518.2 122.8 1.50 470.1 369.1 366.5 77.7 71.3 372.6 432.2 546.2 114.1 1.60 478.1 376.7 374.4 8C.9 79.3 413.4 465.1 569.0 103.9 1.73 493.0 392.0 390.6 84.8 90.1 473.9 506.3 596.9 90.7
Z = 0 . 9 9 S O T = 0 . 1 6 A R C =0.4 1 D E = 0 . 1 7 E L= 0.19 QSWT=0.3160E+02 QST=0.1974E+03 QGST=0.2 290E+03 QGT=0.2879E+03 QGWT=0.5891E+02 HTCGS=27.2 HTCGW= 2.7 * RE=2.181E+03 NU=1.354E+C2 NUN=1.325E+01

261
RUN NO. A14
1 . 25 411.0 341. 0 33 8.7 40.5 36.8 188. 1 220. 7 283.2 62 .5 1 .30 413.1 342.9 340.9 42.1 40. 2 205. 3 234. 8 294.8 60.0 1 . 40 417.4 347. 3 345.6 45.0 46.3 2 37.6 261.0 3 15.3 54.3 1 . 50 422. 1 352. 2 350.9 47. 5 51.4 264. 5 282. 5 33 2.2 49 .7 1 .60 426.9 357. 5 356.6 49.3 55.5 286.4 297.0 345.6 48. 7 1 . 78 436.0 368. 0 368.7 5 1 .5 60.4 313.3
z = 0 .99 SGL = 0.16 ARC = 0.41 DE= 0. 17 EL = 0. 19 QSWT=0. 9579E+01 QST=0. 1336E+03 QGST = 0.1482 E + 0.3 QGT=0. 1748E+03x
QGWT=0.2658E+02 HTCGS=25.4 HTCGW= 1.8 \ RE=2.330E+03 NU = 1 .327F + 02 NUW=9.943E+00 /_
I /
RUN NO. A15 i
1.25 348 .3 312.8 310.4 19.8 15.6 44.6 73. 1 137.7 64. 6 1.30 349. 3 313. 6 311.3 2 1 .3 17.3 50.8 79. 1 14 3.4 69. 3 1 .40 351 .6 315.6 313.2 23.6 21.9 62 .7 91.6 164.6 73.0 1. 50 354.0 318.0 315.5 2 5.0 2 5.9 74.1 104.2 1 74.0 69.3 1.60 356.6 320. 8 318 . 2 2 5.4 29.6 85.0 115.9 176.6 60.7 1.73 361.0 326.7 324.0 23.5 35 .9 103. 3 135.0 1 c4.0 29.1
Z= 0.99 SGL= 0.16 ARC= 0.41 0E= 0.17 E L= 0.1.9 QSWT=0.1597F+02 QST=0.3979E+02 QGST=0.5576E+02 QGT=0.8792E+02 QGWT=0. 3216E+02 HTCGS=18.9 HTCGW=4.0 RE=2.593F+03 NU = 1.1 10E+02 NUW= 2•3 36E +01
RUN NO. A16
1. 462.0 374. 0 369. 2 45.9 57.2 169. 2 226.4 322.6 96.3 1. 30 464. 3 37 7.0 3 72 .9 4 7.7 64.4 190.8 1. 40 469.3 384. 1 3 80.3 51.4 76.2 226.5 271. 7 361.5 39.9 1. 50 474. 6 392.2 333 .0 55.5 34.4 252. 1 302. 2 3 c, 0 . 6 33.4 1. 60 400.4 400. 9 3 95 .7 60.0 89.0 267.3 328.7 422.2 93.4. 1. 78 492. 0 417. 0 410. 5 68.9 88.5 268. 1 345. 9 4 85.3 139 .4
Z = 6 . 9 9 S G L = 0 . 1 6 A R C = 6 . 4 1 D E =0. 17 EL= 0.19 QSWT = 0. 2655F+02 Q 5T = 0. 12 79E + 03 QGST = 0. 1545E+ 03 QGT=0.2 112E+03 QGWT=0. 5669E + 02 HTCGS = 22. 5 HTCGW= 3.0 RE=2.134E+03 NU=1.119E+02 NUW=1.368E+01

262
RUN NO. A17
1 .25 543.0 410.0 395.9 82.5 81.5 246. 1 523. 3 5E3..5 60.2 1 .30 547.2 414.3 400. 7 85.6 90. 2 272.9 540.9 605. 7 64.7 1 .40 5 56. 1 42 4. 1 411.0 9 1.3 10 5.9 322. 2 579. 8 6 4 6.4 66.6 1 . 50 565.4 435. 4 422 .5 96.3 119.5 365.9 613.6 6 6 2.4 63. 8 1 . AO 575.3 447. 9 435.3 10 0.7 131.0 403 .7 651.8 713.7 61.8 1 .78 594.0 473.0 461.2 106.7 146. 2 4 57.0 68 3. 3 757.9 69.6
z = 0. 99 SGL = 0.16 ARC = 0.41 DE = 0. I 7 E L= 0.19 QSWT = 0. 1.340E+03 QST=0. 19 3 1 E«-03 OG ST= 0. 3 2 70E +03 QG T =0. 3610 E+03 QGWT=0.3397E+02 HTCGS=30.5 HTCGW= 1.1 RE=1.930E+03 NU=1.323E+C2 NUW=4.959E+00
RUN NO. A18
1.25 410.0 338.9 336.3 60.8 32.1 137.5 193.0 32 1 .6 1 .30 413. 1 340. 6 338. 6 6 2. 1 34.6 143.2 191. 1 .3 2 8 .3 ,137. 3 1.40 419.4 344.3 343.2 64.3 39.9 171.4 194. 1 34G .4 146. 3 1. 50 425. 9 348. 6 348.0 66.2 45.7 196. 8 208. 2 350 .6 142 . 3 1.60 432.6 3 53.4 352.9 67.7 52.0 224.6 235.7 358 . 9 123. 2 1.78 445.0 363.9 362.3 69.6 64.6 280.9 316.0 ,365 .2 53. 2
Z= 0. 95 SGL = 0.15 ARC = 0 .42 0E= 0. 17 EL = 0. 18 /
QSWT = 0. 6056E+01 QST=0.1031E+03 QGST=0 .1 142E + 03 QGT = 0. 1.8 52E+03 QGWT = 0. 7107E+02 HTCGS = 18.3 HTCGW= 4.1 RE=1.730E+03 NU = 1 .044E+02 NUW=2.003E+01
RUN NO. A19
1. 25 405.0 3 32. 2 329.2 68.5 29.9 176.7 235. 9 36 1 .9 125 .9 1. 30 408.5 333.3 331 .3 7 1.9 33.7 199.3 249. 1 380 .4 131 .3 1. 40 4 16.0 3 3 7. 5 335. 6 77.8 40. 1 238.2 2 76-0 411 .7 135 .7 1. 50 4 24.0 341. 8 340.1 82.3 45. 1 263. 3 301. 8 435 .6 133 .7 1. 60 432.4 346.5 344.7 85.3 48.6 289. 7 323. 8 451 .9 128 .0 1. 78 448.0 355. 5 353.9 87. 1 51.0 306.0 33 8. 0 462 .1 124 .1
z= 0.99 i SGL = 0.16 ARO 0.41 DE= 0. 17 EL= 0. 19 0SWT=0.1778E+02- QST=0.1381E*03 QGST = 0. 1559E + 03 QGT = 0.2 272E+03 QGWT=0.7127E+0? ' HTCGS=22.4 HTCGW= 3.9 ;
•RE = 1. 776E + 03 NU=1.211E+02 NUW=2.006E+01

RUN NO. A20
1. 25 42 7. 2 352.8 347.2 6 9.0 41.1 126.9 239. 1 365. 6 126. 6 1. 30 430.7 355.0 350.0 69. 1 45. 8 141. 6 241. 5 36 5. 8 124. 3 1. 40 43 7.6 360.0 3 55.7 69.1 53.6 166.2 250. 1 3c6. 5 116. 5 1. 50 444. 5 365. 6 361.8 69.3 59.3 1 84 . 4 261. 2 367. 6 106. 5 1. 60 451.4 371. 8 368.0 69.6 62. 9 196. 4 2 71. 8 369. 1 97. 3 1. 78 464.0 383.3 3 79.7 70.2 64. 1 201.5 272.2 3 12. 100. 6
z = 0. 99 SGL = 0.16 ARC = 0.41 DF= 0. 1 7 FL = 0. 19 GSWT=0.4067F+02 QST = 0.9447E + 02 QGST=0.1351E+03 QGT^O. 1952E+03 QGWT=0.6008E+02 HTCGS=20.6 HTCGW= 3.4 PE=1.700E+03 NU=1.076E+02 NUW=1.656E+01
RUN NO. A21
1 . 25 418.0 360.3 351.2 3 5.8 36.3 112. 6 29Q. 7 346.6 55 .9 1.30 419.8 362.2 353. 8 35.2 38.8 120. 5 235. 1 34C.9 55 . 8 1. 40 423. 2 366. 3 359. 1 3 4.3 43.0 133.9 27 4.6 331.3 57 .3 1.50 426.6 370. 8 364.7 33.7 46. 3 144.2 263. 8 32 5. S 62 .0 1.60 430.0 3 75 . 5 370.4 33.3 48.5 151.5 2 51.3 322.9 71 , 1 1. 78 436.0 384.4 380.9 3 3.6 49.9 156. 8 224.6 3 25.4 100 .8
Z= 0.99 SGL = 0.16 ARC = 0.41 0E= 0.17 EL= 0. 19 \ QSWT = 0. 6340E+02 Q ST =0.7490E+02 QGST = 0.1384E+03 QGT = 0.1745E+03 QGWT = 0. 3611E+02 HTCGS =30. 0 HTCGW = 2.7 RE = 3. 15 1E+03 NU = 1 . 550E+02 NUW=1.445E+01
RUN NC. A22
1.25 407.0 341.7 339.0 34.9 29.5 204.8 264.7 337.5 72.8 1 7 3 0 4 0 8. 3 3 4 3 . 3 3 4 1 . 0 3 5 . 5 3 2 . 7 2 2 7 . 6 2 7 8 . 5 3 4 2 . 9 64 .4 1.40 412.4 346.3 344.9 36.9 33.1 265.7 308.1 357.0 48.9 1.50 416.2 350.3 343.8 33.8 42.0 293.6 333.4 375.2 36.8 1.60 420.1 355.2 352.7 41.1 44.5 311.4 367.1 397.7 30.6 1.78 428.0 363.3 359.8 46.4 45.1 317.5 395.1 448.9 53.9
Z = 0 . 9 9 S G L = 6.16 AR C = 6.41 0E= 0.17 EL= 0.19 QSWT=0.2375E+02 QST=0.1503E+03 QGST=0.1740E + 03 QGT = 0.2 035E+03 QGWT = Q.2941E+02 HTCGS =31. 7 HTCGW= 2.0 RE=3.247E+03 NU=1.737E+02 NUW=8.804E+00

Z04
RUN NO. A23
1.25 418.0 355.0 355.7 33.2 32.9 102.2 285.3 321.2 35.9 1.30 419.7 366.6 357.8 33.7 33.1 102.8 275.8 326.3 50.5 T740 423.1 370.0 362.3 34.7 34.3 107.0 258.0 336.3 78.3 1.50 426.6 373.6 367.0 35.7 36.9 115.2 243.4 346.0 102.5 1.60 430.2 377.4 372.0 36.7 40.7 127.4 234.6 355.4 120.8 1.78 437.0 385.6 381.0 38.4 50.8 159.8 250.6
7= 0. 99 SGL = 0.16 ARC= 0.41 DE= 0.17 EL= 0.19 QSWT = 0.6797E+0? QST =0.6471E+02 QGST=O.1327fE + 03 QGT =0.1839E+03 QGWT = 0.5125E+02 HTCGS = 30. 1 HTCGW= 4.0 RE = 3. 140E+03 NU=1. 562F+02 NUW=2.050E+01
RUN NO. A24
1.25 390.6 322. 2 321 .1 38.6 1. 30 392. 6 323. 2 322. 7 41.1 21.1 215.6 227.9 397.2 169 .3 1.40 396.9 325. 5 326.0 44.7 24. 6 2 51.7 2 38. 8 431.7 193 o,
. V.'
1. 50 401 .5 328.1 329 .3 46.3 27.6 282.5 251.7 447.6 195 .9 1. 60 406. 1 331.0 332.6 46.0 30. 0 307.9 266. 6 444 .9 178 .3 1.78 414.0 336.7 338.9 4 0.6 33.0 340.0 285. 7 3 92.7 107 .0
Z= 0. 99 SGL = 0.16 ARC = 0.41 0E= 0. 17 E L = 0. 19 QSWT -. 1634F+ 02 GST=0. 1482E+03' QGST=0 . 1319E + 03 1 QGT =0.2247E+03 QGWT = 0.9282E+02 HTCGS = 21.4 HTCGW= 5.9 RE=3.379E+03 NU=1 .212E+02 NUW=3.169E+0l
RUN MO. A25
1.25 391.5 322.2 322.3 29.3 22.0 173.5 170.6 283.1 112.5 1 . 3 0 3 9 3 . 0 3 2 3 . 3 3 2 3 . 8 3 0 . 5 2 3 . 8 1 8 7 . 8 1 7 9. 1 2 9 4 . 2 1 15.1 1.40 396.2 325.9 326.9 32.7 27.4 216.5 197.5 315.5 118.0 1.50 399.5 328.8 330.3 34.7 31.0 245.2 216.3 335.6 116.8 1.60 403.1 332.1 334.1 36.7 34.6 273.9 235.5 354.6 119.1 1.78 410.0 333.9 341.8 39.9 40.9 325.7 263.1 385.9 117.8
1 = 0 . 9 9 S G L = 0 . 1 6 A R C = 0 . 4 1 0 E = 0 . 1 7 E L = 0.19 QSWT=~. 1507E+02 QST = 0. 1 323E+03 QGST = 0.1172E+03 QGT=0. 1786E+03 QGWT = 0.6144F+C2 HTCGS=19. 8 HTCGW= 4. 1 RE=3.331E + 03 NU=1 .084E + 02 NUW=2.313E + 01

265
RUN NO. A26 A
1 .25 398.9 33 3. 3 331 .4 24.6 22. 1 155.7 195. 3 237.6 42.3 1 . 30 400. 1 334.4 332. 9 24. 5 23.3 164. 0 195.3 236.9 41 .1 1 .40 402.6 336.9 336.0 2 5.2 26.2 184. 9 203. 0 24 3.2 40. 1 1 . 50 405.2 339.7 339.3 26.9 29.9 211.5 219. 5 259.8 40.3
246.2 266.8 40.7 1 .78 414.0 350.0 349.6 37.4 44.6 317.2
Z = 0.84 SCO 0.14 ARO 0.44 0E = 0.17 EL= 0.16 QSWT=0.4212E+01 QST=0.1185E+03 QGST=0.1228E+03 QGT=0.1467E+03 QGWT = 0.2396E+-02 HTCGS=25.1 HTCGW= 1.6 RO3.159E + 03 NU=1.472E+02 NUW= 7. 930E + 00
RUN NO. A2T
1. 25 388.9 334.4 333.2 2 1.3 1. 30 390 .0 335.9 334.7 22.7 31.0 214.8 233. 0 3 2 6.0 88. 1 1. 40 392.4 339. 2 337.8 24.5 35.3 245.3 273. 5 351.8 • 78.3 1. 50 394.9 342. 8 341.0 24. 8 36. 5 253. 7 291.9 3 5 5.1 63 .2 1. 60 3 97.3 346. 4 344. 1 2 3.4 34.4 239.9 286. 3 3 3 6.0 49. 7 1. 78 401.0 351. 7 350.3 1.7.1 22.7 158,7 188. 3 245.0 56 .7
Z= 0.84 SGO 0.14 ARO 0.44 DE= 0.17 EL= 0.16 QSWT-0.2025E+02 QS T = 0. 1 1 87E + 03 QGST=0.1389E+03 QGT=0.1719E+0 3 QGWT=0.3295F+02 HTCGS=35.6 HTCGW= 2.7 RE=4.74?E+03 NU = 2 .024E + 02 NUW=1.643E+01
RUN NO. A23
38.9 1 .30 382.3 329. 0 326.7 23.5 49.6 1 .40 384.7 331. 3 329.5 25.1 23.9 2 55.9 293. 7 359.6 66.0 1 . 50 387.3 333.8 332 .4 26.4 25.6 274.2 30 2. 6 3 7 8 .2 75.6 1 .60 390. 0 336. 4 335.5 2 7.4 27.4 2 94. 4 314. 3 392.8 73 .5 1 .78 395.0 341.7 341 . 3 28.5 31.2 335. 6 344. 7 4C8.6 64.0
Z=0. 8 4 S G l . = 0 . 1 4 A R O 0 . 4 4 6 . 6 = 0.17 E O 0.16 Q.SWT=0. 1505F + 02 QST=0. U82E + 03 QGST=0. 1633E+03 QGT = 0. 1989E+03 QGWT=0.356?F+02 HTCGS =40.7 HTCGW= 2.8 RE = 4. 81 7E+03 NU = 2 ..390E + 02 NUW= 1. 645E+ 01

zoo
RUN NO. A29
1.25 396.0 353.9 351.0 19.0 30.0 119.9 178.4 270.4 92.0 1.30 397.0 355.4 352.8 19.0 30.4 121.3 174.9 270.3 95.4 1.40 398.9 358.5 356.2 19.0 30.9 123.9 170.3 269.6 98.8 1.50 400.7 361.6 359.4 18.9 31.5 126.3 171.5 263.6 97.2 1.60 402.6 364.8 362.4 18.8 32.0 128.5 177.6 267.3 39.7 1 . 7 3 4 0 6 . 0 3 7 0 . 6 3 6 7 . 5 1 8 . 6 3 2 . 7 , 132.0194. 6 2 6 4 . 0 6 9 . 4
Z= 0.84 SGl.= 0.14 ARO 0.44 0E= 0.17 E L= 0.16 QSWT=0.2393E+02 Q S T= 0 . 67 C0E + 02 QGST=0.9093E+02 QGT=0.1420E+03 0GWT=0.5110E+02 HTCGS=31.2 HTCGW= 5.3 RE=4.573E + 03 NU=1.824E+02 NUV* = 2 . 800E+ 01
RUN NU. A~30
1. 2 5 3 9 9 . 0 3 5 7 . 2 3 4 9 . 3 2 2 . 2 3 0 . 7 1 1 5 . 1 2 4 9 . 8 3 1 5 . 4 6 5 . 6 1.30 400.1 353.7 351.5 21.8 30.2 113.6 244.6 310.2 65.5 1.40 402.3 361.7 355.1 21.2 30.0 112.7 232.1 3C1.1 69.0 T750 404.. 3 364. 7 359. 1 2~077 30T5 114.8 216.3 2 9 3.3 77 .5 1.60 406.4 367.8 363.6 20.3 31.7 119.9 197.5 263.3 90.8 1.78 410.0 373.9 372.1 19.9 36.0 136.5 163.9 282.8 113.9
Z= 0.84 SGL= 0.14 ARO 0.44 DE = 0.17 EL= 0.16 QSttT = 0. 5376E+Q2 QS T=0 .6322 E + 02 QGST = 0. 1 1 70E+03 QGT=0. 1 564E+03 QGWT = 0. 3947F. + 02 HTCGS=39.9 HTCGW= 3.9 RE=4.541E+03 NU=2.148E+02 N'JW= 2. 472E + 01
RUN NO. A31
1. ?5 375.6 321.5 320. 1 2 1.3 16. 7 223.9 255. 1 3 04.7 49.6 i . 30 3 76.7 322.4 321.1 22.2 17. 3 232.2 I . 40 3 79. 0 324. 1 3 2 3.2 23.4 18. 4 247.0 267. 5 334.6 67.1 i . 50 331.3 326.0 325. 5 23.6 19. 3 259. 5 271. 1 3 27.9 66.8 i . 60 383.7 323.0 3 23.0 22.9 20. 1 269. 7 269. 1 327.9 58.7 I . 78 387. 5 331. 7 33 3.2 19.3 21. 0 282.3 247. 7 276.1 28 .4
2 = 0 . 3 4 S G L = 0 . 1 4 : A R C = 0 . 4 4 D E = 0 . 1 7 E L = 0 . 16 QSWT=0.6145E+0l QST=0.1363E+03 QGST=0.1430E+03 QGT=0.1695E+03 QGWT = 0.2649E + 02 HTCGS=34. 5 HTCGW= 2.1 RE=4.891L + 03 MU=2.011E + 02. NUW=1.392 E +01

267
RUN NO. A3?
1. 25 426. 1 366. 7 3 62.9 17.8 38.3 285.7 36 2. 2 41 1.2 48 .9 -1. 30 427.0 368. 7 365. 2 1 8.9 40. 8 305.1 375.2 43 5.9 60 .7 1. 40 429.0 373.0 369.9 20.7 44.9 3 36. 1 399. 4 476.8 77 .4 1. 50 431. 1 377. 6 374.6 2 1 .9 47. 5 3 56. 5 413.4 5 06.3 37 .8
43 3. 4 382.4 3 79.3 22.7 48. 6 366.3 4 2 8. S 5 24.3 95 .3. 1. 78 437.5 391. 1 3 88.2 22.9
z= 0. 84 SGL = 0.14 ARC = 0.4 4 DE = 0. 17 FL= 0. 16 QSWT=0.3232E+02 QST=0.1026£ +03 QGST=0.2155E+03OGT=0.2622E+03 QGWT=0.4671E+02 HTCGS=54.3 HTCGW= 3.6 RE=7.053E+03 NJ = 2 .944E + 02 NUW=1.908E+01
RUN NO. A33
1.25 413.3 358.3 3^4.8 2 1.8 36.4 1 .30 419.4 360. 2 357.2 22.5 37.9 282.2 342.0 418.7 76 .6 1. 40 421.7 364. 1 3 61. 9 23.5 40.6 302.6 346.9 438.5 91 .6 1 . 50 424. 1 363. 3 3 66. 5 24.3 42.6 313.2 3 5 3. 9 452.3 9 3 .4 1.60 426.5 372.6 371.0 24.7 43.9 329.2 362.2 460. 1 97 .9
380. 6 370.9 24.6 44. 8 336.8 371. 2 459.1 37 .9
Z= 0. 84 SGL = = 0.14 ARC = 0 .44 DE= 0.17 EL= 0 . 16 QSWT = 0. 1890E+02 QST=0.1664E+03 QGST=0. 18 53E+03 . QGT = 0.2364E+03 QGWT = 0. 5106E+0 12 HTCGS =44. 7 HTCGW= 3.8 RE=5. 803E + 03 NU= 2.487E+02 NUW=1.972E+01
RUN NO. A34
1.25 423.3 362.7 358.4 21.1 35.7 266.2 354.5 437.6 83.1 1 . 3 0 4 2 4 . 4 3 6 4 . " 5 3 6 0 . 4 2 2 . 6 3 7 . 7 2 8 1 . 1 3 6 4 . : 9 4 5 8 . 1 9 3 .2 1.40 426.7 368.5 364.6 23.6 41.1 307.5 385.7 490.1 104.4 1.50 429.1 372.7 369.1 24.5 44.0 329.3 403.8 510.2 106.3 1.60 431.6 377.3 373.S 24.9 46.1 346.6 415.9 518.3 102.4 1.78 436.0 385.8 383.1 24.2 48.5 365.9 420.8 502.9 82.1
Z = 0 . P 4 S G L = 0 . 1 4 A R C '=6' . 4 4 D F = 0 . 1 7 E L =0. 16 QS^T=0.3949E+02 QST=0. 1729E+03 QGST=0.2124E+03 QGT =0. 2631E+03 QGWT=0. 5078E+02 HTCGS = 51 . 0 HTCGW= 3.7 RE=6.404E+03 MU=2.756E+02 NUW=2.072E+01

268
RUN NO. • A35
1.25 422.2 366.7 362.3 19.7 34.4 256.6 346.0 454.5 108.5 1.30 423.2 368.5 364.8 19.8 35.9 268.3 342.9 457.1 114.2 1.40 425.2 372.2 369.7 20.1 38.8 290.9 341.5 462.5 121.0 1.50 427.2 376.2 374.5 20.3 41.6 312.6 346.7 468.5 121.8 1.60 429.2 380.5 379.3 20.6 44.3 333.4 353.3 474.9 116.7 1. 7 8 4 33. 0 3 8 8. 9 3 87. 7 2 1 . 1 4 8 . "7368. 5 3 9 3 . 0 4 8 7 . 8 9 4 . 8
Z = 0.84 SGL= 0.14 ARP 0.44 DE = 0.17 EL= 0.16 QSWT=0.1805F+02 QST=0. 1667E+03 QGST=0.1848E+03 QGT =0. 249 IE+ 03 QGWT=0.6435E+02 HTCGS=49.5 HTCGW= 5.3 RE=7.096E+03 NU=2.739E+02 NUW=2.706E + 01
RUN NO. A36
1 .25 395.6 334.4 330.6 3 1.7 1.30 397.2 335. a 33 2.0 32.6 29. 0 212.3 2 89. 1 314.8 25.7 1.40 400.6 338. 8 335.0 34.4 31. 5 231. 4 309. 4 332.3 22.9 1 . 50 404. 1 342. 1 333.3 36.3 33. 7 248.0 325. 3 3 5 0.3 25.0 1 . 60 407. 3 345. 6 342. 0 3 8.2 35. 5 262. 1 334.3 368.9 34 .6 1.78 415.0 352.2 349. 8 41.7 38. 0 281.2 3 30. 9 403.8 72.9
Z= 0.84 SGL= 0.14 ARC= 0.44 DF= 0.17 EL= 0.16 QSWT=0.409SE+02 QST=0.1309E+03 QGST = 0.17 19E+03 QGT=0. 1875E + 03 QGWT=0.1562E+02 HTCGS=36.8 HTCGW= 1.0 RE=3.157E+03 NU=2.066E+02 NUW=7.145E+00
RUN NO. A37
1.25 476.7 369.4 362.1 62.1 52.1 390.0 537.2 604.1 66.9 1. 3 6 4 7 9 . 8 3 7 2 . 0 3 6 5 . 5 6 2 . 9 5 2 . 1 3 9 0 . 5 5 2 3 . 1 6 11 .4 33.3 1.40 466.2 377.3 372.2 64.8 53.1 398.7 500.9 630.4 129.5 1.50 492.8 382.7 379.0 67.3 55.3 416.4 490.0 655.4 165.4 1.60 499.7 338.4 385.9 70.5 58.7 443.8 494.2 686.5 192.3 1.78 513.0 399.7 398.4 77.7 68.1 517.9 544.3 757.5 213.2
Z = 0 . 8 4 S G L = 6 . 1 4 A R C = 0 . 4 4 D E = 6 . 1 7 E L= 6.16 QSWT=0.3904E+0? 0ST=0.2293E+03 QGST=0.2683E+03 QGT=0.3538E+03 QGWT--=0.8550E + 02 hTCGS=32.3 HTCGW= 3.2 RE=2.789E+03 NU=1.650E+02 NUW=1.604E+01

269
RUN NO. A33
1.25 440. 6 355. 0 348.4 50.5 • 42. 1 312.6 446.3 469.9 43 .6 1 .30 44 3.2 357. 1 350. 5 52.2 42. 5 315.3 44 9. 2 506. 0 56 .8 1.40 448.5 361.4 355.0 55.1 43.7 3 25. 5 455. 6 534. 7 79 . 1 1 . 50 454. 2 365. 9 359. 9 57.6 45.8 342.0 462. 5 558.8 96 .2
370. 6 365.4 59.6 48.7 364. 7 470. 0 578.3 108 .3 1. 78 471 .0 380.0 376.5 61.9
z= o .84 SGL = 0.14 ARO 0.44 DE= 0. 17 EL = 0. 16 QSWT = 0. 6391E+^2 GS T=O.1872E+03 QGST=0 .2511E+03 QGT= 0.2947E+03 QG WT = 0. 4353E+02 HTCGS = 37. 8 HTCGW= 2.0
NU = 1 .980E + 02 NUW=1.183E+01
RUN NO. A39
1 . 2 5 4 7 5 . 0 3 6 9 . 4 3 6 3 . 2 5 T . ™ 5 4 9 . 3 3 7 2 . 1 4 9 3 . 3 5 6 3.5 70.3 1.30 477.9 371.9 366.2 59.4 49.2 368.8 484.9 577.2 92.3 1.40 484.0 376.8 372.3 62.4 50.2 377.1 469.5 6G6.6 137.1 1.50 490.5 382.0 378.7 67.0 53.8 405.6 473.1 652.3 179.2 1.60 497.5 387.7 385.4 73.3 60.1 454.4 500.2 714.1 214.0 1.78 512.0 400.0 393.4 88.9 78.2 594.8 626.6 866.6 240.0
Z= 0.84 SGL= 0.14 ARC= 0.44 DE= 0.17 EL= 0.16 QSWT=0.3579H+02 QST=Q.2324E+03 QGST=0.2632E+03 QGT=0.3614E+03 QGWT=0.9320E+02 HTCGS=32.7 HTCGW= 3.6 RE=2.792E+03 NU=1.672E+02 NUW=1.791E+01
RUN NO. A40
1. 25 461 .1 352. 0 3 43.3 87.9 38.2 282. 5 353. 0 1. 30 465. 7 353. 9 350. 9 95.0 1. 40 47 5.7 3 57.7 356.5 10 4 . 8 39.3 291. 8 316.4 1. 50 486.4 361 . 9 362 .7 108.6 44.0 327. 6 3 10.7 1. 60 497.2 366. 6 369.5 106. 5 51.9 337.3 3 2 3. 8 1. 78 515.0 377.8 383.2 87.6 74.0 556. 1 447. 1
z = 0. 84 SGL = 0.14 ARO 0.44 0. 16
466.6 108.6 50 4.7 164.1 557.3 240.9 5 7 8.1 267.4 567.2 238.4 4 6 7.1 20.0
QSWT=-.R945E+01 QST=0.1942E+03 QGST=0.1853E+03 QGT=0.2845E+03 QGWT = 0.992 1E + 02 HTCGS=20. 1 HTCGW= 3.5 RE=1.558E+03 NU=1.032E+02 NUW=1.851E+01

270
RUN NO. A41
1. 25 410.6 332. 2 325.7 64. 1 22. 1 162. 1 294.5 338.9 44 .4 1.30 413.7 333. 3 327.0 60.9 20.2 147.6 273. 7 322.3 48 .6 1 .40 419. 7 33 5.2 330. 2 5 8.6 19.7 144.2 246.0 3 10.1 64 . 2 1.50 425.6 337.3 334. 1 6 1.6 23.9 175.2 240.9 3 26.0 85 . 1 1.50
1.78 44 7.0 348. 3 349.7
Z= o .84 SGL = 0.14 ARC = 0 .44 DE= 0. 17 EL = 0. 16 QSWT =0.34836+02 QST =0.1210L+03 QGST=0.1553E+03 QGT — 3. 19 49 E+0 3 QGWT =0.3909E+02 HTCGS = 23. 5 HTCGW= 1.9
NU=1 . 277E+02 NUW=1. 16 IE+ 01
RUN NO. A42
1 .25 384.4 321.7 1.30 3 37.1 322.7 320.6 53.6 19. 1 139. 1 175.7 282.8 107 . 1 1.40 392.4 324. 6 3 23.4 5 2.6 20.7 151. 1 176.9 2 77.7 100 .8 1.50 3 97./ 326.9 326.3 53.0 24.3 177.0 187. 7 2 6 0.3 92 . 5 1.60 403.1 329. 5 329.9 54.9 29.7 216.8 209.2 290.3 31 . 1
336. 1 337.8 61.9 44.2 324. 1 289. 5 327.5 38 .0
Z= 0.84 SGL = 0.14 ARC= 0.44 DE= 0.17 EL= 0 .16 QSWT=0.5679F+01 Q ST=0.1062E+03 QGST=0. 1 119E+03 QGT =0.1543E+03 QGUT=0.4242E+02 HTCGS=21.3 HTCGW= 2.6 RE=l.765E+03 NU= 1.216E+02 NUW=1.612E+01
RUN NO. A43
1.25 440.0 345.0 338.4 74.3 32.4 239.2 372.2 396.6 24.4 1 . 3 0 4 4 3.7346. 6 3 4 0 . 7 7 2 . 3 3 0 . 5 2 2 5 .2344." 4 3 83.3 38. 9 1.40 450.7 349.5 345.5 69.1 29.6 218.6 300.0 366.9 66.9 1.50 457.6 352.6 350.9 68.6 32.5 240.4 275.9 364.1 88.2 1.60 464.5 356.2 356.8 70.6 39.2 291.0 278.3 374.E 96.5 1.73 478.0 365.0 368.9 80.6 61.0 455.4 375.7 428.5 52.8
Z=6 . 8 4 S G L = 6 . 1 4 A R C = 6 . 4 4 D E = 6.17 EL= 0.16 QSWT=0.1880E+02 QST=0.1505E+03 QGST=0.1693E+03 QGT=0.20 28E+03 QGWT=0 . 3350F + 02 HTCGS = 21. 7 HTCGW= 1.4 RF = 1.616E + 03 NU=1. 139E + 02 NUW=8.217E+00

2 7 1
RUN NO. A44
1. 25 433.9 360. 0 356.1 3 1.6 40.2 298.9 3 7 3. 9 45C.4 71. 5 1. 30 435. 5 3 62. 0 353. 8 32.0 39.7 295.2 359. 5 4 5 6.4 96.9 1. 40 43 3.7 36 6.0 364.4 33.1 40. 1 299. 5 331. 6 4 71.7 140.2 1. 50 442. 1 370. 1 369 .9 3 4.5 42.7 319.3 323.0 49 1.6 168.6 1. 60 445. 7 374. 6 3 75.3 3 6.2 47.3 354.7 339.2 516.C 176.3 1. 73 452.5 334.2 385.2 40. 1 60. 8 458. 5 439. 1 571.5 132.4
z= 0.84 SGL = 0.14 ARC = 0.44 DE= 0. 17 E L = 0.16 QSWT=0.1965E+01 QST=0.1824E+03 GGST=0.1844E+03 QGT=0.2655E+03 QGWT=0.3111E+02 HTCGS=34.4 HTCGw= 4.8 RF=4.33 7E+03 NU=1.896E + 02 NUW=2.449E+01
RUN NO. A45
1. 25 434. 4 391.7 3 83.7 14.0 42.5 107.3 224. 3 262.0 37.7 1 , 30 435. 1 393. 9 386.7 14.0 44.6 1 12.8 217. 3 261.6 43.8 1 .40 436.5 398.5 392 .8 13.7 47.7 120.8 204. 8 2 5 6 .3 51.5 1. 50 437. 8 403.4 398. 8 13. 1 49.0 124. 6 191. 3 245.1 53.8 1 .60 439. 1 40 8. 3 404.7 12.2 48. 8 124. 3 176. 5 228.0 51.4 1.78 441 . 1 416. 7 414.5 9.8 44. 1 112.9 145.1 182.4 37.3
Z= 0. 70 SGL = 0.12 ARC = 0.47 DE= 0. 18 EL = 0. 13 QSWT = 0.3534F+02 QST =0.6325E+02 QGST=0 .9358E+02 QGT =0.1246E+03 QGWT = 0.2605E+O2 HTCGS= 46. 6 HTCGW= 2.3 RE=5.345E+03 NU = 2. 551E+0 2 NUW=1.499E+01
RUN NO. A46
1. 25 413. 3 361. 7 355.6 28.2 40. 9 112. 6 20 3. 5 273.2 69.7 1. 30 414.7 363.8 358.2 27.6 43.6 120.0 204.0 266.5 62.5 1. 40 417.4 368.4 363.3 26.5 47.4 130.9 206.4 2 56.4 50 .0 1. 50 420.0 373. 2 363.4 2 5.9 49.3 136.5 203. 7 250.8 42. 1 1. 60 422.6 378. 2 373.4 2 5.8 49.3 136.8 203. 5 249.7 41.2 1. 78 42 7.3 386. 7 382. 2 26.7 44. 4 123.9 190.8 2 58.9 68.1
1= 0.70 SGL = 0.12 ARC = 0.47 DE= 0.18 EL = 0.13 QSWT=0.3827F+02 QST=0.6386E+02 QGST=0.1071E+03 QGT=0.1358E+0 3 QGWT=0.2367E+02 HTCGS=36. 1 HTCGW= 2.3 RE=2.90 5E+03 NU=2.068E+02 NUW=1.245E+01

272
RUN NO. A47
1. 25 398.9 336. 1 334.9 31.1 27.3 199.4 222.0 300.0 78.0 1. 30 400.4 337. 5 336. 5 30.5 27.6 201.2 217.9 294.2 76.3 1. 40 403 .5 340. 3 340 .0 30.1 28.6 208.8 214.1 290.6 76.4 1. 50 40 6.5 343. 2 3 43.5 30.8 30.3 2 2 2.0 217.0 297.5 80.5
409.6 346.4 347. i 3 2.6 32. 8 240. 7 227. 5 3 15.0 87.6 1. fti 416.0 352. 6 354.0
z= 0. 70 SGL = 0.12 ARC = 0.47 0E= 0. 18 EL = 0. 13 QSWT=-.2667E+01 QST=0.1228 E + 03 QGST=0.1202E+03 QG T = 0. 1661E+03 QGWT=0.4592E+02 HTCGS=29.5 HTCGW=3.0 RF=3.036E+03 NU=1.751F + 02 NUH= 1 .JlJiEirtl
RUN NO. A48
1.25 413.0 360. 0 356. 5 24. 1 40.4 298.4 1.30 419.2 362.0 359.0 25.1 40.6 300.9 356.0 46 7.4 111 .4 1.40 421. 8 366. 1 3 63.7 26.5 41 .2 305.4 343. 2 49 3.1 144 .9 1.50 424. 5 370. 3 363. 2 27.2 41.6 309. 3 346. 9 5C6.3 159 .5 1.60 427.2 374.4 372.1 27.2 41.9 312.4 354. 0 5G7. C 153 .0 1. 73 432.0 382. 0 378.7 25.5 42.2 316.2 376. 6 476.7 100 .1
Z = 0. 70 SGL = 0.12 4RC= 0.47 0E= 0. 18 EL= 0. 13 QSWT = 0. 1992E+02 QST=0.1637E+03 QGST=0 . 1836E+03 QGT =0.2 601E+0 3 QGWT = 0. 765 1F + 02 HTCGS = 52. 6 HTCGW= 5.4 RE=5. 5 8 8E + 03 NU = 3.064E+02 NUW=2.870E+01
RUN NO. A49
435.0 397.8 390. 1 15.1 41.6 102.7 214.9 279.3 64.4 1. 30 435.8 399. 9 392.4 1 5.0 1. 40 4 37.2 404. 1 397. 1 14.7 41. 7 10 3.5 206. 0 2 71.7 65.7 1. 50 438.7 408. 2 401 .7 14.1 41.3 102. 7 193. 5 261.6 63.2 1. 60 440. 1 412.3 406.3 13.4 40. 5 100.9 189.0 247.6 5 3.7 1. 78 442.3 419.4 414.6 11.5 38.0 95.0 165. 7 212.5 46.7
Z=0. 7 0 S G L = 0 . 1 2 A R C = 6 . 4 7 D E = 0 . 1 8 E L = 0.13 QSWT=0.5073F+02 QST=0.5360E+02 QGST=0.1044E+03 QGT=0.1349E+03 QGWT=0.3056E + 02 HTCGS =54. 7 . HTCGW= 3.5 RE=5.279E + 03 NU = 2.925E + 02 NUW=1.97 IE + 01

115
RUN NO. ' A50
1.25 417.2 391. 7 385.5 1 1.9 25. 1 189.4 301.3 322.9 21.7 1 .30 417.8 392.9 337.2 1 1.2 23. 1 174. 1 277. 1 304.6 27.6 1 .40 418.3 395. 1 390.7 10.4 20. 1 152.0 231.2 2*1.4 50.1 1.50 419.9 397.0 394. 3 1 0.2 18.7 141.2 190.4 275.9 85.5-
398.8 398.0 10.6 18.8 141.9 156. 8 288.2 131.4 1. 73 423.0 402. 5 4 04. 8 13.1 22.7 171.9
Z = 0. 70 SGL = 0.12 ARP 0.47 DE= 0. 18 EL = 0. 13 QSWT=0. 2607E+02 QST = 0. 82 44E+ 02 QGST=0 . 1 085E +-03 QGT =0 . 1 590E+03 QGWT = 0. 5044E+02 HTCGS=73.1 HTCGW= 8.4 RE=7.978E+03 NU = 3 .903E+02 NUW=5.085E + 01
RUN NO. A51
1 .25 417.6 390. 6 333.9 9.5 24.2 1 . 30 418. 1 391. 8 385.7 9.2 22.6 75. 1 166. 3 249. 1 82.8 1 .40 419.0 393.9 389. 1 8.6 20. 7 69.0 141. 1 233.8 92.8 1 . 50 419.3 396. 0 392 .6 8.2 20.6 68. 8 119. 3 222.4 103. 1 1 . 60 420. 6 398. 1 396.2 7.9 2 2.3 74.4 103. 4 2 14.9 111.5 1 . 78 422.0 402. 7 402.6 7.8 29.7 99. 3 101. 3 211.3 109.9
Z= 0.70 SGL= 0.12 ARC = 0.47 0E= 0.18 EL= 0.13 QSWT=0.2677F+0? QST=0.4077E +02 QGST = 0.6754E + 02 QGT =0.1 199E+03 QGWT=0.5232E+C2 HTCGS=45.5 HTCGW= 8.2 RE=7.933E+03 NU=2.495E+G2 NUW=4.643E+01
RUN NO. A52
1 . 2 5 414.0 368.3 353.9 31.4 42. 6 99.9 239. 7 3C3.4 63.8 1 . 30 415.6 370. 5 361. 6 31.5 43. 5 102. 1 70.6 1 .40 413.7 374.9 366 .9 31.4 44. 6 105. 1 2 2 4.4 3 C 4 . 2 79. 8 1 . 50 421.8 3 79. 4 3 72 .0 30.9 45. 1 106.4 216.2 298.9 82.7 1 .60 424.9 383.8 376.9 2 9.8 44. 7 105. 8 209. 6 288.8 79.2 1 .78 430.0 391. 7 385.5 2 6.7 42. 1 100.1 192. 7 258.8 66. 1
Z=6.7 0 S G L = 0.12 ARC= 6.47 DE= 0.18 EL= 0.13 QSWT=0.5821E+02 QST=0 . 55 12 E + 02 QGST=0 . 11 3 3 E+-03 QGT =0 . 1 545 E+0 3 QGWT=0. 411 5E + 0? HTCGS=41. 8 HTCGW= 3.4 RE=2.333F+03 NU=2.376E+02 NUW=1.862E+01

274
RUN MO. ' A53
1.25 414.4 388.9 384.3 7.5 31.2 105.4 174.7 2G4.3 29.5 1.30 414.B 390.5 386.4 7.2 30.9 104.6 165.0 194.7 29.7 1.40 415.5 393.5 390.5 6.9 30.3 102.7 147.3 166.2 38.3 1.50 416.2 396.5 394.3 7.1 29.5 100.3 133.4 191.7 58.3 1.60 416.9 399.4 397.6 7.8 28.6 97.4 124.2 211.3 87.1 1 . ' 7 8 4 1 3 . 5 4 0 4 . 4 4 0 2 . 6 1 0 . 4 2 6 . 6 9 C . 9 1 1 7 . 5 2 81.9164 .4
Z = 0.70 SGL= 0.12 ARC= 0.47 DE = 0.18 EL = 0.13 QSWT=0.1750E+02 QST=0.5261E+02 QGST=0.7011E+02 QG T =0.1 124E+03 QGWT=0.4234E+02 HTCGS=56.3 HTCGW= 7.7 RE=8.910E+03 NU=3.259E+C2 NUW=4.040E+01
RUN NO. A 54
1 7 2 5 4 3 5 . 6 3 9 7 7 2 3 8 2 . 4 1 3 . 6 3 3 . 9 9 8 . 4 316.7 314.7 2.0 1.30 435.7 399.2 385.6 13.3 40.6 103.0 303.3 306.9 3.1 1.40 437.0 403.4 392.1 12.9 42.3 103.8 275.3 297.2 21.9 1. 50 438.3 40.7.7 1.60 439.5 412.0 1.78 442.0 418.9
3 98.7 12.3 405.1 13.1 415.9 14.4
43.2 110.0 41.7 106.5 34.5 88.4
243. 2 207. 3 133. 3
295.4 52 301.3 • 94 3 31.7 198
.2
.0
.4
Z= 0.70 SGL= 0.12 ARC = 0.47 QSWT=0.7056E+02 Q5T=0.5494E +02
DE= 0.18 EL= QGST=0.1255E+03
0. 13 QG T = 0.1622E+03
QGWT=0.3668E+02 RE=6.582E+03 NU=
HTCGS=64.9 HTCGW= 3-9 3.463E+02 NUW=2.257E+01
RUN MO. A55
1 .25 431.1 394.4 3 8 3.5 18.9 46. 1 56.4 19 2. 9 269.6 76.7 1 .30 432.0 396. 7 3 86.3 18.3 45.0 55. 1 83.5 1 .40 43 3. 9 401. 1 393.3 1 8.2 42.7 52.4 149. 8 259.3 109 .6 1 . 50 435 .7 405. 2 399.4 17.3 40.4 49.6 122.0 24 6.8 124.8 1 .60 43 7.3 409. 1 405.0 16.1 38.0 46.9 9 3.0 2 29.3 131.3 1 .78 440.0 415.6 413.9 13.2 33. 8 41.7 63.4 187.6 124.2
Z=6.7 0 S G L = 6 7 1 2 A R C = 0 . 4 7 DE= 6.18 EL- 0.13 QSWT=0.3834E+02 QST=0.2606E+02 QGST=0.6440E+02 QGT=0.1265E+03 QGWT = 0.6206E + 02 HTCGS=33.0 HTCGW= 7.0 RE=4.085E+03 NU=1.809E+02 NUW=3.816E+01