Contrasting styles of explosive eruption at Sete Cidades, São Miguel, Azores, in the last...
18
Research paper Contrasting styles of explosive eruption at Sete Cidades, São Miguel, Azores, in the last 5000 years: Hazard implications from modelling P.D. Cole a, ⁎ , J.M. Pacheco b , R. Gunasekera a , G. Queiroz b , P. Gonçalves b , J.L. Gaspar b a Department of Geography, Environment and Disaster management, Coventry University, Priory Street, Coventry, CV1 5FB, UK b Dept Geociencias, Universita, Acores, Ponta Delgada, Portugal Available online 7 February 2008 Abstract The deposits of three eruptions in the last 5000 years are described in detail in order to constrain eruptive parameters and allow a quantitative assessment of the hazard from a range of explosive eruption types at Sete Cidades volcano, São Miguel, Azores. These deposits include: the Caldeira Seca eruption (P17) which occurred around 600 yr BP, which was the last explosive event from inside the Sete Cidades caldera, the P11 eruption, dated at 2220±70 yr BP, and the undated P8 eruption (b 3000 yr BP). These deposits were chosen to represent the range of likely explosive activity from the caldera. Our studies reveal that the Caldeira Seca eruption (P17) produced ash-rich deposits, probably as the result of hydromagmatic eruptions, and several lapilli fall layers dispersed in different directions. The lapilli fall layers were derived from eruption columns up to10 km high. Evidence indicates pyroclastic density currents (PDCs) only moved outside of the caldera on to the western flank. The P11 deposit represents one of the largest eruptions at Sete Cidades in the last 5000 years. The deposits are composed of two units, the main lower one is a lapilli fall deposit inferred to be derived from an eruption column 18 km high. Evidence for PDCs outside of the caldera occurs to the southeast and northwest. The P8 deposits are composed of numerous alternating lapilli and ash layers representing a highly pulsatory eruption almost all of which are of a fallout origin. The lapilli are inferred to be derived from eruption columns up to 8 km in height. Using the eruptive parameters derived from these deposits we use HAZMAP ([Macedonio, G., Costa, A., Longo, A., 2005. A computer model for volcanic ash fallout and assessment of subsequent hazard, Comput. Geosci. 31, 837–845]) to constrain the probability of fallout of different loads and thicknesses. Two end-member scenarios were used with HAZMAP one representing a P17 eruption and another representing a P11 eruption. Both scenarios use wind profile data averaged over 25 years. For a P17 type event there is a 5% chance of tephra fallout exceeding 15 cm thickness in Ponta Delgada, the capital of São Miguel, indicating that roof collapse associated with such an event is unlikely. The larger magnitude and higher intensity P11 type eruption provides a 5% probability that tephra loads/thicknesses would exceed 92 cm in Ponta Delgada and that roof collapse could be a major problem. To assess the distribution of PDCs from future eruptions we use a GIS application of the energy line model ([Toyos, G., Cole, P.D., Felpeto, A., Marti, J., 2006. A GIS-based methodology for hazard mapping of small volume pyroclastic density currents. Nat. Hazards 41, 99–112]). The model indicates that individual PDCs of up to 10 7 m 3 derived from a vent located centrally within the caldera and a fountain collapse height of 500 m above the caldera floor could be completely contained within the caldera. However, PDCs derived from a vent located at Caldeira Seca in the western part of the caldera show individual PDCs N 10 5 m 3 would travel out of the caldera and down the western flank. As the vent location from a future eruption within the Sete Cidades caldera is unknown, the hazard from PDCs is high for anywhere on the immediate flanks of the volcano. © 2008 Elsevier B.V. All rights reserved. Keywords: Sete Cidades; tephra fallout; pyroclastic density currents; HAZMAP; hazards 1. Introduction Sete Cidades is one of three central volcanoes on the island of São Miguel that have been active during the Holocene. The other volcanoes are Fogo (aka Agua de Pau volcano) and Furnas (Fig. 1), both of which have been the site of historical explosive Available online at www.sciencedirect.com Journal of Volcanology and Geothermal Research 178 (2008) 574 – 591 www.elsevier.com/locate/jvolgeores ⁎ Corresponding author. Tel.: +44 2476 887654. E-mail address: [email protected] (P.D. Cole). 0377-0273/$ - see front matter © 2008 Elsevier B.V. All rights reserved. doi:10.1016/j.jvolgeores.2008.01.008
-
Upload
independent -
Category
Documents
-
view
2 -
download
0
Transcript of Contrasting styles of explosive eruption at Sete Cidades, São Miguel, Azores, in the last...
Available online at www.sciencedirect.com
Journal of Volcanology and Geothermal Research 178 (2008) 574–591www.elsevier.com/locate/jvolgeores
Research paper
Contrasting styles of explosive eruption at Sete Cidades, São Miguel, Azores,in the last 5000 years: Hazard implications from modelling
P.D. Cole a,⁎, J.M. Pacheco b, R. Gunasekera a, G. Queiroz b, P. Gonçalves b, J.L. Gaspar b
a Department of Geography, Environment and Disaster management, Coventry University, Priory Street, Coventry, CV1 5FB, UKb Dept Geociencias, Universita, Acores, Ponta Delgada, Portugal
Available online 7 February 2008
Abstract
The deposits of three eruptions in the last 5000 years are described in detail in order to constrain eruptive parameters and allow a quantitativeassessment of the hazard from a range of explosive eruption types at Sete Cidades volcano, São Miguel, Azores. These deposits include: theCaldeira Seca eruption (P17) which occurred around 600 yr BP, which was the last explosive event from inside the Sete Cidades caldera, the P11eruption, dated at 2220±70 yr BP, and the undated P8 eruption (b3000 yr BP). These deposits were chosen to represent the range of likelyexplosive activity from the caldera.
Our studies reveal that the Caldeira Seca eruption (P17) produced ash-rich deposits, probably as the result of hydromagmatic eruptions, andseveral lapilli fall layers dispersed in different directions. The lapilli fall layers were derived from eruption columns up to10 km high. Evidenceindicates pyroclastic density currents (PDCs) only moved outside of the caldera on to the western flank. The P11 deposit represents one of thelargest eruptions at Sete Cidades in the last 5000 years. The deposits are composed of two units, the main lower one is a lapilli fall deposit inferredto be derived from an eruption column 18 km high. Evidence for PDCs outside of the caldera occurs to the southeast and northwest. The P8deposits are composed of numerous alternating lapilli and ash layers representing a highly pulsatory eruption almost all of which are of a falloutorigin. The lapilli are inferred to be derived from eruption columns up to 8 km in height.
Using the eruptive parameters derived from these deposits we use HAZMAP ([Macedonio, G., Costa, A., Longo, A., 2005. A computer model forvolcanic ash fallout and assessment of subsequent hazard, Comput. Geosci. 31, 837–845]) to constrain the probability of fallout of different loads andthicknesses. Two end-member scenarioswere usedwithHAZMAPone representing a P17 eruption and another representing a P11 eruption. Both scenariosuse wind profile data averaged over 25 years. For a P17 type event there is a 5% chance of tephra fallout exceeding 15 cm thickness in Ponta Delgada, thecapital of São Miguel, indicating that roof collapse associated with such an event is unlikely. The larger magnitude and higher intensity P11 type eruptionprovides a 5% probability that tephra loads/thicknesses would exceed 92 cm in Ponta Delgada and that roof collapse could be a major problem.
To assess the distribution of PDCs from future eruptions we use a GIS application of the energy line model ([Toyos, G., Cole, P.D., Felpeto, A.,Marti, J., 2006. A GIS-based methodology for hazard mapping of small volume pyroclastic density currents. Nat. Hazards 41, 99–112]). The modelindicates that individual PDCs of up to 107 m3 derived from a vent located centrally within the caldera and a fountain collapse height of 500 m abovethe caldera floor could be completely contained within the caldera. However, PDCs derived from a vent located at Caldeira Seca in the western part ofthe caldera show individual PDCsN105 m3 would travel out of the caldera and down the western flank. As the vent location from a future eruptionwithin the Sete Cidades caldera is unknown, the hazard from PDCs is high for anywhere on the immediate flanks of the volcano.© 2008 Elsevier B.V. All rights reserved.
Keywords: Sete Cidades; tephra fallout; pyroclastic density currents; HAZMAP; hazards
⁎ Corresponding author. Tel.: +44 2476 887654.E-mail address: [email protected] (P.D. Cole).
0377-0273/$ - see front matter © 2008 Elsevier B.V. All rights reserved.doi:10.1016/j.jvolgeores.2008.01.008
1. Introduction
Sete Cidades is one of three central volcanoes on the islandof São Miguel that have been active during the Holocene. Theother volcanoes are Fogo (aka Agua de Pau volcano) and Furnas(Fig. 1), both of which have been the site of historical explosive

Fig. 1. Location map showing (a) the island of Sao Miguel and Sete Cidades and (c) the towns and villages and other locations mentioned in the text. (c) View acrossthe caldera from SW rim.
575P.D. Cole et al. / Journal of Volcanology and Geothermal Research 178 (2008) 574–591
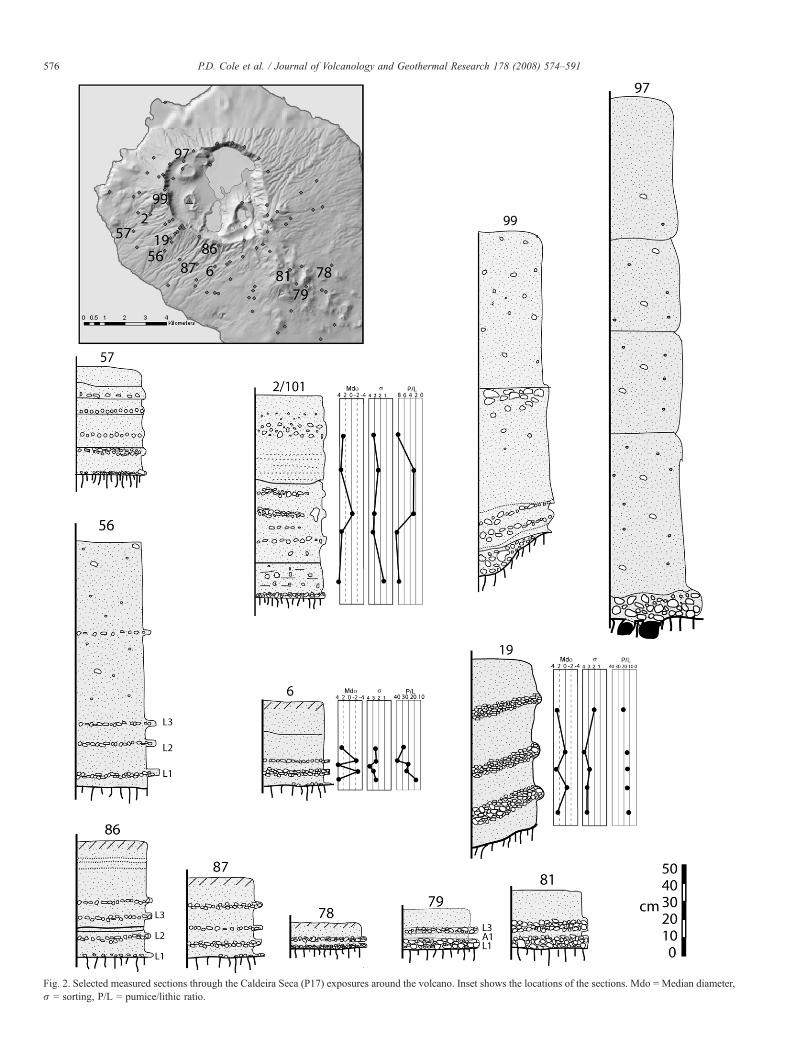
Fig. 2. Selected measured sections through the Caldeira Seca (P17) exposures around the volcano. Inset shows the locations of the sections. Mdo = Median diameterσ = sorting, P/L = pumice/lithic ratio.
576 P.D. Cole et al. / Journal of Volcanology and Geothermal Research 178 (2008) 574–591
,

577P.D. Cole et al. / Journal of Volcanology and Geothermal Research 178 (2008) 574–591
activity (Cole et al., 1995, 1999; Guest et al., 1999, Wallenstein,1999). Fogo was the site of a plinian eruption in 1563 AD(Walker and Croasdale, 1971) and Furnas volcano produced asubplinain/hydrovolcanic eruption in 1630 AD.
Sete Cidades has been the most active of the three volcanoesof Sao Miguel in the last 5000 years, although it has not eruptedhistorically. The first stratigraphic framework for the last5000 year period was constructed by Booth et al. (1978) whoidentified the products of twelve explosive eruptions (termedSete A–L). More recently Queiroz (1997) and Queiroz et al.,2008-this volume identified the products of seventeen explosiveeruptions in the last 5000 years at Sete Cidades (termed P1–P17from oldest to youngest). Fogo has had four, and Furnas ten,explosive eruptions in the last 5000 years respectively (Booth etal., 1978).
Sete Cidades volcano lies 13 km northwest of the city ofPonta Delgada with a population of∼65,000 (Fig. 1). Moreovernumerous villages occur both within the caldera and on theflanks of the volcano. Understanding the physical volcanologyof recent explosive eruptions is key to the mitigation of volcanichazards at Sete Cidades. Although more minor volcanic hazardssuch as lava flows and strombolian events are a threat from SeteCidades these are not considered in this study.
Herein we describe three eruptions that characterise the recenteruptive history: the Caldeira Seca (P17) eruption which was thelast explosive eruption to take place from within the SeteCidades caldera dated at 500±100 yr BP and 663±105 yr BP(Moore and Rubin, 1991; Shotton and Williams, 1971), the P11eruption dated at ∼2220±70 yr BP (Queiroz, 1997) and the P8event which occurred slightly less than 3000 years ago. Theseeruptions have important implications as far as hazards fromfuture explosive events are concerned. We use eruptive para-meters derived from this study as inputs for modelling to makeimportant inferences as to the likely hazards from a futureexplosive event at Sete Cidades.
2. Volcanological background of Sete Cidades volcano
Sete Cidades volcano lies at the northwest end of Sao MiguelIsland and is dominated by a broadly circular caldera measuring5.5×4.5 km that truncates the summit (Fig. 1). The depth of thecaldera, which is complete and unbreached, varies between 200 min the west and 500 m in the east and southeast, although typicaldepths are around 300 m. Sete Cidades, similar to the othervolcanoes of SaoMiguel, is strongly influenced by the tectonics ofthe region (Guest et al., 1999, Queiroz, 1997 and Queiroz et al.,2008-this volume). A graben structure related to the northwest–southeast trending Terceira Rift tectonic system cuts the SeteCidades caldera. This structure is coincident with a rift zone thatextends to the southeast of Sete Cidades and is characterised byabundant scoria cones and lava flows. The rift zone immediately tothe southeast of the caldera is around 200m higher than the calderarim such that it forms a distinct topographic barrier between SeteCidades caldera and Ponta Delgada (Fig. 1).
Queiroz (1997) and Queiroz et al., 2008-this volume proposedthat the caldera is a nested structure that formed as the result ofthree separate collapse episodes, each associated with explosive
eruptions. The three caldera-forming explosive eruptions formedthe Risco, Bretanha and Santa Barbara pyroclastic formationsapproximately 36,000 yr BP, 29,000 yr BP and 16,000 yr BPrespectively (Queiroz, 1997; Queiroz et al., 2008-this volume).Each of these formations is composed of lapilli fallout (possiblyplinian) and deposits pyroclastic density currents (PDCs), some ofwhich are welded. Numerous smaller explosive eruptions haveoccurred between each of these paroxysmal events both inside andoutside the caldera.
3. Products of explosive eruptions
3.1. The Caldeira Seca (P17) pyroclastic deposits
Deposits of this eruption have been documented both insideand outside of the caldera. The deposits are N6 m thick withinexposures on the west and southwest caldera rim, although theyare N10 m thick more than 1 km from the vent inside the caldera(Fig. 2).
Outside of the caldera, deposits of the Caldeira Seca eruptioncrop out on most flanks of the volcano although on the northand northwest exposures are rare, and or thin. On the flanks, tothe south and east, deposits are more typically around 1 m thick(Figs. 2 and 3). The most distal outcrops found are 9.1 kmsoutheast of the vent where deposits are b25 cm thick.
We divide these deposits into three parts based on their locationand characteristics: ‘Proximal deposits’, inside the caldera; ‘Distaldeposits’ on the southeast and eastern flank, and ‘western sectordeposits’ for those on the western caldera rim, and on the westernflank which are anomalous to deposits elsewhere.
3.1.1. Proximal deposits — the Caldeira Seca tuff ring and theintracaldera facies
Booth et al. (1978) established that the source of this eruptionwas Caldeira Seca, an asymmetrical tuff ring whose centre lies1 km inside the west southwest part of the caldera. The tuff ring ismildly elliptical, measuring 1.2 km from north to south at its base,and 1 km from east to west (Fig. 1). The rim of the tuff ring standsup to 100 m above the surrounding floor of the caldera. Smallephemeral exposures caused by landslides on the inner walls ofthe tuff ring exposed a pumice breccia up to 3 m thick, with clastsup to 30 cm in size, interbedded with more ash-rich deposits.
Proximal exposures ∼2 km northwest of Caldeira Seca revealN10 m thick exposures of alternating lapilli and ash deposits,although the base of the sequence is not exposed. Large scale(10's of m in wavelength) cross-stratification is present in severalexposures. Massive deposits of poorly sorted lapilli and ash cropout in units up to 2 m thick, 200 m inside the caldera at itsnorthwest margin. Small exposures of coarse lapilli deposits arealso exposed on the rim of Caldeira do Alferes, a tuff and pumicecone located 1.5 km north of Caldeira Seca.
3.1.2. Distal deposits — (southeast, east and northwest)Around most of the flanks of the volcano the P17 deposits are
composed predominantly of ash, interbedded with subordinatecontinuous coarser-grained lapilli layers (Fig. 2). The lapilli layersare composed mainly of angular pumice with less abundant lithic

Fig. 3. Isopach and isopleth maps of different parts of the Caldeira Seca (P17) deposits (a) Total deposit isopach (b) L1 isopach (c) L2 isopach (d) L3 isopach (e) L2isopleth (f) Geological evidence for, and probable paths of pyroclastic density currents outside of the caldera of Sete Cidades.
578 P.D. Cole et al. / Journal of Volcanology and Geothermal Research 178 (2008) 574–591
clasts. Three distinct thin lapilli layers have been correlated aroundthis region of the volcano, although there are undoubtedly otherthin pumice lapilli layers higher within the sequence that were not
documented in detail. The correlateable lapilli layers are termedfrom the base up: L1, L2, etc. The lowermost deposit is a lapillilayer (L1) that is strongly dispersed to the southeast (See isopach
579P.D. Cole et al. / Journal of Volcanology and Geothermal Research 178 (2008) 574–591
map, Fig. 3b). The different lapilli layers show quite differentdispersal directions, owing to variations in the wind directionduring the eruption. The second lapilli layers L2 is dispersedstrongly to the northwest but of limited extent, in the oppositedirection to the basal lapilli layer L1 (Fig. 3c). The interbedded ashlayers are termed A1, A2 etc, although these layers were moredifficult to correlate.
Lapilli layer L3 shows a more widespread dispersal althoughit has a preferential dispersal to the southeast. Calculations alsoindicate that lapilli L3 was derived from the highest column ofthe P17 eruption (∼10 km — see Table 1).
Contacts between the lapilli layers and ash layers arevariable, in some locations they are sharp, however in manyplaces boundaries between lapilli and the interbedded ash aregradational (Fig. 4a). This indicates that ash and lapilli fellcontemporaneously or in many cases overlapped, indeed thereis evidence that lapilli fallout occurred simultaneously withPDCs (Figs. 2 and 4c).
3.1.3. Western sector deposits — western caldera rim and thewestern flank
Deposits exposed on the western and southwestern rim of thecaldera and on the southwest flank differ from other areas of thevolcano. First, they are particularly thick N6 m in some locationson the caldera rim. Second, they apparently have fewer continuouslapilli layers (Fig. 2 — sections 97, 99, 1/101). Typically thedeposits are massive and poorly sorted layers of mixed ash andlapilli between 0.5 and 3 m thick. Interbedded with the massivelayers are coarse lenses and discontinuous layers of pumice up to35 cm in size and smaller lithics (Fig. 4b and c). Pumice is roundedand typically occurs as accumulations of coarse clasts of pumicetogether with small lithics. At a sequence of exposures 1.5 kmsouthwest of the vent deposits show features such as cross stra-tification and pinch and swell relations (Fig. 4b). At a number ofexposures up to 0.5 km outside the caldera rim, on the south-western flank, massive, poorly sorted deposits can be seen fillingchannels and shallow depressions.More distally, to the west of the
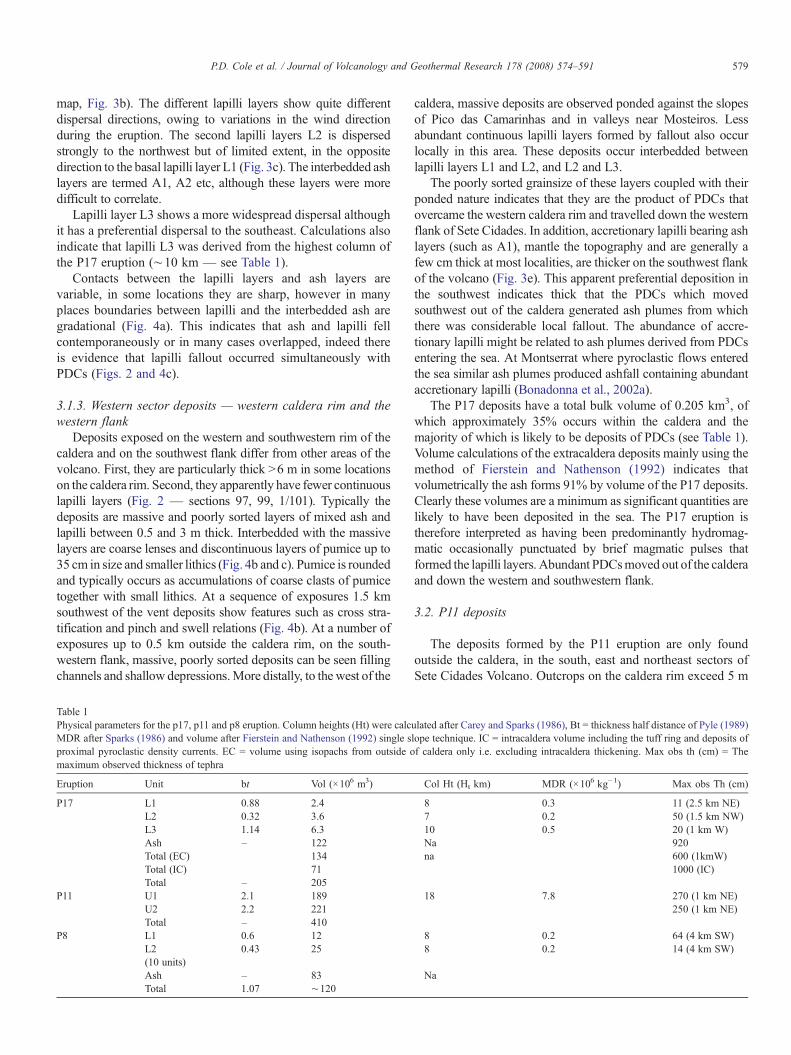
Table 1Physical parameters for the p17, p11 and p8 eruption. Column heights (Ht) were calcMDR after Sparks (1986) and volume after Fierstein and Nathenson (1992) single sproximal pyroclastic density currents. EC = volume using isopachs from outside omaximum observed thickness of tephra
Eruption Unit bt Vol (×106 m3)
P17 L1 0.88 2.4L2 0.32 3.6L3 1.14 6.3Ash – 122Total (EC) 134Total (IC) 71Total – 205
P11 U1 2.1 189U2 2.2 221Total – 410
P8 L1 0.6 12L2 0.43 25(10 units)Ash – 83Total 1.07 ∼120
caldera, massive deposits are observed ponded against the slopesof Pico das Camarinhas and in valleys near Mosteiros. Lessabundant continuous lapilli layers formed by fallout also occurlocally in this area. These deposits occur interbedded betweenlapilli layers L1 and L2, and L2 and L3.
The poorly sorted grainsize of these layers coupled with theirponded nature indicates that they are the product of PDCs thatovercame the western caldera rim and travelled down the westernflank of Sete Cidades. In addition, accretionary lapilli bearing ashlayers (such as A1), mantle the topography and are generally afew cm thick at most localities, are thicker on the southwest flankof the volcano (Fig. 3e). This apparent preferential deposition inthe southwest indicates thick that the PDCs which movedsouthwest out of the caldera generated ash plumes from whichthere was considerable local fallout. The abundance of accre-tionary lapilli might be related to ash plumes derived from PDCsentering the sea. At Montserrat where pyroclastic flows enteredthe sea similar ash plumes produced ashfall containing abundantaccretionary lapilli (Bonadonna et al., 2002a).
The P17 deposits have a total bulk volume of 0.205 km3, ofwhich approximately 35% occurs within the caldera and themajority of which is likely to be deposits of PDCs (see Table 1).Volume calculations of the extracaldera deposits mainly using themethod of Fierstein and Nathenson (1992) indicates thatvolumetrically the ash forms 91% by volume of the P17 deposits.Clearly these volumes are a minimum as significant quantities arelikely to have been deposited in the sea. The P17 eruption istherefore interpreted as having been predominantly hydromag-matic occasionally punctuated by brief magmatic pulses thatformed the lapilli layers. Abundant PDCsmoved out of the calderaand down the western and southwestern flank.
3.2. P11 deposits
The deposits formed by the P11 eruption are only foundoutside the caldera, in the south, east and northeast sectors ofSete Cidades Volcano. Outcrops on the caldera rim exceed 5 m
ulated after Carey and Sparks (1986), Bt = thickness half distance of Pyle (1989)lope technique. IC = intracaldera volume including the tuff ring and deposits off caldera only i.e. excluding intracaldera thickening. Max obs th (cm) = The
Col Ht (Ht km) MDR (×106 kg−1) Max obs Th (cm)
8 0.3 11 (2.5 km NE)7 0.2 50 (1.5 km NW)10 0.5 20 (1 km W)Na 920na 600 (1kmW)
1000 (IC)
18 7.8 270 (1 km NE)250 (1 km NE)
8 0.2 64 (4 km SW)8 0.2 14 (4 km SW)
Na
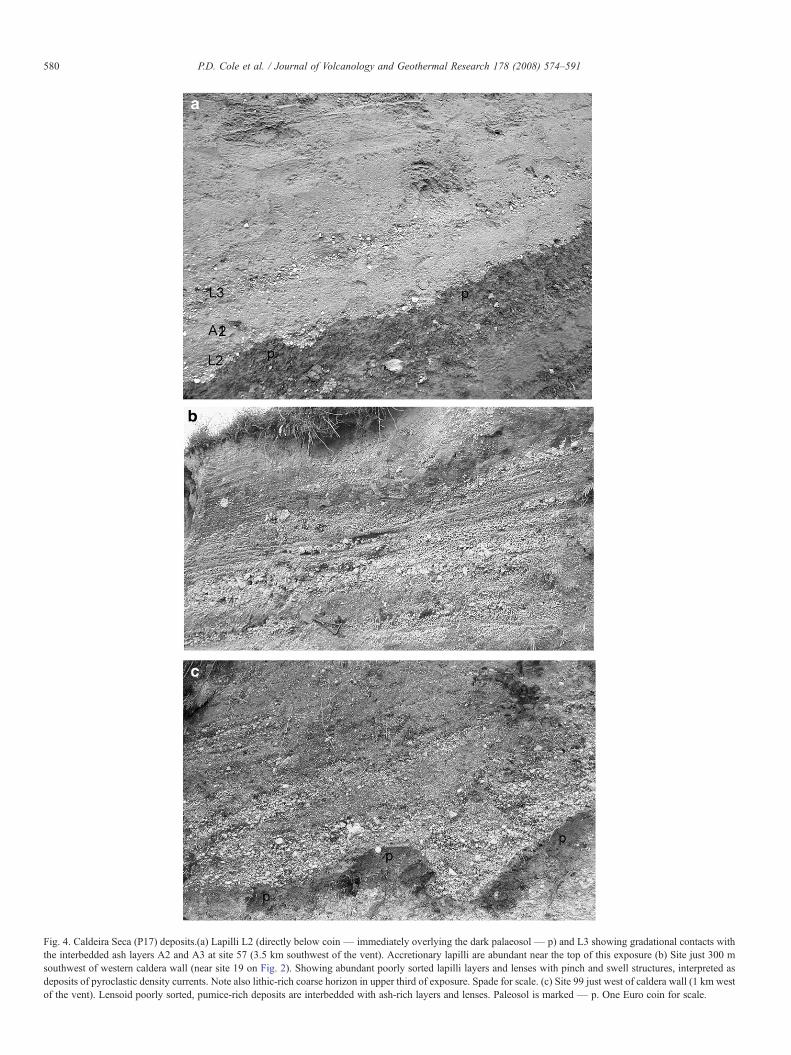
Fig. 4. Caldeira Seca (P17) deposits.(a) Lapilli L2 (directly below coin — immediately overlying the dark palaeosol— p) and L3 showing gradational contacts withthe interbedded ash layers A2 and A3 at site 57 (3.5 km southwest of the vent). Accretionary lapilli are abundant near the top of this exposure (b) Site just 300 msouthwest of western caldera wall (near site 19 on Fig. 2). Showing abundant poorly sorted lapilli layers and lenses with pinch and swell structures, interpreted asdeposits of pyroclastic density currents. Note also lithic-rich coarse horizon in upper third of exposure. Spade for scale. (c) Site 99 just west of caldera wall (1 km westof the vent). Lensoid poorly sorted, pumice-rich deposits are interbedded with ash-rich layers and lenses. Paleosol is marked — p. One Euro coin for scale.
580 P.D. Cole et al. / Journal of Volcanology and Geothermal Research 178 (2008) 574–591

Fig. 5. Selected measured sections through the P11 exposures around the volcano. Inset shows the locations of the sections. Mdo = Median diameter, σ = sorting, P/L = pumice/lithic ratio.
581P.D
.Cole
etal.
/Journal
ofVolcanology
andGeotherm
alResearch
178(2008)
574–591
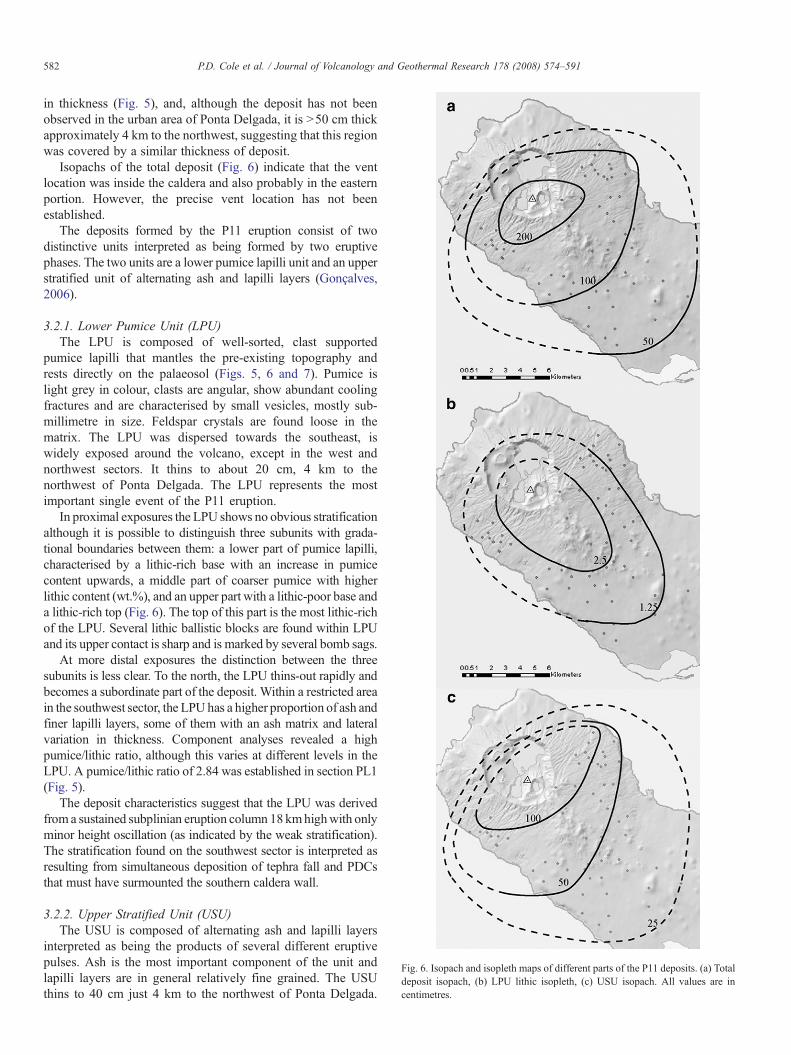
Fig. 6. Isopach and isopleth maps of different parts of the P11 deposits. (a) Totaldeposit isopach, (b) LPU lithic isopleth, (c) USU isopach. All values are incentimetres.
582 P.D. Cole et al. / Journal of Volcanology and Geothermal Research 178 (2008) 574–591
in thickness (Fig. 5), and, although the deposit has not beenobserved in the urban area of Ponta Delgada, it is N50 cm thickapproximately 4 km to the northwest, suggesting that this regionwas covered by a similar thickness of deposit.
Isopachs of the total deposit (Fig. 6) indicate that the ventlocation was inside the caldera and also probably in the easternportion. However, the precise vent location has not beenestablished.
The deposits formed by the P11 eruption consist of twodistinctive units interpreted as being formed by two eruptivephases. The two units are a lower pumice lapilli unit and an upperstratified unit of alternating ash and lapilli layers (Gonçalves,2006).
3.2.1. Lower Pumice Unit (LPU)The LPU is composed of well-sorted, clast supported
pumice lapilli that mantles the pre-existing topography andrests directly on the palaeosol (Figs. 5, 6 and 7). Pumice islight grey in colour, clasts are angular, show abundant coolingfractures and are characterised by small vesicles, mostly sub-millimetre in size. Feldspar crystals are found loose in thematrix. The LPU was dispersed towards the southeast, iswidely exposed around the volcano, except in the west andnorthwest sectors. It thins to about 20 cm, 4 km to thenorthwest of Ponta Delgada. The LPU represents the mostimportant single event of the P11 eruption.
In proximal exposures the LPU shows no obvious stratificationalthough it is possible to distinguish three subunits with grada-tional boundaries between them: a lower part of pumice lapilli,characterised by a lithic-rich base with an increase in pumicecontent upwards, a middle part of coarser pumice with higherlithic content (wt.%), and an upper part with a lithic-poor base anda lithic-rich top (Fig. 6). The top of this part is the most lithic-richof the LPU. Several lithic ballistic blocks are found within LPUand its upper contact is sharp and is marked by several bomb sags.
At more distal exposures the distinction between the threesubunits is less clear. To the north, the LPU thins-out rapidly andbecomes a subordinate part of the deposit. Within a restricted areain the southwest sector, the LPU has a higher proportion of ash andfiner lapilli layers, some of them with an ash matrix and lateralvariation in thickness. Component analyses revealed a highpumice/lithic ratio, although this varies at different levels in theLPU. A pumice/lithic ratio of 2.84 was established in section PL1(Fig. 5).
The deposit characteristics suggest that the LPU was derivedfrom a sustained subplinian eruption column 18 kmhighwith onlyminor height oscillation (as indicated by the weak stratification).The stratification found on the southwest sector is interpreted asresulting from simultaneous deposition of tephra fall and PDCsthat must have surmounted the southern caldera wall.
3.2.2. Upper Stratified Unit (USU)The USU is composed of alternating ash and lapilli layers
interpreted as being the products of several different eruptivepulses. Ash is the most important component of the unit andlapilli layers are in general relatively fine grained. The USUthins to 40 cm just 4 km to the northwest of Ponta Delgada.
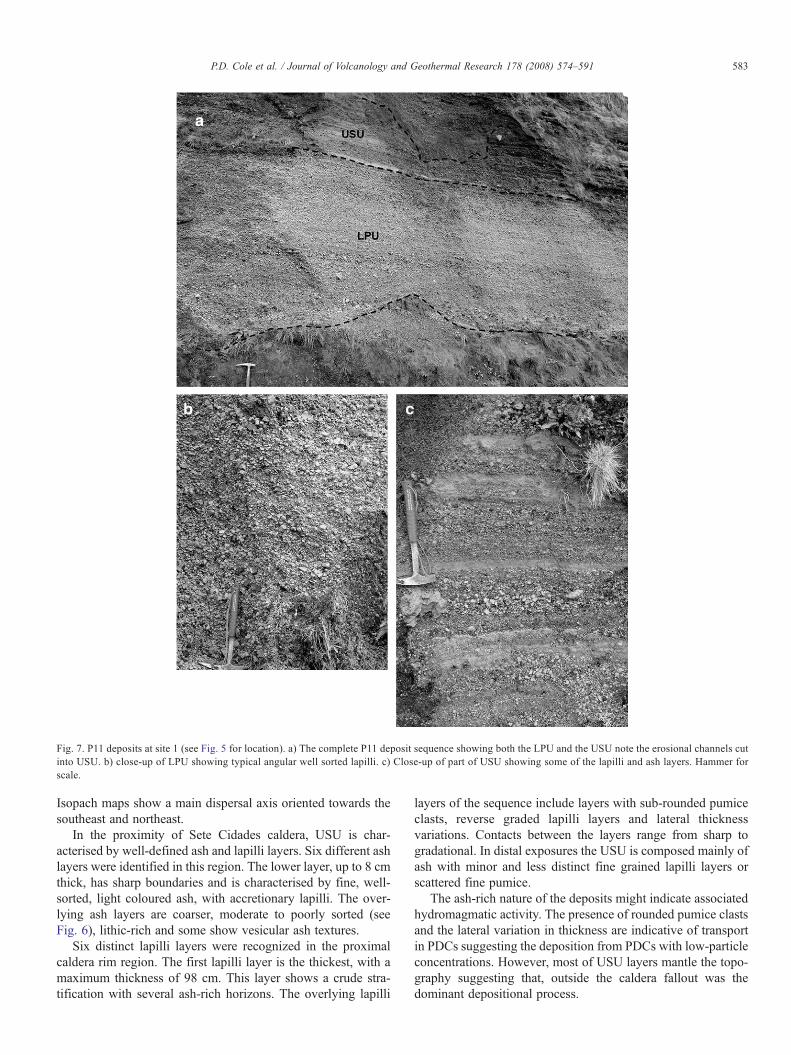
Fig. 7. P11 deposits at site 1 (see Fig. 5 for location). a) The complete P11 deposit sequence showing both the LPU and the USU note the erosional channels cutinto USU. b) close-up of LPU showing typical angular well sorted lapilli. c) Close-up of part of USU showing some of the lapilli and ash layers. Hammer forscale.
583P.D. Cole et al. / Journal of Volcanology and Geothermal Research 178 (2008) 574–591
Isopach maps show a main dispersal axis oriented towards thesoutheast and northeast.
In the proximity of Sete Cidades caldera, USU is char-acterised by well-defined ash and lapilli layers. Six different ashlayers were identified in this region. The lower layer, up to 8 cmthick, has sharp boundaries and is characterised by fine, well-sorted, light coloured ash, with accretionary lapilli. The over-lying ash layers are coarser, moderate to poorly sorted (seeFig. 6), lithic-rich and some show vesicular ash textures.
Six distinct lapilli layers were recognized in the proximalcaldera rim region. The first lapilli layer is the thickest, with amaximum thickness of 98 cm. This layer shows a crude stra-tification with several ash-rich horizons. The overlying lapilli
layers of the sequence include layers with sub-rounded pumiceclasts, reverse graded lapilli layers and lateral thicknessvariations. Contacts between the layers range from sharp togradational. In distal exposures the USU is composed mainly ofash with minor and less distinct fine grained lapilli layers orscattered fine pumice.
The ash-rich nature of the deposits might indicate associatedhydromagmatic activity. The presence of rounded pumice clastsand the lateral variation in thickness are indicative of transportin PDCs suggesting the deposition from PDCs with low-particleconcentrations. However, most of USU layers mantle the topo-graphy suggesting that, outside the caldera fallout was thedominant depositional process.

Fig. 8. Type section through the P8 deposits at site 21 on the southwest flank. Mdo = Median diameter, σ = sorting, P/L = pumice/lithic ratio. At base measuredsections through the P8 exposures show the variation in thickness of the deposits on the southwest flank of the volcano. Inset shows the locations of thesections.
584 P.D. Cole et al. / Journal of Volcanology and Geothermal Research 178 (2008) 574–591

585P.D. Cole et al. / Journal of Volcanology and Geothermal Research 178 (2008) 574–591
The P11 eruption was the largest to occur from Sete Cidades inthe last 5000 years with a bulk volume of 0.41 km3 and differsfrom both the P17 and P8 events in that 46% by volume of thedeposits (LPU) were formed a sustained subplinian magmaticphase. The later phases of the eruption were more similar to otherevents and alternated between magmatic lapilli and ash-richdeposits within which there is evidence, albeit limited, for pyro-clastic density currents.
3.3. P8 deposits
Deposits of the P8 eruption are composed of more than onehundred individual layers or lamina (Fig. 8). The deposits totalup to 3.5 m thick, 2 km from the southwest caldera rim. The P8deposit is typical of moderate volume (b1 km 3) eruptions onSete Cidades and indeed the Azores generally (Self, 1976; Coleet al., 1999, Pacheco, 2001). The P8 sequence is notably dif-ferent from the P17 deposit sequence in that most contacts
Fig. 9. Isopach and isopleth maps of different parts of the P8 deposits on the flanks of(c) Lithic isopleth for lapilli L1. (d) Mean lithic isopleth for lapilli L2 — Mean of t
between the ash and lapilli layers are sharp and well-defined,suggesting that the eruptive activity that formed these units mayhave been distinct with little overlap between them.
Isopach maps of these deposits indicate that the vent of thiseruption was located within the eastern part of the caldera, in theregion of Logoa Santiago. Generally the products show a pro-nounced west southwesterly dispersal axis indicating relativelystrong winds during throughout the eruption (Fig. 9).
The P8 deposits are composed almost totally of mantlebedded lapilli and ash deposits that are interpreted as the productof fallout from convective plumes. However the proportion oflapilli and ash layers varies considerably through the depositsand we subdivide the different parts of the P8 sequence into fourunits, based on their dominant component (Fig. 8).
3.3.1. Unit A1The lowermost deposits of the P8 sequence are predomi-
nantly composed of ash, are cumulatively up to 30 cm thick and
the volcano. (a) Total deposit isopach map for P8. (b) Isopach map for Lapilli L1,en layers. Values are given in centimetres.
586 P.D. Cole et al. / Journal of Volcanology and Geothermal Research 178 (2008) 574–591
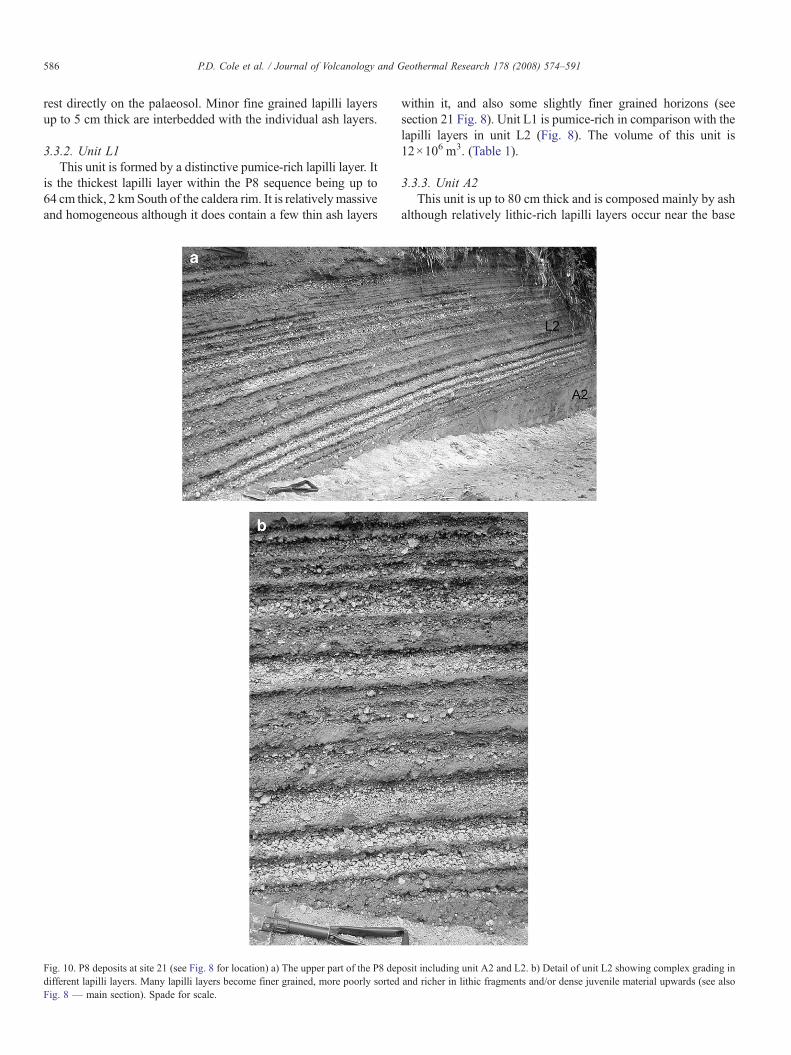
rest directly on the palaeosol. Minor fine grained lapilli layersup to 5 cm thick are interbedded with the individual ash layers.
3.3.2. Unit L1This unit is formed by a distinctive pumice-rich lapilli layer. It
is the thickest lapilli layer within the P8 sequence being up to64 cm thick, 2 km South of the caldera rim. It is relativelymassiveand homogeneous although it does contain a few thin ash layers
Fig. 10. P8 deposits at site 21 (see Fig. 8 for location) a) The upper part of the P8 depdifferent lapilli layers. Many lapilli layers become finer grained, more poorly sortedFig. 8 — main section). Spade for scale.
within it, and also some slightly finer grained horizons (seesection 21 Fig. 8). Unit L1 is pumice-rich in comparison with thelapilli layers in unit L2 (Fig. 8). The volume of this unit is12×106 m3. (Table 1).
3.3.3. Unit A2This unit is up to 80 cm thick and is composed mainly by ash
although relatively lithic-rich lapilli layers occur near the base
osit including unit A2 and L2. b) Detail of unit L2 showing complex grading inand richer in lithic fragments and/or dense juvenile material upwards (see also

Table 2Key input parameters used in HAZMAP modelling. Magma density wasassumed to be 2600 kg m3
Eruption Column Height Volume Mass Pumicelithicratio
(km) (×106 m3 DRE) (E11 kg)
P17 10 89 2.32 80:20P11 18 230 6.06 57:43
587P.D. Cole et al. / Journal of Volcanology and Geothermal Research 178 (2008) 574–591
of the unit. The ash is distinctive in that there are horizonstoward the top of the unit that are rich in accretionary lapilli.
3.3.4. Unit L2This unit is formed by up to ten distinct lapilli layers
(Fig. 10). Individual lapilli layers are up to 14 cm thick how-ever at many localities off the dispersal axis they occur as lessdistinct layers ∼1 cm thick (e.g. Fig. 8 Site 2). These layers arerich in lithic fragments and in particular show enrichment inlithic fragments towards the top of each layer. Such lithic en-richment occurs together with a fining of the lapilli size (Fig. 8).The total volume on this unit is 25×106 m3 giving each lapillilayer a mean volume of 1.6×10⁶ m3, almost an order of magni-tude smaller that the total volume of unit L1.
The P8 deposits have a total bulk volume of 0.12 km3 ofwhichapproximately 69% by volume is ash (Table 1). The P8 depositsare characteristic in that they are formed by many phasesalternating between magmatic lapilli and ash fallout, some ofwhich may have been hydromagmatic. The deposits are solelyderived from fallout and show no evidence of any PDCs havingbeen associated with this eruption.
4. Modelling tephra fallout for sub-plinian events atSete Cidades
We used the results parameters derived from the field studiesof P17 and P11 as inputs for the programHAZMAP (Macedonioet al., 2005) in order to model the range in spatial extent andprobability of tephra fallout from a sub-plinian type events atSete Cidades. We assumed that a best case scenario for a futuresub-plinian event would be the P17 type eruption, while theworst case scenario would be the larger P11 type eruption. Tomodel fallout, wind profiles obtained from the US NationalOceanic and Atmospheric administration (NOAA) ClimaticDiagnostic Centre (http://www.cdc.noaa.gov) were used.
4.1. Modelling tephra dispersal with HAZMAP
There are several approaches to predicting thickness of falloutdeposits. However, the most common approach focuses onparticle advection (by wind) and diffusion (by turbulence) (e.g.Armienti et al., 1988; Folch and Felpeto, 2005; Macedonio et al.,2005). This type of model assumes that far from the vent (orsource point), particles of the eruption column are transported bythe advection effect of the wind, the diffusion effect of atmo-spheric turbulence, and that they settle under gravity at differentvelocities for different particle sizes.
HAZMAP is a Fortran based program that simulates thismass distribution of the deposit for a given wind profile. Acomputation can be performed either in the operational “depositmode” or in the “probability mode” to define the probability of agiven accumulation of mass on the ground for a statistical set ofwind profiles provided (Macedonio et al., 2005).
Key input parameters the model include the total eruptedmass, column height and settling velocity distribution, inaddition to wind profile data. The main input parameters used inthe modelling for P17 and P11 type eruptions are highlighted in
Table 2. For a detailed discussion of HAZMAP and its sensi-tivity to input parameters refer to Macedonio et al. (2005) andBonadonna et al. (2002b).
4.2. The wind dataset
Composite-interpolated Dynamic Wind Modelling (DWM)data is a compilation of part-observation and part-modellingdata from the spectral-based reanalysis system (Kistler et al.,2001). The dataset considered for this study extends over25 years (1st January 1980 to 31st December 2004). Thespectral interpolation model used for data assimilation has ahorizontal resolution of approximately 210 km (Kistler et al.,2001). Consequently, the resulting wind profile is considerablysmoothed and minor local variations are not represented. Thedataset also lack information on the extent to which the windprofiles are dependent on observation as opposed to reanalysisspectral modelling.
For each profile, readings were extracted every 2 km up to aheight of 20 km. Daily averaged DWM wind profiles of the9132 days (1980–2004) used in the study were consistent up to aheight of 20 km, with a mean wind direction of 106.8°. Meanwind speeds ranged between 4.8 and 15.8 m/s. Analysis of thedata also showed that diurnal variations in wind strength anddirection had little affect on the daily averaged wind profile.However, there was a significant change in wind strengths bet-ween summer and winter. Between July to September (summer)wind speeds were considerably lower, whereas during the wintermonths of December to February winds were approximately 20%higher than average.
4.3. Tephra dispersal from P17 Type eruption
Allowing for variations in wind strength and direction byconsidering the full set of daily averaged DWM wind profiles,there is a 5% probability (averaged over the whole urban area),that tephra fallout thickness would exceed 15.3 cm in PontaDelgada (Fig. 11a). The thickness of dry tephra required for50% of the weakest types of roofs to collapse in São Miguel,Azores, could be as low as 22 cm (Booth et al., 1983; Pomoniset al., 1999). With the addition of rainfall this critical thicknessfurther reduces to only 11 cm of tephra (Pomonis et al., 1999).However, using the averaged DWM wind profile over the25 years, tephra thickness in Ponta Delgada could be less than4 cm (Fig. 11b). Other towns in central São Miguel, would havesimilar deposit thicknesses (Table 3). The affect of seasonalvariations in wind speed and direction were also modelled for a

Fig. 11. HAZMAP results for P17 type eruption (a and b) and P11 type eruption (bottom). (a and c) are tephra thickness for a 5% probability, (b and d) are depositthicknesses (HAZMAP run on deposit mode) using the averaged DWM profile over 25 years. Thicknesses are given in centimetres. The dashed circles represent theareas within which the results have greater uncertainty due to nature of the HAZMAP model.
588 P.D. Cole et al. / Journal of Volcanology and Geothermal Research 178 (2008) 574–591
P17 type eruption. The averaged deposit thickness at PontaDelgada for an eruption occurring during the summer monthswas 7.7 cm, while in winter this decreases to 0.5 cm. Howevertowns such as Rabo de Peixe, Ribeira Seca and Ribeira Grande(Fig. 1a) are directly on the likely dispersal axis of tephrafallout, and during winter are likely to suffer thicknesses ofaround 7 cm. During the summer however thickness is likely tobe around 0.5 cm.
4.4. Tephra dispersal from a P11 type eruption
The use of larger mass, higher diffusion coefficient, narrowersettling velocity bandwidth and higher eruption column resultsin the products of the P11 type eruption being more widelydistributed than a P17 type eruption. There is a 5% probabilitythat Ponta Delgada would sustain tephra thicknesses of up to92.2 cm (Fig. 11c). Such a scenario would result in collapse of

Table 3Tephra thicknesses derived from the HAZMAP model outputs. Both totalthicknesses and those of a 5% probability are shown for the major towns in thewestern part of Sao Miguel. Bulk tephra densities of 800 kg m3 were used
Town name P17 type eruption P11 type eruption
Prob. 5% Avg. wind profile Prob. 5% Avg. wind profile
(cm) (cm) (cm) (cm)
Rabo de Peixe 17 9 80 27Ribeira Seca 15 4 64 25Ribeira Grande 11 2 37 20Riberinha 5 4 27 16Lagoa 11 4 37 21Agua de Pau 5 2 23 18Ponta Delgada 15 2 92 25
589P.D. Cole et al. / Journal of Volcanology and Geothermal Research 178 (2008) 574–591
most roofs of buildings including those with reinforced-concrete roofs built within the last 20 years. The roofs ofthese buildings would fail with a dry tephra load ofapproximately 87.5 cm or equivalent thickness (Spence et al.,2005). Using the averaged DWMwind profile over 25 years, fora P11 type eruption the deposit thickness in Ponta Delgadawould be 24.9 cm (Fig. 11d).
5. The caldera and its effects on pyroclasticdensity currents distribution
The strong relief of the Sete Cidades caldera and itssurroundings are likely to have a marked influence on thedistribution of PDCs from future eruptions. In order to quantifythe effect of the caldera on small volume PDCs the simplemacro of Toyos et al. (2006) was used. This macro is based onthe energy line concept (Malin and Sheridan 1982) and canpredict the potential maximum run-out of individual PDCs withvolumes up to 107 m3. Both those PDCs formed by domecollapse and those derived from fountain collapse (at heights of∼500 m) can be considered. The macro outputs maximumpotential runout not inundation areas. It provides an approx-imation of the potential movement of PDCs.
Runs of the macro with the vent located in Caldeira Secawith fountain collapse heights of 500 m (Fig. 12a) show thatPDCs b106 m3 would be contained within the caldera. PDCswith volumes of N106 m3 would travel down the first few km ofthe west southwest flank only. Individual PDCs with volumes of107 m3 would reach the sea to the west but still be confinedwithin the caldera from north through east to South. Verificationof these results can be made from examining the geologicalevidence for PDCs within the P17 deposits, where abundantPDC deposits occur on the west and southwest rim of thecaldera and flank of the volcano (see Fig. 3f). These PDC
Fig. 12. Maps showing maximum potential runout for pyroclastic densitycurrents for three different vent locations. (a) vent location in the centre ofCaldeira Seca (P17 vent) (b) vent location in the centre of the caldera (near to aprobable vent location for P8) (c) vent location near Lagoa Rasa (near P11 ventlocation). Each map shows maximum potential runout for individual pyroclasticdensity currents of 105, 106 and 107 m3 for a fountain collapse height of 500 mabove the caldera floor.
590 P.D. Cole et al. / Journal of Volcanology and Geothermal Research 178 (2008) 574–591
deposits have a similar distribution to those generated by themacro, thus supporting the results.
Identical runs of the model for a vent located within thecentre of the caldera (Fig. 12b) show that all PDCs up to andincluding a volume of 107 m3 would be confined within thecaldera. This highlights the possibility that although PDCs arelikely to be associated with an explosive eruption they may notescape from the confines of the caldera. We speculate that theP8 event might be an example of such an eruption as it has nogeological evidence for PDCs outside the caldera.
To assess the distribution of PDCs associated with a P11 typeeruption runs of the model were made with Lagoa Rasa as thevent (Fig. 12c). This shows that the maximum runout of PDCsis to the south and northeast. It is also notable that the rift zoneto the southeast has apparently blocked the PDCs. Within theUSU of the P11 deposits there is some evidence of PDCs. Inaddition isopach maps of the USU also show a minor dispersalaxis to southwest and northeast. Therefore PDCs might partlyexplain the bimodal isopach distribution of the P11 deposits andprovide some verification for the results of the PDC macro.
8. Discussion and conclusions
The pyroclastic deposits described here are considered torepresent the likely range of future explosive events from SeteCidades volcano. Much larger eruptions, such as caldera-forming events, could take place in the future but these are notconsidered here. The deposits described in this paper vary fromthose dominated by ash (e.g. P17) to those with more pumicelapilli fallout (P11— LPU) or alternating ash and pumice lapillilayers (P8 and P11 — USU). The implication is that ash-richdeposits represent hydrovolcanic activity whereas lapilli-richdeposits are the result of magmatic activity.
Ponta Delgada lies 13 km downwind of the centre of thecaldera of Sete Cidades therefore tephra fallout will be animportant hazard associated with any explosive eruption at SeteCidades. We modelled tephra fallout with HAZMAP, an ad-vection diffusion model, based on parameters derived from fieldstudies of these deposits. Most of Sete Cidades eruptions aremultiphase events and further complexities are added by the factthat the majority of recent eruptions at Sete Cidades are ash-rich.Evidence indicates that this ash may have been derived fromhydrovolcanism and would have been wet. Several assumptionsand simplifications have had to be made to account for thesecomplexities. First, the HAMAP tephra fallout model can onlyestimate the dispersal of dry magmatic tephra, and as aconsequence the load of ash is likely to be underestimated fora given thickness as the ash could well be wet increasing the loadon structures. Second, in our modelling presented in this papercumulative volumes, for the whole eruption, have beenconsidered, as volumes for single phases in multiphase eventswould be inappropriate from a hazard point of view i.e. theywould underestimate the total likely tephra fall from an eruption.
Dry tephra fallout associated with an eruption of magnitudesimilar to the P17 or P8 eruption is unlikely to produce roofcollapse (probability b5%). Driving and general habitationconditions are, however, likely to be poor and the airport is likely
to be out of action. An eruption of P11 magnitude on the otherhand is much more likely to generate roof collapse within townssuch as Ponta Delgada, Rabo de Peixe, Ribeira seca, Riberinhaand Logoa for example. The season during which the eruptiontakes place also has an effect on the probability of the thicknessof tephra across the island of Sao Miguel.
PDCs form the most hazardous phenomena associated withexplosive eruptions. There is evidence of PDCs occurringassociated with both the P11 and P17 eruption. Abundantevidence of PDCs within the deposits of the P17 eruption onthe western flank of Sete Cidades suggest that the location ofthe eruptive vent close to the edge of the caldera was importantin governing their distribution on the flank. Simple modellingusing the energy-line concept supports this proposal, moreoverthe steep relief of the caldera and the surrounding topography,such as the southeast rift zone extending away from SeteCidades can be effective barriers to PDCs depending on thevent location. As a consequence anywhere inside the calderaand towns and villages on the immediate flanks of volcanoincluding Feteiras, Candelaria, Ginetes, Mosteiros, Bretanhaand Remedios could be impacted by PDCs from an explosiveeruption taking place within the caldera. However there is noinformation available to indicate from where the next eruptionwill occur from within the caldera.
Acknowledgement
This research was funded by EU EXPLORIS Framework Vproject number EVR1-2001-00047. Steve Self and AngusDuncan are thanked for constructive reviews which improvedthe paper. Delioma Oramas Dorta and Guillermo Toyosprovided valuable field assistance at various times.
References
Armienti, P., Macedonio, G., Pareschi, M.-T., 1988. A numerical model forsimulation of tephra transport and deposition applications to May 18, 1980,Mount St-Helens eruption. J. Geophys. Res. 93 (B6), 6463–6476.
Bonadonna, C., Mayberry, G.C., Calder, E.S., Sparks, R.S.J., Choux, C.,Jackson, P., Lejeune, A.M., Loughlin, S.C., Norton, G.E., Rose, W.I., Ryan,G., Young, S.R., 2002a. Tephra falloutin the eruption of Soufriere HillsVolcano, Montserrat Montserrat. In: Druitt, T.H., Kokelaar, B.P. (Eds.), Theeruption of Soufrière Hills Volcano, Montserrat, from 1995 to 1999.Geological Society, London, Memoir, pp. 483–516.
Bonadonna, C., Macedonio, G., Sparks, R.S.J., 2002b. Numerical modelling oftephra fallout associated with dome collapses and vulcanian explosions:application to hazard assessment on Montserrat. In: Druitt, T.H., Kokelaar,B.P. (Eds.), The Eruption of Soufrière Hills Volcano, Montserrat, from 1995to 1999, 21. Geological Society, London, Memoirs, pp. 517–537.
Booth, B., Walker, G.P.L., Croasdale, R., 1978. A quantitative study of fivethousand years of volcanism on Sao Miguel, Azores. Philos. Trans. R. Soc.Lond. Ser. A 228, 271–319.
Booth, B., Croasdale, R., Walker, G.P.L., 1983. Volcanic hazard on São Miguel,Açores. In: Tazieff, H., Sabroux, J.C. (Eds.), Forecasting Volcanic Events.Developments in Volcanology, 1. Elsevier, Amsterdam, pp. 99–109.
Carey, S., Sparks, R.S.J., 1986. Quantitative models of the fallout and dispersalof tephra from volcanic eruption columns. Bull. Volcanol. 48, 109–125.
Cole, P.D., Queiroz, G.,Wallenstein, N., Gaspar, J.L., Duncan, A.M., Guest, J.E.,1995. An historic subplinian to phreatomagmatic eruption: the 1630 eruptionof Furnas volcano, Sao Miguel, Azores. J. Volcanol. Geotherm. Res. 69,117–135.

591P.D. Cole et al. / Journal of Volcanology and Geothermal Research 178 (2008) 574–591
Cole, P.D., Guest, J.E., Queiroz, G., Wallenstein, N., Pacheco, J.L., Gaspar, J.L.,Ferreira, T., Duncan, A.M., 1999. Styles of volcanism and volcanic hazards onFurnas volcano, Sao Miguel, Azores. J. Volcanol. Geotherm. Res. 92, 39–53.
Folch, A., Felpeto, A., 2005. A coupled model for dispersal of tephra duringsustained explosive eruptions. J. Volcanol. Geotherm. Res. 145, 337–349.
Fierstein, J., Nathenson, M., 1992. Another look at the calculation of fallouttephra volumes. Bull. Volcanol. 54, 156–167.
Gonçalves, P., 2006. Caracterização do depósito Sete-P11 (Sete Cidades, S.Miguel, Açores): Implicações para a história eruptiva. MSc thesis, AzoresUniversity, 114p.
Guest, J.E., Gaspar, J.L., Cole, P.D., Queiroz, G., Duncan, A.M., Wallenstein,N., Ferreira, T., Pacheco, J.M., 1999. Volcanic Geology of Furnas Volcano,São Miguel, Açores. J. Volcanol. Geotherm. Res. 92, 1–29.
Kistler, R., Kalnay, E., Collins, W., Saha, S., White, G., Woollen, J., Chelliah,M., Ebisuzaki, W., Kanamitsu, M., Kousky, V., van den Dool, H., Jenne, R.,Fiorino, 2001. The NCEP-NCAR 50-Year Reanalysis: Monthly Means CD-ROM and Documentation. Bull. Am. Meteorol. Soc. 82, 247–268.
Macedonio, G., Costa, A., Longo, A., 2005. A computer model for volcanic ashfallout and assessment of subsequent hazard. Comput. Geosci. 31, 837–845.
Malin, M.C., Sheridan, M.F., 1982. Computer-Assisted mapping of pyroclasticsurges. Science 217, 637–640.
Moore, R.B., Rubin, M., 1991. Radiocarbon dates for lava flows and pyroclasticdeposits on Sao Miguel, Azores. Radiocarbon 33, 151–164.
Pacheco, J.M., 2001. Processos associados ao desenvolvimento de erupçõesvulcânicas hidromagmáticas explosivas na ilha do Faial e sua interpretaçãonuma perspectiva de avaliação do hazard e minimização do risco. PhDThesis. Universidade dos Açores, 330p.
Pomonis, A., Spence, R.J.S., Baxter, P.J., 1999. Risk assessment of residentialbuildings for an eruption of Furnas Volcano, São Miguel, the Azores.J. Volcanol. Geotherm. Res. 92, 107–131.
Pyle, D.M., 1989. The thickness, volume and grainsize of tephra fall deposits.Bull. Volcanol. 51, 1–15.
Queiroz, G., 1997 Vulcão das Sete Cidades (S. Miguel, Açores) HistóriaEruptiva e Avaliação do Hazard. Unpublished PhD Thesis. Universidade doAçores, 226p.
Queiroz, G., Pacheco, J.-M., Gaspar, J.L., Aspinall, W.P., Guest, J.E., Ferreira,T., 2008. The last 5000 years of activity at Sete Cidades volcano (S. MiguelIsland, Azores): implications for hazard assessment. J. Volcanol. Geotherm.Res. 178, 562–573 (this volume).
Self, S., 1976. TheRecent volcanology of Terceira, Azores. J. Geol. Soc. Lond. 132,645–666.
Shotton, F.W., Williams, R.E.G., 1971. Birmingham University Radiocarbondates III. Radiocarbon 11, 266.
Sparks, R.S.J., 1986. The dimensions and dynamics of volcanic eruption co-lumns. Bull. Volcanol. 48, 3–15.
Spence,R.J.S., Kelman, I., Calogero, E., Toyos,G., Baxter, P.J., Komorowski, J.-C.,2005. Modelling expected physical impacts and human casualties fromexplosive volcanic eruptions. NaturalHazards andEarth SystemScience, vol. 5,pp. 1003–1015.
Toyos, G., Cole, P.D., Felpeto, A., Marti, J., 2006. A GIS-based methodology forhazardmapping of small volume pyroclastic density currents. Nat. Hazards 41,99–112.
Walker, G.P.L., Croasdale, R., 1971. Two plinian type eruptions in the Azores.J. Geol. Soc. Lond. 127, 17–55.
Wallenstein, N., 1999. Estudo da história recente e do comportamento eruptivodo Vulcão do Fogo (S. Miguel, Açores). Avaliação preliminar do hazard.PhD Thesis. Universidade dos Açores 266p.