
Continuous monitoring of absolute cerebral blood flow by combining diffuse correlation spectroscopy...
9
doi: 10.1152/japplphysiol.01458.2010 110:1691-1698, 2011. First published 31 March 2011; J Appl Physiol Diop, Miguel Arango, Ting-Yim Lee and Keith St. Lawrence Joel A. Cooper, Kenneth M. Tichauer, Melfort Boulton, Jonathan Elliott, Mamadou temporary vessel occlusion near-infrared spectroscopy during global and focal Continuous monitoring of absolute cerebral blood flow by You might find this additional info useful... 34 articles, 10 of which you can access for free at: This article cites http://jap.physiology.org/content/110/6/1691.full#ref-list-1 including high resolution figures, can be found at: Updated information and services http://jap.physiology.org/content/110/6/1691.full can be found at: Journal of Applied Physiology about Additional material and information http://www.the-aps.org/publications/jappl This information is current as of January 6, 2013. http://www.the-aps.org/. © 2011 the American Physiological Society. ISSN: 8750-7587, ESSN: 1522-1601. Visit our website at year (monthly) by the American Physiological Society, 9650 Rockville Pike, Bethesda MD 20814-3991. Copyright physiology, especially those papers emphasizing adaptive and integrative mechanisms. It is published 12 times a publishes original papers that deal with diverse area of research in applied Journal of Applied Physiology at Dartmouth-Hitchcock Med Ctr on January 6, 2013 http://jap.physiology.org/ Downloaded from
Transcript of Continuous monitoring of absolute cerebral blood flow by combining diffuse correlation spectroscopy...
doi: 10.1152/japplphysiol.01458.2010110:1691-1698, 2011. First published 31 March 2011;J Appl Physiol
Diop, Miguel Arango, Ting-Yim Lee and Keith St. LawrenceJoel A. Cooper, Kenneth M. Tichauer, Melfort Boulton, Jonathan Elliott, Mamadoutemporary vessel occlusionnear-infrared spectroscopy during global and focal Continuous monitoring of absolute cerebral blood flow by
You might find this additional info useful...
34 articles, 10 of which you can access for free at: This article citeshttp://jap.physiology.org/content/110/6/1691.full#ref-list-1
including high resolution figures, can be found at: Updated information and serviceshttp://jap.physiology.org/content/110/6/1691.full
can be found at: Journal of Applied Physiology about Additional material and informationhttp://www.the-aps.org/publications/jappl
This information is current as of January 6, 2013.
http://www.the-aps.org/. © 2011 the American Physiological Society. ISSN: 8750-7587, ESSN: 1522-1601. Visit our website at year (monthly) by the American Physiological Society, 9650 Rockville Pike, Bethesda MD 20814-3991. Copyrightphysiology, especially those papers emphasizing adaptive and integrative mechanisms. It is published 12 times a
publishes original papers that deal with diverse area of research in appliedJournal of Applied Physiology
at Dartm
outh-Hitchcock M
ed Ctr on January 6, 2013
http://jap.physiology.org/D
ownloaded from

Continuous monitoring of absolute cerebral blood flow by near-infraredspectroscopy during global and focal temporary vessel occlusion
Joel A. Cooper,1,2 Kenneth M. Tichauer,2,3 Melfort Boulton,1 Jonathan Elliott,2,3 Mamadou Diop,2,3
Miguel Arango,4 Ting-Yim Lee,2,3,5 and Keith St. Lawrence2,3
Departments of 1Medicine, 3Medical Biophysics, and 4Anesthesia and Perioperative Medicine, University of Western Ontario,2Imaging Division, Lawson Health Research Institute, and 5Imaging Research Laboratories, Robarts Research Institute,London, Ontario, Canada
Submitted 17 December 2010; accepted in final form 17 March 2011
Cooper JA, Tichauer KM, Boulton M, Elliott J, Diop M, ArangoM, Lee T, St. Lawrence K. Continuous monitoring of absolute cerebralblood flow by near-infrared spectroscopy during global and focal temporaryvessel occlusion. J Appl Physiol 110: 1691–1698, 2011. First publishedMarch 31, 2011; doi:10.1152/japplphysiol.01458.2010.—Treatment of in-tracranial aneurysms by surgical clipping carries a risk of intraopera-tive ischemia, caused mainly by prolonged temporary occlusion ofcerebral arteries. The objective of this study was to develop anear-infrared spectroscopy (NIRS) technique for continuous monitor-ing of cerebral blood flow (CBF) during surgery. With this approach,cerebral hemodynamics prior to clipping are measured by a bolus-tracking method that uses indocyanine green as an intravascularcontrast agent. The baseline hemodynamic measurements are thenused to convert the continuous Hb difference (HbD) signal (HbD �oxyhemoglobin � deoxyhemoglobin) acquired during vessel occlu-sion to units of CBF. To validate the approach, HbD signal changes,along with the corresponding CBF changes, were measured in pigsfollowing occlusion of the common carotid arteries or a middlecerebral artery. For both occlusion models, the predicted CBFchange derived from the HbD signal strongly correlated with themeasured change in CBF. Linear regression of the predicted andmeasured CBF changes resulted in a slope of 0.962 (R2 � 0.909)following carotid occlusion and 0.939 (R2 � 0.907) followingmiddle cerebral artery occlusion. These results suggest that cali-brating the HbD signal by baseline hemodynamic measurementsprovides a clinically feasible method of monitoring CBF changesduring neurosurgery.
indocyanine green; hemoglobin difference; neurovascular surgery
CEREBRAL ANEURYSMS ARE PRESENT in 3–6% of the populationand rupture at a rate of �0.12% per year (35). The majorclinical manifestation, subarachnoid hemorrhage, is associatedwith an extremely poor prognosis and leaves more than half ofsurvivors with permanent mental and physical disabilities (29).An established treatment of intracranial aneurysms is surgicalplacement of an aneurysm clip (19). However, surgical aneu-rysm clipping carries a risk of intraoperative stroke primar-ily due to temporary vessel occlusion, a technique used tofacilitate aneurysm dissection and clipping by decreasingrisk of rupture (36). The current practice is to limit theduration of vessel occlusion to �15–20 min; however, theincidence of postoperative stroke remains at 5–11% (24, 27).The limitation with these guidelines is that the severity ofischemia varies between patients, depending on the extent ofcollateral blood supply (25, 30). Removing this uncertainty
requires a cerebral monitoring technique to provide the surgicalteam with a continuous assessment of tissue perfusion.
Near-infrared spectroscopy (NIRS) is emerging as a prom-ising technique for assessing brain function during surgery (1,3, 7, 18). However, NIRS has yet to be established as anaccepted monitoring technique, in part because of large inter-subject variations in blood oxygenation measures, such as thetissue oxygenation index (10, 23). Furthermore, interpretingblood oxygenation in terms of altered metabolic demand and/orO2 delivery is difficult without knowledge of the underlyingparameters that control it, namely, cerebral blood flow (CBF),cerebral blood volume (CBV), and cerebral metabolic rate ofO2 (CMRO2
).Our group has developed a technique for measuring CBF
using a light-absorbing dye, indocyanine green (ICG), as aNIRS contrast agent. This technique has been validated in threeseparate studies by comparison with perfusion measurementsobtained by computer tomography (5, 9, 11). The method relieson measuring the passage of ICG through brain tissue over aperiod of typically 40 s following a rapid intravenous injectionof the dye. Although this approach is quantitative, it does notprovide adequate temporal resolution for monitoring CBF duringbrief periods of temporary vessel occlusion, since a delay of�5–10 min is required between injections to allow time for ICGclearance. To overcome this limitation, we propose to combineour discrete method with continuous monitoring of cerebral bloodoxygenation, as it has been observed that the Hb difference (HbD)signal, i.e., oxyhemoglobin concentration ([HbO2]) � deoxyhe-moglobin concentration ([HHb]), may be used as a surrogatemarker of CBF changes (28, 34). The advantage of combiningthese techniques is that the continuous HbD signal can be con-verted to units of CBF (ml·min�1·100 g�1) by use of the mea-surements of basal CBF and CBV obtained with the ICG tech-nique, thus providing a window into cerebral hemodynamic sta-bility during temporary vessel occlusion.
This study includes two sets of experiments. The first wasdesigned to assess the relationship between HbD and CBFduring reductions in global blood flow caused by clamping thecommon carotid arteries in newborn piglets. CBF was mea-sured by the ICG technique before and after clamping of thearteries for comparison with the corresponding change in HbD.CBV and CMRO2
were simultaneously measured to determinehow the main parameters relevant to HbD changed with arterialocclusion (4). This animal model was chosen, as our groupused it previously to validate the NIRS hemodynamic andmetabolic measurements (31, 33). The second set of experi-ments was designed to mimic the procedure employed duringaneurysm surgery. Temporary occlusion of the middle cerebral
Address for reprint requests and other correspondence: K. St. Lawrence,Imaging Division, Lawson Health Research Institute, 268 Grosvenor St.,London, ON, Canada N6A 4V2 (e-mail: [email protected]).
J Appl Physiol 110: 1691–1698, 2011.First published March 31, 2011; doi:10.1152/japplphysiol.01458.2010.
8750-7587/11 Copyright © 2011 the American Physiological Societyhttp://www.jap.org 1691
at Dartm
outh-Hitchcock M
ed Ctr on January 6, 2013
http://jap.physiology.org/D
ownloaded from
arteries (MCAs) was used to induce focal ischemia in weanlingpiglets (17). Older pigs were chosen for these experiments toprovide better visualization of the MCAs. Absolute CBF wasmeasured using the ICG technique before and after MCAocclusion, and the change in CBF was compared with thechange in HbD.
MATERIALS AND METHODS
Animal Preparation and Physiological Monitoring
Studies were approved by the Council on Animal Care at theUniversity of Western Ontario. Newborn Duroc piglets (n � 7) wereused for the carotid occlusion experiments, and Duroc weanlingpiglets (n � 6) were used for the MCA temporary occlusion experi-ments. Animals were delivered from a local supplier on the morningof the experiment. Anesthesia was induced and surgery was per-formed using 3% isoflurane. Animals were tracheotomized and me-chanically ventilated. A cannula was inserted into an ear vein forinjections of ICG, and another cannula was inserted into a femoralartery for continuous monitoring of mean arterial pressure (MAP) andcollection of arterial blood samples for gas and glucose analysis.Experiments were commenced �45 min after surgery to allow theanimal to stabilize.
Arterial PCO2 was monitored throughout the experiments, eitherdirectly from blood samples or by monitoring end-tidal PCO2, and wasmaintained between 37 and 42 Torr by adjustment of the breathingrate and volume. Arterial PO2 was maintained at normoxia (90–130Torr) by adjustment of the inhaled ratio of O2 to medical air. ArterialO2 saturation (SaO2) and heart rate (HR) were continuously monitoredby pulse oximetry. A heated water blanket was used to maintain rectaltemperature at 37.5–38.5°C. Blood glucose level was monitoredintermittently, and a 2-ml infusion of 25% dextrose solution wasadministered intravenously if the glucose concentration fell below 3mM. Arterial pH (pHa) was measured at the end of the surgicalprocedure.
Experimental Procedure
Carotid occlusion model. To induce global cerebral ischemia,vascular occluders (In Vivo Metric, Healdsburg, CA) were placedaround both carotid arteries, proximal to the carotid bifurcation. Aftersurgery, isoflurane was reduced to 1.75%, and piglets were positionedinto a frame used to fix the NIRS probes. The NIRS probes werepositioned on the top of the head, parasagittally, at a source-detectordistance of 3 cm. Because the skull is fairly thin in the newborn piglet,it is assumed that signal contamination from the extracerebral tissuesis negligible.
To measure CBF, CBV, and CMRO2 at different levels, global CBFwas reduced in two steps: 1) by inflation of a single carotid occluderto cause unilateral occlusion and 2) by inflation of the remainingoccluder to cause bilateral carotid occlusion. The duration of each stepwas 10 min, and CBF was restored at the end of the second step bydeflation of the occluders. In four of the seven piglets, the procedurewas performed twice, with a 10-min delay between runs to allow CBFto recover. Once before clamping and again at the 2-min mark of eachstep, a bolus injection of ICG (0.1 mg/kg) was administered tomeasure CBF and CBV. The hemodynamic data were combined with[HHb] measurements at the time of ICG injection to determine theCMRO2.
MCA temporary occlusion model. To produce focal cortical ische-mia, temporary clipping of the MCA was accomplished through aposterior orbital approach (17). A circumferential incision around theorbit was made using monopolar cautery for hemostasis. The superiororbital rim and orbital roof were removed with rongeurs, with partic-ular attention paid to maintaining an intact dura. Under microscopeassistance, boney resection of the orbit continued posteriorly. Once
the resection was completed, the dura was opened to expose the twoor three MCAs and feeding vessels to the MCA territory. Gauzemoistened with isotonic saline replaced the orbital contents duringCBF measurements. The craniotomy was enlarged to expose thecortex supplied by the MCAs and to place the NIRS probes directly onthe dura. This avoided signal contamination from the relatively thickskull of the weanling pig, which can substantially reduce the accuracyof NIRS measurements. The probes were held firmly in position bytwo semirigid stabilizing arms with a 2.5-cm source-detector separa-tion. Because of the invasive nature of the procedure, isoflurane wasmaintained at 2.5–3% after surgery and augmented by a continualfentanyl infusion (0.03 mg·kg�1·h�1).
After surgery, three bolus injections of ICG (0.1 mg/kg), eachseparated by 10 min, were administered to establish baseline CBF.Cortical ischemia was induced by placement of temporary clips overthe MCAs. Because of the natural variation in the number of arteriessupplying the MCA territory in the swine, which has been reportedpreviously (20), two to five MCA clips were required to establishfocal ischemia. After vessel occlusion, CBF was measured at 1 and 10min by the ICG technique. After 10–15 min, the clips were removedto restore blood flow to the area, and CBF was again measured threetimes with the ICG technique. Changes in [HbO2] and [HHb] weremeasured continuously throughout the experiment. For comparisonwith the change in CBF, the change in HbD was averaged over 10 sof data acquired just prior to each ICG measurement.
NIRS
The NIRS data were collected using a continuous-wave, broadbandsystem composed of a tungsten light source (filtered to 600–980 nm),two fiber-optic bundles for light transmission and detection, and aspectrometer. The spectrometer consisted of a holographic gratinghoused in a light-tight box attached to a cooled charge-coupled device(Wright Instruments). Attenuation spectra were collected at a sam-pling rate of 5 Hz and converted to changes in [HbO2] and [HHb] byfitting the modified Beer-Lambert law to changes in attenuation
�A��� � �i
�ciDP�i��� (1)
where �A(�) is the change in attenuation as a function of wavelength(�) and time (t), �ci is the change in concentration of the ith NIRabsorber, DP is the differential path length, and εi(�) is the extinctioncoefficient of the ith NIR absorber as a function of �. The DP wasdetermined using second differential analysis, calibrated to an as-sumed water concentration in brain of 90% for the weanling pigs and85% for the newborn piglets (22). This enabled changes in absolute[HbO2] and [HHb] (i.e., in units of �M) to be determined.
NIRS Methods for Measuring Cerebral Physiology
CBF and CBV were determined by tracking the passage of ICGthrough the brain following a bolus injection (0.1 mg/kg) into an earvein (5). The time-varying concentration of ICG in brain, Q(t), wasdetermined from the temporal change in light attenuation (Eq. 1) andis related to CBF by
Q�t� � CBF · Ca�t� � R�t� (2)
where � refers to the convolution operator, R(t) is the impulse residuefunction, and Ca(t) is the arterial concentration of ICG, which wasmeasured by a dye densitogram (model DDG-2001 A/K, NihonKohden, Tokyo, Japan) attached to the animal’s tail. The tissue andarterial blood ICG concentration-time curves were acquired over a70-s period. A deconvolution routine was used to determine theproduct CBF·R(t), from which the initial height equals CBF and areaunder the function equals CBV (39).
The change in HbD concentration ([HbD]) at a given t {i.e.,�HbD(t) � [HbD(t)] � [HbD(0)]} was converted to CBF by
1692 CONTINUOUS MONITORING OF CBF DURING NEUROSURGERY BY NIRS
J Appl Physiol • VOL 110 • JUNE 2011 • www.jap.org
at Dartm
outh-Hitchcock M
ed Ctr on January 6, 2013
http://jap.physiology.org/D
ownloaded from
CBF�t� � CBF�0� · �1 � �HbD�t� ⁄ �� (3)
where CBF(0) refers to baseline blood flow and �HbD(t) was con-verted to units of g/ml, with the assumption of a molecular weight of64,500. The parameter � is a normalization factor given by2[tHb]CBV·RHctfv, where [tHb] is the total Hb (tHb) concentration, is the density of brain tissue (1.05 g/ml), RHct is the small-to-largevessel hematocrit ratio (0.85) (26), and fv is the assumed venous bloodfraction (0.75) (32). The factor 2 and fv arise from the relationshipbetween �HbD(t) and O2 consumption derived by the Fick principle.In general, �HbD(t) depends on the relationships between CBF, CBV,and CMRO2. Equation 3 was derived assuming a simple power lawrelationship between CBF and CMRO2 and a constant CBV (seeAPPENDIX).
CMRO2 was determined from the Fick principle using the NIRSmeasurement of absolute [HHb] to define the venous O2 concentration(4). The venous [HHb] was determined by normalizing [HHb] by thedilution factor CBV and fv.
Statistical Analysis
Values are means SD. A common regression analysis could notbe used to determine the correlation between CBF and HbD, becausemultiple measurements were acquired from the same animal. Toaccount for the difference between the number of piglets and thenumber of data points, a variation of the generalized estimatingequation method was utilized (38). 1) A linear fit was applied to thedata from each piglet individually. 2) A significant correlation was
tested by using a t-test to compare the average of the distribution ofslopes with the null hypothesis (i.e., a slope � 0). 3) The distributionof slopes was compared with a slope of 1 to determine the agreementof the correlation with the line of identity. Results were consideredstatistically significant for P � 0.05. All statistical analyses wereperformed using SPSS version 15.0 (SPSS, Chicago, IL).
RESULTS
The average weights of the animals were 1.84 0.46 and10.63 0.56 kg in the carotid occlusion and MCA occlusionexperiments, respectively. HR was 140–170 beats/min andMAP was 37–45 mmHg in the newborn piglets and 120–180beats/min and 35 to 60 mmHg in the weanling pigs, respec-tively. For the carotid occlusion experiments, baseline pHa andtHb were 7.36 0.04 and 7.55 1.31 g/dl, respectively. Forthe MCA occlusion experiments, baseline pHa and tHb were7.45 0.04 and 8.48 0.94 g/dl, respectively. No significantchanges from baseline were observed in any of the physiolog-ical parameters throughout the study.
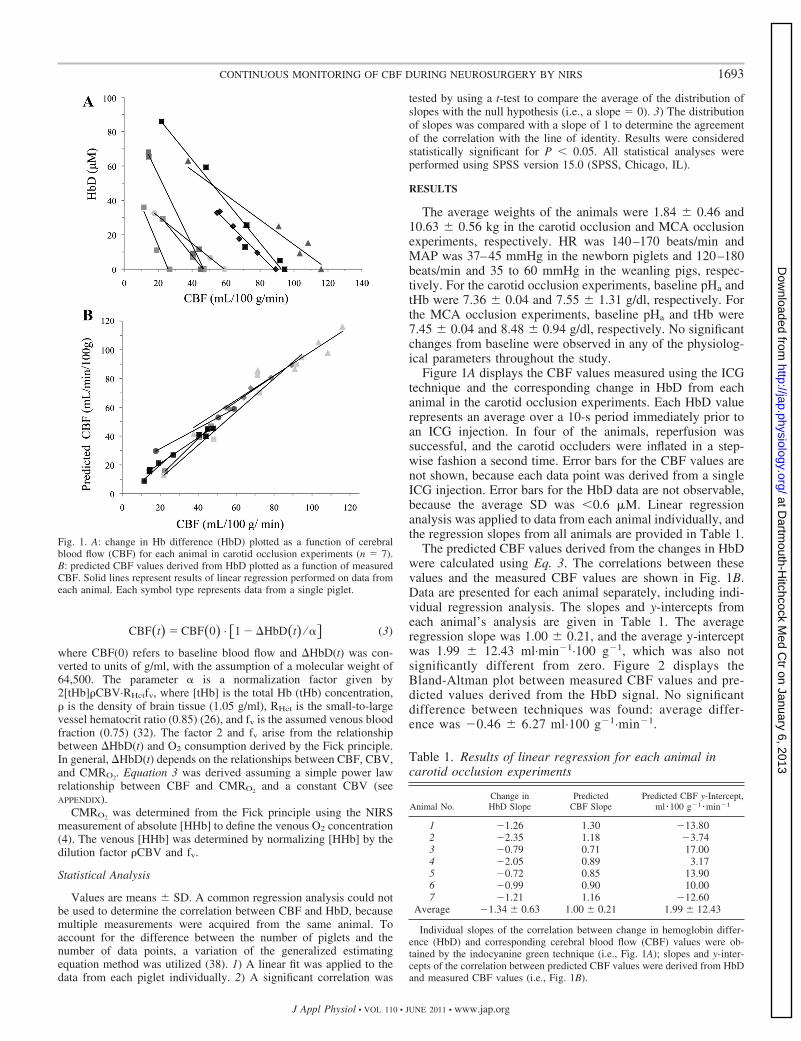
Figure 1A displays the CBF values measured using the ICGtechnique and the corresponding change in HbD from eachanimal in the carotid occlusion experiments. Each HbD valuerepresents an average over a 10-s period immediately prior toan ICG injection. In four of the animals, reperfusion wassuccessful, and the carotid occluders were inflated in a step-wise fashion a second time. Error bars for the CBF values arenot shown, because each data point was derived from a singleICG injection. Error bars for the HbD data are not observable,because the average SD was �0.6 �M. Linear regressionanalysis was applied to data from each animal individually, andthe regression slopes from all animals are provided in Table 1.
The predicted CBF values derived from the changes in HbDwere calculated using Eq. 3. The correlations between thesevalues and the measured CBF values are shown in Fig. 1B.Data are presented for each animal separately, including indi-vidual regression analysis. The slopes and y-intercepts fromeach animal’s analysis are given in Table 1. The averageregression slope was 1.00 0.21, and the average y-interceptwas 1.99 12.43 ml·min�1·100 g�1, which was also notsignificantly different from zero. Figure 2 displays theBland-Altman plot between measured CBF values and pre-dicted values derived from the HbD signal. No significantdifference between techniques was found: average differ-ence was �0.46 6.27 ml·100 g�1·min�1.
Fig. 1. A: change in Hb difference (HbD) plotted as a function of cerebralblood flow (CBF) for each animal in carotid occlusion experiments (n � 7).B: predicted CBF values derived from HbD plotted as a function of measuredCBF. Solid lines represent results of linear regression performed on data fromeach animal. Each symbol type represents data from a single piglet.
Table 1. Results of linear regression for each animal incarotid occlusion experiments
Animal No.Change inHbD Slope
PredictedCBF Slope
Predicted CBF y-Intercept,ml � 100 g�1 � min�1
1 �1.26 1.30 �13.802 �2.35 1.18 �3.743 �0.79 0.71 17.004 �2.05 0.89 3.175 �0.72 0.85 13.906 �0.99 0.90 10.007 �1.21 1.16 �12.60
Average �1.34 0.63 1.00 0.21 1.99 12.43
Individual slopes of the correlation between change in hemoglobin differ-ence (HbD) and corresponding cerebral blood flow (CBF) values were ob-tained by the indocyanine green technique (i.e., Fig. 1A); slopes and y-inter-cepts of the correlation between predicted CBF values were derived from HbDand measured CBF values (i.e., Fig. 1B).
1693CONTINUOUS MONITORING OF CBF DURING NEUROSURGERY BY NIRS
J Appl Physiol • VOL 110 • JUNE 2011 • www.jap.org
at Dartm
outh-Hitchcock M
ed Ctr on January 6, 2013
http://jap.physiology.org/D
ownloaded from
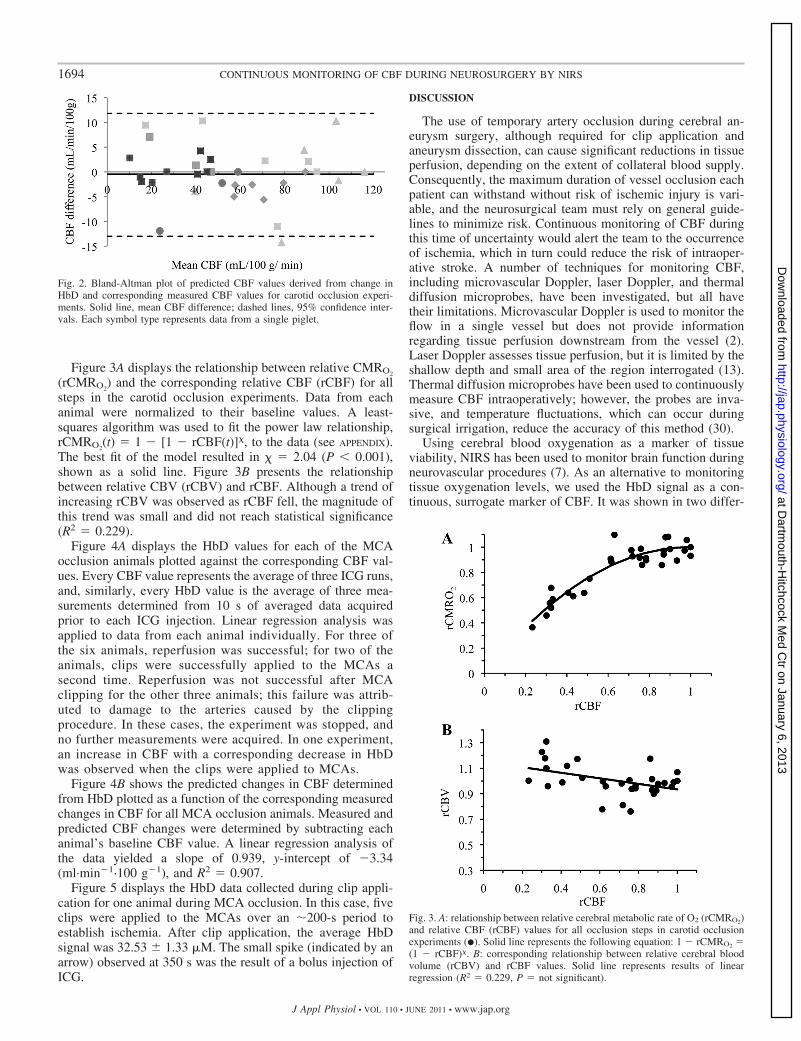
Figure 3A displays the relationship between relative CMRO2
(rCMRO2) and the corresponding relative CBF (rCBF) for all
steps in the carotid occlusion experiments. Data from eachanimal were normalized to their baseline values. A least-squares algorithm was used to fit the power law relationship,rCMRO2
(t) � 1 � [1 � rCBF(t)]�, to the data (see APPENDIX).The best fit of the model resulted in � � 2.04 (P � 0.001),shown as a solid line. Figure 3B presents the relationshipbetween relative CBV (rCBV) and rCBF. Although a trend ofincreasing rCBV was observed as rCBF fell, the magnitude ofthis trend was small and did not reach statistical significance(R2 � 0.229).
Figure 4A displays the HbD values for each of the MCAocclusion animals plotted against the corresponding CBF val-ues. Every CBF value represents the average of three ICG runs,and, similarly, every HbD value is the average of three mea-surements determined from 10 s of averaged data acquiredprior to each ICG injection. Linear regression analysis wasapplied to data from each animal individually. For three ofthe six animals, reperfusion was successful; for two of theanimals, clips were successfully applied to the MCAs asecond time. Reperfusion was not successful after MCAclipping for the other three animals; this failure was attrib-uted to damage to the arteries caused by the clippingprocedure. In these cases, the experiment was stopped, andno further measurements were acquired. In one experiment,an increase in CBF with a corresponding decrease in HbDwas observed when the clips were applied to MCAs.
Figure 4B shows the predicted changes in CBF determinedfrom HbD plotted as a function of the corresponding measuredchanges in CBF for all MCA occlusion animals. Measured andpredicted CBF changes were determined by subtracting eachanimal’s baseline CBF value. A linear regression analysis ofthe data yielded a slope of 0.939, y-intercept of �3.34(ml·min�1·100 g�1), and R2 � 0.907.
Figure 5 displays the HbD data collected during clip appli-cation for one animal during MCA occlusion. In this case, fiveclips were applied to the MCAs over an �200-s period toestablish ischemia. After clip application, the average HbDsignal was 32.53 1.33 �M. The small spike (indicated by anarrow) observed at 350 s was the result of a bolus injection ofICG.
DISCUSSION
The use of temporary artery occlusion during cerebral an-eurysm surgery, although required for clip application andaneurysm dissection, can cause significant reductions in tissueperfusion, depending on the extent of collateral blood supply.Consequently, the maximum duration of vessel occlusion eachpatient can withstand without risk of ischemic injury is vari-able, and the neurosurgical team must rely on general guide-lines to minimize risk. Continuous monitoring of CBF duringthis time of uncertainty would alert the team to the occurrenceof ischemia, which in turn could reduce the risk of intraoper-ative stroke. A number of techniques for monitoring CBF,including microvascular Doppler, laser Doppler, and thermaldiffusion microprobes, have been investigated, but all havetheir limitations. Microvascular Doppler is used to monitor theflow in a single vessel but does not provide informationregarding tissue perfusion downstream from the vessel (2).Laser Doppler assesses tissue perfusion, but it is limited by theshallow depth and small area of the region interrogated (13).Thermal diffusion microprobes have been used to continuouslymeasure CBF intraoperatively; however, the probes are inva-sive, and temperature fluctuations, which can occur duringsurgical irrigation, reduce the accuracy of this method (30).
Using cerebral blood oxygenation as a marker of tissueviability, NIRS has been used to monitor brain function duringneurovascular procedures (7). As an alternative to monitoringtissue oxygenation levels, we used the HbD signal as a con-tinuous, surrogate marker of CBF. It was shown in two differ-
Fig. 3. A: relationship between relative cerebral metabolic rate of O2 (rCMRO2)and relative CBF (rCBF) values for all occlusion steps in carotid occlusionexperiments (�). Solid line represents the following equation: 1 � rCMRO2 �(1 � rCBF)�. B: corresponding relationship between relative cerebral bloodvolume (rCBV) and rCBF values. Solid line represents results of linearregression (R2 � 0.229, P � not significant).
Fig. 2. Bland-Altman plot of predicted CBF values derived from change inHbD and corresponding measured CBF values for carotid occlusion experi-ments. Solid line, mean CBF difference; dashed lines, 95% confidence inter-vals. Each symbol type represents data from a single piglet.
1694 CONTINUOUS MONITORING OF CBF DURING NEUROSURGERY BY NIRS
J Appl Physiol • VOL 110 • JUNE 2011 • www.jap.org
at Dartm
outh-Hitchcock M
ed Ctr on January 6, 2013
http://jap.physiology.org/D
ownloaded from

ent models of temporary vessel occlusion that the change inHbD accurately reflected the measured change in CBF. In thecarotid occlusion model, global CBF was reduced in steps, anda strong linear relationship between CBF and HbD was ob-served in all experiments (Fig. 1A). These results agree withtwo previous studies that reported a strong correlation betweenchanges in CBF and HbD during systemic hypotension (34)and increased intracranial tension (28). The general observa-tion that changes in HbD accurately reflect changes in CBF,regardless of the cause of cerebral hypoperfusion, suggests thatthe HbD signal provides an easily obtained NIRS measure ofCBF.
As an extension to the HbD method, we used NIRS mea-surements of CBF and CBV, obtained using an ICG bolus-tracking method, to calibrate the HbD signal. This dye, whichis approved by the US Federal Drug Administration, has beenused clinically for �30 years and has a high safety record, withan incidence of systemic allergic reactions of �1 in 250,000(14). The calibration consisted primarily of normalizing theHbD concentration by the tHb and CBV of each animal, and
the advantage of this step was to reduce intersubject variability.The regression slopes shown in Fig. 1A demonstrate that theslopes varied considerably between experiments, despite thestrong correlations between HbD and CBF in each experiment.By calibrating the HbD values, this variability was signifi-cantly reduced, as shown in Fig. 1B, and is also evident bycomparing the coefficient of variation for the results given inTable 1. When the changes in HbD were correlated to thecorresponding measured changes in CBF, the CV of the re-gression slope was 47%. This value was reduced to 21% whenHbD was converted to units of blood flow using Eq. 3.Reducing intersubject variability is valuable, since it wouldgive the surgical team more confidence in the predictedchanges in CBF derived from HbD.
A second advantage to measuring CBF prior to vesselocclusion is that it provides a baseline value that can be usedto assess the significance of a CBF reduction following occlu-sion. If we consider the concept of ischemic thresholds,namely, that there are critical values of CBF that discriminatebetween damaged and healthy tissue (21), the risk associatedwith a reduction in CBF would be substantially higher ifbaseline CBF was already low. In the carotid and MCAocclusion experiments, a considerable variation in baselineCBF was observed (Figs. 1A and 4A), likely due to naturalvariations between animals and brain regions, as well asdifferences in anesthetic levels. Variations in resting CBF willalso occur in patients, depending on such factors as age, health,and operating procedures. Consequently, a change of 20ml·min�1·100 g�1 could be considered more clinically signif-icant, depending on whether CBF started at 40 rather than 80ml·min�1·100 g�1.
Despite the consistent finding that changes in HbD providedan accurate measure of the underlying blood flow changes,why this relationship holds true is not obvious, considering thatcerebral blood oxygenation will depend on the responses ofCBF, CBV, and CMRO2
to vessel occlusion. This is evident bythe relationship between these parameters and HbD that wasderived from the Fick principle. In general, an inverse rela-tionship between HbD and CBF is predicted (Eq. A5 in APPEN-DIX). To explain the role of all three parameters, CBV andCMRO2
were measured at each step in the carotid occlusion
Fig. 4. A: change in HbD plotted as a function of CBF for each of 6 animalsin the middle cerebral artery (MCA) occlusion experiments. Error bars, SE;solid line, linear regression for each individual animal. B: predicted change inCBF (�CBF) plotted as a function of corresponding measured change in CBFfor all MCA occlusion experiments. Predicted values were determined fromchange in HbD, and measured values were determined using indocyaninegreen technique. In both cases, �CBF was determined by subtracting eachanimal’s baseline CBF. Linear regression is shown by solid line with slope of0.939 and y-intercept of �3.34 ml·100 g�1·min�1 (R2 � 0.907).
Fig. 5. HbD signal plotted as a function of time during an MCA occlusionexperiment. Time during clip application (5 clips) is outlined by brackets.Arrow indicates time of indocyanine green injection.
1695CONTINUOUS MONITORING OF CBF DURING NEUROSURGERY BY NIRS
J Appl Physiol • VOL 110 • JUNE 2011 • www.jap.org
at Dartm
outh-Hitchcock M
ed Ctr on January 6, 2013
http://jap.physiology.org/D
ownloaded from

experiments. The results showed a slight, but not significant,increase in CBV during reductions in CBF (Fig. 3B); therefore,it was reasonable to ignore CBV contributions to changes inHbD. Figure 6D illustrates how the relationship between HbDand CBF would be altered if there were concurrent changes inCBV. As expected, the magnitude of the deviation from thepredicted linear relationship given by Eq. 3 increases with themagnitude of the true CBF change. For example, the reductionin CBF predicted from the change in HbD would be 56%compared with the correct value of 50% if there was a 10%increase in CBV. A CBV change of this magnitude would besimilar to the data shown in Fig. 3B.
In contrast to CBV, the CMRO2data revealed sizable reduc-
tions in response to carotid clamping, and the relationshipbetween CMRO2
and CBF could be characterized by a powerlaw. This type of relationship is expected, considering thatCMRO2
would be maintained at normal levels during smallerCBF reductions by compensatory increases in O2 extraction.O2 consumption will begin to fall only when this mechanism isexhausted. An intriguing aspect of these data was that thebest-fit value of the power law coefficient (� � 2.04) wasremarkably close to the theoretical value (� � 2) required topredict a linear relationship between changes in HbD andreductions in CBF. These results demonstrate why HbD can beused as a surrogate marker of CBF during temporary vesselocclusion. However, they also indicate that caution is war-ranted if the HbD approach is adapted to other applications,considering that the accuracy of the predicted CBF valuesderived from HbD depends on the relationship between CBFand CMRO2
, as shown in Fig. 6, A and B. For example,
metabolically driven increases in CBF during functional acti-vation would not be represented by � � 2, resulting in anonlinear relationship between HbD and CBF (8).
A limitation of the current study is that the NIRS data wereacquired with single emission and detection probes. In theMCA occlusion experiments, it was necessary to estimate theplacement of the probes on the dura to detect perfusion reduc-tions in cortical regions supplied by the clipped MCAs. Thiscould have contributed to the heterogeneity in the measuredCBF responses to MCA occlusion (Fig. 4A). Blood flowreductions were �30 ml·min�1·100 g�1 in only three of the sixanimals, while an increase in CBF was measured in oneanimal. From the standpoint of assessing the HbD approach, itis interesting to note that the change in HbD also predicted anincrease in CBF in this case; however, the NIRS probes wereclearly not placed over a region affected by the MCA clips. Itis more likely that the probes were interrogating a peripheralregion experiencing hyperemia due to increased blood flow incollateral arteries. Variations in the quantity and quality ofcollateral blood flow could also affect the magnitude andspatial variation of the CBF response to vessel occlusion inpatients. Capturing the region at risk of ischemia likely re-quires regional CBF measurements. One approach is videoan-giography using ICG as a fluorescent blood flow tracer (37).This technology is able to capture images of the vasculature onthe surface of the brain, but it does not interrogate perfusiondeeper in cortical tissue. Another approach would be to use amultiprobe NIRS system capable of generating topographicalmaps (16). If the NIRS probes are placed on the dura, then thenumber of probes would be limited by the size of the craniot-
Fig. 6. A: predicted change in rCMRO2 as a function of rCBF assuming a power law relationship as follows: 1 � rCMRO2 � (1 � rCBF)�. B: correspondingchange in HbD signal derived from Eq. A7 for various values of �. C: predicted change in relative cerebral blood volume (rCBV) as a function of rCBF assuminga power law relationship as follows: rCBV � rCBF . D: corresponding change in HbD derived from Eq. A5 for various values of and assuming � � 2.
1696 CONTINUOUS MONITORING OF CBF DURING NEUROSURGERY BY NIRS
J Appl Physiol • VOL 110 • JUNE 2011 • www.jap.org
at Dartm
outh-Hitchcock M
ed Ctr on January 6, 2013
http://jap.physiology.org/D
ownloaded from
omy and the need not to interfere with the neurosurgeon.Alternatively, the NIRS probes could also be placed on thescalp, provided signal contamination from extracerebral tissuesis removed (11).
In this study, it was demonstrated using two different por-cine models that changes in HbD during vessel occlusionreflected the underlying changes in CBF. Furthermore, it wasshown that the continuous HbD signal could be converted tounits of absolute blood flow by an ICG bolus-tracking methodto measure CBF prior to occlusion. A regression slope close tounity was found when the predicted CBF changes derived fromchanges in HbD were compared with the measured change inCBF. Future goals will be to adapt this combined NIRStechnique to a multiprobe system to monitor regional CBF andto begin preliminary studies involving patients undergoingneurovascular surgery.
APPENDIX
The relationship between the HbD signal and CBF can be ex-plained using the Fick principle
CMRO2 � 1.39CBF��HbO2�a � �HbO2�v� (A1)
where [HbO2]a and [HbO2]v are arterial and venous concentrations ofHbO2, respectively, and the factor 1.39 is the O2-carrying capacity ofHb (ml O2/g Hb). Cerebral blood oxygenation can be determined fromNIRS measurements by scaling the NIRS data by the blood volumeand assuming a relative venous blood fraction (fv) (4)
�HbO2� � �CBV��1 � fv��HbO2�a � fv�HbO2�v� (A2)
Using this relationship, the Fick principle can be written as
CMRO2 � 1.39CBF
fv��HbO2�a �
�HbO2�CBV� (A3)
An equivalent equation can also be written in terms of [HHb]. TheFick principle can be expressed in terms of HbD (i.e., HbD � [HbO2] �[HHb]) by combining the two equations
CMRO2 � 1.39CBF
2fv�HbDa �
HbD
CBV� (A4)
where HbDa � [HbO2]a � [HHb]a. By continuously measuring[HbO2] and [HHb], a change in cerebral blood oxygenation [i.e.,�HbD(t) � HbD(t) � HbD(0)] is related to changes in the underlyingcerebral physiology by
�HbD�t� � ��CBV�t� � CBV�0��HbDa
� 1 �rCBV�t�rCMRO2�t�
rCBF�t� � (A5)
where rCBV(t) � CBV(t)/CBV(0), rCBF(t) � CBF(t)/CBF(0),rCMRO2(t) � CMRO2(t)/CMRO2(0), and � is given by
� �2fv�
1.39CBV�0�CMRO2�0�CBF�0�
(A6)
Equation A5 was derived assuming that arterial O2 saturation re-mained constant. As expected, this equation demonstrates that using�HbD(t) as a blood flow index depends on the relationships betweenCBF, CBV, and CMRO2. It was observed in the carotid occlusionexperiments that changes in CBV during reductions in CBF (Fig. 3B)were relatively small; therefore, it is reasonable to assume that CBVremains constant. Similarly, the data shown in Fig. 3A demonstratethat the relationship between CMRO2 and CBF can be modeled by apower law given by 1 � rCMRO2 � (1 � rCBF)�. Under theseobservations, Eq. A5 simplifies to
�HbD�t� � �1 �1 � �1 � rCBF�t��x
rCBF�t� (A7)
Figure 6 illustrates the relationship between �HbD and CBF predictedby Eq. A7. The dependence of CMRO2 on CBF diminishes as the valueof � increases; however, this results in an increasingly nonlinearrelationship between �HbD and CBF. The relationship between�HbD and CBF only becomes linear for � � 2, for which Eq. A7reduces to
�HbD�t� � ��1 � rCBF�t�� (A8)
Previous studies using transcranial Doppler and microspheres tomeasure CBF have reported a linear relationship between �HbD andCBF (28, 34), which was also observed in both of our experiments(Figs. 2 and 4). Furthermore, the best fit of a power law to theCMRO2-CBF correlation data (Fig. 3) resulted in � � 2.04, which isvery close to the predicted value of 2.
Figure 6 also illustrates the relationship between HbD and CBF ifthere are concurrent blood volume changes. In these simulations,rCBV is related to rCBF by a power law, i.e., rCBV � rCBF , assuggested by Grubb et al. (15). A coefficient of power equal to �0.15predicted CBV increases during blood flow reductions that weresimilar in magnitude to the results shown in Fig. 3B.
ACKNOWLEDGMENTS
We thank Jennifer Hadway and Lise Desjardins for help with the experi-ments.
GRANTS
This research was funded by the Lawson Health Research Institute, Heartand Stroke Foundation of Ontario, and Canadian Institutes of Health Research.
DISCLOSURES
No conflicts of interest, financial or otherwise, are declared by the authors.
REFERENCES
1. Al-Rawi PG, Kirkpatrick PJ. Tissue oxygen index: thresholds forcerebral ischemia using near-infrared spectroscopy. Stroke 37: 2720–2725, 2006.
2. Amin-Hanjani S, Charbel FT. Flow-assisted surgical technique in cere-brovascular surgery. Surg Neurol 68 Suppl 1: S4–S11, 2007.
3. Asgari S, Rohrborn HJ, Engelhorn T, Fauser B, Stolke D. Intraoper-ative measurement of cortical oxygen saturation and blood volume adja-cent to cerebral arteriovenous malformations using near-infrared spectros-copy. Neurosurgery 52: 1298–1304, 2003.
4. Brown DW, Hadway J, Lee TY. Near-infrared spectroscopy measure-ment of oxygen extraction fraction and cerebral metabolic rate of oxygenin newborn piglets. Pediatr Res 54: 861–867, 2003.
5. Brown DW, Picot PA, Naeini JG, Springett R, Delpy DT, Lee TY.Quantitative near infrared spectroscopy measurement of cerebral hemo-dynamics in newborn piglets. Pediatr Res 51: 564–570, 2002.
7. Calderon-Arnulphi M, Alaraj A, Amin-Hanjani S, Mantulin WW,Polzonetti CM, Gratton E, Charbel FT. Detection of cerebral ischemiain neurovascular surgery using quantitative frequency-domain near-infra-red spectroscopy. J Neurosurg 106: 283–290, 2007.
8. Davis TL, Kwong KK, Weisskoff RM, Rosen BR. Calibrated functionalMRI: mapping the dynamics of oxidative metabolism. Proc Natl Acad SciUSA 95: 1834–1839, 1998.
9. Diop M, Elliott JT, Tichauer KM, Lee TY, St. Lawrence K. Abroadband continuous-wave multichannel near-infrared system for mea-suring regional cerebral blood flow and oxygen consumption in newbornpiglets. Rev Sci Instrum 80: 054302, 2009.
10. Dullenkopf A, Baulig W, Weiss M, Schmid ER. Cerebral near-infraredspectroscopy in adult patients after cardiac surgery is not useful formonitoring absolute values but may reflect trends in venous oxygenationunder clinical conditions. J Cardiothorac Vasc Anesth 21: 535–539, 2007.
11. Elliott JT, Diop M, Tichauer KM, Lee TY, St. Lawrence K. Quanti-tative measurement of cerebral blood flow in a juvenile porcine model by
1697CONTINUOUS MONITORING OF CBF DURING NEUROSURGERY BY NIRS
J Appl Physiol • VOL 110 • JUNE 2011 • www.jap.org
at Dartm
outh-Hitchcock M
ed Ctr on January 6, 2013
http://jap.physiology.org/D
ownloaded from
depth-resolved near-infrared spectroscopy. J Biomed Opt 15: 037014,2010.
13. Fabregas N, Gomar C. Monitoring in neuroanaesthesia: update of clin-ical usefulness. Eur J Anaesthesiol 18: 423–439, 2001.
14. Garski TR, Staller BJ, Hepner G, Banka VS, Finney RA Jr. Adversereactions after administration of indocyanine green. JAMA 240: 635, 1978.
15. Grubb RL Jr, Raichle ME, Phelps ME, Ratcheson RA. Effects ofincreased intracranial pressure on cerebral blood volume, blood flow, andoxygen utilization in monkeys. J Neurosurg 43: 385, 1975.
16. Hillman EM. Optical brain imaging in vivo: techniques and applicationsfrom animal to man. J Biomed Opt 12: 051402, 2007.
17. Imai H, Konno K, Nakamura M, Shimizu T, Kubota C, Seki K, HondaF, Tomizawa S, Tanaka Y, Hata H, Saito N. A new model of focalcerebral ischemia in the miniature pig. J Neurosurg 104: 123–132, 2006.
18. Kashiwazaki D, Kuroda S, Terasaka S, Iwasaki Y. Detection ofhemodynamic transient ischemic attack during hemodialysis with near-infrared monitoring in a patient with internal carotid artery occlusion. SurgNeurol 68: 292–295, 2007.
19. Kassell NF, Torner JC, Haley EC Jr, Jane JA, Adams HP, KongableGL. The International Cooperative Study on the Timing of AneurysmSurgery. 1. Overall management results. J Neurosurg 73: 18–36, 1990.
20. Kuluz JW, Prado R, He D, Zhao W, Dietrich WD, Watson B. Newpediatric model of ischemic stroke in infant piglets by photothrombosis:acute changes in cerebral blood flow, microvasculature, and early histo-pathology. Stroke 38: 1932–1937, 2007.
21. Latchaw RE, Yonas H, Hunter GJ, Yuh WT, Ueda T, Sorensen AG,Sunshine JL, Biller J, Wechsler L, Higashida R, Hademenos G.Guidelines and recommendations for perfusion imaging in cerebral ische-mia: a scientific statement for healthcare professionals by the writing group onperfusion imaging, from the Council on Cardiovascular Radiology of theAmerican Heart Association. Stroke 34: 1084–1104, 2003.
22. Matcher SJ, Cope M, Delpy DT. Use of the water absorption spectrumto quantify tissue chromophore concentration changes in near-infraredspectroscopy. Phys Med Biol 39: 177, 1994.
23. Muehlschlegel S, Lobato EB. Con: all cardiac surgical patients shouldnot have intraoperative cerebral oxygenation monitoring. J CardiothoracVasc Anesth 20: 613–615, 2006.
24. Ogilvy CS, Carter BS, Kaplan S, Rich C, Crowell RM. Temporaryvessel occlusion for aneurysm surgery: risk factors for stroke in patientsprotected by induced hypothermia and hypertension and intravenousmannitol administration. J Neurosurg 84: 785–791, 1996.
25. Ohmoto T, Nagao S, Mino S, Fujiwara T, Honma Y, Ito T, OhkawaM. Monitoring of cortical blood flow during temporary arterial occlusionin aneurysm surgery by the thermal diffusion method. Neurosurgery 28:49–54, 1991.
26. Phelps ME, Grubb RL Jr, Ter-Pogossian MM. Correlation betweenPaCO2 and regional cerebral blood volume by X-ray fluorescence. J ApplPhysiol 35: 274–280, 1973.
27. Samson D, Batjer HH, Bowman G, Mootz L, Krippner WJ Jr, MeyerYJ, Allen BC. A clinical study of the parameters and effects of temporaryarterial occlusion in the management of intracranial aneurysms. Neuro-surgery 34: 22–29, 1994.
28. Soul JS, Taylor GA, Wypij D, Duplessis AJ, Volpe JJ. Noninvasivedetection of changes in cerebral blood flow by near-infrared spectroscopyin a piglet model of hydrocephalus. Pediatr Res 48: 445–449, 2000.
29. Suarez JI, Tarr RW, Selman WR. Aneurysmal subarchnoid hemor-rhage. N Engl J Med 354: 387–396, 2006.
30. Thome C, Vajkoczy P, Horn P, Bauhuf C, Hubner U, Schmiedek P.Continuous monitoring of regional cerebral blood flow during temporaryarterial occlusion in aneurysm surgery. J Neurosurg 95: 402–411, 2001.
31. Tichauer KM, Brown DW, Hadway J, Lee TY, St. Lawrence K.Near-infrared spectroscopy measurements of cerebral blood flow andoxygen consumption following hypoxia-ischemia in newborn piglets. JAppl Physiol 100: 850–857, 2006.
32. Tichauer KM, Elliott JT, Hadway JA, Lee DS, Lee TY, St. LawrenceK. Using near-infrared spectroscopy to measure cerebral metabolic rate ofoxygen under multiple levels of arterial oxygenation in piglets. J ApplPhysiol 109: 878–885, 2010.
33. Tichauer KM, Hadway JA, Lee TY, St. Lawrence K. Measurement ofcerebral oxidative metabolism with near-infrared spectroscopy: a valida-tion study. J Cereb Blood Flow Metab 26: 722–730, 2006.
34. Tsuji M, duPlessis A, Taylor G, Crocker R, Volpe JJ. Near infraredspectroscopy detects cerebral ischemia during hypotension in piglets.Pediatr Res 44: 591, 1998.
35. Wardlaw JM, White PM. The detection and management of unrupturedintracranial aneurysms. Brain 123: 205–221, 2000.
36. Woertgen C, Rothoerl RD, Albert R, Schebesch KM, Ullrich OW.Effects of temporary clipping during aneurysm surgery. Neurol Res 30:542–546, 2008.
37. Woitzik J, Pena-Tapia PG, Schneider UC, Vajkoczy P, Thome C.Cortical perfusion measurement by indocyanine-green videoangiographyin patients undergoing hemicraniectomy for malignant stroke. Stroke 37:1549–1551, 2006.
38. Zeger SL, Liang KY, Albert PS. Models for longitudinal data: ageneralized estimating equation approach. Biometrics 44: 1049–1060,1988.
39. Zierler KL. Equations for measuring blood flow by external monitoringof radioisotopes. Circ Res 16: 309, 1965.
1698 CONTINUOUS MONITORING OF CBF DURING NEUROSURGERY BY NIRS
J Appl Physiol • VOL 110 • JUNE 2011 • www.jap.org
at Dartm
outh-Hitchcock M
ed Ctr on January 6, 2013
http://jap.physiology.org/D
ownloaded from