Continuous and integral: - Cycling Embassy of Great Britain
89
PUBLICATION NO. 7 Continuous and integral: The cycling policies of Groningen and other European cycling cities
-
Upload
khangminh22 -
Category
Documents
-
view
3 -
download
0
Transcript of Continuous and integral: - Cycling Embassy of Great Britain
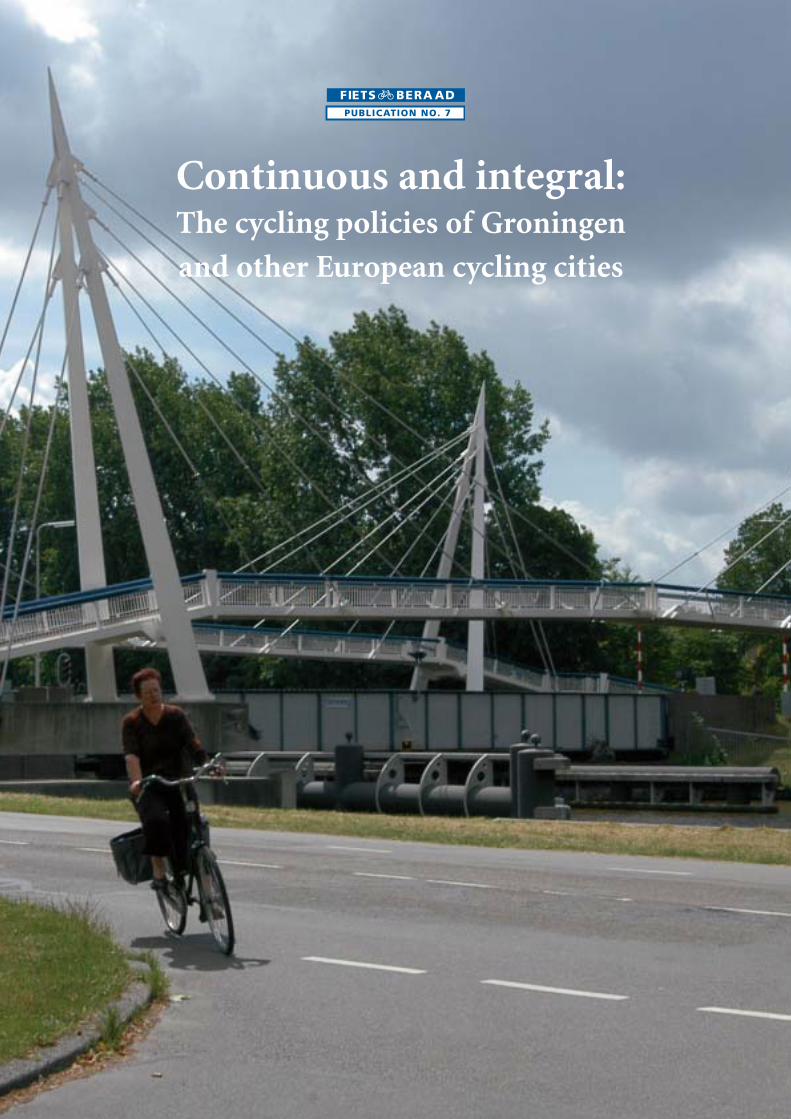
PUBLICATION NO. 7
Continuous and integral:The cycling policies of Groningen
and other European cycling cities

Continuous and integral:The cycling policies of Groningen and other European cycling cities

2 Fietsberaad Publication 7
Contents
Preface 3
1 Introduction 5
1.1 Sustained and integral municipal cycling policy 51.2 Cycling cities in Europe 51.3 Continuous: conclusion of the SHT-study 71.4 Integral: conclusion of the Explanation Model project 12
2 Groningen: the compact cycling city 15
3 Amsterdam: many people, many cyclists, much policy 29
4 Enschede: cycling policy by way of the car 36
5 Zwolle: segregation, wherever necessary 40
6 Veenendaal: ‘pampering’ every 300 metres 48
7 Odense: laboratory with enthusiasm 53
8 Copenhagen: rational cycling policy 59
9 Münster: Germany’s n° 1 cycling city 65
10 Freiburg: stable policy and increasing use 71
11 Ghent: promoting and sensitising 76
12 Comparison 82
Acknowledgements 87

Fietsberaad Publication 7 3
Preface
This Fietsberaad-publication contains a number of accounts concerning the traffic policy ofseveral cities characterised by a relatively high degree of bicycle use, extending over a pro-longed period. Each account gives a specific picture of the ‘course of development’ of bicycleuse in a municipality and the relation between bicycle use and local policy. They concern fivecities in the Netherlands known as ‘cycling cities’: Groningen, Amsterdam, Enschede, Zwolleand Veenendaal. This is added by a selection of five cities from other neighbouring countriesthat also know a respectable level of bicycle use: Münster and Freiburg in Germany,Copenhagen and Odense in Denmark and Ghent in Belgium.
The immediate ground for this publication is the study of Boersma & Van Alteren, completedsome time ago, seeking an explanation for the high degree of bicycle use in Groningen. For this reason the Groningen case receives most attention in this publication; the Boersma& Van Alteren report is summarised extensively. The Groningen account, and, for that matter,most of the other accounts as well are slightly adapted versions of articles published earlierin Fietsverkeer magazine. This, however, does not apply to Odense and Copenhagen, both ofthem new accounts.
The ten city accounts each give a picture of the way in which cycling policy has contributedto the high degree of bicycle use over a prolonged period. Although they are indeed ten unique stories, they do correspond in quite a few places; parallels that could serve asexamples of the ways in which a high degree of bicycle use can be attained - in the long run!
Dick Buursink,president of the Fietsberaad

4 Fietsberaad Publication 7

Fietsberaad Publication 7 5
1. Introduction
1.1 Continuous and integral municipal cycling policy
‘Continuous’ and ‘integral’; two words, together reflecting the essence of explanations forhigh degrees of bicycle use on a municipal level, as these have appeared from various studies over the years. Prolonged, consistent cycling policy; policy embedded in a widerpolicy context of local, ‘deeply-felt’ objectives.
The above word pair, with an emphasis on ‘continuous’ already was the object of a 1999study by the ‘Stichting Historie der Techniek’ (SHT, Foundation for the History of Technology)seeking to explain differences in the development of bicycle use in a number of Europeancities. Giving bicycle use a long-term, and in retrospect, early appropriate place in traffic po-licy is seen by this study as an important explanation for the fairly exceptional developmentof bicycle use in the Netherlands, compared to cities in neighbouring European countries.The outcomes of this study are summarised in brief in section 1.3 (published earlier in Fietsverkeer magazine n° 7).The emphasis on ‘integral’ traffic policy undoubtedly comes out in the SHT-study and is even more prominent in recent studies trying to explain differences in bicycle use betweenmunicipalities from a statistic viewpoint. For “Fietsberaad”, Research voor Beleid recently pre-pared an ‘ultimate’ explanation model for municipal bicycle use, based on earlier attempts.The importance of an integral traffic policy comes out immediately here. The outcomes ofthis study are summarised in section 1.4 (also included in Beleidswijzer Fietsverkeer,December 2005).
The ten city accounts collected here are mainly specifications of the general line between‘continuous’ and ‘integral’. Each city has its own account, with its own specific accents mainly based on local conditions. The parallels and differences found in these ten accountsare analysed in detail in chapter 12 at the end of this publication. First, section 1.2 containsan illustration of the degree in which the cities described here are the top of bicycle use inEurope.
1.2 Cycling cities in Europe
Ten cities with a respectable bicycle use - although the fact remains that the top cities in the Netherlands have a considerably higher level of bicycle use than the ‘best’ cities in theneighbouring countries.
Table 1. Bicycle use in ten European ‘cycling cities’ (with bicycle shares running down)
bicycle share in all trips inhabitants of the inhabitants
Groningen 177.000 37%
Zwolle 110.000 37%
Veenendaal 61.000 32%
Enschede 152.000 31%
Münster 280.000 27%
Amsterdam 735.000 27%
Odense 185.000 25%
Freiburg (im Breisgau) 213.000 22%
Kopenhagen 502.000 23%
Gent 231.000 15%

6 Fietsberaad Publication 7
There certainly are some foreign cities that claim higher bicycle share percentages. Yet, closestudy shows that in these cases it only concerns local trips within municipal boundaries, or specific segments like commuter traffic. The above table and the national surveys belowalways start from figures that are known to relate to the bicycle share in all journeys (by inhabitants of the city or country concerned). These figures originate from many sources; at least two per city (minor differences have been erased).
The Netherlands, Denmark, Germany and Belgium are the countries showing the highestbicycle use in Europe. The ten cities discussed here really belong to the top as far as bicycleuse is concerned. Groningen and Zwolle are the Netherlands’ absolute top, with Veenendaaland Enschede just behind. For this reason bicycle use in the ‘best’ cities of the Netherlandsis of a level completely different from cities in Denmark, Germany and Belgium - and obviously of an altogether different level than in cities in the other European countries:• In the Netherlands the bicycle share has been ca. 26 % over the last decades. The top
municipalities score between 35% and 40%; cities with the lowest bicycle use figure between 15% and 20%.
• In Denmark the bicycle share is almost 20%. The differences in bicycle use among the larger cities are relatively small. Bicycle use is fairly generally found on the level of 20%of all trips.
• In Germany an average 10% of all trips is by bicycle. The western federal states know a higher average bicycle use, especially Nordrhein-Westfalen. Except for Münster andFreiburg there are far more cities with bicycle shares between 20% and 30%.
• Belgium has an average bicycle share of 8%. Many cities in Flanders approach the levelof Ghent: almost 15%. Some sources give a higher bicycle share to the city of Bruges -almost 20%.
For many European countries and cities low bicycle shares certainly do not automaticallyimply a high degree of car use. There are also large differences between countries andcities as far as numbers of pedestrians and especially public transport users are concer-ned. Southern European cities are often characterised by high ‘walking’ shares; for instanceSan Sebastian in Spain: 3% bicycle against ‘only’ 34% car, because public transport playsan important role in San Sebastian (19%), and last not least: walking - a striking 44% of all trips. London has a similar pattern, though slightly less extreme: only 1% bicycle, but instead 18% public transport and 37% walking, and consequently 44% car ‘only’. The lowest car shares are found in cities with relatively high scores for walking, cyclingand public transport. Many cities in Switzerland show a somewhat resembling pattern:over 20% walking, over 10% bicycle and ca. 30% public transport - with a relatively lowcar use as a result (roughly 30% in Basel, Bern and Zürich).
Although average bicycle use in other European countries is much lower we find some stri-king extremes from time to time:• Average bicycle use in Great-Britain is only 2%, but there are several isolated cities with a
much higher degree of bicycle use (York and Hull 11%, Oxford and especially Cambridgenearing 20%). A similar pattern - even slightly more extreme - is found in Sweden andespecially Italy.
• Ireland scores 3% - 4%, with virtually no upward extremes (Dublin 5% at most).• In Sweden bicycle use averages 7% of all trips; for cities this is 10%. Extremes: Lund a
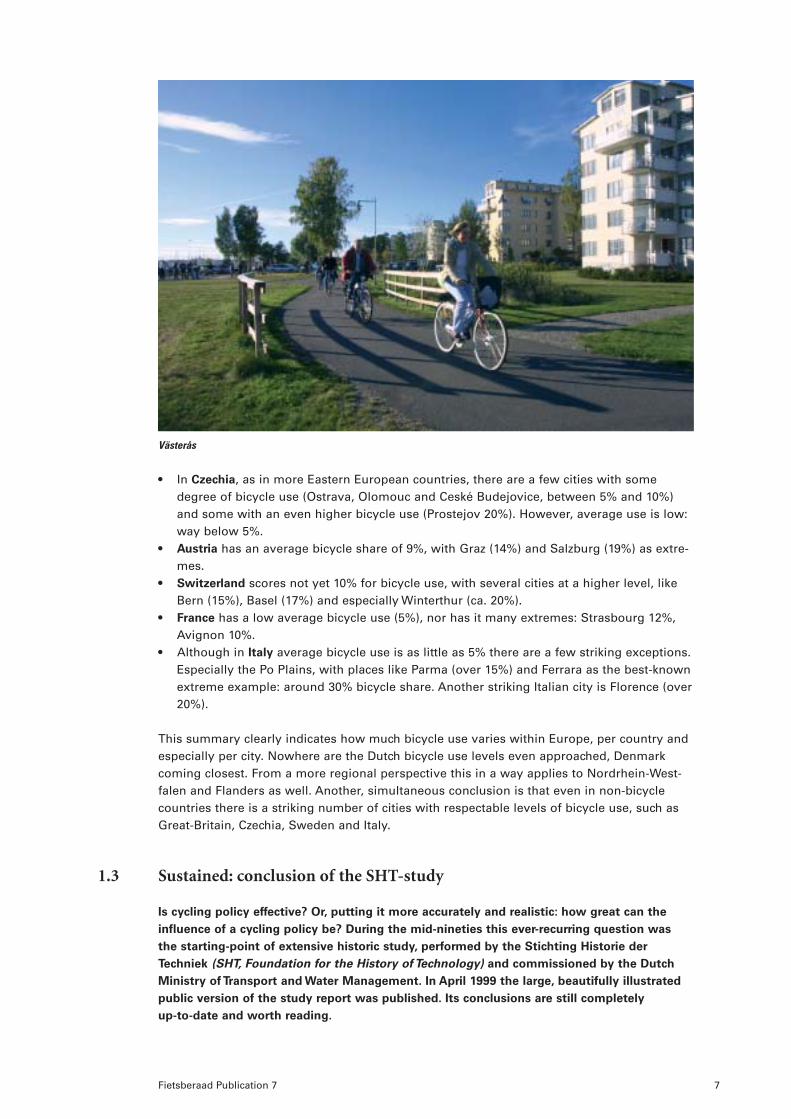
nd Malmö 20%. The small city of Västerås (115,000 inhabitants) has an incredible 33%bicycle share according to a source quoted time and time again.
Fietsberaad Publication 7 7
• In Czechia, as in more Eastern European countries, there are a few cities with somedegree of bicycle use (Ostrava, Olomouc and Ceské Budejovice, between 5% and 10%)and some with an even higher bicycle use (Prostejov 20%). However, average use is low:way below 5%.
• Austria has an average bicycle share of 9%, with Graz (14%) and Salzburg (19%) as extre-mes.
• Switzerland scores not yet 10% for bicycle use, with several cities at a higher level, likeBern (15%), Basel (17%) and especially Winterthur (ca. 20%).
• France has a low average bicycle use (5%), nor has it many extremes: Strasbourg 12%,Avignon 10%.
• Although in Italy average bicycle use is as little as 5% there are a few striking exceptions.Especially the Po Plains, with places like Parma (over 15%) and Ferrara as the best-knownextreme example: around 30% bicycle share. Another striking Italian city is Florence (over20%).
This summary clearly indicates how much bicycle use varies within Europe, per country andespecially per city. Nowhere are the Dutch bicycle use levels even approached, Denmarkcoming closest. From a more regional perspective this in a way applies to Nordrhein-West-falen and Flanders as well. Another, simultaneous conclusion is that even in non-bicyclecountries there is a striking number of cities with respectable levels of bicycle use, such asGreat-Britain, Czechia, Sweden and Italy.
1.3 Sustained: conclusion of the SHT-study
Is cycling policy effective? Or, putting it more accurately and realistic: how great can the
influence of a cycling policy be? During the mid-nineties this ever-recurring question was
the starting-point of extensive historic study, performed by the Stichting Historie der
Techniek (SHT, Foundation for the History of Technology) and commissioned by the Dutch
Ministry of Transport and Water Management. In April 1999 the large, beautifully illustrated
public version of the study report was published. Its conclusions are still completely
up-to-date and worth reading.
Västerås

8 Fietsberaad Publication 7
Eindhoven, end of a working day at the Philips factories, Emmasingel, 1939
phot
o: P
hilip
s co
ncer
narc
hief
This historic study was based on an investigation of three Dutch cities known for their rela-tively high share of bicycle use (Amsterdam, Eindhoven and Enschede) and an urban regionwith a low share of bicycle use (South-East Limburg: Kerkrade-Heerlen). In surrounding coun-tries five cities were studied: cycling city Copenhagen, the bicycle-free city of Manchesterand finally Antwerp, Basel and Hannover; cities that are somewhere in the middle as regardsbicycle use. For all cities, city development and traffic policy since 1900 were the objects of study by way of detailed investigation of city records. Much time also went in the recon-struction of a comparable trend line of bicycle use in each of these cities, in the variable tobe explained (see Figure 1) and in a search for explanations for these trend lines and theirrelating differences among cities.
The trend lines of Figure 1 are based on various kinds of figures, with the required assump-tions varying in their degrees of influence. In places where the trend line is interrupted andthin, estimates have played a more important part. Where estimates over certain periodsappear to be impossible the trend line is missing.

Fietsberaad Publication 7 9
Figure 1. Reconstructed trend lines of bicycle shares in the total number of car, bicycle,moped and public transport journeys, 1920-1995 (in %)
ParallelsThe curves of all nine trend lines can be compared very well. From 1900 onwards the bicyclevery quickly transformed from a product for recreational purposes for a small elite into a utilitarian mass product for all social statuses. All cities know relatively high degrees of bicycle use until way into the ’50s, although at different levels. Differences in bicycle sharesbetween cities before the Second World War have little if anything to do with the position of the motor car, but with the degree in which citizens go on foot and especially with the(early) development of a suitable public transport system (as was the case in Manchester).The sharp decline in bicycle use, especially in the ’60s, was the result of the rapid advance of the motor car. From the ’70s onwards we see a universal stabilisation or a renewed development of bicycle use.
phot
o: H
isto
risch
-topo
graf
isch
e At
las
Gem
eent
earc
hief
Am
ster
dam
Amsterdam, Stadhouderskade and on the right Overtoom, February 1939

10 Fietsberaad Publication 7
DifferencesApart from the general parallels in the trend lines of Figure 1 we immediately find very stri-king differences. Differences in the level on which this general continuous movement takesplace, and differences in strength of the rise and fall of the bicycle use share. The SHT-reportconcludes that the eventual differences in cities in the ’90s can be explained in a clear way:• A high bicycle share (more than 30%) for Amsterdam, Eindhoven, Enschede and Copen-
hagen; cities that never saw the arrival of a ‘bicycle use-consuming’ public transportsystem and where bicycle traffic had always been a regular component of traffic policy:‘Accepting the cyclist as a “normal” traffic participant with equal rights in the ’50s and’60s has been (...) a crucial factor: the realisation of a motor car infrastructure is not atthe expense of the cyclist; the collective bicycle picture is fairly positive and especially“rational”.’
• An average bicycle share (ca. 20%) for South-East Limburg and Hannover. Here, the riseof the motor car coincided with a more manifest pro-car policy and a spatial structurewhich was more in line with the motor car.
• A low bicycle share (ca. 10% or below) for Antwerp, Manchester and Basel. Here it isespecially the car-oriented traffic policy that explains matters, and the manifest influenceof an early, properly functioning public transport system (Manchester): ‘The declinewhich was the result of the arrival of the motor car continues uninterrupted and without“brakes”, because all relevant influencing factors are pointing in the same direction: a negative collective picture, a strong car-oriented policy, realisation of a large-scale car infrastructure, strong suburbanisation (...).’
ContinuousThe essence of the conclusions drawn by the SHT-researchers is that the differences in bicycle use occurring between cities in the ’90s can in the first place be explained from theview of local spatial and traffic policy and the resulting ‘local picture’ of the role and value of bicycle use. However, as this explanation is a long-term one it must be considered overdecades. With regard to spatial policy and picture-forming this conclusion is not surprising,
phot
o: R
amse
yer (
Basl
er V
erke
hrsp
robl
eme,
195
1)
Rush hour at the crossing Margarethenbrücke in Basel, approximately 1950

Fietsberaad Publication 7 11
as by their very nature they will only very gradually result in changes. All this left aside, traf-fic policy also appears to have a relevant, continuous influence. Political choices made in the’50s and ’60s still resound in our present time. This conclusion can best be illustrated by way of extremes. For instance, the three cities witha relatively low bicycle use share, Antwerp, Basel and Manchester, conducted an emphatic,explicit policy strongly aimed at facilitating motor car use for decades. This policy was basedon socially supported ‘pictures’ representing the future role of the bicycle as limited. This isopposed by cities with a relatively high bicycle use share, Amsterdam, Eindhoven, Enschedeand Copenhagen, cities that invariably took their actual traffic situation as starting-point forpolicy, including the role played by the bicycle in this respect and without sharply outlinedpredictions setting the standard.
To discourage or to acceptIn various foreign cities a negative image and the ensuing concrete ‘anti-bicycle’ measureswere intense to a degree that we assume is hard to imagine for the present-day people ofthe Netherlands. A few examples. In Antwerp, Hannover and Basel actual bicycle infrastruc-tures were ‘removed’ from the ’50 onwards; cycle paths were converted into car lanes andcycle lanes into parking lanes. In Antwerp cyclists were obliged to ride in a queue from 1939onwards as they would take too much space if they did not. In 1944 the Basel municipalcouncil wrote 1944: ‘Prinzipiell ist heute zu sagen, daß in der eigentlichen Stadt Radfahrwegenicht mehr erwünscht sind.’ (‘In principle one could now say that cycle paths a no longerdesirable in the city proper.’) After all, cycle paths could not be projected wide enough due to the amount of space needed by cars, so it was better to have just one very narrow strip.Even stronger so: in 1951 the city centre imposed the use of public bicycle parking facilitieswith a maximum parking duration of one to two hours! In this respect most of the cities inthe Netherlands give proof of at least a certain degree of tolerance of bicycle traffic in theirtraffic policy in the ‘50s and ‘60s. It is this acceptance of reality that even in 2006 is largelyresponsible for this constant, high share of bicycle use in the Netherlands. Policy is thereforeeffective, even if this does not work towards active promotion but to just accepting the veryexistence of the bicycle and the facilities it requires.
Enschede, Hengelosestraat, bicycle parking behind V&D, 1939
phot
o: G
emee
ntea
rchi
ef E
nsch
ede

12 Fietsberaad Publication 7
1.4 Integral: conclusion of the ‘Explanation Model’ project
OccasionFrom a global perspective bicycle use in the Netherlands is very high. At the same time thereare clear differences within the Netherlands, especially on municipal levels. The question ofhow to explain these differences has been often asked and is indeed very relevant, becausethe answer in a way tells us about the degree in which bicycle use can be affected by (muni-cipal) cycling policy. Over the past few years various studies have shown that municipal dif-ferences in bicycle use can be explained fairly well and that cycling policy does play a ratherprominent role as regards explanation factors as a whole. In 2005 a study was completed,giving a very well-founded answer to the question of how to explain municipal differences in bicycle use, and what role (elements of) cycling policy and (wider) traffic policy play inthis respect.
Source: Research voor Beleid, Verklaringsmodel voor fietsgebruik gemeenten, Leiden,January 2006 (downloaded via ‘Rapporten’ on www.fietsberaad.nl).
The Explanation ModelResearch involved 44 factors in its analysis. Very diverse by nature, these factors were selected on the basis of existing knowledge about possible factors influencing bicycle use.The eventually resulting explanation model contains eleven factors:1. bicycle-car travelling time ratio (bicycle time-car time) 2. car parking charges (eurocents/h) 3. bus, tram and underground shares in all trips of citizens (%)4. built-up area surface (hectares)5. share of juveniles (number of 10 to 20-year-olds/number of citizens in %)6. share of single-person households7. number of persons on unemployment benefit (number of unemployed/number of
citizens)8. number of protestants (number of citizens calling themselves protestants/number of
citizens in %)9. number of islamic persons (number of citizens calling themselves islamic/number of
citizens in %)10. average rainfall etc. (average annual rainfall 1971-2000, three averages in mm)11. degree of relief (four categories, from 0 to 1)
This model as such is a composition of traffic-scientific, spatial-economic and also demo-graphic, cultural and geographical factors. About one-third of the explanatory power of thismodel lies in the four factors denoting something like ‘integral traffic policy’ (bicycle-car travelling time ratio, car parking charges, share of bus, tram and underground and surface of built-up area).
The ‘variable to be explained’, the indicator for bicycle use, was determined as follows: the2000-2003 average of the total number of trips per bicycle per person/citizen and per day.For the Netherlands as a whole this is about 0.80 bicycle trips (more than 25% of the 3.15that has for many years been the average of the number of trips per Dutch citizen per day).As a formula, the model presents the following picture (B-coefficients rounded-off):
Bicycle use (number of bicycle trips per person per day) = 1.224 – 0.18 travelling time ratio+ 0.0025 parking charges – 0.023 BTU – 0.000033 built-up area surface + 0.037 juveniles +0.0081 single-person households – 0.010 unemployed + 0.0024 protestants – 0.027 islamics– 0.00071 rainfall – 0.324 relief
IllustrationThis table formula first and foremost points out the direction the influence of a variabletakes as regards bicycle use. Bicycle use drops with rising shares of islamic persons. Thesame applies to relief of the soil, the number of unemployed, the share of bus, tram and
underground, the surface of the built-up area, the amount of for instance rainfall and the travelling time ratio between bicycle and car. On the other hand, the share of young personsaged 10-20, the share of single-person households, car parking costs and the share of pro-testants do have a positive influence on bicycle use. The formula also tells something aboutthe weights of the factors, the extent to which differences and changes affect bicycle use. A few examples:• The bicycle-car travelling-time ratio is between 0.8 and 1.1 in many cities. This difference
(0.3) is roughly the maximum influence this factor can have - or has had - on bicycle use.When multiplying this with the coefficient of this factor (- 0.18) you obtain the margin inwhich the influence of this travelling-time ratio is found: 0.054 in comparison with the0.80 of the number of bicycle trips per person per day. A city that has this very bad travel-ling-time ratio (1.1) for bicycles may well be able to achieve this very good 0.8 travelling-time ratio with the help of continuous (integral!) policy and can as such be expected toincrease its bicycle use from 0.775 to 0.825 bicycle trips per person per day, for instance.Assuming that the total number of trips per person does not change (there has not beena change for decades), this will result in an increase in the bicycle share from 24.6% to26.2%.
• The car parking costs measured in “Fietsbalans” are on a level exceeding 50 eurocentsper hour in the most expensive cities. There are also many municipalities that offer freelong-stay parking: 0 cents. In the model, this practical margin of 50 cents per hour impliesa difference of (0.0025 x 50) 0.125 in the number of bicycle trips per person per day; so in general the difference between 0.72 and 0.86 bicycle trips, or the difference between22.8% and 27.3% bicycle share in the modal split.
• In the model, the condition of whether or not there are hilly grounds in the built-up area(score between 0 and 1) implies a margin of 0.324: 22.8% or 28.0% bicycle share in themodal split of the average Dutch municipality.
Great explanation powerWhen quantifying the ‘explanation power’ in statistic terms, the explanation model of these11 factors has an R2 of 0.726. This means that almost 73% of the variance in bicycle useamong municipalities is explained by these factors. This is considerable, and we can there-fore say that this model has great explanation power. When comparing the value predictedby way of this formula with the actual value for each municipality, the following distributionis obtained for the differences (residues):
Fietsberaad Publication 7 13
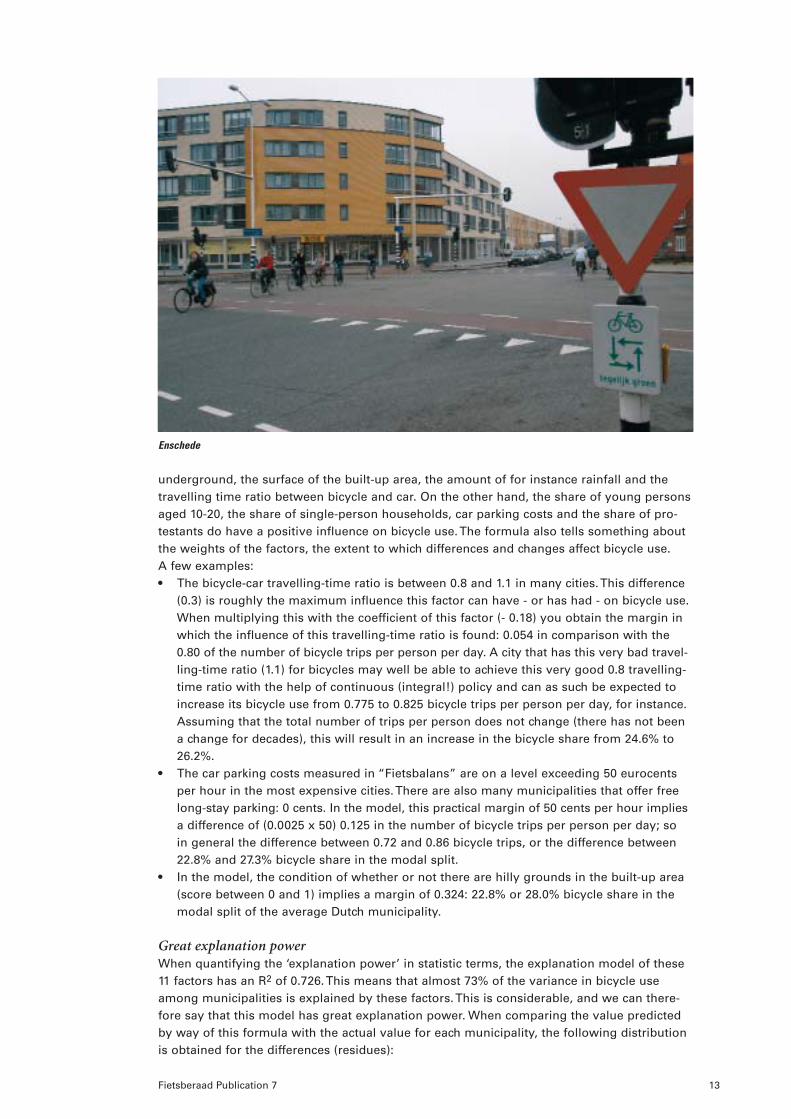
Enschede

14 Fietsberaad Publication 7
Figure 2. Dependent variable: average number of bicycle trips per person per day, 2000-2003
We see that the residues are distributed in an approximately normal way, at an almost 0 ave-rage. This means that the model is statistically adequate for these data. When setting off the predicted value against the actual value according to the formula above, the followingpicture is obtained:
Figure 3. Dependent variable: average number of bicycle trips per person per day, 2000-2003
This shows that the model is a good predictor of actual bicycle use: the point cloud is elon-gated and there are no points far removed from the diagonal. In short, a good predictor andtherefore a good ‘explainer’ of present-day bicycle use per municipality.
Consequence of the modelThe great explanation power of this model serves to make clear that in the Netherlands wehave by now reached such a degree of knowledge development about bicycle use that weare very well able to explain municipal differences. As a result, this knowledge is of excellentuse for political choices. What is also clear is that bicycle use can be explained by way of aset of fairly ‘hard’ factors, often clearly and directly related to bicycle use. On the other handthere are quite a few differences in bicycle use that cannot be explained by way of the model(the 27% unexplained variance).The model also serves to make clear that cycling policy is not everything but it must not beneglected either. Although traffic policy choices surely play a part (car-bicycle travelling-timeratio, car parking costs, shares of bus, tram, underground) they cannot by far explain all dif-ferences in bicycle use. Pure traffic policy factors can account for ca. 40% of all differences.This became clear when a few models were constructed only by way of these factors of traffic policy at some stages of this research.
aver
age
num
ber o
f cyc
ling
trips
pe
r per
son
per d
ay (2
000-
2003
)
Regression Standardized Predicted Value
Freq
uenc
y
Regression Standardized Residual
Mean = 5,18E-15
Std. Dev. = 0,951
N = 117

Fietsberaad Publication 7 15
2. Groningen: compact cycling city
To many other cities in the Netherlands and abroad, Groningen sets the example as regards
bicycle climate and bicycle use. What has made these two factors so prominent here? The
answer revolves around three key words: policy, coherence and continuity. The municipality
for instance conducts a broad cycling policy, firmly embedded in overall transport and traffic
policy. On the other hand, spatial policy has been persistently oriented at a compact city
for decades, offering many activities well within bicycle reach to its citizens. This, putting it
briefly, is the success of vision, political choices and effort on the part of civil service.
Groningen, the cityGroningen has been a regional centre from the thirteenth century onwards. As a Hanze city it had been a centre of trade and industry for ages. A university city, Groningen still occu-pies the seventh position as regards number of citizens, although its population has hardlyincreased since the ’50s: from 150,000 to 178,000. The number of jobs is roughly 115,000.About 55,000 of these are located in and around the city centre. Half of all workers live outside the municipality. The main employers are the two universities, employing almost7,000 people and accommodating more than 36,000 students, and the Academic Hospital,employing 7,000 people.The city has a compact spatial (built-up) structure, even though the number of inhabitantsper hectare of residential area decreased from 136 to 71 between 1964 and 2000. Within a 3-km radius from the heart of the city we find 78% of all inhabitants and 90% of all jobs; near-ly all buildings are found within a 5-km radius. The main road system texture is coarse andintended as a concentration area for car traffic. Its structure is characterised by five radialroutes connecting the city centre with the suburbs, and a ring road to which radial arterialroads are branching on from out of the surrounding region. The city’s most ancient streets,the Hereweg (situated on top of the ‘Hondsrug’ downland) and the Oude Boteringestraat runin a north-south direction to the Grote Markt and the Vismarkt, both of them squares in theheart of the city. Around the car-restricted, partly car-free city centre a car park distributionring is operational (eleven parking garages all of them nearby) for the inner city and theadjoining residential quarters.

16 Fietsberaad Publication 7
Public transport (bus and train) is also characterised by an outspoken radial structure, runninglargely parallel to the main car traffic structure (especially along the routes leading from thering roads to the inner city). All city and district public transport (bus and train) converges intwo mutually connected public transport nodes in the city centre and central station area.
Map 1. Groningen
Groningen, cycling city: how come?In 2002 the Dutch cyclists’ union proclaimed Groningen ‘Cycling City of the Year’. As regardsbicycle use the city has topped the ratings of Dutch cycling cities for years: the share of tripsby bicycle of the citizens of Groningen has been hovering around a level of just under 40%for almost twenty years. This awards Groningen the first place among the main cities, occa-sionally taking turns with Zwolle. The question is how the municipality of Groningen managedto achieve all this. Is this only the result of cycling policy ‘in a strict sense’; activities basedon a policy directed purely at bicycle traffic? Not likely, considering Groningen’s relativelyhigh ‘Fietsbalans’ score in the competitive position of the bicycle compared to the car andthe city’s urban density. These scores indicate a relation with integral transport-and-trafficpolicy and with spatial policy.
Car-restricted area
Parking garage
Car park
Number of places
P+R Citybus route + stops
Parking route + driving direction

Fietsberaad Publication 7 17
Cycling policyPicture 1 starts out with the main bicycle facilities around 1964; a time when only a few‘pure’ cyclists’ facilities had been realised. Through cycle paths were only found alongsidethe Hereweg-Herestraat, the Paterswoldseweg and a part of the Friesestraatweg.Although the first municipal bicycle policy document dates back to 1986, cycling policy hadalready received attention at an earlier stage. The 1969 traffic plan named VerkeersplanCentrum Groningen already assigned priority to bicycle traffic facilities. Preventing cyclingdetours received much attention when one-way car traffic was introduced as a measureaffecting circulation. It was felt important to create uninterrupted, long bicycle routes as partof a route network. Efforts had to be put in to interrupt cyclists’ movements in as few placesas possible and to diminish the risk of accidents. To achieve this, own domains for cyclistsand traffic regulation facilities were considered desirable. Also the 1976 traffic circulationplan named Verkeerscirculatieplan devoted much attention to bicycle traffic. 2.7 million ofthe almost 6.4 million euros spent on the realisation of this plan went to bicycle facilities.Realising all these plans implied that the bicycle traffic infrastructure would steadily expandin the years to come. See Picture 1.
Picture 1. Main bicycle infrastructure around 1964, 1980 and 2000
In the early ‘80s an experiment was started with a surveyed bicycle parking facility in the citycentre. Tests were successful and were followed up. By now the city has a network of almostthirty surveyed bicycle parking facilities. Next to traffic safety, social safety also received moreand more attention. This was materialised by the municipality in a cycling policy budget,whether or not with financial support from the government and the province.
The 1986 bicycle policy document named Nota Fietsvoorzieningen concluded that the initialdecline in bicycle use in the ’60s and the simultaneous growth of car use had been succee-ded by a renewed growth of bicycle use by the mid-‘70s, against all expectations. “Not onlydid this growth express itself in a recreational and physical training environment - witnessthe massive growth in the number of sports cyclists - also the share of the bicycle in com-muter traffic rose sharply. The car-restricting measures in many cities and the costs of carobviously relate to this. Also the municipality of Groningen conducts a traffic policy focusingon bicycle traffic and its promotion.” Gerrit van Werven, policy-making official, in those days in charge of the preparation of Nota Fietsvoorzieningen, emphasises that this was theNetherlands’ first fully-fledged bicycle policy document. Admittedly, Delft for instance alsohad its own policy document, but it only related to the city’s bicycle network. Instead, themunicipality of Groningen had an integral plan, directed at the broad spectrum of cyclingpolicy.
The 2000 bicycle policy document named Nota Fietsverkeer shows that the municipality ofGroningen invested a total of almost 23 million euros in bicycle facilities during the periodbetween 1989 and 2000; facilities like cycle paths and bridges and asphalt cycle path surfa-
cycling facilities along major roads
car-restricted cycling routes
ca. 1964 ca. 1980 ca. 2000

Map 2 shows that by the year 2000 Groningen had a number of intensively used radialbicycle routes, especially the route from Beijum via the Korreweg and the routes follo-wing the Hereweg, Paterswoldseweg and Damsterdiep. Another heavily used transverseconnection is the Pleiadenlaan-Eikenlaan-Asingastraat-Sumatralaan-Kapteynlaan route.The Ebbingestraat, too is used intensively. The total load put on the belt surrounding theinner city, meaning all bicycle traffic from various directions toward the inner city, is ca.150,000 cyclists every 24 hours.
18 Fietsberaad Publication 7
ces. We see specific bicycle traffic investments and investments in bicycle traffic as a resultof other plans. The 2000 Nota Fietsverkeer itself resulted in an extra financial effort on thepart of the municipality, namely another 4 million euros for the years up to and including2002 and another 5.5 million euros for the period between 2003 and 2006.Picture 1 also shows the main bicycle facilities by the year 2000. When compared to the situ-ation existing around 1964 a great number of bicycle facilities appear to have been realisedbetween 1964 and 2000. All bicycle facilities between residential quarters and the city centrehave in fact been realised. In addition a number of main tangential connections were laidout especially for bicycles, such as the cycle paths along the Petrus Camperboulevard andthe Rosensteinlaan, the Stadspark-Peizerweg cycle paths along the Laan 40-45 and theOosterpoort-Centraal Station-Paterswoldseweg bicycle connection.
Map 2. Bicycle use on main routes in Groningen (24 h. intensities)
Integral traffic policyIn 1964 the advance of the motor car had only just begun in the Netherlands. At this time the Grote Markt beltway in the city centre of Groningen handled 23,000 motor vehicles every24 hours while there were 43,000 on the canal beltway surrounding the historic city centre.The load imposed on the Grote Markt beltway was only a little below the total amount oftraffic entering and departing the city!In the present situation, with the advance of the motor car reaching its peak, there are roughly800 buses and taxis and 30,000 motor vehicles every 24 hours. Apparently, an effective policyhas been conducted and realised over the past four decades.Its background must be found in the preceding period. The city centre of Groningen was heavily damaged during the Second World War and the northern and eastern sections of the Grote Markt, de Waagstraat and de Guldenstraat were among the sections almost fullydestroyed during fights between the Canadian army and the German occupying forces.Reconstruction allowed more space to motorised traffic; the centre could now be accessedvia wide arterial roads and passed via the Grote Markt, a sort of traffic square surrounded by wide one-way roads having four or five lanes. There was no proper ring road at all.
< 1.0001.000 - 2.5002.500 - 5.0005.000 - 7.5007.500 - 10.000> 10.000
current intensitiesprognoses missing links

Fietsberaad Publication 7 19
Car traffic boomed in the ’60s, a development which was expected to continue even morestrongly. It is striking that car ownership in Groningen in 1965 was slightly above the natio-nal average (110 cars per 1,000 inhabitants compared to the national average of 100 cars per 1,000 inhabitants). Between 1955 and 1968 car traffic in Groningen became threefold;between 1960 and 1968 it doubled. Public transport declined sharply in this same period.Traffic on one of Groningen’s main public transport lines fell by ca. 45% between 1958 and1967 (1,970 to 1,093 million passengers per year).In 1969 this induced the municipal executive to present a traffic circulation plan characterisedby a far-reaching vision. Named Verkeerscirculatieplan Groningen 1968-1969 this providedfor a distribution ring closely encircling the city centre (Diepenring and Zuiderdiep). The traffic structure would moreover be composed of three tangents: the inner, middle andouter tangent.The distribution ring and the inner and middle tangents would result in large-scale traffic breakthroughs.The plan evoked much resistance and the municipal executive finally came to conclude that,apart from economic development, a liveable, small-scale inner city as a venue for all kindsof activity and with a mixture of living, working and shopping functions favouring pedestri-ans, cyclists and public transport was another thing worth considering. This implied the endof the construction plans of the inner, middle and outer tangents. Only the Zuiderdiep wasfully transformed into an arterial road consisting of four to six lanes, all in accordance withthe starting-points of Verkeerscirculatieplan Groningen 1968-1969.
These changed views were recorded in a policy document named Doelstellingennota 1972;the ‘bible of progressive urban administration’ according to the Nieuwsblad van het Noordennewspaper. In concrete terms the amended policy implied re-allotment of the availablepublic space. The term ‘stadserf’ came to apply to the area surrounding the Grote Markt,allowing more space to pedestrians and cyclists. The flow of city and district public transportwas improved and bus lanes were constructed. The dominant car traffic function of theZuiderdiep was turned back again by realising bus lanes and city centre stops for districtbuses and the construction of segregated, uninterrupted cycle paths.Socialist alderman Max van den Berg commented on this in De Volkskrant newspaper of 24May 1977: “I had been alderman for just two months, eight years ago, when I was shockedto learn what was going to happen to the Zuiderdiep; a wide tarmac road for car traffic cut-ting through the city. Although I was more than prepared to block this within the municipalexecutive, this had become impossible. Everything had been decided on, the contractorcontracted. So I was slightly moved when the first bit of tarmac was removed last week.”
20 Fietsberaad Publication 7
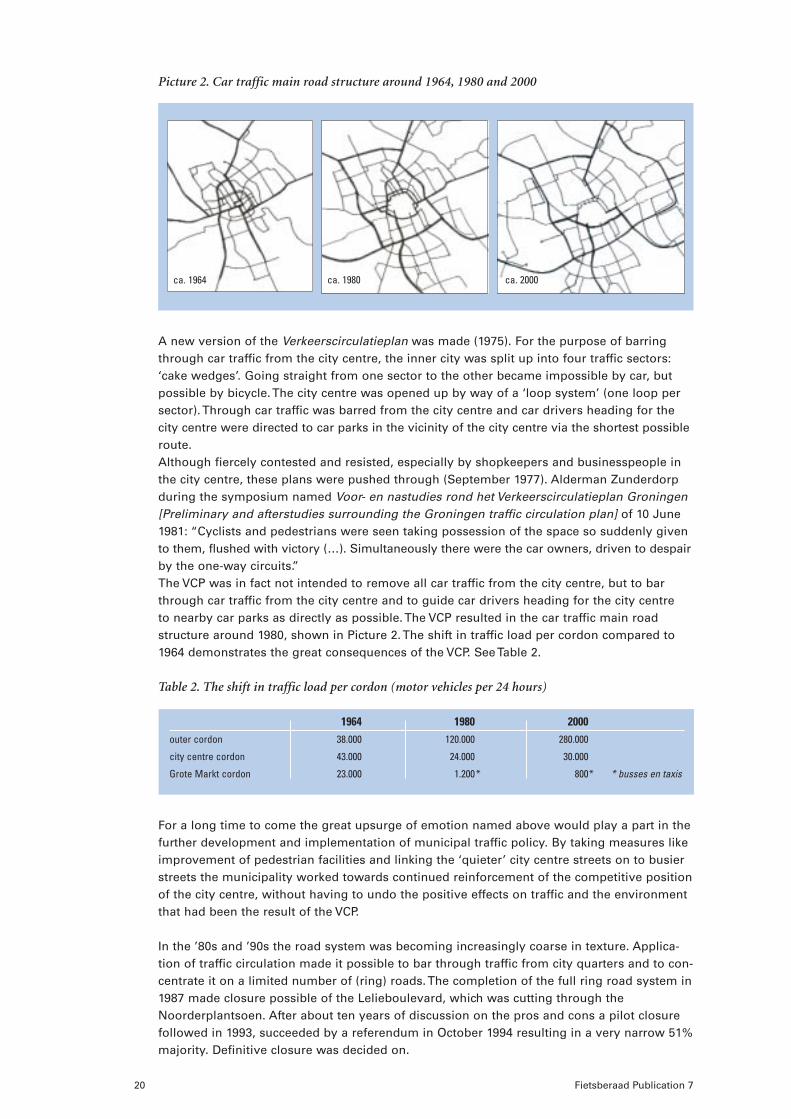
Picture 2. Car traffic main road structure around 1964, 1980 and 2000
A new version of the Verkeerscirculatieplan was made (1975). For the purpose of barringthrough car traffic from the city centre, the inner city was split up into four traffic sectors:‘cake wedges’. Going straight from one sector to the other became impossible by car, butpossible by bicycle. The city centre was opened up by way of a ‘loop system’ (one loop persector). Through car traffic was barred from the city centre and car drivers heading for thecity centre were directed to car parks in the vicinity of the city centre via the shortest possibleroute.Although fiercely contested and resisted, especially by shopkeepers and businesspeople inthe city centre, these plans were pushed through (September 1977). Alderman Zunderdorpduring the symposium named Voor- en nastudies rond het Verkeerscirculatieplan Groningen[Preliminary and afterstudies surrounding the Groningen traffic circulation plan] of 10 June1981: “Cyclists and pedestrians were seen taking possession of the space so suddenly givento them, flushed with victory (…). Simultaneously there were the car owners, driven to despairby the one-way circuits.”The VCP was in fact not intended to remove all car traffic from the city centre, but to barthrough car traffic from the city centre and to guide car drivers heading for the city centre to nearby car parks as directly as possible. The VCP resulted in the car traffic main roadstructure around 1980, shown in Picture 2. The shift in traffic load per cordon compared to1964 demonstrates the great consequences of the VCP. See Table 2.
Table 2. The shift in traffic load per cordon (motor vehicles per 24 hours)
1964 1980 2000outer cordon 38.000 120.000 280.000
city centre cordon 43.000 24.000 30.000
Grote Markt cordon 23.000 1.200* 800* * busses en taxis
For a long time to come the great upsurge of emotion named above would play a part in thefurther development and implementation of municipal traffic policy. By taking measures likeimprovement of pedestrian facilities and linking the ‘quieter’ city centre streets on to busierstreets the municipality worked towards continued reinforcement of the competitive positionof the city centre, without having to undo the positive effects on traffic and the environmentthat had been the result of the VCP.
In the ’80s and ’90s the road system was becoming increasingly coarse in texture. Applica-tion of traffic circulation made it possible to bar through traffic from city quarters and to con-centrate it on a limited number of (ring) roads. The completion of the full ring road system in1987 made closure possible of the Lelieboulevard, which was cutting through theNoorderplantsoen. After about ten years of discussion on the pros and cons a pilot closurefollowed in 1993, succeeded by a referendum in October 1994 resulting in a very narrow 51%majority. Definitive closure was decided on.
ca. 1964 ca. 1980 ca. 2000
Fietsberaad Publication 7 21
Assessment shows that bicycle traffic in the Lelieboulevard and Noorderplantsoen has in-creased by ca. 30%. More than half of all car traffic that used to take this road through theNoorderplantsoen chose the ring road system after the above closure.
Considering, among other things, the bad experiences generated by the VCP and the factthat the Noorderplantsoen referendum had demonstrated the weak social basis for this measure, the municipality organised an experimental open-plan process halfway the ’90s,aiming to develop urban traffic policy for the period until 2010. This process occurred withintense participation by the population and interest groups (in study groups and workshops)and a poll was organised among 5,000 people. This process resulted in the 1997 policy docu-ment named De bereikbare stad leefbaar [The accessible city liveable].The process more than once demonstrated that there was still resistance against the policythat had for many years been conducted by the municipality of Groningen (from the intro-duction of the VCP onwards) to bar unnecessary car traffic from the city centre and to ensurea pleasant environment for pedestrians, cyclists and residents. Two camps could clearly bedistinguished at the start of this process: ‘the municipality does not try hard enough for
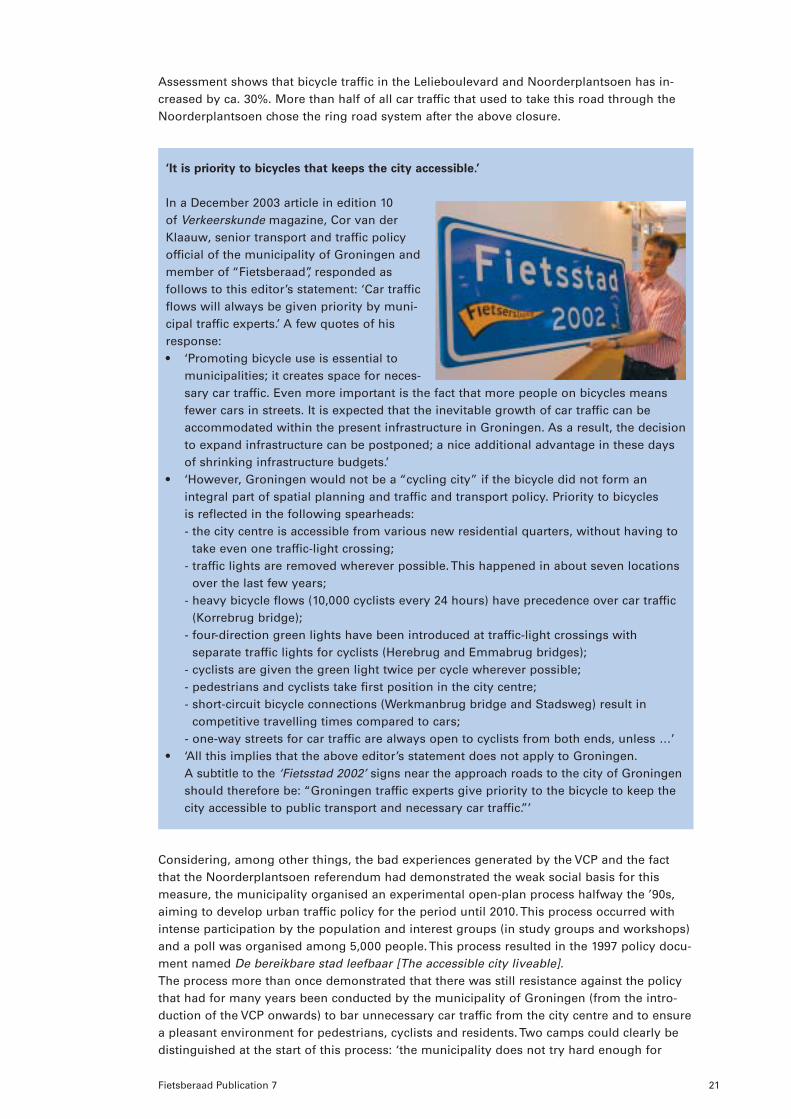
‘It is priority to bicycles that keeps the city accessible.’
In a December 2003 article in edition 10 of Verkeerskunde magazine, Cor van derKlaauw, senior transport and traffic policyofficial of the municipality of Groningen andmember of “Fietsberaad”, responded as follows to this editor’s statement: ‘Car trafficflows will always be given priority by muni-cipal traffic experts.’ A few quotes of his response:• ‘Promoting bicycle use is essential to
municipalities; it creates space for neces-sary car traffic. Even more important is the fact that more people on bicycles meansfewer cars in streets. It is expected that the inevitable growth of car traffic can beaccommodated within the present infrastructure in Groningen. As a result, the decisionto expand infrastructure can be postponed; a nice additional advantage in these daysof shrinking infrastructure budgets.’
• ‘However, Groningen would not be a “cycling city” if the bicycle did not form an integral part of spatial planning and traffic and transport policy. Priority to bicycles is reflected in the following spearheads:- the city centre is accessible from various new residential quarters, without having to
take even one traffic-light crossing;- traffic lights are removed wherever possible. This happened in about seven locations
over the last few years;- heavy bicycle flows (10,000 cyclists every 24 hours) have precedence over car traffic
(Korrebrug bridge);- four-direction green lights have been introduced at traffic-light crossings with
separate traffic lights for cyclists (Herebrug and Emmabrug bridges);- cyclists are given the green light twice per cycle wherever possible;- pedestrians and cyclists take first position in the city centre;- short-circuit bicycle connections (Werkmanbrug bridge and Stadsweg) result in
competitive travelling times compared to cars;- one-way streets for car traffic are always open to cyclists from both ends, unless …’
• ‘All this implies that the above editor’s statement does not apply to Groningen. A subtitle to the ‘Fietsstad 2002’ signs near the approach roads to the city of Groningenshould therefore be: “Groningen traffic experts give priority to the bicycle to keep thecity accessible to public transport and necessary car traffic.”’

cars’ versus ‘the municipality does not try hard enough for public transport and bicycles’.The first-named group largely consisted of people of the surrounding regions who worked in the city or used city facilities. The second group concerned mainly city residents who were troubled by increasing car traffic. The participants in the process were really given theopportunity to enter into the discussions, resulting in a stronger basis for traffic and trans-port policy in Groningen.The essence of the policy in De bereikbare stad leefbaar is that a distinction is made betweenthe areas inside and outside the ring. There are no road breakthroughs inside the ring, andefforts are directed at only a limited improvement of the infrastructure (the access routes), attraffic management and at the downward revaluation of sections of the Diepenring, wherethe emphasis now concerns its staying environment.
From the ‘80s onwards, parking policy became an increasingly guiding policy instrument.Parking fees and maximum parking stays were introduced within a wide circle around thecity centre. Between 1980 and 2000 the surface of the parking-fee area increased from 1.2 km2
to 5 km2. At present there are eleven parking garages, offering a total number of 3,600 places.Most garages charge € 1,50 per hour. Public transport is strongly promoted too, including aP+R Citybus system. Large P+R grounds are found in the Sontweg, Peizerweg and near theKardinge transferium. From here you can take the P+R Citybus to the centre and back again,while parking is free. A bus return ticket is cheap at € 2.00, a rate unchanged since 1 January2004 (a ride is possible at this rate in the presence of at least four other passengers). In 2004over 1.3 million people made use of the Citybus.
Spatial policyAround 1964 Groningen was the most densely-populated city in the Netherlands. So far themunicipal boundaries had only allowed expansion close to the existing city. Parts of the citycentre were relatively worn, impoverished. Business was oriented on waterways. Whether or not by force, policy was directed at living in a concentration in and around the city centre,partly because of the favourable influence this had on the transport balance. The city wasgiven slightly more breathing-air when the municipal boundaries were enlarged in January1969, following annexation of Hoogkerk and Noorddijk. From then onwards, expansionswere subject to the chosen principle of ‘jointed sectors’: new residential quarters distancedfrom each other and from the city centre, each with their own centres and green lungs inbetween. In the early ’70s the general picture showed a strong increase in population. In Groningen this resulted in the construction of Vinkhuizen, a quarter with a fully urban perspective (including high-rise). On the south end of the city the construction of De Wijert-Zuid was started, a residential district for the more affluent. Generally speaking the amountof social housing realised is high within the new city expansions of the ’70s.
22 Fietsberaad Publication 7

While large extensions were being realised, the population of the city of Groningen stabilisedin the ’70s and ’80s. First and foremost this was due to the decline in birth rates; a declinewhich was far greater in Groningen than in the rest of the Netherlands, because of over-representation of the 15-29 age group in the population (caused by an increasing influx ofuniversity students and students of higher professional education). Next, suburbanisationwas high as a result of graduates who had found jobs elsewhere in the Netherlands on theone hand, and young families looking for more spacious accommodation on the other hand.A new increase in population occurred in the ’90s. This was due to provincial policy, whichgave fewer suburbanisation possibilities, and due to the fact that the municipality of Gronin-gen stepped up its housing construction for young families.As a result of the high expectations regarding population growth, a fully new city quarter,Noorddijk, was planned for 60,000 inhabitants. Because of changed views, only Lewenborgand Beijum were realised in the end; quarters intended as an alternative to suburbanisationcentres. These were followed by the Hoornse Meer, a quarter characterised by a mixture ofsocial and non-subsidised housing. The adjacent new residential quarter Hoornsepark wasreserved for owner-occupied housing. Next, the green strips between Lewenborg and Beijumwere used for the realisation of the Ulgersmaborg and Hunze quarters. Finally, during the pasttwo decades, minor quarters like Klein Martijn, Ruischerwaard, Drielanden, De Held, Graven-burg, Ruskenveen, Kranenburg, Piccardthof, Reitdiep and Van Starkenborg were developed.
Apart from what turned out to be a fairly limited expansion from the ’80 onwards, spatialpolicy in Groningen re-focused on a compact city. With businesses shifting away from thecity centre and its surroundings to new estates, not oriented purely on water but also ontransport by road, new space became vacant in and around the centre for housing and officeaccommodation, and service and office functions increased considerably here. Large-scaleretail facilities were realised adjoining the city centre (Westerhaven) and its immediate sphere of influence (the IKEA location). Outside the city centre the municipality opted for a relatively small-scale expansion model, the so-called extension model, which provided greater flexibility than the development of large, new residential quarters. This also allowedoptimal use of existing infrastructure and facilities like district shopping centres and made a high building density possible. Concentration of high-value facilities of various types contributed to the reinforcement of the central position of the city within the region and to restriction of suburbanisation.
Fietsberaad Publication 7 23
main roadrailway
ca. 1964 ca. 1980 ca. 2000
stationwaterway
built-up area (housing)businesses/offices
hospitals/educationrestructuring/intensifying
park/recreation
Due to the combination of increases in urban scale and housing dilution, a nation-widetrend, the picture of a compact city had disappeared around 1980. Yet, policy has continuedto be directed at attracting major economic and social provisions to the city centre and itsenvironment. The Alpha university faculty for instance concentrated in the city centre, andthe university hospital remained, renovated and expanded here.
Picture 3. Spatial structure around 1964, 1980 and 2000

24 Fietsberaad Publication 7
Bicycle parking; successful for 25 years
The motive used in 1982 to openGroningen’s first surveyed bicycleparking facility was to give people achance to get working experience. TheStichting Werkprojecten, a foundationfor work projects, wished to giveopportunities to young people whohad been in breach of the law andhad difficulties finding a job. Workingexperience would give them betterjob prospects. This would remain themost important motive for the nextten years to come. It all started with a guarded bicycle parking facility neara recreation pool, followed by fourmore of these facilities in the city centre a few years later.Halfway the ’90s there were twentybicycle parking facilities and a mobilebicycle parking for the two weeklymarket days and events. By 2006 thisnumber has risen to thirty guardedbicycle parking facilities. Not only is the municipality now a major employer in this respect, also secondary schools possess their own bicycle parking facilities for pupils.This increase is caused by the changed roles of the bicycle parking organisation and themunicipality. The above Stichting Werkprojecten has developed into a professional, custo-mer-directed organisation with a highly varied service package, adapted to the locationconcerned. There are bicycle parking facilities in the city centre equipped with for instancelockers and children’s buggies, while wheelchairs are on loan in other places. You can evenhire complete bicycle racks and manager cubicles. Other bicycle parking facilities alsooffer repairs or (carrier) bicycles for hire, while the recreation pool even has deckchairs for hire. The municipality itself considered bicycle parking facilities as part of its trafficpolicy: promoting bicycle use, less theft and quality improvement of the public space.The municipality is also aware of the future clientele of public bicycle parking facilities.The first school bicycle parking was opened ten years ago. By now there are fifteenschools with surveyed bicycle parking. Students only pay € 22.50 per year, discount included. “This is how education works,” says Cor van der Klaauw of the municipality
of Groningen. “If you have a goodbicycle you put it in a surveyed bicycle parking. With their subscrip-tion students can also park near thelibrary or cinema. Perfect solution.”The success of the Groningen bicycleparking facilities lies in the subscrip-tions, an estimated 10,000. An annualsubscription for twenty-five city bicy-cle parking locations costs € 25; a daycard € 0.90. A subscription thereforepays itself back because there are somany different facilities equippedwith a bicycle parking. Their annualincome - € 250,000 - is largely cost-covering.
Map 3. Bicycle parking in Groningen city centre: five guarded parkings

Around 2000 the spatial structure is characterised by a high degree of condensation. The outercontours of the city of 1980 have been maintained. One of the results is that most destinationswithin the city remain well within bicycle reach, even though the present average movingdistance will undoubtedly be higher than in the ’60s because of the high decline in populationdensity in residential quarters from then on. Apparently its effects have been compensated bya suitable (bicycle) traffic policy aimed to make bicycle use more attractive, for instance by theconstruction of high-value through routes for cyclists - not for car drivers - to and from areasremote from the city centre.
Continuous exchange between fields of policyEver since the early ‘70s this focus on a compact city has been the red line of spatial andtraffic policy in the municipality of Groningen, at executive as well as official levels. Duringan interview, Niek Verdonk, former director of the municipal department of city development,construction and living once observed: “Coincidence, aptitude and good luck are not theonly, and certainly not the first success factors of the spatial shaping of Groningen. It ratheris passion; a basic attitude sometimes labelled as obstinate by discussion partners duringverbal contest about right and wrong in housing construction. It is this attitude that is the basis of spatial planning in the city of Groningen.”
Fietsberaad Publication 7 25
The fact that this line could be followed so persistently cannot be seen as separate from thepolitical and executive dominance of socio-democracy in Groningen since the early ’70s.Sharp contrasts had arisen between left-wing and right-wing political parties, focusing them-selves on urban problems. The left-wing PvdA labour party won the council elections in 1974,after which a left majority executive was formed, bringing a thought revolution: from plansfor wide traffic breakthroughs and housing demolition to a liveable small-scale city centrefocused on residential and meeting functions. Maarten ’t Hart, traffic counsellor in Groningenat the time, used to talk about ‘the living-room function of the city centre’. The PvdA-partywould from then on remain the dominant party in the city council for decades to come, con-tinuously in charge of Spatial Planning and Housing, and also Traffic during the first period.It was this political continuity that ensured political consistency in spite of repeated roughweather and ever-recurring, fierce discussions, both within the council and with interestorganisations and the population.Where city centre policy and traffic policy are continuously characterised by fierce politicalstruggle, cycling policy has always enjoyed a council-wide basis in Groningen. This is still the

case right now, even where it concerns making budgets available. Successive socio-liberalaldermen have also put in a great effort toward bicycle traffic and the present liberal alder-man still continues on this track. The Groningen civil service for all its continuity has surelycontributed to the consequent preparation and implementation of this policy. Policy-makingofficials already present in the ’70s and ’80s have so far held a position within the civil serviceorganisation. By the end of the ‘80s the departments of Urban Construction and Traffic werejoined together within this organisation, resulting in a direct, material relation between bothareas of policy. Its ensuing interdisciplinary influence has without any doubt contributed tothe quality of design, covering structure plans right through to concrete facilities.
26 Fietsberaad Publication 7
Table 3. 2004 survey among passers-by in Groningen city centre; shares of the main modes oftransport in the number of visitors and realised turnovers (in %)
share in visitors share in turnoverswalking bycicle public transport car walking bycicle public transport car
local visitors 32% 46% 13% 9% 19% 56% 14% 25%
regional visitors 1% 22% 41% 36% 0% 21% 32% 40%
superregional visitor 5% 7% 48% 39% 4% 5% 39% 37%
total 20% 31% 27% 21% 11% 34% 25% 35%
Table 3 shows the profit that the Groningen city centre receives per individual mode oftransport. In total, considering all visitors and its complete turnover, the bicycle is ofmajor economic interest as well: 31% of visitors and 34% of the turnover. This obviouslyconcerns mainly Groningen citizens: 46% of the citizens of Groningen goes to the city centre by bicycle, realising 56% of sales to citizens. Visitors from the region and furtheraway in the Netherlands have a slight preference for public transport than for their cars,but visitors who come by car spend far larger amounts.Source: Goudappel Coffeng, Detailhandelsmonitor 2004 Gemeente Groningen, January 2005.

The Groningen success story explainedGroningen is considered one of the foremost cycling cities, bot inside and outside the Nether-lands. It sets an example to other cities as regards bicycle climate and bicycle use. Althoughthese two aspects already are closely interrelated, there is more. There are also clear relationswith the overall living and working climate in the city, with the population build-up, with the significance this city has for its surrounding ‘Ommelanden’ district and so on. In short:coherence, but infused by policy and continuity. The present situation in Groningen was notborn just by itself, nor did this happen in just a day.
Choices were made, made by man. This involved struggle, on and off, to be able to followthe lines that had been set. All this took time, and so did the implementation of all kinds ofplans. Coherence, continuity and policy; they recur time and time again, making it possibleto put the finger on what it is that makes Groningen such a pure cycling city. Naturally thereare also conditions that more or less autonomously explain a part of this high level of bicycleuse. The population for instance only slightly increased over the past forty years, allowingthe city to retain its compactness and resulting in stretches that on the whole remainedwithin cycling distance. Another aspect is the great representation of students in the city.
Still, apart from such conditions, autonomous as they are, there is especially policy:• Groningen conducts a broad cycling policy. ‘Broad’ here implies: attention to lay-out,
management and maintenance of a bicycle traffic infrastructure, (indoor) bicycle parkingfacilities, combating bicycle theft, traffic and social safety and relation to public transport.This policy has been conducted with an open eye for thirty, forty years, and with fundsand budgets available.
• Cycling in Groningen is also attractive because cycling policy is part of overall transportand traffic policy. This implies that politics made choices in the desired (living, working,shopping and recreational) functions of areas within the city and in the ways of movingwithin, to and from these areas. Imposing restrictions on car use - persistently - depen-ding on place and time, and through parking policy, surely contributes to the preferentialposition of the bicycle for many of the trips made by the citizens of Groningen. In thisway an integral transport and traffic policy improves the effectiveness of cycling policy.Not just for the city centre, but for the whole city (consider for instance traffic circulationin the other quarters).
• Spatial policy directed at a compact city implies many accessible activities for citizens,well within cycling distance. This municipal policy was built in two or three decades, persistently and with a clear vision, but also with an open mind to new developments.
Fietsberaad Publication 7 27

28 Fietsberaad Publication 7
To an important degree spatial policy determines the size and location of traffic flows in and around the city and the possibility to choose among various modes of transport. As a result, spatial policy is a precondition of cycling policy.
Policy, therefore, is the very essence of things. But policy is made by man. The fact thatsome politicians and officials did timely anticipate the spirit of the day may be a matter ofgood luck or coincidence, but is also commanded from time to time. For instance by a clearvision, persistence and confidence in one’s own policy, but also when facing resistance frompeople or developers. Surely it is no coincidence that the municipal organisation has beenfunctioning in a consistent and coherent way in these matters. And consciously too, on the part of politics as well as the organisation itself. In short, an integral policy with a longbreath works for Groningen. And for bicycle use as well.

Fietsberaad Publication 7 29
3. Amsterdam: many people, many cyclists,much policy
Amsterdam: capital city and in many respects also exceptional city in the Netherlands.
Certainly where it concerns bicycle use and everything connected (theft included). Leading
city in many aspects of cycling policy. Fietsverkeer magazine often wrote about Amsterdam
affairs. This chapter is a compilation. It opens with facts about bicycle use in Amsterdam,
followed by an assessment of Amsterdam traffic policy until 2000. And there are interviews
with three persons who have embodied Amsterdam policy in the last few years: officials
Joep Huffener and Ria Hilhorst and alderman Mark van der Horst. The chapter is completed
by the new 2006-2010 bicycle plan.
Cycling; disregarding age, income, quarter or ethnic background A survey held among a few thousand Amsterdam citizens demonstrates that cycling has agood name in the Dutch capital. 77% of Amsterdam citizens aged twelve and older has atleast one bicycle ready for use. 50% of them make daily use of the bicycle, 28% a few timesper week and 8% weekly. A number of things are striking here:• Bicycle owners are found all over the city, the largest relative proportion is found in the
centre of Amsterdam (85%) and the smallest in the South-East (70%).• Bicycle ownership is highest among native Amsterdam citizens (85%) and lowest among
citizens of Moroccan (54%) origin. Surinam (57%), Turkish (64%) and Antillean (64%) rankslightly higher.
• Bicycle ownership among young persons until 24 years is lower than among 24-65-year-old: 65% vs. 83%.
• 68% of the persons in households with monthly incomes lower than € 700 possess a bicycle.This is 89% for household incomes exceeding € 3,200.
Are these open doors? Only in part. The common denominator is that there are no reallyextreme variances among parts of the city, ethnic groups or age and income categories.Conclusion therefore is that bicycle ownership is fairly general for the entire population ofAmsterdam.

30 Fietsberaad Publication 7
Roughly 23% of the Amsterdam citizens has no bicycle. Part of them claim not being able tocycle. About 16% of those who can cycle were asked why they do not have one. Especiallynative Amsterdam citizens give (a combination of) three reasons: ‘Not needing a bicycle’,especially because a large city like Amsterdam offers good alternatives by way of publictransport. So this is used more often, certainly when you ‘don’t like cycling’ and claim that‘bicycles offer nothing in the way of comfort’. Immigrant citizens less often claim dangeroustraffic and fear of bicycle theft; reasons that are important enough for their native counter-parts to decide to make do without a bicycle.Respondents were asked for their mode of transport to four different destinations: work orschool (depending on their main occupation), shops for non-daily things and spare time.Table 4 shows the results for trips over estimated distances until 7.5 km. Estimates weremade by the respondents.
Table 4. Choices for modes of transport for trips until 7.5 km and various trip motives,Amsterdam (in %)
Amsterdam citizens show a slightly higher bicycle use compared to the average citizen ofthe Netherlands, both for commuter and shopping traffic and spare time activities. Also, thepublic transport share in Amsterdam is far higher. We can therefore conclude that the bicycle‘grabs’ its entire profit from the car. Undoubtedly this will be due to Amsterdam’s strict par-king policy. For each of the four trip motives put forward, more than half (55%) of the cyclistsstate as main reason that their bicycle brings them to their destination faster!
Source: O+S, the Amsterdam Bureau for Research and Statistics, Amsterdam op de fiets!,September 2003.
Top-form pupils more often go on foot, but why?Amsterdam children in the three top forms of primary school far more often go to school onfoot than by bicycle. Very few of them are brought to school by car or use public transport.This last-named aspect is well in line with the picture in the Netherlands; the first - walkingmuch rather than cycling - is more exceptional.
Table 5. Mode of transport home-school of pupils of 14 primary schools in Amsterdam,classes 6, 7 and 8 (in %)
trip motiveto work to school to shopping area leisure
mode of transport or studycar 13 5 14 19
public tranport 15 47 21 20
cycling 55 33 39 33
walking 10 13 23 27
other 6 2 3 2
total 100 100 100 100
share < 7,5 km 49 69 80 69
often sometimes never totalwalking 60 18 22 100
cycling 22 22 56 100
passenger on bike or moped 4 22 74 100
car passenger 9 36 56 100
by public transport 6 8 86 100

Fietsberaad Publication 7 31
The reason that these pupils walk much more often than cycle to school is mainly that theylive close by; an average distance of 700 m. More than one-fourth even lives within the 300 mrange. So bicycles are simply not necessary here. Almost all children do have a bicycle andthose who live slightly farther away will use it sooner. However, at distances of more than1.5 km they will sooner use other modes of transport. Many children make intensive use oftheir bicycles outside school hours.
We often hear that immigrants cycle far less than native inhabitants of the Netherlands. Thiswould be the reason that many children do not cycle to school in large cities. In time thiswould have an adverse effect on overall bicycle use. Do studies demonstrate this as well?The status of the bicycle in Amsterdam does not give much proof of differences existing between children with native or foreign backgrounds. The share of bicycles found in bothgroups is nearly the same and so is cycling ability. Children are also equally proud of theirbicycles and equally fond of cycling. What indeed appears is that children of newcomers (inthe same way as their parents) are in some respects more negative in their attitudes towardbicycle use. And indeed they cycle to school less frequently: 70% of immigrant pupils nevergo by bicycle versus 47% of native children. The reasons they give are mainly subjective:walking is preferred, or the bus, or not being in the mood. The first and foremost reasongiven by native children is that walking to school is easy because school is so close by. Thisreason is less often heard among children with foreign backgrounds. Especially these childrenwalk to school more often: 80% of all Moroccan children always goes on foot, the same goesfor 71% of the Turkish, 63% of the Surinam and 52% of native children. Regioplan researchagency attributes the fact that immigrant children walk much more often than cycle to schoolpartly to cultural differences: as many of their parents do not (cannot) cycle, cycling abilitiesare less obvious to these children. Another important explanation put forward is that manyimmigrant children are either at city centre schools in the immediate vicinity - so within walking distance - or at schools with a specifically religious background, too far away fromhome and not within cycling distance. Their parents often bring them to school in these cases.
Source: Regioplan, Kind and fiets: een onderzoek naar het gebruik van de fiets doorAmsterdamse basisscholen, Amsterdam, March 2001.

32 Fietsberaad Publication 7
Assessment of 1990-2000 traffic and transport policyStarting-point for Amsterdam transport and traffic policy is the 1993 Regional Transport andTraffic Plan (RVVP) . Its main objective was to discourage car use - which was not a taboo atthe time - and to promote public transport.By far most of all trips from home made by Amsterdam citizens remain within Amsterdam:93% in 1986-1991 and 91% in 1998-2000. These are exceptionally high percentages. Nearly30% of all trips is made on foot. For other modes of transport, see the modal split develop-ment in Table 6.
Table 6. Development of the modal split of Amsterdam citizens, 1986-2000 (in %)
mode of transport 1986 - 1991 1994 - 1997 1998 - 2002public transport 27 25 24
car driver 32 33 32
car passenger 10 8 8
bicycle (incl. moped) 31 34 36
total 100 100 100
Source: municipality of Amsterdam
Bicycle use has increased, especially among residents of the city centre and the old city.Especially public transport users have switched over to bicycles.Whereas Amsterdam citizens do not often leave the city, many people from outside come tothe city for purposes like working, shopping or studying, to name a few. These visitors makeup for a major part of the traffic picture, certainly by day. Each year Amsterdam citizens andvisitors together are counted in over two hundred fixed counting-points between 15.00 and18.00 hrs. It concerns the number of passages by way of the Singelgracht at the edge of the city centre, a beltway around the old city and also around the full agglomerate. Table 7demonstrates the very dominant position taken up by car traffic, certainly outside the citycentre.
Table 7. Number of car and bicycle passages on an average working day between 15.00 and 18.00hrs, 1998-2000, and the development of the number of passages during 1986-2000 (in %)
number of passages 1998 - 2000 development 1986 - 2000 (%)into the city out of the city into the city out of the city
kordon car bicycle car bicycle car bicycle car bicycleSingelgracht 26.400 15.900 30.200 18.100 -19 +20 -20 +9
Old City 58.200 11.300 61.400 10.500 -1 +11 -11 +11
agglomeration boundary 83.300 2.300 113.300 3.500 +35 -8 +21 -12
What also appears is that bicycle traffic in the Singelgracht and on the beltway surroundingthe old city has won grounds, while car traffic lost grounds here. The agglomerate boundaryshows exactly the opposite picture. Apart from bicycle and car, public transport showed avaried picture between 1995 and 1999. The number of public transport users (a daily averageof 650,000 in 1995) slightly increased due to a considerable rise in underground and high-speed tram use and an almost equal decline in tram and bus use. In this same period, thenumber of boarding and descending train travellers rose by 20% until roughly 250,000 peraverage working day in 1999/2000.Parking policy is a major factor in active car use discouragement policy. By now almost thecomplete city area encircled by the ring road is under a (paid) parking regime. Its effects areparticularly noticeable in the city centre, where parking charges have been common alreadysince the early ’90s. Car traffic from and to the city centre has declined and there are conside-rably more bicycle trips. The number of visitors who come to the city by car fell by roughly15% over the past few years.

1984 - 1989 - 1994 - 1998 - 2000 Netherlands 1998 - 2000mode of transport 1986 1991 1996 number % of 84-86 number % of 84-86pedestrians 663 646 460 400 -40% 8.254 -37%
cyclists 925 889 833 696 -25% 32.278 -15%
moped riders 645 613 532 508 -21% 31.794 -9%
motor vehicles
drivers+passengers 1.433 1.363 1.490 1.421 -1% 77.087 +14%
total 3.666 3.511 3.315 3.025 -17,5% 149.413 -3%
Source for data Netherlands: ww.swov.nl/cognos
The stories of the policy makersWhen Joep Huffener took up his position as bicycle coordinator (until 2004) this was a virtually
new function for Amsterdam. As such it involved a greatamount of pioneer’s work. “The city sectors had just beenshaped and a central cycling policy was called for in accor-dance with the Meerjarenplan Fiets. Promoting bicycle use,for instance by making it safer. Through the years you disco-ver that about 90 - 95% of what you can do has actually hap-pened. The remaining 5% that still awaits completion is alsohardest to achieve because most of the time it costs lots oftime and money, at little returns. It also involves a lot ofrepetition, project realisation and management; fewer newthings to tackle.”What is the most important role of the bicycle coordinator?
“Ensuring that cycling policy is an integral policy. De Fietsersbond cyclists’ union very oftendisagreed with me, as an integral policy often requires long-term thinking and planning, whe-reas the cyclists’ union usually wants instant solutions to for instance a black spot, or wantsto construct a cycle path right now. An additional problem of making good cycling policy isof course this system of city sectors, for instance for the Hoofdnet Fiets bicycle network.Although this network indeed had a legal basis, the dIVV (Department for Transport andTraffic Infrastructure) had no say whatsoever in these city sectors. In practice you were forcedto hold a plea for the construction of a cycle path on the basis of your blue eyes and connecti-ons, roughly like this: we have the money bag, so what if you just start spading the groundand give us the missing link?”Any successful projects? “Now I am inclined to name lots of smaller facts, relating for instanceto transport management and chain mobility. I thought up Park & Bike; a concept that worksand which is now copied outside Amsterdam as well. Lots of district bicycle parking facilitieswere restored and seven destination bicycle parking facilities have been realised. And thereare two pilots with automatic bicycle parking facilities which are really functioning well. In my view there is a future for automatic parking for rented and private bicycles. Unfortunately, the Kernnet Fiets bicycle network, complete with safe and comfortable cyclepaths in specifically coloured tarmac, has not been realised. Everyone concerned was enthu-siastic, the city sectors, the environmental departments; there even seemed to be agreementon the funding aspect. But the alderman in support of the entire project stepped down and
Fietsberaad Publication 7 33
Table 8. Number of traffic victims in Amsterdam, relating to mode of transport, 1984-2000 (in %)
Outsiders might be inclined to say that cycling surely must be dangerous in such a busycity. For the outsider this might be the case; for Amsterdam citizens the situation appearsnot to be too serious, although of course even one traffic victim is one too many. See Table 8: 696 casualties among cyclists (six killed) during 1998-2000.This is exactly 25% below the numbers in the period between 1984-1986. Which showsonce more that an increase in bicycle use in the Netherlands can indeed coincide with adecline in the number of casualties among cyclists.
Source: Municipality of Amsterdam, Amsterdam en mobiliteit: effecten van verkeer- en vervoerbeleid 1990-2000, Amsterdam, March 2003.

34 Fietsberaad Publication 7
his successor swept the plan off the table. Still, many fine cycling routes have been realisedover the years and cycling shares in Amsterdam are large. Only in the city centre - wherecycling trips are most frequent - facilities and maintenance are lagging behind when compa-red to the rest of the city.”
The Dienst Infrastructuur Verkeer en Vervoer (Department forTransport and Traffic Infrastructure) (dIVV, 375 staff) plays amain part in promoting bicycle use. Ria Hilhorst works in theStrategy and Policy Unit of dIVV (60 staff). Her very diverse jobspresent a picture of the various bicycle issues in Amsterdam.Take for instance the Hoofdnet Fiets bicycle network. ThedIVV shapes this network in consultation with the Amsterdamcity sectors. These fourteen city sectors themselves imple-ment their own cycling policy, resulting in different budgetsfor the construction and maintenance of cycle paths and brid-ges. This weakens the coherence of the bicycle network. The municipality is now consideringputting the main cycling routes under the responsibility of the central city, which wouldimply the possibility of quality requirements as well. Hilhorst is also involved in the realisa-tion of a general Communicatieplan Fiets cycling communication plan and a marketing planfor the new municipal bicycle parking organisation which has been active since 2001. Thepurpose of this plan is twofold: realising more bicycle parking facilities and increasing theuse of surveyed bicycle parking facilities. Other activities concern the completion of theHoofdnet Fiets policy document and preparation of the Jaarplan Fiets annual bicycle plan,and also activities that are less firmly based on policy. For instance responding to thequestions, suggestions and complaints received via the www.fiets.amsterdam.nl site. Ifnecessary she passes them on to the city sectors. She also handles requests of - mainlyforeign - delegations asking to explain Amsterdam cycling policy.Ria Hilhorst spends a lot of time on meetings within important cycling consultation bodieslike the dIVV, on agreement consultation with the city sectors and consultation within theUrban Bicycle Platform, in which the dIVV, DRO (the Spatial Development Department) andthe Cyclists’ Union keep each other informed on cycling policy. Right now the focus is main-ly on development of the Amsterdam structure plan, bicycle parking facilities and dangeroussituations. The relationship with the DRO is important for its policy implementation. This iswhere the traffic design experts are found. Hilhorst has her own ‘bicycle contact person’ inthe DRO and also in the administrative department. She also consults and advises on theposition of the bicycle within urban projects and promotes bicycle interests in the IJburg,Zuidas and Amsterdam CS projects.
Alderman Mark van der Horst (VVD) would name deeds ratherthan words: “Mobility is high already, and expectations arethat it will rise even more sharply. Also, optimum use mustbe made of each modality. Here we see a breach with thepast: no longer do I wish to obstruct car use. On the otherhand I do realise that we simply must not have too manycars. Therefore: the more people on bicycles, the easier it willbe for the other modalities. I admit that bicycles are no issuein our executive agreement. This is because to us bicyclesare no political thrill. With left-wing parties in the municipalexecutive, this would obviously be an issue for a policy
document. What it comes down to in the end is your choice of words, considering your party’s rank and file. But it does not imply that we do not consider cycling; on the contrary.From our present budget you will see that this is the first in a long series of years that moremoney - over 4.3 million euros - is being allocated for bicycles than in the preceding periods of left-wing constitutions.”“One of this city’s main curses had always been that we were great policy makers. I justneed to open one cupboard here and the reports will come tumbling down all over the floor.We can now start implementing all plans. There is money enough. Implementation however

Fietsberaad Publication 7 35
is what I am worrying about. You just cannot open roads everywhere at the same time.Sometimes you are suddenly faced with restricted capacity; sometimes you must wait forsomething else to pass by before hopping on. There surely is enough knowledge, moneyand organisation, but our next hurdle ahead is actual implementation.”“In the structure plan there will be a new bicycle network on an urban level (Hoofdnet Fiets)and on a city sector level. We will among other things have to consider how to introduce moretraffic segregation here. Right now we want to just pump all traffic through one and the samestreet. Convenient car routes through the city are often automatically transformed into bicycleroutes while other routes would be much more suitable. An example: when cycling from Am-sterdam-West to the Leidseplein, please do not go by way of the Overtoom, but take Vondel-park instead. So adapt your bicycle route here. We now have a separate bicycle bridge fromWest to Vondelpark and you must lure your cyclists into using this route. I do realise howeverthat this is an idealised picture. You just cannot unravel everything in a busy city like ours.”
Choosing for cyclists: The 2006-2010 bicycle policy planSeven spearheads can be distinguished in the new long-term plan that appeared by the endof 2005. Their order of priority occasionally is striking:1. Realising more and better bicycle parking facilities. To give more structure to the policy,
attempts are made by the municipality to lay down a so-called ‘bicycle parking considera-tion frame’ including general observations on how and where to realise, manage and runparking facilities. Another thing required is capacity enlargement near houses in older cityquarters, near public venues, near railway stations and more generally in ‘Locker’, theurban bicycle parking network. For the next five years to come the required budget is esti-mated at € 37 million; funds must be made available by subsidies of the regional authority(€ 2.5 million), city sectors (€ 1 million), the municipal mobility fund (€ 18.5 million), themunicipality’s own funds (€ 2.6 million) and specific funding of the most expensive under-ground bicycle parking facilities.
2. Persistently combating bicycle theft. Continuation of the close cooperation between themunicipality, police and the justice department and continuation of the main activities: registration, enforcement, mounting tags, registration checks and so on. Costs: ca. € 5 mil-lion in five years.
3. Constructing the missing links in the Hoofdnet Fiets bicycle network. Realisation of mostof these will be possible before 2010, so completion is not far off.
4. Promoting traffic safety for cyclists. Black spots and red routes must be persistently tackled,in addition to “Duurzaam Veilig”, the sustainable safety policy. These measures must befunded by way of the 2006-2010 traffic safety policy plan.
5. Proper management and maintenance of the Hoofdnet Fiets bicycle network.6. Reinforcing ‘weak links’ in the Hoofdnet Fiets bicycle network. For instance construction of
separate cycle paths instead of integrated cycle lanes.7. Formulating and implementing a communication strategy directed to specific target groups
and themes. The emphasis must be on groups that cycle less frequently, especially youngpeople. Costs: € 600,000.
The three spearheads of the Hoofdnet Fiets bicycle network will cost an estimated € 53 mil-lion in five years. The three most expensive projects (missing links in the form of bridgesand tunnels) make up for as much as € 21.5 million. Funding must largelycome from regional subsidies (ca. € 25million), contributions from city sectors(€ 10 million), the municipal MobilityFund (€ 5.5 million) and € 5 million viathe central city’s own budget. In thisway, the assumed total spendings inclu-ding organisation expenses will be over€ 100 million in five years for Amster-dam cycling policy - excluding specifictraffic safety projects.

36 Fietsberaad Publication 7
4. Enschede: cycling policy by way of the car
The traffic policy of Enschede is a direct result of the spatial and socio-economic blow the
city suffered due to the disappearance of the textile industry in the nineteen sixties. Dick
Buursink, former social democrat alderman of Enschede and chairman of “Fietsberaad”
looks back. How to be occupied mainly with car traffic and socio-economic developments
and still having cyclists’ interests in mind. And he would not be Buursink if he did not look
forward just for once.
“I was born and bred in Enschede.” Dick Buursink does not like woollywords of welcome and would rathercome straight to the point. We havecome to Enschede by train on a sunny,cold Friday morning and Buursink iswaiting to usher us along to the stationrestaurant, where he unfolds a city plan.“I have experienced the huge changesthis city has had to endure.” Markingout large sections around the heart ofthe city he continues: “All this is wherethe textile plants once stood.”
Textile cityAt the beginning of the twentieth century the appearance of the textile industry transformedEnschede from an agricultural into an industrial centre. In those days the city consisted of a small centre surrounded by textile plants mainly located along the railway tracks, withworking-class areas in between. In the city’s heydays there were ca. 25 large textile plants,including well-known names like Van Heek, Jannink and Ten Cate. The flourishing period ofEnschede as a textile city formed the background of Dick Buursink)s younger years. Thesewere followed by the closure of all factories by the end of the ’60s. His father worked forHolland, the first main textile plant to close its gates, in 1967. Roughly 23,000 direct jobs gotlost on a population of just under 140,000 in these years. As all these factories had beenlocated in fairly central positions - after all, the city only started expanding with the growthof the textile industry - the city now presented a view of having been bombed. Enschede had been transformed into a desolate waste and lots of people found themselves in trouble.The city has ever since been fighting its way out of this spatial and socio-economic blow.Naturally, this affected municipal traffic policy as well.
Rings and radialsAfter his historic account Buursink returns to his city plan. This shows a kind of spider’s web,with two rings clearly visible around the city centre. The inner ring is the so-called centrering. Buursink: “Car traffic would soon disappear within this ring. Back in 1975, Enschedewas the first city to choose for a pedestrian precinct and a number of streets had been madecar-free, including the Oude Markt. This was a first step.”The outer ring is the so-called Singelring (“boulevard ring”). It was realised already in the’30s under burgomaster Edo Bergsma, who also happened to be President of the DutchAutomobile Association and as such apparently had a clearer vision than usual at the time.The Singelring more or less was the city boundary at the time. Radials cross this ring fromall directions; most of them named after their place of destination: Hengelosestraat, Olden-zaalsestraat, Gronausestraat, Haaksbergerstraat. “Increasingly,” Buursink explains, “these

Fietsberaad Publication 7 37
Hengelosestraat
Gronausestraat
Haaksbergerstraat
Oldenzaa
lsest
raat
bebouwingbedrijventerreinbos, park & plantsoenbegraafplaats+ + + +
+ + + ++ + + +
N18
N35
N737
N732
N733
A1
A35
knip station
knip Boulevard 1945
Enschede, 2000Enschede, 1965Enschede, 1930 map
s: E
rwin
Sch
olte
n
built-up areabusiness areaforest and parkcemetry
Debate with the communityDick Buursink is a real political animal. At the early age of 26 (1978) he joined the social demo-crats in the city council. He has been involved in traffic ever since 1986, when in addition tohis position as party chairman he also joined the Spatial Planning and Traffic Committee. But his finest hour obviously started when he became alderman in 1994 and was invited torealise his traffic vision. Doing so, he introduced the above ‘cut’ near the railway station, followed by a similar cut in the Boulevard 1945, putting an end to east-west through trafficsouth of the centre ring. For the fresh alderman however, winning the general public over to these radical measures was not an easy thing to do. “Whether on purpose or not”, saysBuursink in a suddenly fanatic tone, “I have always conducted this discussion with the com-munity in a provocative, tough way. In plain words: if we do nothing right now we will see a total blockade of this city within five or ten years. Of course I always supported my viewsby way of figures. My approach was as practical as possible, translating quantities of parkedcars into football field surfaces. Capacity computations of road crossings. They could not putin a word edgeways. I explained in my very best way possible that we had to choose for thebicycle if we wanted to keep the traffic problem at least manageable. Each cyclist createsroom for a car. I had the newspaper take my picture, squeezed in between two cars andhands up high: now what to do? The result was that a part of the population got a red mistbefore their eyes. Letters to the editor, week-in-week-out.” He has to admit that this wasindeed hard on the citizens of Enschede. After all, he had been the one had who sold his car way back in 1989: “Too expensive for only limited comfort.” So it was easy to push thisfervent socio-democrat cyclist into an ideological corner; he just abhorred cars.Be it as it may, he went on persistently, organising public debates, sometimes including guestexperts as well. Buursink: “Awareness, awareness, awareness; that was what drove me. Thefinal result was that the council accepted the 1998-2015 mobility plan, involving 35 actionsfor implementation and the radical cutting measures named above. The only thing still left to do is to tackle the north-south through route west of the centre ring, so De Ruyterlaan-Ripperdastraat. If I had my say we could for instance introduce a one-way section here. Butthis is no longer for me to decide …” Buursink stepped down as alderman in 2001 due to the2000 fireworks disaster of Enschede.
On your bikesNow for some traffic practice. Unlike anyone else Buursink is aware that words and plansalone are too theoretical and just will not be convincing. For this reason he ushers us to the
radials brought through traffic within the Singelring. So in my view the second step wasobvious: reserving the centre ring for destination traffic and barring through traffic from theSingelring area. The Station Square you see here, located at the north end of the centre ring,is a fine example of this. Not so very long ago southbound through traffic just passed thisplace.” What we now see is an ultra-modern, fully-dressed square only accessible to busesheading for their stops and to cyclists on their ways. Buursink cannot help chuckling softlythat he has not succeeded in making a perfect implementation: “Although the layout of thissquare recently won a prestigious prize, there are massively complaints. Take this coveringfor instance; it may be very avant-garde but it will not keep you dry in a fresh gale.”
Map 4, 5 and 6. Enschede in 1930, 1965 and 2000.

38 Fietsberaad Publication 7
railway bicycle parking facility from where public transport cycling is arranged. Not surpris-ingly, our very first ride takes us to De Ruyterlaan-Ripperdastraat; certainly busy streets con-sidering the time of day. It is the end of a very common, sunny Friday morning. “I don’tknow if the present alderman will go for a drastic approach here. I did write a draft contai-ning recommendations to a few council members, in which I advocate the possibility oftaking one step further in the centre ring. You could for instance convert it into a pure par-king ring. Especially car drivers from up north now take this ring when searching for a suita-ble parking place, but they really should be directed straight to the parking garage near‘their’ approach road. Was my successor angry when reading my draft? No, not really; heeven asked me for a copy. Still, will he ever risk his neck? What I always say is: any aldermanwho wishes to be friends with everybody will only make enemies.”So we are pedalling along, past a few restored premises of the large ‘Van Heek’ to formsome kind of picture of what the textile city of Enschede once must have looked like. In pas-sing, Buursink points at the railway line to Gronau, Munster and Dortmund with some pride.The fact that Germany has become accessible by rail again since the end of 2001 can partlybe put to his account. Our next stop is the Singelring, more specifically the boulevard cros-sing between Oldenzaalsestraat/ Lasonderboulevard. Four-direction green for cyclists here,but what is more important is that the consequences of his traffic policy are obvious in thisplace, because the boulevard ring is very busy indeed.
No double lanesTo take the load off the busy Singelring Buursink at the time opted for luring Singelring traffic one more layer outward via ring road structures well-removed from the city. In thisrespect he has been successful in the south-west end (Usseler ring road, Westwal fly-over),the south end (A35/N35 with sufficient capacity, also around junctions) and the south-eastend (Oostweg and Euregioweg; N35 extension planned until the German autobahn pastGronau). In the north however, this was impossible; nor is it ever likely to be, due to a badlysituated exit, residential quarters and environmental values. The result of all this is that thesecond economic centre next to the heart of the city (university zone, business science parkand football stadium in the west) are not properly linked on to the A1, and that all busy traffic north of the city will remain being crammed into the Singelring. However, those whohalt their bicycles in the Lasonderboulevard will instantly see that Buursink once had analternative here as well. Instead of ‘a third ring’ he could in fact have opted for a renewedlayout of the boulevards; certainly here in Enschede, where boulevards already offer enoughspace. Why then no boulevard including two double lanes? If the trees in the centre hadbeen removed and the pavements had been narrowed down a bit, this would have been aeasy option. Buursink: “But this would have forced cyclists to get off, which was no option.After all, our city’s main infrastructure does not only belong to cars, it is everybody’s. Ourboulevards are major connections to and from school. Telling these cyclists to take illogicalroutes via residential areas will have no follow-up in this case.”

Fietsberaad Publication 7 39
Though all this sounds obvious, it remains funny when you consider a car-less aldermanthat should not be bothered, apparently, that in the situation desired by him the boulevardsonly have cycle lanes used for parking places; no perfect cycle paths. On the other hand this does not mean that the boulevards are dangerous to cyclists, because car flows aresegregated by way of central reserves and they can use spacious lanes.
A flourishing service cityOur long stay in the Lasonderboulevard has made us cold and hungry. We cycle down somemore boulevards before arriving at a sandwich bar. Some doubts remain. How is it possiblethat Buursink managed to withstand this struggle for boulevard widening; something so ob-vious? All the time he had taken a fairly tough stance, maybe because this was a relativelylate issue for Enschede. Twenty years earlier no-one would have complained about thenecessity of cutting down fine trees, but in the late ’90s such a thing was not done. Also thefact that accessibility was not really felt a problem until the ’90s never ceases to surprise us.All this surely must have happened somewhere else, a long time ago? This requires anotherbit of historical context from Buursink: “After the disappearance of the textile industry, a small, active professional workforce remained. A large part of the 45+ age group wasinstantly discarded in the ’70s and lots of people, often poorly educated, qualified for a disability benefit. It all took some time for the active workforce to regain its normal size. Our city gradually transformed itself from an industrial into a flourishing service city. Wenow have the high school and the university, numbering 12,000 and 6,000 students respec-tively. We offer employment in ICT and health care. Take for instance Medisch SpectrumTwente, this country’s largest, non-university hospital and Roesing, a prominent rehabili-tation centre including a research centre. All this brought about a shift in our workforce.People on a disability benefit gradually disappeared into the old-age pension category andwe received many people from elsewhere searching employment here. In such a case yousee a rise of prosperity in the city. Add to this the fact that, being the largest city in the eastof the Netherlands, we saw our regional function becoming more and more prominent. Thisled to the arrival of a music centre, a theatre and a great variety of catering facilities. OnSaturdays only we already welcome between 25,000 and 30,000 Germans to our shoppingmarket. But as we said, our development has been somewhat slower than elsewhere and we are still lagging behind. We still have a large share of unemployed people; not large likefor instance Rotterdam or Groningen, but cities like Amersfoort and Apeldoorn provide farmore jobs than we do. Our population is now on the increase again. Due to the speed andobscurity of these developments we did not notice until the ’90 that our city, too had startedclogging up.”
Lasonderboulevard near the Singelring
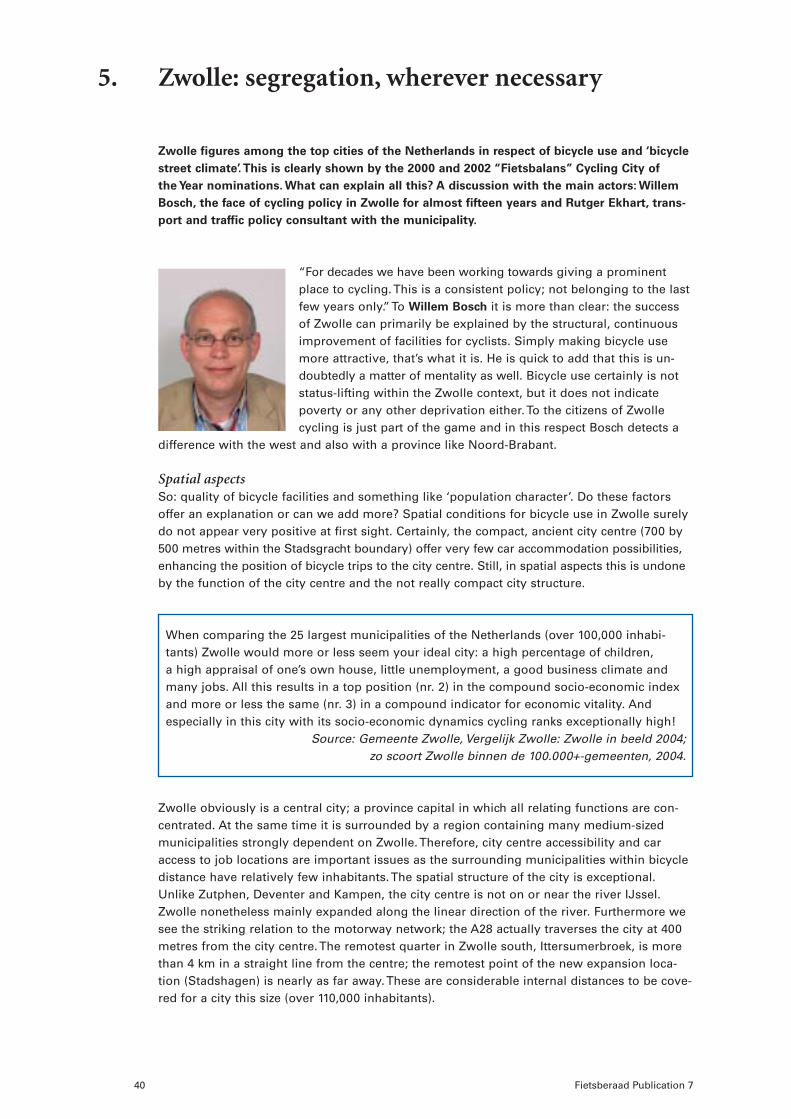
40 Fietsberaad Publication 7
5. Zwolle: segregation, wherever necessary
Zwolle figures among the top cities of the Netherlands in respect of bicycle use and ‘bicycle
street climate’. This is clearly shown by the 2000 and 2002 “Fietsbalans” Cycling City of
the Year nominations. What can explain all this? A discussion with the main actors: Willem
Bosch, the face of cycling policy in Zwolle for almost fifteen years and Rutger Ekhart, trans-
port and traffic policy consultant with the municipality.
“For decades we have been working towards giving a prominentplace to cycling. This is a consistent policy; not belonging to the lastfew years only.” To Willem Bosch it is more than clear: the success of Zwolle can primarily be explained by the structural, continuousimprovement of facilities for cyclists. Simply making bicycle usemore attractive, that’s what it is. He is quick to add that this is un-doubtedly a matter of mentality as well. Bicycle use certainly is notstatus-lifting within the Zwolle context, but it does not indicatepoverty or any other deprivation either. To the citizens of Zwollecycling is just part of the game and in this respect Bosch detects a
difference with the west and also with a province like Noord-Brabant.
Spatial aspectsSo: quality of bicycle facilities and something like ‘population character’. Do these factorsoffer an explanation or can we add more? Spatial conditions for bicycle use in Zwolle surelydo not appear very positive at first sight. Certainly, the compact, ancient city centre (700 by500 metres within the Stadsgracht boundary) offer very few car accommodation possibilities,enhancing the position of bicycle trips to the city centre. Still, in spatial aspects this is undoneby the function of the city centre and the not really compact city structure.
When comparing the 25 largest municipalities of the Netherlands (over 100,000 inhabi-tants) Zwolle would more or less seem your ideal city: a high percentage of children, a high appraisal of one’s own house, little unemployment, a good business climate andmany jobs. All this results in a top position (nr. 2) in the compound socio-economic indexand more or less the same (nr. 3) in a compound indicator for economic vitality. Andespecially in this city with its socio-economic dynamics cycling ranks exceptionally high!
Source: Gemeente Zwolle, Vergelijk Zwolle: Zwolle in beeld 2004; zo scoort Zwolle binnen de 100.000+-gemeenten, 2004.
Zwolle obviously is a central city; a province capital in which all relating functions are con-centrated. At the same time it is surrounded by a region containing many medium-sizedmunicipalities strongly dependent on Zwolle. Therefore, city centre accessibility and caraccess to job locations are important issues as the surrounding municipalities within bicycledistance have relatively few inhabitants. The spatial structure of the city is exceptional.Unlike Zutphen, Deventer and Kampen, the city centre is not on or near the river IJssel.Zwolle nonetheless mainly expanded along the linear direction of the river. Furthermore wesee the striking relation to the motorway network; the A28 actually traverses the city at 400metres from the city centre. The remotest quarter in Zwolle south, Ittersumerbroek, is morethan 4 km in a straight line from the centre; the remotest point of the new expansion loca-tion (Stadshagen) is nearly as far away. These are considerable internal distances to be cove-red for a city this size (over 110,000 inhabitants).

Fietsberaad Publication 7 41
Map 7. The Zwolle bicycle network
main cycle routemissingguarded bicycle parking
metre
0 400 800
Raised eyebrowsNevertheless Bosch and Ekhart mainly raise their eyebrows andtheir eyes become question marks when we suggest these factorscould be ‘negative for bicycle use’. Surely they never looked atthings this way and surely this is different in their view. Just takethe A28, to start with. Without any doubt this makes up for perfectconnections by car. But a barrier to bicycle traffic? Ekhart: “Cyclistson the routes to Aalanden, Stadshagen and Westenholte really arenot aware of crossing the A28. This motorway fits in so well from aspatial viewpoint that it poses no problem at all to cyclists.” Nor are
the avenues that together form the Zwolle ring and the railway line traversing the city at aright angle to the motorway heavy barriers in daily practice. The same goes for the ZwarteWater, behind which Stadshagen arose. “When developing Stadshagen, the choice wasmade again to project a central bicycle-public transport-axis toward the centre. This hasmeanwhile been realised. Only the bridge across the Zwarte Water is not in the north-westdirection we desired, but rather at a right angle to the Zwarte Water. This was mainly on nau-tical grounds. In cases like these you must give in from time to time, you cannot win on allfronts. But first and foremost there had never been any doubt municipality-wide about thedesirability of realising this central bicycle-public transport-axis and to divert more carsaround the city. This is what is most striking here: bicycle use is part of the inhabitants,cycling policy belongs to public servants and city managers. We seldom see discussionsabout starting-points.”
Are Stadshagen and Zwolle-Zuid too far to cycle regularly? Bosch and Ekhart do not believe aword of this. Nor is this an opinion frequently heard in Zwolle. Obviously the high bicycle usefigures show that they are right, but they can also explain: “Both in Zwolle-Zuid and in Stads-hagen for the time to come we will be putting in a great effort towards bringing functions with-in these city sectors, on a fitting scale. Although of course they are not independent quarters,many trips can indeed remain within these quarters, which will award an important role to the bicycle anyhow. Now what is most important is the essence of our cycling policy: whenheading for the city centre and the railway station our direct, comfortable routes with their little congestion are a practical counterbalance for these seemingly long distances.”

42 Fietsberaad Publication 7
Segregated networksThere are various explanations for the speed and comfort these bicycle routes offer. The mostbasic aspect of the explanation for the successful Zwolle cycling policy is its starting-point atthe level of traffic structures, networks. Continuous efforts from the ’70s onwards enabledthe municipality to realise the best part of the main network of bicycle routes, most of themsegregated from the busiest parts of the car network. Attempts had always been consciouslydirected at segregated car and bicycle networks. The concept of separate cycle paths runningalong traffic arteries has therefore become a relatively unimportant phenomenon in Zwolle.In Zwolle-Zuid and Noord for instance we find the great majority of bicycle routes runningthrough quiet residential streets. Or, rather, through residential streets made quiet by way ofcirculation measures. Take the Middelweg for instance; a busy car route in Zwolle-Zuid, not a main bicycle route for that matter. The main bicycle routes are running parallel, 200 metreswest and 500 metres east of the Middelweg. And we can find a lot more of these exampleswhen we compare car and bicycle networks by laying them on top of each other.
The 1978 Fietsverkeersplan bicycle traffic plan line still underlies the policy of Zwolle: ‘We advocate the realisation of a bicycle route plan that contains sections offering higherquality to bicycle flows than other roads can do; all this with the purpose of giving cycliststheir own place in present and future traffic.’ Simultaneous attempts are towards ‘pre-venting the main connections from running parallel to’ car traffic sections. Main bicycleroutes should be kept separate from main roads as much as possible and must traversebusy crossings by way of bicycle-friendly traffic regulations.
Source: AGV, Verkeers- en vervoersplan Zwolle part 3: Fietsverkeersplan (text), 1978.
Free of conflictA great advantage of these segregated structures to cyclists is that the main routes containfewer traffic light crossings; in fact only where bicycle routes cross the most frequented carroutes. For this reason, the municipality has been working for years on transforming thesecrossings into flyovers or tunnel passages. This for instance happened on all crossings withthe IJsselallee and a few crossings with the Zwartewaterallee and Ceintuurbaan. Quite a fewstill figure on the planning list, such as the ‘conflict-free crossing’ between the Meppelerwegand the Ceintuurbaan, which is about to be realised. All this makes Zwolle the city of thebicycle tunnels - and the municipality has devoted a lot of attention for years to social safety

Fietsberaad Publication 7 43
here as well. Especially this concept of social safety induced the municipality to choose formain bicycle routes by way of residential streets wherever possible. After all, social controlis more intense here than on segregated cycle paths. Another point for attention has longbeen proper lighting along main bicycle routes in Zwolle. The 1995 policy document namedRapper op de trapper already included the notion of ‘nocturnal routes’; a selection of mainbicycle routes that should for instance comply with strict lighting demands.
Further to these attempts to create comfortable, segregated bicycle routes, Rapper op detrapper devoted much attention to bicycle-friendly solutions at crossings. ‘In Zwolle weincreasingly decide to give cyclists priority above cars, wherever this is a responsiblething to do. This policy will be continued.’ So: much attention to traffic light regulations,and five policy rules for bicycle friendliness.
City of bicycle lanesApart from being a city of bicycle tunnels Zwolle is a city of bicycle lanes as well. This also is a consequence of the choice of policy, aimed at segregating main bicycle routes from carstructures. Whereas the cycle lane is often a temporary solution elsewhere in the Netherlandsdue to a lack of space for separate paths, this is mostly a conscious, positive choice forZwolle. It becomes visible in the lanes here; not those very narrow lanes that defy all trafficguidelines, making it impossible for cyclists to ride in pairs, but generally wide, comfortablelanes. Zwolle works towards a respectable width of 2 metres; most of the cycle lanes alreadyare 1.75 metres in width (except on routes like the boulevards surrounding the city centre,where they are 1.50 metres). They also are situated in streets with relatively little car traffic.This is the exact reason why Zwolle wishes to apply the concept of ‘bicycle streets’. Bosch:“We are working on a bicycle-street policy document. We see this as the way of taking yetanother quality step for cyclists on our main routes. These routes have become relativelyfree of car traffic already, so the bicycle-street story wishes to emphasise the preferred posi-tion of bicycle traffic on these routes.”In its choice for cycle lanes, Zwolle also awards a prominent role to the comfort of cyclists.After all, cycle lanes are far easier to embody in maintenance schemes than separate cyclepaths, because lanes are an integral part of the road surface. This is another major advantagewhen removing blackice for instance.
Van Karnebeektunnel

44 Fietsberaad Publication 7
Comfort of bicycle facilities has long been a core concept for Zwolle. This was the reasonfor this city to start working with a ‘measuring bicycle’ at an early stage, to determine thedegree of bicycle comfort in the most objective way possible. All thirteen main routes werestudied closely.
Source: Gemeente Zwolle, Comfortabel op het zadel: kwaliteit van 13 hoofdfietsroutes, 2001.
From the jury report Fietsstad van het jaar 2004 [2004 cycling city]: The municipality ofZwolle has been nominated in the category “fast, comfortable and attractive”. It has nowappeared that the city of Zwolle is the most comfortable cycling city. Practically all bicyclefacilities are asphalt for instance. Delays due to traffic lights are low (less than 11 secondsper kilometre), the average speed is high; other traffic participants are of relatively littlehindrance and bicycle facilities are generally wide enough to enable comfortable side-by-side cycling. What is also striking is the good surface, especially of cycle lanes andsolitary cycle paths. There is hardly any nuisance to cyclists here in the way of vibrations.This is the result of many years of undivided attention to bicycle routes.’
Bicycle versus carZwolle pays special attention to realising proper bicycle facilities; a cycling policy firm as arock and supported widely. Primarily spoken however, this policy has a value all its own andis not generally offset against car traffic facilities. Not only the networks, also the areas aresegregated in the sense that cycling policy development must not be continuously placed inthe perspective of competition with cars.This does not often give this cycling policy a heavy political load either. Willem Bosch canremember quite a few times that cycling policy was a serious political issue - consider forinstance all those measures taken in and around the boulevards (the ‘inner ring’) in the early’90s - these can really be named exceptions. “Groningen, Amsterdam, that’s where you findthese ideological city council discussions. Here in the east they are far less frequent.Certainly, we do a lot for cyclists and sometimes this was at the expense of car facilities, andcertainly this sometimes resulted in commotion; still, our prominent red line is that even forcyclists it is far better to keep on working towards these strongly segregated structures.Forcing back car intensity and car speed remains an issue on our radial main bicycle routes,as, after all, they have also been used intensively by cars for ages. Still we persistently try tofind a way out. Take for instance the Assendorperstraat. Ten years ago we just could not have

Fietsberaad Publication 7 45
it our way; now it is one-way traffic for cars, despite the many shops.”The same largely applies to (car) parking policy in and around the city centre, says Bosch.“This is another issue in which we are no leaders.” Only now we see drastic measures beingtaken in parking capacity in the city centre. Almost all street parking places will be removed,while replacement capacity is being realised in parking garages and outside the boulevardarea. In the past there was fierce political discussion concerning parking, especially in thelate ’80s, the time of our Parkeernota policy document. At the time our parking charges wereincreased to a level that can even now be considered as relatively high in the Netherlands.
Assendorperstraat
Green fingersAll this working towards segregated main structures turned out so well for Zwolle that thecity never made a choice to open up new quarters by diverting car traffic around them.Although for the city expansions of the past few years the municipality did indeed give moredirect and shorter connections to bicycle and bus than to cars, the car routes still take a fair-ly central course through the city. Nowhere do we see the well-known ring road as boundarybetween new residential areas and outskirts. This has always been an outspoken politicalstarting-point: Zwolle was to remain a green city, come what may. There have always been‘green fingers’ stretching out almost into the city centre. “The location of the city office, justbehind the railway station, still had cows grazing there until the ’90s”, says Bosch. As thetransformation from city centre to outskirts had to remain gradual on all ends we did notwant this clash in the way of a sharply-defined ring road.No wonder that Zwolle’s “Fietsbalans” scores are bad as regards car-bicycle travelling-timeratios: number 22 of the 25 100,000-plus municipalities. Places with even lower sores areEmmen, Dordrecht and Zoetermeer; about as bad as Apeldoorn and Ede, where cycling takesa very prominent position as well. There seems to be a connection here: Ede, Apeldoorn andZwolle are fairly spacious, maybe even village-like cities offering good facilities for bicyclesas well as cars - these two do not really clash. Also, these three municipalities are located ina more or less eastern position in the Netherlands. Again, a matter of culture?
Almost readyBosch and Ekhart might seem reluctant to admit it, but it is an inevitable conclusion: thecycling policy of Zwolle as regards bicycle routes is almost completed. “My estimate is that90-95% of the routes have been realised in the way we projected them.” What remains istackling a few crossings and upgrading a few main routes into bicycle streets, but this sumsit up more or less. The core of our activities will from now on be optimisation and goodmanagement and maintenance.

An essential element in the history of Zwolle cycling policy is its continuity. This has beenadhered to from a planning level right through to design level. In fact, most of the 1978Fietsverkeersplan still stands, except for some mutations due to city expansions unforeseenat the time. The thirteen main bicycle routes in Rapper op de trapper (1995) still form part of the main network, added by some tangential routes and routes to the most recent resi-dential expansions. The great majority of the plans of the above policy documents have been realised as well, although not along the strict plan lines of Rapper op de trapper, whichinvolved a four-year programme and a relating, reserved budget of 9,9 million guilders(almost 4,5 million euros). These specific budgets just never appeared. Looking back, Boschand Ekhart do not appear to regret this. After all, if continuous, integral assessment of allprojects also enables the realisation of a considerable number of bicycle projects, so muchthe better.A 2001 BYPAD-audit stated that in Zwolle roughly 10% of all spendings on infrastructuregoes to bicycle facilities and that traffic departments roughly spend the same amount oftime on ‘bicycles’ as they do on ‘cars’. “When considering this over a period of roughlytwenty years, this is a pretty accurate picture”, confirms Bosch.
Parking bicyclesA clear, coherent vision, realised persistently over many years. Although this might be thepicture of Zwolle policy as regards bicycle routes, this turns out different for bicycle parking.Zwolle is a two-faced city in this respect. Policy is focused strongly on the railway stationarea: high-quality parking facilities generally offering more than enough capacity, and withstringent enforcement. For Zwolle this results in a picture of having just about the neatestrailway station area of all Dutch cities on most days.On the other hand there is the situation in the city centre. Although this has been an issue inall municipal bicycle plans it has had very little follow-up for about fifteen years. The underly-ing design was merely a paper one. Admittedly, the situation in the city centre is far from sim-ple. The extent of the public space is extremely limited; in fact, Zwolle has no major squaresfit for bicycle parking. Proper solutions offering bicycle parking capacity concentrations areinevitably ‘in-house’. The little progress made so far is also partly due to the position taken bythe bicycle department officials. Bosch: “Bicycle parking facilities are hardly an issue incycling policy. If you want to do it properly you must situate them in suitable spots. For thisreason I have been consciously resisting wrongly-located bicycle parking plans for years, tooremote as they are from the city centre or the bicycle routes. Nor have I ever supported plansto discourage or even prohibit bicycle parking in streets as long as there are no proper alter-natives. So far, unattended bicycle parking has been possible almost all over the city centre.”Again, Zwolle has far-reaching plans - and this time they look promising. The three existingattended bicycle parking facilities are free of charge by now, and one of them is pretty wellused indeed (and well-located). More important however are the plans for a new (free) bicycleparking location: in-house, and offering over 600 places in a real city-centre location betweenthe Melkmarkt and Voorstraat, and with an exit leading to the Grote Markt.
46 Fietsberaad Publication 7

Fietsberaad Publication 7 47
Bicycle parking near Zwolle railway station
When leaving Zwolle railwaystation by way of the citycentre exit you will find bicycle parking facilities onyour left, Westerlaan, and on your right, Oosterlaan.The last look new. Betweenthe road and the fence alongthe railway track we see fine,sheltered and lighted un-attended cycle stands with ca. 900 clamps at intervalsslightly wider (37.5 cm) than before. The closer to the station entrance, the fuller thestands are. Each metre appears to count here.At first sight the users are satisfied. The only impression they have is that quite a fewcycles are left in their stands unattended for many weeks. This is now being tackled by the municipality by way of a sticker campaign: if a bicycle containing a sticker is stillfound after two weeks it qualifies for removal.Complaints heard in the Oosterlaan parking facility only concern antisocial behaviour of a few fellow-users, despite the fine equipment. “Look here”, points a student fromGroningen coming over to spend the weekend with his parents in Zwolle, “this is whatannoys me. A guy like this who is a bit late and just slams his bike into the fence to winjust a hundred metres.” It is true, several bicycles are found standing outside the clamps,but other users do not really seem to bother as long as they are not really in the way.When looking at the crammed, chaotic Westerlaan stands you really do not understandwhy users do not move over to Oosterlaan in greater numbers. When asked for an expla-nation this is short and univocal: they just happen to work, study or live this side of thecity and why cycle 500 metres on for a bit more parking convenience?

48 Fietsberaad Publication 7
6. Veenendaal: pampering every 300 metres
A village that grew into a city: from 5,345 inhabitants to over 61,000 in 2005. Veenendaal is
one of the many ‘new towns’ of the Netherlands, with all those characteristics we already
know from places like Capelle aan den IJssel, Zoetermeer, Hoofddorp and Nieuwegein:
uniform residential areas, large business parks and exchangeable ‘boxes’ along the motor-
way. Yet, Veenendaal has another characteristic, one which is absent in all those other
municipalities: a high degree of bicycle use, in line with the top-10 of Dutch cities. Nearly
31% of all trips made by inhabitants of Veenendaal are by bicycle. Now what are the rea-
sons that especially in this new town bicycles are ranking so high? An explanation by Leo
Smolders, until recently head of the traffic department of the municipality of Veenendaal.
To Leo Smolders (right) the beginningof this story lies way before cycling policy times. The spatial structure ofVeenendaal is a decisive factor. Thebuilt-up area virtually is a 4.5 by 4.5 kmsquare, with the town centre neatlypositioned in the middle. So: ideal forbicycle use. In its turn this structure isdue to ‘coincidences’ like the limitedmunicipal surface, and certainly to theconscious spatial policy conductedover the last few decades. Admittedly,Veenendaal had enough opportunity toadopt an effective spatial policy inthose years, for two reasons.
Many spatial opportunitiesIn the first place Veenendaal is certainly not to be considered the classical agricultural villagesuddenly turned centre of development in post-war years. Founded as a fen community,Veenendaal still shows its typical grid pattern; straight roads, originating in the structure ofthe fen waterways. It had become a relatively large village already in the 18th century,boasting a considerable industrial sector. In the first half of the 20th century the textile andtobacco industry flourished. After 1970 many of these ancient industries rapidly disappeared.The resulting vacant centrally-positioned locations offered many spatial opportunities. Due,perhaps, to factors like this industrial history, Veenendaal remained in control of its spatialand economic developments for a long time to come, always attempting to attain a properbalance between working and living, and quite successfully. Until way into the ’80s the townwas successful in maintaining a situation of ‘employment for own inhabitants’. The retailtrade also tried to maintain such a balance, and was even more successful. Veenendaal nowhas near-perfect purchasing power relations for its own inhabitants. This obviously hasimportant effects on traffic: many local ‘cycleable’ trips.Second, it is of interest that Veenendaal was given a development task in the 1996 policydocument named Tweede Nota over de ruimtelijke ordening in Nederland [Second policydocument concerning spatial planning in the Netherlands]. The village was planned to deve-lop into a city of 100,000 inhabitants. Although this was not fully attained, there was continu-ous development in the form of new residential quarters from the ’70s onwards. This oftenmade instant construction of proper bicycle facilities possible, both on a structural and adesign level, and also enabled funding within the overall operating budget of the new resi-dential quarters. And all this with a keen eye on good accessibility by bicycle of all districtfacilities. See map 9 of the bicycle network: all shopping centres and nearly all schools relatedirectly to bicycle routes.
phot
os: D
irk L
igte
rmoe
t

Fietsberaad Publication 7 49
Consistency in traffic policyVeenendaal’s turbulent growth occurredin a period in which the municipalityhad long since had its own acceptedstructure plan, drawn up in 1948 byurban planner Van Embden. This planreally assigned the status of ring road tothe Rondweg-West. But this was not tobe. The original plans which were aimedto realise new developments in thesouth were changed when the re-ope-ning of the railway to Utrecht came intoview. For this the Dutch railway compa-ny however demanded expansion (over5,000 houses) in a direction west of Veenendaal. This made the Rondweg-West a central axis, and at the sametime the only connection onto the natio-nal motorway network. By that timeanother projected main route,Rondweg-Oost, had already become anissue. This route, all but situated on theeastern municipal boundary, should inany case have to handle all north-souththrough traffic - and is by now also pro-
jected to open up the southern business parks (300 companies) plus the new residentialquarters Dragonder-Oost and Veenendaal-Oost. Completion of this route is expected by theend of 2007. The traffic structure plan prepared by Goudappel Coffeng, determined in 1998,clearly demonstrates the value of the eastern ring road: through traffic is diverted virtuallyaround, and central traffic is handled quickly via both ring roads. Together with the conve-niently-located business parks (all on the edge of town, near the arterial roads) this results ina more or less uninterrupted residential area in Veenendaal, without intense traffic functions.
Cycling to the shopping heartThe Rondweg-West ring road also madeit possible to bar more cars from thecity centre, because through north-southtraffic was now able to take anotherroute. The former north-south route byway of the central shopping street (deHoofdstraat) received a new layout, firstin the form of a yard layout with one-way traffic for cars, later (1988) aspedestrian area, accessible to cyclists atmost times as well. Barring cars fromthe city centre was further promoted bythe phased construction of a centre ring.This centre ring could be completed inthe late ’70s due to the fact that a num-ber of business parks west of the centrehad been vacated.
Buurtlaan-Oost
Map 8. Veenendaal
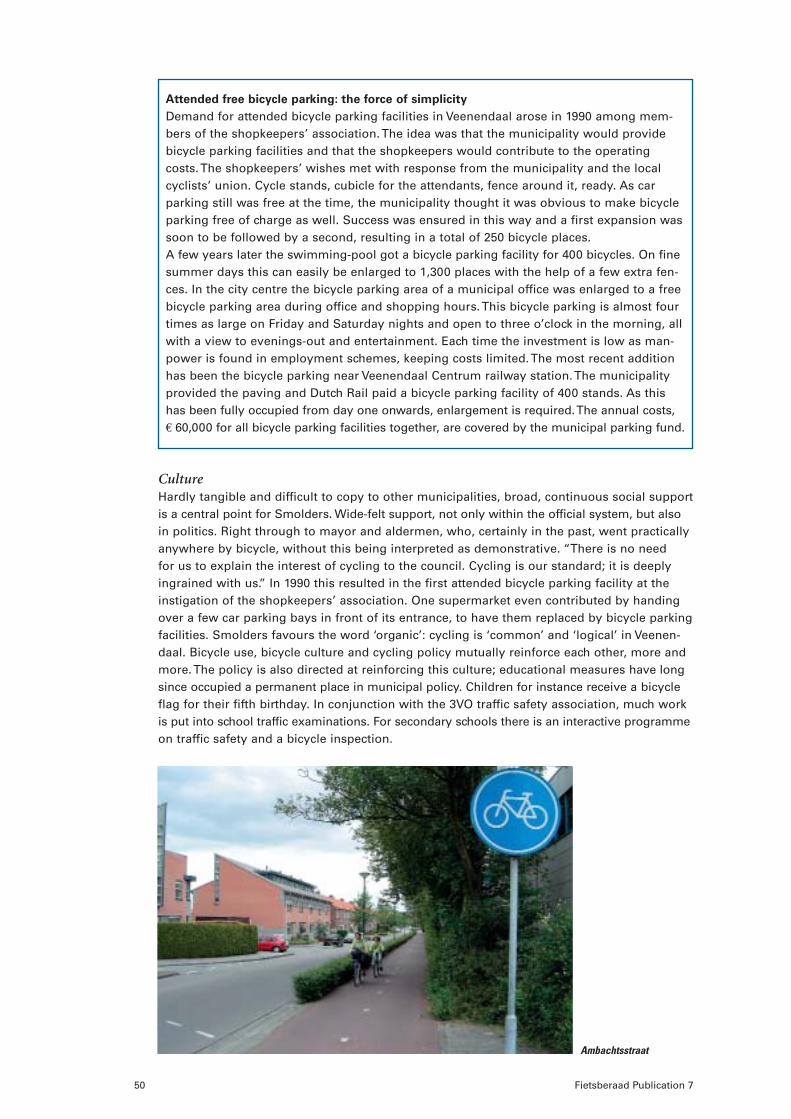
50 Fietsberaad Publication 7
Attended free bicycle parking: the force of simplicity
Demand for attended bicycle parking facilities in Veenendaal arose in 1990 among mem-bers of the shopkeepers’ association. The idea was that the municipality would providebicycle parking facilities and that the shopkeepers would contribute to the operatingcosts. The shopkeepers’ wishes met with response from the municipality and the localcyclists’ union. Cycle stands, cubicle for the attendants, fence around it, ready. As car parking still was free at the time, the municipality thought it was obvious to make bicycleparking free of charge as well. Success was ensured in this way and a first expansion wassoon to be followed by a second, resulting in a total of 250 bicycle places.A few years later the swimming-pool got a bicycle parking facility for 400 bicycles. On finesummer days this can easily be enlarged to 1,300 places with the help of a few extra fen-ces. In the city centre the bicycle parking area of a municipal office was enlarged to a freebicycle parking area during office and shopping hours. This bicycle parking is almost fourtimes as large on Friday and Saturday nights and open to three o’clock in the morning, allwith a view to evenings-out and entertainment. Each time the investment is low as man-power is found in employment schemes, keeping costs limited. The most recent additionhas been the bicycle parking near Veenendaal Centrum railway station. The municipalityprovided the paving and Dutch Rail paid a bicycle parking facility of 400 stands. As thishas been fully occupied from day one onwards, enlargement is required. The annual costs,€ 60,000 for all bicycle parking facilities together, are covered by the municipal parking fund.
CultureHardly tangible and difficult to copy to other municipalities, broad, continuous social supportis a central point for Smolders. Wide-felt support, not only within the official system, but alsoin politics. Right through to mayor and aldermen, who, certainly in the past, went practicallyanywhere by bicycle, without this being interpreted as demonstrative. “There is no need for us to explain the interest of cycling to the council. Cycling is our standard; it is deeplyingrained with us.” In 1990 this resulted in the first attended bicycle parking facility at theinstigation of the shopkeepers’ association. One supermarket even contributed by handingover a few car parking bays in front of its entrance, to have them replaced by bicycle parkingfacilities. Smolders favours the word ‘organic’: cycling is ‘common’ and ‘logical’ in Veenen-daal. Bicycle use, bicycle culture and cycling policy mutually reinforce each other, more andmore. The policy is also directed at reinforcing this culture; educational measures have longsince occupied a permanent place in municipal policy. Children for instance receive a bicycleflag for their fifth birthday. In conjunction with the 3VO traffic safety association, much workis put into school traffic examinations. For secondary schools there is an interactive programmeon traffic safety and a bicycle inspection.
Ambachtsstraat

Fietsberaad Publication 7 51
Car barrierEven after the completion of the Rondweg-Oost ring road and the disappearance of throughcar traffic from the city, the Rondweg-West ring road will remain a busy route. Calculationmodels assume 22,000 vehicles / 24 hrs in 2010 (versus 25,000 to 30,000 on the Rondweg-Oost ring road) on this barrier between Veenendaal- West and the centre. Of all crossingsbetween the Rondweg-West and the east-west bicycle routes there is only one that is not onthe same level. This is a contrast with the bicycle crossings with the Rondweg-Oost, whichare largely in the shape of tunnels. Smolders is nonetheless convinced that the barrier effectof the Rondweg-West will continue to be slight, also because a few car traffic crossings T-junctions, while the crossing bicycle route is continued on the ‘fourth leg’ of the crossing.This enables quick four-direction handling.
Map 9. The bicycle route network of Veenendaal, including guarded bicycle parking facilities
primary cycle route
secundary cycle route
primary school
secundary education
guarded bicycle parking
shops and stores
business area
MeshWhat already appears at the crossings with both ring roads is an essential characteristic ofthe bicycle facilities in Veenendaal: the small, persistently applied mesh of the network. Thebicycle route network of Delft, to which the national government heavily contributed, isknown way outside the Netherlands. In this early ’80s project example, fixed widths weresystematically applied: 500 metres for main routes, 200 to 300 metres for the town quarternetwork and 100 metres for the vicinity network. Only few cities really have applied thissystem right until the very last route in the last decades. Veenendaal has, however, but witha philosophy all its own: no or virtually no distinction between network levels (or, in otherwords, the main and town quarter networks coincide) and a strictly applied 300-metre mesh;a distance already applied in the early ‘70s near the tunnels under the railway embankmentin Veenendaal-West. Near the new Rondweg-Oost this mesh is still strictly adhered to: twelvecrossings every 4 km. Smolders: “In this way we have been able to realise a fine-mesh net-work within which the ideal line is practically always attained. So: very short diversions, andespecially: when heading for the centre, many inhabitants can for instance choose betweentwo or three route options; various routes, each with its own characteristics, so each to your own taste. What you see is that this works in practice: the socially less safe routesthrough parks are used relatively less in the evenings than their alternatives close by. Inshort, a really fitting offer to our citizens.”Also from the viewpoint of quality this system of various equivalent parallel bicycle routesclearly demonstrates its effectiveness. Take for instance the three routes from the southernquarters to the centre; they are used by 2,000 to 4,000 cyclists every 24 hours (see Map 10).
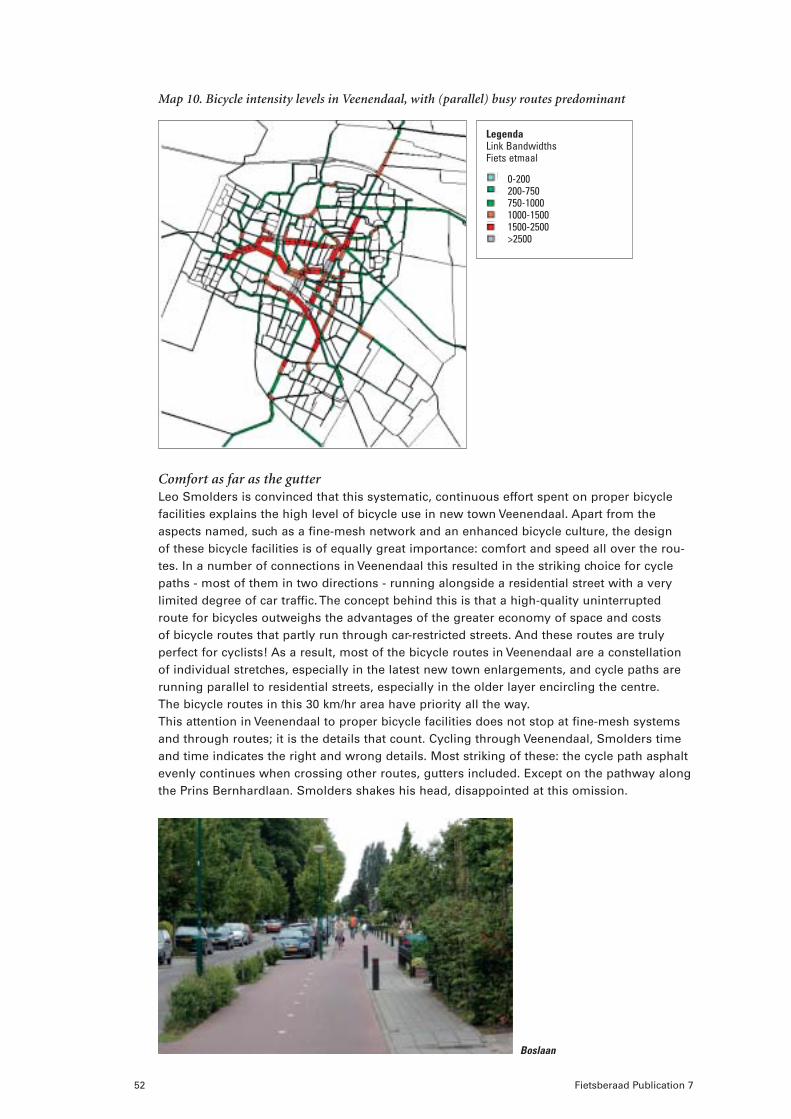
Map 10. Bicycle intensity levels in Veenendaal, with (parallel) busy routes predominant
52 Fietsberaad Publication 7
Boslaan
LegendaLink BandwidthsFiets etmaal
0-200200-750750-10001000-15001500-2500>2500
Comfort as far as the gutterLeo Smolders is convinced that this systematic, continuous effort spent on proper bicyclefacilities explains the high level of bicycle use in new town Veenendaal. Apart from theaspects named, such as a fine-mesh network and an enhanced bicycle culture, the design of these bicycle facilities is of equally great importance: comfort and speed all over the rou-tes. In a number of connections in Veenendaal this resulted in the striking choice for cyclepaths - most of them in two directions - running alongside a residential street with a verylimited degree of car traffic. The concept behind this is that a high-quality uninterruptedroute for bicycles outweighs the advantages of the greater economy of space and costs of bicycle routes that partly run through car-restricted streets. And these routes are truly perfect for cyclists! As a result, most of the bicycle routes in Veenendaal are a constellationof individual stretches, especially in the latest new town enlargements, and cycle paths arerunning parallel to residential streets, especially in the older layer encircling the centre. The bicycle routes in this 30 km/hr area have priority all the way.This attention in Veenendaal to proper bicycle facilities does not stop at fine-mesh systemsand through routes; it is the details that count. Cycling through Veenendaal, Smolders timeand time indicates the right and wrong details. Most striking of these: the cycle path asphaltevenly continues when crossing other routes, gutters included. Except on the pathway alongthe Prins Bernhardlaan. Smolders shakes his head, disappointed at this omission.

7. Odense: laboratory with enthusiasm
Odense, Denmark’s third city as regards inhabitants, has lately been known primarily as a
city with a progressive, innovating cycling policy. For this reason, Odense appears in the
BYPAD European benchmark methodology as the city with the best cycling policy in Europe.
This is the result, first of all, of a four-year programme of experiments conducted in Odense
as from 1999, with financial support by the Ministry of Transport. Just how innovating,
interesting and effective is this approach of Odense?
Fietsberaad Publication 7 53
phot
o: M
ette
Joh
nsen
Odense certainly did not start from scratch in 1999. For a long time the city had had a highdegree of bicycle use combined with a proper cycle path network. Ever since the ‘80s thecycling network has included over 350 km in paths and lanes. Since then the network hashardly been expanded. Most attention went to improvement of traffic safety and comfort and to bicycle use promotion. Since 1999 the network has been expanded by 400 m cyclepath only.
During this four-year programme Odense was appointed National Cycling City by the ministry,with the purpose of implementing and testing a large number of projects aimed at enlargingbicycle use by way of innovating infrastructural measures and promotional activity. The tar-get was: a 20% increase in bicycle traffic in four years, purely by drawing more attention tobicycle use and by making it more attractive.The programme, which in the end included ca. sixty completed projects, had a budget of ca. € 2.7 million. The municipality and the Ministry of Transport each paid half of it.

54 Fietsberaad Publication 7
No new routes, but infrastructural measures insteadAlthough the Odense cycling network might have been finished in the way of routes, largeinfrastructural improvements were required here as well and much has been realised since1999. The safety of twenty crossings was improved and speed was lifted (five mini rounda-bouts, fifteen exit lanes to the right). A very conspicuous, bright-blue crossing with advancedbicycle positions was realised at a few traffic-light crossings. Better bicycle facility markingswere placed along the roads in the city centre.
In addition, more conspicuous innovative measures were taken, part of them to be indicatedas ‘infrastructural’:• Green wave for cyclists
At ca. 350 m. intervals along a bicycle route we find 45 low poles between two crossings,each pole lighting up green at a few seconds’ interval from the other. Who follows theselights has the correct speed (though only 15 km/h in this case) to profit from a green wave.Another bicycle route is equipped with electronic signs indicating the cyclist’s speed.Cyclists themselves appear reasonably satisfied about this. Although not nearly everyonewho saw these light poles realised their purpose at first, half of them are now (more orless) convinced. The problem however is that cyclists have rather varying speeds. Fastcyclists would prefer a considerably higher lighting-up frequency of the guidelight.
• More and quicker maintenanceAll cycle paths have asphalt surfaces. Over the last few years the budget of Odense reser-ved for new asphalt surfaces has been doubled. Apart from this, Odense uses a speciallyequipped Smart for a thorough X-ray of the cycling network. It is a small car, equippedwith a laser beam that accurately maps uneven patches. The maintenance scheme is prio-ritised on the basis of the data obtained. These data are used for other purposes as well.
Mod Nr. Lyndelse
35
6
75
65
55
6
45
32
Tietgens Allé
Læss
øega
de
Hja
llese
vej
Munkebjergvej
Vandrerhjem
Rødegårdsvej
Nyborgvej
Stærmosegårdsvej
Niels Bohrs Allé
Kertemindestien
Kochsg
ade
Åsumvej
Centerstien
Vo
llsm
ose
stie
n
VOLLSMOSE
Ejb
ygad
e
Kertemindevej
Odense ÅFynsværket
SKIBHUSENE
Skib
husv
ej
Rutebilstation
Banegård
Rugårdsvej
Åløkke Skov
Søhu
ssti
en
Stavidsåstien
OdenseIdrætspark
TARUP
NÆSBY
Bogensevej
Jernalderbyen
Stæ
rehu
svej Kirkendrupstien
Søhusvej
Stavids Å
Ryds Å
PÅRUP
STEGSTED
Langesøstien
Sanderumvej
Måg
ebak
ken
Vestre Boulevard
SANDERUM
San
der
umst
ien
Motorvej
HØJMEDYRUP
DALUM
Dalum
vej
HJALLESE
Svendborgvej
Sten
løse
vej
Od
ensevej
SEDEN
BULLERUP
AASUM
Odense Å
Kanalstien
OVER HOLLUF
NEDER HOLLUF
Holluf pile sti
Lindved Å Sti
KORUP
TRØSTRUP
Rugårdsvej
Langesøstien
EJLSTRUP
Ryds Å
UBBERUD
BLOMMENSLYST Middelfartvej
VEJRUP
HOLMSTRUP
BRÆNDEKILDE
Brændekildevej
BELLINGE
HØJBY
ALLERUPBIRKUM
FRAUGDE
FRAUGDE KÆRBY
Fåborg
vej
ZOOSdr.
Bo
ule
vard
DyrskuePlads Golfbane
Camping-plads
DenfynskeLandsby
OdenseUniversitetsHospital
OdenseUniversitet
Golfbane
Holluf Gård
BlangstedgårdAmtsgården
FruensBøge
MunkeMose
STIGE
SØHUS
ODENSE FJORD
AGEDRUP
STENLØSE
SKT. KLEMENS
ELMELUND
NÆSBYHOVED-BROBY
KILLERUP
Mod Langesø
Friluftsbad
Mod Klintebjerg
Færge for cyklisterog fodgængere
1000 m 500 m 1 km 2 km0 m
6
35
www.odense.dk
Cykelstieri Odense
Grusstier
Cykelrute ad eksisterende vej
Overordnede veje med cykelforbud
Nationale cykelruter
Regionale cykelruter
Skov
Enge og grønne områder
Idrætsanlæg
Svømmehal
Gymnasium/læreanstalt
Indkøbscenter
Station
Turist information
Stige Færge, sejltider fremgår af bytrafikkens køreplan
Yderligere information:Tlf. 66 14 88 14 # 2929 - www.odense.dk/bus
CykelruterBlå ruteGrøn ruteGul rute
Alternative ruter
Udgivet af Odense Kommune
ca. 5 minutter på cykel
Map 11. The Odense cycling network

Fietsberaad Publication 7 55
Detection of ‘daily pitfalls’ in Odense is done by four people who are hired to go out intothe streets equipped with a digital camera. These cameras are connected to small compu-ters. As soon as a hole is detected a digital picture is made. This is instantly sent to themunicipality by way of the computer. The municipality assesses the situation and sendsthe photo to the contractor if necessary. The contractor returns a photo following repair.The bicycle patrol group receives a ca. € 3.30 reward per hole ‘scored’.
• Barometer counts cyclists ’as they pass’The bicycle barometer, too, is an invention of Odense (2002). Although its true functiona-lity is obscure, it is more of a publicity- and attention-generating measure, aimed to makecycling intensity really visible to all citizens. Each day 5,000 to 10,000 cyclists pass thebarometer. The annual total is added up as well.
1984 city centre pilot
Odense already participated in an earlier promotion programme of the Danish Ministry of Transport. In 1984 four cities, including Odense, received money for the purpose of constructing a proper bicycle route. In Odense this was done in the city centre, wherethrough car traffic had already been barred in the ’70s. However, cycle paths still were largely absent while over 12,000 cyclists had their daily destinations here. Apart from real pedestrian streets where cyclists were exempt from one-way car traffic measures,attention became focused on two types of new road layout, namely:- a 3.50 m wide two-way cycle path on virtually the same level (3 cm lower) in some
shopping streets, with wide pedestrian zones (4 to 5 metres) on either side;- a combined 6-m wide cycle-and-bus lane.
This pilot (too) was assessed thoroughly. Its main outcome was that mixing cyclists andgreat numbers of pedestrians turned out far more positive than expected. Only a very limited number of (slights) accidents occurred. At the same time the value for cyclists was high: access to destinations in, and also ‘past’ the city centre improved considerably. The combination of cyclists and buses was slightly less positive: cyclists too often feltoppressed by buses approaching through the middle. Still, the number of cyclists to thecity centre increased from 12,500 daily in 1982 to 15,400 in 1990 - although this certainlycannot be attributed to these measures alone.
Bicycle parking: limited numbers, fine shapesThe four-year programme of experiments also gave much attention tobicycle parking. Car parking facilities were exchanged for a bicycle parking location with800 bicycle stands in a central square in the city centre. Another 400sheltered stands were created in Kinopladsen near the shopping streets,
and another 200 clamps were placed all over the city centre. Central station bicycle parkingcapacity was enlarged as well: 400 clamps behind the central station and an in-house atten-ded bicycle parking facility below the station, offering 250 places. From a Dutch viewpointthe realised numbers of bicycle parking places certainly are not high. But what is most striking in the new bicycle parking facilities in Odense is their quality much rather than theirquantity (admittedly, quality is far easier to be attained when quantities are low!). Whatjumps into view is the (small) automatic parking facility near the shopping area; a carrousselaccording to the principle of a bicycle locker - capacity 20 bicycles - allowing three hours’safe bicycle parking at DKK 5 (€ 0.65).
Promoting bicycle use The extent of the infrastructural measures taken in Odense in the last few years concerningboth running and parked bicycles is not really spectacular. Far more interesting are the tech-nical and technological innovations on paper. However, most striking about cycling policy in Odense is its relatively strong and broad attention to promoting bicycle use. There is a

women
men
April 2004 May 2004
56 Fietsberaad Publication 7
continuous flow of information during the four-year programme of experiments via the inter-net (site: www.cykelby.dk), tv, radio, newspapers, magazines (local media feature a total of806 articles on Odense Cycling City) and lectures. Two editions of a special bicycle magazinewere made for inhabitants. The general public, but also journalists and traffic experts wereconstantly fed with new stories, information and with recurring actions which, although notreally revolutionary, derived their power from their regular succession. These actions are:• the annual bicycle day in June, including an exhibition of normal and very unusual
bicycles, a trial show, prize contests and lotteries. Number of visitors: over 450.• handing out apples and chocolate during one October week to a total of 5,000 cyclists,
conveying the message: thanks for your bicycle ride. Cyclists were also given a foldercontaining facts about bicycle use in Odense. Red line of these actions is the attempt to introduce bicycle use as a modern lifestyle, for instance with a large, high-quality bill-board campaign.
Promotion and the business communityEach year a national Cycling to Work campaign is conducted with growing numbers of parti-cipants; nearly 8,000 in Odense and almost 100,000 all over Denmark. This campaign is vir-tually identical to its Dutch Cycling to Work counterpart, where participants formulate theirown target in bicycle kilometres and keep their realised scores. A group of participants of the Cycling to Work campaign also took part in an additional study/contest, emphasising theimportance of a daily bicycle ride. During this contest the Body Mass Index (BMI: weight inkilos, divided by the square of the person’s length in metres) of 670 cyclists was measuredbefore and after the campaign. This is the average score and shift:
Figure 4. BMI-average for women and men before and after the campaign
27
25
23
21
The men show a slight decrease (= improvement), the women hardly any. Admittedly, thepurpose certainly had not been a radical change of this index within one year, but rather todraw attention to the effects of bicycle use on health.
Another well-known thing in the Netherlands regarding transport management is the pheno-menon of company bicycles. These occupy a central position in another project in Odense:bicycles to cover short business trips by day in a healthy, environment-friendly way. 29 companies together used 67 company bicycles during a contest named Who is the grea-test cyclist?The university won with its five bicycles: 4,600 km per bicycle in six months. The daily average for all 67 bicycles was roughly 5 km per bicycle.To these companies there was another aspect to this kilometre contest: bicycles that hadcovered less than 500 km would be charged for 4,000 DKK; if more than 500 km had beencovered the price to be paid was only 1,500 DKK.
School trafficCa. 43% of the children in Odense goes to (primary) school by bike; a percentage which hasrisen during the last few decades, also as a result of the many directed measures of themunicipality. Great emphasis was put on car speed limits on school routes and near schoolentrances.

Fietsberaad Publication 7 57
After investing mainly in infrastructure, the municipality has more and more shifted itsemphasis to communication. What we particularly see are experiments with tailor-made low-budget campaigns to promote bicycle use among infants and pupils of public schoolseven further. Studies had already been performed regularly at all 45 public schools inOdense (covering 87% of all school pupils) into the means of transport used by children togo to school and to other activities. Now, each form teacher collects details during a fixedweek of the year concerning the mode choices of his/her pupils. The school enters these datainto a central file via the internet, so that the municipality has instant access to all recentinformation.Tailor-made campaigns are an essential element of cycling policy in Odense. No expensivebrochures and billboards, but campaigns aiming to attain active, lasting participation. Eachage group has its own campaign, centred around a bicycle use-contest. The main age groupsare infants, children and youngsters. The idea is that children who had a great time withbicycles in their youth will continue cycling as adults as well.Hopes also are that children will set an example to their parents. Initially, campaigns aresmall-scale during the first year. They are followed by assessment before being spread outall over the city. Most campaigns like these are cheap because the municipality cooperateswith private persons, bicycle shops, manufacturers and sponsors.
phot
o: M
ette
Joh
nsen
Table 9. Means of transport chosen by public school pupils in Odense in 2000 (in %)
car 21
public transport 14
walking 23,2
cycling 43,1
Source: statement municipality of Odense

58 Fietsberaad Publication 7
AssessmentThe four-year promotion programme in Odense has been assessed in detail (Evaluering afOdense – Danmarks Nationale Cykelby, 2004). During an extensive survey conducted amongcitizens, about half of them appeared to be informed about the initiatives that had beentaken during the four ‘National Cycling City’ years. The measures best remembered wereinfrastructural improvements: short-circuits, green wave, safe bicycle parking facilities.Campaigns were remembered far less easily. Nor were they greatly valued, especially by the cyclists in the survey. These results are in line with the answers that are/were given bycyclists during an annual survey conducted for a prolonged period. They were asked whichmeasures they thought were most important to increase bicycle use. Things most heardwere: adjusting traffic lights, road surface comfort and bicycle parking possibilities. In theserespects the citizens of Odense are quite satisfied with the physical facilities: 82% finds thatOdense has excellent bicycle facilities.The assessment also proved that development in traffic safety had been positive during the four years the programme lasted, but equally positive as in preceding years: 20% fewercycling victims in four years.
To illustrate the development in bicycle use, the assessment compared the period 1999-2002with 1994-1997. The share taken up by bicycles in all trips by citizens of Odense aged between16 and 74 rose from 22.5 to 24.6%. There was a simultaneous, notable decline in publictransport (8.2 to 6.6%). The increase in bicycle use remained within the fluctuations appea-ring in the time sequence from 1993 onwards. The bicycle share largely fluctuated around25%. This was the case in 1993, later (1996) it fell until slightly over 20% and it has sincebeen fluctuating between 23% and 27% - with 2000 as top year.
phot
o: M
ette
Joh
nsen

Fietsberaad Publication 7 59
8. Copenhagen: rational cycling policy
Copenhagen is one of the few large European cities with a true bicycle tradition. Bicycle use
is widely represented among all groups of citizens. As usual the explanation of this is partly
historical. The last few years however particularly highlight a systematic, broadly covering
cycling policy conducted by the Copenhagen municipal executive.
In 1920 the compact city of Copenhagen numbered 225,000 inhabitants, in 1950 the numberhad risen to more than 770,000. This period of intense growth, in which bicycles - unlike cars- were available to all citizens, is an important element of the explanation of this high degreeof bicycle use. It also is the start of a true tradition, a way of life, in which bicycles are deadcommon in a way we have come to know in the Netherlands. Since the ’50s bicycle usestrongly declined in accordance with the general trend in Europe (as a matter of fact just likeits number of citizens, which fell to 500,000) but the trend has been rising again from theearly ’80s onwards.
Cycle paths; no lanesThe city’s own bicycle facilities were realised immediately after the Second World War, ingreat numbers. Things had already started before this time (1934: 130 km cycle path) con-sisting mainly of recreational cycle paths along arterial roads. After 1945 a central positionwas given to segregation of traffic types on the busiest main roads. Many cycle paths wereconstructed especially along new main roads. Thanks to these facilities presumably bicycleuse stood its ground, even in the decades of decline and minimal attention to cycling policy.The cycle path network has since been almost completed - almost one hundred years ofcycle path construction surely bears its fruits. In total it concerns more than 300 km cyclepath. Normally speaking, cycle paths are laid out on either side of carriage ways for motorvehicles, and measure at least 2 metres, often more than 2.5 metres in width. A specificCopenhagen aspect is that it often concerns ‘(elevated) adjacent cycle paths’ in Dutch terms.A few metres before a crossing, Copenhagen cycle paths transform into cycle lanes and areconducted straight across the road (often marked out blue since the ’90s, with white bicyclesymbols). They transform back into a cycle path beyond the crossing.

60 Fietsberaad Publication 7
Within the framework of its 2001-2016 cycle path priority plan the municipality wishes to com-plete the urban cycling route network by constructing the last 51 kms of bicycle facilities.To be successful at little expense and in the short term, a number of cycle lanes will be laidout in addition to cycle paths. They will take the shape of ‘reinforced’ cycle lanes: a combina-tion of cycle lanes, short cycle paths (such as near bus stops) and traffic islands segregatingbicycle traffic from motorised traffic. These reinforced cycle lanes are intended as cheap,temporary measures. They will later be replaced by permanent cycle paths. For this reasonthe cycle lanes are laid out in the same width (2.20 metres) and on the same stretches astheir future cycle path counterparts. They are separated from the footpath by way of a kerband marked out by way of a 30-cm thick uninterrupted white line. They will later be trans-formed into cycle paths by replacing the white line by a second kerb and by elevating thecycle lane and asphalting it over.Parking lanes, if any, will be laid out to the left or right of the cycle lane. Studies show thatthe well-known crossing problems involved in cycle paths cannot be solved by cycle laneseither, even if the cycle lanes tend to separate the traffic flows. Then there are the problemsgiven by people who park their cars wrongly because cycle lane and parking lane are bothon the same level. The normal difference in height between cycle path and parking laneshould be 7 to 12 cm. According to Niels Jensen, Copenhagen urban traffic planner, theseexperiences are among the reasons why the Copenhagen cycle lane programme is not beingcontinued as intensively as originally planned. The experiences with blue markings on cros-sings are positive, however. Studies show that they improve safety. Especially the number ofaccidents between cyclists continuing their way and oncoming cars turning left has clearlydropped.
General and increasing bicycle useSince the middle of the nineteen seventies bicycle use in Copenhagen has been on the riseagain, especially in the city centre and the first layers encircling it. Counts performed onbeltways around the city centre clearly demonstrate this at a roughly stable number of citizens(twelve-hour counts in two directions):
Cycle tracks andcycle lanes2001
New cycle tracks andreinforced cycle lanes2002 - 2016
Legend
Cycle track priority plan2002 - 2016
1 km0
Map 12. 2002-2016 cycle track priority plan
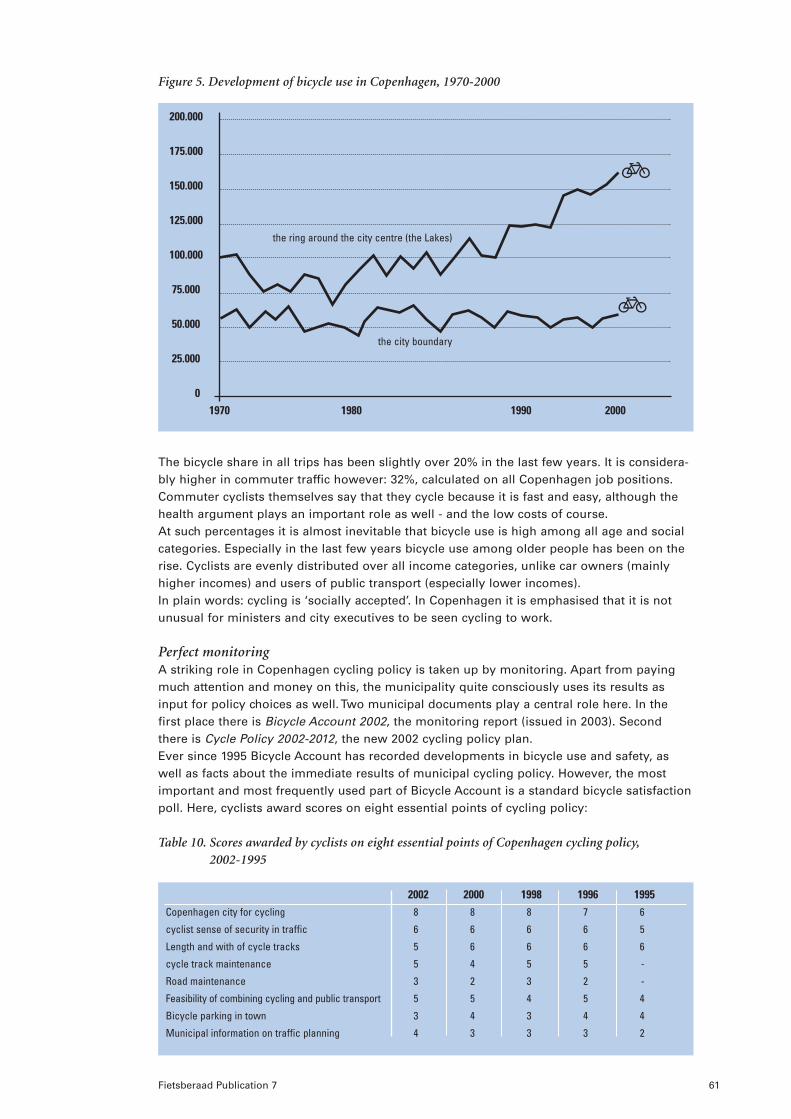
Fietsberaad Publication 7 61
the city boundary
the ring around the city centre (the Lakes)
The bicycle share in all trips has been slightly over 20% in the last few years. It is considera-bly higher in commuter traffic however: 32%, calculated on all Copenhagen job positions.Commuter cyclists themselves say that they cycle because it is fast and easy, although thehealth argument plays an important role as well - and the low costs of course.At such percentages it is almost inevitable that bicycle use is high among all age and socialcategories. Especially in the last few years bicycle use among older people has been on therise. Cyclists are evenly distributed over all income categories, unlike car owners (mainlyhigher incomes) and users of public transport (especially lower incomes).In plain words: cycling is ‘socially accepted’. In Copenhagen it is emphasised that it is notunusual for ministers and city executives to be seen cycling to work.
Perfect monitoringA striking role in Copenhagen cycling policy is taken up by monitoring. Apart from payingmuch attention and money on this, the municipality quite consciously uses its results asinput for policy choices as well. Two municipal documents play a central role here. In thefirst place there is Bicycle Account 2002, the monitoring report (issued in 2003). Secondthere is Cycle Policy 2002-2012, the new 2002 cycling policy plan.Ever since 1995 Bicycle Account has recorded developments in bicycle use and safety, aswell as facts about the immediate results of municipal cycling policy. However, the mostimportant and most frequently used part of Bicycle Account is a standard bicycle satisfactionpoll. Here, cyclists award scores on eight essential points of cycling policy:
Table 10. Scores awarded by cyclists on eight essential points of Copenhagen cycling policy,2002-1995
Figure 5. Development of bicycle use in Copenhagen, 1970-2000
200.000
175.000
150.000
125.000
100.000
75.000
50.000
25.000
01970 1980 1990 2000
2002 2000 1998 1996 1995Copenhagen city for cycling 8 8 8 7 6
cyclist sense of security in traffic 6 6 6 6 5
Length and with of cycle tracks 5 6 6 6 6
cycle track maintenance 5 4 5 5 -
Road maintenance 3 2 3 2 -
Feasibility of combining cycling and public transport 5 5 4 5 4
Bicycle parking in town 3 4 3 4 4
Municipal information on traffic planning 4 3 3 3 2

62 Fietsberaad Publication 7
The overall judgement of the cyclists (Copenhagen Cycling City) is high and has been risingsince 1995. The lower 2002 judgement concerning the length and width of cycle paths couldin the view of the researchers be due to the increase in intensities leading to cycle path congestion on certain stretches during rush hours. After all, cycle paths with a width of 2,20metres can only handle ca. 2,000 cyclists per hour, while the rush hour load on the busieststretches is ca. 2,300 cyclists. Widening to 3 metres is therefore desirable here.
2002-2012 cycling policy planThe aims of the new bicycle plan are familiar: higher speed, more comfort, more safety and((exactly) because of this) more bicycle use. Interesting is the way in which Bicycle Accountis put to use when implementing these aims. First there is its focus on present cyclists. Onefifth of the cyclists namely does not at all find Copenhagen a pleasant city to cycle in. Thisgroup must be prevented from giving up by way of concrete improvements. The next swingis toward six factors that decide the degree of bicycle use, and for the above group as well:‘Safety and a sense of security, effective travelling speeds, health, comfort and the cyclingexperience are all significant factors if cycling is to prove competitive. The quality of bicycletransport is thus crucial to Copenhageners’ decision to cycle or not.’
It is this subjective sense of security that is taken very serious in Copenhagen. Whether thisis rightful or not, a sense of insecurity results in fewer bicycles than possible. From an objec-tive point of view we see a declining number of victims among cyclists (40% fewer seriousvictims in ten years), resulting in a sharply declining risk when we consider the increasingnumbers of cyclists (+25%). Despite all this, the awareness of security is far from optimal.The bicycle plan proposes not to search for an increase in security (awareness) by way ofrealising cycle paths, but to focus on crossings instead. Apart from projected security impro-vement, another target should be shortened waiting-times. In fact, the only real opportuni-ties to increase speed are found at crossings, now that the cycle path network is almostcompleted and all one-way streets in the city centre are open to cyclists from both ends.
Comfort is another aspect worth considering, as Bicycle Account shows: more than half ofthe cyclists is dissatisfied about maintenance and the municipality appears more than willingto do something about this in its bicycle plan. In this respect Health and cycling experience are arguments, or values, for individual cycliststhemselves rather than footholds for concrete measures.
Strandvejen
Lyngbyvej
Tubo
rgve
j
Frederiksborgvej
Hareskovvej
Mør
khøj
vej
Frederikssundsvej
Jyllingevej
Slotsherrensvej
Roskildevej
Vige
rsle
v Allé
Gam
mel
Køg
e La
ndeve
j
dnul
egno
Kje
vs
Englandsvej
Amagerbrogade
Kastrupvej
Holmbladsgade
Bicycle traffic
flows 2002
Number of bicycles
and mopeds on a
weekday 6 am – 6 pm.
2000-3999
4000-5999
6000-7999
8000-9999
10000-11999
12000-13999
14000-15999
16000-17999
18000-24000
Map 13. The intensity of Copenhagen bicycle traffic

Fietsberaad Publication 7 63
Based on this analysis, the bicycle plan identifies measures in nine themes:
1. Cycle paths and cycle lanes By the end of 2001 there was a total of 307 km cycle paths and 9 km cycle lanes, withanother 51 km to be added over the next fifteen years (costs: over € 16 million).
2. Green bicycle routes The main purpose of green bicycle routes are recreational, and concern longer distances.They are high-quality routes, following their own course as much as possible, at minimalstopping frequencies. In 2000 a plan was accepted to realise 21 of such routes, each at an average length of 5 km. It will be quite a few years before all this is realised; costs areestimated at almost € 70 million.
3. Improving bicycle conditions in the city centre Many cycle lanes have been laid out and one-way traffic restrictions have often beenundone. Only very few tasks remain.
Kron
prinsessegad
StoreKo
ngensgadeØsterS ø
gade
Nørre
Søgade
ØsterFarim
agsgade
ØsterVoldgade
Nørre
Voldgade
Nørre
Farim
agsgad
e
Sølvgad e
Gothersgade
Knippelsbr
o
Bremerhol
m
Torvegade
Strædet
Vesterga
de
Nørregade
Langebro
Tietge
ns-gad
e
Halm tor
vet
Vesterbr
ogade
Jernbane
-
gade
h s -p n
H.C. Ander-sens B
oulevard
Vester Voldgade
Storm
-
gade
Vester
Søga
de
Nørrebrogade
Åboulevard
Venders - gade
Vester
Hoved-bane-gården
Nørre-port
Solutions for cyclists in the City Centre
Existing and plannedcycle tracks and cycle lanesSuggested cycle link-upsSuggested green cycle routesMain pedestrian streets
500 m0
Bredgade
e
Farim
agsgad
e
R åd uladse
KongensNytorv
Map 14. Solutions for cyclists in the city centre of Copenhagen
4. Bicycle - public transport combination Promoting the bicycle - public transport combination had already been a spearhead inthe 1998 public transport plan. It is now possible to take bicycles on trains in most situa-tions (except for some trains in rush-hour destinations). New train components haveoften been equipped with proper bicycle sections now, also in the new underground.From now on there will be more attention to bicycle parking near railway stations - andBicycle Account shows the severe need for this.
5. Bicycle parking There are now 3,300 bicycle parking places in the historic city centre; 400 were addedover the past two years. The encircling layers contain another 850 places. All this is noteven nearly enough, just read the Bicycle Account assessments. An action plan will beprepared on the basis of detailed studies with a view to speed up the realisation of morefacilities in the locations required.
6. Improving traffic signals at crossings The by now well-known measures must be realised at far more crossings: retracted stopping lines for cars (4 metres between stopping line and pedestrian crossing), bluecrossing lanes and advance-green lights for cyclists.
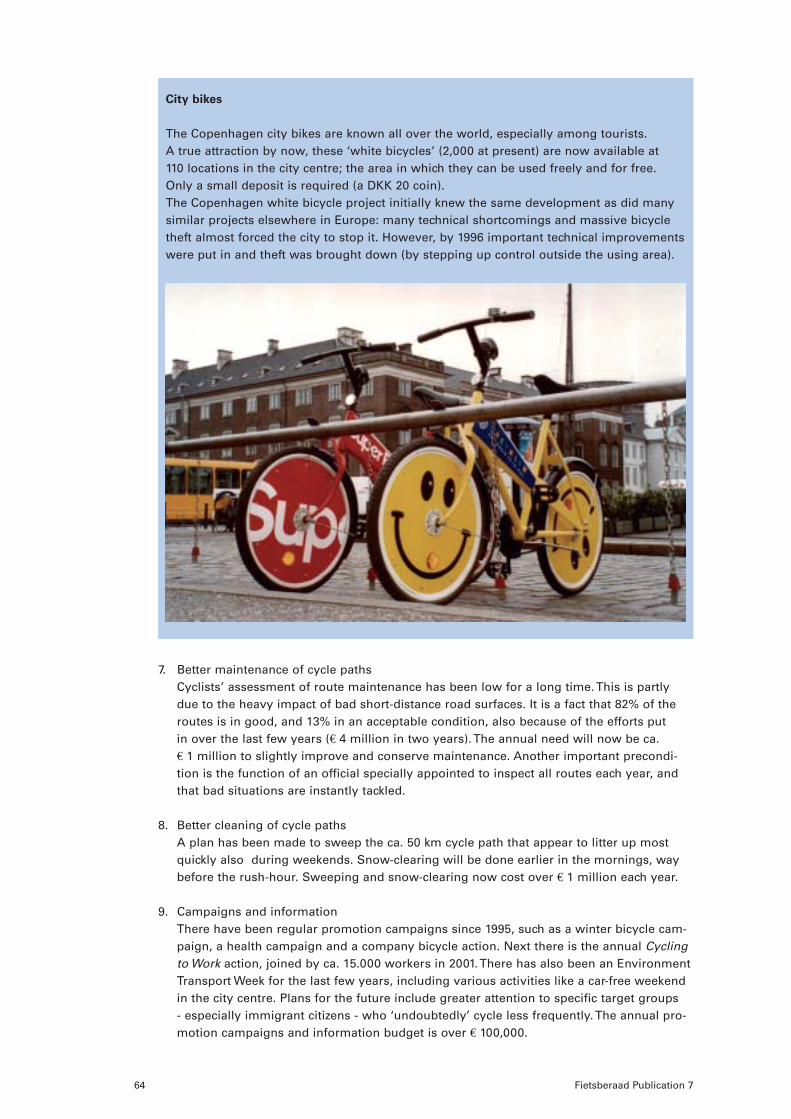
64 Fietsberaad Publication 7
7. Better maintenance of cycle paths Cyclists’ assessment of route maintenance has been low for a long time. This is partlydue to the heavy impact of bad short-distance road surfaces. It is a fact that 82% of theroutes is in good, and 13% in an acceptable condition, also because of the efforts put in over the last few years (€ 4 million in two years). The annual need will now be ca. € 1 million to slightly improve and conserve maintenance. Another important precondi-tion is the function of an official specially appointed to inspect all routes each year, andthat bad situations are instantly tackled.
8. Better cleaning of cycle paths A plan has been made to sweep the ca. 50 km cycle path that appear to litter up mostquickly also during weekends. Snow-clearing will be done earlier in the mornings, waybefore the rush-hour. Sweeping and snow-clearing now cost over € 1 million each year.
9. Campaigns and information There have been regular promotion campaigns since 1995, such as a winter bicycle cam-paign, a health campaign and a company bicycle action. Next there is the annual Cyclingto Work action, joined by ca. 15.000 workers in 2001. There has also been an EnvironmentTransport Week for the last few years, including various activities like a car-free weekendin the city centre. Plans for the future include greater attention to specific target groups - especially immigrant citizens - who ‘undoubtedly’ cycle less frequently. The annual pro-motion campaigns and information budget is over € 100,000.
City bikes
The Copenhagen city bikes are known all over the world, especially among tourists. A true attraction by now, these ‘white bicycles’ (2,000 at present) are now available at 110 locations in the city centre; the area in which they can be used freely and for free.Only a small deposit is required (a DKK 20 coin).The Copenhagen white bicycle project initially knew the same development as did manysimilar projects elsewhere in Europe: many technical shortcomings and massive bicycletheft almost forced the city to stop it. However, by 1996 important technical improvementswere put in and theft was brought down (by stepping up control outside the using area).
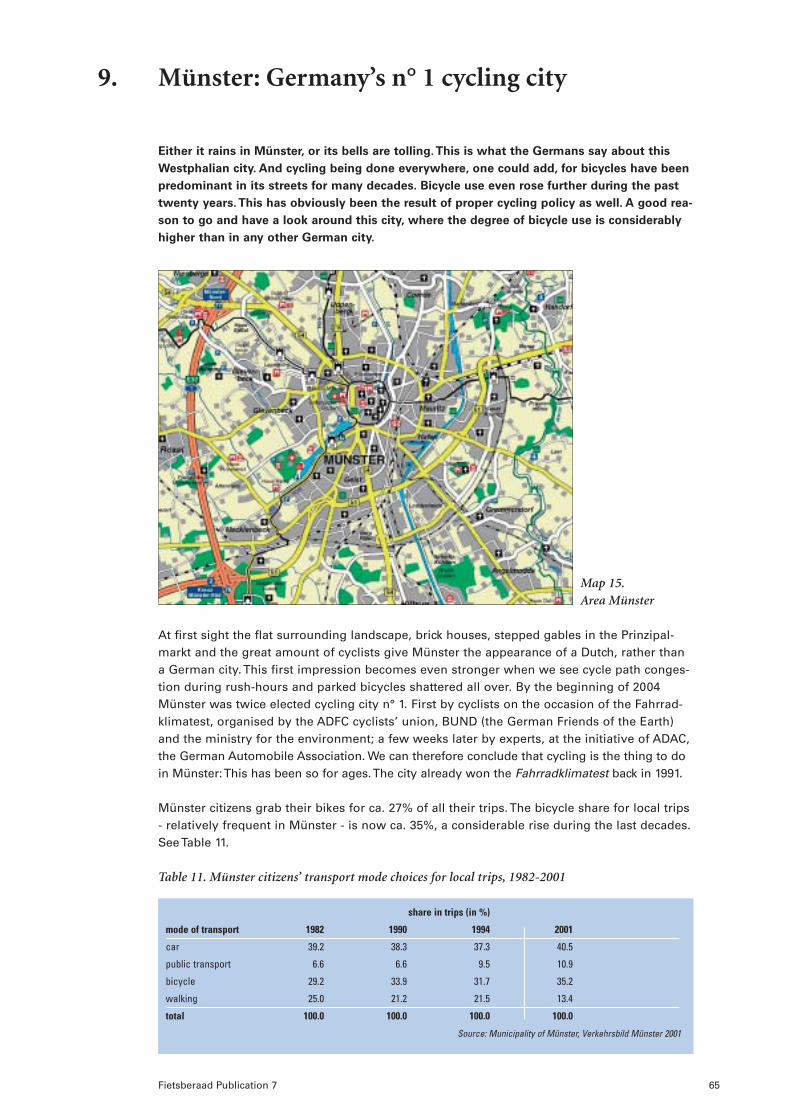
Fietsberaad Publication 7 65
9. Münster: Germany’s n° 1 cycling city
Either it rains in Münster, or its bells are tolling. This is what the Germans say about this
Westphalian city. And cycling being done everywhere, one could add, for bicycles have been
predominant in its streets for many decades. Bicycle use even rose further during the past
twenty years. This has obviously been the result of proper cycling policy as well. A good rea-
son to go and have a look around this city, where the degree of bicycle use is considerably
higher than in any other German city.
Map 15.Area Münster
At first sight the flat surrounding landscape, brick houses, stepped gables in the Prinzipal-markt and the great amount of cyclists give Münster the appearance of a Dutch, rather thana German city. This first impression becomes even stronger when we see cycle path conges-tion during rush-hours and parked bicycles shattered all over. By the beginning of 2004Münster was twice elected cycling city n° 1. First by cyclists on the occasion of the Fahrrad-klimatest, organised by the ADFC cyclists’ union, BUND (the German Friends of the Earth)and the ministry for the environment; a few weeks later by experts, at the initiative of ADAC,the German Automobile Association. We can therefore conclude that cycling is the thing to doin Münster: This has been so for ages. The city already won the Fahrradklimatest back in 1991.
Münster citizens grab their bikes for ca. 27% of all their trips. The bicycle share for local trips- relatively frequent in Münster - is now ca. 35%, a considerable rise during the last decades.See Table 11.
share in trips (in %)
mode of transport 1982 1990 1994 2001
car 39.2 38.3 37.3 40.5
public transport 6.6 6.6 9.5 10.9
bicycle 29.2 33.9 31.7 35.2
walking 25.0 21.2 21.5 13.4
total 100.0 100.0 100.0 100.0
Source: Municipality of Münster, Verkehrsbild Münster 2001
Table 11. Münster citizens’ transport mode choices for local trips, 1982-2001

66 Fietsberaad Publication 7
This increase was partly caused by a continuous decline in walking; a development that alsoresulted in more car and public transport use. It is likely that the bicycle has lost someground to public transport, which was improved, also with the early ‘90s introduction bymany cities of a cheap season ticket for students. In 2001 the bicycle share varied between17% in business traffic and 50% in commuter traffic. Münster most likely is the only Germancity regularly conducting mobility behaviour polls among citizens, visitors and commuters.The results obtained are a sound basis for traffic policy and its resulting decision-makingprocess. Bicycle traffic is integrated in polls and policy alike.
Münsterland city centreA 1,200-year-old former Hanze city, Münster is a solitary, urban centre in Münsterland, withits predominant agricultural character. The city is situated on a junction of roads, railroadsand the Dortmund-Ems canal between the Ruhr Area and the North of Germany. In the pre-sent spatial structure and the radial road pattern we still recognise the development of thiscity into a central location of the Münster principality. The railway network arose in the nine-teenth century. Two ring roads were laid out after 1901: one surrounding the historic city cen-tre and one surrounding the nineteenth-century suburbs. A centre of knowledge, administra-tion and service for a region of over 1.5 million inhabitants, Münster offers employment toover 150,000 people, 66,000 commuters among them. Its university, seven high schools andcentres for research and technology transfer make Münster a true city of knowledge. Ca.60,000 students and 33,000 school pupils, partly originating from the region, make up for arelatively young population: half of the inhabitants is below thirty. After a strong increasebetween 1945 and 1975 (from 76,000 to 262,000) the number of citizens rose only slightly inthe past thirty years, until the present 280,000.
Reconstruction63% of the city was destroyedin 1945, and even 91% of theheart of the city. For practicalreasons and because of a certain predisposition to dayslong gone it was decided toreconstruct the city centre ina traditional way, maintainingthe existing street and plotpattern and reproducing thepre-war city image. This incontrast to other Germancities, where the ideal of the”Autogerechte” or car-adap-ted city characterised recon-struction activities. Buildingdensity in the quarters sur-rounding the city centre wasenlarged by constructing hig-her buildings than before thewar. Bicycle traffic became anobvious component of gene-ral traffic policy, and all mainroads were given adjacentcycle paths for reasons oftraffic safety. With bicyclesbecoming obsolete elsewhereand many bicycle facilitiesdisappearing between the’50s and ’70s to make roomfor cars, the Münster bicycle facilities were properly maintained and steadily expanded.
Lambertkirche
phot
o: P
ress
eam
t Sta
dt M
ünst
er

Fietsberaad Publication 7 67
Why? Presumably because ‘bicycles just happened to be there’. This gradually resulted in acoherent network of cycle paths, connecting all quarters with the city centre. The Promenadeon the former ramparts is now a through priority bicycle route functioning as a green ringroad encircling the ancient city centre. 12,000 cyclists make use of it on busy weekdays.Although citizens and politicians often prefer the Bordsteinradwege - mostly narrow, throughcycle paths on the pavement - (non-compulsory) cycle lanes have been laid out along mainroads as well since 1996. Most of them are wider and have better cyclists handling capacities.Apart from these main roads a secondary network of connections through 30 km/h areas hascome into being since the early ’80s (containing bicycle streets as well), added by pedestrianareas, parks and so on. The fine mesh of this network results in direct connections and itlimits unnecessary detours.
Bicycle laboratoryIn the early ’80s cycling was given a boost. First because of growing environmental aware-ness, second because of the growing realisation that traffic problems cannot be solved byjust building more roads and that increased bicycle use can improve a city’s accessibility andliveability. The room offered by the traffic regulations to try out new bicycle measures wasfully used: bicycles from both ends in one-way streets, bicycle streets, temporary access topedestrian areas for cyclists, cyclists on bus lanes, buses on cycle lanes and so on. A specialpoint for attention was the safe shaping and regulation of crossings. Nearly all regulatedcrossings of the main road network have separate traffic lights and regulations for cyclists; a green wave for cyclists is no exception. There are ‘bicycle sluices’ resembling an OFOS,ensuring that cyclists are given green before the other traffic participants and can in this way turn left safely. Since the late ’80s the ministry of traffic of Nordrhein-Westphalia hassupported these ‘experiments’ to allow other cities to profit from the experiences in Münster.In the scope of a programme on bicycle-friendly cities and communities in the area, namedFahrradfreundliche Städte und Gemeinden in Nordrhein-Westfalen Münster became one of the first model cities to be given the task to prove that an increase in bicycle use is alsopossible at an already existing high degree of bicycle use. Many of the measures tried out in Münster and the other model communities were adopted in 1995 within new concept guidelines and in 1997 within the updated version of the road traffic regulations.
Promenade

68 Fietsberaad Publication 7
Bicycle parkingBicycle parking has long been on the Münster agenda. This is inevitable, as the city centreand the station area are more or less fully scattered with parked bicycles and bicycle theft ishigh. The policy is fairly traditional: there are bicycle stands near all main destinations andshort-term parking zones and tow-away actions in the station environment. In the early ’90sguidelines for the number and quality of bicycle parking facilities near renovations and newconstructions were included in the local building decree. In 1999 a fine bicycle parking facili-ty was opened near the railway station, the largest in Germany, offering capacity of 3,300parking places. What was hoped for was a solution to the ever-growing chaos of parked bicycles in the station square. Soon after its opening the parking facility had an averageoccupation of 80%. 96% of its users are permanent customers; over 70% are commuterswho use their bicycles for train aftertransport.This bicycle parking facility resulted in more bicycle use. One third of the customers are nowmaking more frequent use of their bicycles. One fourth of them had not even used theirbicycles at all until then. In spite of the success of this bicycle parking facility, the number ofbicycles parked in the station square shows no sign of decrease at all. The conclusion there-fore is that many more people are now coming to the station by bicycle than in the past. Thefavourable experiences with this parking facility have increased the attention given to thebicycle parking problem. By now there are political initiatives to build a new parking facilityeast of the station, a municipal policy document on bicycle parking is almost finished andsoon there will be an electronically surveyed parking facility for 500 bicycles below thePrinzipalmarkt in the city centre.
Integral traffic policyLike in many other German cities in the ‘90s, Münster traffic policy transformed from demand-following towards more controlling. The main objectives of the Verkehrsbericht 1993 trafficreport were: optimal use of the existing traffic space and guaranteeing the city’s liveabilityand accessibility. In concrete terms this meant replacement of as many car rides as possibleby environmentally friendly Umweltverbund trips: walking, cycling, public transport and com-binations of these three. What was realised was that already far beyond the city measureswere needed to allow fewer cars in the city centre, that the traffic function must decreaseand the staying function must increase when approaching the city centre, and that a stricterparking regime and higher parking charges are necessary.
Bicycle parking facility near the railway station
phot
o: P
ress
eam
t Sta
dt M
ünst
er

Most of these measures have now been implemented. The car-restricted, partly car-free citycentre can no longer be traversed straight by car. By bicycle this is possible, although at certain times on a few routes only. Recent car parking policy aims to give the ring roadencircling the city centre the function of a parking belt, lined with parking garages and par-king places serving as first relief for most traffic bound for the city centre. Surely this doesnot concern all car traffic, as a few parking garages will remain in the city centre. And evenone more will be added. The parking belt comes as an addition to earlier measures - stationsoutside the city and transferiums on the edge of the city - serving as first relief for visitorsand commuters from outside the region.Only part of these measures have been successful. Especially the transferiums have not yet generated the desired response. The Verkehrsbericht 1993 traffic report introduced a con-trolling form of parking policy, differentiated in target groups as regards charges, walkingdistances, parking duration, permits and so on. All over the city there is the principle of resi-dent parking or paid parking. In the old city centre the parking charges are € 0.50 per halfhour or a maximum € 10 per day; half charges apply outside this area. The parking policyalso encompasses private parking places. Whereas many German municipalities apply acompulsory minimum number per building, Münster has set a maximum instead. If thismaximum should result in a deficit, the building owner will have to pay the municipality forlaying out public parking places. Münster laid down in a local act that part of the returns can also be used for public transport and bicycle measures. Experiences with the measurestaken are positive.
Spatial policyAlthough less and less a truly compact city, Münster policy has consistently aimed towardattracting major economic and social facilities (service, trade, administration) in or near thecity centre or along radial main roads. We find manufacturing industry mainly along thenorth-south axis and near the port. Like other cities, Münster has been characterised byincreasing suburbanisation since the ‘60s. Especially young families are moving to the sur-rounding municipalities, but will retain their job locations in the city, resulting in a sharpincrease of car commuter traffic. The increasing burden felt as a result of commuter traffic inthe late ’80s principally resulted in an urban trend swing toward ‘inside development’. So farthis has been reasonably successful: 71% of the population still lives within a 6-km radiusfrom the city centre. As a result, many trips are short and within cycling distance. In theFlächennutzungsplan 2010 determined in 2003 (comparable to a structure plan) the key wordsstill are: increased mingling of urban functions, short distances, high speed, decentralisedconcentration, traffic, space and energy-saving spatial structures and so on.
Fietsberaad Publication 7 69
phot
o: P
ress
eam
t Sta
dt M
ünst
er
Interior bicycle parking facility near the station
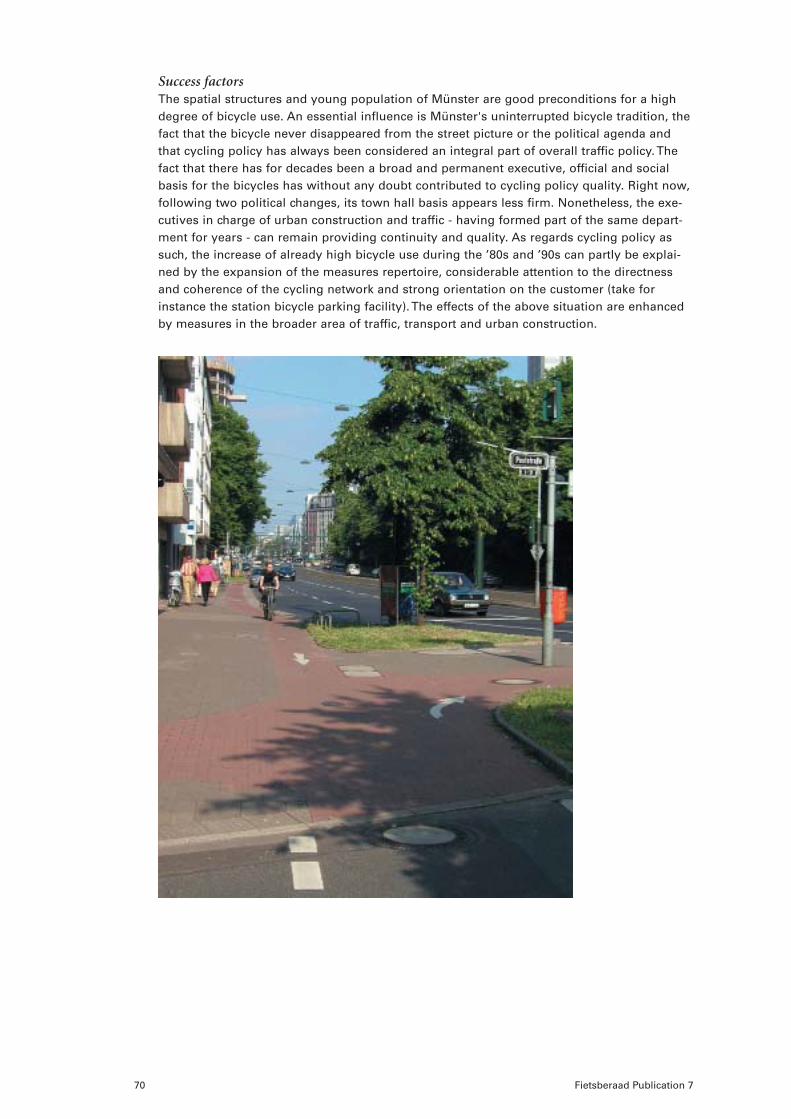
70 Fietsberaad Publication 7
Success factorsThe spatial structures and young population of Münster are good preconditions for a highdegree of bicycle use. An essential influence is Münster's uninterrupted bicycle tradition, thefact that the bicycle never disappeared from the street picture or the political agenda andthat cycling policy has always been considered an integral part of overall traffic policy. Thefact that there has for decades been a broad and permanent executive, official and socialbasis for the bicycles has without any doubt contributed to cycling policy quality. Right now,following two political changes, its town hall basis appears less firm. Nonetheless, the exe-cutives in charge of urban construction and traffic - having formed part of the same depart-ment for years - can remain providing continuity and quality. As regards cycling policy assuch, the increase of already high bicycle use during the ’80s and ’90s can partly be explai-ned by the expansion of the measures repertoire, considerable attention to the directnessand coherence of the cycling network and strong orientation on the customer (take forinstance the station bicycle parking facility). The effects of the above situation are enhancedby measures in the broader area of traffic, transport and urban construction.

Fietsberaad Publication 7 71
10. Freiburg: stable policy and increasing bicycle use
More than ten years ago the Dutch Ministry of Transport and Water Management portrayed
a number of cycling cities inside and outside the Netherlands, including Freiburg. Especially
the strikingly positive image of the bicycle within local community was very characteristic
for this south-German city at the time; it was not just an essential element of its urban traf-
fic system. So let’s look at the development of bicycle traffic and bicycle policy in Freiburg
during the past ten years.
phot
o: G
raha
m P
. Sm
ithThe blue bridge over the railway with on the right the railway station bicycle parking facility ‘mobile’
The fact that environment-friendly modes of transport play a central role in Freiburg instantlyjumps into the view of visitors arriving by train. The railway tracks of the Central Station arecovered by the tram bridge giving direct access to the platforms. Next to this we see the bicy-cle bridge with Mobile in between, the new bicycle parking facility for one thousand bicycles. It offers all kinds of services to cyclists and publictransport users. Whoever approaches Freiburg via the internet will soon get a picture of thecentral role of public transport and bicycles as well: what we see on the site is pictures ofcyclists and trams and we find lots of readily available information on what Freiburg has tooffer to cyclists and public transport users. Citizens are invited to join the discussions on thefuture development of their city. This detailed opinion-shaping process is currently takingplace in the scope of the new traffic development plan named Verkehrsentwicklungsplan2020 and the new Flächennutzungsplan 2020 (a kind of structure plan).
Pleasant conditionsFreiburg is a flourishing city with a pleasant living climate in attractive surroundings: theBlack Forest, the Vosges, the vineyards and orchards of hilly Markgräflerland, the Alsace andSwitzerland are close by. With its 1,800 hours of sun per year, South-Baden is the regionwith the most pleasant climate in Germany. Cycling contributes to this living climate as apiece of mosaic, in the widest sense of the word. Freiburg (213,000 inhabitants) forms theeconomic, scientific, cultural and administrative centre of South-Baden in the Upper Rhine

Plain. The city offers jobs to ca. 120,000 people, slightly more than half of them commuters,most of them from within the region. The service sector and especially many small techno-logical companies are the backbone of the economy. 30,000 students at the university andthe various high schools make Freiburg a city of knowledge. Since 1950 its population hasgrown by more than 80% and this growth still continues. Freiburg is the urban region havingthe largest growth percentage in the area of employment in Baden-Württemberg. Yet it remainsa compact city, and distances are short. 90% of the inhabitants live within a 7.5 km circle aroundthe market with its gothic cathedral. This is the area where we find most job locations. Add tothis the flatness of the city area, and you have proper conditions for bicycle use.The current traffic policy of Freiburg is based on the 1989 traffic plan. Its main purpose is toguarantee the city’s liveability and accessibility by creating attractive alternatives for cars. In the past ten years the realisation of this plan has just been continued. By now most mea-sures have been implemented and they have proved effective - especially regarding theirmutual influence on each other. The main points of this traffic policy have always been:expanding the public transport network, completing the cycling network, realising 30 km/hzones in staying areas, limiting the number of lanes on some main roads or narrowing themdown, and applying a controlling car parking policy. The old objectives and measures areupdated with the revision of the ”Verkehrsentwicklungsplan” (traffic development plan).
Cycling networkSince 1976 Freiburg has been conducting an active cycling policy at an annual investment of€ 836,000. In the past ten years a considerable effort has been put in towards further expan-sion of the cycling network. A few missing links excepted, this has resulted in a coherent,fine-mesh cycling network, connecting all quarters with the city centre and with each other.This cycling network now has a total length of 500 km, of which 160 km are cycle paths (114 km along main roads, 46 km autonomous), 130 km through 30 km/h areas (of which 90 km are cycle lanes) and 210 km on country roads. It is now possible to traverse the cityby bicycle without any interruption in an east-west direction, using the car-free Dreisam bicycle route, a wide road lining the bank.In spite of all this the municipality of Freiburg is forced to continue working on its cyclingnetwork, as many bicycle facilities no longer meet current quality demands. Due to intensivebicycle use certain stretches suffer from capacity problems as cycle paths plainly are far toonarrow, especially those originating in the ’60s. On the westbound stretch of the busy ringroad - lots of cars as well as bicycles - around the car-free city centre the situation is boundto improve greatly, soon. The municipal council namely has decided on a city boulevard offe-ring ample space to cyclists and pedestrians. “The usual cycle paths on pavements lead tomany conflicts between cyclists and pedestrians,” Hendrik Schmitt, bicycle coordinator of the municipality of Freiburg explains. “To prevent this we project cycle lanes on main roadsinstead of cycle paths on pavements, wherever we can.”
72 Fietsberaad Publication 7

Travelling times mapped outThe realisation of this coherent, fine-mesh urban cycling network with direct bicycle connec-tions and the measures taken for the other modes of transport have clearly improved thecompetitive position of the bicycle. Within the scope of an inventory required for the revisionof the Verkehrsentwicklungsplan another detailed study was performed in 2002. It concernedthe time each mode of transport took to travel from certain city locations to the Bertolds-brunnen, a tram-and-bus node in the heart of the city. See Map 16.
Fietsberaad Publication 7 73
Source: Stadt Freiburg i Br. Tiefbauamt - Verkehrsplanung
cycling
public transport< 15 minutes15-20 minutes20-25 minutes25-30 minutes30-35 minutes35-40 minutes> 40 minutes
car< 15 minutes15-20 minutes20-25 minutes> 25 minutes
15 min
20 min
25 min
30 min
35 min
40 min
M 1:50.0000 2.500m
Map 16. A comparison of travelling times by public transport, bicycle and car in Freiburg
This map shows that bicycles are the quickest mode of transport for distances until ca. 3 km:from the first layer encircling the city centre it is a fifteen-minute bicycle ride to the Bertolds-brunnen. This node is within thirty minutes’ reach by bicycle from practically all over thecore of the city, just as quick as public transport. Thanks to the presence of a few quick mainroads this takes a car only twenty minutes in many cases. Public transport is quicker thanthe bicycle only when you start from a few immediate station surroundings in the remotestwestern quarters. It is not likely that there will be many cities that would even realise thevalue of such knowledge about competitive positions of different modes of transport.Certainly the number of municipalities that have access to details as accurate as these ontravelling time requirements - and even mapping them out - must still be smaller. An exampleworth following!
Bicycle parkingUntil ten years ago bicycle parking was one of the weak spots of Freiburg's cycling policy.There was a great shortage of bicycle parking facilities, and the existing stands often werewheel rim killers. This has greatly improved by now. Since 1987 the number of bicycle standsin the city centre has grown from 2,200 to an impressive 5,613 in 2004. All over the city we

74 Fietsberaad Publication 7
now find 8,600 stands, most of these in the centres of the various city quarters and neartram stops. Bad bicycle parking facilities have been replaced by robust clamps, and near thetram termini we now find bicycle lockers as well. In 1999 a ”Mobile” was opened near therailway station on either side of the tracks; this is a mobility centre for cyclists and publictransport users. We find a bicycle parking facility with a capacity of 1,000 stands, bicycles forrent, a bicycle repair shop and a bicycle shop under one roof here. It also accommodates theoffices of the local departments of the ADFC cyclists’ union and “Verkehrsclub Deutschland”,a mobility centre advising travellers and selling tickets, and a café overlooking the railwayand the city. Cyclists arriving from the city end reach the bicycle parking by way of the bluebridge, made car-free at the time of the opening of the Mobile. Direct access to all platformsis possible by way of the public transport bridge.Although the bicycle parking facilities have not yet been assessed, it is clear that there is agreat shortage in many locations because they just are full, some of them even crammed.Many bicycle parking facilities still do not meet current quality demands. Reason enough for the city of Freiburg to leave bicycle parking on top of the agenda.
Bicycle useThe active cycling policy of Freiburg most certainly contributed to the fact that bicycle usehas almost doubled in size since the early ‘80s as regards local trips. In 1999 Freiburg inhabi-tants took their bicycles for 28% of their local trips. This is ca. 22% of all trips. At the sametime, car use for local trips dropped heavily: from 38% to 29%. All of them together, the environment-friendly modes of transport (public transport, bicycle, walking) cover 70% of all local trips. This makes Freiburg a topper within Germany. See Table 12.
Table 12. Development of the choices in modes of transport made by inhabitants of Freiburg,1982-1999, internal/local traffic
share in internal trips (in %)mode of transport 1982 1989 1999car driver 29 29 23
car passenger 9 7 6
public transport 11 18 18
cycling 15 21 28
walking 35 24 24
rest 1 1 1
total 100 100 100
Source: Municipality of Freiburg, Verkehrsentwicklungsplan Freiburg, Teil A: Problemanalyse, p.21
To Freiburg, cycling is the thing to do for almost everybody, all the year round, for all distan-ce categories and travelling motives. The most frequent cyclists are found in the 18-29 agegroup: 41%. Even the 70-plus age group take out their bicycles for a good 14% of their trips.See Table 13.
Table 13. Choice in modes of transport made by inhabitants of Freiburg based on journey purposesand local trips, 1999
share in local trips (in %)home- bring and
purpose commuting business school shopping collect recreational restcar 37 47 10 26 53 25 23
public transport 15 10 27 17 11 15 14
cycling 34 27 36 25 17 29 28
walking 13 14 26 31 19 30 33
total 100 100 100 100 100 100 100
Source: Municipality of Freiburg, Verkehrsentwicklungsplan Freiburg, Teil A: Problemanalyse, p.27

Fietsberaad Publication 7 75
Integral policyThe success of this cycling policy lies mainly in the coherence of overall traffic policy.Cycling policy is an integral component of a traffic policy consistently promoted by theUmweltverbund environment association, while car use is being discouraged at the sametime. Add to this the city’s spatial policy, aiming to keep distances short to avoid unnecessarytraffic. This has also resulted in new, partly car-free residential quarters like Rieselfeld andVauban, both situated within cycling distance from the city centre, and an active locationpolicy for large companies and supermarkets. Verena Breidt, president of the Freiburg divi-sion of the ADFC summarises the Freiburg situation as follows: “Cycling policy in Freiburgwas never an issue of only one certain political party. Independent of political colouringthere has always been at least someone in the past 35 years who brought attention to pro-moting bicycle traffic. Everyone knows what profit good liveability in Freiburg and districtimplies to him or her. Everyone knows some winegrower or ecological farm nearby; placesjust meant to be cycled to. We presume it is this unique combination of a certain degree ofconservatism intent on preserving values, and critical, environment-conscious citizens thatmakes Freiburg so special.”

76 Fietsberaad Publication 7
11. Ghent: promoting and sensitising
Relatively compact, flat, and students all around: Ghent has good conditions for intensive
bicycle use. Since 1993 the municipality has conducted an active cycling policy that makes
use of these conditions. And successfully so: people of Ghent grab their bikes. And because
politicians and officials have been “thinking bike” Ghent traffic policy has been set in motion.
This cycling policy has resulted in a local mobility policy considered Flanders’ most dynamic.
Ghent (230,000 inhabitants) lies where the Leie and Schelde rivers meet; a junction of water-ways, railways and motorways in East Flanders. Its port, the metal and motor industry andthe service sector - including many hospitals - are the pillars of its economy. 50,000 studentsat the university and three high schools and 60,000 school pupils mostly from the regionmake Ghent a city of knowledge and many young people. Cooperation between educationalinstitutions and the business sector results in many starting, innovative enterprises. A shop-ping and entertainment centre, Ghent attracts many visitors from the region and also peoplecoming from all over the country to its congresses and annual fair. Bicycles find their placein this lively city better and better. Right now the people of Ghent take the bicycle for 15% of their trips (walking 18%, public transport 8% and car 59%). Surely this was different once.Right until the ’70s little attention was given to walking and cycling, or to the city’s rich cul-tural-historical heritage either. Economic expansion and smooth car traffic flows topped the agenda. It was only in the late ’80s, when the city was coagulating with cars, did a newawareness of public space arose. This resulted in the first urban innovations and the first car-free streets. Public space was now regarded as a whole, and urban construction and traffic plans were brought in line with each other.
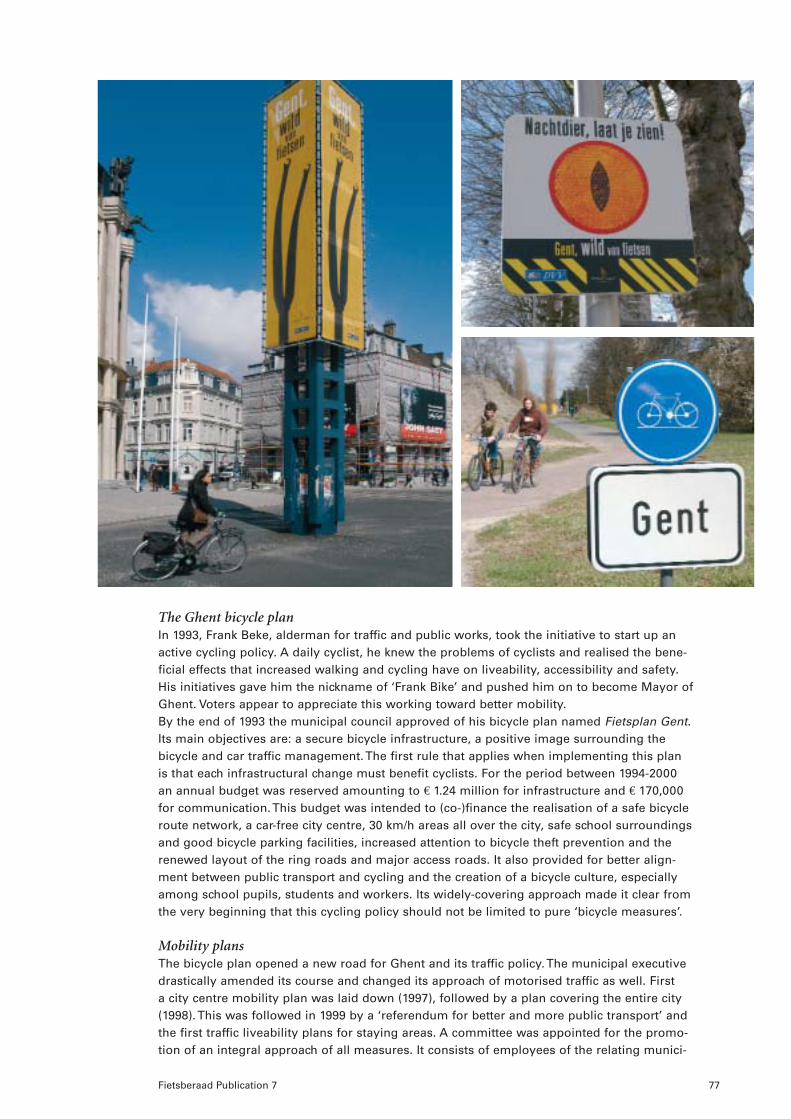
Fietsberaad Publication 7 77
The Ghent bicycle planIn 1993, Frank Beke, alderman for traffic and public works, took the initiative to start up anactive cycling policy. A daily cyclist, he knew the problems of cyclists and realised the bene-ficial effects that increased walking and cycling have on liveability, accessibility and safety.His initiatives gave him the nickname of ‘Frank Bike’ and pushed him on to become Mayor ofGhent. Voters appear to appreciate this working toward better mobility.By the end of 1993 the municipal council approved of his bicycle plan named Fietsplan Gent.Its main objectives are: a secure bicycle infrastructure, a positive image surrounding thebicycle and car traffic management. The first rule that applies when implementing this planis that each infrastructural change must benefit cyclists. For the period between 1994-2000an annual budget was reserved amounting to € 1.24 million for infrastructure and € 170,000for communication. This budget was intended to (co-)finance the realisation of a safe bicycleroute network, a car-free city centre, 30 km/h areas all over the city, safe school surroundingsand good bicycle parking facilities, increased attention to bicycle theft prevention and therenewed layout of the ring roads and major access roads. It also provided for better align-ment between public transport and cycling and the creation of a bicycle culture, especiallyamong school pupils, students and workers. Its widely-covering approach made it clear fromthe very beginning that this cycling policy should not be limited to pure ‘bicycle measures’.
Mobility plansThe bicycle plan opened a new road for Ghent and its traffic policy. The municipal executivedrastically amended its course and changed its approach of motorised traffic as well. First a city centre mobility plan was laid down (1997), followed by a plan covering the entire city(1998). This was followed in 1999 by a ‘referendum for better and more public transport’ andthe first traffic liveability plans for staying areas. A committee was appointed for the promo-tion of an integral approach of all measures. It consists of employees of the relating munici-

78 Fietsberaad Publication 7
pal services, public transport companies, district, province, and so on. This committee mustfirst approve of all measures before they can be implemented.By now all streets in the 35-hectare historic city centre are either car-free or car-restricted, carparking space has been transformed into attractive staying areas and the city centre is nowencircled by a parking route accommodating car traffic heading for the city centre. Comingfrom the ring and access roads and approaching the city centre, car drivers are faced with a decreasing traffic function, an increasing staying function, a stricter parking regime andhigher parking charges.
MeansIt was completely new to Belgium when in 1993 the munici-pal executive appointed a bicycle official, Erwin Stubbe, whohas been pioneering Ghent cycling policy ever since. In 1995Stubbe received the support of an administrative assistant,added by a bicycle plan promoter in 1996. This was the birthof a real ‘bicycle service’. It expanded into Mobility Servicewhen in 1997 the city centre mobility plan also demandedinclusion of the other modes of transport. In 2003 the annualbudget of this Service was € 5 million, of which 29% (ca. € 1,4 million) was reserved for bicycle traffic, 35% for trafficliveability and 25% for public transport.
Bicycle facilitiesOf the four main bicycle routes originally planned, three were almost finished by the end of2003 and one completely. The plans and partial realisation of four additional main routeshave also been taken up now. Major construction works like bicycle tunnels and bridges takeup most time, partly due to (financial) cooperation with other authorities. On some city ringand main access road stretches the number of car traffic lanes has been reduced from three totwo to make wider cycle paths possible. Other measures concern reconstruction of crossings,or less drastic steps, like laying out bicycle (suggestion) lanes and placing road markingsand signs.A big step forward was bicycle traffic from both ends in one-way streets. These streets hadlong since been a serious impediment to cyclists, and Ghent and Antwerp both took the initiative in 1997 to amend their road traffic regulations. By now, one-way traffic can onlybe imposed on cyclists in Ghent in exceptional cases and on urgent grounds. “As we hadprepared a good file we were able to open up more than 500 of our 700 one-way streets to cyclists in both directionswithin a short time; truly a success story”, says Yves de
Baets, communication assistant with the Mobility Service.Like other cities, Ghent had always been critical of allowingcyclists in pedestrian areas. In 1997 cycling was allowed hereas a pilot between six o’clock in the evening and nine o’clockin the morning, although firmly opposed by the pedestrianmovement. Six months later an assessment proved that thatthere had hardly been any problems. From that momentcycling has been allowed at all hours, all over the full, 35-hectare pedestrian area.
Bicycle parkingFrom the very beginning the municipality and the police have been working together towardrealising a structured approach of bicycle parking and preventing and combating bicycle theft.This is done by way of bicycle parking facilities and permanent and mobile parking facilities,rounding up stray bicycles and bicycle wrecks, returning retrieved, stolen bicycles to theirowners via bicycle registration and promoting the use of proper bicycle locks. By now over6,500 bicycle parking places have been realised in more than 200 locations and 4,000 near Sint Pieters railway station, 600 of these under surveillance. A ‘parking team’ ensures quickplacement and maintenance and works continuously on optimisation of the facilities.
phot
o: U
rsul
a Le
hner
-Lie
rz
phot
o: S
tad
Gent

Fietsberaad Publication 7 79
Since 1998 both permanent and mobile surveyed bicycle parking facilities have been placedin locations attracting many cyclists, or during events. Cyclists appreciate this. During theGhent festivities, a ten-day street theatre and music festival, 4,500 cyclists made use of these free facilities in each of the past two years. At a cost of under € 1.20 per bicycle this is an extremely efficient measure, certainly when compared to the high costs of free publictransport offered on certain shopping days and holidays. Ghent also has a bicycle watchconsisting of seven assistants. They label bicycles left behind in the street and bicycle wrecks(almost 5,300 in 2002). Labelled bicycles still found after two weeks are transferred to adepot (over 2,330 in 2002). Whoever reports a bicycle theft with the police and can describethis bicycle in detail can come to the depot to see if it is there. 154 of the 400 Ghent citizenswho took this trouble could return home with their own bicycles.
Ccycle path boarding the water
SensitisingCommunication plays an important role in Ghent bicycle and mobility policy. First, emphasiswas put on informing the population about the Fietsplan Gent and its objectives via news-papers and leaflets. In the next phase people’s minds were gradually turned to a number ofsubjects: this is called sensitising. A number of events were organised for this purpose, likethe Week of the Bicycle, the Week of the Soft Road User, the Week of Transport, Car-restrictedSchool Days, a school rally, a bicycle bell concert for school pupils, bicycle tours and a cycleparty for the disabled. Contributions were and are made to events organised by other orga-nisations, a bicycle private project has been set up and fluorescent, reflecting clothing withthe Fietsplan Gent logo is distributed. Calling up the people to make more frequent, dailyuse of bicycles was postponed until a sufficient amount of safe bicycle facilities had beenprovided. This appeared to be the correct approach, witness a survey conducted amongcyclists. The average Ghent cyclist is not really after information; what matters to him espe-cially is that safe and comfortable bicycle routes are realised. What he does like is the chanceof venting his opinion, irritation or suggestions. An e-mail address specially reserved for this purpose receives 800 messages each month concerning bicycle and mobility policy. Thecycling policy of Ghent radiates on to other cities. When in 1997 a two-day bicycle forum wasorganised in collaboration with Antwerp, various problems were put forward that cannot be solved at municipal level. This is due to legal obstructions: tax-related promotion, one-way roads, 30 km/h areas and so on. The bicycle forum received a lot of attention from themedia and resulted in a foundation named Club of Belgian Cycling Cities. This now contains26 municipalities. Most of the ‘demands’ of the past have been met by now.

80 Fietsberaad Publication 7
PromotionThree target groups receive special attention when promoting bicycle use:• Students
Ghent offers students some tailor-made services to encourage them to use their bicycles.In 2002 for instance a bicycle rental project was started. Its objectives were: a sufficientamount of bicycles available, reducing the degree of bicycle theft and improving overallcycling safety. Bicycles offered for hire are not all of them new, there are also bicyclesthat have not been retrieved from the depot and that have been patched up. During thefirst year over 1,000 students hired a bicycle for € 5 a month. Little use was made of thepossibility of parking bicycles in the bicycle depot during college-free periods.
• School pupilsThe 2002 project named Safe School Surroundings is a structural approach by Ghent of home-school commuter traffic: schools are counselled by a consulting agency whenassessing traffic safety in their school surroundings and when preparing a school trans-port plan. School routes are analysed, choices of modes of transport are studied andrecommendations and suggestions for changing mobility behaviour are given to theschool and the parents. Suggestions also concern integration of ‘traffic’ in education. Theschool transport plan can also be used for subsidy applications to the Flemish District forproposed measures. It is intended to give each school its turn in a few years to come.
• Civil servantsCivil servants of Ghent can use a section of the car parking garage of the administrativecity centre. This has been converted into an electronically secured bicycle facility with itsown entrance and equipped with dressing-rooms and showers. Employees can also useservice bicycles and apply for a ‘company bicycle’, new or restored. Over 700 civil ser-vants make use of this. When Belgium introduced the tax-free bicycle allowance in 1998(€ 0.15/km, maximum 10 km/day) the city of Ghent instantly declared this applicable tocivil servants who walk to the office. An estimated 50% of the civil servants actuallymakes use of this arrangement. Surveys prove, however, that this allowance must be far higher if civil servants are to change their mode of transport.
EffectAlthough since 1977 the number of citizens in Ghent fell continuously, it has been growingslightly again since 1999. The ratio of vacant shops is clearly lower than elsewhere inBelgium. The number of visits to shops and the number of hotel nights show a very strongincrease and also cafés and restaurants attract more visitors. These developments are anindication of the fact that a stay in this city has become more attractive to its inhabitants,

Fietsberaad Publication 7 81
visitors and to companies. All this is reason enough for the executive to continue on its wayand to work towards a further rise - 20% in 2006 - of the number of bicycle trips for instance.Yves de Baets: “It is one of Ghent’s strongest points that everybody thinks ‘bike’ now. Thisspeeds up and reinforces the process.”
The traffic plan for the period between 2002-2007 (Beleidsplan voor een anders-mobieldenken & doen) of new alderman Karin Temmerman distinguishes among clear politicalchoices in transparent words. This apparently is unusual and it shows: ‘There is this clear-ly felt fear of calling a cat a cat.’The plan elaborates six objectives:• Ghent and its pedestrians: can we go a little better and quicker?
Focusing more intensely on sufficiently wide pavements.• Ghent and its cyclists: can we go a little more safely? 20% more cyclists.• Ghent and its public transport: can we double?• Ghent and its cars: can we hold back a little?• Ghent and its inhabitants: can we become slightly more liveable?• Ghent and its parking problem: can we clear up a bit?
As regards bicycle facilities Ghent wishes to forge its good (main) bicycle routes togetherinto an actual network soon, to realise its ‘paper’ street network. A few new bridges andtunnels have also been projected.

82 Fietsberaad Publication 7
12. Comparison
Chapter 1 indicates that a ‘continuous, proper cycling policy’ combined with an ‘integral traffic
policy that allows space to bicycle traffic’ have more or less proved to be the explanation
for high municipal bicycle shares in 2006. The ten case studies contained in this publication
should show this general tendency. On the other hand of course we find differences in these
ten ‘unique’ cities appearing after closer study. This concluding chapter tries to summarise
the parallels and differences. But it is a comparison that requires great prudence. After all,
these ten ‘city accounts’, compact as they are indeed, do not give a complete picture. This
comparison can therefore only be characterised as qualitative and far from accurate.
Prolonged interaction?Degrees of bicycle use are high in all ten cities - even though the differences, varying from a 15% bicycle share for all trips in Ghent to 37% in Groningen, are not small either. A highdegree of bicycle use and a strongly developed cycling policy more or less obviously gohand in hand. Certainly when considered in the longer run: an intensive (and expensive)cycling policy will not hold when it does not result in cycling and a high degree of bicycleuse will not hold when facilities are not uplifted or maintained in a certain way. There is another, third element here: the underlying culture/tradition, the general attitude of citizens,officials and politicians towards bicycle traffic. In the end this culture/tradition will thereforein a way relate to actual cycling policy and bicycle use.What we are in fact talking about is thoughts-words-actions in policy: generally-shared valuations leading to concrete measures via political choices. Table 14 shows a comparisonof the ten cities on these three points:
Table 14. Comparison of the ten cities with regard to culture/tradition, political choices and facilities
analogy exceptionsculture & tradition: Bicycle use ample for Yes, 8 out of 10 show a history of use Freiburg and Ghent
decades and general accepted / appreciated and acceptance of bicycles
political choices: For decades, traffic policy Yes, 8 out of 10 to a certain extent Freiburg and
with attention for bicycle use? always payed attention to cycling escpecially Ghent
facilities: Good cycling network nearly Yes, 8 out of 10 nearly finished with Freiburg and
completed? construction escpecially Ghent
Ghent

Fietsberaad Publication 7 83
This comparison shows the same picture on all three points - which in turn demonstratesthe firm bond that exists between culture/tradition, policy and use.In the last decades Freiburg and Ghent have shown a manifest rise in bicycle use rather thana permanent high level dating way back. It would seem that bicycle use had disappearedfrom view in these cities more than in the other cities; not only when considering numbersof cyclists in the streets or in political terms, but also in cyclists’ facilities. As a result, thetask concerning bicycle facilities was far greater when cycling policy was relaunched in the’80s and ’90s.One the one hand it is obvious that the majority of the European cycling cities discussedhere demonstrate a well-established history of bicycle use, cycling policy and cycling cultu-re. On the other hand it is also right to conclude that this does not apply to all these cities inthe same way. What is striking in this respect is that cities that do not so much fit this picture(Freiburg and Ghent) are also the cities that right now have the lowest degree of bicycle use.They launched or relaunched their cycling policies later than the others, and are not (yet?)on the level of the other cities.
Quality of cycling facilitiesThere is a great deal more to be said about facilities for cyclists and a great deal more tocompare. Completeness of a network is not the same as high network quality. Quality can beexpressed in terms of traffic design (width of lanes and paths, types of crossing provisionsand so on), but this comparison cannot be drawn on the basis of the rough data containedin this publication. Comparing is possible in another way, namely by estimating the degreein which cyclists can participate in traffic in a safe way and without obstructions. So: thedegree in which the bicycle routes of the network run by way of their ‘own facilities’. Asecond point of this comparison of cyclists’ facilities is the theme of bicycle parking: whatare the capacities and how much attention do they receive in the way of policy?
Table 15. Comparison of the ten cities based on cycling network quality and bicycle parking facilities
analogy exceptionsquality of the cycling network: Specific, Limited; 6 out of 10 have separated less ‘separated’: Freiburg
(separated facilities for the bike? facilities for cyclists as a standard and especially Ghent; ‘separated’
to a higher level: Veenendaal
and especially Zwolle
facilities for bicycle parking: Massive Yes, 7 out of 10 have bicycle less weight: Odense and
numbers and strong attention in policy? parking as an important theme Copenhagen (but more
of cycling policy ‘‘bicycles on trains’’);
stronger accent: Amsterdam
When we go a little more deeply into this kind of comparison of bicycle facilities, the picturethat remains is especially that of similarity. Still, a few more differences come to light. Thelower scores of Freiburg and Ghent regarding network quality are a direct result of the com-parison drawn earlier regarding network completeness. More relevant here is the exceptio-nally positive score of Veenendaal and especially Zwolle. These places show that the themeof ‘own facilities’ is now being interpreted at a higher level. So: not just constructing morecycle paths and cycle lanes, but working towards preventing cyclists from being confrontedwith heavy and/or fast car traffic in virtually any place along their route. In such a case muchattention and money is spent on crossings - now mainly in the form of flyovers and tunnels.
The bicycle parking theme indicates a new phase in policy, first and foremost in Amsterdam.In its most recent bicycle plan, parking is now branded as theme of the highest priority. Also the two Danish cities show something special: here, bicycle parking apparently involvesfar lower numbers. Odense for instance realised a 250-place bicycle parking facility near therailway station the last ten years, as well as 400 extra clamps. In Dutch cities, bicycle parkingcertainly appears a huge policy task, especially near railway stations. The same can also be

Integral policyApart from ‘continuous’, ‘integral’ was the second key word used in our introduction to explainhigh degrees of bicycle use. This, admittedly, is a rather vague word. It can be concretised inthree ways:• integral as a thematic term within cycling policy: apart from gradual realisation and
improvement of the ‘normal’ infrastructural facilities (including bicycle parking), projectsrevolving around technical innovation, service and promotion certainly count as well;
• integral as a term referring to the overall policy cycle: from political commitment to planned implementation and assessment;
• integral as a term within overall traffic policy. This specifically applies to the complementof the pull-policy (the honey) - namely the push-policy (the vinegar) of restricting car use,or, in more neutral terms, regulation of car using conditions.
These aspects of ‘integral policy’ show some less strong parallels, certainly in issues concer-ning cycling policy. As generally known by now, certainly via the BYPAD-programme, Danishand Belgian cities score better on non-infrastructural issues than Dutch cities.Striking about Münster is that it conducts a sort of cycling policy that is really typical ofDutch policy.Another striking thing - see the Odense account in the first place - is that close study of thepromotional activities shows that, in themselves, these activities have a character and formatthat can also be considered as Dutch in a way. After all, actions surrounding school traffic,commuter traffic and company bicycles also occur in the Netherlands to some degree. The only difference is that often they are not launched by municipalities so explicitly, andthat they are most certainly not as continuous as those in Odense.
84 Fietsberaad Publication 7
applied to Münster, Freiburg and Ghent; consider for instance the present bicycle parkingcapacity near the central stations. In Münster we see a new 3,300-place facility, in Freiburgthere are 1,000 and in Ghent the total capacity near the railway station is 4,000 places.The lower Danish figures are hard to explain. The most likely reason is that the role of thebicycle-train combination is far smaller in Danish than in other cities. On the other hand, themuch larger possibilities of taking bicycles on trains (and underground and buses) most cer-tainly play a part here.
Freiburg

Fietsberaad Publication 7 85
analogy exceptionsintegral cycling policy: Also attention to Limited; 6 out of 10 cities still have a to some extent Groningen and
innovatons, services and promotion? nearly complete focus on Copenhagen; stronger: Odense
infrastructural measures and Ghent
firm, systematic and enthusiastic cycling Limited; 6 out of 10 show clear ‘holes’ clearly systematic: Amsterdam
policy: From political commitment to in their policy cycle – especially in and Copenhagen;
assessment? political support or in thoroughly more enbedded in politics and with
planned conduct of policy political ‘drive’: Odense and Ghent
integral traffic policy: Restrictions to car Yes, all cities show some kind of probably less restrictions in Zwolle
traffic in and near the city centre restrictions to car traffic near the and especially Veenendaal;
(parking, circulation of car traffic)? city centres clearly more restrictions in
Copenhagen and Amsterdam
Table 16. Comparison of the ten cities based on ‘integral policy’
Where it concerns a more process-based quality of municipal cycling policy (strong politicaldrive and support, knowledge and enthusiasm on the part of officials, good plan-shapingcycle) the differences seem to dominate the parallels. In the two largest cities, Amsterdamand Copenhagen, the force of this plan shaping is very striking. This may very well be neces-sary for large municipal civil service departments: people alone just will not do any more; a formal planning cycle is required to keep cycling policy running. Another equally strikingapproach is that of Odense and Ghent, where the word ‘enthusiasm’ indeed seems to be theessence, added by clear political support. In between we find German and Dutch medium-sized cities, where cycling policy is based more strongly on the ‘bit of everything’ principle.Finally the push-end of traffic policy: the degree in which the competitive position of the carversus the bicycle is at any rate not being improved. It is clear that this issue relates to citycentres alone. In this respect the parallels are strong. The only thing that could be said is thatZwolle and Veenendaal impose even fewer restrictions on car use, and that it is ‘cycling poli-
Amsterdam

86 Fietsberaad Publication 7
cy under its own steam’ here (with result!). It would also appear that car using restrictionsare heavier in the large cities of Copenhagen and Amsterdam.
Mainly parallelsDutch cities on the whole mainly show parallels. There is something like ‘Dutch municipalcycling policy’. The two German cities are a bit like Dutch cities as regards cycling policy(especially Münster), while both Danish cities and Ghent in Belgium differ in a way. For thismatter it is again Münster that approaches the Dutch cities most closely when we considerits extent of bicycle use.When we look at all these parallels it is a fairly strong cycling tradition, expressing itself inan early, high degree of bicycle use and an early launch of the realisation of a proper bicycleroute network, that seems to be essential to the differences. Especially Ghent and Freiburgdiffer here to some extent. In places where this early history, tradition and early network realisation are the most prominent, Zwolle and Veenendaal, we also see a (slight) deviation,in the form of interaction between an extremely segregated cycling infrastructure and limi-ted regulation of car traffic. Finally there is the striking, specific character of cycling policyand broader traffic policy in the much larger cities of Amsterdam and Copenhagen and thestriking, more integral, more ‘man’ oriented character of the cycling policies of Odense andGhent.
Ghent

Acknowledgements• Section 1.3 was published earlier as ‘Fietsbeleid werkt vooral op de lange termijn’, Fiets-
verkeer nr. 7, October 2003, pp. 14-16.• Section 1.4 was also published as a text passage in Beleidswijzer Fietsverkeer of Fiets-
beraad, December 2005, pp. 17-19.• Chapter 2 (Groningen) is an elaboration of the article by Ben Boersma and Sieneke van
Alteren ‘Compacte (fiets)stad Groningen, verkeersbeleid en ruimtelijk beleid gelijk op’,Fietsverkeer nr. 9, June 2004, pp. 3-8, on the basis of the report by Boersma Van Alteren,Fietsgebruik en ruimtelijk beleid, resultatenanalyse gemeente Groningen, September2004, produced on commission of Fietsberaad. The frame concerning surveyed parkingfacilities was taken from Fietsverkeer nr. 11, May 2005, p. 28.
• Chapter 3 (Amsterdam) is mainly a compilation of six (sometimes slightly abbreviated)articles published earlier in Fietsverkeer:- ‘Hoofdstad kiest voor uitgebreide aanpak’, Fietsverkeer nr. 3, June 2002, pp. 13-14;- ‘Amsterdam: geen woorden maar daden’, Fietsverkeer nr. 4, October 2002, pp. 16-17;- ‘Vervoerwijze Amsterdamse bovenbouwscholieren, Lopen versus fietsen: 3-1’,
Fietsverkeer nr. 4, October 2002, p. 24;- ‘Amsterdammers op de fiets!’, Fietsverkeer nr. 8, February 2004, pp. 5-7;- ‘De fiets blijft het goed doen in Amsterdam’, Fietsverkeer nr. 8, February 2004, pp. 8-9;- ‘Fietscoördinator Amsterdam neemt afscheid’, Fietsverkeer nr. 8, February 2004, p. 10.
• Chapter 4 (Enschede) was published earlier as ‘Enschede houdt de auto in toom’,Fietsverkeer nr. 8, February 2004, pp. 11-14, author: Karin Evers.
• Chapter 5 (Zwolle) was published earlier as ‘De lange adem van Zwolle’, Fietsverkeer nr.11, May 2005, pp. 1-7. The frame concerning bicycle-parking near Zwolle railway stationwas taken from Fietsverkeer nr.6, June 2003, p. 7.
• Chapter 6 (Veenendaal) was published earlier as ‘Het comfortabele netwerk vanVeenendaal’, Fietsverkeer nr. 12, October 2005, pp. 4-7. The frame concerning free survey-ed parking facilities was taken from Fietsverkeer nr. 11, May 2005, p. 27.
• Chapter 9 (Münster) was published earlier as ‘Münster: Duitslands fietsstad nummer één’,Fietsverkeer nr. 9, June 2004, pp. 9-11, author: Ursula Lehner-Lierz.
• Chapter 10 (Freiburg) was published earlier as ‘Freiburg: fietsgebruik stabiel op hoogniveau’, Fietsverkeer nr. 10, January 2005, pp. 6-8, author: Ursula Lehner-Lierz.
• Chapter 11 (Ghent) was published earlier as ‘Frank Bike als burgemeester, Gent in beweging’, Fietsverkeer nr. 8, Februari 2004, pp. 15-17, author: Ursula Lehner-Lierz.
Fietsberaad Publication 7 87
Colophon
Published by:Fietsberaad, April 2006Publication number 7
Text:Dirk Ligtermoet (Ligtermoet & Partners, Gouda)
Translation:STENTOR taal, Rotterdam
Design:Klats+Poseidon, Delft
Photography:Stef Breukel, Delft and others
Print:United Graphics
This Publication can be ordered for free,
by post: Fietsberaad, P.o. Box 1031,
3000 BA Rotterdam, The Netherlands
by email: [email protected]
All publications of the Fietsberaad can be down-
loaded from the website: www.fietsberaad.nl