Bells and Trumpets, Jesters and Musici: Sounds and Musical ...
Upload
independentCategory
view
4download
0
Continents and Supercontinents
JOHN J.W. ROGERS M. SANTOSH
OXFORD UNIVERSITY PRESS

CONTINENTS AND SUPERCONTINENTS

This page intentionally left blank
Continents and Supercontinents
JOHN J.W. ROGERS AND M. SANTOSH
12004

1Oxford New York
Auckland Bangkok Buenos Aires Cape Town Chennai
Dar es Salaam Delhi Hong Kong Istanbul Karachi Kolkata
Kuala Lumpur Madrid Melbourne Mexico City Mumbai Nairobi
Sao Paulo Shanghai Taipei Tokyo Toronto
Copyright # 2004 by Oxford University Press, Inc.
Published by Oxford University Press, Inc.
198 Madison Avenue, New York, New York 10016
www.oup.com
Oxford is a registered trademark of Oxford University Press
All rights reserved. No part of this publication may be reproduced,
stored in a retrieval system, or transmitted, in any form or by any means,
electronic, mechanical, photocopying, recording, or otherwise,
without the prior permission of Oxford University Press.
Library of Congress Cataloging-in-Publication Data
Rogers, John J. W. (John James William), 1930–
Continents and supercontinents / John J. W. Rogers and M. Santosh.
p. cm.
Includes bibliographical references and index.
ISBN 0-19-516589-6
1. Earth—Crust. 2. Continents. 3. Continental drift.
4. Plate tectonics. I. Santosh, M. II.Title.
QE511.R59 2004
551.1 036—dc22 2003022676
9 8 7 6 5 4 3 2 1
Printed in the United States of America
on acid-free paper

Preface
This book deals with continents, where more than 95% of the earth’s population lives. We discuss thepresent state of knowledge on the origin and evolution of continents. We pose a number of questions
and attempt their answers. Many of these are controversial, and potential clues have to be sought fromfuture research.
The book begins with two chapters on the history of geologic thought about continents and thedevelopment of basic concepts of plate tectonics. We follow with discussions of the evolution of therocks that make up continental crust and the development of cratons, which we regard as the buildingblocks of continents mortared together by orogenic activity. Two chapters describe the accretion of con-tinents and the further aggregation of most of the world’s continental blocks together to form super-continents. The next two chapters discuss the five supercontinents that were proposed to have existedduring earth history, ranging from a very hypothetical one in the Late Archean to the much better knownPangea at the end of the Paleozoic. Two chapters then describe the history of ocean basins and continentsthat developed after the breakup of Pangea, and we conclude the book with discussions of the effects ofcontinents and supercontinents on climate and organic evolution.
This book was written for two purposes. Primarily it is intended as a text for upper-level undergraduateand beginning graduate courses. We assume that readers have a basic background in mineralogy, petrol-ogy, and structural geology, but we understand that many will not have had geochemistry or geophysics.For this reason, we include short general appendices (A to D) that explain how to use information obtainedfrom studies in seismology, heat flow, paleomagnetism, and heavy isotopes.
We also hope the book is sufficiently informative and provocative that it can be used for general readingby professional geologists and perhaps as a basis for graduate seminars. Partly for this purpose, the bookcontains five special appendices (E to I) that provide detailed information that is not generally needed in anundergraduate text. These special appendices include details about several cratons, anorogenic magmaticsuites, orogenic belts of Grenville age, belts with ages ranging from 2.1 to 1.3 Ga, and orogens commonlyreferred to as Pan-African or Brasiliano.
We have tried to keep the book current to the year 2002, and to include some references which werepublished as recently as early 2003. However, new information on every subject mentioned here continu-ally becomes available through the publication of recent books and issues of journals. In order to providemore timely information after the publication of the book, we have established a website at http://www.gondwanaresearch.com/csbook.
Although the book contains over 700 references, many important papers had to be omitted. In order tokeep the bibliography as short as possible, we have generally listed only recent publications on each topic,particularly choosing those that have extensive references to earlier publications.
The book has been greatly improved by discussions with several people, some of whom kindly revieweddifferent chapters. We are particularly grateful for the assistance given by Tovah Bayer, Joe Carter, DrewColeman, Allen Glazner, Tony Hallam, Joe Meert, Brent Miller, Calvin Miller, Lisa Sloan, and DebbieThomas. All of the line drawings and many of the photographs in the book were prepared by us, and weacknowledge people who provided other photographs in the captions. The University of North Carolina atChapel Hill and the Kochi University are acknowledged for extending facilities. Miriam Kennard and thestaff of the UNC Geology Library provided exceptional help with references. Rachel Cottone, DarrellSandiford, and Yvette Thompson helped in preparation of the manuscript. Finally, we also thank ourwives for understanding the amount of time that preparation of this book has taken from our family lives.
v

This page intentionally left blank
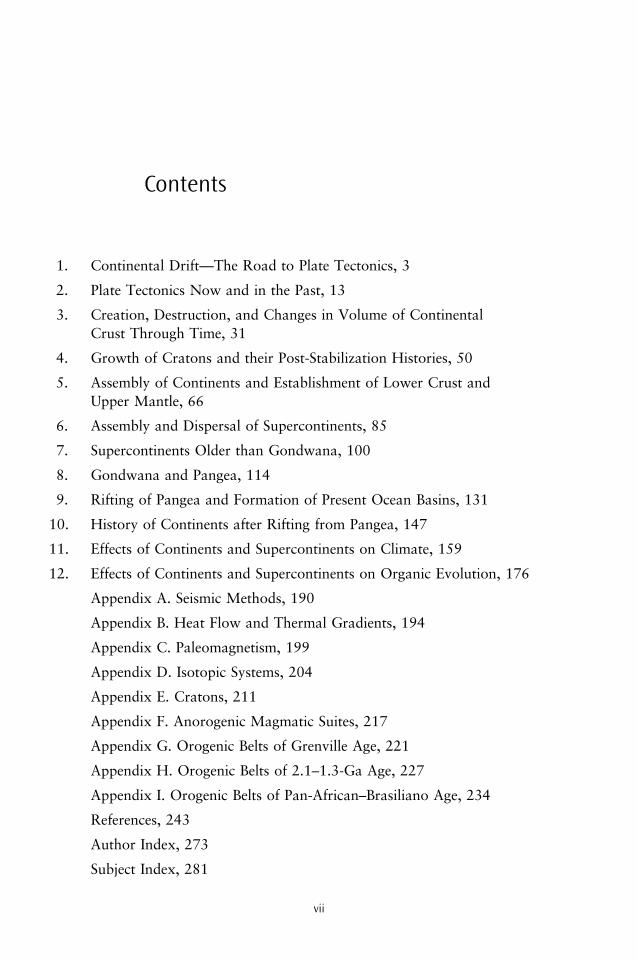
Contents
1. Continental Drift—The Road to Plate Tectonics, 3
2. Plate Tectonics Now and in the Past, 13
3. Creation, Destruction, and Changes in Volume of Continental
Crust Through Time, 31
4. Growth of Cratons and their Post-Stabilization Histories, 50
5. Assembly of Continents and Establishment of Lower Crust and
Upper Mantle, 66
6. Assembly and Dispersal of Supercontinents, 85
7. Supercontinents Older than Gondwana, 100
8. Gondwana and Pangea, 114
9. Rifting of Pangea and Formation of Present Ocean Basins, 131
10. History of Continents after Rifting from Pangea, 147
11. Effects of Continents and Supercontinents on Climate, 159
12. Effects of Continents and Supercontinents on Organic Evolution, 176
Appendix A. Seismic Methods, 190
Appendix B. Heat Flow and Thermal Gradients, 194
Appendix C. Paleomagnetism, 199
Appendix D. Isotopic Systems, 204
Appendix E. Cratons, 211
Appendix F. Anorogenic Magmatic Suites, 217
Appendix G. Orogenic Belts of Grenville Age, 221
Appendix H. Orogenic Belts of 2.1–1.3-Ga Age, 227
Appendix I. Orogenic Belts of Pan-African–Brasiliano Age, 234
References, 243
Author Index, 273
Subject Index, 281
vii

This page intentionally left blank

CONTINENTS AND SUPERCONTINENTS

This page intentionally left blank
1
Continental Drift—The Road to PlateTectonics
Alfred Wegener never set out to be a geologist.With an education in meteorology and astron-
omy, his career seemed clear when he was app-ointed Lecturer in those subjects at the Universityof Marburg, Germany. It wasn’t until 1912, whenWegener was 32, that he published a paper titled‘‘Die Entstehung der Kontinente’’ (The origin of thecontinents) in a recently founded journal calledGeologische Rundschau. This meteorologist hadjust fired the opening shot in a revolution thatwould change the way that geologists thoughtabout the earth.
In a series of publications and talks both beforeand after World War I, Wegener pressed the ideathat continents moved around the earth indepen-dently of each other and that the present continentsresulted from the splitting of a large landmass (wenow call it a ‘‘supercontinent’’) that previously con-tained all of the world’s continents. After splitting,they moved to their current positions, closingoceans in front of them and opening new oceansbehind them. Wegener and his supporters referredto this process as ‘‘continental drift.’’
The proposal that continents moved around theearth led to a series of investigations and ideas thatoccupied much of the 20th century. They are nowgrouped as a set of concepts known as ‘‘platetectonics.’’ We begin this chapter with an investi-gation of the history of this development, startingwith ideas that preceded Wegener’s proposal. Thisis followed by a section that describes the reactionsof different geologists to the idea of continentaldrift, including some comments that demonstratethe rancorous nature of the debate. The next sec-tion discusses developments between Wegener’sproposal and 1960, when Harry Hess suggestedthat the history of modern ocean basins is consis-tent with the concept of drifting continents. Wefinish the chapter with a brief description of sea-floor spreading and leave a survey of plate tec-tonics to chapter 2.
Prevailing Tectonic Ideas in 1912
Although Wegener is credited with first proposingcontinental drift, some tenuous suggestions hadalready been made. We summarize some of thisearly history from LeGrand (1988).
As soon as Europeans began to colonize theAmericas, and geographers started to draw mapsof the Atlantic Ocean, some scholars noticed simi-larities between the western and eastern borders ofthe ocean and suggested reasons for the similarity.Perhaps the most bizarre was in a 1858 book byAntonio Snider (Snider-Pellegrini) titled ‘‘LaCreation et ces Mysteres devoiles’’ (The creationand its mysteries unveiled). Snider thought thatthe present form of the earth developed betweenthe biblical creation and the biblical (Noachian)flood, with one of the last events being a massivecatastrophe that opened the Atlantic Ocean,flooded the Old World, and left Adam’s descen-dants alive only in the Americas.
Geologic reality is slightly more evident in othersuggestions. One was that catastrophic separationof the moon from the earth would have left a voidthat the Americas rushed in to fill, leaving Europeand Africa behind. Origin of the moon from theearth in the early days of formation of the solarsystem is still a viable hypothesis, but it clearlyoccurred before the evolution of continents andhad no effect on drift. In 1881 Eduard Suess pro-posed the name ‘‘Gondwana Land’’ (chapter 8) forthe southern continents (further publication inEnglish, 1904–1909). By 1910 the American geol-ogist F.B. Taylor suggested that the world’s moun-tain belts developed because of drift of continentstoward the equator from both the north and thesouth.
Wegener’s proposal was very different, andmuch better documented, than all of these earlierideas. It also brought Wegener and his supportersinto direct conflict with two prevailing, and some-
3
what contrasting, views of the evolution of theearth: ‘‘contractionism’’ and ‘‘permanentism’’ (‘‘fix-ism’’). Both of these views have now disappearedfrom geological thinking, but they need to be sum-marized for their historical importance.
Contractionism held that the earth was shrink-ing as it cooled down; it was supported by manygeologists, including Eduard Suess, who found itcompatible with his concept of Gondwana Land.Contractionism’s supporters thought that contrac-tion exerted sufficient pressure on the crust to gen-erate mountain ranges as the earth’s circumferencebecame smaller. In order for the earth to remain asphere, it would have to contract equally along allgreat circles, and proponents of the theory pointedout that this could be approximately accomplishedby compression along two great circles perpendicu-lar to each other. In the modern earth, compressionis mostly along the rim of the Pacific Ocean andalong the Alpine–Himalayan belt, which are nearlyperpendicular, and some contractionists felt thisproved their claim.
Contractionism suffered a major blow in the1890s when radioactivity was discovered. Radio-active decay generated heat, and an earth contain-ing radioactive elements was not cooling down asrapidly as one in which the only heat source was itsinitial accretion. Contractionism did not disappearimmediately, however, because no one knew howmuch radioactive material the earth contained, howold the earth was, or how effectively heat wastransferred from the interior to space. Therefore,some geologists still maintained that contractioncaused by cooling of the earth could explain earthhistory much better than the movement of conti-nents.
The second major concept attacked by drifterswas ‘‘permanentism’’ (‘‘fixism’’), which held thatthe earth’s continents and ocean basins had alwaysoccupied the position that they do now. It was alsosupported by numerous geologists, including JamesD. Dana, who, when he was not thinking abouttectonics, established the basic classification ofminerals that is still used today. Some continentalmargins had clearly undergone orogeny and possi-ble enlargement, but it was assumed that this wassimply minor growth that displaced small areas ofocean basins. Identical fossil species found on con-tinents now separated by ocean basins may havecrossed when temporary ‘‘land bridges’’ rose in theoceans. Sediments in mountain belts that appearedto have been derived by erosion of areas in adjacentocean basins were likewise derived from temporaryuplifts in the oceans. Some geologists still espousedpermanentism even after seafloor spreading was
proposed in 1960 (see below). They includedMaurice Ewing, a pioneer in geophysical explora-tion of the oceans and founder of the LamontGeophysical Laboratory. A.A. Meyerhoff andH.A. Meyerhoff, two of the world’s leadingpetroleum geologists, found flaws in the conceptsof drifting and plate tectonics into the 1970s(e.g., Meyerhoff and Meyerhoff, 1974).
The ideas discussed above are now discredited,but much that geologists had learned by the early20th century remains an important part of the dis-cipline. One of the most significant concepts is iso-stasy, which was developed in the 1800s whensurveyors found that they could not produce anexact triangulated base map of India. When themathematician J.H. Pratt, who was also theAnglican Archdeacon of Calcutta, worked throughthe data, he decided that the surveyors had notcorrected accurately for the pull of the Himalayason the plumb bob that they used to set their surveyinstruments horizontal. The surveyors had knownthat the mountains would attract the plumb boband had calculated the effect by assuming that themountains were simply an additional mass added tothe surface of the Indian plains. What they did notknow originally was that the Himalayas actuallyare not an additional mass but the same mass as theplains areas because the mountains extend fartherdown into the denser part of the earth (mantle) thanthe rocks underlying the plains.
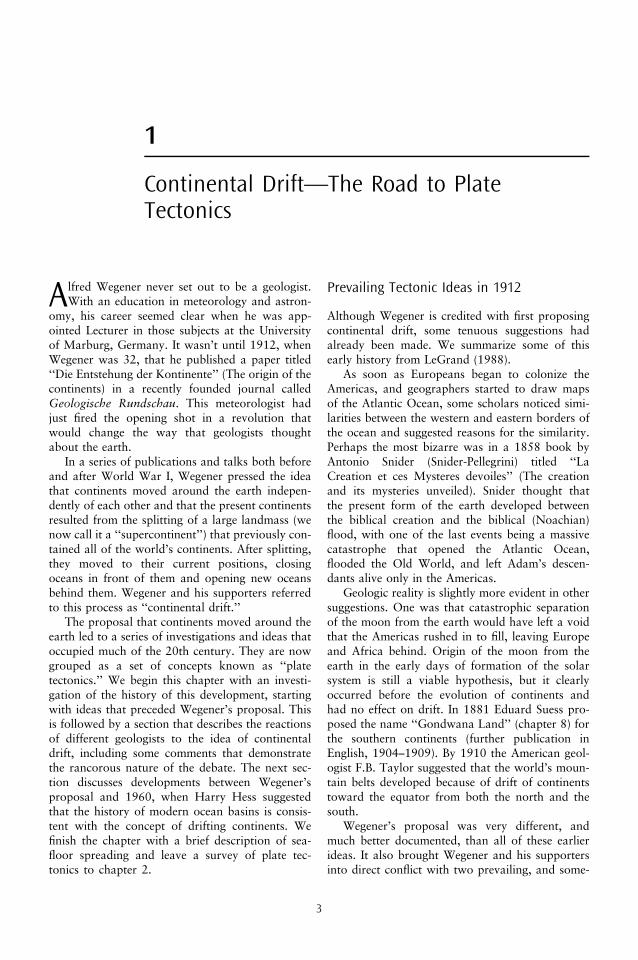
Pratt suggested that the mass equivalence ofmountains and plains could be explained by assum-ing that areas with different elevations all extendedupward from a flat level in the subsurface, withhigher elevations underlain by rocks of lowerdensity than those in lower elevations (fig. 1.1).An alternative model proposed by G.B. Airy, theAstronomer Royal of the United Kingdom, sug-gested that mass equivalence could also beexplained if most continental rocks had the samedensity and those in higher elevations extendedfarther down into the earth than those at lowerelevations.
Ultimately mass equivalence became known asthe ‘‘principle of isostasy’’ (fig. 1.2). The principlebroadly states that most areas of the earth’s surfaceare underlain by equal masses of rock, with eleva-tion difference caused either by variation in densityfrom one part of the earth to another or variation inthicknesses of rocks of equal density. For theHimalayas and other mountain belts, the acceptedexplanation soon became that all mountain rangesare high because of their roots (an Airy model). Thedifference between the elevations of continents andoceans is now known to be the result of both the
4 Continents and Supercontinents
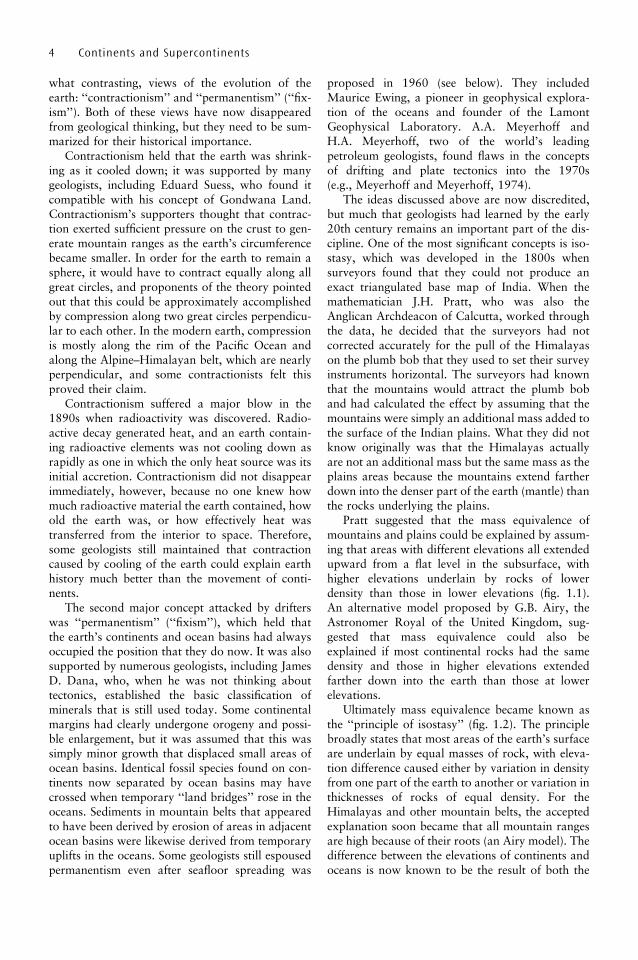
higher density and the lesser thickness of oceaniccrust (a combined Airy and Pratt model). The baseof the crust is now referred to as the Moho, whichwe discuss below and in chapter 3.
Isostasy not only requires variations in densityand thickness of rocks but also implies that surfacerocks are ‘‘floating’’ on denser material within theearth. (A simple demonstration of this is to notethat large ice cubes float higher above water thansmaller ones but also displace more water byextending farther below the surface.) A furtherinference is that surface rocks can float only ifthere is some region in the earth’s interior that ismobile enough to be displaced both vertically andlaterally. This evidence of mobility was extremelyimportant to people who believed in continentaldrift because any large-scale movements along theearth’s surface would be impossible if the interior ofthe earth is completely rigid.
The Controversy about Wegener’sProposal of Continental Drift
The proposal of continental drift brought immedi-ate reactions both pro and con. Most geologists in
the United States were opposed, while those inEurope and other parts of the world were moreinclined to support the idea. We use this sectionto summarize a few of the principal arguments andrefer readers who want a more complete survey tobooks by Marvin (1973), LeGrand (1988), andOreskes (1999).
The concept of drift was supported by a consid-erable body of evidence. The easiest to recognize isthe fit of North and South America to Europe andAfrica around the Atlantic Ocean. Further supportcame from the concept of Gondwana, which origi-nated when paleontologists realized that Paleozoicand Early Mesozoic fossils in South America,Africa, India, and Australia were all very similaralthough the continents are now separated by largeocean basins. Various explanations had been pro-posed for this similarity, but after continental driftwas proposed it became clear that the simplestexplanation for Gondwana was that the southerncontinents had once been joined together in a‘‘supercontinent’’ and later drifted apart.
Once the opening of the Atlantic was proposed,it was possible to add Eurasia and North Americato Gondwana and place all continental masses intoone supercontinent called ‘‘Pangea’’ (chapter 8).The proposed configuration of Pangea (fig. 1.3)was supported not only by the fit of continentsbut also by more geological information. Pale-ontologists soon confirmed that animals thatlived before Pangea rifted are similar not only inthe Gondwana continents but also among mostof the world’s modern continents. Animals thatevolved after rifting, however, are quite distinctfrom one modern continent to another. In similarfashion, mountain (orogenic) belts such as theAppalachians and Caledonides that were olderthan the time of drift could be correlated from
Continental Drift—The Road to Plate Tectonics 5
Figure 1.1. Comparison of Pratt and Airy modelsof isostasy.
Figure 1.2. Cross section of mountains, continen-tal plains, continental shelf, and ocean basin.Values in italics are typical densities in g/cc. Thedifferent depths to the Moho and the higherdensity of the thin oceanic crust than the thickercontinental crust maintain isostatic balancethroughout the section.

one modern continent to another, but youngerones could not.
People opposed to continental drift found nomerit in these arguments. Before we discuss someof the general objections we set the tone of thedebate with quotes from publications of three ofthe leading geologists in the United States (in theinterest of civility we omit several others):
Can we call geology a science when there existssuch difference of opinion on fundamental mat-ters as to make it possible for such a theory asthis to run wild?
R.T. Chamberlain (1928)
[Wegener’s method] is not scientific, but takesthe familiar course of an initial idea, a selectivesearch through the literature for corroborativeevidence, ignoring most of the facts that areopposed to the idea, and ending in a state ofauto-intoxication.
E.W. Berry (1928)
the theory of continental drift is a fairy tale . . .
B. Willis (1944)
Many of the contrary arguments expressed inthese and other papers were based on detail. Driftcouldn’t explain the location of some particularmountain range, the distribution of some fossilgenus, the inferred climate of deposition of somedeposits. The reply of Wegener and his supporterswas that a sweeping new theory couldn’t possiblyinclude all observations that might ultimately proveto be exceptions to the concept. They also suggestedthat people who were concerned about these detailswere so interested in a few ‘‘trees’’ that they couldnot see the ‘‘forest’’ of geologic thought.
That reply led to more problems. People accusedthe ‘‘drifters’’ of getting an idea and then lookingaround for evidence to support it (a ‘‘deductive’’approach to science). Science, so some peopleargued, is an ‘‘inductive’’ discipline, where grandtheories are slowly established by the process ofaccumulating facts until the conclusion is obviousto everyone.
One attack on continental drift was by peoplewho were concerned by the lack of mechanism bywhich the continents moved or a force to movethem. Before information about the low-velocityzone and other mantle structures became available(see below), geologists assumed that continentaldrift meant continents moving across the top ofthe mantle, where no zone of weakness or mobilitywas apparent. It also meant that continents wouldhave to plow into oceanic floor, either shoving itaside or somehow destroying it. Either mechanismrequired a very powerful force, and some peoplewould not accept its existence although Joly (1925),Holmes (1928), and other geologists pointed outvery early in the debate that the convection currentsalready presumed to exist in the mantle could movecontinents.
This debate illustrates a problem that earthscientists face all the time. The earth is large. Ithas a long and complicated history that no onewas around to observe. Much of the evidence ofpast events has been destroyed by younger ones.With these difficulties, it becomes impossible todraw conclusions that can be ‘‘proved,’’ andgeologists are left with the necessity of doing ‘‘thebest they can’’ with the limited informationavailable to them.
Proponents of continental drift, therefore,resorted to the argument that the preponderanceof evidence showed that drift had occurred, evenif they were not able to provide all of the details.Furthermore, they said, if the evidence showed that
6 Continents and Supercontinents
Figure 1.3. Configuration of Pangea.

the continents moved, then they did, even if theforce to move them was unknown. It would benice to figure out what the mechanism and forcewere, but their inability to do so did not mean thatthe continents hadn’t moved.
As information about the earth accumulatedduring the 50 years after Wegener’s first publica-tions, the evidence for continental drift becamestronger (see next section). Recognition that themobile asthenosphere was overlain by a rigid litho-sphere that contained both upper mantle and crustshowed that continental drift probably meant driftof the lithosphere. More information about oceanbasins showed that land bridges and other uplifts ofoceanic lithosphere were impossible. Paleomagneticinformation demonstrated the necessity of differentcontinents moving separately. Recognition that themantle must undergo convection showed thatpowerful forces for lateral movement existed inthe upper mantle.
Even as recently as the 1970s, however, someearth scientists, particularly in the United States, didnot accept the concept of continental drift (seeabove). This opposition began to disappear quicklyafter seafloor spreading was recognized and hadalmost completely vanished by the 1980s. In thenext two sections we discuss the amount of in-formation that had accumulated for geologists touse in 1960 and then the proposal of seafloorspreading.
Information Available in 1960
Information available to earth scientists in the early1900s rapidly expanded by the continuation oftraditional geologic studies and also by the devel-opment of new techniques for studying the earth.One of the most productive was interpretation ofseismic waves that had passed through the earth’sinterior (appendix A). The first advance came in aseries of papers in the early 1900s, when A. and S.Mohorovicic used seismological data to measurethe depth of the crust and the differences betweencrust and mantle (figs. 1.2, 1.4). They found thatthe basic distinction between crust and mantle is arapid increase in the velocities of seismic wavesdownward across a ‘‘discontinuity’’ at the base ofthe crust. Velocities of P waves are in the range6.5–7 km/sec in the lower part of the continentalcrust and are about 8 km/sec in the mantle justbelow the discontinuity. The depth to the discon-tinuity in continents varies from about 30 to 40km in most regions but is commonly greater than
50 km under mountain belts. In ocean basins thediscontinuity is much shallower, commonly about10 km, with a change of P-wave velocities fromabout 7 km/sec in the crust to 8 km/sec just belowthe discontinuity.
This ‘‘Mohorovicic discontinuity,’’ which wefortunately shorten to the ‘‘Moho,’’ firmly estab-lished the distinction between crust and mantle andclarified numerous relationships that had only beenvaguely known in the past. It verified the presenceof mountain roots and the relative thinness of ocea-nic crust, both of which had been surmised from theconcept of isostasy. When it was demonstrated thatP-wave velocities are roughly proportional to rockdensity, the higher density of oceanic crust than thatof the upper part of continental crust could also beconfirmed. It also became possible to demonstratethat material with the seismic velocities of continen-tal crust extended outward from the shoreline toapproximately the edge of continental shelves,requiring that the pre-drift fit of continents be deter-mined at shelf edges rather than the continentalmargins seen on ordinary geographic maps.
In the early 1900s seismic studies were beginningto outline the deep interior of the earth. The exis-tence of a heavy region somewhere within the earthwas already known from gravity studies, whichrevealed that the earth had an average specific grav-ity of 5.5. Because the specific gravities of almost allsurface rocks are less than 3, this meant that somepart of the earth’s interior had specific gravitiesmuch higher than 5.5, and most earth scientistshad concluded that this was probably caused by a‘‘core’’ of iron and nickel. The question was exactlywhere this region is.
Beno Gutenberg and his colleagues began work-ing on this problem in the early 1900s, but it wasn’tuntil 1934 to 1936 that a series of papers providedthe first definitive information (Gutenberg andRichter, 1934–1936). The basic observation wasthat arrival time of P waves at different distancesfrom the location (focus) of an earthquake increasesprogressively up to a distance of 103.58 from theearthquake and then jumps to a much longer timebeyond that distance (see appendix A for a morecomplete explanation). This established that a dis-continuity (‘‘Gutenberg discontinuity’’) at a depthof 2900 km separated a core with lower P-wavevelocities from an overlying mantle with highervelocities (fig. 1.4). This decrease in velocities intodenser material also indicated that at least the outerpart of the core is liquid.
Further seismic investigations of the mantle soonrevealed more structural details. The one mostclearly related to continental drift is the presence
Continental Drift—The Road to Plate Tectonics 7

of a ‘‘low-velocity zone’’ (LVZ) where velocityeither decreases slightly downward or, at least,does not increase as rapidly as it does above orbelow the LVZ (fig. 1.4). This lower velocity mayindicate the presence of a partial liquid or simply anincreased plasticity, but either interpretation leadsto a designation of a mantle with a mobile astheno-sphere overlain by a rigid lithosphere consisting ofboth upper mantle and crust. The LVZ occurs atdepths of about 150–200 km in ocean basins, and azone of mobility presumably also exists under con-tinents, although its depth and nature are still con-troversial. Regardless of its exact nature, however,the presence of an LVZ strengthens the idea thatrigid lithosphere is underlain by a zone mobileenough to permit lithospheric movement.
Other seismic discontinuities in the mantle werefound to occur at depths of about 410 km and 660km, where there are small and abrupt increases in P-wave velocity downward (fig. 1.4). At first, theymay not seem to be closely related to continentaldrift, but recently it has been proposed that the 660-km discontinuity is a zone along which subductedlithosphere accumulates, and its episodic collapseinto the lower mantle is related to superplumes.Because both of these processes may be associatedwith the formation of supercontinents, we return tothis issue in chapter 6.
Seismic studies of the earth yielded informationon not only its internal structure but also an increas-ingly accurate view of the locations of earthquakes.More information on the surface locations (epicen-ters) of earthquakes steadily reinforced the idea thatlarge, roughly equidimensional, areas of the earth’scrust are stable, and deformation occurs only inlinear belts between these stable blocks. Whereasthis had been known for continents since the begin-ning of the 20th century, the new informationexpanded the concept of stability and linear mobilebelts to the ocean basins. These areas were laterreferred to as plates and plate margins (chapter 2).
Information on the depths of earthquakes led toan unexpected result first described by K. Wadati in1929 (see Wadati, 1940). He showed that someseismically active areas contain earthquakes thatextend from the surface to depths of several hun-dred kilometers along a plane that dips from theocean margin under a continental margin or islandarc. The idea was expanded by Hugo Benioff in1954, who demonstrated that the dips of theseplanes vary from margin to margin. These zoneshave commonly been referred to as ‘‘Benioff zones,’’although more accurately they should be ‘‘Wadati–Benioff zones.’’ After the terminology of plate tec-tonics was refined, they have been known as ‘‘sub-duction zones’’ (chapter 2).
8 Continents and Supercontinents
Figure 1.4. Cross section of earth from crust to core.

The identification of the earth’s major layers andtheir properties was combined with newly emerginginformation about the earth’s heat budget to iden-tify another major earth process—mantle con-vection currents (appendix B). Geologists havealways known that the interior of the earth is hot,partly because temperatures in deep mines are highand also because there needs to be a heat source tomelt the lavas erupted by volcanoes. Before thediscovery of radioactivity in the 1890s, however,geologists had assumed that the internal heat of theearth was merely a remnant of the heat generatedwhen the earth accumulated. This implied that theearth was rapidly cooling down and could not bevery old if the interior was still hot.
The presence of radioactive elements in theearth, however, meant that the earth had a contin-ual heat source and was cooling down much moreslowly than previously thought (the rate of coolingis highly controversial and well beyond the scope ofthis book). Realization that the earth’s interior isvery hot led to early proposals of convection cur-rents (see above), and more evidence gave addi-tional credibility to this idea. As soon as seismicinformation confirmed that the mantle consistsmostly of material with the composition of olivine,as petrologists had long presumed, it was easy tocalculate the maximum temperature gradient themantle could have without becoming unstable andundergoing convection (the thermodynamic reasonfor this instability is discussed in appendix B).Calculations yield some uncertainty because theproperties of the deep mantle are not well known,but the equilibrium gradient cannot be higher than0.38C/km and may be as low as 0.18C/km.
A gradient of 0.38C/km for a mantle 2900 kmthick means that the base of the mantle could beonly ~9008C hotter than the top in order to remainstable. Studies of metamorphic rocks and inclusionsin lavas had already shown petrologists that thebase of the continental crust had a temperature onthe order of several hundred degrees, for a tempera-ture gradient of a few tens of degrees per kilometer.And if the top of the mantle has a temperature of afew hundred degrees, then the bottom of the mantlecould be only slightly hotter than about 10008C.
For several reasons this temperature is impossi-ble. The outer part of the core could not be liquid atthis temperature. Volcanoes erupting lavas at tem-peratures of 10008C and higher could not originateat the bottom of the mantle. Even a small amount ofradioactive material in the mantle would generatehigher temperatures. Estimates of actual tempera-ture gradients in the mantle were on the order of18C/km, yielding temperatures at the base of the
mantle of several thousand degrees (consistent withmodern estimates).
These temperature estimates indicate that themantle could be stable only if it is rigid and unableto flow and/or if its composition varies so muchwith depth that the equilibrium gradient is muchhigher than has been calculated. Both conditionsseemed unlikely, and geologists concluded that themantle is unstable and is continually undergoingconvective overturn (discussion of work by Jolyand Holmes in preceding section). When this wasfirst realized, the next problem was locating theconvection currents. Placing the upwelling limbsat mid-ocean ridges was relatively easy. Mountainbelts might be places where two colliding currentsgenerated the horizontal compression that causedorogeny. But where are the downgoing limbs of theconvective cells? They could be confidently locatedunder Wadati–Benioff zones where those zonesexist, but many ridges, such as the mid-Atlanticridge, are in oceans whose margins show no defor-mation. In these areas, the location of the down-going limbs was unclear. This problem is stillunsolved, and most geologists simply assume thatdowngoing limbs are somewhere under continentsor their margins, although firm evidence is lacking.
About the middle of the 20th century, geologistsdiscovered that rocks containing significant concen-trations of iron might be used to show the positionof the magnetic poles at the time the rocks formed(appendix C). Combined with the ages of the rocks,these magnetically determined pole positionsyielded results that were originally very hard toexplain because the magnetic orientations in therocks usually did not point to the present magneticpoles.
The first conclusion was that the magnetic polesmust have moved since the rocks formed, a processcalled ‘‘polar wandering’’ (‘‘true polar wandering’’).One explanation was that the magnetic axis of theearth is independent of the rotational axis, and it isonly an accident that the present magnetic poles arenear the geographic poles. This possibility wasquickly rejected when earth scientists realized thatthe magnetic field is almost certainly generated byrotation of the earth’s core, and although there iscontinual movement of the field, it is unlikely everto have produced magnetic poles far from the geo-graphic ones.
A better explanation became clear when paleo-magneticists working in different continents founddifferent pole positions for rocks of the same age.The only explanations for this observation wereeither that the earth’s magnetic field was not adipole, which seemed impossible, or that the rocks
Continental Drift—The Road to Plate Tectonics 9

had moved since their magnetic orientations wereimposed on them. This led to the realization thatthe magnetic orientations measured in rocks do notshow the real magnetic poles but only ‘‘apparent’’ones, and ‘‘polar wandering curves’’ were thencalled ‘‘apparent polar wandering curves’’ (APWcurves; further explanation in Appendix C).
One of the earliest observations by S.K. Runcornin 1956 showed that APW curves for NorthAmerica and Europe during the Mesozoic andCenozoic started about 5000 km apart and gradu-ally approached the present North Pole as the mea-sured rocks became younger (fig. 1.5). Because theNorth Atlantic Ocean is about 5000 km wide, thebest explanation for these curves was that the twocontinents were joined early in the Mesozoic, whenthe ocean started to open, and continually movedfarther apart since then. This movement caused allapparent poles older than Early Mesozoic to bedisplaced by 5000 km, whereas younger apparentpoles were displaced only by the amount of openingsince the age that they represent.
Seafloor Spreading Proposed in 1960
In 1959 Harry Hess began to talk about a new ideafor the evolution of ocean basins. He described it ina research report submitted that same year, andthen Robert Dietz amplified the idea in a paperpublished in 1961. In 1962 Hess published one ofthe most famous papers in the history of the earthsciences. The title was ‘‘History of ocean basins,’’and Hess referred to it as ‘‘an essay in geopoetry’’because, although his idea answered many ques-tions then bothering geologists, at that time therewas no specific proof that seafloor spreading reallyoccurred.
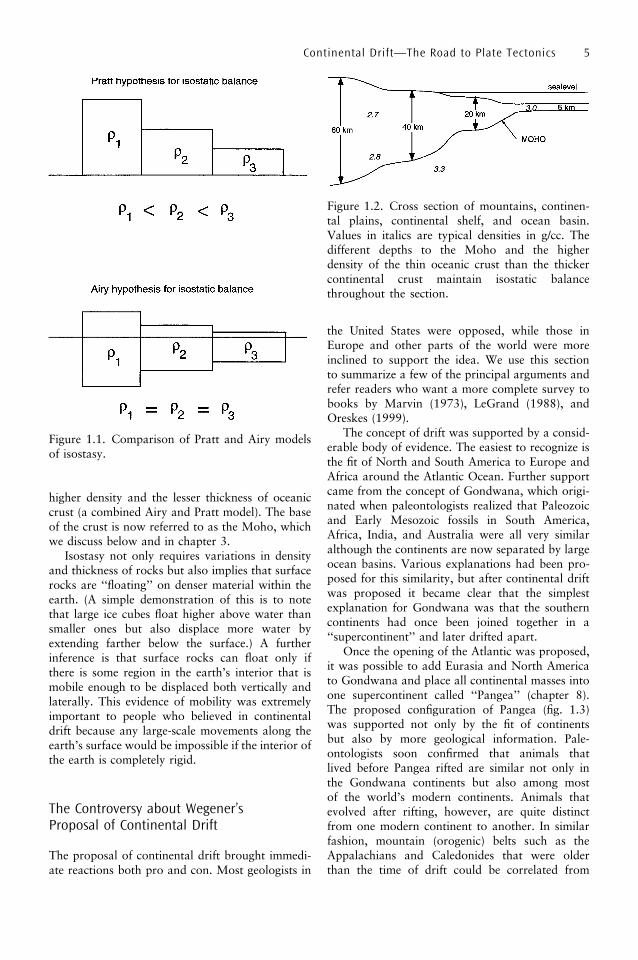
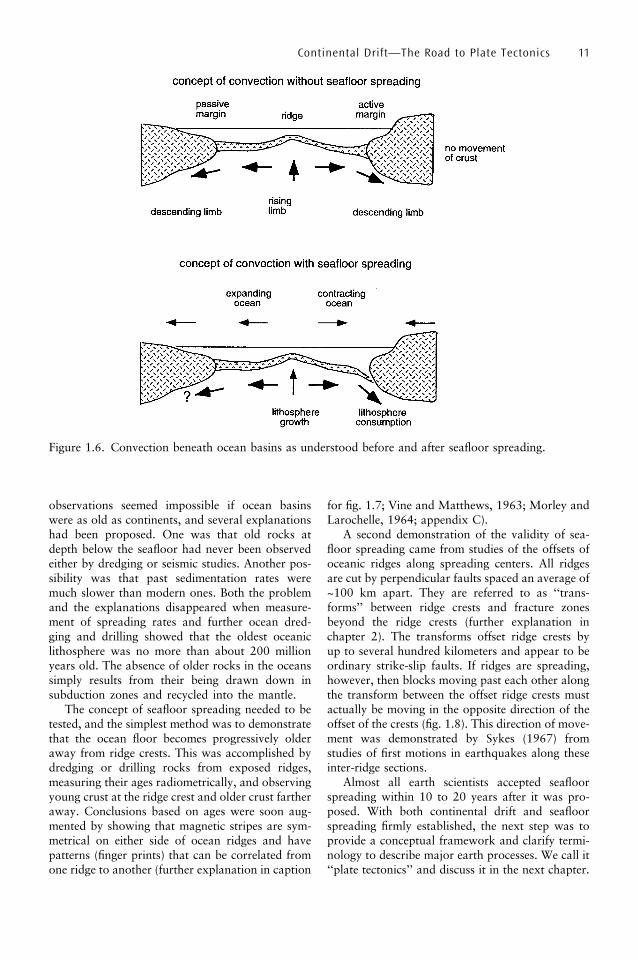
The concept of seafloor spreading required afundamental change in the way that earth scientistsregarded the earth (fig. 1.6; Dietz, 1961). Mid-ocean ridges had been considered merely to be theplaces where convection currents rose and thenmoved away beneath immobile ocean crust. Thenew idea stated that ridges are not just the sites ofrising limbs of convection currents but are also theplace where new oceanic lithosphere is created. Thisnew lithosphere then moves progressively outwardto make room for younger material, thus continu-ally enlarging ocean basins. Ocean basins thatexpand in this way are places where continentsdrift away from each other.
In an earth with a constant radius, oceanic litho-sphere must be destroyed at the same rate at which
it forms. The only way for this to happen is forlithosphere to reenter the mantle, and the obviousplace for this to occur is the Wadati–Benioff zones(soon named ‘‘subduction’’ zones) that dip down-ward to depths of several hundred kilometers.Seafloor spreading requires these zones to be placesnot just of minor fault slippage but places wherelarge volumes of lithosphere descend to the depth ofthe deepest earthquakes or possibly beyond.
Simultaneous construction and destruction ofoceanic lithosphere meant that some oceans, orportions of them, are expanding while other oceansare becoming smaller. The Atlantic Ocean is almostentirely an opening ocean because the only subduc-tion zone is along the Lesser Antilles, whereas thePacific Ocean is completely surrounded by subduc-tion zones and is contracting. Geologists had longknown that ‘‘Atlantic-type’’ margins without earth-quakes were very different from ‘‘Pacific-type’’ mar-gins, with earthquakes and volcanism, but thereason for this difference was not clear until sea-floor spreading was understood.
Creation and destruction of oceanic lithosphereexplained another problem that had bothered geol-ogists. Early exploration of the oceans hadretrieved some rocks from the ocean floor, butnone of them geologically very old. Furthermore,early seismic measurements of the thickness ofoceanic sediments had shown that the sedimentload of rivers draining continents could easily fillthe basins in a few tens of millions of years. These
10 Continents and Supercontinents
Figure 1.5. Apparent polar wandering (APW)curves for North America and Europe for the past500 million years. Cambrian pole positions for bothcontinents are in the Pacific Ocean. The curvesbecome closer toward the present and meet at thecurrent North Pole. For more detailed informationsee Runcorn (1956, 1962).
observations seemed impossible if ocean basinswere as old as continents, and several explanationshad been proposed. One was that old rocks atdepth below the seafloor had never been observedeither by dredging or seismic studies. Another pos-sibility was that past sedimentation rates weremuch slower than modern ones. Both the problemand the explanations disappeared when measure-ment of spreading rates and further ocean dred-ging and drilling showed that the oldest oceaniclithosphere was no more than about 200 millionyears old. The absence of older rocks in the oceanssimply results from their being drawn down insubduction zones and recycled into the mantle.
The concept of seafloor spreading needed to betested, and the simplest method was to demonstratethat the ocean floor becomes progressively olderaway from ridge crests. This was accomplished bydredging or drilling rocks from exposed ridges,measuring their ages radiometrically, and observingyoung crust at the ridge crest and older crust fartheraway. Conclusions based on ages were soon aug-mented by showing that magnetic stripes are sym-metrical on either side of ocean ridges and havepatterns (finger prints) that can be correlated fromone ridge to another (further explanation in caption
for fig. 1.7; Vine and Matthews, 1963; Morley andLarochelle, 1964; appendix C).
A second demonstration of the validity of sea-floor spreading came from studies of the offsets ofoceanic ridges along spreading centers. All ridgesare cut by perpendicular faults spaced an average of~100 km apart. They are referred to as ‘‘trans-forms’’ between ridge crests and fracture zonesbeyond the ridge crests (further explanation inchapter 2). The transforms offset ridge crests byup to several hundred kilometers and appear to beordinary strike-slip faults. If ridges are spreading,however, then blocks moving past each other alongthe transform between the offset ridge crests mustactually be moving in the opposite direction of theoffset of the crests (fig. 1.8). This direction of move-ment was demonstrated by Sykes (1967) fromstudies of first motions in earthquakes along theseinter-ridge sections.
Almost all earth scientists accepted seafloorspreading within 10 to 20 years after it was pro-posed. With both continental drift and seafloorspreading firmly established, the next step was toprovide a conceptual framework and clarify termi-nology to describe major earth processes. We call it‘‘plate tectonics’’ and discuss it in the next chapter.
Continental Drift—The Road to Plate Tectonics 11
Figure 1.6. Convection beneath ocean basins as understood before and after seafloor spreading.
Summary—The Problem of New Ideas
In less than one century, continental drift, seafloorspreading, and the broad concepts of plate tectonicshave come to dominate the thinking of geologists inplace of the old ideas of contractionism and perma-nentism. Progress toward this understanding hasbeen slow, partly because new factual informationwas needed to support new ideas and partlybecause of the inherent difficulty of introducing
new ideas to an established profession. Some scho-lars are understandably cautious because many newideas have evaporated under scrutiny by someoneother than the original author. Other scholars,however, resist new ideas because their egos aretied to old ones, and they do not want to see alifetime of research proven wrong. Regardless of thereasons, all of the argumentation pro and con isusually good for the profession because it strength-ens the ultimate product of research.
12 Continents and Supercontinents
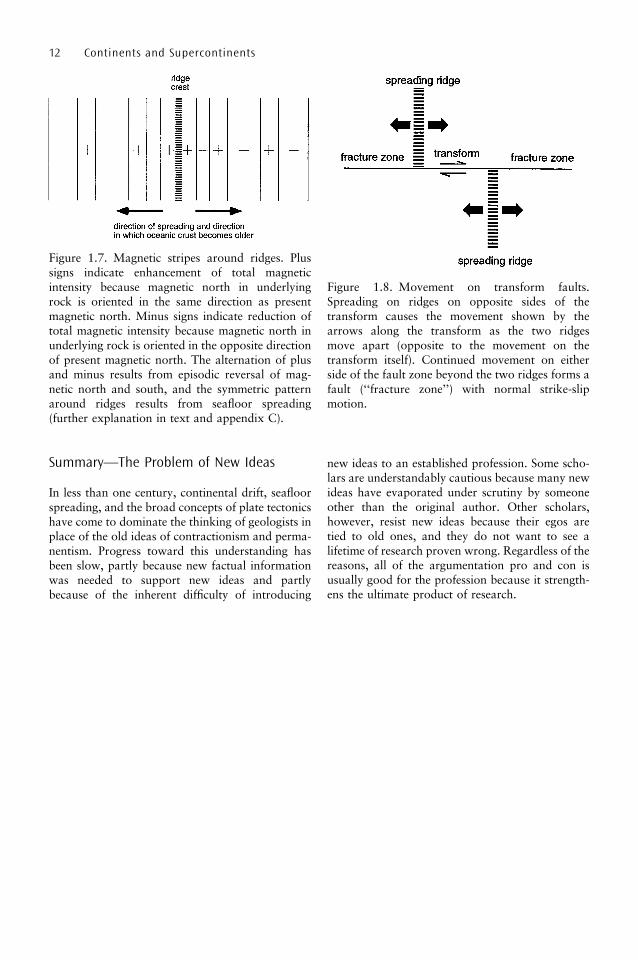
Figure 1.7. Magnetic stripes around ridges. Plussigns indicate enhancement of total magneticintensity because magnetic north in underlyingrock is oriented in the same direction as presentmagnetic north. Minus signs indicate reduction oftotal magnetic intensity because magnetic north inunderlying rock is oriented in the opposite directionof present magnetic north. The alternation of plusand minus results from episodic reversal of mag-netic north and south, and the symmetric patternaround ridges results from seafloor spreading(further explanation in text and appendix C).
Figure 1.8. Movement on transform faults.Spreading on ridges on opposite sides of thetransform causes the movement shown by thearrows along the transform as the two ridgesmove apart (opposite to the movement on thetransform itself). Continued movement on eitherside of the fault zone beyond the two ridges forms afault (‘‘fracture zone’’) with normal strike-slipmotion.
2
Plate Tectonics Now and in the Past
The concepts known as plate tectonics that beganto develop in the 1960s built on a foundation of
information that included:
� The earth’s mantle is rigid enough to trans-mit seismic P and S waves, but it is mobileto long-term stresses.
� The earth’s temperature gradient is so highthat convective overturn must occur in themantle.
� The top of the mobile part of the mantle is azone of relatively low velocity at depths ofabout 100 to 200 km. This zone separatesan underlying asthenosphere from a rigidlithosphere, which includes rigid upper man-tle and crust.
� Seismic activity, commonly accompanied byvolcanism, occurs along narrow, relativelylinear, zones in oceans and along some conti-nental margins.
� The zones of instability surround large areasof comparative stability.
� Ocean lithosphere is continually generatedalong mid-ocean ridges and destroyed whereit descends under the margins of continentsand island arcs. This causes oceans tobecome larger, but shrinkage of oceans canoccur where lithosphere is destroyed aroundocean margins faster than it is formed withinthe basin.
� Some of the belts of instability are faultswith lateral offsets of hundreds of kilo-meters.
� Some continental margins are unstable(Pacific type), but others are attached tooceanic lithosphere without any apparenttectonic contact (Atlantic type).
� Different areas containing continents andattached oceanic lithosphere move aroundthe earth independently of each other.
Most of this chapter consists of a summary ofplate tectonics in the present earth, including pro-
cesses along plate margins and the types of rocksformed there (readers who want more detailedinformation are referred to Rogers, 1993a;Kearey, 1996; and Condie, 1999). We also brieflydiscuss plumes and then finish with a word of cau-tion about interpreting the history of the ancientand hotter earth with the principles of modern platetectonics.
Plates and Plate Margins
Starting from the body of continually expandinginformation summarized above, numerous earthscientists in the 1960s and 1970s began to establisha conceptual framework that would organize scien-tific thinking about the earth’s tectonic processes.This required a new terminology, and it arrivedrapidly (Oreskes, 2002). Geologists decided to callthe stable areas ‘‘plates’’ and the unstable zonesaround them ‘‘plate margins.’’ Thus, the conceptbecame known as ‘‘plate tectonics.’’
Plates are essentially broad regions of litho-sphere, although the failure to detect low-velocityzones under many continents leaves unresolvedquestions. Because lithosphere is known to be rela-tively cool and rigid, geologists realized that it wascapable of transmitting stresses over long distanceswithout internal deformation. This presumablyexplains the restriction of tectonic activity to themargins of plates.
Two terms became widely used for the twodifferent types of continental margins. Atlantic-type margins were referred to as ‘‘passive,’’ withthe continental margin consisting of thin continen-tal crust formed during continental rifting andjoined to the oldest seafloor in the adjacent ocean.Pacific-type margins became known as ‘‘active’’margins because of their tectonic activity. The joinbetween continental and oceanic lithosphere inactive margins is almost everywhere a trenchwhere oceanic lithosphere is drawn downwardinto the mantle.
13

With this distinction established, most plates thatcontain continents also contain some oceanic litho-sphere attached to a passive margin. For example,the South American plate extends west from themid-Atlantic ridge to the active margin with the PacificOcean, thus including both continent and the wes-tern South Atlantic Ocean. The Pacific plate, how-ever, includes much of the Pacific Ocean and consistssolely of oceanic lithosphere. Figure 2.1 shows thepresent distribution of plates on the earth’s surface.
Plate margins are classified into three types.Accreting (rifting) margins include mid-oceanspreading centers and areas of rifting within con-tinental areas, each of which is discussed separatelybelow. Destructive (subducting) margins also occurin two different situations, and we include separatesections for subduction that forms island arcswithin ocean basins and subduction along continen-tal margins. The third type of margin is transform(strike-slip) and includes most of the world’s longestfaults. We conclude this section with a very impor-tant feature where three margins intersect to form a‘‘triple junction.’’
Accreting Margins
‘‘Accreting’’ margins occur along mid-ocean ridges,where new oceanic lithosphere is formed. ‘‘Rifted’’
margins, where two plates separate, are primarilyoceanic spreading ridges, and whether zones ofrifting within continents, such as the East Africanrift system, should be considered plate margins issimply a matter of definition.
The top of all mid-ocean ridges is at a depth of~2.5 km (fig. 2.2). This is the isostatically balancedelevation of exposed asthenosphere as new litho-sphere forms and starts to move away from theridge crest. As this movement continues awayfrom the source of heat at the ridge crest, rocksbecome progressively cooler and the elevation ofthe ocean floor decreases to the ~5-km depth ofabyssal plains (fig. 2.2). This decrease in elevation
14 Continents and Supercontinents
Figure 2.1. Major plates on the present earth. The North American plate extends into eastern Asia and isseparated from the Eurasian plate by a boundary through the Arctic Ocean (chapter 9). Abbreviations are:GJF, Gorda and Juan de Fuca; CA, Caribbean; CO, Cocos; SC, Scotia; SS, South Sandwich; PH,Philippines.
Figure 2.2. Features of spreading centers.

is almost entirely the result of cooling, which causesasthenosphere with a relatively low density to con-vert to lithosphere with higher densities, leading toa general ‘‘shrinkage’’ of the rock column.
Because cooling causes the elevation of ridges tobe proportional to age of the lithosphere, ridgeswith different spreading rates have different topo-graphic profiles. Fast spreading centers such as theEast Pacific Rise, with spreading rates of ~7 mm/yron each side of the ridge (‘‘half spreading rates’’)remain at high elevations for hundreds of kilo-meters beyond the crest, but ridges with low spread-ing rates, such as the mid-Atlantic ridge with a halfrate of ~1 mm/yr, show rapid decreases in elevationaway from the ridge crest and have sharp topo-graphic profiles. Ridges with slow spreading ratesalso have a better defined valley at the top of theridge, where the valley is surrounded by rift‘‘shoulders’’ uplifted as the new lithosphere pullsaway from the ridge crest (fig. 2.3).
The transform faults that separate segments ofridge crests (chapter 1; fig. 1.8) extend beyond thecrests as fracture zones that cause strike-slip offsetsbetween sections of the ridges. Differences in agesbetween rocks on either side of the fracture zonescause elevation differences that may be as high asone kilometer on very large fractures. All of theknown fracture zones are perpendicular to theridge crests, which distinguishes them from the
faults that offset segments of linear rift systemswithin continents (see below).
The types of rocks that form along ridge crestsare very similar to those exposed in suites of rockscalled ‘‘ophiolites’’ where they have been emplacedon land by tectonic processes. We discuss themhere, starting with the history of their recognitionand also pointing out that the exact relationshipbetween exposed ophiolites and mid-ocean ridges iscontroversial.
Ophiolites One of the most influential papers inthe history of geology was published by G. Stein-mann in the Proceedings of the 14th InternationalGeological Congress in Madrid (1927). Althoughhe had discussed ophiolites and deep-sea sedi-ments for more than 20 years, his 1927 paper wasthe first one to convince geologists of the tectonicsignificance of a sequence of rocks that came tobe known as the ‘‘Steinmann trinity.’’
The ophiolites studied by Steinmann are in theAlps, and they became a standard for recognitionof ophiolites worldwide. A complete ophiolite ofthis type consists of a basal peridotite (harzbur-gite), a series of gabbroic rocks and overlyingbasalts/spilites that are commonly pillowed, anda top suite of various seafloor sediments, includingred clays and cherts (fig. 2.4). In many places, the
Plate Tectonics Now and in the Past 15
Figure 2.3. Extension of the Reykjanes spreading center from the North Atlantic into Iceland, where itforms a valley. The photograph is taken from the western shoulder of the ridge, where some of the basalthas pulled away from the shoulder and fallen down into the valley toward the right (photo by J.J.W.R.).
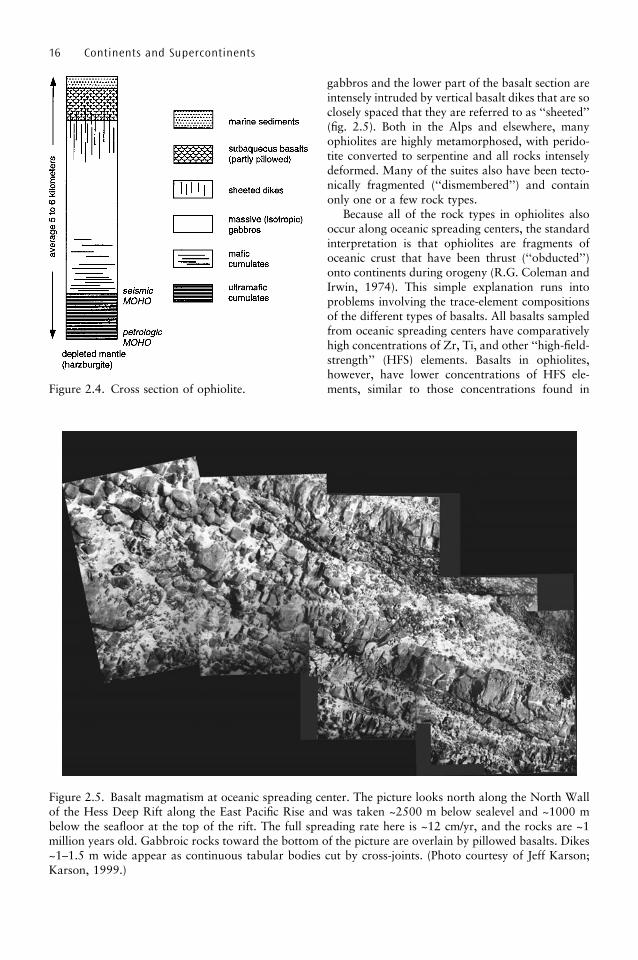
gabbros and the lower part of the basalt section areintensely intruded by vertical basalt dikes that are soclosely spaced that they are referred to as ‘‘sheeted’’(fig. 2.5). Both in the Alps and elsewhere, manyophiolites are highly metamorphosed, with perido-tite converted to serpentine and all rocks intenselydeformed. Many of the suites also have been tecto-nically fragmented (‘‘dismembered’’) and containonly one or a few rock types.
Because all of the rock types in ophiolites alsooccur along oceanic spreading centers, the standardinterpretation is that ophiolites are fragments ofoceanic crust that have been thrust (‘‘obducted’’)onto continents during orogeny (R.G. Coleman andIrwin, 1974). This simple explanation runs intoproblems involving the trace-element compositionsof the different types of basalts. All basalts sampledfrom oceanic spreading centers have comparativelyhigh concentrations of Zr, Ti, and other ‘‘high-field-strength’’ (HFS) elements. Basalts in ophiolites,however, have lower concentrations of HFS ele-ments, similar to those concentrations found in
16 Continents and Supercontinents
Figure 2.4. Cross section of ophiolite.
Figure 2.5. Basalt magmatism at oceanic spreading center. The picture looks north along the North Wallof the Hess Deep Rift along the East Pacific Rise and was taken ~2500 m below sealevel and ~1000 mbelow the seafloor at the top of the rift. The full spreading rate here is ~12 cm/yr, and the rocks are ~1million years old. Gabbroic rocks toward the bottom of the picture are overlain by pillowed basalts. Dikes~1–1.5 m wide appear as continuous tabular bodies cut by cross-joints. (Photo courtesy of Jeff Karson;Karson, 1999.)

subduction-zone basalts. The problem of ophioliteswith rock types clearly formed along spreadingcenters and basalts with the compositions of rocksformed in subduction zones has been referred to asthe ‘‘ophiolite conundrum’’ (Moores et al., 2000).Moores et al. explain this problem by pointing outthat some spreading centers, particularly those thatwere probably the source of ophiolites in the Alpsand other Tethyan orogenic belts (chapter 10), mayhave evolved in oceanic crust that had recently beeninvolved in subduction along older continental mar-gins and was already depleted in HFS elementswhen spreading centers were established.
Intracontinental Rifts
Rifts within continents can be subdivided into threebasic types. One is a single rift valley or a series ofrift valleys oriented to form a linear rift system, anda second is a broad basin consisting of multiplerifts. The third type of intracontinental rift nowoccurs as passive margins, and their evolutionfrom the other types of continental rifts is unclear.
Until the past few decades it was assumed thatlinear systems of rifts were simple grabens droppeddown between two blocks that now form riftshoulders similar to those on oceanic spreadingcenters (fig. 2.3). Recent work, however, demon-strates that the linear systems consist of a series ofindividual rifts that are highly asymmetrical (theyhave a ‘‘polarity’’), with one side uplifted to form afault-bounded shoulder and the other side pulledaway to form the rift basin (fig. 2.6). The individualrifts commonly alternate polarity along the rift sys-tem, causing the uplifted (mountainous) edge of therift to alternate from side to side of the system.Where individual rift blocks overlap each other,they form a compressional region of upliftedrocks, and where individual rift blocks move pasteach other, they form ‘‘transfer’’ faults at angles tothe linear rift system. The best developed exampleof a long linear rift system is the East African riftvalleys, which we discuss briefly in chapter 10.
Extension in some continental areas developsbroad basins that contain numerous individualrifts. Sections across the basins pass through severalparallel half grabens, with the total extension ofbasin roughly equal to the sum of the extensionon each of the individual rifts. A type example isthe Basin and Range of the western United Statesand northern Mexico (fig. 2.7), and we describesimilar examples in our discussion of the extensionof northern Eurasia during the Mesozoic andCenozoic.
Plate Tectonics Now and in the Past 17
Figure 2.6. Features of linear rift systems.
Figure 2.7. Map of Basin and Range in westernUnited States (adapted from J. Stewart, 1978).

The upwelling asthenosphere reaches the surfacein oceanic ridges, but not in intracontinental set-tings. In their early stages of development, however,both linear rifts and broad basins develop in areasof uplift that indicate significant asthenosphericupwelling at depth. Presumably this occurs becausemantle heating causes dense lithosphere to convertto lower density asthenosphere (the opposite of the
process that causes ocean ridges to subside on theirflanks). The mantle heating not only causes upliftbut also produces an enormous variety of volcanicrocks in extensional environments. The easternbranch of the East African rift system is mostlyfilled by high-Na basalt and lavas apparently frac-tionated from it (figs. 2.8 and 2.9). The westernbranch has only a few volcanic cones that consist
18 Continents and Supercontinents
Figure 2.8. Longonot volcano in eastern branch of East African rift system (photo by J.J.W.R.).
Figure 2.9. Eastern branch of East African rift valley looking west. The far wall is ~30 km away. (Photo byJ.J.W.R.).

of extremely high-K lavas. The Basin and Rangecontains rock types ranging from rhyolite to alkali-olivine basalt. Thus far, there has been no successfuleffort to relate these different rock types to thedifferent extensional environments in which theywere erupted.
Passive continental margins formed by separa-tion of continents have a mixture of characteristicsthat do not fit either linear or basinal intraconti-nental rift zones. They are clearly places wherecontinental crust becomes thinner toward theoceans and then disappears at approximately theouter edge of the continental shelf (fig. 2.10). Theoutermost edge of continental crust is difficult toinvestigate because it is under water and buried bysediments, but apparently it is highly intruded bybasaltic dikes that were probably injected duringthe fragmentation that pulled the continents apart.Syn-rift sediments formed in half grabens thatdeveloped as the two continents began to separate.The post-rift unconformity developed on the riftedsurface, and post-rift sediments accumulated on thesubsiding margin as the continents drifted awayfrom each other.
Some continental margins that were attached toeach other before rifting apparently separated alonglow-angle ‘‘detachment’’ faults (fig. 2.11). Thismechanism creates an upper-plate margin and alower-plate margin. The upper plate commonly dis-plays a steep fault bounding the rift and one or
more thick half grabens filled by sediments.Conversely, the lower plate shows little uplift andis covered only by thin sediments in shallow halfgrabens.
The traditional view of continental rifting is thatocean basins develop either from linear rift systemsor from broad basins, but the evidence for thissequence is unclear. No present continents containbroad extensional basins near their rifted margins,suggesting that regions such as the Basin and Rangewere not precursors to continental separation.Evolution of oceans from linear zones such asEast Africa seems more plausible, but no character-istic sets of alternating half grabens and transferfaults have been found along modern margins.
Intraoceanic Subduction
A term for zones of lithosphere destruction was notformally defined until a paper by D.A. White et al.(1970) suggested that they be called ‘‘subduction’’zones. The term had originally been used to describevery large thrusts that brought one part of a moun-tain belt on top of another (Ampferer and Hammer,1911). With the expansion of the term to all areaswhere lithosphere descends to significant depths,some geologists use the term ‘‘A-type’’ subduction(Ampferer) for subduction of continental crust and‘‘B-type’’ subduction (Benioff) for subduction of
Plate Tectonics Now and in the Past 19
Figure 2.10. Features of passive continental margins. This section is adapted from Grow and Sheridan(1988) and illustrates an area of the east coast of North America where sediment accumulation is thickerthan normal.

oceanic crust. The importance of subduction inearth history was emphasized in numerous papersduring the development of plate tectonics, includingDewey and Bird (1970), who showed its relation-ship to mountain building, and W. Ernst (1970),who studied continental-margin accretion inCalifornia and also showed how subduction couldcause the development of blueschist-facies rocks.
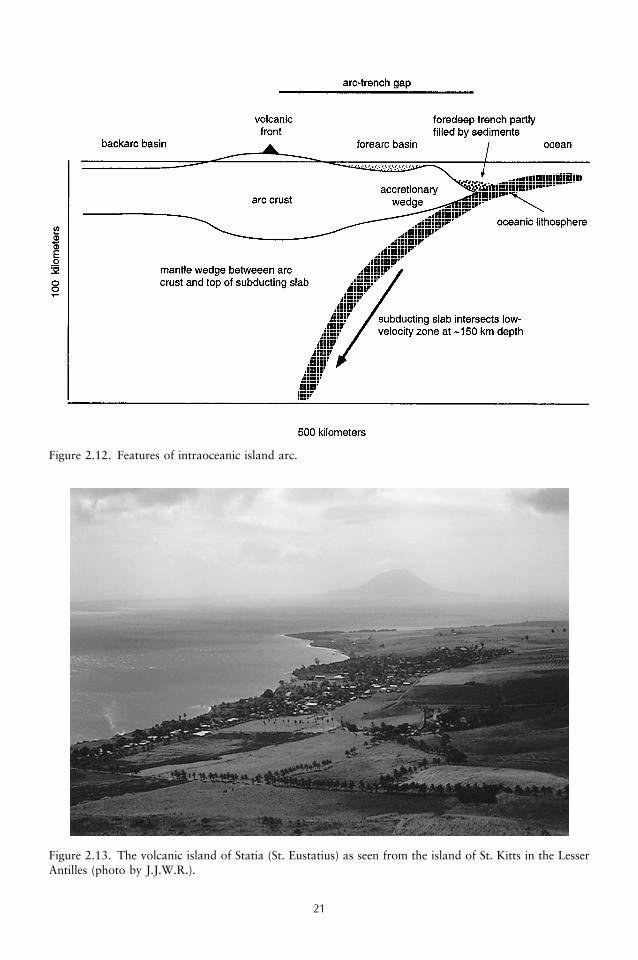
Subduction of oceanic lithosphere beneath otheroceanic lithosphere produces chains of islandsreferred to as ‘‘island arcs’’ (figs. 2.12 and 2.13).The arcuate shape as seen on the earth’s surfaceresults from the intersection of a flat plane (the slab)
with a sphere (the earth), with the curvature of thearc ranging from nearly a straight line (great circle)where the slab is steep to a highly curved arc wherethe angle of subduction is shallow. The frontal partof the arc consists of a foredeep trench between thedescending slab and the overlying plate and com-monly a forearc wedge of sediments and volcanicrocks derived from the emerging arc. As the slabdescends it becomes isolated from the overlyinglithosphere by a mantle wedge. Intersection of theslab with the low-velocity zone generates melting ofsome mixture of slab, overlying mantle wedge, andolder parts of the arc to produce a volcanic suite
20 Continents and Supercontinents
Figure 2.11. Development of rift along detachment fault.
21
Figure 2.12. Features of intraoceanic island arc.
Figure 2.13. The volcanic island of Statia (St. Eustatius) as seen from the island of St. Kitts in the LesserAntilles (photo by J.J.W.R.).

generally referred to as ‘‘calcalkaline’’ (chapters 3and 5) but of highly controversial origin.
Further descent of the slab behind the arc com-monly places the slab in a zone of extension as thelower part (toe) tends to break away and descend asan isolated body of lithosphere. Some combinationof this breaking and mantle upwelling generates a‘‘backarc’’ basin, where volcanism very similar tomid-ocean ridge basalt (MORB) results from melt-ing of this rising mantle.
Subduction Beneath Continental Margins
Descent of lithosphere beneath continental marginsgenerates a more complicated series of events thansubduction beneath oceanic lithosphere (fig. 2.14).The foredeep trench, forearc deposits, and mantlewedge are similar to those of intraoceanic arcs, butthe overlying continental lithosphere causes differ-ences in both structures and magmatic products.Structures in compressional continental marginstend to be both ‘‘synthetic’’ and ‘‘antithetic.’’Synthetic faults are approximately parallel to thedescending slab and form thrusts that verge towardthe ocean. Antithetic thrusts, conversely, develop onthe landward side of the orogen and may carryoverlying rocks far into the continental interior.
Many continental-margin arcs contain rocksuites that were metamorphosed under conditionsof high pressure and low temperature. Where sub-
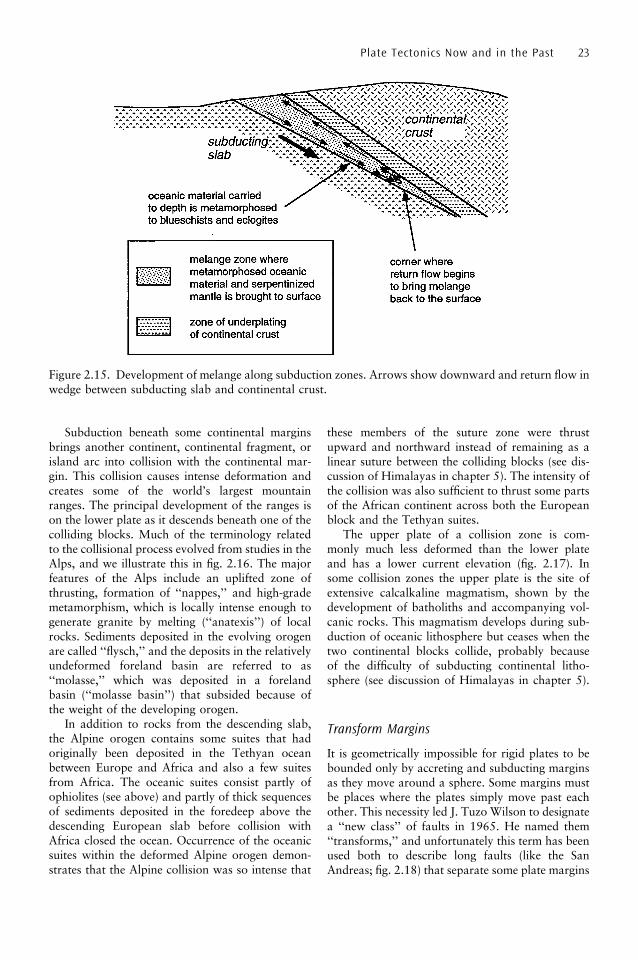
duction is particularly rapid, sediment and basalt inthe slab enter the blueschist and/or eclogite stabilityfield (fig. B3; discussion of Japan in chapter 5).Typical rock types include metamorphosed varietiesof basalt, peridotite, oceanic mud and chert, andsandstones and shales formed in the subduction-zone trench. In some places these rocks werereturned to the surface as large blocks along thrustor normal faults, but many suites are referred to as‘‘melanges’’ because they contain a chaotic assem-blage of small fragments of all of these rock types.The origin of the melanges has been very controver-sial, but they have now been explained as the resultof upward (‘‘return’’) flow of subducted materialsalong one or more wedges within the subductioncomplex (fig. 2.15; Cloos, 1982; V. Hansen, 1992).
Magmatic products in continental margins aremore complicated than in island arcs because theycan be produced by partial melting of subductedsediments and oceanic lithosphere, by the mantlewedge, and also by a complex sequence of continen-tal rocks already in place above the subductionzone. The major products of this magmatism arebatholiths and related volcanic rocks that are gen-erally classified as calcalkaline (chapter 3). The pro-portion of these magmas derived from remelting ofolder lithosphere and the proportion newly derivedfrom asthenosphere are closely tied to the problemof changes in the volume of continental crustthrough time. We discuss this question in chapter4 and also in a description of the Andes in chapter 5.
22 Continents and Supercontinents
Figure 2.14. Major features produced by subduction of oceanic lithosphere beneath a continental margin.
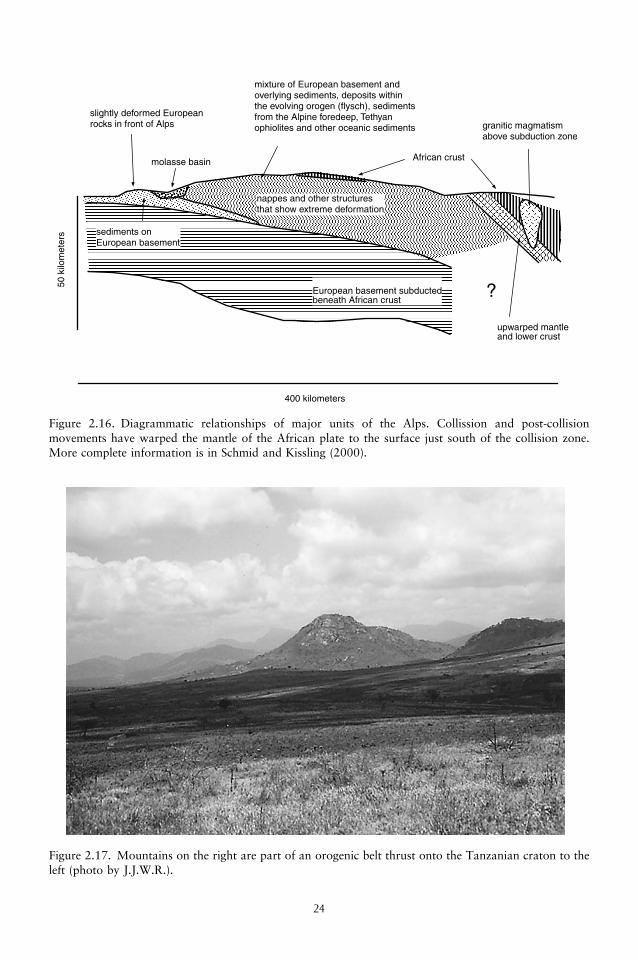
Subduction beneath some continental marginsbrings another continent, continental fragment, orisland arc into collision with the continental mar-gin. This collision causes intense deformation andcreates some of the world’s largest mountainranges. The principal development of the ranges ison the lower plate as it descends beneath one of thecolliding blocks. Much of the terminology relatedto the collisional process evolved from studies in theAlps, and we illustrate this in fig. 2.16. The majorfeatures of the Alps include an uplifted zone ofthrusting, formation of ‘‘nappes,’’ and high-grademetamorphism, which is locally intense enough togenerate granite by melting (‘‘anatexis’’) of localrocks. Sediments deposited in the evolving orogenare called ‘‘flysch,’’ and the deposits in the relativelyundeformed foreland basin are referred to as‘‘molasse,’’ which was deposited in a forelandbasin (‘‘molasse basin’’) that subsided because ofthe weight of the developing orogen.
In addition to rocks from the descending slab,the Alpine orogen contains some suites that hadoriginally been deposited in the Tethyan oceanbetween Europe and Africa and also a few suitesfrom Africa. The oceanic suites consist partly ofophiolites (see above) and partly of thick sequencesof sediments deposited in the foredeep above thedescending European slab before collision withAfrica closed the ocean. Occurrence of the oceanicsuites within the deformed Alpine orogen demon-strates that the Alpine collision was so intense that
these members of the suture zone were thrustupward and northward instead of remaining as alinear suture between the colliding blocks (see dis-cussion of Himalayas in chapter 5). The intensity ofthe collision was also sufficient to thrust some partsof the African continent across both the Europeanblock and the Tethyan suites.
The upper plate of a collision zone is com-monly much less deformed than the lower plateand has a lower current elevation (fig. 2.17). Insome collision zones the upper plate is the site ofextensive calcalkaline magmatism, shown by thedevelopment of batholiths and accompanying vol-canic rocks. This magmatism develops during sub-duction of oceanic lithosphere but ceases when thetwo continental blocks collide, probably becauseof the difficulty of subducting continental litho-sphere (see discussion of Himalayas in chapter 5).
Transform Margins
It is geometrically impossible for rigid plates to bebounded only by accreting and subducting marginsas they move around a sphere. Some margins mustbe places where the plates simply move past eachother. This necessity led J. Tuzo Wilson to designatea ‘‘new class’’ of faults in 1965. He named them‘‘transforms,’’ and unfortunately this term has beenused both to describe long faults (like the SanAndreas; fig. 2.18) that separate some plate margins
Plate Tectonics Now and in the Past 23
Figure 2.15. Development of melange along subduction zones. Arrows show downward and return flow inwedge between subducting slab and continental crust.
24
Figure 2.16. Diagrammatic relationships of major units of the Alps. Collission and post-collisionmovements have warped the mantle of the African plate to the surface just south of the collision zone.More complete information is in Schmid and Kissling (2000).
Figure 2.17. Mountains on the right are part of an orogenic belt thrust onto the Tanzanian craton to theleft (photo by J.J.W.R.).
and also to describe much shorter faults that offsetoceanic spreading centers (see above).
Transform zones in continents are essentiallylarge strike-slip faults that are not ordinarilyreferred to as plate margins (fig. 2.19). They arecommonly generated where plates collide obliquely(transpression) or where a colliding continentalblock penetrates into another continent and pushes
crust out of its way by forming thrust faults in frontand strike-slip faults to the side. One of the largestareas of this type of activity results from thecollision of India and Asia, which we discuss inchapter 10.
Large strike-slip faults are seldom exactlystraight and form complex structures at bends.Where a bend in a fault causes blocks on opposite
Plate Tectonics Now and in the Past 25
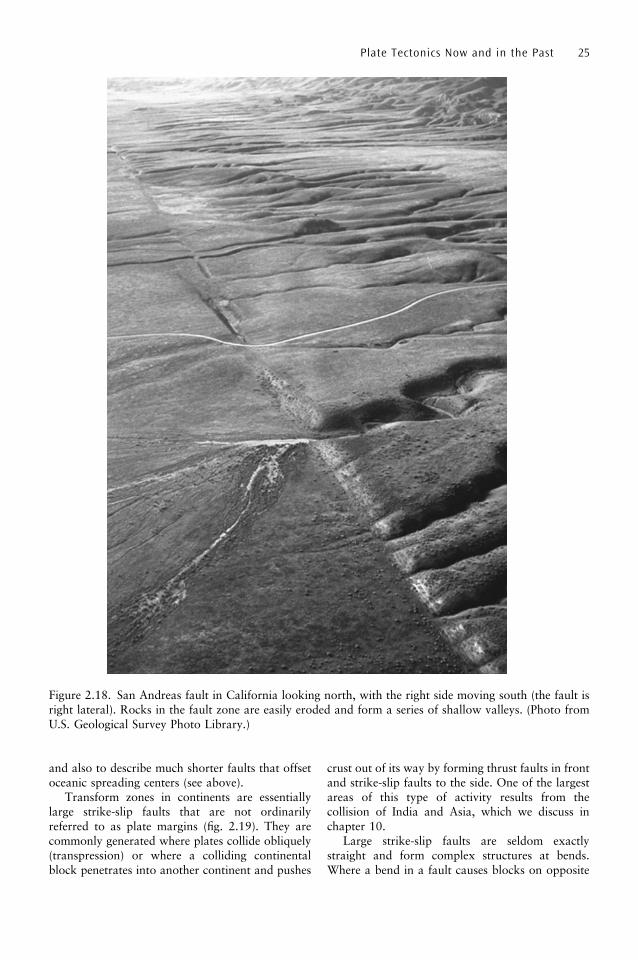
Figure 2.18. San Andreas fault in California looking north, with the right side moving south (the fault isright lateral). Rocks in the fault zone are easily eroded and form a series of shallow valleys. (Photo fromU.S. Geological Survey Photo Library.)
sides to move toward each other, the area is called a‘‘restraining bend,’’ and thrusts and related struc-tures develop in the compressional zone. Where theopposite sides of a fault move away from eachother, the area is a ‘‘releasing bend’’ dominatedby extension. ‘‘Pull-apart’’ basins form in thesebends and also along straight sections of strike-slip faults, forming some of the world’s lowestcontinental areas, including the Dead Sea (nearly400 m below sealevel) and the Turfan depression ofwestern China, which is more than 100 m belowsealevel (chapter 10).
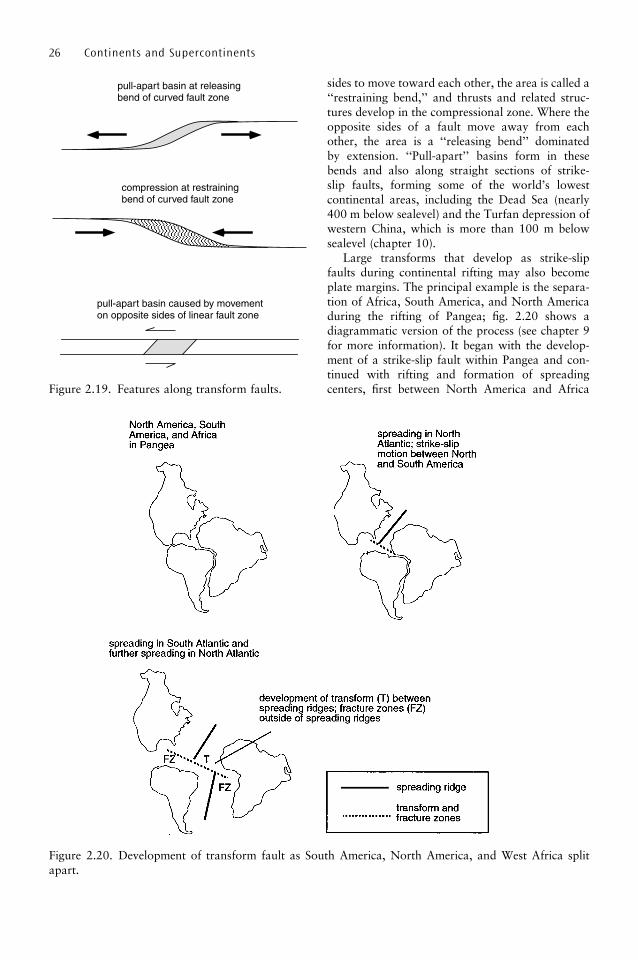
Large transforms that develop as strike-slipfaults during continental rifting may also becomeplate margins. The principal example is the separa-tion of Africa, South America, and North Americaduring the rifting of Pangea; fig. 2.20 shows adiagrammatic version of the process (see chapter 9for more information). It began with the develop-ment of a strike-slip fault within Pangea and con-tinued with rifting and formation of spreadingcenters, first between North America and Africa
26 Continents and Supercontinents
Figure 2.19. Features along transform faults.
Figure 2.20. Development of transform fault as South America, North America, and West Africa splitapart.
and later between South America and Africa. Afterspreading had continued long enough for the north-ern and southern Atlantic Oceans to join, the for-mer intracontinental fault continued within theocean basin as a transform between the two spread-ing ridges and as a fracture zone with strike-slipmovement outside of the area between the ridges.
Triple Junctions
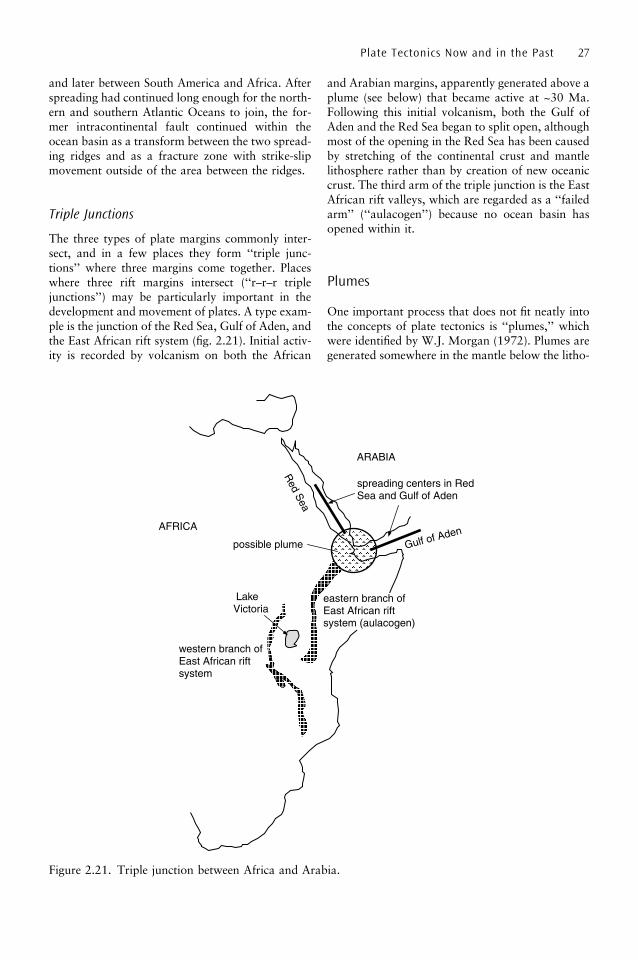
The three types of plate margins commonly inter-sect, and in a few places they form ‘‘triple junc-tions’’ where three margins come together. Placeswhere three rift margins intersect (‘‘r–r–r triplejunctions’’) may be particularly important in thedevelopment and movement of plates. A type exam-ple is the junction of the Red Sea, Gulf of Aden, andthe East African rift system (fig. 2.21). Initial activ-ity is recorded by volcanism on both the African
and Arabian margins, apparently generated above aplume (see below) that became active at ~30 Ma.Following this initial volcanism, both the Gulf ofAden and the Red Sea began to split open, althoughmost of the opening in the Red Sea has been causedby stretching of the continental crust and mantlelithosphere rather than by creation of new oceaniccrust. The third arm of the triple junction is the EastAfrican rift valleys, which are regarded as a ‘‘failedarm’’ (‘‘aulacogen’’) because no ocean basin hasopened within it.
Plumes
One important process that does not fit neatly intothe concepts of plate tectonics is ‘‘plumes,’’ whichwere identified by W.J. Morgan (1972). Plumes aregenerated somewhere in the mantle below the litho-
Plate Tectonics Now and in the Past 27
Figure 2.21. Triple junction between Africa and Arabia.
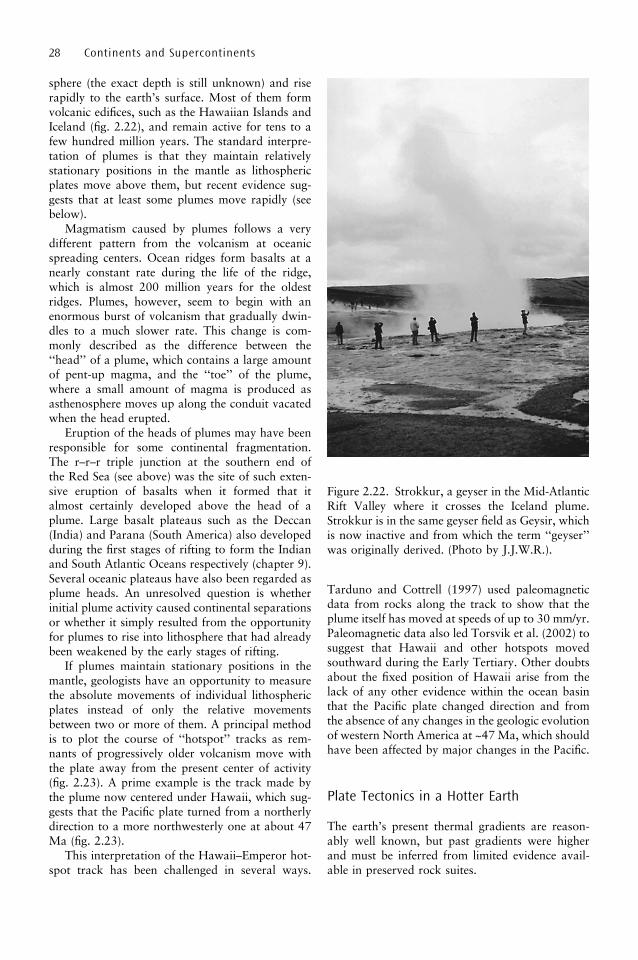
sphere (the exact depth is still unknown) and riserapidly to the earth’s surface. Most of them formvolcanic edifices, such as the Hawaiian Islands andIceland (fig. 2.22), and remain active for tens to afew hundred million years. The standard interpre-tation of plumes is that they maintain relativelystationary positions in the mantle as lithosphericplates move above them, but recent evidence sug-gests that at least some plumes move rapidly (seebelow).
Magmatism caused by plumes follows a verydifferent pattern from the volcanism at oceanicspreading centers. Ocean ridges form basalts at anearly constant rate during the life of the ridge,which is almost 200 million years for the oldestridges. Plumes, however, seem to begin with anenormous burst of volcanism that gradually dwin-dles to a much slower rate. This change is com-monly described as the difference between the‘‘head’’ of a plume, which contains a large amountof pent-up magma, and the ‘‘toe’’ of the plume,where a small amount of magma is produced asasthenosphere moves up along the conduit vacatedwhen the head erupted.
Eruption of the heads of plumes may have beenresponsible for some continental fragmentation.The r–r–r triple junction at the southern end ofthe Red Sea (see above) was the site of such exten-sive eruption of basalts when it formed that italmost certainly developed above the head of aplume. Large basalt plateaus such as the Deccan(India) and Parana (South America) also developedduring the first stages of rifting to form the Indianand South Atlantic Oceans respectively (chapter 9).Several oceanic plateaus have also been regarded asplume heads. An unresolved question is whetherinitial plume activity caused continental separationsor whether it simply resulted from the opportunityfor plumes to rise into lithosphere that had alreadybeen weakened by the early stages of rifting.
If plumes maintain stationary positions in themantle, geologists have an opportunity to measurethe absolute movements of individual lithosphericplates instead of only the relative movementsbetween two or more of them. A principal methodis to plot the course of ‘‘hotspot’’ tracks as rem-nants of progressively older volcanism move withthe plate away from the present center of activity(fig. 2.23). A prime example is the track made bythe plume now centered under Hawaii, which sug-gests that the Pacific plate turned from a northerlydirection to a more northwesterly one at about 47Ma (fig. 2.23).
This interpretation of the Hawaii–Emperor hot-spot track has been challenged in several ways.
Tarduno and Cottrell (1997) used paleomagneticdata from rocks along the track to show that theplume itself has moved at speeds of up to 30 mm/yr.Paleomagnetic data also led Torsvik et al. (2002) tosuggest that Hawaii and other hotspots movedsouthward during the Early Tertiary. Other doubtsabout the fixed position of Hawaii arise from thelack of any other evidence within the ocean basinthat the Pacific plate changed direction and fromthe absence of any changes in the geologic evolutionof western North America at ~47 Ma, which shouldhave been affected by major changes in the Pacific.
Plate Tectonics in a Hotter Earth
The earth’s present thermal gradients are reason-ably well known, but past gradients were higherand must be inferred from limited evidence avail-able in preserved rock suites.
28 Continents and Supercontinents
Figure 2.22. Strokkur, a geyser in the Mid-AtlanticRift Valley where it crosses the Iceland plume.Strokkur is in the same geyser field as Geysir, whichis now inactive and from which the term ‘‘geyser’’was originally derived. (Photo by J.J.W.R.).

Figure 2.24 summarizes the probable ranges(high and low) of thermal gradients at present andin the Archean. Much of the information comesfrom the presence or absence of komatiites andblueschists. Komatiites are volcanic or shallowintrusive rocks that have high concentrations ofolivine, presumably indicating derivation from themantle by a higher degree of partial melting ofperidotite than the melting that produces typicalbasalt. No komatiites formed in the Phanerozoic,showing that all present gradients must be lowenough that they intersect the mantle solidusbelow the temperatures needed to form komatiites.The presence of komatiites in the Archean, how-ever, shows that some gradients were high enoughto intersect the mantle solidus at a shallow depth.
Blueschists are metamorphic rocks that containminerals that are stable only under conditions ofhigh pressure and low temperature (fig. B.3). Theyare formed where subduction of oceanic lithospherecools the surrounding mantle as it descends. Theabundance of blueschists in Phanerozoic orogeniccomplexes clearly shows that some Phanerozoicgradients are low enough to be within the blueschiststability field. By contrast, Archean rock suites con-tain no blueschist, demonstrating that the lowestArchean gradients were too high to intersect theblueschist stability field.
Further inferences about Archean thermal gradi-ents are provided by diamonds and the thickness of
old continental crust. Archean diamonds couldhave developed only if some Archean gradientswere low enough to intersect the graphite–diamondboundary. Preservation of Archean continentalcrust with thicknesses of a few tens of kilometersshows that at least some Archean gradients musthave been below the melting curve of continentalcrust at those depths. Many gradients, however,may have been so high that most Archean conti-nental crust was destroyed shortly after it formed(chapter 3).
The earth may have been too hot during theArchean for the creation of the type of organizedconvection that the mantle now undergoes, andsome earth scientists have speculated that move-ment in this very hot mantle is better described as‘‘turbulent.’’ Oceanic areas with many, frequentlyshifting, convection cells would not have had simplespreading ridges, and their history would be almostimpossible to determine. The earth may also havebeen hot enough not only to cause mantle turbu-lence but also to prevent the development of rigidlithospheres over broad areas. In that situation,modern types of subduction would have beenimpossible, and both oceanic and continental litho-sphere would have been circulated back into themantle frequently and in local areas.
One consequence of higher thermal gradients inthe past is development of oceanic crusts that werethicker than those at present. Because thermal gra-
Plate Tectonics Now and in the Past 29
Figure 2.23. Outline of Hawaiian plume track.
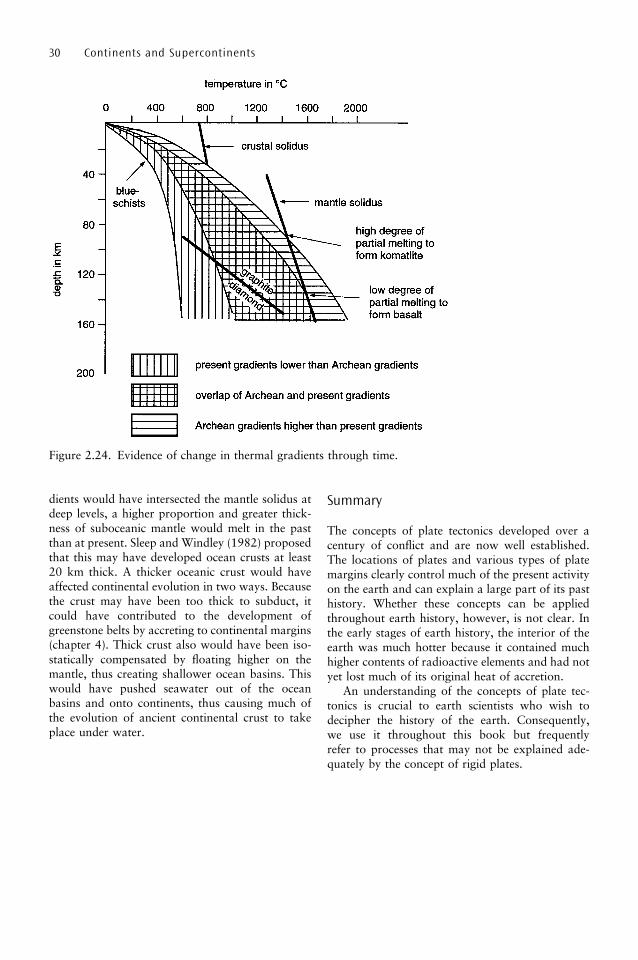
dients would have intersected the mantle solidus atdeep levels, a higher proportion and greater thick-ness of suboceanic mantle would melt in the pastthan at present. Sleep and Windley (1982) proposedthat this may have developed ocean crusts at least20 km thick. A thicker oceanic crust would haveaffected continental evolution in two ways. Becausethe crust may have been too thick to subduct, itcould have contributed to the development ofgreenstone belts by accreting to continental margins(chapter 4). Thick crust also would have been iso-statically compensated by floating higher on themantle, thus creating shallower ocean basins. Thiswould have pushed seawater out of the oceanbasins and onto continents, thus causing much ofthe evolution of ancient continental crust to takeplace under water.
Summary
The concepts of plate tectonics developed over acentury of conflict and are now well established.The locations of plates and various types of platemargins clearly control much of the present activityon the earth and can explain a large part of its pasthistory. Whether these concepts can be appliedthroughout earth history, however, is not clear. Inthe early stages of earth history, the interior of theearth was much hotter because it contained muchhigher contents of radioactive elements and had notyet lost much of its original heat of accretion.
An understanding of the concepts of plate tec-tonics is crucial to earth scientists who wish todecipher the history of the earth. Consequently,we use it throughout this book but frequentlyrefer to processes that may not be explained ade-quately by the concept of rigid plates.
30 Continents and Supercontinents
Figure 2.24. Evidence of change in thermal gradients through time.

3
Creation, Destruction, and Changes in Volumeof Continental Crust Through Time
The low density of continental crust creates areasof land that cover about 25% of the world’s
surface. The ultimate source of this crust must havebeen the mantle, but the mechanisms and times ofextraction are not well known. Because the rate atwhich continental crust has been destroyed andincorporated back into the mantle is also uncertain,the volume of continental crust that existed in theearth throughout its history is highly controversial.We investigate these problems in this chapter,beginning with a discussion of how the wide varietyof rocks that constitute the crust may have evolvedfrom the mantle. The next section summarizesinformation on the rates of destruction of crust,which leads to the issue of changes in the volumeof continental crust through time.
We leave to chapter 4 the discussion of‘‘cratons,’’ which are large areas of continentalcrust that became stable at different times in thepast 3 billion years and then moved around theearth as relatively undeformed continental blocks.Cratons are commonly referred to as ‘‘shields’’where their crystalline basement rocks are exposed.The discussion in this chapter and several laterchapters requires some knowledge of the signifi-cance of isotopic information, and we provide abrief summary in appendix D.
In order to describe continental crust and itsrelationships to other parts of the earth, we muststart with several definitions. ‘‘Sialic’’ (Si þ Al)refers to rocks, such as granite, that are particularlyrich in SiO2, with Al2O3 as the second most abun-dant oxide; they are commonly referred to as‘‘felsic.’’ ‘‘Simatic’’ (Si þ Mg) similarly designatesbasalts and other low-silica ‘‘mafic’’ rocks.‘‘Ultrasimatic’’ and ‘‘ultramafic’’ refer to rocksextremely rich in olivine, mostly different varietiesof peridotite. Some sialic (felsic) rocks have highconcentrations of large-ion-lithophile (LIL) ele-ments, which are ions that are ‘‘incompatible’’with (do not fit into) typical minerals in the mantle,
including olivine, pyroxene, and calcic plagioclase.LIL elements include K, Rb, Ba, and U, which iscoordinated with oxygen to form the low-densityuranyl complex (UO2
þ2). Because of their incom-patibility, LIL elements tend to concentrate in fluidsthat move them upward in the crust as part of thedensity stratification of the earth (see below).
This chapter makes extensive use of isotopicinformation summarized in appendix D.
Origin of Continental Crust
The mantle and crust of the earth represent the‘‘stony,’’ silicate-bearing, components of the solarcloud that accreted to form the inner, ‘‘terrestrial,’’planets of the solar system. The 15% of the earththat is in the core came from the ‘‘metallic,’’ mostlyiron and nickel, part of the solar cloud. During andshortly after planetary accretion, the Fe/Ni formed aliquid that was ‘‘immiscible’’ with (did not mixwith) the silicate fraction of the earth. In the earth’sgravity field, this dense Fe/Ni liquid separateddownward into the core, and the silicates fractio-nated upward. Throughout its history, the earthunderwent further gravitational segregation thatdeveloped a mantle, oceanic crust, and continentalcrust (figs. 1.4 and 3.1).
The earth’s crust extends from the surface downto the Mohorovicic discontinuity (Moho; chapter1). As originally defined by Mohorovicic, theboundary between crust and mantle is a seismicdiscontinuity that separates much higher velocitiesin the mantle (typically ~8 km/sec for P waves) fromthose in the overlying crust. Normal values of P-wave velocities in the crust range from very low innear-surface sediments to 6.8–7.2 km/sec just abovethe Moho. In many areas a minor discontinuity(Conrad) at a depth of ~20 km separates uppercrust with velocities of 6–6.7 km/sec from theregion of higher velocities in the lower crust.
31
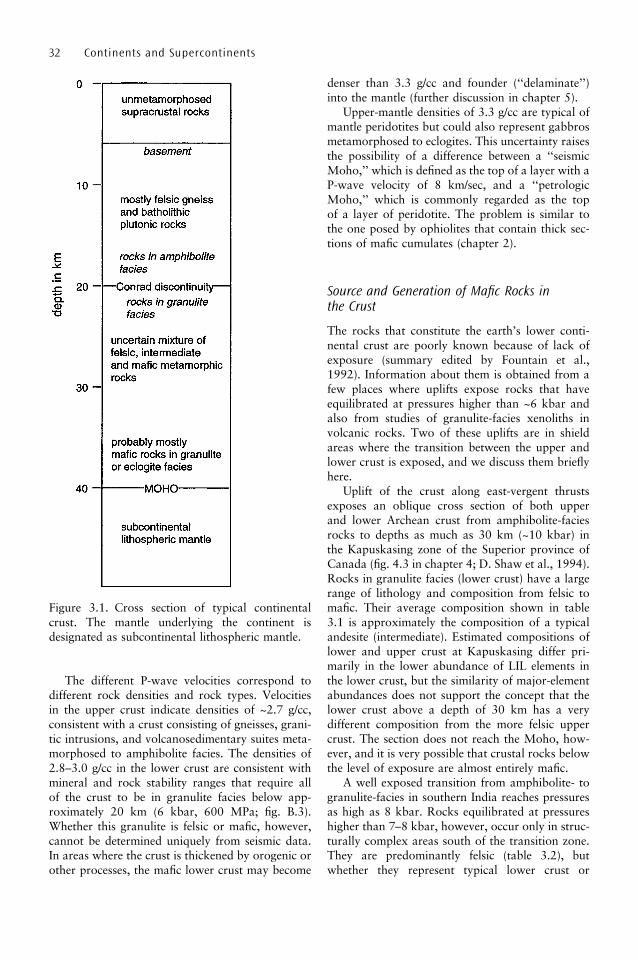
The different P-wave velocities correspond todifferent rock densities and rock types. Velocitiesin the upper crust indicate densities of ~2.7 g/cc,consistent with a crust consisting of gneisses, grani-tic intrusions, and volcanosedimentary suites meta-morphosed to amphibolite facies. The densities of2.8–3.0 g/cc in the lower crust are consistent withmineral and rock stability ranges that require allof the crust to be in granulite facies below app-roximately 20 km (6 kbar, 600 MPa; fig. B.3).Whether this granulite is felsic or mafic, however,cannot be determined uniquely from seismic data.In areas where the crust is thickened by orogenic orother processes, the mafic lower crust may become
denser than 3.3 g/cc and founder (‘‘delaminate’’)into the mantle (further discussion in chapter 5).
Upper-mantle densities of 3.3 g/cc are typical ofmantle peridotites but could also represent gabbrosmetamorphosed to eclogites. This uncertainty raisesthe possibility of a difference between a ‘‘seismicMoho,’’ which is defined as the top of a layer with aP-wave velocity of 8 km/sec, and a ‘‘petrologicMoho,’’ which is commonly regarded as the topof a layer of peridotite. The problem is similar tothe one posed by ophiolites that contain thick sec-tions of mafic cumulates (chapter 2).
Source and Generation of Mafic Rocks inthe Crust
The rocks that constitute the earth’s lower conti-nental crust are poorly known because of lack ofexposure (summary edited by Fountain et al.,1992). Information about them is obtained from afew places where uplifts expose rocks that haveequilibrated at pressures higher than ~6 kbar andalso from studies of granulite-facies xenoliths involcanic rocks. Two of these uplifts are in shieldareas where the transition between the upper andlower crust is exposed, and we discuss them brieflyhere.
Uplift of the crust along east-vergent thrustsexposes an oblique cross section of both upperand lower Archean crust from amphibolite-faciesrocks to depths as much as 30 km (~10 kbar) inthe Kapuskasing zone of the Superior province ofCanada (fig. 4.3 in chapter 4; D. Shaw et al., 1994).Rocks in granulite facies (lower crust) have a largerange of lithology and composition from felsic tomafic. Their average composition shown in table3.1 is approximately the composition of a typicalandesite (intermediate). Estimated compositions oflower and upper crust at Kapuskasing differ pri-marily in the lower abundance of LIL elements inthe lower crust, but the similarity of major-elementabundances does not support the concept that thelower crust above a depth of 30 km has a verydifferent composition from the more felsic uppercrust. The section does not reach the Moho, how-ever, and it is very possible that crustal rocks belowthe level of exposure are almost entirely mafic.
A well exposed transition from amphibolite- togranulite-facies in southern India reaches pressuresas high as 8 kbar. Rocks equilibrated at pressureshigher than 7–8 kbar, however, occur only in struc-turally complex areas south of the transition zone.They are predominantly felsic (table 3.2), butwhether they represent typical lower crust or
32 Continents and Supercontinents
Figure 3.1. Cross section of typical continentalcrust. The mantle underlying the continent isdesignated as subcontinental lithospheric mantle.
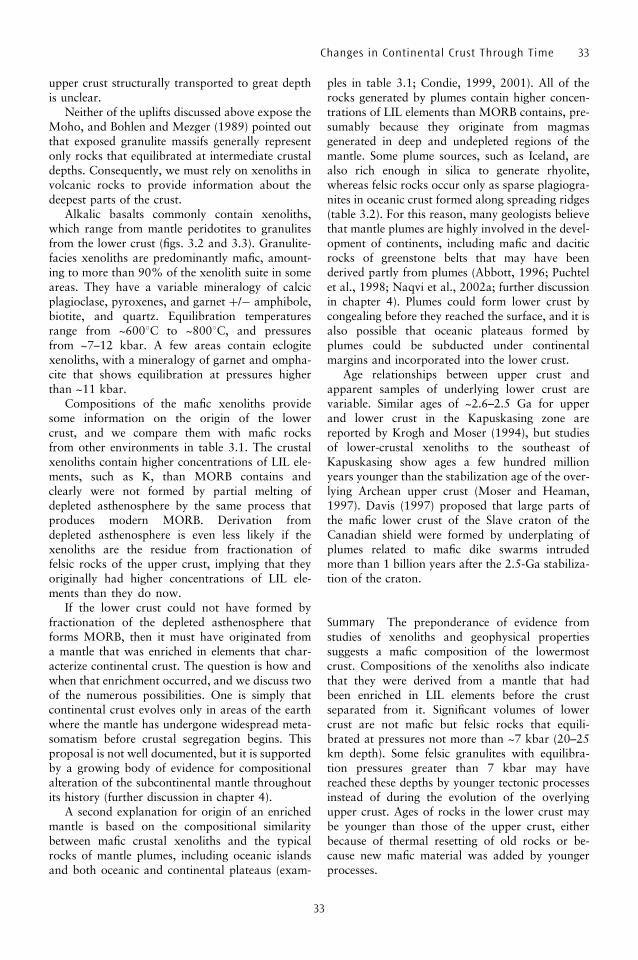
upper crust structurally transported to great depthis unclear.
Neither of the uplifts discussed above expose theMoho, and Bohlen and Mezger (1989) pointed outthat exposed granulite massifs generally representonly rocks that equilibrated at intermediate crustaldepths. Consequently, we must rely on xenoliths involcanic rocks to provide information about thedeepest parts of the crust.
Alkalic basalts commonly contain xenoliths,which range from mantle peridotites to granulitesfrom the lower crust (figs. 3.2 and 3.3). Granulite-facies xenoliths are predominantly mafic, amount-ing to more than 90% of the xenolith suite in someareas. They have a variable mineralogy of calcicplagioclase, pyroxenes, and garnet þ/� amphibole,biotite, and quartz. Equilibration temperaturesrange from ~6008C to ~8008C, and pressuresfrom ~7–12 kbar. A few areas contain eclogitexenoliths, with a mineralogy of garnet and ompha-cite that shows equilibration at pressures higherthan ~11 kbar.
Compositions of the mafic xenoliths providesome information on the origin of the lowercrust, and we compare them with mafic rocksfrom other environments in table 3.1. The crustalxenoliths contain higher concentrations of LIL ele-ments, such as K, than MORB contains andclearly were not formed by partial melting ofdepleted asthenosphere by the same process thatproduces modern MORB. Derivation fromdepleted asthenosphere is even less likely if thexenoliths are the residue from fractionation offelsic rocks of the upper crust, implying that theyoriginally had higher concentrations of LIL ele-ments than they do now.
If the lower crust could not have formed byfractionation of the depleted asthenosphere thatforms MORB, then it must have originated froma mantle that was enriched in elements that char-acterize continental crust. The question is how andwhen that enrichment occurred, and we discuss twoof the numerous possibilities. One is simply thatcontinental crust evolves only in areas of the earthwhere the mantle has undergone widespread meta-somatism before crustal segregation begins. Thisproposal is not well documented, but it is supportedby a growing body of evidence for compositionalalteration of the subcontinental mantle throughoutits history (further discussion in chapter 4).
A second explanation for origin of an enrichedmantle is based on the compositional similaritybetween mafic crustal xenoliths and the typicalrocks of mantle plumes, including oceanic islandsand both oceanic and continental plateaus (exam-
ples in table 3.1; Condie, 1999, 2001). All of therocks generated by plumes contain higher concen-trations of LIL elements than MORB contains, pre-sumably because they originate from magmasgenerated in deep and undepleted regions of themantle. Some plume sources, such as Iceland, arealso rich enough in silica to generate rhyolite,whereas felsic rocks occur only as sparse plagiogra-nites in oceanic crust formed along spreading ridges(table 3.2). For this reason, many geologists believethat mantle plumes are highly involved in the devel-opment of continents, including mafic and daciticrocks of greenstone belts that may have beenderived partly from plumes (Abbott, 1996; Puchtelet al., 1998; Naqvi et al., 2002a; further discussionin chapter 4). Plumes could form lower crust bycongealing before they reached the surface, and it isalso possible that oceanic plateaus formed byplumes could be subducted under continentalmargins and incorporated into the lower crust.
Age relationships between upper crust andapparent samples of underlying lower crust arevariable. Similar ages of ~2.6–2.5 Ga for upperand lower crust in the Kapuskasing zone arereported by Krogh and Moser (1994), but studiesof lower-crustal xenoliths to the southeast ofKapuskasing show ages a few hundred millionyears younger than the stabilization age of the over-lying Archean upper crust (Moser and Heaman,1997). Davis (1997) proposed that large parts ofthe mafic lower crust of the Slave craton of theCanadian shield were formed by underplating ofplumes related to mafic dike swarms intrudedmore than 1 billion years after the 2.5-Ga stabiliza-tion of the craton.
Summary The preponderance of evidence fromstudies of xenoliths and geophysical propertiessuggests a mafic composition of the lowermostcrust. Compositions of the xenoliths also indicatethat they were derived from a mantle that hadbeen enriched in LIL elements before the crustseparated from it. Significant volumes of lowercrust are not mafic but felsic rocks that equili-brated at pressures not more than ~7 kbar (20–25km depth). Some felsic granulites with equilibra-tion pressures greater than 7 kbar may havereached these depths by younger tectonic processesinstead of during the evolution of the overlyingupper crust. Ages of rocks in the lower crust maybe younger than those of the upper crust, eitherbecause of thermal resetting of old rocks or be-cause new mafic material was added by youngerprocesses.
33
Changes in Continental Crust Through Time 33

34
Tables 3.1 and 3.2 show the compositions of rock suites that illustrate discussions in the text of chapter 3. Because of the enormous number of rocks thathave been analyzed, we cannot claim that the values shown in these tables are comprehensive samples of the different environments in which the rocks formed,but we believe that they closely represent rocks generated in each environment. Some of the suites shown here were selected in preference to others, includingthose that are more widely known, because we wanted all of our suites to have values for LIL and other trace elements that are regarded as diagnostic ofenvironments of formation.
The tables contain both averages and ranges. We use averages if the investigators who did the work regarded a rock suite as sufficiently homogeneous tocalculate an average in their published paper. Where averages were not reported, we show ranges of data for each element. For clarity, we have rounded offmany values and eliminated outliers. Concentrations of major elements are shown as weight percent and of trace elements as part per million (ppm) by weight.Values for iron are shown as total Fe calculated as FeO. Initial (87Sr/86Sr)I are normal, and all "Nd are relative to CHUR except for suite 9 in table 3.2.
Table 3.1. Compositions of mafic rocks
Component 1 2 3 4 5 6 7 8 9
SiO2 49–50.5 50–52 47–47.5 48–52 49–54 50.0 57.9 43–48 40–48
TiO2 1–2 1.5–3 2–2.1 1.7–2.4 0.6–1.6 1.2 0.65 0.8–3 0.7–3
Al2O3 14–15 13–16 14.4–15.2 12–14 14.5–21 14.9 17.3 13–18 11–16FeOT 10–14 11–14 12–13 11–13 8–11 9.4 7.1 11–16 11–18
MgO 6–8 5–6.5 4.3–6.4 8–15 5–9 8.1 4.3 5–10 7–9
CaO 10.5–13 8.5–10.5 7.2–10.8 8–10 8–13 10.5 7.6 12–15 6–12
Na2O 2–3.5 2.8–3.3 2.5–3.0 1.2–2.3 1.3–3.5 2.8 2.7 1.2–2.5 1.5–2.8K2O 0.03–0.2 0.5–1.2 0.5–1.7 0.04–0.5 0.14–0.6 0.48 1.5 0.03–0.4 0.3–1.1
Ba 4–10 200–400 100–300 30–100 50–200 201 523 30–190 90–800Rb 0.6–4 10–35 9–62 0.1–6 5–20 10 41 1–5 4 or 40
Sr 70–100 250–400 175–340 250–380 150–300 311 447 50–250 200–400
Zr 75–200 125–225 140–170 90–125 20–50 124 114 70–300 50–150Y — 30–50 30–50 20–30 12–20 28 16 20–45 20–100
(87Sr/86Sr)I 0.702–0.703 0.703–0.705 0.704–0.706 0.703–0.703 0.7045–0.705 0.7035–0.704 — 0.701–0.705 0.703–0.704(or variable)
"Nd þ10 þ3 to 0 þ2 to �3:5 þ3 to 2 þ3 to �3 — — +2 to �5 negative

35
1. Mid-ocean ridge basalt (MORB) from a segment of the North Atlantic ridge as far from plume influence as possible. Zr and Y were not reported by the authors and are added by us as typical
values for MORB. (Schilling et al., 1983.) Sr and Nd values are typical of hundreds of analyses.
2. Imnaha basalts of Columbia River basalt plateau. They represent a continental flood basalt, probably developed from the head of a plume. Major and trace elements are from Hooper and
Hawkesworth (1993). Sr and Nd values are from Hooper (1997).
3. Kerguelen plateau in the Indian Ocean, a typical intraoceanic plateau possibly related to plume activity. All values from Davies et al. (1989).
4. Tholeiitic basalt of Lanai, Hawaii. It represents the Hawaiian plume in an island that is no longer volcanically active. (West et al., 1992.) Sr and Nd values are typical of hundreds of analyses of
Hawaiian basalts.
5. Primitive subduction-zone magmas from intraoceanic island arcs in the southwest Pacific. Major and trace elements are from I. Smith et al. (1997). Sr and Nd values are from Gamble et al.
(1997). More information is provided by other papers in volume 35 of the Canadian Mineralogist (edited by Nixon et al., 1997).
6. Basalts of the Clarno Formation, central Oregon. The Clarno is a predominantly andesitic suite that ranges from basalt to rhyolite and was proposed to have been produced by subduction under
a thin continental margin. Samples chosen for averaging are the lowest-SiO2 members of the suite, and values are normalized to 50.0% SiO2. Major and trace elements are from Rogers and Ragland
(1980). Sr values are from Suayah and Rogers (1991).
7. Weighted average of the granulite-facies rocks of the Kapuskasing zone of the Superior craton (D. Shaw et al., 1994).
8. Xenoliths typical of mafic granulites that have very low LIL element concentrations. Ranges of major elements, trace elements, Sr ratios, and Nd values are from Rudnick (1990) and Rudnick and
Taylor (1991) in eastern Australia and from Kempton et al. (1997) in the Pannonian basin of Hungary.
9. Range of major and trace element concentrations in xenoliths of mafic granulites reported by Holtta et al. (2000) in Finland and by Markwick and Downes (2000) in northwestern Russia. They
have higher concentrations of LIL elements than the xenoliths shown in column 8 except for Rb in the suite reported by Markwick and Downes; this averages about 4 ppm Rb, whereas the suite stu-
died by Holtta et al. averages about 40 ppm Rb. Initial Sr values are reported as 0.703–0.704 by Markwick and Downes and highly variable by Holtta et al. Nd values are reported as negative and
variable by Markwick and Downes.
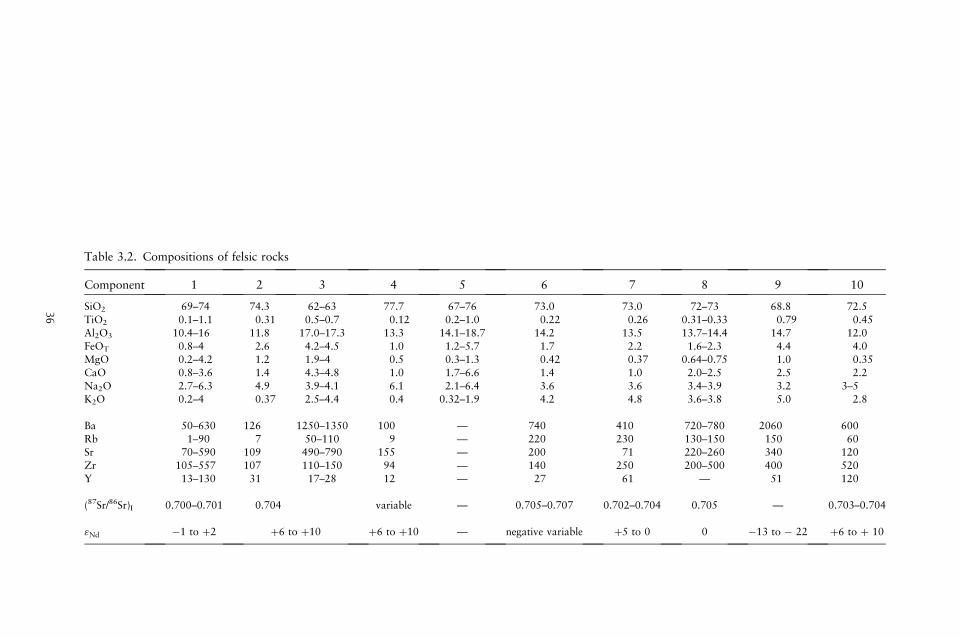
36
Table 3.2. Compositions of felsic rocks
Component 1 2 3 4 5 6 7 8 9 10
SiO2 69–74 74.3 62–63 77.7 67–76 73.0 73.0 72–73 68.8 72.5
TiO2 0.1–1.1 0.31 0.5–0.7 0.12 0.2–1.0 0.22 0.26 0.31–0.33 0.79 0.45
Al2O3 10.4–16 11.8 17.0–17.3 13.3 14.1–18.7 14.2 13.5 13.7–14.4 14.7 12.0
FeOT 0.8–4 2.6 4.2–4.5 1.0 1.2–5.7 1.7 2.2 1.6–2.3 4.4 4.0MgO 0.2–4.2 1.2 1.9–4 0.5 0.3–1.3 0.42 0.37 0.64–0.75 1.0 0.35
CaO 0.8–3.6 1.4 4.3–4.8 1.0 1.7–6.6 1.4 1.0 2.0–2.5 2.5 2.2
Na2O 2.7–6.3 4.9 3.9–4.1 6.1 2.1–6.4 3.6 3.6 3.4–3.9 3.2 3–5K2O 0.2–4 0.37 2.5–4.4 0.4 0.32–1.9 4.2 4.8 3.6–3.8 5.0 2.8
Ba 50–630 126 1250–1350 100 — 740 410 720–780 2060 600
Rb 1–90 7 50–110 9 — 220 230 130–150 150 60Sr 70–590 109 490–790 155 — 200 71 220–260 340 120
Zr 105–557 107 110–150 94 — 140 250 200–500 400 520
Y 13–130 31 17–28 12 — 27 61 — 51 120
(87Sr/86Sr)I 0.700–0.701 0.704 variable — 0.705–0.707 0.702–0.704 0.705 — 0.703–0.704
"Nd �1 to þ2 þ6 to þ10 þ6 to þ10 — negative variable þ5 to 0 0 �13 to � 22 þ6 to þ 10

37
1. Tonalite–trondhjemite–granodiorite (TTG) gneisses from the Western Dharwar craton of southern India. The wide range of values is from 18 different suites analyzed by various workers and
includes typical ranges for TTG suites elsewhere. Major and trace elements from Rogers et al., (1986). Sr and Nd values from Meen et al. (1992) and Peucat et al. (1993).
2. Keratophyre (Na rhyolite) produced in the early stages of subduction in the Virgin Islands, northeastern Caribbean (Donnelly and Rogers, 1980). The same Sr and Nd values are listed for columns
2 and 3 and are based on general studies of Mesozoic igneous activity in the northeastern Caribbean by Frost et al. (1998).
3. Batholithic rocks with greater than 60% SiO2 produced by subduction in the northeastern Caribbean. (A. Smith et al., 1998; additional information is in other papers in Geological Society of
America Special Paper 322, edited by Lidiak and Larue, 1998.) The same Sr and Nd values are listed for columns 2 and 3 and are based on general studies of Mesozoic igneous activity in the north-
eastern Caribbean by Frost et al. (1998).
4. High-SiO2 plagiogranite (Na granite) from an oceanic shear zone (Flagler and Spray, 1991). Sr and Nd values are from the study of a plagiogranite in the Semail ophiolite (Amri et al., 1996).
5. Range of compositions produced by experimental melting of basaltic compositions under different conditions of temperature, total pressure, and water pressure (Winther, 1996).
6. Compositions of granites produced during the later stages of continental-margin subduction (e.g., granites of Sierra Nevada). One of four suites normalized to 73.0% SiO2 from average SiO2 con-
tents ranging from 72.9% to 74.2% (LO suite of Rogers and Greenberg, 1990). Sr and Nd values are typical of hundreds of analyses of rocks from the Sierra Nevadas, Andes, and other continen-
tal-margin batholiths.
7. Compositions of post-orogenic granites (identified in text). One of four suites normalized to 73.0% SiO2 from average SiO2 contents ranging from 72.9% to 74.2% (PO suite of Rogers and
Greenberg, 1990). Sr and Nd values are typical of numerous analyses of post-orogenic granites worldwide.
8. Cantarito rhyolites produced by subduction in central Andes. Zr and Y were not reported by the authors and are added by us as typical values for subduction-zone rhyolites. (All data from Kay
et al., 1991; more information is in other papers in Geological Society of America Special Paper 265, edited Harmon and Rapela, 1991.)
9. Felsic granulites in Cardamom massif of southern India. Major and trace elements are from Chacko et al. (1992). Nd values (relative to depleted mantle) are from Brandon and Meen (1995).
10. Rhyolites from Iceland. Icelandic rhyolites are referred to locally as liparites and constitute ~15% of the volcanism in Iceland. Major elements, trace elements, and Nd values are from Kempton
et al. (2000). Sr values are typical of Icelandic volcanic rocks (from R. Taylor et al., 1997).
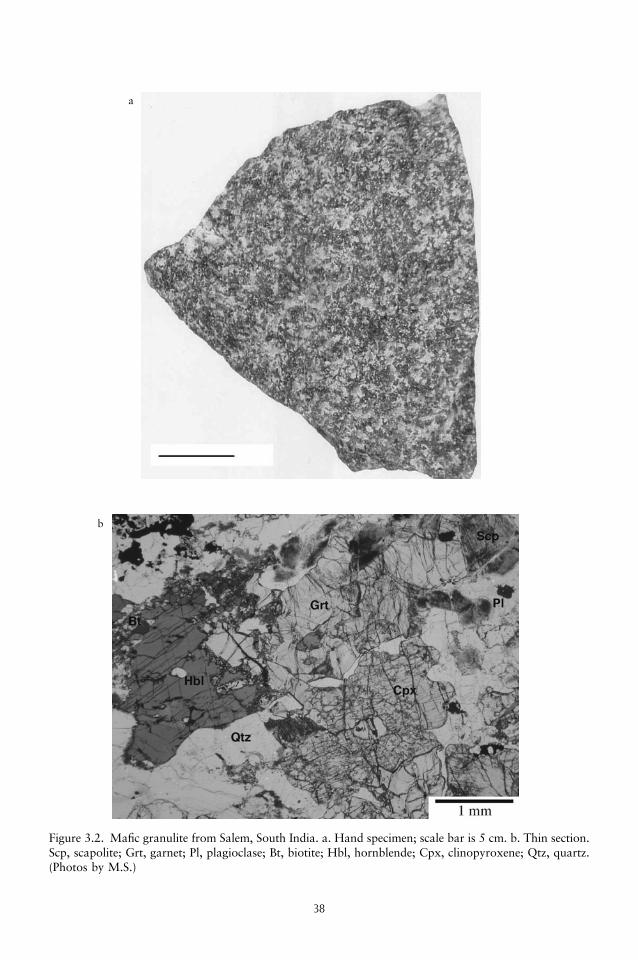
38
Figure 3.2. Mafic granulite from Salem, South India. a. Hand specimen; scale bar is 5 cm. b. Thin section.Scp, scapolite; Grt, garnet; Pl, plagioclase; Bt, biotite; Hbl, hornblende; Cpx, clinopyroxene; Qtz, quartz.(Photos by M.S.)
a
b
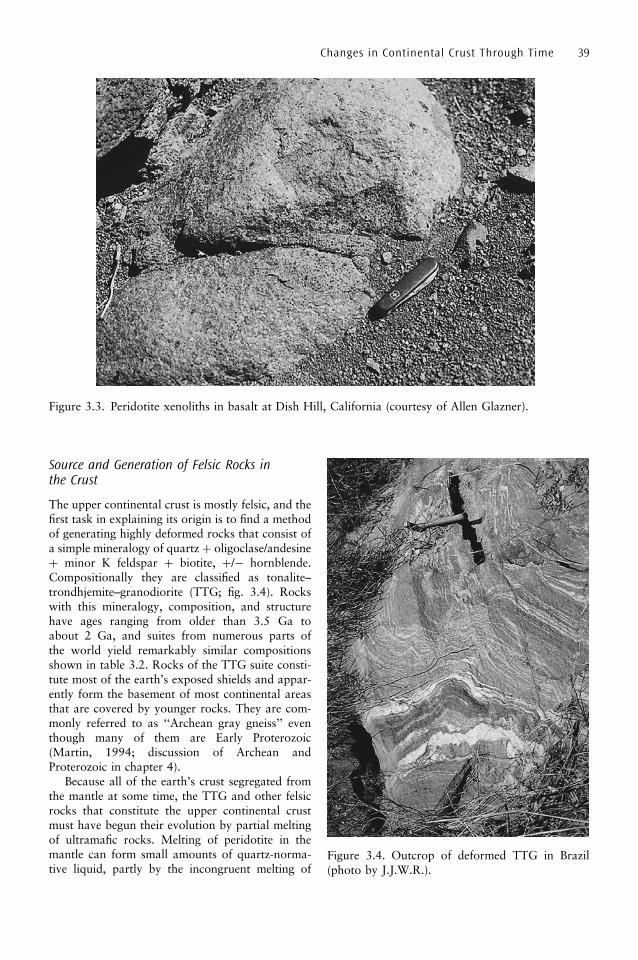
Source and Generation of Felsic Rocks inthe Crust
The upper continental crust is mostly felsic, and thefirst task in explaining its origin is to find a methodof generating highly deformed rocks that consist ofa simple mineralogy of quartz þ oligoclase/andesineþ minor K feldspar þ biotite, þ/� hornblende.Compositionally they are classified as tonalite–trondhjemite–granodiorite (TTG; fig. 3.4). Rockswith this mineralogy, composition, and structurehave ages ranging from older than 3.5 Ga toabout 2 Ga, and suites from numerous parts ofthe world yield remarkably similar compositionsshown in table 3.2. Rocks of the TTG suite consti-tute most of the earth’s exposed shields and appar-ently form the basement of most continental areasthat are covered by younger rocks. They are com-monly referred to as ‘‘Archean gray gneiss’’ eventhough many of them are Early Proterozoic(Martin, 1994; discussion of Archean andProterozoic in chapter 4).
Because all of the earth’s crust segregated fromthe mantle at some time, the TTG and other felsicrocks that constitute the upper continental crustmust have begun their evolution by partial meltingof ultramafic rocks. Melting of peridotite in themantle can form small amounts of quartz-norma-tive liquid, partly by the incongruent melting of
Changes in Continental Crust Through Time 39
Figure 3.3. Peridotite xenoliths in basalt at Dish Hill, California (courtesy of Allen Glazner).
Figure 3.4. Outcrop of deformed TTG in Brazil(photo by J.J.W.R.).

pyroxene to form olivine and a silica-rich basalt.Large volumes of silicic magmas, however, cannotbe produced by direct partial melting of mantleperidotite, and most geologists propose that high-silica magmas must be generated by a two-stageprocess in which the mantle produces basalt mag-mas and the resulting basalts/gabbros are laterremelted to generate siliceous melts. This can beaccomplished by a variety of processes of partialmelting, and Winther (1996) experimentally gener-ated tonalites and trondhjemites similar to those oftable 3.2 from basalt/gabbro under a large range oftemperatures, total pressures, and water-vaporpressures.
Although the felsic rocks of both oceanic andcontinental areas are ultimately derived from themantle, they show significant differences in compo-sition (table 3.2). At similar percentages of SiO2,TTG suites and other continental rocks are muchricher in LIL elements than the rocks of oceanicislands (such as Iceland) and intraoceanic arcs(such as the Caribbean) are. These differences incomposition indicate that continental rocks havebeen derived from a more LIL-element-rich (‘‘fer-tile’’) upper mantle than the mantle underlyingoceanic crust. This is the same conclusion that wereached for the evolution of mafic rocks in thelower crust (see above) and further supports thelikelihood that all continental crust evolved onlyfrom mantle enriched in LIL elements.
The time at which mantle enrichment occurred isclarified by isotopic data, which invariably showthat the TTG have high positive "Nd values, highnegative "Sr values, and TDM ages only a few hun-dred million years older than the measured ages ofgneiss emplacement. These data show that enrich-ment must have occurred only shortly beforeseparation of the basalts that melted to form theTTG. If enrichment had occurred much earlier thanbasalt separation, high Rb/Sr and Sm/Nd ratioswould have generated lower (less positive) "Nd
values, and higher (less negative) "Sr values, thanthose of asthenospheric mantle. The TDM ages alsoindicate extraction of TTG magmas from themantle after only a brief residence in some basalt/gabbro intermediate.
Some gneisses in the TTG suite are classified asgranodiorites because they have slightly higher con-centrations of K and other LIL elements than tona-lites and trondhjemites. They have similar isotopicproperties to the tonalites and trondhjemites, how-ever, and presumably they were also derived from asimilar mantle source (Stern and Hanson, 1991).The higher concentrations of LIL elements mayhave resulted from fractional crystallization of
tonalite/trondhjemite magmas before the gneiss pre-cursors were emplaced, but it is also possible thatsome of these rocks were metasomatized after theyoriginally crystallized (see below). In parts of someshield areas, the TTG are not as intensely deformedas gneisses, and they have locally been referred to asbatholiths (Nutman et al., 1999).
The TTG suites differ in three ways from typicalsubduction-zone (‘‘Sierran-type’’) batholiths devel-oped along Phanerozoic continental margins. Oneis that they contain almost no diorite and exhibit arange of SiO2 contents that is smaller than thegradational series of rocks from diorite to granitethat characterizes modern batholiths. A second dif-ference is that, within their limited range of SiO2
contents, the TTG show increasing Na2O withincreasing SiO2, whereas the dominant variationin modern batholiths is strong increase in K2O(fig. 3.5). The third distinction is that Phanerozoicbatholiths have "Sr values that are positive, insteadof negative, and "Nd � 0, instead of positive. All ofthese differences suggest that Phanerozoic suiteswere generated from subcontinental mantle thathad been enriched in LIL elements long before thebatholiths were produced (further discussion inchapter 5).
Summary The world’s upper continental crustconsists mostly of TTG suites formed during theArchean and Early Proterozoic. They clearly de-veloped by a two-stage process of partial meltingof mantle peridotite to form basalt/gabbro andthen melting of the basalt/gabbro to form felsicrocks. Apparently the mantle had been enriched inLIL elements shortly before initial partial meltingoccurred. The original mantle source shows some
40 Continents and Supercontinents
Figure 3.5. Diagram showing common sodic frac-tionation trend in Archean plutonic suites andpotassic trend in younger suites.
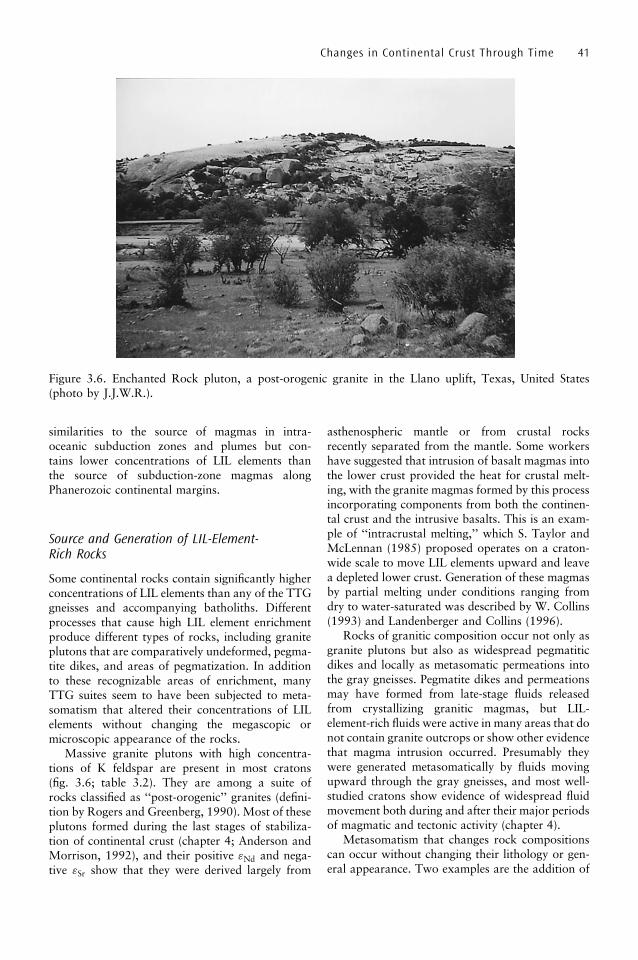
similarities to the source of magmas in intra-oceanic subduction zones and plumes but con-tains lower concentrations of LIL elements thanthe source of subduction-zone magmas alongPhanerozoic continental margins.
Source and Generation of LIL-Element-Rich Rocks
Some continental rocks contain significantly higherconcentrations of LIL elements than any of the TTGgneisses and accompanying batholiths. Differentprocesses that cause high LIL element enrichmentproduce different types of rocks, including graniteplutons that are comparatively undeformed, pegma-tite dikes, and areas of pegmatization. In additionto these recognizable areas of enrichment, manyTTG suites seem to have been subjected to meta-somatism that altered their concentrations of LILelements without changing the megascopic ormicroscopic appearance of the rocks.
Massive granite plutons with high concentra-tions of K feldspar are present in most cratons(fig. 3.6; table 3.2). They are among a suite ofrocks classified as ‘‘post-orogenic’’ granites (defini-tion by Rogers and Greenberg, 1990). Most of theseplutons formed during the last stages of stabiliza-tion of continental crust (chapter 4; Anderson andMorrison, 1992), and their positive "Nd and nega-tive "Sr show that they were derived largely from
asthenospheric mantle or from crustal rocksrecently separated from the mantle. Some workershave suggested that intrusion of basalt magmas intothe lower crust provided the heat for crustal melt-ing, with the granite magmas formed by this processincorporating components from both the continen-tal crust and the intrusive basalts. This is an exam-ple of ‘‘intracrustal melting,’’ which S. Taylor andMcLennan (1985) proposed operates on a craton-wide scale to move LIL elements upward and leavea depleted lower crust. Generation of these magmasby partial melting under conditions ranging fromdry to water-saturated was described by W. Collins(1993) and Landenberger and Collins (1996).
Rocks of granitic composition occur not only asgranite plutons but also as widespread pegmatiticdikes and locally as metasomatic permeations intothe gray gneisses. Pegmatite dikes and permeationsmay have formed from late-stage fluids releasedfrom crystallizing granitic magmas, but LIL-element-rich fluids were active in many areas that donot contain granite outcrops or show other evidencethat magma intrusion occurred. Presumably theywere generated metasomatically by fluids movingupward through the gray gneisses, and most well-studied cratons show evidence of widespread fluidmovement both during and after their major periodsof magmatic and tectonic activity (chapter 4).
Metasomatism that changes rock compositionscan occur without changing their lithology or gen-eral appearance. Two examples are the addition of
Changes in Continental Crust Through Time 41
Figure 3.6. Enchanted Rock pluton, a post-orogenic granite in the Llano uplift, Texas, United States(photo by J.J.W.R.).

K to graywackes of supracrustal suites in Canadaand southern India at uncertain times after the ori-ginal deposition of the sediments (Fedo et al., 1997;Naqvi et al., 2002b). This addition increased theK2O content of the clay matrix, resulting in a highersericite/chlorite ratio, without affecting the propor-tions of other minerals. These observations raise thepossibility that the process of LIL element enrich-ment is widespread throughout the world’s uppercontinental crust but has not been widely recognizedbecause of the lack of change in the visible appear-ance of the rocks. The extreme restriction of U to theuppermost continental crust (Zartman and Doe,1981) may also indicate widespread metasomatism,but the mechanism remains unknown.
Destruction of Continental Crust
Crust can be destroyed by two methods: erosionand direct reincorporation into the mantle by someprocess similar to modern subduction. The relativesignificance of these two processes has almostcertainly changed from the early stages of earthhistory to the present time, with erosiondominant now and direct reincorporation moresignificant in the past.
Present Destruction
The most important method of crust destruction atthe present time is clearly erosion. The erosion rateis particularly intense from mountains along activecontinental margins, and the debris is almostimmediately deposited in the adjacent trench andcarried down the underlying subduction zone.Even sediments deposited in Atlantic-type oceansmust ultimately be carried back into the mantle asall oceanic crust older than ~200 million years isdestroyed (chapter 1). Judging by present erosionrates, von Huene and Scholl (1991) suggested thatsediment being eroded from present continents issubducted and destroyed almost as rapidly as newrock is added to continents by magmatic activity.Despite this high erosion and recycling rate, largeregions of the earth’s continents still expose veryancient rocks, and we examine this problem inchapter 4.
The most intense destruction of continental crusttoday is taking place in the Himalayas, where theIndian subcontinent descends under Asia (fig. 3.7).The complex layering of mantle and crust under theHimalayas, including some seismic sections thatreveal molten material in the middle crust (K.
Nelson et al., 1996), suggests that some of thesubducted crust is being melted or directly incorpo-rated into the mantle by some other process. Thereis no compelling evidence, however, that subduc-tion without erosion is responsible for any signifi-cant destruction of Himalayan crust. Conversely,uplift rates in the Himalayas (locally much greaterthan 1 km/million years) cause erosion and producean enormous amount of debris that is ultimatelywashed into the Indian Ocean. This debris repre-sents a minimum 25 km of erosion in theHimalayas in the past 20 million years, and a com-bination of erosion and normal faulting maintains aconstant elevation of the Himalayas as they aretectonically uplifted (M. Johnson, 1994; Einsele etal., 1996; Fielding, 1996; Zeitler et al., 2001;further discussion of Himalayas in chapter 5).These data show that more than 90% of thedestruction of crust in the Himalayas is accom-plished by surface erosion.
42 Continents and Supercontinents
Figure 3.7. Himalayan river carrying eroded debris(photo by A.K. Jain, copyright Gondwana ResearchGroup, Japan).
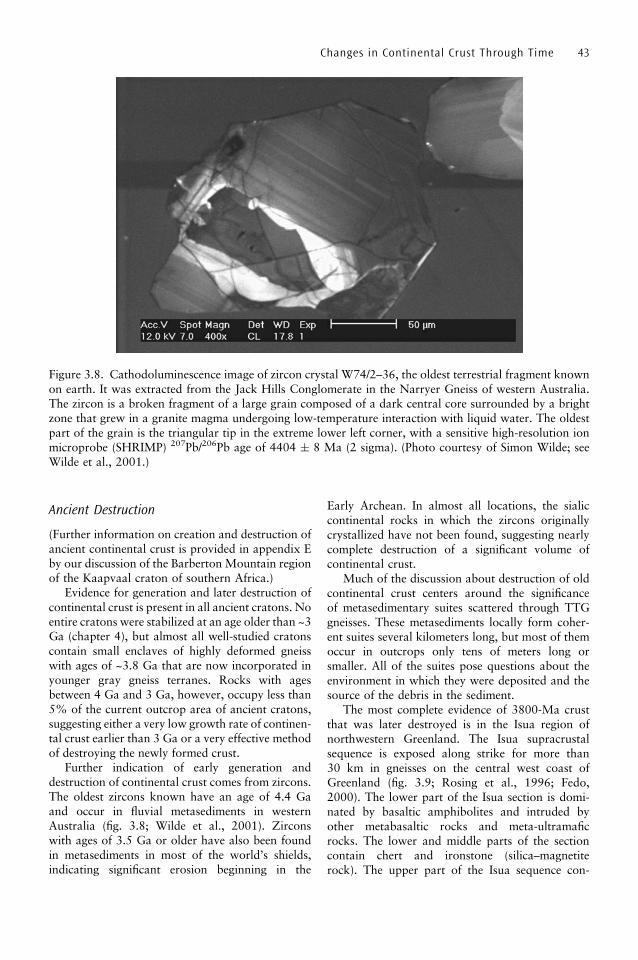
Ancient Destruction
(Further information on creation and destruction ofancient continental crust is provided in appendix Eby our discussion of the Barberton Mountain regionof the Kaapvaal craton of southern Africa.)
Evidence for generation and later destruction ofcontinental crust is present in all ancient cratons. Noentire cratons were stabilized at an age older than ~3Ga (chapter 4), but almost all well-studied cratonscontain small enclaves of highly deformed gneisswith ages of ~3.8 Ga that are now incorporated inyounger gray gneiss terranes. Rocks with agesbetween 4 Ga and 3 Ga, however, occupy less than5% of the current outcrop area of ancient cratons,suggesting either a very low growth rate of continen-tal crust earlier than 3 Ga or a very effective methodof destroying the newly formed crust.
Further indication of early generation anddestruction of continental crust comes from zircons.The oldest zircons known have an age of 4.4 Gaand occur in fluvial metasediments in westernAustralia (fig. 3.8; Wilde et al., 2001). Zirconswith ages of 3.5 Ga or older have also been foundin metasediments in most of the world’s shields,indicating significant erosion beginning in the
Early Archean. In almost all locations, the sialiccontinental rocks in which the zircons originallycrystallized have not been found, suggesting nearlycomplete destruction of a significant volume ofcontinental crust.
Much of the discussion about destruction of oldcontinental crust centers around the significanceof metasedimentary suites scattered through TTGgneisses. These metasediments locally form coher-ent suites several kilometers long, but most of themoccur in outcrops only tens of meters long orsmaller. All of the suites pose questions about theenvironment in which they were deposited and thesource of the debris in the sediment.
The most complete evidence of 3800-Ma crustthat was later destroyed is in the Isua region ofnorthwestern Greenland. The Isua supracrustalsequence is exposed along strike for more than30 km in gneisses on the central west coast ofGreenland (fig. 3.9; Rosing et al., 1996; Fedo,2000). The lower part of the Isua section is domi-nated by basaltic amphibolites and intruded byother metabasaltic rocks and meta-ultramaficrocks. The lower and middle parts of the sectioncontain chert and ironstone (silica–magnetiterock). The upper part of the Isua sequence con-
Changes in Continental Crust Through Time 43
Figure 3.8. Cathodoluminescence image of zircon crystal W74/2–36, the oldest terrestrial fragment knownon earth. It was extracted from the Jack Hills Conglomerate in the Narryer Gneiss of western Australia.The zircon is a broken fragment of a large grain composed of a dark central core surrounded by a brightzone that grew in a granite magma undergoing low-temperature interaction with liquid water. The oldestpart of the grain is the triangular tip in the extreme lower left corner, with a sensitive high-resolution ionmicroprobe (SHRIMP) 207Pb/206Pb age of 4404 � 8 Ma (2 sigma). (Photo courtesy of Simon Wilde; seeWilde et al., 2001.)

tains metamorphosed pelites and graywackes pluscalcsilicates (metamorphosed sandy/shaly carbo-nates). The lithologies indicate that depositionoccurred on a platform covered by shallowwater. The basement of this platform is unknownbecause it was destroyed when the supracrustalsuite was engulfed by younger gneisses, but thepresence of rounded zircons in some Isua rocksclearly signifies erosion of continental gneissic/granitic precursors.
Early Archean supracrustal suites smaller thanIsua are commonly scattered as remnants throughgray gneiss terranes. They do not exhibit a coherentstratigraphy but consist of lithologies similar tothose at Isua, including quartzite, quartz-pebbleconglomerate, ironstone (fig. 3.10), calcsilicates,and mica schists (presumably metamorphosed silt-stones and shales). As at Isua, all of these rocksappear to have been deposited in shallow water, but
their basements have not been preserved, and theircomposition is unknown.
The origin of quartz in the sandstones and con-glomerates is highly controversial. Much of it isprobably clastic, derived by erosion of pre-existingsialic rocks. This source is supported by the pre-sence of zircons in some siliceous metasediments,but whether they are rounded (and thus trans-ported) or oddly shaped because of metamorphicgrowth is generally unclear. If the quartz and zirconare detrital, then presumably some of the surround-ing gneiss is older and formed a basement and/or asource area for detritus. The abundance of quartz inthe sandstones and conglomerates now may bemuch higher than when they were originally depos-ited because of diagenetic destruction of less stableminerals (Cox et al., 2002; fig. 3.11).
Although erosion of continental crust clearlycontributed debris to some Archean sediment,large volumes of sediments older than 3 Ga donot contain quartz or other debris from a continen-tal source. Examples include the oldest greenstonebelts in the Western Dharwar craton of southernIndia (Naqvi et al., 1983), the Warrawoonasequence of the Pilbara craton of westernAustralia (Barley, 1993), and parts of the Isuasequence described above. All of these suites con-tain cherts deposited by precipitation and debrisfrom mafic source rocks despite the presence ofadjoining gneissic terranes at the same time as thesediments were deposited.
Because large amounts of sialic crust clearlyexisted much earlier than 3 Ga, the absence ofquartz and resistant ‘‘granitic’’ minerals such aszircon in many Archean sediments requires somekind of plausible explanation. One possibility isthat the sialic crust that existed before 3 Ga wastoo thin to establish a subaerial landmass that couldbe eroded. A second possibility is that oceanic crustwas so thick in the early earth that continental areashad very little ‘‘freeboard’’ and seawater coveredmost of them (chapter 2). This explanation is con-sistent with observations that show evolution ofgreenstone belts of the same age as surroundinggneisses but without any sedimentary debris fromthe gneisses (chapter 4). Furthermore, if most crustwas submerged, then its destruction must have beencaused by direct reincorporation into themantle rather than by surface erosion.
Summary Destruction of continental crust at pre-sent is largely caused by surface erosion, but directreincorporation into the mantle was probablymore important than erosion in the past. Because
44 Continents and Supercontinents
Figure 3.9. Generalized stratigraphic section at Isuasection, Greenland. The thicknesses shown in thesection have been greatly reduced from those of theoriginal sediments by subsequent deformation. Formore detailed information see Nutman andCollerson (1989).

45
Figure 3.10. Banded iron formation, showing alternating bands of silica and iron oxide with widths of afew centimeters. The outcrop is partly covered by leaves. Sudan Formation, northern Minnesota (courtesyof John Goodge).
Figure 3.11. Photomicrograph of quartz sandstone showing diagenetic destruction of less stable mineralsand replacement by SiO2 (courtesy of Ronadh Cox; copyright by Geological Society of America, 2002).

of the scarcity of rocks older than 3 Ga, the totalrate of destruction at that time must have beenonly slightly less than the rate of production. After3 Ga, however, production clearly exceeded de-struction, although continental crust is now beingdestroyed at a rate approximately equal to therate at which new crust is forming.
Changes in Volume of ContinentalCrust Through Time
Because both production of juvenile crust and crus-tal destruction occurred simultaneously throughoutthe history of the earth, and neither of the rates arewell known, many investigators now rely almostcompletely on isotopic information to calculategrowth rates, destruction rates, and changes in thevolume of continental crust though time. We dis-cuss below the inferences that can be drawn fromthe distribution of zircon ages, TDM values, andlimited information from Os isotopes (see appendixD for explanation of isotopic systems).
Isotopic Information
Zircons crystallize from magmas that are richenough in silica to be quartz normative. Smallzircons form in some tholeiitic (silica-saturated)basalts, and they occur in almost all quartz-bearingigneous rocks with compositions ranging fromquartz diorite to granite. Therefore, initial ages ofcrystallization of zircons generally show the timeswhen granites and other silicic igneous rocks wereemplaced, and the distribution of these agesthrough time can be used to estimate rates of for-mation of continental crust. Detailed study of indi-vidual zircons may also reveal whether theycrystallized from magmas ultimately derived froma mantle source or from magmas produced bypartial melting of older crustal rocks. Remeltingof zircon-bearing rocks generally does not consumeall of the zircons, and the small remnants com-monly form tiny cores around which the newerzircons develop. These rocks may have been derivedwholly by remelting of older crust or by mixing ofmagmas with both juvenile and crustal sources.Conversely, silicic magmas produced by partialmelting of mafic rocks from the mantle may notcontain zircon cores, thus implying that the entiregranite is a juvenile addition to the crust.
Plotting the frequency of zircon crystallizationages, commonly the upper intercepts of discordia,within individual cratons usually reveals one or
more very narrow peaks. Figure 3.12 (Hartmann,2002) shows the distribution for the Amazonianshield (Brazilian and Guiana cratons; appendix E).Several peaks suggest crystallization of silicic rocksat various times, but the peaks centered around 2.1Ga and 0.7 Ga are clearly dominant. The 2.1-Gaage is referred to as the Transamazonian event andrepresents the time at which the Amazonian cratonbecame a stable block (chapter 4). We use TDM agesbelow to show that 2.1 Ga was a time of majorcrustal growth, but granites produced during theevent at 0.7 Ga consisted almost entirely ofremelted older crust.
Values for TCHUR and TDM based on Nd iso-topes have been calculated for numerous areas,such as individual cratons and orogenic belts. Asan example, we compare TDM data for the Amazonshield with zircon ages discussed above (fig. 3.13;Sato and Siga, 2002). With the exception of a fewages between 0.5 and 1 Ga, mantle separation agesrange broadly from ~2 Ga back to ~3.5 Ga andshow a significant peak at 2.1 Ga. This correspondsto the 2.1-Ga zircon peak and confirms segregationof large volumes of crust from the mantle at thattime. The scarcity of TDM ages at 0.7 Ga, however,demonstrates that the 0.7-Ga event shown by zir-con data represents melting of older crust ratherthan generation of juvenile crust.
The frequency of zircon crystallization and TDM
ages throughout the entire earth suggests that theearth’s preserved continental crust was developedat a relatively constant rate, with two peaks ~100million years long at ~2.7 Ga and ~1.9 Ga (fig.
46 Continents and Supercontinents
Figure 3.12. Histogram of ages of concordantzircons in South America (based on data inHartmann, 2002).
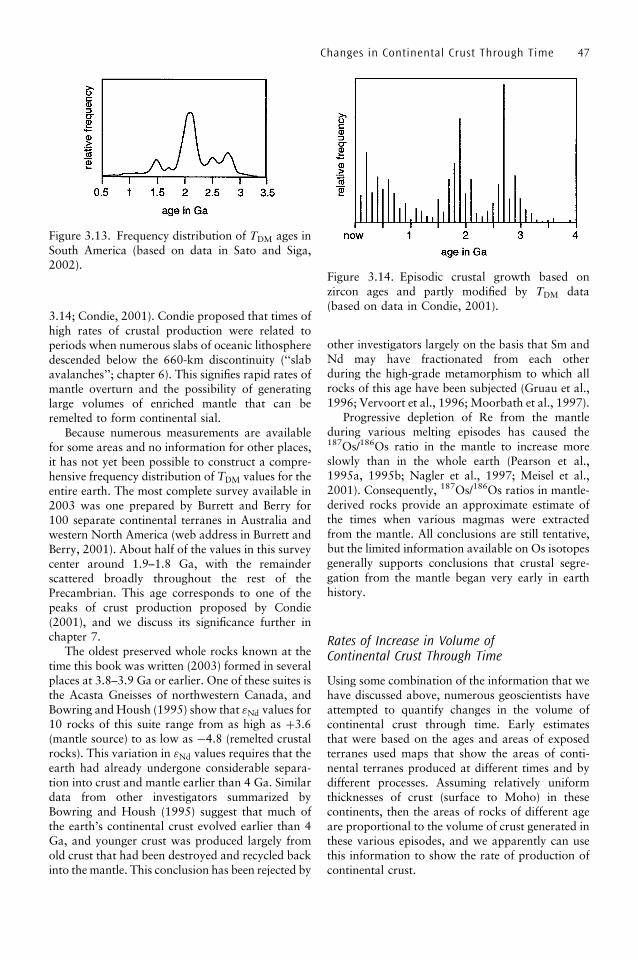
3.14; Condie, 2001). Condie proposed that times ofhigh rates of crustal production were related toperiods when numerous slabs of oceanic lithospheredescended below the 660-km discontinuity (‘‘slabavalanches’’; chapter 6). This signifies rapid rates ofmantle overturn and the possibility of generatinglarge volumes of enriched mantle that can beremelted to form continental sial.
Because numerous measurements are availablefor some areas and no information for other places,it has not yet been possible to construct a compre-hensive frequency distribution of TDM values for theentire earth. The most complete survey available in2003 was one prepared by Burrett and Berry for100 separate continental terranes in Australia andwestern North America (web address in Burrett andBerry, 2001). About half of the values in this surveycenter around 1.9–1.8 Ga, with the remainderscattered broadly throughout the rest of thePrecambrian. This age corresponds to one of thepeaks of crust production proposed by Condie(2001), and we discuss its significance further inchapter 7.
The oldest preserved whole rocks known at thetime this book was written (2003) formed in severalplaces at 3.8–3.9 Ga or earlier. One of these suites isthe Acasta Gneisses of northwestern Canada, andBowring and Housh (1995) show that "Nd values for10 rocks of this suite range from as high as þ3.6(mantle source) to as low as �4.8 (remelted crustalrocks). This variation in "Nd values requires that theearth had already undergone considerable separa-tion into crust and mantle earlier than 4 Ga. Similardata from other investigators summarized byBowring and Housh (1995) suggest that much ofthe earth’s continental crust evolved earlier than 4Ga, and younger crust was produced largely fromold crust that had been destroyed and recycled backinto the mantle. This conclusion has been rejected by
other investigators largely on the basis that Sm andNd may have fractionated from each otherduring the high-grade metamorphism to which allrocks of this age have been subjected (Gruau et al.,1996; Vervoort et al., 1996; Moorbath et al., 1997).
Progressive depletion of Re from the mantleduring various melting episodes has caused the187Os/186Os ratio in the mantle to increase moreslowly than in the whole earth (Pearson et al.,1995a, 1995b; Nagler et al., 1997; Meisel et al.,2001). Consequently, 187Os/186Os ratios in mantle-derived rocks provide an approximate estimate ofthe times when various magmas were extractedfrom the mantle. All conclusions are still tentative,but the limited information available on Os isotopesgenerally supports conclusions that crustal segre-gation from the mantle began very early in earthhistory.
Rates of Increase in Volume ofContinental Crust Through Time
Using some combination of the information that wehave discussed above, numerous geoscientists haveattempted to quantify changes in the volume ofcontinental crust through time. Early estimatesthat were based on the ages and areas of exposedterranes used maps that show the areas of conti-nental terranes produced at different times and bydifferent processes. Assuming relatively uniformthicknesses of crust (surface to Moho) in thesecontinents, then the areas of rocks of different ageare proportional to the volume of crust generated inthese various episodes, and we apparently can usethis information to show the rate of production ofcontinental crust.
Changes in Continental Crust Through Time 47
Figure 3.13. Frequency distribution of TDM ages inSouth America (based on data in Sato and Siga,2002).
Figure 3.14. Episodic crustal growth based onzircon ages and partly modified by TDM data(based on data in Condie, 2001).

Unfortunately, these simple calculations do notwork very well. One reason is the problem of dis-tinguishing ‘‘juvenile’’ crust that has come directlyfrom the mantle from crust that contains pre-existing sial. Only juvenile crust represents truecrustal growth, and suites such as granite batholithsthat formed by melting of older basement of theterrane cannot be included in the volume of newcrust. Distinction of juvenile and recycled compo-nents is extremely difficult even in modern bath-olithic suites such as the Andes, an issue that wediscuss further in chapter 5.
Data obtained from all of the isotopic systemsdiscussed above indicate that the crust and uppermantle of the earth followed different paths of iso-topic evolution since early in the history of theearth. Selective movement of LIL elements upwardbegan depleting the mantle at an early age, leaving amantle with higher ratios of Sm/Nd and lowerratios of Rb/Sr, Lu/Hf, Re/Os, and U/Pb than inthe crust. The exact rates of crustal evolution arehighly controversial, but all estimates show suchrapid production that there must also have been ahigh rate of crustal destruction throughout most ofearth history.
All of the difficulties of determining the volumeof continental crust at any one time in earth historyhave led geologists to propose an extraordinaryvariety of curves to show changes in volume withtime. They all start with the assumption that theinitial earth accreted with a relatively homogeneouscomposition and that all sial separated at a latertime. We show four generalized examples in fig.3.15.
� At least 100 years ago geologists began torealize that the sizes of continents hadincreased through geologic time. The anti-quity of continental ‘‘basements’’ was recog-nized even before radiometric dating becamepossible, and in the past half century theseages were quantified. Because of these ages,most geologists assumed that the volume ofcontinental crust increased more rapidly inthe past than in more recent times, and somegeologists suggested that almost all growthtook place in the Archean. An approximategrowth curve representing these beliefs isshown as ‘‘traditional’’ in fig. 3.15.
� Suggestions of episodic growth of continentalcrust have been based on both geologicobservations and isotopic data. The possibi-lity that much of the growth of continentsoccurred at about 1.9–1.8 Ga is suggestedby the large number of orogenic belts of this
age (chapter 5), and recent summaries ofTDM ages tend to support this conclusion(see above). We designate a curve based onthese data as ‘‘tectonic’’ in fig. 3.15 (furtherdiscussion in chapter 4).
� An episodic growth curve using zircon andTDM ages (from Condie, 2001) is similar tothe tectonic curve in showing one peak at1.9–1.8 Ga, but it also shows another majorpeak at ~2.7 Ga. We label it as a ‘‘zircon–TDM’’ curve in fig. 3.15.
� Some isotopic studies (see above) have beeninterpreted to show that nearly all of thecontinental crust fractionated from the man-tle very early in earth history and has under-gone recycling since then. This possibilitywas suggested by Hargraves (1976) basedon the possibility that the earth was totallycovered by oceans very early in its history,which would not have been possible unlessdistinction between continents and oceanbasins did not exist because continental sialof uniform thickness covered the entireearth. We label this curve ‘‘recycling’’ in fig.3.15.
Summary
Continental crust evolved from the mantle as partof the process of gravitative segregation of theearth. Separation of crust from the mantle beganwithin a few hundred million years after the earthaccreted, but we have only indirect (mostly isotopic)and controversial evidence of the quantity of crustproduced at different times in earth history.Generation of large volumes of siliceous magmasrequired at least a two-stage process in which man-
48 Continents and Supercontinents
Figure 3.15. Proposed rates of growth of continen-tal crust.

tle ultramafic rocks partially melted to form basalticrocks and the basalts melted again to form magmasthat crystallized to quartz-bearing rocks. All pre-served continental crust appears to have evolvedfrom regions of the upper mantle that had beenenriched in LIL elements shortly before segregationbegan. Further generation of LIL-element-rich rocksmay have been the result of intracrustal melting,metasomatism, and other uncertain processes.
Continual recycling of crust back into the mantlehas taken place throughout earth history, presum-
ably starting at about the same time that crustalgeneration began. This recycling was caused bothby erosion of continental crust above sealevel andprobably also by direct reincorporation of thincrust into the mantle by a process similar to modernsubduction. Direct reincorporation was the princi-pal method of recycling during the early history ofthe earth, but erosion is the dominant process now.Recycling has destroyed almost all of the rocksolder than 3 Ga, but many cratonic areas escapedsignificant destruction since they were formed.
Changes in Continental Crust Through Time 49

4
Growth of Cratons and their Post-StabilizationHistories
As we have seen in chapter 3, continental crustevolved from regions of the mantle that con-
tained higher concentrations of LIL elements thanregions that underlie typical ocean basins. The mostcomplete record of this evolutionary process is incratons, which passed through periods of rapid crustproduction to times of comparative stability overintervals of several hundred million years. Afterthe cratons became stable enough to accumulatesequences of undeformed platform sediments, theymoved about the earth without being subjected tofurther compressive tectonic activity. Because manyof the cratons are also partly covered by sedimentsthat are unmetamorphosed or only slightly meta-morphosed, they appear to have undergone verylittle erosion since the sediments were deposited.Thus, a craton may be considered as a large blockof continental crust that has been permanentlyremoved from the crustal recycling process.
This chapter starts with a discussion of thehistory of cratons as interpreted from studies ofthe upper part of the crust. We describe theSuperior craton of the Canadian shield and theWestern Dharwar craton of southern India withinthe chapter and use appendix E for brief summa-ries of other typical cratons. These cratons andnumerous others elsewhere developed at differenttimes during earth history, and we look for simi-larities and differences that may have been causedby progressive cooling of the earth (chapter 2).This section concludes with a summary of thegeneral evolution of cratons and the meaning ofthe terms ‘‘Archean’’ and ‘‘Proterozoic.’’
The following section is an investigation of pro-cesses that occurred following stabilization, all ofwhich take place in the presence of fluids thatpermeate the crust. We include a summary ofthese fluids and their effects on anorogenic magma-tism and separation of the lower and upper crust.
The final section discusses the relationshipbetween cratons and their underlying subcontinen-
tal lithospheric mantle (SCLM). Continual meta-somatism and metamorphism of the SCLM aftercratons develop above it apparently has notdestroyed the relationship between the ages of thecratons and the concentrations of major elements inthe SCLM. This provides us with an opportunity todetermine whether cratons evolved from the mantlebeneath them or by depletion of much largervolumes of mantle.
The discussions in this chapter are based partlyon information summarized in appendices B (heatflow) and D (isotopes).
History of Cratons
This section describes the evolution of the uppercrust of cratons that were stabilized at widely dif-ferent times. Within the chapter we include summa-ries of the Western Dharwar craton of southernIndia (3.0 Ga) and the Superior craton of Canada(2.7 Ga). Appendix E contains summaries of theBarberton Mountain region of the Kaapvaal cratonof southern Africa (3.1 Ga), the Guiana craton ofSouth America (2.1–2.0 Ga), and the Nubian–Arabian craton of Africa–Arabia (0.6–0.5 Ga).
Western Dharwar Craton (Stabilized at3.0 Ga)
The Western Dharwar craton (WDC) of southernIndia began to evolve about 3.5 billion years agoand possibly earlier (fig. 4.1; summaries by Rogers,1986, and Rogers and Mauldin, 1994). The wes-tern margin is the Indian Ocean, where the WDCrifted away fromMadagascar. The northern marginis overlain by Neoproterozoic/Early Phanerozoicsedimentary basins and the Cretaceous/TertiaryDeccan basalts. The southern margin is a transitionto a 2.5-Ga Granulite terrane (see below). The
50
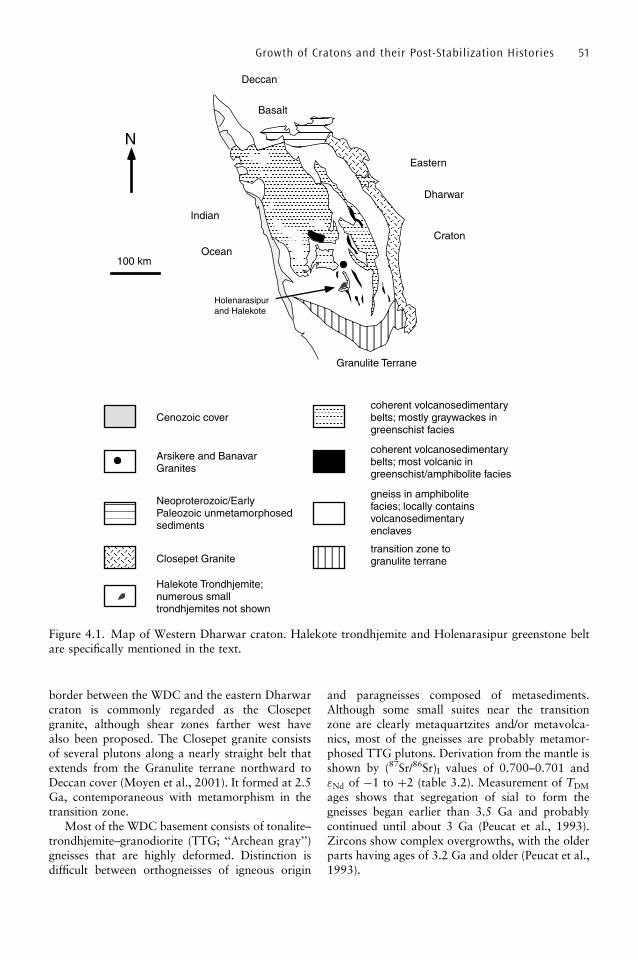
border between the WDC and the eastern Dharwarcraton is commonly regarded as the Closepetgranite, although shear zones farther west havealso been proposed. The Closepet granite consistsof several plutons along a nearly straight belt thatextends from the Granulite terrane northward toDeccan cover (Moyen et al., 2001). It formed at 2.5Ga, contemporaneous with metamorphism in thetransition zone.
Most of the WDC basement consists of tonalite–trondhjemite–granodiorite (TTG; ‘‘Archean gray’’)gneisses that are highly deformed. Distinction isdifficult between orthogneisses of igneous origin
and paragneisses composed of metasediments.Although some small suites near the transitionzone are clearly metaquartzites and/or metavolca-nics, most of the gneisses are probably metamor-phosed TTG plutons. Derivation from the mantle isshown by (87Sr/86Sr)I values of 0.700–0.701 and"Nd of �1 to þ2 (table 3.2). Measurement of TDM
ages shows that segregation of sial to form thegneisses began earlier than 3.5 Ga and probablycontinued until about 3 Ga (Peucat et al., 1993).Zircons show complex overgrowths, with the olderparts having ages of 3.2 Ga and older (Peucat et al.,1993).
Growth of Cratons and their Post-Stabilization Histories 51
Figure 4.1. Map of Western Dharwar craton. Halekote trondhjemite and Holenarasipur greenstone beltare specifically mentioned in the text.
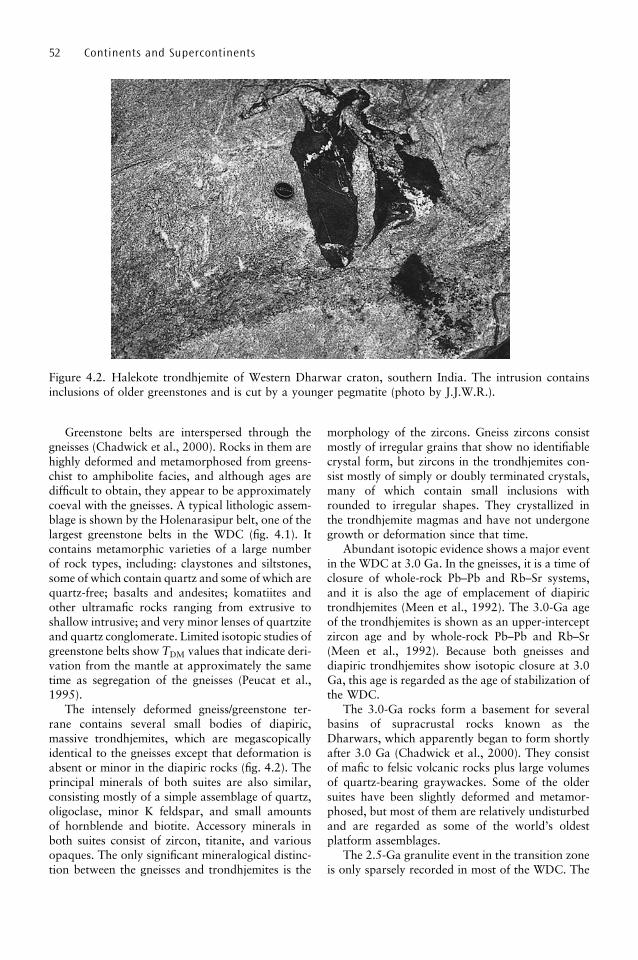
Greenstone belts are interspersed through thegneisses (Chadwick et al., 2000). Rocks in them arehighly deformed and metamorphosed from greens-chist to amphibolite facies, and although ages aredifficult to obtain, they appear to be approximatelycoeval with the gneisses. A typical lithologic assem-blage is shown by the Holenarasipur belt, one of thelargest greenstone belts in the WDC (fig. 4.1). Itcontains metamorphic varieties of a large numberof rock types, including: claystones and siltstones,some of which contain quartz and some of which arequartz-free; basalts and andesites; komatiites andother ultramafic rocks ranging from extrusive toshallow intrusive; and very minor lenses of quartziteand quartz conglomerate. Limited isotopic studies ofgreenstone belts show TDM values that indicate deri-vation from the mantle at approximately the sametime as segregation of the gneisses (Peucat et al.,1995).
The intensely deformed gneiss/greenstone ter-rane contains several small bodies of diapiric,massive trondhjemites, which are megascopicallyidentical to the gneisses except that deformation isabsent or minor in the diapiric rocks (fig. 4.2). Theprincipal minerals of both suites are also similar,consisting mostly of a simple assemblage of quartz,oligoclase, minor K feldspar, and small amountsof hornblende and biotite. Accessory minerals inboth suites consist of zircon, titanite, and variousopaques. The only significant mineralogical distinc-tion between the gneisses and trondhjemites is the
morphology of the zircons. Gneiss zircons consistmostly of irregular grains that show no identifiablecrystal form, but zircons in the trondhjemites con-sist mostly of simply or doubly terminated crystals,many of which contain small inclusions withrounded to irregular shapes. They crystallized inthe trondhjemite magmas and have not undergonegrowth or deformation since that time.
Abundant isotopic evidence shows a major eventin the WDC at 3.0 Ga. In the gneisses, it is a time ofclosure of whole-rock Pb–Pb and Rb–Sr systems,and it is also the age of emplacement of diapirictrondhjemites (Meen et al., 1992). The 3.0-Ga ageof the trondhjemites is shown as an upper-interceptzircon age and by whole-rock Pb–Pb and Rb–Sr(Meen et al., 1992). Because both gneisses anddiapiric trondhjemites show isotopic closure at 3.0Ga, this age is regarded as the age of stabilization ofthe WDC.
The 3.0-Ga rocks form a basement for severalbasins of supracrustal rocks known as theDharwars, which apparently began to form shortlyafter 3.0 Ga (Chadwick et al., 2000). They consistof mafic to felsic volcanic rocks plus large volumesof quartz-bearing graywackes. Some of the oldersuites have been slightly deformed and metamor-phosed, but most of them are relatively undisturbedand are regarded as some of the world’s oldestplatform assemblages.
The 2.5-Ga granulite event in the transition zoneis only sparsely recorded in most of the WDC. The
52 Continents and Supercontinents
Figure 4.2. Halekote trondhjemite of Western Dharwar craton, southern India. The intrusion containsinclusions of older greenstones and is cut by a younger pegmatite (photo by J.J.W.R.).
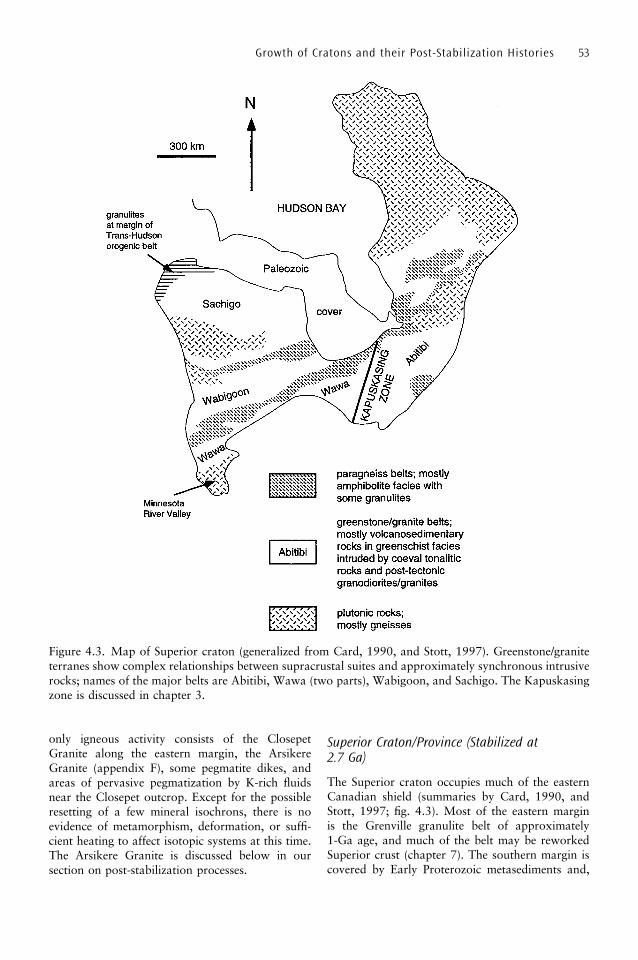
only igneous activity consists of the ClosepetGranite along the eastern margin, the ArsikereGranite (appendix F), some pegmatite dikes, andareas of pervasive pegmatization by K-rich fluidsnear the Closepet outcrop. Except for the possibleresetting of a few mineral isochrons, there is noevidence of metamorphism, deformation, or suffi-cient heating to affect isotopic systems at this time.The Arsikere Granite is discussed below in oursection on post-stabilization processes.
Superior Craton/Province (Stabilized at2.7 Ga)
The Superior craton occupies much of the easternCanadian shield (summaries by Card, 1990, andStott, 1997; fig. 4.3). Most of the eastern marginis the Grenville granulite belt of approximately1-Ga age, and much of the belt may be reworkedSuperior crust (chapter 7). The southern margin iscovered by Early Proterozoic metasediments and,
Growth of Cratons and their Post-Stabilization Histories 53
Figure 4.3. Map of Superior craton (generalized from Card, 1990, and Stott, 1997). Greenstone/graniteterranes show complex relationships between supracrustal suites and approximately synchronous intrusiverocks; names of the major belts are Abitibi, Wawa (two parts), Wabigoon, and Sachigo. The Kapuskasingzone is discussed in chapter 3.
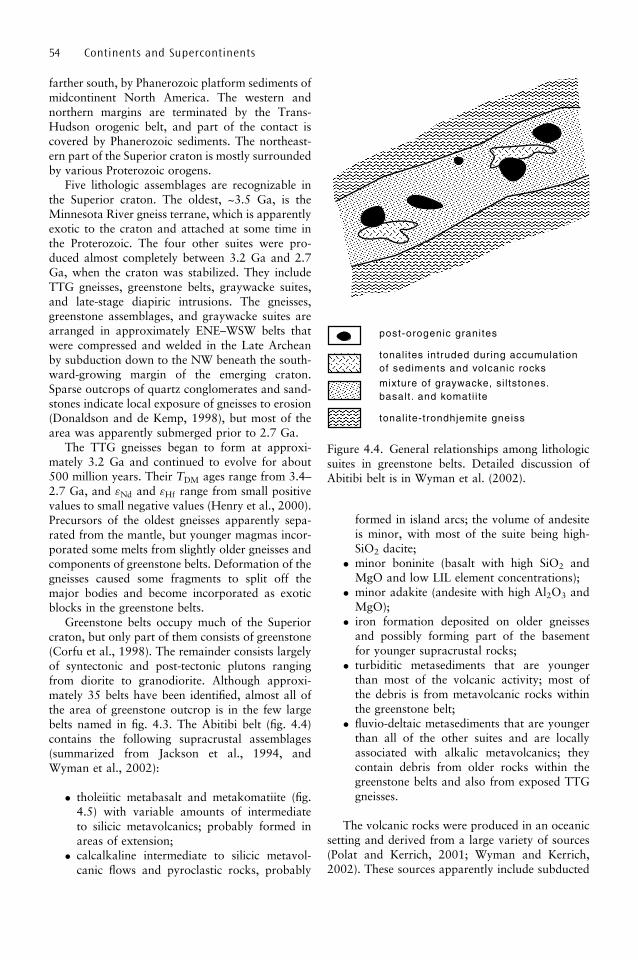
farther south, by Phanerozoic platform sediments ofmidcontinent North America. The western andnorthern margins are terminated by the Trans-Hudson orogenic belt, and part of the contact iscovered by Phanerozoic sediments. The northeast-ern part of the Superior craton is mostly surroundedby various Proterozoic orogens.
Five lithologic assemblages are recognizable inthe Superior craton. The oldest, ~3.5 Ga, is theMinnesota River gneiss terrane, which is apparentlyexotic to the craton and attached at some time inthe Proterozoic. The four other suites were pro-duced almost completely between 3.2 Ga and 2.7Ga, when the craton was stabilized. They includeTTG gneisses, greenstone belts, graywacke suites,and late-stage diapiric intrusions. The gneisses,greenstone assemblages, and graywacke suites arearranged in approximately ENE–WSW belts thatwere compressed and welded in the Late Archeanby subduction down to the NW beneath the south-ward-growing margin of the emerging craton.Sparse outcrops of quartz conglomerates and sand-stones indicate local exposure of gneisses to erosion(Donaldson and de Kemp, 1998), but most of thearea was apparently submerged prior to 2.7 Ga.
The TTG gneisses began to form at approxi-mately 3.2 Ga and continued to evolve for about500 million years. Their TDM ages range from 3.4–2.7 Ga, and "Nd and "Hf range from small positivevalues to small negative values (Henry et al., 2000).Precursors of the oldest gneisses apparently sepa-rated from the mantle, but younger magmas incor-porated some melts from slightly older gneisses andcomponents of greenstone belts. Deformation of thegneisses caused some fragments to split off themajor bodies and become incorporated as exoticblocks in the greenstone belts.
Greenstone belts occupy much of the Superiorcraton, but only part of them consists of greenstone(Corfu et al., 1998). The remainder consists largelyof syntectonic and post-tectonic plutons rangingfrom diorite to granodiorite. Although approxi-mately 35 belts have been identified, almost all ofthe area of greenstone outcrop is in the few largebelts named in fig. 4.3. The Abitibi belt (fig. 4.4)contains the following supracrustal assemblages(summarized from Jackson et al., 1994, andWyman et al., 2002):
� tholeiitic metabasalt and metakomatiite (fig.4.5) with variable amounts of intermediateto silicic metavolcanics; probably formed inareas of extension;
� calcalkaline intermediate to silicic metavol-canic flows and pyroclastic rocks, probably
formed in island arcs; the volume of andesiteis minor, with most of the suite being high-SiO2 dacite;
� minor boninite (basalt with high SiO2 andMgO and low LIL element concentrations);
� minor adakite (andesite with high Al2O3 andMgO);
� iron formation deposited on older gneissesand possibly forming part of the basementfor younger supracrustal rocks;
� turbiditic metasediments that are youngerthan most of the volcanic activity; most ofthe debris is from metavolcanic rocks withinthe greenstone belt;
� fluvio-deltaic metasediments that are youngerthan all of the other suites and are locallyassociated with alkalic metavolcanics; theycontain debris from older rocks within thegreenstone belts and also from exposed TTGgneisses.
The volcanic rocks were produced in an oceanicsetting and derived from a large variety of sources(Polat and Kerrich, 2001; Wyman and Kerrich,2002). These sources apparently include subducted
54 Continents and Supercontinents
Figure 4.4. General relationships among lithologicsuites in greenstone belts. Detailed discussion ofAbitibi belt is in Wyman et al. (2002).
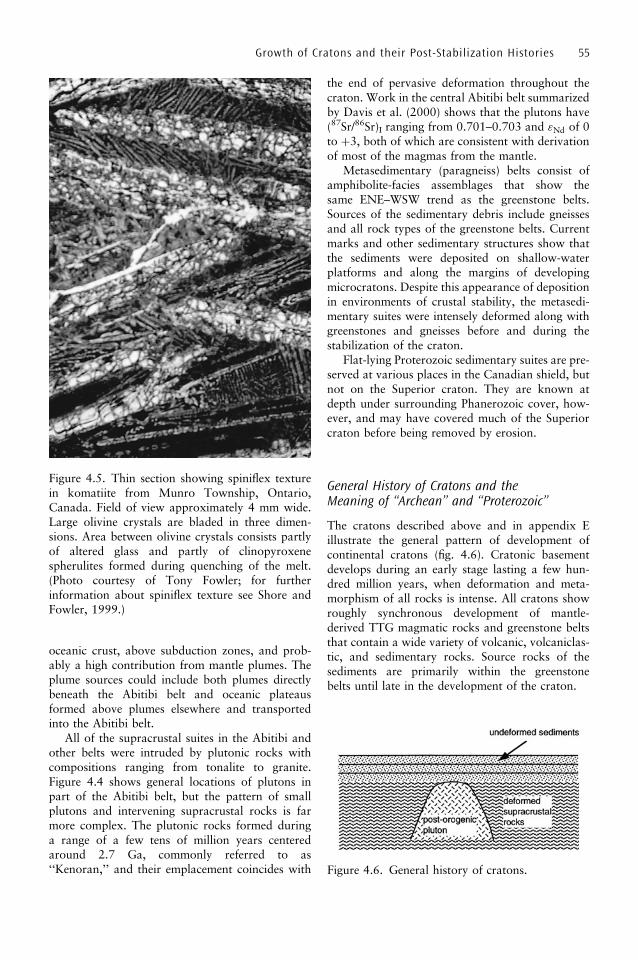
oceanic crust, above subduction zones, and prob-ably a high contribution from mantle plumes. Theplume sources could include both plumes directlybeneath the Abitibi belt and oceanic plateausformed above plumes elsewhere and transportedinto the Abitibi belt.
All of the supracrustal suites in the Abitibi andother belts were intruded by plutonic rocks withcompositions ranging from tonalite to granite.Figure 4.4 shows general locations of plutons inpart of the Abitibi belt, but the pattern of smallplutons and intervening supracrustal rocks is farmore complex. The plutonic rocks formed duringa range of a few tens of million years centeredaround 2.7 Ga, commonly referred to as‘‘Kenoran,’’ and their emplacement coincides with
the end of pervasive deformation throughout thecraton. Work in the central Abitibi belt summarizedby Davis et al. (2000) shows that the plutons have(87Sr/86Sr)I ranging from 0.701–0.703 and "Nd of 0to þ3, both of which are consistent with derivationof most of the magmas from the mantle.
Metasedimentary (paragneiss) belts consist ofamphibolite-facies assemblages that show thesame ENE–WSW trend as the greenstone belts.Sources of the sedimentary debris include gneissesand all rock types of the greenstone belts. Currentmarks and other sedimentary structures show thatthe sediments were deposited on shallow-waterplatforms and along the margins of developingmicrocratons. Despite this appearance of depositionin environments of crustal stability, the metasedi-mentary suites were intensely deformed along withgreenstones and gneisses before and during thestabilization of the craton.
Flat-lying Proterozoic sedimentary suites are pre-served at various places in the Canadian shield, butnot on the Superior craton. They are known atdepth under surrounding Phanerozoic cover, how-ever, and may have covered much of the Superiorcraton before being removed by erosion.
General History of Cratons and theMeaning of ‘‘Archean’’ and ‘‘Proterozoic’’
The cratons described above and in appendix Eillustrate the general pattern of development ofcontinental cratons (fig. 4.6). Cratonic basementdevelops during an early stage lasting a few hun-dred million years, when deformation and meta-morphism of all rocks is intense. All cratons showroughly synchronous development of mantle-derived TTG magmatic rocks and greenstone beltsthat contain a wide variety of volcanic, volcaniclas-tic, and sedimentary rocks. Source rocks of thesediments are primarily within the greenstonebelts until late in the development of the craton.
Growth of Cratons and their Post-Stabilization Histories 55
Figure 4.5. Thin section showing spiniflex texturein komatiite from Munro Township, Ontario,Canada. Field of view approximately 4 mm wide.Large olivine crystals are bladed in three dimen-sions. Area between olivine crystals consists partlyof altered glass and partly of clinopyroxenespherulites formed during quenching of the melt.(Photo courtesy of Tony Fowler; for furtherinformation about spiniflex texture see Shore andFowler, 1999.)
Figure 4.6. General history of cratons.
Crustal stability (‘‘age of stabilization’’ or ‘‘ageof cratonization’’) is attained at an age determinedfrom four observations (1 to 4). The most impor-tant (1) is the beginning of deposition of unde-formed platform sediments in shallow basins onthe stabilized crust. These sediments commonly lieon top of undeformed granite plutons (2) that areonly a few tens of million years older than the oldestsediments. The age of intrusion of the granites alsorepresents the youngest age of compressive defor-mation of basement gneisses (3) and the youngestage of whole-rock isochrons (4).
All cratons seem to have followed the samepattern of development at all ages from 3 Ga to0.5 Ga, and we can recognize only three differencesbetween old and young cratons. One is that koma-tiites are restricted to old crust developed when theearth’s thermal gradients were high. A second isthat older volcanic suites tend to be bimodalbasalt–rhyolite, whereas younger ones are completebasalt–andesite–rhyolite sequences. The third dif-ference is that plutons intruded during stabilizationof the Guiana and Nubian–Arabian cratons consistof granite dominated by K feldspar, whereasequivalent plutons in the older Superior andWestern Dharwar cratons are granodiorites andtonalites/trondhjemites dominated by sodic plagio-clase. All of these differences may be related to amantle that was more ‘‘primitive’’ in the early earththan at more recent times.
Differences between cratons of different agesraise the issue of the meanings of the terms‘‘Archean’’ and ‘‘Proterozoic.’’ When it was firstused, Archean referred to rocks that were presumedto be so different from younger rocks that they musthave evolved under very different conditions.Further investigation, however, showed that theyconsist of sedimentary, volcanic, and intrusiverocks similar to recent rocks, with degrees of meta-morphism also in the same ranges as young rocksin Phanerozoic orogenic belts. Comparison ofArchean and younger environments is discussed inmore detail by Nisbet (1987).
Rocks referred to as Archean, however, are dif-ferent from younger ones in the amount of deforma-tion that most of them have undergone, with theoldest sialic rocks in most areas creating a basementof highly deformed gneisses that are overlain by less-deformed suites. Thus, geologists commonly refer tothe Archean as a time in earth history when the earthwas hotter and more mobile than it was later. Whengeologists working in Canada discovered that thischange took place at about 2.5 Ga, a standard timescale was developed in which the Archean–Proterozoic boundary was established at 2.5 Ga.
After an age of 2.5 Ga was designated for theboundary, work in other Precambrian areas beganto show similar transitions from a very mobileenvironment to a more stable one at differenttimes. For example, our discussion of cratonsshows that the transition occurred in the WesternDharwar craton when it was stabilized at ~3.0 Ga.Similarly, the Guiana craton became stable at ~2.0Ga and the Nubian–Arabian craton at ~0.5 Ga(appendix E). These ages have led some geologiststo regard the Archean–Proterozoic boundary as atime of tectonic change, which occurred at differenttimes in different areas (Master, 1990).
As we discuss above, we regard the transitionfrom mobility to stability as a very important timein the history of each craton, and we recognize thatit took place at different times in different cratons.For simplicity, however, we will continue to refer toevents older than ~2.5 Ga as Archean and thosebetween ~2.5 Ga and ~0.5 Ga as Proterozoic.
Using 2.5 Ga as a starting date, the Proterozoicextends to the base of the Cambrian, which ismarked by the development of skeletal organismsat 540 Ma (chapter 12). Subdivisions of theProterozoic are not standard, and we use a classifi-cation in which Paleoproterozoic extends from 2.5Ga to about 1.8 Ga, Mesoproterozoic from 1.8 Gato about 1.0 Ga, and Neoproterozoic from 1 Ga tothe Cambrian at ~0.54 Ga.
Processes During and FollowingCratonic Stabilization
Crustal stabilization merely signifies the end of per-vasive compression and the development of broadsedimentary platforms. It does not mean that acraton has become inert to further internal pro-cesses. All cratons are permeated by fluids through-out their post-stabilization history, locally causinganorogenic magmatism more than 1 billion yearsafter the craton originally formed. We start thissection with a general discussion of fluids andamplify it by discussions of four anorogenic igneoussuites in appendix F. We finish with a discussion ofa transition zone between upper and lower crust insouthern India and show that it was developedlargely by fluid movement.
Fluids
Fluids play an important role in modifying thecomposition of the earth’s crust by transportingand redistributing various elements. They are also
56 Continents and Supercontinents

important scavengers of metals and have beeninstrumental in the formation of a variety of eco-nomic mineral deposits. Metal-enriched fluidsfocused along crustal pathways such as shearzones or fault zones give rise to rich veins or con-centrations of metallic mineral deposits. Seepage ofore-bearing fluids over larger areas of the crust givesrise to disseminated mineral deposits.
Evidence for the nature and activity of fluids inthe continental crust comes from field observations,petrographic examination, and geochemical studies.Their pervasive effect has been noted in most cra-tons, including the Superior province (Kerrich andLudden, 2000). Distribution of major and minorelements in minerals and rocks, their isotopic pat-terns, and calculations of mineral–fluid equilibriabased on various mineral assemblages also yieldpotential information on the activity of fluids.
Although a variety of fluids and their mixtureshave acted upon the earth’s crust, the dominantfluid species are CO2 and H2O with variable con-centration of salts (mainly chlorides and carbo-
nates) and traces of other volatiles such as CH4,N2, and SO2. A general stratification in the distri-bution of fluids shows that: the upper crust isdominated by H2O and brine solutions with var-ious amounts of CH4 and/or N2, as trace admix-tures derived from supracrustal sources; CO2–H2Ofluids dominate the deeper parts of the upper crust;and CO2-rich fluids characterize the lower crust(fig. 4.7; Touret and Dietvorst, 1983).
Good outcrops, commonly in quarry sections ingranulite terranes, show structurally controlledtransformation of garnet- and biotite-bearingupper-amphibolite facies gneisses to orthopyrox-ene-bearing greasy green zones of dry granulite(incipient charnockite) on a mesoscopic scale(Santosh, 2000; Santosh and Yoshikura, 2001;Santosh et al., 2001). The arrested charnockitepatches, lenses, and trees are reminiscent of fluidpathways along which copious amounts of CO2
have influxed from deeper sources, leading to thedesiccation of the gneisses and stabilization of thedry granulite assemblages which characterize the
Growth of Cratons and their Post-Stabilization Histories 57
Figure 4.7. General distribution of fluids in continental crust (based on Touret and Dietvorst, 1983).
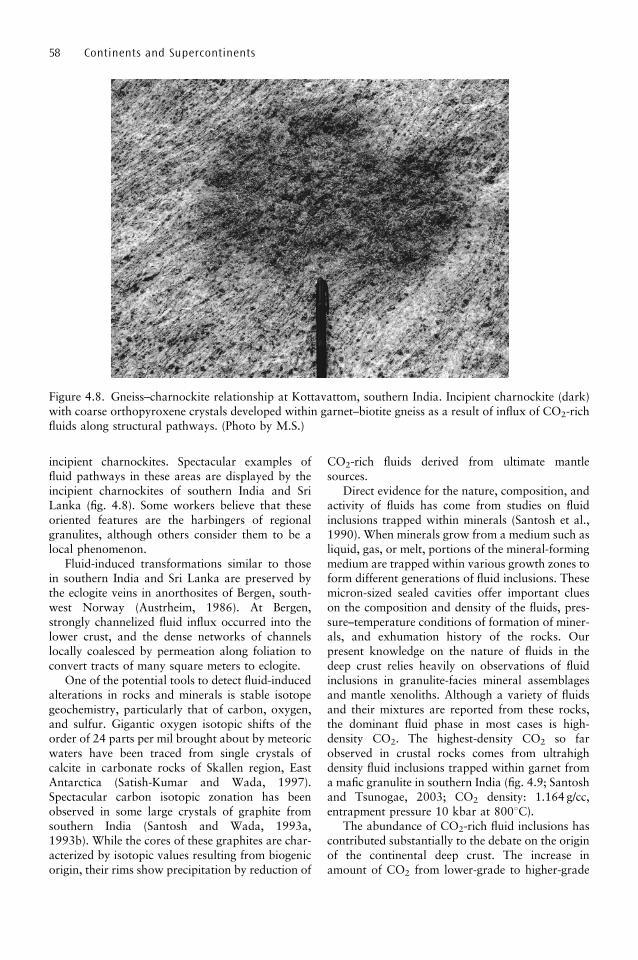
incipient charnockites. Spectacular examples offluid pathways in these areas are displayed by theincipient charnockites of southern India and SriLanka (fig. 4.8). Some workers believe that theseoriented features are the harbingers of regionalgranulites, although others consider them to be alocal phenomenon.
Fluid-induced transformations similar to thosein southern India and Sri Lanka are preserved bythe eclogite veins in anorthosites of Bergen, south-west Norway (Austrheim, 1986). At Bergen,strongly channelized fluid influx occurred into thelower crust, and the dense networks of channelslocally coalesced by permeation along foliation toconvert tracts of many square meters to eclogite.
One of the potential tools to detect fluid-inducedalterations in rocks and minerals is stable isotopegeochemistry, particularly that of carbon, oxygen,and sulfur. Gigantic oxygen isotopic shifts of theorder of 24 parts per mil brought about by meteoricwaters have been traced from single crystals ofcalcite in carbonate rocks of Skallen region, EastAntarctica (Satish-Kumar and Wada, 1997).Spectacular carbon isotopic zonation has beenobserved in some large crystals of graphite fromsouthern India (Santosh and Wada, 1993a,1993b). While the cores of these graphites are char-acterized by isotopic values resulting from biogenicorigin, their rims show precipitation by reduction of
CO2-rich fluids derived from ultimate mantlesources.
Direct evidence for the nature, composition, andactivity of fluids has come from studies on fluidinclusions trapped within minerals (Santosh et al.,1990). When minerals grow from a medium such asliquid, gas, or melt, portions of the mineral-formingmedium are trapped within various growth zones toform different generations of fluid inclusions. Thesemicron-sized sealed cavities offer important clueson the composition and density of the fluids, pres-sure–temperature conditions of formation of miner-als, and exhumation history of the rocks. Ourpresent knowledge on the nature of fluids in thedeep crust relies heavily on observations of fluidinclusions in granulite-facies mineral assemblagesand mantle xenoliths. Although a variety of fluidsand their mixtures are reported from these rocks,the dominant fluid phase in most cases is high-density CO2. The highest-density CO2 so farobserved in crustal rocks comes from ultrahighdensity fluid inclusions trapped within garnet froma mafic granulite in southern India (fig. 4.9; Santoshand Tsunogae, 2003; CO2 density: 1.164 g/cc,entrapment pressure 10 kbar at 8008C).
The abundance of CO2-rich fluid inclusions hascontributed substantially to the debate on the originof the continental deep crust. The increase inamount of CO2 from lower-grade to higher-grade
58 Continents and Supercontinents
Figure 4.8. Gneiss–charnockite relationship at Kottavattom, southern India. Incipient charnockite (dark)with coarse orthopyroxene crystals developed within garnet–biotite gneiss as a result of influx of CO2-richfluids along structural pathways. (Photo by M.S.)

rocks, and the dominantly anhydrous compositionof the rocks found in most of the exposed continen-tal deep crust, prompted some workers to proposepervasive flooding of the deep crust by CO2
degassed from the mantle. However, some deepcrustal terranes do not preserve evidence for CO2-induced transformations. They are thought to havebeen derived either through vapor-absent meta-morphism by the intrusion of hot magmas, orthrough the extraction of water in granitic melts,leaving an anhydrous residue.
Indeed, CO2 and H2O could have played amajor role in the genesis of the continental crustand some of the related mineral deposits. However,many questions remain unanswered. Where doesthe CO2 originate? We know that CO2 can begenerated through a number of mechanisms such
as decarbonation of carbonate rocks, or by oxida-tion of carbonaceous matter. The CO2-rich fluidscommonly associated with deep crustal rocks arethought to have been derived from ultimate mantlesources and transferred to higher crustal levelsthrough either magmatic conduits or mantle-rootedshear zones. Since CO2 has only limited solubility innormal silicic magmas, it is possible that under-plated alkali basalts could have transported CO2
in a dissolved state and released it upon freezing.Some CO2 could also have been transported assuspended carbonate minerals in magmas ratherthan as a free fluid phase.
Many other questions also are unanswered. If asubstantial amount of CO2 is liberated from themantle, in what form is it stored there? Does theweathering of CO2-enriched rocks contribute sig-
Growth of Cratons and their Post-Stabilization Histories 59
Figure 4.9. Photomicrographs of fluid inclusions containing very high-density CO2 in dark ovoid androunded cavities up to 30 microns long. The upper photograph from a garnet granulite from southern Indiacontains CO2-filled inclusions with densities up to 1.1 g/cc in quartz (Santosh and Tsunogae, 2003). Thelower photograph shows high-density (1.0 g/cc) CO2 trapped within fluid inclusions in garnet from a maficgranulilte in Sri Lanka. (Photos by M.S.)
nificantly to the CO2 budget of the atmosphere,with the continental crust acting as a temporarystore of CO2 on its passage from the mantle tothe crust? Opinions are diverse, and the topic con-tinues to be a challenge to geologists.
Anorogenic Magmatism Related to Fluids
Anorogenic magmatism appears to occur in almostall of the world’s cratons at times ranging from afew hundred million years to more than 1 billionyears after stabilization. Similar rocks also intrudeorogenic belts long after the final compressionalevent. Most of the rocks produced by anorogenicmagmatism have high concentrations of alkaliesand other LIL elements, and many of them containabundant Sn, rare earth elements (REE), and otherore elements that are mobilized by fluids. Evenrocks that are not ore-bearing were affected byfluids containing H2O, CO2, HF, and other compo-nents discussed above. Many of them are broadlyregarded as ‘‘ring complexes,’’ some are carbon-atitic, and some are mantle-derived kimberlites.
The time of emplacement and types of rocksdistinguish anorogenic suites from the post-oro-genic granites discussed in chapter 3. Post-orogenicsuites commonly consist solely of granite intrudedwithin a few tens of millions of years followingcratonic stabilization or the end of compressiveorogeny, whereas anorogenic suites contain thehighly variable lithologies mentioned above andfollow crustal stabilization after a much longertime.
We describe four anorogenic suites in appendixF and briefly summarize what we learn from themin this section.
� The Arsikere Granite of southern India wasintruded at 2.5 Ga, approximately 500million years after the stabilization of theWestern Dharwar craton (see above). Themajor minerals are typically granitic, butrestriction of Ti to sphene instead of magne-tite, high F contents in mica, and primaryfluorite indicate that the granite magma wasgenerated when HF invaded a relativelyanhydrous lower crust.
� Alkaline rocks and carbonatite at AlnoIsland, Sweden, were intruded about 1.5 bil-lion years after stabilization of the Baltic cra-ton at ~2 Ga. Fluid phases included bothH2O and CO2, and some of the H2O-richphases contained as much as 40% NaCl.Fluids not only mobilized magmas but also
penetrated wall rocks and caused widespreadalteration.
� Alkaline and silica-undersaturated rocksformed a ring complex at Abu Khrug, Egyptat 90 Ma. They are part of a series of anoro-genic complexes intruded into the Nubian–Arabian shield over a period of several hun-dred million years after it became stable(appendix E). Fluids at the various com-plexes included H2O, CO2, and HF, all ofwhich caused generation of the magmas andalso penetrated surrounding rocks.
� The volcano Ol Doinyo Lengai in theEastern Branch of the East African rift val-leys was constructed mostly by nepheline-rich flows and pyroclastic rocks and is nowthe only active volcano in the world to eruptnatrocarbonatite (sodium carbonate). Thiseruption of carbonate lavas shows extremeconcentration of CO2 at depth in addition toH2O and other fluids.
Summary Anorogenic magmatism shows contin-ued escape of fluids from the earth’s interior morethan 1 billion years after stabilization of the over-lying crust. Although the fluids are dominated byH2O and CO2, some of them also contain HF anddissolved NaCl.
Separation of Upper and Lower Crust inSouthern India
Exposure of the lower continental crust and thetransition zone between the lower and upper crustis very rare. The best known region occurs in south-ern India, where the Indian subcontinent has beentilted northward as continuing spreading along theCarlsberg ridge in the northwestern Indian Oceanpushes the Indian plate farther north beneath thesouthern margin of Asia. The resultant northwardtipping of India exposes deep crustal rocks over alarger area than anywhere else in the world, and thenorthern margin of this granulite terrane is a trans-ition zone to amphibolite-facies gneisses. Wedescribe it where it forms the southern margin ofthe Western Dharwar craton (fig. 4.1).
Along the southern boundary of the WDC thetransition zone is a few tens of kilometers wide(Pichamuthu, 1960; Condie et al., 1982). Rocks tothe south are typical felsic granulites with a primarymineralogy consisting of quartz, K feldspar, sodicplagioclase, and a small amount of orthopyroxene� biotite and accessory minerals. Farther to thenorth, exposures show a mixture of gneisses and
60 Continents and Supercontinents

granulites, with the granulites occurring mostly inveins or ‘‘stringers’’ surrounded by amphibolite-facies gneiss (fig. 4.10). This mixed rock suite passesfarther northward to a homogeneous mass of gneisswith amphibole and biotite.
Because both amphibolitic gneiss and silicicgranulites are closely intermingled in the transitionzone, both rocks clearly came to metamorphic equi-librium at the same temperatures and pressures.The only reason the amphibolitic and granuliticrocks could coexist must have been variation inthe compositions and pressures of fluids, whichwere extremely important in forming the entiregranulite terrane (see above). This conclusion isreinforced by studies of fluid inclusions that showa predominance of CO2 in the granulite stringersand water in the surrounding gneisses (E. Hansen etal., 1995). Apparently expulsion of CO2 from themantle and lower crust along zones of weakness inthe transition zone caused dehydration and con-version of hydrous amphibole to anhydrous ortho-pyroxene.
Water driven upward by CO2 encroachmentcarried LIL elements with it because of their solu-bility in hydrous media. This left a depleted lowercrust, which has very low concentrations of Rb andBa, and produced an upper crust enriched in U, K,and other LIL elements. Evidence of fluid move-ment, LIL element depletion, and production ofsilicic granulites has major implications for the
nature of the lower continental crust worldwide(chapters 3 and 5).
Relationship Between Cratons andtheir Underlying Upper Mantle
The mantle directly beneath continents is referred toas ‘‘subcontinental lithospheric mantle,’’ commonlyabbreviated as SCLM. The SCLM is now known tobe significantly different from mantle underlyingoceanic crust, and it also seems to have slightlydifferent compositions from one cratonic area toanother. This relationship remains intact despitecontinued thermal metamorphism and metasoma-tism of the SCLM from the formation of the over-lying crust to the present. We begin with adiscussion of this metasomatism and then continuewith the significance of compositional patterns.
Metasomatism of the SubcontinentalLithospheric Mantle
Studies of the concentrations of LIL elements in theSCLM produce remarkably inconsistent results.The differences probably result from the extremevariability of the metamorphic/metasomatic processfrom place to place and also with time in the sameplace. We illustrate this variability by discussing
Growth of Cratons and their Post-Stabilization Histories 61
Figure 4.10. Transition between amphibolite-facies gneiss and granulite-facies charnockite atKabbaldurga, India. The charnockite is dark layers and lenses in the lighter colored gneiss. (Photocourtesy of M. Jayananda.)

only a few of the numerous studies that have inves-tigated the process.
Compositional alteration of the SCLM is welldemonstrated by xenoliths in the 90-Ma Matsokukimberlite pipe in Lesotho (Olive et al., 1997;appendix F). The peridotite was intruded into theKaapvaal craton, which was stabilized at 3.1 Ga,but osmium isotope studies of peridotite xenolithsshow a range of younger ages, with apparentlyunaltered peridotite yielding ages of 2.2 to 1.2 Ga,and ages of veins, dikes, and metasomatized peri-dotite ranging from ~300 Ma to ~150 Ma. Theseages show that alteration of the mantle removed Refrom different phases and established their Os iso-topic systems at different times throughout theentire 3-billion-year history of the craton.
Similar young alteration is shown by peridotite(spinel lherzolite) xenoliths in Quaternary volcanicrocks erupted through Early Paleozoic to Mesozoiccrust in the Yukon, Canada (Carignan et al., 1996).The xenoliths have similar ratios of the various Pbisotopes, which indicates that they should have hadsimilar U/Pb ratios throughout their history. The238U/204Pb ratios range from 12.2 to 46.5, however,suggesting that U and Pb metasomatism occurred asrecently as 30 Ma. Earlier metasomatic alteration isalso shown by 87Sr/86Sr ratios that range from0.7033 to 0.7050 in different xenoliths.
Several complexes of carbonatite and alkalinerocks occur along the transition zone betweenupper and lower crust in southern India (seeabove; summary from Pandit et al., 2002). A com-plex intruded in the Paleoproterozoic has(87Sr/86Sr)I of ~0.702 and "Nd of 0 to +1, indicatingderivation from a depleted mantle. Neoproterozoiccomplexes formed approximately 1 billion yearslater in the same area, however, have (87Sr/86Sr)Iranging from 0.705 to 0.707 and "Nd of �6 to �17,indicating enrichment of the mantle source in LILelements at some time during the middle part of theProterozoic.
Despite these demonstrations of mantle metaso-matism, some studies show that the SCLM has beenunaltered since the overlying craton was formed.Bell and Blenkinsop (1987) described more than 25carbonatites with ages from 2.7 Ga to 120 Ma inthe Superior craton of the Canadian shield. Most ofthe carbonatites are associated with Phanerozoicrifts or other major faults, but some suites are inlocations that are not clearly associated with zonesof structural weakness. The carbonatites of theSuperior craton also occur as isolated bodies thatare not comagmatic with silicate rocks of alkalinering complexes, as they are in many other regions.Because carbonatites apparently are derived from
the mantle (presumably SCLM; see above), Bell andBlenkinsop (1987) used the isotopic composition ofthe Superior carbonatites as representative of man-tle composition at the time they were formed.Variations in initial 143Nd/144Nd ratios (fig. 4.11)and in87Sr/86Sr ratios with age show that Rb/Sr andSm/Nd ratios in the mantle source regions did notchange between 2.7 Ga and 120 Ma. Furthermore,the Rb/Sr ¼ 0.020 is lower, and the Sm/Nd ¼ 0.358is higher, than the ratios for the unfractionatedsilicate portion of the earth. These ratios indicatethat the upper mantle beneath the Superior cratonhad undergone significant depletion of Rb and Nd,and presumably other LIL elements, by the time ofstabilization at 2.7 Ga and apparently has not beenenriched since that time.
Summary Most studies of xenoliths from theupper mantle beneath continents show that fluidspassing through the mantle have added or re-moved LIL elements that affect isotopic systems.This alteration apparently has continued through-out the lifetime of the overlying craton and pre-sumably is still in operation at present. A fewstudies, however, suggest that the SCLM has re-mained inert since the cratonic crust was extractedfrom the mantle. Available data suggest that themetasomatic process is too variable to provideuseful generalizations at the present time.
Relationship Between Composition ofSCLM and Age of Overlying Cratons
The most compelling information about the SCLMand its relationship to cratons comes from studiesof the compositions and equilibration conditions ofmantle xenoliths in volcanic rocks and kimberlites,
62 Continents and Supercontinents
Figure 4.11. Nd isotope relationships in carbona-tites of Superior craton, Canada (modified from Belland Blenkinsop, 1987).
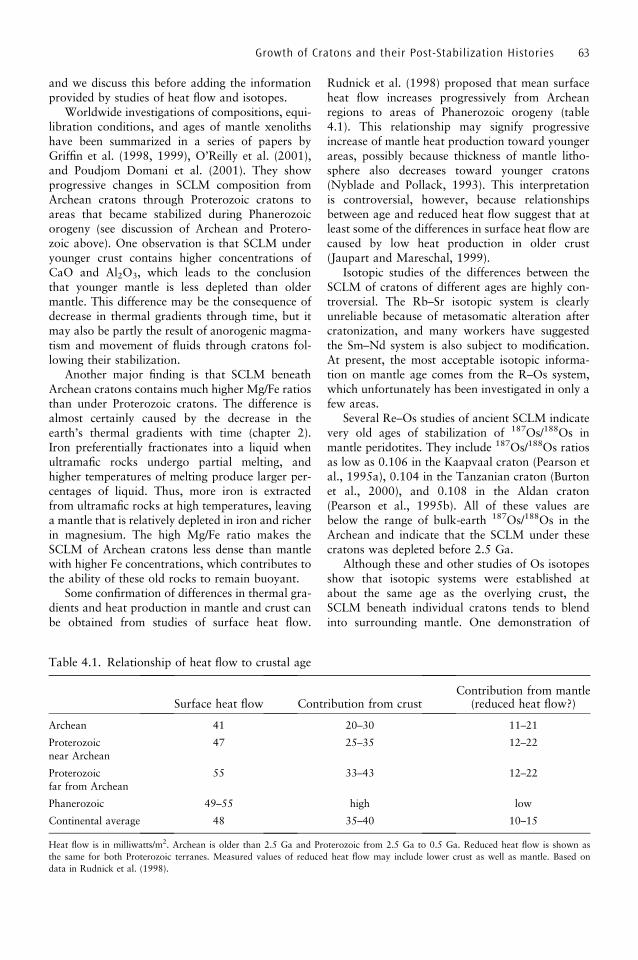
and we discuss this before adding the informationprovided by studies of heat flow and isotopes.
Worldwide investigations of compositions, equi-libration conditions, and ages of mantle xenolithshave been summarized in a series of papers byGriffin et al. (1998, 1999), O’Reilly et al. (2001),and Poudjom Domani et al. (2001). They showprogressive changes in SCLM composition fromArchean cratons through Proterozoic cratons toareas that became stabilized during Phanerozoicorogeny (see discussion of Archean and Protero-zoic above). One observation is that SCLM underyounger crust contains higher concentrations ofCaO and Al2O3, which leads to the conclusionthat younger mantle is less depleted than oldermantle. This difference may be the consequence ofdecrease in thermal gradients through time, but itmay also be partly the result of anorogenic magma-tism and movement of fluids through cratons fol-lowing their stabilization.
Another major finding is that SCLM beneathArchean cratons contains much higher Mg/Fe ratiosthan under Proterozoic cratons. The difference isalmost certainly caused by the decrease in theearth’s thermal gradients with time (chapter 2).Iron preferentially fractionates into a liquid whenultramafic rocks undergo partial melting, andhigher temperatures of melting produce larger per-centages of liquid. Thus, more iron is extractedfrom ultramafic rocks at high temperatures, leavinga mantle that is relatively depleted in iron and richerin magnesium. The high Mg/Fe ratio makes theSCLM of Archean cratons less dense than mantlewith higher Fe concentrations, which contributes tothe ability of these old rocks to remain buoyant.
Some confirmation of differences in thermal gra-dients and heat production in mantle and crust canbe obtained from studies of surface heat flow.
Rudnick et al. (1998) proposed that mean surfaceheat flow increases progressively from Archeanregions to areas of Phanerozoic orogeny (table4.1). This relationship may signify progressiveincrease of mantle heat production toward youngerareas, possibly because thickness of mantle litho-sphere also decreases toward younger cratons(Nyblade and Pollack, 1993). This interpretationis controversial, however, because relationshipsbetween age and reduced heat flow suggest that atleast some of the differences in surface heat flow arecaused by low heat production in older crust(Jaupart and Mareschal, 1999).
Isotopic studies of the differences between theSCLM of cratons of different ages are highly con-troversial. The Rb–Sr isotopic system is clearlyunreliable because of metasomatic alteration aftercratonization, and many workers have suggestedthe Sm–Nd system is also subject to modification.At present, the most acceptable isotopic informa-tion on mantle age comes from the R–Os system,which unfortunately has been investigated in only afew areas.
Several Re–Os studies of ancient SCLM indicatevery old ages of stabilization of 187Os/188Os inmantle peridotites. They include 187Os/188Os ratiosas low as 0.106 in the Kaapvaal craton (Pearson etal., 1995a), 0.104 in the Tanzanian craton (Burtonet al., 2000), and 0.108 in the Aldan craton(Pearson et al., 1995b). All of these values arebelow the range of bulk-earth 187Os/188Os in theArchean and indicate that the SCLM under thesecratons was depleted before 2.5 Ga.
Although these and other studies of Os isotopesshow that isotopic systems were established atabout the same age as the overlying crust, theSCLM beneath individual cratons tends to blendinto surrounding mantle. One demonstration of
Growth of Cratons and their Post-Stabilization Histories 63
Table 4.1. Relationship of heat flow to crustal age
Surface heat flow Contribution from crustContribution from mantle
(reduced heat flow?)
Archean 41 20–30 11–21
Proterozoic 47 25–35 12–22
near Archean
Proterozoic 55 33–43 12–22
far from Archean
Phanerozoic 49–55 high low
Continental average 48 35–40 10–15
Heat flow is in milliwatts/m2. Archean is older than 2.5 Ga and Proterozoic from 2.5 Ga to 0.5 Ga. Reduced heat flow is shown as
the same for both Proterozoic terranes. Measured values of reduced heat flow may include lower crust as well as mantle. Based on
data in Rudnick et al. (1998).
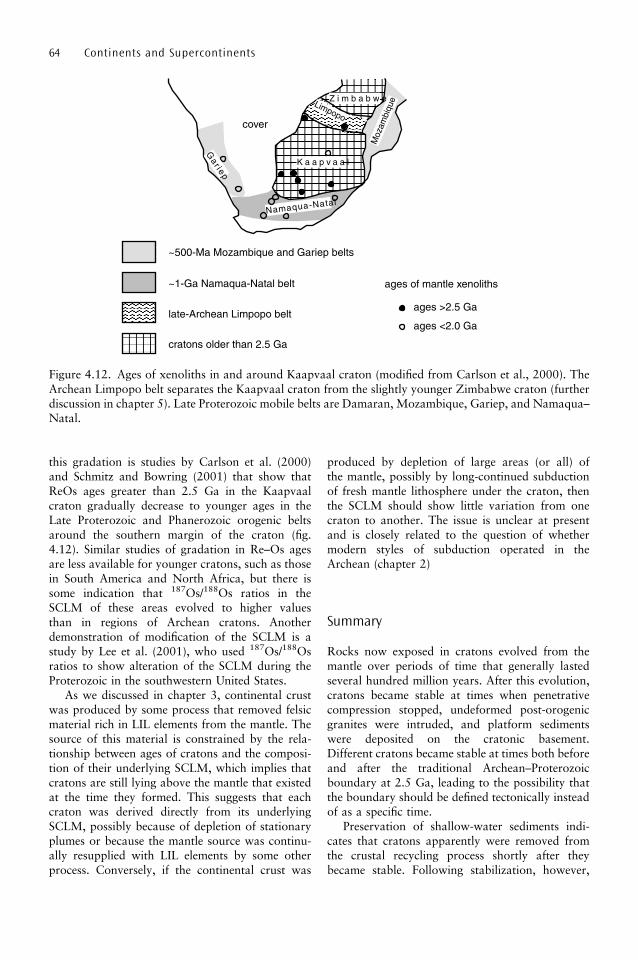
this gradation is studies by Carlson et al. (2000)and Schmitz and Bowring (2001) that show thatReOs ages greater than 2.5 Ga in the Kaapvaalcraton gradually decrease to younger ages in theLate Proterozoic and Phanerozoic orogenic beltsaround the southern margin of the craton (fig.4.12). Similar studies of gradation in Re–Os agesare less available for younger cratons, such as thosein South America and North Africa, but there issome indication that 187Os/188Os ratios in theSCLM of these areas evolved to higher valuesthan in regions of Archean cratons. Anotherdemonstration of modification of the SCLM is astudy by Lee et al. (2001), who used 187Os/188Osratios to show alteration of the SCLM during theProterozoic in the southwestern United States.
As we discussed in chapter 3, continental crustwas produced by some process that removed felsicmaterial rich in LIL elements from the mantle. Thesource of this material is constrained by the rela-tionship between ages of cratons and the composi-tion of their underlying SCLM, which implies thatcratons are still lying above the mantle that existedat the time they formed. This suggests that eachcraton was derived directly from its underlyingSCLM, possibly because of depletion of stationaryplumes or because the mantle source was continu-ally resupplied with LIL elements by some otherprocess. Conversely, if the continental crust was
produced by depletion of large areas (or all) ofthe mantle, possibly by long-continued subductionof fresh mantle lithosphere under the craton, thenthe SCLM should show little variation from onecraton to another. The issue is unclear at presentand is closely related to the question of whethermodern styles of subduction operated in theArchean (chapter 2)
Summary
Rocks now exposed in cratons evolved from themantle over periods of time that generally lastedseveral hundred million years. After this evolution,cratons became stable at times when penetrativecompression stopped, undeformed post-orogenicgranites were intruded, and platform sedimentswere deposited on the cratonic basement.Different cratons became stable at times both beforeand after the traditional Archean–Proterozoicboundary at 2.5 Ga, leading to the possibility thatthe boundary should be defined tectonically insteadof as a specific time.
Preservation of shallow-water sediments indi-cates that cratons apparently were removed fromthe crustal recycling process shortly after theybecame stable. Following stabilization, however,
64 Continents and Supercontinents
Figure 4.12. Ages of xenoliths in and around Kaapvaal craton (modified from Carlson et al., 2000). TheArchean Limpopo belt separates the Kaapvaal craton from the slightly younger Zimbabwe craton (furtherdiscussion in chapter 5). Late Proterozoic mobile belts are Damaran, Mozambique, Gariep, and Namaqua–Natal.

all cratons have undergone extensive modificationby fluids, which generate anorogenic magmatismmore than 1 billion years after stabilization insome cratons. This modification seems to havehad a significant effect on the concentrations of
LIL elements in the underlying mantle, but generalrelationships between ages of cratons and the com-positions of the mantle beneath them demonstratethat the sialic rocks of cratons probably evolvedlargely from the mantle beneath them.
Growth of Cratons and their Post-Stabilization Histories 65
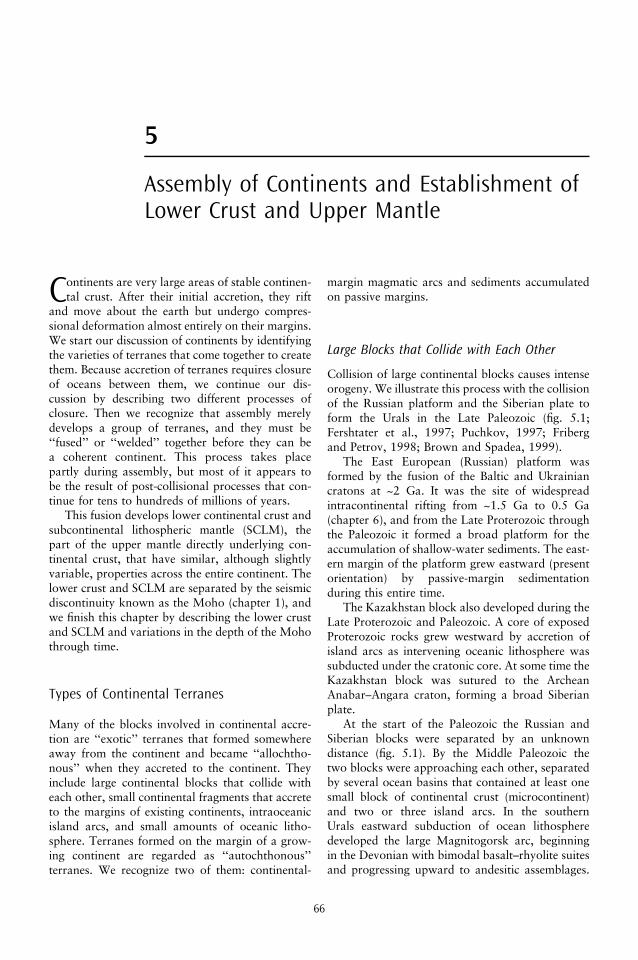
5
Assembly of Continents and Establishment ofLower Crust and Upper Mantle
Continents are very large areas of stable continen-tal crust. After their initial accretion, they rift
and move about the earth but undergo compres-sional deformation almost entirely on their margins.We start our discussion of continents by identifyingthe varieties of terranes that come together to createthem. Because accretion of terranes requires closureof oceans between them, we continue our dis-cussion by describing two different processes ofclosure. Then we recognize that assembly merelydevelops a group of terranes, and they must be‘‘fused’’ or ‘‘welded’’ together before they can bea coherent continent. This process takes placepartly during assembly, but most of it appears tobe the result of post-collisional processes that con-tinue for tens to hundreds of millions of years.
This fusion develops lower continental crust andsubcontinental lithospheric mantle (SCLM), thepart of the upper mantle directly underlying con-tinental crust, that have similar, although slightlyvariable, properties across the entire continent. Thelower crust and SCLM are separated by the seismicdiscontinuity known as the Moho (chapter 1), andwe finish this chapter by describing the lower crustand SCLM and variations in the depth of the Mohothrough time.
Types of Continental Terranes
Many of the blocks involved in continental accre-tion are ‘‘exotic’’ terranes that formed somewhereaway from the continent and became ‘‘allochtho-nous’’ when they accreted to the continent. Theyinclude large continental blocks that collide witheach other, small continental fragments that accreteto the margins of existing continents, intraoceanicisland arcs, and small amounts of oceanic litho-sphere. Terranes formed on the margin of a grow-ing continent are regarded as ‘‘autochthonous’’terranes. We recognize two of them: continental-
margin magmatic arcs and sediments accumulatedon passive margins.
Large Blocks that Collide with Each Other
Collision of large continental blocks causes intenseorogeny. We illustrate this process with the collisionof the Russian platform and the Siberian plate toform the Urals in the Late Paleozoic (fig. 5.1;Fershtater et al., 1997; Puchkov, 1997; Fribergand Petrov, 1998; Brown and Spadea, 1999).
The East European (Russian) platform wasformed by the fusion of the Baltic and Ukrainiancratons at ~2 Ga. It was the site of widespreadintracontinental rifting from ~1.5 Ga to 0.5 Ga(chapter 6), and from the Late Proterozoic throughthe Paleozoic it formed a broad platform for theaccumulation of shallow-water sediments. The east-ern margin of the platform grew eastward (presentorientation) by passive-margin sedimentationduring this entire time.
The Kazakhstan block also developed during theLate Proterozoic and Paleozoic. A core of exposedProterozoic rocks grew westward by accretion ofisland arcs as intervening oceanic lithosphere wassubducted under the cratonic core. At some time theKazakhstan block was sutured to the ArcheanAnabar–Angara craton, forming a broad Siberianplate.
At the start of the Paleozoic the Russian andSiberian blocks were separated by an unknowndistance (fig. 5.1). By the Middle Paleozoic thetwo blocks were approaching each other, separatedby several ocean basins that contained at least onesmall block of continental crust (microcontinent)and two or three island arcs. In the southernUrals eastward subduction of ocean lithospheredeveloped the large Magnitogorsk arc, beginningin the Devonian with bimodal basalt–rhyolite suitesand progressing upward to andesitic assemblages.
66
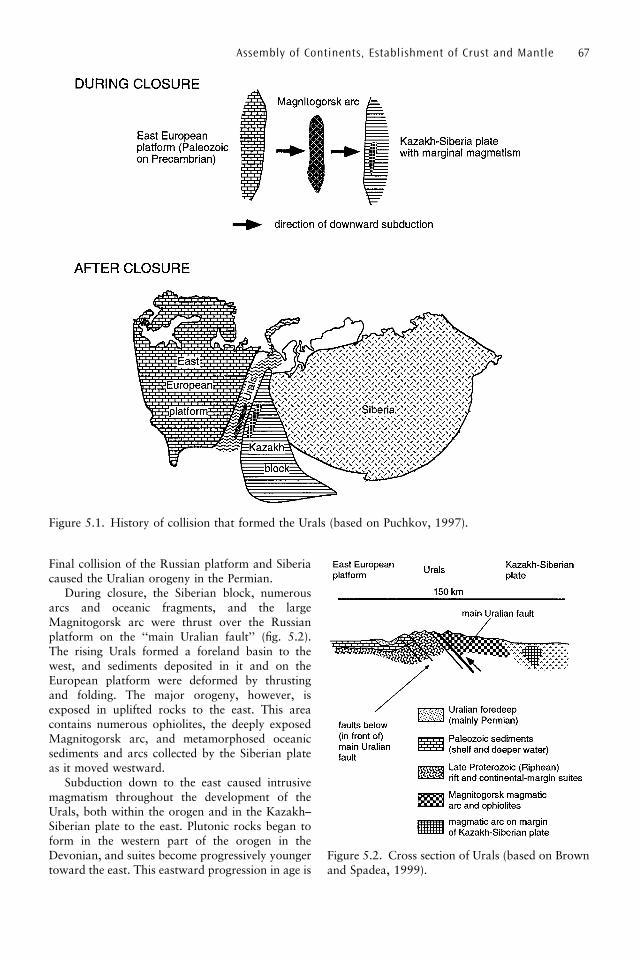
Final collision of the Russian platform and Siberiacaused the Uralian orogeny in the Permian.
During closure, the Siberian block, numerousarcs and oceanic fragments, and the largeMagnitogorsk arc were thrust over the Russianplatform on the ‘‘main Uralian fault’’ (fig. 5.2).The rising Urals formed a foreland basin to thewest, and sediments deposited in it and on theEuropean platform were deformed by thrustingand folding. The major orogeny, however, isexposed in uplifted rocks to the east. This areacontains numerous ophiolites, the deeply exposedMagnitogorsk arc, and metamorphosed oceanicsediments and arcs collected by the Siberian plateas it moved westward.
Subduction down to the east caused intrusivemagmatism throughout the development of theUrals, both within the orogen and in the Kazakh–Siberian plate to the east. Plutonic rocks began toform in the western part of the orogen in theDevonian, and suites become progressively youngertoward the east. This eastward progression in age is
Assembly of Continents, Establishment of Crust and Mantle 67
Figure 5.1. History of collision that formed the Urals (based on Puchkov, 1997).
Figure 5.2. Cross section of Urals (based on Brownand Spadea, 1999).
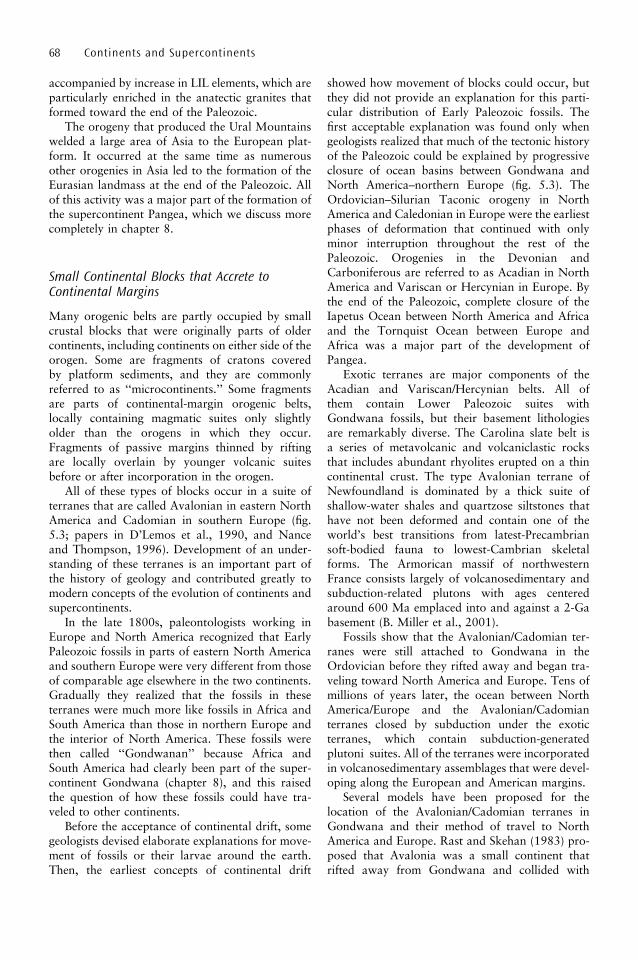
accompanied by increase in LIL elements, which areparticularly enriched in the anatectic granites thatformed toward the end of the Paleozoic.
The orogeny that produced the Ural Mountainswelded a large area of Asia to the European plat-form. It occurred at the same time as numerousother orogenies in Asia led to the formation of theEurasian landmass at the end of the Paleozoic. Allof this activity was a major part of the formation ofthe supercontinent Pangea, which we discuss morecompletely in chapter 8.
Small Continental Blocks that Accrete toContinental Margins
Many orogenic belts are partly occupied by smallcrustal blocks that were originally parts of oldercontinents, including continents on either side of theorogen. Some are fragments of cratons coveredby platform sediments, and they are commonlyreferred to as ‘‘microcontinents.’’ Some fragmentsare parts of continental-margin orogenic belts,locally containing magmatic suites only slightlyolder than the orogens in which they occur.Fragments of passive margins thinned by riftingare locally overlain by younger volcanic suitesbefore or after incorporation in the orogen.
All of these types of blocks occur in a suite ofterranes that are called Avalonian in eastern NorthAmerica and Cadomian in southern Europe (fig.5.3; papers in D’Lemos et al., 1990, and Nanceand Thompson, 1996). Development of an under-standing of these terranes is an important part ofthe history of geology and contributed greatly tomodern concepts of the evolution of continents andsupercontinents.
In the late 1800s, paleontologists working inEurope and North America recognized that EarlyPaleozoic fossils in parts of eastern North Americaand southern Europe were very different from thoseof comparable age elsewhere in the two continents.Gradually they realized that the fossils in theseterranes were much more like fossils in Africa andSouth America than those in northern Europe andthe interior of North America. These fossils werethen called ‘‘Gondwanan’’ because Africa andSouth America had clearly been part of the super-continent Gondwana (chapter 8), and this raisedthe question of how these fossils could have tra-veled to other continents.
Before the acceptance of continental drift, somegeologists devised elaborate explanations for move-ment of fossils or their larvae around the earth.Then, the earliest concepts of continental drift
showed how movement of blocks could occur, butthey did not provide an explanation for this parti-cular distribution of Early Paleozoic fossils. Thefirst acceptable explanation was found only whengeologists realized that much of the tectonic historyof the Paleozoic could be explained by progressiveclosure of ocean basins between Gondwana andNorth America–northern Europe (fig. 5.3). TheOrdovician–Silurian Taconic orogeny in NorthAmerica and Caledonian in Europe were the earliestphases of deformation that continued with onlyminor interruption throughout the rest of thePaleozoic. Orogenies in the Devonian andCarboniferous are referred to as Acadian in NorthAmerica and Variscan or Hercynian in Europe. Bythe end of the Paleozoic, complete closure of theIapetus Ocean between North America and Africaand the Tornquist Ocean between Europe andAfrica was a major part of the development ofPangea.
Exotic terranes are major components of theAcadian and Variscan/Hercynian belts. All ofthem contain Lower Paleozoic suites withGondwana fossils, but their basement lithologiesare remarkably diverse. The Carolina slate belt isa series of metavolcanic and volcaniclastic rocksthat includes abundant rhyolites erupted on a thincontinental crust. The type Avalonian terrane ofNewfoundland is dominated by a thick suite ofshallow-water shales and quartzose siltstones thathave not been deformed and contain one of theworld’s best transitions from latest-Precambriansoft-bodied fauna to lowest-Cambrian skeletalforms. The Armorican massif of northwesternFrance consists largely of volcanosedimentary andsubduction-related plutons with ages centeredaround 600 Ma emplaced into and against a 2-Gabasement (B. Miller et al., 2001).
Fossils show that the Avalonian/Cadomian ter-ranes were still attached to Gondwana in theOrdovician before they rifted away and began tra-veling toward North America and Europe. Tens ofmillions of years later, the ocean between NorthAmerica/Europe and the Avalonian/Cadomianterranes closed by subduction under the exoticterranes, which contain subduction-generatedplutoni suites. All of the terranes were incorporatedin volcanosedimentary assemblages that were devel-oping along the European and American margins.
Several models have been proposed for thelocation of the Avalonian/Cadomian terranes inGondwana and their method of travel to NorthAmerica and Europe. Rast and Skehan (1983) pro-posed that Avalonia was a small continent thatrifted away from Gondwana and collided with
68 Continents and Supercontinents
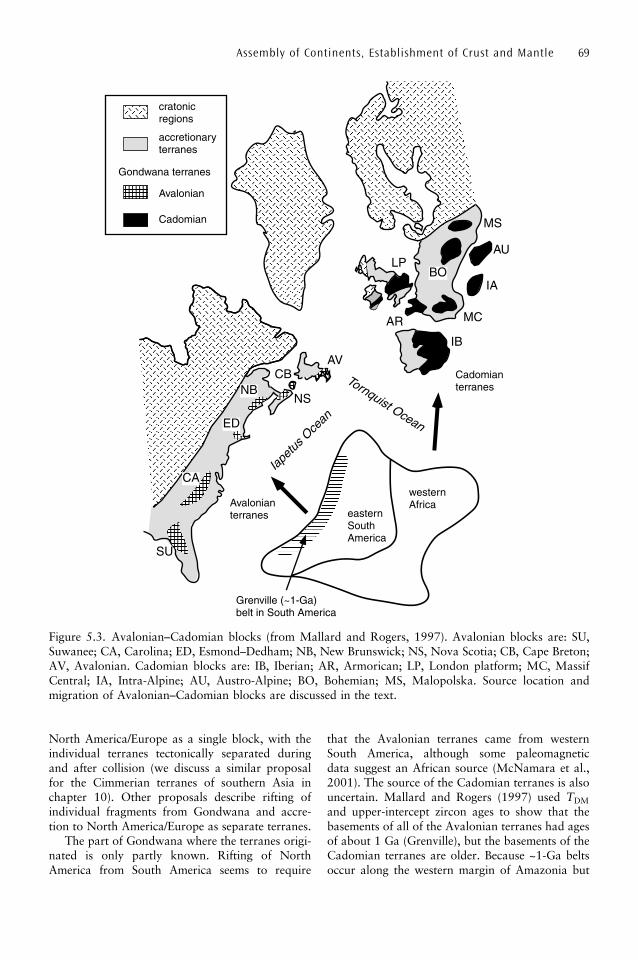
North America/Europe as a single block, with theindividual terranes tectonically separated duringand after collision (we discuss a similar proposalfor the Cimmerian terranes of southern Asia inchapter 10). Other proposals describe rifting ofindividual fragments from Gondwana and accre-tion to North America/Europe as separate terranes.
The part of Gondwana where the terranes origi-nated is only partly known. Rifting of NorthAmerica from South America seems to require
that the Avalonian terranes came from westernSouth America, although some paleomagneticdata suggest an African source (McNamara et al.,2001). The source of the Cadomian terranes is alsouncertain. Mallard and Rogers (1997) used TDM
and upper-intercept zircon ages to show that thebasements of all of the Avalonian terranes had agesof about 1 Ga (Grenville), but the basements of theCadomian terranes are older. Because ~1-Ga beltsoccur along the western margin of Amazonia but
Assembly of Continents, Establishment of Crust and Mantle 69
Figure 5.3. Avalonian–Cadomian blocks (from Mallard and Rogers, 1997). Avalonian blocks are: SU,Suwanee; CA, Carolina; ED, Esmond–Dedham; NB, New Brunswick; NS, Nova Scotia; CB, Cape Breton;AV, Avalonian. Cadomian blocks are: IB, Iberian; AR, Armorican; LP, London platform; MC, MassifCentral; IA, Intra-Alpine; AU, Austro-Alpine; BO, Bohemian; MS, Malopolska. Source location andmigration of Avalonian–Cadomian blocks are discussed in the text.

are absent from northern Africa, this difference inbasement ages suggests a model for rifting andaccretion of the Avalonian/Cadomian terranes asshown in fig. 5.3.
Intraoceanic Island Arcs
Island arcs form in different tectonic settings. Someare purely intraoceanic, whereas narrow oceanbasins separate others from continents. Some arcspass laterally into continental-margin fold belts orare built against continental crust. A typical arcsystem (fig. 5.4) comprises: a trench filled by pelagicand turbidite sediments; a tectonic melange ofthrusted oceanic and terrigenous sediments plussmall layers of ophiolites; an active arc trench gapthat includes a forearc basin with diverse sediments;and a wide magmatic arc composed of high-levelvolcanic rocks and deep-seated plutonic intrusions.The backarc or interarc basin (also called marginalsea) forms by backarc spreading and rests on thinoceanic crust.
The Japanese arc represents a typical matureintraoceanic arc system with a thick subarc crustof 30–35 km (fig. 5.5; Hashimoto, 1991; Kano,2001). It began to form during subduction beneathAsia and continued as the opening of the Japan Seaseparated the arc from mainland Asia. A largecomponent of the crust includes intrusive rocksand possible detached segments of continental base-ment. The volcanic rocks are predominantly ande-sites but show a range of compositions that enablesthem to be classified into three series: tholeiitic onthe seaward side of the arc, calcalkali fartherinland, and alkali toward the northwest.
This magmatism occurred on and within accre-tionary complexes of Late Paleozoic to Cenozoicage. They show a distinct zonal arrangement asnarrow linear belts several tens of kilometers wideand 100 to 1000 km long, all of them with E–Wlongitudinal axes. The complexes are older on theJapan Sea (continental) side and become youngertoward the Pacific Ocean.
Major pre-Jurassic units comprise the ~300-Ma(Permian) accretionary complex of the Hida mar-
70 Continents and Supercontinents
Figure 5.4 Typical features of island arc. The accretionary wedge (accretionary prism) separates theforedeep trench (subduction zone) from the elevated island arc. The forearc basin is shown with anaccumulation of sediments in the collapse structure on the top of the wedge. The mantle wedge is mantlebetween the subducted slab and the crust of the arc (including accreted material). The back-arc basincommonly overlies extensional parts of the subducted slab.
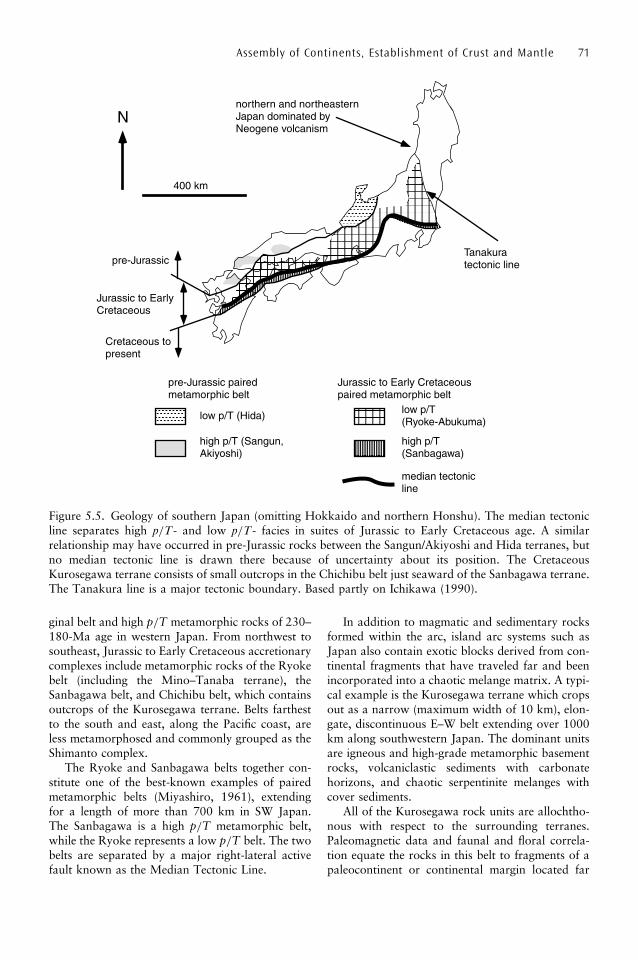
ginal belt and high p=T metamorphic rocks of 230–180-Ma age in western Japan. From northwest tosoutheast, Jurassic to Early Cretaceous accretionarycomplexes include metamorphic rocks of the Ryokebelt (including the Mino–Tanaba terrane), theSanbagawa belt, and Chichibu belt, which containsoutcrops of the Kurosegawa terrane. Belts farthestto the south and east, along the Pacific coast, areless metamorphosed and commonly grouped as theShimanto complex.
The Ryoke and Sanbagawa belts together con-stitute one of the best-known examples of pairedmetamorphic belts (Miyashiro, 1961), extendingfor a length of more than 700 km in SW Japan.The Sanbagawa is a high p=T metamorphic belt,while the Ryoke represents a low p=T belt. The twobelts are separated by a major right-lateral activefault known as the Median Tectonic Line.
In addition to magmatic and sedimentary rocksformed within the arc, island arc systems such asJapan also contain exotic blocks derived from con-tinental fragments that have traveled far and beenincorporated into a chaotic melange matrix. A typi-cal example is the Kurosegawa terrane which cropsout as a narrow (maximum width of 10 km), elon-gate, discontinuous E–W belt extending over 1000km along southwestern Japan. The dominant unitsare igneous and high-grade metamorphic basementrocks, volcaniclastic sediments with carbonatehorizons, and chaotic serpentinite melanges withcover sediments.
All of the Kurosegawa rock units are allochtho-nous with respect to the surrounding terranes.Paleomagnetic data and faunal and floral correla-tion equate the rocks in this belt to fragments of apaleocontinent or continental margin located far
Assembly of Continents, Establishment of Crust and Mantle 71
Figure 5.5. Geology of southern Japan (omitting Hokkaido and northern Honshu). The median tectonicline separates high p=T- and low p=T- facies in suites of Jurassic to Early Cretaceous age. A similarrelationship may have occurred in pre-Jurassic rocks between the Sangun/Akiyoshi and Hida terranes, butno median tectonic line is drawn there because of uncertainty about its position. The CretaceousKurosegawa terrane consists of small outcrops in the Chichibu belt just seaward of the Sanbagawa terrane.The Tanakura line is a major tectonic boundary. Based partly on Ichikawa (1990).
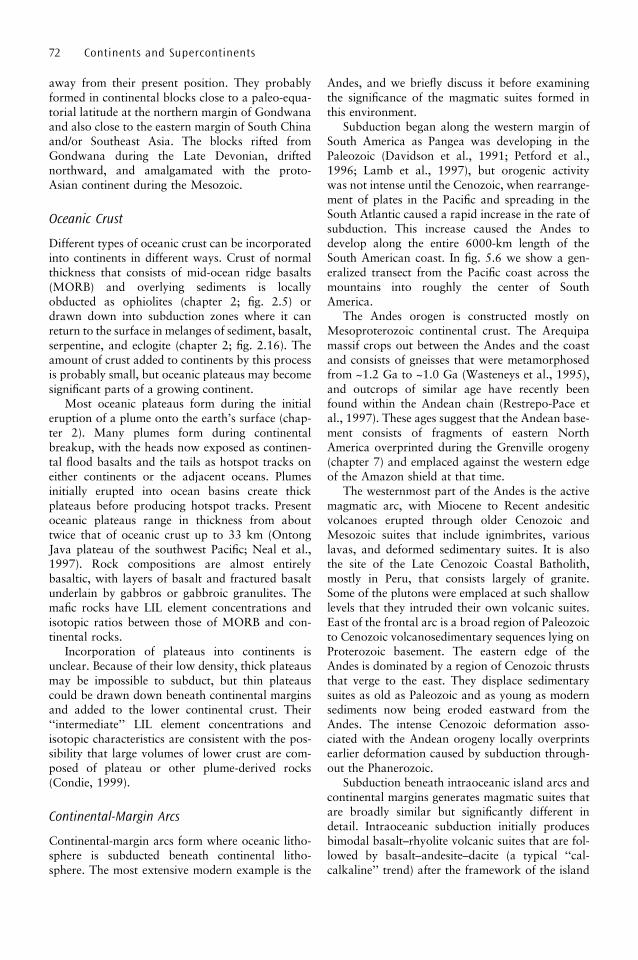
away from their present position. They probablyformed in continental blocks close to a paleo-equa-torial latitude at the northern margin of Gondwanaand also close to the eastern margin of South Chinaand/or Southeast Asia. The blocks rifted fromGondwana during the Late Devonian, driftednorthward, and amalgamated with the proto-Asian continent during the Mesozoic.
Oceanic Crust
Different types of oceanic crust can be incorporatedinto continents in different ways. Crust of normalthickness that consists of mid-ocean ridge basalts(MORB) and overlying sediments is locallyobducted as ophiolites (chapter 2; fig. 2.5) ordrawn down into subduction zones where it canreturn to the surface in melanges of sediment, basalt,serpentine, and eclogite (chapter 2; fig. 2.16). Theamount of crust added to continents by this processis probably small, but oceanic plateaus may becomesignificant parts of a growing continent.
Most oceanic plateaus form during the initialeruption of a plume onto the earth’s surface (chap-ter 2). Many plumes form during continentalbreakup, with the heads now exposed as continen-tal flood basalts and the tails as hotspot tracks oneither continents or the adjacent oceans. Plumesinitially erupted into ocean basins create thickplateaus before producing hotspot tracks. Presentoceanic plateaus range in thickness from abouttwice that of oceanic crust up to 33 km (OntongJava plateau of the southwest Pacific; Neal et al.,1997). Rock compositions are almost entirelybasaltic, with layers of basalt and fractured basaltunderlain by gabbros or gabbroic granulites. Themafic rocks have LIL element concentrations andisotopic ratios between those of MORB and con-tinental rocks.
Incorporation of plateaus into continents isunclear. Because of their low density, thick plateausmay be impossible to subduct, but thin plateauscould be drawn down beneath continental marginsand added to the lower continental crust. Their‘‘intermediate’’ LIL element concentrations andisotopic characteristics are consistent with the pos-sibility that large volumes of lower crust are com-posed of plateau or other plume-derived rocks(Condie, 1999).
Continental-Margin Arcs
Continental-margin arcs form where oceanic litho-sphere is subducted beneath continental litho-sphere. The most extensive modern example is the
Andes, and we briefly discuss it before examiningthe significance of the magmatic suites formed inthis environment.
Subduction began along the western margin ofSouth America as Pangea was developing in thePaleozoic (Davidson et al., 1991; Petford et al.,1996; Lamb et al., 1997), but orogenic activitywas not intense until the Cenozoic, when rearrange-ment of plates in the Pacific and spreading in theSouth Atlantic caused a rapid increase in the rate ofsubduction. This increase caused the Andes todevelop along the entire 6000-km length of theSouth American coast. In fig. 5.6 we show a gen-eralized transect from the Pacific coast across themountains into roughly the center of SouthAmerica.
The Andes orogen is constructed mostly onMesoproterozoic continental crust. The Arequipamassif crops out between the Andes and the coastand consists of gneisses that were metamorphosedfrom ~1.2 Ga to ~1.0 Ga (Wasteneys et al., 1995),and outcrops of similar age have recently beenfound within the Andean chain (Restrepo-Pace etal., 1997). These ages suggest that the Andean base-ment consists of fragments of eastern NorthAmerica overprinted during the Grenville orogeny(chapter 7) and emplaced against the western edgeof the Amazon shield at that time.
The westernmost part of the Andes is the activemagmatic arc, with Miocene to Recent andesiticvolcanoes erupted through older Cenozoic andMesozoic suites that include ignimbrites, variouslavas, and deformed sedimentary suites. It is alsothe site of the Late Cenozoic Coastal Batholith,mostly in Peru, that consists largely of granite.Some of the plutons were emplaced at such shallowlevels that they intruded their own volcanic suites.East of the frontal arc is a broad region of Paleozoicto Cenozoic volcanosedimentary sequences lying onProterozoic basement. The eastern edge of theAndes is dominated by a region of Cenozoic thruststhat verge to the east. They displace sedimentarysuites as old as Paleozoic and as young as modernsediments now being eroded eastward from theAndes. The intense Cenozoic deformation asso-ciated with the Andean orogeny locally overprintsearlier deformation caused by subduction through-out the Phanerozoic.
Subduction beneath intraoceanic island arcs andcontinental margins generates magmatic suites thatare broadly similar but significantly different indetail. Intraoceanic subduction initially producesbimodal basalt–rhyolite volcanic suites that are fol-lowed by basalt–andesite–dacite (a typical ‘‘cal-calkaline’’ trend) after the framework of the island
72 Continents and Supercontinents
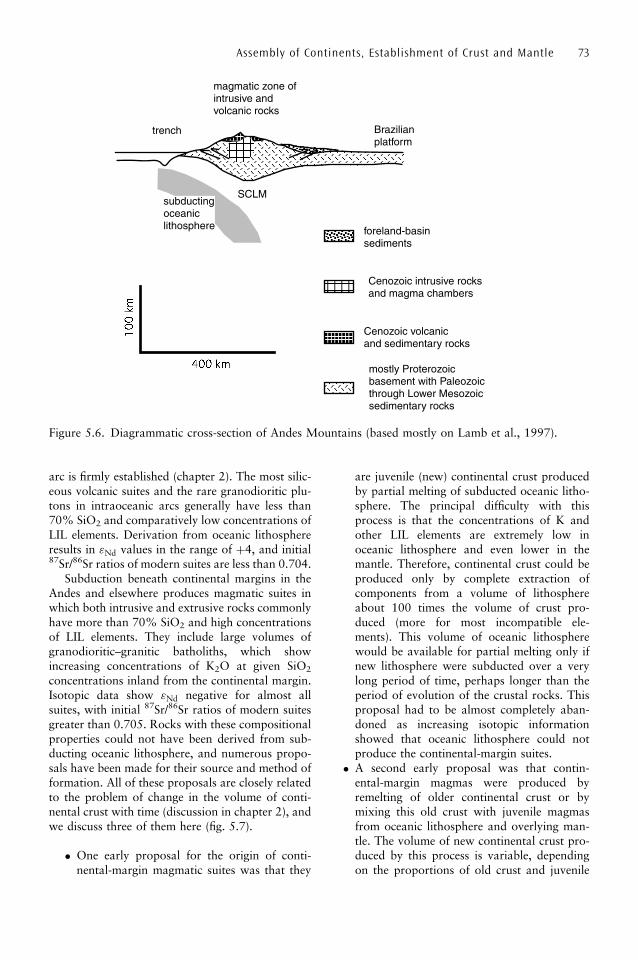
arc is firmly established (chapter 2). The most silic-eous volcanic suites and the rare granodioritic plu-tons in intraoceanic arcs generally have less than70% SiO2 and comparatively low concentrations ofLIL elements. Derivation from oceanic lithosphereresults in "Nd values in the range of þ4, and initial87Sr/86Sr ratios of modern suites are less than 0.704.
Subduction beneath continental margins in theAndes and elsewhere produces magmatic suites inwhich both intrusive and extrusive rocks commonlyhave more than 70% SiO2 and high concentrationsof LIL elements. They include large volumes ofgranodioritic–granitic batholiths, which showincreasing concentrations of K2O at given SiO2
concentrations inland from the continental margin.Isotopic data show "Nd negative for almost allsuites, with initial 87Sr/86Sr ratios of modern suitesgreater than 0.705. Rocks with these compositionalproperties could not have been derived from sub-ducting oceanic lithosphere, and numerous propo-sals have been made for their source and method offormation. All of these proposals are closely relatedto the problem of change in the volume of conti-nental crust with time (discussion in chapter 2), andwe discuss three of them here (fig. 5.7).
� One early proposal for the origin of conti-nental-margin magmatic suites was that they
are juvenile (new) continental crust producedby partial melting of subducted oceanic litho-sphere. The principal difficulty with thisprocess is that the concentrations of K andother LIL elements are extremely low inoceanic lithosphere and even lower in themantle. Therefore, continental crust could beproduced only by complete extraction ofcomponents from a volume of lithosphereabout 100 times the volume of crust pro-duced (more for most incompatible ele-ments). This volume of oceanic lithospherewould be available for partial melting only ifnew lithosphere were subducted over a verylong period of time, perhaps longer than theperiod of evolution of the crustal rocks. Thisproposal had to be almost completely aban-doned as increasing isotopic informationshowed that oceanic lithosphere could notproduce the continental-margin suites.
� A second early proposal was that contin-ental-margin magmas were produced byremelting of older continental crust or bymixing this old crust with juvenile magmasfrom oceanic lithosphere and overlying man-tle. The volume of new continental crust pro-duced by this process is variable, dependingon the proportions of old crust and juvenile
Assembly of Continents, Establishment of Crust and Mantle 73
Figure 5.6. Diagrammatic cross-section of Andes Mountains (based mostly on Lamb et al., 1997).
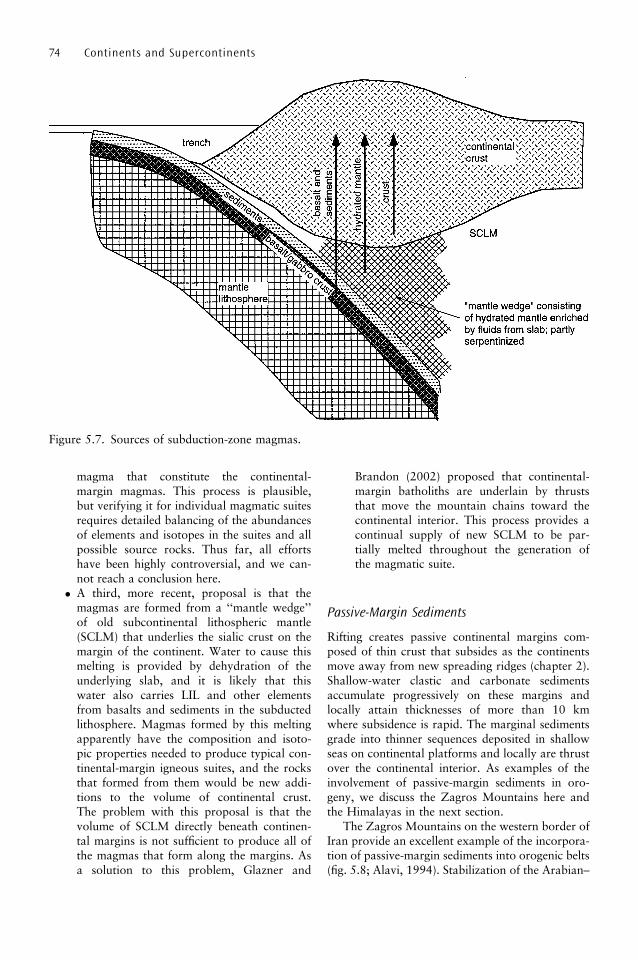
magma that constitute the continental-margin magmas. This process is plausible,but verifying it for individual magmatic suitesrequires detailed balancing of the abundancesof elements and isotopes in the suites and allpossible source rocks. Thus far, all effortshave been highly controversial, and we can-not reach a conclusion here.
� A third, more recent, proposal is that themagmas are formed from a ‘‘mantle wedge’’of old subcontinental lithospheric mantle(SCLM) that underlies the sialic crust on themargin of the continent. Water to cause thismelting is provided by dehydration of theunderlying slab, and it is likely that thiswater also carries LIL and other elementsfrom basalts and sediments in the subductedlithosphere. Magmas formed by this meltingapparently have the composition and isoto-pic properties needed to produce typical con-tinental-margin igneous suites, and the rocksthat formed from them would be new addi-tions to the volume of continental crust.The problem with this proposal is that thevolume of SCLM directly beneath continen-tal margins is not sufficient to produce all ofthe magmas that form along the margins. Asa solution to this problem, Glazner and
Brandon (2002) proposed that continental-margin batholiths are underlain by thruststhat move the mountain chains toward thecontinental interior. This process provides acontinual supply of new SCLM to be par-tially melted throughout the generation ofthe magmatic suite.
Passive-Margin Sediments
Rifting creates passive continental margins com-posed of thin crust that subsides as the continentsmove away from new spreading ridges (chapter 2).Shallow-water clastic and carbonate sedimentsaccumulate progressively on these margins andlocally attain thicknesses of more than 10 kmwhere subsidence is rapid. The marginal sedimentsgrade into thinner sequences deposited in shallowseas on continental platforms and locally are thrustover the continental interior. As examples of theinvolvement of passive-margin sediments in oro-geny, we discuss the Zagros Mountains here andthe Himalayas in the next section.
The Zagros Mountains on the western border ofIran provide an excellent example of the incorpora-tion of passive-margin sediments into orogenic belts(fig. 5.8; Alavi, 1994). Stabilization of the Arabian–
74 Continents and Supercontinents
Figure 5.7. Sources of subduction-zone magmas.
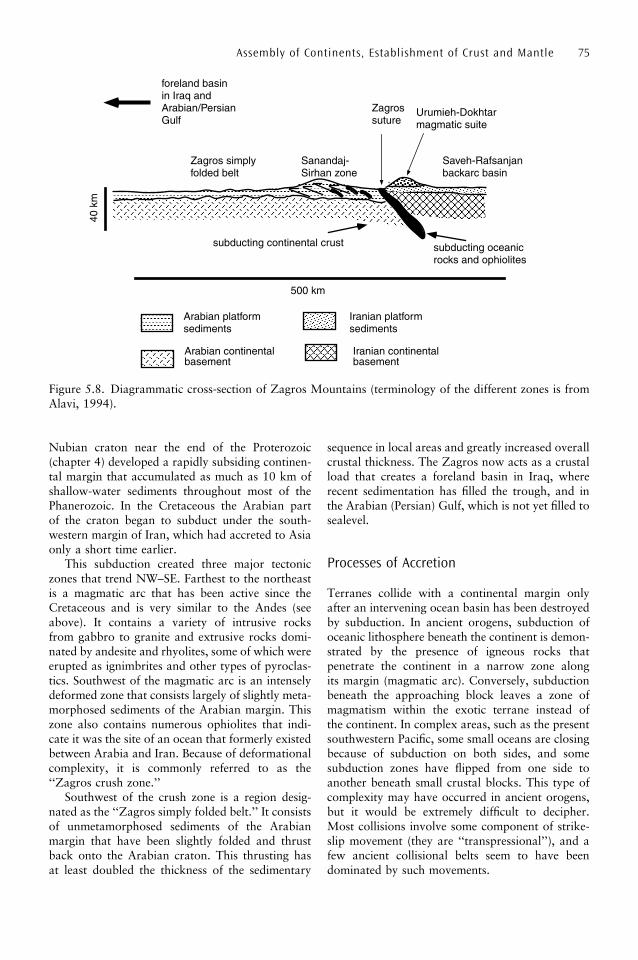
Nubian craton near the end of the Proterozoic(chapter 4) developed a rapidly subsiding continen-tal margin that accumulated as much as 10 km ofshallow-water sediments throughout most of thePhanerozoic. In the Cretaceous the Arabian partof the craton began to subduct under the south-western margin of Iran, which had accreted to Asiaonly a short time earlier.
This subduction created three major tectoniczones that trend NW–SE. Farthest to the northeastis a magmatic arc that has been active since theCretaceous and is very similar to the Andes (seeabove). It contains a variety of intrusive rocksfrom gabbro to granite and extrusive rocks domi-nated by andesite and rhyolites, some of which wereerupted as ignimbrites and other types of pyroclas-tics. Southwest of the magmatic arc is an intenselydeformed zone that consists largely of slightly meta-morphosed sediments of the Arabian margin. Thiszone also contains numerous ophiolites that indi-cate it was the site of an ocean that formerly existedbetween Arabia and Iran. Because of deformationalcomplexity, it is commonly referred to as the‘‘Zagros crush zone.’’
Southwest of the crush zone is a region desig-nated as the ‘‘Zagros simply folded belt.’’ It consistsof unmetamorphosed sediments of the Arabianmargin that have been slightly folded and thrustback onto the Arabian craton. This thrusting hasat least doubled the thickness of the sedimentary
sequence in local areas and greatly increased overallcrustal thickness. The Zagros now acts as a crustalload that creates a foreland basin in Iraq, whererecent sedimentation has filled the trough, and inthe Arabian (Persian) Gulf, which is not yet filled tosealevel.
Processes of Accretion
Terranes collide with a continental margin onlyafter an intervening ocean basin has been destroyedby subduction. In ancient orogens, subduction ofoceanic lithosphere beneath the continent is demon-strated by the presence of igneous rocks thatpenetrate the continent in a narrow zone alongits margin (magmatic arc). Conversely, subductionbeneath the approaching block leaves a zone ofmagmatism within the exotic terrane instead ofthe continent. In complex areas, such as the presentsouthwestern Pacific, some small oceans are closingbecause of subduction on both sides, and somesubduction zones have flipped from one side toanother beneath small crustal blocks. This type ofcomplexity may have occurred in ancient orogens,but it would be extremely difficult to decipher.Most collisions involve some component of strike-slip movement (they are ‘‘transpressional’’), and afew ancient collisional belts seem to have beendominated by such movements.
Assembly of Continents, Establishment of Crust and Mantle 75
Figure 5.8. Diagrammatic cross-section of Zagros Mountains (terminology of the different zones is fromAlavi, 1994).
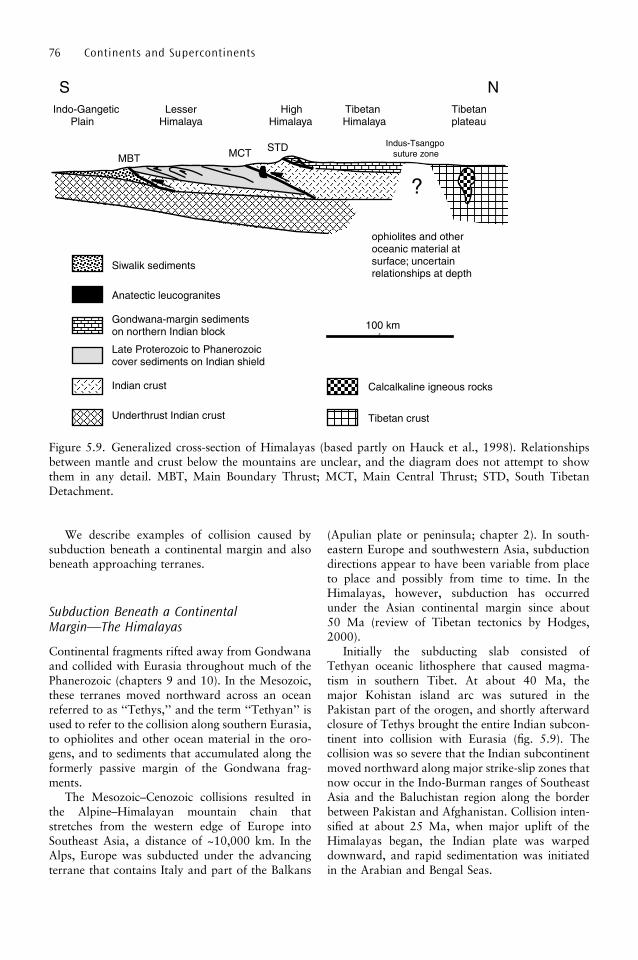
We describe examples of collision caused bysubduction beneath a continental margin and alsobeneath approaching terranes.
Subduction Beneath a ContinentalMargin—The Himalayas
Continental fragments rifted away from Gondwanaand collided with Eurasia throughout much of thePhanerozoic (chapters 9 and 10). In the Mesozoic,these terranes moved northward across an oceanreferred to as ‘‘Tethys,’’ and the term ‘‘Tethyan’’ isused to refer to the collision along southern Eurasia,to ophiolites and other ocean material in the oro-gens, and to sediments that accumulated along theformerly passive margin of the Gondwana frag-ments.
The Mesozoic–Cenozoic collisions resulted inthe Alpine–Himalayan mountain chain thatstretches from the western edge of Europe intoSoutheast Asia, a distance of ~10,000 km. In theAlps, Europe was subducted under the advancingterrane that contains Italy and part of the Balkans
(Apulian plate or peninsula; chapter 2). In south-eastern Europe and southwestern Asia, subductiondirections appear to have been variable from placeto place and possibly from time to time. In theHimalayas, however, subduction has occurredunder the Asian continental margin since about50 Ma (review of Tibetan tectonics by Hodges,2000).
Initially the subducting slab consisted ofTethyan oceanic lithosphere that caused magma-tism in southern Tibet. At about 40 Ma, themajor Kohistan island arc was sutured in thePakistan part of the orogen, and shortly afterwardclosure of Tethys brought the entire Indian subcon-tinent into collision with Eurasia (fig. 5.9). Thecollision was so severe that the Indian subcontinentmoved northward along major strike-slip zones thatnow occur in the Indo-Burman ranges of SoutheastAsia and the Baluchistan region along the borderbetween Pakistan and Afghanistan. Collision inten-sified at about 25 Ma, when major uplift of theHimalayas began, the Indian plate was warpeddownward, and rapid sedimentation was initiatedin the Arabian and Bengal Seas.
76 Continents and Supercontinents
Figure 5.9. Generalized cross-section of Himalayas (based partly on Hauck et al., 1998). Relationshipsbetween mantle and crust below the mountains are unclear, and the diagram does not attempt to showthem in any detail. MBT, Main Boundary Thrust; MCT, Main Central Thrust; STD, South TibetanDetachment.

Figure 5.9 shows a transect across the presentHimalayas between India and Tibet. South of theMain Boundary Thrust are Miocene to Recent sedi-ments (Siwaliks) eroded from the Himalayas. TheMBT uplifts metasediments of the Indian plate toform the Lesser Himalayas. Some of them havebeen approximately dated, and they seem to corre-late with Late Proterozoic sediments that overliecrystalline basement of the Indian shield. Meta-morphic grade increases upward in the metasedi-ments to the Main Central Thrust, which bringscrystalline rocks of the Indian shield upward toform the Greater Himalayas. Some of the rocks atthe highest elevations in the Greater Himalayas areTethyan sediments deposited on the northern mar-gin of the Indian plate, but most of the Tethyandeposits occur at lower elevations north of theSouth Tibetan Detachment, a series of down-to-the-north normal faults. The northern margin ofthis Tethyan belt is the Yarlung–Tsangpo (Indus–Tsangpo) suture zone, which is a tectonic melangeof ophiolite, radiolarian chert, and other materialfrom the Tethyan Ocean plus blocks of continental-margin sediments.
North of the suture zone is a series of plutonicrocks (Gangdese batholith) emplaced throughAsian continental crust (Debon et al., 1986).Subduction of oceanic crust produced early pluton-ism in the Late Cretaceous, and the first stages ofthe collision of India and Asia caused additionalmagmatism in the Eocene. Initial 87Sr/86Sr ratios of0.704–0.707 indicate that source regions of themagmas did not include any sediments or Indiancontinental crust. Magmatism appears to haveended at about 25 Ma when collision was completeand continental India began to subduct.
One of the major problems of Himalayan geol-ogy is the cause of crustal thickening both in themountains and in the Tibetan plateau to the north(Harrison et al., 1992). The only magmatic rocks inthe Himalayas are anatectic granites derived bymelting of crustal rocks, so there has been no addi-tion of juvenile (mantle-derived) material to anypart of the area south of the Yarlung–Tsangposuture. Thus, the 70-km crustal thickness of theHimalayas must have been caused by compressionand thickening of the Indian continental crust andunderlying mantle. Some of this thickening mayhave resulted from thrust stacking of both crustand mantle, but whether this mechanism is effectiveat depths of several tens of kilometers is presentlycontroversial.
The 50-km depth of the crust beneath Tibetnorth of the Himalayas has been explained in sev-eral ways, including an early suggestion that the
Indian plate was underthrust all the way to thenorthern edge of the plateau. The mechanism ofthis thrusting is unclear, however, and the elevationmay be primarily the result of a thermal anomalythat reduces the density of the mantle and crust.
Accretion by Subduction under ArrivingTerranes—Paleozoic North America
Fragmentation of Rodinia between about 800 Maand 600 Ma (chapter 7) left North America almostcompletely surrounded by rifted margins. Thesemargins accumulated rift sediments and shelfdeposits until the Middle Paleozoic. During thistime, shallow ocean water encroached over mostof the midcontinent, forming the basal deposits ofsedimentary suites that accumulated until near theend of the Mesozoic.
Orogeny began on all margins of North Americain the Middle Paleozoic by collision of exotic blocks(fig. 5.10). Along the east coast, the Avalonianterranes collided as oceanic lithosphere was sub-ducted beneath them (see above). In the south, theOuachita Mountains were formed in the LateCarboniferous (Pennsylvanian) by collision of aterrane that is now completely buried beneathcoastal plain sediments (Viele, 1989). Subductionbeneath this terrane instead of under NorthAmerica is shown by a complete absence of mag-matism in and north of the Ouachitas and by pre-servation of volcanic rocks in Paleozoic sedimentsbeneath the coastal plain to the south.
Orogenies in western North America in theDevonian and Permian are known mainly becausethrust sheets of those ages bring volcanosedimen-tary sequences of island arcs and backarc basinseastward over platform sediment (Burchfiel et al.,1992). The absence of magmatism in the NorthAmerican platform indicates that orogeny was notcaused by subduction of lithosphere beneath NorthAmerica but by subduction of the intervening oceanbasin beneath the approaching arcs. Similarly, theInnuitian area of northern Canada contains sedi-ments in a fold and thrust belt generated by colli-sion of the offshore terrane Pearya in the MiddlePaleozoic (Trettin, 1991). The absence of magmaticrocks and metamorphism in the orogenic belt andthe presence of both in Pearya demonstrate subduc-tion of North America under the colliding terrane.
With the partial exception of Late Paleozoicsubduction under the continental margin in NewEngland and the maritime area of Canada, no sub-duction occurred beneath North America until theLate Triassic. At this time, opening of the Atlantic
Assembly of Continents, Establishment of Crust and Mantle 77
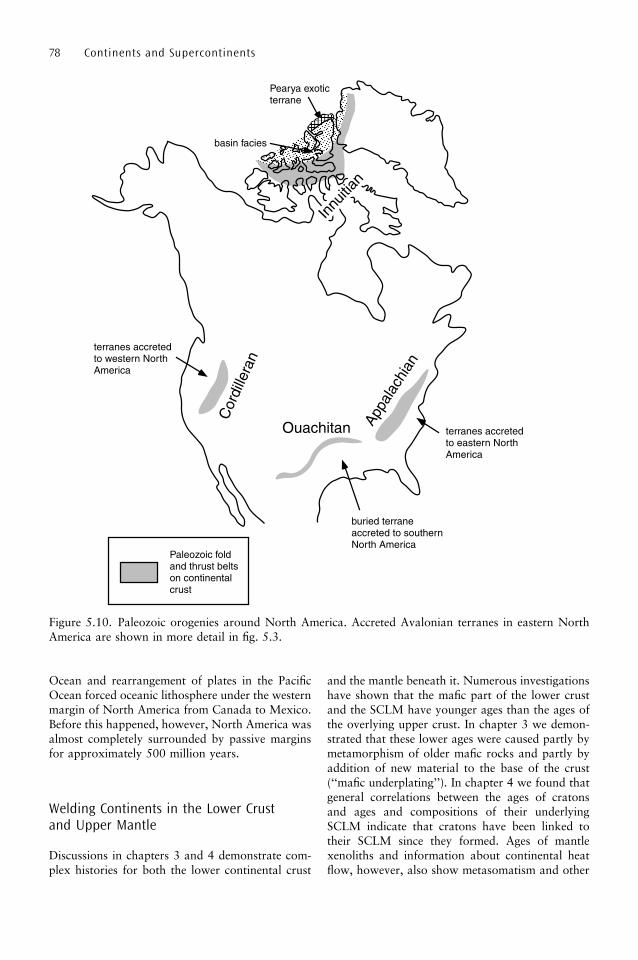
Ocean and rearrangement of plates in the PacificOcean forced oceanic lithosphere under the westernmargin of North America from Canada to Mexico.Before this happened, however, North America wasalmost completely surrounded by passive marginsfor approximately 500 million years.
Welding Continents in the Lower Crustand Upper Mantle
Discussions in chapters 3 and 4 demonstrate com-plex histories for both the lower continental crust
and the mantle beneath it. Numerous investigationshave shown that the mafic part of the lower crustand the SCLM have younger ages than the ages ofthe overlying upper crust. In chapter 3 we demon-strated that these lower ages were caused partly bymetamorphism of older mafic rocks and partly byaddition of new material to the base of the crust(‘‘mafic underplating’’). In chapter 4 we found thatgeneral correlations between the ages of cratonsand ages and compositions of their underlyingSCLM indicate that cratons have been linked totheir SCLM since they formed. Ages of mantlexenoliths and information about continental heatflow, however, also show metasomatism and other
78 Continents and Supercontinents
Figure 5.10. Paleozoic orogenies around North America. Accreted Avalonian terranes in eastern NorthAmerica are shown in more detail in fig. 5.3.

reworking of the SCLM long after stabilization ofoverlying cratons.
The reprocessing and addition of new materialto the lower crust and SCLM are probably neces-sary for the development of continents, becauseassembly of terranes merely develops a group ofseparate blocks. These blocks must be ‘‘fused’’ or‘‘welded’’ together before they become a coherentcontinent, and much of this welding clearly occursin the lower crust and SCLM following assembly.This reprocessing and welding apparently developcontinent-wide domains by processes that ‘‘blur’’(homogenize) the original differences within thelower crust and also within the SCLM. Somemajor structures recognized on the surface havebeen followed seismically into the lower crust andSCLM, but the variation from place to place is farsmaller than in the separate terranes that can berecognized in the upper crust.
We begin this section with an investigation ofthe properties of the lower crust and then describethe SCLM, mostly using the results of two longseismic surveys (fig. 5.11). Then we finish with adiscussion of changes in the depth of the Mohothrough time, including the distinction betweenseismic Moho and petrologic Moho (chapters 2and 3).
Lower Crust
The process of forming a homogeneous lower crustis well shown in fig. 5.12 (Morozova et al., 1999).
The transect crosses the exposed Baltic shield, sedi-mentary basins on subsided shield, the UralMountains collisional belt, the West SiberianBasin, and the Altay Mountain Range. The Uralscontain a major suture between colliding terranesand several smaller sutures between island arcs andmicrocontinents within the suture zone (see above).The West Siberian Basin contains a thick sequenceof sediments deposited on basalt that was eruptedinto a series of rifts that may locally have separatedto form a short-lived ocean basin. The Altay Rangeis bounded on the north by one or more majorsutures that separate it from the SiberianPrecambrian crust.
The various crustal blocks clearly had separategeologic histories before assembly into the Asiancontinent. Despite these original differences, how-ever, the present lower crust shows only small var-iations from place to place and is now a coherentblock that extends through the entire transect. Someof this welding and the blurring of terranes mayhave occurred during assembly, but the lateral con-tinuity of different crustal regions suggests thatcomplete establishment of the crust did not occuruntil after all of the crustal blocks had accreted.Part of the blending must have involved changingthe lower crust of island arcs and other oceanicterranes into continental crust. The method isunclear, although it probably involved intracrustalmelting and other methods for separating LIL ele-ments upward and leaving a more mafic anddepleted crust at depth (chapter 2).
Assembly of Continents, Establishment of Crust and Mantle 79
Figure 5.11. Map of Eurasia showing locations of central section of European Geotraverse and Quartzseismic profile across Russia and Siberia.

Depths to the Moho shown in fig. 5.12 averageabout 40 km in most regions and reach 50 kmbeneath the Ural and Altay ranges. These differ-ences, however, do not show a relationship to var-iations in P-wave velocities in crust just above theMoho. Velocities of 7.2 km/sec (almost certainlymafic rock) are present beneath the Baltic shield,the Urals, and basins between them, but velocitiesof only 6.7 to 6.8 km/sec occur below both the WestSiberian Basin and the Altay Range.
Similar conclusions can be drawn from seismicrefraction studies in the central-European section ofthe European Geotraverse, from an investigation ofthe European crust along a transect from the north-ern tip of Norway across the Mediterranean toTunisia (fig. 5.13; Prodehl and Aichroth, 1992).The section crosses an area that contains numerousPaleozoic fold belts and accreted terranes, withseismically recognizable sutures throughout theupper crust and locally extending into the lowercrust. There is some indication of a Conrad discon-tinuity in several places at depths of 20–25 km, andpart of the lower crust appears to be mafic. TheMoho is nearly flat at depths of ~30 km, and typicalupper-mantle velocities are present below it.Although there is some seismic variability in thelower crust, it is much smaller than in near-surfaceterranes, indicating that blurring and fusing oforiginal terranes has occurred.
Subcontinental Lithospheric Mantle andthe Low-velocity Zone
Seismic data amplify the information about theSCLM derived from studies of xenoliths and heatflow (see above; chapters 3 and 4). As a general-ization, velocities of seismic waves in the uppermantle beneath continents are a few percent higherthan at comparable depths below oceans. Becauserock density and seismic velocities are higher wheretemperatures are lower, this difference is consistentwith the likelihood that thermal gradients in themantle below continents are lower than belowocean basins. Within the SCLM, small variationsin wave velocities provide further detail about itsdevelopment (Mechie et al., 1997).
Figure 5.14 shows seismic velocities in theSCLM along the same transect that we used todiscuss crustal structure from the Baltic shield tothe Altay Mountains (Morozova et al., 1999).Velocities tend to increase downward from theMoho until low-velocity zones (LVZs) are reached.The highest LVZ has velocities only slightly lowerthan in the mantle above it, and the LVZ at depthscentered around 200 km is probably the low-velo-city lid at the top of the asthenosphere (lithosphere–sthenosphere boundary). Morozova et al. recognizetwo smaller LVZs within the asthenosphere, andtheir origin and significance are less clear.
80 Continents and Supercontinents
Figure 5.12. Lithologic interpretation of seismic properties of crust in Quartz geotraverse located in fig.5.11. The mountain root under the Urals is shown with P-wave velocities of 7.2–8.0 km/sec, with velocitiesgenerally higher under the eastern part of the range. The two types of lower crust shown have distinctlydiffferent seismic characteristics. Discussion of the history of the Ural Mountains earlier in this chapter(figs. 5.1 and 5.2). Morozova, E.A., Morozov, I.B., Smithson, S.B., and Solodilov, L.N. (1999).Heterogeneity of the uppermost mantle beneath Russian Eurasia from the ultra-long-range profileQUARTZ. J. Geophys. Res., v. 104, 20,329–30,348. Copyright 1999 American Geophysical Union.Modified by permission of American Geophysical Union.

Similar differences in seismic-wave velocitiesoccur under other continental regions. As an exam-ple, lateral velocity differences under Australia aremostly restricted to mantle above a depth of ~200km, perhaps locally deeper under the Archean cra-tons of the west. The zone of variations is generally150 km deep along the eastern margin of thecontinent, but is locally as shallow as 80 km.These depths appear to represent the base of thelithosphere, with more lateral uniformity in theunderlying asthenosphere. Investigations of theuppermost SCLM here by Simons et al. (1999)
show velocities that are a few percent higherunder the Precambrian regions of the western partof the continent, decrease toward the east, and areparticularly low under the areas of Phanerozoicaccretion and recent volcanism along the easternmargin of the continent.
Determination of the thickness of the SCLM isimportant because the LVZ presumably is the baseof the rigid lithosphere that moves with its over-lying crust on top of a more mobile asthenosphere.It is also the base of the ‘‘tectosphere,’’ defined byJordan (1975) as the part of the earth rigid enough
Assembly of Continents, Establishment of Crust and Mantle 81
Figure 5.13. Lithologic interpretation of seismic features of European geotraverse located in fig. 5.11(interpreted from information in Prodehl and Aichroth, 1992).
Figure 5.14. Seismic properties of subcrustal lithospheric mantle (SCLM). The lowermost low-velocityzone (LVZ) shown in this diagram is probably the top of the asthenosphere. Morozova et al. (1999)propose two LVZs in the lithosphere, and we show only the one that is most apparent. Modified fromMorozova, E.A., Morozov, I.B., Smithson, S.B., and Solodilov, L.N. (1999). Heterogeneity of theuppermost mantle beneath Russian Eurasia from the ultra-long-range profile QUARTZ. J. Geophys. Res.,v. 104, 20,329–30,348. Copyright 1999 American Geophysical Union. Modified by permission ofAmerican Geophysical Union.
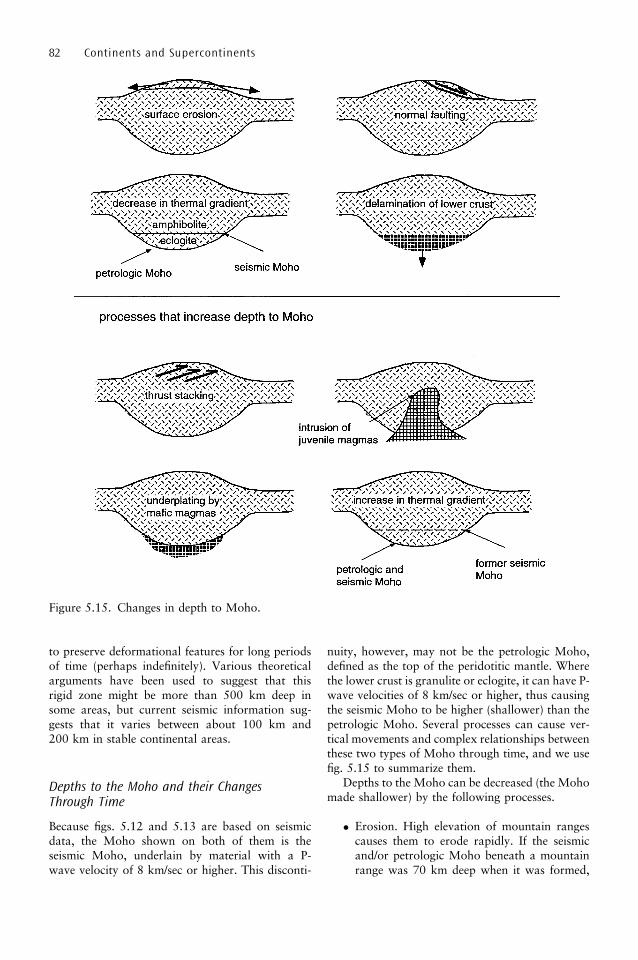
to preserve deformational features for long periodsof time (perhaps indefinitely). Various theoreticalarguments have been used to suggest that thisrigid zone might be more than 500 km deep insome areas, but current seismic information sug-gests that it varies between about 100 km and200 km in stable continental areas.
Depths to the Moho and their ChangesThrough Time
Because figs. 5.12 and 5.13 are based on seismicdata, the Moho shown on both of them is theseismic Moho, underlain by material with a P-wave velocity of 8 km/sec or higher. This disconti-
nuity, however, may not be the petrologic Moho,defined as the top of the peridotitic mantle. Wherethe lower crust is granulite or eclogite, it can have P-wave velocities of 8 km/sec or higher, thus causingthe seismic Moho to be higher (shallower) than thepetrologic Moho. Several processes can cause ver-tical movements and complex relationships betweenthese two types of Moho through time, and we usefig. 5.15 to summarize them.
Depths to the Moho can be decreased (the Mohomade shallower) by the following processes.
� Erosion. High elevation of mountain rangescauses them to erode rapidly. If the seismicand/or petrologic Moho beneath a mountainrange was 70 km deep when it was formed,
82 Continents and Supercontinents
Figure 5.15. Changes in depth to Moho.

20 km of erosion would reduce the depth to50 km, which is normal for many rangesdeveloped in the Paleozoic. The problemwith this explanation is that 20 km of ero-sion would bring the level of exposure intogranulite facies. Because granulites are rarelyexposed in the higher elevations of mountainranges, however, surface erosion can beresponsible for only part of the reduction inMoho depth.
� Stretching and normal faulting. Normalfaulting in very high mountain ranges (seeHimalayas above) reduces the depth to theMoho by decreasing the load imposed by therange. Similarly, lateral stretching thins thecrust, commonly by developing one or moredetachment faults (discussion of rifting inchapter 2). Both processes reduce the thick-ness of the crust and thereby cause theMoho to rise.
� Conversion of gabbro to eclogite. In someplaces the Moho measured seismically maypartly represent a zone of transition betweengabbro, with a density of ~3.0 g/cc, andmafic rocks in eclogite facies, which havedensities ranging from ~3.3 g/cc for garnetgranulites to as much as ~3.6 g/cc for eclo-gites consisting solely of garnet and ompha-cite. Mafic lower crust converts to eclogitefacies at depths that depend on the thermalgradient, deeper where the gradient is highand shallower where it is low. As an aver-age, eclogite-facies rocks are stable belowdepths of about 40 km (fig. 2.2), and conver-sion between gabbro and eclogite moves theMoho up or down as the thermal gradientchanges. Thus, a deep mountain root shouldbecome shallower as heat flow decreases fol-lowing the peak of orogeny. This explana-tion for changes in Moho depth requireslarge parts of the region below the seismicMoho to consist of rocks in eclogite facies,causing the top of the petrologic Moho(mantle peridotite) to be deeper.
� ‘‘Delamination.’’ Depth to the Moho may bedecreased by a process of ‘‘delamination,’’which is separation (‘‘peeling off’’) of SCLMand lower crust downward into the mantle.This occurs because the density of litho-spheric mantle is slightly higher than thedensity of the uppermost asthenosphere, andlithosphere is buoyant only because it isattached to crust of lower density. Underconditions that are not fully understood, thismantle lithosphere can be detached from
lighter crust above it and drop into the man-tle. Where the lower crust is dense rocks ineclogite or granulite facies, it can also bedetached from lighter overlying crust, caus-ing the Moho to become much shallower asnew mantle flows into the space left by thedelaminated material.
Several processes can increase the depth to theMoho.
� Thrust stacking. Where several thrustsequences overlap each other in a mountainbelt, the crustal thickening causes a deepen-ing of the Moho. This process can constructa thick orogenic belt by compression withoutaddition of new crust from the mantle.
� Addition of juvenile magmas. If the mag-matic rocks of mountain belts represent juve-nile additions from a mantle source, they cancause crustal thickening without lateralshortening by compression. Whether thisprocess is a significant part of orogeny isunclear because of uncertainty about thesource of magmatic suites in mountain belts(discussion of Andes above).
� Mafic underplating. Intrusion of mafic mag-mas at or near the base of the crust has com-monly been regarded as a source of heat forsuch processes as metamorphism and intra-crustal melting (chapter 3). Unless these newmafic rocks are converted to granulite or eclo-gite facies, they can cause thickening of crustabove the seismic Moho, which is underlainby rocks with a P-wave velocity of 8 km/sec.
� Increase in thermal gradient. This processcauses the opposite effects of a decrease inthermal gradients discussed above. Highertemperatures, perhaps accompanied by infil-tration of water, reduce the density of granu-lites and thus move the zone of 8-km/secP-wave velocities to greater depth.
Summary
Continents form by the assembly of allochthonousterranes and become larger by growth on continen-tal margins. Far-traveled terranes include large andsmall continental blocks, island arcs, and smallamounts of oceanic crust. Marginal growth takesplace largely where subduction of oceanic litho-sphere forms mountain belts characterized by defor-mation and magmatism, but sediments of passive
Assembly of Continents, Establishment of Crust and Mantle 83

margins are incorporated in continental interiorswhen they collide with another continent.
Assembly requires closure of oceans by subduc-tion either under the margin of the accreting con-tinent or under the colliding block. All of thecollisions are commonly accompanied by strike-slip movements approximately parallel to themargin of the growing continent.
Welding of terranes into coherent continentsprobably occurs both during and after collision.
This develops mafic lower crusts and underlyingmantles that are somewhat more homogeneousthan the diverse felsic terranes that overlie them.Some of this continued activity locally causes theMoho to move up or down because of intrusion ofjuvenile magmas, structural thickening and thinningof the crust, delamination of dense crust, and theeffects of changing temperatures on the density ofthe lower crust.
84 Continents and Supercontinents
6
Assembly and Dispersal of Supercontinents
Supercontinents are assemblies that contain all, ornearly all, of the earth’s continental blocks. The
concept arose with the recognition of Gondwana inthe late 1800s (chapters 1 and 8), and it has beengreatly expanded since then. In this chapter webuild on the ideas developed in chapters 2 through5 to discuss the origin and dispersal of superconti-nents. The first section considers various mechan-isms for the accretion of supercontinents, and thesecond section considers the reasons for theirassembly. The last two sections consider evidencethat former supercontinents have broken up and thereasons for their dispersal.
We emphasize that the processes of accretionand dispersal overlap, with rifting of some partsof a supercontinent occurring at the same times assuturing in other areas. This overlapping producesa time when the supercontinent has its largest co-herent area, which we refer to as the time of‘‘maximum packing.’’
Models for the Assembly ofSupercontinents
All supercontinents contain the same types of ter-ranes that occur in individual continents (chapter4). All models of assembly recognize that someterranes accreted as small individual blocks andsome as continental-sized masses that containedseveral individual blocks that had been previouslysutured together. Differences between modelsinvolve the area of the supercontinent that consistedof previously sutured large blocks and the areaformed by accretion of small individual blocks.Resolution of this problem requires an understand-ing of the nature of orogenic belts developed duringassembly, and we discuss this issue first.
Types of Orogenic Belts
All orogenic belts have many similarities. They allunderwent lateral compression that led to rock
deformation and crustal thickening. Thickeningpushed some rocks down into realms of highertemperature and pressure, causing metamorphism,and magmatic intrusion locally raised temperatureseven higher in some areas. Almost all orogenscontain magmatic rocks from various sources,including rocks partially melted within the orogenand magmas from subducted lithosphere andmantle below the deformed belt.
Despite these similarities, different orogenscontain features that enable us to distinguish dif-ferent environments of formation. We discussthem here in three categories: (1) ‘‘intercratonic’’orogens formed by closure of ocean basins; (2)‘‘intracratonic’’ orogens developed within conti-nental areas where there was no pre-existingocean basin; and (3) ‘‘confined’’ orogens formedby closure of small ocean basins that existed asindentations into continental blocks that had notbeen completely split apart. All of the differentrock suites mentioned here have been discussed inprevious chapters.
� The classical view of an orogenic belt is anintercratonic one formed by collision of twoor more continental blocks previously sepa-rated by an ocean basin, and here we use fig.6.1 to summarize the characteristic featuresof this type of orogen. The presence ofophiolites and other oceanic material is aclear indication of ocean closure and forma-tion of a suture zone. Many suture zonesalso contain volcanosedimentary suites ofisland arcs, and some include microcon-tinents. Syn- to late-tectonic magmatismcommonly produces calcalkaline batholithicassemblages of gabbro–diorite–granodiorite-granite. They commonly have TDM ages onlyslightly greater than the age of emplacement,and initial 87Sr/86Sr ratios are between ratiosfor average continental crust and averageoceanic crust (~0.705–0.708 in recent batho-lithic suites). Shortly after the close of defor-
85

mation, the orogenic belt is penetrated bynumerous bodies of post-orogenic granite.
� Intracratonic orogenic belts are also illu-strated in fig. 6.1. Eroded belts consist largelyof granulites thrust over one continentalblock and overlain by other continental rocksthat range from gneisses to unmetamor-phosed sediments. Ophiolites or other oceanicremnants are not present in the orogeniczone, but because these materials aresqueezed upward and easily eroded in inter-cratonic belts, their absence is not by itselfsufficient proof of intracratonic activity.Intracratonic orogeny is also shown by anabsence of batholithic suites and postorogenicgranites, with magmatism commonlyrestricted to local anatectic granites and post-tectonic alkaline suites. The anatectic granitesshow their derivation from within the orogen
by having high initial 87Sr/86Sr ratios typicalof old continental crust and TDM values thatindicate much greater source ages than theages of emplacement. Figure 5.2 shows anoceanic suture outside of the orogenic beltbecause the lateral stresses needed to cause anorogeny presumably developed by subductionof oceanic lithosphere on one or both sides ofthe orogen.A typical intracratonic belt is the Rocky
Mountains of western North America. TheLaramide orogeny that was responsible fordevelopment of much of the RockyMountains was clearly caused by subductionof Pacific oceanic lithosphere beneath thewestern margin of North America in the LateCretaceous/Early Tertiary. This compressionwas transmitted to the continental interior,where it caused east-vergent thrusting of
86 Continents and Supercontinents
Figure 6.1. Characteristics of intercratonic and intracratonic orogens.

supracrustal rocks in the northern Rockies,and upward movement of Proterozoic rocksalong high-angle faults in the southernRockies.
The Rocky Mountains are regarded asintracratonic because no ocean closedbeneath the mountain range, and the sutureat the source of compression was on the con-tinental margin hundreds of kilometers to thewest. The difference from intercratonic oro-genic belts is well shown by Laramide andyounger magmatism. Subduction beneath thecontinental margin produced batholiths alongthe entire western edge of North America,but none within the Rockies. Tertiary graniteintrusions into the Proterozoic uplifts haveTDM ages centered around 1000 Ma andinitial 87Sr/86Sr ratios generally greater than0.707 (Stein and Crock, 1990). Some of theintrusions were accompanied by volatiles thatproduced topaz, as in other magmas com-monly regarded as anorogenic (chapter 4).
Intracratonic belts occur in other areas ofthe earth. One is the Tien Shan Mountains ofcentral Asia (Bullen et al., 2001), where LateCenozoic and current uplift are caused by col-lision of India with an Asiatic margin well tothe south of the Tien Shan (see Himalayas,chapter 4). An older belt is the Eastern Ghatsof India (chapter 7; appendix H), whichunderwent repeated orogeny at ~1.6 Ga, 1Ga, and 0.5 Ga.
� The concept of confined orogens has beendeveloped very recently, with the type exam-ple being the Aracuai belt of eastern Brazil(fig. 6.2; Pedrosa-Soares et al., 2001). TheAracuai belt indents the southern margin of acratonic block stabilized at ~2 Ga and nowseparated by the opening of the AtlanticOcean to form the Sao Francisco craton ofeastern South America and the Congo cratonof western Africa. The former union of thesecratons is shown by correlation of geologicsuites between the two blocks, and we discussbelow the possibility that the combined SaoFrancisco–Congo craton was part of a muchbroader continental assembly (see Atlanticabelow) that developed at ~2 Ga.
The Aracuai belt began when rifting devel-oped a small triple junction within the SaoFrancisco–Congo craton at approximately1.0 to 0.9 Ga. The three arms of this junctioninclude an ocean basin extending into the cra-ton from its southern margin (present orienta-tion) and two aulacogens, one in South
America and one in Africa. Ocean opening isshown by the preservation of an ophioliteand a calcalkaline magmatic arc in the pre-sent Aracuai belt. Closure of the basin wascentered around 600 Ma, when subductionclosed the small basin, produced syn- andlate-tectonic granitic rocks, and thrust meta-morphosed supracrustal and basement suitesonto continental blocks on both sides of thebelt. As in other collisional orogens, compres-sional orogeny was followed by intrusion ofpost-orogenic granites about 50 million yearsafter the end of deformation.During rifting, the Aracuai basin was very
similar to the present Red Sea (chapter 10).The Red Sea extends northward from a verylarge triple junction at its southern end, withcreation of ocean crust in the southern partand extreme stretching that may develop intoan ocean basin in the north. Two rifts (Suezand Aqaba) extend from the northern end ofthe Red Sea just as the Paramirim and Sangharifts did from the northern end of the Aracuaiocean basin. If the Red Sea ever closes backon itself in the future, it seems likely that itwill develop an orogenic belt similar toAracuai.The concept of confined orogen may
explain the evolution of other orogens thanAracuai. One example may be theOrdovician–Silurian Caledonide belt ofnorthern Europe and Greenland (Hurich,1996; Kalsbeek et al., 2000). Correlation oforogenic and magmatic events shows thatNorth America, Greenland, and Balticabecame a coherent block during the MiddleProterozoic (we discuss the supercontinentNena below), much earlier than theCaledonide orogeny. The presence of ophio-lites in the upthrust terranes in Europeand subduction-generated magmatism inGreenland, however, clearly indicates closureof ocean basin. Therefore the Caledonidescannot have formed in an intracratonic beltthat did not contain an ocean basin, and theyshow all of the characteristics of a confinedorogen.
Accretion of Small or Large ContinentalBlocks to Form Supercontinents
All known supercontinents contain numerous oro-genic belts developed during the time range inwhich the supercontinents accreted. If all of these
Assembly and Dispersal of Supercontinents 87

belts resulted from the closing of ocean basins, thenthe accreting blocks were only as large as the areasbetween the orogenic belts (Unrug, 1992). If, how-ever, some of the orogenic belts were intracratonicor confined, then the accreting blocks may havecontained the belts and been much larger.
Three large continental blocks with ages of 2.0Ga and older may have been involved in the accre-tion of all younger supercontinents (Rogers, 1996).They are named Atlantica, Arctica, and Ur and arerecognized primarily by the pattern of cratonic sta-bilization ages within Pangea (fig. 6.3; discussion ofstabilization in Chapter 3). The existence of theselarge blocks requires younger orogenic belts withinthem to be intracontinental or confined, which is
highly controversial, with the degree of controversyincreasing from youngest to oldest.
� Atlantica (2.0 Ga; fig. 6.4). The numerous~2-Ga cratons of South America and westernAfrica seem to have formed a coherent conti-nent that did not fracture until the breakupof Pangea. Creation of the continentoccurred from 2.1 Ga to 2.0 Ga, an orogenicepisode referred to as the Transamazonian inSouth America and Eburnian in Africa(Boher et al., 1992, in Africa; Hartmann,2002, in South America). The continent isnamed Atlantica because the Atlantic Oceanopened through it.
88 Continents and Supercontinents
Figure 6.2. Map of Aracuai belt, a confined orogen (modified from Pedrosa-Soares et al., 2001).

The most important evidence for the exis-tence of a coherent Atlantica is correlation of~2-Ga fluvio-deltaic sediments among five ofthe cratons (Ledru et al., 1994). This correla-tion seems impossible if the cratons were
together 2 billion years ago and rifted apartlater. If they became widely separated, theprobability seems vanishingly small thatthese five cratons would have come backtogether during the growth of Gondwana
Assembly and Dispersal of Supercontinents 89
Figure 6.3. Ages of cratons in Pangea (from Rogers, 1996). Symbols designate the following cratons: AL,Aldan; AR, Aravalli; AN/AG, Anabar/Angara; BA/UK, Baltic/Ukraine; BH, Bhandara (Bastar); BR, Brazil(Guapore); BU, Bundelkhand; CA, Central Arabia; CK, Congo/Kasai; DH, Dharwar (west and east); DM,western Dronning Maud Land; EA, an assemblage of Early to Middle Proterozoic areas in easternAustralia; GA, Gawler; GU, Guiana; HE, Hearne; H–T, terranes, including Archean, assembled in theHoggar and Tibesti areas of North Africa in the Pan-African; KA, Kaapvaal; KI, Kimberley; KZ,Kazakhstan; MA, Madagascar; NA, North Atlantic, including Nain, Greenland, and Lewisian; NAS,mostly juvenile Pan-African crust in the Nubian–Arabian shield; NC, North China (Sino-Korean); NP,Napier; PI, Pilbara; RA, Rae; RP, Rio de la Plata; SC, South China (Yangtze); SF, Sao Francisco, includingSalvador; SI, Singhbhum; SL, Slave; SU, Superior; TA, Tarim; TZ, Tanzania; VE, Vestfold; WA, WestAfrica, including the small Sao Luis craton now on the coast of South America; WN, West Nile (Nile–Uweinat); WY, Wyoming craton; YI, Yilgarn; ZI, Zimbabwe. The 2–1-Ga crust in North America is mostlyjuvenile growth on the southern and western sides of the Archean shield.

and Pangea in the same relative positionsthat they had occupied 1.5 billion years ear-lier, and it is far more likely that they wouldhave been dispersed throughout youngersupercontinents.Accretion of Atlantica to Gondwana as a
coherent block requires that the numerous600–500-Ma orogenic belts within it wereeither intracratonic or confined orogens. Theevidence that the Aracuai belt in the SaoFrancisco–Congo craton was confined is veryclear (see above), but it is less certain forother belts. In chapter 3 we used the rela-tionships between zircon U/Pb ages and TDM
ages in these belts as an example of thedevelopment of new crust from pre-existingcrust instead of production of juvenile crustfrom the mantle. This lack of juvenile crustsupports the concept that these orogenicbelts did not form by the closure of largeocean basins but by intracontinental oro-geny, and we discuss the issue in more detailin chapter 8.
� Arctica (2.5 Ga; fig. 6.5). Cratons of ~2.5-Ga stabilization age occur primarily in
North America and Siberia, and the conti-nent containing them was named Arcticabecause the Arctic Ocean opened throughthem. The existence of Arctica at 2.5 Gafaces two challenges. One is the position ofSiberia, which Condie and Rosen (1994) andPelechaty (1996) place against the northernmargin of North America, but which Searsand Price (2000, 2002) suggest was posi-tioned against the western edge of NorthAmerica through much of the Proterozoic.The second problem is the history of the cra-tons in Canada. H. Williams et al. (1991)proposed the name ‘‘Kenorland’’ for a 2.5-Ga continent that included the Canadian cra-tons of Arctica (fig. 6.6). Numerous agesranging from 2.4 Ga to 2.0 Ga occur in theregion between the Superior and Slave pro-vinces. These ages suggest that Kenorlandunderwent widespread rifting during thistime and was then reassembled at 1.9–1.8Ga by collision along the Trans-Hudson oro-gen and Taltson magmatic belt.Reassembly of rifted fragments from
Kenorland raises the same question that wediscussed for Atlantica—the problem ofbringing widely separated blocks back to thesame positions they occupied before disper-sal. For this reason, Aspler and Chiarenzelli
90 Continents and Supercontinents
Figure 6.4. Map of Atlantica (from Rogers, 1996).Fluvio-deltaic sequences correlated by Ledru et al.(1994) include: Tarkwaian in West Africa;Francevillian in the Congo craton; Corrego andRio do Ouro in the Sao Francisco craton; andvariously named sequences in the Brazil andGuiana cratons. Symbols for cratons are asshown in fig. 6.3.
Figure 6.5. Map of Arctica (from Rogers, 1996).Arctica includes Kenorland (fig. 6.6) plus Siberia,Baltica, and the Wyoming craton. Symbols forcratons are as shown in fig. 6.3.
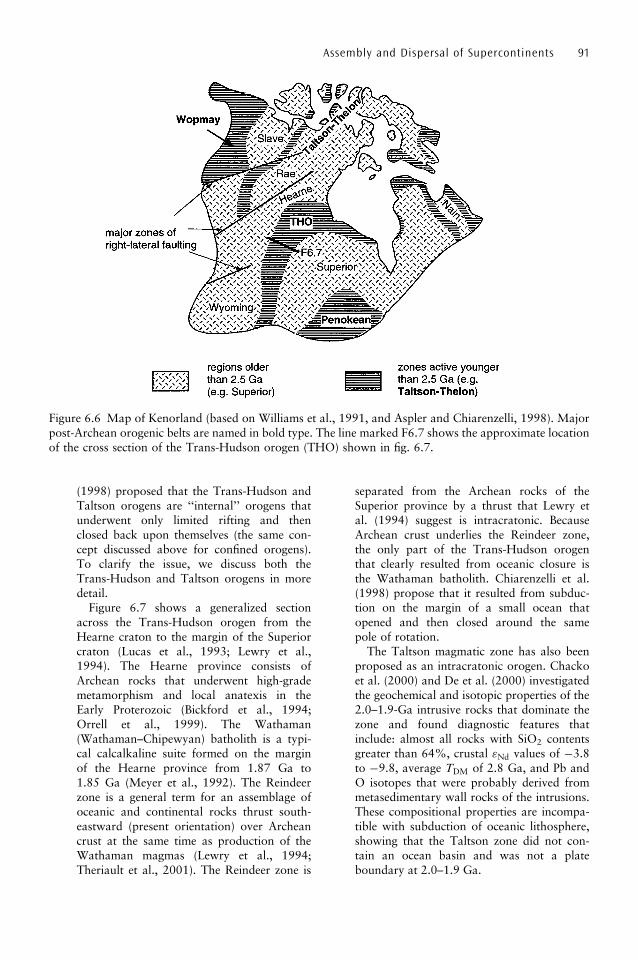
(1998) proposed that the Trans-Hudson andTaltson orogens are ‘‘internal’’ orogens thatunderwent only limited rifting and thenclosed back upon themselves (the same con-cept discussed above for confined orogens).To clarify the issue, we discuss both theTrans-Hudson and Taltson orogens in moredetail.
Figure 6.7 shows a generalized sectionacross the Trans-Hudson orogen from theHearne craton to the margin of the Superiorcraton (Lucas et al., 1993; Lewry et al.,1994). The Hearne province consists ofArchean rocks that underwent high-grademetamorphism and local anatexis in theEarly Proterozoic (Bickford et al., 1994;Orrell et al., 1999). The Wathaman(Wathaman–Chipewyan) batholith is a typi-cal calcalkaline suite formed on the marginof the Hearne province from 1.87 Ga to1.85 Ga (Meyer et al., 1992). The Reindeerzone is a general term for an assemblage ofoceanic and continental rocks thrust south-eastward (present orientation) over Archeancrust at the same time as production of theWathaman magmas (Lewry et al., 1994;Theriault et al., 2001). The Reindeer zone is
separated from the Archean rocks of theSuperior province by a thrust that Lewry etal. (1994) suggest is intracratonic. BecauseArchean crust underlies the Reindeer zone,the only part of the Trans-Hudson orogenthat clearly resulted from oceanic closure isthe Wathaman batholith. Chiarenzelli et al.(1998) propose that it resulted from subduc-tion on the margin of a small ocean thatopened and then closed around the samepole of rotation.The Taltson magmatic zone has also been
proposed as an intracratonic orogen. Chackoet al. (2000) and De et al. (2000) investigatedthe geochemical and isotopic properties of the2.0–1.9-Ga intrusive rocks that dominate thezone and found diagnostic features thatinclude: almost all rocks with SiO2 contentsgreater than 64%, crustal "Nd values of �3.8to �9.8, average TDM of 2.8 Ga, and Pb andO isotopes that were probably derived frommetasedimentary wall rocks of the intrusions.These compositional properties are incompa-tible with subduction of oceanic lithosphere,showing that the Taltson zone did not con-tain an ocean basin and was not a plateboundary at 2.0–1.9 Ga.
Assembly and Dispersal of Supercontinents 91
Figure 6.6 Map of Kenorland (based on Williams et al., 1991, and Aspler and Chiarenzelli, 1998). Majorpost-Archean orogenic belts are named in bold type. The line marked F6.7 shows the approximate locationof the cross section of the Trans-Hudson orogen (THO) shown in fig. 6.7.

Whether the Kenorland part of Arcticahas been coherent since 2.5 Ga or wasassembled at 1.9–1.8 Ga, it is clear that itbecame significantly larger by the MiddleProterozoic. Part of this growth was accre-tion on the western margin (Wopmay oro-gen, Bowring and Grotzinger, 1992), andpart consisted of continued accretion on thesouthern and eastern margins from ~1.8 Gato the formation of Rodinia at ~1 Ga
(chapter 7). Accretionary belts in easternNorth America correlate so well with simi-lar belts on the southern margin of theBaltic shield, that Gower et al. (1990)named the combined North America,Greenland, and Baltica as the superconti-nent Nena (an acronym for NorthernEurope North America; fig. 6.8). Nenaapparently remained a coherent block from~1.8 Ga to the breakup of Pangea.
92 Continents and Supercontinents
Figure 6.7. Generalized lithologic cross-section of Trans-Hudson orogen (based on Lucas et al., 1993;Lewry et al., 1994; and Chiarenzelli et al., 1998). The section unites three separate seismic profiles, and thisfigure simplifies relationships in complex terranes. Discussion in text includes names of tectonic regions.
Figure 6.8 Map of Nena. GR is Greenland (from Rogers, 1996; based on work by Gower et al., 1990).

� Ur (3.0 Ga; fig. 6.9). The only large cratonicareas stabilized as old as 3.0 Ga are all inone part of Pangea (fig. 6.3). They includethe Kaapvaal craton (appendix E), theWestern Dharwar craton of India, theSinghbhum craton of India (recently dated as3.2 Ga by Mukhopadhyay, 2001), and thePilbara craton of Australia (Barley, 1993;Kloppenberg et al., 2001; Blewett, 2002).Small exposures of 3.0-Ga cratons also occuron the margin of East Antarctica, where theyare known to have been joined to India andAustralia no later than Middle Proterozoicand probably earlier. As with Atlantica andArctica, the probability of all of these oldcratons assembling into one area of Pangeais extremely small if they had been separatedat any time between 3 Ga and the end of thePaleozoic. Because they are the oldest cra-tons known, the supercontinent created bythem was named Ur, from a German wordmeaning ‘‘original.’’
Tests of the existence of Ur are very diffi-cult because of its age. Specific correlationsof rocks are impossible, although D. Nelsonet al. (1999) suggested that both theKaapvaal and Pilbara cratons have roughlysimilar histories. The existence of Ur as oldas 3 Ga also requires that numerous youngerorogenic belts be intracratonic or confined
orogens. One uncertain area is the EasternDharwar craton (Jayananda et al., 2000;Mazumder et al., 2000).Regardless of whether Ur became a coher-
ent continent as old as 3 Ga, it may haveformed a core for a continental block thatbecame coherent no later than 1.8 Ga. Atthis time, northern India was sutured to theolder cratons of southern and eastern India,and Australia expanded by attachment of theYilgarn craton and several terranes in centraland eastern Australia (fig. 6.9). We refer tothis larger block as expanded Ur. ExpandedUr may have included the ‘‘Mawson conti-nent’’ proposed by Peucat et al. (1999), butrelationships are unclear.
Our discussions of supercontinent assembly inchapters 7 and 8 use both of the models of accretionthat we describe above—one in which all orogenicbelts were active during accretion of small indivi-dual blocks and one in which much of the super-continent was formed by accretion of one or moreof these three old blocks.
Causes of Supercontinent Assembly
Processes in the mantle exercise fundamental con-trols over the accretion and movement of conti-
Assembly and Dispersal of Supercontinents 93
Figure 6.9 Maps of Ur and expanded Ur (from Rogers, 1996). Symbols for cratons are as shown in fig. 6.3.

nents. Information about the present mantle can beobtained from a variety of geophysical methods,but ancient mantle processes must be inferredfrom the records that they left in rocks that weare able to study. In this section we discuss relation-ships among plumes, superplumes, and slab ava-lanches in the mantle and crustal processes such asthe rate of production of continental crust and thetimes of supercontinent assembly.
A fundamental seismic discontinuity in the man-tle at a depth of 660 km is caused by downwardphase change to denser material (chapter 2). Mantleprocesses associated with plate tectonic movementsnormally occur above this discontinuity, whichforms the base for convection cells that rise atspreading centers and also the lowest depth reachedby subducting slabs (hence the deepest earth-quakes). Mantle below the discontinuity affects sur-face processes largely through plumes that may begenerated as deep as the base of the mantle, which isseismically designated the d 00 layer.
At various occasions in earth history, the 660-km discontinuity seems to have been disrupted (fig.6.10). Subducted slabs of oceanic lithosphere tendto accumulate at the discontinuity because they aredenser than the mantle above and around them.Their low temperature and lack of LIL elements,removed during subduction-zone magmatism, alsomake them slightly denser than the mantle beneaththe discontinuity. Thus, places where numerousslabs have accumulated can become unstable, withthe slabs dropping into the lower mantle as a ‘‘slabavalanche’’ (Condie, 2001). This avalanche dis-places material in the lower mantle, causing it torise elsewhere on the earth as a plume or, if largeenough, as a ‘‘superplume.’’
Material rising from the lower mantle hasimportant effects on the composition of theupper mantle. Because continental crust is derivedsolely by extraction of material from the uppermantle, that part of the mantle becomes rapidlydepleted in LIL elements, including those impor-tant in analysis of isotopic systems (Rb, Nd, Re;appendix D). The upper mantle may not containenough of these LIL elements to generate all of thecontinental crust in the earth and to account forisotopic changes. Consequently, many earth scien-tists propose that compositional evolution of theupper parts of the earth can be explained only ifplumes, superplumes, or other infusions from thelower mantle periodically replenish the uppermantle in LIL elements.
In addition to compositional effects, plumescause plate movements on the surface (Gurnis,1988). Both the geoidal low created by a slab ava-lanche and the high created by rising large plumes/superplumes should move surface plates toward thearea of the avalanche. Plates that are purely oceaniclithosphere would presumably disappear into themantle, but plates that contain continents wouldbe too light to subduct. Thus, where this processcontinues for a few hundred million years, it islikely that virtually all continental blocks wouldaccumulate in one area to form a supercontinent.
Because the breakup of one supercontinent over-laps the assembly of the next one, it is possible thatmantle movements that cause breakup automati-cally begin the accretion process elsewhere. Figure6.11 shows how rising mantle beneath a supercon-tinent sends continental blocks toward areas ofaccretion above a geoid low. Presumably this wasa continuing process during most of earth history.
94 Continents and Supercontinents
Figure 6.10. Diagrammatic representation of slab avalanches.
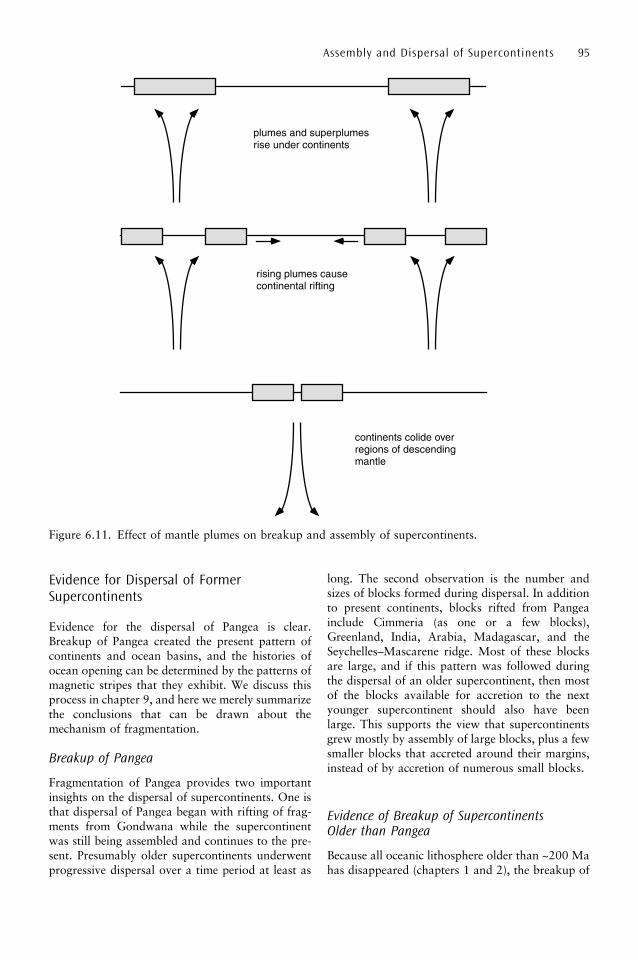
Evidence for Dispersal of FormerSupercontinents
Evidence for the dispersal of Pangea is clear.Breakup of Pangea created the present pattern ofcontinents and ocean basins, and the histories ofocean opening can be determined by the patterns ofmagnetic stripes that they exhibit. We discuss thisprocess in chapter 9, and here we merely summarizethe conclusions that can be drawn about themechanism of fragmentation.
Breakup of Pangea
Fragmentation of Pangea provides two importantinsights on the dispersal of supercontinents. One isthat dispersal of Pangea began with rifting of frag-ments from Gondwana while the supercontinentwas still being assembled and continues to the pre-sent. Presumably older supercontinents underwentprogressive dispersal over a time period at least as
long. The second observation is the number andsizes of blocks formed during dispersal. In additionto present continents, blocks rifted from Pangeainclude Cimmeria (as one or a few blocks),Greenland, India, Arabia, Madagascar, and theSeychelles–Mascarene ridge. Most of these blocksare large, and if this pattern was followed duringthe dispersal of an older supercontinent, then mostof the blocks available for accretion to the nextyounger supercontinent should also have beenlarge. This supports the view that supercontinentsgrew mostly by assembly of large blocks, plus a fewsmaller blocks that accreted around their margins,instead of by accretion of numerous small blocks.
Evidence of Breakup of SupercontinentsOlder than Pangea
Because all oceanic lithosphere older than ~200 Mahas disappeared (chapters 1 and 2), the breakup of
Assembly and Dispersal of Supercontinents 95
Figure 6.11. Effect of mantle plumes on breakup and assembly of supercontinents.
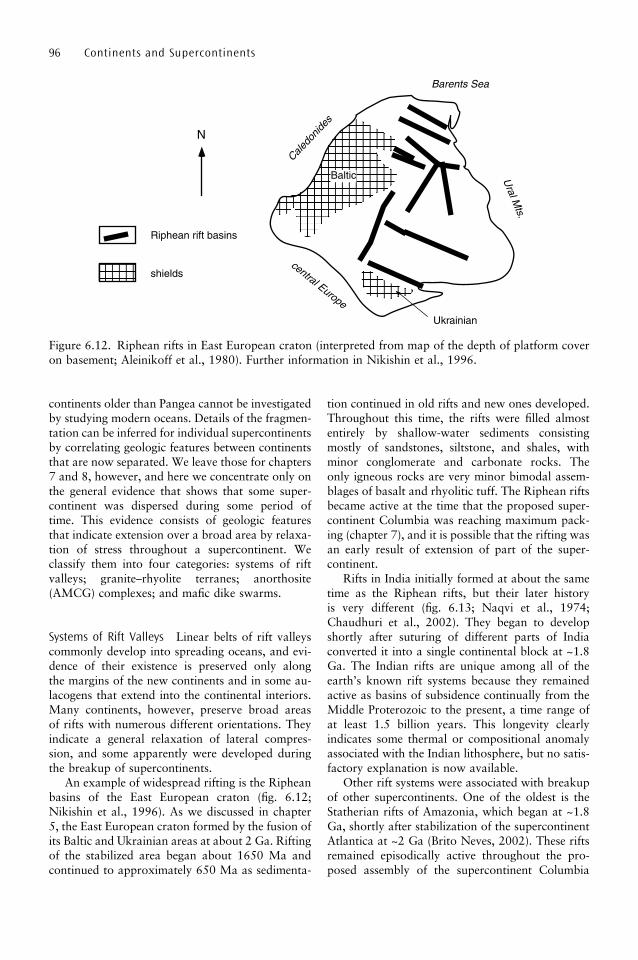
continents older than Pangea cannot be investigatedby studying modern oceans. Details of the fragmen-tation can be inferred for individual supercontinentsby correlating geologic features between continentsthat are now separated. We leave those for chapters7 and 8, however, and here we concentrate only onthe general evidence that shows that some super-continent was dispersed during some period oftime. This evidence consists of geologic featuresthat indicate extension over a broad area by relaxa-tion of stress throughout a supercontinent. Weclassify them into four categories: systems of riftvalleys; granite–rhyolite terranes; anorthosite(AMCG) complexes; and mafic dike swarms.
Systems of Rift Valleys Linear belts of rift valleyscommonly develop into spreading oceans, and evi-dence of their existence is preserved only alongthe margins of the new continents and in some au-lacogens that extend into the continental interiors.Many continents, however, preserve broad areasof rifts with numerous different orientations. Theyindicate a general relaxation of lateral compres-sion, and some apparently were developed duringthe breakup of supercontinents.
An example of widespread rifting is the Ripheanbasins of the East European craton (fig. 6.12;Nikishin et al., 1996). As we discussed in chapter5, the East European craton formed by the fusion ofits Baltic and Ukrainian areas at about 2 Ga. Riftingof the stabilized area began about 1650 Ma andcontinued to approximately 650 Ma as sedimenta-
tion continued in old rifts and new ones developed.Throughout this time, the rifts were filled almostentirely by shallow-water sediments consistingmostly of sandstones, siltstone, and shales, withminor conglomerate and carbonate rocks. Theonly igneous rocks are very minor bimodal assem-blages of basalt and rhyolitic tuff. The Riphean riftsbecame active at the time that the proposed super-continent Columbia was reaching maximum pack-ing (chapter 7), and it is possible that the rifting wasan early result of extension of part of the super-continent.
Rifts in India initially formed at about the sametime as the Riphean rifts, but their later historyis very different (fig. 6.13; Naqvi et al., 1974;Chaudhuri et al., 2002). They began to developshortly after suturing of different parts of Indiaconverted it into a single continental block at ~1.8Ga. The Indian rifts are unique among all of theearth’s known rift systems because they remainedactive as basins of subsidence continually from theMiddle Proterozoic to the present, a time range ofat least 1.5 billion years. This longevity clearlyindicates some thermal or compositional anomalyassociated with the Indian lithosphere, but no satis-factory explanation is now available.
Other rift systems were associated with breakupof other supercontinents. One of the oldest is theStatherian rifts of Amazonia, which began at ~1.8Ga, shortly after stabilization of the supercontinentAtlantica at ~2 Ga (Brito Neves, 2002). These riftsremained episodically active throughout the pro-posed assembly of the supercontinent Columbia
96 Continents and Supercontinents
Baltic
Ukrainian
shields
Riphean rift basins
Caledo
nides
Barents Sea
Ural M
ts.
central Europe
N
Figure 6.12. Riphean rifts in East European craton (interpreted from map of the depth of platform coveron basement; Aleinikoff et al., 1980). Further information in Nikishin et al., 1996.

(chapter 7), possibly demonstrating synchronousextension and compression in different parts ofthe assembling supercontinent. Other major exam-ples include aulacogens and related rifts developedin North America shortly after the breakup ofRodinia at ~800–700 Ma (chapter 7), and earlystages of rifting in Africa followed the breakup ofPangea (Lambiase, 1989).
Granite–Rhyolite Terranes Granite–rhyolite ter-ranes are large areas of rhyolitic flows and pyro-clastics locally penetrated by granitic plutonsemplaced during the same period of time as erup-tion of the volcanic rocks. Many of the rocks areperalkaline, with alkali concentrations high en-ough to generate riebeckite and aegerine. Intrusiverocks occur in ring complexes and as individualplutons. The types of rocks and their compositionsare characteristic of areas of continental rifting.
An example of granite–rhyolite terranes is theMalani suite of northwestern India (Bhushan, 2000;Pandit et al., 2001; Roy, 2001). It covers ~20,000sq km with extrusive suites up to 300 m thickformed from ~900 Ma to ~700 Ma. The oldestvolcanic rocks are minor tholeiitic and alkalibasalts, but almost all of the rest of the suite con-sists of peraluminous or peralkaline rhyolite plussome trachyte. Granites that intrude the suitelocally have SiO2 concentrations greater than70%, total alkali between 5% and 10%, and extre-mely low MgO and FeO. Most of the granitescontain hydrothermal veins and other evidence of
fluid activity, including local development of topazand tin minerals. The age range of the Malani suiteis very similar to the range proposed for rifting ofRodinia (chapter 7), and it may have been eruptedbecause of widespread extension of the supercon-tinent at that time.
Older granite–rhyolite terranes with large arealextent have been recognized in three places. Thelargest underlies much of the Phanerozoic platformof North America, where it is known from drillcores throughout the area and outcrops in the St.Francois Mountains (Bickford and Anderson,1993). It formed in an age range centered around~1.3 Ga and probably overlies terranes accreted tothe southern margin of the Canadian shield. Aterrane of similar lithology and age has been pro-posed in eastern India (Chaudhuri et al., 2002)based on rhyolite outcrops preserved in rift basins.The suites in both North America and India havebeen regarded as the result of widespread extensionduring the breakup of Columbia (chapter 7).Similarly the Uatuma suite in South America fol-lowed consolidation of northern South America(Brito Neves, 2002) and may be related to extensionof the supercontinent Atlantica (see above).
AMCG Suites Massif anorthosites mostly occur inrock associations known as AMCG complexes(Emslie and Hunt, 1990). The A signifies anortho-site, composed almost entirely of plagioclase (lab-radorite to andesine) plus minor oxides and a fewmafic minerals. The rocks are granulated becauseof intense shearing during and after emplacement.The M refers to mangerite, and the C stands forcharnockite formed by igneous processes, in con-trast to the many charnockites developed by anhy-drous metamorphism of gneisses (chapter 4). TheG refers to granite, rich in quartz and K feldsparand commonly exhibiting rapakivi texture.
The AMCG complexes probably developed initi-ally from basaltic magma ponded near the base ofthe crust or in the upper mantle. Starting from thisbasalt, separation involved several processes, gen-erally involving both crystal accumulation andmagma mixing (Wiebe, 1992). Production of theinitial basalt and subsequent processing almost cer-tainly occurred during crustal extension, which alsoenabled the resulting magmas to move upward inthe crust.
Mukherjee and Das (2002) summarized the fea-tures of 72 massif anorthosites worldwide. A feware Phanerozoic and are commonly associated withring complexes and emplaced into near-surfacerocks. More than 90% of the dated complexes,
Assembly and Dispersal of Supercontinents 97
Figure 6.13. Rift valleys in India (from Rogers andSantosh, 2002).

however, were emplaced into granulite-facies wallrocks between 2000 Ma and 1000 Ma, and half ofthem are restricted to an age range of 1500 Ma to1200 Ma.
All of the AMCG complexes and other massifanorthosites indicate crustal extension during thetime when they were formed. For some suites, thisextension may have been related to the end of alocalized orogeny, but the concentration and wide-spread distribution of complexes with ages from2000 Ma to 1000 Ma indicate one or more periodsof widespread extension during this time. We dis-cuss the possibility that the 1500–1200 Ma suitesare related to dispersal of the supercontinentColumbia in chapter 7, but the cause of emplace-ment at other times is unclear.
Mafic Dyke Swarms Mafic dike swarms developwhen basaltic magma penetrates (and partly cre-ates) cracks near the earth’s surface and crystal-lizes to gabbros, diabases, dolerites, and otherrocks with a variety of textures. Dike swarms ofany orientation are clear indicators of crustal ex-tension and occur in numerous parts of the earth(review by R. Ernst and Buchan, 1997), but themost useful are swarms that radiate from a smallarea. The center of radiation is generally inferredto be a plume that was responsible for at leastsome of the horizontal stress relaxation (see dis-cussion of ‘‘large igneous provinces’’ in Condie,2001).
The best studied swarm is the Mackenzie dikesemplaced at about 1.4 Ga in northern Canada(LeCheminant and Heaman, 1989). They radiatefrom the Coppermine River Basalts, formed nearthe end of orogeny on the continental margin ofNorth America. The dikes were intruded during thesame time range as AMCG complexes and thegranite–rhyolite terrane were developed farthersouth in North America, and all of these suitesmay be related to dispersal of the supercontinentColumbia (chapter 7).
No correlatives of the Mackenzie dikes havebeen found in other continents, but several dikeswarms have been proposed to occur in two con-tinents that were rifted apart after the dikes wereformed. For example, Correa-Gomes and Oliveira(2000) proposed that 1.0-Ga dikes in eastern Braziland western Africa were emplaced as the super-continent Rodinia was breaking up (chapter 7).Similarly, Park et al. (1995) suggested that a 780-Ma radiating dike swarm in Rodinia was separatedby rifting between Australia and North America(fig. 6.14).
Causes of Dispersal of Supercontinents
Supercontinents break up because they are sub-jected to lateral extension throughout most oftheir area. This requires uplift that can be causedonly by an accumulation of heat under the super-continent. Part of this accumulation results fromthe comparatively low conductivity of continentalcrust, which prevents escape of heat across theearth’s surface as rapidly as it does across oceaniclithosphere. Some of the increase in temperaturemay also result from the inability of subductingslabs to reach the interior of the supercontinentand cool the upper mantle beneath it.
It is unclear whether uplift of a supercontinent isrelated to the development of plumes and super-plumes (Condie, 2001). The problem is complicatedby the uncertain relationship between plumes/superplumes and basalt plateaus. Many geologistsassume that large areas of basaltic eruption are the‘‘heads’’ of plume (hotspot) tracks, although thisassumption has been challenged by examinationof sequences of ages along the tracks (chapter 2).
Some basalt plateaus are clearly related to thebreakup of Pangea. Hawkesworth et al. (1999) andStorey et al. (2001) discussed the possibility that abroad region of Gondwana was underlain by hotmantle (superplume?) that generated basalt pro-vinces during different ages of fragmentation in atleast three locations (further discussion in chapter9). Courtillot et al. (1999) also suggested that muchof the breakup of Pangea was caused by plumesthat developed at different times. Broad uplift ofPangea before rupturing is also shown now by ageoidal high in most of the Atlantic Ocean, which is
98 Continents and Supercontinents
Figure 6.14. Orientations of ~800-Ma mafic dikesin Australia and North America (modified fromPark et al., 1995). The black circle shows thelocation of a possible plume in southeasternAustralia.
almost certainly the remains of an axis of upliftbeneath Pangea.
The relationship of plumes (and basalt plateaus)to fragmentation of supercontinents, however, is notalways clear (Storey and Kyle, 1997; Condie, 2001).Some parts of Pangea seem to have rifted apartwithout any associated magmatism, either of basaltsor other magmatic rocks. Furthermore, some basaltplateaus clearly have no relationship to superconti-nents. Examples include the ~15-Ma ColumbiaRiver basalts in western North America and, lessclearly, a possible superplume in the Pacific Oceanfrom about 120 Ma to 80 Ma (Larson, 1991). Thissuperplume apparently caused so much reorganiza-tion of the earth’s interior that no magnetic reversalsoccurred for 40 million years, referred to as theCretaceous ‘‘magnetic quiet zone.’’ The plume alsoformed numerous oceanic plateaus that are stillpreserved in the ocean and may have initiatedsome of the Pacific hotspot tracks.
Summary
Models for the formation of supercontinentsdepend highly on interpretation of the historyof orogenic belts within the continents. Inter-continental belts formed by closure of oceans withinthe belts demonstrate assembly of terranes on either
side. Intracontinental belts that formed by rework-ing of older crust within the belt, however, probablydeveloped within a large continental block thataccreted intact to the supercontinent. Some confinedorogens opened briefly and closed without disper-sing the continental blocks that contain them, thuspermitting those blocks to accrete intact to a super-continent.
Supercontinents probably accrete where mantleprocesses bring most of the earth’s terranes into onearea, probably above the downgoing limbs of verylarge convection cells. Different interpretations ofthe nature of orogenic belts lead to different modelsfor the assembly of supercontinents. If most beltsare intercontinental, then supercontinents havebeen formed by accretion of numerous small ter-ranes. If many belts are intracontinental or con-fined, however, then supercontinents formed byaccretion of a few large blocks and accumulationof smaller terranes around their margins.
Dispersal of supercontinents is probably causedby accumulation of heat under the supercontinent,possibly above rising convection cells. The dispersalof Pangea can be traced by patterns of oceanopening, but the breakup of older supercontinentsmust be inferred from evidence of widespread conti-nental extension. Indicators of extension include riftsystems, granite–rhyolite terranes, anorthosite(AMCG) complexes, and dike swarms.
Assembly and Dispersal of Supercontinents 99

7
Supercontinents Older than Gondwana
The configurations of Gondwana and Pangea arewell known because the histories of oceans that
opened to disperse Pangea can be reconstructedfrom their patterns of magnetic stripes (chapters 1and 9). The configurations of older supercontinentscannot be easily determined because the oceaniclithosphere formed when they dispersed is so oldthat it has been completely subducted anddestroyed. Thus the histories, and even existence,of these older continents must be inferred fromindirect evidence.
The four most widely used techniques for recon-structing old supercontinents are: paleomagneticdata; correlation of orogenic belts that developedduring accretion of the supercontinent: correlationof extensional features that developed when thesupercontinent fragmented; and recognition thatsediment in one present continent was derivedfrom a source now in another continent.
Paleomagnetic information can be used in twoways. One is to compare APW curves for differentcontinental blocks to determine whether there wereperiods of time when two or more blocks seem tohave been joined (appendix C). If similar move-ments are found for several continental blocksthat are now separated, then we can infer thatthey formed a single block, perhaps a superconti-nent, during the period when they had identicalAPW paths. Another method of using paleomag-netic data is simply to compare the apparent lati-tudes of numerous continental blocks. Even thoughlongitudes cannot be specified, latitudes can be usedto infer proximity of different blocks, thus support-ing other information that suggests the configura-tion of a supercontinent.
Correlation of orogenic belts starts with identi-fication of belts of different ages in present conti-nents. Belts of the same age are now scattered allover the earth’s land surface because of fragmenta-tion of supercontinents and movement of moderncontinents to their present positions. The configura-tions of older supercontinents can be inferred byplacing modern continents into positions in which
these orogenic belts line up to form a pattern thatwould be expected to develop during accretion of asupercontinent. We demonstrate this techniquebelow in our discussion of the configurations ofRodinia and Columbia.
Correlation of extensional features is possiblebecause fragmentation of a supercontinent is gen-erally accompanied by widespread extensionthroughout much of the former landmass (chapter6). This extension results in some features that canbe correlated among the newly formed fragments,including orientations of mafic dike swarms andpositions of aulacogens and other rifts. Featuressuch as granite–rhyolite terranes and AMCG suites,however, indicate broad extension but are not read-ily correlatable from place to place.
Determination of the sources of sediments ismost commonly done by measuring the ages ofzircons in the clastic suites. In many sediments,the ages correspond to the ages of nearby crystallinerocks, but some sediments contain zircons thatcould not have derived from adjacent rocks, sug-gesting that their source has now rifted away duringfragmentation of a supercontinent.
Other, less direct, methods have been employedin efforts to infer configurations of old superconti-nents. In chapter 6 we described how the groupingof cratons with similar stabilization ages in differentparts of Pangea suggests the existence of three oldlarge continents. We discuss below how the distri-bution of different types of sediments has been usedto infer the existence of two supercontinents in theLate Archean.
All of these methods become less certain as theage of the proposed supercontinent increases. Forthis reason, we discuss supercontinents older thanGondwana in order of their increasing age. Theyoungest of these is Rodinia, which apparentlyreached its maximum packing (chapter 6) atabout 1 Ga. The configuration of Rodinia is highlycontroversial, partly because the entire concept ofthis supercontinent was initially suggested asrecently as 1990. Columbia, with maximum pack-
100

ing at about 1.6 Ga, was originally proposed byPiper (2003) and is even more controversial. Theoldest is an unnamed supercontinent that was pro-posed in 2003 to have existed in the Late Archeanand Early Proterozoic.
Because of the newness of all of these proposalsand their highly controversial nature, we cannotpresent a timely discussion of them in this book,and we use a website at www.gondwanaresearch.com/csbook to maintain up-to-date information onnew data and ideas. This information supplementsthe discussion of the configurations of supercon-tinents in this chapter and of related orogenicbelts in appendices G (belts of Grenville age) andH (belts of 2.1–1.3 Ga age).
Rodinia
The transition from Precambrian to Cambrian ismarked by the sudden appearance of skeletal organ-isms (chapter 12). In stratigraphic sections thatcross this boundary without interruption in sedi-mentation, lower sequences with enigmatic soft-bodied organisms gradually change upward tosediments that contain organized burrows, smallshells of controversial origin, and then shelledinvertebrates that represent most of the phyla thatexist today. The development of skeletal structuresapparently occurred within a few million yearsbetween 540–530 Ma, and McMenamin andMcMenamin (1990) proposed that it followed theevolution of various groups of soft-bodied metazo-ans that occurred in large areas of continentalshelves in the latest Precambrian. This suggested asupercontinent of some uncertain configuration,and McMenamin and McMenamin named itRodinia, derived from a Russian word for ‘‘beget.’’
The search for a configuration of Rodinia wasassisted by the observation that a time of 1 Ga andslightly older was a period of major orogeny inmany parts of the world. Named for the typeGrenville area of eastern Canada, correlative beltswith various names occur in linear orogens in allcontinents (fig. 7.1). Events of this time, however,are absent from many broad regions, suggestingthat the Grenville-age belts were linked alongworldwide zones of orogeny that may have createdthe supercontinent proposed by McMenamin andMcMenamin.
Grenville-age orogens are shown in fig. 7.1 andare summarized in appendix G. Figure 7.1 distin-guishes orogens regarded as ‘‘interior magmaticbelts’’ from those classified as ‘‘exterior thrust
zones.’’ The criteria for these two types of orogenare discussed in our description of the typeGrenville belt in appendix G.
Fitting Grenville-age belts together has led tonumerous proposed configurations for ~1-Gasupercontinents, most of which are referred to asRodinia but also include an early proposal forPalaeopangaea.
Proposed Configurations of Rodinia
The first configurations of a 1-Ga supercontinent touse the name Rodinia were published in the early1990s. Following them, numerous modificationshave been suggested throughout the past decade,but here we discuss only four of them and leavemany proposals to our website.
All proposals begin with the concept that muchof North America (‘‘cratonic North America’’) hadachieved nearly its present shape by ~1.3–1.2 Ga.Whether it had reached this configuration earlier,perhaps 1.8 Ga or 2.5 Ga, is unclear and is dis-cussed in chapter 6.
The configuration of Rodinia most commonlyreferred to was published by Hoffman (1991).Figure 7.2a shows blocks surrounding Laurentiaand attached East Antarctica along a series ofGrenville-age belts. Baltica is attached to southernGreenland and Amazonia to eastern North America.Next to Amazonia, Grenville-age belts continuearound blocks east of the Congo craton and attachthem to Congo. Grenville-age belts almost comple-tely surround the Kalahari craton and followaround the coast of East Antarctica, and all ofEast Antarctica is assumed to have been a coherentblock at ~1 Ga. India and Australia are shownsutured to East Antarctica in the same relative posi-tions they occupied in East Gondwana (chapter 8).The positions of numerous blocks now in Asia aresuggested but not shown on the map. This config-uration is similar to one proposed by Meert (2001)based on paleomagnetic evidence (fig. 7.2b).
The configuration of Rodinia proposed byHoffman (1991) assumes that all Grenville beltsare zones of oceanic closure between continentalblocks. It also accepts a juxtaposition of westernNorth America and East Antarctica (Dalziel, 1991),referred to as the SWEAT (Southwest NorthAmerica East Antarctica) proposed by Moores(1991) rather than a position of Australia againstNorth America (AUSWUS connection; see below).Siberia is located adjacent to northern Canada, asproposed by Condie and Rosen (1994). West Africais shown related to both Congo and Amazonia butwithout Grenville-age attachment.
Supercontinents Older than Gondwana 101

On the basis of an early suggestion by Brookfield(1993), Karlstrom et al. (1999) and Burrett andBerry (2000, 2002) proposed a configuration forpart of Rodinia that is different from the onesdiscussed above (fig. 7.2c). The key relationship isan ‘‘AUSWUS’’ connection, named for a position inwhich eastern Australia adjoins the western UnitedStates. This configuration correlates the Grenville/Sveconorwegian belts with the Musgrave andAlbany/Fraser belts of Australia and further intoadjoined belts in East Antarctica. It also requiresOaxaquia (appendix G) to be a link between NorthAmerica and Australia. By placing Australia south(present orientation) of its position in other modelsof Rodinia, the AUSWUS configuration leaves roomfor Siberia to be joined to western Canada, asproposed by Sears and Price (2000, 2002).
A configuration of a ~1-Ga supercontinent quitedifferent from Rodinia was suggested by Piper(1982, 2001; fig. 7.2d). He referred to it as
‘‘Palaeopangaea’’ because it had a slightly curvedshape similar to that of Pangea. The principal evi-dence for Palaeopangaea is paleomagnetic data sup-plemented by correlation of Grenville belts. Pipercompared APW curves (chapter 1) for differentblocks in both Palaeopangaea and a Rodinia con-figuration, and the better correlation of curveswithin Palaeopangaea has been used as evidenceto support that configuration. The configurationproposed by Piper (2001) accepts the coherence ofthe three old continental assemblies proposed byRogers (1996; chapter 6).
Many alternative configurations have been pro-posed for Rodinia. We discuss them in the websiteand mention only a few examples here. Li et al.(1995) placed Baltica off the coast of Greenlandclose to the position it occupied in Pangea, SouthChina between Australia and North America, andNorth China adjacent to Siberia along a continua-tion of the join between Baltica and Greenland.
102 Continents and Supercontinents
Figure 7.1. Locations of Grenville belts. For clarity, southern Africa is shown at two locations. DA,Darling; MU, Musgrave; FR, Fraser; AL, Albany; WI, Windmill Islands; BU, Bunger Hills; EG, EasternGhats; RA, Rayner; TR, Transantarctic; MA, Maudheim; NA, Natal; LU, Lurio; GR, Grenville; AP;scattered outcrops in the Appalachians; LL, Llano; WT, West Texas; OA, Oaxaquia; SV, Sveconorwegian;SU, Sunsas; KI, Kibaran. Further discussion in text and appendix H.

Dalziel et al. (2000b) placed the Kalahari blockagainst southern North America. Torsvik et al.(2001) proposed that India and East Antarcticawere separated in Rodinia, and Hartz and Torsvik(2002) place the eastern side of Baltica (presentorientation) instead of the western side againstGreenland. Wingate et al. (2002) proposed anAUSMEX connection, in which Australia wasadjacent to Mexico instead of to the westernUnited States.
Breakup of Rodinia
Separation of blocks in Rodinia probably occurredmostly between 800–600 Ma. In this section wediscuss the evidence for dispersal and brieflydescribe movements of continental blocks fromRodinia to Gondwana. We leave a more completediscussion of the movements of blocks between 750Ma and 250 Ma to chapter 8.
Rifting Because it was at or near the center of Ro-dinia, the consequences of rifting are well dis-played in North America (fig. 7.3). The earliestdevelopment is the midcontinent rift system, whichbegan during the last stages of accretion in otherparts of Rodinia. The only outcrop is the lopolithicDuluth gabbro with an age of ~1.1 Ga, and therest of both the western and eastern branches areburied by flat-lying Paleozoic sediments. This riftsystem remained active throughout the Paleozoic,forming depocenters for sedimentary accumula-tions thicker than on the midcontinent platform.
Rifting of the western margin of PrecambrianNorth America may have begun at ~750 Ma,when APW curves between Laurentia andAustralia began to diverge (Powell et al., 1993).Subsidence analysis of latest-Proterozoic andPaleozoic sequences in western North Americashows that accumulation of sediments in this areabegan at ~625 Ma and continued without interrup-tion until docking of arc terranes in the Devonian(Bond et al., 1984; chapter 5). The similarity ofthis series of sediments in North Americawith sequences preserved in the TransantarcticMountains led Moores (1991) to propose theSWEAT connection (see above).
Eastern and southern North America developeda complex margin as the continent rifted awayfrom some part of South America and attachedblocks. The margin is highly irregular because ofoffset along numerous transform faults (fig. 7.3;Thomas, 1977). The largest fault causes the presentseparation of the Appalachian and Ouachita oro-gens, and smaller offsets along the Appalachians
controlled the development of salients where theAppalachian fold and thrust belt was deformedfarther west during the Alleghenian orogeny (chap-ter 10). Several rifts extend into the continent fromthe margin, and some remained active from thelatest Proterozoic through most of the Paleozoic.
Complex patterns of rifting associated with thebreakup of Rodinia are known in continental areasoutside of North America. In two of them, theRiphean rifts of Russia (chapter 6) and the riftvalleys of India, post-Rodinia sedimentation sim-ply continued in rifts that had already been estab-lished in the Middle Proterozoic. In South Americaand West Africa, however, new patterns of riftsdeveloped shallow ocean basins floored by conti-nental crust throughout a broad continental areathat had been stable since ~2 Ga (Brito Neves,2002; fig. 7.4).
Movement after Breakup Rodinia broke up intocontinental blocks whose histories are very contro-versial (fig. 7.5). Because Laurentia was at the cen-ter, it was almost completely surrounded by riftedmargins that remained passive until the Paleozoic(chapter 5). South America moved away fromNorth America by a counterclockwise rotation asit traveled to the position south of North Americathat it would occupy in Pangea (chapter 8). As itmoved, fragments of western South America riftedaway and traveled to the east coast of NorthAmerica at the same time as rifted terranes fromeastern North America were attached to westernSouth America (Thomas and Astini, 2002; see dis-cussion of Andes and Avalonian terranes in chap-ter 5). Brief collisions between North and SouthAmerica may also have occurred during thisperiod of migration, possibly contributing to com-pressional stresses generated during Paleozoic oro-genies (Dalziel, 1997).
The western margin of Africa in Rodinia hadapparently been passive during most of the accre-tion of the supercontinent. This condition may haveremained unchanged if South America and west-central Africa moved largely as a coherent block,but if all of Africa consisted mostly of separateblocks, they would have followed different pathsuntil their accretion to Gondwana. Much of easternand southern Africa became involved in compres-sive orogeny by latest Proterozoic time as West andEast Gondwana were fused together (chapter 8).
Numerous blocks separated from western NorthAmerica when Rodinia broke apart. North andSouth China probably moved separately from con-troversial positions in Rodinia until their accretionto Pangea. Australia, India, Madagascar, at least
Supercontinents Older than Gondwana 103
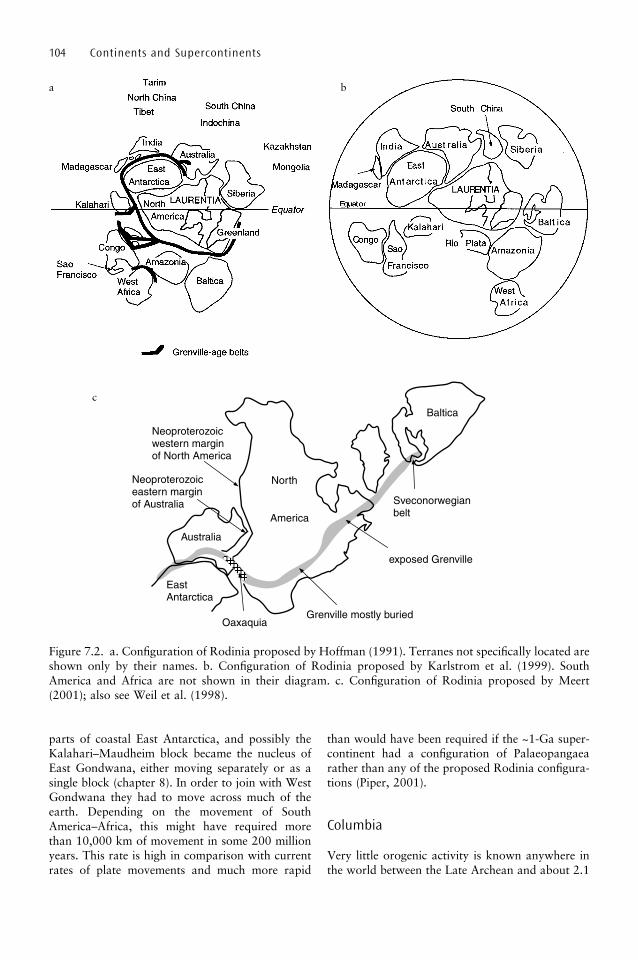
parts of coastal East Antarctica, and possibly theKalahari–Maudheim block became the nucleus ofEast Gondwana, either moving separately or as asingle block (chapter 8). In order to join with WestGondwana they had to move across much of theearth. Depending on the movement of SouthAmerica–Africa, this might have required morethan 10,000 km of movement in some 200 millionyears. This rate is high in comparison with currentrates of plate movements and much more rapid
than would have been required if the ~1-Ga super-continent had a configuration of Palaeopangaearather than any of the proposed Rodinia configura-tions (Piper, 2001).
Columbia
Very little orogenic activity is known anywhere inthe world between the Late Archean and about 2.1
104 Continents and Supercontinents
Figure 7.2. a. Configuration of Rodinia proposed by Hoffman (1991). Terranes not specifically located areshown only by their names. b. Configuration of Rodinia proposed by Karlstrom et al. (1999). SouthAmerica and Africa are not shown in their diagram. c. Configuration of Rodinia proposed by Meert(2001); also see Weil et al. (1998).
a b
c
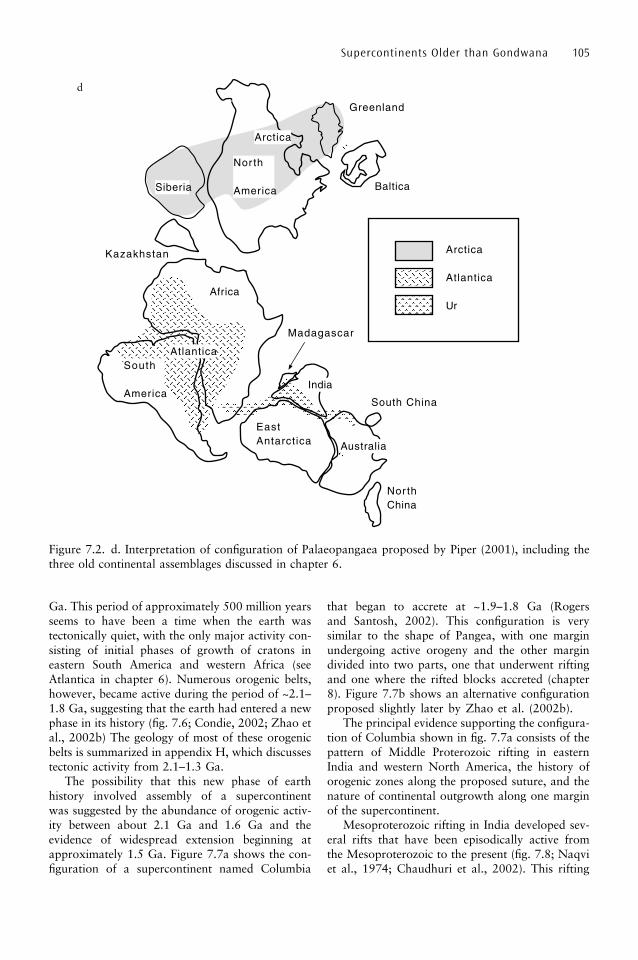
Ga. This period of approximately 500 million yearsseems to have been a time when the earth wastectonically quiet, with the only major activity con-sisting of initial phases of growth of cratons ineastern South America and western Africa (seeAtlantica in chapter 6). Numerous orogenic belts,however, became active during the period of ~2.1–1.8 Ga, suggesting that the earth had entered a newphase in its history (fig. 7.6; Condie, 2002; Zhao etal., 2002b) The geology of most of these orogenicbelts is summarized in appendix H, which discussestectonic activity from 2.1–1.3 Ga.
The possibility that this new phase of earthhistory involved assembly of a supercontinentwas suggested by the abundance of orogenic activ-ity between about 2.1 Ga and 1.6 Ga and theevidence of widespread extension beginning atapproximately 1.5 Ga. Figure 7.7a shows the con-figuration of a supercontinent named Columbia
that began to accrete at ~1.9–1.8 Ga (Rogersand Santosh, 2002). This configuration is verysimilar to the shape of Pangea, with one marginundergoing active orogeny and the other margindivided into two parts, one that underwent riftingand one where the rifted blocks accreted (chapter8). Figure 7.7b shows an alternative configurationproposed slightly later by Zhao et al. (2002b).
The principal evidence supporting the configura-tion of Columbia shown in fig. 7.7a consists of thepattern of Middle Proterozoic rifting in easternIndia and western North America, the history oforogenic zones along the proposed suture, and thenature of continental outgrowth along one marginof the supercontinent.
Mesoproterozoic rifting in India developed sev-eral rifts that have been episodically active fromthe Mesoproterozoic to the present (fig. 7.8; Naqviet al., 1974; Chaudhuri et al., 2002). This rifting
Supercontinents Older than Gondwana 105
Figure 7.2. d. Interpretation of configuration of Palaeopangaea proposed by Piper (2001), including thethree old continental assemblages discussed in chapter 6.
d

106
Figure 7.3. Neoproterozoic rifting along the eastern margin of North America. The complex pattern oftransforms that intersect the margin is from Thomas (1977).
Figure 7.4. Rift patterns in Amazonia and western Africa following the breakup of Rodinia (modified fromBrito Neves, 2002).

107
Figure 7.5. Breakup of Rodinia.
Figure 7.6. Locations of orogenic belts with ages from 2.1–1.3 Ga. For clarity, southern Africa is shown attwo locations. Tn, Trans-North China; Ak, Akitkan; Ag, Angara; Kk, Kola–Karelia; Vo, Volhyn; Pa,Pachemel; Sv, Svecofennian; Kg, Konigsbergian–Gothian; Fo, Foxe; Wo, Wopmay; Tt, Taltson–Thelon; Ri,Rinkian; Ng, Nagssugtoqidian; To, Torngat; Un, Ungava; Nq, New Quebec; Ke, Ketilidian; Mk,Makkovikian; La, Labradorian; Th, Trans-Hudson; Gf, Great Falls; Pe, Penokean; Yv, Yavapai; Ma,Mazatzal; Rj, Rio Negro–Juruena; Ro, Rondonian; Te, Transamazonian–Eburnian; Ca, Capricorn; Af,Albany–Fraser; Wb, Windmill Islands–Bunger Hills; Ra, Rayner; Ci, Central Indian; Eg, Eastern Ghats;Ad, Aravalli–Delhi; Ln, Lurio–Namama; Li, Limpopo. Further discussion in text and Appendix H.
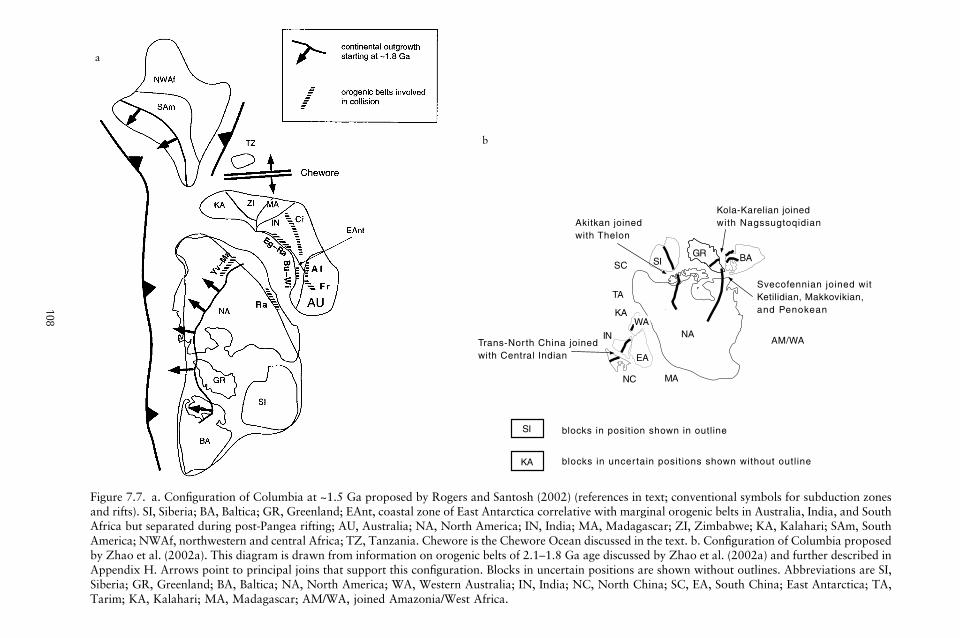
108
Figure 7.7. a. Configuration of Columbia at ~1.5 Ga proposed by Rogers and Santosh (2002) (references in text; conventional symbols for subduction zonesand rifts). SI, Siberia; BA, Baltica; GR, Greenland; EAnt, coastal zone of East Antarctica correlative with marginal orogenic belts in Australia, India, and SouthAfrica but separated during post-Pangea rifting; AU, Australia; NA, North America; IN, India; MA, Madagascar; ZI, Zimbabwe; KA, Kalahari; SAm, SouthAmerica; NWAf, northwestern and central Africa; TZ, Tanzania. Chewore is the Chewore Ocean discussed in the text. b. Configuration of Columbia proposedby Zhao et al. (2002a). This diagram is drawn from information on orogenic belts of 2.1–1.8 Ga age discussed by Zhao et al. (2002a) and further described inAppendix H. Arrows point to principal joins that support this configuration. Blocks in uncertain positions are shown without outlines. Abbreviations are SI,Siberia; GR, Greenland; BA, Baltica; NA, North America; WA, Western Australia; IN, India; NC, North China; SC, EA, South China; East Antarctica; TA,Tarim; KA, Kalahari; MA, Madagascar; AM/WA, joined Amazonia/West Africa.
b
a
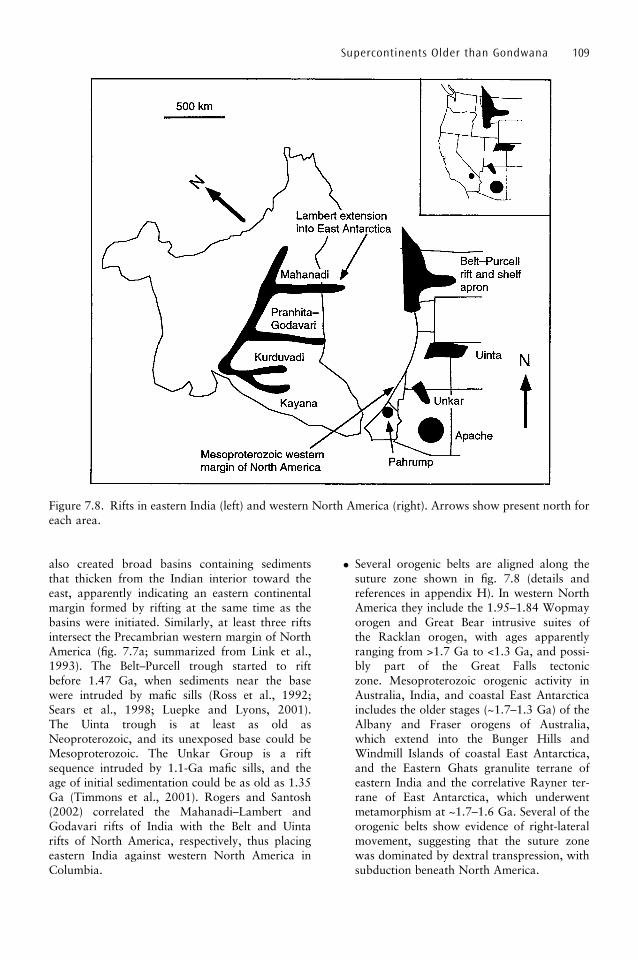
also created broad basins containing sedimentsthat thicken from the Indian interior toward theeast, apparently indicating an eastern continentalmargin formed by rifting at the same time as thebasins were initiated. Similarly, at least three riftsintersect the Precambrian western margin of NorthAmerica (fig. 7.7a; summarized from Link et al.,1993). The Belt–Purcell trough started to riftbefore 1.47 Ga, when sediments near the basewere intruded by mafic sills (Ross et al., 1992;Sears et al., 1998; Luepke and Lyons, 2001).The Uinta trough is at least as old asNeoproterozoic, and its unexposed base could beMesoproterozoic. The Unkar Group is a riftsequence intruded by 1.1-Ga mafic sills, and theage of initial sedimentation could be as old as 1.35Ga (Timmons et al., 2001). Rogers and Santosh(2002) correlated the Mahanadi–Lambert andGodavari rifts of India with the Belt and Uintarifts of North America, respectively, thus placingeastern India against western North America inColumbia.
� Several orogenic belts are aligned along thesuture zone shown in fig. 7.8 (details andreferences in appendix H). In western NorthAmerica they include the 1.95–1.84 Wopmayorogen and Great Bear intrusive suites ofthe Racklan orogen, with ages apparentlyranging from >1.7 Ga to <1.3 Ga, and possi-bly part of the Great Falls tectoniczone. Mesoproterozoic orogenic activity inAustralia, India, and coastal East Antarcticaincludes the older stages (~1.7–1.3 Ga) of theAlbany and Fraser orogens of Australia,which extend into the Bunger Hills andWindmill Islands of coastal East Antarctica,and the Eastern Ghats granulite terrane ofeastern India and the correlative Rayner ter-rane of East Antarctica, which underwentmetamorphism at ~1.7–1.6 Ga. Several of theorogenic belts show evidence of right-lateralmovement, suggesting that the suture zonewas dominated by dextral transpression, withsubduction beneath North America.
Supercontinents Older than Gondwana 109
Figure 7.8. Rifts in eastern India (left) and western North America (right). Arrows show present north foreach area.

The subduction that began at 2.1–1.8 Gaalong the southern margin of Baltica, easternmargin of North America, and western mar-gin of Amazonia continued as a broad zoneof continental outbuilding that continuedinto Grenville time (appendix H). In Balticathese belts include the Svecofennian orogen,Western Gneiss region, the SouthwestScandinavian gneiss complex, and theKonigsbergian–Gothian magmatic suite. TheKetilidian orogen of Greenland andMakkovik province of Labrador developedbetween approximately 1.8–1.7 Ga, andfurther outbuilding continued in NorthAmerica through the early phases of theGrenville orogeny. This outgrowth is wellshown by the Yavapai and Mazatzal pro-vinces of the southwestern United States,which developed from ~1.8–1.5 Ga. Theseorogens apparently continue northward tothe Canadian shield beneath Phanerozoicplatform sediments. The western part of theAmazon craton also underwent marginalgrowth from ~1.8–1.3 Ga, when subductionbeneath Amazonia progressively formed theRio Negro–Juruena and Rondonian suites(appendix H).
The configuration of Columbia proposed byZhao et al. (2002b; fig. 7.7b) compares with theone proposed by Rogers and Santosh in the fol-lowing ways.
� The major part of the supercontinent in bothproposals is Nena, consisting of NorthAmerica, Greenland, Siberia, and Baltica,with Siberia in the same position in bothconfigurations.
� South America and northwestern Africa arejoined in both configurations, referred to asthe continental assemblage Atlantica in chap-ter 6, but Zhao et al. do not place thisregion in contact with other continentalareas in the supercontinent.
� South China is shown as a separate block byZhao et al. and omitted by Rogers andSantosh.
� Zhao et al. show North China attached toIndia, with the Trans-North China Orogenconnected to the Central Indian TectonicZone, but North China/India are shown onlyquestionably attached to the rest of thesupercontinent. Rogers and Santosh omitNorth China from Columbia because ofuncertainty about its location.
� A major difference between the configura-tions proposed by Zhao et al. (2002b) andby Rogers and Santosh (2002) centersaround East Antarctica. Zhao et al. group allof East Antarctica with Australia, SouthAfrica, and the Tarim craton of central Asia.This assembly is sutured against the westernmargin of North America, with EastAntarctica opposite the United States andAustralia opposite Canada. In contrast,Rogers and Santosh propose an expanded Ur(chapter 6) that contains India, South Africa,Australia, and coastal Antarctica, with asouthern margin (present orientation) at anunknown location under the Antarctic ice-cap. The configuration proposed by Rogersand Santosh omits the rest of East Antarctica(including the ‘‘Mawson continent’’ pro-posed by Peucat et al., 1999) becauseFitzsimons (2000) indicates that EastAntarctica may not have been a coherentblock before Pan-African time.
Paleomagnetic confirmation of the configura-tions of Columbia is difficult to find because ofthe age of the proposed supercontinent. Meert(2002) found that the configuration suggested byRogers and Santosh (2002) was consistent withpaleomagnetic data but could not be supported bythem. Similarly, Zhao et al. (2002b) found paleo-magnetic support for parts of their proposed con-figuration but no complete confirmation.
Evidence for Breakup of Columbia
In addition to the rifting between India and NorthAmerica discussed above, abundant evidence showswidespread fragmentation and extension of conti-nental blocks beginning at ~1.5 Ga. It appliesequally well to either configuration of Columbiaproposed above, but for simplicity we show it infig. 7.9 on the map of Columbia proposed byRogers and Santosh (2002; fig. 7.7a). The generalcharacteristics of extensional features describedhere are described in chapter 6.
Rifting occurred along all margins of Columbiafrom about 1.6–1.4 Ga. A rift along one margin isshown by the ~1.4-Ga Chewore ophiolite in theZambezi orogenic belt between Zimbabwe and cen-tral Africa (fig. 7.7a; Oliver et al., 1998; S. Johnsonand Oliver, 2000). It may indicate that theTanzania craton rifted away from the Zimbabwecraton at this time and then moved across an inter-vening ocean basin to collide with the Congo craton
110 Continents and Supercontinents
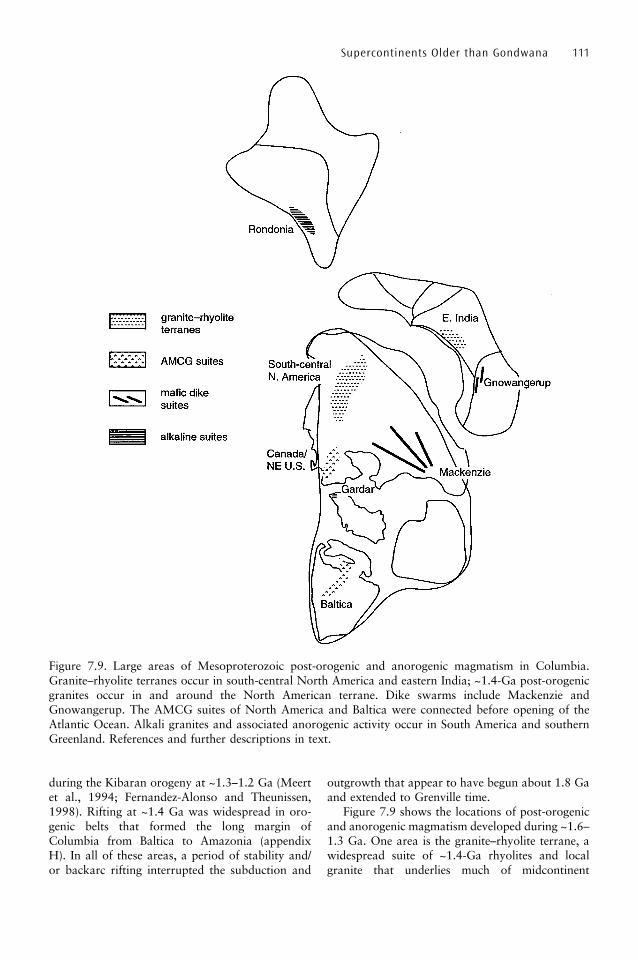
during the Kibaran orogeny at ~1.3–1.2 Ga (Meertet al., 1994; Fernandez-Alonso and Theunissen,1998). Rifting at ~1.4 Ga was widespread in oro-genic belts that formed the long margin ofColumbia from Baltica to Amazonia (appendixH). In all of these areas, a period of stability and/or backarc rifting interrupted the subduction and
outgrowth that appear to have begun about 1.8 Gaand extended to Grenville time.
Figure 7.9 shows the locations of post-orogenicand anorogenic magmatism developed during ~1.6–1.3 Ga. One area is the granite–rhyolite terrane, awidespread suite of ~1.4-Ga rhyolites and localgranite that underlies much of midcontinent
Supercontinents Older than Gondwana 111
Figure 7.9. Large areas of Mesoproterozoic post-orogenic and anorogenic magmatism in Columbia.Granite–rhyolite terranes occur in south-central North America and eastern India; ~1.4-Ga post-orogenicgranites occur in and around the North American terrane. Dike swarms include Mackenzie andGnowangerup. The AMCG suites of North America and Baltica were connected before opening of theAtlantic Ocean. Alkali granites and associated anorogenic activity occur in South America and southernGreenland. References and further descriptions in text.
United States (Bickford and Anderson, 1993; VanSchmus et al., 1996). Granites of ~1.4-Ga age occurwithin the granite–rhyolite terrane and also arespread throughout most of the pre-1.5-Ga orogenicbelts of the central and southwestern United States(Anderson and Morrison, 1992; Anderson andCullers, 1999). They are a typical post-orogenicsuite, consisting almost exclusively of granite with-out any associated mafic or intermediate rocks andfew alkaline rocks (chapter 4). A rhyolite provincesimilar to the granite–rhyolite terrane is now pre-served only as fragments in the rifts and marginalbasins of eastern India that began to form atapproximately 1.5 Ga. Rocks consist partly offlows and ash flows but are predominantly air-falltuffs deposited in water and partly mixed withother sediments.
Several dozen plutonic assemblages in northernNorth America and southern Baltica contain a mix-ture of rock types broadly classified as anorthositecomplexes (AMCG; Emslie and Hunt, 1990;Haapala and Ramo, 1990; Puura and Floden,1999; Ahall et al., 2000; Lu et al., 2002). Almostall of the massifs have ages ranging from about 1.6–1.4 Ga, and all of them are clearly related to relaxa-tion of horizontal stress shortly after orogeniccrustal growth. Minor AMCG suites in NorthChina have ages of ~1.6 Ga, similar to ages ofolder suites in Baltica, suggesting this age of separa-tion of the two cratons.
Rapakivi granites and related rocks occur innumerous plutonic suites in the Rondonian oro-genic region of the southern Amazonian craton(Bettencourt et al., 1999). The massifs consist pri-marily of rapakivi granite with minor associatedmafic rocks, and some alkaline intrusives are sometalliferous that the area is commonly referredto as the Rondonian tin province. Ages rangefrom ~1.6 Ga to slightly greater than 1.3 Ga andcenter between 1.5–1.4 Ga. They either follow, orare associated with, the last stages of theRondonian orogeny, presumably as a result ofpost-orogenic crustal extension.
The Mackenzie dike swarm consists of maficdikes that radiate from a small area of northwesternCanada and extend east and south across much ofCanada. Widely spaced samples have ages closelycentered at ~1.3 Ga (LeCheminant and Heaman,1989), and the suite may include the Copperminebasalts of the Racklan orogen (appendix H). Thecontinent-wide extent of these dikes indicates exten-sion associated with asthenospheric uplift, possiblya broad mantle plume. Similarly, the Gnowangerupdikes are aligned along the southern margin of theYilgarn block in the western Australian craton
(Myers, 1993). Their intrusion at ~1.3 Ga is essen-tially synchronous with intrusion of the Mackenziedike swarm of North America and presumablyindicates extension throughout much of Columbiaat this time.
Magmatic rocks in the Gardar province ofsouthernmost Greenland are an approximately1.3–1.2-Ga assemblage of mafic dikes and highlyalkaline plutonic suites. Many of them have com-positions similar to those of the ultrapotassic andother alkaline rocks of the western branch of theEast African rift zone (Macdonald and Upton,1993), and this similarity presumably shows thatthe Gardar suite occupies a Mesoproterozoic rift.
The approximate age equivalence of all of thesesuites with the Mesoproterozoic rift valleys of Indiaand North America suggests widespread relaxationof horizontal stress starting at about 1.5 Gathroughout much of the earth’s continental crust.Presumably this relaxation was associated with theprocesses that caused the breakup of Columbia.
A Neoarchean Supercontinent
Piper (2003) used paleomagnetic data to study thepositions of continental blocks during the period2.9–2.2 Ga. He suggested the presence of a super-continent that had a linear to slightly curved shapesimilar to that of both Palaeopangaea and Pangea(fig. 7.10). The two limbs of the supercontinentwere also proposed to contain approximately thesame continental blocks as Palaeopangaea andPangea. One limb, located at high latitudes, con-tained older cratons now in India, Australia, andthe Kaapvaal region of southern Africa (discussedas the continental assembly Ur in chapter 6). Thesecond arm was in low latitudes and consistedmostly of North America and Baltica (see Arcticaand Nena in chapter 6).
Piper (2003) proposed that the similarity ofthe shapes of this Neoarchean supercontinent,Palaeopangaea, and Pangea required only smallamounts of movement to form one supercontinentfrom its predecessor. The slow rate during theProterozoic particularly suggests that theProterozoic was generally a time of slow mantleconvection, which affected both tectonic andsurface processes (chapter 11).
Support for the configuration of the super-continent shown in fig. 7.10 comes from the dis-tribution of Paleoproterozoic sediments. Aspler andChiarenzelli (1998) suggested the presence of twoNeoarchean supercontinents that were essentially
112 Continents and Supercontinents
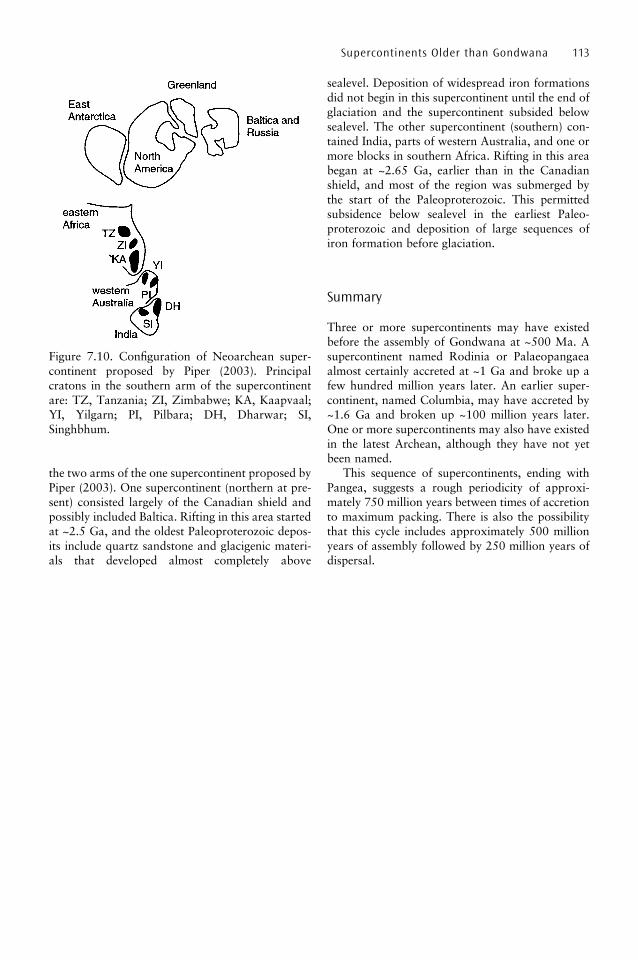
the two arms of the one supercontinent proposed byPiper (2003). One supercontinent (northern at pre-sent) consisted largely of the Canadian shield andpossibly included Baltica. Rifting in this area startedat ~2.5 Ga, and the oldest Paleoproterozoic depos-its include quartz sandstone and glacigenic materi-als that developed almost completely above
sealevel. Deposition of widespread iron formationsdid not begin in this supercontinent until the end ofglaciation and the supercontinent subsided belowsealevel. The other supercontinent (southern) con-tained India, parts of western Australia, and one ormore blocks in southern Africa. Rifting in this areabegan at ~2.65 Ga, earlier than in the Canadianshield, and most of the region was submerged bythe start of the Paleoproterozoic. This permittedsubsidence below sealevel in the earliest Paleo-proterozoic and deposition of large sequences ofiron formation before glaciation.
Summary
Three or more supercontinents may have existedbefore the assembly of Gondwana at ~500 Ma. Asupercontinent named Rodinia or Palaeopangaeaalmost certainly accreted at ~1 Ga and broke up afew hundred million years later. An earlier super-continent, named Columbia, may have accreted by~1.6 Ga and broken up ~100 million years later.One or more supercontinents may also have existedin the latest Archean, although they have not yetbeen named.
This sequence of supercontinents, ending withPangea, suggests a rough periodicity of approxi-mately 750 million years between times of accretionto maximum packing. There is also the possibilitythat this cycle includes approximately 500 millionyears of assembly followed by 250 million years ofdispersal.
Supercontinents Older than Gondwana 113
Figure 7.10. Configuration of Neoarchean super-continent proposed by Piper (2003). Principalcratons in the southern arm of the supercontinentare: TZ, Tanzania; ZI, Zimbabwe; KA, Kaapvaal;YI, Yilgarn; PI, Pilbara; DH, Dharwar; SI,Singhbhum.
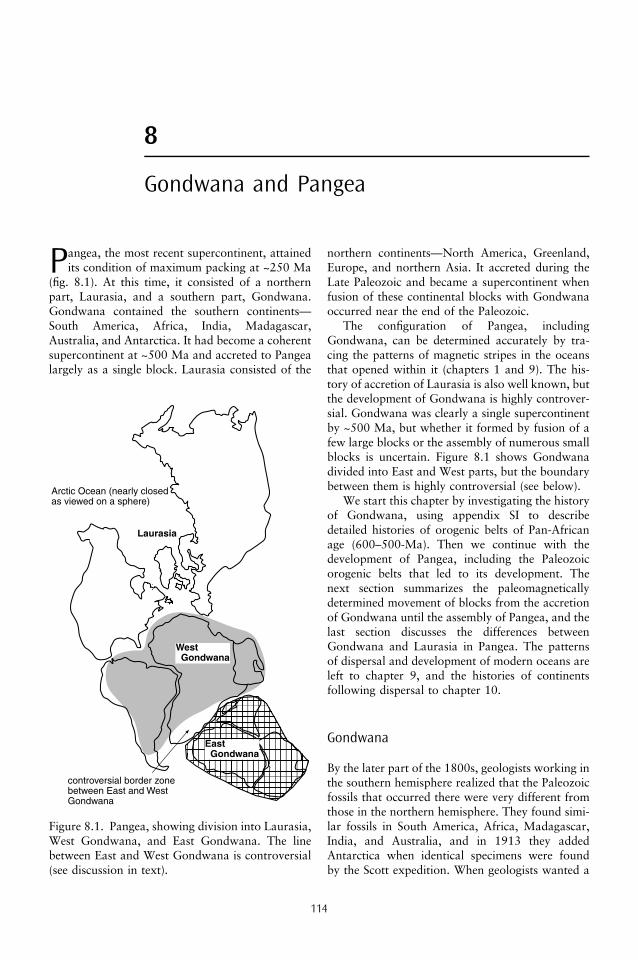
8
Gondwana and Pangea
Pangea, the most recent supercontinent, attainedits condition of maximum packing at ~250 Ma
(fig. 8.1). At this time, it consisted of a northernpart, Laurasia, and a southern part, Gondwana.Gondwana contained the southern continents—South America, Africa, India, Madagascar,Australia, and Antarctica. It had become a coherentsupercontinent at ~500 Ma and accreted to Pangealargely as a single block. Laurasia consisted of the
northern continents—North America, Greenland,Europe, and northern Asia. It accreted during theLate Paleozoic and became a supercontinent whenfusion of these continental blocks with Gondwanaoccurred near the end of the Paleozoic.
The configuration of Pangea, includingGondwana, can be determined accurately by tra-cing the patterns of magnetic stripes in the oceansthat opened within it (chapters 1 and 9). The his-tory of accretion of Laurasia is also well known, butthe development of Gondwana is highly controver-sial. Gondwana was clearly a single supercontinentby ~500 Ma, but whether it formed by fusion of afew large blocks or the assembly of numerous smallblocks is uncertain. Figure 8.1 shows Gondwanadivided into East and West parts, but the boundarybetween them is highly controversial (see below).
We start this chapter by investigating the historyof Gondwana, using appendix SI to describedetailed histories of orogenic belts of Pan-Africanage (600–500-Ma). Then we continue with thedevelopment of Pangea, including the Paleozoicorogenic belts that led to its development. Thenext section summarizes the paleomagneticallydetermined movement of blocks from the accretionof Gondwana until the assembly of Pangea, and thelast section discusses the differences betweenGondwana and Laurasia in Pangea. The patternsof dispersal and development of modern oceans areleft to chapter 9, and the histories of continentsfollowing dispersal to chapter 10.
Gondwana
By the later part of the 1800s, geologists working inthe southern hemisphere realized that the Paleozoicfossils that occurred there were very different fromthose in the northern hemisphere. They found simi-lar fossils in South America, Africa, Madagascar,India, and Australia, and in 1913 they addedAntarctica when identical specimens were foundby the Scott expedition. When geologists wanted a
114
Figure 8.1. Pangea, showing division into Laurasia,West Gondwana, and East Gondwana. The linebetween East and West Gondwana is controversial(see discussion in text).
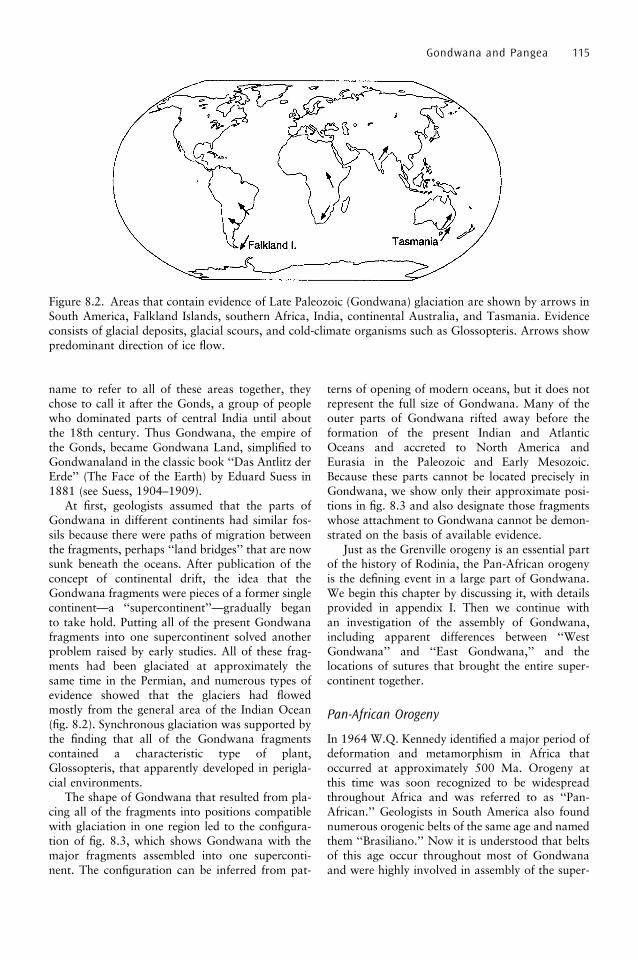
name to refer to all of these areas together, theychose to call it after the Gonds, a group of peoplewho dominated parts of central India until aboutthe 18th century. Thus Gondwana, the empire ofthe Gonds, became Gondwana Land, simplified toGondwanaland in the classic book ‘‘Das Antlitz derErde’’ (The Face of the Earth) by Eduard Suess in1881 (see Suess, 1904–1909).
At first, geologists assumed that the parts ofGondwana in different continents had similar fos-sils because there were paths of migration betweenthe fragments, perhaps ‘‘land bridges’’ that are nowsunk beneath the oceans. After publication of theconcept of continental drift, the idea that theGondwana fragments were pieces of a former singlecontinent—a ‘‘supercontinent’’—gradually beganto take hold. Putting all of the present Gondwanafragments into one supercontinent solved anotherproblem raised by early studies. All of these frag-ments had been glaciated at approximately thesame time in the Permian, and numerous types ofevidence showed that the glaciers had flowedmostly from the general area of the Indian Ocean(fig. 8.2). Synchronous glaciation was supported bythe finding that all of the Gondwana fragmentscontained a characteristic type of plant,Glossopteris, that apparently developed in perigla-cial environments.
The shape of Gondwana that resulted from pla-cing all of the fragments into positions compatiblewith glaciation in one region led to the configura-tion of fig. 8.3, which shows Gondwana with themajor fragments assembled into one superconti-nent. The configuration can be inferred from pat-
terns of opening of modern oceans, but it does notrepresent the full size of Gondwana. Many of theouter parts of Gondwana rifted away before theformation of the present Indian and AtlanticOceans and accreted to North America andEurasia in the Paleozoic and Early Mesozoic.Because these parts cannot be located precisely inGondwana, we show only their approximate posi-tions in fig. 8.3 and also designate those fragmentswhose attachment to Gondwana cannot be demon-strated on the basis of available evidence.
Just as the Grenville orogeny is an essential partof the history of Rodinia, the Pan-African orogenyis the defining event in a large part of Gondwana.We begin this chapter by discussing it, with detailsprovided in appendix I. Then we continue withan investigation of the assembly of Gondwana,including apparent differences between ‘‘WestGondwana’’ and ‘‘East Gondwana,’’ and thelocations of sutures that brought the entire super-continent together.
Pan-African Orogeny
In 1964 W.Q. Kennedy identified a major period ofdeformation and metamorphism in Africa thatoccurred at approximately 500 Ma. Orogeny atthis time was soon recognized to be widespreadthroughout Africa and was referred to as ‘‘Pan-African.’’ Geologists in South America also foundnumerous orogenic belts of the same age and namedthem ‘‘Brasiliano.’’ Now it is understood that beltsof this age occur throughout most of Gondwanaand were highly involved in assembly of the super-
Gondwana and Pangea 115
Figure 8.2. Areas that contain evidence of Late Paleozoic (Gondwana) glaciation are shown by arrows inSouth America, Falkland Islands, southern Africa, India, continental Australia, and Tasmania. Evidenceconsists of glacial deposits, glacial scours, and cold-climate organisms such as Glossopteris. Arrows showpredominant direction of ice flow.
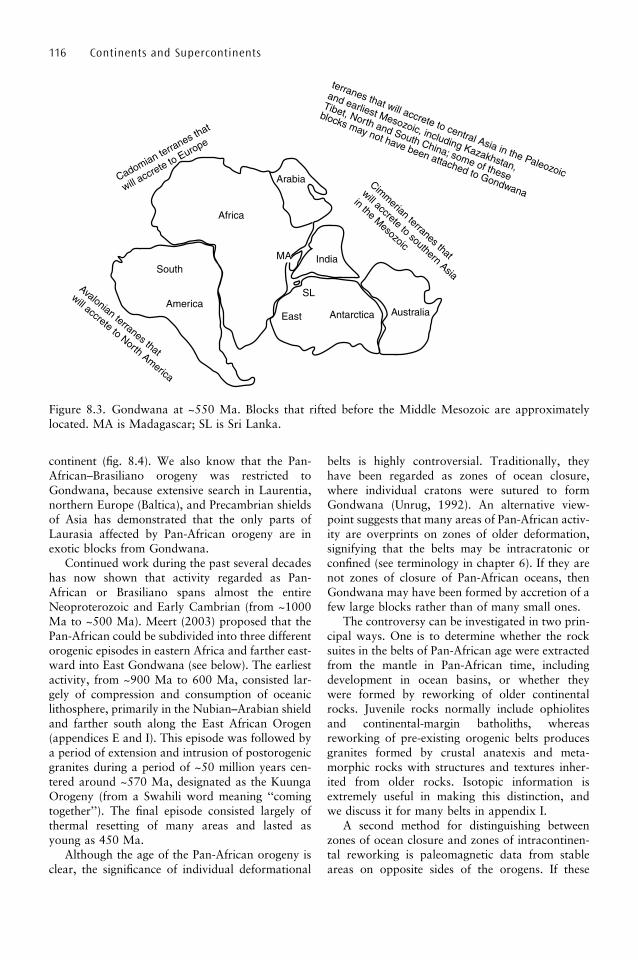
continent (fig. 8.4). We also know that the Pan-African–Brasiliano orogeny was restricted toGondwana, because extensive search in Laurentia,northern Europe (Baltica), and Precambrian shieldsof Asia has demonstrated that the only parts ofLaurasia affected by Pan-African orogeny are inexotic blocks from Gondwana.
Continued work during the past several decadeshas now shown that activity regarded as Pan-African or Brasiliano spans almost the entireNeoproterozoic and Early Cambrian (from ~1000Ma to ~500 Ma). Meert (2003) proposed that thePan-African could be subdivided into three differentorogenic episodes in eastern Africa and farther east-ward into East Gondwana (see below). The earliestactivity, from ~900 Ma to 600 Ma, consisted lar-gely of compression and consumption of oceaniclithosphere, primarily in the Nubian–Arabian shieldand farther south along the East African Orogen(appendices E and I). This episode was followed bya period of extension and intrusion of postorogenicgranites during a period of ~50 million years cen-tered around ~570 Ma, designated as the KuungaOrogeny (from a Swahili word meaning ‘‘comingtogether’’). The final episode consisted largely ofthermal resetting of many areas and lasted asyoung as 450 Ma.
Although the age of the Pan-African orogeny isclear, the significance of individual deformational
belts is highly controversial. Traditionally, theyhave been regarded as zones of ocean closure,where individual cratons were sutured to formGondwana (Unrug, 1992). An alternative view-point suggests that many areas of Pan-African activ-ity are overprints on zones of older deformation,signifying that the belts may be intracratonic orconfined (see terminology in chapter 6). If they arenot zones of closure of Pan-African oceans, thenGondwana may have been formed by accretion of afew large blocks rather than of many small ones.
The controversy can be investigated in two prin-cipal ways. One is to determine whether the rocksuites in the belts of Pan-African age were extractedfrom the mantle in Pan-African time, includingdevelopment in ocean basins, or whether theywere formed by reworking of older continentalrocks. Juvenile rocks normally include ophiolitesand continental-margin batholiths, whereasreworking of pre-existing orogenic belts producesgranites formed by crustal anatexis and meta-morphic rocks with structures and textures inher-ited from older rocks. Isotopic information isextremely useful in making this distinction, andwe discuss it for many belts in appendix I.
A second method for distinguishing betweenzones of ocean closure and zones of intracontinen-tal reworking is paleomagnetic data from stableareas on opposite sides of the orogens. If these
116 Continents and Supercontinents
Figure 8.3. Gondwana at ~550 Ma. Blocks that rifted before the Middle Mesozoic are approximatelylocated. MA is Madagascar; SL is Sri Lanka.

areas have nearly identical APW curves before andduring Pan-African time, then they presumablyformed a coherent block that accreted toGondwana intact. Conversely, if they have differentAPW curves, then the Pan-African belt betweenthem was a zone of ocean closure.
Differences Between East and WestGondwana
East Gondwana traditionally consists of Australia,India, East Antarctica, Sri Lanka, and Madagascar.West Gondwana has generally been regarded asconsisting of South America and all or most ofAfrica. Figure 8.5 displays four types of evidencethat have been used to distinguish between East andWest Gondwana:
� Ages of cratonization (from Rogers, 1996)show a clear difference between the eastern
and western parts of Gondwana. Cratonsof 3.0–2.5-Ga age are concentrated inAustralia, India, coastal East Antarctica,and parts of southern Africa. They are com-pletely absent, however, from central andnorthern Africa and all of South America.
� With the exception of the Sunsas belt in wes-tern South America, Grenville-age (~1-Ga)orogenic belts are restricted to the same partof Gondwana as older cratons (appendix H).They are common in western Australia,where there is very little evidence of youngeractivity, and in India, Sri Lanka, and adja-cent East Antarctica. Grenville–Kibaran oro-genic activity also appears to surround theKalahari craton of southern Africa and itsattached Maudheim region of Antarctica.The northernmost extent of Grenville-ageorogeny in Africa appears to be the typeKibaran belt between the Tanzanian andCongo cratons.
Gondwana and Pangea 117
Figure 8.4. Sketch of Gondwana showing names of major belts and areas of Pan-African activity (furtherinformation in Fig. I.1 and appendix I). Cratonic blocks (shaded) are: Waf, West Africa; HO–TI, Hoggar–Tibesti; WN, West Nile; CA, Central Arabian; AM, Amazonia; SF/CK, Sao Francisco joined with Congo–Kasai; TZ, Tanzania; MA, Madagascar; IN, India; Waus, western Australia; RP, Rio de la Plata; KA,Kalahari, including Kaapvaal of southern Africa and Maudheim region of East Antarctica; SL, Sri Lanka;NA, Napier; PC, Prince Charles.

� Pan-African activity occurs from Indiathroughout all areas of Gondwana to thewest and south, including Sri Lanka,Madagascar, southern and central Africa,and adjoining parts of Antarctica. Pan-African orogenies mostly overprint olderareas of Grenville-age orogeny. Some ofthese belts may be reworked intracontinentalterranes, and some may represent Pan-African oceans that opened and then closedwithin older orogenic belts. Our discussionof individual Pan-African orogens (appendixI) suggests that different tectonic modelsapply to different belts.
� Pan-African orogeny in northern and westernAfrica and in all of eastern South Americadoes not overprint rocks of Grenville age
except in the Sunsas belt along the westernmargin of Amazonia. Some areas, such asnorth–central and northeastern Africa, areclearly regions of both growth of juvenilecrust and extensive reworking of older crust(appendix I). Igneous rocks in some Pan-African belts may have been derived fromcrust formed as early as the Transamazonianorogeny (~2 Ga). Some belts contain evi-dence of both the existence of small oceanbasins and inheritance from rocks older thanPan-African, which probably indicates thatthey were confined orogens (appendix I;chapter 6).
On the basis of the information in fig. 8.5, manyworkers believe that East Gondwana was a coherent
118 Continents and Supercontinents
Figure 8.5. Relationships between ages of cratonization and Grenville and Pan-African activity inGondwana.
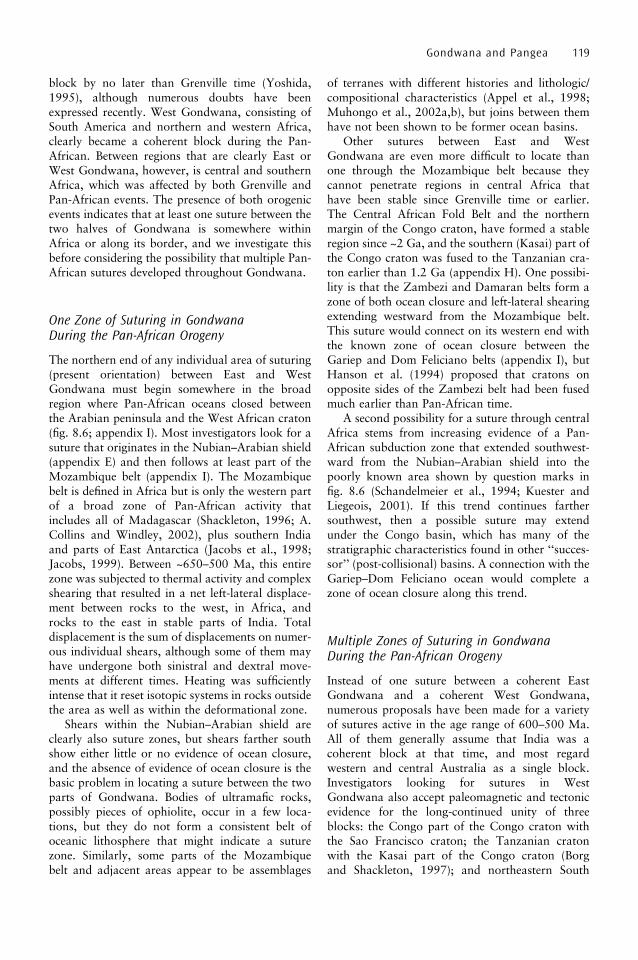
block by no later than Grenville time (Yoshida,1995), although numerous doubts have beenexpressed recently. West Gondwana, consisting ofSouth America and northern and western Africa,clearly became a coherent block during the Pan-African. Between regions that are clearly East orWest Gondwana, however, is central and southernAfrica, which was affected by both Grenville andPan-African events. The presence of both orogenicevents indicates that at least one suture between thetwo halves of Gondwana is somewhere withinAfrica or along its border, and we investigate thisbefore considering the possibility that multiple Pan-African sutures developed throughout Gondwana.
One Zone of Suturing in GondwanaDuring the Pan-African Orogeny
The northern end of any individual area of suturing(present orientation) between East and WestGondwana must begin somewhere in the broadregion where Pan-African oceans closed betweenthe Arabian peninsula and the West African craton(fig. 8.6; appendix I). Most investigators look for asuture that originates in the Nubian–Arabian shield(appendix E) and then follows at least part of theMozambique belt (appendix I). The Mozambiquebelt is defined in Africa but is only the western partof a broad zone of Pan-African activity thatincludes all of Madagascar (Shackleton, 1996; A.Collins and Windley, 2002), plus southern Indiaand parts of East Antarctica (Jacobs et al., 1998;Jacobs, 1999). Between ~650–500 Ma, this entirezone was subjected to thermal activity and complexshearing that resulted in a net left-lateral displace-ment between rocks to the west, in Africa, androcks to the east in stable parts of India. Totaldisplacement is the sum of displacements on numer-ous individual shears, although some of them mayhave undergone both sinistral and dextral move-ments at different times. Heating was sufficientlyintense that it reset isotopic systems in rocks outsidethe area as well as within the deformational zone.
Shears within the Nubian–Arabian shield areclearly also suture zones, but shears farther southshow either little or no evidence of ocean closure,and the absence of evidence of ocean closure is thebasic problem in locating a suture between the twoparts of Gondwana. Bodies of ultramafic rocks,possibly pieces of ophiolite, occur in a few loca-tions, but they do not form a consistent belt ofoceanic lithosphere that might indicate a suturezone. Similarly, some parts of the Mozambiquebelt and adjacent areas appear to be assemblages
of terranes with different histories and lithologic/compositional characteristics (Appel et al., 1998;Muhongo et al., 2002a,b), but joins between themhave not been shown to be former ocean basins.
Other sutures between East and WestGondwana are even more difficult to locate thanone through the Mozambique belt because theycannot penetrate regions in central Africa thathave been stable since Grenville time or earlier.The Central African Fold Belt and the northernmargin of the Congo craton, have formed a stableregion since ~2 Ga, and the southern (Kasai) part ofthe Congo craton was fused to the Tanzanian cra-ton earlier than 1.2 Ga (appendix H). One possibi-lity is that the Zambezi and Damaran belts form azone of both ocean closure and left-lateral shearingextending westward from the Mozambique belt.This suture would connect on its western end withthe known zone of ocean closure between theGariep and Dom Feliciano belts (appendix I), butHanson et al. (1994) proposed that cratons onopposite sides of the Zambezi belt had been fusedmuch earlier than Pan-African time.
A second possibility for a suture through centralAfrica stems from increasing evidence of a Pan-African subduction zone that extended southwest-ward from the Nubian–Arabian shield into thepoorly known area shown by question marks infig. 8.6 (Schandelmeier et al., 1994; Kuester andLiegeois, 2001). If this trend continues farthersouthwest, then a possible suture may extendunder the Congo basin, which has many of thestratigraphic characteristics found in other ‘‘succes-sor’’ (post-collisional) basins. A connection with theGariep–Dom Feliciano ocean would complete azone of ocean closure along this trend.
Multiple Zones of Suturing in GondwanaDuring the Pan-African Orogeny
Instead of one suture between a coherent EastGondwana and a coherent West Gondwana,numerous proposals have been made for a varietyof sutures active in the age range of 600–500 Ma.All of them generally assume that India was acoherent block at that time, and most regardwestern and central Australia as a single block.Investigators looking for sutures in WestGondwana also accept paleomagnetic and tectonicevidence for the long-continued unity of threeblocks: the Congo part of the Congo craton withthe Sao Francisco craton; the Tanzanian cratonwith the Kasai part of the Congo craton (Borgand Shackleton, 1997); and northeastern South
Gondwana and Pangea 119
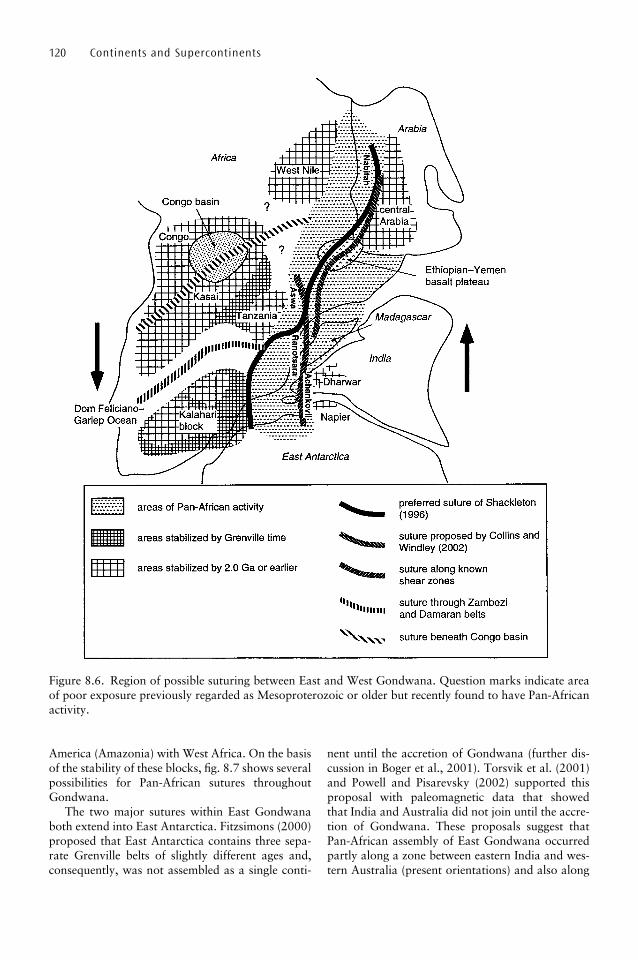
America (Amazonia) with West Africa. On the basisof the stability of these blocks, fig. 8.7 shows severalpossibilities for Pan-African sutures throughoutGondwana.
The two major sutures within East Gondwanaboth extend into East Antarctica. Fitzsimons (2000)proposed that East Antarctica contains three sepa-rate Grenville belts of slightly different ages and,consequently, was not assembled as a single conti-
nent until the accretion of Gondwana (further dis-cussion in Boger et al., 2001). Torsvik et al. (2001)and Powell and Pisarevsky (2002) supported thisproposal with paleomagnetic data that showedthat India and Australia did not join until the accre-tion of Gondwana. These proposals suggest thatPan-African assembly of East Gondwana occurredpartly along a zone between eastern India and wes-tern Australia (present orientations) and also along
120 Continents and Supercontinents
Figure 8.6. Region of possible suturing between East and West Gondwana. Question marks indicate areaof poor exposure previously regarded as Mesoproterozoic or older but recently found to have Pan-Africanactivity.

a zone between western India and eastern Africa.The suture east of India is presumably along theDarling belt (Wilde, 1999; appendix H), and thesuture west of India is probably within the broadzone of suturing and/or shearing along the east coastof Africa and through Madagascar (see above).
In West Gondwana, numerous Pan-Africansutures exist in the Nubian–Arabian shield (appen-dix E) and on the western and southern edges of thelargely unknown area that extends from theNubian–Arabian shield to the eastern margin ofthe West African craton (appendix I). This broadarea almost certainly contains additional Pan-African sutures, but the lack of exposure has pre-vented accurate location. As discussed above, anysuture between East and West Gondwana wouldhave to extend southward from this area of Pan-African ocean closure.
Sutures of Pan-African age may exist elsewherewithin West Gondwana, but their locations arecontroversial. The controversy stems from the diffi-culty of distinguishing between Pan-African beltsthat formed by ocean closure and those that over-print older rocks (see above). Trompette (1997) andAlkmim et al. (2001) accepted the existence of both
types of orogen but proposed somewhat differentzones of suturing caused by the closure of oceansthat existed in Pan-African–Brasiliano time. Theconclusion that these zones are Pan-African suturesconflicts with the proposal of Brito Neves (2002)that Brasiliano oceans formed by rifting of Rodiniawere shallow and floored by thin continental crust(chapter 7).
Possible sutures in West Gondwana all extendfrom the Sahara region of ocean closure to either oftwo oceanic regions on the opposite side of thesupercontinent (fig. 8.7). One is the recognizedzone of ocean closure between the Dom Felicianobelt of South America and the Gariep belt of south-ern Africa (appendix I). The other is the Tocantinsregion on the southern margin of the Amazonianblock, where evidence of ocean closure is contro-versial (appendix I).
Summary
The assembly of Gondwana was completed by550–500 Ma, generally referred to as Pan-Africantime. The assembled supercontinent is commonlyregarded as comprising East Gondwana, which
Gondwana and Pangea 121
Figure 8.7. Possible zones of Pan-African suturing in Gondwana shown by dark lines.
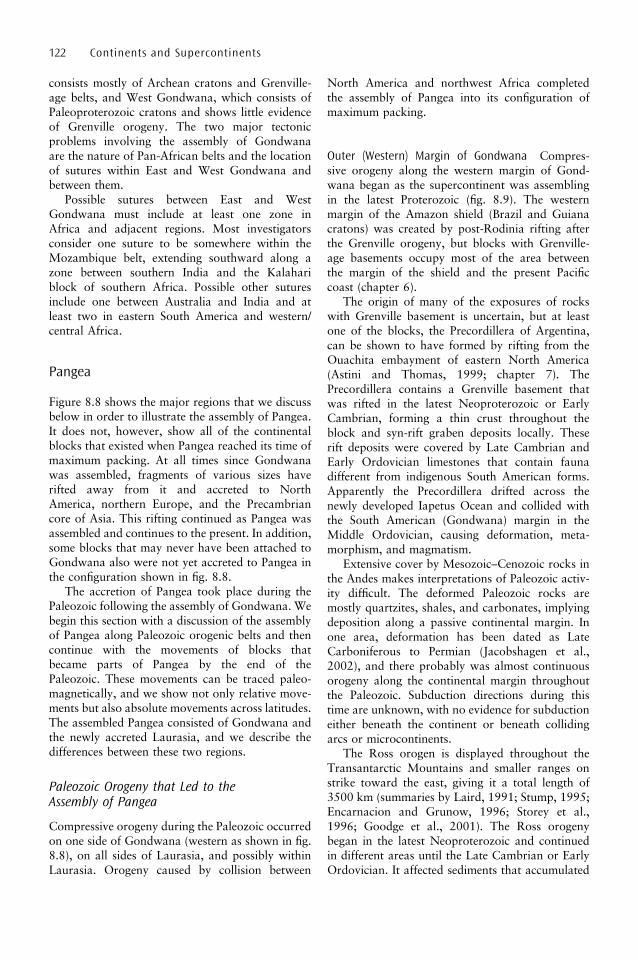
consists mostly of Archean cratons and Grenville-age belts, and West Gondwana, which consists ofPaleoproterozoic cratons and shows little evidenceof Grenville orogeny. The two major tectonicproblems involving the assembly of Gondwanaare the nature of Pan-African belts and the locationof sutures within East and West Gondwana andbetween them.
Possible sutures between East and WestGondwana must include at least one zone inAfrica and adjacent regions. Most investigatorsconsider one suture to be somewhere within theMozambique belt, extending southward along azone between southern India and the Kalahariblock of southern Africa. Possible other suturesinclude one between Australia and India and atleast two in eastern South America and western/central Africa.
Pangea
Figure 8.8 shows the major regions that we discussbelow in order to illustrate the assembly of Pangea.It does not, however, show all of the continentalblocks that existed when Pangea reached its time ofmaximum packing. At all times since Gondwanawas assembled, fragments of various sizes haverifted away from it and accreted to NorthAmerica, northern Europe, and the Precambriancore of Asia. This rifting continued as Pangea wasassembled and continues to the present. In addition,some blocks that may never have been attached toGondwana also were not yet accreted to Pangea inthe configuration shown in fig. 8.8.
The accretion of Pangea took place during thePaleozoic following the assembly of Gondwana. Webegin this section with a discussion of the assemblyof Pangea along Paleozoic orogenic belts and thencontinue with the movements of blocks thatbecame parts of Pangea by the end of thePaleozoic. These movements can be traced paleo-magnetically, and we show not only relative move-ments but also absolute movements across latitudes.The assembled Pangea consisted of Gondwana andthe newly accreted Laurasia, and we describe thedifferences between these two regions.
Paleozoic Orogeny that Led to theAssembly of Pangea
Compressive orogeny during the Paleozoic occurredon one side of Gondwana (western as shown in fig.8.8), on all sides of Laurasia, and possibly withinLaurasia. Orogeny caused by collision between
North America and northwest Africa completedthe assembly of Pangea into its configuration ofmaximum packing.
Outer (Western) Margin of Gondwana Compres-sive orogeny along the western margin of Gond-wana began as the supercontinent was assemblingin the latest Proterozoic (fig. 8.9). The westernmargin of the Amazon shield (Brazil and Guianacratons) was created by post-Rodinia rifting afterthe Grenville orogeny, but blocks with Grenville-age basements occupy most of the area betweenthe margin of the shield and the present Pacificcoast (chapter 6).
The origin of many of the exposures of rockswith Grenville basement is uncertain, but at leastone of the blocks, the Precordillera of Argentina,can be shown to have formed by rifting from theOuachita embayment of eastern North America(Astini and Thomas, 1999; chapter 7). ThePrecordillera contains a Grenville basement thatwas rifted in the latest Neoproterozoic or EarlyCambrian, forming a thin crust throughout theblock and syn-rift graben deposits locally. Theserift deposits were covered by Late Cambrian andEarly Ordovician limestones that contain faunadifferent from indigenous South American forms.Apparently the Precordillera drifted across thenewly developed Iapetus Ocean and collided withthe South American (Gondwana) margin in theMiddle Ordovician, causing deformation, meta-morphism, and magmatism.
Extensive cover by Mesozoic–Cenozoic rocks inthe Andes makes interpretations of Paleozoic activ-ity difficult. The deformed Paleozoic rocks aremostly quartzites, shales, and carbonates, implyingdeposition along a passive continental margin. Inone area, deformation has been dated as LateCarboniferous to Permian (Jacobshagen et al.,2002), and there probably was almost continuousorogeny along the continental margin throughoutthe Paleozoic. Subduction directions during thistime are unknown, with no evidence for subductioneither beneath the continent or beneath collidingarcs or microcontinents.
The Ross orogen is displayed throughout theTransantarctic Mountains and smaller ranges onstrike toward the east, giving it a total length of3500 km (summaries by Laird, 1991; Stump, 1995;Encarnacion and Grunow, 1996; Storey et al.,1996; Goodge et al., 2001). The Ross orogenybegan in the latest Neoproterozoic and continuedin different areas until the Late Cambrian or EarlyOrdovician. It affected sediments that accumulated
122 Continents and Supercontinents
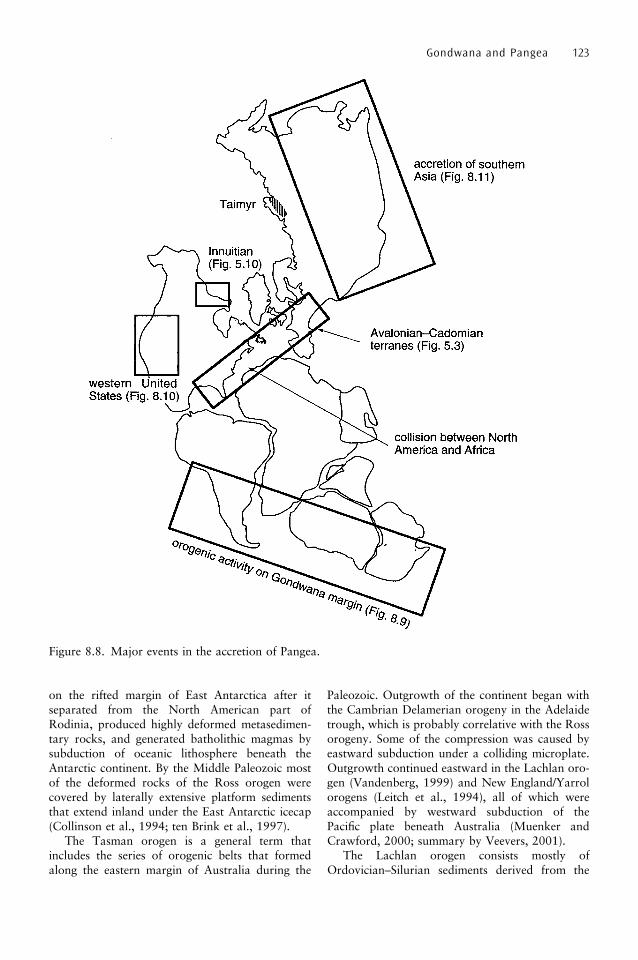
on the rifted margin of East Antarctica after itseparated from the North American part ofRodinia, produced highly deformed metasedimen-tary rocks, and generated batholithic magmas bysubduction of oceanic lithosphere beneath theAntarctic continent. By the Middle Paleozoic mostof the deformed rocks of the Ross orogen werecovered by laterally extensive platform sedimentsthat extend inland under the East Antarctic icecap(Collinson et al., 1994; ten Brink et al., 1997).
The Tasman orogen is a general term thatincludes the series of orogenic belts that formedalong the eastern margin of Australia during the
Paleozoic. Outgrowth of the continent began withthe Cambrian Delamerian orogeny in the Adelaidetrough, which is probably correlative with the Rossorogeny. Some of the compression was caused byeastward subduction under a colliding microplate.Outgrowth continued eastward in the Lachlan oro-gen (Vandenberg, 1999) and New England/Yarrolorogens (Leitch et al., 1994), all of which wereaccompanied by westward subduction of thePacific plate beneath Australia (Muenker andCrawford, 2000; summary by Veevers, 2001).
The Lachlan orogen consists mostly ofOrdovician–Silurian sediments derived from the
Gondwana and Pangea 123
Figure 8.8. Major events in the accretion of Pangea.

west (Vandenberg, 1999; Foster and Gray, 2000).Final orogeny in the Early Carboniferous causedintense deformation, low-rank metamorphism,and injection of large volumes of granitic magma.The amount of granite increases toward the east,and Chappell et al. (1988) used rocks in theLachlan orogen to establish their concept of I-typeand S-type granites. The I-type granites containcompositional and isotopic properties that suggestderivation largely from oceanic lithosphere sub-ducted under the continental margin, whereas S-type granites appear to have formed by remeltingof pre-existing sedimentary rocks. The boundarybetween these two suites is known as the I–S line,and it may mark the boundary between olderAustralian crust and oceanic crust.
As subduction occurred along the Australianmargin throughout the Paleozoic, intraplate defor-mation took place throughout much of the conti-nental interior (Scrimgeour and Close, 1999; Braunand Shaw, 2001; Scrimgeour and Raith, 2001).This formed several belts of deformation, some ofwhich now expose rocks of granulite facies. Theweakness that permitted this type of deformationmay have resulted from lithospheric thinning asso-ciated with development of Neoproterozoic sedi-mentary basins during and after separation ofAustralia and North America.
Outer (Western) Margin of Laurasia The westernedge of North America during the Paleozoic wasthe passive margin of a continent that wasgradually being covered by a sequence of shelfsediments (fig. 8.10; Burchfiel et al., 1992). Theinferred continental margin at the beginning ofthe Paleozoic illustrates the outgrowth that hasoccurred during the Phanerozoic by some com-bination of accretion of exotic terranes and incor-poration of sediments eroded from North America
into a continental wedge along the border of thecontinent. Although no subduction occurred be-neath western North America during the Paleozoic(chapter 5), evidence of compressive orogeny iswell displayed in the United States. Orogeny inthe western United States was created by collisionof island arcs that were generated by westwardsubduction beneath the arc. Ocean closure causedthrust sequences to overlap the continental marginby a few hundred kilometers during the Devonian(Antler orogeny) and Permian (Sonoma orogeny).The thrust sheets contain sediments derived fromcontinental erosion, sediments washed from volca-nic arcs into the ocean basins between the arcsand the continent, and volcanic and volcaniclasticrocks of the arc.
Within Laurasia (?) Paleozoic orogeny occurred inthe Innuitian belt on the northern margin ofCanada (chapter 5), and Late Neoproterozoic toEarly Paleozoic deformation affected the Taimyrbelt on the northern margin of Siberia (Vernikovs-ky and Vernikovskaya, 2001). Because the ArcticOcean opened between North America and Siber-ia during the Cenozoic, the two continents musthave been joined at some earlier time. If thissuturing occurred in the Proterozoic (chapter 6),then the Innuitian and Taimyr belts developedwithin an ocean that extended into Laurasia dur-ing the Late Neoproterozoic and Early Paleozoic.
Inside (Eastern) Margin of Laurasia Orogeny oc-curred almost continuously throughout the Paleo-zoic along the continental margins of NorthAmerica and Europe. Dalziel (1997) attributedsome of the orogeny in North America to repeatedcollision with South America as the two conti-nents rotated past each other from their positions
124 Continents and Supercontinents
Figure 8.9. Orogeny along the margin of Gondwana during the Paleozoic.
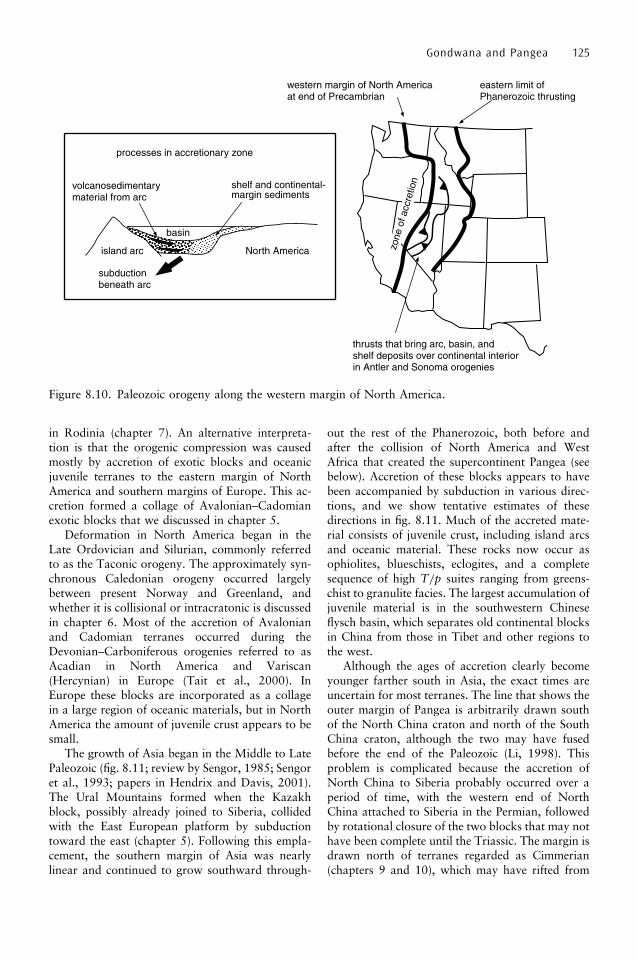
in Rodinia (chapter 7). An alternative interpreta-tion is that the orogenic compression was causedmostly by accretion of exotic blocks and oceanicjuvenile terranes to the eastern margin of NorthAmerica and southern margins of Europe. This ac-cretion formed a collage of Avalonian–Cadomianexotic blocks that we discussed in chapter 5.
Deformation in North America began in theLate Ordovician and Silurian, commonly referredto as the Taconic orogeny. The approximately syn-chronous Caledonian orogeny occurred largelybetween present Norway and Greenland, andwhether it is collisional or intracratonic is discussedin chapter 6. Most of the accretion of Avalonianand Cadomian terranes occurred during theDevonian–Carboniferous orogenies referred to asAcadian in North America and Variscan(Hercynian) in Europe (Tait et al., 2000). InEurope these blocks are incorporated as a collagein a large region of oceanic materials, but in NorthAmerica the amount of juvenile crust appears to besmall.
The growth of Asia began in the Middle to LatePaleozoic (fig. 8.11; review by Sengor, 1985; Sengoret al., 1993; papers in Hendrix and Davis, 2001).The Ural Mountains formed when the Kazakhblock, possibly already joined to Siberia, collidedwith the East European platform by subductiontoward the east (chapter 5). Following this empla-cement, the southern margin of Asia was nearlylinear and continued to grow southward through-
out the rest of the Phanerozoic, both before andafter the collision of North America and WestAfrica that created the supercontinent Pangea (seebelow). Accretion of these blocks appears to havebeen accompanied by subduction in various direc-tions, and we show tentative estimates of thesedirections in fig. 8.11. Much of the accreted mate-rial consists of juvenile crust, including island arcsand oceanic material. These rocks now occur asophiolites, blueschists, eclogites, and a completesequence of high T=p suites ranging from greens-chist to granulite facies. The largest accumulation ofjuvenile material is in the southwestern Chineseflysch basin, which separates old continental blocksin China from those in Tibet and other regions tothe west.
Although the ages of accretion clearly becomeyounger farther south in Asia, the exact times areuncertain for most terranes. The line that shows theouter margin of Pangea is arbitrarily drawn southof the North China craton and north of the SouthChina craton, although the two may have fusedbefore the end of the Paleozoic (Li, 1998). Thisproblem is complicated because the accretion ofNorth China to Siberia probably occurred over aperiod of time, with the western end of NorthChina attached to Siberia in the Permian, followedby rotational closure of the two blocks that may nothave been complete until the Triassic. The margin isdrawn north of terranes regarded as Cimmerian(chapters 9 and 10), which may have rifted from
Gondwana and Pangea 125
Figure 8.10. Paleozoic orogeny along the western margin of North America.
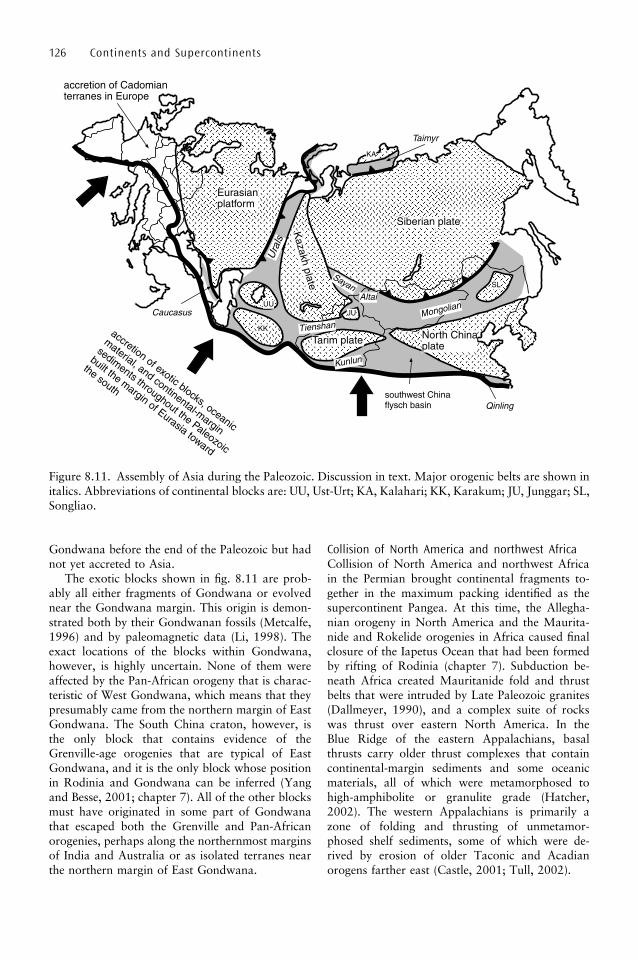
Gondwana before the end of the Paleozoic but hadnot yet accreted to Asia.
The exotic blocks shown in fig. 8.11 are prob-ably all either fragments of Gondwana or evolvednear the Gondwana margin. This origin is demon-strated both by their Gondwanan fossils (Metcalfe,1996) and by paleomagnetic data (Li, 1998). Theexact locations of the blocks within Gondwana,however, is highly uncertain. None of them wereaffected by the Pan-African orogeny that is charac-teristic of West Gondwana, which means that theypresumably came from the northern margin of EastGondwana. The South China craton, however, isthe only block that contains evidence of theGrenville-age orogenies that are typical of EastGondwana, and it is the only block whose positionin Rodinia and Gondwana can be inferred (Yangand Besse, 2001; chapter 7). All of the other blocksmust have originated in some part of Gondwanathat escaped both the Grenville and Pan-Africanorogenies, perhaps along the northernmost marginsof India and Australia or as isolated terranes nearthe northern margin of East Gondwana.
Collision of North America and northwest AfricaCollision of North America and northwest Africain the Permian brought continental fragments to-gether in the maximum packing identified as thesupercontinent Pangea. At this time, the Allegha-nian orogeny in North America and the Maurita-nide and Rokelide orogenies in Africa caused finalclosure of the Iapetus Ocean that had been formedby rifting of Rodinia (chapter 7). Subduction be-neath Africa created Mauritanide fold and thrustbelts that were intruded by Late Paleozoic granites(Dallmeyer, 1990), and a complex suite of rockswas thrust over eastern North America. In theBlue Ridge of the eastern Appalachians, basalthrusts carry older thrust complexes that containcontinental-margin sediments and some oceanicmaterials, all of which were metamorphosed tohigh-amphibolite or granulite grade (Hatcher,2002). The western Appalachians is primarily azone of folding and thrusting of unmetamor-phosed shelf sediments, some of which were de-rived by erosion of older Taconic and Acadianorogens farther east (Castle, 2001; Tull, 2002).
126 Continents and Supercontinents
Figure 8.11. Assembly of Asia during the Paleozoic. Discussion in text. Major orogenic belts are shown initalics. Abbreviations of continental blocks are: UU, Ust-Urt; KA, Kalahari; KK, Karakum; JU, Junggar; SL,Songliao.

Movements of Continental Blocks fromRodinia to Pangea
Different configurations and breakup patterns ofRodinia require different paths of movement ofblocks from Rodinia to Gondwana. Because all ofthem are highly controversial, we begin to describesome absolute movements starting with positions ofcontinental blocks at 580 Ma, prior to the assemblyof Gondwana (fig. 8.12a). The diagram shows east-ern Laurentia just beginning to separate from thewestern margin of the Precambrian region of east-ern South America along a rift that crossed theSouth Pole. Rifting between these two blocksformed the Iapetus Ocean, which closed at theend of the Paleozoic during the suturing of Pangea(see above). The diagram also shows a block con-taining the Sao Francisco, Congo, and Kalaharicratons separated by the Brasiliano Ocean fromeastern South America and by the MozambiqueOcean from a block containing India, Australia,and East Antarctica. The position of Siberia relativeto North America is uncertain, and we show itsgeneral latitude in the diagram. Complete openingof the Iapetus Ocean may not have occurred untilafter the assembly of Gondwana at ~550 Ma (fig.8.12b).
Figure 8.12b shows the positions of major con-tinental blocks at 550 Ma, the time at which theassembly of Gondwana was nearly complete. TheSouth American part of Gondwana had drifted onlya short distance from the South Pole since 580Ma, and the assembled continent extended intothe northern hemisphere. Laurentia and SouthAmerica had separated since 580 Ma to form theIapetus Ocean, and Baltica–Russia is an indepen-dent block at approximately the same latitude as 30million years earlier. It is shown in an orientationthat requires rotation through 1808 before its colli-sion with Greenland approximately 150 millionyears later (Caledonian orogeny). Siberia is notshown in the diagram and may have been in thenorthern hemisphere, although some evidence sug-gests that Siberia and North America were joineduntil the Mesozoic (chapter 6).
The positions of major blocks at the end of theOrdovician are significantly different from theirlocations at the beginning of the Cambrian,approximately 100 million years earlier (fig.8.12c). By this time, Gondwana had begun tomove across the South Pole, creating glaciationsthat we discuss in chapter 11. This movement con-tinued through the Paleozoic, at which time theSouth Pole was located in East Antarctica at
approximately the same position that it now occu-pies. Avalonian and Cadomian terranes had com-pleted their separation from Gondwana and wereabout to collide with North America (which ispartly in the northern hemisphere) and northernEurope, causing a series of Middle Paleozoic oro-genies. Baltica had completed its rotation fromits orientation at 550 Ma, and its western marginwould soon collide with eastern Greenland. Siberiaand Tarim were in the northern hemisphere, andNorth China, South China, and the southern part ofthe future Indochina were all straddling the equa-tor. Various Cimmerian terranes (chapter 9) wereapparently still attached to Gondwana.
Figure 8.12d places Pangea at ~250 Ma in apaleomagnetic framework (simplified from fig. 8.1;Scotese and McKerrow, 1990). North America andthe Precambrian regions of Eurasia had movedcompletely into the northern hemisphere, andAvalonian and Cadomian blocks from Gondwanahad also moved northward to collide with easternNorth America and southern Europe. The collisionof West Africa with eastern North America closedthe Iapetus Ocean and completed the Paleozoicassembly of Pangea. At this time, Cimmerian blocksmay still have been attached to Gondwana, and theremaining part of Gondwana had moved almostcompletely across the South Pole. North andSouth China are shown as still separated fromAsia, moving into position to collide with the south-ern margin of the continent in the Early Mesozoic,although the times of these collisions are very con-troversial (see above).
Differences Between Gondwana andLaurasia in Pangea
The fully assembled Pangea was divided approxi-mately equally between Laurasia in the north, andGondwana in the south. These two regions hadvery different histories before the formation ofPangea and were significantly different withinPangea. Our summary of these differences isbased partly on information discussed above andpartly on Veevers (1995) and Veevers and Tewari(1995).
Because Gondwana was completely assembledby ~500 Ma, it was more than 200 million yearsold when it was incorporated into Pangea.Conversely, Laurasia consisted partly of the veryold regions of North America, Greenland, andBaltica (referred to as Nena in chapter 6), butmost of Asia formed during the accretion of
Gondwana and Pangea 127

128
a
b

129
Figure 8.12. Paleomagnetically determined locations of major continental blocks. Diagrams a, b, and c areviews of the southern hemisphere; diagram d is a view of the hemisphere (pole to pole) that containedPangea. In all diagrams, continental blocks shown outside the circle of the hemisphere were on the oppositehemisphere. a. 580 Ma (modified from Meert, 2001). Major oceans are shown in italics, with the Iapetusjust beginning to rift. M is Madagascar. b. 550 Ma (modified from Meert, 2001). The Iapetus had becomewider since 580 Ma. c. 450 Ma (based on positions of blocks proposed by Cocks and Torsvik, 2002).Annamia is a block currently between South China and the major part of Indochina; Sibumasu is anacronym for Siam, Burma, Malaysia, and Sumatra. d. 250 Ma. Information supporting this configurationis in Scotese and McKerrow (1990).
c
d
Pangea. This difference in average age betweenGondwana and Laurasia largely controlled broadpatterns of basin formation and also affected thetransport of sediment into those basins.
Pangea began to break up in the Late Triassicand Early Jurassic from ~225–175 Ma, a time thatfollowed the Permo-Triassic extinction event andalso the maximum glacial episode (chapters 11and 12). During the period before rifting, marinewater encroached only along the margins of thesupercontinent, leaving the interior almost comple-tely as exposed land. The highest area at this timeseems to have been in East Antarctica, which pro-vided sedimentary debris that washed outward overmuch of East Gondwana. Sequences of terrestrialsediment from this source are particularly wellexposed in the ‘‘Gondwana’’ rifts of India, thathad been active since the Middle Proterozoic butwere now filled by clastic debris and developedabundant coal (Veevers and Tewari, 1995).Sediment derived from this Antarctic upland didnot reach areas of Laurasia, where EarlyMesozoic terrestrial sequences were thin andderived from local sources.
Erosion of sediment from the interior toward itsnorthern margin apparently began in the Cambro-Ordovician, shortly after the fusion of Gondwana.North Africa and Arabia are covered by fluvio-deltaic sediments of this age, both in the Nubian–Arabian shield (chapter 4) and in the area of NorthAfrica converted into continental crust by accretionof microcontinents and subduction of oceanic litho-sphere (see above).
Differences in average elevation of continentalsurfaces apparently both preceded and followed theassembly of Pangea. During the Paleozoic, shallowmarine water covered ~40–30% of the cratons andother stabilized continental areas that would lateraccrete to Laurasia. At this time, however, onlyabout 20–10% of Gondwana was submergedbelow shallow epeiric seas (Veevers, 1995). In theMesozoic and Cenozoic, after dispersal of Pangea,
Laurasian fragments continued to show muchhigher percentages covered by shallow seas thanfragments of Gondwana (Algeo and Wilkinson,1991).
Differences between continental blocks inLaurasia and those in Gondwana throughout thePhanerozoic imply that some process that operatedduring the formation of Gondwana was fundamen-tally different from processes that caused assemblyof Laurasia. Veevers (1995) proposed that this pro-cess developed a lower crust with P-wave velocitiesof ~7.5 km/sec throughout most of Gondwana butonly in limited parts of Laurasia, such as theColorado plateau. The exact nature of this processis unclear, but recent finding of similar P-wavevelocities beneath much of the Rocky Mountainsof North America (Dueker et al., 2001; CD-ROMWorking Group, 2002) suggests that it is a char-acteristic of intracontinental activity.
Summary
Pangea grew by continental-margin orogeny alongone entire side (western in present orientation), byaccretion of exotic and juvenile material along theeastern margin of North America and Eurasia, andultimately by collision of eastern North Americawith western Africa. At its time of maximum pack-ing (~250 Ma), Pangea had western and north-eastern margins undergoing subduction and asoutheastern (Gondwana) margin undergoing rift-ing. The rifted fragments from Gondwana accumu-lated on the northeastern margin of Pangea, aprocess that continues to the present. Even at itstime of maximum packing, Pangea did not containall of the world’s continental blocks. At the end ofthe Paleozoic separate blocks probably includedvarious Cimmerian terranes that had already riftedfrom Gondwana and may have included bothNorth and South China.
130 Continents and Supercontinents
9
Rifting of Pangea and Formation of PresentOcean Basins
At the end of the Paleozoic the supercontinentPangea was surrounded by the ‘‘superocean’’
Panthalassa (all ocean). We have no way of know-ing what islands, island arcs, spreading ridges, andother features most of the ocean contained, becauseall of it has now been subducted. We can, however,be somewhat more specific about continental frag-ments and spreading ridges in the small region ofPanthalassa directly adjacent to the eastern marginof Pangea. This part of the ocean, known as‘‘Tethys,’’ left a record of its history as continentalfragments continued to rift from the Gondwana(southern) part of Pangea and move across Tethysto collide with the Laurasian (northeastern) marginof Pangea (chapter 8).
During the Mesozoic and Cenozoic the positionsand configurations of continents and ocean basinsgradually attained their present form. Major con-tinental reorganization resulted from movements offragments across Tethys and the opening of theAtlantic, Indian, Arctic, and Antarctic Oceans andassociated smaller seas. The size of Panthalassa,now known as the Pacific Ocean, graduallydecreased as other oceans opened and small seasformed by a variety of processes in the westernPacific. Separation and collision of continentalplates in what had been the center of Pangeaformed the Gulf of Mexico–Caribbean and theMediterranean.
By creating new spreading centers, the breakupof Pangea generated a larger volume of youngocean lithosphere both in the new ocean basinsand in the Pacific than the volume occupied byspreading centers in Panthalassa. By filling moreof the ocean basins, these ridges forced seawaterto rise eustatically onto continental platforms,creating shallow seas and filling cratonic basinswhere the crust was tectonically depressed.
We begin this chapter by discussing the succes-sive changes in Tethys and then the origin of theworld’s major ocean basins. This is followed by an
investigation of the smaller seas of the westernPacific region and the specific histories of the Gulfof Mexico–Caribbean and the Mediterranean.We continue with a discussion of the causes andlocations of rifts that break up supercontinents andfinish with a description of eustatic sealevelchanges.
Tethys
The process of fragments rifting from Gondwanaand moving across Tethys to accrete with Laurasiacontinued without interruption across the timeboundary between the Paleozoic and Mesozoic.Some of these fragments had almost certainly riftedaway from Gondwana but not yet reached Eurasiaat the beginning of the Mesozoic, thus yielding amap similar to the one shown in fig. 9.1.
The shape of Tethys began to change when theAtlantic and Indian Oceans started to open at ~180Ma (see below). Patterns of drift established byspreading centers in the new oceans causedEurasia to rotate toward an east–west orientationfrom its position in Pangea, where Europe was nearthe equator and Siberia near the north pole. At thesame time, Africa, India, and Australia began tomove northward because of spreading in thenewly forming Indian and Antarctic Oceans. Thiscaused a Tethyan Sea that had been elongatednorth–south along the eastern margin of Pangeato become elongated east–west as Eurasia andparts of the former Gondwana rotated towardeach other like the blades of a pair of scissors.
These movements shortened the distancebetween the southern and northern margins ofTethys and decreased the time that it tookGondwana fragments to cross to the Eurasian mar-gin. We show this process diagrammatically in fig.9.2, which uses only one of the several terminolo-gies that have been applied to the parts of Tethys
131

that closed northward of the moving fragments andopened behind them. The closure of Paleotethysoccurred in the Mesozoic as Cimmerian blocksaccreted to Eurasia, with similar closure ofNeotethys and opening of the Indian Ocean in theCenozoic. Both of these accretions generated wide-spread orogenic events, all of which are describedmore completely in chapter 10.
Formation of Modern Oceans
Almost all of the breakup of Pangea and movementof continents to their present positions can bedescribed in detail because of the preservation ofmagnetic stripes in modern ocean basins. This
wealth of information is well beyond the scope ofthis book, and we present only the outline of thesemovements and refer readers who want more detailto the website operated by C.R. Scotese atwww.scotese.com. This site shows configurationsof continents and ocean basins at numerous timesthroughout the Phanerozoic, including animationsof many of the movements.
Indian Ocean
The Indian Ocean opened behind (south of) the lastcontinental blocks to rift from Gondwana and tra-vel northward across Tethys to Eurasia. In contrastto the linear opening in the Atlantic (see below), theIndian Ocean exhibits an extremely complicated
132 Continents and Supercontinents
Figure 9.1. Pangea at ~250 Ma, showing oceans around it and oceans that caused fragmentation byopening within it. The border between the Indian and Antarctic Oceans is arbitrary.
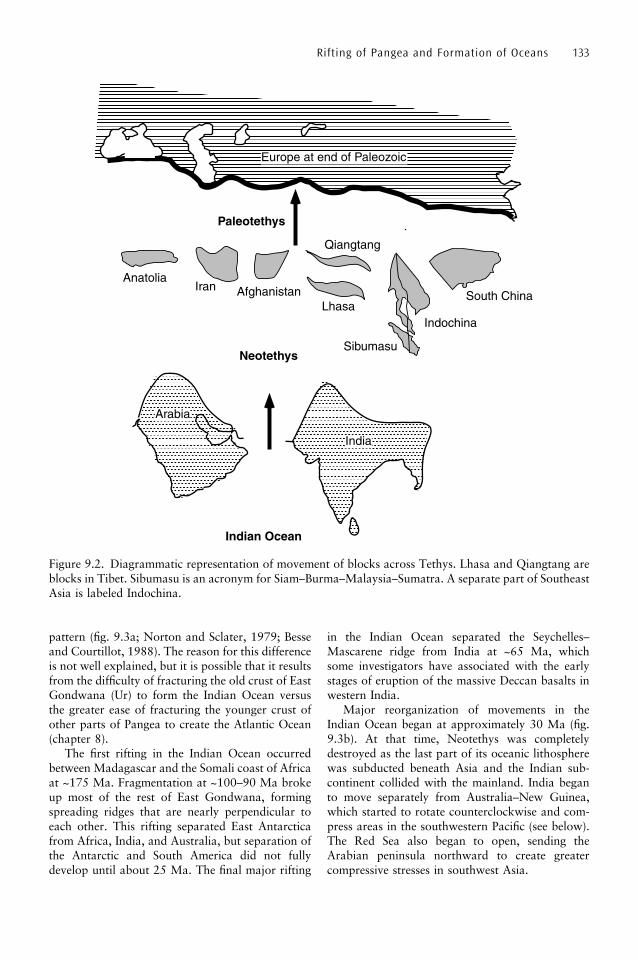
pattern (fig. 9.3a; Norton and Sclater, 1979; Besseand Courtillot, 1988). The reason for this differenceis not well explained, but it is possible that it resultsfrom the difficulty of fracturing the old crust of EastGondwana (Ur) to form the Indian Ocean versusthe greater ease of fracturing the younger crust ofother parts of Pangea to create the Atlantic Ocean(chapter 8).
The first rifting in the Indian Ocean occurredbetween Madagascar and the Somali coast of Africaat ~175 Ma. Fragmentation at ~100–90 Ma brokeup most of the rest of East Gondwana, formingspreading ridges that are nearly perpendicular toeach other. This rifting separated East Antarcticafrom Africa, India, and Australia, but separation ofthe Antarctic and South America did not fullydevelop until about 25 Ma. The final major rifting
in the Indian Ocean separated the Seychelles–Mascarene ridge from India at ~65 Ma, whichsome investigators have associated with the earlystages of eruption of the massive Deccan basalts inwestern India.
Major reorganization of movements in theIndian Ocean began at approximately 30 Ma (fig.9.3b). At that time, Neotethys was completelydestroyed as the last part of its oceanic lithospherewas subducted beneath Asia and the Indian sub-continent collided with the mainland. India beganto move separately from Australia–New Guinea,which started to rotate counterclockwise and com-press areas in the southwestern Pacific (see below).The Red Sea also began to open, sending theArabian peninsula northward to create greatercompressive stresses in southwest Asia.
Rifting of Pangea and Formation of Oceans 133
Figure 9.2. Diagrammatic representation of movement of blocks across Tethys. Lhasa and Qiangtang areblocks in Tibet. Sibumasu is an acronym for Siam–Burma–Malaysia–Sumatra. A separate part of SoutheastAsia is labeled Indochina.
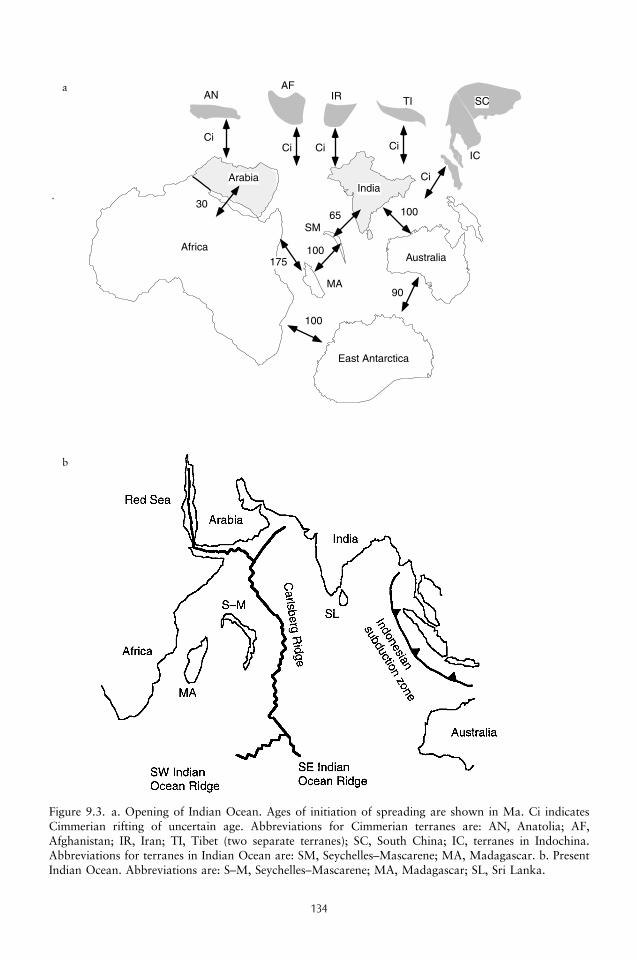
134
Figure 9.3. a. Opening of Indian Ocean. Ages of initiation of spreading are shown in Ma. Ci indicatesCimmerian rifting of uncertain age. Abbreviations for Cimmerian terranes are: AN, Anatolia; AF,Afghanistan; IR, Iran; TI, Tibet (two separate terranes); SC, South China; IC, terranes in Indochina.Abbreviations for terranes in Indian Ocean are: SM, Seychelles–Mascarene; MA, Madagascar. b. PresentIndian Ocean. Abbreviations are: S–M, Seychelles–Mascarene; MA, Madagascar; SL, Sri Lanka.
a
b
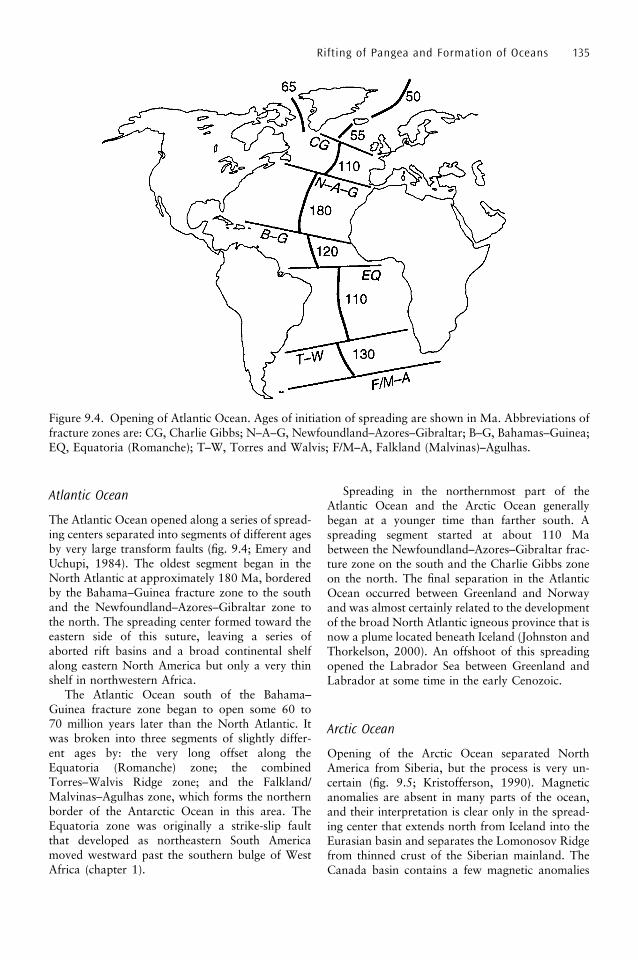
Atlantic Ocean
The Atlantic Ocean opened along a series of spread-ing centers separated into segments of different agesby very large transform faults (fig. 9.4; Emery andUchupi, 1984). The oldest segment began in theNorth Atlantic at approximately 180 Ma, borderedby the Bahama–Guinea fracture zone to the southand the Newfoundland–Azores–Gibraltar zone tothe north. The spreading center formed toward theeastern side of this suture, leaving a series ofaborted rift basins and a broad continental shelfalong eastern North America but only a very thinshelf in northwestern Africa.
The Atlantic Ocean south of the Bahama–Guinea fracture zone began to open some 60 to70 million years later than the North Atlantic. Itwas broken into three segments of slightly differ-ent ages by: the very long offset along theEquatoria (Romanche) zone; the combinedTorres–Walvis Ridge zone; and the Falkland/Malvinas–Agulhas zone, which forms the northernborder of the Antarctic Ocean in this area. TheEquatoria zone was originally a strike-slip faultthat developed as northeastern South Americamoved westward past the southern bulge of WestAfrica (chapter 1).
Spreading in the northernmost part of theAtlantic Ocean and the Arctic Ocean generallybegan at a younger time than farther south. Aspreading segment started at about 110 Mabetween the Newfoundland–Azores–Gibraltar frac-ture zone on the south and the Charlie Gibbs zoneon the north. The final separation in the AtlanticOcean occurred between Greenland and Norwayand was almost certainly related to the developmentof the broad North Atlantic igneous province that isnow a plume located beneath Iceland (Johnston andThorkelson, 2000). An offshoot of this spreadingopened the Labrador Sea between Greenland andLabrador at some time in the early Cenozoic.
Arctic Ocean
Opening of the Arctic Ocean separated NorthAmerica from Siberia, but the process is very un-certain (fig. 9.5; Kristofferson, 1990). Magneticanomalies are absent in many parts of the ocean,and their interpretation is clear only in the spread-ing center that extends north from Iceland into theEurasian basin and separates the Lomonosov Ridgefrom thinned crust of the Siberian mainland. TheCanada basin contains a few magnetic anomalies
Rifting of Pangea and Formation of Oceans 135
Figure 9.4. Opening of Atlantic Ocean. Ages of initiation of spreading are shown in Ma. Abbreviations offracture zones are: CG, Charlie Gibbs; N–A–G, Newfoundland–Azores–Gibraltar; B–G, Bahamas–Guinea;EQ, Equatoria (Romanche); T–W, Torres and Walvis; F/M–A, Falkland (Malvinas)–Agulhas.
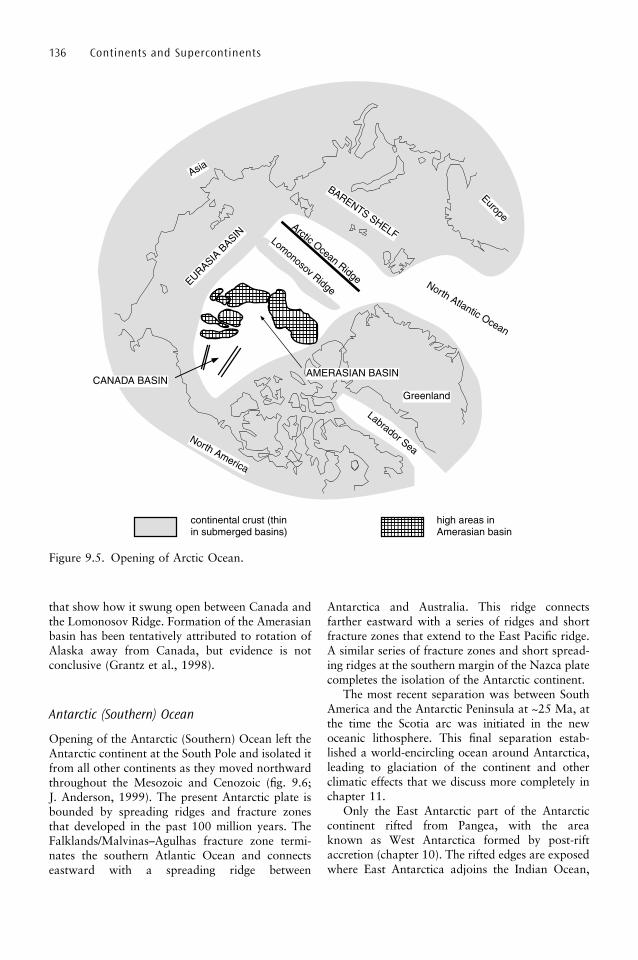
that show how it swung open between Canada andthe Lomonosov Ridge. Formation of the Amerasianbasin has been tentatively attributed to rotation ofAlaska away from Canada, but evidence is notconclusive (Grantz et al., 1998).
Antarctic (Southern) Ocean
Opening of the Antarctic (Southern) Ocean left theAntarctic continent at the South Pole and isolated itfrom all other continents as they moved northwardthroughout the Mesozoic and Cenozoic (fig. 9.6;J. Anderson, 1999). The present Antarctic plate isbounded by spreading ridges and fracture zonesthat developed in the past 100 million years. TheFalklands/Malvinas–Agulhas fracture zone termi-nates the southern Atlantic Ocean and connectseastward with a spreading ridge between
Antarctica and Australia. This ridge connectsfarther eastward with a series of ridges and shortfracture zones that extend to the East Pacific ridge.A similar series of fracture zones and short spread-ing ridges at the southern margin of the Nazca platecompletes the isolation of the Antarctic continent.
The most recent separation was between SouthAmerica and the Antarctic Peninsula at ~25 Ma, atthe time the Scotia arc was initiated in the newoceanic lithosphere. This final separation estab-lished a world-encircling ocean around Antarctica,leading to glaciation of the continent and otherclimatic effects that we discuss more completely inchapter 11.
Only the East Antarctic part of the Antarcticcontinent rifted from Pangea, with the areaknown as West Antarctica formed by post-riftaccretion (chapter 10). The rifted edges are exposedwhere East Antarctica adjoins the Indian Ocean,
136 Continents and Supercontinents
Figure 9.5. Opening of Arctic Ocean.
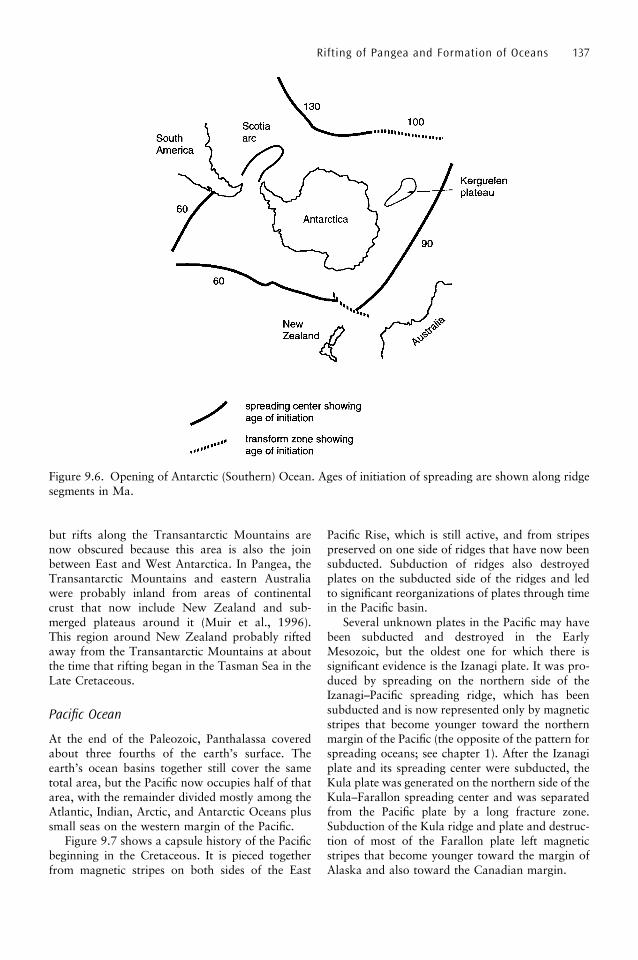
but rifts along the Transantarctic Mountains arenow obscured because this area is also the joinbetween East and West Antarctica. In Pangea, theTransantarctic Mountains and eastern Australiawere probably inland from areas of continentalcrust that now include New Zealand and sub-merged plateaus around it (Muir et al., 1996).This region around New Zealand probably riftedaway from the Transantarctic Mountains at aboutthe time that rifting began in the Tasman Sea in theLate Cretaceous.
Pacific Ocean
At the end of the Paleozoic, Panthalassa coveredabout three fourths of the earth’s surface. Theearth’s ocean basins together still cover the sametotal area, but the Pacific now occupies half of thatarea, with the remainder divided mostly among theAtlantic, Indian, Arctic, and Antarctic Oceans plussmall seas on the western margin of the Pacific.
Figure 9.7 shows a capsule history of the Pacificbeginning in the Cretaceous. It is pieced togetherfrom magnetic stripes on both sides of the East
Pacific Rise, which is still active, and from stripespreserved on one side of ridges that have now beensubducted. Subduction of ridges also destroyedplates on the subducted side of the ridges and ledto significant reorganizations of plates through timein the Pacific basin.
Several unknown plates in the Pacific may havebeen subducted and destroyed in the EarlyMesozoic, but the oldest one for which there issignificant evidence is the Izanagi plate. It was pro-duced by spreading on the northern side of theIzanagi–Pacific spreading ridge, which has beensubducted and is now represented only by magneticstripes that become younger toward the northernmargin of the Pacific (the opposite of the pattern forspreading oceans; see chapter 1). After the Izanagiplate and its spreading center were subducted, theKula plate was generated on the northern side of theKula–Farallon spreading center and was separatedfrom the Pacific plate by a long fracture zone.Subduction of the Kula ridge and plate and destruc-tion of most of the Farallon plate left magneticstripes that become younger toward the margin ofAlaska and also toward the Canadian margin.
Rifting of Pangea and Formation of Oceans 137
Figure 9.6. Opening of Antarctic (Southern) Ocean. Ages of initiation of spreading are shown along ridgesegments in Ma.
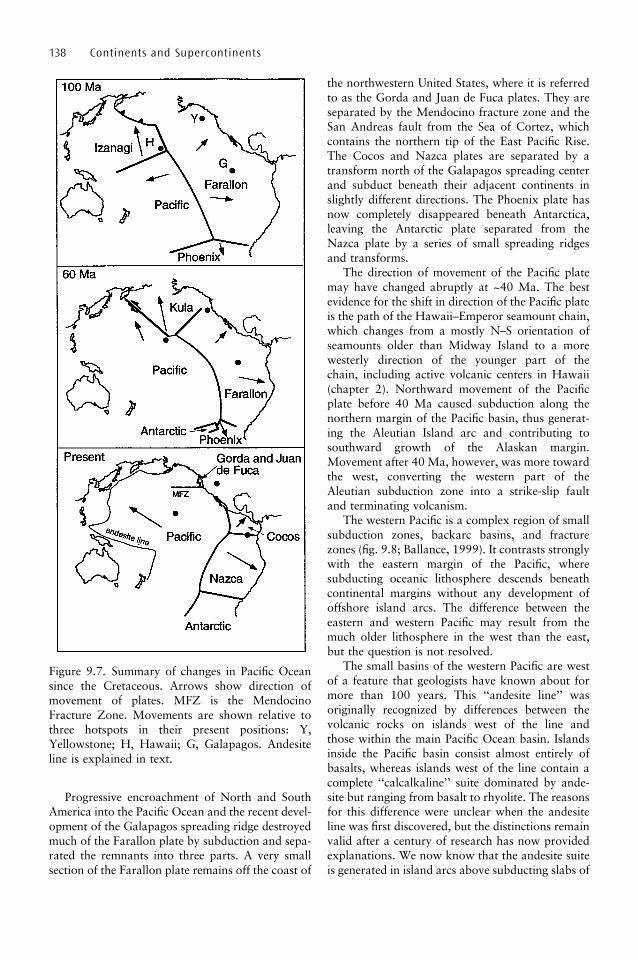
Progressive encroachment of North and SouthAmerica into the Pacific Ocean and the recent devel-opment of the Galapagos spreading ridge destroyedmuch of the Farallon plate by subduction and sepa-rated the remnants into three parts. A very smallsection of the Farallon plate remains off the coast of
the northwestern United States, where it is referredto as the Gorda and Juan de Fuca plates. They areseparated by the Mendocino fracture zone and theSan Andreas fault from the Sea of Cortez, whichcontains the northern tip of the East Pacific Rise.The Cocos and Nazca plates are separated by atransform north of the Galapagos spreading centerand subduct beneath their adjacent continents inslightly different directions. The Phoenix plate hasnow completely disappeared beneath Antarctica,leaving the Antarctic plate separated from theNazca plate by a series of small spreading ridgesand transforms.
The direction of movement of the Pacific platemay have changed abruptly at ~40 Ma. The bestevidence for the shift in direction of the Pacific plateis the path of the Hawaii–Emperor seamount chain,which changes from a mostly N–S orientation ofseamounts older than Midway Island to a morewesterly direction of the younger part of thechain, including active volcanic centers in Hawaii(chapter 2). Northward movement of the Pacificplate before 40 Ma caused subduction along thenorthern margin of the Pacific basin, thus generat-ing the Aleutian Island arc and contributing tosouthward growth of the Alaskan margin.Movement after 40 Ma, however, was more towardthe west, converting the western part of theAleutian subduction zone into a strike-slip faultand terminating volcanism.
The western Pacific is a complex region of smallsubduction zones, backarc basins, and fracturezones (fig. 9.8; Ballance, 1999). It contrasts stronglywith the eastern margin of the Pacific, wheresubducting oceanic lithosphere descends beneathcontinental margins without any development ofoffshore island arcs. The difference between theeastern and western Pacific may result from themuch older lithosphere in the west than the east,but the question is not resolved.
The small basins of the western Pacific are westof a feature that geologists have known about formore than 100 years. This ‘‘andesite line’’ wasoriginally recognized by differences between thevolcanic rocks on islands west of the line andthose within the main Pacific Ocean basin. Islandsinside the Pacific basin consist almost entirely ofbasalts, whereas islands west of the line contain acomplete ‘‘calcalkaline’’ suite dominated by ande-site but ranging from basalt to rhyolite. The reasonsfor this difference were unclear when the andesiteline was first discovered, but the distinctions remainvalid after a century of research has now providedexplanations. We now know that the andesite suiteis generated in island arcs above subducting slabs of
138 Continents and Supercontinents
Figure 9.7. Summary of changes in Pacific Oceansince the Cretaceous. Arrows show direction ofmovement of plates. MFZ is the MendocinoFracture Zone. Movements are shown relative tothree hotspots in their present positions: Y,Yellowstone; H, Hawaii; G, Galapagos. Andesiteline is explained in text.
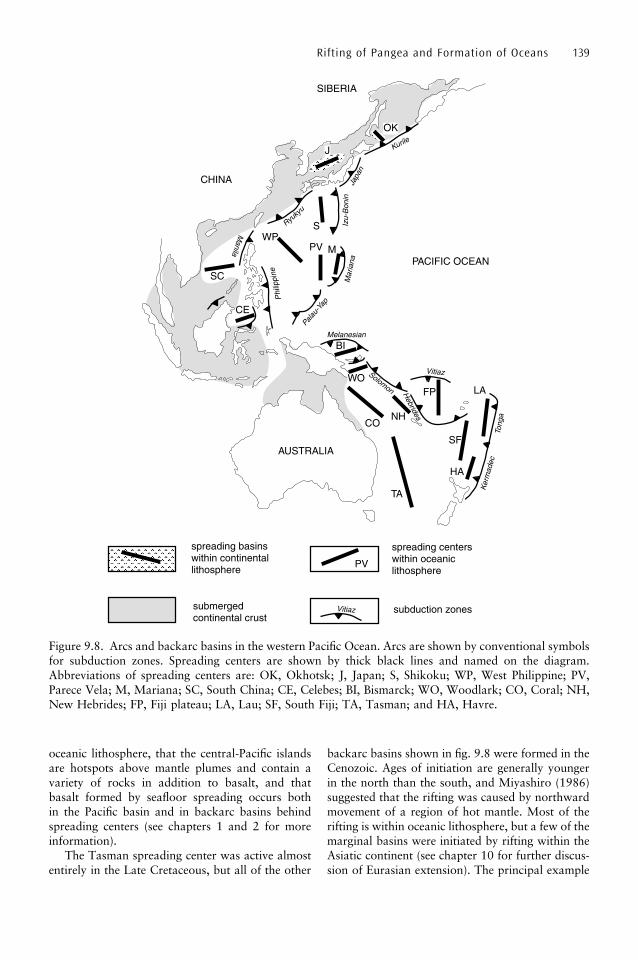
oceanic lithosphere, that the central-Pacific islandsare hotspots above mantle plumes and contain avariety of rocks in addition to basalt, and thatbasalt formed by seafloor spreading occurs bothin the Pacific basin and in backarc basins behindspreading centers (see chapters 1 and 2 for moreinformation).
The Tasman spreading center was active almostentirely in the Late Cretaceous, but all of the other
backarc basins shown in fig. 9.8 were formed in theCenozoic. Ages of initiation are generally youngerin the north than the south, and Miyashiro (1986)suggested that the rifting was caused by northwardmovement of a region of hot mantle. Most of therifting is within oceanic lithosphere, but a few of themarginal basins were initiated by rifting within theAsiatic continent (see chapter 10 for further discus-sion of Eurasian extension). The principal example
Rifting of Pangea and Formation of Oceans 139
Figure 9.8. Arcs and backarc basins in the western Pacific Ocean. Arcs are shown by conventional symbolsfor subduction zones. Spreading centers are shown by thick black lines and named on the diagram.Abbreviations of spreading centers are: OK, Okhotsk; J, Japan; S, Shikoku; WP, West Philippine; PV,Parece Vela; M, Mariana; SC, South China; CE, Celebes; BI, Bismarck; WO, Woodlark; CO, Coral; NH,New Hebrides; FP, Fiji plateau; LA, Lau; SF, South Fiji; TA, Tasman; and HA, Havre.
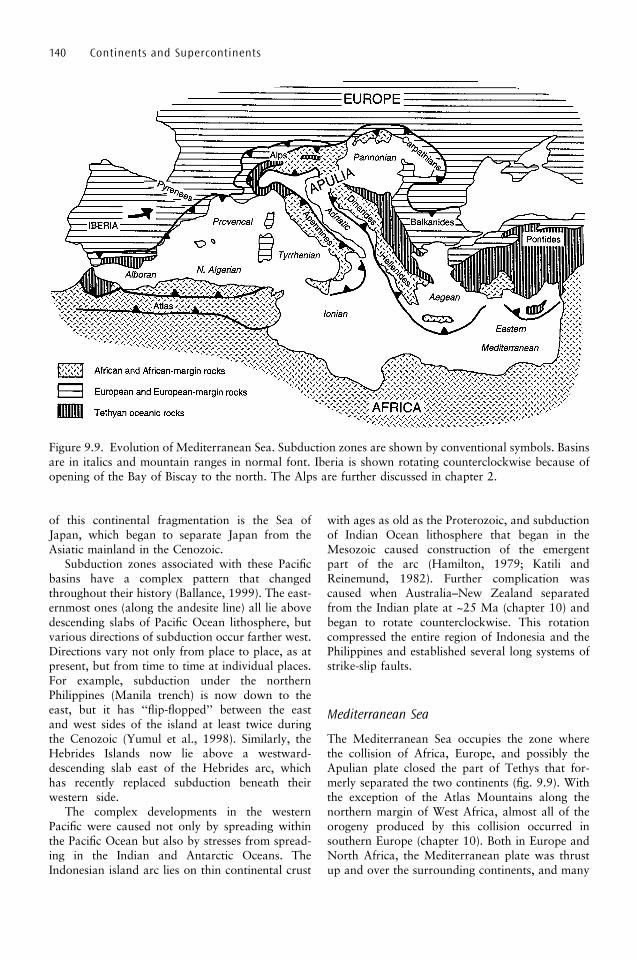
of this continental fragmentation is the Sea ofJapan, which began to separate Japan from theAsiatic mainland in the Cenozoic.
Subduction zones associated with these Pacificbasins have a complex pattern that changedthroughout their history (Ballance, 1999). The east-ernmost ones (along the andesite line) all lie abovedescending slabs of Pacific Ocean lithosphere, butvarious directions of subduction occur farther west.Directions vary not only from place to place, as atpresent, but from time to time at individual places.For example, subduction under the northernPhilippines (Manila trench) is now down to theeast, but it has ‘‘flip-flopped’’ between the eastand west sides of the island at least twice duringthe Cenozoic (Yumul et al., 1998). Similarly, theHebrides Islands now lie above a westward-descending slab east of the Hebrides arc, whichhas recently replaced subduction beneath theirwestern side.
The complex developments in the westernPacific were caused not only by spreading withinthe Pacific Ocean but also by stresses from spread-ing in the Indian and Antarctic Oceans. TheIndonesian island arc lies on thin continental crust
with ages as old as the Proterozoic, and subductionof Indian Ocean lithosphere that began in theMesozoic caused construction of the emergentpart of the arc (Hamilton, 1979; Katili andReinemund, 1982). Further complication wascaused when Australia–New Zealand separatedfrom the Indian plate at ~25 Ma (chapter 10) andbegan to rotate counterclockwise. This rotationcompressed the entire region of Indonesia and thePhilippines and established several long systems ofstrike-slip faults.
Mediterranean Sea
The Mediterranean Sea occupies the zone wherethe collision of Africa, Europe, and possibly theApulian plate closed the part of Tethys that for-merly separated the two continents (fig. 9.9). Withthe exception of the Atlas Mountains along thenorthern margin of West Africa, almost all of theorogeny produced by this collision occurred insouthern Europe (chapter 10). Both in Europe andNorth Africa, the Mediterranean plate was thrustup and over the surrounding continents, and many
140 Continents and Supercontinents
Figure 9.9. Evolution of Mediterranean Sea. Subduction zones are shown by conventional symbols. Basinsare in italics and mountain ranges in normal font. Iberia is shown rotating counterclockwise because ofopening of the Bay of Biscay to the north. The Alps are further discussed in chapter 2.
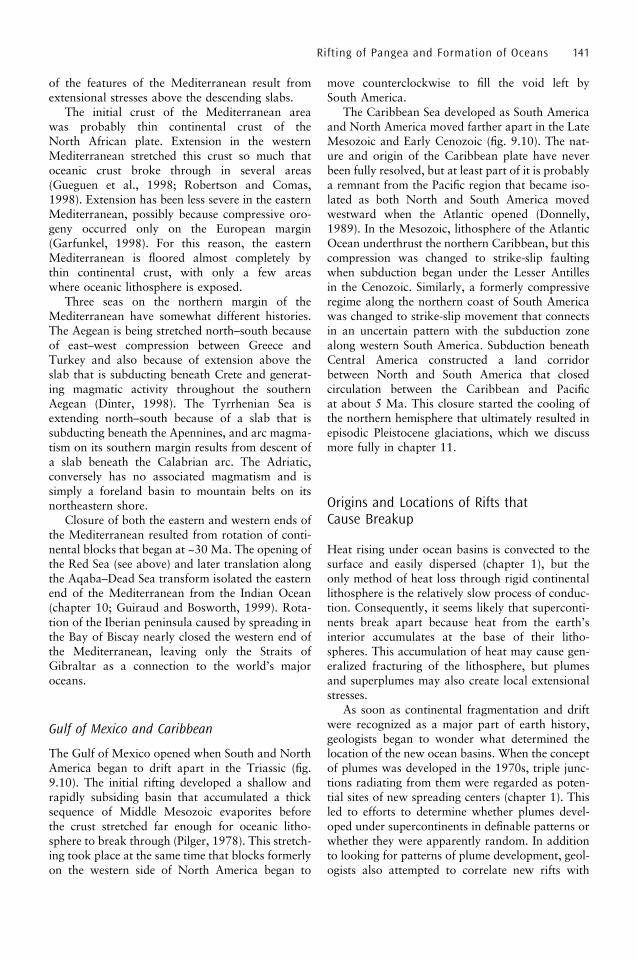
of the features of the Mediterranean result fromextensional stresses above the descending slabs.
The initial crust of the Mediterranean areawas probably thin continental crust of theNorth African plate. Extension in the westernMediterranean stretched this crust so much thatoceanic crust broke through in several areas(Gueguen et al., 1998; Robertson and Comas,1998). Extension has been less severe in the easternMediterranean, possibly because compressive oro-geny occurred only on the European margin(Garfunkel, 1998). For this reason, the easternMediterranean is floored almost completely bythin continental crust, with only a few areaswhere oceanic lithosphere is exposed.
Three seas on the northern margin of theMediterranean have somewhat different histories.The Aegean is being stretched north–south becauseof east–west compression between Greece andTurkey and also because of extension above theslab that is subducting beneath Crete and generat-ing magmatic activity throughout the southernAegean (Dinter, 1998). The Tyrrhenian Sea isextending north–south because of a slab that issubducting beneath the Apennines, and arc magma-tism on its southern margin results from descent ofa slab beneath the Calabrian arc. The Adriatic,conversely has no associated magmatism and issimply a foreland basin to mountain belts on itsnortheastern shore.
Closure of both the eastern and western ends ofthe Mediterranean resulted from rotation of conti-nental blocks that began at ~30 Ma. The opening ofthe Red Sea (see above) and later translation alongthe Aqaba–Dead Sea transform isolated the easternend of the Mediterranean from the Indian Ocean(chapter 10; Guiraud and Bosworth, 1999). Rota-tion of the Iberian peninsula caused by spreading inthe Bay of Biscay nearly closed the western end ofthe Mediterranean, leaving only the Straits ofGibraltar as a connection to the world’s majoroceans.
Gulf of Mexico and Caribbean
The Gulf of Mexico opened when South and NorthAmerica began to drift apart in the Triassic (fig.9.10). The initial rifting developed a shallow andrapidly subsiding basin that accumulated a thicksequence of Middle Mesozoic evaporites beforethe crust stretched far enough for oceanic litho-sphere to break through (Pilger, 1978). This stretch-ing took place at the same time that blocks formerlyon the western side of North America began to
move counterclockwise to fill the void left bySouth America.
The Caribbean Sea developed as South Americaand North America moved farther apart in the LateMesozoic and Early Cenozoic (fig. 9.10). The nat-ure and origin of the Caribbean plate have neverbeen fully resolved, but at least part of it is probablya remnant from the Pacific region that became iso-lated as both North and South America movedwestward when the Atlantic opened (Donnelly,1989). In the Mesozoic, lithosphere of the AtlanticOcean underthrust the northern Caribbean, but thiscompression was changed to strike-slip faultingwhen subduction began under the Lesser Antillesin the Cenozoic. Similarly, a formerly compressiveregime along the northern coast of South Americawas changed to strike-slip movement that connectsin an uncertain pattern with the subduction zonealong western South America. Subduction beneathCentral America constructed a land corridorbetween North and South America that closedcirculation between the Caribbean and Pacificat about 5 Ma. This closure started the cooling ofthe northern hemisphere that ultimately resulted inepisodic Pleistocene glaciations, which we discussmore fully in chapter 11.
Origins and Locations of Rifts thatCause Breakup
Heat rising under ocean basins is convected to thesurface and easily dispersed (chapter 1), but theonly method of heat loss through rigid continentallithosphere is the relatively slow process of conduc-tion. Consequently, it seems likely that superconti-nents break apart because heat from the earth’sinterior accumulates at the base of their litho-spheres. This accumulation of heat may cause gen-eralized fracturing of the lithosphere, but plumesand superplumes may also create local extensionalstresses.
As soon as continental fragmentation and driftwere recognized as a major part of earth history,geologists began to wonder what determined thelocation of the new ocean basins. When the conceptof plumes was developed in the 1970s, triple junc-tions radiating from them were regarded as poten-tial sites of new spreading centers (chapter 1). Thisled to efforts to determine whether plumes devel-oped under supercontinents in definable patterns orwhether they were apparently random. In additionto looking for patterns of plume development, geol-ogists also attempted to correlate new rifts with
Rifting of Pangea and Formation of Oceans 141
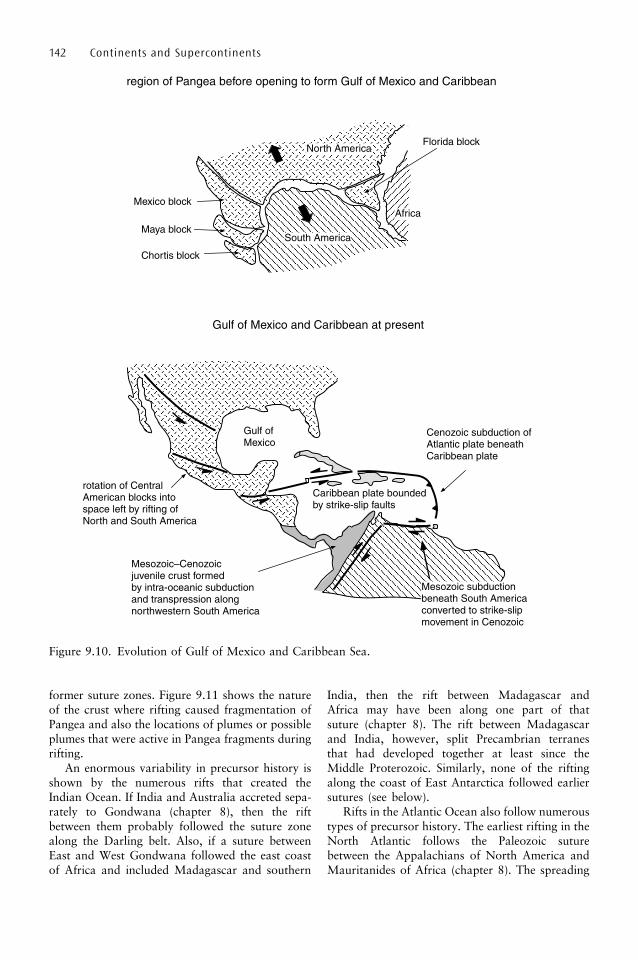
former suture zones. Figure 9.11 shows the natureof the crust where rifting caused fragmentation ofPangea and also the locations of plumes or possibleplumes that were active in Pangea fragments duringrifting.
An enormous variability in precursor history isshown by the numerous rifts that created theIndian Ocean. If India and Australia accreted sepa-rately to Gondwana (chapter 8), then the riftbetween them probably followed the suture zonealong the Darling belt. Also, if a suture betweenEast and West Gondwana followed the east coastof Africa and included Madagascar and southern
India, then the rift between Madagascar andAfrica may have been along one part of thatsuture (chapter 8). The rift between Madagascarand India, however, split Precambrian terranesthat had developed together at least since theMiddle Proterozoic. Similarly, none of the riftingalong the coast of East Antarctica followed earliersutures (see below).
Rifts in the Atlantic Ocean also follow numeroustypes of precursor history. The earliest rifting in theNorth Atlantic follows the Paleozoic suturebetween the Appalachians of North America andMauritanides of Africa (chapter 8). The spreading
142 Continents and Supercontinents
Figure 9.10. Evolution of Gulf of Mexico and Caribbean Sea.
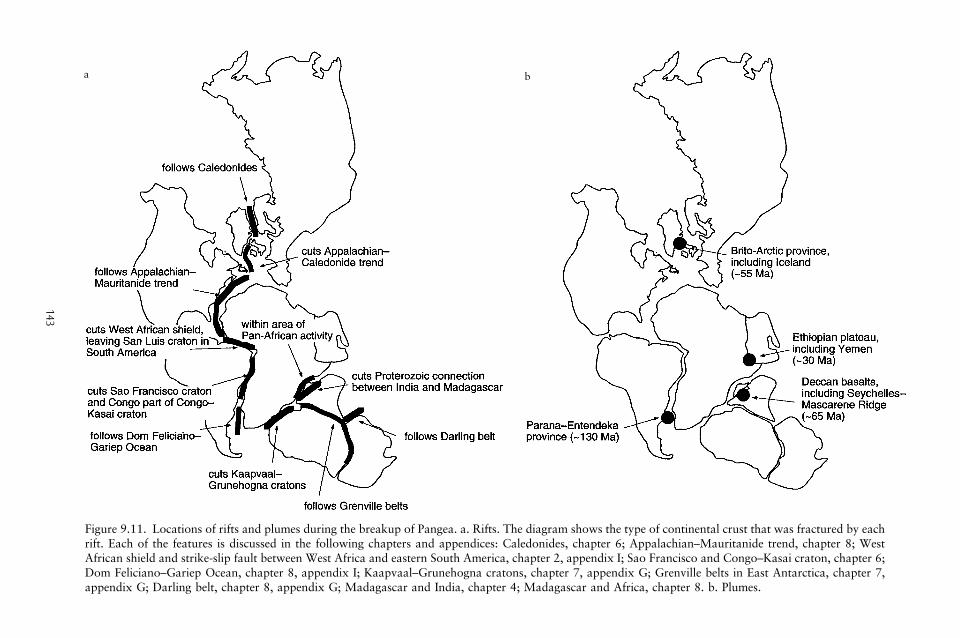
143
Figure 9.11. Locations of rifts and plumes during the breakup of Pangea. a. Rifts. The diagram shows the type of continental crust that was fractured by eachrift. Each of the features is discussed in the following chapters and appendices: Caledonides, chapter 6; Appalachian–Mauritanide trend, chapter 8; WestAfrican shield and strike-slip fault between West Africa and eastern South America, chapter 2, appendix I; Sao Francisco and Congo–Kasai craton, chapter 6;Dom Feliciano–Gariep Ocean, chapter 8, appendix I; Kaapvaal–Grunehogna cratons, chapter 7, appendix G; Grenville belts in East Antarctica, chapter 7,appendix G; Darling belt, chapter 8, appendix G; Madagascar and India, chapter 4; Madagascar and Africa, chapter 8. b. Plumes.
a b

center between Greenland and Norway follows theCaledonide orogen, but whether this was an inter-continental suture or an intracontinental orogenis uncertain (chapter 5). Rifting between theNewfoundland–Azores–Gibraltar and Greenland–Scotland zones cuts across Middle Paleozoic oro-genic belts that formerly extended from NorthAmerica into Europe. Rifting south of theBahama–Guinea fracture zone also appears toshow no relationship to older structures. TheEquatoria fracture zone cut across the southerntip of the West African craton and left a smallpart as the San Luis craton of South America.Spreading centers in the South Atlantic cut the for-merly united Congo–Sao Francisco craton (chapter6) until they reach the former Dom Feliciano–Gariep Ocean (chapter 8) at the southern end ofthe Atlantic.
Whether rifts in the Arctic Ocean follow formerzones of tectonic weakness is unclear. The ArcticOcean ridge apparently cut across ancient Siberiancontinental crust, but it is possible that this sub-merged area might have contained an older suturezone. The Canada and Amerasian basins are sofilled with fragments of continental crust, and theopening pattern is so unclear, that the location ofinitial rifting cannot be determined from presentinformation.
The rifts that formed around East Antarctica donot appear to follow any former suture. BetweenAfrica and East Antarctica the rift cuts through theArchean Kaapvaal–Grunehogna craton (chapter 7),which had been coherent since the Paleoproterozoicor earlier. Farther east, separation between EastAntarctica and India/Australia is within a set ofMeso-/Neoproterozoic orogenic belts in India andAustralia that correlate so well with belts in EastAntarctica that the sutures associated with theseorogens are presumably farther south under theAntarctic icecap (appendix G). Rifting along theTransantarctic Mountains followed an Early-Paleozoic orogen, but it is not clear whether itdeveloped in a suture zone.
Most, but not all, geologists believe that largebasalt plateaus were developed above plumes(chapter 1). Figure 9.11b shows the locations offour basalt plateaus, presumably caused by plumes,that were clearly involved in the breakup of differ-ent parts of Pangea. Iceland, which is still astridethe mid-Atlantic ridge, is part of a much broaderBrito-Arctic basalt province that is now preservedin both eastern Greenland and the HebrideanIslands of northern Scotland (Kent and Fitton,2000). Because this province began to form at~55 Ma, the same age as the oldest magnetic stripes
between Greenland and Europe, it is clear that theIceland plume either initiated the spreading or wasable to rise because the area was undergoing exten-sion.
Similar relationships between age of basalt pla-teaus and initiation of spreading are present in threeother locations. The Parana basalts and associatedvolcanic rocks of South America and the similarEntendeka suite of southern Africa developed as asingle volcanic province at ~130 Ma, when this partof the Atlantic Ocean began to open (Kirstein et al.,2001; Marsh et al., 2001; Ernesto et al., 2002). Theisland of Tristan da Cunha, on the mid-Atlanticridge, is still volcanically active and may be thepresent site of the plume that formed the Parana–Entendeka suite. Tristan da Cunha is connected tothe Entendeka province by the Walvis ridge and tothe Parana province by the Torres ridge, butwhether these ridges are both hotspot tracks isunclear (fig. 9.4).
Spreading in the northern Indian Ocean at ~65Ma split the 65-Ma Deccan basalts in eastern Indiafrom their apparent continuation in the Seychelles–Mascarene Ridge. The Deccan basalts were appar-ently the head of a plume that left a trail across partof the Indian Ocean and is now located at ReunionIsland (Lenat et al., 2001). The most recent exampleof spreading associated with a basalt plateau is atthe southern end of the Red Sea, where theEthiopian–Yemen basalt plateau developed at thetime all three arms of the triple junction began tospread (Ebinger and Casey, 2001; Menzies et al.,2001; chapter 2).
In addition to Tristan da Cunha, two othervolcanic islands are located along or near the mid-Atlantic ridge in the southern part of the AtlanticOcean. Ascension and St. Helena have both beenproposed to be the tails of plume tracks that weredeveloped during the opening of the ocean. Effortsto relate them to volcanic activity in Africa, how-ever, have been mostly unsuccessful, and we discussthe issue more completely in chapter 10.
Eustatic Changes in Sealevel
Since the beginning of the Phanerozoic, global sea-level probably has not varied by more than a fewhundred meters. The two major processes that con-trol the changes that have occurred operate oververy different periods of time. Glacial–interglacialvariations typically have periodicities of less than afew hundred thousand years, and we discuss themin chapter 11. Variations with periodicities of tensof millions of years are determined by the volume of
144 Continents and Supercontinents

ocean basins that is filled by spreading ridges, andwe discuss them here because the breakup ofPangea triggered a major rise in global sealevel.
Variations in global sealevel during thePhanerozoic are controversial in detail but fairlywell known over intervals of tens of millions ofyears. A generalized illustration of variations insealevel shows highstands in the Ordovician andCretaceous with lowstands near the end of thePaleozoic and at present (fig. 9.12). The cause ofthe Ordovician highstand is unclear, but the one inthe Middle Cretaceous is almost certainly the resultof the fragmentation of Pangea and development ofnumerous spreading centers in the Atlantic andIndian Oceans at about 100 Ma (see above).Sealevel rise was enhanced in the Cretaceous bydevelopment of a superplume in the Pacific Ocean(Larson, 1991).
The extent of continental submersion during theCretaceous was controlled not only by global sea-level but also by local tectonic activity. Thus theamount of continental submergence or emergencevaried between continents and within continents.Figure 9.13 shows the principal areas of Creta-ceous flooding, distinguishing between areas sub-merged because of tectonic subsidence and thoseflooded only by sealevel rise and subsidence ofrifted margins.
Rifting causes continental margins to becomethinner and susceptible to encroachment by marinewater, with the extent of submersion dependent onglobal sealevel, post-rift tectonic activity, and therate of sedimentary outbuilding of the continentalmargin (chapter 2). The Atlantic Ocean covered thecontinental shelf of North America and penetratedfar into the interior but encroached only slightlyon Africa because the initial rifting was on theeastern side of the extended region (see above).Encroachment similarly covered shelves in SouthAmerica but did not extend into the interior exceptin areas of tectonic subsidence. Large regions of theArctic Ocean are floored by thin continental crust(see above), and they have been submerged con-tinually since rifting.
Several continental margins that were notformed by rifting of Pangea are now submergedand/or show the effects of Cretaceous sealevel rise.One of the thickest sedimentary suites accumulatedon the northeastern margin of the Arabian penin-sula before it collided with Asia, and remnants ofsediments from the northern margin of India arelocally preserved in the Himalayas. The margins ofeastern Asia, the Sunda shelf, and northernAustralia/New Guinea are all thin and covered byseawater, either because of stretching of old con-
tinental crust or because the crust is now formingand has not yet developed normal thickness.
The general emergence of Gondwana and sub-mergence of Laurasia within Pangea continued intothe Early Mesozoic (chapter 8). The principal areaaffected was northern Europe, the Russian plat-form, and areas toward the southeast. This regionaccumulated widespread suites of Mesozoic rocksbefore becoming emergent in the Cenozoic.
Figure 9.13 shows some of the large areas whereCretaceous flooding was caused partly by tectonicdownwarp. The Western Interior Seaway of NorthAmerica was a foreland basin depressed by loadingof the Sevier orogenic belt to the west. TheMississippi, Amazon, and Parana basins all formedalong major river systems, possibly indicating thatthe rivers followed long-term zones of weakness. A
Rifting of Pangea and Formation of Oceans 145
Figure 9.12. Eustatic sealevels during the Phaner-ozoic. Adapted from Haq et al. (1987).
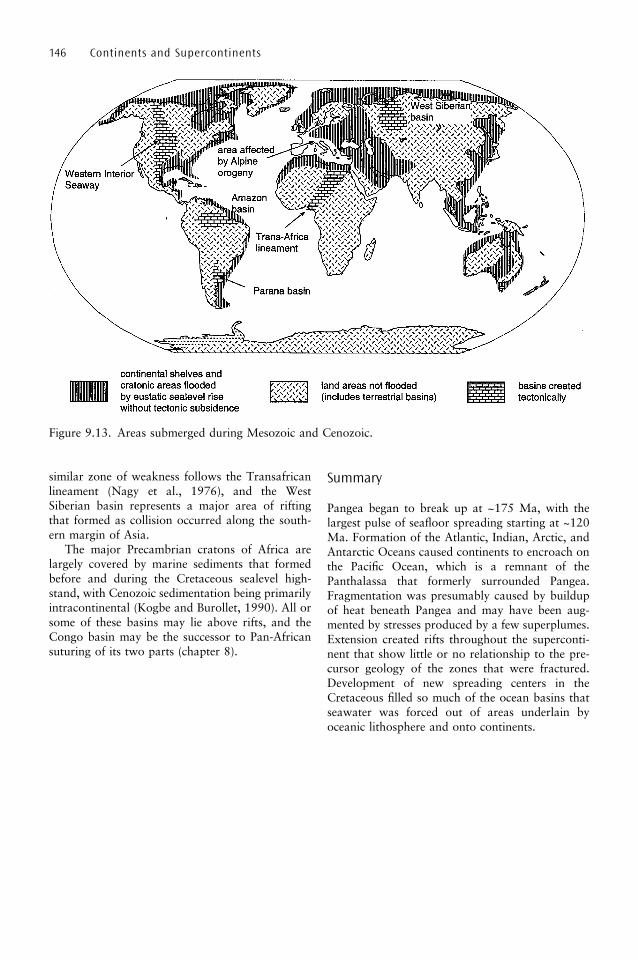
similar zone of weakness follows the Transafricanlineament (Nagy et al., 1976), and the WestSiberian basin represents a major area of riftingthat formed as collision occurred along the south-ern margin of Asia.
The major Precambrian cratons of Africa arelargely covered by marine sediments that formedbefore and during the Cretaceous sealevel high-stand, with Cenozoic sedimentation being primarilyintracontinental (Kogbe and Burollet, 1990). All orsome of these basins may lie above rifts, and theCongo basin may be the successor to Pan-Africansuturing of its two parts (chapter 8).
Summary
Pangea began to break up at ~175 Ma, with thelargest pulse of seafloor spreading starting at ~120Ma. Formation of the Atlantic, Indian, Arctic, andAntarctic Oceans caused continents to encroach onthe Pacific Ocean, which is a remnant of thePanthalassa that formerly surrounded Pangea.Fragmentation was presumably caused by buildupof heat beneath Pangea and may have been aug-mented by stresses produced by a few superplumes.Extension created rifts throughout the superconti-nent that show little or no relationship to the pre-cursor geology of the zones that were fractured.Development of new spreading centers in theCretaceous filled so much of the ocean basins thatseawater was forced out of areas underlain byoceanic lithosphere and onto continents.
146 Continents and Supercontinents
Figure 9.13. Areas submerged during Mesozoic and Cenozoic.

10
History of Continents after Rifting fromPangea
As continents moved from Pangea to their presentpositions, they experienced more than 100 mil-
lion years of geologic history. Compressive andextensional stresses generated by collision withcontinental and oceanic plates formed mountainbelts, zones of rifting and strike-slip faulting, andmagmatism in all of these environments. In thischapter we can only provide capsule summaries ofthis history for each of the various continents, butmany of their salient features have been discussedas examples of tectonic processes in earlier chap-ters. The final section analyzes the breakup ofPangea as part of the latest cycle of accretionand dispersal of supercontinents. Because itinvolves continuation of this cycle into the future,it is necessarily very speculative.
Histories of Individual Continents
Figure 10.1 shows approximate patterns of move-ment of each continent from its position in Pangeato the present. The dominant feature of this patternis northward movement of all continents exceptAntarctica, which has remained over the SouthPole for more than 250 million years. Shortlyafter geologists recognized the concept of continen-tal drift, this movement was referred to by theGerman word ‘‘Polflucht’’ (flight from the pole)because all of the continents were seen to be fleeingfrom the South Pole. The only continent that didnot simply move northward was Eurasia, whichessentially rotated clockwise and changed its orien-tation from north–south to east–west. Comparisonof fig. 10.1 with fig. 8.12a (locations of continentsshortly before the assembly of Gondwana) showsthat the net effect of the last 580 million years ofearth history has been a transfer of most continentalcrust from the southern hemisphere to the northernhemisphere.
Eurasia
Accretion and compression against the southernmargin of Eurasia constructed a series of mountainbelts from the Pyrenees in the west to the numerousranges of Southeast Asia in the east. This collisiongenerated extensional and transtensional forces thatopened rifts and pull-apart basins. Tectonic loadingcreated foreland basins with sediment thicknesses ofseveral kilometers. Opposite the area where thecollision of India caused the most intense compres-sion, the extensional basins are interspersed withmountain ranges that were lifted up intracontinen-tally. We divide the discussion of Eurasia into asection where compression dominates to the south(present orientation) of the former margin ofPangea and a section that describes processes withinthe landmass to the north.
The Collision Zone Compression in southern Eur-ope produced the Alps and related mountain beltsfarther east (chapter 2; fig. 10.2). The orogenicbelts contain passive-margin sediments depositedon both the African and European margins plus abroad range of supracrustal rocks formed in theTethyan Ocean that separated the two continentalmargins. These Tethyan rocks include ophiolites,various rocks of island arcs, and thick sequencesof turbidites and other flysch. They were all thrustin a general northerly direction as the Europeancontinental lithosphere descended beneath Tethyanlithosphere and, ultimately, beneath Africa or con-tinental fragments north of Africa (Frey et al.,1999; Schmid and Kissling, 2000).
Most of the compression began in the Cretaceousand continues to the present. The complex patternof tectonism was largely caused by a region knownas Apulia (Adria) that was either a promontory ofNorth Africa or a separate microcontinent (fig.10.2). The Apennines, Alps, and Dinarides formed
147

148 Continents and Supercontinents
Figure 10.1. Movement of continents from Pangea to the present. Arrows show general directions relativeto other fragments of Pangea, and lengths of arrows indicate the relative amounts of movement.
Figure 10.2. Compression along the southern margin of Eurasia. The Iberian peninsula is shown rotatingcounterclockwise. Abbreviations are: AP, Apulia plate; NAF, North Anatolian fault zone; AN, Anatolia;IR, Iran; AF, Afghanistan; Sc, Southwest China flysch basin; ADS, Aqaba–Dead Sea fault zone; Ma,Makran accretionary prism; BAL, Baluchistan fault zone; IBR, Indo-Burman ranges; RRA, Red River–Ailongshan fault zone. Three mountain ranges are discussed in more detail elsewhere: Alps, chapter 2;Zagros, chapter 5; Himalaya, chapter 5.
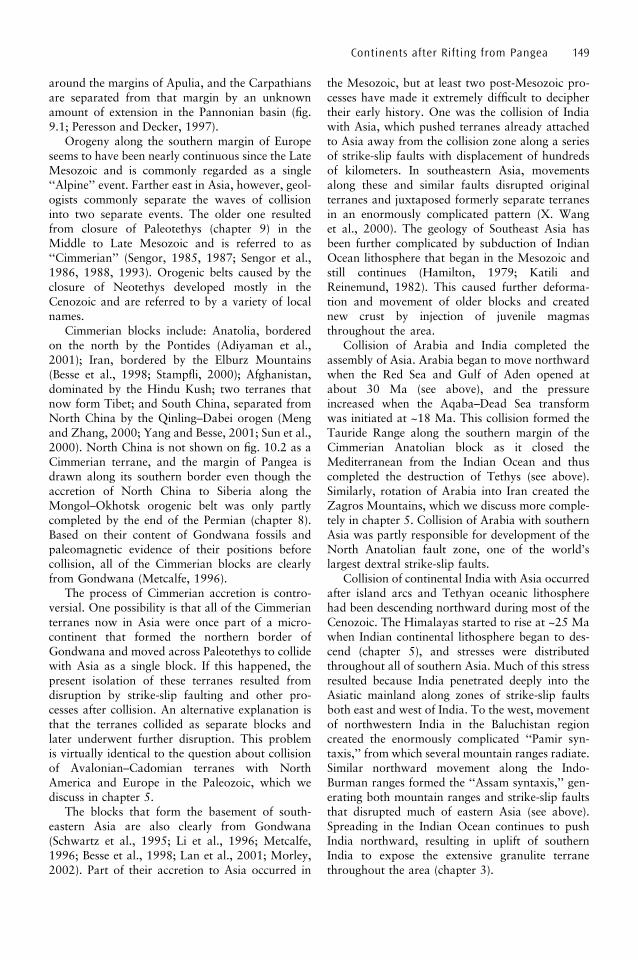
around the margins of Apulia, and the Carpathiansare separated from that margin by an unknownamount of extension in the Pannonian basin (fig.9.1; Peresson and Decker, 1997).
Orogeny along the southern margin of Europeseems to have been nearly continuous since the LateMesozoic and is commonly regarded as a single‘‘Alpine’’ event. Farther east in Asia, however, geol-ogists commonly separate the waves of collisioninto two separate events. The older one resultedfrom closure of Paleotethys (chapter 9) in theMiddle to Late Mesozoic and is referred to as‘‘Cimmerian’’ (Sengor, 1985, 1987; Sengor et al.,1986, 1988, 1993). Orogenic belts caused by theclosure of Neotethys developed mostly in theCenozoic and are referred to by a variety of localnames.
Cimmerian blocks include: Anatolia, borderedon the north by the Pontides (Adiyaman et al.,2001); Iran, bordered by the Elburz Mountains(Besse et al., 1998; Stampfli, 2000); Afghanistan,dominated by the Hindu Kush; two terranes thatnow form Tibet; and South China, separated fromNorth China by the Qinling–Dabei orogen (Mengand Zhang, 2000; Yang and Besse, 2001; Sun et al.,2000). North China is not shown on fig. 10.2 as aCimmerian terrane, and the margin of Pangea isdrawn along its southern border even though theaccretion of North China to Siberia along theMongol–Okhotsk orogenic belt was only partlycompleted by the end of the Permian (chapter 8).Based on their content of Gondwana fossils andpaleomagnetic evidence of their positions beforecollision, all of the Cimmerian blocks are clearlyfrom Gondwana (Metcalfe, 1996).
The process of Cimmerian accretion is contro-versial. One possibility is that all of the Cimmerianterranes now in Asia were once part of a micro-continent that formed the northern border ofGondwana and moved across Paleotethys to collidewith Asia as a single block. If this happened, thepresent isolation of these terranes resulted fromdisruption by strike-slip faulting and other pro-cesses after collision. An alternative explanation isthat the terranes collided as separate blocks andlater underwent further disruption. This problemis virtually identical to the question about collisionof Avalonian–Cadomian terranes with NorthAmerica and Europe in the Paleozoic, which wediscuss in chapter 5.
The blocks that form the basement of south-eastern Asia are also clearly from Gondwana(Schwartz et al., 1995; Li et al., 1996; Metcalfe,1996; Besse et al., 1998; Lan et al., 2001; Morley,2002). Part of their accretion to Asia occurred in
the Mesozoic, but at least two post-Mesozoic pro-cesses have made it extremely difficult to deciphertheir early history. One was the collision of Indiawith Asia, which pushed terranes already attachedto Asia away from the collision zone along a seriesof strike-slip faults with displacement of hundredsof kilometers. In southeastern Asia, movementsalong these and similar faults disrupted originalterranes and juxtaposed formerly separate terranesin an enormously complicated pattern (X. Wanget al., 2000). The geology of Southeast Asia hasbeen further complicated by subduction of IndianOcean lithosphere that began in the Mesozoic andstill continues (Hamilton, 1979; Katili andReinemund, 1982). This caused further deforma-tion and movement of older blocks and creatednew crust by injection of juvenile magmasthroughout the area.
Collision of Arabia and India completed theassembly of Asia. Arabia began to move northwardwhen the Red Sea and Gulf of Aden opened atabout 30 Ma (see above), and the pressureincreased when the Aqaba–Dead Sea transformwas initiated at ~18 Ma. This collision formed theTauride Range along the southern margin of theCimmerian Anatolian block as it closed theMediterranean from the Indian Ocean and thuscompleted the destruction of Tethys (see above).Similarly, rotation of Arabia into Iran created theZagros Mountains, which we discuss more comple-tely in chapter 5. Collision of Arabia with southernAsia was partly responsible for development of theNorth Anatolian fault zone, one of the world’slargest dextral strike-slip faults.
Collision of continental India with Asia occurredafter island arcs and Tethyan oceanic lithospherehad been descending northward during most of theCenozoic. The Himalayas started to rise at ~25 Mawhen Indian continental lithosphere began to des-cend (chapter 5), and stresses were distributedthroughout all of southern Asia. Much of this stressresulted because India penetrated deeply into theAsiatic mainland along zones of strike-slip faultsboth east and west of India. To the west, movementof northwestern India in the Baluchistan regioncreated the enormously complicated ‘‘Pamir syn-taxis,’’ from which several mountain ranges radiate.Similar northward movement along the Indo-Burman ranges formed the ‘‘Assam syntaxis,’’ gen-erating both mountain ranges and strike-slip faultsthat disrupted much of eastern Asia (see above).Spreading in the Indian Ocean continues to pushIndia northward, resulting in uplift of southernIndia to expose the extensive granulite terranethroughout the area (chapter 3).
Continents after Rifting from Pangea 149

Eurasia North of the Collision Zone Collision ofIndia and other blocks on the southern margin ofEurasia distributed stresses throughout the entirelandmass, forming foreland basins, extensionalbasins, and a region of intracratonic mountainranges and pull-apart basins. They are shown infig. 10.3, and we discuss each type of deformationbriefly in this section.
Foreland basins develop where the weight of athickened orogen causes subsidence of an adjacentblock (chapters 1 and 2). The concept was origin-ally developed from studies in the Alps, whichyielded the terms ‘‘flysch’’ and ‘‘molasse’’ for sedi-ments deposited in different tectonic environments.Flysch included sediments deposited within an oro-gen undergoing active deformation, and molassereferred to sediments that were deposited eitherafter active deformation had stopped or in areasoutside the zone of deformation. The Alpine originof the term is shown by designation of the forelandbasin north of the Alps as the ‘‘Molasse Basin,’’which accumulated as much as 10 km of sedimentin the Late Mesozoic and Early Cenozoic (chapter2; Homewood et al., 1986).
Figure 10.3 shows two other foreland basins.The Pontide orogen on the northern edge of theAnatolian plate caused subsidence of the
European foreland to create the Black Sea. Thisdepression caused the floor of the Black Sea to tiltsouthward, forming a shallow shelf on the northand a deep-water basin on the south (Meredith andEgan, 2002). Similar depression of the southernCaspian Sea by the Elburz Range caused accumula-tion of a thick sequence of sediment in the southernpart of the sea, and the depression may be so severethat Caspian lithosphere is subducting beneath theIranian region (Axen et al., 2001).
East–west extension in many areas north of thecollision zone was caused by north–south compres-sion along the southern margin of Eurasia InEurope, the Rhine graben extends northwardalmost perpendicular to the Alps (Laubscher,2001; Schumacher, 2002). A much broader regionof extension began to form in the North Seaand thinned the crust sufficiently that the area isnow submerged. Extensional development of thePannonian region is within the collision zone andis mentioned above.
Extension of the very large West Siberian basinbegan shortly after development of the Siberianbasaltic province at 250 Ma (Reichow et al.,2002). Sediments accumulated most rapidly duringactive extension in the Mesozoic and then moreslowly during the entire Cenozoic (Aleinikov et
150 Continents and Supercontinents
Figure 10.3. Extensional features in Eurasia. Abbreviations are: mb, Molasse Basin; bs, Black Sea; ca,Caspian Sea; AL, Altai Range; DZ, Dzunggar Basin; TA, Tarim; TI, Tien Shan Range; KU, Kunlun Range;QA, Qaidam Basin; AF, Altyn Tagh fault.

al., 1980; Rudkevich and Maksimov, 1988). Theduration of activity in the basin suggests that it wasaffected not only by collision along the southernmargin of Eurasia but also by subduction ofTethyan lithosphere at times when continentalcollision was not occurring.
Broad upwarp and depression occurred at sev-eral places in Asia in the Cenozoic. Upwarpformed a dome with ~300 m of uplift inMongolia at the same time as the developmentof Lake Baikal (Cunningham, 2001). The AralSea and Lake Balkash are very shallow bodies ofwater that apparently formed in slightly down-warped basins.
Lake Baikal is the world’s deepest lake andcontains the largest volume of freshwater. It liesin a volcanically active rift zone with a NE–SWorientation that was presumably generated bynorthward-directed compression from the collidingIndian plate during the Cenozoic (Delvaux et al.,1997; Ionov, 2002). Lake Baikal is on the westernedge of an extensional region that has a width ofmore than 1000 km from central Siberia to north-eastern China (Liu et al., 2001; Ren et al., 2002).This area makes it even larger than the compar-able Basin and Range province of western NorthAmerica (see below).
When India collided with central Asia it encoun-tered a region that had been assembled largely dur-ing the Late Paleozoic (chapter 8; Heubeck, 2001).This collage of microcontinents, arcs, and oceanicsuites was intensely reactivated by renewed com-pression in the Cenozoic. Areas that were uplifted(‘‘rejuvenated’’) during this compression becamemountain ranges, locally raising Paleozoic rocksthat had been eroded almost to sealevel to formranges such as Altay and Tien Shan, which didnot begin to rise until the Late Cenozoic. The south-ernmost of the rejuvenated ranges is Kunlun whichformed the southern margin of Eurasia beforeaccretion of the Cimmerian blocks that constituteTibet (Jolivet et al., 2001).
The Dzunggar, Tarim, Qaidam, and smallerbasins developed among the rejuvenated ranges(Vincent and Allen, 2001), with their depressioncaused partly by loading of adjacent mountainranges but probably more significantly by pull-apart movements along fault zones. Figure 10.3shows only the largest of these fault zones as anextension of the Altyn Tagh fault, which forms thenorthern margin of Tibet and distributes left-lateralmovement through much of eastern Asia (Yin et al.,2002). The pull-apart motions created basins thatare locally very deep, with the Turfan depressionbeing more than 100 km below sealevel.
North America
Rifting of Pangea left North America with passivemargins on three sides of the continent and anactive margin only on the west. The rate of conver-gence between North America and the Pacificincreased when the North Atlantic opened andwestward subduction beneath colliding island arcs(chapter 8) changed to eastward subduction ofPacific lithosphere beneath continental NorthAmerica. The interaction of sequences of plates inthe Pacific, plus the steady northward movement ofthe Pacific relative to North America, created acomplex history of the western part of the continentthat we can summarize only briefly here (fig. 10.4aand b). Ward (1995) provides a general summary ofthe history of western North America since thebeginning of subduction.
Infilling of the broad embayment in thePrecambrian margin of North America began inthe Paleozoic (chapter 8) and was probably com-pleted by the middle of the Mesozoic. The largelyunknown mix of exotic terranes and continental-margin suites that accreted in this region, plus rota-tion of some terranes southeastward toward theGulf of Mexico, produced a western continentalmargin that was an approximate straight line bysome time in the Jurassic. At this time, the easternPacific consisted solely of the Farallon plate (fig.9.7), which subducted beneath North America ata rate equal to the combined spreading velocities ofthe East Pacific Rise and mid-Atlantic ridge. Thissubduction generated batholithic suites alongalmost the entire western margin of NorthAmerica from the Jurassic until the Early Cenozoic.
While batholiths were intruded through conti-nental crust, North America built outward by accu-mulation of a collage of terranes west of the zone ofintrusion. This collage contains an enormous vari-ety of suites, many of them with controversial ori-gins. Some may be exotic fragments from unknowncontinents. Others appear to be island arcs thatformed offshore of North America before collision.A few have been proposed to be oceanic plateausthat had densities too low for them to be subductedunder the continental margin. All of these terranesare interspersed through a mixture of continental-margin sediments, ophiolitic melanges, and marinesediments such as chert and deposits of marine fans.
Intrusion and outbuilding were greatly affectedby changes in configuration of plates in the PacificOcean (chapter 9; Atwater, 1989; Atwater andStock, 1998). During the Late Cretaceous thenorthern margin of the Farallon plate was a spread-ing center on the southern edge of the Kula plate,
Continents after Rifting from Pangea 151

152
Figure 10.4. Mesozoic–Cenozoic tectonics of western North America. a. Compressional features in western North America before collision with the EastPacific Rise. b. Extensional features in western North America after collision with the East Pacific rise.
a b

which directed the Kula plate almost directly north-ward under the margin of Alaska and the Aleutians.This movement caused southward growth ofAlaska as oceanic materials subducted under theadvancing continental margin, and subductionbeneath areas of thin continental crust or oceaniccrust developed the Aleutian island arc. Thisgrowth continued until ~40 Ma, when the Kulaplate was completely destroyed and the Pacificplate changed its direction of movement (chapter 9).
The Farallon plate underwent further fragmen-tation as North America moved farther westward,and parts of the Farallon–Pacific ridge intersectedthe margin of North America. This process has nowleft only a remnant of the Farallon plate (Gorda andJuan de Fuca plates) subducting to form theCascade Range in Oregon and Washington andanother remnant referred to as the Cocos plate tocause continuing volcanism in Mexico and CentralAmerica. The Gorda and Juan de Fuca plates areterminated southward by the Mendocino fracturezone, which extends to the northern end of the SanAndreas fault. The San Andreas fault lies within thebroad zone of right-lateral displacement betweenthe Pacific and North American plates and showsmore than 100 km of dextral movement in the LateCenozoic. The southern end of the San Andreasconnects with the part of the East Pacific Rise thatextends into the Sea of Cortez and forms the easternmargin of the Cocos plate.
Mesozoic and Cenozoic activity affected NorthAmerica up to 1000 km east of its Pacific margin.During the Cretaceous, construction of the Sevierthrust belt produced a load that created the WesternInterior Seaway (chapter 9). In the Late Cretaceousand Early Cenozoic (Laramide time), areas to theeast of the Sevier orogen were uplifted along faultsof uncertain origin to form a series of blocks thatnow constitute much of the southern RockyMountains. Orogeny during Laramide time northof these uplifts developed more conventional oro-genic features, moving thrust sheets hundreds ofkilometers eastward over ‘‘miogeoclinal’’ rocks toform the Rocky Mountains in the northern UnitedStates and Canada.
Compression changed largely to transtensionalong the central (U.S.) part of the continental mar-gin as the continent began to override the EastPacific Rise. The disappearance of the rise andFarallon plate in this area occurred at about thesame time as the Basin and Range extensional pro-vince began to open (chapter 2). This series of N–S-trending fault basins and intervening ranges hasstretched to a width nearly three times as much asthe original area, partly resulting in the westward
bulge of North America along the U.S. coastline.The Rio Grande rift began to form at ~30 Ma as aresult of dextral rotation between the Coloradoplateau and continental crust to the east(Wawrzyniec et al., 2002).
Both compressive and extensional activity inwestern North America largely bypassed theColorado plateau (Selverstone et al., 1999; D.Smith, 2000). The plateau consists of Precambrianbasement overlain by flat-lying sedimentary rocksthat range from Late Proterozoic to the present.Older suites are mostly marine and younger onesalmost completely terrestrial, showing a long-termemergence of the plateau. The almost completeabsence of rifting or compression throughout theinterior of the plateau even while it was surroundedby intense deformation make this area one of theworld’s most enigmatic features, with no presentexplanation for its ability to remain a bulwarkagainst surrounding activity.
South America
The Precambrian crust of South America extends tothe western coastline of most of the continent(chapter 8; fig. 10.5). The South Atlantic Oceanbegan to open at ~110 Ma (see above), and theincreased rate of subduction of Pacific oceanic litho-sphere beneath the continental margin began toconstruct the modern Andes. Construction resultingfrom subduction of the Farallon plate continuedwithout interruption when the Farallon platebroke up, and now the Andes lie wholly abovethe Nazca plate. We provide further informationabout the Andes in chapter 5, where they are usedas the type example of orogenic activity on conti-nental margins not accompanied by collision ofexotic terranes.
The only places along the western margin ofSouth America not underlain by Precambriancrust are the northwestern corner and the southerntip of the continent. The northwest has a basementof mostly Cenozoic arc and continental-marginsuites and is dominated by the northeasterly sub-duction of the Cocos plate and by dextral strike-slipfaults that form the margin between the SouthAmerican and Caribbean plates. Modern volcanismis intense in the southern part of this area butnonexistent to the north, where the orogenic trendsswing toward an E–W orientation along the south-ern margin of the Caribbean.
The southern tip of South America is underlainby a suite of Paleozoic and Early Mesozoic arcs andaccretionary wedges. This terrane was apparently
Continents after Rifting from Pangea 153
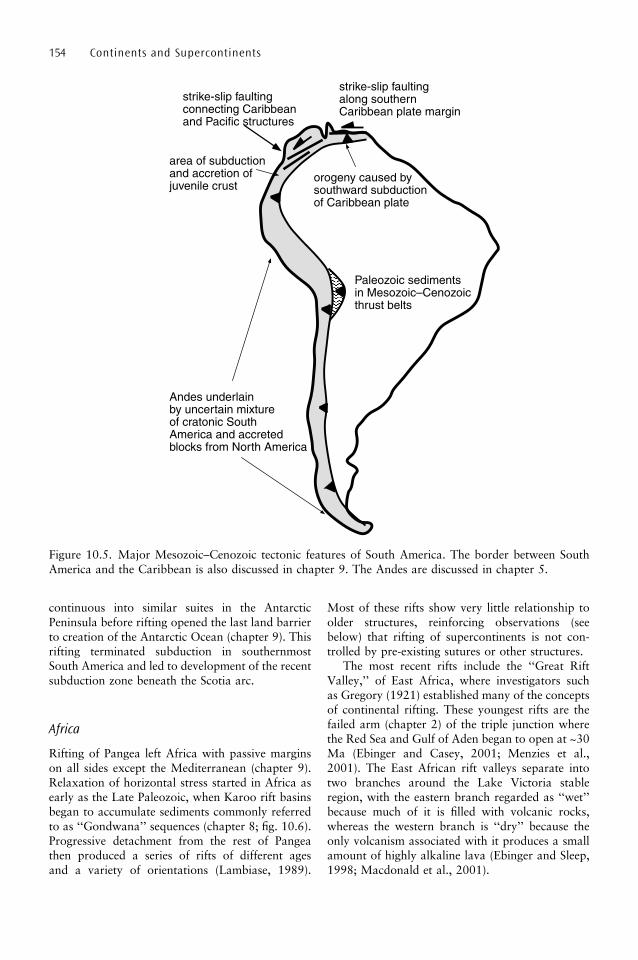
continuous into similar suites in the AntarcticPeninsula before rifting opened the last land barrierto creation of the Antarctic Ocean (chapter 9). Thisrifting terminated subduction in southernmostSouth America and led to development of the recentsubduction zone beneath the Scotia arc.
Africa
Rifting of Pangea left Africa with passive marginson all sides except the Mediterranean (chapter 9).Relaxation of horizontal stress started in Africa asearly as the Late Paleozoic, when Karoo rift basinsbegan to accumulate sediments commonly referredto as ‘‘Gondwana’’ sequences (chapter 8; fig. 10.6).Progressive detachment from the rest of Pangeathen produced a series of rifts of different agesand a variety of orientations (Lambiase, 1989).
Most of these rifts show very little relationship toolder structures, reinforcing observations (seebelow) that rifting of supercontinents is not con-trolled by pre-existing sutures or other structures.
The most recent rifts include the ‘‘Great RiftValley,’’ of East Africa, where investigators suchas Gregory (1921) established many of the conceptsof continental rifting. These youngest rifts are thefailed arm (chapter 2) of the triple junction wherethe Red Sea and Gulf of Aden began to open at ~30Ma (Ebinger and Casey, 2001; Menzies et al.,2001). The East African rift valleys separate intotwo branches around the Lake Victoria stableregion, with the eastern branch regarded as ‘‘wet’’because much of it is filled with volcanic rocks,whereas the western branch is ‘‘dry’’ because theonly volcanism associated with it produces a smallamount of highly alkaline lava (Ebinger and Sleep,1998; Macdonald et al., 2001).
154 Continents and Supercontinents
Figure 10.5. Major Mesozoic–Cenozoic tectonic features of South America. The border between SouthAmerica and the Caribbean is also discussed in chapter 9. The Andes are discussed in chapter 5.
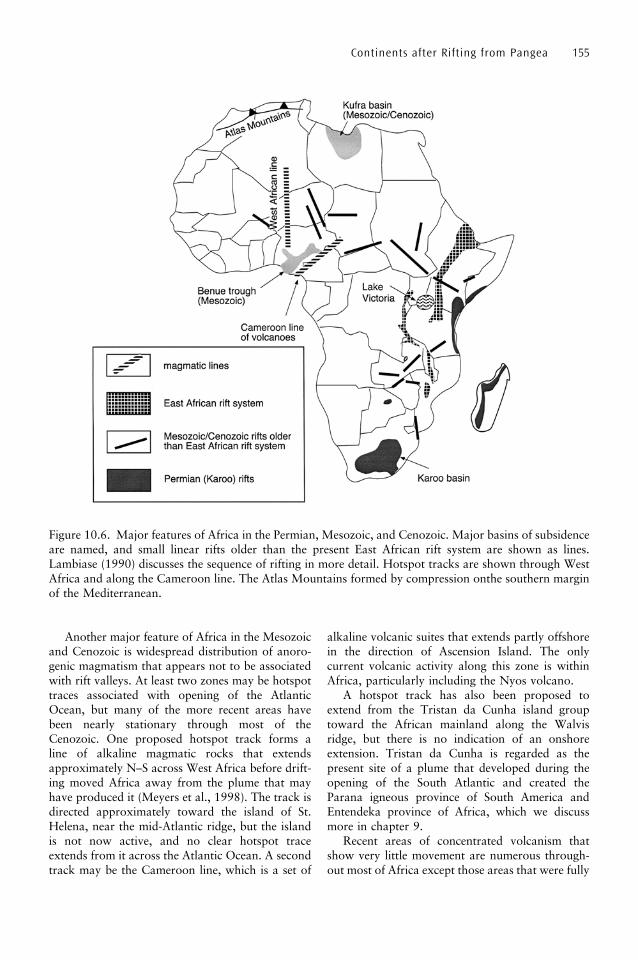
Another major feature of Africa in the Mesozoicand Cenozoic is widespread distribution of anoro-genic magmatism that appears not to be associatedwith rift valleys. At least two zones may be hotspottraces associated with opening of the AtlanticOcean, but many of the more recent areas havebeen nearly stationary through most of theCenozoic. One proposed hotspot track forms aline of alkaline magmatic rocks that extendsapproximately N–S across West Africa before drift-ing moved Africa away from the plume that mayhave produced it (Meyers et al., 1998). The track isdirected approximately toward the island of St.Helena, near the mid-Atlantic ridge, but the islandis not now active, and no clear hotspot traceextends from it across the Atlantic Ocean. A secondtrack may be the Cameroon line, which is a set of
alkaline volcanic suites that extends partly offshorein the direction of Ascension Island. The onlycurrent volcanic activity along this zone is withinAfrica, particularly including the Nyos volcano.
A hotspot track has also been proposed toextend from the Tristan da Cunha island grouptoward the African mainland along the Walvisridge, but there is no indication of an onshoreextension. Tristan da Cunha is regarded as thepresent site of a plume that developed during theopening of the South Atlantic and created theParana igneous province of South America andEntendeka province of Africa, which we discussmore in chapter 9.
Recent areas of concentrated volcanism thatshow very little movement are numerous through-out most of Africa except those areas that were fully
Continents after Rifting from Pangea 155
Figure 10.6. Major features of Africa in the Permian, Mesozoic, and Cenozoic. Major basins of subsidenceare named, and small linear rifts older than the present East African rift system are shown as lines.Lambiase (1990) discusses the sequence of rifting in more detail. Hotspot tracks are shown through WestAfrica and along the Cameroon line. The Atlas Mountains formed by compression onthe southern marginof the Mediterranean.

stabilized prior to Pan-African time (chapter 8;Ritsema and van Heijst, 2000). They erupted avariety of rocks that include large volcanic plateaus,local centers of alkalic suites, and mixtures of bothtypes of rocks. This typical anorogenic magmatismprobably results from some combination of the lackof compressive stress and a thick lithosphere thatappears to characterize much of the continent.
Australia–New Guinea–New Zealand
Australia and New Guinea have been part of asingle plate floored by continental crust throughoutthe Phanerozoic and possibly earlier (fig. 10.7). Therifting that disrupted Pangea left Australia withpassive margins on the west and south, and onlyNew Guinea has undergone compressive deforma-tion since that time. Subduction beneath the NewGuinea margin began in the Mesozoic and con-structed the island as a melange of volcanic andintrusive suites, continental-margin sediments,obducted ophiolites, and oceanic plateaus (Hilland Raza, 1999).
This construction was terminated in the MiddleCenozoic when the Bismarck and other basinsopened and new subduction zones were created
(Hall and Spakman, 2002). Counterclockwise rota-tion of Australia–New Guinea began at ~25 Ma(chapter 9), and much of the deformation in NewGuinea became transpressional. This movementformed the left-lateral Sorong fault, which extendsfrom New Guinea to structures around thePhilippines and is one of the world’s longest faultzones.
New Zealand and at least some of the sub-merged continental plateaus around it apparentlyrifted away from East Antarctica in the EarlyMesozoic. This crust then merged with an unknownamount of submerged crust east of the presentmargin of Australia to form a broad zone of thincontinental crust. Opening of the Tasman Sea in theLate Cretaceous (chapter 9) separated the NewZealand area from Australia and isolated easternAustralia from all geologic activity except intraplatemagmatism, which produced the voluminousNewer Basalts.
Both before and after opening of the TasmanSea, lithosphere of the Pacific plate subducted underthe North Island of New Zealand and the Tongaand Kermadec arcs to the north, creating a zone ofmagmatism that is still active. The subduction zoneterminates near the south end of the North Island,and is replaced southward by a very long zone of
156 Continents and Supercontinents
Figure 10.7. Major Mesozoic and Cenozoic tectonic features of Australia, New Guinea, New Zealand, andadjacent seas. Australia and New Guinea were a single joined block during this time. Subduction zones areshown by conventional symbols.
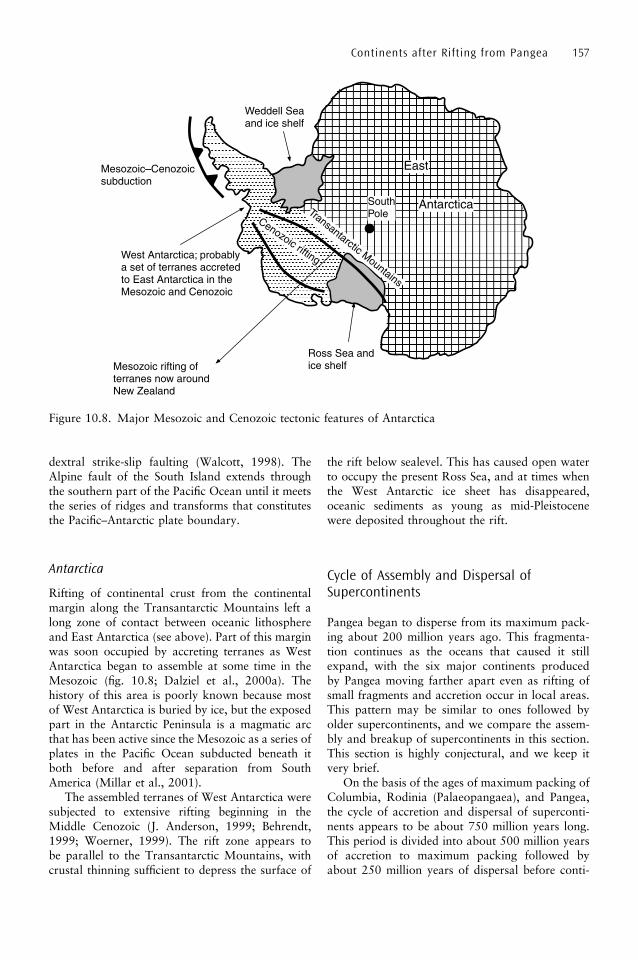
dextral strike-slip faulting (Walcott, 1998). TheAlpine fault of the South Island extends throughthe southern part of the Pacific Ocean until it meetsthe series of ridges and transforms that constitutesthe Pacific–Antarctic plate boundary.
Antarctica
Rifting of continental crust from the continentalmargin along the Transantarctic Mountains left along zone of contact between oceanic lithosphereand East Antarctica (see above). Part of this marginwas soon occupied by accreting terranes as WestAntarctica began to assemble at some time in theMesozoic (fig. 10.8; Dalziel et al., 2000a). Thehistory of this area is poorly known because mostof West Antarctica is buried by ice, but the exposedpart in the Antarctic Peninsula is a magmatic arcthat has been active since the Mesozoic as a series ofplates in the Pacific Ocean subducted beneath itboth before and after separation from SouthAmerica (Millar et al., 2001).
The assembled terranes of West Antarctica weresubjected to extensive rifting beginning in theMiddle Cenozoic (J. Anderson, 1999; Behrendt,1999; Woerner, 1999). The rift zone appears tobe parallel to the Transantarctic Mountains, withcrustal thinning sufficient to depress the surface of
the rift below sealevel. This has caused open waterto occupy the present Ross Sea, and at times whenthe West Antarctic ice sheet has disappeared,oceanic sediments as young as mid-Pleistocenewere deposited throughout the rift.
Cycle of Assembly and Dispersal ofSupercontinents
Pangea began to disperse from its maximum pack-ing about 200 million years ago. This fragmenta-tion continues as the oceans that caused it stillexpand, with the six major continents producedby Pangea moving farther apart even as rifting ofsmall fragments and accretion occur in local areas.This pattern may be similar to ones followed byolder supercontinents, and we compare the assem-bly and breakup of supercontinents in this section.This section is highly conjectural, and we keep itvery brief.
On the basis of the ages of maximum packing ofColumbia, Rodinia (Palaeopangaea), and Pangea,the cycle of accretion and dispersal of superconti-nents appears to be about 750 million years long.This period is divided into about 500 million yearsof accretion to maximum packing followed byabout 250 million years of dispersal before conti-
Continents after Rifting from Pangea 157
Figure 10.8. Major Mesozoic and Cenozoic tectonic features of Antarctica

nental blocks begin reassembling. If this periodicityis being followed by fragments from Pangea, thenthey are likely to spend the next 50–100 millionyears drifting farther apart until the succeedingsupercontinent begins to form.
The name ‘‘Amasia’’ has been proposed for thenext supercontinent (Hoffman, 1992). The NorthAmerican and Asiatic plates are already fused alonga zone of uncertain nature through eastern Asia(chapter 2), and it is possible that the next super-continent will develop as more of the present con-tinents collide around this Asia–North Americanucleus. Part of this fusion might result from furtheraccretion of Gondwana blocks to southern Asia,perhaps by closure of the Indian Ocean. If SouthAmerica and Antarctica moved in some pattern thatcaused them also to accrete to Asia in about 500million years, then the next supercontinent wouldreach its maximum packing at the same time in thecycle as previous supercontinents.
In chapter 6 we discuss two models for theformation of supercontinents. One model proposesthat supercontinents develop through accretion ofnumerous small blocks along intercontinental oro-genic belts formed by ocean closure. The secondmodel suggests reorganization of large old conti-nental blocks that had remained stable since theywere originally formed at ~3 Ga (Ur), ~2.5 Ga(Arctica), and ~2 Ga (Atlantica). The breakup ofPangea mostly into large continental blocks and a
few small ones seems to support the second model,which is consistent with the suggestion that theearth’s lithosphere has always consisted of a rela-tively small number of plates (D. Anderson, 2002).
Despite the similarity that all supercontinentsfragmented into large blocks, the breakup ofPangea may differ in one respect from that of theolder supercontinents Columbia and Rodinia.According to the second model presented above,both Columbia and Rodinia fragmented aroundthe three older continental blocks, thus preservingthem for incorporation into Pangea, but only one ofthe three remained unfractured when Pangea brokeup. The core of Arctica (Kenorland) remainedintact, but Atlantica was cut into two halves(Africa and South America), and Ur was shatteredinto more than three fragments.
We close this chapter with two observations.One is that processes now occurring on the earthare fully consistent with operation of a cycle ofsupercontinent assembly and dispersal throughoutearth history. The dispersal of Pangea appears tofollow the same time schedule and to form approxi-mately the same numbers of fragments as its pre-decessors. The second observation is that fragmentsformed from Pangea generally do not contain thesame assemblies of cratons as those formed fromRodinia and Columbia. The reasons for both thesimilarity and difference are unknown and shouldconstitute a basis for future research.
158 Continents and Supercontinents
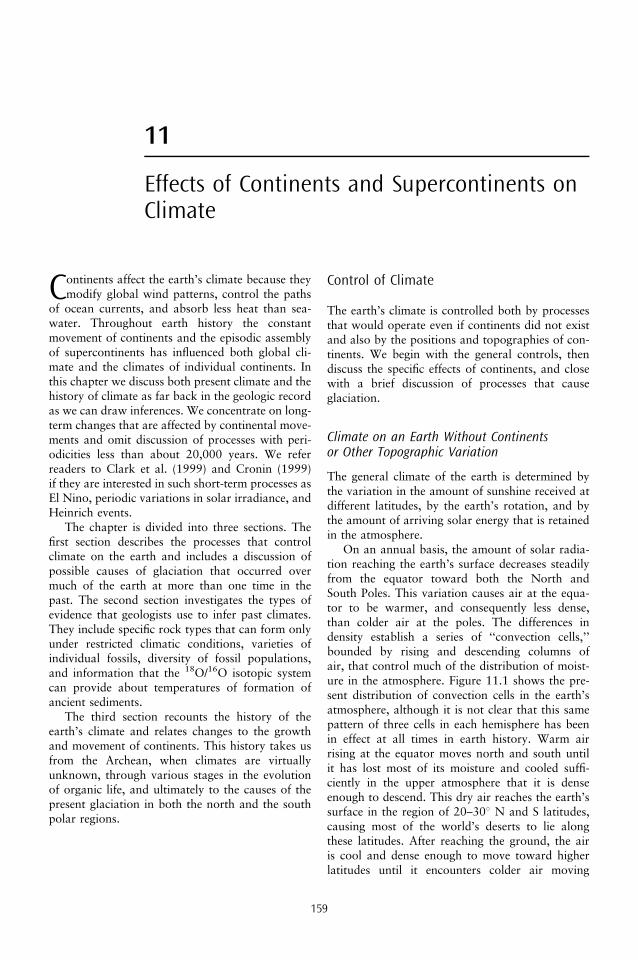
11
Effects of Continents and Supercontinents onClimate
Continents affect the earth’s climate because theymodify global wind patterns, control the paths
of ocean currents, and absorb less heat than sea-water. Throughout earth history the constantmovement of continents and the episodic assemblyof supercontinents has influenced both global cli-mate and the climates of individual continents. Inthis chapter we discuss both present climate and thehistory of climate as far back in the geologic recordas we can draw inferences. We concentrate on long-term changes that are affected by continental move-ments and omit discussion of processes with peri-odicities less than about 20,000 years. We referreaders to Clark et al. (1999) and Cronin (1999)if they are interested in such short-term processes asEl Nino, periodic variations in solar irradiance, andHeinrich events.
The chapter is divided into three sections. Thefirst section describes the processes that controlclimate on the earth and includes a discussion ofpossible causes of glaciation that occurred overmuch of the earth at more than one time in thepast. The second section investigates the types ofevidence that geologists use to infer past climates.They include specific rock types that can form onlyunder restricted climatic conditions, varieties ofindividual fossils, diversity of fossil populations,and information that the 18O/16O isotopic systemcan provide about temperatures of formation ofancient sediments.
The third section recounts the history of theearth’s climate and relates changes to the growthand movement of continents. This history takes usfrom the Archean, when climates are virtuallyunknown, through various stages in the evolutionof organic life, and ultimately to the causes of thepresent glaciation in both the north and the southpolar regions.
Control of Climate
The earth’s climate is controlled both by processesthat would operate even if continents did not existand also by the positions and topographies of con-tinents. We begin with the general controls, thendiscuss the specific effects of continents, and closewith a brief discussion of processes that causeglaciation.
Climate on an Earth Without Continentsor Other Topographic Variation
The general climate of the earth is determined bythe variation in the amount of sunshine received atdifferent latitudes, by the earth’s rotation, and bythe amount of arriving solar energy that is retainedin the atmosphere.
On an annual basis, the amount of solar radia-tion reaching the earth’s surface decreases steadilyfrom the equator toward both the North andSouth Poles. This variation causes air at the equa-tor to be warmer, and consequently less dense,than colder air at the poles. The differences indensity establish a series of ‘‘convection cells,’’bounded by rising and descending columns ofair, that control much of the distribution of moist-ure in the atmosphere. Figure 11.1 shows the pre-sent distribution of convection cells in the earth’satmosphere, although it is not clear that this samepattern of three cells in each hemisphere has beenin effect at all times in earth history. Warm airrising at the equator moves north and south untilit has lost most of its moisture and cooled suffi-ciently in the upper atmosphere that it is denseenough to descend. This dry air reaches the earth’ssurface in the region of 20–308 N and S latitudes,causing most of the world’s deserts to lie alongthese latitudes. After reaching the ground, the airis cool and dense enough to move toward higherlatitudes until it encounters colder air moving
159
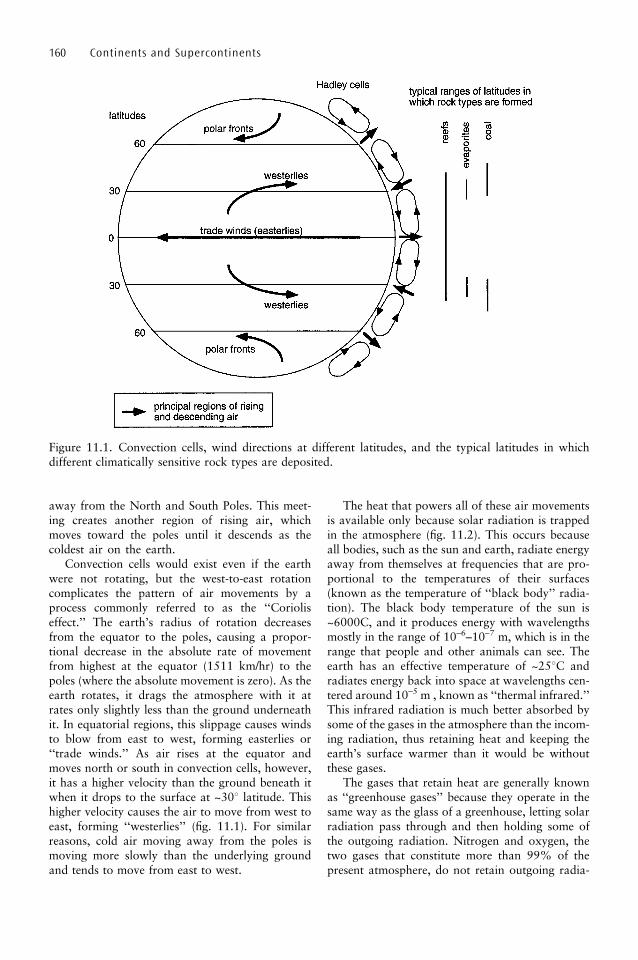
away from the North and South Poles. This meet-ing creates another region of rising air, whichmoves toward the poles until it descends as thecoldest air on the earth.
Convection cells would exist even if the earthwere not rotating, but the west-to-east rotationcomplicates the pattern of air movements by aprocess commonly referred to as the ‘‘Corioliseffect.’’ The earth’s radius of rotation decreasesfrom the equator to the poles, causing a propor-tional decrease in the absolute rate of movementfrom highest at the equator (1511 km/hr) to thepoles (where the absolute movement is zero). As theearth rotates, it drags the atmosphere with it atrates only slightly less than the ground underneathit. In equatorial regions, this slippage causes windsto blow from east to west, forming easterlies or‘‘trade winds.’’ As air rises at the equator andmoves north or south in convection cells, however,it has a higher velocity than the ground beneath itwhen it drops to the surface at ~308 latitude. Thishigher velocity causes the air to move from west toeast, forming ‘‘westerlies’’ (fig. 11.1). For similarreasons, cold air moving away from the poles ismoving more slowly than the underlying groundand tends to move from east to west.
The heat that powers all of these air movementsis available only because solar radiation is trappedin the atmosphere (fig. 11.2). This occurs becauseall bodies, such as the sun and earth, radiate energyaway from themselves at frequencies that are pro-portional to the temperatures of their surfaces(known as the temperature of ‘‘black body’’ radia-tion). The black body temperature of the sun is~6000C, and it produces energy with wavelengthsmostly in the range of 10–6–10–7 m, which is in therange that people and other animals can see. Theearth has an effective temperature of ~258C andradiates energy back into space at wavelengths cen-tered around 10–5 m , known as ‘‘thermal infrared.’’This infrared radiation is much better absorbed bysome of the gases in the atmosphere than the incom-ing radiation, thus retaining heat and keeping theearth’s surface warmer than it would be withoutthese gases.
The gases that retain heat are generally knownas ‘‘greenhouse gases’’ because they operate in thesame way as the glass of a greenhouse, letting solarradiation pass through and then holding some ofthe outgoing radiation. Nitrogen and oxygen, thetwo gases that constitute more than 99% of thepresent atmosphere, do not retain outgoing radia-
160 Continents and Supercontinents
Figure 11.1. Convection cells, wind directions at different latitudes, and the typical latitudes in whichdifferent climatically sensitive rock types are deposited.

tion, and the principal greenhouse gases consist ofwater, CO2, and CH4. The combination of solarradiation and atmospheric absorption keep the sur-face temperature of the present earth at ~25C, but itmay have been very different in the past. One pos-sible variable is the radiation output of the sun,with many solar astronomers proposing that thissolar ‘‘irradiance’’ (‘‘luminosity’’) has steadilyincreased from ~75% of its present value at thetime the earth coalesced at about 4.5 Ga (Kuhn etal., 1989).
The principal reason for long-term variation insurface temperature probably is changes in the con-
centrations of greenhouse gases in the atmosphere.In the present atmosphere, O2 reacts with CH4 toform H2O and CO2 at such a fast rate that theaverage methane molecule released into the atmo-sphere remains for fewer than 10 years. Before freeoxygen began to accumulate in the atmosphere at~2 Ga, CH4 may have been a major component ofthe atmosphere, thus keeping the earth warmerthan it is now. Another greenhouse gas that mayhave been much more abundant in the early earththan it is now is CO2, which is known to be a majorcomponent of the atmosphere of Venus. Since 2 Ga,the principal variation in the concentrations ofgreenhouse gases has presumably been changes inthe abundance of CO2.
In addition to the long-term changes in theearth’s temperature, short-term cyclical variationsresult from irregularities in the earth’s orbit aroundthe sun (fig. 11.3). These orbital effects are referredto as ‘‘Croll–Milankovitch cycles’’ and have threecomponents. Slight changes in the shape of theearth’s orbit, referred to as its ‘‘ellipticity,’’ have amajor periodicity of ~100,000 years. The angle thatthe earth’s axis makes with its orbital plane (its‘‘obliquity’’) varies through an angle of ~38 with aperiodicity of ~41,000 years, and the rotational axisalso moves with an approximately circular motion,forming cycles of ‘‘precession’’ with periodicities of~23,000 years and ~19,000 years. Further informa-tion is provided by Clark et al. (1999) and Cronin(1999).
Orbital variations cause cyclical changes in theamount of solar radiation that reaches the earth.One principal effect is cyclical advance and retreatof glaciers during long periods of glaciation, caus-
Continents and Climate 161
Figure 11.2. Greenhouse effect resulting fromdifferent wavelengths of incoming and outgoingradiation on the earth’s surface.
Figure 11.3. Orbital variations.
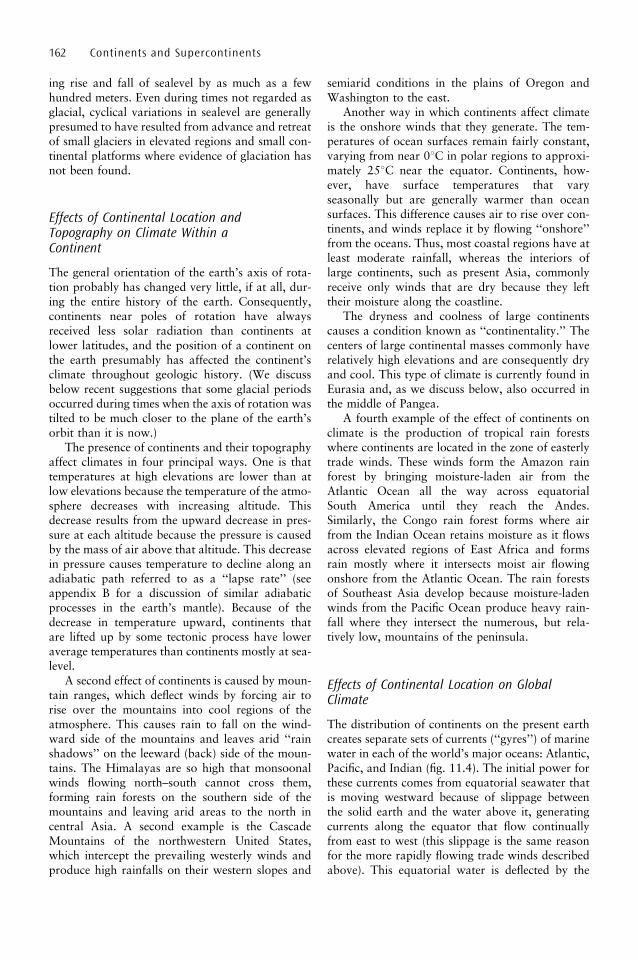
ing rise and fall of sealevel by as much as a fewhundred meters. Even during times not regarded asglacial, cyclical variations in sealevel are generallypresumed to have resulted from advance and retreatof small glaciers in elevated regions and small con-tinental platforms where evidence of glaciation hasnot been found.
Effects of Continental Location andTopography on Climate Within aContinent
The general orientation of the earth’s axis of rota-tion probably has changed very little, if at all, dur-ing the entire history of the earth. Consequently,continents near poles of rotation have alwaysreceived less solar radiation than continents atlower latitudes, and the position of a continent onthe earth presumably has affected the continent’sclimate throughout geologic history. (We discussbelow recent suggestions that some glacial periodsoccurred during times when the axis of rotation wastilted to be much closer to the plane of the earth’sorbit than it is now.)
The presence of continents and their topographyaffect climates in four principal ways. One is thattemperatures at high elevations are lower than atlow elevations because the temperature of the atmo-sphere decreases with increasing altitude. Thisdecrease results from the upward decrease in pres-sure at each altitude because the pressure is causedby the mass of air above that altitude. This decreasein pressure causes temperature to decline along anadiabatic path referred to as a ‘‘lapse rate’’ (seeappendix B for a discussion of similar adiabaticprocesses in the earth’s mantle). Because of thedecrease in temperature upward, continents thatare lifted up by some tectonic process have loweraverage temperatures than continents mostly at sea-level.
A second effect of continents is caused by moun-tain ranges, which deflect winds by forcing air torise over the mountains into cool regions of theatmosphere. This causes rain to fall on the wind-ward side of the mountains and leaves arid ‘‘rainshadows’’ on the leeward (back) side of the moun-tains. The Himalayas are so high that monsoonalwinds flowing north–south cannot cross them,forming rain forests on the southern side of themountains and leaving arid areas to the north incentral Asia. A second example is the CascadeMountains of the northwestern United States,which intercept the prevailing westerly winds andproduce high rainfalls on their western slopes and
semiarid conditions in the plains of Oregon andWashington to the east.
Another way in which continents affect climateis the onshore winds that they generate. The tem-peratures of ocean surfaces remain fairly constant,varying from near 08C in polar regions to approxi-mately 258C near the equator. Continents, how-ever, have surface temperatures that varyseasonally but are generally warmer than oceansurfaces. This difference causes air to rise over con-tinents, and winds replace it by flowing ‘‘onshore’’from the oceans. Thus, most coastal regions have atleast moderate rainfall, whereas the interiors oflarge continents, such as present Asia, commonlyreceive only winds that are dry because they lefttheir moisture along the coastline.
The dryness and coolness of large continentscauses a condition known as ‘‘continentality.’’ Thecenters of large continental masses commonly haverelatively high elevations and are consequently dryand cool. This type of climate is currently found inEurasia and, as we discuss below, also occurred inthe middle of Pangea.
A fourth example of the effect of continents onclimate is the production of tropical rain forestswhere continents are located in the zone of easterlytrade winds. These winds form the Amazon rainforest by bringing moisture-laden air from theAtlantic Ocean all the way across equatorialSouth America until they reach the Andes.Similarly, the Congo rain forest forms where airfrom the Indian Ocean retains moisture as it flowsacross elevated regions of East Africa and formsrain mostly where it intersects moist air flowingonshore from the Atlantic Ocean. The rain forestsof Southeast Asia develop because moisture-ladenwinds from the Pacific Ocean produce heavy rain-fall where they intersect the numerous, but rela-tively low, mountains of the peninsula.
Effects of Continental Location on GlobalClimate
The distribution of continents on the present earthcreates separate sets of currents (‘‘gyres’’) of marinewater in each of the world’s major oceans: Atlantic,Pacific, and Indian (fig. 11.4). The initial power forthese currents comes from equatorial seawater thatis moving westward because of slippage betweenthe solid earth and the water above it, generatingcurrents along the equator that flow continuallyfrom east to west (this slippage is the same reasonfor the more rapidly flowing trade winds describedabove). This equatorial water is deflected by the
162 Continents and Supercontinents

same Coriolis effect that controls wind movements,and in the North Atlantic this process creates anortheasterly flowing current that brings warmwater around the north coast of Europe and asoutherly return flow along the west coast. A simi-lar current in the South Atlantic brings warm watersouthward along the east coast of South America,and the return flow along the coast of southwesternAfrica carries water so cold that onshore windsproduce so little rain that the area is a desert.
Currents similar to those in the Atlantic Oceanalso form in both hemispheres of the Pacific Ocean.Both of them bring cold water along the west coastsof North and South America, with the current flow-ing northward along South America mixing withenough Antarctic water that it is so cold that itforms the same type of deserts as in southwesternAfrica. The Indian Ocean is almost wholly in thesouthern hemisphere and has only the one majorconvection cell shown in fig. 11.4.
Water in the three major oceans of the presentearth now meets only in the Antarctic (Southern)Ocean. This water continually circulates from westto east around the Antarctic continent, thus isolat-ing it from warm water generated in the otheroceans. We discuss below that Antarctica becameglaciated only when the separation of SouthAmerica and the Antarctic Peninsula allowed thisisolation to occur at 30–25 Ma.
The positions of continents also affect globalclimate because of their ability to reflect solar radia-tion back into the atmosphere more effectively than
ocean water, which tends to absorb radiation (i.e.,land has a higher ‘‘albedo’’ than water). Because ofthis difference, global temperatures were probablylower in the past when continents were clusterednear the equator than when they were broadlydistributed or mostly in polar positions. This gen-eral cooling may have slightly reduced the hightemperatures that land surfaces would have hadbecause of their equatorial position.
Possible Origins of Glacial Periods
During the past 2 million years, glaciation hasclearly resulted from the position of the Antarcticover the South Pole, the proximity of NorthAmerica and Europe to the North Pole, and thepresence of high mountains that permit glaciationeven in low latitudes. Ancient periods of glaciationmay also have resulted from the presence of highmountains and the polar position of continents, butalternative explanations have recently been pro-posed. The three most widely known are a highobliquity of the earth in its orbit, a complete cover-ing of the earth by ice when atmospheric CO2
concentrations were very low, and formation ofglaciers in orogenic belts and along uplifted riftmargins developed during the breakup of super-continents.
At present the earth’s obliquity (see above) is23.58, causing the Tropics of Cancer andCapricorn to be located at 23.58 north and south,
Continents and Climate 163
Figure 11.4. Major oceanic circulation on the present earth.

respectively, and the Arctic and Antarctic Circles at66.58 north and south. Some investigators haveproposed that the obliquity may have been muchhigher than 23.58 in the past (Williams, 1993). Thishigher value would have significantly changed theamount of solar radiation that the earth received atdifferent latitudes. At the present low obliquity, theamount of radiation received declines continuallyfrom the equator to the poles. At high obliquity,however, the annual average radiation would havebeen almost constant at all latitudes. If the obliquityhad been as high as 908 (axis of rotation in theplane of the orbit), polar regions would each havereceived six months of intense sunlight, with equa-torial regions receiving only weak radiationthroughout the year. In this situation, glaciationwould have been more likely along the equatorthan near the poles.
The idea of a ‘‘snowball earth’’ (complete icecover) was developed by several investigators, ori-ginally to explain Neoproterozoic glaciation thatpreceded the Cambrian development of skeletalorganisms (chapter 12; Kirschvink, 1992;Hoffman et al., 1998; Hoffman and Schrag,2002). The concept arose from presumed observa-tions that continental (low-altitude) glaciationoccurred simultaneously in several regions thatpaleomagnetic data showed were in low latitudes.The process envisions initial development of partialice cover, which reflects solar radiation back intospace (increases the earth’s albedo). As less radia-tion reaches the earth, the ice cover expands even-tually to cover the entire earth, both on continentsand on ocean surface. The end of total ice covercomes only when volcanic outgassing releasesenough CO2 into the atmosphere to warm theearth back to normal temperatures. The cycle ofonset of a snowball earth and return to normalclimate may last about 15 million years, indicatingthat periods of glaciation as long as 200 millionyears in the Paleoproterozoic and Neoproterozoic(see below) required repeated cycles of snowballearth development and disappearance.
During periods of ice cover, normal life on earthshould slow down because of the decrease in photo-synthesis, and organic carbon should be buried incomparatively ‘‘dead’’ oceans. This possibility issupported by the observation that �13C values arehigh in oceanic sediments deposited at this timebecause of the removal of organic carbon rich in12C (further discussion in chapter 12). Further sup-port comes from the observation that some glacialsediments are covered by ‘‘cap carbonates’’ thatformed when warmer temperatures released anabundance of CO2 into the atmosphere and oceans.
The proposal of a snowball earth has significantsupport, but many people oppose it. We note herethat the proposal is valid only if: 1) paleomagneticdata indicating glaciation at low latitude are valid;2) the glaciations can be shown to have occurred atlow elevations; and 3) the glaciations can be shownto have been nearly synchronous around the world.Thus far, all of these requirements have beenstrongly challenged, and we discuss them brieflyin our section on Neoproterozoic glaciation below.
Control of glaciation largely by tectonics wasproposed by Eyles (1993). The concept was basedpartly on the distribution of 800–600-Ma glacialepisodes along the margins of Rodinia (chapter 7).Because many rifted continental margins areuplifted (chapter 2), high elevations along thesemargins could have created glacial conditionsregardless of the latitude where they occurred.Other glaciers may have formed where compres-sional orogeny created high mountains. We con-sider these concepts further in our discussion ofthe history of climate below.
Methods for Inferring Past Climates
Inferring past climates becomes more difficult as theage being investigated increases (more completediscussion in Cronin, 1999). Some varieties ofrocks can be deposited only under specific climaticconditions. Fossils that are similar to modern onescan be assumed to have lived in similar habitats, butancient fossils that have no living relatives are lesseasily placed. Because of the scarcity or absence offossils, Precambrian climates must be inferred fromother types of evidence. Concentrations of stableisotopes, particularly 18O, are partly controlled bytemperature, providing an opportunity to infer con-ditions of formation of ancient rocks.
Special Types of Rocks
Numerous rock types provide information aboutthe climates under which they were deposited, andhere we discuss the four that are most widely used.
Reefs develop where calcareous animals arecemented together by calcareous (‘‘coralline’’)algae. They form a solid mass that grows upwardas either the sealevel rises or the reef subsides.Because all of the organisms live only in seawaterand the algae need light for photosynthesis, reefsgrow at sealevel and at latitudes that are lowenough to provide adequate sunlight (fig. 11.1).The highest-latitude reefs at present are in
164 Continents and Supercontinents

Bermuda, at 338N, but it is possible that reefgrowth occurred at higher latitudes during timeswhen the whole earth was warmer than it is now.
Reefs similar to present ones did not exist untilthe Phanerozoic because of the absence of skeletalorganisms. Similar types of structures, known as‘‘stromatolites,’’ have been created by cyanobac-teria since the Early Archean, but because of theability of primitive bacteria to live in a wide rangeof temperatures they cannot be used as climateindicators (chapter 12).
Coal forms wherever trees, leaves, and othervegetative organic matter accumulate in thickmasses that are later buried, compressed, andheated (L. Thomas, 2002). The compression andheating drive volatiles away from the organic mat-ter and leave a carbon-rich residue that constitutesone of the several varieties of coal. Although thisaccumulation can occur at many geographic loca-tions and over a broad range of latitudes (fig. 11.1),most of the world’s coal resources were formed incoastal swamps during repeated incursions andwithdrawals of seawater. Many of these depositscontain the remains of broad-leafed plants thatapparently flourished in temperate latitudes, butcoal developed over a broader range of latitudesin the Late Paleozoic (see below). Coal did not formuntil the development of land plants in the Silurian,with the oldest major coal deposits developing inthe Late Carboniferous (Pennsylvanian).
Evaporites develop where large quantities of sea-water can flow into a basin and continually evapo-rate (Warren, 1999). This replenishment is requiredin order to form thick sequences because of the lowpercentage of dissolved salts in seawater, and it canoccur only under special tectonic and climatic con-ditions. Small deposits in environments such asplaya lakes can develop at any latitude, but basin-wide deposits generally form only in arid regionsnear 20–308 latitude (fig. 11.1). These large evapor-ite suites precipitate both in continually subsidingbasins on continental platforms, such as thePermian deposits of west Texas, and in isolatedbasins formed along orogenic belts, such as theMiocene evaporites in the Mediterranean.
Evaporites similar to modern ones have formedonly since the Neoproterozoic (A. Stewart, 1979).The oldest evaporites are exclusively sulfate (anhy-drite and gypsum), and no salt deposits older thanCambrian have ever been found (Knauth, 1998).The absence of salt in Precambrian rocks may bethe result of the ease of solution and removal of saltfrom original deposits, but it is also possible thatPrecambrian oceans were dominated by Na2CO3
instead of NaCl and did not deposit salt.
Both continental ice sheets and valley glaciersleave numerous types of evidence of their formerexistence. Much of the present topography ofnorthern North America and Europe was producedby glaciers, including geomorphic features such asmoraines and U-shaped valleys and minor effectssuch as sub-glacial scour marks (striations). Manyrocks deposited by glaciers are ‘‘tillites’’ that consistof angular (unrounded) fragments ranging fromlarge boulders to fine clay (fig. 11.5). Tillites occurin moraines and in deposits that are more widelydistributed. In addition, glacial deposits includeoutwash plains, with angular gravel to silt, andvarved sediment deposited in periglacial lakes.One rock type that is regarded as particularly asso-ciated with glaciers is ‘‘dropstone’’ deposits (fig.11.6). Dropstones form where ice containing largepieces of glacial debris floats over deep water anddrops its load when the ice melts.
Most of the rocks deposited by glaciers are dif-ficult to distinguish from those formed in otherenvironments (Eyles, 1993). Chaotic deposits ofmoraines are similar to landslide debris or sub-aqueous debris flows, distal deposits of streamsoriginating in high mountains may look like thegravels of outwash plains, and varves can developin nonglacial lakes. These similarities make it diff-icult to recognize ancient periods of glaciationunless the deposits are associated with dropstonesor contain boulders and cobbles that show glacialstriations or glacial faceting.
Rocks deposited by valley and continentalglaciers are broadly similar, but the source ofPleistocene deposits can generally be distinguishedby their relationships to modern topography.Ancient periods of glaciation, however, can berecognized only by glacial deposits, and the distinc-tion between valley glaciation and continental gla-ciation is commonly difficult to make in outcrops oflimited extent. This difficulty causes problems indistinguishing whether an ancient glacial episodeoccurred at low elevations over a broad continentalarea or only at high elevations in mountains, lead-ing to arguments about the latitude at which glacia-tion occurred (see below).
Fossils
The climatic ranges of modern animals and plantsare sufficiently well known that they can be used toinfer climates in which sediments were deposited upto 100 million years ago (possibly older). Modernorganisms now living on some part of a continentcan be compared with fossils in underlying sedi-
Continents and Climate 165

ments, thus yielding a record of climatic changesthat may have been caused by movement of thecontinent across latitudes. A prime example is theuse of fossils to demonstrate the general northwardmovement of North America and Europe during theCenozoic.
Determination of paleoclimates is more difficultfor old fossils that do not have close living relatives.For animals, one general principle is that species
diversity of a fossil assemblage is higher in lowlatitudes than in high latitudes. By contrast, thenumber of individuals of a single species preservedin a fossil assemblage is commonly higher in highlatitudes. Another distinction can commonly bemade for shelled organisms, such as bivalves andgastropods, because shells in low latitudes generallyhave more ornamentation than the simple shells oforganisms that live at high latitudes.
166 Continents and Supercontinents
Figure 11.5. Typical glacial tillite (photograph by Nick Eyles). Reproduced from Eyles, N., andJanuszczak, N., Interpreting the Neoproterozoic glacial record; the importance of tectonics, in press.American Geophysical Union Monograph. Copyright 2004 American Geophysical Union. Reproduced bypermission of American Geophysical Union.
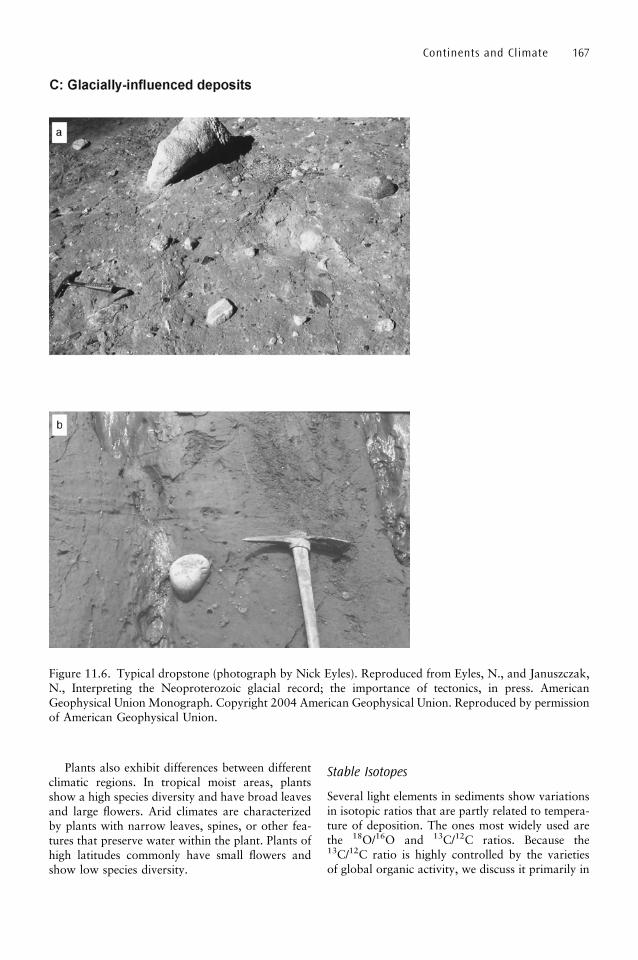
Plants also exhibit differences between differentclimatic regions. In tropical moist areas, plantsshow a high species diversity and have broad leavesand large flowers. Arid climates are characterizedby plants with narrow leaves, spines, or other fea-tures that preserve water within the plant. Plants ofhigh latitudes commonly have small flowers andshow low species diversity.
Stable Isotopes
Several light elements in sediments show variationsin isotopic ratios that are partly related to tempera-ture of deposition. The ones most widely used arethe 18O/16O and 13C/12C ratios. Because the13C/12C ratio is highly controlled by the varietiesof global organic activity, we discuss it primarily in
Continents and Climate 167
Figure 11.6. Typical dropstone (photograph by Nick Eyles). Reproduced from Eyles, N., and Januszczak,N., Interpreting the Neoproterozoic glacial record; the importance of tectonics, in press. AmericanGeophysical Union Monograph. Copyright 2004 American Geophysical Union. Reproduced by permissionof American Geophysical Union.
chapter 12, and here we consider only 18O/16Oratios.
Isotopes of all elements fractionate during geo-logic processes. For heavy isotopes the difference inmasses between two isotopes (e.g., 235U and 238U) isso small that the fractionation is not noticeable. Forlight elements, however, the mass difference is largeenough to cause significant differences between dif-ferent phases. Thus, the difference in masses of 18Oand 16O is more than 10% of the mass of eachisotope, leading to major fractionation duringchemical reactions.
Determination of paleoclimates generallydepends on the relationships between water andsediments deposited from it. These relationshipsare commonly measured in terms of the differencesbetween 18O/16O ratios in sediments and the ratioin modern seawater (referred to as SMOW, orstandard mean ocean water). These differencesare recorded as �18O, calculated as
�18O ¼ 1000� ð18O=16Orock
�18 O=16OSMOWÞ=18O=16OSMOW
Fractionation of 18O and 16O occurs duringseveral processes. Evaporation removes more ofthe light isotope from seawater, leading to lower18O/16O ratios in atmospheric moisture than inseawater. This further leads to low ratios in rain,snow, ice, and all freshwater, and the preferentialretention of 16O in glacial ice permits �18O toincrease in seawater and fossils equilibrated withit during periods of glaciation and to decrease whenglacial ice melts and flows back into the ocean.
Oxygen isotopes also fractionate when solidsprecipitate from water, either directly or by biolo-gical construction of the skeletal parts of organisms.In these reactions, 18O is preferentially incorporatedinto the solids, with different degrees of fractiona-tion for different minerals, such as calcite, arago-nite, silica, etc. This fractionation makes �18O of allsolids positive compared to �18O defined as zero forseawater. The degree of fractionation between allsolids and seawater depends on temperature, withhigher temperatures causing less fractionation. Weuse this relationship below to infer temperatures ofancient oceans.
History of the Earth’s Climate and theEffects of Continents andSupercontinents
As with most of the topics considered in this book,our information about the earth’s climate is less
clear as the age that we discuss increases. In thissection we start with the very limited informationavailable for the Archean and proceed to a sum-mary of the more detailed knowledge available forthe Cenozoic.
Archean
The only organisms alive in the Archean were bac-teria (chapter 12), and they provide virtually noinformation about climate. Modern bacteria, parti-cularly the primitive Archaea, can live in coldAntarctic lakes and water boiling in geysers (chap-ter 12), and their Archean counterparts presumablycould have existed under similar temperatureranges. Consequently, the traces of filamentousalgae in chert and the stromatolites built by cyano-bacteria (blue-green algae) merely demonstrate thatliquid water existed on the earth’s surface in theArchean because the surface temperature wasbetween the freezing and boiling points.
The possibility that Archean temperatures werehigh because of high concentrations of CO2 in theatmosphere is suggested by the scarcity of organ-isms that could precipitate calcite and the scarcity oflimestones in Archean sediments (see discussion ofgreenstone belts in chapter 4). A partial confirma-tion of this high temperature comes from studies of18O/16O ratios in 3.5-Ga cherts in the Kaapvaalcraton of southern Africa (Knauth and Lowe,2003; chapter 4). They found �18O of these chertsranging from +11 to +20, compared to rangesof Phanerozoic cherts from +20 to +35. Because �18
O decreases with increasing temperature (seeabove), these low values suggest very high tempera-tures of the Archean ocean, probably in the range of55–858C.
If temperatures were extremely high at 3.5 Ga,they may have decreased by 2.8 Ga. Two investiga-tions suggest that glaciation occurred in theKaapvaal craton at this time (Young et al., 1998;Modie, 2002). The evidence is controversial, but ifglaciation did occur, it seems impossible for tem-peratures of surface water anywhere on the earth tohave been much higher than they are at present.The cause of glaciation is also unclear because thelatitude of the Kaapvaal craton at 2.8 Ga is com-pletely unknown.
Paleoproterozoic
Paleoproterozoic life provides no more informationabout the earth’s climate than Archean life. Animportant indication that Paleoproterozoic surface
168 Continents and Supercontinents

temperatures were similar to the present is evidenceof glaciation in the Canadian shield, Baltica, theKaapvaal craton of southern Africa, and westernAustralia during a 200-million-year period fromapproximately 2.4–2.2 Ga (Eyles, 1993; Martin,1999; Bekker et al., 2001; Young, 2002).
The causes of Paleoproterozoic glaciation arecontroversial. Evans et al. (1997) used paleomag-netic information to propose that the glaciationsoccurred at low latitudes and were caused by devel-opment of a snowball earth. The supercontinentthat Piper (2003) suggested to have existed in thePaleoproterozoic also placed North America in lowlatitudes but indicated a high-latitude location ofAustralia and southern Africa (chapter 7). Eyles(1993) attributed glaciation in North America toformation of glaciers at high elevations on upliftedrift flanks formed during incipient breakup ofKenorland (chapter 6), which could have occurredat any latitude.
Mesoproterozoic
The Mesoproterozoic atmosphere was clearly dif-ferent from the atmosphere that had existed before~2 Ga. Deposition of red beds instead of bandediron formations demonstrate the presence of freeoxygen, which would have kept the CH4 contentextremely low. Thus, the only greenhouse gaswhose concentration could vary significantly wasCO2. Except for a presumably very low concen-tration of O2, the Mesoproterozoic atmosphereprobably was similar to that of the modern earth.
Unfortunately, virtually no information is avail-able about the climate of the Mesoproterozoic.Lithologic indicators such as coal and reefs didnot exist at that time, evaporites are rare and notsimilar to Phanerozoic varieties (see above), and noglacial deposits have been found. The absence ofglaciation can be explained in at least three ways.
One explanation is simply that glaciation existedbut the evidence has been destroyed by later ero-sion. A second possibility is that the global climatewas too warm because solar irradiance hadincreased since the Paleoproterozoic and atmo-spheric CO2 had not decreased enough to permitglaciation. The third possibility involves the sizeand orientation of the supercontinent Columbia(chapter 7).
Although one proposed configuration ofColumbia is similar to that of Pangea, Columbiamay not have extended into latitudes high enoughto cause glaciation. Using very limited paleomag-netic information, Meert (2002) proposed that
Columbia at 1.5 Ga was primarily located in equa-torial and temperate latitudes, although a preferredlocation of North America at 1.77 Ga was over theSouth Pole. Even if Columbia had a north–southorientation, it was smaller than Pangea and may nothave extended into either the north or south polarregions.
Neoproterozoic
Neoproterozoic climates are dominated by a seriesof glaciations that occurred between ~800 Ma and~550 Ma. Although glaciation probably occurredalmost continuously at different places throughoutthis time interval, conventional classifications dividethe glacial periods into Sturtian from 750–700 Ma,Marinoan–Vendian from 625–580 Ma, and Sinianfrom 600–550 Ma. All of these glaciations occurredduring the breakup of Rodinia, and younger oneswere associated with the assembly of Gondwana. Inaddition to the lithologic evidence of glaciation atvarious locations, the effects of glaciation are foundin nonglacial sediments deposited during variationsin sealevel caused by Croll–Milankovitch cyclicaladvances and retreats of continental glaciers(Dehler et al., 2001).
The concepts of glaciation because of a snowballearth or high obliquity of the earth’s axis originallydeveloped from studies of Neoproterozoic glacia-tion. These explanations are opposed to the con-ventional explanations that glaciation occurs athigh latitudes or at any latitude where elevationsare sufficiently high. Distinction between these pro-posals must be based on the locations of the glacia-tions shown in fig. 11.7, which shows the locationsand approximate ages of the major glaciations.
Eyles (1993) proposed that the major Neo-proterozoic glaciations occurred where tectonic pro-cesses created high elevations regardless of latitude.This explanation signifies that the glacial depositswere formed predominantly by valley glaciersinstead of broad continental ice sheets. Some earlyglaciation in South America and part of West Africawas attributed to formation of mountains duringcompressive orogeny between Amazonia and thecombined Congo–Sao Francisco cratons. Collisionsmay also have been responsible for glaciationthrough much of West Africa in the latest Neopro-terozoic. By contrast, the Sturtian glaciation begin-ning at ~750 Ma on the western margin of NorthAmerica (present orientation) and younger glacia-tions on the eastern margin and in Baltica may havedeveloped on uplifted rift flanks formed during thedispersal of Rodinia.
Continents and Climate 169
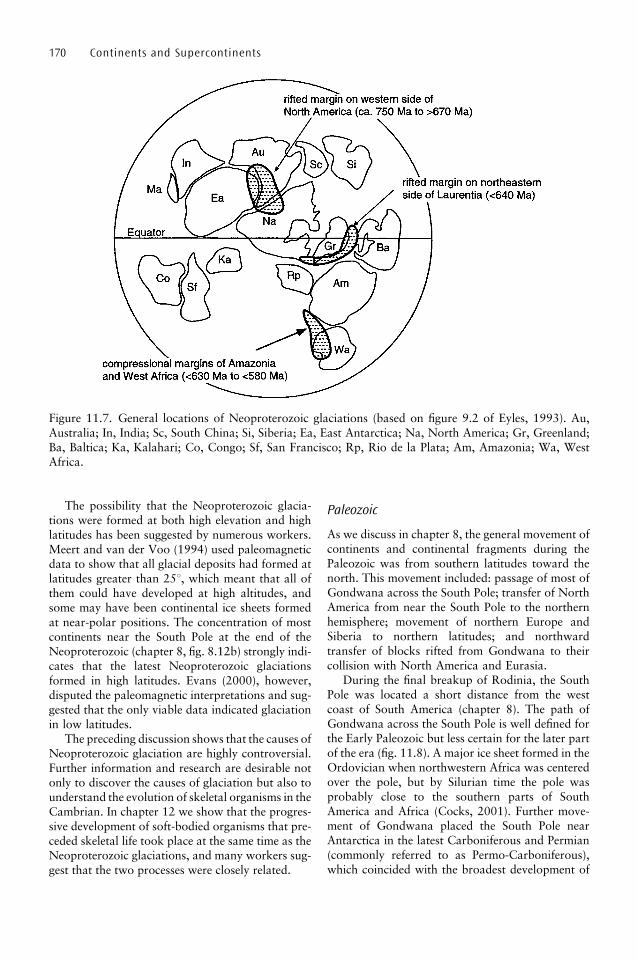
The possibility that the Neoproterozoic glacia-tions were formed at both high elevation and highlatitudes has been suggested by numerous workers.Meert and van der Voo (1994) used paleomagneticdata to show that all glacial deposits had formed atlatitudes greater than 258, which meant that all ofthem could have developed at high altitudes, andsome may have been continental ice sheets formedat near-polar positions. The concentration of mostcontinents near the South Pole at the end of theNeoproterozoic (chapter 8, fig. 8.12b) strongly indi-cates that the latest Neoproterozoic glaciationsformed in high latitudes. Evans (2000), however,disputed the paleomagnetic interpretations and sug-gested that the only viable data indicated glaciationin low latitudes.
The preceding discussion shows that the causes ofNeoproterozoic glaciation are highly controversial.Further information and research are desirable notonly to discover the causes of glaciation but also tounderstand the evolution of skeletal organisms in theCambrian. In chapter 12 we show that the progres-sive development of soft-bodied organisms that pre-ceded skeletal life took place at the same time as theNeoproterozoic glaciations, and many workers sug-gest that the two processes were closely related.
Paleozoic
As we discuss in chapter 8, the general movement ofcontinents and continental fragments during thePaleozoic was from southern latitudes toward thenorth. This movement included: passage of most ofGondwana across the South Pole; transfer of NorthAmerica from near the South Pole to the northernhemisphere; movement of northern Europe andSiberia to northern latitudes; and northwardtransfer of blocks rifted from Gondwana to theircollision with North America and Eurasia.
During the final breakup of Rodinia, the SouthPole was located a short distance from the westcoast of South America (chapter 8). The path ofGondwana across the South Pole is well defined forthe Early Paleozoic but less certain for the later partof the era (fig. 11.8). A major ice sheet formed in theOrdovician when northwestern Africa was centeredover the pole, but by Silurian time the pole wasprobably close to the southern parts of SouthAmerica and Africa (Cocks, 2001). Further move-ment of Gondwana placed the South Pole nearAntarctica in the latest Carboniferous and Permian(commonly referred to as Permo-Carboniferous),which coincided with the broadest development of
170 Continents and Supercontinents
Figure 11.7. General locations of Neoproterozoic glaciations (based on figure 9.2 of Eyles, 1993). Au,Australia; In, India; Sc, South China; Si, Siberia; Ea, East Antarctica; Na, North America; Gr, Greenland;Ba, Baltica; Ka, Kalahari; Co, Congo; Sf, San Francisco; Rp, Rio de la Plata; Am, Amazonia; Wa, WestAfrica.
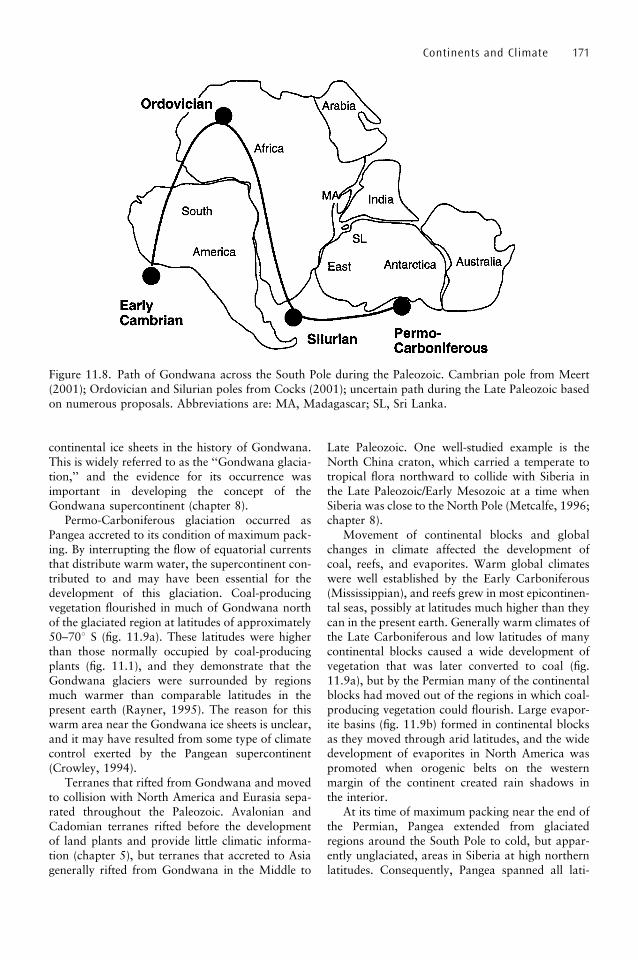
continental ice sheets in the history of Gondwana.This is widely referred to as the ‘‘Gondwana glacia-tion,’’ and the evidence for its occurrence wasimportant in developing the concept of theGondwana supercontinent (chapter 8).
Permo-Carboniferous glaciation occurred asPangea accreted to its condition of maximum pack-ing. By interrupting the flow of equatorial currentsthat distribute warm water, the supercontinent con-tributed to and may have been essential for thedevelopment of this glaciation. Coal-producingvegetation flourished in much of Gondwana northof the glaciated region at latitudes of approximately50–708 S (fig. 11.9a). These latitudes were higherthan those normally occupied by coal-producingplants (fig. 11.1), and they demonstrate that theGondwana glaciers were surrounded by regionsmuch warmer than comparable latitudes in thepresent earth (Rayner, 1995). The reason for thiswarm area near the Gondwana ice sheets is unclear,and it may have resulted from some type of climatecontrol exerted by the Pangean supercontinent(Crowley, 1994).
Terranes that rifted from Gondwana and movedto collision with North America and Eurasia sepa-rated throughout the Paleozoic. Avalonian andCadomian terranes rifted before the developmentof land plants and provide little climatic informa-tion (chapter 5), but terranes that accreted to Asiagenerally rifted from Gondwana in the Middle to
Late Paleozoic. One well-studied example is theNorth China craton, which carried a temperate totropical flora northward to collide with Siberia inthe Late Paleozoic/Early Mesozoic at a time whenSiberia was close to the North Pole (Metcalfe, 1996;chapter 8).
Movement of continental blocks and globalchanges in climate affected the development ofcoal, reefs, and evaporites. Warm global climateswere well established by the Early Carboniferous(Mississippian), and reefs grew in most epicontinen-tal seas, possibly at latitudes much higher than theycan in the present earth. Generally warm climates ofthe Late Carboniferous and low latitudes of manycontinental blocks caused a wide development ofvegetation that was later converted to coal (fig.11.9a), but by the Permian many of the continentalblocks had moved out of the regions in which coal-producing vegetation could flourish. Large evapor-ite basins (fig. 11.9b) formed in continental blocksas they moved through arid latitudes, and the widedevelopment of evaporites in North America waspromoted when orogenic belts on the westernmargin of the continent created rain shadows inthe interior.
At its time of maximum packing near the end ofthe Permian, Pangea extended from glaciatedregions around the South Pole to cold, but appar-ently unglaciated, areas in Siberia at high northernlatitudes. Consequently, Pangea spanned all lati-
Continents and Climate 171
Figure 11.8. Path of Gondwana across the South Pole during the Paleozoic. Cambrian pole from Meert(2001); Ordovician and Silurian poles from Cocks (2001); uncertain path during the Late Paleozoic basedon numerous proposals. Abbreviations are: MA, Madagascar; SL, Sri Lanka.
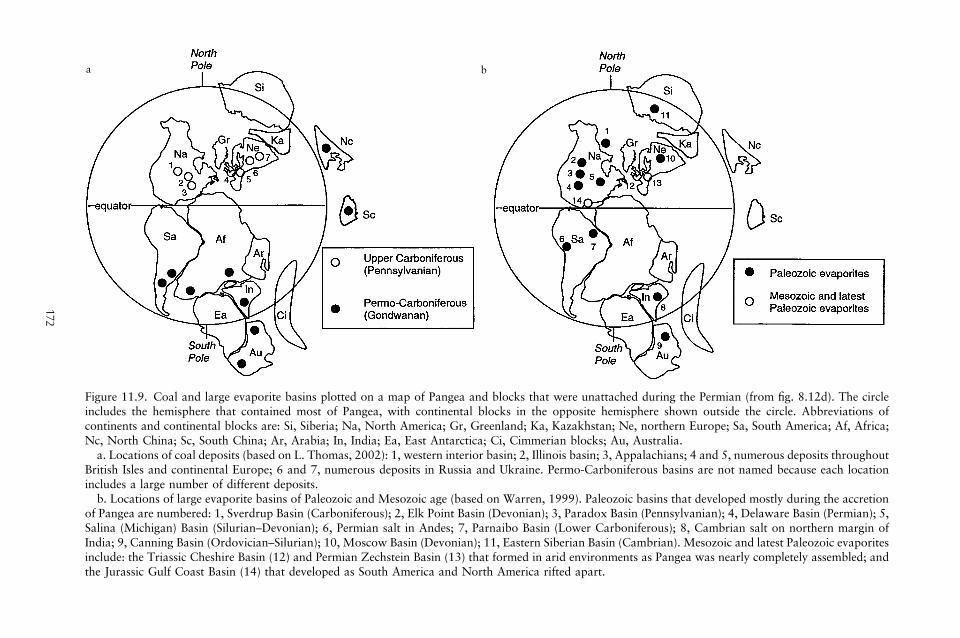
172
Figure 11.9. Coal and large evaporite basins plotted on a map of Pangea and blocks that were unattached during the Permian (from fig. 8.12d). The circleincludes the hemisphere that contained most of Pangea, with continental blocks in the opposite hemisphere shown outside the circle. Abbreviations ofcontinents and continental blocks are: Si, Siberia; Na, North America; Gr, Greenland; Ka, Kazakhstan; Ne, northern Europe; Sa, South America; Af, Africa;Nc, North China; Sc, South China; Ar, Arabia; In, India; Ea, East Antarctica; Ci, Cimmerian blocks; Au, Australia.a. Locations of coal deposits (based on L. Thomas, 2002): 1, western interior basin; 2, Illinois basin; 3, Appalachians; 4 and 5, numerous deposits throughout
British Isles and continental Europe; 6 and 7, numerous deposits in Russia and Ukraine. Permo-Carboniferous basins are not named because each locationincludes a large number of different deposits.b. Locations of large evaporite basins of Paleozoic and Mesozoic age (based on Warren, 1999). Paleozoic basins that developed mostly during the accretion
of Pangea are numbered: 1, Sverdrup Basin (Carboniferous); 2, Elk Point Basin (Devonian); 3, Paradox Basin (Pennsylvanian); 4, Delaware Basin (Permian); 5,Salina (Michigan) Basin (Silurian–Devonian); 6, Permian salt in Andes; 7, Parnaibo Basin (Lower Carboniferous); 8, Cambrian salt on northern margin ofIndia; 9, Canning Basin (Ordovician–Silurian); 10, Moscow Basin (Devonian); 11, Eastern Siberian Basin (Cambrian). Mesozoic and latest Paleozoic evaporitesinclude: the Triassic Cheshire Basin (12) and Permian Zechstein Basin (13) that formed in arid environments as Pangea was nearly completely assembled; andthe Jurassic Gulf Coast Basin (14) that developed as South America and North America rifted apart.
a b

tudes, but it did not have the range of climatesfound on the present earth. Blockage of the flowof equatorial ocean currents and the presence oforogenic belts along almost the entire western sideof Pangea created widespread arid conditions(Parrish, 1993). Permian coal is absent from almostall of Pangea and is known only in areas around theGondwana ice sheet and in Chinese continentalblocks that had not yet docked with Pangea.Permian evaporites are widespread, however,including large salt deposits in the western UnitedStates and in Europe.
Mesozoic and Cenozoic
Rifting of Pangea affected global climates andcaused climate change within individual continentalblocks as they moved to new locations during theMesozoic and Cenozoic. We discuss both of theseprocesses in this section.
The breakup of Pangea caused global warmingby permitting ocean currents to flow through thefragmented supercontinent and distribute heat moreeffectively around the earth. Warmer climates wereestablished by the Triassic and almost immediatelyreplaced glacial climates in Gondwana. Highertemperatures of the Triassic occurred even inAntarctica, which remained at high latitudes andwas probably located over the South Pole(Retallack and Alonso-Zarza, 1998).
Slightly later in the Mesozoic, ocean currentsflowed unimpeded along the entire equatorial
region of the earth (fig. 11.10). These currentsdistributed heat so effectively that the Permo-Carboniferous ice sheet in southern Gondwanaeither disappeared or was greatly reduced in size.There is no direct evidence for its continued exis-tence, but cycles of sealevel fluctuation in someMesozoic sediments suggest control of seawatervolume by advance and retreat of small ice sheetsduring Croll–Milankovitch cycles (Gale et al.,2002). A ‘‘greenhouse climate’’ was well establishedin the Cretaceous, when high sealevels were causedmostly by filling of ocean basins by spreadingcenters and partly by the lack of glaciation.
Much of the early fragmentation of Pangeaoccurred in low latitudes (chapter 9). During initialrifting of the Atlantic Ocean, reefs grew for manymillions of years along the subsiding margin ofNorth America until plate motions brought it toofar north to support reef growth. Rifting in these hotregions formed shallow marine basins that causedprecipitation of evaporites in basins now preservedon continental margins. An enormous thickness ofsalt was deposited in the area that ultimately becamethe Gulf of Mexico (fig. 11.9b; chapter 10).
Some plate motions brought continental blocksinto temperate latitudes that promoted accumula-tion of coal-producing vegetation in coastalswamps. No coal was formed in the Triassicbecause the end-Paleozoic extinction destroyedvegetation capable of ultimately producing coal,but new varieties of coal-producing vegetationhad developed by the Jurassic (chapter 12). They
Continents and Climate 173
Figure 11.10. Worldwide equatorial circulation during the Cretaceous.
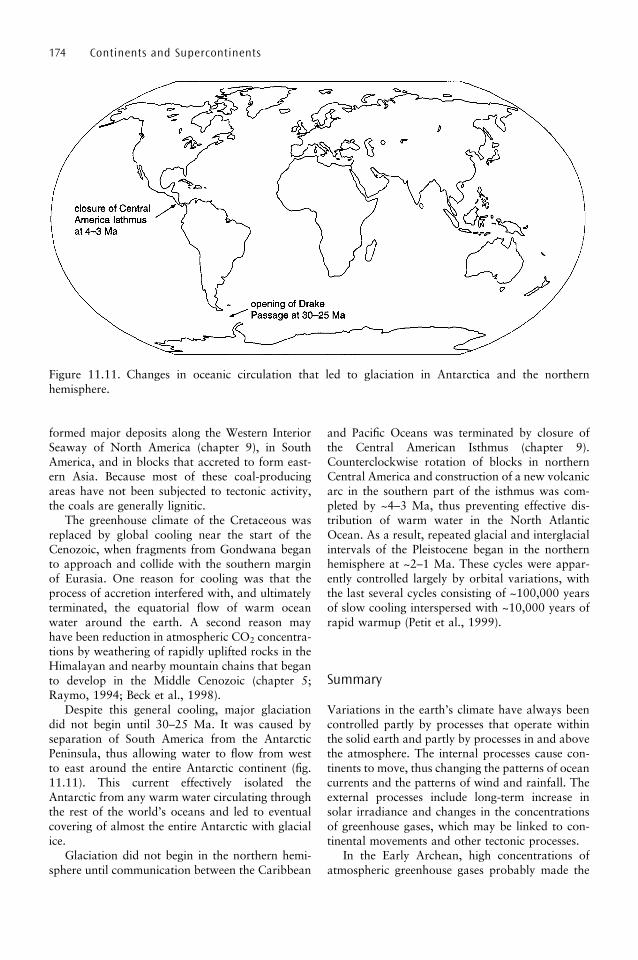
formed major deposits along the Western InteriorSeaway of North America (chapter 9), in SouthAmerica, and in blocks that accreted to form east-ern Asia. Because most of these coal-producingareas have not been subjected to tectonic activity,the coals are generally lignitic.
The greenhouse climate of the Cretaceous wasreplaced by global cooling near the start of theCenozoic, when fragments from Gondwana beganto approach and collide with the southern marginof Eurasia. One reason for cooling was that theprocess of accretion interfered with, and ultimatelyterminated, the equatorial flow of warm oceanwater around the earth. A second reason mayhave been reduction in atmospheric CO2 concentra-tions by weathering of rapidly uplifted rocks in theHimalayan and nearby mountain chains that beganto develop in the Middle Cenozoic (chapter 5;Raymo, 1994; Beck et al., 1998).
Despite this general cooling, major glaciationdid not begin until 30–25 Ma. It was caused byseparation of South America from the AntarcticPeninsula, thus allowing water to flow from westto east around the entire Antarctic continent (fig.11.11). This current effectively isolated theAntarctic from any warm water circulating throughthe rest of the world’s oceans and led to eventualcovering of almost the entire Antarctic with glacialice.
Glaciation did not begin in the northern hemi-sphere until communication between the Caribbean
and Pacific Oceans was terminated by closure ofthe Central American Isthmus (chapter 9).Counterclockwise rotation of blocks in northernCentral America and construction of a new volcanicarc in the southern part of the isthmus was com-pleted by ~4–3 Ma, thus preventing effective dis-tribution of warm water in the North AtlanticOcean. As a result, repeated glacial and interglacialintervals of the Pleistocene began in the northernhemisphere at ~2–1 Ma. These cycles were appar-ently controlled largely by orbital variations, withthe last several cycles consisting of ~100,000 yearsof slow cooling interspersed with ~10,000 years ofrapid warmup (Petit et al., 1999).
Summary
Variations in the earth’s climate have always beencontrolled partly by processes that operate withinthe solid earth and partly by processes in and abovethe atmosphere. The internal processes cause con-tinents to move, thus changing the patterns of oceancurrents and the patterns of wind and rainfall. Theexternal processes include long-term increase insolar irradiance and changes in the concentrationsof greenhouse gases, which may be linked to con-tinental movements and other tectonic processes.
In the Early Archean, high concentrations ofatmospheric greenhouse gases probably made the
174 Continents and Supercontinents
Figure 11.11. Changes in oceanic circulation that led to glaciation in Antarctica and the northernhemisphere.
earth’s surface much warmer than it is now.Temperatures apparently decreased significantlyby the end of the Archean, and glaciation occurredat several places on the earth during a period of~200 million years in the Paleoproterozoic.Mesoproterozoic atmospheres seem to have beensimilar to those at present, although a completeabsence of glaciation anywhere on the earthbetween 2200 Ma and 800 Ma suggests that world-wide warmth was caused by some combination ofincrease in solar irradiance, elevated CO2 concen-trations, and location of continental blocks in tem-perate and tropical latitudes. Neoproterozoicglaciations have been attributed to high obliquityof the earth’s axis of rotation, ice covering to form asnowball earth, formation of glaciers on rifted andcompressional margins during the fragmentation ofRodinia, and location of most continental blocksnear the South Pole.
During the Paleozoic much of Gondwana passedacross or near the South Pole. The South Pole wasapparently near Antarctica during the Permo-Carboniferous glaciation that occurred when anearly assembled Pangea blocked the equatorialflow of ocean water. Rifting of Pangea led torapid warmup as ocean currents flowed more easily,and global cooling did not begin until near the startof the Cenozoic. East Antarctica remained over theSouth Pole since the end of the Paleozoic but wasnot glaciated until 30–25 Ma, when northwardmovement of South America opened a passagethat allowed the Southern Ocean to isolateAntarctica from warm water. Cooling continuedthroughout the Cenozoic, possibly because ofincreased tectonic activity, but the Pleistoceneglaciation of the northern hemisphere did notbegin until construction of the Central AmericanIsthmus prevented exchange of water between theAtlantic and Pacific Oceans.
Continents and Climate 175
12
Effects of Continents and Supercontinents onOrganic Evolution
The earth’s organic life has changed continuallyfor more than 3.5 billion years. This evolution
may have resulted partly from environmental stressgenerated by tectonic activity within the earth andpartly from processes independent of the earth’sinterior. This chapter investigates these differenteffects in an attempt to determine the role thatcontinents played in the evolution of organisms.
Continents and tectonics associated with themmay have influenced organic evolution in bothactive and passive ways. Active effects include sev-eral processes that partly controlled the earth’s sur-face environment. Climate change was causedpartly by movements of continents and construc-tion of orogenic belts. Continental rifting increasedthe area of shallow seas as new continental marginssubsided. Changes in volume of ocean ridges andepeiric movements of continents caused marinetransgressions and regressions. Temperatures ofwater in shallow seas increased or decreased ascontinents moved across latitudes.
The major passive effects of continents andsupercontinents result from their influence on diver-sity of organisms. When continents were broadlydispersed and occupied most latitudes, as on thepresent earth, this isolation resulted in shallow-water and subaerial families that contained numer-ous genera, genera with large numbers of species,and species divided among many different varieties.This diversity was clearly smaller at times whencontinents were aggregated into a few landmassesand particularly low when supercontinents per-mitted exchange of organisms throughout most ofthe world’s land and shallow seas. During times ofmajor environmental stress, these differences wouldhave restricted extinction of organisms to localspecies and genera during times of high diversitybut might have permitted disappearance of wholeorders and classes when diversity was low.
Organic evolution was almost certainly affectedby species diversity, but it may have occurred
without any active control by tectonic processes.Although evolution probably occurs only whenchanging environments place stresses on organismsthat enhance the competition among them, it is alsopossible that competition between organisms cancause evolution even without significant environ-mental change. Furthermore, some environmentalchange probably resulted from processes that arenot related to the tectonics of the solid earth. Suchprocesses include climate change caused by varia-tions in solar irradiance, progressive modificationof the concentrations of greenhouse gases, and pos-sibly major variations in the obliquity of the earth’sorbit (further discussion in chapter 11). Anotherexternal cause of evolution may have been theimpacts of meteorites, which are referred to as‘‘bolides’’ when they explode on impact. Bolideswere probably responsible for sudden (‘‘cata-strophic’’) extinction events followed by develop-ment of completely new varieties of organisms, andimpacts of several small meteorites within a shortinterval of time may also have led to biotic changes.
We begin this chapter with a section on the waysin which the record of organisms is preserved in theearth. They include recognizable fossils and tracefossils (ichnofossils), preserved organic matter ofuncertain source, and variation in 12C/13C isotoperatios. The next section discusses whether the sizesand distributions of continents could have influ-enced various major steps in organic evolution.The final section attempts to answer the questionof the relative significance of external and internal(tectonic) processes on evolution.
Preservation of Organic Activity
The most obvious evidence of former organismsis fossils. Some shells and bones, either whole orfragmented, are preserved in their original or
176
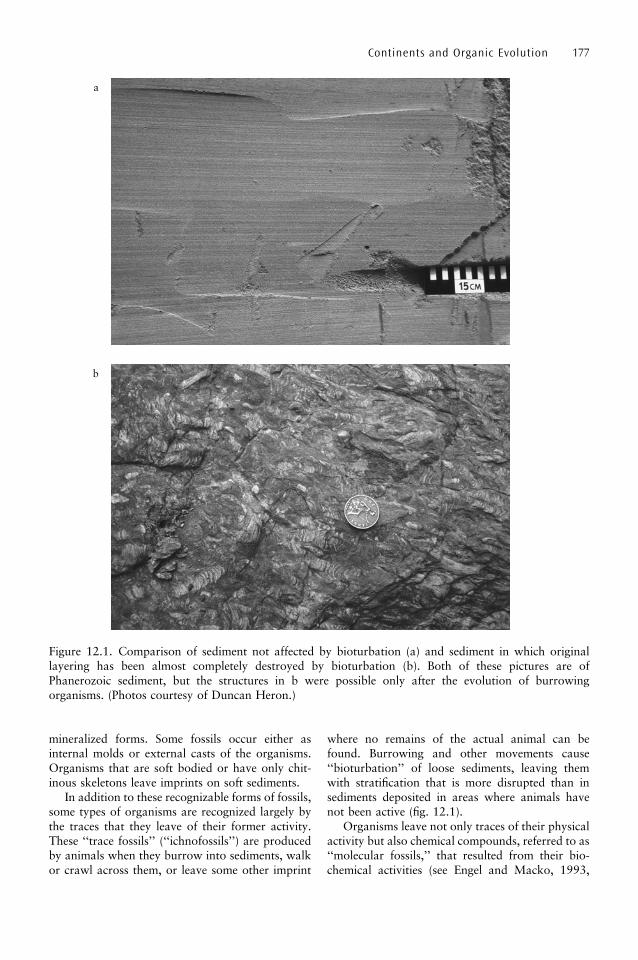
mineralized forms. Some fossils occur either asinternal molds or external casts of the organisms.Organisms that are soft bodied or have only chit-inous skeletons leave imprints on soft sediments.
In addition to these recognizable forms of fossils,some types of organisms are recognized largely bythe traces that they leave of their former activity.These ‘‘trace fossils’’ (‘‘ichnofossils’’) are producedby animals when they burrow into sediments, walkor crawl across them, or leave some other imprint
where no remains of the actual animal can befound. Burrowing and other movements cause‘‘bioturbation’’ of loose sediments, leaving themwith stratification that is more disrupted than insediments deposited in areas where animals havenot been active (fig. 12.1).
Organisms leave not only traces of their physicalactivity but also chemical compounds, referred to as‘‘molecular fossils,’’ that resulted from their bio-chemical activities (see Engel and Macko, 1993,
Continents and Organic Evolution 177
Figure 12.1. Comparison of sediment not affected by bioturbation (a) and sediment in which originallayering has been almost completely destroyed by bioturbation (b). Both of these pictures are ofPhanerozoic sediment, but the structures in b were possible only after the evolution of burrowingorganisms. (Photos courtesy of Duncan Heron.)
a
b
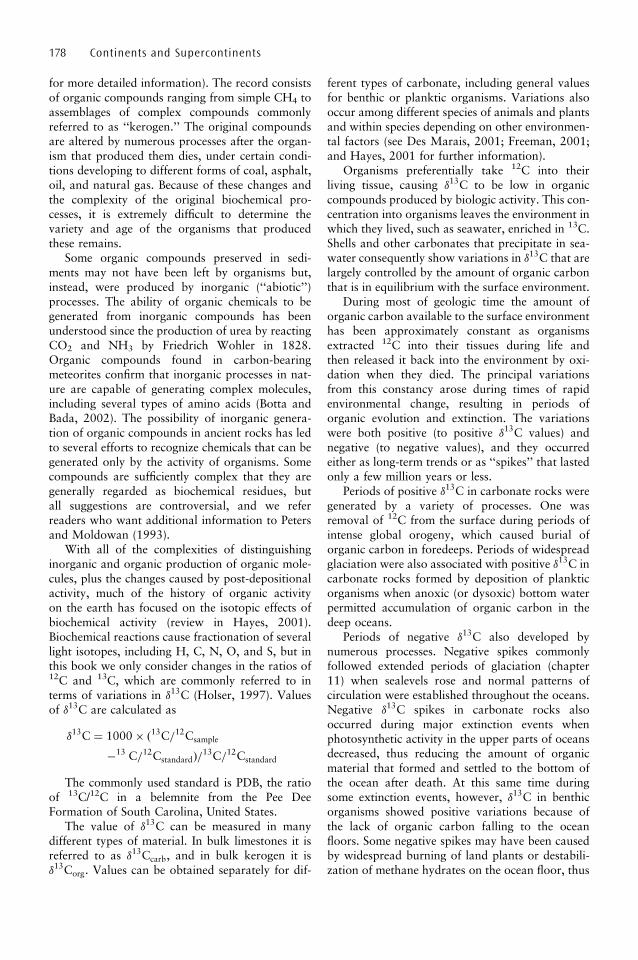
for more detailed information). The record consistsof organic compounds ranging from simple CH4 toassemblages of complex compounds commonlyreferred to as ‘‘kerogen.’’ The original compoundsare altered by numerous processes after the organ-ism that produced them dies, under certain condi-tions developing to different forms of coal, asphalt,oil, and natural gas. Because of these changes andthe complexity of the original biochemical pro-cesses, it is extremely difficult to determine thevariety and age of the organisms that producedthese remains.
Some organic compounds preserved in sedi-ments may not have been left by organisms but,instead, were produced by inorganic (‘‘abiotic’’)processes. The ability of organic chemicals to begenerated from inorganic compounds has beenunderstood since the production of urea by reactingCO2 and NH3 by Friedrich Wohler in 1828.Organic compounds found in carbon-bearingmeteorites confirm that inorganic processes in nat-ure are capable of generating complex molecules,including several types of amino acids (Botta andBada, 2002). The possibility of inorganic genera-tion of organic compounds in ancient rocks has ledto several efforts to recognize chemicals that can begenerated only by the activity of organisms. Somecompounds are sufficiently complex that they aregenerally regarded as biochemical residues, butall suggestions are controversial, and we referreaders who want additional information to Petersand Moldowan (1993).
With all of the complexities of distinguishinginorganic and organic production of organic mole-cules, plus the changes caused by post-depositionalactivity, much of the history of organic activityon the earth has focused on the isotopic effects ofbiochemical activity (review in Hayes, 2001).Biochemical reactions cause fractionation of severallight isotopes, including H, C, N, O, and S, but inthis book we only consider changes in the ratios of12C and 13C, which are commonly referred to interms of variations in �13C (Holser, 1997). Valuesof �13C are calculated as
�13C ¼ 1000� ð13C=12Csample
�13 C=12CstandardÞ=13C=12Cstandard
The commonly used standard is PDB, the ratioof 13C/12C in a belemnite from the Pee DeeFormation of South Carolina, United States.
The value of �13C can be measured in manydifferent types of material. In bulk limestones it isreferred to as �13Ccarb, and in bulk kerogen it is�13Corg. Values can be obtained separately for dif-
ferent types of carbonate, including general valuesfor benthic or planktic organisms. Variations alsooccur among different species of animals and plantsand within species depending on other environmen-tal factors (see Des Marais, 2001; Freeman, 2001;and Hayes, 2001 for further information).
Organisms preferentially take 12C into theirliving tissue, causing �13C to be low in organiccompounds produced by biologic activity. This con-centration into organisms leaves the environment inwhich they lived, such as seawater, enriched in 13C.Shells and other carbonates that precipitate in sea-water consequently show variations in �13C that arelargely controlled by the amount of organic carbonthat is in equilibrium with the surface environment.
During most of geologic time the amount oforganic carbon available to the surface environmenthas been approximately constant as organismsextracted 12C into their tissues during life andthen released it back into the environment by oxi-dation when they died. The principal variationsfrom this constancy arose during times of rapidenvironmental change, resulting in periods oforganic evolution and extinction. The variationswere both positive (to positive �13C values) andnegative (to negative values), and they occurredeither as long-term trends or as ‘‘spikes’’ that lastedonly a few million years or less.
Periods of positive �13C in carbonate rocks weregenerated by a variety of processes. One wasremoval of 12C from the surface during periods ofintense global orogeny, which caused burial oforganic carbon in foredeeps. Periods of widespreadglaciation were also associated with positive �13C incarbonate rocks formed by deposition of plankticorganisms when anoxic (or dysoxic) bottom waterpermitted accumulation of organic carbon in thedeep oceans.
Periods of negative �13C also developed bynumerous processes. Negative spikes commonlyfollowed extended periods of glaciation (chapter11) when sealevels rose and normal patterns ofcirculation were established throughout the oceans.Negative �13C spikes in carbonate rocks alsooccurred during major extinction events whenphotosynthetic activity in the upper parts of oceansdecreased, thus reducing the amount of organicmaterial that formed and settled to the bottom ofthe ocean after death. At this same time duringsome extinction events, however, �13C in benthicorganisms showed positive variations because ofthe lack of organic carbon falling to the oceanfloors. Some negative spikes may have been causedby widespread burning of land plants or destabili-zation of methane hydrates on the ocean floor, thus
178 Continents and Supercontinents

rapidly introducing large amounts of 12C into theatmosphere and surface water.
We illustrate long-term variability with fig. 12.2,which shows �13C throughout the Proterozoic(Brasier and Lindsay, 1998; Calver and Lindsay,1998; Lindsay and Brasier, 2000, 2002). The gen-eralized high �13C in the Paleoproterozoic began inthe latter stages of glaciation and the early stages ofthe worldwide 2.1–1.8-Ga orogenies (chapter 11and appendix H). The lack of variation between~2.1 Ga and 0.8 Ga presumably indicates continuedrecycling of carbon through organisms and the sur-face environment without burial of organic carbon.This constancy seems not to have been affectedby accretion and rifting of the supercontinentColumbia in the Mesoproterozoic. A more detailedrecord of �13C is available for the Neoproterozoic,when rapid oscillations began after Grenville-ageorogenies and presumably were related to a seriesof glacial intervals during the breakup of Rodinia(chapters 7 and 11).
Major Episodes of Evolution and theirRelationship to Continents andSupercontinents
This section recounts major changes in the types oforganisms inhabiting the earth and attempts torelate these changes to the histories of continentsand supercontinents. More information about evo-lutionary changes is provided by numerous bookson paleontology and historical geology, and a shortsummary can be found in Rogers (1993a).
Prokaryotes
Prokaryotes are distinguished from all other organ-isms by their lack of a cell nucleus, with their DNAand regulatory organs distributed throughoutthe cell or attached to the outer cell wall. The firstlife on earth probably developed by ~3.8 Ga(Schidlowski, 2001) and undoubtedly consisted ofprokaryotes, all of which are single-celled organ-isms commonly referred to as bacteria. Bacteriainclude an enormous number of forms with differ-ent lifestyles (Hagadorn et al., 1999), and theirgeologic record is difficult to interpret (Nisbet andSleep, 2001). Two of these types of bacteria,‘‘archaebacteria’’ (Archaea) and ‘‘cyanobacteria’’(blue-green algae), are particularly important toour investigation and we discuss them briefly here.
Archaebacteria are different from all otherorganisms on earth because the fatty acids (lipids)that constitute most of their cells are linked toeach other by oxygen atoms (forming ethers).Archaebacteria provide important informationabout conditions on the earth’s surface when lifeevolved. Modern varieties live mostly in three dif-ferent environments, including boiling water in hotsprings, highly saline lakes, and swamps, where thearchaebacteria produce CH4. These characteristicssuggest that the surface of the early earth was hot(chapter 11), that at least some bodies of waterwere rich in dissolved minerals, and that the atmo-sphere contained CH4.
Cyanobacteria (blue-green algae) are differentfrom all other bacteria because they release oxygenby photosynthesis and can live in the presence ofoxygen. Cyanobacteria form sticky mats on the
Continents and Organic Evolution 179
Figure 12.2. Variation in �13C during the Proterozoic (modified from Brasier and Lindsay, 1998).
surface of sediments deposited in shallow water,and these mats can trap clastic particles as theywash across the surface. Continued accumulationcan develop finely layered rocks known as ‘‘stro-matolites,’’ which include both limestones andsilicic varieties. Stromatolites formed bacteriallyhave been proposed to occur in chert as old as 3.5Ga, although the evidence is highly controversial(Brasier et al., 2002; Schopf et al., 2002). Microbialmats in siliciclastic rocks have also been proposedfor rocks of 2.9-Ga age (Noffke et al., 2003).
The origin of prokaryotes, basically the origin oflife, is a problem far beyond the scope of this book,and it is not clear that their evolution was influ-enced by any of the fundamental processes that weconsider. Prokaryotes had evolved well before thedevelopment of long-lived continental platforms(cratons; chapter 4), and the only emergent landwas probably short-lived areas of sialic crust andpossibly platforms similar to modern island arcs.The effect of bolide impacts is also unclear. TheArchean was presumably a time of frequentimpacts, although the only remaining evidence istektite layers as old as 3.5 Ga (Byerly et al., 2002).
Eukaryotes
Eukaryote cells differ from those of prokaryotes byhaving genetic material inside a nucleus and muchof the regulatory material separated into organelles.Eukaryotes also differ from all prokaryotes inrequiring oxygen to live, either in water or air,whereas all prokaryotes except cyanobacteria diein an environment that contains oxygen. Allprokaryotes and some eukaryotes (such as fora-minifera) are single celled, but eukaryotes alsohave the ability to form multicellular organisms.Recognition of single-celled eukaryotes in the fossilrecord is controversial. It is generally based on theobservation that single-celled eukaryotes tend to belarger and have more complex surfaces than pro-karyotes, and it has also been based on discovery oforganic molecules in kerogen that are larger andmore complex than those synthesized by modernprokaryotes.
The exact time of evolution of eukaryotes ishighly uncertain, and estimates vary widely. Somestudies of the varieties of organic molecules in kero-gens suggest that eukaryotes may have existed inthe Archean (Brocks et al., 1999). Because theyrequire oxygen in order to live, however, mostworkers assume that eukaryotes could not haveevolved until at least low concentrations of oxygen
developed in the atmosphere and oceans. Fedonkin(2003) proposed that the evolution of eukaryoteswas forced by gradually increasing atmosphericoxygen throughout the Proterozoic.
The initial development of free oxygen in theatmosphere at ~2.1 Ga is indicated by severaltypes of evidence, including the deposition of ironformation before that time and red beds afterward(summary in Des Marais, 1997a,b). The age of theoldest observed single-celled eukaryote fossils isconsistent with evolution at 2.1 Ga or possiblylater in the Proterozoic. Spiral forms of organismsthat were presumably eukaryotic have beenreported from ~2.1-Ga iron formations (Han andRunnegar, 1992). Shales with an age of 1.5 Gacontain acritarchs that may have been the restingcysts of algae (Javaux et al., 2001).
A time of 2.1 Ga is at the end of, or immediatelyfollowing, the 200-million-year period of glaciationthat occurred in many parts of the earth during thePaleoproterozoic (chapter 11). The glaciation mighthave led to the development of eukaryotes by creat-ing environmental stresses necessary for organicevolution to occur, and the possibility that glacia-tion occurred on uplifted flanks of continental rifts(chapter 11) suggests an underlying relationshipbetween tectonics and evolution. Approximately2.1 Ga is also the beginning of the long period ofconstant �13C that characterized much of theProterozoic (see above). The times of all tectonic,climatic, and evolutionary events are too uncertainto yield a definitive conclusion, but we can suggestthe following possibilities for the influence oftectonics on the evolution of eukaryotes:
� Whether or not caused by tectonic uplift, aprolonged period of glaciation created envir-onmental stresses that led to evolution (wediscuss this possibility further in the sectionon Neoproterozoic evolution below).
� Rifting of continents may have caused theglaciation by exposing more rock to weath-ering, thereby reducing atmospheric CO2
concentrations (chapter 11).� The lack of compressive orogenic activity
between ~2.5–2.1 Ga (chapter 7) may havepermitted expansion of epicontinental seas inareas not undergoing active rifting, a possibi-lity suggested by the constancy of �13C ratiosfrom 2.1–0.8 Ga (fig. 12.2). This broad areaof warm shallow water may have providedenough different ecological niches to stimu-late evolution of new organisms that couldoccupy them.
180 Continents and Supercontinents

Multicellular Organisms
Multicellular eukaryotes include metazoans (ani-mals), metaphytes (plants), and fungi. The time atwhich multicellular organisms first appeared is ques-tionable because of the difficulty of distinguishingthem from other organic remains in the Precam-brian. Neoproterozoic organisms clearly includedmetazoans (see below), and they almost certainlyevolved by some time in the Late Mesoproterozoicor possibly earlier (Seilacher et al., 1998; Butterfield,2000, 2001). The limited information available doesnot provide a cause for the evolution of multicellularorganisms, and whether they were influenced by theaccretion of the supercontinent Columbia or othertectonic processes during the Mesoproterozoic(chapter 7) is unknown.
Ediacaran and Similar Assemblages
Complex soft-bodied assemblages of theNeoproterozoic were first discovered in theEdiacara sediments of southern Australia, and simi-lar assemblages have now been located at numerousother places. Whether these organisms have anyrelationships to modern animals or plants, how-
ever, is uncertain (fig. 12.3). Some have forms simi-lar to jellyfish and others to worms, both of whichevolved as recognizable forms in the Cambrian (seebelow). On the basis of these similarities, someinvestigators regard some Ediacaran organisms assoft-bodied precursors to animals that developedskeletal parts in the Cambrian (Narbonne, 1998).Other investigators, however, find very little rela-tionship with Cambrian organisms and consider theEdiacaran assemblage to consist of forms thatbecame almost entirely extinct at the beginning ofthe Cambrian (Seilacher, 1992).
The Ediacaran assemblage flourished from ~565Ma to ~543 Ma, although some forms may haveevolved earlier, and some may have continued intothe Paleozoic (Narbonne and Gehling, 2003). Thus,the Ediacaran biota apparently developed during thelatest stages of rifting of Rodinia and the accretion ofGondwana (chapters 7 and 8), and Waggoner(1999) showed that slightly different suites of organ-isms were clustered into three different areas ofRodinia (fig. 12.4). This grouping suggests that thefragmentation of Rodinia exerted some control overthe evolution of Ediacaran organisms, possiblybecause it created such large areas of submergedcontinental crust that shallow seas provided newenvironments for Ediacaran organisms to fill.
Continents and Organic Evolution 181
Figure 12.3. Ediacaran biota from the Ediacara Formation of South Australia. Upper left—Dickinsoniacostata; upper middle—Spriggina; upper right—Tribrachidium; lower left—Parvancorina; lower middle—Aspidella; lower right—Charniodiscus. (Photo courtesy of Yasuo Kondo.)

The development of Ediacaran organisms in thelatest part of the Neoproterozoic may have beeninfluenced by any or all of a complex series ofevents in addition to the rifting of Rodinia.Evolutionary stress may have been provided byNeoproterozoic glaciation, which probably endedat ~580 Ma, although it may have lasted to ayounger time. Whether the glaciation was causedby tectonic processes and the location of continentsor by external forces is uncertain (chapter 11). Abolide that created the Acraman impact site inAustralia at 580 Ma was large enough to causeworldwide modification of atmosphere and oceans,including reduction of light reaching the surfaceand consequent reduction in the amount of photo-synthesis (Grey et al., 2003). The ages of all of theseevents except the Acraman impact (580 Ma) havebroad ranges and uncertainties, and for this reasonthe cause of the development of Ediacaran organ-isms remains highly controversial.
Precambrian–Cambrian Transition
The transition from the Precambrian to theCambrian was not instantaneous but apparentlyoccurred in only a few million years betweenapproximately 545 Ma and 540 Ma (Bowring etal., 1993; Landing et al., 1998). During this timethe Ediacaran biota became almost completely
extinct, and many modern varieties of animalsdeveloped skeletal parts. The transition is preservedat numerous localities, and we present a generalizeddiagram in fig. 12.5 that is based mostly on workin Newfoundland (Landing et al., 1989).
The earliest indication of the development ofmodern animals is the presence of burrows in softsediments. Prior to the Cambrian, sediment on theseafloor retained its original bedding, with noindication of the bioturbation that disturbs muchPhanerozoic sediment. At a somewhat youngertime, the fauna became dominated by a group oforganisms known as ‘‘small shelly fossils.’’ Some ofthe tiny shells are recognizable as primitive mol-luscs, but many have no certain affiliation to mod-ern organisms, and some are probably ‘‘platelets’’that formed a disorganized skeletal protectionaround larger organisms (Conway Morris andPeel, 1990). By the time of the small shelly fossils,all of the types of mineralization that characterizemodern animals were being produced, includingcalcite, phosphate, and silica. Recognizable animalskeletons occur higher in transition sections thanthe small shelly fossils. They represent many of themodern animal phyla, including: trilobites andother arthropods; siliceous and calcareous sponges;gastropods and bivalves of the molluscan phyla;both articulate and inarticulate brachiopods; andprimitive forms of echinoderms (Zhuravlev andRiding, 2001).
182 Continents and Supercontinents
Figure 12.4. Localized areas of different types of Ediacaran biota plotted on configuration of Gondwanaproposed by Rogers (1996). Modified from Waggoner (1999).
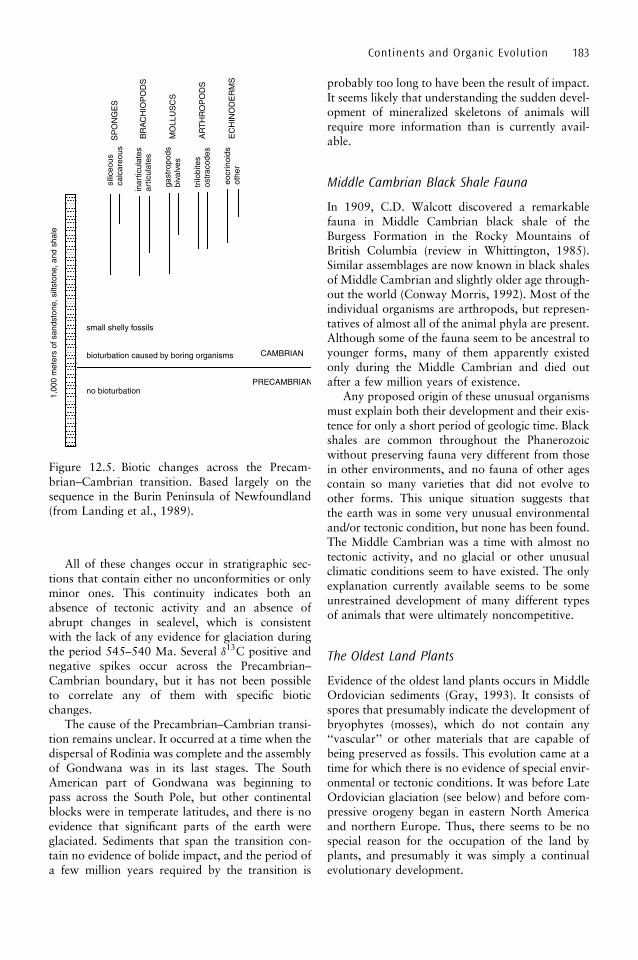
All of these changes occur in stratigraphic sec-tions that contain either no unconformities or onlyminor ones. This continuity indicates both anabsence of tectonic activity and an absence ofabrupt changes in sealevel, which is consistentwith the lack of any evidence for glaciation duringthe period 545–540 Ma. Several �13C positive andnegative spikes occur across the Precambrian–Cambrian boundary, but it has not been possibleto correlate any of them with specific bioticchanges.
The cause of the Precambrian–Cambrian transi-tion remains unclear. It occurred at a time when thedispersal of Rodinia was complete and the assemblyof Gondwana was in its last stages. The SouthAmerican part of Gondwana was beginning topass across the South Pole, but other continentalblocks were in temperate latitudes, and there is noevidence that significant parts of the earth wereglaciated. Sediments that span the transition con-tain no evidence of bolide impact, and the period ofa few million years required by the transition is
probably too long to have been the result of impact.It seems likely that understanding the sudden devel-opment of mineralized skeletons of animals willrequire more information than is currently avail-able.
Middle Cambrian Black Shale Fauna
In 1909, C.D. Walcott discovered a remarkablefauna in Middle Cambrian black shale of theBurgess Formation in the Rocky Mountains ofBritish Columbia (review in Whittington, 1985).Similar assemblages are now known in black shalesof Middle Cambrian and slightly older age through-out the world (Conway Morris, 1992). Most of theindividual organisms are arthropods, but represen-tatives of almost all of the animal phyla are present.Although some of the fauna seem to be ancestral toyounger forms, many of them apparently existedonly during the Middle Cambrian and died outafter a few million years of existence.
Any proposed origin of these unusual organismsmust explain both their development and their exis-tence for only a short period of geologic time. Blackshales are common throughout the Phanerozoicwithout preserving fauna very different from thosein other environments, and no fauna of other agescontain so many varieties that did not evolve toother forms. This unique situation suggests thatthe earth was in some very unusual environmentaland/or tectonic condition, but none has been found.The Middle Cambrian was a time with almost notectonic activity, and no glacial or other unusualclimatic conditions seem to have existed. The onlyexplanation currently available seems to be someunrestrained development of many different typesof animals that were ultimately noncompetitive.
The Oldest Land Plants
Evidence of the oldest land plants occurs in MiddleOrdovician sediments (Gray, 1993). It consists ofspores that presumably indicate the development ofbryophytes (mosses), which do not contain any‘‘vascular’’ or other materials that are capable ofbeing preserved as fossils. This evolution came at atime for which there is no evidence of special envir-onmental or tectonic conditions. It was before LateOrdovician glaciation (see below) and before com-pressive orogeny began in eastern North Americaand northern Europe. Thus, there seems to be nospecial reason for the occupation of the land byplants, and presumably it was simply a continualevolutionary development.
Continents and Organic Evolution 183
Figure 12.5. Biotic changes across the Precam-brian–Cambrian transition. Based largely on thesequence in the Burin Peninsula of Newfoundland(from Landing et al., 1989).

Extinction at the End of the Ordovician
The transition from the Ordovician to the Silurianover a period of several million years is marked byextinction of almost all graptolites, most cono-donts, more than 80% of brachiopod genera, andabout 50% of bivalve genera (Hallam and Wignall,1997). The extinction was mostly toward the end ofa period that began with a sharp negative spike in�13C followed by a few million years of positivevalues as marine regression exposed some landareas and developed shallow seas in areas of for-merly deeper water. Several short positive and nega-tive spikes in �13C occurred as sealevels returned tonormal at the end of the extinction event.
During the Late Ordovician compressive oro-geny was beginning in eastern North America andnorthern Europe, and subduction occurred beneathalmost the entire outer margin of Gondwana (chap-ters 5 and 8). Rifting continued along the inner(eastern) margin of Gondwana, and Avalonian–Cadomian terranes were in transit across theIapetus Ocean. Gondwana had moved across theSouth Pole so that the South Pole was centered innorthwestern Africa, causing widespread glaciationin that region.
Glaciation may have been partly responsible forthe Late Ordovician extinction because it causedregression from the generally high sealevels of theearlier part of the Ordovician (chapter 11). Thiswould have resulted in a reduction of the numberof ecological niches available to marine organismsand forced greater competition between them.Biotic recovery in the Silurian may have begunwhen glacial melting was completed near the endof the Ordovician, although the generally low sea-levels of the Silurian probably were caused by atleast limited continental glaciation as Gondwanapassed across the South Pole throughout the period.
Late Devonian Extinction
Extinction near the end of the Devonian hascommonly been referred to as the ‘‘Frasnian–Famennian’’ event because it was originally thoughtto have been restricted to the last two epochs of theDevonian period. Further work, however, has nowdemonstrated that it occurred over approximately15 million years in most of the later half of theDevonian (House, 2002). The episodic nature ofextinction and recovery is shown by at least twopositive and negative excursions in �13C rather thana single event (Joachimski et al., 2002).
The extinction and succession by new organismswas mostly restricted to marine fauna that were
affected by widespread development of anoxic/dysoxic water (Hallam and Wignall, 1997). Mosttypes of trilobites became extinct at this time orearlier, with only one group surviving into theCarboniferous. A few types of molluscs, some bra-chiopods, all cystoids, and all jawless fish (Agnatha)also became extinct. New animals that developed inthe Late Devonian or Early Carboniferous includesome types of brachiopods and several varieties ofcephalopods, with almost all Paleozoic ammonitesfirst appearing at this time. There was no significantextinction among land organisms, with both ani-mals and plants continuing to evolve toward moreadvanced varieties. The principal developmentamong land animals was the first appearance ofamphibians. Vascular plants (Tracheophytes),which had just evolved in the Silurian, continuedto develop into the varieties that would flourish inthe Carboniferous (Gray, 1993).
No cause of the Late Devonian extinctions isimmediately apparent. Some climatic variation isimplied by several �13C variations and transgres-sion–regression cycles. No direct evidence of glacia-tion has been found, although waxing and waningof small icecaps within Gondwana may have causedthe sealevel variations. The assembly of Asia hadbegun, and compressive orogeny was active aroundall margins of North America, the outer marginof Gondwana, and much of southern Europe.Whether any of this climatic and tectonic activitywas responsible for the biotic events is unclear,however, and recent discovery of evidence ofseveral small meteorite impacts during the LateDevonian suggests that they may have been respon-sible for the climatic and environmental changes(McGhee, 2001; Sandberg et al., 2002; Warme etal., 2002).
Paleozoic–Mesozoic Boundary
Mass extinction at the end of the Permian destroyed~90% of marine species and ~70% of vertebratespecies on land (Erwin, 1993; Erwin et al., 2002).Extinction occurred through a period of a few mil-lion years in the Late Permian, and by its end theworld’s oceans contained no more trilobites, fusu-linids, tabulate and rugose corals, blastoids, andstalked crinoids. All of the animal phyla survivedthe extinction, however, and diversified to newforms in the Triassic. This expansion created newtypes of corals, caused enormous expansion ofammonites, and began the diversification of reptilesand mammals. Most major groups of plants sur-vived the end of the Permian, but the species that
184 Continents and Supercontinents
produced coal in the Carboniferous became extinctand were not replaced by new coal-producing typesuntil the Jurassic (chapter 11).
These biotic developments occurred during atime when Pangea was at, or near, its condition ofmaximum packing (chapter 8). As we discussed inchapter 11, the configuration of Pangea producedextensive glaciation in Gondwana, warm globalclimates, arid conditions in the center of thesupercontinent, and marine regression. Duringregression the oceans developed lower regions ofanoxic water, which may have lasted as long as 20million years (Knoll et al., 1996; Isozaki, 1997;Wignall and Twitchett, 2002). Environmental stresswas also created by the eruption in the Siberianbasalt province, which began at ~250 Ma andwas so large that it could have caused worldwideatmospheric contamination with ash and poisonousgases (Reichow et al., 2002; chapter 10).
More than one episode of transgression andregression are suggested by extinction of differentgroups at two or more times, largely in pulses at~260 Ma and ~250 Ma (Erwin et al., 2002).Whether these pulses were nearly instantaneous ormerely part of a continual extinction process iscontroversial. If the extinction was gradual, thentectonic control by the assembly of Pangea is alikely cause. If the extinctions were rapid, however,then external control by widespread volcanism orbolide impact is more likely. Available evidencecannot demonstrate which, if any, of these causesis more likely.
Development of Calcareous Nanoplanktonand Microplankton
Photosynthetic organisms must have been the baseof the oceanic food chain throughout the history ofthe earth. The oldest known groups that secretecalcite, however, did not develop before theMesozoic. Because remains of these organisms areeasily destroyed after deposition, the stratigraphicrecord is not certain, but it appears that coccolitho-phores first appeared in the Triassic, with diatomsand planktic foraminifera in the Cretaceous.
The reasons for evolution of the calcareousplankton are obscure. The highly uncertain datesof their appearance do not seem to correlate withany tectonic or external events. The climaticwarmup that began in the Triassic continued with-out significant interruption, and sealevels rose con-tinually to their peak in the Late Cretaceous(chapter 11). Also, the arrival of calcareous plank-ton cannot be correlated with any known meteorite
impacts or with the development of anoxic/dysoxiclayers in the lower part of the oceans at severaltimes in the Jurassic and Cretaceous.
Late Triassic–Early Jurassic
During a period of about 5 million years in thelatest Triassic and earliest Jurassic the world’soceans lost ~10% of their animal families (Palfyand Smith, 2000; Palfy et al., 2002). On the basisof fossil and �13C data, the extinction may haveoccurred in more than one series of transgressionand regression. At least one of the regressions coin-cided with development of anoxia (or dysoxia) inthe lower oceans, during which organic matteraccumulated widely on ocean floors (Hasselbo etal., 2002). Full recovery of organic diversity did notoccur until the Middle Jurassic (Hallam andWignall, 1997).
The causes of the anoxia and extinction areunclear. General climate warmth and lack of anyevidence for glaciation at these times indicate littlepossibility that the anoxic conditions were causedby glacial regression and terminated when glaciersmelted and flushed out the lower oceans. Theextinction cannot be correlated with any specifictectonic activity, and there is no credible evidencefor meteorite impact at this time. One possibility isbased on the age of the massive Karoo basalts ofsouthern Africa and the synchronous Ferrar maficprovince of Antarctica (Palfy et al., 2002). Theireruption at the same time as the extinction andanoxic events raises the possibility that volcanismplaced enough ash and poisonous gases into theatmosphere to alter climate and ocean composition.
Cretaceous–Tertiary Boundary
The great faunal diversity of the Cretaceous wasdramatically reduced at the end of the period(papers in Koeberl and MacLeod, 2002).Although all phyla survived, several groups oforganisms became extinct. They included: dino-saurs and all closely related forms (only crocodilessurvived); rudistid and similar reef-formingbivalves; all ammonites and belemnites; all flyingand marine reptiles. Even the surviving groups weregreatly affected, with extinction of nearly 90% ofplanktonic micro- and nano-organisms, 50% ofmacro-invertebrates, 75% of angiosperms, and per-haps 50% of all species. Revival of species diversitydid not fully occur until 5–10 million years later.
The extinction took place in a shorter period oftime than can be measured at the end of the
Continents and Organic Evolution 185
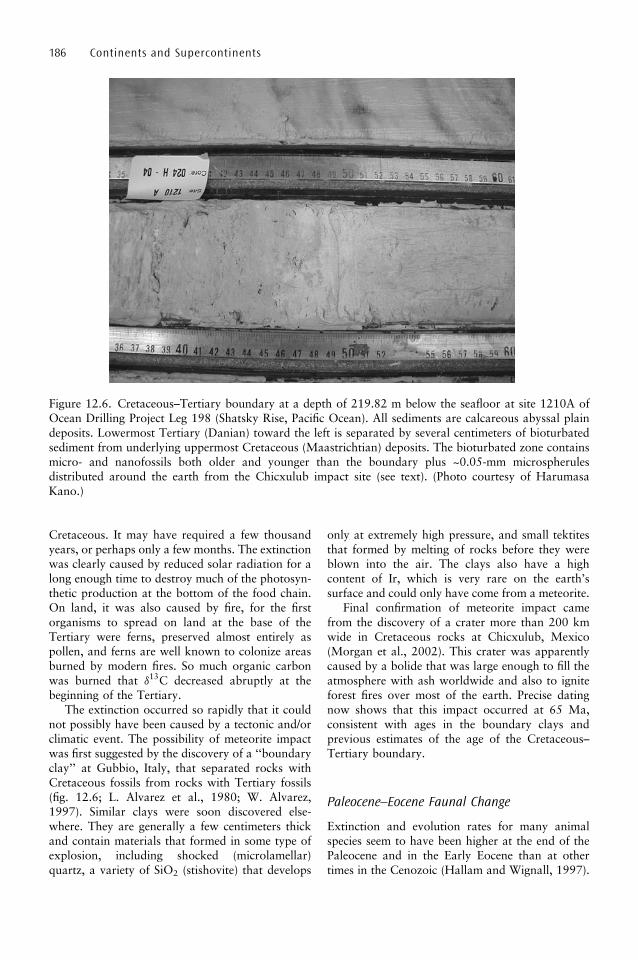
Cretaceous. It may have required a few thousandyears, or perhaps only a few months. The extinctionwas clearly caused by reduced solar radiation for along enough time to destroy much of the photosyn-thetic production at the bottom of the food chain.On land, it was also caused by fire, for the firstorganisms to spread on land at the base of theTertiary were ferns, preserved almost entirely aspollen, and ferns are well known to colonize areasburned by modern fires. So much organic carbonwas burned that �13C decreased abruptly at thebeginning of the Tertiary.
The extinction occurred so rapidly that it couldnot possibly have been caused by a tectonic and/orclimatic event. The possibility of meteorite impactwas first suggested by the discovery of a ‘‘boundaryclay’’ at Gubbio, Italy, that separated rocks withCretaceous fossils from rocks with Tertiary fossils(fig. 12.6; L. Alvarez et al., 1980; W. Alvarez,1997). Similar clays were soon discovered else-where. They are generally a few centimeters thickand contain materials that formed in some type ofexplosion, including shocked (microlamellar)quartz, a variety of SiO2 (stishovite) that develops
only at extremely high pressure, and small tektitesthat formed by melting of rocks before they wereblown into the air. The clays also have a highcontent of Ir, which is very rare on the earth’ssurface and could only have come from a meteorite.
Final confirmation of meteorite impact camefrom the discovery of a crater more than 200 kmwide in Cretaceous rocks at Chicxulub, Mexico(Morgan et al., 2002). This crater was apparentlycaused by a bolide that was large enough to fill theatmosphere with ash worldwide and also to igniteforest fires over most of the earth. Precise datingnow shows that this impact occurred at 65 Ma,consistent with ages in the boundary clays andprevious estimates of the age of the Cretaceous–Tertiary boundary.
Paleocene–Eocene Faunal Change
Extinction and evolution rates for many animalspecies seem to have been higher at the end of thePaleocene and in the Early Eocene than at othertimes in the Cenozoic (Hallam and Wignall, 1997).
186 Continents and Supercontinents
Figure 12.6. Cretaceous–Tertiary boundary at a depth of 219.82 m below the seafloor at site 1210A ofOcean Drilling Project Leg 198 (Shatsky Rise, Pacific Ocean). All sediments are calcareous abyssal plaindeposits. Lowermost Tertiary (Danian) toward the left is separated by several centimeters of bioturbatedsediment from underlying uppermost Cretaceous (Maastrichtian) deposits. The bioturbated zone containsmicro- and nanofossils both older and younger than the boundary plus ~0.05-mm microspherulesdistributed around the earth from the Chicxulub impact site (see text). (Photo courtesy of HarumasaKano.)

About 50% of benthic foraminifera became extinct,and planktic foraminifera and land mammalsevolved rapidly during the ‘‘Paleocene–EoceneThermal Maximum’’ (PETM). The PETM was atime when all of the earth’s seawater became war-mer, reducing the longitudinal gradient of decreas-ing temperature of surface water toward the polesand also the vertical gradient of decreasing tem-perature from the top to the bottom of the oceans.The origin of the PETM is highly controversial, butbecause it coincided with a sharp reduction in �13C,many investigators attribute it to sudden release ofmethane from seafloor sediments (D. Thomas et al.,2002).
Late Eocene Faunal Change
The latter part of the Eocene is characterized byrapid disappearance and evolution of plankticorganisms at the species level, although no massextinction occurred in any major groups. Thisdevelopment occurred during a time of generalcooling from high temperatures of the Cretaceousto the present. No cause for the rapid biotic changeis immediately apparent, but it may have resultedfrom the impact of at least three meteorites (allsmaller than at Chicxulub) within a few millionyears (McGhee, 2001).
Summary of the Effect of Continentsand Supercontinents on OrganicEvolution
Numerous causes have been proposed for majorextinctions and development of new types of organ-isms. We start this section by reviewing possiblecauses and their relationship to continental/tectonicprocesses before investigating the role that conti-nents may have played in each of the stages of bioticdevelopment discussed in the preceding section(more complete discussion in Hallam and Wignall,1997).
� Global warming or cooling caused by varia-tion in concentrations of greenhouse gases,changes in solar intensity, or other factorsthat affected the earth at all latitudes.Warming might have eliminated organismsthat normally live in polar latitudes, andcooling could have caused extinction of tro-pical species. Temperature increase mightalso have resulted in anoxia/dysoxia aswarming of the oceans reduced their ability
to dissolve oxygen. This type of generalizedtemperature change seems more likely tohave been caused by external processes thanby movement of continents or assembly anddispersal of supercontinents.
� Change in temperature gradients across lati-tudes, generally accompanied by develop-ment of continental glaciers in high latitudes.These changes would normally have causedorganisms to move across latitudes to remainin their normal temperature zones and mightonly result in extinctions by changing oceancirculation and causing transgression orregression. Most glacial intervals were prob-ably caused by positions of continents andsupercontinents, although other possibilitieshave been proposed (chapter 11).
� Transgression and regression that affectedhabitats both on shallow shelves and in thedeep ocean. Worldwide regression couldhave eliminated some shallow-water nichesand caused extinction of benthic organismsin them, whereas general transgression mayhave filled isolated basins and created habi-tats for the evolution of new organisms.Organisms that lived at any depth in theopen oceans were probably affected by trans-gression and regression only if they causedchanges in the amounts of dissolved oxygen,particularly resulting in anoxic/dysoxic con-ditions (see below). Short-term variations insealevel were almost certainly caused by gla-ciation and deglaciation, but variations overperiods of millions of years resulted mostlyfrom changes in volumes of ocean ridges andpartly by epeirogenic movements of conti-nents (chapter 2).
� Anoxic/dysoxic conditions both in epeiricseas and in the deep oceans. Shallow-waterblack shales developed during both trans-gressions and regressions wherever basinswere sufficiently isolated that surface anddeep water could not interchange. Deep-water anoxic/dysoxic events seem to havebeen independent of sealevel, and numerousproposals have been made for their origin.Some of these deep-water events apparentlyoccurred at the same time as periods ofrapid biotic change, but others are appar-ently unrelated. The only effect of continentsand supercontinents on anoxia/dysoxia wasprobably the provision of shallow basins oncontinental shelves.
� Eruption of large quantities of ash and volca-nic gases that caused global cooling and also
Continents and Organic Evolution 187

made atmosphere and surface water poiso-nous to many organisms. Some extinctionevents have been attributed partly to eruptionof large regions of plateau basalts, but someplateau basalt provinces developed at timeswhen no significant biotic change occurred.Large areas of subaerial plateau basalts canform only on continents, and they may haveformed only during continental rifting and/orpassage over a plume (chapter 2).
� Impacts of large bolides apparently couldhave caused almost instantaneous extinction,and repeated impact of smaller meteoritesmay have contributed to extinction eventsthat occurred over several million years. Thegeneral effect on biotic evolution is unclear,however, because several very large impactsin the Phanerozoic occurred at times whenthere were no significant biotic overturns.
Table 12.1 summarizes the 15 episodes of bioticchange discussed in the previous section and showsour best estimate of the possible involvement ofvarious fundamental causes. The table does notshow transgressive/regressive or anoxic/dysoxicepisodes that may have been directly responsiblefor biotic change but only the underlying stressesthat led to these direct causes.
Although all of the 15 episodes listed in table12.1 presumably had one or more fundamental
causes, we have found none for seven of them.The earliest prokaryotes and multicellular organ-isms undoubtedly evolved for fundamental reasons,but none are easily identified. The only apparentreason for the evolution of eukaryotes is someunknown and hypothetical involvement of tec-tonics/continents in the development of atmo-spheric oxygen. Similarly we find no fundamentalcause for the evolution of the unusual MiddleCambrian fauna, the first land plants, the firstcalcareous plankton, or the thermal maximum atthe Paleocene–Eocene boundary.
Four of the events shown in table 12.1 occurredduring or shortly after periods of climatic dis-ruption, mostly associated with glaciation. Theyinclude development of Ediacaran biota duringthe last stages of Neoproterozoic glaciation andthe Precambrian–Cambrian transition that occurredseveral million years after glaciation ended.Whether the Neoproterozoic glaciation was causedby the position of continents near the South Pole iscontroversial. The Late Ordovician and Permian–Triassic extinctions also occurred at or near the endof glacial intervals, and they clearly formed whendifferent parts of Gondwana passed across theSouth Pole during the Paleozoic.
The Permian–Triassic extinction was probablycaused by the effects of Pangea in addition toPermo-Carboniferous glaciation. The superconti-nent affected global climates by cutting the east–
188 Continents and Supercontinents
Table 12.1. Fundamental causes of rapid evolution and possible involvement of continents andsupercontinents
EventClimaticstress
Volcanicstress
Bolideimpact Tectonic involvement
Development of prokaryotesDevelopment of eukaryotes none unless related to development of
atmospheric O2
Development of multicellular organismsEdiacaran biota � � possible control of glaciation
Precambrian–Cambrian boundary � possible control of preceding glaciation
Middle Cambrian fauna
Development of land plantsLate Ordovician extinction � possible control of glaciation
Late Devonian extinction �Permiam–Triassic boundary � � Pangea controlled climate change and
disruption of oceanic circulationDevelopment of calcareous plankton
Triassic–Jurassic extinction �Cretaceous–Tertiary boundary �Paleocene–Eocene extinction
Late Eocene extinction �
Possible controls are marked with an �. Blank spaces indicate no discernible control. All information based on references cited in
text.

west flow of ocean water and also by the develop-ment of mountains along its western edge. Thisgave Pangea a generally warm climate despite gla-ciation in Gondwana and created large areas ofaridity. Eruption of the Siberian basalt province atthe same time as the major extinction undoubtedlycontributed to the Permian–Triassic biotic overturn,but it seems likely that the major source of stresswas the existence and configuration of Pangea.
In addition to its contribution to the Permian–Triassic extinction, eruption of plateau basalts mayhave been the direct cause of the biotic overturn atthe Triassic–Jurassic boundary. Volcanism, how-ever, seems to have had no effect on other timesof major biotic crises.
Bolide impact clearly was the major cause of theCretaceous–Tertiary extinction. A large bolide mayalso have been responsible for some of the develop-ment of Ediacaran organisms, and groups of smal-ler bolides may have contributed to extinctions inthe Late Devonian and Late Eocene. No otherextinction events can be attributed to bolides, andsome large impacts occurred at times when therewas no significant biotic overturn.
Summary
The continual evolution of new organisms andextinction of old ones throughout almost all ofearth history has passed through several timeswhen totally new types of organisms developed.These times in the Phanerozoic commonly followepisodes of mass extinction, but extinction eventsare unknown in the Precambrian until near the endof the Proterozoic.
Whether the fundamental causes of these devel-opments among organisms are internal to theearth (tectonic) or external is largely unknown.Movement of continents and the assembly and dis-persal of supercontinents seems to have influencedsome of the events, particularly the Permian–Triassic extinction, but apparently had no effecton other events. This conclusion implies thatorganic evolution on the earth’s surface was mostlydecoupled from processes within the solid earth.
Continents and Organic Evolution 189

Appendix A
Seismic Methods
An elastic material is one that deforms and thenreturns to its original condition without any
permanent distortion. This happens if we stretch arubber band and then let it go without breaking it,and it also happens whenever the earth is subjectedto short-term stresses such as earthquake move-ments. The earth is elastic to rapid motions, suchas seismic waves, and in this appendix we showhow seismic waves have been used to locate theearth’s two major discontinuities: the Moho andthe core–mantle boundary.
The energy that causes an earthquake or otherstress is dissipated through the deformed elasticmaterial as a series of seismic waves. In rocks,these waves consist of primary (P) waves that oscil-late back and forth like sound waves in air (fig.A.1). A secondary (S) set of waves is also caused byenergy release in rocks and travels by a side-to-side(transverse) motion (fig. A.1). Because of theirmotions, P waves can travel through solids, liquids,and gases, but S waves can travel only throughsolids. Velocities of the waves are determined bythe elastic properties of the media through whichthey travel according to the equations
VP ¼ ½ðKþ 4
3�Þ=��1=2
and
VS ¼ ðK=�Þ1=2
where
VP is the velocity of the P waveVS is the velocity of the S waveK is the bulk modulus (incompressibility)� is the rigidity modulus (a measure of shear
strength)� is the density
Both K and � are constants that are used todescribe elastic behavior. Because VP is determinedby both K and � but VS depends only on the bulkmodulus, the P wave is faster than the S wave, andin almost all earth materials VP=VS is typicallyabout 5/3.
The two equations above suggest that velocitiesof both P and S waves are inversely proportionalto the densities of the materials they pass through.In actual rocks, however, the velocities of bothwaves increase as density increases becauseincrease in � also causes rapid increase in both Kand �. In the earth, this means that both VP andVS generally increase downward as densityincreases under increasing pressure of overlying
190
Figure A.1. Methods of transmission of seismic waves.
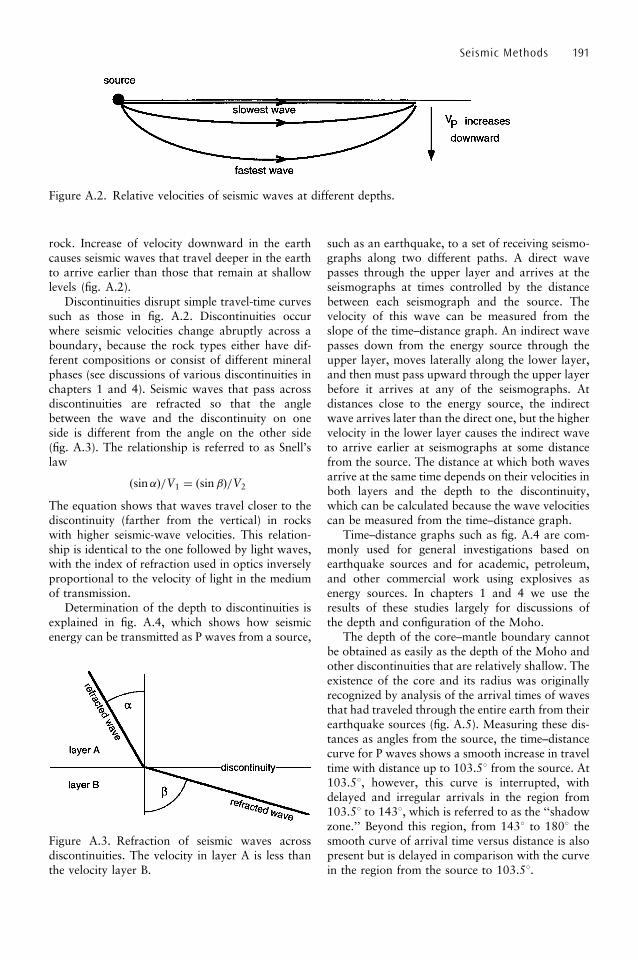
rock. Increase of velocity downward in the earthcauses seismic waves that travel deeper in the earthto arrive earlier than those that remain at shallowlevels (fig. A.2).
Discontinuities disrupt simple travel-time curvessuch as those in fig. A.2. Discontinuities occurwhere seismic velocities change abruptly across aboundary, because the rock types either have dif-ferent compositions or consist of different mineralphases (see discussions of various discontinuities inchapters 1 and 4). Seismic waves that pass acrossdiscontinuities are refracted so that the anglebetween the wave and the discontinuity on oneside is different from the angle on the other side(fig. A.3). The relationship is referred to as Snell’slaw
ðsin�Þ=V1 ¼ ðsin �Þ=V2
The equation shows that waves travel closer to thediscontinuity (farther from the vertical) in rockswith higher seismic-wave velocities. This relation-ship is identical to the one followed by light waves,with the index of refraction used in optics inverselyproportional to the velocity of light in the mediumof transmission.
Determination of the depth to discontinuities isexplained in fig. A.4, which shows how seismicenergy can be transmitted as P waves from a source,
such as an earthquake, to a set of receiving seismo-graphs along two different paths. A direct wavepasses through the upper layer and arrives at theseismographs at times controlled by the distancebetween each seismograph and the source. Thevelocity of this wave can be measured from theslope of the time–distance graph. An indirect wavepasses down from the energy source through theupper layer, moves laterally along the lower layer,and then must pass upward through the upper layerbefore it arrives at any of the seismographs. Atdistances close to the energy source, the indirectwave arrives later than the direct one, but the highervelocity in the lower layer causes the indirect waveto arrive earlier at seismographs at some distancefrom the source. The distance at which both wavesarrive at the same time depends on their velocities inboth layers and the depth to the discontinuity,which can be calculated because the wave velocitiescan be measured from the time–distance graph.
Time–distance graphs such as fig. A.4 are com-monly used for general investigations based onearthquake sources and for academic, petroleum,and other commercial work using explosives asenergy sources. In chapters 1 and 4 we use theresults of these studies largely for discussions ofthe depth and configuration of the Moho.
The depth of the core–mantle boundary cannotbe obtained as easily as the depth of the Moho andother discontinuities that are relatively shallow. Theexistence of the core and its radius was originallyrecognized by analysis of the arrival times of wavesthat had traveled through the entire earth from theirearthquake sources (fig. A.5). Measuring these dis-tances as angles from the source, the time–distancecurve for P waves shows a smooth increase in traveltime with distance up to 103.58 from the source. At103.58, however, this curve is interrupted, withdelayed and irregular arrivals in the region from103.58 to 1438, which is referred to as the ‘‘shadowzone.’’ Beyond this region, from 1438 to 1808 thesmooth curve of arrival time versus distance is alsopresent but is delayed in comparison with the curvein the region from the source to 103.58.
Seismic Methods 191
Figure A.2. Relative velocities of seismic waves at different depths.
Figure A.3. Refraction of seismic waves acrossdiscontinuities. The velocity in layer A is less thanthe velocity layer B.
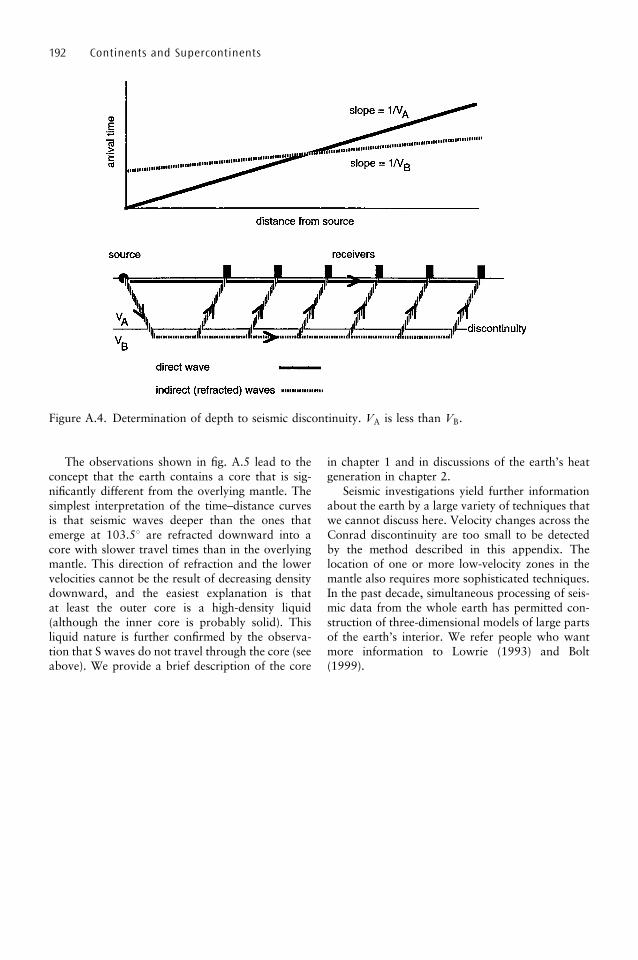
The observations shown in fig. A.5 lead to theconcept that the earth contains a core that is sig-nificantly different from the overlying mantle. Thesimplest interpretation of the time–distance curvesis that seismic waves deeper than the ones thatemerge at 103.58 are refracted downward into acore with slower travel times than in the overlyingmantle. This direction of refraction and the lowervelocities cannot be the result of decreasing densitydownward, and the easiest explanation is thatat least the outer core is a high-density liquid(although the inner core is probably solid). Thisliquid nature is further confirmed by the observa-tion that S waves do not travel through the core (seeabove). We provide a brief description of the core
in chapter 1 and in discussions of the earth’s heatgeneration in chapter 2.
Seismic investigations yield further informationabout the earth by a large variety of techniques thatwe cannot discuss here. Velocity changes across theConrad discontinuity are too small to be detectedby the method described in this appendix. Thelocation of one or more low-velocity zones in themantle also requires more sophisticated techniques.In the past decade, simultaneous processing of seis-mic data from the whole earth has permitted con-struction of three-dimensional models of large partsof the earth’s interior. We refer people who wantmore information to Lowrie (1993) and Bolt(1999).
192 Continents and Supercontinents
Figure A.4. Determination of depth to seismic discontinuity. VA is less than VB.

193
Figure A.5. Recognition of core.

Appendix B
Heat Flow and Thermal Gradients
Despite the number of heat sources in the earthand uncertainties over their relative importance
in the past and at present, only a limited number ofmeasurements can be made that provide any infor-mation about the earth’s present thermal conditionand its history. In this appendix we describe mea-surements of the present heat flow, the reason thatthe earth’s mantle is convecting, and inferences thatcan be drawn about past thermal conditions bydetermining temperatures and pressures at whichrocks came to equilibrium in the earth’s interior.This appendix is closely linked to discussions inchapters 1, 2, and 3.
Heat flow is measured by determining tempera-ture gradients near the earth’s surface and the ther-mal conductivity of the rocks that these gradientsare established in. Gradients are measured by drop-ping a set of thermometers down a hole and makingsimultaneous readings of the temperature at severaldepths. Holes on land generally must be hundredsor more meters deep in order to obtain temperaturemeasurements that are not disturbed by percolatinggroundwater, but holes in deep ocean sediments canbe as shallow as 10 m. Thermal conductivity isobtained by making laboratory measurements ofthe ease with which heat flows through rocks incores from the holes, and heat flow (Q) is calculatedby the equation
Q ¼ thermal gradient� conductivity
Where thermal gradient is in degrees Celsius perkilometer and conductivity is in watts per meter perdegree, heat flow is reported in units of milliwattsper square meter (mW/m2). This unit replaces anolder one referred to as ‘‘heat flow unit’’ (HFU),which is microcalories per square centimeter persecond and is equal to 41.87 mW/m2.
Surface heat flow can be combined with theabundances of radioactive elements in near-surfacerocks to obtain a value referred to as ‘‘reduced heatflow’’ (Q*). Measurement of the concentrations ofK, Th, and U in cores from the holes where tem-perature gradients were obtained permits calcula-
tion of near-surface radioactive heat production (A)in units of microwatts per cubic meter. Combiningrates of heat flow and rates of production at differ-ent places within a terrane commonly yields a linearrelationship of the type shown in fig. B.1.
Extrapolation of the line in fig. B.1 to zero heatproduction yields Q*, which is the heat flow thatwould be measured in the terrane if near-surfacerocks generated no heat. Because all radioactiveelements are also LIL elements (chapter 3), theyare concentrated in the upper continental crustand commonly account for more than one half ofthe heat flow in investigated terranes. This yieldsreduced heat flows that are very low in most con-tinental regions. Because the rate of decrease inconcentration of radioactive elements downwardin the upper crust can only be estimated, the exactmeaning of the reduced flow is unclear, but it iscommonly regarded as heat flowing out of thelower crust and mantle.
The existence of convection in the earth’s mantlethat we discuss in chapter 1 results from the rela-tionship between actual temperature gradients andthe gradients required for stability in a gravitationalfield. A thick body, such as the mantle, is mechani-
194
Figure B.1. Calculation of reduced heat flow.Plotted points represent measured heat flow andproduction at different places within a terrane.

cally stable in a gravity field only if the downwardincrease in temperature to areas of higher density(caused by higher pressure) follows the equation
dTdP
� �S
¼ �T
�cP
where T and p are temperature and pressure, Srefers to constant entropy, � is the coefficient ofthermal expansion, � is density, and cP is heatcapacity at constant pressure. This equation definesa temperature gradient known as an ‘‘equilibriumadiabat,’’ the rate of change of T and p for a bodymoving vertically without exchanging heat with itssurroundings and at a rate that is infinitely slow.
We use fig. B.2 to demonstrate that mantle con-vection occurs if the mantle is mobile and actualthermal gradients are higher than the gradient alongthe equilibrium adiabat (further discussion in chap-ter 1). Because of the time needed for thermalequilibration in the mantle, any spontaneous move-ment of material will probably be adiabatic. Thus,material moving vertically without gain or loss ofheat from any point on the p–T grid follows anadiabatic path that shows its change in T and p.Along an adiabatic path, when material rises tolower pressure it expands and converts internalenergy into work, thus reducing the remaining
energy and decreasing the temperature. Similarly,material moving downward heats up because ofcompression. Infinitely slow movement forms anequilibrium adiabat, with maximum change in tem-perature. More rapid movement occurs along anyof a series of disequilibrium adiabats, with slopes ashigh as vertical (no change in temperature).
Because all adiabats are steeper on this diagramthan the actual thermal gradient in the mantle, anyrising material has a higher temperature than itssurroundings, and it expands and becomes lessdense than its surroundings. Similarly, falling mate-rial becomes denser than the surroundings. Bothtypes of movement cause mechanical instabilitythat results in continual convection in the mantle(fig. B.2). Thus, if the actual temperature gradient inthe mantle is higher than the stable gradient alongan equilibrium adiabat, the mantle must undergoconvection.
Measurement of past thermal gradients requiresestimates of temperatures and pressures preservedin ancient rocks and minerals. Many of these esti-mates can be made from assemblages of meta-morphic minerals using a facies diagram such asthe one shown in fig. B.3b. A rock containingmineral suites that plot at any point in this diagrampresumably formed at the temperature and depth
Heat Flow and Thermal Gradients 195
Figure B.2. Cause of convection in the mantle.
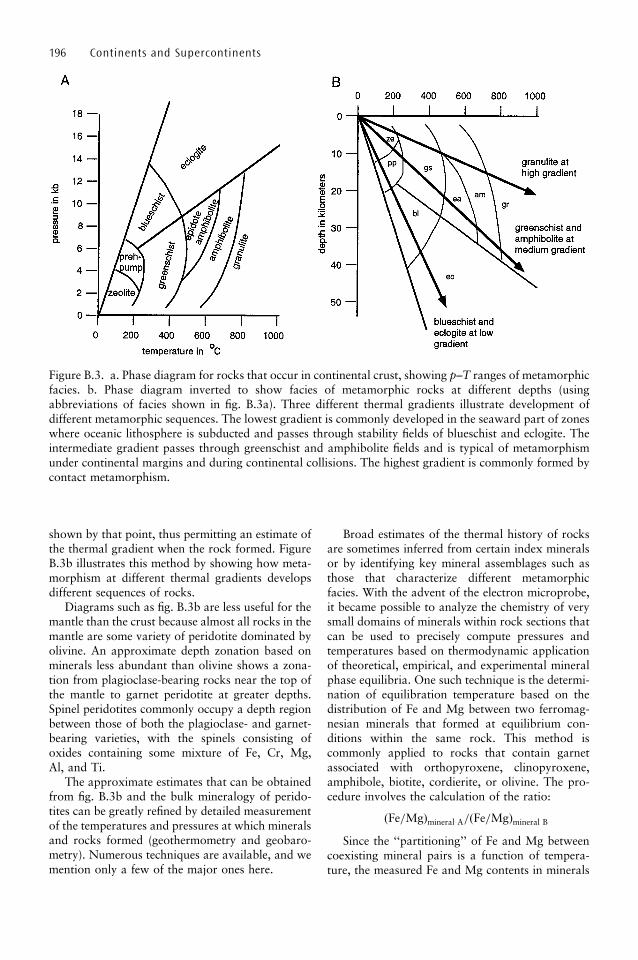
shown by that point, thus permitting an estimate ofthe thermal gradient when the rock formed. FigureB.3b illustrates this method by showing how meta-morphism at different thermal gradients developsdifferent sequences of rocks.
Diagrams such as fig. B.3b are less useful for themantle than the crust because almost all rocks in themantle are some variety of peridotite dominated byolivine. An approximate depth zonation based onminerals less abundant than olivine shows a zona-tion from plagioclase-bearing rocks near the top ofthe mantle to garnet peridotite at greater depths.Spinel peridotites commonly occupy a depth regionbetween those of both the plagioclase- and garnet-bearing varieties, with the spinels consisting ofoxides containing some mixture of Fe, Cr, Mg,Al, and Ti.
The approximate estimates that can be obtainedfrom fig. B.3b and the bulk mineralogy of perido-tites can be greatly refined by detailed measurementof the temperatures and pressures at which mineralsand rocks formed (geothermometry and geobaro-metry). Numerous techniques are available, and wemention only a few of the major ones here.
Broad estimates of the thermal history of rocksare sometimes inferred from certain index mineralsor by identifying key mineral assemblages such asthose that characterize different metamorphicfacies. With the advent of the electron microprobe,it became possible to analyze the chemistry of verysmall domains of minerals within rock sections thatcan be used to precisely compute pressures andtemperatures based on thermodynamic applicationof theoretical, empirical, and experimental mineralphase equilibria. One such technique is the determi-nation of equilibration temperature based on thedistribution of Fe and Mg between two ferromag-nesian minerals that formed at equilibrium con-ditions within the same rock. This method iscommonly applied to rocks that contain garnetassociated with orthopyroxene, clinopyroxene,amphibole, biotite, cordierite, or olivine. The pro-cedure involves the calculation of the ratio:
ðFe=MgÞmineral A=ðFe=MgÞmineral B
Since the ‘‘partitioning’’ of Fe and Mg betweencoexisting mineral pairs is a function of tempera-ture, the measured Fe and Mg contents in minerals
196 Continents and Supercontinents
Figure B.3. a. Phase diagram for rocks that occur in continental crust, showing p–T ranges of metamorphicfacies. b. Phase diagram inverted to show facies of metamorphic rocks at different depths (usingabbreviations of facies shown in fig. B.3a). Three different thermal gradients illustrate development ofdifferent metamorphic sequences. The lowest gradient is commonly developed in the seaward part of zoneswhere oceanic lithosphere is subducted and passes through stability fields of blueschist and eclogite. Theintermediate gradient passes through greenschist and amphibolite fields and is typical of metamorphismunder continental margins and during continental collisions. The highest gradient is commonly formed bycontact metamorphism.

can be used to compute the temperature of equili-bration of the mineral pair. The variations in Fe andMg from core to rim of single grains can also beused to calculate the changing thermal gradients.This technique finds wide application in estimatingthe temperature of equilibration of metamorphicmineral assemblages at various depths in the earth’scrust. It should be noted that the computations arealso dependent on the concentrations of variousother components in coexisting minerals and thepresence or absence of different mineral phases inthe rock.
The distribution of Fe and Mg among mineralphases, however, provides little information aboutthe pressure of equilibration. Determination ofpressure is mostly based on the ability of Al tooccupy sites of tetrahedral coordination and alsosites of 6-fold coordination in minerals. In low-pressure minerals such as plagioclase, Al is almostinvariably in 4-fold coordination, whereas Al has a6-fold coordination in denser minerals such as gar-net. Precise calculations require equilibrium assem-blages with coexisting minerals that have variableAl concentrations. One of the commonly used sys-tems takes into consideration the distribution of Alin the assemblage:
Garnetð6-fold AlÞ þ plagioclase ð4-fold AlÞþ Al2SiO5 þ quartz
Many high-grade supracrustal rocks containthe assemblage garnet–aluminosilicate–plagio-clase–quartz, and are hence suitable for geobaro-metry. Dry granulite-facies rocks that characterize alarge part of the exposed middle and lower conti-nental crust commonly contain a garnet–ortho-pyroxene/clinopyroxene–plagioclase–quartz assem-blage, which also provides a potential barometer.More details on thermobarometry based on mineralphase equilibria can be found in Ferry (1986).
Estimation of pressure and temperature fromminerals and rocks is also done using a variety ofother techniques. Out of these, the application offluid inclusion and stable isotope techniques is nowwidely employed. Fluid inclusions trapped in miner-als preserve various proportions and combinationsof gases, liquids, and melts from metamorphic, mag-matic, or hydrothermal environments (chapter 4and appendix F). By observing the temperature ofphase changes within the inclusions, the composi-tion and density of the fluids can be characterized.The data are then used to compute isochores (linesof constant volume) in pressure–temperature space.Simultaneous estimation of pressures and tempera-tures can be derived by intersection of isochores of
different categories of fluids trapped at the sametime. Where an independent estimate of temperatureis available from mineral thermometry, the intersec-tion of the temperature with the isochore deter-mined from fluid inclusions yields the pressure.One of the underlying assumptions of this techniqueis that fluid inclusions remained as closed systemsfrom the time of trapping, which is verified by find-ing inclusions trapped at peak pressure and tem-perature during rock formation still preserved evenin rocks that equilibrated in the continental lowercrust (Santosh and Tsunogae, 2003).
Temperatures can also be estimated from thepartitioning of stable isotopes between coexistingminerals. One of the most widely applied methodsis based on carbon-isotope exchange between co-existing calcite and graphite in high-grade meta-morphic rocks. The partitioning of 13C and 12Cbetween coexisting calcite and graphite is a functionof the temperature of equilibration of these carbon-bearing phases (Valley, 2001). Experimental andempirical calibrations of the calcite–graphite ther-mometer have been applied to derive the thermalstructure of continental crust, even in the case ofextreme crustal metamorphism involving ultrahigh-temperature (>1100oC) metamorphic conditions(Satish-Kumar et al., 2002).
Under suitable conditions, studies of the varia-tion of pressure–temperature conditions in rockscan be expanded to obtain information on thechanges of these parameters through time. Thus,the ‘‘p–T–t’’ path of a rock can be defined by care-
Heat Flow and Thermal Gradients 197
Figure B.4. Idealized isothermal decompression(ITD) and isobaric cooling (IBC) paths.
ful studies of mineral assemblages and reactiontextures that developed in a rock at various stagesof its formation or exhumation. The p–T–t path hastwo components: the ‘‘prograde’’ path in which therock was taken down to deeper portions of theearth and was subjected to high temperatures andpressures, and the ‘‘retrograde’’ path through whichit was brought back (exhumed) to shallower levelsafter metamorphism.
The nature of prograde and retrograde paths isdifferent in different tectonic environments, such asin zones of collision or extension. The two common
types of p–T–t paths described from metamorphicrocks are ‘‘isothermal uplift’’ or ‘‘isothermaldecompression’’ (ITD), where hot rocks are broughtup rapidly, and ‘‘isobaric cooling’’ (IBC) whererocks reside at a certain depth for longer time andundergo slow cooling. We show idealized ITD andIBC paths in fig. B.4. A combination of studies frommineral assemblages, textural relations, and chemi-cal zoning preserved in minerals help in reconstruct-ing the pressure–temperature–fluid history andp–T–t paths and thus aid in defining the thermalgradients within the crust.
198 Continents and Supercontinents

Appendix C
Paleomagnetism
The earth’s magnetic field affects all rocks andminerals at all times, but minerals that contain
iron can retain a ‘‘memory’’ (‘‘remanence’’) of thefield that existed at the time they were originallyformed. The strongest magnetism is in magnetite,which is attracted by a simple hand magnet, butweaker magnetic fields are retained in all of these‘‘ferromagnetic’’ minerals and can be measuredwith laboratory instruments. Because the magneticproperties of naturally occurring minerals havebeen imposed by the earth’s magnetic field, theminerals contain a record of their past positionson the earth and of variations in the earth’s mag-netic field through time. We use this appendix toshow how this information can be used to decipherboth the history of individual suites of rocks and thehistory of tectonic processes.
Magnetic fields are generated by the movementof electrically charged particles. Although the exactcauses of the earth’s magnetic field are controver-sial, it is clearly related to rotation of the earth’siron–nickel core, which presumably indicates thatthe earth has had a magnetic field since the coresegregated from the rest of the earth shortly afterthe earth accreted. This field is enormously com-plicated, but about 80% can be described as a barmagnet (magnetic dipole) with north and south‘‘geomagnetic poles’’ that passes through the cen-ter of the earth and is tilted about 11.58 awayfrom the earth’s axis of rotation (fig. C.1).Torsvik and Van der Voo (2002) estimated thatas much as 25% of the magnetic field in thePhanerozoic was not a simple dipole.
Compass needles do not point toward the geo-magnetic poles but to the north and south ‘‘mag-netic poles.’’ If the magnetic field were a simpledipole, then these poles would be at the two endsof the bar magnet and would be identical to thegeomagnetic poles. Other influences on the mag-netic field, however, place the present north mag-netic pole at about latitude 808 N, longitude 1098W and the south magnetic pole at 658 N, 1388 E.
The positions of the magnetic poles vary slightlythrough time. In the past century the north mag-netic pole has moved about 10 km/yr, and the southmagnetic pole has shown similar motion in thesouthern hemisphere. Despite this variability andthe difference between the magnetic axis and rota-tional axis of the earth, accumulated paleomagneticdata indicate that the magnetic and rotational axeshave been close to each other throughoutgeologic time and that magnetic pole positionsaveraged over a period of 3000–10,000 years areidentical to geographic poles. The possibility thatthe magnetic axis has had a very different orienta-tion in the past (‘‘true polar wander’’) has beensuggested, and we discuss it briefly in chapter 11.
Because the magnetic poles are not at the rota-tional poles, the orientation of the magnetic field at
199
Figure C.1. Comparison of the earth’s rotationalaxis, magnetic dipole axis, and locations ofmagnetic poles. The south magnetic pole is on thehemisphere not shown here.

any point on the earth’s surface must be describedby two different measurements (fig. C.2). The‘‘inclination’’ is the angle that the field makes withthe earth’s surface at that point. It is 908 at thenorth and south magnetic poles and at all latitudesis described by the equation tan(inclination)¼ 2tan(latitude). The ‘‘declination’’ is the anglemeasured on the surface between true north andsouth (along a meridian of longitude) and the direc-tion of the compass needle. If a compass needlewere mounted in a sphere, the inclination wouldbe approximately the angle between the needle andthe earth’s surface, and the declination would be theangle between the needle and a meridian of long-itude that passes through the earth’s geographicpoles.
In addition to small movements of the magneticfield, the north and south magnetic poles episodi-cally reverse themselves (‘‘flip-flop’’), with magneticnorth switching to magnetic south and vice versa.The reason and mechanism for this exchange areunclear, but detailed magnetic measurements of themost recent reversals suggest that the magneticpoles need a few thousand years to rotate aroundthe earth from their previous positions to their new
positions. When the reversal is complete, the formernorth-seeking pole of a compass points to the south,and the south-seeking pole toward the north. Thepresent is defined as a time of ‘‘normal’’ polarity,with magnetic north near the north geographicpole, and ‘‘reverse’’ polarity is a time when mag-netic north and south are in opposite positions.
Efforts to find some periodicity to the reversalshave failed to detect anything except random varia-tion. In the past ~80 million years, major reversalshave occurred approximately every 2 million years,and there have been numerous short-lived reversals,many of which have lasted less than 100,000 years(fig. C.3). A period of normal polarity withoutreversals occurred between 118 Ma and 83 Ma,and a period of reverse polarity lasted from about316 Ma to 262 Ma.
The earth’s magnetic field imposes magneticorientations on iron-bearing minerals both when
200 Continents and Supercontinents
Figure C.2. Definition of inclination and declina-tion.
Figure C.3. Magnetic time scale for past 80 millionyears (based on McElhinny and McFadden, 1999).

they form and during later events. Initial orienta-tions (remanences) develop when minerals grow inmetamorphic rocks and sediments and also duringdeposition of clastic sediments. In igneous and high-temperature metamorphic rocks, the crystallizationof these minerals may be above the ‘‘Curie tempera-ture,’’ which prevents minerals from retaining arecord of the earth’s magnetic field (and hence therock’s position) until they cool down below theCurie temperature. All of these initial orientationsmay then be further modified when the rocks arealtered (‘‘overprinted’’) by chemical and thermalprocesses as they move through the earth’s mag-netic field because of seafloor spreading, continentaldrift, and other processes. For example, meta-morphism at temperatures above the Curie tem-peratures of the different minerals may destroy(‘‘reset’’) the original orientations in the rocks.
Because initial orientations are complexlyaltered by movement of minerals around the earthand by other events, it is necessary for paleomagne-ticists to investigate the entire magnetic history ofmaterials they are studying by isolating the differentdirections (‘‘components’’) of magnetization withina rock sample. In some cases it is possible to recog-nize a series of discrete events, such as initialcrystallization, followed by low-temperature meta-morphism, and even recent weathering that mod-ified the original magnetic orientation. For manystudies, the principal task is to remove later magne-tizations in order to determine the initial one, whichis then used to determine where the mineral or rockwas on the earth’s surface when it was first magne-tized.
Paleomagneticists ‘‘clean’’ later magnetizationsfrom minerals and rocks in three ways in theirlaboratories. One is by chemical solution, whichcan destroy diagenetic and other late-formingminerals. A second procedure is measuring theorientation of the magnetic field as a mineral orrock is progressively heated. This removes later,and presumably weaker, magnetizations as the tem-perature rises toward the Curie point. A thirdmethod is to subject the mineral to rapidly alternat-ing magnetic fields, which also removes the weakermagnetizations.
Paleomagnetic information has been used in twoprincipal ways. First we discuss the construction ofa time scale based on magnetic reversal sequences,which can be correlated with radiometric dates andis then useful for dating suites of rocks for whichabsolute dates are not available. The reversalsequence is very important in showing the patternsof opening of modern ocean basins (chapter 1) andhas also been used to correlate some events on
continents. The second use of paleomagnetic datais mapping the movement of continental regionsthrough time by locating apparent pole positionsfor rocks of different ages on the continents. Thisyields ‘‘apparent polar wandering (APW) curves’’that provide information on continental movementsand their relationships to each other.
Rocks that are magnetized when they formalong mid-ocean spreading centers carry their mag-netic orientations with them when they move awayfrom the centers. Rocks that are forming now andduring past times of normal polarity have magneticorientations that enhance the strength of the earth’smagnetic field near them, but those that formedwhen polarity was reversed reduce the strength ofthe magnetic field. This alternation of enhancementand reduction produces an alternating series ofpositive and negative deviations (‘‘anomalies’’)from average magnetic intensities on each side ofthe spreading ridge as older rocks move fartheraway. These ‘‘stripes’’ provided some of the bestinitial support for the concept of seafloor spreading,and we discuss them further in chapter 1 and fig.1.7.
By combining magnetic patterns in the oceanswith absolute dates from oceanic crust, it is possibleto construct a magnetic time scale for both largeand small reversals during the past ~175 millionyears. Older rocks in ocean basins have now beencompletely subducted (chapter 1), and it is neces-sary to investigate dated rocks on land in order toextend the time scale further back. Figure C.3shows the complexity of the time scale for thepast 80 million years.
Because the magnetic reversals show no repeti-tive periodicity, the pattern of reversals can be usedas ‘‘finger prints’’ to date suites of rocks that cannototherwise be dated or to confirm dates obtained byother means. This method has been used to dateregions of ocean basins that have been isolated fromspreading ridges either because the ridges have beensubducted or because of plate reorganizationswithin the basins. Some suites of rocks on landhave also been dated magnetically, although thesedates are commonly accepted only when confirmedby other methods.
Apparent polar wandering curves are con-structed by measuring the magnetic orientations ofrocks of different ages within one coherent region,such as a drifting continent. In each rock, the mag-netic inclination shows the latitude (paleolatitude)at which the rock formed, but it does not showwhether the indicated pole was north or southbecause the rock may have formed during a periodof either normal or reversed polarity. The declina-
Paleomagnetism 201

tion indicates the amount of rotation undergone bythe rock since it formed.
We begin to illustrate the process of constructingAPW paths with the simple example of a block ofcontinental crust moving along a meridian of long-itude away from the North Pole between 60 Maand the present (fig. C.4). The oldest rocks carrymagnetic orientations that are nearly verticalbecause they formed near the pole, and progres-sively younger rocks show increasing distancesfrom the pole. This sequence of poles yields anAPW path that appears to proceed in the oppositedirection from the actual movement of the rocksmeasured. In constructing fig. C.4, the uncertaintybetween normal and reversed positions of poles hasbeen resolved by placing apparent poles along asmooth path. For rock suites formed during thepast few hundred million years, it is generally alsopossible to determine whether the path shows anorth or south pole, but in older rocks this distinc-tion is commonly difficult.
The paleolongitude at which a rock formed can-not be determined purely from magnetic orientationbecause the rock’s magnet points toward the northor south magnetic poles wherever the rock is on theearth’s surface. Consequently, paleomagnetic data
202 Continents and Supercontinents
Figure C.4. Idealized APW path for continent moving south from North Pole in past 60 million years.
Figure C.5. Idealized APW paths for continents Aand B (from J. Meert, personal communication).Ages of apparent pole positions are shown for bothcurves.

can only support other evidence, such as patterns ofseafloor spreading, to indicate longitudinal move-ments of rocks. Figure 1.5 shows how early paleo-magnetic data helped to confirm the separation ofNorth America and Europe by opening of theAtlantic Ocean.
Locations of apparent pole positions for twodifferent areas, such as two continents, can beused to show their relative movements. Figure C.5shows the apparent pole positions for two conti-nents that were separated before 450 Ma, joined at450 Ma, moved together until 350 Ma, and then
split apart again. These APW data would permitdetermination of absolute movements of both con-tinents across latitudes and indicate that there wasno longitudinal separation between them from450–350 Ma. They would, however, provide noinformation on absolute longitudes of either con-tinent.
This review has covered only a few aspects of thestudy of paleomagnetism, and we refer readers whowish more information to Van der Voo (1993) andMcElhinny and McFadden (1999).
Paleomagnetism 203

Appendix D
Isotopic Systems
Isotopic studies of the evolution of the earth inevi-tably start with the concept of a ‘‘primitive’’ earth
that had not undergone any compositional fractio-nation. If we knew the concentrations of parent anddaughter isotopes in this original earth, then wecould use the half lives of the various parent isotopesto calculate the concentrations of daughter isotopesin the whole earth at any time in its 4.55-billion-yearhistory. Because the earth has undergone composi-tional fractionation, however, it is impossible tomeasure these original concentrations directly, andthey must be inferred by some indirect method.
Most methods for estimating original isotoperatios either depend on, or can be checked by, stu-dies of meteorites. One variety of meteorites, knownas chondrites, is used for most isotopes because it ishypothesized to represent the unfractionated com-position of the earth. Because the meteorites areunfractionated, we can use present concentrationsof parent and daughter isotopes, plus the half livesof the parents, to calculate back to the ratios that themeteorites had at any time since they were formed4.55 billion years ago. Applying this method to theearth is commonly referred to as viewing the earth asa ‘‘chondritic uniform reservoir’’ (CHUR), and iso-topic ratios calculated from this concept are desig-nated with the subscript CHUR. The concept ofCHUR is similar to the one used for Sr isotopes,but they are compared to meteorites classified asbasaltic achondrites, which provide an initial Srisotope ratio known as BABI (‘‘basaltic achondritebest initial’’).
Five isotopic systems are important in our stu-dies of the evolution of the earth: Rb–Sr, Sm–Nd,Lu–Hf, Re–Os, and the more complex U–Th–Pbsystem. We discuss each of them briefly below.
Rb–Sr
Decay of 87Rb by beta emission with a half life of48:9� 109 years produces 87Sr, which is not radio-active. Concentrations of both isotopes are com-
monly reported as ratios with the nonradiogenic86Sr, allowing construction of graphs such as fig.D.1. This diagram shows present isotope ratiosmeasured in several different phases that formedat the same time from a common source, such asa suite of comagmatic igneous rocks or individualminerals in the same rock. If these phases havedifferent proportions of Rb and Sr, then a plot of87Sr/86Sr versus 87Rb/86Sr forms a straight line thatextrapolates back to an ‘‘initial ratio’’ (Sri) at87Rb/86Sr ¼ 0, which is the 87Sr/86Sr ratio of thesource at the time the suite of rocks or mineralsoriginally formed. The caption for figure D.1 alsoshows how the age of the suite can be measuredfrom the plotted data.
The Sri of the primitive earth (BABI) is estimatedto be approximately 0.699 based on studies ofbasaltic achondrites. If the earth had remainedunfractionated, its present 87Sr/86Sr would havebeen 0.702–0.703, but both Rb and Sr are fractio-nated upward into the upper mantle and crust.Furthermore, Rb is a LIL element (chapter 2) andis highly concentrated into continental crust, yield-ing very high Rb/Sr ratios that produced high87Sr/86Sr ratios. These fractionations have contin-ued through the entire history of the earth, formingpresent 87Sr/86Sr ratios that are high in continentalcrust and much lower in the depleted mantle thatmelts to form oceanic tholeiites along mid-oceanridges. Figure D.2 shows the growth curve fordepleted mantle (asthenosphere) and also the gen-eral ranges for isotopes in continental crust andlithospheric mantle beneath continents.
An extraordinary amount of information on thesources of magmatic rocks can be obtained bycomparing their Sri values at the time of magmageneration against the growth curves in fig. D.2. Forexample, modern lavas with Sri of 0.703 have prob-ably been derived from a mantle source, whereasvolcanic rocks with Sri of 0.710 presumably weregenerated by partial melting of continental crust.Similarly, magmas that are 1 billion years oldshould have comparatively low Sri if derived from
204

the mantle and higher Sri if from the continentalcrust.
The curves shown in fig. D.2 are difficult tointerpret and it is customary to report Sri valuesfor individual suites in terms of their "Sr values (fig.D.3), which are their deviations from mantle valuesat the age of the suite.
Sm–Nd
In most ways, the Sm–Nd isotopic system is similarto the Rb–Sr system and can be analyzed in asimilar fashion. Variations in Nd isotopes arecaused by the radioactivity of 147Sm, which decaysto 143Nd by emission of an alpha particle and has ahalf life of 106� 109 years. This causes the con-centration of 143Nd in the whole earth to increasewith time and also increases the ratio of 143Nd tothe nonradiogenic 144Nd. Individual rocks and rocksuites can be dated by measuring their 143Nd/144Ndratios and their 147Sm/144Nd ratios and determiningages and initial ratios using isochrons of the sametype that we used above for the Rb–Sr system. Forour purposes, however, it is more useful to calculate
Isotopic Systems 205
Figure D.1. Rb–Sr isochron for a comagmatic suite of rocks and/or minerals. The intercept at 87Rb/86Sr ¼0 is the initial ratio (Sri) for this suite of rocks. All rocks and minerals in this suite start with this ratio, androcks with higher 87Rb/86Sr ratios generate more Sr through time as the suite evolves. This yields a slopedline of present 87Rb/86Sr versus 87Sr/86Sr values, with the slope of the line proportional to the time sinceformation of the suite.
Figure D.2. Growth of 87Rb/86Sr in the bulk earthand continental crust starting from the initial87Rb/86Sr of the unfractionated earth.
Figure D.3. Determination of "Sr.

143Nd/144Nd ratios in the mantle at the times whendifferent volumes of juvenile crust were formed.
Just as in the Rb–Sr system, decay of 147Smcauses the 143Nd/144Nd ratio to increase with timein the whole earth, but the major difference is thatthe Rb parent is the LIL element in the Rb–Srsystem, whereas the Nd daughter is the LIL elementin the SmNd system. Both Sm and Nd are rare earthelements with þ3 valences, but the lighter Ndþ3 is alarger ion than Smþ3 and fractionates more readilyinto melts than Sm. This causes the mantle tobecome depleted in Nd relative to the crust, andthe 143Nd/144Nd ratio increases much more rapidlyin the mantle than in either oceanic crust or con-tinental crust. The numerical differences between143Nd/144Nd ratios in the crust and mantle aresmaller than the differences between the 87Sr/86Srratios because the fractionation between Rb and Sris much greater than the fractionation between Smand Nd.
Figure D.4 shows variations in the 143Nd/144Ndratio throughout the history of the earth, startingfrom the initial ratios for the primitive earth usingthe CHUR model (initial 143Nd/144Nd ¼ 0:512;initial 147Sm/144Nd ¼ 0:197). The 143Nd/144Ndratio in an unfractionated earth grows slowlyalong the line labeled CHUR in the diagram.Because the mantle has selectively fractionated Ndupward into the crust at all times, the 143Nd/144Ndratio in the mantle has become higher than the143Nd/144Nd ratio in the bulk earth. Figure D.4shows this change as a ‘‘depleted’’ (asthenospheric)mantle curve, labeled DM.
Instead of discussing 143Nd/144Nd ratios asshown in fig. D.4, it is easier to use a diagram inwhich the growth curve for the entire earth (CHUR)
is ‘‘rotated’’ to horizontal (fig. D.5). This permitscalculation of 143Nd/144Nd ratios in other parts ofthe earth in terms of their deviation ("Nd) from thevalues in the bulk earth or depleted mantle atdifferent times.
Because selective loss of Nd from the astheno-sphere steadily increases the Sm/Nd ratio in thelithosphere, all asthenospheric "Nd values are posi-tive. Similarly, all "Nd values in rocks that havebeen in the lithosphere for significant periods oftime are negative, and those in crustal rocks arelowest. This provides another method for distin-guishing between mantle and crustal sources of
206 Continents and Supercontinents
Figure D.4. Evolution of 143Nd/144Nd in unde-pleted mantle (CHUR) and depleted (astheno-spheric) mantle (DM) starting from the initial143Nd/144Nd of the unfractionated earth.
Figure D.5. Determination of TDM, TCHUR, and "Nd. The diagram shows the curve for bulk-earth evolutionin fig. D.4 as a horizontal line with a value of zero in epsilon units. Numbers show the values of143Nd/144Nd at three points on the diagram. Explanation in text.

modern igneous rocks. It also enables us to obtaininformation from the negative relationshipbetween "Sr and "Nd, where rocks from islandarcs and continental margins plot between thefields for MORB and suites formed within conti-nents (fig. D.6).
We can use fig. D.5 to demonstrate graphicallyone method to calculate the time when a juvenilerock in the crust separated from its original mantlesource. The calculation assumes that Sm and Nd arechemically similar enough that they did not frac-tionate in the rock during metamorphism or otherpost-magmatic processes and requires measuringthe age of formation of the rock, its present143Nd/144Nd ratio, and its present 147Sm/144Ndratio. With this information, the present143Nd/144Nd ratio can be extrapolated back eitherto a time of separation from a primitive earth,referred to as ‘‘TCHUR,’’ or to a time of separationfrom a depleted mantle, referred to as ‘‘TDM.’’These values are referred to as ‘‘model ages’’ anddo not necessarily correspond to specific geologicevents.
Lu–Hf
Variation in Hf isotopes is produced by radioactiv-ity of 176Lu, which undergoes beta decay with a halflife of 35� 109 years. The 176Lu isotope produces176Hf, which is compared with the nonradiogenic177Hf to yield variable 176Hf/177Hf ratios. Esti-mated concentrations in a primitive earth (CHUR)yield an initial 176Hf/177Hf ¼ 0:278 and initial176Lu/177Hf ¼ 0:33. The Lu–Hf system is analyzedin the same way as the Rb–Sr and Sm–Nd systems
by calculating "Hf in ways similar to those used forSr and Nd isotopes.
Isotopic data for Lu and Hf can be collectedfrom both whole rocks and minerals, and some ofthe most useful information comes from zircons.Because zircons contain significant concentrationsof Hf but virtually no Lu, the 176Hf/177Hf ratiosacquired by zircons during their crystallizationundergo almost no change during their post-crystal-lization history. Consequently, 176Hf/177Hf ratios inzircons are identical to the ratios in the magmasfrom which they crystallized.
During petrologic processes, the Lu and Hfbehave very similarly to Sm and Nd. Both Hf andNd daughters are more fractionated into melts thanLu and Sm parents, causing increase in both Lu/Hfand Sm/Nd ratios in the asthenosphere and corre-sponding decrease in the lithosphere through time.This yields a linear relationship in which "Hf isapproximately (1.5–2) � "Nd in many studiedrock suites and shows that "Hf can be used in thesame way as "Nd to determine source regions ofigneous rocks. Rocks in which "Nd and "Hf arenot proportional presumably have been affectedby fractionation of Sm, Nd, Lu, and/or Hf duringmetamorphism or in some other process, all ofwhich lead to controversial interpretations of thehistory of the rocks being investigated.
Re–Os
The Re–Os system has many similarities to the Lu–Hf system. 187Re decays to 187Os by beta decaywith a half life of 42� 109 years, and the concen-tration of 187Os is reported as a ratio with nonra-
Isotopic Systems 207
Figure D.6. Typical relationship between "Nd and "Sr.
diogenic 186Os or with 188Os, which has shownvirtually no change in abundance since the forma-tion of the earth. During production of magmasfrom the mantle, Re is preferentially fractionatedinto melts, and Os remains in the solid residue.Analyses of 187Os/186Os or 187Os/188Os ratios arecommonly made of whole-rock mantle xenolithsand also of chromite separates.
Limited evidence suggests that the initial187Os/186Os ratio for the bulk earth (CHUR) wasabout 0.81, and the initial 187Re/186Os wasapproximately 3. Depletion of Re causes this ratioin the mantle to increase more slowly than in thewhole earth, and the present 187Os/186Os ratios inthe mantle are ~1.06. This variation permits mea-sured 187Os/186Os ratios in mantle-derived rocks toprovide an estimate of the time when regions of theupper mantle lost Re and apparently became stable.Calculation of "Os is done by similar methods as areused for Sr and Nd isotopes.
Another parameter is TRD, the time at whichdepletion of the mantle in Re leaves rocks with Osisotope ratios that remain unchanged during theremaining history of the earth. This time is deter-mined from the linear change of 187Os/186Os from0.81 at 4.5 Ga to 1.06 now.
Investigations of Os isotopes that use the ratio187Os/188Os instead of 187Os/186Os yield the sameinterpretations but with different numerical valuesbecause the ratio of 186Os/188Os is 0.12043.
U–Th–Pb
Two long-lived radioactive isotopes occur in nat-ural U and one in Th. All three of them decaythrough complex schemes of intermediate isotopesuntil they reach stable isotopes of Pb. Summaryequations for these decays are:
238U yields 206Pb þ 8aþ 6b
T1=2 ¼ 4:47� 109 years
235U yields 207Pbþ 7aþ 4b
T1=2 ¼ 0:704� 109 years
232Th yields 208Pb þ 6aþ 4b
T1=2 ¼ 14:0� 109 years
It is convenient to express many of the parentand daughter isotope concentrations as ratios withthe nonradiogenic 204Pb.
An enormous amount of information can beobtained from the U–Th–Pb system, but we discuss
only two of the numerous uses that can be made ofit: measurement of the ages of zircons and detectionof changes in U/Pb ratios in different regions of theearth at different times.
When zircons crystallize they readily include Uin their lattices but exclude Pb. This means that anyPb now measured in a zircon was formed by radio-active decay of U in the zircon, and the U/Pb ratiois an indication of the age of the zircon.Determinations are complicated, however, by thetendency of Pb to diffuse out of zircons as soon as itis produced. Figure D.7 shows the problem andmethod of determining the age of a zircon diagram-matically.
The ‘‘concordia’’ curve in fig. D.7 shows the206Pb/238U and 207Pb/235U ratios that zircons crys-tallized at different ages from 4.55 Ga to 0 Ga(present) would have now if they had not lost anyPb after crystallization. It starts from the point 0,0because zircons crystallizing now contain no Pb,and proceeds to higher concentrations of 206Pband 207Pb as their radioactive parents decay. Theshape of the curve results from the much shorterhalf life of 235U than of 238U, which has caused the235U/238U ratio to decrease from a high value in theoriginal earth to 1/137.8 today. Analyzed zirconswhose 206Pb/238U and 207Pb/235U ratios plot onconcordia at any specific age are regarded as ‘‘con-cordant’’ and have clearly crystallized at that age.
If the zircons lose Pb, either continually or in asingle event such as metamorphic reheating, how-ever, then their various U/Pb ratios fall below theconcordia (fig. D.7). Loss of Pb in one event com-monly produces a suite of zircons that lie along a‘‘discordia,’’ which forms a straight line betweenthe concordia at the time of original zircon crystal-lization and the date of Pb loss. Connecting thisdiscordia line to the upper intercept with concordiashows the time of initial zircon crystallization, andconnecting it to the lower intercept reveals the timeof the event that caused Pb loss.
The evolution of Pb isotopes in the earth canbe shown diagrammatically in fig. D.8, in which207Pb/204Pb and 206Pb/204Pb are plotted againsteach other starting from initial values in the initialearth of 206Pb/204Pb ¼ 9:31, 207Pb/204Pb ¼ 10:3,and U/Pb ¼ 7:2. The ‘‘conformable’’ curve is a pri-mary growth curve that shows how these radio-genic isotopes of Pb would have grown relative tothe nonradiogenic 204Pb in an unfractionated earthfrom 4.55 Ga to the present (0 Ga). The short halflife of 235U relative to 238U causes the curve to riserapidly at first and more slowly later. Minerals suchas galena, which contains no U, are referred to as‘‘conformable’’ if they have the Pb isotope ratios
208 Continents and Supercontinents

209
Figure D.7. Calculation of ages of concordant and discordant zircons. This diagram amplifies thediscussion in the text with the specific example of a zircon that crystallized at 3500 Ma and lost Pb in asingle event at 500 Ma.
Figure D.8. Evolution of 207Pb/204Pb and 206Pb/204Pb in earth history. The conformable curve starts at206Pb/204Pb ¼ 9.31, 207Pb/204Pb ¼ 10.3, and a value of 235U/238U that evolved to the present 235U/238Uratio of 1/137.8. All primary curves terminate on a straight line referred to as the ‘‘geochron.’’ Primaryevolution is interrupted by events that change U/Pb ratios, which cause isotopic ratios on this diagram todiverge from the conformable and other primary curves.
that the whole earth had at the time the mineralsformed.
Some Pb isotopes apparently evolved in parts ofthe initial earth that had different U/Pb ratios thanthe average for the bulk earth. They formed other‘‘primary’’ growth curves leading to present207Pb/204Pb and 206Pb/204Pb ratios that lie along astraight line known as a ‘‘geochron.’’
Many 207Pb/204Pb and 206Pb/204Pb ratios do notlie along primary growth curves and are referred toas ‘‘disconformable.’’ Disconformable mineralsresult from the ease of fractionation of U from Pb
by various earth processes, particularly because U isan LIL element and Pb is not. Thus, when U rises inthe mantle and then becomes further concentratedin the upper levels of the continental crust, the U/Pbratio also increases in these regions The result isthat many of the Pb isotope systems that are mea-sured in near-surface rocks show one or more timesof U enrichment, and we show the general result infig. D.8.
Further information on isotope geology can befound in Faure (1986) and Dickin (1995).
210 Continents and Supercontinents
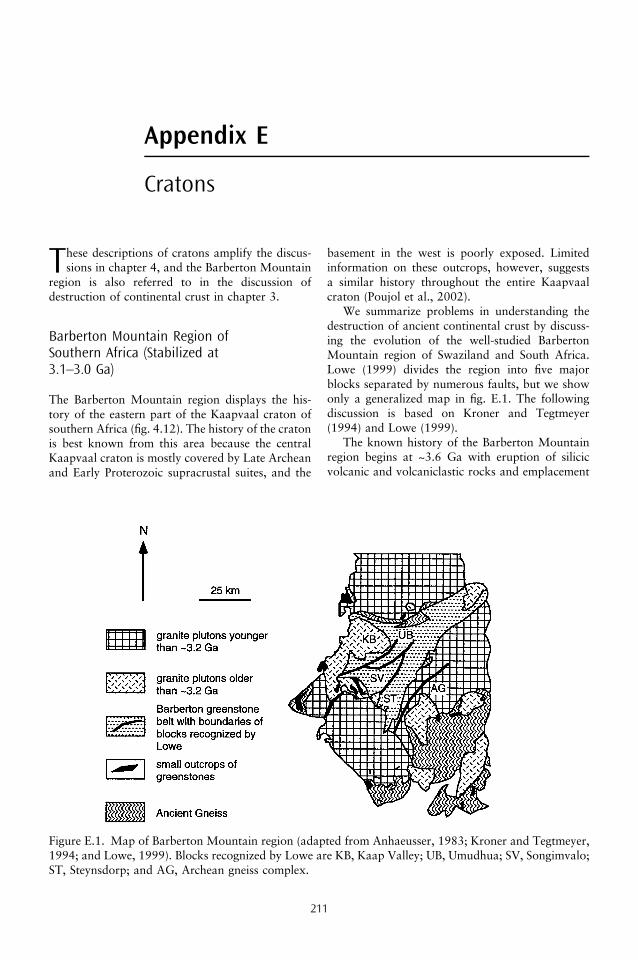
Appendix E
Cratons
These descriptions of cratons amplify the discus-sions in chapter 4, and the Barberton Mountain
region is also referred to in the discussion ofdestruction of continental crust in chapter 3.
Barberton Mountain Region ofSouthern Africa (Stabilized at3.1–3.0 Ga)
The Barberton Mountain region displays the his-tory of the eastern part of the Kaapvaal craton ofsouthern Africa (fig. 4.12). The history of the cratonis best known from this area because the centralKaapvaal craton is mostly covered by Late Archeanand Early Proterozoic supracrustal suites, and the
basement in the west is poorly exposed. Limitedinformation on these outcrops, however, suggestsa similar history throughout the entire Kaapvaalcraton (Poujol et al., 2002).
We summarize problems in understanding thedestruction of ancient continental crust by discuss-ing the evolution of the well-studied BarbertonMountain region of Swaziland and South Africa.Lowe (1999) divides the region into five majorblocks separated by numerous faults, but we showonly a generalized map in fig. E.1. The followingdiscussion is based on Kroner and Tegtmeyer(1994) and Lowe (1999).
The known history of the Barberton Mountainregion begins at ~3.6 Ga with eruption of silicicvolcanic and volcaniclastic rocks and emplacement
211
Figure E.1. Map of Barberton Mountain region (adapted from Anhaeusser, 1983; Kroner and Tegtmeyer,1994; and Lowe, 1999). Blocks recognized by Lowe are KB, Kaap Valley; UB, Umudhua; SV, Songimvalo;ST, Steynsdorp; and AG, Archean gneiss complex.

of TTG plutons that were magmatically related tothe siliceous volcanics and are now converted togneisses. A very small amount of metagraywackethat was deposited at this time contains some debriseroded from the gneisses.
Intrusion of TTG gneisses at ~3.6 Ga was thefirst episode in a series of similar intrusions thatwere emplaced, deformed, and metamorphosedfrom ~3.6 Ga to ~3.2 Ga. All of the gneisses showpositive "Nd, negative "Sr, and TDM ages a fewhundred million years older than their emplacementages, indicating continuous extraction from themantle over a period of at least 500 million years.The entire suite of gneisses has been widely referredto as the ‘‘Ancient Gneiss Complex,’’ and someworkers have proposed that the successive phasesformed at least a partial basement for deposition ofoverlying volcanic and sedimentary rocks.
From 3.50 to 3.43 Ga, these oldest rocks werefollowed by a basal series of mafic/ultramafic vol-canic and intrusive rocks (including komatiites) andoverlying silicic flows and volcaniclastic rocks.They were intruded by precursors of TTG gneissesat 3.46–3.45 Ga. Some debris from the gneissesoccurs in minor graywackes in the supracrustalsection, but most of the sedimentary rocks obtainedtheir components solely from the silicic volcani-clastics (some geologists refer to these rocks as‘‘epiclastic’’).
From 3.43 Ga to about 3.2 Ga, more komatiitesand mafic rocks were erupted and overlain byyounger sequences of silicic volcanics and asso-ciated sediments. Thick sequences of cherts werealso deposited during this time interval. They wereformed by syn- or post-depositional silicification ofvolcaniclastic rocks, sediments containing debrisfrom gneisses, and both biochemically and chemi-cally deposited sediments. Additional members ofthe Ancient Gneiss Complex were also intrudedduring this period.
The Barberton Mountain region became a stablecraton at about 3.1 Ga (Moser et al., 2001) with theemplacement of undeformed, diapiric granites/granodiorites between 3.2 and 3.1 Ga (we discusscratonic stabilization in chapter 3). Immediatelyafter this stabilization, graywackes of the MoodiesFormation were widely distributed over the newplatform and contain debris from all of the under-lying rock types.
The information summarized above yields threesignificant observations that must be explained inany effort to determine rates of crust productionand destruction in the Barberton Mountain region.(1) For approximately 500 million years, theBarberton Mountain region was an area of syn-
chronous and repeated production of mantle-derived TTG, mafic/ultramafic lavas, silicic lavas,and silicic pyroclastic and epiclastic rocks. (2)Continuous extraction of TTG precursors fromthe mantle suggests that a large volume of conti-nental crust was generated during this period, but itdid not produce a stable basement for deposition ofsupracrustal rocks. (3) Only a small amount ofsedimentary debris was produced by erosion ofTTG until intrusion of post-orogenic granites andrapid production of crust developed a stable cratonat 3.2–3.1 Ga.
Observations in the Barberton region illustratethe difficulty of determining rates of production anddestruction of crust in the past. Both rates couldhave been low in the Barberton region if the scarcityof preserved ancient crust was caused simply by theinability of the ancient mantle to produce new crustquickly. This seems unlikely because of the largevolume of silicic volcanism and also because ofisotopic data (see below) that suggest worldwideseparation of large amounts of continental crustfrom the mantle early in earth history.
For these reasons it seems more probable thatboth growth and destruction in the Barbertonregion were rapid instead of slow. Also, the lackof debris produced by erosion of basement TTGshows that this rapid destruction could not havebeen caused by erosion of significant areas of con-tinental crust above sealevel. For these reasons, weconclude that the destruction could only have beenaccomplished by direct subduction of thin, newlyformed, and unstable crust.
Guiana (Guyana) Craton (Stabilized at2.1–2.0 Ga)
The Guiana craton is the part of the Amazonianshield north of the Amazon River (fig. E.2; Gibbsand Barron, 1993; Sidder et al., 1995). With theexception of an exotic 3.0–2.5-Ga suite at thenorthern end of the craton, all of the rocks inthe craton are younger than 2.5 Ga (Gaudette etal., 1996). Stabilization occurred during theTransamazonian event between 2.1 Ga and 2.0 Ga.
More than 90% of the Guiana craton consists ofTTG gneisses. Limited dating and other isotopicinformation indicates that they evolved from themantle between about 2.5 Ga and 2.1 Ga. Intensedeformation apparently occurred throughout theirformation, culminating in the Transamazonianevent.
Two suites of supracrustal rocks occur in theGuiana craton. Most are typical greenstone assem-
212 Continents and Supercontinents

blages that consist mainly of metavolcanic rocks,with basalts dominant near the base of the sequenceand silicic rocks increasing in abundance upward(Vanderhaeghe et al., 1998). Komatiites have notbeen reported, and a complete basalt–andesite–dacite sequence is present instead of the bimodalbasalt–rhyolite assemblages of greenstone belts inmany cratons. Sediments include cherts and ironformation in addition to graywackes derived byerosion of metavolcanic rocks within the greenstonebelts.
A second group of pre-stabilization supracrustalrocks consists of shales and shaly sandstones with-out associated volcanic rocks. They apparentlywere deposited in comparatively stable shallow-water environments, but they were all intenselydeformed and intruded during the Trans-amazonian event.
A large variety of silicic igneous rocks wereintruded during the Transamazonian orogeny in afew tens of millions of years centered around 2.1Ga. The older suites are trondhjemitic (sodic), andmagmas emplaced during the later stages of tecton-
ism are more granitic (potassic). This syntectonicemplacement of the older magmas produced defor-mational structures similar to those in the olderTTG gneisses, and the various suites have not every-where been distinguished in the field. The youngerintrusives are diapiric granites whose lack of defor-mation demonstrates the end of compressive tecton-ism in the Guiana craton.
Almost immediately after stabilization of theGuiana craton, large parts of it were covered byflow and pyroclastic rocks of the Uatuma Group(Brito Neves, 2002). The eruptives and associatedshallow intrusions were probably formed over anage range of about 100 million years between ~2.0Ga and ~1.8 Ga. Rock types are mostly rhyoliticand dacitic, but they range from andesites to mildlyalkalic trachytes.
Extension of the Guiana craton began inUatuma time, and it clearly affected deposition ofthe overlying Roraima Group, a series of sand-stones with stratigraphic thicknesses of at least1800 m. The suite occurs in one large outcropand several smaller ones scattered over the craton,
Cratons 213
Figure E.2. Map of Guiana craton (compiled from Gibbs and Barron, 1983; Gibbs and Barron, 1993; andSidder et al., 1995).
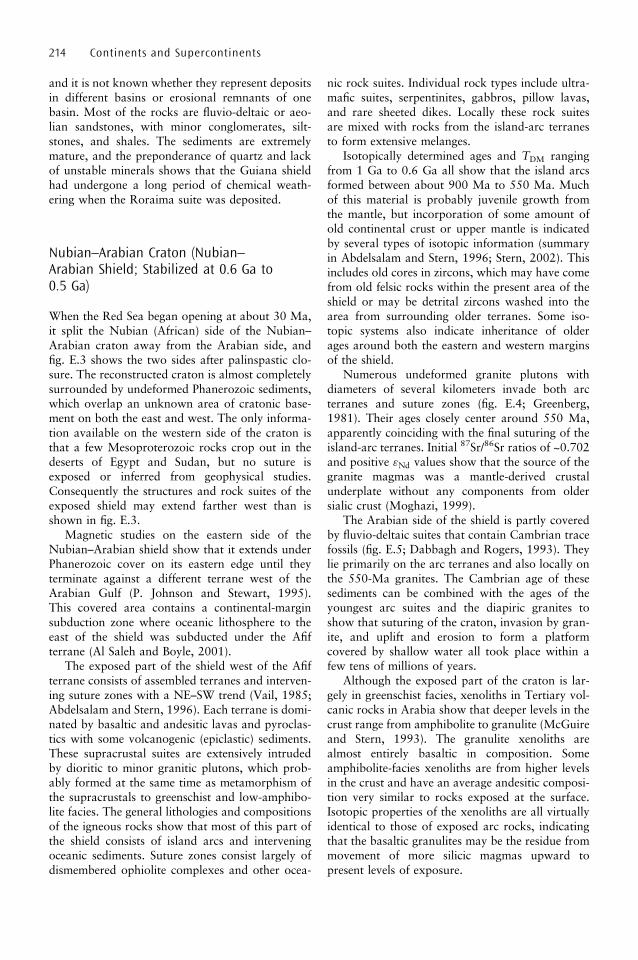
and it is not known whether they represent depositsin different basins or erosional remnants of onebasin. Most of the rocks are fluvio-deltaic or aeo-lian sandstones, with minor conglomerates, silt-stones, and shales. The sediments are extremelymature, and the preponderance of quartz and lackof unstable minerals shows that the Guiana shieldhad undergone a long period of chemical weath-ering when the Roraima suite was deposited.
Nubian–Arabian Craton (Nubian–Arabian Shield; Stabilized at 0.6 Ga to0.5 Ga)
When the Red Sea began opening at about 30 Ma,it split the Nubian (African) side of the Nubian–Arabian craton away from the Arabian side, andfig. E.3 shows the two sides after palinspastic clo-sure. The reconstructed craton is almost completelysurrounded by undeformed Phanerozoic sediments,which overlap an unknown area of cratonic base-ment on both the east and west. The only informa-tion available on the western side of the craton isthat a few Mesoproterozoic rocks crop out in thedeserts of Egypt and Sudan, but no suture isexposed or inferred from geophysical studies.Consequently the structures and rock suites of theexposed shield may extend farther west than isshown in fig. E.3.
Magnetic studies on the eastern side of theNubian–Arabian shield show that it extends underPhanerozoic cover on its eastern edge until theyterminate against a different terrane west of theArabian Gulf (P. Johnson and Stewart, 1995).This covered area contains a continental-marginsubduction zone where oceanic lithosphere to theeast of the shield was subducted under the Afifterrane (Al Saleh and Boyle, 2001).
The exposed part of the shield west of the Afifterrane consists of assembled terranes and interven-ing suture zones with a NE–SW trend (Vail, 1985;Abdelsalam and Stern, 1996). Each terrane is domi-nated by basaltic and andesitic lavas and pyroclas-tics with some volcanogenic (epiclastic) sediments.These supracrustal suites are extensively intrudedby dioritic to minor granitic plutons, which prob-ably formed at the same time as metamorphism ofthe supracrustals to greenschist and low-amphibo-lite facies. The general lithologies and compositionsof the igneous rocks show that most of this part ofthe shield consists of island arcs and interveningoceanic sediments. Suture zones consist largely ofdismembered ophiolite complexes and other ocea-
nic rock suites. Individual rock types include ultra-mafic suites, serpentinites, gabbros, pillow lavas,and rare sheeted dikes. Locally these rock suitesare mixed with rocks from the island-arc terranesto form extensive melanges.
Isotopically determined ages and TDM rangingfrom 1 Ga to 0.6 Ga all show that the island arcsformed between about 900 Ma to 550 Ma. Muchof this material is probably juvenile growth fromthe mantle, but incorporation of some amount ofold continental crust or upper mantle is indicatedby several types of isotopic information (summaryin Abdelsalam and Stern, 1996; Stern, 2002). Thisincludes old cores in zircons, which may have comefrom old felsic rocks within the present area of theshield or may be detrital zircons washed into thearea from surrounding older terranes. Some iso-topic systems also indicate inheritance of olderages around both the eastern and western marginsof the shield.
Numerous undeformed granite plutons withdiameters of several kilometers invade both arcterranes and suture zones (fig. E.4; Greenberg,1981). Their ages closely center around 550 Ma,apparently coinciding with the final suturing of theisland-arc terranes. Initial 87Sr/86Sr ratios of ~0.702and positive "Nd values show that the source of thegranite magmas was a mantle-derived crustalunderplate without any components from oldersialic crust (Moghazi, 1999).
The Arabian side of the shield is partly coveredby fluvio-deltaic suites that contain Cambrian tracefossils (fig. E.5; Dabbagh and Rogers, 1993). Theylie primarily on the arc terranes and also locally onthe 550-Ma granites. The Cambrian age of thesesediments can be combined with the ages of theyoungest arc suites and the diapiric granites toshow that suturing of the craton, invasion by gran-ite, and uplift and erosion to form a platformcovered by shallow water all took place within afew tens of millions of years.
Although the exposed part of the craton is lar-gely in greenschist facies, xenoliths in Tertiary vol-canic rocks in Arabia show that deeper levels in thecrust range from amphibolite to granulite (McGuireand Stern, 1993). The granulite xenoliths arealmost entirely basaltic in composition. Someamphibolite-facies xenoliths are from higher levelsin the crust and have an average andesitic composi-tion very similar to rocks exposed at the surface.Isotopic properties of the xenoliths are all virtuallyidentical to those of exposed arc rocks, indicatingthat the basaltic granulites may be the residue frommovement of more silicic magmas upward topresent levels of exposure.
214 Continents and Supercontinents

Cratons 215
Figure E.3. Map of Nubian–Arabian shield (compiled from Vail, 1985, and Al Saleh and Boyle, 2001).Named suture zones are Nabitah, Urd, and al-Amar. The gray pattern that occupies most of the shieldincludes numerous terranes with small lithologic differences and various names used by differentinvestigators.

216 Continents and Supercontinents
Figure E.4. Younger granite pluton intruding Neoproterozoic wall rocks in eastern Egypt (photo byJ.J.W.R.).
Figure E.5. Wajid Formation of Saudi Arabia (topof peak), showing flat-lying Lower Cambriansediments resting unconformably on deformedNeoproterozoic basement (photo by J.J.W.R.).

Appendix F
Anorogenic Magmatic Suites
Descriptions of these anorogenic magmatic suitesamplify discussions in chapter 4.
Arsikere Granite
The 2.5-Ga Arsikere Granite is a roughly circularpluton with an outcrop area of ~75 km2 in theWestern Dharwar craton (WDC) of India (fig. 4.2;Rogers, 1988). A slight indication of ring structureis shown along part of the margin by a narrow zoneof granite that apparently fractionated from themain part of the pluton. A very discordant age ofeuhedral zircons and a whole-rock Rb–Sr age showoriginal crystallization at ~2.6 Ga (J. Miller et al.,1996), the same time as granulite-facies meta-morphism at the southern margin of the WDC(see below). An initial 87Sr/86Sr value of 0.702suggests derivation of the Arsikere magma from alower crust that had been depleted in Rb at sometime older than 2.5 Ga, presumably when the WDCwas stabilized at 3.0 Ga.
Major minerals are typical quartz, K feldspar,and sodic plagioclase, but many of the minor andtrace minerals are very unusual. Euhedral epidotewas formed by crystallization in the magma ratherthan by alteration of primary Ca-bearing minerals.Euhedral sphene is abundant, and high oxygenfugacities are shown by incorporation of all of theTi in sphene, leaving Ti-free magnetite as the onlyopaque mineral. High concentrations of HF in themagmatic fluids are demonstrated by the presenceof magmatic fluorite and high fluorine contents ofboth biotite and muscovite.
The mineralogy, composition, and isotopicproperties of the Arsikere Granite suggest twoproperties of the stabilized WDC. One is that theArsikere magma was produced from a lower crustthat had a low water content and was depleted inLIL elements. The second is that generation of themagma may have been possible only because of thepresence of nonhydrous fluids such as HF.
Alno Island
The alkaline–carbonatite complex of Alno Islandand related suites in Sweden were emplacedbetween 610 Ma and 530 Ma into ~2-Ga gneissesof the Baltic shield (Morogan and Lindblom,1995). The principal Alno complex has a diameterof ~4 km and consists of at least one ring dikeand two small intrusions. Associated rocks includevolcanic vents containing breccia and tuff, carbo-natite plugs, and dikes consisting of silicate rocks,carbonatite, and kimberlite. Principal intrusiverocks are ijolites, accompanied by pyroxenite,other alkalic mafic rocks, nepheline syenite, andsiliceous carbonatite. Much of the intrusion issurrounded by a zone of fenitization, whereCO2-rich fluids permeated the surrounding wallrocks. Rock compositions show that the silicatemagmas contain some components from the man-tle, but whether some are from the lower crust isunclear.
Fluid inclusions in the Alno suite have beenintensely studied. Compositions of different typesof fluids in various minerals and rocks include: athree-phase suite consisting of liquid H2O þ liquidCO2 þ vapor; liquid H2O þ solids that commonlyinclude NaCl; liquid H2O þ vapor containingH2O and CO2; and a single phase of miscibleH2O and CO2. Some of the differences in fluidswere controlled by immiscibility between silicateand carbonate magmas at depth. Fluids containingas much as 40% NaCl developed during crystal-lization of silicates as magmas rose in the complex.Many of the fluids in crystals that formed near thesurface seem to have been diluted with surfacewater.
The Alno suite demonstrates that magmatismcan occur in areas that appear to have been dor-mant for 1.5 billion years provided sufficient fluidsare available to mobilize the melts. At Alno, thosefluids contained high concentrations of NaCl aswell as H2O and CO2.
217
Abu Khrug
The ~90-Ma ring complex at Abu Khrug, Egypt,is one of numerous ring complexes eruptedthrough the Nubian–Arabian craton throughoutthe Phanerozoic (Landoll et al., 1994). Rocktypes include rhyolitic and trachytic volcanicsand shallow intrusive alkali syenites, quartz sye-nites, nepheline syenites, and minor dikes thatrange from gabbro to trachyte. Sodic mineralssuch as aegerine and riebeckite are common,along with feldspathoids in the undersaturatedrocks. The only evidence of fluid activity at AbuKhrug is widespread hydrothermal alteration, butSn mineralization in a similar complex in SaudiArabia (Silsilah) shows the importance of HF in itsformation (DuBray, 1986).
Isotopic evidence indicates that gabbros that areregarded as parental magmas at Abu Khrug werederived almost completely from a basaltic uppermantle. The "Nd value of the gabbros is þ4.4,significantly higher than could have been derivedfrom any sialic rocks of the crust. Similar positive"Nd values also occur in alkali syenites and nephelinesyenites, but quartz syenites have lower 143Nd/144Ndratios that indicate crustal assimilation.
Magmatism at Abu Khrug and elsewhere in theNubian–Arabian craton demonstrates that many
areas of the underlying mantle were fertile (capableof producing magmas) for several hundred millionyears after cratonic stabilization. There is no indi-cation that fluids caused the magmatism at AbuKhrug, but HF and probably other species wereimportant in some of the other anorogenic com-plexes in the Nubian–Arabian shield.
Ol Doinyo Lengai
The Eastern Branch of the East African Rift Valleywas the site of eruption of voluminous alkali-olivinebasalt, both as valley filling and as large cones(chapter 10). In the southern part of the rift, thismagmatism produced comparatively recent vol-canoes such as Kilimanjaro and Ngorongoro inTanzania, but about 1 million years ago renewedfaulting developed a sharp western edge of the riftvalley and caused a sudden change in volcanicactivity (fig. F.1). At the same time, the typicalbasaltic volcanism ceased and was replaced byeruption of magmas that were highly alkaline andrich in carbonates. This magmatism built majorvolcanoes, both within and just outside of the rift,plus areas of carbonate-rich spatter cones.
The alkaline magmatism produced mostly pho-nolite and some rocks so undersaturated that they
218 Continents and Supercontinents
Figure F.1. Map showing volcanism and rifting in Ol Doinyo Lengai area (adapted from J. Dawson,1989).

are referred to nephelinite. These silicate rocks plusminor carbonatite built the modern cones as stra-tovolcanoes. The most recent volcanic activity is inOl Doinyo Lengai, which is the only active volcanoin the world to erupt lavas that consist of natrocar-bonatite, mostly sodium carbonate plus smallamounts of other carbonates (J. Dawson, 1989).The lavas and fragments erupt at temperatures of~6008C, and the liquids are so fluid that they haveviscosities only slightly higher than water. Becausethey are completely soluble, the natrocarbonatitesremain only briefly on the surface before they aredissolved and washed away, partly to form thealkalic Lake Natron.
The eruption of nepheline-rich magmas in thispart of the East African rift system clearly wasrelated to the increase in extension that causedfaulting at ~1 Ma. This relaxation provided thenew volcanoes access to some magma reservoirwith very low SiO2 concentrations, high concentra-tions of CO2 and H2O, and apparently a source ofNa. Similar fluids containing CO2, H2O, and Na-rich brine have been observed in other alkali–carbonate complexes, but the concentrations aregenerally lower than at Ol Doinyo Lengai.
Matsoku Kimberlite
Kimberlites are volatile-rich eruptions from theupper mantle that commonly reach the surface as
‘‘pipes.’’ Many of them consist mostly of brecciaand other pyroclastic material, some of which hasbeen blown through the air. Minor liquid phasescrystallize as dikes, usually at greater depth than thebreccias. Components are all from the upper mantleand include crystals of mantle minerals (xeno-crysts), xenoliths of peridotite and rocks that hadbeen altered by upper-mantle processes, andhydrous alteration products of almost everything(fig. F.2). Some kimberlites contain diamonds,showing their derivation from a depth of morethan 100 km.
Kimberlites have been formed at virtually allages from the Middle Proterozoic to the Tertiary.They are all continental and are most common inexposed shields. They also occur, however, in cra-tonic areas covered by sediments and volcanics, andsome were erupted through comparatively youngorogenic belts.
We use the pipe at Matsoku, Lesotho, as anexample of kimberlites. It contains an assemblageof components that provides a large amount ofinformation about the origin of kimberlite and itssignificance for studies of cratons and their under-lying mantle (Olive et al., 1997). It was intruded at90 Ma into basalts of the supracrustal Karoo basin,which lies on the margin between the Kaapvaalcraton and Late Proterozoic orogenic belts to thesouth. The kimberlite contains a large variety ofxenoliths from the lithospheric upper mantle,including peridotite that is apparently unaltered
Anorogenic Magmatic Suites 219
Figure F.2. Photomicrograph of metasomatic vein of mica, amphibole, rutile, and ilmenite (MARID)formed by infiltration of melt into ancient lithospheric mantle less than 100 million years before eruption ina kimberlite (courtesy of Graham Pearson).
and peridotite that had been intruded by metaso-matic veins and dikes.
Osmium isotopic studies of the various xenolithsshow different times when Re was almost comple-tely removed from them and their 187Os/188Osratios were established. For unaltered peridotitesand wall rocks around dikes these ages rangefrom about 2200 Ma to 1200 Ma, whereas theyvary from ~300 Ma to ~150 Ma for veins, dikes,and other metasomatized fragments. All of theseages are much younger than the 3100-Ma age ofthe Kaapvaal craton and suggest that the entire
underlying upper mantle has been modified sincecratonic evolution was complete. The latest andmost recognizable metasomatism probablyoccurred a few hundred million years before erup-tion of the kimberlite.
The Matsoku kimberlite demonstrates the extentto which upper mantle is modified as long as 3billion years after stabilization of the overlying cra-ton. It also shows that this modification probablycould not have occurred without the introductionof new fluids from elsewhere in the earth.
220 Continents and Supercontinents

Appendix G
Orogenic Belts of Grenville Age
Belts of Grenville age are shown in fig. 7.1, whichuses the classification into interior magmatic
and exterior thrust belts identified in the discussionof the Grenville belt of eastern North America (seebelow). We begin with an extended discussion ofthe type Grenville belt of eastern North Americaand continue with belts of similar age elsewhere inthe world.
Grenville Belt of Eastern Canada
The Grenville ‘‘front’’ cuts abruptly across thesoutheastern margin of the Superior craton of theCanadian shield (fig. G.1). The front separates NE–SW-trending granulite-facies rocks of the Grenvilleprovince from rocks of various orientations in theSuperior province. Early work found that somerock suites of the Superior province could be corre-lated across the front into the Grenville belt, show-ing that at least part of the Grenville belt wasreworked crust of continental North America.Further studies, aided by an intense program ofreflection-seismic work, now demonstrate a com-plex history of the Grenville belt that began atabout 1.8 Ga and continued until final consolida-tion followed by rifting at some time younger than1 Ga (reviews by Rivers, 1997, and Davidson,1998).
Figure G.1 illustrates the basic structure of theGrenville belt in eastern Canada. It is dominated bynorthwest-vergent thrusts that bring a series of dif-ferent terranes on top of each other (Louden andFan, 1998; Carr et al., 2000; Ludden and Hynes,2000; Mereu, 2000; D.J. White et al., 2000). Thethrusts generally root into some type of decollementat depths of ~25 km. The rock underlying thedecollement is generally unknown, and some work-ers have speculated that it might be an extension ofthe Superior craton. This implies overthrusting ofthe craton by several hundred kilometers, which hasbeen demonstrated in numerous younger orogens(chapter 5).
On the northwestern margin of the Grenvillebelt, rocks of the Superior province are coveredby a ‘‘parautochthon’’ of granulite-facies rocksthat consist at least partly of metamorphosedSuperior suites. The rocks are mostly felsic withsome possible metamorphosed greenstone assem-blages. Because of the intense metamorphic over-printing, ages of protoliths are difficult todetermine, but at least some rocks younger thanthe Superior craton are apparently interspersed.
The next belt to the southeast is the CentralGneiss belt (also referred to as Laurentia þLaurentian margin), which consists of para- andorthogneisses generally in granulite to high-amphi-bolite facies (Ketchum and Davidson, 2000). Theboundary between the Central Gneiss belt and theparautochthon is clearly one or more of the north-west-vergent thrusts, but the exact location is un-certain because some of the suites regarded asparautochthonous may be allochthonous. Mostlithologies in the gneiss belt are felsic, includingmetasediments originally deposited along the mar-gin of the Superior craton. Ages and TDM values are1.7 Ga and slightly younger, indicating that mostcomponents of the belt were newly created in theProterozoic (Guo and Dickin, 1996; Dickin, 1998,2000). Efforts to find a suture zone within the belthave been complicated by the scarcity of maficrocks that might represent oceanic lithosphere,such as metagabbro and eclogite, but some out-crops suggest ocean closure within the gneiss beltat ~1.2 Ga.
All components of the Composite Arc belt areclearly allochthonous to the Superior craton. Rocksin the belt consist of a variety of lithologies com-monly formed in island arcs, including both cal-calkaline and bimodal volcanic suites, clasticsediments, and minor carbonate rocks. Some sedi-ments probably formed in backarc basins and con-tain debris from both the developing arcs and theNorth American margin. Ages and TDM valuesindicate juvenile formation at ~1.3–1.2 Ga. Thearc belt contains numerous individual terranes,
221

and the entire assemblage was clearly swepttogether by the early part of the Grenville orogeny.
The Frontenac–Adirondack belt lies between theComposite Arc belt and Phanerozoic rocks thatcover the southeastern margin of the Grenville oro-gen. Much of the belt contains quartzofeldspathicgneiss and marble in low-granulite to high-amphi-bolite facies. The Adirondack highlands, however,consist largely of AMCG massifs, dominated byanorthosite and charnockite. These intrusive suiteswere emplaced mostly between ~1.2–1.0 Ga intometasediments that probably had been deposited at~1.3–1.2 Ga and metamorphosed at approximatelythe same time as igneous intrusion.
Assembly of most of the terranes in the Grenvillebelt may have been complete by ~1.4 Ga, withmetamorphism and compression of the terranesoccurring later (Martignole and Friedman, 1998;Hanmer et al., 2000). Very little activity occurredfrom ~1.4–1.3 Ga, consistent with data from theSveconorwegian belt (see below), and possiblyrelated to the breakup of the supercontinent
Columbia (see below). The earliest phases of theGrenville compression and metamorphism occurredat ~1.3–1.2 Ga, regarded by some workers as aseparate Elzivirian orogeny. Thrusting and meta-morphism continued from ~1.2–1.0 Ga throughoutthe Grenville belt, with brief interruptions whenlocal crustal extension accompanied the intrusionof AMCG complexes. The final stages of theGrenville orogeny recorded in present exposurestook place slightly younger than 1.0 Ga, whenpost-orogenic granites were intruded. Extensionbegan at ~0.9 Ga (Streepey et al., 2000).
In addition to the classification of terranes usedabove, Gower et al. (1990) separated the Grenvilleorogen into an ‘‘exterior thrust belt’’ and an ‘‘inter-ior magmatic belt.’’ The thrust belt includes all ofthe parautochthon and the northwestern part of theCentral Gneiss terrane, both of which exhibit onlyvery minor magmatism. This absence maystrengthen arguments that the inner part of thegneiss belt contains significant components ofcrust from the Superior craton. All areas southeast
222 Continents and Supercontinents
Figure G.1. Grenville orogen (adapted from Rivers, 1997; Davidson, 1998; Louden and Fan, 1998; Carr etal., 2000; Ludden and Hynes, 2000; Mereu, 2000; D. White et al., 2000).
of the thrust belt contain various types of graniticrock suites, presumably associated with the con-solidation of juvenile terranes.
The interior magmatic belt is defined largely bythe presence of granites that were intruded in thegeneral age range of 1.2–0.9 Ga. The granites com-monly occur as individual plutons and are notassociated with other igneous rocks of comparableages. These granites are apparently post-orogenicvarieties characteristic of intercontinental belts thatresult from collision of two continental land masses(chapter 5).
Grenville Rocks in Areas of NorthAmerica Outside the Type GrenvilleBelt
The Grenville front has been traced beneathPhanerozoic cover through much of the easternand southern United States. Grenville outcropsoccur in scattered locations in the thrust complexesof New England, the Blue Ridge Mountains, andparts of West Texas (Rankin et al., 1993; Faill,1997). Rocks of Grenville age are very sparselyexposed in northern Mexico, but it is not clearwhether they are a southern continuation of olderProterozoic accretionary belts in the southwesternUnited States or are exotic (Sanchez-Zavala et al.,1999). Rocks of the Oaxaquia terrane in southernMexico are clearly exotic to North America, and wediscuss them below.
Grenville exposures in the Blue RidgeMountains consist mostly of ortho- and para-gneisses with ages of parent rocks in the generalrange of 1.2–1.0 Ga (Rankin et al., 1993).Metamorphism to low-granulite or high-amphibo-lite facies occurred at ~1 Ga, consistent with ages inparts of the Grenville orogen that are betterexposed. Many of the outcrops show no evidenceof intrusion at this time and presumably representthe exterior thrust belt of the Grenville orogen, butsome of the gneissic suites were intruded by granitesand similar rocks at ~1.0 Ga, placing them as partof the interior magmatic belt. All of the outcropsare in thrust complexes and can be regarded eitheras parautochthonous or as allochthonous blocksthat originated very close to the North Americancontinental margin.
Grenville outcrops in Texas clearly are parts ofthe interior magmatic belt. Metasedimentary andmetavolcanic rocks of the basement in the Llanoarea apparently evolved at some time before 1.1 Ga,when they were compressed and metamorphosed to
high-amphibolite facies (Rougvie et al., 1999). Thisbasement was extensively intruded by diapiric gran-ites at ~1 Ga, and this emplacement stabilized thecrust against further deformation and metamorph-ism (D. Smith et al., 1997). The FranklinMountains at the western tip of Texas contain asuite of sedimentary rocks metamorphosed at ~1.3Ga and intruded by granites and related igneousrocks at ~1 Ga (Rankin et al., 1993; D.R. Smith etal., 1997).
Sveconorwegian Belt
The Sveconorwegian belt along the southern mar-gin of the Baltic shield is almost identical to theoutcropping part of the Grenville belt (Starmer,1993, 1996; Cosca et al., 1998). The Sveco-norwegian frontal deformation zone is a north-vergent thrust complex that is equivalent to theGrenville front (Juhlin et al., 2000). It separatesthe Baltic shield from rocks deformed and intrudedmostly during the period 1.1–1.0 Ga (Andersson etal., 1999; Bingen et al., 2001; Johansson et al.,2001). The belt consists mostly of supracrustalrocks metamorphosed to low-granulite or high-amphibolite facies and separated by terrane bound-aries indicating accretion of individual arcs. SomeAMCG complexes within the belt developed at ~1.1Ga, roughly synchronous with similar suites in theGrenville terrane. The metamorphic rocks wereintruded by granite between ~1.0–0.9 Ga, indicatingthat the Sveconorwegian belt is mostly within theinternal magmatic part of Grenville orogens.
Oaxaquia
Much of eastern Mexico appears to be underlain bya basement of Grenville age, and Ortega-Gutierrezet al. (1995) proposed the name Oaxaquia for thisvery large terrane. The major exposure is theOaxacan complex in southern Mexico (Keppieand Ortega-Cutierrez, 1999; Keppie et al., 2001),but numerous smaller suites of Proterozoic rocksare exposed through Phanerozoic cover farthernorth (Lawlor et al., 1999; Weber and Koehler,1999; Lopez et al., 2001). Principal rock typesinclude paragneisses formed from clastic rocksand calcsilicates, felsic and basaltic orthogneisses,anorthosites and charnockites of AMCG com-plexes, and calcalkaline granite. Northward andwestward thrusting and metamorphism to low-granulite and high-amphibolite facies occurred at
Orogenic Belts of Grenville Age 223
~1 Ga and slightly younger. This assemblage indi-cates a geologic history consisting of formation ofan island arc or continental-margin arc terminatedby metamorphism, deformation, and intrusion. Asin other Grenville belts, a brief period of relaxationof crustal stress is shown by the presence of theAMCG suites.
Many geologists have proposed that theGrenville rocks in Mexico are a southern extensionof the sparsely exposed Grenville belt in the easternand southern United States (see above). In somereconstructions of Rodinia, this extension wouldprovide a link with Grenville terranes in EastAntarctica, thus forming a continuous belt aroundmost of North America. This connection seems unli-kely, however, for two reasons. One is isotopic cor-relation of Oaxaquia with Colombia instead ofNorth America (Ruiz et al., 1999). The secondreason is that supracrustal rocks lying on theOaxaquia basement contain Lower Paleozoic fossilsmore similar to those of the western margin ofAmazonia than to fauna in North America(Stewart et al., 1999). Both of these types of evidencedemonstrate that Oaxaquia is essentially the south-ernmost of a series of Avalonian terranes in easternNorth America derived fromGondwana (chapter 5).
Sunsas Belt
The Sunsas belt extends along the western marginof the Amazonian shield and westward throughBolivia until it is buried by sediments of theAndean orogeny. We summarize the history ofthis belt and related suites from Litherland et al.(1989), Tassinari and Macambira (1999), Santos etal. (2000), Almeida et al. (2000), and Geraldes et al.(2001).
Beginning at ~1.3 Ga, thick sequences of flysch-type sediments were deposited in the central zone,exposed mostly in Columbia. At approximately thesame time, thinner sequences of orthoquartzites andrelated suites began to accumulate on the margin ofthe Amazonian shield to the east. Orogenic activitybegan at some time before 1.1 Ga, accompanied byeruption of minor basalts and larger volumes ofsyntectonic granites. The sediments were meta-morphosed mostly to amphibolite facies, althoughgranulites exposed in tectonic windows in theColombian Andes may be correlative with theSunsas belt and indicate a higher grade of meta-morphism characteristic of Grenville belts elsewhere.The syntectonic granites have ages of ~1.1 Ga, pre-sumably the peak of metamorphism, and post-oro-
genic suites slightly younger than 1 Ga indicate thetermination of orogeny at that time. The orogenicactivity developed numerous thrust sequences thatcarried metamorphosed platform sediments farthereast over the Amazonian shield and contributed tothe intense deformation of the thick metasedimentsin the central part of the orogen.
The Sunsas belt clearly showsmany similarities tothe Grenville and Sveconorwegian belts. Theyinclude peak metamorphism at ~1.1 Ga, transportof metasediments on numerous shear zones from theaxis of the orogen toward adjoining shields, andtermination of orogeny with intrusion of post-oro-genic granites just after 1.0 Ga. The Sunsas belt alsoshows the same division into interior magmatic zoneand exterior thrust zone as in the Grenville province.
Much of present South America west of theSunsas belt is underlain by rocks of Grenville age(discussion of Andes in chapter 6). Because the beltpresumably marks the western margin of theAmazonian shield in Grenville time, rocks to thewest must have accumulated against the Sunsasmargin at some time younger than 1 Ga. At presenttheir origin is unknown, partly because they havebeen discovered recently and partly because somany of them are exposed only in small windows.One explanation is that they are fragments of theGrenville terrane in North America, transportedtoward South America at the same time as SouthAmerican blocks with Grenville basements accretedto North America as Oaxaquia and relatedAvalonian terranes (see above).
Southern Africa and Dronning MaudLand
The southern part of the Mozambique belt (Luriobelt) bounds the eastern margin of the Kaapvaalcraton, and the Natal belt forms the southern mar-gin The Mozambique belt was active primarily dur-ing Pan-African (~0.5-Ga) time, but the Lurio beltcontains metasediments and metavolcanics thatwere metamorphosed and thrust northwestwardover the craton in a series of Grenville-age shearzones (Sacchi et al., 2000; Kroner et al., 2001).Metamorphism is generally in amphibolite faciesin the south, grading to granulite facies towardthe north. Granites include both highly deformedsyntectonic varieties and undeformed post-tectonicplutons.
The Natal belt has a Grenville history partlysuperimposed on a series of rock suites that evolvedmuch earlier in the Proterozoic (R. Thomas et al.,
224 Continents and Supercontinents
1993). The northern zone of the belt consists largelyof volcanic rocks in amphibolite facies, and thesouthern zone is mostly granulite-facies meta-sediments plus syn- to post-tectonic granites.Metamorphism of all of these rocks was near itspeak between ~1.1–1.0 Ga.
The Maudheim province of adjacent EastAntarctica contains a fragment of the Kaapvaal cra-ton (Grunehogna) plus metamorphosed supracrus-tal rocks. They include calcalkaline volcanic rocksand sediments consisting of graywackes, shales, andminor quartz–carbonate sequences (Groenewald etal., 1991). Metamorphism at 1.1–1.0 Ga convertedmost of these rocks to amphibolite facies, with somegranulites thrust over them. Synchronous deforma-tion caused tight folding and displacement of allrocks to the north in a series of thrust zones.
The similarity of geologic history in southernAfrica and Maudheim suggests that they developedas one unit during Grenville time (Moyes et al.,1993; Golynski and Jacobs, 2001). In particular,rocks in all provinces were thrust toward theKaapvaal craton, suggesting that a Grenville-ageocean was somewhere to the south of Maudheim,presumably now covered by the Antarctic icecap. Onthe basis of isotopic mapping,Wareham et al. (1998)suggested that southern Africa and Maudheim werealso connected to parts of West Antarctica and theFalkland Islands in Grenville time.
Eastern Ghats and Rayner Belts
The Eastern Ghats belt forms the eastern margin ofthe Archean shield of eastern India (fig. 7.1). It con-sists almost entirely of felsic charnockites andkhondalites plus minor granulitic mafic rocks meta-morphosed two (perhaps three) times during theProterozoic. The Terrane Boundary Shear Zone(TBSZ) is similar to the Grenville front and trans-ported granulite-facies rocks westward over thedominantly amphibolite-facies suites of theArchean cratons (Biswal et al., 2002). Retro-gression along the TBSZ converted some rocksfrom granulitic to high-amphibolite facies, indicat-ing that metamorphic activity continued duringthrusting.
Crustal separation (including TDM) ages of theprotoliths of virtually all rocks are older than 2 Ga(Shaw et al., 1997; Rickers et al., 2001). This reset-ting of older rocks and the absence of ophiolites orother evidence of ocean closure suggests that theentire Eastern Ghats belt formed by metamorphismand deformation of an eastern extension of the
Archean crust of India. The oldest recognizablemetamorphism was at ~1.6 Ga, but it was over-printed by the major tectonometamorphic event at~1 Ga, which established almost all of the structuralpatterns in the belt. Very minor overprintingoccurred locally at ~0.5 Ga.
In Pangea, the Eastern Ghats was separated fromthe Rayner belt of Antarctica by the ArcheanNapier complex (Biswal et al., 2002). The Raynerbelt is similar to the Eastern Ghats, showing gran-ulite-facies metamorphism at ~1 Ga and northward(present orientation) thrusting over the Napier com-plex (L. Black et al., 1987). In both belts, granulite-facies metamorphism occurred primarily duringGrenville time, both belts were thrust away fromcentral East Antarctica over adjoining Archean cra-tons, and neither belt exhibits evidence of oceanclosure within the belt. Presumably the closurethat created both orogenies was somewhere withinthe ice-covered part of East Antarctica. The EasternGhats appears to represent an exterior thrust belt,and the Rayner suite the interior magmatic belt, of atypical Grenville orogen.
Belts in Australia and Adjoined EastAntarctica
The Darling belt follows the western margin of theYilgarn craton of southwestern Australia, and theAlbany–Fraser belt wraps around its southern andsoutheastern cratonic margins (Harris, 1995; Myerset al., 1996). The orogenic belt of the MusgraveRange connects to the eastern end of the Fraser beltand extends eastward until covered by youngerrocks. The Albany–Fraser belt also connects withcoastal East Antarctica, and we discuss all of thesebelts in this section.
The Darling belt consists of three basementinliers surrounded by Phanerozoic sediments thathave been only slightly deformed (Harris, 1995;Wilde, 1999). Exposed or drilled basement showsa few ages slightly greater than 2 Ga, but mostrocks of the orogen are significantly younger.Most of the rocks consist of para- and orthogneissesand some late-tectonic granites with ages rangingfrom ~1.1–1.0 Ga. Deformation was mostly trans-pressional, with tectonic transport toward theYilgarn craton.
Rocks in the Albany belt are largely reworkedsuites of the Yilgarn craton, but they include juve-nile magmas and also sediments formed by erosionof both the Yilgarn craton and the juvenile rocks.Metamorphic grades range from high amphiboliteto low granulite, with tectonic transport toward the
Orogenic Belts of Grenville Age 225

Yilgarn craton during one or more periods of dex-tral transpression. The major tectonism was at ~1.3Ga, with significant overprint at ~1.2 Ga (Clark etal., 2000). Reworked rocks of the Yilgarn cratonform at least the northern part of the Albany beltand may form the basement throughout the belt(Black et al., 1992). Ages of inherited zircons inthe metasediments and TDM ages of magmatic pro-toliths range up to 3 Ga. The northern part of theorogen appears to be an exterior thrust belt, but alarge granitic intrusion in the south places that partin the interior magmatic zone. Harris (1993) corre-lated the Albany orogen with the Central IndianTectonic Zone (chapter 6).
The Fraser belt differs from the Albany beltmainly by the presence of the large Fraser maficigneous complex, which has been deformed andinterleaved with granulitic metasediments. In addi-tion, the belt contains reworked rocks of the Yilgarncraton, ortho- and paragneisses, migmatites, andwidespread granites. Some intrusive activity beganby ~1.7 Ga, but most of the tectonism was during aperiod of dextral transpression from 1.3–1.1 Ga.
The Musgrave belt forms the northern margin ofthe Gawler craton, possibly joining most ofProterozoic Australia to the Gawler craton andattached parts of East Antarctica (R. White et al.,1999). Deformation and metamorphism in theMusgrave belt occurred mostly from 1.3–1.2 Ga.During this time pre-existing felsic magmatic rocksand syntectonic orthogneisses were metamorphosedto granulite and high-amphibolite facies. Zircons inthese older rocks have ~1.2-Ga overgrowths,approximately the same age as the emplacement ofpost-tectonic granites.
Several areas of coastal East Antarctica havealmost identical histories to the Albany–Fraserorogen (Harris, 1995). The Windmill Islands,Bunger Hills, and Mirnvy region all show high-grade metamorphism at ~1.2–1.0 Ga of protolithsthat range in age from Archean to MiddleProterozoic. These regions also exhibit the samenorthward (present orientation) tectonic transportaway from an apparent suture zone under theAntarctic icecap. Boger et al. (2000) correlatethis belt westward around much of coastal EastAntarctica, with the exception that orogenic activ-ity with complex vergences occurred in one suiteof the Prince Charles Hills from 1.0–0.9 Ga.
Transantarctic Mountains
The Transantarctic Mountains are mostly the site ofthe Ross orogeny, a tectonometamorphic event that
occurred from the latest Proterozoic to the beginningof the Phanerozoic. Early investigations suggestedthe presence of a Grenville-age orogeny, but theevidence is questionable. By contrast, recent workindicates the possibility of an orogeny at ~1.7 Ga(Nimrod orogeny). At this time overgrowths wereformed on inherited Archean zircons, conformablezircons crystallized in intrusive rocks, and zirconscrystallized in eclogites (Goodge et al., 2001).
Present data show no evidence of a Grenvilleevent in the Transantarctic Mountains. Conse-quently, any collision between this margin of EastAntarctica and any other continental block presum-ably occurred either before the creation of Rodiniaor in Pan-African time.
South China (Yangtze) Craton
The oldest rocks in the South China craton haveages greater than 3.0 Ga, and they are followed byan extremely complex series of events (Qiu andGao, 2000). The entire craton apparently did notdevelop as a coherent block until terranes in thesoutheast (present orientation) collided with olderareas in the north at some time in the Middle toLate Proterozoic (Chen and Jahn, 1998). The laststages of development seem to have occurred inGrenville time, and the craton was sufficientlyestablished that some models show its location inRodinia (Li et al., 1995).
Kibaran Event of Central Africa
The type Kibaran of central Africa is an orogenicbelt in Congo on the eastern margin of the Congocraton, and its name is widely used to refer toorogenies in the general age range of 1.4–1.0 Ga.Areas along the western flank of the Tanzania cra-ton in Burundi and Tanzania, however, are betterknown than the type Kibaran (Rumvegeri, 1991;Meert et al., 1994; Deblond et al., 2001). This latterarea shows deposition of thin sediments on themargin of the craton, an orogenically active zoneto the west during the period of 1.4–1.2 Ga, withthrusting toward the Tanzanian craton interior andintrusion of granitic plutons at ~1.2 Ga. This his-tory is consistent with collision of the Congo andTanzanian cratons between ~1.4–1.2 Ga, and it ispossible that the Kibaran orogeny in its type areaterminated before orogenies in areas commonlyregarded as Grenville.
226 Continents and Supercontinents
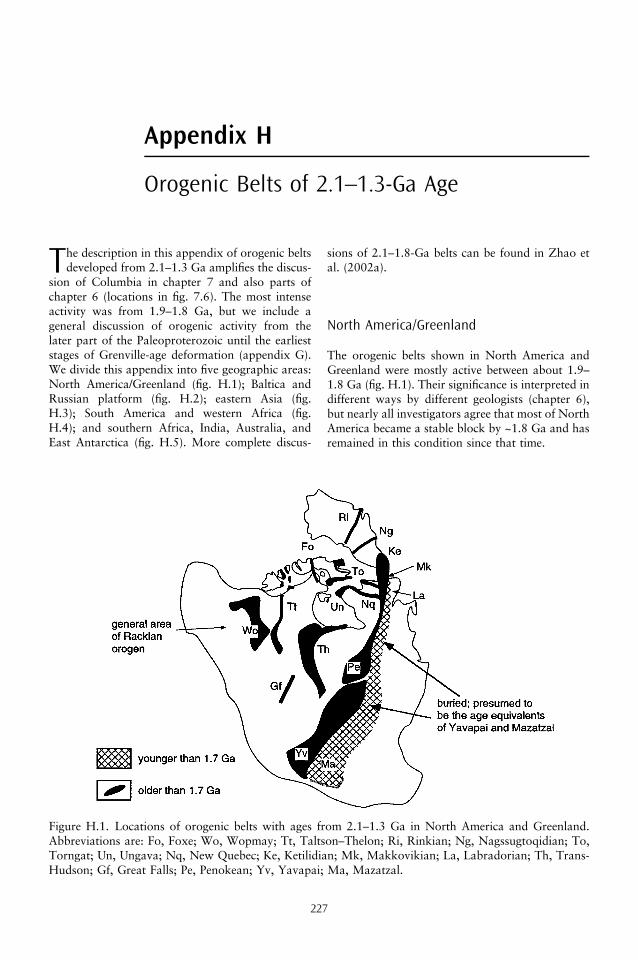
Appendix H
Orogenic Belts of 2.1–1.3-Ga Age
The description in this appendix of orogenic beltsdeveloped from 2.1–1.3 Ga amplifies the discus-
sion of Columbia in chapter 7 and also parts ofchapter 6 (locations in fig. 7.6). The most intenseactivity was from 1.9–1.8 Ga, but we include ageneral discussion of orogenic activity from thelater part of the Paleoproterozoic until the earlieststages of Grenville-age deformation (appendix G).We divide this appendix into five geographic areas:North America/Greenland (fig. H.1); Baltica andRussian platform (fig. H.2); eastern Asia (fig.H.3); South America and western Africa (fig.H.4); and southern Africa, India, Australia, andEast Antarctica (fig. H.5). More complete discus-
sions of 2.1–1.8-Ga belts can be found in Zhao etal. (2002a).
North America/Greenland
The orogenic belts shown in North America andGreenland were mostly active between about 1.9–1.8 Ga (fig. H.1). Their significance is interpreted indifferent ways by different geologists (chapter 6),but nearly all investigators agree that most of NorthAmerica became a stable block by ~1.8 Ga and hasremained in this condition since that time.
227
Figure H.1. Locations of orogenic belts with ages from 2.1–1.3 Ga in North America and Greenland.Abbreviations are: Fo, Foxe; Wo, Wopmay; Tt, Taltson–Thelon; Ri, Rinkian; Ng, Nagssugtoqidian; To,Torngat; Un, Ungava; Nq, New Quebec; Ke, Ketilidian; Mk, Makkovikian; La, Labradorian; Th, Trans-Hudson; Gf, Great Falls; Pe, Penokean; Yv, Yavapai; Ma, Mazatzal.
Wopmay (Bear Province)
The Wopmay orogen represents the earliest phaseof the growth of North America westward from theSlave craton (chapter 6). The eastern part of theorogen is largely a highly metamorphosed wedge ofcontinental-margin sediments thrust eastwardtoward the craton between ~1.9–1.84 Ga. Com-pression may have been caused by collision of acomplex terrane, possibly continental fragment,that now forms the western part of the orogen(Gandhi et al., 2001). Eastward subduction beneaththe continental margin formed the Great Bear andFort Simpson batholithic suites from ~1.9–1.8 Ga(Ross, 1991).
Racklan
To the west of the Wopmay orogen, the Racklanbelt is exposed primarily as the Wernecke Group,which underwent deformation both before and after1.3 Ga (Cook, 1992), and the Coppermine homo-cline, where sedimentation both preceded and fol-lowed eruption of the subduction-related Narakayvolcanic suite at ~1.7 Ga (Bowring and Ross, 1985).
Great Falls
The Great Falls tectonic zone is one of the majorright-lateral shears that cut the western part of theCanadian shield (chapter 6). Mueller et al. (2002)proposed that volcanic and sedimentary rockscharacteristic of island arcs were attached to theWyoming craton at ~1.85 Ga, when the cratonwas sutured to the Rae province (cratons shownin fig. 6.7).
Trans-Hudson and Taltson–Thelon
The Trans-Hudson and Taltson–Thelon orogenscut the Canadian shield into three parts and arecritical to an understanding of its history. We dis-cuss in chapter 6 how different investigators haveinterpreted these orogens as the result of continentalcollisions following the closure of wide oceanbasins and, conversely, as intracratonic orogensthat developed largely within a Canadian shieldthat had accreted by the end of the Archean.
Foxe, New Quebec, Torngat, andUngava/Cape Smith
Several belts are concentrated in eastern Canada(Foxe, New Quebec, Torngat, Ungava/Cape
Smith). All of these belts were active at ~2.0–1.8Ga, and if they were not internal (intracratonic orconfined), they contributed to a continental assem-bly that became coherent by no later than 1.8 Ga.They all contain abundant Archean rock thatapparently consists of reworked material from adja-cent cratons, but they also contain rock suites thatpresumably formed in island arcs and may repre-sent ophiolitic material from closing ocean basins(papers in Brewer, 1996; Wardle et al., 2002). TheFoxe orogen may be an eastward continuation ofthe Snowbird zone, which separates the Rae andHearne provinces. The Snowbird zone is clearly aright-lateral shear, but whether it represents a colli-sional belt or simply an intracontinental shear isvery controversial (Kopf, 2002).
Penokean
The Penokean orogen developed from 1.9–1.8 Gaalong the southern margin of the Superior craton. Itconsists mostly of a wedge of continental-marginsediments plus reworked parts of the Archean cra-ton and a batholithic suite formed during north-ward subduction beneath the Superior craton(Attoh et al., 1997). The southern margin of theorogen is covered by platform sediments of interiorNorth America, but apparently the southwardgrowth of North America continued throughoutmost of the Proterozoic (see discussion of Yavapaiand Mazatzal below).
Nagssugtoqidian
The Nagssugtoqidian orogen apparently crossesGreenland from the west to east coasts althoughmuch of it is covered by ice. The northern andsouthern parts consist largely of reworked rocksfrom adjacent Archean cratons, but the centralpart consists of highly deformed Paleoproterozoicmetasediments intruded at ~1.9 Ga by batholithicsuites and at ~1.8 Ga by pink granites that mayrepresent the final stages of orogenic deformation(Kalsbeek and Nutman, 1996; Whitehouse et al.,1998).
Rinkian
The Rinkian orogen of Greenland is almost com-pletely covered by ice, but it may be a continuationof the Foxe orogen of Labrador (Kalsbeek et al.,1998).
228 Continents and Supercontinents

Makkovikian and Ketilidian
The Ketilidian province of Greenland andMakkovik province of Labrador consist of felsicgneisses among voluminous batholithic suites.Most of the intrusions formed between approxi-mately 1.8–1.7 Ga and post-date thrusting towardthe continental interiors of Greenland and Canada(Kerr et al., 1996). In Labrador these suites areabruptly terminated southward by the Labra-dorian batholithic suite, which has ages in therange of 1.7–1.6 Ga.
The history of eastern North America is unclearbetween the time of the Makkovikian and Grenvilleorogenies, a period of several hundred millionyears. Gower et al. (1990) and Rivers (1997)described the pre-Grenville history of easternCanada as a period of continental-margin out-growth beginning at ~1.8 Ga followed by backarcrifting and stability from approximately 1.5–1.3Ga. This stability was terminated when the earlystages of the Grenville orogeny began shortly after1.3 Ga. Farther south in eastern North America,rocks older than Grenville crop out only in a fewisolated patches where they have been uncovered byerosion of Paleozoic thrust complexes in the BlueRidge province. They are all granulites and exhibitpoorly defined ages in the range of 1.8–1.6 Ga(Fullagar, 2002).
Labradorian
The Labradorian episode is primarily a time ofintrusion of batholithic magmas along the marginof North America in Labrador (Rivers, 1997).
Yavapai and Mazatzal
The Yavapai and Mazatzal orogens both contain aseries of accreted arcs and continental-marginsupracrustal rocks intruded by batholithic suites(Karlstrom and Humphreys, 1998). The Yavapaiprovince apparently completed its accretion in theperiod from 1.8–1.7 Ga, and the isotopically dis-tinct Mojave area has the same history as the rest ofthe Yavapai province (Barth et al., 2000; D.Coleman et al., 2002). The Mazatzal province fol-lowed from about 1.7–1.5 Ga and continued theprocess of outgrowth of the North American cra-ton. Mesoproterozoic growth was followed by theearly stages of the Grenville collisional orogeny(1.3–1.2 Ga), which consolidated this portion ofRodinia (Condie, 1992; Van Schmus et al., 1996).
Midcontinent North America is almost entirelycovered by undeformed sediments that began toaccumulate when the underlying basement was sta-bilized, but it is apparently underlain by extensionsof the Yavapai and Mazatzal orogens. The oldestrocks in this area belong to the Central PlainsOrogen and consist of metaigneous and metasedi-mentary rocks of amphibolite grade or lower (VanSchmus et al., 1993). Ages commonly range from1.8–1.6 Ga, consistent with those of the Yavapaiand Mazatzal orogens to the southwest. The gran-ite–rhyolite terrane south of the Central PlainsOrogen is identified by widespread magmatism cen-tered around 1.4 Ga, but the age of the underlyingbasement is unclear.
Baltica and Russia
Baltic Shield and East European Platform
Precambrian basement underlies a broad areaknown as the East European platform (discussionof Urals in chapter 5) and is exposed only in theBaltic and Ukrainian cratons (fig. H.2). The coveredregion may consist of three Late Archean andPaleoproterozoic blocks sutured at ~1.9 Ga alongthe completely covered Volhyn and Pachemel(Pachelma) belts (Claesson et al., 2001). An ~1.9-Ga suture is exposed in the northern part of theBaltic shield, where the Kola–Karelia belt bringstogether two Late Archean blocks, apparentlyby subduction beneath the northern block(Gorbatschev and Bogdanova, 1993).
Orogenic Belts of 2.1–1.3-Ga 229
Figure H.2. Locations of orogenic belts with agesfrom 2.1–1.3 Ga in Baltica and Russia.Abbreviations are: Kk, Kola–Karelian; Vo,Volhyn; Pa, Pachemel.
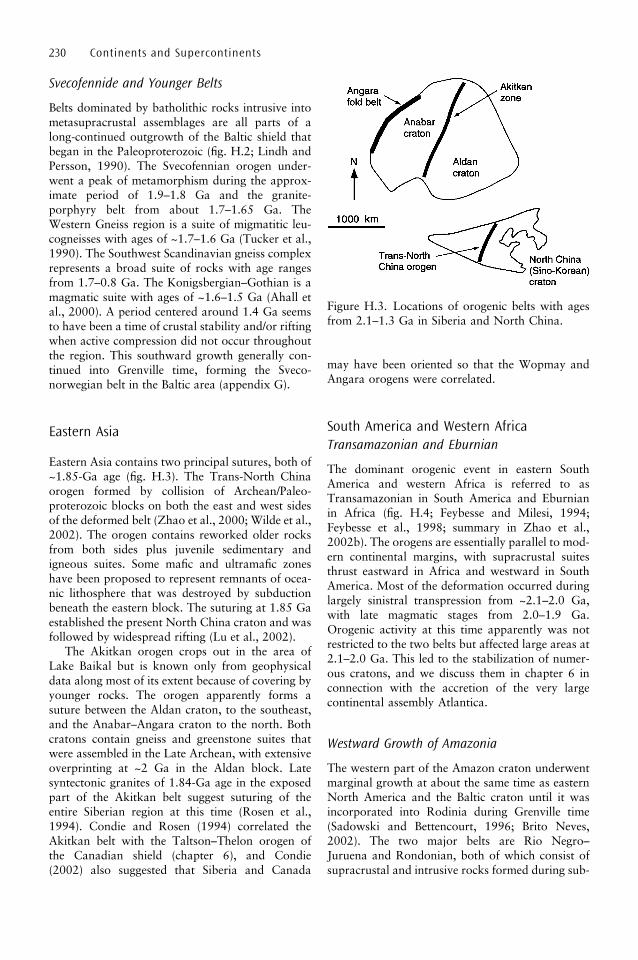
Svecofennide and Younger Belts
Belts dominated by batholithic rocks intrusive intometasupracrustal assemblages are all parts of along-continued outgrowth of the Baltic shield thatbegan in the Paleoproterozoic (fig. H.2; Lindh andPersson, 1990). The Svecofennian orogen under-went a peak of metamorphism during the approx-imate period of 1.9–1.8 Ga and the granite-porphyry belt from about 1.7–1.65 Ga. TheWestern Gneiss region is a suite of migmatitic leu-cogneisses with ages of ~1.7–1.6 Ga (Tucker et al.,1990). The Southwest Scandinavian gneiss complexrepresents a broad suite of rocks with age rangesfrom 1.7–0.8 Ga. The Konigsbergian–Gothian is amagmatic suite with ages of ~1.6–1.5 Ga (Ahall etal., 2000). A period centered around 1.4 Ga seemsto have been a time of crustal stability and/or riftingwhen active compression did not occur throughoutthe region. This southward growth generally con-tinued into Grenville time, forming the Sveco-norwegian belt in the Baltic area (appendix G).
Eastern Asia
Eastern Asia contains two principal sutures, both of~1.85-Ga age (fig. H.3). The Trans-North Chinaorogen formed by collision of Archean/Paleo-proterozoic blocks on both the east and west sidesof the deformed belt (Zhao et al., 2000; Wilde et al.,2002). The orogen contains reworked older rocksfrom both sides plus juvenile sedimentary andigneous suites. Some mafic and ultramafic zoneshave been proposed to represent remnants of ocea-nic lithosphere that was destroyed by subductionbeneath the eastern block. The suturing at 1.85 Gaestablished the present North China craton and wasfollowed by widespread rifting (Lu et al., 2002).
The Akitkan orogen crops out in the area ofLake Baikal but is known only from geophysicaldata along most of its extent because of covering byyounger rocks. The orogen apparently forms asuture between the Aldan craton, to the southeast,and the Anabar–Angara craton to the north. Bothcratons contain gneiss and greenstone suites thatwere assembled in the Late Archean, with extensiveoverprinting at ~2 Ga in the Aldan block. Latesyntectonic granites of 1.84-Ga age in the exposedpart of the Akitkan belt suggest suturing of theentire Siberian region at this time (Rosen et al.,1994). Condie and Rosen (1994) correlated theAkitkan belt with the Taltson–Thelon orogen ofthe Canadian shield (chapter 6), and Condie(2002) also suggested that Siberia and Canada
may have been oriented so that the Wopmay andAngara orogens were correlated.
South America and Western AfricaTransamazonian and Eburnian
The dominant orogenic event in eastern SouthAmerica and western Africa is referred to asTransamazonian in South America and Eburnianin Africa (fig. H.4; Feybesse and Milesi, 1994;Feybesse et al., 1998; summary in Zhao et al.,2002b). The orogens are essentially parallel to mod-ern continental margins, with supracrustal suitesthrust eastward in Africa and westward in SouthAmerica. Most of the deformation occurred duringlargely sinistral transpression from ~2.1–2.0 Ga,with late magmatic stages from 2.0–1.9 Ga.Orogenic activity at this time apparently was notrestricted to the two belts but affected large areas at2.1–2.0 Ga. This led to the stabilization of numer-ous cratons, and we discuss them in chapter 6 inconnection with the accretion of the very largecontinental assembly Atlantica.
Westward Growth of Amazonia
The western part of the Amazon craton underwentmarginal growth at about the same time as easternNorth America and the Baltic craton until it wasincorporated into Rodinia during Grenville time(Sadowski and Bettencourt, 1996; Brito Neves,2002). The two major belts are Rio Negro–Juruena and Rondonian, both of which consist ofsupracrustal and intrusive rocks formed during sub-
230 Continents and Supercontinents
Figure H.3. Locations of orogenic belts with agesfrom 2.1–1.3 Ga in Siberia and North China.
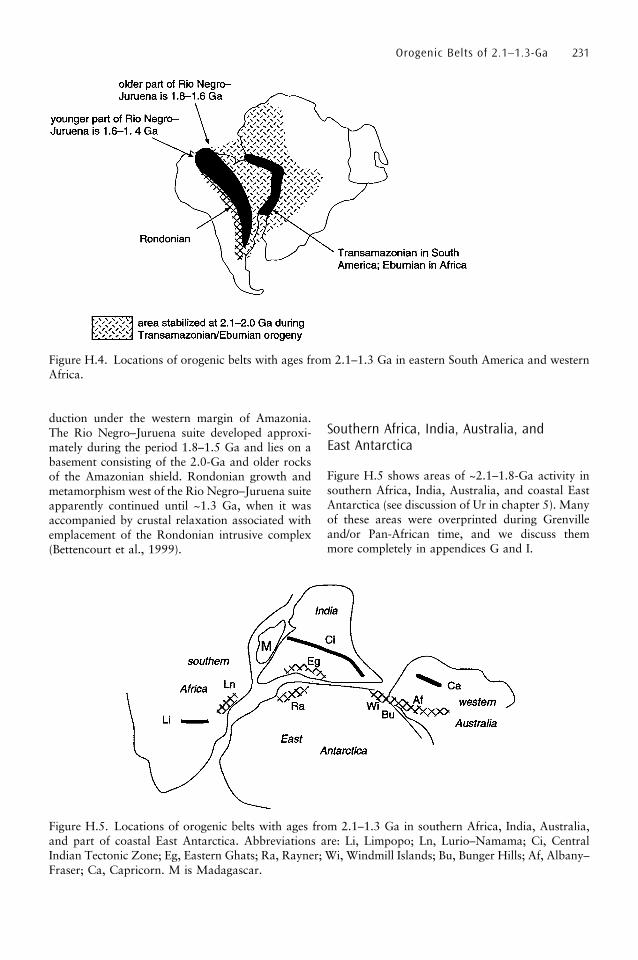
duction under the western margin of Amazonia.The Rio Negro–Juruena suite developed approxi-mately during the period 1.8–1.5 Ga and lies on abasement consisting of the 2.0-Ga and older rocksof the Amazonian shield. Rondonian growth andmetamorphism west of the Rio Negro–Juruena suiteapparently continued until ~1.3 Ga, when it wasaccompanied by crustal relaxation associated withemplacement of the Rondonian intrusive complex(Bettencourt et al., 1999).
Southern Africa, India, Australia, andEast Antarctica
Figure H.5 shows areas of ~2.1–1.8-Ga activity insouthern Africa, India, Australia, and coastal EastAntarctica (see discussion of Ur in chapter 5). Manyof these areas were overprinted during Grenvilleand/or Pan-African time, and we discuss themmore completely in appendices G and I.
Orogenic Belts of 2.1–1.3-Ga 231
Figure H.4. Locations of orogenic belts with ages from 2.1–1.3 Ga in eastern South America and westernAfrica.
Figure H.5. Locations of orogenic belts with ages from 2.1–1.3 Ga in southern Africa, India, Australia,and part of coastal East Antarctica. Abbreviations are: Li, Limpopo; Ln, Lurio–Namama; Ci, CentralIndian Tectonic Zone; Eg, Eastern Ghats; Ra, Rayner; Wi, Windmill Islands; Bu, Bunger Hills; Af, Albany–Fraser; Ca, Capricorn. M is Madagascar.

Southern Africa
The Zimbabwe craton was attached to theKaapvaal craton by collision along the Limpopobelt (Rollinson and Whitehouse, 2001). Most ofthe belt consists of Archean rocks that weredeformed and metamorphosed between 2.0–1.9Ga (Holzer et al., 1999). The northern edge of theZimbabwe craton seems to have undergone riftingat ~1.4 Ga, the age of the Chewore ophiolite in theZambezi belt (S. Johnson and Oliver, 2000).
India
Events with ages of 1.9 Ga to 1.4 Ga are wide-spread throughout India. The Delhi orogen ofnorthwestern India showed continued sedimenta-tion and deformation from the Paleoproterozoicinto the Mesoproterozoic, with ages of magmaticrocks from 1.9 Ga to 1.5 Ga (Chaudhary et al.,1984). Gneisses in the Meghalaya area of north-eastern India have a Rb–Sr age of ~1.7 Ga, andinclusions in a younger pluton have a Rb–Sr age of~1.5 Ga (Ghosh et al., 1994). Closure of northernand southern India occurred along the CentralIndian Tectonic Zone at ~1.8 Ga (Acharyya andRoy, 2000), and L. Harris (1993) correlated it withthe Albany belt of Australia.
The southernmost part of India consists largelyof rocks originally formed in the Paleoproterozoicand then overprinted during the Pan-African(Santosh et al., 2003). The southern margin of theArchean cratons of central India is a transition zoneto granulites (chapter 4), and the terrane directlysouth of the transition zone consists of Archeanrocks overprinted by younger events. The southernborder of this region is a dextral fault zone, whichseparates the overprinted Archean suites fromgneisses, granulites, and supracrustal rocks thatformed originally at ~1.9–1.8 Ga and were over-printed in Pan-African time.
The Eastern Ghats granulite terrane of easternIndia is mostly a suite of silicic metaigneous andmetasedimentary rocks that show abundant iso-topic evidence of Mesoproterozoic events priorto metamorphism during the Grenville (~1 Ga)and Pan-African (~0.5 Ga) events (Bhattacharya,1996; Arima et al., 2000; Dobmeier and Simmat,2002). Ultrahigh temperature metamorphism ofmetapelites occurred at ~1.6 Ga (Dasgupta et al.,1999). Cooling ages of allanite and monazite from apegmatite are from 1.7–1.6 Ga (Mezger and Cosca,1999). C. Shaw et al. (1997) reported ages up to 1.5Ga for a broad range of rock types and also showthat both felsic and mafic rocks have Sm–Nd whole-
rock ages of ~1.4 Ga, with some indication of olderages based mostly on U–Pb systems.
The Aravalli–Delhi orogens of northwesternIndia began to develop at ~1.9 Ga and continueduntil later in the Proterozoic.
Australia
Eastward growth of Australia occurred from theEarly Proterozoic to the Mesozoic. It began duringand following the suturing of the Pilbara andYilgarn cratons along the Capricorn orogen (VanKranendonk and Collins, 1998), and possibly thecomplete fusion of all of the Precambrian of westernAustralia by ~1.8 Ga (G. Dawson et al., 2002). TheCapricorn orogen contains oceanic lithosphere,continental-margin sediments, banded iron forma-tion, and carbonates, all of which suggest develop-ment in a backarc or foreland-basin environment.Deformation apparently occurred when the Pilbaraand Yilgarn cratons collided at ~2.0–1.9 Ga.
The Albany and Fraser orogens of Australiaextend into the Bunger Hills and Windmill Islandsof coastal East Antarctica, which were attachedthroughout most of the Proterozoic (L. Harris,1995). Together they form the southern and south-eastern margins of the western Australian craton.The oldest well-known Mesoproterozoic activity inthe Fraser belt consists of intrusion of subduction-related batholiths between approximately 1.7–1.6Ga (Nelson et al., 1995), and the next well-datedevent was dextral transpression and intrusion of theAlbany enderbite at ~1.3 Ga. This history isremarkably similar to that of the Windmill Islandsand Bunger Hills of Antarctica (L. Harris, 1995).The Windmill Islands contain gneisses at least asold as 1.5 Ga, and orthogneisses in the Bunger Hillsrange from 1.7–1.5 Ga. These Meso-protero-zoic ages have not been found in the Albany belt,which shows the oldest orogenic activity at ~1.3 Ga,partly reworking Archean and Paleoproterozoicrocks in the southern margin of the Yilgarn shield(western Australian craton).
East Antarctica
Areas of Proterozoic orogeny in coastal EastAntarctica correlate well with orogens in SouthAfrica, India, and Australia. The Windmill Islandsand Bunger Hills are so similar to the Albany andFraser orogens of Australia that they presumablydeveloped together both in Grenville and pre-Grenville time (see above). Similarly the Raynerorogen (Kelly et al., 2002) shares a common history
232 Continents and Supercontinents

with the Eastern Ghats of India, including north-ward vergence of thrusts (present orientation inAntarctica and pre-drift orientation of India inGondwana). The Transantarctic (Ross) orogen
was primarily active during the Neoproterozoicand Early Paleozoic (chapter 8; appendix I), andolder events are controversial.
Orogenic Belts of 2.1–1.3-Ga 233

Appendix I
Orogenic Belts of Pan-African–Brasiliano Age
The names and locations of the major Pan-African–Brasiliano orogenic belts and the stable
areas that they separate are shown in fig. I.1. It alsoshows four important regions that we discuss inmore detail below. We begin with a discussion ofindividual orogenic belts and then proceed to theseareas of greater detail.
The Central African fold belt formed along thecontinental margin between the northern part ofthe Congo craton and the Pan-African region thatoccupied much of the area from West Africa tocentral Arabia (Feybesse et al., 1998; Toteu et al.,2001). Development that began in the Archean isshown by Archean xenocrysts and isotopic inheri-tance in high-grade metamorphic rocks formedduring the Eburnian (~2.1 Ga) orogeny. The areawas unaffected by events of Grenville age, and atsome time before the Pan-African orogeny itbecame the site of an ocean basin that extendednorthward from the Congo craton. In a periodcentered around 600 Ma, oceanic volcanic rocksand sediments, continental-margin sediments, andEburnian-age metamorphic rocks were thrust ontothe Congo craton, accompanied by syntectonicmagmatism and right-lateral thrusting. This Pan-African orogeny may have been caused by colli-sion with an unknown block to the north, or itmay have been an Andean-style orogeny along acontinental margin.
Although the Central African fold belt appearsto extend into the Borborema province, the historyof Borborema is very different (da Silva Filho andde Lima, 1995). Borborema is dominated by intenseright-lateral shears that extend into it from theCentral African fold belt and also from orogenicbelts on the east side of the West African craton.The shearing is contemporaneous with, and may bepartly responsible for, emplacement of voluminoushigh-K magmatic rocks with a range of SiO2 con-tents from intermediate to felsic. Derivation of thesemagmas from an enriched lithospheric mantle isdemonstrated by high concentrations of LIL ele-ments and several isotopic studies, including TDM
values of 2–1.8 Ga for magmas emplaced at 600–500 Ma (Ferreira et al., 1998; Guimares et al.,1998; Neves et al., 2000). This evidence clearlyindicates that Pan-African oceanic lithosphere didnot extend into Borborema, and the orogen is intra-continental.
The Aracuai belt, including West Congo, is thetype example of a confined orogen (chapter 5;Pedrosa-Soares et al., 2001). It represents closureof an ocean basin that extended briefly into the SaoFrancisco and Congo cratons, which had beenfused at some time much earlier than the approxi-mately 600-Ma age of orogenic activity.
The Kaoko and Gariep belts of Africa and theDom Feliciano belt of South America developed onopposite sides of a closing ocean basin. The easternpart of the Gariep belt consists of a parautochtho-nous sequence of unmetamorphosed shelf sedimentsthrust over a basement of Grenville age on thewestern margin of the Kalahari block (fig. I.1;Frimmel and Frank, 1998). The western part ofthe Gariep belt formed on oceanic lithosphere,and it contains oceanic basalts and sediments andbimodal basalt–rhyolite suites, all of which arehighly deformed. Deformation, thrusting, andemplacement of post-orogenic granites all occurredduring ~600–500 Ma.
The Dom Feliciano belt also consists of predo-minantly oceanic and continental terranes (fig. I.1;Leite et al., 1998; Frantz and Botelho, 2000). Thewestern part of the belt contains parautochthonousrocks of the Rio de la Plata craton that were meta-morphosed to high-amphibolite facies and thrusttoward the craton at various times culminating at~580 Ma. East of this sequence is a terrane domi-nated by ophiolites and oceanic sediments that washighly deformed, invaded by syntectonic batholithicrocks, and also thrust westward at ~580 Ma. Theoccurrence of batholithic suites in the DomFeliciano belt and their absence in the Gariep andKaoko belts suggest that the Pan-African oceanclosed by subduction westward under the Rio dela Plata craton.
234

The Mozambique belt extends southward fromthe Nubian–Arabian shield along almost the entireeast coast of Africa and is commonly referred to asthe ‘‘East African Orogen’’ (reviews by Stern, 1994,2002). As we discussed in chapter 3, the Nubian–Arabian shield clearly resulted from the accumula-tion of volcanic arcs during a few hundred millionyears before ~600 Ma, with intrusion of post-tectonic granites and stabilization of the terranebetween 600–500 Ma. This region of juvenilecrust extends to the northern margin of theEthiopian flood basalts and also appears in scat-tered outcrops just south of the basalts (Teklay etal., 2001; Yibas et al., 2001), but the Mozambiquebelt farther south apparently had a differenthistory.
The Mozambique belt through Kenya,Tanzania, and Mozambique is the eastern marginof the Tanzanian and Kalahari blocks. The marginis best exposed in Tanzania, where granulites of theMozambique belt are thrust over the Archean cra-ton in a pattern similar to the Grenville front and
other granulite belts (Muhongo, 1999; chapter 7).Some rocks from the craton have been intermixedin the thrust sequences, suggesting that westernparts of the belt are parautochthonous. Rocksthroughout the belt consist almost entirely ofpara- and orthogneisses and migmatites in high-amphibolite to granulite facies. Mafic rocks occurlocally, but their ages are unclear, and no unques-tionable ophiolite or ophiolite fragments have beenfound.
The Mozambique belt exhibits a complex seriesof orogenic events showing almost continuousactivity from about 1100–600 Ma, and all ofthem show vergences toward the west. The oldestcompressive deformation was probably in the Luriobelt of northern Mozambique, which may havebeen associated with suturing of the Maudheimand Kalahari blocks (chapter 7; Pinna et al.,1993; Manhica et al., 2001). This suturing is con-sistent with proposals that formation of juvenilecrust terminated about 1000 Ma, and 600-MaPan-African orogenesis merely overprinted older
Orogenic Belts of Pan-African–Brasiliano 235
Figure I.1. Locations of major belts of Pan-African age plus four areas described in detail in this appendix.Numbers in each area are the figure numbers of maps in this appendix. Abbreviations are: Waf, WestAfrica; HO–TI, Hoggar–Tibesti; WN, West Nile; CA, Central Arabia; Am, Amazonia; SF/CK, SaoFrancisco/Congo–Kasai; MA, Madagascar; IN, India; RP, Rio de la Plata; KA, Kalahari; SL, Sri Lanka;NA, Napier; PC, Prince Charles; Waus, western Australia.
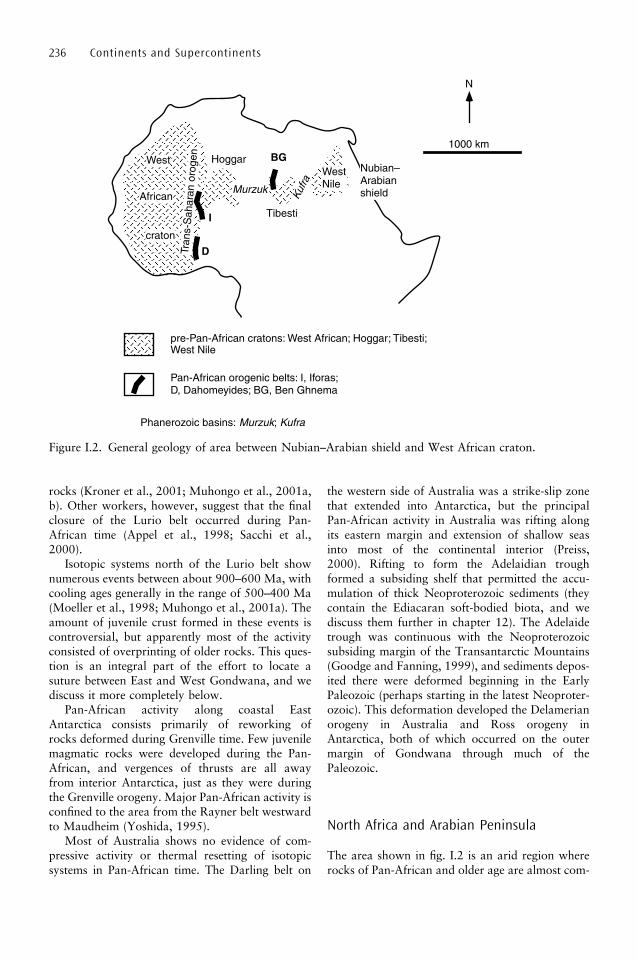
rocks (Kroner et al., 2001; Muhongo et al., 2001a,b). Other workers, however, suggest that the finalclosure of the Lurio belt occurred during Pan-African time (Appel et al., 1998; Sacchi et al.,2000).
Isotopic systems north of the Lurio belt shownumerous events between about 900–600 Ma, withcooling ages generally in the range of 500–400 Ma(Moeller et al., 1998; Muhongo et al., 2001a). Theamount of juvenile crust formed in these events iscontroversial, but apparently most of the activityconsisted of overprinting of older rocks. This ques-tion is an integral part of the effort to locate asuture between East and West Gondwana, and wediscuss it more completely below.
Pan-African activity along coastal EastAntarctica consists primarily of reworking ofrocks deformed during Grenville time. Few juvenilemagmatic rocks were developed during the Pan-African, and vergences of thrusts are all awayfrom interior Antarctica, just as they were duringthe Grenville orogeny. Major Pan-African activity isconfined to the area from the Rayner belt westwardto Maudheim (Yoshida, 1995).
Most of Australia shows no evidence of com-pressive activity or thermal resetting of isotopicsystems in Pan-African time. The Darling belt on
the western side of Australia was a strike-slip zonethat extended into Antarctica, but the principalPan-African activity in Australia was rifting alongits eastern margin and extension of shallow seasinto most of the continental interior (Preiss,2000). Rifting to form the Adelaidian troughformed a subsiding shelf that permitted the accu-mulation of thick Neoproterozoic sediments (theycontain the Ediacaran soft-bodied biota, and wediscuss them further in chapter 12). The Adelaidetrough was continuous with the Neoproterozoicsubsiding margin of the Transantarctic Mountains(Goodge and Fanning, 1999), and sediments depos-ited there were deformed beginning in the EarlyPaleozoic (perhaps starting in the latest Neoproter-ozoic). This deformation developed the Delamerianorogeny in Australia and Ross orogeny inAntarctica, both of which occurred on the outermargin of Gondwana through much of thePaleozoic.
North Africa and Arabian Peninsula
The area shown in fig. I.2 is an arid region whererocks of Pan-African and older age are almost com-
236 Continents and Supercontinents
Figure I.2. General geology of area between Nubian–Arabian shield and West African craton.
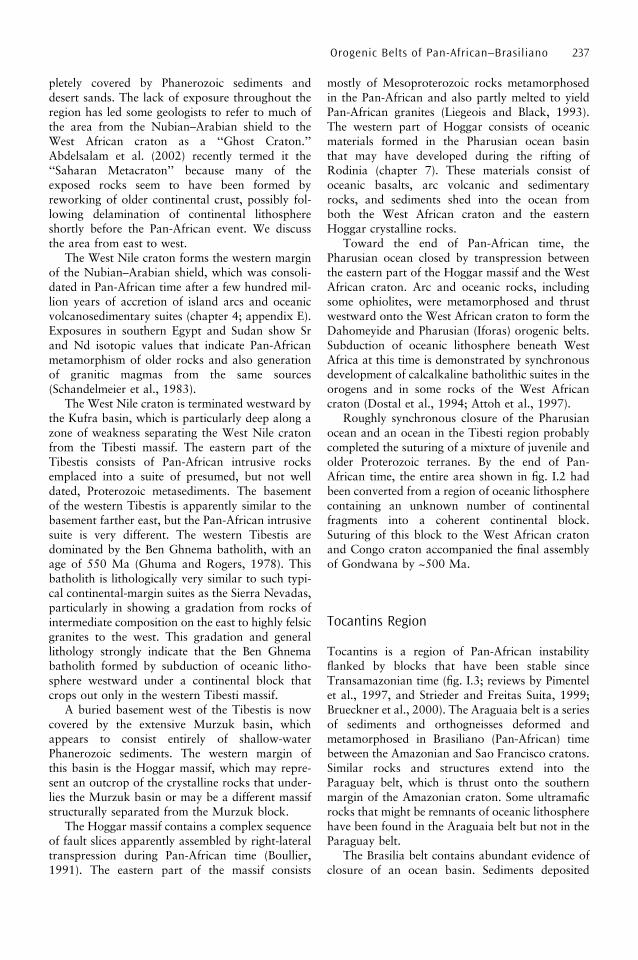
pletely covered by Phanerozoic sediments anddesert sands. The lack of exposure throughout theregion has led some geologists to refer to much ofthe area from the Nubian–Arabian shield to theWest African craton as a ‘‘Ghost Craton.’’Abdelsalam et al. (2002) recently termed it the‘‘Saharan Metacraton’’ because many of theexposed rocks seem to have been formed byreworking of older continental crust, possibly fol-lowing delamination of continental lithosphereshortly before the Pan-African event. We discussthe area from east to west.
The West Nile craton forms the western marginof the Nubian–Arabian shield, which was consoli-dated in Pan-African time after a few hundred mil-lion years of accretion of island arcs and oceanicvolcanosedimentary suites (chapter 4; appendix E).Exposures in southern Egypt and Sudan show Srand Nd isotopic values that indicate Pan-Africanmetamorphism of older rocks and also generationof granitic magmas from the same sources(Schandelmeier et al., 1983).
The West Nile craton is terminated westward bythe Kufra basin, which is particularly deep along azone of weakness separating the West Nile cratonfrom the Tibesti massif. The eastern part of theTibestis consists of Pan-African intrusive rocksemplaced into a suite of presumed, but not welldated, Proterozoic metasediments. The basementof the western Tibestis is apparently similar to thebasement farther east, but the Pan-African intrusivesuite is very different. The western Tibestis aredominated by the Ben Ghnema batholith, with anage of 550 Ma (Ghuma and Rogers, 1978). Thisbatholith is lithologically very similar to such typi-cal continental-margin suites as the Sierra Nevadas,particularly in showing a gradation from rocks ofintermediate composition on the east to highly felsicgranites to the west. This gradation and generallithology strongly indicate that the Ben Ghnemabatholith formed by subduction of oceanic litho-sphere westward under a continental block thatcrops out only in the western Tibesti massif.
A buried basement west of the Tibestis is nowcovered by the extensive Murzuk basin, whichappears to consist entirely of shallow-waterPhanerozoic sediments. The western margin ofthis basin is the Hoggar massif, which may repre-sent an outcrop of the crystalline rocks that under-lies the Murzuk basin or may be a different massifstructurally separated from the Murzuk block.
The Hoggar massif contains a complex sequenceof fault slices apparently assembled by right-lateraltranspression during Pan-African time (Boullier,1991). The eastern part of the massif consists
mostly of Mesoproterozoic rocks metamorphosedin the Pan-African and also partly melted to yieldPan-African granites (Liegeois and Black, 1993).The western part of Hoggar consists of oceanicmaterials formed in the Pharusian ocean basinthat may have developed during the rifting ofRodinia (chapter 7). These materials consist ofoceanic basalts, arc volcanic and sedimentaryrocks, and sediments shed into the ocean fromboth the West African craton and the easternHoggar crystalline rocks.
Toward the end of Pan-African time, thePharusian ocean closed by transpression betweenthe eastern part of the Hoggar massif and the WestAfrican craton. Arc and oceanic rocks, includingsome ophiolites, were metamorphosed and thrustwestward onto the West African craton to form theDahomeyide and Pharusian (Iforas) orogenic belts.Subduction of oceanic lithosphere beneath WestAfrica at this time is demonstrated by synchronousdevelopment of calcalkaline batholithic suites in theorogens and in some rocks of the West Africancraton (Dostal et al., 1994; Attoh et al., 1997).
Roughly synchronous closure of the Pharusianocean and an ocean in the Tibesti region probablycompleted the suturing of a mixture of juvenile andolder Proterozoic terranes. By the end of Pan-African time, the entire area shown in fig. I.2 hadbeen converted from a region of oceanic lithospherecontaining an unknown number of continentalfragments into a coherent continental block.Suturing of this block to the West African cratonand Congo craton accompanied the final assemblyof Gondwana by ~500 Ma.
Tocantins Region
Tocantins is a region of Pan-African instabilityflanked by blocks that have been stable sinceTransamazonian time (fig. I.3; reviews by Pimentelet al., 1997, and Strieder and Freitas Suita, 1999;Brueckner et al., 2000). The Araguaia belt is a seriesof sediments and orthogneisses deformed andmetamorphosed in Brasiliano (Pan-African) timebetween the Amazonian and Sao Francisco cratons.Similar rocks and structures extend into theParaguay belt, which is thrust onto the southernmargin of the Amazonian craton. Some ultramaficrocks that might be remnants of oceanic lithospherehave been found in the Araguaia belt but not in theParaguay belt.
The Brasilia belt contains abundant evidence ofclosure of an ocean basin. Sediments deposited
Orogenic Belts of Pan-African–Brasiliano 237
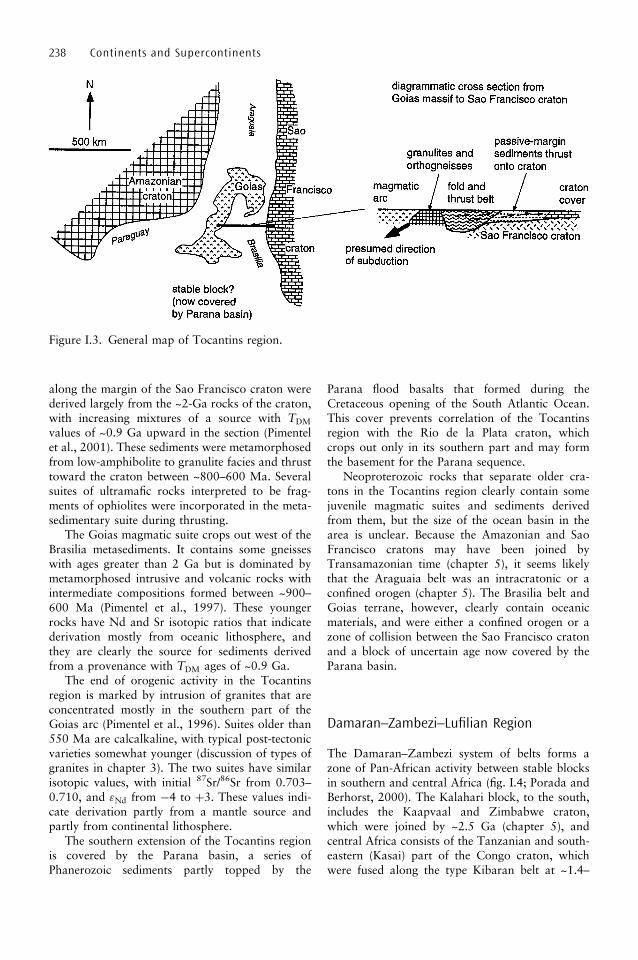
along the margin of the Sao Francisco craton werederived largely from the ~2-Ga rocks of the craton,with increasing mixtures of a source with TDM
values of ~0.9 Ga upward in the section (Pimentelet al., 2001). These sediments were metamorphosedfrom low-amphibolite to granulite facies and thrusttoward the craton between ~800–600 Ma. Severalsuites of ultramafic rocks interpreted to be frag-ments of ophiolites were incorporated in the meta-sedimentary suite during thrusting.
The Goias magmatic suite crops out west of theBrasilia metasediments. It contains some gneisseswith ages greater than 2 Ga but is dominated bymetamorphosed intrusive and volcanic rocks withintermediate compositions formed between ~900–600 Ma (Pimentel et al., 1997). These youngerrocks have Nd and Sr isotopic ratios that indicatederivation mostly from oceanic lithosphere, andthey are clearly the source for sediments derivedfrom a provenance with TDM ages of ~0.9 Ga.
The end of orogenic activity in the Tocantinsregion is marked by intrusion of granites that areconcentrated mostly in the southern part of theGoias arc (Pimentel et al., 1996). Suites older than550 Ma are calcalkaline, with typical post-tectonicvarieties somewhat younger (discussion of types ofgranites in chapter 3). The two suites have similarisotopic values, with initial 87Sr/86Sr from 0.703–0.710, and "Nd from �4 to þ3. These values indi-cate derivation partly from a mantle source andpartly from continental lithosphere.
The southern extension of the Tocantins regionis covered by the Parana basin, a series ofPhanerozoic sediments partly topped by the
Parana flood basalts that formed during theCretaceous opening of the South Atlantic Ocean.This cover prevents correlation of the Tocantinsregion with the Rio de la Plata craton, whichcrops out only in its southern part and may formthe basement for the Parana sequence.
Neoproterozoic rocks that separate older cra-tons in the Tocantins region clearly contain somejuvenile magmatic suites and sediments derivedfrom them, but the size of the ocean basin in thearea is unclear. Because the Amazonian and SaoFrancisco cratons may have been joined byTransamazonian time (chapter 5), it seems likelythat the Araguaia belt was an intracratonic or aconfined orogen (chapter 5). The Brasilia belt andGoias terrane, however, clearly contain oceanicmaterials, and were either a confined orogen or azone of collision between the Sao Francisco cratonand a block of uncertain age now covered by theParana basin.
Damaran–Zambezi–Lufilian Region
The Damaran–Zambezi system of belts forms azone of Pan-African activity between stable blocksin southern and central Africa (fig. I.4; Porada andBerhorst, 2000). The Kalahari block, to the south,includes the Kaapvaal and Zimbabwe craton,which were joined by ~2.5 Ga (chapter 5), andcentral Africa consists of the Tanzanian and south-eastern (Kasai) part of the Congo craton, whichwere fused along the type Kibaran belt at ~1.4–
238 Continents and Supercontinents
Figure I.3. General map of Tocantins region.
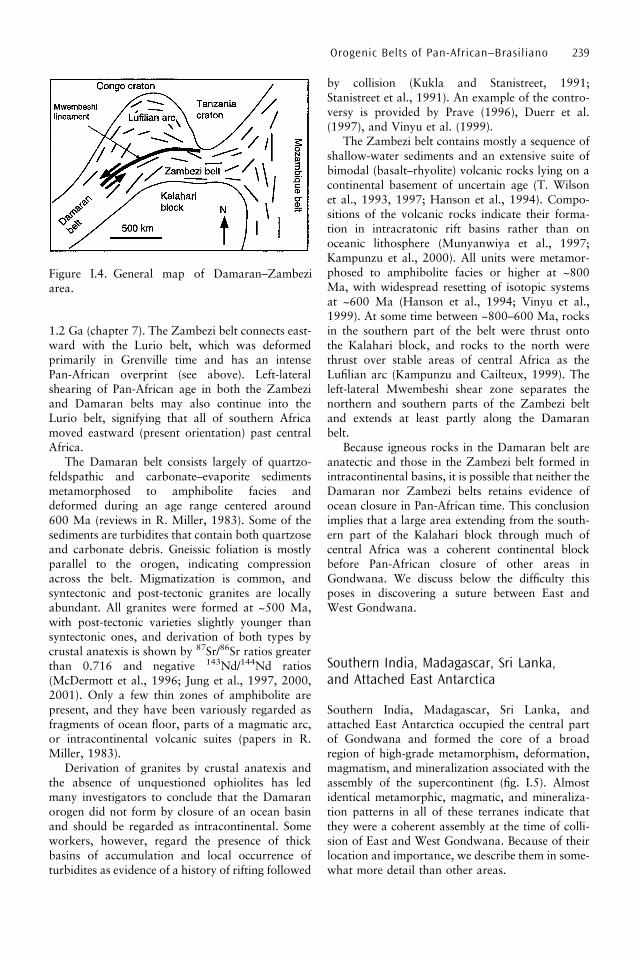
1.2 Ga (chapter 7). The Zambezi belt connects east-ward with the Lurio belt, which was deformedprimarily in Grenville time and has an intensePan-African overprint (see above). Left-lateralshearing of Pan-African age in both the Zambeziand Damaran belts may also continue into theLurio belt, signifying that all of southern Africamoved eastward (present orientation) past centralAfrica.
The Damaran belt consists largely of quartzo-feldspathic and carbonate–evaporite sedimentsmetamorphosed to amphibolite facies anddeformed during an age range centered around600 Ma (reviews in R. Miller, 1983). Some of thesediments are turbidites that contain both quartzoseand carbonate debris. Gneissic foliation is mostlyparallel to the orogen, indicating compressionacross the belt. Migmatization is common, andsyntectonic and post-tectonic granites are locallyabundant. All granites were formed at ~500 Ma,with post-tectonic varieties slightly younger thansyntectonic ones, and derivation of both types bycrustal anatexis is shown by 87Sr/86Sr ratios greaterthan 0.716 and negative 143Nd/144Nd ratios(McDermott et al., 1996; Jung et al., 1997, 2000,2001). Only a few thin zones of amphibolite arepresent, and they have been variously regarded asfragments of ocean floor, parts of a magmatic arc,or intracontinental volcanic suites (papers in R.Miller, 1983).
Derivation of granites by crustal anatexis andthe absence of unquestioned ophiolites has ledmany investigators to conclude that the Damaranorogen did not form by closure of an ocean basinand should be regarded as intracontinental. Someworkers, however, regard the presence of thickbasins of accumulation and local occurrence ofturbidites as evidence of a history of rifting followed
by collision (Kukla and Stanistreet, 1991;Stanistreet et al., 1991). An example of the contro-versy is provided by Prave (1996), Duerr et al.(1997), and Vinyu et al. (1999).
The Zambezi belt contains mostly a sequence ofshallow-water sediments and an extensive suite ofbimodal (basalt–rhyolite) volcanic rocks lying on acontinental basement of uncertain age (T. Wilsonet al., 1993, 1997; Hanson et al., 1994). Compo-sitions of the volcanic rocks indicate their forma-tion in intracratonic rift basins rather than onoceanic lithosphere (Munyanwiya et al., 1997;Kampunzu et al., 2000). All units were metamor-phosed to amphibolite facies or higher at ~800Ma, with widespread resetting of isotopic systemsat ~600 Ma (Hanson et al., 1994; Vinyu et al.,1999). At some time between ~800–600 Ma, rocksin the southern part of the belt were thrust ontothe Kalahari block, and rocks to the north werethrust over stable areas of central Africa as theLufilian arc (Kampunzu and Cailteux, 1999). Theleft-lateral Mwembeshi shear zone separates thenorthern and southern parts of the Zambezi beltand extends at least partly along the Damaranbelt.
Because igneous rocks in the Damaran belt areanatectic and those in the Zambezi belt formed inintracontinental basins, it is possible that neither theDamaran nor Zambezi belts retains evidence ofocean closure in Pan-African time. This conclusionimplies that a large area extending from the south-ern part of the Kalahari block through much ofcentral Africa was a coherent continental blockbefore Pan-African closure of other areas inGondwana. We discuss below the difficulty thisposes in discovering a suture between East andWest Gondwana.
Southern India, Madagascar, Sri Lanka,and Attached East Antarctica
Southern India, Madagascar, Sri Lanka, andattached East Antarctica occupied the central partof Gondwana and formed the core of a broadregion of high-grade metamorphism, deformation,magmatism, and mineralization associated with theassembly of the supercontinent (fig. I.5). Almostidentical metamorphic, magmatic, and mineraliza-tion patterns in all of these terranes indicate thatthey were a coherent assembly at the time of colli-sion of East and West Gondwana. Because of theirlocation and importance, we describe them in some-what more detail than other areas.
Orogenic Belts of Pan-African–Brasiliano 239
Figure I.4. General map of Damaran–Zambeziarea.

Southern India
Southern India comprises two distinct domainsseparated by the right-lateral Palghat–Cauveryand related shear zones. The Archean Dharwarcraton to the north was stabilized at 3.0 Ga (chap-ter 4). It has a southern margin fringed by high-pressure granulite massifs with TDM ages rangingfrom 3.4–2.6 Ga and metamorphism at ~2.5 Ga(Peucat et al., 1993; N. Harris et al., 1994; dis-cussion of transition zone in chapter 3). The cratonand marginal massifs are largely unaffected by Pan-African orogeny.
By contrast, terranes south of the Palghat–Cauvery shear zone show extensive Pan-Africanreworking. This region contains the Palni–Kodaikanal–Cardamom and the Nagercoil massifs,which consist of charnockites and slivers of gran-ulite-grade metasediments. Between and aroundthe massifs is a vast supracrustal terrane composedof leptynites, khondalites, calcsilicates, and char-nockites. Pan-African granulite-facies metamorph-ism and extensive crustal rejuvenation at ~550 Ma
characterize all of these blocks (Bartlett et al.,1995, 1998; Santosh et al., 2003). Most of them,however, preserve Paleoproterozoic TDM ages(2.4–2.2 Ga), showing that the Pan-African eventwas one of crustal reworking and not of crustalgrowth. Mineral reaction textures and exhumationpaths of these granulites indicate rapid and vir-tually isothermal uplift of various levels of thecontinental crust along a clockwise p–T path dur-ing late Pan-African time.
The northern and southern parts of this high-pressure terrane are separated by the left-lateralAchankovil Shear Zone. A belt of cordieritegneisses, charnockites, and calcsilicate rocks ~50km wide along the shear zone shows TDM ages inthe range of 1.5–1.2 Ga (Bartlett et al., 1995;Brandon and Meen, 1995), suggesting that the sedi-ment was derived from both Paleoproterozoic (~2.0Ga) and Neoproterozoic (~1.0–0.5 Ga) sources.Several felsic, mafic, and ultramafic intrusivesoccur along the shear zone, and both the high-grade metamorphic rocks and the intrusives showPan-African ages. It is possible that the Achankovil
240 Continents and Supercontinents
Figure I.5. General map of southern India, Madagascar, Sri Lanka, and adjoining East Antarctica. EG,Eastern Ghats; SGB, Southern Granulite Belt; PC, Palghat-Cauvery shear zone; k, Palni-Kodaikanal-Cardamom massif; N, Nagercoil massif; W, Wanni complex; H, highlands complex; V, Vijayan complex;SL, Sri Lanka
metasedimentary belt represents an internal or con-fined orogen (chapter 5), but the possibility remainsto be investigated.
The Pan-African orogeny in southern India wasaccompanied by widespread felsic magmatismrepresented by a suite of alkali granite and syeniteplutons that puncture the granulite-facies basement(U–Pb zircon ages of ~580–555 Ma; J. Miller et al.,1996). Most of the plutons occur along or proximalto regional fault lineaments, suggesting that themagma tectonics and emplacement occurred in anextensional tectonic regime (Santosh and Drury,1988). The magmatism might represent high tem-peratures above a rising plume or a zone of riftingrelated to the extensional collapse following thecollision of East and West Gondwana.
The final phase of magmatism is marked by theemplacement of pegmatites and veins that carrynumerous types of mineralization. The timing ofmineralization has been established from a Re–Osage of 525 Ma for molybdenites associated withalkali granite (Santosh et al., 1994) and a U–Pb ageof 512 Ma for gem-quality zircons associated withpegmatite (J. Miller et al., 1996). Gemstone miner-alizations in southern India, Sri Lanka,Madagascar, and parts of East Antarctica showcomparable ages, similar tectonic settings, andremarkably identical mineral associations, suggest-ing a Pan-African gemstone province within EastGondwana (Menon and Santosh, 1995).
The late Pan-African in southern India and otherparts of East Gondwana was also a period of exten-sive infiltration of CO2-rich fluids from mantlesources. A variety of mineralogic and isotopicalterations in high-grade metamorphic rocks andthe presence of abundant CO2-rich fluid inclusionsin metamorphic, magmatic, and pegmatitic assem-blages provide evidence for the transfer of CO2
through deep-rooted shear zones or magmatic con-duits. Rich graphite deposits also formed withinveins and pegmatites in southern India, Sri Lanka,and Madagascar by precipitation from CO2�H2Ofluids (Santosh and Wada, 1993a,b; Santosh andYoshida, 2001).
East Antarctica
Major Pan-African orogenic belts crop out inLutzow–Holm Bay and the Rayner complex (fig.I.5) and also in Prydz Bay and the southern PrinceCharles Mountains farther east. Lutzow–HolmBay, perhaps the locus of Pan-African extensioninto Antarctica, shows granulite-facies metamorph-ism at 550–520 Ma based on SHRIMP U–Pb ages
of zircons in high-grade metamorphic rocks(Shiraishi et al., 1994). This area may be an exten-sion of the Highland and Southwestern complexesof Sri Lanka (see below). The Rayner belt, sepa-rated from the Archean Napier complex by a poorlyexposed fault, has TDM ages of 2.3–1.3 Ga and maycorrelate with the Wanni complex in Sri Lanka,which also shows a metamorphic event at 1.1 Ga(Shiraishi et al., 1994). All of the Antarctic beltsshown in fig. 8.7 exhibit extensive Pan-Africanoverprints, and ages from Prydz Bay and the south-ern Prince Charles Mountains also indicate promi-nent late Pan-African orogeny between 550–490Ma (Boger et al., 2000, 2001, 2002). Significantvolumes of felsic plutons were emplaced throughoutthe area during Pan-African time, correlating withidentical late Pan-African magmatism in southernIndia, Sri Lanka, and Madagascar.
The lithologic units, metamorphic style, anddeformation patterns in all of these areas of EastAntarctica are closely comparable with those insouthern India, Sri Lanka, and Madagascar. All ofthese areas also have Mesoproterozoic TDM ages,with the youngest ages (1.1–0.9 Ga) from the SorRondane Mountains of East Antarctica and theVijayan complex of Sri Lanka. The assembly thusrepresents a Mesoproterozoic–Neoproterozoic ter-rane that underwent extensive crustal reworkingbut limited crustal growth during the Pan-Africanevent.
Madagascar
In Madagascar, the Ranotsara shear zone separatesthe Precambrian terrane into the southern andnorthern blocks and probably correlates with theAchankovil shear zone in southern India (Windleyand Razakamanana, 1996). Both shear zones con-tain abundant granulite-facies supracrustal rocksand charnockites that yield ages in the range of~570–520 Ma, late Pan-African alkali granites,and mineralized pegmatites.
South of the Ranotsara shear zone are N–Strending granulites and upper-amphibolite-faciesparagneisses that contain conformable layers ofmarble, quartzite, diopsidite, and amphibolite.Prominent Neoproterozoic ductile shear zonesdivide the southern block into different units, indi-cating an accelerated exhumation accompanied byextensional tectonics between 520–490 Ma (de Witet al., 2001). The southern block also carriesevidence for widespread Pan-African overprintingranging in age from 570–523 Ma (Paquetteet al., 1994), representing reworking of early
Orogenic Belts of Pan-African–Brasiliano 241

Precambrian protoliths. Massif-type anorthositesyield crystallization ages of ~660 Ma and meta-morphic ages of 559 Ma (Ashwal et al. 1998),and numerous stratoid sheets of alkali graniteswere emplaced at 585 Ma (Nicollet, 1990). LatePan-African pegmatites contain ruby, beryl, colum-bite, niobotantalites, and uranium-bearing miner-als. Both magmatism and pegmatite formation inMadagascar are identical to those in southern Indiawith respect to timing of formation, tectonic envir-onment, and mineralization (Menon and Santosh,1995). All of this magmatism is correlated with anextensional setting and high geothermal gradientsaccompanying collapse of the Pan-African orogenthat may have sutured East and West Gondwana.
Central and northern Madagascar consists ofPrecambrian rocks that form three distinct N–Sbelts (Windley and Razakamanana, 1996; A.Collins and Windley, 2002). The central (axial)belt exhibits dextral shearing and comprises granu-lite-facies rocks and their partly retrogressedequivalents of amphibolite-facies gneisses: para-gneisses and graphitic gneisses (Nedelec et al.,2000). The region also contains a number of granitesheets; lenses of mafic–ultramafic rocks with ages of787 Ma that include harzburgite, dunite, pyroxe-nite, and gabbro that contain nickel mineralization;and some lenses of low-pressure granulite. Ages inthis terrane range from 726–527 Ma. Structurallyabove this central belt, toward the north of theisland, are several synclinal belts which containgranulite and amphibolite-facies hornblendegneisses with ages of ~2700 Ma. Magnetite quart-zite, hornblende-rich gabbro, metavolcanic amphi-bolite layers, basic granulites, and folded stratiformcomplexes of norite and pyroxenite also occurwithin these belts.
The axial belt of northern Madagascar sharesmany similarities with the Palghat–Cauvery shearzone in southern India, with both zones markingthe boundary between southern terranes character-ized by crustal reworking and high-grade meta-
morphism during the Pan-African and a northernArchean craton where a Pan-African overprint isless recognizable.
Sri Lanka
The Sri Lankan fragment of Gondwana has beendivided into three distinct provinces based on TDM
ages (Milisenda et al., 1994). The oldest is theHighland/Southwestern complex (HSWC), whichis dominated by high-grade supracrustal rocks andgranitoids with TDM ages of 2.9–1.9 Ga that com-pare closely with the TDM ages from southern India.The western margin of the HSWC is a youngerprovince known as the Wanni complex (WC), char-acterized by lower-grade (amphibolite-facies) rockswith TDM ages of 1.91.2 Ga. A similar range ofTDM ages has been obtained from the Achankovilmetasediments in southern India (see above). Thethird and youngest age province is the Vijayancomplex (VC), comprising mostly amphibolite-facies rocks exposed on the eastern edge of theHSWC and clearly separated from it by a majorthrust. The Vijayan complex has TDM ages from1.5–0.8 Ga, indicative of a younger period of crus-tal growth.
In common with other East Gondwana terranes,Sri Lankan terranes also show upper-amphibolite togranulite-grade metamorphism and felsic magma-tism during the Pan-African orogeny. The regionalhigh-grade metamorphism, charnockite formation,and granite emplacement at about 550 Ma arebroadly coeval and occurred within a relativelyshort time span of 100 Ma (Kroner et al., 1994).Distinct Pan-African thrust-nappe structures devel-oped along both the eastern and western bound-aries of the HSWC (Kriegsman, 1995). Sri Lanka isalso one of nature’s museums for gems, and thegemstone mineralization here is closely comparableto that in southern India.
242 Continents and Supercontinents

References
Abbott, D.H. (1996) Plumes and hotspots assources of greenstone belts. Lithos, v. 37,113–127.
Abdelsalam, M.G., and Stern, R.J. (1996) Suturesand shear zones in the Arabian–Nubian shield.J. African Earth Sci., v. 23, 289–310.
Abdelsalam, M.G., Liegeois, J.-P., and Stern, R.J.(2002). The Saharan metacraton. J. AfricanEarth Sci., v. 34, 289–310.
Acharyya, S.K., and Roy, A. (2000) Tectonother-mal history of the Central Indian TectonicZone and reactivation of major faults/shearzones. J. Geol. Soc. India, v. 55, 239–256.
Adiyaman, O., Chorowicz, J., Arnaud, O.N., Gun-dogdu, M.N., and Gourgaud, A. (2001) LateCenozoic tectonics and volcanism along theNorth Anatolian fault; new structural and geo-chemical data. Tectonophysics, v. 338,135–165.
Ahall, K.-I., Connelly, J.N., and Brewer, T.S. (2000)Episodic rapakivi magmatism due to distalorogenesis?: correlation of 1.69–1.50 Ga oro-genic and inboard ‘‘anorogenic’’ events in theBaltic shield. Geology, v. 28, 823–826.
Al Saleh, A.M., and Boyle, A.P. (2001) Neo-proterozoic ensialic back-arc spreading in theeastern Arabian shield: geochemical evidencefrom the Halaban ophiolite. J. African EarthSci., v. 33, 1–15.
Alavi, M. (1994) Tectonics of the Zagros orogenicbelt of Iran: new data and interpretations.Tectonophysics, v. 229, 211–238.
Aleinikov, A.L., Belavin, O.V., Bulashevich, Y.P.,Tavrin, I.F., Maksimov, E.M., Rudkevich,M.Y., Nalivkin, V.D., Shablinskaya, N.V.,and Surkov, V.S. (1980) Dynamics of theRussian and West Siberian platforms. InDynamics of plate interiors (A.W. Bally,Ed.). Amer. Geophys. Union GeodynamicsSer. 1, 53–71.
Algeo, T.J., and Wilkinson, B.H. (1991) Modernand ancient continental hypsometries. Geol.Soc. London J., v. 148, 643–653.
Alkmim, F.F., Marshak, S., and Fonseca, M.A.(2001) Assembling West Gondwana in theNeoproterozoic; clues from the Sao FranciscoCraton region, Brazil. Geology, v. 29,319–322.
Almeida, F.F.M. de, Brito Neves, B.B. de, and DalRe Carneiro, C. (2000) The origin and evolu-tion of the South American platform. Earth-Sci. Rev., v. 50, 77–111.
Alvarez, L.W., Alvarez, W., Asaro, F., and Michel,H.V. (1980) Extraterrestrial cause for the Cre-taceous–Tertiary extinction. Science, v. 208,1095–1098.
Alvarez, W. (1997) T. Rex and the crater of doom.Princeton, N.J. Princeton University Press.
Ampferer, O., and Hammer, W. (1911) Geolo-gischer querschnitt durch die Ostalpen vonAllgau zum Gardarsee, Jahrbuch GeologischenReichsanstalt, v. 61, 531–710.
Amri, I., Benoit, M., and Ceuleneer, G. (1996)Tectonic setting for the genesis of oceanic pla-giogranites: evidence from a paleo-spreadingstructure in the Oman ophiolite. Earth Planet.Sci. Lett., v. 139, 177–194.
Anderson, D.L. (2002) How many plates? Geology,v. 30, 411–414.
Anderson, J.B. (1999) Antarctic marine geology.New York, Cambridge University Press.
Anderson, J.L., and Cullers, R.L. (1999) Paleo- andMesoproterozoic granite plutonism of Color-ado and Wyoming. Rocky Mountain Geol., v.34, 149–164.
Anderson, J.L., and Morrison, J. (1992) The role ofanorogenic granites in the Proterozoic crustaldevelopment of North America. In Proterozoiccrustal evolution (K.C. Condie, Ed.). NewYork, Elsevier, 263–299.
Andersson, J., Soderlund, U., Cornell, D., Johans-son, L., and Moller, C. (1999) Sveconorwegian(Grenvillian) deformation, metamorphism andleucosome formation in SW Sweden, SW BalticShield; constraints from a Mesoproterozoicgranite intrusion. Precamb. Res., v. 98,151–171.
Anhaeusser, C.R. (Ed.) (1983) Contributions to thegeology of the Barberton Mountain Land.Geol. Soc. South Africa Spec. Publ. 9.
Appel, P., Moeller, A., and Schenk, V. (1998) High-pressure granulite-facies metamorphism in thePan-African Belt of eastern Tanzania; P–T–tevidence against granulite formation by conti-nent collision. J. Metam. Geol., v. 16,491–509.
243

Arima, M., Takono, N., and Saradhi, P. (2000)Tectonothermal evolution of Eastern Ghatsbelt, India: implications for the East Gond-wana–Rodinia amalgamation. Tokyo, 20thSymposium on Antarctic Geosciences, 32–33.Tokyo, National Institute of Polar Research.
Ashwal, L.D., Hamilton, M.A., Morel, V.P.I., andRambeloson, R.A. (1998) Geology, petrologyand isotope geochemistry of massif-typeanorthosites from southwest Madagascar.Contrib. Mineral. Petrol., v. 133, 389–401.
Aspler, L.B., and Chiarenzelli, J.R. (1998) TwoNeoarchean supercontinents? Evidence fromthe Paleoproterozoic. Sedimentary Geol., v.120, 75–104.
Astini, R.A., and Thomas, W.A. (1999) Origin andevolution of the Precordillera terrane of wes-tern Argentina; a drifted Laurentian orphan.In Laurentia–Gondwana connections beforePangea (J.D. Keppie, Ed.). Geol. Soc. Amer.Spec. Paper 336, 1–20.
Attoh, K., Dallmeyer, R.D., and Affaton, P. (1997)Chronology of nappe assembly in the Pan-Afri-can Dahomeyide orogen, West Africa: evidencefrom 40Ar/39Ar mineral ages. Precamb. Res., v.82, 153–171.
Atwater, T. (1989) Plate tectonic history of theNortheast Pacific and western North America.In The eastern Pacific Ocean and Hawaii (E.L.Winterer, D.M. Hussong, and R.W. Decker,Eds.). The Geology of North America, V.N.,Geol. Soc. Amer., 21–72.
Atwater, T., and Stock, J. (1998) Pacific–NorthAmerica plate tectonics of the Neogene south-western United States: an update. Internat.Geol. Rev., v. 40, 375–402.
Austrheim, H. (1986) Eclogitization of lower crus-tal granulites by fluid migration through shearzones. Earth Planet. Sci. Lett., v. 81, 221–232.
Axen, G. Jr., Lam, P.S., Grove, M., Stockli, D.F.,and Hassanzadeh, J. (2001) Exhumation of thewest-central Alborz Mountains, Iran, Caspiansubsidence, and collision-related tectonics.Geology, v. 29, 559–562.
Ballance, P.F. (1999) Simplification of the south-west Pacific Neogene arcs; inherited complex-ity and control by a retreating pole of rotation.In Continental tectonics (C. Mac Niocaill andP.D. Ryan, Eds.). Geol. Soc. London Spec.Publ. 164, 7–19.
Barley, M.E. (1993) Volcanic, sedimentary and tec-tonostratigraphic environments of the approxi-mately 3.46 Ga Warrawoona Megasequence; areview. Precamb. Res., v. 60, 47–67.
Barth, A.P., Wooden, J.L., Coleman, D.S., and Fan-ning, C.M. (2000) Geochronology of the Pro-terozoic basement of southwesternmost NorthAmerica, and the origin and evolution of theMojave crustal province. Tectonics, v. 19,616–629.
Bartlett, J.M., Dougherty-Page, J.S., Harris,N.B.W., Hawkesworth, C.J., and Santosh, M.(1998) The application of single zircon eva-poration and model Nd ages to the interpreta-tion of polymetamorphic terrains: an examplefrom the Proterozoic mobile belt of southIndia. Contrib. Mineral. Petrol., v. 131,181–195.
Bartlett, J.M., Harris, N.B.W., Hawkesworth, C.J.,and Santosh, M. (1995) New isotopic con-straints on the crustal evolution of SouthIndia and Pan-African granulite metamorph-ism. Geol. Soc. India Memoir 34, 391–397.
Beck, R.A., Sinha, A., Burbank, D.W., Sercombe,W.J., and Khan, A.M. (1998) Climatic, ocea-nographic, and isotopic consequences of thePaleocene India–Asia collision. In Late Paleo-cene–Early Eocene climatic and biotic events inthe marine and terrestrial records (M.-P.Aubrey, S.G. Lucas, and W.A. Berggren,Eds.). New York, Columbia University Press,103–117.
Behrendt, J.C. (1999) Crustal and lithosphericstructure of the West Antarctic Rift systemfrom geophysical investigations; a review. InLithosphere dynamics and environmentalchange of the Cenozoic West Antarctic Riftsystem (F.M. van der Wateren and S.A.P.L.Cloetingh, Eds.). Global and PlanetaryChange, v. 23, 25–44.
Bekker, A., Kaufman, A.J., Karhu, J.A., Beukes,N.J., Swart, Q.D., Coetzee, L.L., and Eriksson,K.A. (2001) Chemostratigraphy of the Paleo-proterozoic Duitschland Formation, SouthAfrica: implications for coupled climaticchange and carbon cycling. Amer. J. Sci., v.301, 261–285.
Bell, K., and Blenkinsop, J. (1987) Archeandepleted mantle: evidence from Nd and Srinitial isotopic ratios of carbonatites. Geochim.Cosmochim. Acta, v. 51, 291–298.
Benioff, H. (1954) Orogenesis and deep crustalstructure—additional evidence from seismol-ogy. Geol. Soc. Amer. Bull., v. 65, 385–400.
Berry, E.W. (1928) Comments on the Wegenerhypothesis. In Theory of continental drift(W.A.J.M. van Waterschoot van der Gracht,Ed.). Amer. Assoc. Petrol. Geol., 194–196.
Besse, J., and Courtillot, V. (1988) Palaeogeo-graphic maps of the continents bordering theIndian Ocean since the early Jurassic.J. Geophys. Res., v. 93, 11,791–11,808.
Besse, J., Torcq, F., Gallet, Y., Ricou, L.E., Krystyn,L., and Saidi, A. (1998) Late Permian to lateTriassic palaeomagnetic data from Iran; con-straints on the migration of the Iranian blockthrough the Tethyan Ocean and initial destruc-tion of Pangaea. Geophys. J. Internat., v. 135,77–92.
244 Continents and Supercontinents

Bettencourt, J.S., Tosdal, R.M., Leite, W.B., andPayolla, B.L. (1999) Mesoproterozoic rapakivigranites of the Rondonian tin province, south-western border of the Amazon craton, Brazil; I.reconnaissance U–Pb geochronology andregional implications. In Rapakivi granitesand related rocks (I. Haapala and O.T.Ramo, Eds.). Precamb. Res., v. 95, 41–67.
Bhattacharya, S. (1996) Eastern Ghats granuliteterrain of India: an overview. In PrecambrianIndia within East Gondwana (M. Yoshida, M.Santosh, and M. Arima, Eds.). J. SoutheastAsian Earth Sci., v. 14, 165–174.
Bhushan, S.K. (2000) Malani rhyolites; a review.Gondwana Res., v. 3, 65–77.
Bickford, M.E., and Anderson, A.L. (1993) MiddleProterozoic magmatism. In Precambrian: con-terminous U.S. (J.C. Reed, Jr., M.E. Bickford,R.S. Houston, P.K. Link, D.W. Rankin, P.K.Sims, and W.R. Van Schmus, Eds.). The Geol-ogy of North America, v. C-2, Geol. Soc.Amer., 281–292.
Bickford, M.E., Collerson, K.D., and Lewry, J.F.(1994) Crustal history of the Rae and Hearneprovinces, southwestern Canadian shield, Sas-katchewan; constraints from geochronologicand isotopic data. Precamb. Res., v. 68, 1–21.
Bingen, B., Davis, W.J., and Austrheim, H. (2001)Zircon U–Pb geochronology in the Bergen Arceclogites and their Proterozoic protoliths, andimplications for the pre-Scandian evolution ofthe Caledonides in western Norway. Geol. Soc.Amer. Bull., v. 113, 640–649.
Biswal, T.K., Biswal, B., Mitra, S., and Maitry Roy,M. (2002) Deformation pattern of the NWterrane boundary of the Eastern Ghats MobileBelt, India; a tectonic model and correlationwith Antarctica. Gondwana Res., v. 5, 45–52.
Black, L.P., Harley, S.L., Sun, S.S., and McCulloch,M.T. (1987) The Rayner Complex of EastAntarctica: complex isotopic systematicswithin a Proterozoic mobile belt. J. Metam.Geol., v. 5, 126.
Black, L.P., Harris, L.B., and Delor, C.P. (1992)Reworking of Archaean and early Proterozoiccomponents during a progressive, middle Pro-terozoic tectonothermal event in the Albanymobile belt, Western Australia. Precamb.Res., v. 59, 95–123.
Blewett, R.S. (2002) Archaean tectonic processes: acase for horizontal shortening in the NorthPilbara granite–greenstone terrane, WesternAustralia. Precamb. Res., v. 113, 87–120.
Boger, S.D., Carson, C.J., Fanning, C.M., Hergt,J.M., Wilson, C.J.L., and Woodhead, J.D.(2002) Pan-African intraplate deformation inthe nothern Prince Charles Mountains, eastAntarctica. Earth Planet. Sci. Lett., v. 195,195–210.
Boger, S.D., Carson, C.J., Wilson, C.J.L., and Fan-ning, C.M. (2000) Neoproterozoic deforma-tion in the Radok Lake region of thenorthern Prince Charles Mountains, east Ant-arctica; evidence for a single protracted oro-genic event. Precamb. Res., v. 104, 1–24.
Boger, S.D., Wilson, C.J.L., and Fanning, C.M.(2001) Early Paleozoic tectonism within theEast Antarctic craton: the final suture betweeneast and west Gondwana? Geology, v. 29,463–466.
Boher, M., Abouchami, W., Michard, A., Albarede,F., and Arndt, N.T. (1992) Crustal growth inWest Africa at 2.1 Ga. J. Geophys. Res., v. 97,345–369.
Bohlen, S.R., and Mezger, K. (1989) Origin ofgranulite terranes and the formation of thelowermost continental crust. Science, v. 244,326–329.
Bolt, B.A. (1999) Earthquakes (4th ed.). New York,W.H. Freeman Co.
Bond, G.C., Nickerson, P.A., and Kominz, M.A.(1984) Breakup of a supercontinent between625 Ma and 555 Ma: new evidence and impli-cations for continental histories. Earth Planet.Sci. Lett., v. 70, 325–345.
Borg, G., and Shackleton, R.M. (1997) The Tanza-nia and NE-Zaire cratons, In Greenstone belts(M.J. DeWit and L.D. Ashwal, Eds.). OxfordMonographs on Geology and Geophysics 35,608–619.
Botta, G., and Bada, J.L. (2002) Extraterrestrialorganic compounds in meteorites. Surv. inGeophys., v. 23, 411–467.
Boullier, A.-M. (1991) The Pan-African trans-Saharan belt in the Hoggar shield (Algeria,Mali, Niger); a review. In The West Africanorogens and circum-Atlantic correlatives (R.D.Dallmeyer and J.P. Lecorche, Eds.). Berlin,Springer-Verlag, 85–105.
Bowring, S.A., and Grotzinger, J.P. (1992) Implica-tions of new chronostratigraphy for tectonicevolution of Wopmay orogen, northwestCanadian shield. Amer. J. Sci., v. 292, 1–20.
Bowring, S.A., and Housh, T. (1995) The earth’searly evolution. Science, v. 269, 1535–1540.
Bowring, S.A., and Ross, G.M. (1985) Geochronol-ogy of the Narakay Volcanic Complex: impli-cations for the age of the CoppermineHomocline and Mackenzie events. CanadianJ. Earth Sci., v. 22, 774–781.
Bowring, S.A., Grotzinger, J.P., Isachsen, C.E.,Knoll, A.H., Pelechaty, S.M., and Kolosov, P.(1993) Calculating rates of Early Cambrianevolution. Science, v. 261, 1293–1298.
Brandon, A.D., and Meen, J.K. (1995) Nd isotopicevidence for the position of southernmostIndian terrains within East Gondwana. Pre-camb. Res., v. 70, 269–280.
References 245
Brasier, M.D., and 7 others (2002). Questioning theevidence for Earth’s oldest fossils. Nature, v.416, 76–81.
Brasier, M.D., and Lindsay, J.F. (1998) A billionyears of environmental stability and the emer-gence of eukaryotes; new data from northernAustralia. Geology, v. 26, 555–558.
Braun, J., and Shaw, R. (2001) A thin-plate modelof Palaeozoic deformation of the Australianlithosphere; implications for understandingthe dynamics of intracratonic deformation, InContinental reactivation and reworking (J.A.Miller, R.E. Holdsworth, I.S. Buick, and M.Hand, Eds.). Geol. Soc. London Spec. Pub.184, 165–193.
Brewer. T.S. (Ed.) (1996) Precambrian crustal evo-lution in the North Atlantic region. Geol. Soc.London Spec. Pub. 112.
Brito Neves, B.B. de (2002) Main stages of thedevelopment of the sedimentary basins ofSouth America and their relationship with thetectonics of supercontinents. Gondwana Res.,v. 5, 175–196.
Brocks, J.J., Logan, G.A., Buick, R., and Summons,R.E. (1999) Archean molecular fossils and theearly rise of eukaryotes. Science, v. 285,1033–1036.
Brookfield, M.E. (1993) Neoproterozoic Laurentia–Australia fit. Geology, v. 21, 683–686.
Brown, D., and Spadea, P. (1999) Processes offorearc and accretionary complex formationduring arc-continent collision in the southernUral Mountains. Geology, v. 27, 649–652.
Brueckner, H.K., Cunningham, D., Alkmim, F.F.,and Marshak, S. (2000) Tectonic implicationsof Precambrian Sm–Nd dates from the south-ern Sao Francisco craton and adjacent Aracuaiand Riberira belts, Brazil. Precamb. Res., v. 99,255–269.
Bullen, M.E., Burbank, D.W., Garver, J.I., andAbdrakhmatov, K.Ye. (2001) Late Cenozoictectonic evolution of the northwestern TienShan: new age estimates for the initiation ofmountain building. Geol. Soc. Amer. Bull., v.113, 1544–1559.
Burchfiel, B.C., Cowan, D.S., and Davis, G.A.(1992) Tectonic overview of the Cordilleranorogen in the western United States. In TheCordilleran orogen: conterminous U.S. (B.C.Burchfiel, P.W. Lipman, and M.M. Zoback,Eds.). The Geology of North America, v. G-3,Geol. Soc. Amer., 407–479.
Burrett, C., and Berry, R. (2000) Proterozoic Aus-tralia–western United States (AUSWUS) fitbetween Laurentia and Australia. Geology, v.28, 103–106.
Burrett, C., and Berry, R. (2001). Unpublisheddata.
Burrett, C., and Berry, R. (2002) A statisticalapproach to defining Proterozoic crustal pro-
vinces and testing continental reconstructionsof Australia and Laurentia—SWEAT or AUS-WUS? Gondwana Res., v. 5, 109–122.
Burton, K.W., Schiano, P., Birck, J.-L., Allegre, C.J.,Rehkamper, M., Halliday, A.N., and Dawson,J.B. (2000) The distribution and behaviour ofrhenium and osmium amongst mantle mineralsand the age of the lithospheric mantle beneathTanzania. Earth Planet. Sci. Lett., v. 183,93–106.
Butterfield, N.J. (2000) Bangiomorpha Pubescensn. gen., n. sp.: implications for the evolutionof sex, multicellularity, and the Mesoprotero-zoic/Neoproterozoic radiation of eukaryotes.Paleobiology, v. 26, 386–404.
Butterfield, N.J. (2001) Paleobiology of the lateMesoproterozoic (ca. 1200 Ma) Hunting For-mation, Somerset Island, Arctic Canada. Pre-camb. Res., v. 111, 235–256.
Byerly, G.R., Lowe, D.R., Wooden, J.L., and Xie,X. (2002) An Archean impact layer from thePilbara and Kaapvaal cratons. Science, v. 297,1325–1327.
Calver, C.R., and Lindsay, J.F. (1998) Ediacaransequence and isotope stratigraphy of the Offi-cer basin, South Australia. Australian J. EarthSci, v. 45, 513–532.
Card, K.D. (1990) A review of the Superior pro-vince of the Canadian shield. Precamb. Res., v.48, 99–156.
Carignan, J., Ludden, J., and Francis, D. (1996) Onthe recent enrichment of subcontinental litho-sphere: a detailed U–Pb study of spinel lherzo-lite xenoliths, Yukon, Canada. Geochim.Cosmochim. Acta, v. 60, 4241–4252.
Carlson, R.W., and 16 others (2000) Continentalgrowth, preservation, and modification insouthern Africa. GSA Today, v. 10, no. 2, 1–7.
Carr, S.D., Easton, R.M., Jamieson, R.A., and Cul-shaw, N.G. (2000) Geologic transect across theGrenville orogen of Ontario and New York.Canadian J. Earth Sci., v. 37, 193–216.
Castle, J.W. (2001) Foreland-basin sequenceresponse to collisional tectonism. Geol. Soc.Amer. Bull., v. 113, 801–812.
CD-ROM Working Group (2002) Structure andevolution of the lithosphere beneath theRocky Mountains: initial results from theCD-ROM experiment. GSA Today, v. 12, no.3, 4–10.
Chacko, T., De, S.K., Creaser, R.A., and Muehlen-bachs, K. (2000) Tectonic setting of the Talt-son magmatic zone at 1.9–2.0 Ga: a granitoid-based perspective. Canadian J. Earth Sci., v.37, 1597–1609.
Chacko, T., Ravindra Kumar, G.R., Meen, J.K., andRogers, J.J.W. (1992) Geochemistry of high-grade supracrustal rocks from the Kerala Khon-dalite Belt and adjacent massif charnockites,South India. Precamb, Res., v. 55, 469–489.
246 Continents and Supercontinents
Chadwick, B., Vasudev, V.N., and Hegde, G.V.(2000) The Dharwar Craton, southern India,interpreted as the result of late Archaeanoblique convergence. Precamb. Res., v. 99,91–111.
Chamberlain, R.T. (1928) Some of the objections toWegener’s theory. In Theory of continentaldrift (W.A.J.M. van Waterschoot van derGracht, Ed.). Amer. Assoc. Petrol. Geol.,83–87.
Chappell, B.W., White, A.J.R., and Hine, R. (1988)Granite provinces and basement terranes in theLachlan fold belt, southeastern Australia. Aus-tralian J. Earth Sci., v. 35, 505–521.
Chaudhary, A.K., Gopalan, K., and Sastry, C.A.(1984) Present status of the geochronology ofthe Precambrian rocks of Rajasthan. Tectono-physics, v. 105, 131–140.
Chaudhuri, A.K., Saha, D., Deb, G.K., PatranabisDeb, S., Mukherjee, M.K., and Ghosh, G.(2002) The Purana basins of southern provinceof India—a case for Mesoproterozoic fossilrifts. Gondwana Res., v. 5, 23–33.
Chen, J., and Jahn, B.-M. (1998) Crustal evolutionof southeastern China: Nd and Sr isotopicevidence. Tectonophysics, v. 284, 101–133.
Chiarenzelli, J.R., Aspler, L.B., Villeneuve, M., andLewry, J.F. (1998) Early Proterozoic evolutionof the Saskatchewan Craton and its allochtho-nous cover, Trans-Hudson Orogen. J. Geol., v.106, 247–267.
Claesson, S., Bogdanova, S.B., Bibikova, E.V., andGorbatschev, R. (2001) Isotopic evidence forthe Palaeoproterozoic accretion in the base-ment of the East European craton. Tectono-physics, v. 339, 1–18.
Clark, D.J., Hensen, B.J., and Kinny, P.D. (2000)Geochronological constraints for a two-stagehistory of the Albany–Fraser Orogen, WesternAustralia. Precamb. Res., v. 102, 155–183.
Clark, P.O., Webb., R.S., and Keigwin, L.D. (Eds.)(1999) Mechanisms of global climate change atmillennial time scales. Amer. Geophys. UnionMonograph 112.
Cloos, M. (1982) Flow melanges: numerical model-ing and geologic constraints on their origin inthe Franciscan subduction complex, Califor-nia. Geol. Soc. Amer. Bull., v. 93, 330–345.
Cocks, L.R.M. (2001) Ordovician and Silurian glo-bal geography. J. Geol. Soc. London, v. 158,197–210.
Cocks, L.R.M., and Torsvik, T.H. (2002) Earthgeography from 500 to 400 million yearsago: a faunal and paleomagnetic review. J.Geol. Soc. Lond., v. 159, 631–644.
Coleman, D.S., Barth, A.P., and Wooden, J.L.(2002) Early to Middle Proterozoic recon-struction of the Mojave Province, southwes-tern United States. Gondwana Res., v. 5,75–78.
Coleman, R.G., and Irwin, W.P. (1974) Ophiolitesand ancient continental margins, In The geol-ogy of continental margins (C.A. Burk andC.L. Drake, Eds.). New York, Springer Verlag,921–931.
Collins, A.S., and Windley, B.F. (2002) The tectonicevolution of central and northern Madagascarand its place in the final assembly of Gond-wana. J. Geol., v. 110, 325–329.
Collins, W.J. (1993) Melting of Archaean sialiccrust under high alphaH2O conditions; genesisof 3300 Ma Na-rich granitoids in the MountEdgar batholith, western Australia. Precamb.Res., v. 60, 151–174.
Collinson, J.W., Isbell, J.L., Elliot, D.H., Miller,M.F., Miller, J.M.G., and Veevers, J.J. (1994)Permian–Triassic Antarctic basins. In Per-mian–Triassic Pangean basins and foldbeltsalong the Panthalassan margin of Gondwana-land (J.J. Veevers and C.McA. Powell, Eds.).Geol. Soc. Amer. Memoir 184, 173–222.
Condie, K.C. (1992) Proterozoic terrane and con-tinental accretion in southwestern NorthAmerica. In Proterozoic continental evolution(K.C. Condie, Ed.). Amsterdam, Elsevier,447–480.
Condie, K.C. (1999) Mafic crustal xenoliths and theorigin of the lower continental crust. In Ocea-nic plateaus and hotspot islands; identificationand role in continental growth (K.C. Condieand D.H. Abbott, Eds.). Lithos, v. 46, 95–101.
Condie, K.C. (2001) Mantle plumes and theirrecord in earth history. Cambridge, CambridgeUniversity Press.
Condie, K.C. (2002) Breakup of a Paleoproterozoicsupercontinent. Gondwana Res., v. 5, 41–43.
Condie, K.C., and Rosen, O.M. (1994) Laurentia–Siberia connection revisited. Geology, v. 22,168–170.
Condie, K.C., Allen, P., and Narayana, B.L. (1982)Geochemistry of the Archean low- to high-grade transition zone, southern India. Contrib.Mineral. Petrol., v. 81, 157–167.
Conway Morris, S. (1992) Burgess Shale-type fau-nas in the context of the ‘‘Cambrian explo-sion’’: a review. J. Geol. Soc. London, v. 149,631–636.
Conway Morris, S., and Peel, J.S. (1990) Articu-lated halkieriids from the Lower Cambrian ofnorth Greenland. Nature, v. 345, 802–805.
Cook, F.A. (1992) Racklan orogen. Canadian J.Earth Sci., v. 29, 2490–2496.
Corfu, F., Davis, D.W., Stone, D., and Moore, M.L.(1998) Chronostratigraphic constraints on thegenesis of Archean greenstone belts, northwes-tern Superior Province, Ontario, Canada. Pre-camb. Res., v. 92, 277–295.
Correa-Gomes, L.C., and Oliveira, L.P. (2000)Radiating 1.0 Ga mafic dyke swarms of easternBrazil and western Africa; evidence of post-
References 247
assembly extension in the Rodinia superconti-nent? Gondwana Res., v. 3, 325–332.
Cosca, M.A., Mezger, K., and Essene, E.J. (1998)The Baltica-Laurentia connection; Sveco-norwegian (Grenvillian) metamorphism, cool-ing, and unroofing in the Bamble Sector,Norway. J. Geol., v. 106, 539–552.
Courtillot, V., Jaupart, C., Manighetti, I., Tappon-nier, P., and Besse, J. (1999) On causal linksbetween flood basalts and continental breakup.Earth Planet. Sci. Lett., v. 166, 177–195.
Cox, R., Gutmann, E.D., and Hines, P.G. (2002)Diagenetic origin for quartz-pebble conglom-erates. Geology, v. 30, 323–326.
Cronin, T.M. (1999) Principles of paleoclimatol-ogy. New York, Columbia University Press.
Crowley, T.J. (1994) Pangean climates, In Pangea;paleoclimate, tectonics, and sedimentation dur-ing accretion, zenith, and breakup of a super-continent (G.D. Klein, Ed.). Geol. Soc. Amer.Spec. Paper 288, 25–39.
Cunningham, W.D. (2001) Cenozoic normal fault-ing and regional doming in the southernHangay region, central Mongolia: implicationsfor the origin of the Baikal rift province. Tec-tonophysics, v. 331, 389–411.
D’Lemos, R.S., Strachan, R.A., and Topley, C.G.(Eds.) (1990) The Cadomian orogeny. Geol.Soc. London Spec. Paper 51.
da Silva Filho, A.F., and Lima, E.S. de (Eds.) (1995)Geology of the Borborema Province, northeastBrazil. Spec. Issue of J. South Amer. Earth Sci.,v. 8, 233–424.
Dabbagh, M.E., and Rogers, J.J.W. (1983) Deposi-tional environments and tectonic significanceof the Wajid Sandstone of southern Saudi Ara-bia. J. African Earth Sci., v. l, 47–57.
Dallmeyer, R.D. (1990) The West African orogensand Circum-Atlantic correlatives. In Avalonianand Cadomian geology of the North Atlantic(R.A. Strachan and G.K. Taylor, Eds.). Glas-gow, Blackie, 134–165.
Dalziel, I.W.D. (1991) Pacific margins of Laurentiaand East Antarctica-Australia as a conjugaterift pair: evidence and implications for anEocambrian supercontinent. Geology, v. 19,598–601.
Dalziel, I.W.D. (1997) Overview: Neoproterozoic–Palaeozoic geography and tectonics. Review,hypothesis, environmental speculations. Geol.Soc. Amer. Bull., v. 109, 16–42.
Dalziel, I.W.D., Lawver, L.A., and Murphy, J.B.(2000a) Plumes, orogenesis, and superconti-nental fragmentation. Earth Planet. Sci. Lett.,v. 178, 1–11.
Dalziel, I.W.D., Mosher, S., and Gahagan, L.M.(2000b) Laurentia–Kalahari collision and theassembly of Rodinia. J. Geol., v. 108,499–513.
Dasgupta, P., Sen, J., Dasgupta, M., Raith, M.,Bhui, U.K., and Ehl, J. (1999) Ultra-high tem-perature metamorphism of metapelitic granu-lites from Kondapalle, Eastern Ghats belt:implications for the Indo–Antarctic correla-tion. J. Petrol., v. 40, 1065–1087.
Davidson, A. (1998) An overview of Grenville Pro-vince geology, Canadian Shield. In Geology ofthe Precambrian Superior and Grenville pro-vinces and Precambrian fossils in North Amer-ica (S.B. Lucas and M.R. St. Onge, Eds.). Geol.Soc. Amer., 207–270.
Davidson, J.P., Harmon, R.S., and Gerhard, W.(1991) The source of central Andean magmas;some considerations. In Andean magmatismand its tectonic setting (R.S. Harmon andC.W. Rapela, Eds.). Geol. Soc. Amer. Spec.Paper 265, 171–334.
Davies, H.L., Sun, S.S., Frey, F.A., Gautier, I.,McCulloch, M.T., Price, R.C., Bassias, Y.,Klootwijk, C.T., and Leclaire, L. (1989) Basaltbasement from the Kerguelen plateau and thetrail of a Dupal plume. Contrib. Mineral. Pet-rol., v. 103, 457–469.
Davis, W.J. (1997) U–Pb zircon and rutile agesfrom granulite xenoliths in the Slave Province;evidence for mafic magmatism in the lowercrust coincident with Proterozoic dike swarms.Geology, v. 25, 343–346.
Davis, W.J., Lacroix, S., Gariepy, C., andMachado, N. (2000) Geochronology andradiogenic isotope geochemistry of plutonicrocks from the central Abitibi subprovince:significance to the internal subdivision andplutono–tectonic evolution of the Abitibi belt.Canadian J. Earth Sci., v. 37, 117–133.
Dawson, G.C., Krapez, B., Fletcher, I.R.,McNaughton, N.J., and Rasmussen, B.(2002) Did late Paleoproterozoic assembly ofproto-Australia involve collision between thePilbara, Yilgarn, and Gawler cratons? Geo-chronological evidence from the Mount BarrenGroup in the Albany–Fraser orogen of WesternAustralia. Precamb. Res., v. 118, 195–220.
Dawson, J.B. (1989) Sodium carbonatite extrusionsfrom Oldoinyo Lengai, Tanzania: implicationsfor carbonatite complex genesis. In Carbona-tites—genesis and evolution (K. Bell, Ed.). Lon-don, Unwin Hyman, 255–277.
De, S.K., Chacko, T., and Creaser, R.A. (2000)Geochemical and Nd–Pb–O isotope systema-tics of granites from the Taltson magmaticzone, NE Alberta; implications for early Pro-terozoic tectonics in western Laurentia. Pre-camb. Res., v. 102, 221–249.
de Wit, M.J., Bowring, S.A., Ashwal, L.D., Ran-drianasolo, L.G., Morel, V.P.I., and Rambelo-son, R.A. (2001) Age and tectonic evolution ofNeoproterozoic ductile shear zones in south-
248 Continents and Supercontinents
western Madagascar, with implications forGondwana studies. Tectonics, v. 20, 1–45.
Deblond, A., Punzalan, L.E., Boven, A., and Tack,L. (2001) The Malagarazi Supergroup ofsoutheast Burundi and its correlative BukobaSupergroup of northwest Tanzania: Neo- andMesoproterozoic chronostratigraphic con-straints from Ar–Ar ages on mafic intrusiverocks. J. African Earth Sci., v. 32, 435–449.
Debon, F., LeFort, P., Sheppard, S.M.F., and Sonet,J. (1986) The four plutonic belts of the Trans-himalaya–Himalaya: a chemical, mineralogi-cal, isotopic, and chronological synthesisalong a Tibet–Nepal section. J. Petrol., v. 27,219–250.
Dehler, C.M., Elrick, M., Karlstrom, K.E., Smith,G.A., Cressey, L.J., and Timmons, J.M. (2001)Neoproterozoic Chuar Group (approximately800–742 Ma), Grand Canyon; a record ofcyclic marine deposition during global coolingand supercontinent rifting. Sedimentary Geol.,v. 141–142, 465–499.
Delvaux, D., Moeys, R., Stapel, G., Petit, C., Levi,K., Miroschnichenko, A., Ruzhich, V., andSan’Kov, V. (1997) Paleostress reconstructionsand geodynamics of the Baikal region, centralAsia, Part 2: Cenozoic rifting. Tectonophysics,v. 282, 1–38.
Des Marais, D.J. (1997a) Isotopic evolution of bio-geochemical carbon cycle during the Protero-zoic Eon. Organic Geochem., v. 27, 185–193.
Des Marais, D.J. (1997b) Long-term evolution ofthe biogeochemical carbon cycle; interactionsbetween microbes and minerals. Geomicrobiol-ogy v. 35, 429–448.
Des Marais, D. J. (2001) Isotopic evolution of thebiogeochemical carbon cycle during the Pre-cambrian. In Stable isotope geochemistry(J.W. Valley and D.R. Cole, Eds.). Rev. Miner-alogy and Geochem., v. 43, Mineralogical Soc.Amer., 555–578.
Dewey, J.F., and Bird, J.M. (1970) Mountain beltsand the new global tectonics. J. Geophys. Res.,v. 75, 2626–2647.
Dickin, A.P. (1995) Radioactive isotope geology.Cambridge, Cambridge University Press.
Dickin, A.P. (1998) Nd isotope mapping of a cryp-tic continental suture, Grenville Province ofOntario. Precamb. Res., v. 91, 433–444.
Dickin, A.P. (2000) Crustal formation in the Gren-ville Province: Nd-isotope evidence. CanadianJ. Earth Sci., v. 37, 165–181.
Dietz, R.S. (1961) Continent and ocean basin evo-lution by spreading of the sea floor. Nature, v.190, 854–857.
Dinter, D.A. (1998) Late Cenozoic extension of theAlpine collisional orogen, northeastern Greece;origin of the North Aegean Basin. Geol. Soc.Amer. Bull., v. 110, 1208–1226.
Dobmeier, C., and Simmat, R. (2002) Post-Grenvil-lean transpression in the Chilka Lake area,Eastern Ghats Belt—implications for the geo-logical evolution of peninsular India. Precamb.Res., v. 113, 243–268.
Donaldson, J.A., and de Kemp, E.A. (1998)Archaean quartz arenites in the Canadianshield: examples from the Superior andChurchill Provinces. Sedimentary Geol., v.120, 153–176.
Donnelly, T.W. (1989) Geologic history of the Car-ibbean and Central America. In The Geologyof North America, v. A (A.W. Bally and A.R.Palmer, Eds.). Geol. Soc. Amer., 299–321.
Donnelly, T.W., and Rogers, J.J.W. (1980) Igneousseries in island arcs—the northeastern Carib-bean compared with worldwide island-arcassemblages. Bull. Volcanologique, v. 43,347–382.
Dostal, J., Dupuy, C., and Caby, R. (1994) Geo-chemistry of the Neoproterozoic Tilemsi belt ofIforas (Mali, Sahara): a crustal accretion of anoceanic island arc. Precamb. Res., v. 65,55–69.
DuBray, E.A. (1986) Jabal Silsilah tin prospect,Najd region, Kingdom of Saudi Arabia. J. Afri-can Earth Sci., v. 4, 237–247.
Dueker, K., Yaun, H., and Zurek, B. (2001) Thick-structured Proterozoic lithosphere of theRocky Mountain region. GSA Today, v. 11,no. 12, 1–9.
Duerr, S.B., Dingeldey, D.P., and Prave, A.R.(1997) Tale of three cratons; tectonostrati-graphic anatomy of the Damara Orogen innorthwestern Namibia and the assembly ofGondwana; discussion and reply. Geology, v.25, 1149–1151.
Ebinger, C.J., and Casey, M. (2001) Continentalbreakup in magmatic provinces; an Ethiopianexample. Geology, v. 29, 527–530.
Ebinger, C.J., and Sleep, N.H. (1998) Cenozoicmagmatism throughout East Africa resultingfrom impact of a single plume. Nature, v.395, 788–791.
Einsele, G., Ratschbacher, L., and Wetzel, A. (1996)The Himalaya–Bengal fan denudation–accu-mulation system during the past 20 Ma. J.Geol., v. 104, 163–184.
Emery, K.O., and Uchupi, E. (1984) The geology ofthe Atlantic Ocean. New York, Springer Ver-lag.
Emslie, R.F., and Hunt, P.A. (1990) Ages and pet-rogenetic significance of igneous mangerite–charnockite suites associated with massifanorthosites, Grenville province. J. Geol., v.98, 213–231.
Encarnacion, J.P., and Grunow, A.M. (1996) Chan-ging magmatic and tectonic cycles along thepalaeo-Pacific margin of Gondwana and the
References 249
onset of early Paleozoic magmatism in Antarc-tica. Tectonics, v. 15, 1325–1341.
Engel, M.H., and Macko, S.A. (Eds.) (1993)Organic geochemistry: principles and applica-tions. New York, Plenum.
Ernesto, M., Marques, L.S., Piccirillo, E.M.,Molina, E.C., Usami, N., Comin-Chiaramonti,P., and Bellieni, G. (2002) Parana magmaticprovince–Tristan da Cunha plume system;fixed versus mobile plume, petrogenetic con-siderations and alternative heat sources. J. Vol.Geotherm. Res., v. 118, 15–36.
Ernst, R.E., and Buchan, K.L. (1997) Giant radiat-ing dyke swarms: their use in identifying pre-Mesozoic large igneous provinces and mantleplumes. In Large igneous provinces—continen-tal, oceanic, and planetary flood volcanism (J.J.Mahoney and M.F. Coffin, Eds.). Amer. Geo-phys. Union Geophys. Monograph 100,297–333.
Ernst, W.G. (1970) Tectonic contact between theFranciscan melange and the Great Valleysequence—crustal expression of a Late Meso-zoic Benioff zone. J. Geophys. Res., v. 75,886–902.
Erwin, D.H. (1993) The great Paleozoic crisis: lifeand death in the Permian. New York, Colum-bia University Press.
Erwin, D.H., Bowring, S.A., and Yugan, J. (2002)End-Permian mass extinctions: a review. InCatastrophic events and mass extinctions:impacts and beyond (C. Koeberl and K.G.MacLeod, Eds.). Geol. Soc. Amer. Spec.Paper 356, 363–383.
Evans, D.A., Beukes, N.J., and Kirschvink, J.L.(1997) Low latitude glaciation in the Paleopro-terozoic era. Nature, v. 386, 262–266.
Evans, D.A.D. (2000) Stratigraphic, geochronologi-cal, and paleomagnetic constraints upon theNeoproterozoic climatic paradox. Amer. J.Sci., v. 300, 347–433.
Eyles, N. (1993) Earth’s glacial record and its tec-tonic setting. Earth-Sci. Rev., v. 35, 1–248.
Eyles, N., and Januszczak, N. (2003) Interpretingthe Neoproterozoic glacial record; the impor-tance of tectonics. Amer. Geophys. UnionMonograph (in press).
Faill, R.T. (1997) A geologic history of the north-central Appalachians. 1. Orogenesis from theMesoproterozoic through the Taconic oro-geny. Amer. J. Sci., v. 297, 551–619.
Faure, G. (1986) Principles of isotope geology (2nd.ed.). New York, John Wiley and Sons.
Fedo, C.M. (2000) Setting and origin for proble-matic rocks from the > 3.7 Ga Isua greenstonebelt, southern West Greenland; Earth’s oldestcoarse clastic sediments. Precamb. Res., v. 101,69–78.
Fedo, C.M., Young, G.M., Nesbitt, H.W., andHanchar, J.M. (1997) Potassic and sodic meta-
somatism in the Southern Province of theCanadian Shield: evidence from the Palaepro-terozoic Serpent Formation, Huronian Super-group, Canada. Precamb. Res., v. 84, 17–36.
Fedonkin, M.A. (2003) The origin of Metazoa inthe light of the Proterozoic fossil record.Paleontol. Res., v. 7, 9–41.
Fernandez-Alonso, M., and Theunissen, K. (1998)Airborne geophysics and geochemistry providenew insights in the intracontinental evolutionof the Mesoproterozoic Kibaran belt (CentralAfrica). Geol. Mag., v. 135, 203–216.
Ferreira, V.P., Sial, A.N., and Jardim de Sa, E.F.(1998) Geochemical and isotopic signatures ofProterozoic granitoids in terranes of the Bor-borema structural province, northeastern Bra-zil. J. South Amer. Earth Sci., v. 11, 439–455.
Ferry, J.M. (Ed.) (1986) Characterization of meta-morphism through mineral equilibria. Min.Soc. Amer., Rev. Mineralogy, v. 10, 397 pp.
Fershtater, G.B., Montero, P., Borodina, N.S.,Pushkarev, E.V., Smirnov, V.N., and Bea, P.(1997) Uralian magmatism: an overview. Tec-tonophysics, v. 276, 87–102.
Feybesse, J.L., and Milesi, J.P. (1994) The Archean/Proterozoic contact zone in West Africa: amountain belt of decollement, thrusting andfolding on a continental margin related to the2.1 Ga convergence of Archean cratons? Pre-camb. Res., v. 69, 199–227.
Feybesse, J.L., Johan, V., Triboulet, C., Guerrot, C.,Mayaga-Mikolo, F., Bouchot, V., and EkoN’Dong, J. (1998) The West Central AfricanBelt: a model of 2.5–2.0 Ga accretion and two-phase orogenic evolution. Precamb. Res., v. 87,161–216.
Fielding, E.J. (1996) Tibet uplift and erosion. Tec-tonophysics, v. 260, 55–84.
Fitzsimons, I.C.W. (2000) Grenville-age basementprovinces in East Antarctica: evidence for threeseparate collisional orogens. Geology, v. 28,879–882.
Flagler, P.A., and Spray, J.G. (1991) Generation ofplagiogranite by amphibolite anatexis inoceanic shear zones. Geology, v. 19, 70–73.
Foster, D.A., and Gray, D.R. (2000) Evolution andstructure of the Lachlan fold belt (orogen) ofeastern Australia. Ann. Rev. Earth Planet. Sci.,v. 28, 47–80.
Fountain, D.M., Arculus, R., and Kay, R.W. (Eds.)(1992) Continental lower crust. Amsterdam,Elsevier.
Frantz, J.C., and Botelho, N.F. (2000) Neoproter-ozoic granitic magmatism and evolution of theeastern Dom Feliciano Belt in southernmostBrazil; a tectonic model. Gondwana Res., v.3, 7–19.
Freeman, K.H. (2001) Isotopic biogeochemistry ofmarine organic carbon. In Stable isotope geo-chemistry (J.W. Valley and D.R. Cole, Eds.).
250 Continents and Supercontinents
Rev. Mineralogy and Geochem., v. 43, Miner-alogical Soc. Amer., 579–605.
Frey, M., Desmons, J., and Neubauer, F. (1999)The new metamorphic map of the Alps.Schweiz. Mineral. Petrog. Mitteilungen, v. 79,230 pp.
Friberg, M., and Petrov, G.A. (1998) Structure ofthe Middle Urals, east of the main Uralianfault. Geological J., v. 33, 37–48.
Frimmel, H.E., and Frank, W. (1998) Neoprotero-zoic tectono-thermal evolution of the GariepBelt and its basement, Namibia and SouthAfrica. Precamb. Res., v. 90, 1–28.
Frost, C.D., Schellekens, J.H., and Smith, A.L.(1998) Nd, Sr, and Pb isotopic characterizationof Cretaceous and Paleogene volcanic and plu-tonic island arc rocks from Puerto Rico. InTectonics and geochemistry of the northeasternCaribbean (E.G. Lidiak and D.K. Larue, Eds.).Geol. Soc. Amer. Spec. Paper 322, 123–132.
Fullagar, P.D. (2002) Evidence for early Mesopro-terozoic (and earlier?) crust in the southern andcentral Appalachians of North America. Gond-wana Res., v. 5, 197–204.
Gale, A.S., Hardenbol, J., Hathway, B., Kennedy,W.J., Young, J.R., and Phansalkar, V. (2002)Global correlation of Cenomanian (Upper Cre-taceous) sequences: evidence for Milankovitchcontrol on sea level. Geology, v. 30, 291–294.
Gamble, J.A., Christie, R.H.K., Wright, I.C., andWysoczanski, R.J. (1997) Primitive K-richmagmas from Clark volcano, southern Kerma-dec arc: a paradox in the K–depth relationship.Canadian Mineral., v. 35, 275–290.
Gandhi, S.S., Mortensen, J.K., Prasad, N., and vanBreemen, O. (2001) Magmatic evolution of thesouthern Great Bear continental arc, northwes-tern Canadian shield: geochronological con-straints. Canadian J. Earth Sci., v. 38,767–785.
Garfunkel, Z. (1998) Constraints on the origin andhistory of the eastern Mediterranean basin. InCollision-related processes in the Mediterra-nean region (A.H.F. Robertson and M.C.Comas, Eds.). Tectonophysics Spec. Issue, v.298, 5–32.
Gaudette, H., Olszewski, W.J., Santos, J., andOrestes, S. (1996) Geochronology of Precam-brian rocks from the northern part of the Gui-ana shield, state of Roraima, Brazil. J. SouthAmer. Earth Sci., v. 9, 183–195.
Geraldes, M.C., Van Schmus, W.R., Condie, K.C.,Bell, S., Texeira, W., and Babinski, M. (2001)Proterozoic geologic evolution of the SW partof the Amazonian craton in Mato GrossoState, Brazil. Precamb. Res., v. 111, 91–128.
Ghosh, S., Chakraborty, S., Paul, D.K., Bhalla, J.K.,Bishui, P.K., and Gupta, S.N. (1994) New Rb–Sr isotopic ages and geochemistry of granitoidsfrom Meghalaya and their significance in mid-
dle- to late-Proterozoic crustal evolution.Indian Minerals, v. 48, 33–44.
Ghuma, M.A., and Rogers, J.J.W. (1978) Geology,geochemistry, and tectonic setting of the BenGhnema batholith, Tibesti massif, southernLibya. Geol. Soc. Amer. Bull., v. 89,1351–1358.
Gibbs, A.K., and Barron, C.N. (1983) The Guianashield reviewed. Episodes, v. 1983, no. 2,7–14.
Gibbs, A.K., and Barron, C.N. (1993) The geologyof the Guiana Shield. New York, Oxford Uni-versity Press.
Glazner, A.F., and Brandon, M.T. (2002) Origin ofenriched geochemical signatures in continentalarc rocks by antithetic subduction of continen-tal lithosphere (abstract). Eos (Trans. Amer.Geophys. Union), v. 83, no. 47, AbstractV12C–10.
Golynsky, A., and Jacobs, J. (2001) Grenville-ageversus Pan-African magnetic anomaly imprintsin western Dronning Maud Land, East Antarc-tica. J. Geol., v. 109, 136–142.
Goodge, J.W., and Fanning, C.M. (1999) 2.5 b.y.of punctuated earth history as recorded in asingle rock. Geology, v. 27, 1007–1010.
Goodge, J.W., Fanning, C.M., and Bennett, V.C.(2001) U–Pb evidence of ~1.7-Ga crustal tec-tonism during the Nimrod Orogeny in theTransantarctic Mountains, Antarctica: impli-cations for Proterozoic plate reconstructions.Precamb. Res., v. 12, 261–288.
Gorbatschev, R., and Bogdanova, S. (1993) Fron-tiers in the Baltic shield. Precamb. Res., v. 64,3–21.
Gower, C.F., Ryan, A.B., and Rivers, T. (1990)Mid-Proterozoic Laurentia–Baltica; an over-view of its geological evolution and a summaryof the contributions made by this volume.In Mid-Proterozoic Laurentia–Baltica (C.F.Gower, T. Rivers, and A.B. Ryan, Eds.).Geol. Assoc. Canada Spec. Paper 38, 1–20.
Grantz, A., Clark, D.L., Phillips, R.L., and Srivas-tava, S.P. (1998) Phanerozoic stratigraphy ofNorthwind Ridge, magnetic anomalies in theCanada basin, and the geometry and timing ofrifting in the Amerasia basin, Arctic Ocean.Geol. Soc. Amer. Bull., v. 110, 801–820.
Gray, J. (1993) Major Paleozoic land plant evolu-tionary bio-events. Palaeogeog., Palaeoclim.,Palaeontol., v. 104, 153–169.
Greenberg, J.K. (1981) Characteristics and origin ofEgyptian Younger Granites. Geol. Soc. Amer.Bull., v. 89, Pt. 1, pp. 224–232; Pt. 2, pp.749–840.
Gregory, J.W. (1921) The rift valleys and geologyof East Africa; an account of the origin andhistory of the rift valleys of East Africa andtheir relation to the contemporary earth move-
References 251
ments which transformed the geography of theworld. London, Seeley, Service and Co.
Grey, K., Walter, M.R., and Calver, C.R. (2003)Neoproterozoic biotic diversification: snowballearth or aftermath of the Acraman impact?Geology, v. 31, 459–462.
Griffin, W.L., O’Reilly, S.Y., and Ryan, C.G.(1999) The composition and origin of subcon-tinental lithospheric mantle. In Mantle petrol-ogy: field observations and high-pressureexperimentation: a tribute to Francis R. (Joe)Boyd (Y. Fei, C.M. Bertka, and B.O. Mysen,Eds.). Geochemical Soc. Spec. Pub. 6, 13–43.
Griffin, W.L., O’Reilly, S.Y., Ryan, C.G., Gaul, O.,and Ionov, D. (1998) Secular variation in thecomposition of the subcontinental lithosphericmantle. In Structure and evolution of the Aus-tralian continent (J. Braun et al., Eds.). Amer.Geophys. Union Geodynamics Series, v. 26,1–26.
Groenewald, P.B., Grantham, G.H., and Watkeys,M.K. (1991) Geological evidence for a Proter-ozoic to Mesozoic link between southeasternAfrica and Dronning Maud Land, Antarctica.J. Geol. Soc. London, v. 148, 1115–1123.
Grow, J.A., and Sheridan, R.E. (1988) U.S. Atlanticcontinental margin; a typical Atlantic-type orpassive continental margin. In The Atlanticcontinental margin (J.A. Grow and R.E. Sher-idan, Eds.). Geol. Soc. Amer., Geology ofNorth America v. I–2, 1–7.
Gruau, G., Rosing, M., Bridgwater, D., and Gill,R.C.O. (1996) Resetting of Sm–Nd systematicsduring metamorphism of >3.7-Ga rocks; impli-cations for isotopic models of early Earth dif-ferentiation. Chem. Geol., v. 133, 225–240.
Gueguen, E., Doglioni, C., and Fernandez, M.(1998) On the post-25 Ma evolution of thewestern Mediterranean. In Collision-relatedprocesses in the Mediterranean region(A.H.F. Robertson and M.C. Comas, Eds.).Tectonophysics Spec. Issue, v. 298, 259–270.
Guimares, I. deP., da Silva Filho, A.F., and Ade-jardo, F. (1998) Nd- and Sr- isotopic and U–Pbgeochronologic constraints for evolution of theshoshonitic Brasiliano Bom Jardin and Tori-tama complexes; evidence for a Transamazo-nian enriched mantle under Borborematectonic province, Brazil. Internat. Geol. Rev.,v. 40, 500–527.
Guiraud, R., and Bosworth, W. (1999) Phanerozoicgeodynamic evolution of northeastern Africaand the northwestern Arabian Platform. Tec-tonophysics, v. 315, 73–108.
Guo, A., and Dickin, A.P. (1996) The southernlimit of Archean crust and significance ofrocks with Paleoproterozoic model ages; Ndmodel age mapping in the Grenville Provinceof western Quebec. Precamb. Res., v. 77,231–241.
Gurnis, M. (1988) Large-scale mantle convectionand the aggregation and dispersal of supercon-tinents. Nature, v. 232, 695–699.
Gutenberg, B., and Richter, C.F. (1934, 1935,1936) On seismic waves. Gerlands BeitrageGeophysik, v. 43, pp. 56–133; v. 45, pp.280360; v. 47, pp. 73–131.
Haapala, I., and Ramo, O.T. (1990) Petrogenesis ofthe Proterozoic rapakivi granites of Finland. InOre-bearing granite systems: petrogenesis andmineralizing processes (H.J. Stein and J. Han-nah, Eds.). Geol. Soc. Amer. Spec. Paper 246,275–286.
Hagadorn, J.W., Pflueger, F., and Bottjer, D. (Eds.)(1999) Unexplored microbial worlds. Palaios,v. 14, 93 pp.
Hall, R., and Spakman, W. (2002) Subducted slabsbeneath the eastern Indonesia–Tonga region;insights from tomography. Earth Planet. Sci.Lett., v. 201, 321–336.
Hallam, A., and Wignall, P.B. (1997) Mass extinc-tions and their aftermath. Oxford, OxfordUniversity Press.
Hamilton, W. (1979) Tectonics of the Indonesianregion. U.S. Geol. Surv. Spec. Pub. 1078.
Han, T.-M., and Runnegar, B. (1992) Megascopiceukaryotic algae from the 2.1-billion-year-oldNegaunee iron-formation, Michigan. Science,v. 257, 232–235.
Hanmer, S., Corrigan, D., Pehrsson, S., andNadeau, L. (2000) SW Grenville Province,Canada; the case against post-1.4 Ga accre-tionary tectonics. Tectonophysics, v. 319,33–51.
Hansen, E.C., Newton, R.C., Janardhan, A.S., andLindenberg, S. (1995) Differentiation of lateArchean crust in the eastern Dharwar craton,Krishnagiri–Salem area, South India. J. Geol.,v. 103, 629–651.
Hansen, V.L. (1992) Backflow and margin-parallelshear within an ancient subduction complex.Geology, v. 20, 71–74.
Hanson, R.E., Wilson, T.J., and Munyanwiya,H. (1994) Geologic evolution of the Neopro-terozoic Zambezi Orogenic Belt in Zambia. J.African Earth Sci., v. 18, 135–150.
Haq, B.U., Hardenboll, J., and Vail, P.R. (1987)Chronology of fluctuating sea levels since theTriassic. Science, v. 238, 1237–1242.
Hargraves, R.B. (1976) Precambrian geologic his-tory. Science, v. 193, 363–371.
Harmon, R.S. and Rapela, C.W. (Eds.) (1991)Andean magmatism and its tectonic setting.Geol. Soc. Amer. Spec. Paper 265. 309 pp.
Harris, L.B. (1993) Correlations of tectonother-mal events between the Central Indian Tec-tonic Zone and the Albany Mobile Belt ofWestern Australia. In Gondwana Eight:assembly, evolution and dispersal (R.H.Findlay, R. Unrug, M.R. Banks, and J.J.
252 Continents and Supercontinents

Veevers, Eds.). Rotterdam, A.A. Balkema,165–180.
Harris, L.B. (1995) Correlation between theAlbany, Fraser, and Darling mobile belts ofwestern Australia and Mirnvy to WindmillIslands in the East Antarctic shield: implica-tions for Proterozoic Gondwanaland recon-structions. In India and Antarctica during thePrecambrian (M. Yoshida and M. Santosh,Eds.). Geol. Soc. India Mem. 34, 47–71.
Harris, N.B.W., Santosh, M., and Taylor, P.N.(1994) Crustal evolution in South India: con-straints from Nd isotopes. J. Geol., v. 102,139–150.
Harrison, T.M., Copeland, P., Kidd, W.S.F., andAn Yin (1992) Raising Tibet. Science, v. 255,1663–1670.
Hartmann, L.A. (2002) The Mesoproterozoicsupercontinent Atlantica in the Brazilianshield—review of geological and U–Pb zirconand Sm–Nd isotopic evidence. GondwanaRes., v. 5, 157–163.
Hartz, E.B., and Torsvik, T.H. (2002) Balticaupside down: a new plate tectonic model forRodinia and the Iapetus Ocean. Geology, v.30, 255–258.
Hashimoto, M. (Ed.) (1991) Geology of Japan.Tokyo, Terra Scientific Publishing Co., andDordrecht, Kluwer Academic Publishers.
Hasselbo, S.P., Robinson, S.A., Surlyk, F., and Pia-secki, S. (2002) Terrestrial and marine extinc-tion at the Triassic–Jurassic boundarysynchronized with major carbon-cycle pertur-bation: a link to initiation of massive volcan-ism? Geology, v. 30, 251–254.
Hatcher, R.D., Jr. (2002). Alleghanian (Appala-chian) orogeny, a product of zipper tectonics;rotational transpressive continent–continentcollision and closing of ancient oceans alongirregular margins. In Variscan–Appalachiandynamics; the building of the late Paleozoicbasement (J.R. Martinez Catalan, R.D.Hatcher, Jr., R. Arenas, and F. Diaz Garcia,Eds.). Geol. Soc. Amer. Spec. Paper 364,1199–1208.
Hauck, M.L., Nelson, K.D., Brown, L.D., Zhao,Wenjin, and Ross, A.R. (1998) Crustal struc-ture of the Himalayan orogen at ~908 eastlongitude from Project INDEPTH deep reflec-tion profiles. Tectonics, v. 17, 481–500.
Hawkesworth, C.J., Kelley, S., Turner, S., Le Roex,A., and Storey, B. (1999) Mantle processesduring Gondwana break-up and dispersal. J.African Earth Sci., v. 28, 239–261.
Hayes, J.M. (2001) Fractionation of carbon andhydrogen isotopes in biosynthetic processes.In Stable isotope geochemistry (J.W. Valleyand D.R. Cole, Eds.). Rev. Mineralogy andGeochem., v. 43, Mineralogical Soc. Amer.,225–277.
Hendrix, M.S., and Davis, G.A. (Eds.) (2001)Paleozoic and Mesozoic tectonic evolution ofcentral Asia: from continental assembly tointracontinental deformation. Geol. Soc.Amer. Mem. 194.
Henry, P., Stevenson, R.K., Larbi, Y., and Gariepy,C. (2000) Nd isotopic evidence for Early toLate Archean (3.4–2.7 Ga) crustal growth inthe Western Superior Province (Ontario,Canada). Tectonophysics, v. 322, 135–151.
Hess, H.H. (1962) History of ocean basins. In Pe-trologic studies—a volume in honor of A.F.Buddington (A.E.J. Engel, H.L. James, andB.F. Leonard, Eds.). Geol. Soc. Amer., NewYork, 599–620.
Heubeck, C. (2001) Assembly of central Asia dur-ing the middle and late Paleozoic. In Paleozoicand Mesozoic tectonic evolution of centralAsia: from continental assembly to intraconti-nental deformation (M.S. Hendrix and G.A.Davis, Eds.). Geol. Soc. Amer. Mem. 194,1–22.
Hill, K.C., and Raza, A. (1999) Arc-continent colli-sion in Papua Guinea; constraints from fissiontrack thermochronology. Tectonics, v. 18,950–966.
Hodges, K.V. (2000) Tectonics of the Himalayaand southern Tibet from two perspectives.Geol. Soc. Amer. Bull., v. 112, 324–350.
Hoffman, P.F. (1991) Did the breakout of Lauren-tia turn Gondwanaland inside out? Science, v.252, 1409–1412.
Hoffman, P.F. (1992) Rodinia, Gondwanaland,Pangea, and Amasia; alternating kinematic sce-narios of supercontinental fusion (abstract).Eos (Trans. Amer. Geophys. Union), v. 73,no. 14 supplement, 282.
Hoffman, P.F., and Schrag, D.P. (2002) The snow-ball Earth hypothesis: testing the limits ofglobal change. Terra Nova, v. 14, 129–155.
Hoffman, P.F., Kaufman, A.J., Halverson, G.P.,and Schrag, D.P. (1998) The Neoproterozoicsnowball earth. Science, v. 281, 1342–1346.
Holmes, A. (1928) Radioactivity and continentaldrift. Geol. Mag., v. 65, 236–238.
Holser, W.T. (1997) Geochemical events documen-ted in inorganic carbon isotopes. Palaeogeog.,Palaeoclim., Palaeontol., v. 132, 173–182.
Holtta, P., Huhma, H., Manttari, I., Peltonen, P.,and Juhanoja, J. (2000) Petrology and geo-chemistry of mafic granulite xenoliths fromthe Lahtojoki kimberlite pipe, eastern Finland.Lithos, v. 51, 109–133.
Holzer, L., Barton, J.M., Paya, B.K., and Kramers,J.D. (1999) Tectonothermal history of the wes-tern part of the Limpopo Belt; tectonic modelsand new perspectives. J. African Earth Sci., v.28, 383–402.
Homewood, P., Allen, P.A., and Williams, G.D.(1986) Dynamics of the molasse basin of wes-
References 253
tern Switzerland. In Foreland basins (P.A.Allen and P. Homewood, Eds.). Internat.Assoc. Sedimentol. Spec. Pub. 8, 199–217.
Hooper, P.R. (1997) The Columbia River floodbasalt province: current status. In Largeigneous provinces: continental, oceanic, andplanetary flood volcanism (J.J. Mahoney andM.F. Coffin, Eds.). Geophysical Monograph100, Amer. Geophys. Union, 1–27.
Hooper, P.R., and Hawkesworth, C.J. (1993) Iso-topic and geochemical constraints on the originand evolution of the Columbia River Basalt. J.Petrol., v. 34, 1203–1246.
House, M.R. (2002) Strength, timing, setting andcause of mid-Paleozoic extinctions. Palaeo-geog., Palaeoclim., Palaeontol., v. 181, 5–25.
Hurich, C.A. (1996) Kinematic evolution of thelower plate during intracontinental subduc-tion: an example from the Scandinavian Cale-donides. Tectonics, v. 15, 1248–1263.
Ichikawa, K. (1990) Pre-Cretaceous terranes ofJapan. In Pre-Jurassic evolution of easternAsia (K. Ichikawa, S. Mizutani, I. Hara, S.Hada, and A. Yao, Eds.). Osaka, IGCP–IUGSProject 224 Publication, 1–12.
Ionov, D. (2002) Mantle structure and rifting pro-cesses in the Baikal–Mongolia region: geophy-sical data and evidence from xenoliths involcanic rocks. Tectonophysics, v. 351,41–60.
Isozaki, Y. (1997) Permo-Triassic boundary super-anoxia and stratified superocean: records fromlost deep sea. Science, v. 276, 235–238.
Jackson, S.L., Fyon, J.A., and Corfu, F. (1994)Review of Archean supracrustal assemblagesof the southern Abitibi greenstone belts inOntario, Canada; products of microplate inter-action within a large-scale plate-tectonic set-ting. Precamb. Res., v. 65, 183–205.
Jacobs, J. (1999) Neoproterozoic/lower Paleozoicevents in central Dronning Maud Land (EastAntarctica). Gondwana Res., v. 2, 473–480.
Jacobs, J., Fanning, C.M., Henjes-Kunst, F., Olesch,M., and Paech, H.J. (1998) Continuation ofthe Mozambique belt into East Antarctica:Grenville-age metamorphism and polyphasePan-African high-grade events in central Dron-ning Maud Land. J. Geol., v. 106, 385–406.
Jacobshagen, V., Muller, J., Wemmer, K., Ahrendt,H., and Manutsoglu, E. (2002) Hercyniandeformation and metamorphism in the Cordil-lera Oriental of southern Bolivia, centralAndes. Tectonophysics, v. 345, 119–130.
Jaupart, C., and Mareschal, J.C. (1999) The ther-mal structure and thickness of continentalroots. Lithos, v. 48, 93–114.
Javaux, E.J., Knoll, A.H., and Walter, M.R. (2001)Morphological and ecological complexity inearly eukaryotic ecosystems. Nature, v. 412,66–69.
Jayananda, M., Moyen, J.F., Martin, H., Peucat,J.J., Auvray. B., and Mahabaleswar, B. (2000)Late Archaean (2550–2520 Ma) juvenile mag-matism in the eastern Dharwar craton, south-ern India; constraints from geochronology,Nd–Sr isotopes and whole rock geochemistry.Precamb. Res., v. 99, 225–254.
Joachimski, M.M., Pancost, R.D., Freeman, K.H.,Ostertag-Henning, C., and Buggisch, W.(2002) Carbon isotope geochemistry of theFrasnian–Fammenian transition. Palaeogeog.,Palaeoclim., Palaeontol., v. 181, 91–109.
Johansson, L., Moller, C., and Soderlund, U. (2001)Geochronology of eclogite facies metamorph-ism in the Sveconorwegian Province of SWSweden. Precamb. Res., v. 106, 261–275.
Johnson, M.R.W. (1994) Volume balance of ero-sional loss and sediment deposition related toHimalayan uplifts. J. Geol. Soc. London, v.151, 217–220.
Johnson, P.R., and Stewart, I.C.F. (1995) Magneti-cally inferred basement structure in centralSaudi Arabia. Tectonophysics, v. 245, 37–52.
Johnson, S.P., and Oliver, G.J.H. (2000) Mesopro-terozoic oceanic subduction, island-arc forma-tion and the initiation of back-arc spreading inthe Kibaran belt of central, southern Africa:evidence from the ophiolite terrane, Cheworeinliers, northern Zimbabwe. Precamb. Res., v.103, 125–146.
Johnston, S.T., and Thorkelson, D.J. (2000) Con-tinental flood basalts; episodic magmatismabove long-lived hotspots. Earth Planet. Sci.Lett., v. 175, 247–256.
Jolivet, M., Brunel, M., Seward, D., Xu, A., Yang,J., Roger, F., Tapponier, P., Malavielle, J., andArnaud, N. (2001) Mesozoic and Cenozoictectonics of the northern edge of the TibetanPlateau; fission-track constraints. Tectono-physics, v. 343, 111–134.
Joly, J. (1925) The surface history of the earth.Oxford, Clarendon Press.
Jordan, T.H. (1975) The continental Tectosphere.Nature, v. 257, 745–750.
Juhlin, C., Wahlgren, C.-H., and Stephens, M.B.(2000) Seismic imaging in the frontal part ofthe Sveconorwegian Orogen, south-westernSweden. Precamb. Res., v. 102, 135–154.
Jung, S., Hoernes, S., and Mezger, K. (2000) Geo-chronology and petrogenesis of Pan-Africansyn-tectonic, S-type and post-tectonic A-typegranite (Namibia); products of melting of crus-tal sources, fractional crystallization and wallrock entrainment. Lithos, v. 50, 259–287.
Jung, S., Mezger, K., and Hoernes, S. (1997) Pet-rology and geochemistry of syn- to post-colli-sional metaluminous A-type granites; a majorand trace element and Nd–Sr–Pb–O isotopestudy from the Proterozoic Damara Belt,Namibia. Lithos, v. 45, 147–175.
254 Continents and Supercontinents

Jung, S., Mezger, K., and Hoernes, S. (2001) Traceelement and isotopic (Sr, Nd, Pb, O) argumentsfor a mid-crustal origin of Pan-African garnet-bearing S-type granites from the Damaraorogen (Namibia). Precamb. Res., v. 110,325–355.
Kalsbeek, F., and Nutman, A.P. (1996) Anatomyof the early Proterozoic Nagssugtoqidian Oro-gen, West Greenland, explored by reconnais-sance SHRIMP U–Pb zircon dating. Geology,v. 24, 515–518.
Kalsbeek, F., Pulvertaft, T.C.R., and Nutman, A.P.(1998) Geochemistry, age, and origin of meta-graywackes from the Palaeoproterozoic KarratGroup, Rinkian belt, West Greenland. Pre-camb. Res., v. 91, 383–399.
Kalsbeek, F., Thrane, K., Nutman, A.P., and Jep-sen, H.F. (2000) Late Mesoproterozoic to earlyNeoproterozoic history of the East GreenlandCaledonides: evidence for Grenvillian orogen-esis? J. Geol. Soc. London, v. 157, 1215–1225.
Kampunzu, A.B., and Cailteux, J. (1999) Tectonicevolution of the Lufilian Arc (Central Africacopper belt) during Neoproterozoic Pan-African orogenesis. Gondwana Res., v. 2,401–421.
Kampunzu, A.B., Tembo, F.M., Kapenda, D., andHunstman-Mapila, P. (2000) Geochemistryand tectonic setting of mafic igneous units inthe Neoproterozoic Katangan Basin, centralAfrica; implications for Rodinia breakup.Gondwana Res., v. 3, 125–153.
Kano, T. (2001) Major geologic units of south-westJapan. ISRGA Field Guide Book. GondwanaRes. Group Misc. Publ. No. 11, GondwanaInstitute of Geology and Environment (Japan).
Karlstrom, K.E., and Humphreys, E.D. (1998) Per-sistent influence of Proterozoic accretionaryboundaries in the tectonic evolution of south-western North America: interaction of cratonicgrain and mantle modification events. RockyMountain Geol., v. 33, 161–179.
Karlstrom, K.E., Harlan, S.S., Williams, M.L.,McLelland, J., Geissman, J.W., and Ahall,A.-I. (1999) Refining Rodinia: geologic evi-dence for the Australia–western U.S. connec-tion. GSA Today, v. 9, no. 10, 1–7.
Karson, J.A. (1999) Geological investigation of alineated massif at the Kane transformationfault; implications for oceanic core complexes.In Response of the earth’s lithosphere to exten-sion (R.S. White, R.F.P. Hardman, A.B. Watts,and R.B. Whitmarsh, Eds.). Phil. Trans. Roy.Soc. Mathematical, Physical and EngineeringSciences, v. 357, 713–740.
Katili, J.A., and Reinemund, J.A. (1982) SoutheastAsia: tectonic framework, earth resources andregional geological programs. Internat. UnionGeol. Sci. Pub. 13.
Kay, S.M., Mpodozis, C., Ramos, V.A., and Muni-zaga, F. (1991) Magma source variations formid-late Tertiary magmatic rocks associatedwith a shallowing subduction zone and a thick-ening crust in the central Andes (288 to 338S).In Andean magmatism and its tectonic setting(R.S. Harmon and C.W. Rapela, Eds.). Geol.Soc. Amer. Spec. Paper 265, 113–137.
Kearey, P. (1996) Global tectonics (2nd ed.).Oxford, Blackwell Science.
Kelly, N.M., Clarke, G.L., and Fanning, C.M.(2002) A two-stage evolution of the Neopro-terozoic Rayner structural episode: new U–Pbsensitive high resolution ion microprobe con-straints from the Oygarden Group, KempLand, East Antarctica. Precamb. Res., v. 116,307–330.
Kempton, P.D., Downes, H., and Embey-Isztin, A.(1997) Mafic granulite xenoliths in Neogenealkali basalts from the western PannonianBasin; insights into the lower crust of a col-lapsed orogen. J. Petrol., v. 38, 941–970.
Kempton, P.D., Fitton, J.G., Saunders, A.D., Now-ell, G.M., Taylor, R.N., Hardarson, B.S., andPearson, G. (2000) The iceland plume in spaceand time: a Sr–Nd–Pb–Hf study of the NorthAtlantic rifted margin. Earth Planet. Sci. Lett.,v. 177, 255–271.
Kennedy, W.Q. (1964) The structural deformationof Africa in the Pan-African (�500 m.y.) tec-tonic episode. Leeds Univ. Res. Inst. AfricanGeol., Annual Rept., v. 8, 48–49.
Kent, R.W., and Fitton, J.G. (2000) Mantle sourcesand melting dynamics in the British Palaeogeneigneous province. J. Petrology, v. 41,1023–1040.
Keppie, J.D., and Ortega-Gutierrez, F. (1999) Mid-dle American Precambrian basement: a missingpiece of the reconstructed 1-Ga orogen. Geol.Soc. Amer. Spec. Paper 336, 199–210.
Keppie, J.D., Dostal, J., Ortega-Gutierrez, F., andLopez, R. (2001) A Grenvillian arc on themargin of Amazonia; evidence from the south-ern Oaxacan Complex, southern Mexico. Pre-camb. Res., v. 112, 165–181.
Kerr, A., Ryan, B., Gower, C.F., and Wardle, R.J.(1996) The Makkovik province: extension ofthe Ketilidian mobile belt in mainland NorthAmerica. In Precambrian crustal evolution inthe North Atlantic region (T.S. Brewer, Ed.).Geol. Soc. London Spec. Publ. 112, 155–177.
Kerrich, R., and Ludden, J.N. (2000) The role offluids during formation and evolution of thesouthern Superior Province lithosphere; anoverview. Canadian J. Earth Sci., v. 37,135–164.
Ketchum, J.W.F., and Davidson, A. (2000) Crustalarchitecture and tectonic assembly of the Cen-tral Gneiss Belt, southwestern Grenville Pro-
References 255
vince, Canada: a new interpretation. CanadianJ. Earth Sci., v. 37, 217–234.
Kirschvink, J.L. (1992) Late Proterozoic low-lati-tude global glaciation: the snowball Earth. InThe Proterozoic biosphere: a multidisciplinarystudy (J.W. Schopf and C. Klein, Eds.). Cam-bridge, Cambridge Univ. Press, 51–52.
Kirstein, L.A., Kelley, S., Hawkesworth, C., Turner,S., Mantovani, M., and Wijbrans, J. (2001)Protracted felsic magmatic activity associatedwith the opening of the South Atlantic. J. Geol.Soc. London, v. 158, 583–592.
Kloppenberg, A., White, S.H., and Zegers, T.E.(2001) Structural evolution of the Warra-woona Greenstone Belt and adjoining grani-toid complexes, Pilbara craton, Australia:implications for Archean tectonic processes.Precamb. Res., v. 112, 107–147.
Knauth, L.K. (1998) Salinity history of the earth’searly ocean. Nature, v. 395, 554–555.
Knauth, P.L., and Lowe, D.R. (2003) High Archeanclimatic temperature inferred from oxygen iso-tope geochemistry of cherts in the 3.5 Ga Swa-ziland Supergroup, South Africa. Geol. Soc.Amer. Bull, v. 115, 566–580.
Knoll, A.H., Bambach, R.K., Canfield, D.E., andGrotzinger, J.P. (1996) Comparative earth his-tory and Late Permian mass extinction.Science, v. 273, 452–457.
Koeberl, C., and MacLeod, K.G. (Eds.) (2002) Cat-astrophic events and mass extinctions: impactsand beyond. Geol. Soc. Amer. Spec. Paper 356.
Kogbe, C.A., and Burollet, P.F. (1990). A review ofcontinental sediments in Africa. In Major Afri-can continental Phanerozoic complexes anddynamics of sedimentation (C.A. Kogbe andJ. Lang, Eds.). J. African Earth Sci., v. 10,1–25.
Kopf, C.F. (2002) Archean and early Proterozoicevents along the Snowbird tectonic zone innorthern Saskatchewan, Canada. GondwanaRes., v. 5, 79–83.
Kriegsman, L.M. (1995) The Pan-African event inEast Antarctica; a view from Sri Lanka and theMozambique belt. Precamb. Res., v. 75,263–277.
Kristofferson, Y. (1990) Eurasia basin. In The Arc-tic Ocean region (A. Grantz, L. Johnson, andJ.F. Sweeney, Eds.). The geology of NorthAmerica, v. L, Geol. Soc. Amer., 365–378.
Krogh, T.H., and Moser, D.E. (1994) U-Pb zirconand monazite ages from the Kapuskasinguplift; age constraints on deformation withinthe Ivanhoe Lake fault zone. Canadian J. EarthSci., v. 7, 1096–1103.
Kroner, A., and Tegtmeyer, A. (1994) Gneiss–greenstone relationships in the Ancient Gneisscomplex of southwestern Swaziland, southernAfrica, and implications for early crustal evo-lution. Precamb. Res., v. 67, 109–139.
Kroner, A., Jaeckel, P., and Williams, I.S. (1994)Pb-loss patterns in zircons from a high-grademetamorphic terrain as revealed by differentdating methods: U–Pb and Pb–Pb ages forigneous and metamorphic zircons from north-ern Sri Lanka. Precamb. Res., v. 66, 151–181.
Kroner, A., Willner, A.P., Hegner, E., Jaeckel, P.,and Nemchin, A. (2001) Single zircon ages, P–T evolution and Nd isotopic systematics ofhigh-grade gneisses in southern Malawi andtheir bearing on the evolution of the Mozam-bique belt in southeastern Africa. Precamb.Res., v, 109, 257–291.
Kuester, D., and Liegeois, J.-P. (2001) Sr, Nd iso-topes and geochemistry of the Bayuda Deserthigh-grade metamorphic basement (Sudan); anearly Pan-African oceanic convergent margin,not the edge of the East Saharan ghost craton.Precamb. Res., v. 109, 1–23.
Kuhn, W.R., Walker, J.C.G., and Marshall, H.G.(1989) The effect on earth’s surface tempera-ture from variations in rotation rate, continentformation, solar luminosity, and carbon diox-ide. J. Geophys. Res., v. 94, 11,129–11,136.
Kukla, P.A., and Stanistreet, I.G. (1991) Record ofthe Damaran Khomas Hochland accretionaryprism in central Namibia; refutation of an‘‘ensialic’’ origin of a late Proterozoic orogenicbelt. Geology, v. 19, 473–476.
Laird, M.G. (1991) The late Proterozoic–middlePalaeozoic rocks of Antarctica. In The geologyof Antarctica (R.J. Tingey, Ed.). OxfordMonographs on Geology and Geophysics 17,74–119.
Lamb, S., Hoke, L., Lorcan, K., and Dewey, J.(1997) Cenozoic evolution of the centralAndes in Bolivia and northern Chile. In Oro-geny through time (J.-P. Burg and M. Ford,Eds.). Geol. Soc. London Spec. Publ. 121,237–264.
Lambiase, J.J. (1989) The framework of Africanrifting during the Phanerozoic. J. AfricanEarth Sci., v. 8, 183–190.
Lan, C.Y., Chung, S.L., Lo, C.-H., Lee, Tung-Yi,Wang, P.L., Li, H., and Dinh, V.T. (2001) Firstevidence for Archean continental crust innorthern Vietnam and its implications for crus-tal and tectonic evolution in Southeast Asia.Geology, v. 29, 219–222.
Landenberger, B., and Collins, W.J. (1996) Deriva-tion of A-type granites from a dehydrated char-nockitic lower crust; evidence from theChaelundi Complex, eastern Australia. J. Pet-rol., v. 37, 145–170.
Landing, E., Bowring, S.A., Davidek, K.L., Wes-trop, S.R., Geyer, G., and Heldmaier, W.(1998) Duration of the Early Cambrian: U–Pb ages of volcanic ashes from Avalon andGondwana. Canadian J. Earth Sci., v. 35,329–338.
256 Continents and Supercontinents
Landing, E., Myrow, P., Benus, A., and Narbonne,G.M. (1989) The Placentian Series: appearanceof the oldest skeletized fossils in southeasternNewfoundland. J. Paleontol., v. 63, 739–769.
Landoll, J.D., Foland, K.A., and Henderson,C.M.B. (1994) Nd isotopes demonstrate therole of contamination in the formation of coex-isting quartz and nepheline syenites at the AbuKhrug complex, Egypt. Contrib. Mineral. Pet-rol., v. 117, 305–329.
Larson, R.L. (1991) Latest pulse of the earth: evi-dence for a mid-Cretaceous superplume. Geol-ogy, v. 19, 547–550.
Laubscher, H. (2001) Plate interactions at thesouthern end of the Rhine Graben. Tectono-physics, v. 343, 1–19.
Lawlor, P.J., Ortega-Gutierrez, F., Cameron, K.L.,Ochoa-Camarillo, H., Lopez, R., and Samp-son, D.E. (1999) U–Pb geochronology, geo-chemistry, and provenance of the GrenvillianHuiznopala Gneiss of eastern Mexico. Pre-camb. Res., v. 94, 73–99.
LeCheminant, A.N., and Heaman, L.M. (1989)Mackenzie igneous events, Canada: MiddleProterozoic hotspot magmatism associatedwith ocean opening. Earth Planet. Sci. Lett.,v. 96, 38–48.
Ledru, P., Johan, V., Millesi, J.P., and Tegyey, M.(1994) Markers of the last stages of the Palaeo-proterozoic collision: evidence for a 2 Ga con-tinent involving circum-Atlantic provinces.Precamb. Res., v. 69, 169–191.
Lee, C.-T., Yin, Q., Rudnick, R.L., and Jacobsen,S.B. (2001) Preservation of ancient and fertilelithospheric mantle beneath the southwesternUnited States. Nature, v. 411, 69–73.
LeGrand, H.E. (1988) Drifting continents and shift-ing theories. Cambridge, Cambridge UniversityPress.
Leitch, E.C., Fergusson, C.L., Henderson, R.A., andMorand, V.J. (1994) Late Palaeozoic arc flankand fore-arc basin sequence of the New Eng-land fold belt in the Stanage Bay region, centralQueensland. Australian J. Earth Sci., v. 41,301–310.
Leite, J.A.D., Hartman, L.A., McNaughton, N.J.,and Chemale, F., Jr. (1998) SHRIMP U/Pbzircon geochronology of Neoproterozoic juve-nile and crustal-reworked terranes in southern-most Brazil. Internat. Geol. Rev., v. 40,688–705.
Lenat, J.-F., Gibert-Malengreau, B., and Galdeano,A. (2001) A new model for the evolution of thevolcanic island of Reunion (Indian Ocean).J. Geophys. Res., v. 106, 8645–8663.
Lewry, J.F., and 8 others (1994) Structure of aPaleoproterozoic continent–continent collisionzone: a LITHOPROBE seismic reflection pro-file across the Trans-Hudson orogen, Canada.Tectonophysics, v. 232, 143–160.
Li, Z.-X. (1998) Tectonic history of the major EastAsian lithospheric blocks since the mid-Proter-ozoic; a synthesis. In Mantle dynamics andplate interactions in East Asia (F.J. Martin,S.-L. Chung, C.-H. Lo, and T.-Y. Lee, Eds.).Amer. Geophys. Union Geodynamics Series, v.27, 221–243.
Li, Z.-X., Zhang, L., and Powell, C.McA. (1995)South China in Rodinia: part of the missinglink between Australia–East Antarctica andLaurentia? Geology, v. 23, 407–410.
Li, Z.-X., Zhang, L., and Powell, C.McA. (1996)Positions of the East Asian cratons in the Neo-proterozoic supercontinent Rodinia. Austra-lian J. Earth Sci., v. 43, 593–604.
Lidiak, E.G., and Larue, D.K. (Eds.) (1998) Tec-tonics and geochemistry of the northeasternCaribbean. Geol. Soc. Amer. Spec. Paper 322.
Liegeois, J.P., and Black, R. (1993) Cratons, mobilebelts, alkaline rocks and continental litho-spheric mantle; the Pan-African testimony. J.Geol. Soc. London, v. 150, 89–98.
Lindh, A., and Persson, P.-O. (1990) Proterozoicgranitoid rocks of the Baltic shield—trends ofdevelopment. In Mid-Proterozoic Laurentia–Baltica (C.F. Gower, T. Rivers, and B. Ryan,Eds.). Geol. Assoc. Canada Spec. Paper 38,23–40.
Lindsay, J.F., and Brasier, M.D. (2000) A carbonisotope reference curve for ca. 1700–1575 Ma,McArthur and Mount Isa basins, NorthernAustralia. Precamb. Res., v. 99, 271–308.
Lindsay, J.F., and Brasier, M.D. (2002) Did globaltectonics drive early biosphere evolution? Car-bon isotope record from 2.6 to 1.9 Ga carbo-nates of Western Australia basins. Precamb.Res., v. 114, 1–34.
Link, P.K., and 12 others (1993) Middle and LaterProterozoic stratified rocks of the western U.S.Cordillera, Colorado Plateau, and Basin andRange province. In Precambrian: contermi-nous U.S. (J.C. Reed, Jr., M.E. Bickford, R.S.Houston, P.K. Link, D.W. Rankin, P.K. Sims,and W.R. Van Schmus, Eds.). The Geology ofNorth America, v. C-2. Geol. Soc. Amer.,463–595.
Litherland, M., and 10 others (1989) The Proter-ozoic of eastern Bolivia and its relationship tothe Andean mobile belt. Precamb. Res., v. 43,157–174.
Liu, J., Han, J., and Fyfe, W.S. (2001) Cenozoicepisodic volcanism and continental rifting inNortheast China and possible link to JapanSea development as revealed from K–Ar geo-chronology. Tectonophysics, v. 339, 385–401.
Lopez, R., Cameron, K.L., and Jones, N.W. (2001)Evidence for Paleoproterozoic, Grenvillian,and Pan-African age Gondwanan crustbeneath northeastern Mexico. Precamb. Res.,v. 107, 195–214.
References 257

Louden, K.E., and Fan, J. (1998) Crustal structuresof Grenville, Makkovik, and southern Nainprovinces along the Lithoprobe ECSOOTTransect; regional seismic refraction and grav-ity models and their tectonic implications.Canadian J. Earth Sci., v. 35, 583–601.
Lowe, D.R. (1999) Geologic evolution of the Bar-berton Greenstone Belt and vicinity. In Geolo-gic evolution of the Barberton Greenstone Belt,South Africa (D.R. Lowe and B.R. Byerly,Eds.). Geol. Soc. Amer. Spec. Paper 329,287–312.
Lowrie, W. (1993) Fundamentals of geophysics.Cambridge, Cambridge Univ. Press.
Lu, S., Yang, C., Li, H., and Li, H. (2002) A groupof rifting events in the North China craton.Gondwana. Res., v. 5, 123–131.
Lucas, S.B., Green, A., Hajnal, Z., White, D.,Lewry, J., Ashton, K., Weber, W., and Clowes,R. (1993) Deep seismic profile across a Proter-ozoic collision zone: surprises at depth. Nat-ure, v. 363, 339–342.
Ludden, J.N., and Hynes, A. (2000) The Lithop-robe Abitibi-Grenville transect; two billionyears of crust formation and recycling in thePrecambrian Shield of Canada. Canadian J.Earth Sci., v. 37, 459–476.
Luepke, J.J., and Lyons, T.W. (2001) Pre-Rodinian(Mesoproterozoic) supercontinental riftingalong the western margin of Laurentia: geo-chemical evidence from the Belt–Purcell super-group. Precamb. Res., v. 111, 79–90.
Macdonald, R., and Upton, B.G.C. (1993) TheProterozoic Gardar rift zone, South Greenland:comparisons with the East African rift system.In Magmatic processes and plate tectonics(H.M. Prichard, T. Alabaster, N.B.W. Harris,and C.R. Neary, Eds.). Geol. Soc. LondonSpec. Publ. 76, 427–442.
Macdonald, R., Rogers, N.W., Fitton, J.G., Black,S., and Smith, M. (2001) Plume-lithosphereinteractions in the generation of the basalts ofthe Kenya Rift, East Africa. J. Petrol., v. 42,877–900.
Mallard, L.D., and Rogers, J.J.W. (1997) Relation-ship of Avalonian and Cadomian terranes toGrenville and Pan-African events. In Assemblyand dispersal of supercontinents (N. Rast andJ.J.W. Rogers, Eds.). J. Geodynamics, v. 23,197–221.
Manhica, A.D.S.T., Grantham, G.H., Armstrong,R.A., Guise, P.G., and Kruger, F.J. (2001)Polyphase deformation and metamorphism atthe Kalahari craton–Mozambique Belt bound-ary. In Continental reactivation and reworking(J.A. Miller, J.A. Holdsworth, and I.S. Buick,Eds.). Geol. Soc. London Spec. Publ. 184,303–322.
Markwick, A.J.W., and Downes, H. (2000) Lowercrustal granulite xenoliths from the Archan-
gelsk kimberlite pipes; petrological, geochem-ical and geophysical results. Lithos, v. 51,135–151.
Marsh, J.S., Ewart, A., Milner, S.C., Duncan, A.R.,and Miller, R. McG. (2001) The Entendekaigneous province; magma types and theirstratigraphic distribution with implicationsfor the evolution of the Parana–Entendekaflood basalt province. Bull. Volcanologique,v. 62, 464–486.
Martignole, J., and Friedman, R. (1998) Geochro-nological constraints on the last stages of ter-rane assembly in the central part of theGrenville Province. Precamb. Res., v. 92,145–164.
Martin, D.M. (1999) Depositional setting andimplications of Paleoproterozoic glaciomarinesedimentation in the Hamersley Province, Wes-tern Australia. Geol. Soc. Amer. Bull., v. 111,189–203.
Martin, H. (1994) Archean grey gneisses and thegenesis of the continental crust. In Archeancrustal evolution (K.C. Condie, Ed.). Amster-dam, Elsevier, 205–260.
Marvin, U.B. (1973). Continental drift: the evolu-tion of a concept. Washington, SmithsonianInst. Press.
Master, S. (1990) ‘‘Archaean,’’ ‘‘Proterozoic,’’ andthe Archaean–Proterozoic boundary; semanticminefield in a Precambrian no-man’s land.South African J. Geol., v. 93, 417–419.
Mazumder, R., Bosse, P.K., and Sarkar, S.A. (2000)A commentary on the tectono-sedimentaryrecord of pre-2.0 Ga continental growth ofIndia vis-a-vis a possible pre-Gondwana Afro-Indian supercontinent. J. African Earth Sci., v.30, 201–217.
McDermott, F., Harris, N.B.W., and Hawkes-worth, C.J. (1996) Geochemical constraintson crustal anatexis; a case study from thePan-African Damara granitoids of Namibia.Contrib. Mineral. Petrol., v. 123, 406–423.
McElhinny, M.W., and McFadden, P.L. (1999)Paleomagnetism—continents and oceans.International Geophysics Series, v. 75, SanDiego, Academic Press.
McGhee, G.R., Jr. (2001) The ‘‘multiple impactshypothesis’’ for mass extinction: a compari-son of the Late Devonian and late Eocene.Palaeogeog., Palaeoclim., Palaeontol., v. 176,47–58.
McGuire, A.V., and Stern, R.J. (1993) Granulitexenoliths from western Saudi Arabia; thelower crust of the Precambrian Arabian–Nubian shield. Contrib. Mineral. Petrol., v.114, 395–408.
McMenamin, M.A.S., and McMenamin, D.L.S.(1990) The emergence of animals: the Cam-brian breakthrough. New York, ColumbiaUniversity Press.
258 Continents and Supercontinents
McNamara, A.K., Mac Niocaill, C., van der Pluijm,B.A., and Van der Voo, R. (2001) West Afri-can proximity of the Avalon terrane in thelatest Precambrian. Geol. Soc. Amer. Bull., v.113, 1161–1170.
Mechie, J., Egorkin, A.V., Solidilov, L., Fuchs, K.,Lorenz, F., and Wenzel, F. (1997) Major fea-tures of the mantle velocity structure beneathnorthern Eurasia from long-range seismicrecordings of peaceful nuclear explosions. InUpper mantle heterogeneities from active andpassive seismology (K. Fuchs, Ed.). Dordrecht,Kluwer Academic Publ., 33–50.
Meen, J.K., Rogers, J.J.W., and Fullagar, P.D.(1992) Pb isotopic compositions of the Wes-tern Dharwar Craton, southern India: evidencefor distinct middle Archean terranes in a lateArchean craton. Geochim. Cosmochim. Acta,v. 56, 2455–2470.
Meert, J.G. (2001) Growing Gondwana and refin-ing Rodinia: a paleomagnetic perspective.Gondwana Res., v. 4, 279–288.
Meert, J.G. (2002) Paleomagnetic evidence fora Paleo–Mesoproterozoic supercontinentColumbia. Gondwana Res., v. 5, 207–215.
Meert, J.G. (2003) A synopsis of events related tothe assembly of eastern Gondwana. Tectono-physics, v. 362, 1–40.
Meert, J.G., and van der Voo, R. (1994) The Neo-proterozoic (1000–540 Ma) glacial intervals:no more snowball earth? Earth Planet. Sci.Lett., v. 123, 1–13.
Meert, J.G., Hargraves, R.B., Van der Voo, R.,Hall, C.M., and Halliday, A.N. (1994) Paleo-magnetic and 40Ar/39Ar studies of LateKibaran intrusives in Burundi, East Africa:implications for late Proterozoic superconti-nents. J. Geol., v. 102, 621–637.
Meisel, T., Walker, R.J., Irving, A.J., and Lorand,J.-P. (2001) Osmium isotope compositionsof mantle xenoliths: a global perspective. Geo-chim. Cosmochim. Acta, v. 65, 1311–1323.
Meng, Q.-R., and Zhang, G.-W. (2000) Geologicframework and tectonic evolution of the Qinl-ing orogen, central China. Tectonophysics, v.323, 183–196.
Menon, R.D., and Santosh, M. (1995) The Pan-African gemstone province of East Gondwana.Geol. Soc. India Memoir 34, 357–371.
Menzies, M., Baker, J., and Chazot, G. (2001)Cenozoic plume evolution and flood basaltsin Yemen; a key to understanding older exam-ples. In Mantle plumes; their identificationthrough time (R.E. Ernst and K.L. Buchan,Eds.). Geol. Soc. Amer. Spec. Paper 352, 23–36.
Meredith, D.J., and Egan, S.S. (2002) The geologi-cal and geodynamic evolution of the easternBlack Sea basin: insights from 2-D and 3-D
tectonic modelling. Tectonophysics, v. 350,157–179.
Mereu, R.F. (2000) The complexity of the crust andMoho under the southeastern Superior andGrenville provinces of the Canadian Shieldfrom seismic refraction-wide-angle reflectiondata. Canadian J. Earth Sci., v. 37, 439–458.
Metcalfe, I. (1996) Gondwanaland dispersion,Asian accretion and evolution of easternTethys. In Breakup of Rodinia and Gondwa-naland and assembly of Asia (Z.X. Li, I. Met-calfe, and C.McA. Powell, Eds.). Australian J.Earth Sci., v. 43, 605–623.
Meyer, M.T., Bickford, M.E., and Lewry, J.F.(1992) The Wathaman batholith: an Early Pro-terozoic continental arc in the Trans-Hudsonorogenic belt, Canada. Geol. Soc. Amer. Bull.,v. 104, 1073–1085.
Meyerhoff, A.A., and Meyerhoff, H.A. (1974) Testsof plate tectonics. In Plate tectonics: assess-ments and reassessments (C.F. Kahle, Ed.).Amer. Assoc. Petrol. Geol. Memoir 23, 43–145.
Meyers, J.B., Rosendahl, B.R., Harrison, C.G.A.,and Ding, Z.D. (1998) Deep-imaging seismicand gravity results from the offshore Camer-oon volcanic line and speculation of Africanhotlines. Tectonophysics, v. 284, 31–63.
Mezger, K., and Cosca, M.A. (1999) The thermalhistory of the Eastern Ghats belt (India) asrevealed by U–Pb and 40Ar/39Ar dating ofmetamorphic and magmatic minerals: implica-tions for the SWEAT correlation. Precamb.Res., v. 94, 251–271.
Milisenda, C.C., Liew, T.C., Hofmann, A.W., andKohler, H. (1994) Nd isotopic mapping of theSri Lanka basement: update and additionalconstraints from Sr isotopes. Precamb. Res.,v. 66, 95–110.
Millar, I.L., Willan, R.C.R., Wareham, C.D., andBoyce, A.J. (2001) The role of crustal andmantle sources in the genesis of the granitoidsof the Antarctic Peninsula and adjacent crustalblocks. J. Geol. Soc. London, v. 158, 855–867.
Miller, B.V., Samson, S.D., and D’lemos, R.S.(2001) U–Pb geochronological constraints onthe timing of plutonism, volcanism, andsedimentation, Jersey, Channel Islands, UK. J.Geol. Soc. London, v. 158, 243–252.
Miller, J.S., Santosh, M., Pressley, R.A., Clements,A.S., and Rogers, J.J.W. (1996) A Pan-Africanthermal event in southern India. In Precam-brian India within East Gondwana (M.Yoshida, M. Santosh, and M. Arima, Eds.).Special issue of J. Southeast Asian Earth Sci.,v. 14, 127–136.
Miller, R. McG. (Ed.) (1983) Evolution of theDamara Orogen of South West Africa/Nami-bia. Geol. Soc. South Africa Spec. Pub. 11.
References 259
Miyashiro, A. (1961) Evolution of metamorphicbelts. J. Petrol., v. 2, 277–311.
Miyashiro, A. (1986) Hot regions and the originof marginal basins in the western Pacific. Tec-tonophysics, v. 122, 195–216.
Modie, B.N. (2002) A glacigenic interpretation of aNeoarchean (~2.78 Ga) volcanogenic sedimen-tary sequence in the Nnywane formation, Sik-wane, Southeast Botswana. J. African EarthSci., v. 35, 163–175.
Moeller, A., Mezger, K., and Schenk, V. (1998)Crustal age domains and the evolution of thecontinental crust in the Mozambique Belt ofTanzania; combined Sm–Nd, Rb–Sr, and Pb–Pb isotopic evidence. J. Petrol., v. 39, 749–783.
Moghazi, A.-K. M. (1999) Magma source and evo-lution of late Neoproterozoic granitoids in theGabal El-Urf area, Eastern Desert, Egypt; geo-chemical and Sr–Nd constraints. Geol. Mag.,v. 136, 285–300.
Moorbath, S., Whitehouse, M.J., and Kamber, B.S.(1997) Extreme Nd-isotope heterogeneity inthe early Archaean—fact or fiction? Case his-tories from northern Canada and West Green-land. Chem. Geol., v. 135, 213–231.
Moores, E.M. (1991) Southwest U.S.–East Antarc-tica (SWEAT) connection: a hypothesis. Geol-ogy, v. 19, 425–428.
Moores, E.M., Kellogg, L.H., and Dilek, Y. (2000)Tethyan ophiolites, mantle convection, and‘‘historical contingency’’; a resolution of theophiolite conundrum. In Ophiolites and ocea-nic crust (Y. Dilek, E. Moores, D. Elthon, andA. Nicolas, Eds.). Geol. Soc. Amer. Spec. Paper349, 3–12.
Morgan, J., Warner, M., and Grieve, R. (2002)Geophysical constraints on the size and struc-ture of the Chicxulub impact crater. In Cata-strophic events and mass extinctions: impactsand beyond (C. Koeberl and K.G. MacLeod,Eds.). Geol. Soc. Amer. Spec. Paper 356, 39–46.
Morgan, W.J. (1972) Plate motions and deep man-tle convection. In Studies in earth and spacesciences (R. Shagam, R.B. Hargraves, W.J.Morgan, F.B. van Houten, C.A. Burk, H.D.Holland, and L.C. Hollister, Eds.). Geol. Soc.Amer. Memoir, 132, 7–22.
Morley, C.K. (2002) A tectonic model for the Ter-tiary evolution of strike-slip faults and riftbasins in SE Asia. Tectonophysics, v. 347,189–215.
Morley, L.W., and Larochelle, A. (1964) Paleomag-netism as a means of dating geological events.In Geochronology in Canada (F.F. Osborne,Ed.). Univ. Toronto Press, Royal. Soc. CanadaSpec. Pub. 8, 39–51.
Morogan, V., and Lindblom, S. (1995) Volatilesassociated with the alkaline–carbonatite mag-matism at Alno, Sweden: a study of fluid and
solid inclusions in minerals from the Langar-sholmen ring complex. Contrib. Mineral. Pet-rol., v. 122, 262–274.
Morozova, E.A., Morozov, I.B., Smithson, S.B.,and Solodilov, L.N. (1999) Heterogeneity ofthe uppermost mantle beneath Russian Eurasiafrom the ultra-long-range profile QUARTZ. J.Geophys. Res., v. 104, 20,329–20,348.
Moser, D.E., and Heaman, L.M. (1997) Protero-zoic zircon growth in Archean lower crustxenoliths, southern Superior Craton; a conse-quence of Matachewan Ocean opening. Con-trib. Mineral. Petrol., v. 128, 164–175.
Moser, D.E., Flowers, R.M., and Hart, R.J. (2001)Birth of the Kaapvaal tectosphere 3.08 billionyears ago. Science, v. 291, 465–468.
Moyen, J.F., Martin, H., and Jayananda, M. (2001)Multi-element geochemical modeling of crust–mantle interactions during late-Archaean crus-tal growth: the Closepet granite (South India).Precamb. Res., v. 112, 87–105.
Moyes, A.B., Groenewald, P.B., and Brown, R.W.(1993) Isotopic constraints on the age andorigin of the Brattskarvet intrusive suite, Dron-ning Maud-Land, Antarctica. Chem. Geol., v.106, 453–466.
Mueller, P.A., Heatherington, A.L., Kelly, D.M.,Wooden, J.L., and Mogk, D.W. (2002) Paleo-proterozoic crust within the Great Falls tec-tonic zone: implications for the assembly ofsouthern Laurentia. Geology, v. 30, 127–130.
Muenker, C., and Crawford, A. (2000) Cambrianarc evolution along the SE Gondwana activemargin; a synthesis from Tasmania–New Zeal-and–Australia–Antarctica correlations. Tec-tonics, v. 19, 415–432.
Muhongo, S. (1999) Anatomy of the MozambiqueBelt of eastern and southern Africa; evidencefrom Tanzania. Gondwana Res., v. 2,369–375.
Muhongo, S., Kroner, A., and Nemchin, A.A.(2001a) Single zircon evaporation andSHRIMP ages for granulite-facies rocks in theMozambique Belt of Tanzania. J. Geol., v. 109,171–189.
Muhongo, S., Kroner, A., Wallbrecher, E., Tuisku,P., Hauzenberger, C., and Sommer, H.(2001b) Cross-section through the Mozambi-que Belt of East Africa and implications forGondwana assembly. Gondwana Res., v. 4,709–710.
Muir, R.J., Ireland, T.R., Weaver, S.D., and Brad-shaw, J.D. (1996) Ion microprobe dating ofPaleozoic granitoids: Devonian magmatism inNew Zealand and correlations with Australiaand Antarctica. Chem. Geol. (Isotope Geosci.Sect.), v. 127, 191–210.
Mukherjee, A., and Das, S. (2002) Anorthosites,granulites and the supercontinent cycle. Gond-wana Res., v. 5, 147–156.
260 Continents and Supercontinents

Mukhopadhyay, D. (2001) The Archaean nucleusof Singhbhum: the present state of knowledge.Gondwana Res., v. 4, 307–318.
Munyanwiya, H., Hanson, R.E., Blenkinsop, T.G.,and Treloar, P.J. (1997) Geochemistry ofamphibolites and quartzofeldspathic gneissesin the Pan-African Zambezi Belt, NorthwestZimbabwe; evidence for bimodal magmatismin a continental rift setting. Precamb. Res., v.81, 179–196.
Myers, J.S. (1993) Precambrian history of the westAustralian craton and adjacent orogens. Ann.Rev. Earth Planet. Sci., v. 21, 453–485.
Myers, J.S., Shaw, R.D., and Tyler, I.M. (1996)Tectonic evolution of Proterozoic Australia.Tectonics, v. 15, 1431–1446.
Nagler, Th.F., Kramers, J.D., Kamber, B.S., Frei,R., and Prendergast, M.D.A. (1997) Growth ofsubcontinental lithospheric mantle beneathZimbabwe started at or before 3.8 Ga: Re–Os study on chromites. Geology, v. 25,983–986.
Nagy, R.M., Ghuma, M.A., and Rogers, J.J.W.(1976) A crustal suture and lineament inNorth Africa. Tectonophysics Letter Section,v. 31, T67–T72.
Nance, R.D., and Thompson, H.D. (Eds.) (1996)Avalonian and related peri-Gondwana terranesof the circum-North Atlantic. Geol. Soc. Amer.Spec. Paper 304.
Naqvi, S.M., Condie, K.C., and Allen, P. (1983)Geochemistry of some unusual early Archaeansediments from Dharwar craton, India. Pre-camb. Res., v. 22, 125–147.
Naqvi, S.M., Divakara Rao, V., and Narain, H.(1974) The protocontinental growth of theIndian shield and the antiquity of its rift val-leys. Precamb. Res., v. 1, 345–398.
Naqvi, S.M., Manikyamba, C., Gnaneshwar Rao,T., Subba Rao, D.V., Ram Mohan, M., andSrinivasa Sarma, D. (2002a) Geochemical andisotopic constraints of Neoarchaean fossilplume for evolution of volcanic rocks of San-dur greenstone belt, India. J. Geol. Soc. India,v. 60, 27–56.
Naqvi, S.M., Uday Raj, B., Subba Rao, D.V., Man-ikyamba, C., Nirmal Charan, S., Balaram, V.,and Srinivasa Sarma, D. (2002b) Geology andgeochemistry of arenite–quartzwacke from thelate Archaean Sandur schist belt—implicationsfor provenance and accretion processes. Pre-camb. Res., v. 114, 177–197.
Narbonne, G.M. (1998) The Ediacaran biota: aterminal Neoproterozoic experiment in theevolution of life. GSA Today, v, 8, no. 2, 1–6.
Narbonne, G.M., and Gehling, J.G. (2003) Lifeafter snowball: the oldest complex Ediacaranfossils. Geology, v. 31, 27–30.
Neal, C.R., Mahoney, J.W., Kroenke, L.W., Dun-can, R.A., and Petterson, M.G. (1997) The
Ontong Java plateau. In Large igneous pro-vinces; continental, oceanic, and planetaryflood volcanism (J.J. Mahoney and M.F. Cof-fin, Eds.). Amer. Geophys. Union GeophysicalMonograph 100, 183–216.
Nedelec, A., Ralison, B., Bouchez, J.-L., and Gre-goire, V. (2000) Structure and metamorphismof the granitic basement around Anantanarivo:a key to the Pan-African history of centralMadagascar and its Gondwana connections.Tectonics, v. 19, 997–1020.
Nelson, D.R., Myers, J.S., and Nutman, A.P.(1995) Chronology and evolution of themiddle Proterozoic Albany–Fraser orogen,Western Australia. Australian J. Earth Sci., v.42, 481–495.
Nelson, D.R., Trendall, A.F., and Altermann, W.(1999) Chronological correlations between thePilbara and Kaapvaal cratons. Precamb. Res.,v. 97, 165–189.
Nelson, K.D., and 27 others (1996) Partially moltenmiddle crust beneath southern Tibet: Synthesisof project INDEPTH results. Science, v. 274,1684–1688.
Neves, S.P., Mariano, G., Guimares, I.P., da SilvaFilho, A.F., and Melo, S.C. (2000) Intralitho-spheric differentiation and crustal growth;evidence from the Borborema Province, north-eastren Brazil. Geology, v. 28, 519–522.
Nicollet, C. (1990) Crustal evolution of the granu-lites of Madagascar. In Granulites and crustalevolution (D. Veilzeuf and P. Vidal, Eds.).NATO ASI Ser C, v. 311. Dordrecht, Kluwer,291–310.
Nikishin, A.M., and 14 others (1996) Late Precam-brian to Triassic history of the East EuropeanCraton: dynamics of sedimentary basin evolu-tion. Tectonophysics, v. 268, 23–63.
Nisbet, E.G. (1987) The young earth—an introduc-tion to Archaean geology. Boston, Allen andUnwin.
Nisbet, E.G., and Sleep, N.H. (2001). The habitatand nature of early life. Nature, v. 409,1083–1091.
Nixon, G.T., Johnston, A.D., and Martin, R.F.(Eds.) (1997) Nature and origin of primitivemagmas at subduction zones, CanadianMineral., v. 35, 253–569.
Noffke, N., Hazen, R., and Nhleko, N. (2003)Earth’s earliest microbial mats in a siliciclasticmarine environment (2.9 Ga Mozaan Group,South Africa). Geology, v. 31, 673–676.
Norton, I.O., and Sclater, J.G. (1979) A model forthe evolution of the Indian Ocean and thebreakup of Gondwanaland. J. Geophys. Res.,v. 84, 6803–6830.
Nutman, A.P., and Collerson, K.D. (1991) Veryearly crustal-accretion complexes preserved inthe North Atlantic craton. Geology, v. 19,791–794.
References 261
Nutman, A.P., Bennett, V.C., Friend, C.R.L., andNorman, M.D. (1999) Meta-igneous (non-gneissic) tonalites and quartzdiorites froman extensive ca. 3800 Ma terrain south ofthe Isua supracrustal belt, southern WestGreenland; constraints on early crust forma-tion. Contrib. Mineral. Petrol., v. 137,364–388.
Nyblade, A.A., and Pollack, H.N. (1993) A globalanalysis of heat flow from Precambrian ter-rains: implications for the thermal structureof Archean and Proterozoic lithospheres. J.Geophys. Res., v. 98, 12,207–12,218.
O’Reilly, S.Y., Griffin, W.L., Poudjom Domani,Y.H., and Morgan, P. (2001) Are lithospheresforever? Tracking changes in subcontinentallithospheric mantle through time. GSAToday, v. 11, 4–10.
Olive, V., Ellam, R.M., and Harte, B. (1997) A Re–Os isotope study of ultramafic xenoliths fromthe Matsuko kimberlite. Earth Planet. Sci.Lett., v. 150, 129–140.
Oliver, G.J.H., Johnson, S.P., Williams, I.S., andHerd, D.A. (1998) Relict 1.4 Ga oceaniccrust in the Zambezi valley, northern Zim-babwe: evidence for Mesoproterozoic super-continental fragmentation. Geology, v. 26,571–573.
Oreskes, N. (1999) The rejection of continentaldrift. New York, Oxford University Press.
Oreskes, N. (2002) Plate tectonics: an insider’shistory of the modern theory of the earth.Boulder, Colo, Westview Press.
Orrell, S.E., Bickford, M.E., and Lewry, J.F. (1999)Crustal evolution and age of thermotectonicreworking in the western hinterland of theTrans-Hudson orogen, northern Saskatche-wan. Precamb. Res., v. 95, 187–223.
Ortega-Gutierrez, F., Ruiz, J., and Centeno-Garcia,E. (1995) Oaxaquia, a Proterozoic microconti-nent accreted to North America during the latePaleozoic. Geology, v. 23, 1127–1130.
Palfy, J., and Smith, P.L. (2000) Synchrony betweenEarly Jurassic extinction, oceanic anoxic event,and the Karoo–Ferrar flood basalt volcanism.Geology, v. 28, 747–750.
Palfy, J., Smith, P.L., and Mortensen, J.K. (2002)Dating the end-Triassic and Early Jurassicmass extinctions, correlative large igneous pro-vinces, and isotopic events. In Catastrophicevents and mass extinctions: impacts andbeyond (C. Koeberl and K.G. MacLeod,Eds.). Geol. Soc. Amer. Spec. Paper 356,523–532.
Pandit, M.K., Ashwal, L.D., Tucker, R.D., Carter,L.M., Van Lente, B., Torsvik, T.H., Jamtveit,B., and Bhushan, S.K. (2001) Proterozoic acidmagmatism in the Northwest Indian shield andits significance for Rodinia construction.Gondwana Res., v. 4, 726–728.
Pandit, M.K., Sial, A.N., Sukuraman, G.B., Pimen-tel, M.M., Ramaswamy, A.K., and Ferreira,V.P. (2002). Depleted and enriched mantlesources for Paleo- and Neoproterozoic carbo-natites of southern India: Sr, Nd, C–O isotopicand geochemical constraints. Chem. Geol., v.189, 69–89.
Paquette, J.L., Nedelec, A., Moine, B., and Rako-tondrazafy, M. (1994) U–Pb, single zircon Pbevaporation, and Sm–Nd isotopic study of agranulite domain in SE Madagascar. J. Geol.,v. 102, 523–538.
Park, J.K., Buchan, K.L., and Harlan, S. (1995) Aproposed giant radiating dyke swarm fragmen-ted by the separation of Laurentia and Austra-lia based on paleomagnetism of ca. 780 Mamafic intrusions in western North America.Earth Planet. Sci. Lett., v. 132, 129–139.
Parrish, J.T. (1993) Climate of the supercontinentPangea. J. Geol., v. 101, 215–233.
Pearson, D.G., Carlson, R.W., Shirey, S.B., Boyd,F.R., and Nixon, P.H. (1995a) Stabilisation ofArchaean lithospheric mantle: a Re–Os isotopestudy of peridotite xenoliths from the Kaap-vaal craton. Earth Planet. Sci. Lett., v. 134,341–357.
Pearson, D.G., Snyder, G.A., Shirey, S.B., Taylor,L.A., Carlson, R.W., and Sobolev, N.V.(1995b) Archaean Re–Os age for Siberian eclo-gites and constraints on Archaean tectonics.Nature, v. 374, 711–713.
Pedrosa-Soares, A.C., Noce, C.M., Wiedemann,C.M., and Pinto, C.P. (2001) The Aracuai–West-Congo Orogen in Brazil: an overview ofa confined orogen formed during Gondwana-land assembly. Precamb. Res., v. 110,307–323.
Pelechaty, S.M. (1996) Stratigraphic evidence forthe Siberia–Laurentia connection and EarlyCambrian rifting. Geology, v. 24, 719–722.
Peresson, H., and Decker, K. (1997) Far-field effectsof late Miocene subduction in the Eastern Car-pathians; E–W compression and inversion ofstructures in the Alpine-Carpathian–Panno-nian region. Tectonics, v.16, 38–56.
Peters, K.E., and Moldowan, J.M. (1993) The bio-marker guides: interpreting molecular fossils inpetroleum and ancient sediments. EnglewoodCliffs, N.J., Prentice Hall.
Petford, N., Atherton, M.P., and Halliday, A.N.(1996) Rapid magma production rates, under-plating and remelting in the Andes: isotopicevidence from northern-central Peru (98–118S). J. South Amer. Earth Sci., v. 9, 69–78.
Petit, J.R., and 18 others (1999) Climate and atmo-spheric history of the past 420,000 years fromthe Vostok ice core. Nature, v. 399, 429–436.
Peucat, J.J., Bouhallier, H., Fanning, C.M., andJayananda, M. (1995) Age of the Holenarasi-pur greenstone belt, relationships with sur-
262 Continents and Supercontinents

rounding gneisses (Karnataka, South India). J.Geol., v. 103, 701–710.
Peucat, J.J., Mahabaleswar, B., and Jayananda, M.(1993) Age of younger tonalitic magmatismand granulitic metamorphism in the SouthIndian transition zone (Krishnagiri area); com-parison with older Peninsular gneisses from theGorur–Hassan area. J. Metam. Petrol., v. 11,879–888.
Peucat, J.J., Meno, R.P., Monnier, O., and Fanning,C.M. (1999) The Terre Adelie basement in theEast-Antarctica shield: geological and isotopicevidence for a major 1.7 Ga thermal event:comparison with the Gawler craton in SouthAustralia. Precamb. Res., v. 94, 205–224.
Pichamuthu, C.S. (1960) Charnockite in themaking. Nature, v. 188, 135–136.
Pilger, R.H., Jr. (1978) A closed Gulf of Mexico,pre-Atlantic ocean plate reconstruction and theearly rift history of the Gulf and North Atlan-tic. Trans. Gulf Coast Assoc. Geol. Soc., v. 28,385–393.
Pimentel, M.M., Dardenne, M.A., Fuck, R.A.,Viana, M.G., Junges, S.L., Fischel, D.P., Seer,H.J., and Dantas, E.L. (2001) Nd isotopes andthe provenance of detrital sediments of theNeoproterozoic Brasilia Belt, central Brazil.J. South Amer. Earth Sci., v. 14, 571–585.
Pimentel, M.M., Fuck, R.A., and Souza de Alvar-enga, C.J. (1996) Post-Brasiliano (Pan-African)high-K granitic magmatism in central Brazil;the role of late Precambrian–early Paleozoicextension. Precamb. Res., v. 80, 217–238.
Pimentel, M.M., Whitehouse, M.J., Viana, M. dasG., Fuck, R.A., and Machado, N. (1997) TheMara Rosa arc in the Tocantins Province;further evidence for Neoproterozoic crustalaccretion in central Brazil. Precamb. Res., v.81, 299–310.
Pinna, P., Jourde, G., Calvez, J.Y., Mroz, J.P., andMarques, J.M. (1993) The Mozambique Beltin northern Mozambique; Neoproterozoic(1100–850 Ma) crustal growth and tectogen-esis, and superimposed PanAfrican (800–550Ma) tectonism. Precamb. Res., v. 62, 1–59.
Piper, J.D.A. (1982) The Precambrian Palaeomag-netic record: the case for the Proterozoic super-continent. Earth Planet. Sci. Lett., v. 59, 61–89.
Piper, J.D.A. (2001) The Neoproterozoic supercon-tinent: Rodinia or Palaeopangaea? Earth Pla-net. Sci. Lett., v. 176, 131–146.
Piper, J.D.A. (2003) Consolidation of continentalcrust in late Archean–early Proterozoic times.Gondwana Res., v. 6, 435–448.
Polat, A., and Kerrich, R. (2001) Geodynamic pro-cesses, continental growth and mantle evolu-tion recorded in late Archean greenstone beltsof the southern Superior Province, Canada.Precamb. Res., v. 112, 5–25.
Porada, H., and Berhorst, V. (2000) Towards a newunderstanding of the Neoproterozoic–earlyPaleozoic Lufilian and northern Zambezibelts in Zambia and the Democratic Republicof Congo. J. African Earth Sci., v. 30,727–771.
Poudjom Domani, Y.H., O’Reilly, S.Y., Griffin,W.L., and Morgan, P. (2001) The densitystructure of subcontinental lithospherethrough time. Earth Planet Sci. Lett., v. 184,605–621.
Poujol, M., Anhaeusser, C.R., and Armstrong, R.A.(2002) Episodic granite emplacement in theAmalia–Kraaipan terrane, South Africa: con-firmation from single zircon U–Pb geochronol-ogy. J. African Earth Sci., v. 35, 147–161.
Powell, C.McA., and Pisarevsky, S.A. (2002) LateNeoprotrozoic assembly of East Gondwana.Geology, v. 30, 3–6.
Powell, C.McA., Li, Z.-X., McElhinny, M.W.,Meert, J.G., and Park, J.K. (1993) Paleomag-netic constraints on timing of the Neoproter-ozoic breakup of Rodinia and the Cambrianformation of Gondwana. Geology, v. 21,889–892.
Prave, A.R. (1996) Tale of three cratons; tectonos-tratigraphic anatomy of the Damara Orogenin northwestern Namibia and the assembly ofGondwana. Geology, v. 24, 1115–1118.
Preiss, W.V. (2000) The Adelaide geosyncline ofSouth Australia and its significance in Neopro-terozoic continental reconstruction. Precamb.Res., v. 100, 21–63.
Prodehl, C., and Aichroth, B. (1992) Seismic inves-tigations along the European Geotraverse andits surroundings in central Europe. TerraNova, v. 4, 14–24.
Puchkov, V.N. (1997) Structure and geodynamicsof the Uralian orogen. In Orogeny throughtime (J.-P. Burg and M. Ford, Eds.). Geol.Soc. London Spec. Pub. 121, 201–236.
Puchtel, I.S., Hofmann, A.W., Mezger, K., Jochum,K.P., Shchipansky, A.A., and Samsonov, A.V.(1998) Oceanic plateau model for continentalcrustal growth in the Archaean: a case studyfrom the Kostomuksha greenstone belt, NWBaltic shield. Earth Planet. Sci. Lett., v. 155,57–74.
Puura, V., and Floden, T. (1999) Rapakivi–granite–anorthosite magmatism: a way of thinning andstabilization of the Svecofennian crust, BalticSea basin. In Tectonics of continental interiors(S. Marshak, B.A. van der Pluijm, and M.Hamburger, Eds.). Tectonophysics, v. 305,75–92.
Qiu, Y.M.M., and Gao, S. (2000) First evidence of>3.2 Ga continental crust in the Yangtze cra-ton of South China and its implications forArchean crustal evolution and Phanerozoic tec-tonics. Geology, v. 28, 11–14.
References 263

Rankin, D.W., and 11 others (1993) Proterozoicrocks east and southeast of the Grenvillefront. In Precambrian: conterminous U.S.(J.C. Reed, Jr., M.E. Bickford, R.S. Houston,P.K. Link, D.W. Rankin, P.K. Sims, and W.R.Van Schmus, Eds.). The geology of NorthAmerica, v. C-2, Geol. Soc. Amer., 335–461.
Rast, N., and Skehan, J.W. (1983) The evolution ofthe Avalon plate. Tectonophysics, v. 100,257–286.
Raymo, M.E. (1994) The Himalayas, organic car-bon burial, and climate in the Miocene. Paleo-ceanography, v. 3, 399–404.
Rayner, R.J. (1995) The paleoclimate of the Karoo:evidence from plant fossils. Palaeogeog.,Palaeoclimat., Palaeoecol., v. 119, 385–394.
Reichow, M.K., Saunders, A.D., White, R.V., Prin-gle, M.A., Al’Mukhamedov, A.I., Medvedev,A. I., and Kirda, N.P. (2002) 40Ar/39Ar datesfrom the West Siberian basin: Siberian floodbasalt province doubled. Science, v. 296,1846–1849.
Ren, J., Tamaki, K., Li, S., and Zhang, J. (2002)Late Mesozoic and Cenozoic rifting and itsdynamic setting in eastern China and adjacentseas. Tectonophysics, v. 344, 175–205.
Restrepo-Pace, P.A., Ruiz, J., Gehrels, G.E., andCosca, M. (1997) Geochronology and Ndisotopic data of Grenville-age rocks in theColombian Andes; new constraints for lateProterozoic–early Paleozoic paleocontinentalreconstructions of the Americas. Earth Planet.Sci. Lett., v. 150, 427–441.
Retallack, G.J., and Alonso-Zarza, A.M. (1998)Middle Triassic paleosols and paleoclimate ofAntarctica. J. Sedimentary Res., v. 68,169–194.
Rickers, K., Mezger, K., and Raith, M.M. (2001)Evolution of the continental crust in the Pro-terozoic Eastern Ghats belt, India and newconstraints for Rodinia reconstruction: impli-cations from Sm–Nd, Rb–Sr and Pb–Pb iso-topes. Precamb. Res., v. 112, 183–210.
Ritsema, J., and van Heijst, H.-J. (2000) New seis-mic model of the upper mantle beneath Africa.Geology, v. 28, 63–66.
Rivers, T. (1997) Lithotectonic elements of theGrenville Province: review and tectonic impli-cations. Precamb. Res., v. 86, 117–154.
Robertson, A.H.F., and Comas, M.C. (1998) Colli-sion-related processes in the Mediterraneanregion; introduction. In Collision-related pro-cesses in the Mediterranean region (A.H.F.Robertson and M.C. Comas, Eds.). Tectono-physics, v. 298, 1–4.
Rogers, J.J.W. (1986) The Dharwar craton and theassembly of peninsular India. J. Geol., v. 94,129–144.
Rogers, J.J.W. (1988) The Arsikere Granite ofsouthern India: magmatism and metamorph-
ism in a previously depleted crust. Chem.Geol., v. 67, 155–163.
Rogers, J.J.W. (1993a) A history of the Earth. Cam-bridge, Cambridge Univ. Press.
Rogers, J.J.W. (1993b) India and Ur. J. Geol. Soc.India, v. 42, 217–222.
Rogers, J.J.W. (1996) A history of continents in thepast three billion years. J. Geol., v. 104, 91–107.
Rogers, J.J.W., and Greenberg, J.K. (1990) Late-orogenic, post-orogenic, and anorogenic gran-ites: distinction by major-element and trace-element chemistry, and possible origins. J.Geol., v. 98, 291–309.
Rogers, J.J.W., and Mauldin, L.C. (1994) A reviewof the terranes of southern India. In Volcanism(K.V. Subbarao, Ed.). New Delhi, Wiley East-ern Ltd., 157–171.
Rogers, J.J.W., and Ragland, P.C. (1980) Traceelements in continental-margin magmatism—Part I. Trace elements in the Clarno Formationof central Oregon and the nature of the con-tinental margin on which eruption occurred.Geol. Soc. Amer. Bull., v. 91, Part I, pp.196–198; Part II, Card 3, pp. 1217–1292.
Rogers, J.J.W., and Santosh, M. (2002) Configura-tion of Columbia, a Mesoproterozoic super-continent. Gondwana Res., v. 5, 5–22.
Rogers, J.J.W., Callahan, E.J., Dennen, K.O., Full-agar, P.D., Stroh, P.T., and Wood, L.F. (1986)Chemical evolution of Peninsular Gneiss in theWestern Dharwar craton, southern India. J.Geol., v. 94, 233–246.
Rollinson, H.R., and Whitehouse, M. (Eds.) (2001)Archaean crustal evolution. Precamb. Res., v.112, 163 pp.
Rosen, O.M., Condie, K.C., Natapov, L.M., andNozhkin, A.D. (1994) Archean and early Pro-terozoic evolution of the Siberian craton: apreliminary assessment. In Archean crustalevolution (K.C. Condie, Ed.). Developmentsin Precamb. Geol. 11, Amsterdam, Elsevier,411–459.
Rosing, M.T., Rose, N.M., Bridgwater, D., andThomsen, H. (1996) Earliest part of earth’sstratigraphic record; a reappraisal of the >3.7Ga Isua (Greenland) supracrustal sequence.Geology, v. 24, 43–46.
Ross, G.M. (1991) Precambrian basement in theCanadian cordillera: an introduction. Cana-dian J. Earth Sci., v. 28, 1133–1139.
Ross, G.M., Parrish, R.R., and Winston, D. (1992)Provenance and U–Pb geochronology of theMesoproterozoic Belt Supergroup (northwes-tern United States): implications for age ofdeposition and pre-Panthalassa plate recon-structions. Earth Planet. Sci. Lett., v. 113,57–76.
Rougvie, J.R., Carlson, W.D., Copeland, P., andConnelly, J.N. (1999) Late thermal evolution
264 Continents and Supercontinents
of Proterozoic rocks in the northeastern LlanoUplift, central Texas. Precamb. Res., v. 94,49–72.
Roy, A.B. (2001) Neoproterozoic crustal evolutionof northwestern Indian shield: implications onbreakup and assembly of supercontinents.Gondwana Res., v. 4, 289–306.
Rudkevich, M.Ya., and Maksimov, Ye.M. (1988)Cyclicity in the geologic development of theWest Siberian platform in the cratonal stage.Petroleum. Geol., v. 24, 265–269.
Rudnick, R.L. (1990) Nd and Sr isotopic composi-tions of lower-crustal xenoliths from NorthQueensland, Australia: implications for Ndmodel ages and crustal growth processes.Chem. Geol., v. 83, 195–208.
Rudnick, R.L., and Taylor, S.R. (1991) Petrologyand geochemistry of lower crustal xenolithsfrom northern Queensland and inferences onlower crustal composition. In The Australianlithosphere (B. Drummond, Ed.). Geol. Soc.Australia Spec. Pub. 17, 189–208.
Rudnick, R.L., McDonough, W.F., and O’Connell,R.J. (1998) Thermal structure, thickness andcomposition of continental lithosphere. Chem.Geol., v. 145, 395–411.
Ruiz, J., Tosdal, R.M., Restrepo, P.A., and Murillo-Muneton, G. (1999) Pb isotope evidence forColombia–southern Mexico connections in theProterozoic. In Laurentia–Gondwanaconnections before Pangea (V.A. Ramos andJ.D. Keppie, Eds.). Geol. Soc. Amer. Spec.Paper 336, 183–197.
Rumvegeri, B.T. (1991) Tectonic significance ofKibaran structures in Central and EasternAfrica. J. African Earth Sci., v. 13, 267–276.
Runcorn, S.K. (1956) Palaeomagnetic comparisonsbetween Europe and North America. Geol.Assoc. Canada Proc., v. 8, 77–85.
Runcorn, S.K. (1962) Palaeomagnetic evidence forcontinental drift and its geophysical cause. InContinental drift. Academic Press Internat.Geophys. Series 3, Chapter 1, 1–40.
Sacchi, R., Cadoppi, P., and Costa, M. (2000) Pan-African reactivation of the Lurio segment ofthe Kibaran Belt system; a reappraisal fromrecent age determinations in northern Mozam-bique. J. African Earth Sci., v. 30, 629–639.
Sadowski, G.R., and Bettencourt, J.S. (1996) Meso-proterozoic tectonic correlations between east-ern Laurentia and the western border of theAmazon craton. Precamb. Res., v. 76,213–227.
Sanchez-Zavala, J.L., Centeno-Garcia, E., andOrtega-Gutierrez, F. (1999) Review of Paleo-zoic stratigraphy of Mexico and its role in theGondwana–Laurentia connections. In Lauren-tia–Gondwana connections before Pangea(V.A. Ramos and J.D. Keppie, Eds). Geol.Soc. Amer. Spec. Paper 336, 211–226.
Sandberg, C.A., Morrow, J.R., and Ziegler, W.(2002) Late Devonian sea-level changes, cata-strophic events, and mass extinctions. In Cat-astrophic events and mass extinctions: impactsand beyond (C. Koeberl and K.G. MacLeod,Eds.). Geol. Soc. Amer. Spec. Paper 356, pp.473–487.
Santos, J.O.S., Hartmann, L.A., Gaudette, H.E.,Groves, D.I., McNaughton, N.J., and Fletcher,I.R. (2000) A new understanding of the pro-vinces of the Amazon craton based on integra-tion of field mapping and U–Pb and Sm–Ndgeochronology. Gondwana Res., v. 3,453–488.
Santosh, M. (2000) Palaeoproterozoic accretion,Pan-African reworking and fluid-driven pro-cesses in the continental deep crust of southernIndia. In Deep crustal studies on granulite ter-ranes from southern India (C. Srikantappa,Ed.). Indian Mineralogist, v. 34, 22–28.
Santosh, M., and Drury, S.A. (1988) Alkali graniteswith Pan-African affinities from Kerala, S.India, J. Geology, v. 96, 616–626.
Santosh, M., and Tsunogae, T. (2003) Extremelyhigh density pure CO2 fluid inclusions in agarnet granulite from southern India. J.Geol., v. 111, 1–16.
Santosh, M., and Wada, H. (1993a) A carbon iso-tope study of graphites from the Kerala Khon-dalite Belt: evidence for CO2 infiltration ingranulites. J. Geol., v. 101, 643–651.
Santosh, M., and Wada, H. (1993b) Microscaleisotopic zonation in graphite crystals: evidencefor channeled CO2 influx in granulites. EarthPlanet. Sci. Lett., v. 119, 19–26.
Santosh, M., and Yoshida, M. (2001) Pan-Africanextensional collapse along the Gondwanasuture. Gondwana Res., v. 4, 188–191.
Santosh, M., and Yoshikura, S. (2001) Charnockitemagmatism and charnockitic metasomatism inEast Gondwana and Asia. Gondwana Res., v.4, 768–771.
Santosh, M., Harris, N.B.W., Jackson, D.H., andMattey, D.P. (1990) Dehydration and incipientcharnockite formation: a phase equilibria andfluid inclusion study from South India. J. Geol.,v. 98, 915–926.
Santosh, M., Suzuki, K., and Masuda, A. (1994)Re–Os dating of molybdenites from southernIndia; implication for Pan-African metallo-geny. J. Geol. Soc. India, v. 43, 585–590.
Santosh, M., Yokoyama, K., Biju-Sekhar, S., andRogers, J.J.W. (2003) Multiple tectonothermalevents in the granulite blocks of southern Indiarevealed from EPMA dating: implications onthe history of supercontinents. GondwanaRes., v. 6, 29–64.
Santosh, M., Yoshida, M., and Yoshikura, S.(2001) Fluids in the Gondwana crust. Gond-wana Res., v. 4, 766–768.
References 265

Satish-Kumar, M., and Wada, H. (1997) Meteoricwater infiltration in Skallen marbles, East Ant-arctica; oxygen isotope evidence, In Proceed-ings of the 16th NIPR Symposium on AntarcticGeosciences (M. Funaki, Ed.), Tokyo, v. 10,111–119. Tokyo, National Institute for PolarResearch.
Satish-Kumar, M., Wada, H., and Santosh, M.(2002) Constraints on the application of car-bon isotope thermometry in high- and ultra-high-temperature metamorphic terranes. J.Metam. Geol., v. 20, 335–350.
Sato, K., and Siga, O., Jr. (2002) Rapid growth ofcontinental crust between 2.2 to 1.8 Ga in theSouth American platform: integrated Austra-lian, European, North American, and SW USAcrustal evolution study. Gondwana Res., v. 5,165–173.
Schandelmeier, H., Richter, A.E., and Franz, G.(1983) Outline of the geology of magmaticand metamorphic units between Gebel Uwei-nat and Bir Safsaf (SW Egypt/NW Sudan). J.African Earth Sci., v. 1, 275–283.
Schandelmeier, H., Wipfler, E., Kuster, D., Sultan,M., Becker, R., Stern, R.J., and Abedelsalam,M.G. (1994) Atmur–Delgo suture: a Neopro-terozoic oceanic basin extending into the inter-ior of northeast Africa. Geology, v. 22,563–566.
Schidlowski, M. (2001) Carbon isotopes as biogeo-chemical recorders of life over 3.8 Ga of earthhistory: evolution of a concept. Precamb. Res.,v. 106, 117–134.
Schilling, J.G., Zajac, M., Evans, R., Johnston, T.,White, W., Devine, J.D., and Kingsley, R.(1983) Petrologic and geochemical variationsalong the mid-Atlantic ridge from 298N to798N. Amer. J. Sci., v. 283, 510–586.
Schmid, S.M., and Kissling, E. (2000) The arc of thewestern Alps in the light of geophysical data ondeep crustal structure. Tectonics, v. 19, 62–85.
Schmitz, M.D., and Bowring, S.A. (2001) The sig-nificance of U–Pb zircon dates in lower crustalxenoliths from the southwestern margin of theKaapvaal Craton, southern Africa. Chem.Geol., v. 172, 59–76.
Schopf, J.W., Krudytsev, A.B., Agrestl, D.E., Wdo-wiak, T.J., and Czaja, A.D. (2002) LaserRaman imagery of earth’s earliest fossils. Nat-ure, v. 416, 73–76.
Schumacher, M.E. (2002) Upper Rhine Graben;role of preexisting structures during rift evolu-tion. Tectonics, v. 21, 1–17.
Schwartz, M.O., Rajah, S.S., Askury, A.K., Puttha-piban, P., and Djaswadi, S. (1995) The South-east Asian tin belt. Earth-Sci. Rev., v. 38,95–293.
Scotese, C.R., and McKerrow, W.S. (1990) Revisedworld maps and introduction. In Palaeozoicgeography and biogeography (W.S. McKerrow
and C.R. Scotese, Eds.). Geol. Soc. LondonMemoir 12, 1–21.
Scrimgeour, I., and Close, D. (1999) Regional high-pressure metamorphism during intracratonicdeformation; the Petermann orogeny, centralAustralia. J. Metam. Geol., v. 17, 557–572.
Scrimgeour, I., and Raith, J.G. (2001) High-gradereworking of Proterozoic granulites duringOrdovician intraplate transpression, easternArunta inlier, central Australia. In Continen-tal reactivation and reworking (J.A. Miller,R.E. Holdsworth, I.S. Buick, and M. Hand,Eds.). Geol. Soc. London Spec. Pub. 184,261–287.
Sears, J.W., and Price, R.A. (2000) New look at theSiberian connection: no SWEAT. Geology, v.28, 423–426.
Sears, J.W., and Price, R.A. (2002) The hypotheti-cal Mesoproterozoic supercontinent Columbia:implications of the Siberian–west Laurentianconnection. Gondwana Res., v. 5, 35–39.
Sears, J.W., Chamberlain, K.R., and Buckley, S.N.(1998) Structural and U–Pb geochronologicalevidence for 1.47 Ga rifting in the Belt basin,western Montana. Canadian J. Earth Sci., v.35, 467–475.
Seilacher, A. (1992) Vendobionta and Psammocor-allia: lost constructions of Precambrian evolu-tion. J. Geol. Soc. London, v. 149, 607–613.
Seilacher, A., Bose, P.K., and Pflueger, F. (1998)Triploblastic animals more than 1 billion yearsago: trace fossil evidence from India. Science,v. 281, 80–83.
Selverstone, J., Pun, A., and Condie, K.C. (1999)Xenolithic evidence for Proterozoic crustalevolution beneath the Colorado plateau.Geol. Soc. Amer. Bull., v. 111, 590–606.
Sengor, A.M.C. (1985). East Asian tectonic collage.Nature, v. 318, 16–17.
Sengor, A.M.C. (1987) Tectonics of the Tethysides:orogenic collage development in a collisionalsetting. Ann. Rev. Earth Planet. Sci., v. 15,213–244.
Sengor, A.M.C., Altiner, D., Cin, A., Ustaomer, T.,and Hsu, K.J. (1988) Origin and assembly ofthe Tethyside orogenic collage at the expenseof Gondwanaland. In Gondwana and Tethys(A. Hallam, Ed.). Geol. Soc. London Spec. Pub.37, 119–181.
Sengor, A.M.C., Natal’in, B.A., and Burtman, V.S.(1993). Evolution of the Altaid tectonic collageand Palaeozoic crustal growth in Eurasia. Nat-ure, v. 364, 299–307.
Shackleton, R.M. (1996) The final collision zonebetween East and West Gondwana: where is it?J. African Earth Sci., v. 23, 271–287.
Shaw, C.A., Arima, M., Kagami, H., Fanning,C.M., Shiraishi, K., and Motoyoshi, Y.(1997) Proterozoic events in the EasternGhats granulite belt, India: evidence from
266 Continents and Supercontinents

Rb–Sr, Sm–Nd systematics, and SHRIMPdating. J. Geol., v. 105, 645–656.
Shaw, D.M., Dickin, A.P., Li, H., McNutt, R.H.,Schwarcz, H.P., and Truscott, M.G. (1994)Crustal geochemistry in the Wawa–Foleyetregion, Ontario. Canadian J. Earth Sci., v.31, 1104–1121.
Shiraishi, K., Ellis, D.J., Hiroi, Y., Fanning, C.M.,Motoyoshi, Y., and Nakai, Y. (1994) Cam-brian orogenic belt in East Antarctica and SriLanka: implications for Gondwana assembly.J. Geol., v. 102, 47–65.
Shore, M., and Fowler, A.D. (1999) The origin ofspiniflex texture in komatiites. Nature, v. 397,691–694.
Sidder, G.B., Garcia, A.E., and Stoeser, J.W. (Eds.)(1995) Geology and mineral deposits of theVenezuelan Guyana Shield. U.S. Geol. Surv.Bull. 2124.
Simons, F.J., Zielhuis, A., and van der Hilst, R.D.(1999) The deep structure of the Australiancontinent from surface wave tomography.Lithos, v. 48, 17–43.
Sleep, N.H., and Windley, B.F. (1982) Archeanplate tectonics: constraints and inferences. J.Geol., v. 90, 363–379.
Smith, A.L., Schellekens, J.H., and Muriel Diaz,A.-L. (1998) Batholiths as markers of tectonicchange in the northeastern Caribbean. In Tec-tonics and geochemistry of the NortheasternCaribbean (E.G. Lidiak and D.K. Larue,Eds.). Geol. Soc. Amer. Spec. Paper 322,99–122.
Smith, D. (2000) Insights into the evolution of theuppermost continental mantle from xenolithlocalities on and near the Colorado plateauand regional comparisons. J. Geophys. Res.,v. 105, 16,769–16,781.
Smith, D.R., Barnes, C., Shannon, W., Roback, R.,and James, E. (1997) Petrogenesis of Mid-Pro-terozoic granitic magmas; examples from cen-tral and West Texas. Precamb. Res., v. 85,53–79.
Smith, I.E.M., Worthington, T.J., Price, R.C., andGamble, J.A. (1997) Primitive magmas in arc-type volcanic associations: examples from thesouthwest Pacific. In Nature and origin of pri-mitive magmas at subduction zones (G.T.Nixon, A.D. Johnston, and R.F. Martin,Eds.). Canadian Mineral., v. 35, 257–273.
Stampfli, G.M. (2000) Tectonics and magmatism inTurkey and the surrounding area. In Tethyanoceans (E. Bozkurt, J.A. Winchester, andJ.D.A. Piper, Eds.). Geol. Soc. London Spec.Pub. 173, 1–23.
Stanistreet, I.G., Kukla, P.A., and Henry, G. (1991)Sedimentary basinal responses to a late Pre-cambrian Wilson cycle; the Damara Orogenand Nama Foreland, Namibia. J. AfricanEarth Sci., v. 13, 141–156.
Starmer, I.C. (1993) The Sveconorwegian Orogenyin Southern Norway, relative to deep crustalstructures and events in the North AtlanticProterozoic supercontinent. Norsk GeologiskTidsskrift, v. 73, 109–132.
Starmer, I.C. (1996) Accretion, rifting, rotation andcollision in the North Atlantic supercontinent,1700–950 Ma. In Precambrian crustal evolu-tion in the North Atlantic region (T.S. Brewer,Ed.) Geol. Soc. London Spec. Pub. 112,219–248.
Stein, H.J., and Crock, J.G. (1990) Late Cretac-eous–Tertiary magmatism in the ColoradoMineral Belt; Rare earth element and samar-ium–neodymium isotopic studies. In The nat-ure and origin of Cordilleran magmatism (L.A.Anderson, Ed.). Geol. Soc. Amer. Memoir 174,195–223.
Steinmann, G. (1927) Die ophiolitischen zone inden Mediterranean Kettengebirgen. CongresGeologique International, XIV Session,Madrid, Spain, 637–667.
Stern, R.A., and Hanson, G.N. (1991) Archeanhigh-Mg granodiorite: a derivative of lightrare earth element-enriched monzodiorite ofmantle origin. J. Petrol., v. 32, 201–238.
Stern, R.J. (1994) Arc assembly and continentalcollision in the Neoproterozoic East Africanorogen: implications for the consolidation ofGondwanaland. Ann. Rev. Earth Planet. Sci.,v. 22, 319–351.
Stern, R.J. (2002) Crustal evolution in the EastAfrican orogen: a neodymium isotopic per-spective. J. African Earth Sci., v. 34, 109–117.
Stewart, A.J. (1979) A barred-basin marine evapor-ite in the Upper Proterozoic of the AmadeusBasin, central Australia. Sedimentology, v. 26,33–62.
Stewart, J.H. (1978) Basin–range structure inwestern North America: a review. In Ceno-zoic tectonics and regional geophysics of thewestern cordillera (R.B. Smith and G.P.Eaton, Eds.). Geol. Soc. Amer. Memoir152, 1–32.
Stewart, J.H., Blodgett, R.B., Boucot, A.J., Carter,J.L., and Lopez, R. (1999) Exotic Paleozoicstrata of Gondwanan provenance near CiudadVictoria, Tamaulipas, Mexico. In Laurentia–Gondwana connections before Pangea (V.A.Ramos and J.D. Keppie, Eds.). Geol. Soc.Amer. Spec. Paper 336, 227–252.
Storey, B.C., and Kyle, P.R. (1997) An activemantle mechanism for Gondwana breakup.South African J. Geol., v. 100, 283–290.
Storey, B.C., Leat, P.T., and Ferris, J.K. (2001) Thelocation of mantle plume centers during theinitial stages of Gondwana breakup. In Mantleplumes; their identification through time (R.E.Ernst and K. Buchan, Eds.). Geol. Soc. Amer.Spec. Paper 352, 71–80.
References 267
Storey, B.C., Macdonald, D.L.M., Dalziel, I.W.D.,Isbell, J.L., and Millar, I.L. (1996) Early Paleo-zoic sedimentation, magmatism, and deforma-tion in the Pensacola Mountains, Antarctica:the significance of the Ross orogeny. Geol. Soc.Amer. Bull., v. 108, 685–707.
Stott, C.M. (1997) The Superior Province, Canada.In Greenstone belts (M. J. De Wit and L.D.Ashwal, Eds.). Oxford Monographs on Geol-ogy and Geophysics 35, 480–507.
Streepey, M.M., van der Pluijm, B.A., Essene, E.J.,Hall, C.M., and Macloughlin, J.F. (2000) LateProterozoic (ca. 930 Ma) extension in easternLaurentia. Geol. Soc. Amer. Bull., v. 112,1522–1530.
Strieder, A.J., and Freitas Suita, M.T. de (1999)Neoproterozoic geotectonic evolution ofTocantins structural province, central Brazil.J. Geodynamics, v. 28, 267–289.
Stump, E. (1995) The Ross orogen of the Transan-tarctic Mountains. Cambridge, CambridgeUniv. Press.
Suayah, I.B., and Rogers, J.J.W. (1991) Petrology ofthe lower Tertiary Clarno Formation in north-central Oregon: the importance of magma mix-ing. J. Geophys. Res., v. 96, 13,357–13,371.
Suess, E. (1904–1909) English editions of multivo-lume work titled ‘‘Das Antlitz der Erde.’’Oxford, Clarendon Press.
Sun, Y., Chen, Z., Lio, Y., Wang, T., and Zhang, Z.(2000) Junction and evolution of the Qinling,Qilian and Kunlun orogenic belts. Acta Geolo-gica Sinica (English edition), v. 74, 223–228.
Sykes, L.R. (1967) Mechanism of earthquakes andnature of faulting on mid-oceanic ridges. J.Geophys. Res., v. 72, 2131–2153.
Tait, J., Schatz, M., Bachtadse, V., and Soffel, H.(2000). Palaeomagnetism and Palaeozoicpalaeogeography of Gondwana and Europeanterranes. In Orogenic processes: quantificationand modeling in the Variscan belt (W. Franke,V. Haak, O. Oncken, and D. Tanner, Eds.).Geol. Soc. London Spec. Pub. 179, 21–34.
Tarduno, J.A., and Cottrell, R.D. (1997) Paleomag-netic evidence for motion of the Hawaiian hot-spot during formation of the Emperorseamounts. Earth Planet. Sci. Lett., v. 153,171–180.
Tassinari, C.C.G., and Macambira, M.J.B. (1999)Geochronological provinces of the Amazoniancraton. Episodes, v. 22, 174–182.
Taylor, R.N., Thirlwall, M.F., Murton, B.J., Hilton,D.R., and Gee, M.A.M. (1997) Isotopic con-straints on the influence of the Icelandic mantleplume. Earth Planet. Sci. Lett., v. 148, E1–E8.
Taylor, S.R., and McLennan, S.M. (1985) The con-tinental crust: its composition and evolution.Oxford, Blackwell Scientific.
Teklay, M., Haile, T., Kroner, A., Asmerom, Y.,and Watson, J. (2001) A back-arc palaeotec-
tonic setting for the Neoproterozoic magmaticrocks of western Eritea: inferences from geo-chemistry, geochronology and isotope geology(abstract). Gondwana Res., v. 4, 800.
ten Brink, U.S., Hackney, R.I., Bannister, S., Stern,T.A., and Makovsky, Y. (1997) Uplift of theTransantarctic Mountains and the bedrockbeneath the East Antarctic ice sheet. J. Geo-phys. Res., v. 102, 27,603–27,621.
Theriault, R.J., St-Onge, M.R., and Scott, D.J.(2001) Nd isotopic and geochemical signatureof the Paleoproterozoic Trans-Hudson orogen,southern Baffin Island, Canada: implicationsfor the evolution of eastern Laurentia. Pre-camb. Res., v. 108, 113–138.
Thomas, D.J., Zachos, J.C., Bralower, T.J., Tho-mas, E., and Bohaty, S. (2002) Warming thefuel for the fire: evidence for the thermal dis-sociation of methane hydrate during the Paleo-cene–Eocene thermal maximum. Geology, v.30, 1067–1070.
Thomas, L. (2002) Coal geology. Chichester, UK,John Wiley and Sons.
Thomas, R.J., Eglington, R.N., Bowring, S.A.,Retief, E.A., and Walraven, F. (1993) Newisotope data from a Neoproterozoic porphyri-tic granitoid–charnockite suite from Natal,South Africa. Precamb. Res., v. 62, 83–101.
Thomas, W.A. (1977) Evolution of Appalachian–Ouachita salients and recesses from reentrantsand promontories in the continental margin.Amer. J. Sci., v. 277, 1233–1278.
Thomas, W.A., and Astini, R.A. (2002) Ordoviciancollision of the Argentine Precordillera withGondwana, independent of Laurentian Taco-nic orogeny. Tectonophysics, v. 345, 131–152.
Timmons, J.M., Karlstrom, K.E., Dehler, C.M.,Geissman, J.W., and Heizler, M.T (2001) Pro-terozoic multistage (ca. 1.1 and 0.8 Ga) exten-sion recorded in the Grand CanyonSupergroup and establishment of northwest-and north-trending tectonic grains in thesouthwestern United States. Geol. Soc. Amer.Bull., v. 113, 163–180.
Torsvik, T.H., and Van der Voo, R. (2002) Refin-ing Gondwana and Pangea: estimates of Pha-nerozoic non-dipole (octupole) fields. Geophys.J. Internat., v. 151, 771–794.
Torsvik, T.H., Carter, L.M., Ashwal, L.D.,Bhushan, S.K., Pandit, M.K., and Jamtveit, B.(2001) Rodinia refined or obscured; palaeo-magnetism of the Malani igneous suite (NWIndia). Precamb. Res., v. 108, 319–333.
Torsvik, T.H., Van der Voo, R., and Redfield, T.F.(2002) Relative hotspot motions versus truepolar wander. Earth Planet. Sci. Lett., v. 202,185–200.
Toteu, S.F., Van Schmus, W.R., Penaye, J., andMichard, A. (2001) New U–Pb and Sm–Nddata from north-central Cameroon and its
268 Continents and Supercontinents
bearing on the pre-Pan African history ofcentral Africa. Precamb. Res., v. 108, 45–73.
Touret, J., and Dietvorst, P. (1983) Fluid inclusionsin high-grade anatectic metamorphites. J. Geol.Soc. London, v. 140, 635–649.
Trettin, H.P. (1991) The Proterozoic to Late Silur-ian record of Pearya. In Geology of the Innui-tian Orogen and Arctic Platform of Canadaand Greenland (H.P. Trettin, Ed.). Geologyof Canada, no. 3, Geol. Surv. Canada,241–259.
Trompette, R. (1997) Neoproterozoic (~600 Ma)aggregation of western Gondwana: a tentativescenario. Precamb. Res., v. 82, 101–112.
Tucker, R.D., Krogh, T.E., and Raheim, A. (1990)Petrologic evolution and age-province bound-aries in the central part of the Western Gneissregion, Norway: results of U–Pb dating ofaccessory minerals from Trondheimsfjord toGeiranger. In Mid-Proterozoic Laurentia–Bal-tica (C.F. Gower, T. Rivers, and A.B. Ryan,Eds.). Geol. Assoc. Canada Spec. Paper 38,149–174.
Tull, J.F. (2002) Southeastern margin of the middlePaleozoic shelf, southwesternmost Appala-chians: regional stability bracketed by Acadianand Alleghanian tectonism. Geol. Soc. Amer.Bull., v. 114, 643–655.
Unrug, R. (1992) The supercontinent cycle andGondwana assembly: component cratons andthe timing of suturing events. J. Geodynamics,v. 16, 215–246.
Vail, J. (1985) Pan-African (late Precambrian) tec-tonic terrains and the reconstruction of theArabian–Nubian shield. Geology, v. 13,839–842.
Valley, J.W. (2001) Stable isotope thermometry athigh temperatures. Min. Soc. Amer. Rev.Mineralogy, v. 43, 365–402.
Van der Voo, R. (1993) Paleomagnetism of theAtlantic, Tethys and Iapetus Oceans. Cam-bridge, Cambridge Univ. Press.
Van Kranendonk, M.J., and Collins, W.J. (1998)Timing and tectonic significance of lateArchaean, sinistral strike-slip deformation inthe central Pilbara structural corridor, PilbaraCraton, Western Australia. In The tectonicsand metallogenic evolution of the Pilbara Cra-ton (M.E. Barley and S.E. Loader, Eds.). Pre-camb. Res., v. 88, 207–231.
Van Schmus, W. R., Bickford, M.E., and 23 others(1993) Transcontinental Proterozoic pro-vinces. In Precambrian: conterminous U.S.(J.C. Reed, Jr., M.E. Bickford, R.S. Houston,P.K. Link, D.W. Rankin, P.K. Sims, and W.R.Van Schmus, Eds.). The geology of NorthAmerica, v. C-2, Geol. Soc. Amer., 171–334.
Van Schmus, W.R., Bickford, M.E., and Turek, A.(1996) Proterozoic geology of the east–centralMidcontinent basement. In Basement and
basins of eastern North America (B.A. vander Pluijm and P.A. Catacosinos, Eds.). Geol.Soc. Amer. Spec. Paper 308, 7–32.
Vandenberg, A.H.M. (1999) Timing of orogenicevents in the Lachlan Orogen. Australian J.Earth Sci., v. 46, 691–701.
Vanderhaeghe, O., Ledru, P., Thieblemont, D.,Egal, E., Cocherie, A., Tegyey, M., andMilesi, J.-P. (1998) Contrasting mechanismof crustal growth; geodynamic evolution ofthe Paleoproterozoic granite–greenstone beltsof French Guiana. Precamb. Res., v. 92,165–194.
Veevers, J.J. (1995) Emergent, long-lived Gondwa-naland vs. submergent, short-lived Laurasia;supercontinental and Pan-African heat impartslong-term buoyancy by mafic underplating.Geology, v. 23, 1131–1134.
Veevers, J.J. (2001) Atlas of billion-year earthhistory of Australia and neighbours in Gond-wanaland. Sydney, Gemoc Press.
Veevers, J.J. and Tewari, R.C. (1995) Gondwanamaster basin of peninsular India betweenTethys and the interior of the Gondwanalandprovince of Pangea. Geol. Soc. Amer. Memoir187.
Vernikovsky, V.A., and Vernikovskaya, A.E.(2001) Central Taimyr accretionary belt (Arc-tic Asia): Meso–Neoproterozoic tectonic evolu-tion and Rodinia breakup. Precamb. Res., v.110, 127–141.
Vervoort, J.D., Patchett, P.J., Gehrels, G.E., andNutman, A.P. (1996) Constraints on earlyearth differentiation from hafnium and neody-mium isotopes. Nature, v. 379, 624–627.
Viele, G.W. (1989) The Ouachita orogenic belt. InThe Appalachian–Ouachita orogen in the Uni-ted States (R.D. Hatcher, Jr., W.A. Thomas,and G.W. Viele, Eds.). The Geology of NorthAmerica, v. F-2, Boulder, Geol. Soc. Amer.,555–561.
Vincent, S.J., and Allen, M.B. (2001) Sedimentaryrecord of Mesozoic intracontinental deforma-tion in the eastern Junggar Basin, northwesternChina; response to orogeny at the Asian mar-gin. In Paleozoic and Mesozoic tectonic evolu-tion of central Asia; from continental assemblyto intracontinental deformation (M.S. Hendrixand G.A. Davis, Eds.). Geol. Soc. Amer. Mem-oir 194, 341–360.
Vine, F.J., and Matthews, D.H. (1963) Magneticanomalies over ocean ridges. Nature, v. 199,947–949.
Vinyu, M.L., Hanson, R.E., Martin, M.W., Bowr-ing, S.A., Jelsma, H.K., Krol, M.A., and Dirks,P.H.G.M. (1999) U–Pb and 40Ar/39Ar geo-chronological constraints on the tectonic evo-lution of the easternmost part of the Zambeziorogenic belt, Northeast Zimbabwe. Precamb.Res., v. 98, 67–82.
References 269
von Huene, R., and Scholl, D.W. (1991) Observa-tions at convergent margins concerning sedi-ment subduction, subduction erosion, and thegrowth of continental crust. Rev. Geophys., v.29, 279–316.
Wadati, K. (1940) Deep-focus earthquakes in Japanand its vicinity. Proc. Pacific Sci. Congress, v.1, 139–147, Berkeley, University of CaliforniaPress.
Waggoner, B. (1999) Biogeographic analysis of theEdiacara biota: a conflict with paleotectonicreconstructions. Paleobiology, v. 25, 440–458.
Walcott, R.I. (1998) Modes of oblique compres-sion; late Cenozoic tectonics of the SouthIsland of New Zealand. Rev. Geophys., v. 36,1–26.
Wang, X., Metcalfe, I., Jian, P., He, L., and Wang,C. (2000) The Jinshajiang–Ailaoshan suturezone, China: tectonostratigraphy, age and evo-lution. J. Asian Earth Sci., v. 18, 675–690.
Ward, P.L. (1995) Subduction cycles under westernNorth America during the Mesozoic and Cen-ozoic eras. In Jurassic magmatism and tec-tonics of the North American cordillera(D.M. Miller and C. Busby, Eds.). Geol. Soc.Amer. Spec. Paper 299, 1–46.
Wardle, R.J., Gower, C.F., James, D.T., St-Onge,M.R., Scott, D.J., and Garde, A.A. (2002) Pro-terozoic evolution of the northeastern Cana-dian Shield. Canadian J. Earth Sci., v. 39,895 pp.
Wareham, C.D., Pankhurst, R.J., Thomas, R.J.,Storey, B.C., Grantham, G.H., Jacobs, J., andEglington, B.M. (1998) Pb, Nd, and Sr isotopemapping of Grenville-age crustal provinces inRodinia. J. Geol., v. 106, 647–649.
Warme, J.E., Morgan, M., and Kuehner, H.-C.(2002) Impact-generated carbonate accretion-ary lapilli in the Late Devonian Alamo Breccia.In Catastrophic events and mass extinctions:impacts and beyond (C. Koeberl and K.G.MacLeod, Eds.). Geol. Soc. Amer. Spec.Paper 356, 489–504.
Warren, J. (1999) Evaporites: their evolution andeconomics. Oxford, Blackwell.
Wasteneys, H.A., Clark, A.H., Farrar, E., and Lan-gridge, R.J. (1995) Grenvillean granulite-faciesmetamorphism in the Arequipa massif, Peru.Earth Planet. Sci. Lett., v. 132, 63–73.
Wawrzyniec, T.F., Geissman, J.W., Melker, M.D.,and Hubbard, M. (2002) Dextral shear alongthe eastern margin of the Colorado Plateau; akinematic link between Laramide contractionand Rio Grande rifting (ca. 75–13 Ma). J.Geol., v. 110, 305–324.
Weber, B., and Koehler, H. (1999) Sm–Nd, Rb–Srand U–Pb geochronology of a Grenville terranein southern Mexico; origin and geologic his-tory of the Guichicovi Complex. Precamb.Res., v. 96, 245–262.
Wegener, A. (1912) Die Entstehung der Kontinente.Geologische Rundschau, v. 3, 276–292.
Weil, A., van der Voo, R., Niocaill, C.M., andMeert, J.G. (1998) The Proterozoic supercon-tinent Rodinia: paleomagnetically derivedreconstruction for 1100 to 800 Ma. Earth Pla-net Sci. Lett., v. 154, 13–24.
West, H.B., Garcia, M.O., Gerlach, D.C., andRomano, J. (1992) Geochemistry of tholeiitesfrom Lanai, Hawaii. Contrib. Mineral. Petrol.,v. 112, 520–542.
White, D.A., Roeder, D.H., Nelson, T.H., and Cro-well, J.C. (1970) Subduction. Geol. Soc. Amer.Bull., v. 81, 3431–3432.
White, D.J., Forsyth, D.A., Asudeh, I., Carr, S.D.,Wu, H., Easton, R.M., and Mereu, R.F. (2000)A seismic-based cross-section of the Grenvilleorogen in southern Ontario and western Que-bec. Canadian J. Earth Sci., v. 37, 183–192.
White, R.W., Clarke, G.L., and Nelson, D.R.(1999) SHRIMP U–Pb zircon dating of Gren-ville-age events in the western part of the Mus-grave block, central Australia. J. Metam.Geol., v. 17, 465–481.
Whitehouse, M.J., Kalsbeek, F., and Nutman, A.P.(1998) Crustal growth and crustal recycling inthe Nagssugtoqidian orogen of West Green-land: constraints from isotope systematicsand U–Pb zircon geochronology. In Isotopesand crustal evolution; special volume to hon-our Stephen Moorbath (M.J. Whitehouse andC.R.L. Friend, Eds.). Precamb. Res., v. 91,365–381.
Whittington, H.B. (1985) The Burgess Shale. Geol.Surv. Canada and Yale Univ. Press.
Wiebe, R.A. (1992) Proterozoic anorthosite com-plexes. In Proterozoic crustal evolution (K.C.Condie, Ed.). Developments in Precambriangeology 10. Amsterdam, Elsevier, 215–216.
Wignall, P.B., and Twitchett, R.J. (2002) Extent,duration, and nature of the Permian–Triassicsuperanoxic event. In Catastrophic events andmass extinctions: impacts and beyond (C. Koe-berl and K.G. MacLeod, Eds.). Geol. Soc.Amer. Spec. Paper 356, 395–413.
Wilde, S.A. (1999) Evolution of the western marginof Australia during the Rodinian and Gondwa-nan supercontinent cycles. Gondwana Res., v.2, 481–499.
Wilde, S.A., Valley, J.W., Peck, W.H., and Graham,C.M. (2001) Evidence from detrital zircons forthe existence of continental crust and oceanson the earth 4.4 Gyr ago. Nature, v. 409,175–181.
Wilde, S.A., Zhao, G., and Sun, M. (2002) Devel-opment of the North China Craton during theLate Archaean and its final amalgamation at1.8 Ga; some speculations on its positionwithin a global Palaeoproterozoic superconti-nent. Gondwana Res., v. 5, 85–94.
270 Continents and Supercontinents
Williams, G.E. (1993) History of Earth’s obliquity.Earth-Sci. Rev., v. 34, 1–45.
Williams, H., Hoffman, P.F., Lewry, J.F., Monger,J.W.H., and Rivers, T. (1991) Anatomy ofNorth America: thematic portrayals of the con-tinent. Tectonophysics v. 187, 117–134.
Willis, B. (1944) Continental drift—ein Marchen.Amer. J. Sci., v. 242, 509–513.
Wilson, J.T. (1965) A new class of faults and theirbearing on continental drift. Nature, v. 207,343–347.
Wilson, T.J., Grunow, A.M., and Hanson, R.E.(1997) Gondwana assembly: the view fromsouthern Africa and East Gondwana. J. Geo-dynamics, v. 23, 263–286.
Wilson, T.J., Hanson, R.E., and Wardlaw, M.S.(1993) Late Proterozoic evolution of the Zam-bezi Belt, Zambia; implications for regionalPan-African tectonics and shear displacementsin Gondwana, In Assembly, evolution and dis-persal; Proceedings of the Gondwana EightSymposium (R.H. Findlay, R. Unrug, M.R.Banks, and J.J. Veevers, Eds.). Internat. Gond-wana Symposium 8, 69–82. Rotterdam, A.A.Balkema.
Windley, B.F., and Razakamanana, T. (1996) TheMadagascar–India connection in a Gondwanaframework. Osaka, Gondwana Res. GroupMem. 3, Field Sci. Pub., 25–37.
Wingate, M.T.D., Pisarevsky, S.A., and Evans,D.A.D. (2002) Rodinia connections betweenAustralia and Laurentia: no SWEAT, no AUS-WUS? Terra Nova, v. 14, 121–128.
Winther, T.K. (1996) An experimentally basedmodel for the origin of tonalitic and trondhje-mitic melts. Chem. Geol., v. 127, 43–59.
Woerner, G. (1999) Lithospheric dynamics andmantle sources of alkaline magmatism of theCenozoic West Antarctic rift system. In Litho-sphere dynamics and environmental change ofthe Cenozoic West Antarctic rift system (F.M.van der Wateren and S.A.P.L. Cloetingh,Eds.). Global and Planetary Change, v. 23,61–77.
Wyman, D.A., and Kerrich, R. (2002) Formation ofArchean continental lithospheric roots: the roleof mantle plumes. Geology, v. 30, 543–546.
Wyman, D.A., Kerrich, R., and Polat, A. (2002)Assembly of Archean cratonic mantle litho-sphere and crust: plume–arc interaction in theAbitibi–Wawa subduction–accretion complex.Precamb. Res., v. 115, 11–36.
Yang, Z., and Besse, J. (2001) New Mesozoicapparent polar wander path for South China:tectonic consequences. J. Geophys. Res., v.106, 8493–8520.
Yibas, B., Reimold, W.U., and Anhaeusser, C.R.(2001) The geodynamic evolution of the Neo-proterozoic of southern Ethiopia. GondwanaRes., v. 4, 835–836.
Yin, A., Rumelhart, P.E., Butler, R., Cowgill, E.,Harrison, T.M., Foster, D.A., Ingersoll, R.V.,and Zhang, Q. (2002) Tectonic history of theAltyn Tagh fault system in northern Tibetinferred from Cenozoic sedimentation. Geol.Soc. Amer. Bull., v. 114, 1257–1295.
Yoshida, M. (1995) Assembly of East Gondwana-land during the Mesoproterozoic and its reju-venation during the Pan-African period, InIndia and Antarctica during the Precambrian(M. Yoshida and M. Santosh, Eds.). Geol. Soc.India Memoir 34, 25–45.
Young, G.M. (2002) Stratigraphic and tectonic set-tings of Proterozoic glacigenic rocks andbanded iron-formations: relevance to thesnowball earth debate. J. African Earth Sci.,v. 35, 451–466.
Young, G.M., von Brunn, V., Gold, D.J.C., andMinter, W.E.L. (1998) Earth’s oldest reportedglaciation: physical and chemical evidencefrom the Mozaan Group (~2.9 Ga) of SouthAfrica. J. Geol., v. 106, 523–538.
Yumul, G.P., Jr., Imalanta, C.B., Faustino, D.V.,and de Jesus, J.V. (1998) Translation anddocking of an arc terrane: geological and geo-chemical evidence from the southern Zambalesophiolite complex, Philippines. Tectonophy-sics, v. 293, 255–272.
Zartman, R.E., and Doe, B.R. (1981) Plumbotec-tonics—the model. Tectonophysics, v. 75,135–162.
Zeitler, P.K., and 10 others (2001) Erosion, Hima-layan geodynamics, and the geomorphology ofmetamorphism. GSA Today, v. 11, no. 11,4–9.
Zhao, G., Cawood, P.A., Wilde, S.A., and Sun, M.(2002a) Review of global 2.1–1.8 Ga colli-sional orogens and accreted cratons: a pre-Rodinia supercontinent? Earth-Sci. Rev., v.59, 125–162.
Zhao, G., Cawood, P.A., Wilde, S.A., Sun, M., andLu, L. (2000) Metamorphism of basementrocks in the central zone of the North Chinacraton: implications for Paleoproterozoic tec-tonic evolution. Precamb. Res., v. 103, 55–88.
Zhao, G., Sun, M., and Wilde, S.A. (2002b) DidSouth America and West Africa marry anddivorce or was it a long-lasting relationship?Gondwana Res., v. 5, 591–596.
Zhuravlev, A.Y., and Riding, R. (Eds.) (2001) Theecology of the Cambrian radiation. New York,Columbia Univ. Press.
References 271

This page intentionally left blank

Author Index
Abbott, D.H. 33Abdelsalam, M.G. 214, 237Acharyya, S.K. 232Adiyaman, O. 149Ahall, K.-I. 112, 230Aichroth, B. 80, 81Alavi, M. 74, 75Aleinikov, A.L. 96, 150Algeo, T.J. 130Alkmin, F.F. 121Allen, M.B. 151Almeida, F.F.M de 224Alonso-Zarza, A.M. 173Al-Saleh, A.M. 214–215Alvarez, L.W. 186Alvarez, W. 186Ampferer, O. 19Amri, I. 37Anderson, A.L. 97, 112Anderson, D.L. 158Anderson, J.B. 136, 157Anderson, J.L. 41, 112Andersson, J. 223Anhaeusser, C.R. 211Appel, P. 119, 236Arima, M. 232Ashwal, L.D. 242Aspler, L.B. 91, 112Astini, R.A.103, 122Attoh, K. 228, 237Atwater, T. 151Austrheim, H. 58Axen, G. Jr. 150
Bada, J.L. 178Ballance, P.F. 138, 140Barley, M.E. 44, 93Barron, C.N. 212, 213Barth, A.P. 229Bartlett, J.M. 240Beck, R.A. 174Behrendt, J.C. 157Bekker, A. 169Bell, K. 62Benioff, H. 8, 9, 10, 19
Berhorst, V. 238Berry, E.W. 6Berry, R. 47, 102Besse, J. 126, 133, 149Bettencourt, J.S. 112, 230, 231Bhattacharya, S. 232Bhushan, S.K. 97Bickford, M.E. 91, 97, 112Bingen, B. 223Bird, J.M. 20Biswal, T.K. 225Black, L.P. 225, 226, 237Blenkinsop, J. 62Blewett, R.S. 93Bogdanova, S. 229Boger, S.D. 120, 226, 241Boher, M. 88Bohlen, S.R. 33Bolt, B.A. 192Bond, G.C. 103Borg, G. 119Bosworth, W. 141Botelho, N.F. 234Botta, G. 178Boullier, A.-M. 237Bowring, S.A. 47, 64, 92, 182, 228Boyle, A.P. 214, 215Brandon, A.D. 74Brandon, M.T. 74Brasier, M.D. 178, 179, 180Braun, J. 124Brewer, T.S. 228Brito Neves, B.B. de 96, 97, 103, 106, 121, 213,
230Brocks, J.J. 180Brookfield, M.E. 102Brown, D. 66, 67Brueckner, H.K. 237Buchan, K.L. 98Bullen, M.E. 87Burchfiel, B.C. 77, 124Burollet, P.F. 146Burrett, C. 47, 102Burton, K.W. 63Butterfield, N.J. 181
273
Byerly, G.R. 180
Cailteux, J. 239Calver, C.R. 179Card, K.D. 53Carignan, J. 62Carlson, R.W. 64Carr, S.D. 221, 222Casey, M. 144, 154Castle, J.W. 126CD-ROM Working Group 130Chacko, T. 37, 91Chadwick, B. 52Chamberlain, R.T. 6Chappell, B.W. 129Chaudhary, A.K. 232Chaudhuri, A.K. 96, 97, 105Chen, J. 226Chiarenzelli, J.R. 91, 92, 112Claesson, S. 229Clark, D.J. 226Clark, P.O. 159, 161Cloos, M. 22Close, D. 124Cocks, L.R.M. 129, 170, 171Coleman, D.S. 229Coleman, R.G. 16Collerson, K.D. 44Collins, A.S. 119, 242Collins, W.J. 41, 232Collinson, J.W. 123Comas, M.C. 141Condie, K.C. 13, 33, 47, 48, 60, 72, 90, 94, 98,
99, 101, 105, 229, 230Conway Morris, S. 182, 183Cook, F.A. 228Corfu, F. 54Correa-Gomes, L.C. 98Cosca, M.A. 223, 232Cottrell, R.D. 28Courtillot, V. 98, 133Cox, R. 44Crawford, A. 123Crock, J.G. 87Cronin, T.M. 159, 161, 164Crowley, T.J. 171Cullers, R.L. 112Cunningham, W.D. 151
da Silva Filho, A.F. 234Dabbagh, M.E. 214Dallmeyer, R.D. 126Dalziel, I.W.D. 101, 103, 124, 157Das, S. 97Dasgupta, P. 232Davidson, A. 221, 222Davidson, J.P. 72Davies, H.L 35Davis, G.A. 125Davis, W.J. 33, 55
Dawson, G.C. 232Dawson, J.B. 218, 219De, S.K. 91de Kemp, E.A. 54De Lima, E.S. 234de Wit, M.J. 241Deblond, A. 226Debon, F. 77Decker, K. 149Dehler, C.M. 169Delvaux, D. 151Des Marais, D. J. 178, 180Dewey, J.F. 20Dickin, A.P. 210, 221Dietvorst, P. 57Dietz, R.S. 10Dinter, D.A. 141D’Lemos, R.S. 68Dobmeier, C. 232Doe, B.R. 42Donaldson, J.A. 54Donnelly, T.W. 37, 141Dostal, J. 237Downes, H. 35Drury, S.A. 241DuBray, E.A. 218Dueker, K. 130Duerr, S.B. 239
Ebinger, C.J. 144, 154Egan, S.S. 150Einsele, G. 42Emery, K.O. 135Emslie, R.F. 97, 112Encarnacion, J.P. 122Engel, M.H. 177Ernesto, M. 144Ernst, R.E. 98Ernst, W.G. 20Erwin, D.H. 184, 185Evans, D.A.D. 169, 170Eyles, N. 164, 165, 169, 170
Faill, R.T. 223Fan, J. 221, 222Fanning, C.M. 236Faure, G. 210Fedo, C.M. 42, 43Fedonkin, M.A. 180Fernandez-Alonso, M. 111Ferreira, V.P. 234Ferry, J.M. 197Fershtater, G.B. 66Feybesse, J.L. 230, 234Fielding, E.J. 42Fitton, J.G. 144Fitzsimons, I.C.W. 110, 120Flagler, P.A. 39Floden, T. 112Foster, D.A. 124
274 Author Index

Fountain, D.M. 32Fowler, A.D. 55Frank, W. 234Frantz, J.C. 234Freeman, K.H. 178Freitas Suita, M.T. de 237Frey, M. 147Friberg, M. 66Friedman, R. 222Frimmel, H.E. 234Frost, C.D. 37Fullagar, P.D. 229
Gale, A.S. 173Gamble, J.A. 35Gandhi, S.S. 228Gao, S. 226Garfunkel, Z. 141Gaudette, H. 212Gehling, J.G. 181Geraldes, M.C. 224Ghosh, S. 232Ghuma, M.A. 237Gibbs, A.K. 212, 213Glazner, A.F. 74Golynsky, A. 225Goodge, J.W. 226, 236Gorbatschev, R. 229Gower, C.F. 92, 222, 229Grantz, A. 136Gray, D.R. 184Gray, J. 124, 183Greenberg, J.K. 37, 41, 214Gregory, J.W. 154Grey, K. 182Griffin, W.L 63Groenewald, P.B. 225Grotzinger, J.P. 92Grow, J.A. 19Gruau, G. 47Grunow, A.M. 122Gueguen, E. 141Guimares, I. deP. 234Guiraud, R. 141Guo, A. 221Gurnis, M. 94Gutenberg, B. 7
Haapala, I. 112Hagadorn, J.W. 179Hall, R. 156Hallam, A. 184, 185, 186, 187Hamilton, W. 140. 149Hammer, W. 19Han, T.-M. 180Hanmer, S. 222Hansen, E.C. 61Hansen, V.L. 22Hanson, G.N. 40Hanson, R.E. 119, 239
Haq, B.U. 145Hargraves, R.B. 48Harmon, R.S. 37Harris, L.B. 225, 226, 232Harris, N.B.W. 240Harrison, T.M. 77Hartmann, L.A. 46, 88Hartz, E.B. 103Hashimoto, M. 70Hasselbo, S.P. 185Hatcher, R.D., Jr. 126Hauck, M.L. 76Hawkesworth, C.J. 35, 98Hayes, J.M. 178Heaman, L.M. 33, 98, 112Hendrix, M.S. 125Henry, P. 54Hess, H.H. 3, 10Heubeck, C. 151Hill, K.C. 156Hodges, K.V. 76Hoffman, P.F. 101, 194, 158, 164Holmes, A. 6, 9Holser, W.T. 178Holtta, P. 35Holzer, L. 232Homewood, P. 150Hooper, P.R. 35House, M.R. 184Housh, T. 47Humphreys, E.D. 229Hunt, P.A. 97, 112Hurich, C.A. 87Hynes, A. 221, 222
Ionov, D. 151Irwin, W.P. 16Isozaki, Y. 185
Jackson, S.L. 54Jacobs, J. 119, 225Jacobshagen, V. 122Jahn, B.-M. 226Januszczak, N. 166, 167Jaupart, C. 63Javaux, E.J. 180Jayananda, M. 93Joachimski, M.M. 184Johansson, L. 223Johnson, M.R.W. 42Johnson, P.R. 214Johnson, S.P. 110, 232Johnston, S.T. 135Jolivet, M. 151Joly, J. 6, 9Jordan, T.H. 81Juhlin, C. 223Jung, S. 239
Kalsbeek, F. 87, 228
Author Index 275

Kampunzu, A.B. 239Kano, T. 70Karlstrom, K.E. 102, 104, 229Karson, J.A. 16Katili, J.A. 140, 149Kay, S.M. 37Kearey, P. 13Kelly, N.M. 232Kempton, P.D. 35, 37Kennedy, W.Q. 115Kent, R.W. 144Keppie, J.D. 223Kerr, A. 229Kerrich, R. 54, 57Ketchum, J.W.F. 221Kirschvink, J.L. 164Kirstein, L.A. 144Kissling, E. 24, 147Kloppenberg, A. 93Knauth, P.L. 168Knoll, A.H. 185Koeberl, C. 185Koehler, H. 223Kogbe, C.A. 146Kopf, C.F. 228Kriegsman, L.M. 242Kristofferson, Y. 135Krogh, T.E. 33Kroner, A. 211, 224, 236, 242Kuester, D. 119Kuhn, W.R. 161Kukla, P.A. 239Kyle, P.R. 99
Laird, M.G. 122Lamb, S. 72, 73Lambiase, J.J. 97, 154, 155Lan, C.Y. 149Landenberger, B. 41Landing, E. 182, 183Landoll, J.D. 218Larochelle, A. 11Larson, R.L. 99, 145Larue, D.K. 37Laubscher, H. 150Lawlor, P.J. 223LeCheminant, A.N. 98, 112Ledru, P. 89, 90Lee, C.-T. 64LeGrand, H.E. 3, 5Leitch, E.C. 123Leite, J.A.D. 234Lenat, J.-F. 144Lewry, J.F. 91, 92Li, Z.-X. 102, 125, 126, 148, 226Lidiak, E.G. 37Liegeois, J.-P. 119, 237Lindblom, S. 217Lindh, A. 230Lindsay, J.F. 179
Link, P.K. 109Litherland, M. 224Liu, J. 151Lopez, R. 223Louden, K.E. 221, 222Lowe, D.R. 168, 211Lowrie, W. 168, 211Lu, S. 112, 230Lucas, S.B. 91, 92Ludden, J.N. 57, 221, 222Luepke, J.J. 109Lyons, T.W. 109
Macambira, M.J.B. 224Macdonald, R. 112, 154Macko, S.A. 177MacLeod, K.G. 185Maksimov, Ye.M. 151Mallard, L.D. 69Manhica, A.D.S.T. 235Mareschal, J.C. 63Markwick, A.J.W. 35Marsh, J.S. 144Martignole, J. 222Martin, D.M. 169Martin, H. 39Marvin, U.B. 5Master, S. 56Matthews, D.H. 11Mauldin, L.C. 50Mazumder, R. 93McDermott, F. 239McElhinny, M.W. 200, 203McFadden, P.L. 200, 203McGhee, G.R., Jr. 184, 187McGuire, A.V. 214McKerrow, W.S. 129McLennan, S.M. 41McMenamin, D.L.S. 101McMenamin, M.A.S. 101McNamara, A.K. 69Mechie, J. 80Meen, J.K. 37, 52, 240Meert, J.G. 101, 104, 110, 111, 116, 129, 169,
170, 171, 202, 226Meisel, T. 47Meng, Q.-R. 149Menon, R.D. 241, 242Menzies, M. 144, 154Meredith, D.J. 150Mereu, R.F. 221, 222Metcalfe, I. 126, 149, 171Meyer, M.T. 91Meyerhoff, A.A. 4Meyerhoff, H.A. 4Meyers, J.B. 155Mezger, K. 33, 232Milesi, J.P. 230Milisenda, C.C. 242Millar, I.L. 157
276 Author Index

Miller, B.V. 68Miller, J.S. 241Miller, R. McG. 239Miyashiro, A. 71, 139Modie, B.N. 168Moeller, A. 236Moghazi, A.-K. M. 214Moldowan, J.M. 178Moorbath, S. 47Moores, E.M. 17, 101, 103Morgan, J. 186Morgan, W.J. 27Morley, C.K. 149Morley, L.W. 11Morogan, V. 217Morozov, I.B. 79, 80, 81Morozova, E.A. 79, 80, 81Morrison, J. 41Moser, D.E. 33, 212Moyen, J.F. 51Moyes, A.B. 225Mueller, P.A. 228Muenker, C. 123Muhongo, S. 119, 235, 236Muir, R.J. 137Mukherjee, A. 97Mukhopadhyay, D. 93Munyanwiya, H. 239Myers, J.S. 112, 225
Nagler, Th.F. 47Nagy, R.M. 146Nance, R.D. 68Naqvi, S.M. 33, 42, 44, 96, 105Narbonne, G.M. 181Neal, C.R. 72Nedelec, A. 242Nelson, D.R. 93, 232Nelson, K.D. 42Neves, S.P. 234Nicollet, C. 242Nikishin, A.M. 96Nisbet, E.G. 56, 179Nixon, G.T. 35Noffke, N. 180Norton, I.O. 133Nutman, A.P. 40, 44, 228Nyblade, A.A. 63
Olive, V. 62, 219Oliveira, L.P. 98Oliver, G.J.H. 110, 232O’Reilly, S.Y. 63Oreskes, N. 5, 13Orrell, S.E. 91Ortega-Gutierrez, F. 223
Palfy, J. 185Pandit, M.K. 97Paquette, J.L. 241
Park, J.K. 98Parrish, J.T. 173Pearson, D.G. 47, 63Pedrosa-Soares, A.C. 87, 88, 234Peel, J.S. 182Pelechaty, S.M. 90Peresson, H. 149Persson, P.-O. 230Peters, K.E. 178Petford, N. 72Petit, J.R. 174Petrov, G.A. 66Peucat, J.J. 37, 51, 52, 93, 110, 240Pichamuthu, C.S. 60Pilger, R.H., Jr. 141Pimentel, M.M. 237, 238Pinna, P. 235Piper, J.D.A. 101, 102, 104, 105, 112, 113, 169Pisarevsky, S.A. 120Polat, A. 54Pollack, H.N. 63Porada, H. 238Poudjom Domani, Y.H. 63Poujol, M. 211Powell, C.McA. 120Prave, A.R. 239Preiss, W.V. 236Price, R.A. 90, 102Prodehl, C. 80, 81Puchkov, V.N. 66, 67Puchtel, I.S. 33Puura, V. 112
Qiu, Y.M.M. 226
Ragland, P.C. 35Raith, J.G. 124Ramo, O.T. 112Rankin, D.W. 223Rapela, C.W. 37Rast, N. 68Raymo, M.E. 174Rayner, R.J. 171Raza, A. 156Razakamanana, T. 241, 242Reichow, M.K. 150, 185Reinemund, J.A. 140, 149Ren, J. 151Restrepo-Pace, P.A. 72Retallack, G.J. 173Richter, C.F. 7Rickers, K. 225Riding, R. 182Ritsema, J. 156Rivers, T. 221, 222, 229Robertson, A.H.F. 141Rogers, J.J.W. 13, 35, 37, 41, 50, 69, 88, 89, 90,
92, 93, 97, 102, 105, 108, 109, 110, 117,179, 182, 214, 217, 237
Rollinson, H.R. 232
Author Index 277
Rosen, O.M. 90, 101, 230Rosing, M.T. 43Ross, G.M. 109, 228Rougvie, J.R. 223Roy, A. 232Roy, A.B. 97Rudkevich, M.Ya. 151Rudnick, R.L. 35, 63Ruiz, J. 224Rumvegeri, B.T. 226Runcorn, S.K. 10Runnegar, B. 180
Sacchi, R. 224, 236Sadowski, G.R. 230Sanchez-Zavala, J.L. 223Sandberg, C.A. 184Santos, J.O.S. 224Santosh, M. 57, 58, 59, 97, 105, 108, 109, 110,
197, 224, 232, 240, 241, 242Satish-Kumar, M. 58Sato, K. 46, 47Schandelmeier, H. 119, 237Schidlowski, M. 179Schilling, J.G. 35Schmid, S.M. 24, 147Schmitz, M.D. 64Scholl, D.W. 42Schopf, J.W. 180Schrag, D.P. 164Schumacher, M.E. 150Schwartz, M.O. 149Sclater, J.G. 133Scotese, C.R. 129Scrimgeour, I. 124Sears, J.W. 90, 102, 109Seilacher, A. 181Selverstone, J. 153Sengor, A.M.C. 125, 149Shackleton, R.M. 119Shaw, C.A. 225, 232Shaw, D.M. 32, 35Shaw, R. 124Sheridan, R.E. 19Shiraishi, K. 241Shore, M. 55Sidder, G.B. 212, 213Siga, O., Jr. 46, 47Simmat, R. 232Simons, F.J. 81Skehan, J.W. 68Sleep, N.H. 30, 154, 179Smith, A.L. 37Smith, D. 153Smith, D.R. 223Smith, I.E.M. 35Smith, P.L. 185Smithson, S.B. 80, 81Solodilov, L.N. 80, 81Spadea, P. 66, 67
Spakman, W. 156Spray, J.G. 37Stampfli, G.M. 149Stanistreet, I.G. 239Starmer, I.C. 223Stein, H.J. 87Steinmann, G. 15Stern, R.A. 40Stern, R.J. 214, 235Stewart, A.J. 165Stewart, I.C.F. 214Stewart, J.H. 224Stock, J. 151Storey, B.C. 98, 99, 122Stott, C.M. 53Streepey, M.M. 222Strieder, A.J. 237Stump, E. 122Suayah, I.B. 35Suess, E. 3, 4, 115Sun, Y. 149Sykes, L.R. 11
Tait, J. 125Tarduno, J.A. 28Tassinari, C.C.G. 224Taylor, R.N. 37Taylor, S.R. 35, 41Tegtmeyer, A. 211Teklay, M. 235ten Brink, U.S. 123Tewari, R.C. 127, 130Theriault, R.J. 91Theunissen, K. 111Thomas, D.J. 187Thomas, L. 165, 172Thomas, R.J. 224Thomas, W.A. 103, 105, 122Thompson, H.D. 68Thorkelson, D.J. 135Timmons, J.M. 109Torsvik, T.H. 28, 103, 120, 129, 199Toteu, S.F. 234Touret, J. 57Trettin, H.P. 77Trompette, R. 121Tsunogae, T. 58, 59, 197Tucker, R.D. 230Tull, J.F. 126Twitchett, R.J. 185
Uchupi, E. 135Unrug, R. 88, 116Upton, B.G.C. 112
Vail, J. 214, 215Valley, J.W. 197Van der Voo, R. 170, 199, 203van Heijst, H.-J. 156Van Kranendonk, M.J. 232
278 Author Index

Van Schmus, W. R. 112, 229Vandenberg, A.H.M. 123, 124Vanderhaeghe, O. 213Veevers, J.J. 123, 127, 130Vernikovskaya, A.E. 124Vernikovsky, V.A. 124Vervoort, J.D. 47Viele, G.W. 77Vincent, S.J. 151Vine, F.J. 11Vinyu, M.L. 239von Huene, R. 42
Wada, H. 58, 241Wadati, K. 8, 9, 10Waggoner, B. 181, 182Walcott, R.I. 157Wang, X. 149Ward, P.L. 151Wardle, R.J. 228Wareham, C.D. 225Warme, J.E. 184Warren, J. 165, 172Wasteneys, H.A. 72Wawrzyniec, T.F. 153Weber, B. 223Wegener, A. 3, 7Weil, A. 104West, H.B. 35White, R.W. 226
Whitehouse, M.J. 228, 232Whittington, H.B. 183Wiebe, R.A. 97Wignall, P.B. 184, 185, 186, 187Wilde, S.A. 43, 121, 225, 230Wilkinson, B.H. 130Williams, G.E. 164Williams, H. 90Willis, B. 6Wilson, J.T. 23Wilson, T.J. 239Windley, B.F. 30, 119, 241, 242Wingate, M.T.D. 103Winther, T.K. 37, 40Woerner, G. 157Wyman, D.A. 54
Yang, Z. 126, 149Yibas, B. 235Yin, A. 151Yoshida, M. 119, 236, 241Yoshikura, S. 57Young, G.M. 168, 169Yumul, G.P., Jr. 140
Zartman, R.E. 42Zeitler, P.K. 42Zhao, G. 105, 108, 110, 230Zhuravlev, A.Y. 182
Author Index 279

This page intentionally left blank
Subject Index
d13C 178–179d18O 168eHf 207eNd 206eNd and eSr relationship 207eOs 208eSr 205Abiotic 178Abitibi belt 53–54Abu Khrug ring complex 60, 218Acadian orogeny 125Acasta Gneiss 47Accreting margins 14–15Accretion of earth 31Accretionary wedge 21, 70Achankovil Shear Zone 240Acraman impact 182Active margins 13Adamastor Ocean 106Adelaidian trough 236Adiabatic path 195Adirondack highlands 222Adriatic Sea 140Aegean Sea 140Afghanistan 133, 148–149Afif terrane 215Africa 154–156African hotspots 154–156African rifts 154–156Akitkan orogen 107, 230Akiyoshi belt 70–71Al-Amar suture 215Albany belt 102, 225–226, 231–232Albany–Fraser belt 107, 225, 231–232Albedo 163Alboran basin 140Aldan craton 89, 230Aleutian Island arc 138Alleghanian orogeny 126Alno Island 60, 217Alps 23–25, 147–148Altay Range 80, 126, 150–151Altyn Tagh fault 150–151Amasia 158Amazonia 106, 117, 230–231, 235AMCG complexes 97–98, 111–112
Amerasian basin 136Amphibolite facies 196Anabar–Angara craton 89Anatolia 133, 148–149Ancient Gneiss Complex 212Andes 73–74, 153–154Andesite line 138Angara belt 107, 230Annamia 129Anorogenic magmatism 60Antarctic Peninsula 157Antarctic (Southern) Ocean 136–137Antarctica 157Antler orogeny 125Apennines 140Appalachian coal basin 172Appalachian Mountains 102Appalachian rifts 106Appalachian salients 106Apparent polar wandering 201–203Apparent polar wandering curves (APWs) 9,
201–203Apulia 140, 147, 148Aqaba–Dead Sea transform 148–149Ar Rayn terrane 215Arabia 133, 148–149Aracuai belt 234–235Arafura Sea 156–157Araguaia belt 237–238Aravalli orogen 107Arc–trench gap 20–21, 70, 136Archaea 179Archean and Proterozoic comparison 55–56Archean climate 168Archean gray gneiss 39Arctic Ocean 135Arctic Ocean ridge 136Arctica 90–91Arequipa block 106Arequipa massif 72Armorican massif 69Armorican terrane 69Arsikere Granite 51, 53, 60, 217Asia (growth) 125–126Aspidella 181Assam syntaxis 149
281
Asthenosphere 8Atlantic Ocean 135Atlantic-type margins 10Atlantica 88–90Atlas Mountains 140Atmosphere (composition) 160–161Atmosphere (density) 162A-type subduction 19Aulacogen 27AUSMEX connection 103Australia 156–157, 231–232Austroalpine terrane 69AUSWUS connection 102Avalonian terranes 68–70, 116Axial shear zone (Madagascar) 240–242
Backarc basin 21, 139–140Bahama–Guinea fracture zone 135Balkanides 140Baltic shield 229Baltic/Ukrainian craton 89Baltica 92Baluchistan 148–149Banda arc 151–152Banded iron formation 45Barberton Mountain region 43, 211–212Barents shelf 136Basalt plateaus 143–144Basaltic achondrite best initial ratio (BABI) 205Basin and Range 17, 152–153Bastar craton (see Bhandara craton)Belt–Purcell group 109Ben Ghnema batholith 117, 235–237Benioff zones 8–9Bhandara craton 89Bioturbation 177Bismarck spreading center 139Black body radiation 160Black Sea 150–151Blue-green algae (see Cyanobacteria)Blue Ridge Mountains 223Blueschist facies 22, 29–30, 196Bohai Gulf 150–151Bohemian terrane 69Bolide impacts 176, 188Borborema area 117, 234–235Boundary clay (Cretaceous–Tertiary) 187Brasilia belt 237–238Brasiliano oceans 106Brasiliano orogeny 115, 128, 232–234Brazilian craton 89British coal basins 172Brito-Arctic basalt 143–144B-type subduction 19Bulk modulus (incompressibility) 190Bundelkhand craton 89Bunger Hills 102, 107, 226, 231–232Burgess Shale 183Burin Peninsula 183Burrowing 182
Cadomian terranes 68–70, 116, 126Calcareous microplankton 185Calcareous nanoplankton 185Caledonide belt 81Cameroon line 155Canada basin 136Canning evaporite basin 172Cantarito rhyolites 36–37Cape Breton terrane 69Capricorn orogen 107, 231–232Carbon isotopic system 178Carbonatite 62, 217–219Cardamom massif 36–37, 240Caribbean Sea 141Carolina terrane 69Carpathian Mountains 140Cascade Mountains 162Caspian Sea 150–151Celebes spreading center 139Cenozoic climate 173Central African fold belt 234–235Central Arabia 117, 235Central Indian Tectonic Zone 107, 231–232CH4 160–161Charlie Gibbs fracture zone 135Charniodiscus 181Cheshire evaporite basin 172Chewore ophiolite 110Chichibu belt 70–71Chicxulub impact 185Chondrites 204Chondritic uniform reservoir (CHUR) 204Cimmerian terranes 116, 148–149Clarno Formation basalt 34–35Climate controls 159–163Climate history 168–174Closepet Granite 51CO2 160–161, 217Coal 160, 165, 172Coastal Batholith of Peru 72Coastal plutonic suite of Canada 151–152Cocos plate 138Collision 66–68Colorado plateau 152–153Columbia assembly 104–110Columbia dispersal 110–112Composite Arc Belt 221–222Concordia 208–210Confined orogens 87–88Conformable lead 208–210Congo basin 120Congo craton 89–117Congo/Kasai craton 89–117Conrad discontinuity 31–32Continental crust (accretion) 33–42Continental crust (destruction) 42–46Continental crust (origin) 31–33Continental crust (volume) 46–48Continental drift 3, 5–7Continental movements 147–149
282 Subject Index

Continental shelves 7Continental-margin arcs 72–74Continental-margin magmatic suites 72–74Continentality 162Contractionism 4Convection 195Convection cells 159–160Convection currents 9Coppermine homocline 228Coppermine River Basalts 98, 228Coral Sea 139Core 7, 192–193Coriolis effect 160Cratonic stabilization 55–56Cratons 31, 50Cratons (history) 50–56Cretaceous flooding 145–146Cretaceous–Tertiary boundary 185–186Croll–Milankovitch cycles (see Milankovitch
cycles)Crust 7–8Curie temperatures 201Cyanobacteria 179
Dahomeyide orogen 117, 235–237Damaran belt 117, 225, 235, 238–239Darling belt 102, 236Deccan basalt 28, 143–144Delamerian orogeny 123Delamination 82–83Delaware evaporite basin 172Delhi orogen 107Depths to the Moho and their changes through
time 82–83Deserts 160–162Destructive (subducting) margins 19–23Detachment faults 19–20Devonian extinction 183Dharwar block 113, 240Dharwars 52Diagenesis 44Diamonds 29–30Dickinsonia costata 181Dinarides 140Disconformable lead 208–210Discordia 208–210Dom Feliciano belt 117, 234–235Dronning Maud Land 224–225Dropstone 165, 167Dzunggar (Junggar) basin 126, 150–151
East African orogen 235–236East African rift system 18, 27, 154–155East Antarctica 231–232East European (Russian) platform 66–68, 126,
229East Gondwana 117Easterlies 160Eastern Asia 230Eastern Australia 89
Eastern Dharwar craton 89Eastern Ghats 102, 107, 225, 230–232, 240Eburnian orogen 107, 230–231Eccentricity 161Eclogite 22Eclogite facies 196Ediacaran 181–182Elastic material 190Elburz Mountains 148–149Elk Point evaporite Basin 172Entendeka volcanic suite 143Epeiric seas 145Epidote-amphibolite facies 196Equatoria (Romanche) zone 135Equilibration pressure 197–198Equilibration temperature 196–198Equilibrium adiabat 195Equilibrium thermal gradient 195Esmond–Dedham terrane 69Ethiopian flood basalts 143Ethiopian–Yemen basalt plateau 27, 143–144Eukaryote evolution 180Eurasia collision zone 147–149Eurasia extension 150–151Eurasian basin 136European coal basins 172European Geotraverse 79–81Eustatic changes in sealevel 144–146Evaporites 160, 165, 172Evolution of organisms 179–187Exterior thrust belt 222
Failed arm 27Falkland/Malvinas–Agulhas fracture zone 135Farallon plate 138Felsic granulite 36–37Felsic rocks 31Felsic rocks (generation) 39–41Fenitization 217Fiji plateau 139Fixism 4Fluid inclusions 58–59Fluids 56–60, 217–220Flysch 23Fore-arc basin 20–21Foredeep trench 20–21Foreland basin 22–23Fort Simpson batholithic suite 228Fossil ornamentation 166Fossils and climate 165–167Foxe orogen 107, 227–228Fracture zones 12, 26Franklin Mountains 223Fraser orogen 225–226, 231–232Frasnian–Famennian extinction 184Frontenac–Adirondack belt 221–222
Galapagos spreading ridge 138Gangdese batholith 76–77Gardar province 111–112
Subject Index 283
Gariep belt 117, 234–235Gariep–Dom Feliciano ocean 121Gawler craton 89Geochron 209Geographic poles 199Geomagnetic poles 199Glacial periods 169–170Glacial periods (origin) 163–164Gnowangerup dikes 111–112Godavari rift 97–109Goias massif 238Gondwana 114, 116Gondwana glaciers 115, 171Gondwana Land 3, 115Gorda plate 138Granite–rhyolite terrane (North America) 97,
110–111Granite–rhyolite terranes 97, 110–111Granulite facies 32–33, 196Gravitational fractionation 31Great Bear intrusive suite 109Great Falls tectonic zone 107, 227–228Great Rift Valley (see East African
rift system)Greater (High) Himalayas 76–77Greenhouse climate in Cretaceous 173Greenhouse gases 160Greenschist facies 196Greenstone belts 53–55Grenville age 101–112, 118, 221–222Grenville belt of eastern Canada 221–223Grenville front 221–222Grenville rocks in North America 223Grunehogna craton 143Guapore shield 89Guiana (Guyana) craton 89, 212–214Gulf Coast evaporite basin 172Gulf of California (Sea of Cortez) 152–153Gulf of Mexico 141–142Gyres 162–163
Halekote trondhjemite 52Half graben 17Havre spreading center 139Hawaii–Emperor seamount chain 29, 138Hawaiian hotspot 138Hearne craton 89Heat flow 63, 194–195Heat production 9, 194Hellenides 140Hercynian orogeny (see Variscan orogeny)HF 217–218Hida belt 70–71Highland/Southwestern Complex (HSWC) 240,
243Himalaya 76–77, 148–149Hindu Kush 148–149H2O 217Hoggar massif 117, 236–237Hotspot tracks 28–29
Iapetus Ocean 128Iapetus rift margin 104–106Iberian peninsula 140Iberian terrane 69Iceland 28Iceland rhyolite (liparite) 36–37Ichnofossils 177Iforas belt 236–237Illinois coal basin 172Imnaha basalt 34–35Incipient charnockite 57–58Incompatible elements 31India 133, 148–149, 231–232, 235Indian Ocean 132–133Indian rift valleys 96–97Indo-Burman ranges 76–77Indochina 133Indonesian subduction zone 134Indus–Tsangpo suture 76–77Innuitian orogeny 77–78Inside (eastern) margin of Laurasia 124Intercratonic orogens 85–87Interior magmatic belt 102, 222–223Internal orogens 90–91Intra-Alpine terrane 69Intracontinental rifts 17–19Intracratonic orogens 85–87Intracrustal melting 41Intraoceanic island arcs 20–21, 70–72Intraoceanic subduction 19Ionian Sea 140Iran 133, 148–149Iridium 186Ironstone (see Banded iron formation)I–S line 124Island arcs 20–22, 70–72Isobaric cooling (IBC) 197Isochores 197Isostasy 4–5Isothermal decompression (ITD) 197Isua 43–44I-type granites 124Izanagi plate 138Izu–Bonin arc 139
Japan arc 70–72, 139Japan (Sea of) 139Juan de Fuca plate 138Junggar (Dzunggar) basin 126, 150–151Jura Mountains 81Juvenile crust 48
Kaap Valley 211Kaapvaal craton 43, 89, 113, 210Kabbaldurga, India 61Kalahari block 106, 117, 235Kaoko belt 117, 234–235Kapuskasing zone 32, 34–35, 53Karakum 126
284 Subject Index

Karoo rift basins 155Kazakhstan block 66–68, 89, 126Kenoran 55Kenorland 91–92Keratophyre 36–37Kerguelen plateau 137Kerogen 178Ketilidian orogen 107, 227, 229Kibaran orogeny 102, 117, 226Kimberley craton 89Kodaikanal massif 240Kohistan island arc 76–77Kola–Karelia belt 107, 229Komatiite 29–30, 54–55Konigsbergian–Gothian magmatic suite 107K–T boundary (see Cretaceous–Tertiary
boundary)Kufra basin 236–237Kula plate 138Kunlun Range 126, 148–149Kurile arc 139Kurosegawa terrane 70–71Kuunga orogeny 116
Labradorian batholithic suite 107, 227, 229Lachlan orogen 123–124Lake Baikal 150–151Lake Nyos 155Lake Victoria 27Lanai basalt 34–35Land bridges 4Land plants 183Lapse rate 161Laramide orogeny 153Large blocks that collide with each other 66–68Large igneous provinces 98Large-ion-lithophile elements (LILE) 31Late-Devonian extinction 184Late-Eocene faunal change 186–187Late Triassic–Early Jurassic extinction 185Lau spreading center 139Laurasia 89, 124–130Laurentia 104Lesser Antilles 21Lesser Himalaya 76–77Lewisian 89Lhasa block 133LILE-rich rocks (origin) 41–42Limpopo belt 107, 231–232Linear rift systems 17Lithosphere 8Llano area 102, 223Lomonosov Ridge 136London platform 69Longonot volcano 18Low-velocity zone (LVZ) 8, 80–81Lower crust 31–32, 79–80Lufilian belt 117, 235, 238–239Lu–Hf isotopic system 207Luis Alves Ocean 106
Lurio (Lurio–Namama) belt 102, 107, 224,231–232, 236
Lutzow–Holm complex 240–241
MacKenzie dikes 98, 111–112Madagascar 117, 235Mafic dyke swarms 98Mafic granulite 34–35Mafic rocks 32–33Mafic underplating 82–83Magnetic anomalies 201Magnetic dating 201Magnetic declination 200Magnetic dipole 199Magnetic field 199Magnetic inclination 200Magnetic polarity 200Magnetic poles 9, 199Magnetic quiet zone 99Magnetic remanence 200Magnetic reversals 200–201Magnetic stripes 11–12, 201Magnetic time scale 200Magnitogorsk arc 66–68Mahanadi–Lambert lineament 109Main Boundary Thrust 76–77Main Central Thrust 76–77Main Uralian fault 66–68Makkovikian orogen 107, 227, 229Makran accretionary prism 148–149Malani igneous suite 97Malopolska terrane 69Manila trench 139Mantle 192–193Mantle discontinuities 7–8Mantle solidus 29–30Mantle wedge 20–21Mariana island arc 139Mariana spreading center 139MARID vein 219Massif Central 69Matsoku kimberlite 219–220Maudheim province 102, 117, 225Mauritanide belt 126Mawson continent 110Maximum packing in supercontinents 85Mazatzal orogen 107, 227, 229Median Tectonic Line 70–71Mediterranean Sea 140–141Melanesian arc 139Melange 22–23Mendocino Fracture Zone 152–123Mesoproterozoic 56Mesoproterozoic climate 169Mesozoic climate 173Metallic meteorite 131Metamorphic facies 196Metasedimentary (paragneiss) belts 53–55Metasomatism of SCLM 61–64Mid-Atlantic Ridge 135
Subject Index 285
Mid-continent rift system 106Middle Cambrian black shale fauna 183Mid-ocean ridge basalt, 34–35Mid-ocean ridges 9Milankovitch cycles 161Minnesota River gneiss terrane 53–54Mino–Tanaba terrane 70–71Mirnvy region 226Mohorovicic discontinuity (MOHO) 7, 31–32,
82–83Molasse 23Molecular fossils 177Mongolian orogenic belt 126Moodies Formation 212Moraines 165Moscow evaporite Basin 172Mountain roots 7Mozambique belt 224, 235–236Mozambique ocean 128Multicellular organisms 181Murzuk basin 236–237Musgrave belt 102Mwembeshi shear zone 239
Nabitah suture 215Nagercoil massif 240Nagssugtoqidian orogen 107, 227–228Nain province 89Namama belt (see Lurio–Namama belt)Napier complex 89, 117, 225, 235, 240–241Nappes 23Narakay volcanic suite 228Natal belt 102Natrocarbonatite (see Sodium carbonate lavas)Nazca plate 138Nena 92Neoarchean supercontinent 112–113Neoproterozoic 56Neoproterozoic climate 169–170Neotethys 137New Brunswick terrane 69New England orogen 124New Guinea 156–157New Hebrides spreading center 139New Quebec orogen 107, 227–228New Zealand 156–157Newfoundland–Azores–Gibraltar fracture zone
135Ngorongoro 218Nile–Uweinat craton (see West Nile craton)Nimrod orogeny 226North Algerian basin 140North America 151–153North Anatolian fault zone 148–149North China (Sino-Korean) craton 89, 126North Sea 150Nova Scotia terrane 69Nubian–Arabian craton (shield) 89, 214–216,
235–237
Oaxaquia 102, 223–224Obduction 16Obliquity 161–163Ocean currents 162–163Oceanic crust 72Oceanic plateaus 72Okhotsk Sea 139Ol Doinyo Lengai 60, 218–219Onshore wind 172Ophiolite conundrum 17Ophiolites 15–17Orbital effects 161Ordovician extinction 183Ordovician glaciation 183Organic activity (preservation) 176–178Organic compounds produced abiotically
176–178Organic compounds produced by organisms
176–178Orogenic belts (types) 85–87Ouachita Mountains 77–78Outer (western) margin of Gondwana 122Outer (western) margin of Laurasia 123–124Outwash plains 165Oxygen isotopes 167–168
Pachemel (Pachelma) belt 107, 229Pacific Ocean 137–140Pacific-type margins 10Paired metamorphic belts 70–71Palaeopangaea 102, 104Palau–Yap arc 139Paleocene–Eocene faunal change 186–187Paleocene–Eocene Thermal Maximum (PETM)
186–187Paleoproterozoic 56Paleoproterozoic climate 168–169Paleoproterozoic glaciation 168–169Paleotethys 133Paleozoic climate 170–171Paleozoic–Mesozoic boundary 184–185Paleozoic North America 77–78Paleozoic orogeny 122Palghat–Cauvery shear zones 240Palni massif 240Pamir syntaxis 149Pampia block 106Pan-African orogeny 114–117, 234–242Panamparema block 106Pangea 114, 122–130, 184Pangea accretion 122–126Pangea dispersal 95, 131, 140–144Pangea (movements of blocks to form) 127Pannonian basin 140Panthalassa 131Paradox evaporite basin 172Paragneiss belts 53, 55Paraguay belt 237–238Parana basalt 28, 238
286 Subject Index

Parana basin 143–144, 238Parece Vela spreading center 139Parnaiba block 106Parnaibo evaporite basin 172Parvancorina 181Passive-margin sediments 74–75Passive margins 13, 18Past climates (methods for inferring) 164–167PDB 168, 178Pearya 77–78Peninsular Range batholith 151–152Penokean orogen 89, 107, 227–228Peri-Franciscan Ocean 106Permanentism 4Permian–Triassic extinction 184–185Permo-Carboniferous glaciation 170–171Petrologic Moho 82–83Pharusian ocean 106, 117, 235–237Philippine arc 139Phoenix plate 138Pilbara craton 89, 113Plagiogranite 36–37Plate margins 13–14Plates 13–14Pleistocene glaciation 174Plume head 28Plume toe 28Plumes 27–28, 33, 94–95Polar fronts 160Pontides 140–148Post-orogenic granite 36–37, 55–56Post-stabilization history 56–62Precambrian–Cambrian transition 182–183Precession 161Precordillera of Argentina 122Prince Charles Hills 117, 226, 235Prograde metamorphism 197Prokaryotes 179–180Proterozoic 55–56Provencal basin 140p–T–t path 197–198Pull-apart basins 26Pyrenees 140–148
Qaidam basin 150–151Qiangtang block 133Qinling–Dabei orogen 148–149QUARTZ seismic profile 79–80
Racklan orogen 108–109, 227Radiation 161Radioactivity 7Rae province 89Rain forests 162Rain shadows 161Ranotsara shear zone 240Rapakivi granitesRayner belt 102, 107, 225, 231–232, 240–241Rb–Sr isochron 204–205
Rb–Sr isotopic system 204–205Recycling crustal growth rate 48Red River–Ailongshan fault 148–149Red Sea 27Reduced heat flow 194Reefs 160, 164–165Reindeer zone 91–92Releasing bend 26Re–Os isotopic system 207–208Restraining bend 26Retrograde metamorphism 197Reunion Island 144Reykjanes spreading center 15Rhine graben 150Ridge crests 11Rift valleys 96–97Rigidity modulus 190Rinkian orogen 107, 227–228Rio de la Plata craton 89, 106, 117, 235Rio Grande rift 152–153Rio Negro–Juruena belt 107, 230–231Riphean basins 96Rocky Mountains 153Rodinia assembly 101–104Rodinia dispersal 104–106Rokelide–Goianide Ocean 106Rokelide orogen 126Rondonian belt 107, 110–111, 230–231Roraima Group 213Ross orogen 122, 124r–r–r triple junctions 27Russia coal basins 172Ryoke–Abukuma belt 71Ryukyu arc 139
Saharan Metacraton 237Salina (Michigan) evaporite basin 172San Andreas fault 23, 25Sanbagawa belt 70–71Sao Francisco/Congo–Kasai craton 235Sao Francisco craton 89Sao Luis craton 106Sayan Range 126Scotia arc 137Seafloor spreading 10–11Secondary (S) waves 170Seismic discontinuity 191–192Seismic Moho 82–83Seismic refraction 191–193Semail ophiolite 36–37Sevier orogenic belt 153Seychelles–Mascarene ridge 134Shadow zone 192–193Sheeted dikes 16Shields 31Shikoku spreading center 139Sial 31Sialic rocks 32Siberian basalts 150, 184
Subject Index 287
Siberian plate 126Sibumasu terrane 133Silsilah complex 218Sima 31Singhbhum craton 89Sino-Korean craton (see North China craton)Siwaliks 76–77Skeletal organisms 182Slab avalanches 94Slave craton 89Small continental blocks that accrete to
continental margins 68–70Small shelly fossils 182Sm–Nd isotopic system 205–207Snell’s law 191Snowball Earth 164Snowbird zone 228Sodium carbonate lavas 216Solar irradiance (luminosity) 161Solomon arc 139Songimvalo block 211Songliao microcontinent 126Sonoma orogeny 125Sor Rondane Mountains 240–241Sorong fault 156–157South America 153–154South China 133, 148–149South China Sea 139South China (Yangtze) craton 89, 226South Fiji spreading center 139South Tibetan Detachment 76Southeast Indian Ocean ridge 134Southern Africa 231–232Southern (Antarctic) Ocean 136–137Southwest China flysch basin 126, 148Southwest Indian Ocean ridge 134Southwest Pacific island arcs 138–140Southwest Scandinavian gneiss complex 110Species diversity 166Spreading rates 15Spriggina 181(87Sr/86Sr)i 204–205Sri Lanka 240St. Francois Mountains 97Statherian rifts 96Steinmann trinity 15Steynsdorp terrane 211Stony meteorites 31Stromatolites 180S-type granites 124Subcontinental lithospheric mantle (SCLM) 32,
61–63, 80–81Subduction beneath continental margins 22–23Subduction under arriving terranes 77–78Subduction zone basalt 34–35Subduction zones 8, 10Sunsas belt 102, 224Supercontinent assembly 85–93Supercontinent cycle 157–158Supercontinent dispersal 95–99
Supercontinents 3Superior craton (province) 53–55, 89Superplumes 98–99Suwanee terrane 69Svecofennian orogen 107Sveconorwegian orogen 102, 223Sverdrup evaporite basin 172SWEAT (Southwest North America East
Antarctica) connection 101
TCHUR 46, 206TDM 46, 206TRD 208Taconic orogeny 125Taimyr belt 124Taltson magmatic suite 227–228Taltson–Thelon orogen 89, 227–228Tanakura line 70–71Tanzania craton 89, 113, 117Tarim basin 150–151Tarim block 89, 126Tasman orogen 123Tasman Sea 139Tauride Range 148–149Tectonic control of glaciation 164Tectonic crustal growth rate 48Tectosphere 81Tethys 76–77, 131Thelon orogen 227–228Thermal conductivity 194Thermal gradients 28–30, 82–83, 194–197Thermal infrared 160–161Tibesti massif 117, 236–237Tibet 148–149Tienshan Range 126, 150–151Tillite 165Tocantins region 117, 237–238Tonga arc 139Torngat orogen 107, 227–228Tornquist Ocean 69Torres–Walvis Ridge 135Trace fossils 177Trade winds 160Traditional crustal growth rate 48Trans-African lineament 146Transamazonian event 213Transamazonian orogen 107, 230–231Transantarctic Mountains 102, 226, 236Transfer fault 17Transform faults 11–12Transform margins 23–27Trans-Hudson orogenic belt 53, 91, 227–238Transition zone in southern India 51–53, 60–61Trans-North China orogen 107, 230Trans-Saharan orogen 236–237Triassic–Jurassic extinction 185Tribrachidium 181Triple junction 27Tristan da Cunha 155
288 Subject Index
Tropic of Cancer 163Tropic of Capricorn 163True polar wandering 9TTG (tonalite–trondhjemite–granite) 36–37,
39–40Turbulent mantle 29Tyrrhenian Sea 140
Uatuma Group 213Uinta rift 109Ukraine coal basins 172Ultramafic rocks 31Umudhua terrane 211Ungava/Cape Smith orogen 107, 227–228Unkar Group 109Upper crust 31–32Ur 93Ural Range 66, 68, 79–80, 126Urd suture 215Ust-Urt terrane 126U–Th–Pb isotopic system 208–210
Variscan orogeny 81, 125Vascular plants 183Vestfold Hills 89Vijayan Complex 240, 243Vitiaz arc 139Volcanism (effect on evolution) 187–188Volhyn belt 229
Wadati–Benioff zones (see Benioff zones)Wajid Formation 214–216Wanni Complex 240, 243Wathaman (Wathaman–Chipewyan) batholith
89–90Wernecke Group 228West Africa 106, 155, 235
West African craton 89, 117, 236–237West Antarctica 157West Congo belt 117West Gondwana 117West Nile craton 89, 117, 235–237West Philippine spreading center 139West Siberian Basin 79–80, 145–146, 150–151West Texas 102Westerlies 160Western Australia 235Western Dharwar craton 50–53Western Gneiss region 230Western interior coal basin 172Western Interior Seaway 145–148Windmill Islands 102, 107, 226, 231–232Woodlark spreading center 139Wopmay (Bear) province 91, 107, 227–228Wyoming craton 89
Yangtze craton (see South China craton)Yarlung–Tsangpo suture (see Indus–Tsangpo
suture)Yarrol orogen 124Yavapai orogen 107, 227–229Yellowstone hotspot 89Yilgarn craton 89Younger Granite (Egypt) 214–216
Zagros Mountains 74–75, 148–149Zagros simply folded belt 74–75Zagros suture 74–75Zambezi orogenic belt 110, 117, 235, 238–239Zechstein evaporite basin 172Zimbabwe craton 89Zircon dating 208–209Zircons 43, 46Zircon–TDM crustal growth rate 48
Subject Index 289
Copyright © 2022 FDOKUMEN