Contents - Millonarium FX
50
Global Stock Markets 3 Global Stock Index 3 United States 3 Europe 8 Asia-Pacific 15 Global Interest Rates 24 United States 26 European and Asia-Pacific 27 International Currency Relationships 29 Dollar Rates 29 Other Rates 30 Metals & Energy 33 Gold & Silver 34 Crude oil 34 Natural Gas 34 Economic, Monetary and Cultural Trends 35 35 39 43 Europe Australia . ........ A Capsule Summary of the Wave Principle Glossary of Terms 46 Contents United States.............. 40 1
-
Upload
khangminh22 -
Category
Documents
-
view
1 -
download
0
Transcript of Contents - Millonarium FX

Global Stock Markets . . . . . . . . . . . 3Global Stock Index . . . . . . . . . . . . . 3
United States . . . . . . . . . . . . . . . . . 3
Europe . . . . . . . . . . . . . . . . . . . . . . 8
Asia-Pacific . . . . . . . . . . . . . . . . . 15
Global Interest Rates . . . . . . . . . . . 24United States . . . . . . . . . . . . . . . . 26
EuropeanandAsia-Pacific . . . . . 27
International Currency Relationships . . . . . . . . . . . . . . . . . 29
Dollar Rates . . . . . . . . . . . . . . . . . 29
Other Rates . . . . . . . . . . . . . . . . . 30
Metals & Energy . . . . . . . . . . . . . . 33Gold & Silver . . . . . . . . . . . . . . . . 34
Crude oil . . . . . . . . . . . . . . . . . . . 34
Natural Gas . . . . . . . . . . . . . . . . . 34
Economic, Monetary and Cultural Trends . . . . . . . . . . . . . . . 35
35
39
43
Europe
Australia
. . . . . . . . . . . . . . . . . . . . .
. . . . . . . . . . . . . . . . . . . . .
A Capsule Summary of the Wave Principle . . . . . . . . . .
Glossary of Terms . . . . . . . . . . . . . 46
Contents
United States. . . . . . . . . . . . . .
40
1

© August 31, 2018
(data through August 30)
Welcome
AnnouncementsGlobal Market Perspective has guided globally-minded
investors for over 27 years. Now, a redesign and new
features are making it quicker and easier for subscribers to
get a comprehensive view of the world’s hotspots. In
addition to a new navigation and mobile-friendly interface,
the brand-new Chart Gallery feature lets you quickly scan
the most important charts in each section. One subscriber
writes, “I’m in love with the chart galleries! Thanks for
that!” Use the feedback button and let us know what you
think.
Join Jordan Kotick and Robert Kelley for a free webinar on
Thursday, September 6 at noon Eastern time. Learn how
Robert uses the Wave Principle and supporting technical
indicators to spot and execute intraday trade set-ups.
Register for free
here: https://www.elliottwave.com/wave/webinar
(https://www.elliottwave.com/wave/webinar).
Meet and chat with Steven Hochberg at the Dallas
MoneyShow, October 3-5. Attend Steve’s workshop and
learn where the opportunities and risks are for the
remainder of 2018 and 2019. Register free:
www.elliottwave.com/wave/DallasMoneyShow
(https://www.elliottwave.com/wave/DallasMoneyShow).
Ask Bob Prechter and Steven Hochberg your questions at
the New Orleans Investment Conference, November 1-
4. The next few years will likely be one of the riskiest and
potentially most profitable periods in history. Thousands of
investors say that the annual Conference is the single best
place to learn how to build and protect your wealth. Learn
more and register now: www.elliottwave.com/wave/NOIC
(http://www.elliottwave.com/wave/NOIC).
Shake hands with our Asian-Pacific editors at the IFTA
2018 Conference in Kuala Lumpur, October 26-28.
EWI’s Asian-Pacific Financial Forecast editor Mark
Galasiewski will share his Elliott wave and socionomic
research, including forecasts for the major Asian-Pacific
markets. EWI’s Asian-Pacific Short Term Update editor,
Chris Carolan, will present his Spiral Calendar work,
which earned him the Charles Dow award. Learn more:
www.elliottwave.com/wave/IFTA2018
(http://www.elliottwave.com/wave/IFTA2018).
WORLD STOCK MARKETS
U.S. Markets -
Bottom LineThe stock market’s main index, the Dow Jones Industrial
Average, remains in the late stages of a countertrend rally
from early February, as does the broader NYSE Composite.
Both indexes should complete their advances without
exceeding the January top. The S&P 500, propelled by a
concentrated number of tech and social media shares,
carried to a new high. The index should reverse trend when
the Dow and NYSE Composite complete their second wave
rallies.
European Markets -
Bottom Line
2

Europe’s major stock markets are tracing out the initial
sub-waves of large-degree bear market. The burgeoning
sell-off, which is already pressuring many important
sectors, stands ready to hit many more in the months
ahead. A six-month push by UK investors into high-beta
stocks is symptomatic of a late-stage market advance. Once
the positive mood trend reverses, the rush to safety should
become at least as dramatic as the rush to risk that
preceded it. The currency and credit crisis in Turkey
testifies (again) to governments’ inability to halt debt
deflation. Looking ahead, both Europe’s eastern bloc and
its southern region are future credit accidents waiting to
happen.
Asian-Pacific Markets
- Bottom LineMost Asian-Pacific stock markets have begun the final
waves up in their rallies from 2016. Some markets are
rallying in B waves.
Global Stock IndexThe Dow Jones Global Index is back near its March peak,
consistent with the outlook for a move to new highs. A
wave 9 triangle ended at the late-June low. From that
point, a first and second wave unfolded and wave (iii) of 0
up is under way. Expect continued advance over the
coming weeks, ultimately above the 425.67 high. The
bullish view remains preferred while the mid-August low at
391.28 remains intact.
U.S. Chart GalleryView Charts
U.S. Stock Markets
Speculative thrusts are not uncommon at the end of long-
term uptrends. In early 1946, for instance, R.N. Elliott even
constructed a “Special Index” to account for what he called
“a new crop of reckless speculators with more money than
3

experience who favored low-priced stocks instead of
seasoned issues of the type represented by the popular
averages.” As it turned out, a significant top in the Dow
Jones Industrial Average was a few months away, in May
1946, that led to a 24% decline over the next five months.
The current peaking process is much bigger, however, and
the speculative intensity has reached an even greater
extreme. Indexes such as the NASDAQ measure the
performance of more speculative shares, which include the
tech/social media sector. Just a few stocks in the NASDAQ
now account for much of the stock market’s latest rally.
Many observers cite this strength as the reason that stocks
will continue to advance. Recent issues of GMP have
pointed out that the NASDAQ has a long history of
continuing to new highs after the DJIA tops at the end of
the biggest bull markets. For instance, the NASDAQ
peaked on October 31, 2007, 20 days after major tops in
the Dow and S&P on October 11. In 2000, the NASDAQ
Composite topped on March 10, two months after the
Dow’s January 14 peak. Going back even further to the
Cycle wave III high in the late-1960s, the OTC index, the
forerunner to the modern-day NASDAQ, made a
substantial new high in November 1969 while the Dow
stopped short of its 1966 high. This chart shows the
performance of the two indexes from 1965 to 970. Note the
persistence of the OTC index rally during this period. After
the Dow’s December 1968 top, the index declined 31% to
May 1970. At the time, this was largest selloff since March
1937-March 1938. In his last major forecast, Elliott noted
that reckless speculation usually ends large market
advances; this one fits the historical precedents.
Elliott Wave Analysis
In August, the Dow Industrials’ second-wave retracement
continued to subdivide, with the index carrying into the
price territory of a gap at 26,061-26,186, which was created
by the close of February 1 and the open of February 2. The
index has not yet been able to break away, in either
direction, from the top line of the Primary wave 5 channel,
instead traversing above and below it since April. The Dow
is the stock market’s most prominent index, and it remains
in Intermediate wave (2) of the bear market. The view that
the recent Dow rally is an upward retracement is supported
by the NYSE Composite index, a broader stock index that
contains all of the more than 2000 stocks listed on the New
York Stock Exchange. The NYSE Composite, which reflects
the performance of the average stock, has retraced 69% of
the decline from the January top so far, recently filling a
gap from the close on February 2.
The S&P 500, a mixture of the blue-chip Dow and tech-
influenced NASDAQ, carried to new highs on the strength
of just six stocks: Facebook, Apple, Amazon, Netflix,
Microsoft and Google (Alphabet). These issues account for
more than a third of the entire advance from the February
low. The NASDAQ’s move through 8000 has been even
thinner. According to Bloomberg, 48% of the NASDAQ’s
push through this level is accounted for by just four stocks:
Amazon, Apple, Netflix and Google (see pie chart). Many
market analysts celebrated these record highs as bullish
breakthroughs (“It’s ‘Dangerous’ for Bears to Ignore the
Breakout in Stocks,” MarketWatch, August 30), but the
narrowness of the advances actually portend a bearish turn
once the final subwaves are complete. The next chart
depicts the withering strength of the rally in the S&P. The
bottom graph displays the percentage of S&P 5004

components accompanying the index to its recent high. On
the day of the January 26 high, 25% of all S&P 500 stocks
were hitting new highs. On Friday, August 24, as the S&P
500 exceeded the January high for the first time, just 8%
hit new highs. Now compare the percentage of stocks rising
to new highs during the advance from the wave (4) low in
February 2016 to the percentages during the rally from
February of this year. It’s a striking display of dissipating
upward momentum, indicative of a rise that is in its late
stages. We did not anticipate that the S&P would reach a
new high, but the wave labels on the chart show the
advance from February as wave 5 of (5); the lack of
participation by its members is compatible with this
interpretation.
In sum, the performance of the average stock has been a
partial upward retracement of the decline from January, as
shown by the broad NYSE Composite, while a concentrated
number of high-profile tech/social media shares have
pushed the NASDAQ to new highs and influenced the S&P
500 enough to reach a new high. The extreme narrowness
of the rally in the latter indexes makes it best labeled a fifth
wave—Minor wave 5 of Intermediate wave (5). Stocks have
held up longer than we thought, but in our estimation, the
weight of evidence clearly favors a pending decline,
whether it starts from the peak of wave (2) or wave (5).
Investor Psychology
It’s official. The bull market is now the longest in history.
Or at least that’s what dozens of different articles reported
in August. While a few questioned the validity of the
alleged record, 3,453 days, or 9.46 years of gains in the
S&P without a decline of 20% or more, the media mostly
took the claim at face value. “The record” is mostly just
another expression of the investment world’s extreme
optimism toward the stock market’s immediate future.
This is evident from a Bloomberg offering that shows two
even longer gains in the Dow Jones Industrial Average, “a
17-year rally” from 1949 to 1966 and an “18-year rally”
from 1982 to 2000 and concludes, “U.S. Stocks May Be
Just Getting Started.” These headlines affirm the intensity
of bullish opinion, not to mention a conspicuous lack of
originality:
So, it’s the “longest” bull market in history and “it may be
just getting started”! Of course, few noted that the DJIA,
the stock market’s main index, as well as the broader NYSE
Composite index, as well as many foreign indexes, have
failed to accompany the S&P to new highs. Why dampen
the mood? In our view this is just another version of the
“melt-up,” “Fear of Missing Out,” a.k.a. FOMO, and
“euphoria” chatter that echoed up and down Wall Street
back in January (see discussion, February GMP). People
are so locked in to the ironclad case for further gains in
stock prices that they parrot one another in their bullish
pronouncements. This headline from Bloomberg on
Wednesday, echoes the mantras of early 2018:
A dawning “melt-up euphoria” fits perfectly at this
juncture. Euphoria is defined (dictionary.com) as “a feeling
of happiness, confidence, or well-being sometimes
5

exaggerated in pathological states of mania.” That’s exactly
how we see the current state of investor psychology in the
stock market. Of course, the greatest bull market of all time
has little, if any, room to run, and we’re not talking about
the rise from 2009. We’re talking about the Grand
Supercycle degree rise that dates all the way back to 1784.
According to the Wave Principle, bull markets are gauged
not by days and arbitrary retracement levels but by their
form and attendant psychology. The five-wave form of the
rise in the Dow Jones Industrial Average is clear, not just at
Grand Supercycle degree but also at Supercycle degree
from 1932. This next chart of the Dow shows the five-wave
form at three smaller degrees of trend—Cycle, Primary and
Intermediate—from 1974, 2009 and 2016, respectively. As
for the attendant psychology, the celebration of the
“Longest Bull Market in History” and the consensus that it
has “Room to Run” are perfect compliments to a peak of
such magnitude. “Bull markets don’t die of old age,”
concludes one business daily. True enough, they die of
extreme conviction and commitment. The sentiment
toward this one is so powerful that people chant the same
words in unison to express their faith in its persistence.
Buying Back the All-Time Top
Speaking of a striking lack of originality, corporate
buybacks, which have a long history of topping out with
major stock market peaks, are yet another sentiment
indicator registering new all-time highs. According to the
latest Goldman Sachs estimate, buybacks for 2018 will
exceed $1 trillion by the end of the year. The chart below
shows the total for the S&P 500 through the first quarter of
2018. The first peak reading occurred in the first quarter of
2000, coincident with a major top in stocks and the start of
the dot.com crash. It was then dwarfed by the level of
buybacks in the third quarter of 2007, when the major
averages were a few days from beginning the biggest stock
market decline since the 1930s. As The Global Market
Perspective noted in December 2017, companies are
“competing with investment managers and everyday
individuals in making a record commitment to stocks.” The
Theorist has also previously said that “company officers are
part of the market’s psychological fabric just like everyone
else, and they tend to become bold when things look good,
and that’s usually near a top.” By this measure, confidence
appears to be entering something of a blow-off. Goldman
Sachs reports that as earnings season restrictions on share
repurchases end, companies are piling into their own
shares. Share repurchases are surging 56% from a year ago,
says Goldman. Buybacks reputedly “pay” shareholders by
raising stock prices, but the chart shows us that this trade
always goes awry, eventually. Shareholders will soon rue
the buyback explosion and will wish they had instead
received hard cash in the form of dividends.
Bailouts Are Over: Let the Bailouts Begin
6
Last week, Greece “celebrated” the end of its “third bailout
rescue,” as the country announced that it will no longer
count on funds from European creditors. “After eight years
of economic turmoil, Greece can finally claim financial
independence.” But with an unemployment rate of 19.6%
and an economy that is 25% smaller than it was in 2010,
Greece is hardly an economic juggernaut. And this state of
affairs was “achieved” in the late stages of a global bull
market. Here, at the forefront of a new global bear market,
bailout lines are already forming, which is similar to what
happened with respect to the subprime bailouts near the
stock market peak of 2007. Angola, Pakistan, Indonesia,
South Africa and Brazil are already candidates for aid from
the International Monetary Fund.
The rescue effort started in June, when Argentina got $50
billion, the largest IMF bailout in history. And it’s already
falling behind. On Wednesday, Argentina asked the IMF
“to accelerate disbursements.” Yesterday, Argentina’s
central bank raised its benchmark interest rate to 60
percent, the highest in the world. “The external
environment has deteriorated since” the bailout was
announced, says the head of fixed income research at a
global investment firm. Turkey is likely the next candidate
for a bailout, as it is considered “more important and
possibly systemic than Argentina.” But Turkey illustrates
how much more challenging the bailout process will be this
time, as its leadership refuses to accept outside help.
Venezuela’s economy, a complete basket case, has a
political climate that makes it even less accessible than
Turkey. “Normally a country in such a state would turn to
the IMF for a bailout,” says The Independent (U.K.). “But
Venezuela broke off relations with the multilateral lender
of last resort in 2007, making any rescue very difficult.”
Pakistan is another bailout conundrum. The IMF is
considering an $8-to-$10 billion loan that would be at least
eight times as large as the country’s last bailout just four
years ago. According to various press accounts, it would
also be the 13th bailout of Pakistan in the post-World War
II history of the IMF. One complicating factor is that China
has already extended considerable loans to Pakistan, and
the U.S. administration fears that any bailout would only
“help China.” China seems willing to save Pakistan on its
own, but China will have trouble satisfying its own
considerable internal demand for bailouts, a topic GMP
discussed last month. The Nikkei Asian Review reported on
Monday that the volume of defaulting Chinese bonds
continues to surge. While larger, well-connected firms
receive a form of bail-out leniency on the part of Chinese
banks, smaller firms “must fend for themselves.” Since
January, more than 300 online lenders have collapsed, as
“banks reduced their supplies of working capital.”
Meanwhile, China’s selective approach to bailouts is
beginning to backfire, as it “is discouraging rational
investment that balances risk and return” and causes
“many business owner and others” to ignore “demands for
additional collateral.” Our prognosis is that the bailout
business will continue to boom until it is realized that the
demand cannot possibly be satisfied. After 40 years of
bailouts, it may take some time to reach that point.
The End Is Near; Buy More Stocks
Back in March 2000, GMP established an indicator that we
called the “uh-oh effect” based on this comment from At
the Crest of the Tidal Wave: “There are times in history
when the percentage of naive investors is so high that
occasional warnings from professionals are irrelevant to
net market psychology.... [It] is in fact normal behavior at
7

the biggest tops of all.” So, when Standard & Poor’s issued
a negative assessment for U.S. stocks at the 2000 market
peak, GMP stated, “We do not view this sentiment as a
contrary indicator,” as the warnings were largely ignored
even by the parties that issued them. The S&P declined 51%
from March 2000 to October 2002. Then, in May 2007, the
month that the financials peaked and a few months ahead
of the October 2007 top in the market’s main stock
indexes, GMP cited another “expression of the uh-oh
effect” and stated, “History reveals that these warnings are
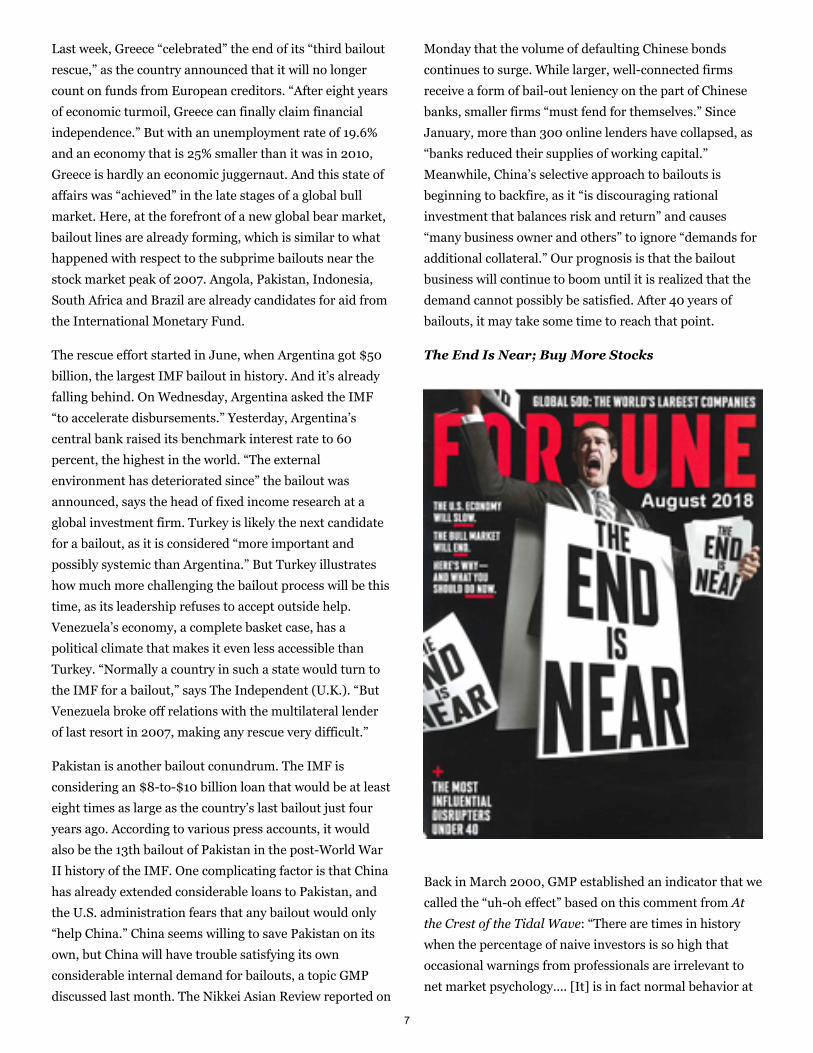
never taken seriously.” This August 2018 Fortune
magazine cover calling for a slowing economy and the end
of the bull market may mark the most magnanimous
issuance of the uh-oh effect to date. After laying out a
carefully articulated case for an oncoming recession,
Fortune’s editors conclude that the answer is to stay
invested in stocks, though some allocation adjustments
may be necessary. Specifically, it recommends a 50%/25%
split—not between stocks and bonds but between U.S. and
international stocks. “Consider selling some U.S. stock and
buying foreign ones,” says the article. “You’ll get more bang
for your buck.” Fortune’s blithe disregard for its own
analysis tells us everything we need to know: bullish
market psychology has seldom been more dominant.
European Chart
GalleryView Charts
European Stock
Markets
The FTSE Small-Cap Index of high-beta stocks peaked on
May 22, 2018, after essentially matching its January 12,
2018 high. The index then fell to 5,796 on August 15,
leaving behind a bearish double top, as the upper graph on
this chart shows.
The lower graph, meanwhile, depicts the FTSE AIM 100
Index, comprising the smallest of the small-caps that trade
on London’s Alternative Investment Market (AIM). The
index extended its 2018 rally, as prices bested both their
February and June peaks, pushing to an all-time high of
5866 on July 27, 2018. Investors’ movement toward
increasing risk is a more dramatic version of the same shift
that led to the stock market tops in 2000 and 2007. In
2000, it was a handful of unproven technology shares that
captured investors’ collective imagination. In 2007, the
real estate sector served the same purpose. On both of
those previous occasions, however, investors’ habituation
to above-average returns pulled them deeper and deeper
into the market’s obscure corners in search of even greater
returns.
Today’s topping process continues to draw inspiration
from those earlier two peaks, but it’s also adding numerous
new twists of its own. Real estate and technology have
definitely recaptured investors’ imaginations, but, at one
point or another over the past two years, so have
cryptocurrencies, financial technology (see Market
Psychology section), obscure credit products, emerging
market debt, and ultra-long dated bonds. Meanwhile, an
8

ever-shrinking handful of U.S. stock-market darlings —
namely Facebook, Amazon, Apple, Netflix and Google
(Alphabet), collectively known as FAANG —have
increasingly shouldered the burden of propping up the
NASDAQ and S&P 500, as the Elliott Wave Financial
Forecast and Elliott Wave Theorist discussed last month.
Our view is that investors are massively mispricing risk as
they move into smaller and smaller baskets of shares that
are still going up. This kind of behavior typifies a peaking
market.
But bear markets have not been eradicated, and investors
will soon relearn a critical lesson: Smaller, less-liquid
shares almost always suffer disproportionately during
market drawdowns, something that is especially true of
AIM-listed shares. Back in 2015, for instance, when the
Alternative Investment Market turned 20 years old,
London Business School professors Elroy Dimson and Paul
Marsh conducted a study of 2,877 AIM-listed companies.
Their now-famous research found that a hypothetical
investor would have lost money on 72% of those shares,
and, worse, that same investors would have lost a
catastrophic 95% of their investment in fully 30% of the
cases studied. In contrast, just 39 of the nearly 3,000
companies studied generated gains of 1,000% or more. In
other words, AIM shares attract gamblers searching for
large — but highly infrequent — payouts, which is why the
market is so useful as a gauge of investor sentiment. As one
commentator recently told the This Is Money.co.uk
website, investors on the junior bourse “are said to be so
short-term, they make goldfish look like memory experts.”
(8/18/18)
Here’s another colorful portrayal of AIM investing from the
Financial Times in 2014:
The Muppet Market in Numbers
For disappointment, dashed hopes,
false dawns, broken promises, under-
delivery and consistently dolorous
failure, there’s little to match AIM.
London’s junior market has proved
time and again to be a money pit.
— FT, 10/8/14
Despite the terrible odds of finding a winner, every mood
peak generates an influx of new investors who are willing
to try, and this time is no different. “Finding Winners on
AIM,” reads a typical headline on the website of a Bristol-
based financial services company. According to the article,
“smaller companies have the potential to deliver fantastic
returns for investors. Getting into companies early in their
listed life means you can be taken along for the ride as they
prosper and grow….”
This statement is true up to a point: Investing early in great
companies is a fantastic way to build stock-market wealth.
But how do you know if you are investing in a great
company? And beyond that, how do you know that you are
investing early within a stock market cycle? The Elliott
wave model is the best method we know of for answering
that second question, and, right now, the waves are
virtually screaming that the rally has reached its terminal
stage. As the broad market reverses, liquidity across the
small-cap markets will run dry, and the bottom will simply
fall out.
Elliott Wave Analysis
9

The stock market’s advance continues to narrow, with
many secondary indexes — such as the Spanish IBEX
Index, the Portuguese PSI Index, and the Italian MIB —
failing to keep pace with the blue-chip indexes in core
Europe. This graph, for example, is an updated version of
one we showed in the December 2015 issue. It shows a
critical and persistent divergence between the Euro Stoxx
50 index of blue-chip companies and the Stoxx EU
Enlarged 15 Index, which tracks shares in the 12 nations
that joined the EU since 2004: Bulgaria, Cyprus, Czech
Republic, Estonia, Hungary, Latvia, Lithuania, Malta,
Poland, Romania, Slovakia and Slovenia. While core
Europe has so far escaped the inevitable tug of contraction,
shares across the eastern bloc continue to drag down
overall performance. This divergence will not last forever.
As we have said before, Europe’s debt problem has not
been solved. Instead, it has been papered over with a host
of knee-jerk government reactions. A uniform bear market
will re-introduce the region to a host of economic crises, as
well as a concomitant round of political, cultural and social
upheaval.
Back in core Europe, stocks continue to closely follow our
recent analysis. The daily DAX chart updates the progress
of the index's downward stairsteps since it's all-time high
of 13,597 on January 23, 2018. As shown, Minor wave 1
bottomed at 12,003 on February 9, and Minor wave 2
topped at 13,204 on May 22. The best interpretation labels
the July-August price action as another series of first-wave
declines and second-wave countertrend rallies. This wave
labeling — which calls for an immediate and dramatic
resumption of the bear market — will remain valid unless
shares exceed 12,887, which is the July 27 high. Our near-
term analysis of the Stoxx 50 (not shown) is virtually
identical; a rally above 3,537 would turn our immediate
bearish opinion temporarily neutral.
Finally, Britain’s FTSE 100 has advanced in five waves
from its February 11, 2016, low of 5,500 to its May 22,
2018, high of 7,903. The rally lost momentum in wave (5)
compared to wave (3), as shown by the lower graph of the
Relative Strength Index. This is the typical profile that we
look for in an impulsive advance, and it suggests that the
index’s final high is already in place. So far, however, prices
have traced out a series of three-wave moves to the
downside, leaving the potential for a final rally to new all-
time highs intact. Either way, the market’s upside potential
is severely limited, as any advance should be repelled by
the upper boundary of the Elliott-defined parallel trend
channel that has governed the market for more than two
years.
10
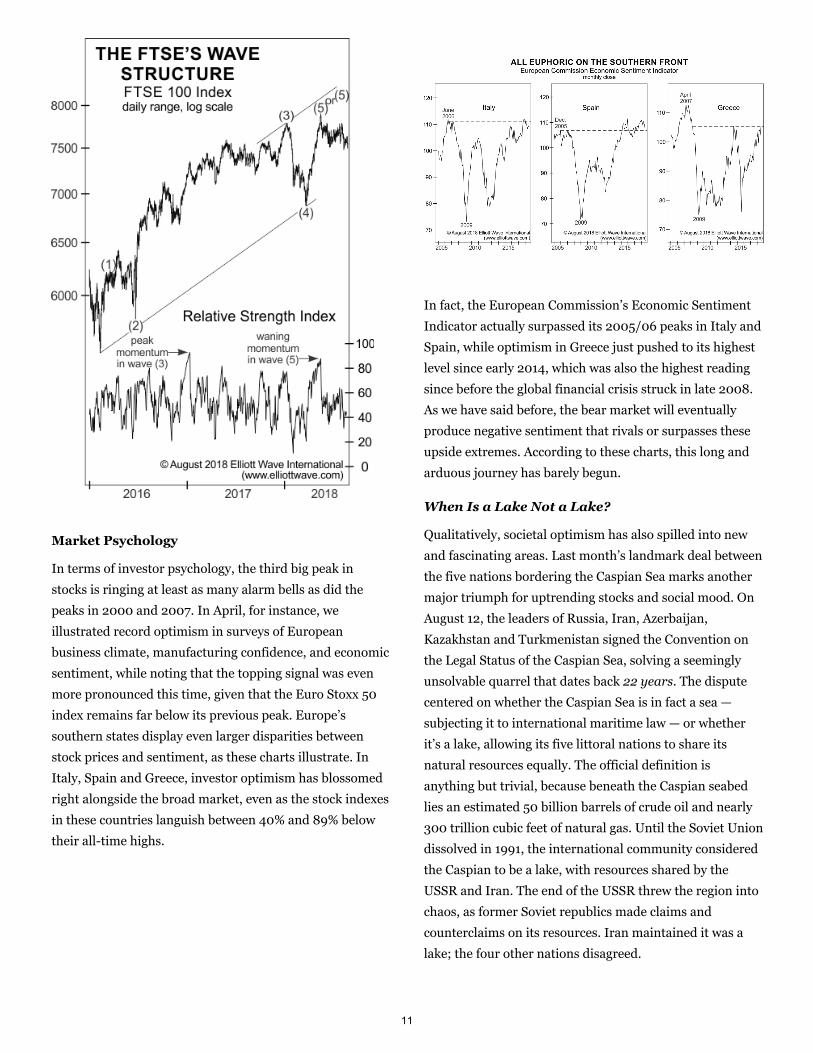
Market Psychology
In terms of investor psychology, the third big peak in
stocks is ringing at least as many alarm bells as did the
peaks in 2000 and 2007. In April, for instance, we
illustrated record optimism in surveys of European
business climate, manufacturing confidence, and economic
sentiment, while noting that the topping signal was even
more pronounced this time, given that the Euro Stoxx 50
index remains far below its previous peak. Europe’s
southern states display even larger disparities between
stock prices and sentiment, as these charts illustrate. In
Italy, Spain and Greece, investor optimism has blossomed
right alongside the broad market, even as the stock indexes
in these countries languish between 40% and 89% below
their all-time highs.
In fact, the European Commission’s Economic Sentiment
Indicator actually surpassed its 2005/06 peaks in Italy and
Spain, while optimism in Greece just pushed to its highest
level since early 2014, which was also the highest reading
since before the global financial crisis struck in late 2008.
As we have said before, the bear market will eventually
produce negative sentiment that rivals or surpasses these
upside extremes. According to these charts, this long and
arduous journey has barely begun.
When Is a Lake Not a Lake?
Qualitatively, societal optimism has also spilled into new
and fascinating areas. Last month’s landmark deal between
the five nations bordering the Caspian Sea marks another
major triumph for uptrending stocks and social mood. On
August 12, the leaders of Russia, Iran, Azerbaijan,
Kazakhstan and Turkmenistan signed the Convention on
the Legal Status of the Caspian Sea, solving a seemingly
unsolvable quarrel that dates back 22 years. The dispute
centered on whether the Caspian Sea is in fact a sea —
subjecting it to international maritime law — or whether
it’s a lake, allowing its five littoral nations to share its
natural resources equally. The official definition is
anything but trivial, because beneath the Caspian seabed
lies an estimated 50 billion barrels of crude oil and nearly
300 trillion cubic feet of natural gas. Until the Soviet Union
dissolved in 1991, the international community considered
the Caspian to be a lake, with resources shared by the
USSR and Iran. The end of the USSR threw the region into
chaos, as former Soviet republics made claims and
counterclaims on its resources. Iran maintained it was a
lake; the four other nations disagreed.
11

Of course, positively waxing social mood simply carves a
new path through political disagreement where none
existed before. According to Russian officials, the Caspian
will no longer be considered either a sea or a lake. Rather,
as the BBC reports the convention “gives the body of water
a ‘special legal status,’” with all five littoral nations sharing
common usage of the surface water. The resource-rich
seabed will also get divided up, an “important step in the
easing of regional tensions.” (BBC, 8/12/18)
Elsewhere, political relationships have also benefitted from
uptrending stocks. Last month, for instance, we noted how
difficult it has been for Britain to actually leave the
European Union, as Brexit supporters (that is, those who
support political dis-integration) now find themselves
fighting against a social mood uptrend rather than being
propelled by a social mood downtrend. U.S. President
Donald Trump’s on-again-off-again love affair with various
world leaders (see GMP, May 2018) also speaks to the
trend. At this point, the press has used the term
“bromance” to describe his affinity for French President
Emmanuel Macron, Russian President Vladimir Putin,
Canadian Prime Minister Justin Trudeau, Japanese Prime
Minister Shinzo Abe, North Korean dictator Kim Jong-un,
U.S. Senator Rand Paul, as well as singer-songwriter Kanye
West. In the past, lesser mood uptrends have produced
inseverable political bonds (think Ronald Reagan and
Margaret Thatcher). But only a mood peak of historic
proportions can account for the fact that one of the most
divisive U.S. presidents in history has managed to find
common cause with so many politicians around the globe.
Yes, We Have Been Here Before
The financial technology (fintech) sector is another
benefactor of society’s blooming optimism. Shown here,
the Global Fintech Thematic Index, which tracks the
performance of companies “disrupting existing business
models in the financial services and banking sectors,”
(www.indxx.com) has more than doubled over the past
two-and-a-half years. In terms of Elliott waves, fintech has
also traced out a picture-perfect five-wave impulse, putting
the index on course for a jaw-dropping setback. In fact, so
many mania symptoms plague the sector that the sell-off
could be catastrophic. Take, for instance, the soaring
valuations and ever-accelerating growth forecasts across
the industry. In one of the most potent signs of optimism
to date, Wirecard, a 19-year-old German payments
processor, just surpassed Deutsche Bank in terms of
market capitalization. Despite bringing in the equivalent of
only 5% of Deutsche Bank’s revenue, investors pushed
Wirecard’s share price north of 194 on Monday, giving the
company a market value of more than €21 billion. With
shares up more than 78,000% since their 2002 low, the
12

company will likely replace Commerzbank in the venerable
DAX index, which has been a member since the index’s
inception in 1988.
Shares of the Amsterdam-based fintech darling, Adyen,
have likewise soared. Up 43% since its June 2018 debut,
shares of the company are now valued at more than €16
billion. And Monzo will likely be the “latest European
fintech unicorn,” the term used to describe privately held
startup valued at $1billion or more. The British digital
bank is on track to complete a round of fundraising this
year that could give it a $1.5 billion valuation. Here, the
influx of new money seems entirely undeterred by the
company’s lack of profit. In fact, Monzo’s annual loss
quadrupled to £33 million in the 12 months to February
2018, according to the company’s latest annual report.
Meanwhile, total customer deposits stand at just £71.2
million, or less than £150 per account. According to Chief
Executive Tom Blomfield, Monzo seeks to turn a profit by
cutting customer support costs and increasing revenue
from lending. What he’s probably not accounting for,
however, is the inevitable drop-off in borrowing and
lending that will accompany widespread deflation.
Don’t get us wrong. The current model of state-supported
monopoly banks absolutely needs to be overhauled, and we
hope that one or more of these innovators can do it.
However, the revolution will probably have to wait until
well after the next bear market bottom, which could take a
decade or more.
Migraine Oncoming
In established sectors like pharmaceuticals, the bear
market is already fully established. When we last discussed
big pharma back in June 2015, global experts were
applauding a recent wave of mergers, acquisitions, buyouts
and ground-breaking financial takeovers. When the
Financial Times foresaw “no end in sight to the wave of
pharma dealmaking,” the June 2015 GMP countered that
these kinds of outbreaks almost always occur toward the
end of an uptrend. Our accompanying chart, “Little Bubble
in Big Pharma,” illustrated an even more dangerous mania
characteristic: an unsustainable parabolic curve in the
Bloomberg Europe 500 Pharmaceuticals Index. Here’s
what we said about its likely trajectory:
“Exponentially rising markets —
despite their inherent unsustainability
— never fail to attract throngs of
investors at the worst possible time….
[A] return trip back to the index’s
March 2009 low would imply a near-
70% crash from today’s prices. It
won’t happen overnight, but it will
probably happen quicker than anyone
expects.”
— GMP, June 2015
As it turned out, the index had already registered its all-
time high two months earlier. After a brief rally failed to
surpass the April 2015 peak, prices embarked on a
harrowing eight-month slide of more than 30%. In doing
so, they also decisively penetrated their parabolic arc, as
this updated chart shows. This move signals the end of the
manic period, but merely the start of a new bear market, as
the wave labels on the right show. The initial decline was
wave (A) of a broader correction, while wave (B) took the
13

form of a contracting triangle. If complete, the index stands
at the forefront of wave (C) down, which should be an
enduring slide that pulls price back to 175 at minimum.
One big clue that the worst is still to come is that despite
the early break in share prices, deal-making in the sector
has been slow to recede. According to New York law firm
White & Case, Big Pharma “continues to deliver large,
industry-shifting transactions,” with Sanofi’s acquisition of
Bioverativ ($11.1 billion) and KKR’s announced acquisition
of Envision Healthcare ($9.4 billion) being the two largest
deals so far in 2018. As we explained three years ago,
pharmaceutical deals provide especially useful gauges of
long-term sentiment, “because drug pipelines are
notoriously long and enormously expensive, and they are
riddled with potential pitfalls.” (GMP, June 2015) In other
words, the ability to close on these kinds of deals signals a
long-term wager by company executives that industry
fundamentals will remain robust. With pharmaceuticals
reversing course, these wagers have already begun to turn
south. In the first half of 2018, deals in the pharmaceutical,
medical and biotech sectors totaled just $65.4 billion,
representing a 31% year-over-year decline. So, even the
massive Sanofi and KKR deals could not upend the sector’s
waning activity as a whole.
Meanwhile, Bayer’s quick reversal of fortune illustrates just
how quickly investors may respond to the new mood. Less
than two months ago, Germany’s largest drugmaker
wrapped up its $63 billion takeover of Monsanto, the
widely maligned U.S. company that produces genetically
modified seeds. After immediately dumping the Monsanto
name, Bayer “expected the deal to boost its core earnings
per share in the first full year … and by a double-digit
percentage in the third year.” (Reuters, 8/13/18) The
company may still achieve those numbers, but stock
investors have not waited for the anticipated windfall, as
this chart shows. After markets closed on Friday, August
10, a California jury awarded $289 million to the plaintiff,
a former groundskeeper named Dewayne Johnson, who
argued that his terminal cancer was caused by Monsanto’s
popular weed killer, Roundup. When markets opened the
following Monday, investors dumped Bayer stock to the
tune of 11%, wiping away $11 billion of the company’s
market capitalization — or “37 times the value of the
14

damages,” as the Wall Street Journal calculated it. The
press overwhelmingly connected the verdict to the sell-off,
but as the chart of Bayer’s stock price reveals, prices
actually peaked alongside the broader pharmaceutical
sector almost four years ago. So, once again, the bad news
that purportedly caused a stock’s price to decline arrived
long after shares had already peaked.
Unfortunately, these after-the-fact rationalizations are as
costly as they are common. Rather than prepare investors
for what’s ahead, they merely explain away existing
circumstances, citing the appropriate news of the day. It’s a
bitter pill that mainstream analysts will never swallow, but
everything investors need to know about forecasting stock
prices is written into the waves already.
Asian-Pacific Chart
GalleryView Charts
Asian-Pacific Stock
Markets OverviewImagine, for a moment, that there was no U.S. trade war
going on, no deleveraging campaign in China, no crises in
Turkey or Argentina threatening contagion. In fact,
imagine that no significant negative news at all needed to
be considered—just reports of peaceful commercial activity
throughout the world. Even in such a utopian scenario,
Asian stocks this year would still have corrected their
strong advance in 2017 with a three-wave decline. Why?
Because that’s simply how financial markets behave. And,
furthermore, they now appear to have completed a three-
wave decline.
The MSCI Emerging Markets Asia Infotech Index
has been for years now the region’s relative strength leader,
supporting the larger uptrend. The index completed its
three-wave correction with an ending diagonal in the wave
(c) position. Elliott Wave Principle says that ending
diagonals usually give rise to a sharp, quick thrust back to
the start of the diagonal and, typically, much farther. If our
wave 9 count is correct, then the index should easily
exceed its January 2018 high. This high-probability pattern
in the infotech index points to opportunities in individual
infotech stocks, such as those we review this month in the
Chinese internet sector.
The three-wave decline in the broader MSCI Emerging
Markets Asia Index is also clear, although its wave (c)
took the form of an impulse. Ideally, the index will follow
the infotech index above its January 2018 high to complete
five waves up from 2016. But the depth of the correction—
which retraced almost 38.2% of the entire advance from
2016—raises another possibility: that wave 3 up ended at
the 2018 high, and therefore that the correction this year is
wave a of 4 down.
That scenario appears to be unfolding in some smaller
markets in the region, mainly in Southeast Asia, where the
percentage declines were larger than most. The major
indexes in Vietnam, Thailand and Indonesia completed five
waves up at their 2018 highs and then three waves down,
and so may have the major indexes in Singapore and
perhaps even Hong Kong (see Hong Kong/Singapore).
Those three-wave declines mean that the wave b rallies
15

should retrace all or almost all of the wave a declines.
Toward the end of the regional rally, we will expect to see
some markets fail to confirm the new highs in others,
setting up bearish divergences, and the Southeast Asian
markets would seem to be good candidates to watch for
such signals.
Several indicators of sentiment provide support for a low
now. The Tokyo Stock Exchange short-sell ratio nearly
reached a record high in mid-August (see Japan). Also, in
early August short interest as a percentage of outstanding
shares in the iShares MSCI Emerging Markets ETF nearly
matched the 15% level it reached at the 2016 low,
Bloomberg reported on August 22 based on IHS Markit
data. And Sentix’s survey of private investors regarding
their six-month economic outlook for Asia Ex-Japan also
nearly matched its early 2016 extreme. That level of
pessimism approximately matched the level reached ahead
of the 2011 lows, but it also matched the level the indicator
hit just before the October 2008 crash.
Could a collapse occur at the current juncture, with
sentiment depressed and bad news hitting the headlines
daily? Anything is possible in the markets, but we believe
the depressed sentiment supports the bullish outlook
indicated by the relative strength and the ending diagonal
in Asia’s infotech sector. Also, markets are not falling in
unison, as usually occurs ahead of big declines such as
those that occurred in 2008, 2011, and even 2015. Chinese,
Hong Kong and Korean stocks—the heavy lifters in MSCI’s
Asia indexes—may have recently hit new correction lows.
However, Indian and Australian stocks—as well as those in
other parts of the world—have recently hit new 52-week
highs.
So, let’s look at China and the opportunities in its overseas-
listed internet sector now.
ChinaThe Shanghai Composite fell to within a percent of
undercutting its 2016 low and has since rallied. Like other
major indexes in the region, the Shanghai index has so far
declined in three waves from its January 2018 high. If the
index were to rally from here with other regional indexes,
the advance would likely retrace nearly all the decline. But,
16

if the index were instead to continue declining, it would
probably complete five waves down. Either way, the index,
which still trades 55% below its 2007 high, may remain
chronically weak, because it is ultimately headed much
lower within wave C down of its wave IV contracting
triangle.
The Shanghai Financials Index has held above its June
lows while the Shanghai Composite fell to new correction
lows in August. The resulting divergence should eventually
support a rally in mainland shares.
Sentiment considerations
“The Chinese government always oscillates between
maintaining stability and achieving quality growth.
When you see the government switch to stimulus, it
generally means the government cares about
stability.”— Hong Kong University economist quoted
on Bloomberg on August 23, 2018
This insightful comment about Chinese government
behavior is in fact true universally, although it is perhaps
more visible in China because the government exercises
strong control over the economy. Governments around the
world tend to intervene in their economies at times of
instability or uncertainty, which they generally tend to
perceive after significant stock corrections. That’s why
crackdowns, stimuli and other interventions can often act
as bottoming signals for stocks, as our August 2015 study
of government interventions in Asian stock markets
pointed out (see charts here).
Following that logic, various anecdotes appear to suggest
that sentiment is extreme, which may support a low. After
the Chinese government spent most of the past few years
reducing leverage, in late July it began implementing
various stimulus measures, such as restarting stalled
infrastructure projects, encouraging banks to lend to
exporters and small and medium-sized businesses, and
proposing to let banks keep almost unlimited holdings of
local government bonds without including them in stress-
test calculations.
Even though sentiment does seem severe, one objective
indicator with a relatively reliable track record of calling
lows has yet to signal a negative extreme: New investors in
China continue to open brokerage accounts weekly at a rate
much higher than the 200,000 level that has typically
marked lows in the past. That investing behavior suggests
that the market has been sliding down a “slope of hope”
and that the August lows will eventually be exceeded as
wave C down continues.
Overseas Chinese internet stocks
Alibaba, ZTO Express and Baozun
The biggest Chinese internet company of all, Alibaba, may
have ended a fourth wave at its August lows. Its long
sideways price action has probably helped the MSCI EM
Asia Infotech Index to maintain its relative strength (see
Overview). The shares of two U.S.-listed Chinese e-
commerce companies that are dependent upon Alibaba,
delivery service ZTO Express and online store facilitator
Baozun, also appear to be ready to rally soon.
17

Huya and iQIYI
Our July 2018 issue identified four recent IPOs that had
rallied strongly in five waves and then begun corrections.
Those corrections have since revealed the strongest of the
four: midcaps iQiyi, the so-called Chinese Netflix, and
Huya, a livestreaming gaming platform comparable to
Twitch. Both stocks have since traced out double zigzag
corrections, and Huya shares turned up near the 61.8%
retracement of its wave (i) up, which may support the end
of wave (ii). But double zigzags can easily morph into triple
zigzags, so more cautious investors may wish to wait and
see whether the stocks can first rise above their July 2018
wave x highs, which would invalidate the triple zigzag
scenarios and raise the odds that the corrections have
ended.
Momo and YY
Two other high-growth midcaps capitalizing on China’s
livestreaming boom have also traced out bullish patterns:
Momo, a live entertainment platform that also owns a
dating app comparable to Match.com’s Tinder, and YY, a
competitor entertainment platform that owns a controlling
stake in Huya (see above). Since their IPOs, the two stocks
may have traced out a series of first and second waves and
have now begun third-of-a-third-wave advances.
18

JapanThe Nikkei 225 continues to rise in wave 0 of (3) up. An
alternate but still bullish count is that the index is now
ending a fourth-wave contracting triangle from its 2018
high (not labeled). Another near-record extreme in the
Tokyo Stock Exchange short-sell ratio and another bounce
off the lower channel line provide support for both
scenarios.
The behavior of foreign investors may also support a rally:
Foreigners have dumped $34.7 billion worth of in Japanese
equities so far in 2018 in the “biggest exodus in more than
three decades,” Bloomberg reported on August 28. After
the prior outflow extreme, following the 1987 crash,
Japanese stocks rallied for two more years before ending
their bull market.
IndiaThe Nifty 50 Index continues to rally in wave 0 of 3 up.
The Nifty Next 50 Index and the iShares MSCI India
ETF provide support for continued rally in the Nifty 50
because their wave 0 advances have not yet exceeded their
wave 8 highs. Once they do, we will consider prospects for
an end to wave 3 up.
19

Pharma stocks
With the Nifty hitting new all-time highs for weeks, the risk
has risen for sectors that have already advanced strongly.
Now could be a good time then to consider an out-of-favor
sector, such as pharmaceuticals, which only recently ended
its correction that began in 2015. Our research turned up
two stocks, Shilpa Medicare and Granules India, that
have each begun fifth waves up within impulsive advances
from their 2008-2009 lows.
The USD/INR has remained weaker than other currency
pairs against the U.S. dollar (for example, see AUD/USD
section). That may mean that wave 0 up is extending or,
following the alternate count, that the rate has already
begun a larger impulsive advance.
20

AustraliaThe ASX Midcap 50 Index and the All Ordinaries
continue to rise in wave (3) up. If the midcap index were to
fall below the channel to 6,800, then it would probably
mean that wave 3 of (3) up already ended. The uptrend line
drawn from the 1974 low should cap any additional rally in
the All Ordinaries. The line runs through 6,750 in late
September.
The a2 Milk Company
While studying at Cambridge University in the year 2000,
Corran McLachlan learned that the A1 protein in
conventional cow milk affects some people negatively. He
then learned of a way to identify cows that produce milk
free of the A1 protein and contain only the A2 variety,
which more people can tolerate. From there, the A2 milk
revolution began, with the founding of The a2 Milk
Company in New Zealand.
Sales have since rocketed, taking a 10% share of the
supermarket milk market and a 32% share of the infant
formula market in Australia. More recently, the company
has expanded its sales in the United States and China, its
fastest-growing market.
Since the stock’s IPO in 2015, the company’s shares are
tracing out an impulsive advance and they have now begun
wave 5 up of that advance.
21

The AUD/USD fell to new lows within its wave B
correction but has since rebounded quickly. Lingering
negative sentiment as measured by the Australian Dollar
Daily Sentiment Index may support a rally now. But the
more reliable indicator may be the intraparty coup that led
to the removal of yet another Australian prime minister on
August 24. See Cultural Trends for the story.
Hong Kong and
SingaporeThe Hang Seng Index ended three waves down near the
B-D line of its wave IV triangle. As noted in the Overview,
the index’s decline may represent an initial leg down within
a correction, as the decline in the Straits Times Index
probably does. The Singapore index has been much
weaker, having fallen below its B-D line and turned down
from resistance at the underside of its wave (1) trend
channel. Both indexes should rally along with other
regional markets, but their upside could be limited to
around their 2018 highs for a while.
China strikes back at a low
Negative mood in the wake of the wave IV correction in
Hong Kong inspired the founding of two secessionist
organizations in early 2016, as our July 2016 issue reported
. The largest correction in the Hang Seng Index since
that time now appears to have inspired China to strike
back. Hong Kong’s security bureau has threatened to ban
one of the parties, the Hong Kong National Party, on
national security grounds—a prospect that has sent chills
down the spine of free-speech advocates in the territory.
The party has until September 11 to submit arguments
against the ban.
“Why are they so heavy-handed and using a sledgehammer
to crack a walnut?” a pro-democracy lawyer asked the
Washington Post on August 11. He then answered his own
question: because they want to “nip the movement in the
bud [and] test the temperature of the public to see how
they would react to legislation being enacted.” Probably,
but, for our purposes, the timing of the crackdown suggests
a negative mood extreme, which supports a low in Hong
Kong stocks.
Valuation
22

Valuations have fallen considerably in many markets
during the correction. One of the more reliable valuation
measures in the Asian-Pacific region has been the Hang
Seng Property Index’s price-to-earnings ratio. The ratio
recently hit 5.5, a level that has preceded significant rallies
several times in the past 20 years and may again support a
rally in Hong Kong. A caveat, though: The signals in 1998
and 2015 preceded sharp rallies, but prices eventually fell
to lower levels before bottoming.
Chinese oil giants
Patterns in the shares of two Chinese oil giants traded in
the United States and Hong Kong, China Petroleum &
Chemical and CNOOC, point to significant upside over
the intermediate and long terms. Since their 2008-2009
lows, the two stocks have traced out a series of first and
second waves. (CNOOC’s alternate count shows that the
stock may have ended a wave (4) triangle in 2017).
In addition, the pattern in China Petroleum from 2007 to
the present looks like one at smaller degree from 2004 to
2006, after which the stock exploded higher in the early
stages of a fifth wave up. That fractal similarity may mean
that the advance from the 2008-2009 lows in both stocks
is also a fifth wave—at one larger degree.
South Korea and
TaiwanLike the correction in Hong Kong’s Hang Seng Index, the
KOSPI’s correction is deep, perhaps too deep to be a
fourth wave of Minute degree. Therefore, the alternate
count shows it may instead be wave a of 4 down. The
Taiwan Index may have completed a wave 9 contracting
triangle.
23

GLOBAL INTEREST RATES
Fixed Income Chart
GalleryView Charts
Interest Rates
Around the WorldU.S. Treasury yields remain in a rising trend that should
carry higher still. Short term, a record net-short position in
10-year T-notes may mean a countertrend bounce in prices
(decline in yields) prior to the onset of the next wave
lower.
Global bond markets continued to show signs of fracturing
during August. The yield on the Bloomberg Barclays Global
Treasury index, an aggregate of global government bonds,
was unchanged on the month. However, global aggregate
credit underperformed marginally and, after recovering in
July, emerging market bonds took another bath in August.
Turkey led the underperformance, crashing in the first half
of the month, with the yield on its 5-year U.S. dollar bonds
rising from 6.5% to over 9% as investors fled.
The Bond UniverseAn advance in Intermediate degree wave (3) remains the
modus operandi for the yield in our Bond Universe (the
Bloomberg Barclays Global Aggregate index). And, fixed
income savers should be increasingly pleased with higher
yields well into 2019. We expect the baseline since 2016,
currently hovering around 1.74%, to provide support for
any pullback in yields.
You can track the movement of the Bond Universe index,
as well as many more including corporate sectors and
junk bonds, with our Bond Market Monitor in the Interest
Rates section of Pro Services
(https://www.elliottwave.com/Trader-Analysis/Pro-
Services).
Special Section - The
Crisis in TurkeyYou can’t extrapolate too much from
Turkey; when you look across
emerging markets, it’s very much the
exception rather than the rule.
— Emerging Markets Fund Manager,
Citywire.co.uk, 8/17/1824

Turkey’s currency and credit crisis remains contained for
now; however, the idea that financial authorities can stop
credit contagion will probably generate more investment
losses over the next decade than any other market myth. In
Europe alone, credit contagion has jumped the proverbial
firebreak at least half-a-dozen times over the past decade,
spreading initially out of Ireland and Greece and into
sovereign bond markets in Portugal, Italy, Spain and
Cyprus. In corporate debt, meanwhile, the credit crunch
has bankrupted at least as many European banks. As we
regularly document, debt is the one bubble that holds up
every sector of the mania, and governments actually stand
least prepared to deal with the inevitable contraction.
Turkey represents the latest iteration of this slow-moving
tragedy, and, once again, most experts whose job it is to
spot problems ahead of time got taken by surprise. In fact,
as 10-year Turkish yields soared past 20% and the lira
plummeted against the dollar, the New York Times found
just one analyst — a “soft-spoken Englishman who eschews
financial television and social media” — who anticipated
Turkey’s credit crises.
Turkey’s Financial Crisis
Surprised Many. Except This
Analyst
For the past seven years, Tim Lee has
been warning that a financial crisis in
Turkey would set off a wider calamity
in global markets. Just about nobody
listened — until now.
— NYT, 8/11/18
The article indirectly captures an important truism about
professional market analysis: At major market turning
points, the accuracy of an analyst’s financial opinion is
almost always directly proportional to the scarcity of
people listening to it. In fact, our own warnings about
Turkey have fallen on deaf ears since at least February
2014, when we argued that the country’s “burgeoning
financial crisis is steadily transitioning into a political one.”
We updated subscribers on the situation in October 2014
and again in January 2015. By February 2017, the bear
market had foisted itself upon society with spates of deadly
terrorist attacks, a failed coup attempt by factions of the
military, and the temporary suspension of human rights
under the European Convention on Human Rights. “Right
on cue,” we wrote in the February 2017 GMP, “political and
cultural chaos have caught up to the country’s financial
decline.”
Just three months later, the snowballing crisis compelled
us to double down on our bearish message. Identifying
Turkey — along with South Africa and Russia — as “three
more ticking time bombs investors should watch closely,”
the May 2017 GMP illustrated Turkey’s widening 10-year
bond spread with Germany and directly stated, “Turkey is
at risk of a new credit crisis.” The warning arrived just in
time. The chart shows that credit spreads immediately
transitioned from gradually widening to dangerously
spiking. More important, this three-panel chart captures
the aftermath in terms of the country’s stock, bond and
currency markets. As the iShares MSCI Turkey ETF (left
panel) crashed 50% since our warning, the country’s 10-
year bond yield (middle) more than doubled, and the
Turkish Lira (right) plunged 50% against the U.S. dollar.
Financial forecasts don’t always work out this well, but,
when they do, the profits can flow fast and furious.
25

Of course, now is not the time to rest on one’s laurels. One
good way to tell if a crisis is ending or beginning is to gauge
the financial community’s reaction to it. At this point, every
new crisis seems only to strengthen the resolve that it will
be the last. As Turkish markets slipped, one analyst told
CNBC, “I don’t expect any euro zone country bond yields to
really suffer due to Turkey.” (8/10/18) Another credit
strategist said that “Turkey will be a small component of
European company profits with no specific name standing
out as overly exposed.” The Financial Times quickly added
its own headline: “Turkey contagion fears are overblown.”
(8/14/18)
These bullish kneejerk reactions — as well as analysts’
willingness to explain away credit deflation — stems from
the lingering influence of a Supercycle degree trend toward
positive social mood. In fact, the few analysts who didn’t
downplay the risk of contagion immediately began
searching for upside opportunities. Here was the consensus
crisis reaction, as Reuters described it:
Emerging Market Fund
Managers Hunt For Bargains
After Turkey Contagion
Turkey’s economic crisis has created
headaches for investors and
policymakers across emerging
markets, but for some fund managers,
it’s a chance to pick up a range of
cheap assets, from Indonesian bonds
to Brazilian equities.
— Reuters, 8/27/18
This immediate buying in the face of crisis never
signals a long-term bottom. And what most
analysts refer to as contagion is really just an
aggregate shift in investor psychology away from
risk-seeking strategies and toward risk aversion.
The problem is, once psychology shifts in this
way, fearful investors don’t waste time dissecting
which are their potentially vulnerable assets;
instead, they dump them all on the market en
masse. As we describe in the stock market
section, Europe’s eastern bloc nations are
especially susceptible to contagion right now.
Ultimately, however, these deflationary credit
conditions will work their way back through
southern Europe and infect the core European
nations of France and Germany — nations that
almost everyone currently believes to be
immune.
U.S. Treasuries
Pop quiz: What do these economically noteworthy
countries have in common: Germany, France, Switzerland,
Japan, Austria, Portugal and the Netherlands? Answer:
Nine years into a global economic expansion, their two-
year government debt still carries a negative yield. If an
investor wants to be guaranteed to lose money safely,
26

owning the two-year government debt of these countries
will do the trick. The reality is that negative bond yields
reflect the intensifying deflationary pressures of a global
economic stagnation that will eventually morph into an
outright contraction.
The bear market in U.S. 10-year T-notes and 30-year T-
bonds started in July 2016, when the yield on each reached
a record low of 1.318% and 2.088%, respectively. The yield
on U.S. 2-year T-notes, however, started rising nearly five
years earlier, in September 2011, after it reached a record
low 0.143%, as shown on the chart. The rise appears well
on its way of reaching an initial target range at 3.123% to
3.346%, which represent the extremes of two previous
fourth waves of lesser degree.
As for 10-year U.S. T-notes, Large Speculators have built a
massive net-short position in the number of futures
contracts, betting to a record degree that prices will decline
and yields will rise from current levels. Usually, but not
always, a record net-short position implies a price rise, as
Large Specs are often caught in large wrong-way bets at
trend reversals. A rally in T-note prices may occur in the
near term, but the long term trend in prices is lower and
yields higher. The Short Term Update is watching the wave
development closely and will keep readers apprised about
the next wave of the ongoing bear market.
European and Asian-
Pacific Interest RatesEuribor
Our wave picture remains unchanged. We continue to look
for wave 2 to peak near 100.420, the 78.6% retracement of
wave 1. A fresh wave of decline to new lows should then
follow. The prior fourth-wave low near 99.120 remains a
reasonable downside target.
German 5-Year Bond Yield
In August, Germany's 5-year yield completed a small-
degree correction near -14 bps and then dipped to a two-
month low of -35 bps. This keeps the focus on the
downside for lower yields and higher bond prices in Minor
wave 3. Overcoming support near -44 bps is a key
objective. Trade below that level opens the doors for a
larger decline toward new all-time lows. Wave 3 would
achieve a 2.618 multiple of wave 1 near -64 bps.
German 10-Year Bond Yield
Unlike the German 5-year, the German 10-year remains
contained in a sideways range. Eventually, yields should
break down and attempt to take out the early-June low of
19 bps.
27
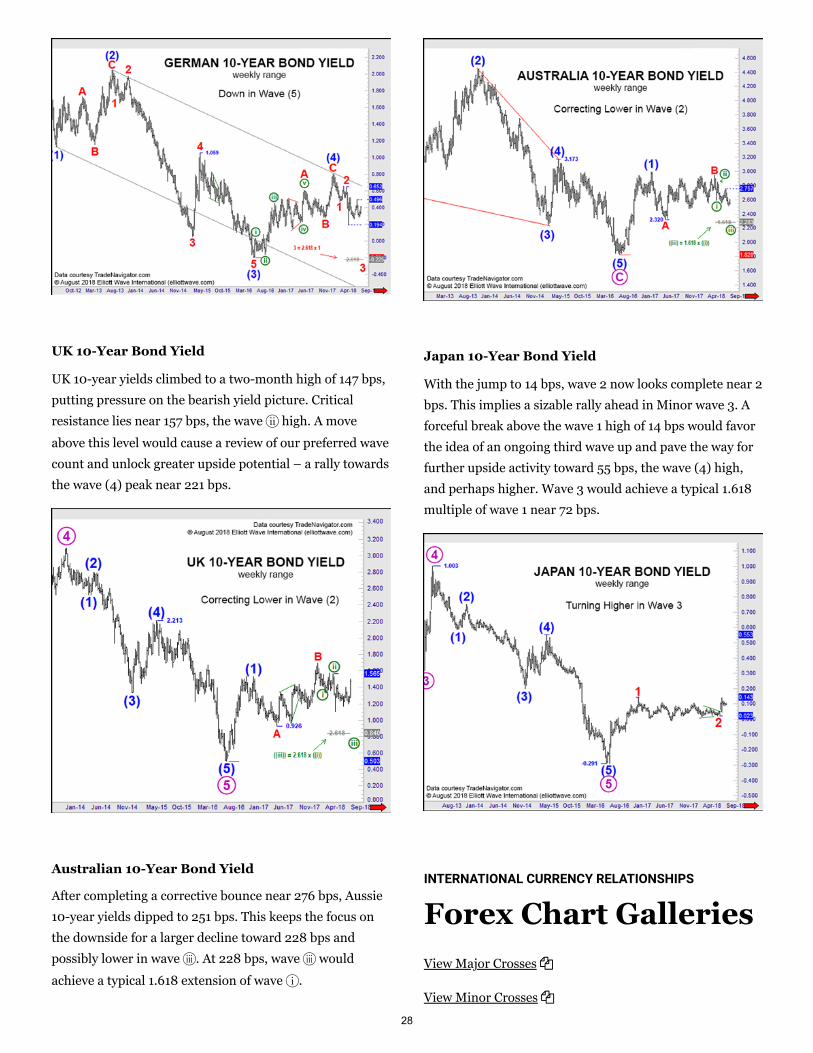
UK 10-Year Bond Yield
UK 10-year yields climbed to a two-month high of 147 bps,
putting pressure on the bearish yield picture. Critical
resistance lies near 157 bps, the wave 7 high. A move
above this level would cause a review of our preferred wave
count and unlock greater upside potential – a rally towards
the wave (4) peak near 221 bps.
Australian 10-Year Bond Yield
After completing a corrective bounce near 276 bps, Aussie
10-year yields dipped to 251 bps. This keeps the focus on
the downside for a larger decline toward 228 bps and
possibly lower in wave 8. At 228 bps, wave 8 would
achieve a typical 1.618 extension of wave 6.
Japan 10-Year Bond Yield
With the jump to 14 bps, wave 2 now looks complete near 2
bps. This implies a sizable rally ahead in Minor wave 3. A
forceful break above the wave 1 high of 14 bps would favor
the idea of an ongoing third wave up and pave the way for
further upside activity toward 55 bps, the wave (4) high,
and perhaps higher. Wave 3 would achieve a typical 1.618
multiple of wave 1 near 72 bps.
INTERNATIONAL CURRENCY RELATIONSHIPS
Forex Chart GalleriesView Major Crosses
View Minor Crosses
28
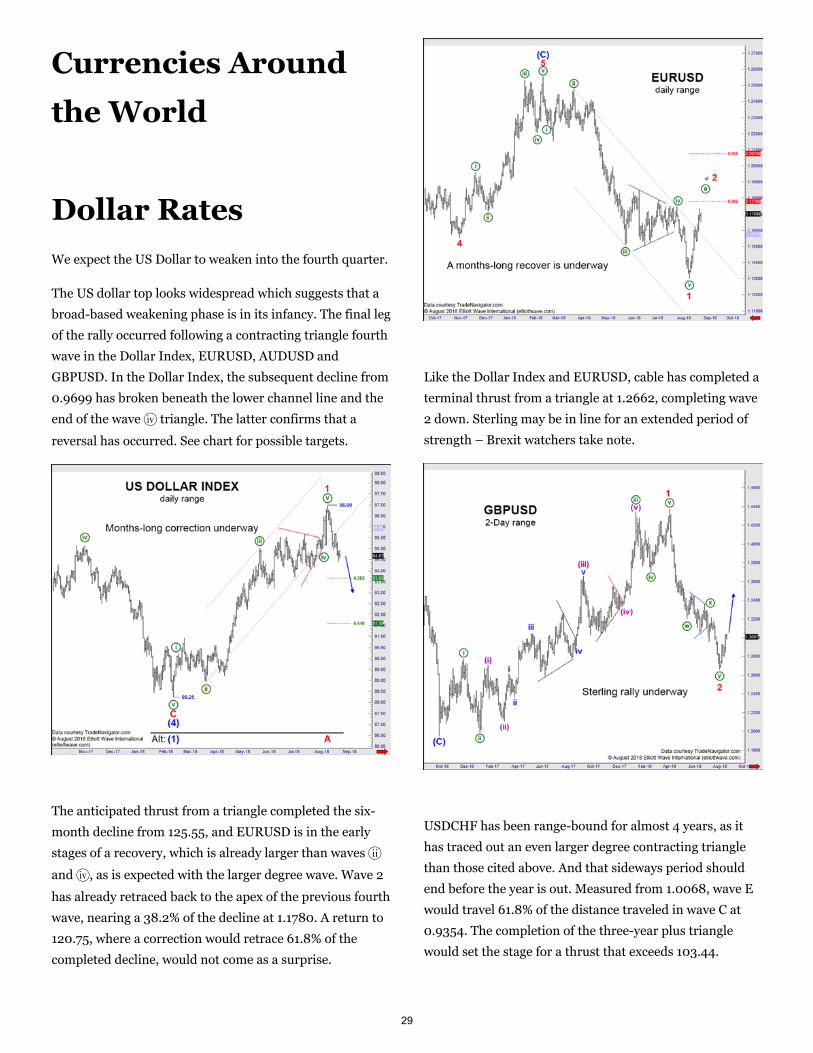
Currencies Around
the World
Dollar RatesWe expect the US Dollar to weaken into the fourth quarter.
The US dollar top looks widespread which suggests that a
broad-based weakening phase is in its infancy. The final leg
of the rally occurred following a contracting triangle fourth
wave in the Dollar Index, EURUSD, AUDUSD and
GBPUSD. In the Dollar Index, the subsequent decline from
0.9699 has broken beneath the lower channel line and the
end of the wave 9 triangle. The latter confirms that a
reversal has occurred. See chart for possible targets.
The anticipated thrust from a triangle completed the six-
month decline from 125.55, and EURUSD is in the early
stages of a recovery, which is already larger than waves 7
and 9, as is expected with the larger degree wave. Wave 2
has already retraced back to the apex of the previous fourth
wave, nearing a 38.2% of the decline at 1.1780. A return to
120.75, where a correction would retrace 61.8% of the
completed decline, would not come as a surprise.
Like the Dollar Index and EURUSD, cable has completed a
terminal thrust from a triangle at 1.2662, completing wave
2 down. Sterling may be in line for an extended period of
strength – Brexit watchers take note.
USDCHF has been range-bound for almost 4 years, as it
has traced out an even larger degree contracting triangle
than those cited above. And that sideways period should
end before the year is out. Measured from 1.0068, wave E
would travel 61.8% of the distance traveled in wave C at
0.9354. The completion of the three-year plus triangle
would set the stage for a thrust that exceeds 103.44.
29

A multi-year triangle is also nearing its end in USDJPY.
Starting from nearby the existing high at 113.16, wave (E)
should end after three waves and above the wave (C) low at
104.62. The completion of the triangle underway since
June 2015 will set the stage for a thrust higher that exceeds
125.85. The wave (E) decline would reflect the anticipated
US Dollar weakness.
The three-wave decline from 1.4690 to 1.2061 delivers a
bullish message, but a wave B correction of the subsequent
leading diagonal wave A might sink to 1.2565 where it
would retrace 61.8% of wave A. A setback here is also in
line with our general outlook for US dollar.
The Aussie Dollar also supports our outlook for a weak US
dollar. Look for a sharp rally in AUDUSD in coming
months.
Other RatesThe Euro is starting to outperform against many of the
crosses we follow. The Swiss franc is also doing well, still
outperforming the Euro and Sterling impressively. Sterling
and Aussie continue to struggle against the Yen.
EURGBP is breaking above the band of resistance we
highlighted last month circa .90. We have raised key
support to 0.8949 and remain focused on a target of30

0.9241, where wave D = .618 x wave B, a common
relationship within triangles.
The impulsive nature of the decline from 1.1714 supports
our forecast for wave 8 down. Breaking below 1.1244 and
out of wave (A)'s corrective price channel will further
support this forecast.
Given the three-wave structure of wave (a), and using
1.5580 as key support, we are looking for wave (b) to retest
if not exceed the wave 6 high. Also, at 1.6193, wave c = a
within wave (b), a common wave relationship within a
zigzag. If EURAUD breaks decisively above wave 6, it will
likely have broken outside the corrective price channel for
wave (b), so we will have reason to suspect that wave 7 has
already ended. Note to wave students: An expanded flat
wave 7 remains a possibility with a cluster of targets near
1.65. We can address that further if it becomes necessary
based on price action and structure.
The impulsive nature of the decline from 1.5586 has us
favoring that wave (c) is underway, potentially the final
wave within the larger degree wave B triangle. Therefore,
we are on high alert for the triangle to end, with targets for
its completion located at 1.4719 and 1.4350.
31

This month in EURTRY, we have raised key support to
6.4910, looking for a push above 8.1146 to complete a
series of fifth waves.
EURNOK's decisive breakout above wave 2's corrective
price channel supports the call for a third wave advance.
We have raised key support to 9.4906 and expect the
market to rally well above the wave 1 high at 9.9934.
Wave 2 is still unfolding; we anticipate it will end between
the .618 and .786 Fibonacci retracements of wave 1. Once
the low is in place, expect EURPLN to move swiftly
through 4.4140.
We are raising key support to 1.7118, and the focus remains
on higher in wave 5. A target zone comprising two common
relationships for wave 5 is located between 1.8274 and
1.8392.
Using 124.90 as key support, our focus remains on higher
in EURJPY, however, we have adjusted the wave labeling
to favor the advance from 109.57 is wave (D) of a triangle.
Wave Z is expected to unfold as a zigzag, and our target for
wave (D) is 143.96, where it will equal .618 times wave (B).
32

The wave b triangle we have been monitoring can be
counted as complete at 83.25. Against this level, our focus
is on lower in wave c. Wave c must unfold in five waves
and may end up tagging the rising trendline circa 77.50.
If GBPJPY is coiling in a series of ones and twos lower, we
expect wave 2 will run into stiff resistance at the upper
boundary of the price channel. From a wave 2 peak, favor
an accelerated move lower in a series of third waves with
sights set in the low 130s, circa the 1.618 Fibonacci
projection for wave (iii).
Lower key resistance to 1.3053, allowing for more
weakness in wave 8 of C. Breaking out of wave B's
corrective price channel supports the bearish forecast; the
next hurdle is the wave X low at 1.2221.
METALS & ENERGY
Metals and Energy
Around the World
33

Gold and silver are due for rallies. The significance of
Crude Oil's early-July peak is still an open question.
Natural Gas took a bullish first step.
Gold & SilverThat gold rally that GMP has forecast seems to be
underway. Last month our discussion centered around the
bearish sentiment that had reached record levels. The deep
pessimism toward gold’s prospects was keenly reflected in
these Bloomberg headlines:
Usually, when dispassionate reporters use colorful
language such as “Rout,” “Carnage” and “Give Up Hope” to
describe a market move, it can be as strong a sentiment
signal as more quantitative measures. In the middle of this
exposition on gold’s inherent weakness, on August 16, gold
made a low at $1167.10, which completes Minor wave C of
Intermediate wave (B). As noted last month, wave (B) is
taking the form of a barrier triangle (see text, p.49). The
rally since August 16 is the early stage of Minor wave D, an
advance that should carry to the $1300-$1350 range before
it terminates. Gold should then decline in wave E to
complete the triangle pattern and Intermediate wave (B).
The alternate count is that wave (B) is tracing out a flat
pattern (see text, p.45) instead of a triangle, in which case
gold would decline to modestly below $1123 to complete
the Intermediate-degree pattern and then start a multi-
month advance. The long term gold chart and the idealized
schematic next to it show where gold currently resides in
the progression of its structure. GMP and GMP have been
steadfast in our stance that gold remains in a phase of
partial recovery within an overall bear market. While the
countertrend advance is not complete, we show the long
term chart to place the current juncture in its proper
context. There will arise a historic, ultra-low-risk
opportunity to own gold as a cornerstone of one’s long
term investments, but that point in price and time is not
now.
Another strong sign that the precious metals are now at the
forefront of a near-term advance is seen on this next graph,
which shows the price of gold and silver since September
2016. Oftentimes at significant trend reversal points, gold
and silver will fail to confirm each other’s extreme prices.
Observe the rally in gold from December 2016 to January
2018; silver made a series of lower highs relative to gold’s
advance, failing to confirm gold’s rise. Sentiment reached a
bullish extreme on January 25 of this year, when the Daily
Sentiment Index jumped to 91% gold bulls (trade-
futures.com). At that point, gold started its largest selloff
since the July-December 2016 decline. At the recent
August lows, a 20-month non-confirmation existed
between silver, which made a series of lower lows from
34

December 2016, and gold, which remained above its
December 2016 low. The Daily Sentiment Index, formerly
at 91% bulls at the January high, declined to just 6% gold
bulls and 7% silver bulls, as shown on the chart. The weight
of evidence remains near-term bullish for the metals.
EnergyCrude Oil
August's price action adds little new to the picture. If a
significant top is in place, WTI should stay below 71.29 —
the prompt month October contract's high comparable to
75.27 on the continuation chart, and trend on down in
third-wave fashion. A solid break below the bottom end of
the weekly uptrend channel should strengthen the bearish
case. A rally past 71.29, however, would tilt the odds
towards a more prolonged advance.
Natural Gas
The rally above the B-D trendline in August provides the
initial hint that triangle wave (B) ended at 2.704 and that
an important seasonal low is in place. If so, the market
should ratchet higher in an impulsive manner. Any backing
and filling should prove corrective and set the stage for
further advance. The next big hurdle to cross is the 3.053
wave D peak, which would also be a new 2018 high for the
prompt month October contract (currently 3.025).
ECONOMIC, MONETARY, AND CULTURAL TRENDS
Economic Chart
GalleryView Charts
U.S. Economy &
Deflation
35

Back in March 2013, GMP observed “a sudden global drive
toward currency devaluation” and classified it as “another
clear parallel to the end of the bull market in 1929.” In the
late 1920s and early 1930s, the transformation took the
form of a currency war in which many countries sought to
make up declining trade revenue with other countries by
purposely causing the value of their currencies to fall. It is
still early in the current transition to a global economic
contraction, but the initial currency declines relative to the
U.S. dollar, the world’s reserve currency, suggest strongly
that the next deflation will be every bit as serious as the
one that began in earnest in 1929. In June, GMP cited the
collapse of Venezuela’s bolivar as the bellwether
devaluation. The events of August 18-19 highlight the
severity of the unfolding economic stress. Venezuela
effectively reduced the value of its currency by another
96%, issuing new bills that magically wiped five zeroes off
the bolivar’s price. According to the IMF, Venezuela’s
inflation rate is now 83,000%, reminiscent of the
wheelbarrows that were needed to buy bread in Weimar
Germany in 1924. This picture shows the volume of
bolivars needed to buy a roll of toilet paper.
Venezuela is not alone. The chart shows that the prices of
the Argentine peso, Turkish lira and Brazilian real are also
cratering. A global bear market invariably brings a flight to
quality and this one is no different. From the beginning of
the last bear market in October 2007 to its end in March
2009, the lira, peso and real fell an average of 22.7%
relative to the U.S. dollar. At this point, the bear market in
the US has barely begun, yet these coal-mine, canary
currencies are already crashing against the dollar. This is a
warning of the oncoming deflation. Stories about the
destabilizing effects of currency losses are also bubbling up
in Pakistan, South Africa and Iran. Many regard these
developments as peripheral. “Turkey and Argentine woes
are in the idiosyncratic category,” says a global macro-
strategist. But the rapid spread of these devaluations
argues against such cavalier dismissals. In an article at
Emerging-Europe.com, titled “Is Poland the Next
Turkey?”, EWI colleague Murray Gunn notes that
“developing geo-political” issues generally follow crashing
currencies. He cites the “price action in the Polish zloty” as
a prime example and warns that it probably means the
“news flow may be about to turn very negative for Poland.”
Eventually, currency turmoil will hit the mainstream, and
the news stream will follow as it always does.
Debt: From Milestones to Millstones
Some readers may remember that back in July 2007, the
subprime mortgage market managed to remain aloft even
after several subprime funds went over the edge into
bankruptcy because the market disappeared for the
mortgage bonds that they held. Industry experts instructed
Wall and Main Streets to ignore the carnage and the stock
market, and even some portions of the mortgage bond
market, continued to notch new highs in October 2007.
After that, the period of suspended animation finally gave
way to a plunge that eventually affected every corner of the36

financial markets. Today, something similar is happening
in the global credit markets. On the one hand, the march
continues into some of the most exotic, i.e., speculative,
credit market instruments in history. As GMP noted in
July, almost 80% of the $1 trillion U.S. leveraged loan
market is now covenant-lite. Moody’s estimates that first-
lien recoveries in the case of financial distress are likely to
be 61 cents on the dollar compared to a historic average of
71 cents. For second-lien loans, the recoveries may be more
like 14 cents versus the historic average of 43 cents.
Considering the emerging breadth of the next credit crisis,
our forecast is that even these low estimates will prove to
be way too optimistic. Commercial mortgage bonds are
another bond market sector that is essentially back to
where it was at the outset of the last credit crisis. According
to Bloomberg, the bonds “are getting stuffed with the
lowest quality loans” since 2007. Full-term and partial-
term interest-only loans now account for just under 80% of
commercial mortgage bonds. “To keep yield relatively
high,” underwriters removed and watered down
“protections.” Whatever it takes to “keep yields high,” if
“yield” means paper promises rather than what the
investor will actually end up receiving.
Observing that “investors have been lending to virtually
anyone willing to pay a decent yield,” Bloomberg surveyed
corporate filings and found that 69 companies have
increased their debt by at least 50% in the last five years.
These issuers have total debt of at least $5 billion. The list
includes many household names such as Dell, Tesla and
Netflix. Then there’s AT&T, which financial writer William
Cohen in a New York Times opinion piece on August 9
titled “The Big, Dangerous Bubble in Corporate Debt,”
identifies as the king of excess debt accumulation. To
finance its purchase of Time Warner, AT&T “stuffed itself
to the gills with an estimated $180 billion in debt.” As with
many firms, the only way it can pay back the debt holders
is by borrowing more money when it comes due. So it goes
at the end of the greatest credit bubble in history. This
status is cemented by a Bloomberg story on August 10
about the “Credit Market’s ‘Eyeball Valuations.’” The
article explores a new world of revised underwriting
standards in which investors “set aside” profits and focus
instead on planned growth, “high equity valuations and the
outside cash [companies have] raised.” The obsession with
eyeballs, or the raw numbers of website visitors, defined
valuations during the dot-com boom of the late 1990s.
Now, we’ve come to the point where the frothy valuations
of the Great Asset Mania are bankable assets. In recent
offering circulars, cosmetics firm Anastasia Beverly Hills
touted its 17 million Instagram followers, while ride-
sharing company Uber Technologies, boasted about its
“app penetration rate.” Even though both firms stated that
“future profitability may weaken,” bond investors lent
Anastasia $650 million while Uber took in $1.5 billion.
“You get comfortable with cash burn if it’s contributing to
increase in earnings or building an asset base that
significantly covers the company’s debt,” explained a high
yield bond fund manager. “Cash burn” is another holdover
from the technology bubble in 2000. Its application, in all
seriousness, to the credit markets testifies to how deeply
The Great Asset Mania has penetrated the psyche of
bondholders—and how far there is to fall.
The credit boom continues to press to new highs in other
areas as well. CLOs, or collateralized loan obligations, are
another exotic debt instrument that has bounced all the
way back from dubious distinction during the last credit
crisis. According to Standard & Poor’s, total CLO issuance
for 2018 hit $83 billion in early July, which means it’s well
on its way to exceeding its prior annual high of about $140
billion last year and in 2006. Consumer lending is also
setting records. This graph, from The Wall Street Journal
on August 25, shows a new high in the value of total37

personal loans in the first half of the year. The Journal
reports that “lenders pitch the loans as a way for
consumers to pay for projects or activities that might have
otherwise taken months to save for.” “Take a trip,” says
Barclays PLC. “Add a new deck,” says Citizens Financial.
These and other lenders sent out 1.26 billion solicitations
in the first half of 2018. Another $140 billion in credit may
seem like a drop in the bucket, but the new high in
personal loans rests atop a new all-time high in credit card
debt. In May 2018, outstanding credit card debt hit $1.04
trillion, surpassing the May 2008 extreme by 2%. Says one
observer, “The bet is that this time it won’t end so badly.”
But there are already subtle signs that such an even worse
ending is near. For one thing, a Bloomberg article on
August 22 notes that credit card lenders blinked in the first
quarter of the year, reducing the average line of credit
available to “subprime consumers” by 10%. “The pullback
is a reversal after years of banks loosening their
underwriting standards as part of a push to grab market
share in credit cards.” In another harbinger of the next
credit squeeze, global bond markets are wheezing from a
sudden lack of liquidity. In July, The Wall Street Journal
reported that the median bid-ask spread for developed
European high-yield credit is up 24% so far this year.
“Episodes of extreme stress in Italy and emerging markets
have highlighted just how quickly trading conditions can
deteriorate.” In another throwback to the 2007 subprime
mortgage bond market, illiquidity claimed its first victim in
early August as GAM Holding AG, a Swiss asset-
management firm, shuttered its Absolute Return Bond
Fund. The Financial Times called the closure “disturbing
for a supposedly diversified fund in a comparatively benign
market.” Initially, at least, the fund says that investors will
get back 60% of their money. Similar freezes will become
common as illiquidity becomes much more pronounced.
The junk bond market, which has also grown into a $1
trillion market within the last few years, will be another
focal point. A trillion here and a trillion there will add up in
a hurry.
The student loan market is another sector that illustrates
credit markets’ underlying vulnerability. As the chart here
shows, total loans recently crossed $1.5 trillion, so it’s
actually 50% larger than the junk bond market or the credit
card market. The steadiness of the rise in outstanding
student loans may appear unstoppable, but we continue to
state emphatically that it will reverse, probably soon, and
fast. The April issue of GMP forecast that the “U.S. student
loan program will fail” as college attendance declines and
“the education bubble” bursts. A closer look reveals that
this change of trend may already be well along. The steady
retreat of the one-year-rate-of-change on the bottom of the
chart is one clue to this reality. Another is the source of the
ongoing rise in absolute terms: an increase in interest
expenses rather than new loans. Student loan originations
peaked six years ago and are down 20% since then.
Bloomberg reports that U.S. Department of Education loan
modifications “seem to incentivize borrowers to ultimately
seek loan forgiveness rather than repay their debt.” Loan
forgiveness equates to deflation, which will reverse the rise
as even interest payments become too much for student
loan holders to bear. Meanwhile, the value of a college
education is undergoing a downside reappraisal. A recent
NY Times column says flat out, “College May Not Be Worth
It Anymore.” The gap between wages earned by high school
and college grads continues to shrink. At this point, “25%
of college graduates earn no more than the average high
school grad.” In the not-too-distant future, college will be
seen as a luxury item that many high school graduates can
do without.
38

THE OLD FISHERMAN
UNALTERABLY INTENT...
COLD EVENING RAIN
—BUSON
European Economy &
DeflationIf the 2018 economic story were a Dickens novel, then the
title would certainly be “A Tale of Two Economies.” On the
one hand, it’s clearly the best of times for overindebted
borrowers who desire to dig themselves in a little deeper.
The worst of times, on the other hand, will come when
consumer prices begin to fall again, essentially increasing
the value of every pound, euro and dollar that needs to be
paid back. The following chart from the Institute of
International Finance (IIF) shows that outstanding global
debt pushed north of $247 trillion in the first quarter of
2018, reaching yet another all-time high. In truth, however,
the eye-popping absolute numbers were probably the least
surprising part of the IIF report, as global debt has set new
records in each of the past six quarters. What is more
striking this time is that debt jumped by the largest margin
in two years. In fact, financial debt was up 8.9%, household
debt rose 17.5%, government debt jumped 19.6%, and non-
financial corporate debt skyrocketed an incredible 27.6%.
Meanwhile, the ratio of global debt to global GDP
increased for the first time since the third quarter of 2016,
meaning that, once again, IOUs are piling up faster than
the underlying economic growth needed to support them.
As we have said before, the process of deflating this
worldwide mountain of credit will be tortuously long.
In the meantime, consumer price declines — what most
people incorrectly refer to as deflation — will likely
resurface soon. Core CPI in the Eurozone (top graph)
peaked again in 2017, establishing a succession of three
lower peaks that date back to 2002. In Britain, meanwhile,
core CPI peaked in November 2017, slipping back below
the Bank of England’s 2% target rate last month. If the
39

broad markets are peaking as we believe, then these charts
depict the start of a downtrend that will lead to full scale
consumer-price deflation sometime next year.
Declining five-year break-even rates in the eurozone
further illustrate the deflationary picture to come. On
August 17, European Short-Term Update editor Murray
Gunn published this chart, which depicts average
combined breakevens across Europe’s three largest
economies: Germany, France and Italy.
As Murray describes it, the chart shows that the
“expectation of the average annual change in consumer
prices over the next five years peaked out at 1.34% in April
and that it has since declined to 1.04% today. Indeed, that
movement appears to be impulsive, suggesting that the
larger trend has turned down.” For our part, we would add
only that break-even rates represent especially useful
benchmarks, because they do not rely on guesswork.
Rather, they illustrate the market’s opinion on the inflation
vs. deflation debate, because they track the difference
between nominal bonds and their inflation-linked
counterparts. When markets weigh in this heavily on the
deflationary side of the ledger, experience tells us to sit up
and pay attention. If you haven't done so already, now is
the time to refamiliarize yourself with Book Two of
Conquer the Crash, which outlines precisely how to protect
yourself and profit from this rare economic occurrence.
Live and Let Die
By Murray Gunn, European Short Term Update, Interest
Rates Pro Services, Currency Pro Services
Aston Martin's IPO is yet another sign that the global
economy is at a peak.
Aston Martin, the British luxury car manufacturer, has
announced plans for an initial public offering (IPO) on the
London Stock Exchange. Seeking to cash-out $6.4 billion
of shares, it will decide by September 20 whether to pull
the trigger. The company, founded in 1913 (coincidentally
the same year as the U.S. Federal Reserve), has gone from
an all-time production low of only 30 cars in 1982 to well
over 5,000 per year now. That period coincides with the
biggest expansion of debt in history, fueled by a long
decline in bond yields and interest rates. Aston Martin is,
of course, synonymous with the fictional character of
James Bond, originating from Ian Fleming's classic spy
novels. Suave, sophisticated and yet also a ruthless
maverick, Bond's car of choice has been an Aston. For
decades, EWI and the Socionomics Institute have
demonstrated a connection between the popularity of
James Bond movies and the stock market (the lead
indicator of the economy). Bond becomes more popular
during bull markets because those trends are driven by
testosterone, a key ingredient in periods of positive social
mood.
The chart below shows the Dow Jones Industrial Average, a
proxy for the global economy, all the way back to 1896. We
have highlighted the periods when Aston Martin declared
insolvency or was in deep financial stress. Socionomists
will not be surprised to see that they coincide with troughs
in the global economy, coming after periods of stagnation
or decline. Now, with Aston Martin's popularity and
confidence so elevated that it is going public, the
probability that the IPO coincides with a peak in the global
economy is high. Expect financial markets to be shaken, as
well as stirred, in the months ahead.
40

AustraliaFor now, Australia’s currency may be the bestmeasure of the nation’s political winds
During Japan’s long bear market from 1989 to 2012,
turnover in the prime minister’s office became so high that
a Japanese cultural website explaining senryu (a form of
haiku) in English once cited this sadly humorous poem:
To my child
I have to yet again teach
the name of our prime minister
Australian parents may appreciate that sentiment after
Scott Morrison on August 24 became Australia’s sixth
prime minister in 11 years. Morrison replaced Malcolm
Turnbull after party insiders successfully challenged
Turnbull for leadership of the ruling Liberal-National
Coalition. The high turnover in the prime minister’s office
since the global financial crisis marks a change from the
prior bull market: Australia had only three PMs from 1983
to 2007, one every eight years on average. But, since 2007,
no prime minister has completed a three-year term.
Ever since Julia Gillard became prime minister after
ousting Kevin Rudd as leader of the Labor Party in 2010,
we have noticed that such intraparty coups have tended to
coincide with lows in Australian stocks—and we
successfully used those incidents to support bullish
forecasts for stocks. But last week’s leadership change does
not fit that model, because the All Ordinaries recently
logged a 52-week high.
Still, the latest coup was clearly mood-driven. An opinion
poll had revealed just days earlier that the opposition
Labor Party had suddenly widened its lead over the ruling
coalition to 10 points from just two points one month
before—a huge jump.
Because the stock market is not always a perfect indicator
of mood, we can look to derivative measures of mood, such
as a nation’s currency. In this case, the Aussie’s exchange
rate with the U.S. dollar may provide an explanation. The
four successful ruling party leadership challenges since the
global financial crisis have all occurred after significant
declines in the Aussie.
After Morrison’s victory was announced, the Aussie rallied.
“Morrison is obviously more familiar to global investors
given his time as treasurer,” a currency strategist in Sydney
offered to Bloomberg on August 24.
If our analysis is correct, though, the cause-and-effect
relationship is the other way around: It’s not that
Morrison’s victory caused the Aussie to rally; it’s that
41

Turnbull was replaced toward the end of a significant
decline in the Aussie.
Note: You can read more about prime ministerial turnover
during Japan’s long bear market in Chapter 10 of
Socionomic Causality in Politics, which we have excerpted
here .
42

The Wave Principle is Ralph Nelson Elliott’s discovery that social, or crowd, behavior trends and reverses in recognizable patterns. Using stock market data as his main research tool, Elliott isolated thirteen patterns of movement, or “waves,” that recur in market price data. He named, defined and illustrated those patterns. He then described how these structures link together to form larger versions of those same patterns, how those in turn link to form identical patterns of the next larger size, and so on. In a nutshell, then, the Wave Principle is a catalog of price patterns and an explanation of where these forms are likely to occur in the overall path of market development.
Pattern AnalysisUntil a few years ago, the idea that market movements are patterned was highly controversial, but recent scientific discoveries have established that pattern formation is a fundamental characteristic of complex systems, which include financial markets. Some such systems undergo “punctuated growth,” that is, periods of growth alternating with phases of non-growth or decline, building fractally into similar patterns of increasing size. This is precisely the type of pattern identified in market movements by R.N. Elliott some sixty years ago.
The basic pattern Elliott described consists of impulsive waves (denoted by numbers) and corrective waves (denoted by letters). An impulsive wave is composed of five subwaves and moves in the same direction as the trend of the next larger size. A corrective wave is composed of three subwaves and moves against the trend of the next larger size. As the chart shows, these basic patterns link to form five- and three-wave structures of increasingly larger size (larger “degree” in Elliott terminology).
In the chart above, the first small sequence is an impulsive wave ending at the peak labeled 1. This pattern signals that the movement of one larger degree is also upward. It also signals the start of a three-wave corrective sequence, labeled wave 2.
Waves 3, 4 and 5 complete a larger impulsive sequence, labeled wave (1). Exactly as with wave 1, the impulsive structure of wave (1) tells us that the movement at the next larger degree is upward and signals the start of a three-wave corrective downtrend of the same degree as wave (1). This correction, wave (2), is followed by waves (3), (4) and (5) to complete an impulsive sequence of the next larger degree, labeled wave 1. Once again, a three-wave correction of the same degree occurs, labeled wave 2. Note that at each “wave one” peak, the implications are the
43

Global Market Perspective Capsule Summary
same regardless of the size of the wave. Waves come in degrees, the smaller being the building blocks of the larger. Here are the accepted notations for labeling Elliott Wave patterns at every degree of trend:
Within a corrective wave, waves A and C may be smaller-degree impulsive waves, consisting of five subwaves. This is because they move in the same direction as the next larger trend, i.e., waves (2) and (4) in the illustration. Wave B, however, is always a corrective wave, consisting of three subwaves, because it moves against the larger downtrend. Within impulsive waves, one of the odd-numbered waves (usually wave three) is typically longer than the other two. Most impulsive waves unfold between parallel lines except for fifth waves, which occasionally unfold between converging lines in a form called a “diagonal triangle.” Variations in corrective patterns involve repetitions of the three-wave theme, creating more complex structures that are named with such terms as “zigzag,” “flat,” “triangle” and “double three.” Waves two and four typically “alternate” in that they take different forms.
Each type of market pattern has a name and a geometry that is specific and exclusive under certain rules and guidelines, yet variable enough in other aspects to allow for a limited diversity within patterns of the same type. If indeed markets are patterned, and if those patterns have a recognizable geometry, then regardless of the variations allowed, certain relationships in extent and duration are likely to recur. In fact, real world experience shows that they do. The most common and therefore reliable wave relationships are discussed in Elliott Wave Principle, by A.J. Frost and Robert Prechter.
Applying the Wave PrincipleThe practical goal of any analytical method is to identify market lows suitable for buying (or covering shorts), and market highs suitable for selling (or selling short). The Elliott Wave Principle is especially well suited to these functions. Nevertheless, the Wave Principle does not provide certainty about any one market outcome; rather, it provides an objective means of assessing the relative probabilities of possible future paths for the market. At any time, two or more valid wave interpretations are usually acceptable by the rules of the Wave Principle. The rules are highly specific and keep the number of valid alternatives to a minimum. Among the valid alternatives, the analyst will generally regard as preferred the interpretation that satisfies the largest number of guidelines and will accord top alternate status to the interpretation satisfying the next largest number of guidelines, and so on.
Alternate interpretations are extremely important. They are not “bad” or rejected wave interpretations. Rather, they are valid interpretations that are accorded a lower probability than the preferred count. They are an essential aspect of investing with the Wave Principle, because in the event that the market fails to follow the preferred scenario, the top alternate count becomes the investor’s backup plan.
Fibonacci RelationshipsOne of Elliott’s most significant discoveries is that because markets unfold in sequences of five and three waves, the number of waves that exist in the stock market’s patterns reflects the Fibonacci sequence of numbers (1, 1, 2, 3, 5, 8, 13, 21, 34, etc.), an additive sequence that nature employs in many processes of growth and decay, expansion and contraction, progress and regress. Because this sequence is governed by the ratio, it appears throughout the price and time structure of the stock market, apparently governing its progress.
What the Wave Principle says, then, is that mankind’s progress (of which the stock market is a popularly determined valuation) does not occur in a straight line, does not occur randomly, and does not occur cyclically. Rather, progress takes place in a “three steps forward, two steps back” fashion, a form that nature prefers. As a corollary, the Wave Principle reveals that periods of setback in fact are a requisite for social (and perhaps even individual) progress.
ImplicationsA long-term forecast for the stock market provides insight into the potential changes in social psychology and even the occurrence of resulting events. Since the Wave Principle reflects social mood change, it has not been surprising to discover, with preliminary data, that the trends of popular culture that also reflect mood change move in concert with the ebb and flow of aggregate stock prices. Popular tastes in entertainment, self-expression and political representation all reflect changing social moods and appear to be in harmony with the trends revealed more precisely by stock market data. At one-sided extremes of mood expression, changes in cultural trends can be anticipated.
44

Global Market Perspective Capsule Summary
On a philosophical level, the Wave Principle suggests that the nature of mankind has within it the seeds of social change. As an example simply stated, prosperity ultimately breeds reactionism, while adversity eventually breeds a desire to achieve and succeed. The social mood is always in flux at all degrees of trend, moving toward one of two polar opposites in every conceivable area, from a preference for heroic symbols to a preference for anti-heroes, from joy and love of life to cynicism, from a desire to build and produce to a desire to destroy. Most important to individuals, portfolio managers and investment corporations is that the Wave Principle indicates in advance the relative magnitude of the next period of social progress or regress.
Living in harmony with those trends can make the difference between success and failure in financial affairs. As the Easterners say, “Follow the Way.” As the Westerners say, “Don’t fight the tape.” In order to heed these nuggets of advice, however, it is necessary to know what is the Way, and which way the tape. There is no better method for answering that question than the Wave Principle.
To obtain a full understanding of the Wave Principle including the terms and patterns, please read Elliott Wave Principle by A.J. Frost and Robert Prechter, or take the free 10 Lessons on the Wave Principle on the Elliott Wave International website at www.elliottwave.com (http://www.elliottwave.com/tutorial/).
45

Global Market Perspective Capsule Summary
Alternation (guideline of) — If wave two is asharp correction, wave four will usually be a sideways correction, and vice versa.
Apex — Intersection of the two boundary lines of acontracting triangle.
Corrective Wave — A three-wave pattern, orcombination of three wave patterns, that moves in the opposite direction of the trend of one larger degree.
Diagonal Triangle (Ending) — A wedge-shapedpattern containing overlap that occurs only in fifth or C waves. Subdivides 3-3-3-3-3.
Diagonal Triangle (Leading) — A wedge-shapedpattern containing overlap that occurs only in first or A waves. Subdivides 5-3-5-3-5.
Double Three — Combination of two simple sidewayscorrective patterns, labeled W and Y, separated by a corrective wave labeled X.
Double Zigzag — Combination of two zigzags, labeledW and Y, separated by a corrective wave labeled X.
Equality (guideline of) — In a five-wave sequence,when wave three is the longest, waves five and one tend to be equal in price length.
Expanded Flat — Flat correction in which wave Benters new price territory relative to the preceding impulse wave.
Failure — See Truncated Fifth.
Flat — Sideways correction labeled A-B-C. Subdivides3-3-5.
Impulse Wave — A five-wave pattern that subdivides5-3-5-3-5 and contains no overlap.
Impulsive Wave — A five-wave pattern that makesprogress, i.e., any impulse or diagonal triangle.
Irregular Flat — See Expanded Flat.
One-two, one-two — The initial development in afive-wave pattern, just prior to acceleration at the center of wave three.
Overlap — The entrance by wave four into the price terri- tory of wave one. Not permitted in impulse waves.
Previous Fourth Wave — The fourth wave within thepreceding impulse wave of the same degree. Corrective patterns typically terminate in this area.
Sharp Correction — Any corrective pattern that doesnot contain a price extreme meeting or exceeding that of the ending level of the prior impulse wave; alternates with sideways correction.
Sideways Correction — Any corrective pattern thatcontains a price extreme meeting or exceeding that of the prior impulse wave; alternates with sharp correction.
Third of a Third — Powerful middle section within animpulse wave.
Thrust — Impulsive wave following completion of atriangle.
Triangle (contracting, barrier) — Corrective pattern,subdividing 3-3-3-3-3 and labeled A-B-C-D-E. Occurs as a fourth, B, X (in sharp correction only) or Y wave. Trendlines converge as pattern progresses.
Triangle (expanding) — Same as other triangles, buttrendlines diverge as pattern progresses.
Triple Zigzag — Combination of three zigzags,labeled W, Y and Z, each separated by a corrective wave labeled X.
Truncated Fifth — The fifth wave in an impulsivepattern that fails to exceed the price extreme of the third wave.
Zigzag — Sharp correction, labeled A-B-C. Subdivides5-3-5.
GLOSSARY OF TERMS
46

Global Market Perspective Capsule Summary
The Elliott Wave Principle is a detailed description of how financial markets behave. The description reveals that mass psychology swings from pessimism to optimism and back in a natural sequence, creating specific Elliott wave patterns in price movements. Each pattern has implications regarding the position of the market within its overall progression, past, present and future. The purpose of Elliott Wave International’s market-oriented publications is to outline the progress of markets in terms of the Wave Principle and to educate interested parties in the successful application of the Wave Principle. While a course of conduct regarding investments can be formulated from such application of the Wave Principle, at no time will Elliott Wave International make specific recommendations for any specific person, and at no time may a reader, caller or viewer be justified in inferring that any such advice is intended. Investing carries risk of losses, and trading futures or options is especially risky because these instruments are highly leveraged, and traders can lose more than their initial margin funds. Information provided by Elliott Wave International is expressed in good faith, but it is not guaranteed. The market service that never makes mistakes does not exist. Long-term success trading or investing in the markets demands recognition of the fact that error and uncertainty are part of any effort to assess future probabilities. Please ask your broker or your advisor to explain all risks to you before making any trading and investing decisions.
47

Global Market Perspective Bios
EDITORS
Robert R. Prechter, CMT Robert R. Prechter, is president of Elliott Wave International, publisher of Global Market Perspective. After working as a Technical Market Specialist with the Merrill Lynch Market Analysis Department in New York, he founded EWI in 1979. Bob served for ten years on the Board of Directors of the Market Technicians Association (MTA) and was elected its president in 1990. Currently he serves on the advisory board of the MTA’s Educational Foundation. Bob has made presentations on his socionomic theory of finance to the London School of Economics, Oxford University, Cambridge University, Trinity (Dublin), MIT, Georgia Tech, SUNY and academic conferences. He graduated from Yale University in 1971 with a degree in psychology. For more information, visit www.robertprechter.com.
Dave AllmanDave Allman graduated from the University of Maryland at the age of 19 with a degree in mathematics, became addicted to the markets and what makes them tick in 1978, and has worked closely with Bob Prechter since 1983. He has lectured around the globe on the application of the Wave Principle and investor psychology and has taught advanced classes on Elliott wave analysis to hundreds of investors. Today, Dave is active behind the scenes on a variety of projects at Elliott Wave International and the Socionomics Institute. Since October 1990, Dave has reviewed and edited all the commentary and charts in Global Market Perspective.
Steven CraigSteve has been involved with the energy industry for well over a decade and joined EWI in January 2001 as senior energy analyst. His industry focus was on trading and risk management, and he is intimately familiar with the production and consumption side of the business. Steve’s most recent positions were at Central and South West (now American Electric Power) and with Kerr-McGee. His extensive experience with the physical and financial aspects of crude oil, natural gas and electricity adds a valuable dimension to his analytical approach. He is responsible for EWI’s online Pro Services energy coverage, and his crude oil and natural gas views are featured each month in Global Market Perspective.
Mark GalasiewskiMark Galasiewski began his analytical career in 2001, researching company fundamentals at an institutional brokerage in Stamford, Connecticut. After joining Elliott Wave International in 2005, Mark contributed to Robert Prechter’s Elliott Wave Theorist before joining EWI’s Global Market Perspective team covering Asian stock indexes. For six years during the 1990s he lived in Japan, where he observed that country’s extended bear market first-hand. Mark has traveled to many of the countries whose markets he analyzes. A graduate of Middlebury College in East Asian Studies, he is fluent in Japanese and conversant in Mandarin Chinese.
Murray GunnAfter earning his Master of Arts Degree in economics, Murray went straight into fund management in 1991. He quickly realized that textbook descriptions don’t apply to real-world markets, which in turn led him to technical analysis and the Elliott Wave Principle. He worked for several firms as a fund manager in global bonds, currencies and stocks, including long posts at Standard Life Investments and the Abu Dhabi Investment Authority. Murray then joined HSBC Bank as Head of Technical Analysis. A published author (Trading Regime Analysis), he has served on the board of the Society of Technical Analysts (UK), and delivered lectures on the Elliott Wave Principle to students at Queen Mary University and Kings College London. Watch for Murray’s commentary in Global Market Perspective, Interest Rates and Currency Pro Services, and on deflation.com.
48

Global Market Perspective Bios
Steven HochbergSteve Hochberg began his professional career with Merrill Lynch and joined Elliott Wave International in 1994. Over the years, Steve has become a sought-after lecturer and is quoted in various media outlets, such as USA Today, The Los Angeles Times, The Washington Post, Barron’s, Reuters and Bloomberg. He also does interviews about the financial markets on CNBC, MSNBC and Bloomberg Television. Steve co-edits The Elliott Wave Financial Forecast with Pete Kendall, writes the Short Term Update thrice weekly, and provides commentary on the U.S. stock market, interest rates and precious metals for Global Market Perspective.
Robert KelleyRobert Kelley has worn numerous hats since beginning his career in 1987 as a futures broker. He joined EWI in 1990 and edited The Elliott Wave Short Term Update, the Currency and Commodity Hotline and the currency section of The Elliott Wave Currency and Commodity Forecast newsletter. In 1994, he left EWI for New York to become a Vice President of JP Morgan where he was in charge of the technical market research department. He later served as a consultant for HSBC Securities and thereafter developed a proprietary options trading system. In May 2000, Robert rejoined EWI where he now provides analysis for the World Stock Index for Global Market Perspective.
Peter M. KendallPeter Kendall served as a financial reporter and columnist from 1983 to 1992. He wrote the “On the Money,” a column for The Business Journal from 1991 to 1997. Pete joined Elliott Wave International as a researcher in 1992 and has been contributing to GMP since 1995. Pete is Director of EWI’s Center for Cultural Studies, where he focuses on popular culture and the new science of socionomics. Pete graduated from Miami University in Oxford, Ohio with a degree in Business Administration. For Global Market Perspective, Pete provides commentary on cultural trends, the economy and the U.S. stock market.
Michael MaddenMichael Madden, CMT, CFTe, CEWA, began his financial career in 2009 while living in the United States. He focused on technical analysis and grew to appreciate using the Wave Principle in his own trading. After he settled back in his home in Ireland, he earned the Certified Elliott Wave Analyst (CEWA) designation and launched his own Elliott wave forecasting and consulting service in 2012. He joined EWI in 2014 and now covers intraday currency cross rates for EWI’s online Pro Services currencies coverage and Global Market Perspective.
Jim MartensJim Martens began using the Elliott Wave Principle in 1985 and by 1989 was making insightful market calls for his metals trader colleagues on the Commodity Exchange Center in New York. Jim joined Elliott Wave International in 1993 as a commodity specialist. He also oversaw EWI’s currency analysis before joining Nexus Capital Ltd., a Soros-affiliated hedge fund in 2001. He rejoined EWI in 2005. Jim received a degree in finance from Florida Atlantic University. He covers currency relationships for Global Market Perspective and provides full coverage of dollar rates in EWI’s online Pro Services currencies coverage.
49

Global Market Perspective Bios
Brian WhitmerBrian Whitmer’s analytical proficiency extends to two professions: He received a degree in civil engineering from the University of Maryland and has served as a designer, planner, and project manager for $100-million-plus civil and residential developments. Brian also is an Elliott-savvy technical analyst who is proficient in socionomics, the science of history and social prediction. He describes himself as self-educated in Austrian economics and thus well-versed in the misunderstandings of mainstream economics. Joining Elliott Wave International in 2009, Brian serves as editor of The European Financial Forecast and contributes the European stock section of Global Market Perspective.
Ivelin “Ivo” ZhelevBased in Bulgaria, Ivelin Zhelev, CEWA, has been involved in the financial markets since 2011. He is a co-founder of EWM Interactive, a company that provides weekly wave outlooks for the major forex pairs and major stock indexes and a contributor to two books published by Academic Publishing House “Tsenov” - Svishtov, “Capital Optimization” and “Debt Management.” Ivo contributes commentary for the interest rates section of Global Market Perspective.
AcknowledgmentsOur production team is indispensible in getting out each issue of GMP. For this issue, Angela Hall, Shannon Clark, Cari Dobbins, and John Watson handled charts, fact-checking, proofreading, layout and other details.
50