
Postharvest Biology and Technology 95 (2014) 1–6 Contents lists available at ScienceDirect
Upload
independentCategory
view
0download
0
This is an open access article which appeared in a journal publishedby Elsevier. This article is free for everyone to access, download and
read.
Any restrictions on use, including any restrictions on furtherreproduction and distribution, selling or licensing copies, or postingto personal, institutional or third party websites are defined by the
user license specified on the article.
For more information regarding Elsevier’s open access licensesplease visit:
http://www.elsevier.com/openaccesslicenses

Author's personal copy
NeuroImage: Clinical 4 (2014) 444–453
Contents lists available at ScienceDirect
NeuroImage: Clinical
j o u r n a l h o m e p a g e : w w w . e l s e v i e r . c o m / l o c a t e / y n i c l
Increased topographical variability of task-related activation in
perceptive and motor associative regions in adult autistics
Marie-Pier Poulin-Lord
a , b , Elise B. Barbeau
a , b , c , Isabelle Souli eres a , b , d , Oury Monchi e , f , Julien Doyon
h , Habib
Benali g , Laurent Mottron
a , b , c , *
a Centre d’Excellence en Troubles Envahissants du D eveloppement de l’Universit e de Montr eal (CETEDUM), Montr eal, QC, Canada b Centre de recherche de l’Institut universitaire en sant e mentale de Montr eal, Montr eal, QC, Canada c D epartement de Psychiatrie, Universit e de Montr eal, Montr eal, QC, Canada d D epartement de Psychologie, Universit e du Qu ebec a Montr eal, QC, Canada e Centre de Recherche, Institut Universitaire de G eriatrie de Montr eal, Montr eal, QC, Canada f D epartement de Radiologie, Universit e de Montr eal, Montr eal, QC, Canada g Laboratoire d’Imagerie Fonctionnelle — U678, Facult e de M edecine, Pierre et Marie Curie — Piti e Salp etri ere, Paris, France h D epartement de Psychologie, Unit e de Neuroimagerie Fonctionnelle (UNF), Universit e de Montr eal, Montr eal, QC, Canada
a r t i c l e i n f o
Article history:
Received 25 October 2013
Received in revised form 29 January 2014
Accepted 17 February 2014
Keywords:
Autism
fMRI
Plasticity
Primary areas
Associative areas
a b s t r a c t
Background: An enhanced plasticity is suspected to play a role in various microstructural alterations, as well
as in regional cortical reallocations observed in autism. Combined with multiple indications of enhanced
perceptual functioning in autism, and indications of atypical motor functioning, enhanced plasticity predicts
a superior variability in functional cortical allocation, predominant in perceptual and motor regions.
Method: To test this prediction, we scanned 23 autistics and 22 typical participants matched on age, FSIQ,
Raven percentile scores and handedness during a visuo-motor imitation task. For each participant, the
coordinates of the strongest task-related activation peak were extracted in the primary (Brodmann area 4)
and supplementary (BA 6) motor cortex, the visuomotor superior parietal cortex (BA 7), and the primary
(BA 17) and associative (BAs 18 + 19) visual areas. Mean signal changes for each ROI in both hemispheres,
and the number of voxels composing the strongest activation cluster were individually extracted to compare
intensity and size of the signal between groups. For each ROI, in each hemisphere, and for every participant, the
distance from their respective group average was used as a variable of interest to determine group differences
in localization variability using repeated measures ANOVAs. Between-group comparison of whole-brain
activation was also performed.
Results: Both groups displayed a higher mean variability in the localization of activations in the associative
areas compared to the primary visual or motor areas. However, despite this shared increased variability in
associative cortices, a direct between-group comparison of the individual variability in localization of the
activation revealed a significantly greater variability in the autistic group than in the typical group in the left
visuo-motor superior parietal cortex (BA 7) and in the left associative visual areas (BAs 18 + 19).
Conclusion: Different and possibly unique strategies are used by each autistic individual. That enhanced
variability in localization of activations in the autistic group is found in regions typically more variable in
non-autistics raises the possibility that autism involves an enhancement and / or an alteration of typical
plasticity mechanisms. The current study also highlights the necessity to verify, in fMRI studies involving
autistic people, that hypoactivation at the group level does not result from each individual successfully
completing a task using a unique brain allocation, even by comparison to his own group. c © 2014 The Authors. Published by Elsevier Inc.
This is an open access article under the CC BY license
( http: // creativecommons.org / licenses / by / 3.0 / ).
* Correspondence to: Laurent Mottron. Service de recherche, H opital Rivi ere-des-
Prairies, 7070 Blvd. Perras, Montr eal H1E 1A4, QC, Canada.
E-mail address: [email protected] (L. Mottron).
1. Introduction
Autism is characterized by social and communication alterations,
as well as by repetitive behaviors and restrictive interests, combined
with a large diversity among symptomatic profiles and individual
developmental trajectories ( American Psychiatric Association, 2013 ;
2213-1582/ $ - see front matter c © 2014 The Authors. Published by Elsevier Inc. This is an open access article under the CC BY license ( http: // creativecommons.org / licenses / by /
3.0 / ).
http://dx.doi.org/10.1016/j.nicl.2014.02.008

Author's personal copy
M.p. Poulin-Lord et al. / NeuroImage: Clinical 4 (2014) 444–453 445
Newschaffer et al., 2007) . The variability of autistic phenotype may
result from the heterogeneity of environmental constraints and up-
bringing. However, mechanisms for heterogeneity may also be intrin-
sic to what autism is. The most obvious factor for phenotypic hetero-
geneity is the wide range of chromosomal regions and the several
hundreds of polymorphisms that have been associated with autism
( Scherer and Dawson, 2011 ). Whereas autism is understood as a final
common pathway of these various mutations ( Ben-David and Shif-
man, 2012 ), each genetic alteration may produce its own footprint on
the phenotype. For instance, in the case of “syndromic autism”, autism
accompanied by tuberous sclerosis will differ from that accompanied
by Fragile X. Another putative source of heterogeneity may be that the
common effect of these mutations (either involved in syndromic or
non-syndromic autism) is an increase in synaptic plasticity, a mech-
anism which may increase the experience-dependent variability in
brain functional allocation ( Markram and Markram, 2010 ; Mottron et
al., 2013 ; Chung et al., 2012 ; Zoghbi and Bear, 2012 ). However, em-
pirical arguments in favor of enhanced plasticity in autism are mostly
indirect – based on examining in animal models the effect of genetic
( Kelleher and Bear, 2008 ; Baudouin et al., 2012 ) or environmental
( Markram and Markram, 2010 ) alterations – and mostly related to
microstructural alterations ( Markram and Markram, 2010 ).
Enhanced functional plasticity should also be present at the macro-
scopic level, and predict a greater variability in the autism group in
regional allocation of brain functions ( Barnes and Finnerty, 2010 ).
Spatial variability in functional allocation is not identically distributed
on the surface of the cortex. In an fMRI resting state study in typical in-
dividuals, Mueller et al. (2013 ) demonstrated that functional connec-
tivity in hetero-modal association cortices (lateral prefrontal regions,
temporo-parietal junction) is substantially more variable than that
in unimodal perceptual and motor cortices. Regions of this increased
inter-subject variability overlap with regions displaying more vari-
able cortical folding, as well as with regions implicated in individual
cognitive differences and regions displaying the largest evolutionary
expansion between monkeys and humans. Autistics should therefore
present more within-group variability in terms of functional allo-
cation in associative regions, because these regions are intrinsically
more variable and less genetically constrained in humans ( Brun et al.,
2009 ). There are indications that an autistic-specific plasticity pro-
cess favors these regions, as manifested by their enhanced gyrification
( Wallace et al., 2013 ), as well as by these regions being the primary lo-
cus of structural alterations, as revealed by the latest structural meta-
analysis ( Nickl-Jockschat et al., 2012 ). At the functional level, a re-
cent ALE meta-analysis of 26 neuroimaging experiments using visual
stimuli in autistic individuals revealed a material-specific functional
reallocation of visual occipitoparietal associative areas, in the form of
atypical spatial distribution of neural activity, and decreased activity
in some frontal areas, in autistic relative to non-autistic individuals
( Samson et al., 2012 ).
Pierce et al. (2001 ) were the first to report a greater individual
variability in localization of cerebral activations in autistics. Whereas
hypo-activation of the fusiform gyrus was observed in autistics at the
group level during a face perception task, each autistic participant had
a unique functional hot spot in response to faces (ranging from the
frontal lobe to the occipital lobe and fusiform gyrus), while locations
in non-autistics all fell within the fusiform face area. Similar increased
inter-individual spatial variability in functional activations was also
found in autistic groups during a visuomotor sequence learning task
( M uller et al., 2003 ; M uller et al., 2004 ). In these studies, the 3D dis-
tance between the group’s strongest activation peak in a specific re-
gion and each individual’s closest peak was used as a direct measure
of individual spatial variability. The premotor (BA 6) and the supe-
rior parietal (BA 7) cortices were used as target regions. Compared to
typical individuals, autistics showed greater inter-individual spatial
variability and decreased activation in the right superior parietal re-
gion (BA 7) during the early learning stage, and greater variability and
activation in the right premotor region (BA 6) during the late learning
stage. Scherf et al. (2010) used a similar computation of the individ-
ual variability in a study involving face, object and place processing.
Greater variability in localization of activations was observed within
the autistic group, but only in the fusiform gyrus during face pro-
cessing. Whereas these findings are consistent with our hypothesis of
enhanced variability, they are post-hoc findings, and do not compare
primary and associative perceptual and motor regions. This distinc-
tion is of interest because the main difference in variability reported
in typical individuals involves contrasting primary and associative
regions ( Mueller et al., 2013 ; Tahmasebi et al., 2012 ).
The aim of the study was to use functional magnetic reso-
nance imaging (fMRI) to determine whether there is increased inter-
individual variability in the localization, intensity and size of cerebral
activations within the primary and associative areas of both visual
and motor modalities in autistic individuals, compared to non-autistic
individuals. Between-group comparisons of whole brain activations
were also performed to determine if individual variability is associ-
ated with between-group differences in task-related activity. We dis-
tinguished primary and associative areas of visual and motor modal-
ities recruited during a visuo-motor imitation task, using anatomical
ROIs. An easy visuo-motor task was chosen in order to produce a
combined activation of visual and motor cortices. BA 4 (primary mo-
tor cortex), BA 6 (premotor cortex and supplementary motor area,
SMA), and BA 7 (visuomotor superior parietal cortex) were selected
as ROI to investigate motor functions. BA 18 (V2: secondary visual
cortex) and BA 19 (associative visual cortex) were grouped together
to represent the global associative areas of the visual cortex, and BA
17 (V1: primary visual cortex) composed the visual ROI.
2. Methods
2.1. Participants
The initial experimental sample comprised 26 autistic partici-
pants and 23 typically developing participants recruited from the
research database of the Universit e de Montr eal Autism Center of
Excellence at the Rivi ere-des-Prairies Hospital (Montreal, Canada).
The autistic and non-autistic groups were matched on age, gender,
Wechsler Full-scale and Performance IQ (WISC-III or WAIS III, Cana-
dian norms), Raven’s Progressive Matrices percentile (North Ameri-
can norms) ( Raven, 1976 ) and manual preference estimated using the
Edinburgh Handedness Inventory ( Oldfield, 1971 ). Two left-handed
autistics were not included in the analysis, in order to satisfy group
matching in handedness. Most autistic participants were diagnosed
using a multidisciplinary assessment that included a clinical eval-
uation based on DSM-IV criteria, the Autism Diagnostic Interview
Revised (ADI-R) ( Lord et al., 1994 ) and the Autistic Diagnostic Obser-
vation Schedule (ADOS-G modules 3–4) ( Lord et al., 1989 ). However,
some participants were characterized using expert interdisciplinary
judgment only (one participant) or combined with either ADOS-G
(two participants) or ADI-R (two participants). Typical participants
were screened for personal or familial neurological or medical condi-
tions known to affect brain function. Exclusion criteria were uncor-
rectable visual impairment, current use of psychoactive or vasoactive
medications and use of drugs or alcohol exceeding 2 drinks per day. All
structural scans were reviewed by a neurologist to ensure that no par-
ticipant had any anatomical abnormalities. Written informed consent
was obtained from all participants in accordance with the Regroupe-
ment Neuroimagerie / Qu ebec IRB approved protocol 08-09-003. All
participants received monetary compensation for their participation.
2.2. Stimuli and procedure
The visuomotor imitation task included 15 different hand ges-
tures drawn in black and white, each illustrated twice to represent

Author's personal copy
446 M.p. Poulin-Lord et al. / NeuroImage: Clinical 4 (2014) 444–453
Fig. 1. Two different sample stimuli from the visuo-motor imitation task.
both left and right hands. These visual stimuli were presented so that
the participants saw the hands with the palm facing them and could
distinguish clearly the configuration of the fingers ( Fig. 1 ). A practice
session outside the scanner ensured that the participants familiarized
themselves with the different gestures, understood the task and could
imitate the gestures with their hand while minimizing movement of
the rest of the body. During the fMRI scanning session, participants
were lying on their back in the scanner with their hands on the sides
of the body, palms facing up. No visual feedback could be used during
the task, as participants had to look continuously at the stimuli pre-
sented. Visual stimuli were presented using the Matlab Psychtoolbox
( Brainard, 1997 ; Pelli, 1997 ; Kleiner et al., 2007 ), on a screen at the
back of the scanner bore. The participants saw the stimuli through
an individually adjusted mirror attached in front of their eyes on
the head coil. Vision correction with fMRI compatible lenses for par-
ticipants with myopia or hyperopia was applied in concordance with
their optometrist’s prescription. A total of 96 hand gestures were pre-
sented during the session, in 16 blocks of 6 trials. The session started
with a 10 second fixation cross. Then, each of the 16 blocks included a
2.5 second instruction slide indicating the hand to be used to imitate
the hand gesture presented (left hand or right hand condition) for the
following 6 trials. The stimuli were presented pseudo-randomly (3
s / stimulus) in the same visual field as the hand to be used to imitate.
A fixation cross (9.5 second duration) ended each block and served as
the baseline. The total duration of the session was 490 s.
2.3. Image acquisition
Images were acquired on a Siemens Tim Trio 3T scanner with a
32 channel phased-array head coil at the “Unit e de Neuroimagerie
Fonctionnelle” (University of Montreal). The scanning session in-
cluded anatomical T1-weighted structural brain images using an ME-
MPRAGE 4-Echo sequence (176 slices, 1 mm
3 voxels, TR = 2530 ms,
TE = 1.64 / 3.5 / 5.36 / 7.22 ms, flip angle = 7 ◦). Acquisition of func-
tional data used an echo planar imaging (EPI) pulse sequence (150
acquisitions, TR = 3330 ms, 60 slices, matrix size 80 × 80, voxel
size 2.5 × 2.5 × 2 mm
3 , slice thickness: 2 mm with a 0.5 mm gap,
TE = 30 ms, flip angle = 90 ◦). Gradient echo phase and magnitude field
maps were then acquired (60 slices, matrix size = 80 × 80, voxel size
2.5 × 2.5 × 2.0 mm
3 , slice thickness = 2 mm with a 0.5 mm gap,
TR = 488 ms, TE short = 4.92 ms, TE long = 7.38 ms, flip angle = 60 ◦) to
correct image distortions and improve co-registration accuracy using
the field map toolbox in SPM.
2.4. Image analysis
SPM8, MRICRON and SPSS were respectively used for image pre-
processing, visualization and statistical analysis.
2.4.1. Preprocessing
Image preprocessing steps started with a two-pass realignment
involving initial registration of all images to the first image of the
time series within the run, followed by registration of the images
to the mean of the images computed after a first realignment, and
then followed by resampling using 4th degree b-spline interpolation.
Slice time correction was applied using interpolation between time
points at each voxel taking the last slice of the EPI volume as reference.
Images were then spatially transformed and spatially normalized into
the ICBM152 MNI space. Normalized images were finally smoothed
using 3D Gaussian filtering kernel of 8 mm FWHM.
2.4.2. Statistical modeling
After inspection of functional activations (at uncorrected p < .001),
participants were excluded if they presented an aberrant pattern of
activation with no activation in the visual and motor-related areas (1
per group). The final sample included 23 autistic and 22 typical partic-
ipants ( Table 1 ). Head motion parameters during the functional scan-
ning session were inspected and did not exceed 1.5 mm of translation
and 0.05 degree of rotation for any of the participants. Independent-
sample t -tests were performed on the translation and rotation param-
eters. The groups did not differ in the magnitude of maximal trans-
lation ( t (43) = .624, p = .536) or rotation ( t (43) = −.724, p = .473).
To allow longitudinal magnetization equilibration, the first two
volumes of the session were discarded. Model specification of the
first level analysis included a design matrix for each of the two ac-
tive conditions (left / right hand) and the baseline condition (fixation
cross) corresponding to the timing described above in the procedure
in Section 2.2 . Six head motion estimates were included in the model
as covariates of no interest. A high-pass temporal filter with a cutoff of
128 s was also used to remove low-frequency noise. A GLM model was
used for statistical analysis. The hemodynamic response was modeled
using the canonical hemodynamic function implemented as boxcar
basis functions in SPM8. In the first-level analysis, the following con-
trasts were computed: left and right hand respectively vs. the fixation
cross baseline. To allow inference at the population level, the mixed
effect model included a second-level analysis where the first-level
contrasts were entered in a random-effect model with three factors:
Subject (55 levels), Group (2 levels), which was assumed to have un-
equal variance, and Condition (2 levels). The mixed effect model cov-
ers the first-level analysis (accounting for within-subject variability)
followed by second level analysis (accounting for between-subject
variability). The critical threshold was t = 5.38, p < .05, FWE with an
extent threshold of k = 20 voxels.
2.5. Computing parameters of individual variability
Individual variability corresponds to the magnitude of the within-
group variability, and is measured through three different parameters
based on the strongest activation peak of task-related activity: its lo-
calization , its mean signal change between task and baseline and its
size . In order to compute individual variability for these three param-
eters, regions of interest (ROIs), which were defined from a Brodmann
area (BA) atlas using the WFU Pickatlas SPM Toolbox ( Maldjian et al.,
2003 ; Maldjian et al., 2004 ), were used to measure the individual ac-
tivations in the visual and motor regions involved in the task. Using
these ROIs defined from a template rather than from each individual
is justified for this study because the size of individually defined ROIs
depends on the statistical significance of the functional responses,
which were a function of the variability and the response amplitude
( Dinstein et al., 2010 ). As the goal of this study is to investigate indi-
vidual variability in autistic compared to typical individuals, the use
of anatomically defined ROI masks gave us a legitimate comparison
point. Computations of the three parameters determining individual
variability were all based on the strongest activation peak for each ROI,
within each hemisphere. Separate repeated measures ANOVAs were
performed for the visual and motor modalities with Region (primary,
associative), Side (left, right) and Group as factors. Significant main
effects and interactions were then further investigated using two-
tailed independent-samples t -tests. Since this measure of variability

Author's personal copy
M.p. Poulin-Lord et al. / NeuroImage: Clinical 4 (2014) 444–453 447
Table 1
Participant characteristics.
Typicals Autistics p value
Sample size (gender) 22 (3F, 19 M) 23 (3F, 20 M)
Age (years)
Mean (SD) 22.6 (5.56) 19.8 (4.72) .125
Range 15–35 14–30
Full-scale IQ
Mean (SD) 107.3 (12.51) 100.3 (10.48) .056
Range 87–127 86–118
Performance IQ
Mean (SD) 104.7 (13.14) 105.1 (11.74) .709
Range 82–122 92–127
Verbal IQ
Mean (SD) 108.7 (11.81) 99.8 (14.87) .017
Range 91–127 67–119
Raven percentile
Mean (SD) 68.1 (25.41) 75.5 (15.99) .268
Range 25–96.5 50–100
Handedness
Mean (SD) + 74.05 (38.57) + 62.35 (59.06) .460
Range −87.5 to + 100 −80 to + 100
ADOS score
Mean (cut-off)
Communicative − 4.95 (3)
Social − 9.57 (6)
Social + communicative − 14.52 (10)
ADI score
Mean (cut-off)
Social − 21.48 (10)
Communicative − 16.86 (8)
Behavior − 6.14 (3)
Note. Groups were matched on gender, age, full scale IQ, performance IQ, Raven Progressive Matrices percentile scores and manual preference, which is reported as the Edinburgh
score (from −100 completely left handed to + 100 completely right handed). ADI: Autism Diagnostic Interview, ADOS: Autism Diagnostic Observation Schedule. Group differences
were assessed using independent t -tests.
is associated with standard deviation of the parameters computed,
Levene’s tests (homogeneity of variance) were applied.
2.5.1 Spatial localization
Coordinates of the strongest activation peak were extracted from
the functional images with an uncorrected threshold ( p < .001) for
each participant, ROI and hemisphere. Using a lower uncorrected
threshold is justified given our goal, as it does not affect the local-
ization of the activation, only its intensity and its size. Based on the
method used by M uller et al. (2003 ), distances in three-dimensional
stereotactic space were computed between the group mean maxima
and the individual maxima. For example, if the strongest activation
in the right BA 17 for one participant was located at [20, −84, 10]
and occurred at [18, −93, −4] for the group mean, the distance was √
2 2 + 9 2 + 14 2 = 16 . 76 mm. The variable obtained was thus the ge-
ometric distance from the group mean activation, and was therefore
used to measure intra-group variability in localization of activations,
or spatial variability.
2.5.2 Mean signal change
To compare the intensity of the signal between groups, mean sig-
nal changes of activated voxels of each individual for each ROI and
hemisphere were extracted from the strongest activation peak ( Chung
et al., 2007 ). Only those which reached the more conservative thresh-
old of p < .05 FWE corrected were included in the analyses. An average
of 2 measures was excluded in each group and ROI, except for the BA
7 ROI; about 7 measures had to be excluded in each group.
2.5.3 Size of activation
The size of activation was determined by computing the number
of voxels that reached the conservative threshold of p < .05 FWE
corrected within the ROI.
2.6. Group analysis: whole brain task-related activity
In order to disentangle region-specific individual variability from
group differences in whole brain activation, the latter was computed
through a repeated measures ANOVA with Subject, Group (typical or
autistic) and Condition (left hand or right hand) as factors.
2.7. Voxel-based morphometry
2.7.1 Image preprocessing
A voxel-based morphometry (VBM) analysis was conducted using
the SPM8 VBM-DARTEL procedure ( Ashburner, 2010 ) to see whether
the group differences observed in terms of functional variability could
be explained by an anatomical difference in the same gray matter re-
gions. First the T1 images were visually inspected for artifacts and 3
subjects were rejected at this level. The images were segmented into
gray matter (GM), white matter (WM) and cerebrospinal fluid (CSF)
using the New Segment tool. The resulting gray matter images for each
subject were then used in the DARTEL (create templates) procedure.
The resulting template files of each subject were smoothed, spatially
normalized and Jacobian scaled to MNI space. A 10 mm FWHM Gaus-
sian kernel was used.
2.7.2 Statistical analysis
A t -test was performed to investigate whole-brain group dif-
ferences in gray matter correcting for total intra-cranial volume
(GM + WM + CSF) using global normalization.

Author's personal copy
448 M.p. Poulin-Lord et al. / NeuroImage: Clinical 4 (2014) 444–453
Fig. 2. Mean distances in millimeters from the group mean activation peak in the
motor and visual ROIs in autistic and typical groups during the visuo-motor imitation
task. Differences between groups reaching significance ( p < .05) are indicated by an
asterisk (*).
Fig. 3. Localization of all individual peaks of activation in the left visual ROIs. Each
peak is represented as a 1 cm diameter sphere projected on the cortical surface us-
ing Freesurfer. The color scale represents the overlap of individual peaks, darker being
1 individual and brighter 5 and more. The primary area (BA 17) is in red and the
associative area (BAs 18–19) is in blue. The autism and typical groups are displayed
separately.
3. Results
3.1. Individual variability differences
3.1.1 Spatial localization
( Fig. 2 ) Mean distances and their standard deviation for each group,
ROI and hemisphere are presented in Table 2 .
3.1.1.1 Visual areas The repeated measures ANOVA revealed signif-
icant Region ( F (1,39) = 50.79, p < .001) and Side ( F (1,39) = 5.15,
p = .029) main effects, as well as a Region × Group interaction
( F (1,39) = 6.38, p = .016). In both groups the variability was more
important in the left hemisphere. Independent t -tests showed that
the variability of individual distances from the group mean activation
peaks was greater in the autistic group than in the typical group in left
BAs 18 + 19 (associative visual regions: t (43) = 3.67, p = .001) but
not in left BA 17 ( t (41) = .257, p = .799). This group difference was not
present for the right hemisphere (right BAs 18 + 19: t (42) = .979,
p = .333, right BA 17: t (40) = −.821, p = .417) (see Fig. 3) . Levene’s
tests did not reach significance.
Fig. 4. Localization of all individual peaks of activation in the left motor ROIs. Each
peak is represented as a 1 cm diameter sphere projected on the cortical surface using
Freesurfer. The color scale represents the overlap of individual peaks, darker being 1
individual and brighter 5 and more. The primary area (BAs 4–6) is in red and the asso-
ciative area (BA 7) is in blue. The autistic and typical groups are displayed separately.
Fig. 5. Mean signal change in motor and visual ROIs in autistic and typical groups
during the visuo-motor imitation task. No difference between groups was observed.
3.1.1.2 Motor-related areas The repeated measures ANOVA revealed
significant Region ( F (1,35) = 26.29, p < .001) and Side ( F (1,35) = 11.72,
p = .002) main effects, a Side × Group interaction ( F (1,35) = 6.06,
p = .019) as well as a three-way Region × Side × Group interaction
( F (1,35) = 6.00, p = .019). The independent t -tests revealed that autis-
tics exhibited greater variability than typicals in BA 7 only and on
the left side only ( t (37) = 2.67, p = .014) the latter being associated
with a significant Levene’s test ( p = .032) as well. The independent
t -tests and Levene’s tests did not reach significance ( p > .05) for the
between-group differences in the primary motor ROIs (BA 4, BA 6)
(see Fig. 4 ).
3.1.2 Mean signal change
No significant between-group difference was observed in mean
signal change ( p > .05) ( Fig. 5 ). Levene’s tests were not significant,
except for the left BA 4 ( p = .039).
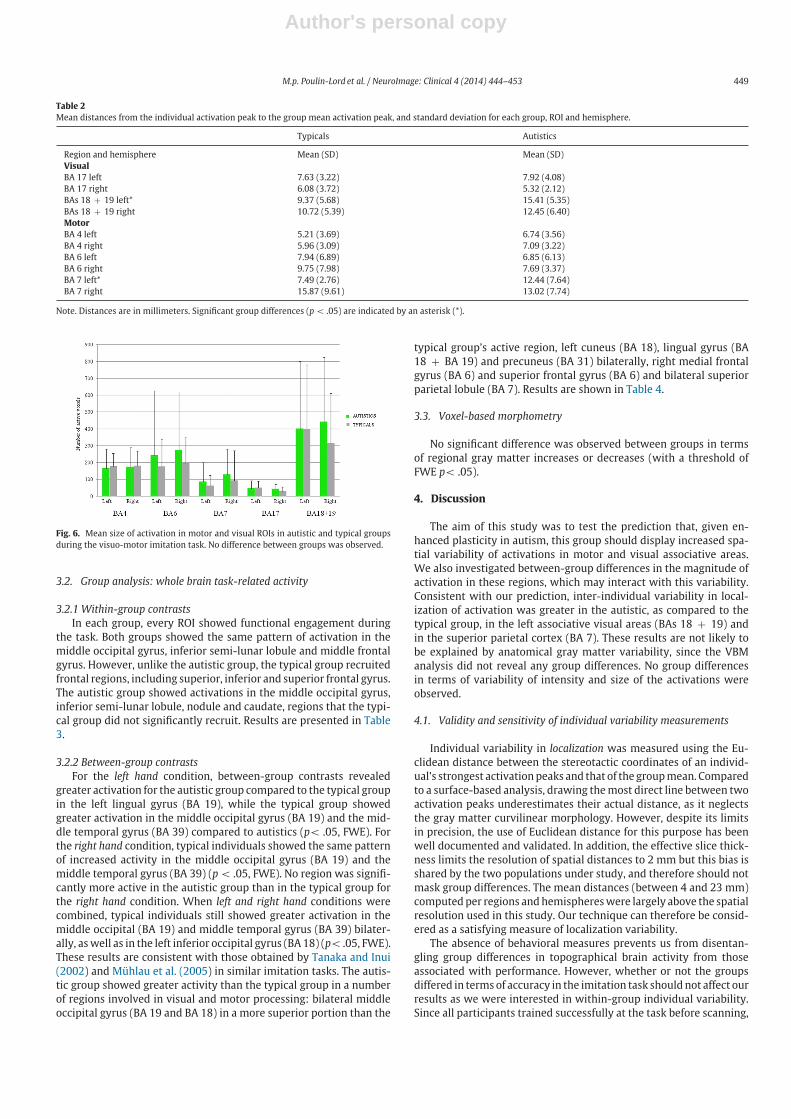
3.1.3 Size of activation
( Fig. 6 ) No significant between-group difference was observed
in the size of activation ( p > .05). Levene’s tests were not significant.
Author's personal copy
M.p. Poulin-Lord et al. / NeuroImage: Clinical 4 (2014) 444–453 449
Table 2
Mean distances from the individual activation peak to the group mean activation peak, and standard deviation for each group, ROI and hemisphere.
Typicals Autistics
Region and hemisphere Mean (SD) Mean (SD)
Visual
BA 17 left 7.63 (3.22) 7.92 (4.08)
BA 17 right 6.08 (3.72) 5.32 (2.12)
BAs 18 + 19 left* 9.37 (5.68) 15.41 (5.35)
BAs 18 + 19 right 10.72 (5.39) 12.45 (6.40)
Motor
BA 4 left 5.21 (3.69) 6.74 (3.56)
BA 4 right 5.96 (3.09) 7.09 (3.22)
BA 6 left 7.94 (6.89) 6.85 (6.13)
BA 6 right 9.75 (7.98) 7.69 (3.37)
BA 7 left* 7.49 (2.76) 12.44 (7.64)
BA 7 right 15.87 (9.61) 13.02 (7.74)
Note. Distances are in millimeters. Significant group differences ( p < .05) are indicated by an asterisk (*).
Fig. 6. Mean size of activation in motor and visual ROIs in autistic and typical groups
during the visuo-motor imitation task. No difference between groups was observed.
3.2. Group analysis: whole brain task-related activity
3.2.1 Within-group contrasts
In each group, every ROI showed functional engagement during
the task. Both groups showed the same pattern of activation in the
middle occipital gyrus, inferior semi-lunar lobule and middle frontal
gyrus. However, unlike the autistic group, the typical group recruited
frontal regions, including superior, inferior and superior frontal gyrus.
The autistic group showed activations in the middle occipital gyrus,
inferior semi-lunar lobule, nodule and caudate, regions that the typi-
cal group did not significantly recruit. Results are presented in Table
3 .
3.2.2 Between-group contrasts
For the left hand condition, between-group contrasts revealed
greater activation for the autistic group compared to the typical group
in the left lingual gyrus (BA 19), while the typical group showed
greater activation in the middle occipital gyrus (BA 19) and the mid-
dle temporal gyrus (BA 39) compared to autistics ( p < .05, FWE). For
the right hand condition, typical individuals showed the same pattern
of increased activity in the middle occipital gyrus (BA 19) and the
middle temporal gyrus (BA 39) ( p < .05, FWE). No region was signifi-
cantly more active in the autistic group than in the typical group for
the right hand condition. When left and right hand conditions were
combined, typical individuals still showed greater activation in the
middle occipital (BA 19) and middle temporal gyrus (BA 39) bilater-
ally, as well as in the left inferior occipital gyrus (BA 18) ( p < .05, FWE).
These results are consistent with those obtained by Tanaka and Inui
(2002 ) and M uhlau et al. (2005 ) in similar imitation tasks. The autis-
tic group showed greater activity than the typical group in a number
of regions involved in visual and motor processing: bilateral middle
occipital gyrus (BA 19 and BA 18) in a more superior portion than the
typical group’s active region, left cuneus (BA 18), lingual gyrus (BA
18 + BA 19) and precuneus (BA 31) bilaterally, right medial frontal
gyrus (BA 6) and superior frontal gyrus (BA 6) and bilateral superior
parietal lobule (BA 7). Results are shown in Table 4 .
3.3. Voxel-based morphometry
No significant difference was observed between groups in terms
of regional gray matter increases or decreases (with a threshold of
FWE p < .05).
4. Discussion
The aim of this study was to test the prediction that, given en-
hanced plasticity in autism, this group should display increased spa-
tial variability of activations in motor and visual associative areas.
We also investigated between-group differences in the magnitude of
activation in these regions, which may interact with this variability.
Consistent with our prediction, inter-individual variability in local-
ization of activation was greater in the autistic, as compared to the
typical group, in the left associative visual areas (BAs 18 + 19) and
in the superior parietal cortex (BA 7). These results are not likely to
be explained by anatomical gray matter variability, since the VBM
analysis did not reveal any group differences. No group differences
in terms of variability of intensity and size of the activations were
observed.
4.1. Validity and sensitivity of individual variability measurements
Individual variability in localization was measured using the Eu-
clidean distance between the stereotactic coordinates of an individ-
ual’s strongest activation peaks and that of the group mean. Compared
to a surface-based analysis, drawing the most direct line between two
activation peaks underestimates their actual distance, as it neglects
the gray matter curvilinear morphology. However, despite its limits
in precision, the use of Euclidean distance for this purpose has been
well documented and validated. In addition, the effective slice thick-
ness limits the resolution of spatial distances to 2 mm but this bias is
shared by the two populations under study, and therefore should not
mask group differences. The mean distances (between 4 and 23 mm)
computed per regions and hemispheres were largely above the spatial
resolution used in this study. Our technique can therefore be consid-
ered as a satisfying measure of localization variability.
The absence of behavioral measures prevents us from disentan-
gling group differences in topographical brain activity from those
associated with performance. However, whether or not the groups
differed in terms of accuracy in the imitation task should not affect our
results as we were interested in within-group individual variability.
Since all participants trained successfully at the task before scanning,

Author's personal copy
450 M.p. Poulin-Lord et al. / NeuroImage: Clinical 4 (2014) 444–453
Table 3
Activity associated with the visuo-motor imitation task in each group.
Left Right
Region label BA x y z t d x y z t d
TYPICALS
Both conditions
Occipital
Middle occipital gyrus 18 −36 −86 −8 52.09 15.92 28 −86 −8 46.93 14.35
−28 −86 4 47.20 14.42
Posterior
Inferior semi-lunar lobule −26 −62 −52 13.30 4.07 30 −60 −52 10.33 3.16
−20 −70 −50 11.41 3.49 20 −72 −48 10.11 3.09
Frontal
Superior frontal gyrus 9 −42 42 32 12.39 3.78
−34 54 32 6.72 2.05
Inferior frontal gyrus 46 52 40 12 9.48 2.89
Middle frontal gyrus 10 42 40 8 6.49 1.98
Superior frontal gyrus 9 38 48 34 9.44 2.88
AUTISTICS
Both conditions
Occipital
Inferior occipital gyrus 18 −34 −84 −10 47.67 14.57
Middle occipital gyrus 18 −30 −88 −2 40.21 12.29 28 −86 −8 45.91 14.03
Posterior
Inferior semi-lunar lobule −18 −62 −52 11.17 3.41 22 −64 −52 9.52 2.91
−28 −58 −52 9.96 3.04 14 −76 −46 8.67 2.65
−14 −72 −48 9.13 2.79
Frontal
Middle frontal gyrus 9 42 46 32 10.17 3.11
36 38 28 6.95 2.14
Anterior lobe
Nodule 2 −56 −34 6.66 2.04
Sub-lobar
Caudate −18 28 −4 6.89 2.11
Note: Specific activations for each group in both conditions (left hand + right hand). The coordinates are in MNI space. BA refers to Brodmann area and d represents Cohen’s
effect size. The critical threshold was t = 5.38, p < .05, FWE. Extent threshold: k = 20 voxels.
and since this elementary task is performed at ceiling level in adults
of average measured intelligence ( Salowitz et al., 2013 ; Williams et
al., 2004 ), the possible role of within-group difference in performance
variability in our findings should be minimal.
Another limitation of this study is that individual variability was
assessed using a single measure per subject. Mueller et al. (2013) used
several measures taken 6 months apart and subtracted intra-subject
variability from overall variability to obtain residual inter-subject
variability. Our single-measure procedure may therefore overesti-
mate inter-subject variability. However, it could not overestimate
group differences in this regard, as the two groups shared this bias.
4.2. Individual variability in localization of visual and motor
activations
4.2.1 Primary and associative visual areas
No difference related to localization of activation was observed in
either left of right primary visual cortices (BA 17). A similar magni-
tude of activation in primary visual areas (BA 17) in both groups is
concordant with Hadjikani et al.’s (2004) findings that the early sen-
sory visual areas are typically organized in autistic adults. Although
a greater variability could be influenced by a greater task-specific
cognitive demand in autistic participants, greater variability param-
eters in the associative than in the primary areas was shared by both
groups. The fact that mean variability in the localization of activations
was higher in the associative than in the primary visual areas for both
groups is consistent with associative areas being more variable than
primary perceptual ones ( Mueller et al., 2013 ). It is also in line with
the increase in variability of localization paralleling the hierarchy of
levels of processing ( Tahmasebi et al., 2012 ).
The main difference between groups in terms of variability resided
in an even greater variability in localization of activation in autistic
than in typical individuals in the left associative visual areas (BAs
18 + 19). The autistic group displayed greater bilateral activation in
the middle occipital gyrus (BA 18 + BA 19), lingual gyrus (BA 18 + BA
19) and precuneus (BA 31), as well as in the left cuneus (BA 18). A
greater variability in associative visual regions in the autistic group is
consistent with the greater implication of the associative visual areas
during tasks involving visual stimuli in autism ( Samson et al., 2012 ),
and particularly BA 18 ( Souli eres et al., 2009 ).
4.2.2 Primary and associative motor-related areas
Following a pattern similar to that of visual regions, mean dis-
tances between the individual activation peak and the group mean
activation peak of each group drastically increased between BA 4 and
BA 7. This trend is more pronounced in autistics, who showed greater
spatial variability of activations in the left hemisphere in BA 7, an
associative visuomotor region, while no difference was observed in
the primary motor area, BA 4, and premotor cortex / SMA, BA 6. BA
7 is localized in the superior parietal cortex and is involved in the
integration of visual and motor information. This region receives af-
ferences from the visual areas and sends information to the premotor
areas (BA 6). The second level analysis revealed that the autistic group
showed greater activation than the typical group in the right medial
and superior frontal gyrus (BA 6) and in the bilateral superior parietal
lobule (BA 7). Increased activation in the superior parietal cortex was
also reported in autism during a visuo-spatial task ( Damarla et al.,
2010 ) and was associated with a greater functional importance of the
visuo-spatial processing in autistics compared to typicals. Our results
are consistent with the behavioral literature of motor skills in autism,
showing an atypical role of sensory–perceptual input / feedback in
autistics when executing a motor task ( Izawa et al., 2012 ; Linkenauger

Author's personal copy
M.p. Poulin-Lord et al. / NeuroImage: Clinical 4 (2014) 444–453 451
Table 4
Between-group differences in the visuo-motor imitation task.
Left Right
Region label BA x y z t d x y z t d
TYPICALS > AUTISTICS
Both conditions
Occipital
Inferior occipital gyrus 18 −40 −86 −4 8.29 2.53
Middle occipital gyrus 19 −30 −84 4 8.40 2.56 44 −74 0 8.48 2.59
Temporal
Middle temporal gyrus 39 −44 −76 14 6.27 2.46 54 −72 10 7.41 2.26
58 −62 4 6.66 2.03
Left hand condition
Occipital
Middle occipital gyrus 19 44 −74 0 6.68 2.59
Temporal
Middle temporal gyrus 39 54 −72 10 6.20 2.26
Right hand condition
Occipital
Middle occipital gyrus 19 −30 −84 4 6.32 2.56
−38 −86 6 6.07 2.34
Temporal
Middle temporal gyrus 39 −46 −76 14 6.70 2.39
AUTISTICS > TYPICALS
Both conditions
Occipital
Middle occipital gyrus 19 −32 −84 18 8.55 2.61
18 38 −92 10 6.33 1.93
14 −94 14 6.76 2.06
Precuneus 31 −20 −76 20 6.60 2.01 26 −78 22 7.67 2.34
Cuneus 18 −2 −86 18 6.58 2.01
Lingual gyrus 19 30 −88 24 6.17 1.88
18 −20 −70 −6 6.72 2.05 18 −72 −8 6.61 2.02
20 −78 −16 6.25 1.91
Parietal
Superior parietal lobule 7 −22 −74 50 7.66 2.38 28 −70 52 6.96 2.12
Postcentral gyrus 2 −32 −28 38 6.21 1.89
Sublobar
Caudate −18 28 −4 6.61 2.02
Frontal
Superior frontal gyrus 8 26 34 52 6.37 1.94
Medial frontal gyrus 6 6 −20 70 6.16 1.88
Left hand condition
Occipital
Lingual gyrus 19 −24 −68 −8 6.00 1.89
Right hand condition
No significant loci
Note. Activity associated with group differences in both conditions (left hand + right hand), left hand condition and right hand condition. The coordinates are in MNI space. BA
refers to Brodmann area and d represents Cohen’s effect size. The critical threshold was t = 5.38, p < .05, FWE. Extent threshold: k = 20 voxels.
et al., 2012 ; Gowen and Hamilton, 2013 ).
4.2.3 Effect of lateralization
The three series of group differences reported here are all limited
to the left hemisphere. This may at least partially result from autistics
displaying an atypical reduction of lateralization in functions which
are usually lateralized in typical individuals. In the autism literature,
most differences in lateralized functions independent of handedness
are in the form of an absence of asymmetry in language-related re-
gions ( Herbert et al., 2002 ; De Foss e et al., 2004 ; Rojas et al. , 2002 ,
2005 ) and face processing areas ( Conturo et al., 2008 ; Kleinhans et al. ,
2008 , 2010 ). However, since the visual and motor functions under
study here are not known to be lateralized, and the variability under
study in this paper is not directly associated with superior activation,
we do not know if this explanation can be applied to the current set
of findings.
4.3. Mechanisms of topographical variability
In the context of atypical microstructural plasticity and multi-
ple de-novo mutations of genes involved in the construction of local
neural networks in autism ( Kelleher and Bear, 2008 ), an increased
variability of cortical functional allocation may be attributed to the
alteration of the neurobiological and experience-dependent plastic-
ity mechanism responsible for this variability in typical individuals
( Mottron et al., 2013 ; Mueller et al., 2013 ). Regions of enhanced vari-
ability in autistics are, at least partially (for visual tasks), overlapping
with regions also displaying an enhanced activity, and are function-
ally associated with peaks of ability ( Souli eres et al., 2009 ). This sug-
gests that this alteration of dominant functional allocation is related
to one of the most specific aspects of autistic cognition. Moreover,
considering that perceptual peaks of performance are not found to
the same extent in autistic people with and without speech onset
delay ( Bonnel et al., 2010 ; Barbeau et al., 2013 ), this variability may
also contribute to the difference between the autism and Asperger
subgroups, based on contrasted speech acquisition and perceptual
performance ( Mottron et al., 2013 ).

Author's personal copy
452 M.p. Poulin-Lord et al. / NeuroImage: Clinical 4 (2014) 444–453
4.4. Methodological consequences of variability
Finally, the fact that individual variability of the functional allo-
cation of brain resources interferes with between-group differences
in activations has important heuristic consequences for future fMRI
studies of autistic people. Our results are consistent with those of
M uller et al. (2001) and Pierce et al. (2001) in that the autism group is
characterized by spatial inconsistencies in the activations across sub-
jects, as can be observed in Figs. 3 and 4 of the present study; sites of
activations specific to one individual are more numerous and distant
in the autism group than in the typical group. Autistic–control fMRI
group differences are usually interpreted as evidence of functional
deficits at the group level ( Gernsbacher, 2007 ). The current study sug-
gests, rather, that hypoactivation at the group level may result from
each individual successfully completing a task using a unique brain
allocation, even by comparison to his own group. This is confirmed by
an ALE meta-analysis ( Samson et al., 2012 ) demonstrating that het-
erotopic activation can coexist with typical group performance. This
highlights the necessity to assume that, for fMRI second level anal-
ysis, autistic samples have unequal variance, particularly when the
task involves motor and perceptive associative regions. We therefore
encourage an investigation of individual variability, including its mea-
surement using distance computation between individual activations
and their group mean activations, or using surface-based analysis.
5. Conclusion
Preliminary investigations of autistic topographical variability in
task-related brain activation ( Pierce et al., 2001 ; Scherf et al., 2010 )
reveal greater and more heterogeneous implication of the associative
visual areas. Our study adds a new element to the interpretation of
this variability: in the visual and motor-related domain, autistics dis-
play an increased functional variability in the regions where typical
individuals also show enhanced topographical variability relative to
other regions, raising the possibility that autism involves an enhance-
ment and / or an alteration of typical plasticity mechanisms.
Acknowledgments
This work was supported by an operating grant from the Canadian
Institutes of Health Research (CIHR, No. MOP-84243 ) to L. Mottron
and a studentship from the CIHR to E.B. Barbeau. The authors want to
thank the participants for their invaluable contribution to this project,
Arnaud Bor e for the images and Agn es Jacob for proof reading the
article.
References
American Psychiatric Association2013. Diagnostic and Statistical Manual of Mental Disorders DSM-5. American Psychiatric Association.
Ashburner, J, 2010. VBM Tutorial. Barbeau, EB, Souli eres, I, Dawson, M, Zeffiro, TA, Mottron, L, 2013. The level and nature
of autistic intelligence III: inspection time. Journal of Abnormal Psychology 122,
295–301. http://dx.doi.org/10.1037/a0029984 , 23088375 . Barnes, SJ, Finnerty, GT, 2010. Sensory experience and cortical rewiring. Neuroscientist
: A Review Journal Bringing Neurobiology, Neurology and Psychiatry 16, 186–98. http://dx.doi.org/10.1177/1073858409343961 , 19801372 .
Baudouin, SJ, Gaudias, J, Gerharz, S, Hatstatt, L, Zhou, K, Punnakkal, P et al, 2012. Shared synaptic pathophysiology in syndromic and nonsyndromic rodent models
of autism. Science (New York, N.Y.) 338, 128–32. http://dx.doi.org/10.1126/science.
1224159 , 22983708 . Ben-David, E, Shifman, S, 2012. Networks of neuronal genes affected by common and
rare variants in autism spectrum disorders. PLOS Genetics 8. http://dx.doi.org/10. 1371/journal.pgen.1002556 , 22412387 .
Bonnel, A, McAdams, S, Smith, B, Berthiaume, C, Bertone, A, Ciocca, V et al, 2010. Enhanced pure-tone pitch discrimination among persons with autism but not
Asperger syndrome. Neuropsychologia 48, 2465–75. http://dx.doi.org/10.1016/j.
neuropsychologia.2010.04.020 , 20433857 . Brainard, DH, 1997. The psychophysics toolbox. Spatial Vision 10, 433–6. http://dx.doi.
org/10.1163/156856897X00357 , 9176952 .
Brun, CC, Lepor e, N, Pennec, X, Lee, AD, Barysheva, M, Madsen, SK et al, 2009. Map-
ping the regional influence of genetics on brain structure variability— a tensor- based morphometry study. NeuroImage 48, 37–49. http://dx.doi.org/10.1016/j.
neuroimage.2009.05.022 , 19446645 . Chung, L, Bey, AL, Jiang, YH, 2012. Synaptic plasticity in mouse models of autism spec-
trum disorders. Korean Journal of Physiology & Pharmacology: Official Journal of
the Korean Physiological Society and the Korean Society of Pharmacology 16, 369–78. http://dx.doi.org/10.4196/kjpp.2012.16.6.369 , 23269898 .
Chung, SC, Sohn, JH, Lee, B, Tack, GR, Yi, JH, You, JH et al, 2007. A comparison of the mean signal change method and the voxel count method to evaluate the sensitivity of
individual variability in visuospatial performance. Neuroscience Letters 418, 138–42. http://dx.doi.org/10.1016/j.neulet.2007.03.014 , 17379407 .
Conturo, TE, Williams, DL, Smith, CD, Gultepe, E, Akbudak, E, Minshew, NJ, 2008. Neu- ronal fiber pathway abnormalities in autism: an initial MRI diffusion tensor tracking
study of hippocampo-fusiform and amygdalo-fusiform pathways. Journal of the
International Neuropsychological Society 14, 933–46. http://dx.doi.org/10.1017/ S1355617708081381 , 18954474 .
Damarla, SR, Keller, TA, Kana, RK, Cherkassky, VL, Williams, DL, Minshew, NJ et al, 2010. Cortical underconnectivity coupled with preserved visuospatial cognition
in autism: evidence from an fMRI study of an embedded figures task. Autism
Research: Official Journal of the International Society for Autism Research 3, 273–
9. http://dx.doi.org/10.1002/aur.153 , 20740492 .
Foss e L, De, Hodge, SM, Makris, N, Kennedy, DN, Caviness, VS Jr., McGrath, L et al, 2004. Language-association cortex asymmetry in autism and specific language im-
pairment. Annals of Neurology 56, 757–66. http://dx.doi.org/10.1002/ana.20275 , 15478219 .
Dinstein, I, Thomas, C, Humphreys, K, Minshew, N, Behrmann, M, Heeger, DJ, 2010. Normal movement selectivity in autism. Neuron 66, 461–9. http://dx.doi.org/10.
1016/j.neuron.2010.03.034 , 20471358 .
Gernsbacher, MA, 2007. The eye of the beholder. Observer 20 (5), 44. Gowen, E, Hamilton, A, 2013. Motor abilities in autism: a review using a computational
context. Journal of Autism and Developmental Disorders 43, 323–44. http://dx.doi. org/10.1007/s10803- 012- 1574- 0 , 22723127 .
Hadjikhani, N, Chabris, CF, Joseph, RM, Clark, J, McGrath, L, Aharon, I et al, 2004. Early visual cortex organization in autism: an fMRI study. Neuroreport 15, 267–70.
http://dx.doi.org/10.1097/00001756- 200402090- 00011 , 15076750 .
Herbert, MR, Harris, GJ, Adrien, KT, Ziegler, DA, Makris, N, Kennedy, DN et al, 2002. Ab- normal asymmetry in language association cortex in autism. Annals of Neurology
52, 588–96. http://dx.doi.org/10.1002/ana.10349 , 12402256 . Izawa, J, Pekny, SE, Marko, MK, Haswell, CC, Shadmehr, R, Mostofsky, SH, 2012. Mo-
tor learning relies on integrated sensory inputs in ADHD, but over-selectively on proprioception in autism spectrum conditions. Autism Research = : Official Journal
of the International Society for Autism Research 5, 124–36. http://dx.doi.org/10.
1002/aur.1222 , 22359275 . Kelleher, RJ 3rd, Bear, MF, 2008. The autistic neuron: troubled translation? Cell 135,
401–6. http://dx.doi.org/10.1016/j.cell.2008.10.017 , 18984149 . Kleiner M, Brainard D, Pelli D, What’s new in Psychtoolbox-3? Perception 36 (2007)
ECVP Abstract Supplement. Kleinhans, NM, Richards, T, Johnson, LC, Weaver, KE, Greenson, J, Dawson, G et al, 2011.
fMRI evidence of neural abnormalities in the subcortical face processing system in ASD. NeuroImage 54, 697–704, 20656041 .
Kleinhans, NM, Richards, T, Sterling, L, Stegbauer, KC, Mahurin, R, Johnson, LC et al,
2008. Abnormal functional connectivity in autism spectrum disorders during face processing. Brain : A Journal of Neurology 131, 1000–12. http://dx.doi.org/10.1093/
brain/awm334 , 18234695 . Linkenauger, SA, Lerner, MD, Ramenzoni, VC, Proffitt, DR, 2012. A perceptual-
motor deficit predicts social and communicative impairments in individuals with autism spectrum disorders. Autism Research = : Official Journal of the Interna-
tional Society for Autism Research 5, 352–62. http://dx.doi.org/10.1002/aur.1248 ,
22961977 . Lord, C, Rutter, M, Goode, S, Heemsbergen, J, Jordan, H, Mawhood, L et al, 1989. Autism
diagnostic observation schedule: a standardized observation of communicative and social behavior. Journal of Autism and Developmental Disorders 19, 185–212.
http://dx.doi.org/10.1007/BF02211841 , 2745388 . Lord, C, Rutter, M, Couteur A, Le, 1994. Autism Diagnostic Interview — Revised: a revised
version of a diagnostic interview for caregivers of individuals with possible perva-
sive developmental disorders. Journal of Autism and Developmental Disorders 24, 659–85. http://dx.doi.org/10.1007/BF02172145 , 7814313 .
Maldjian, JA, Laurienti, PJ, Burdette, JH, 2004. Precentral gyrus discrepancy in electronic versions of the Talairach atlas. NeuroImage 21, 450–5. http://dx.doi.org/10.1016/j.
neuroimage.2003.09.032 , 14741682 . Maldjian, JA, Laurienti, PJ, Kraft, RA, Burdette, JH, 2003. An automated method
for neuroanatomic and cytoarchitectonic atlas-based interrogation of fMRI data
sets. NeuroImage 19, 1233–9. http://dx.doi.org/10.1016/S1053- 8119(03)00169- 1 , 12880848 .
Markram, K, Markram, H, 2010. The intense world theory — a unifying theory of the neurobiology of autism. Frontiers in Human Neuroscience 4, 224, 21191475 .
Mottron, L, Bouvet, L, Bonnel, A, Samson, F, Burack, JA, Dawson, M et al, 2013. Veridical mapping in the development of exceptional autistic abilities. Neuroscience and
Biobehavioral Reviews 37, 209–28. http://dx.doi.org/10.1016/j.neubiorev.2012.11.
016 , 23219745 . Mueller, S, Wang, D, Fox, MD, Yeo, BT, Sepulcre, J, Sabuncu, MR et al, 2013. Individual
variability in functional connectivity architecture of the human brain. Neuron 77, 586–95. http://dx.doi.org/10.1016/j.neuron.2012.12.028 , 23395382 .
M uhlau, M, Hermsd orfer, J, Goldenberg, G, Wohlschl ager, AM, Castrop, F, Stahl, R et al,

Author's personal copy
M.p. Poulin-Lord et al. / NeuroImage: Clinical 4 (2014) 444–453 453
2005. Left inferior parietal dominance in gesture imitation: an fMRI study. Neu-
ropsychologia 43, 1086–98. http://dx.doi.org/10.1016/j.neuropsychologia.2004.10. 004 .
M uller, RA, Cauich, C, Rubio, MA, Mizuno, A, Courchesne, E, 2004. Abnormal activity patterns in premotor cortex during sequence learning in autistic patients. Bio-
logical Psychiatry 56, 323–32. http://dx.doi.org/10.1016/j.biopsych.2004.06.007 ,
15336514 . M uller, RA, Kleinhans, N, Kemmotsu, N, Pierce, K, Courchesne, E, 2003. Abnormal vari-
ability and distribution of functional maps in autism: an fMRI study of visuomotor learning. American Journal of Psychiatry 160, 1847–62. http://dx.doi.org/10.1176/
appi.ajp.160.10.1847 , 14514501 . M uller, RA, Pierce, K, Ambrose, JB, Allen, G, Courchesne, E, 2001. Atypical patterns of
cerebral motor activation in autism: a functional magnetic resonance study. Bio- logical Psychiatry 49, 665–76. http://dx.doi.org/10.1016/S0006- 3223(00)01004- 0 ,
11313034 .
Newschaffer, CJ, Croen, LA, Daniels, J, Giarelli, E, Grether, JK, Levy, SE et al, 2007. The epidemiology of autism spectrum disorders. Annual Review of Pub-
lic Health 28, 235–58. http://dx.doi.org/10.1146/annurev.publhealth.28.021406. 144007 , 17367287 .
Nickl-Jockschat, T, Habel, U, Michel, TM, Manning, J, Laird, AR, Fox, PT et al, 2012. Brain structure anomalies in autism spectrum disorder — a meta-analysis of VBM
studies using anatomic likelihood estimation. Human Brain Mapping 33, 1470–89.
http://dx.doi.org/10.1002/hbm.21299 , 21692142 . Oldfield, RC, 1971. The assessment and analysis of handedness: the Edinburgh in-
ventory. Neuropsychologia 9, 97–113. http://dx.doi.org/10.1016/0028-3932(71) 90067-4 , 5146491 .
Pelli, DG, 1997. The VideoToolbox software for visual psychophysics: transform- ing numbers into movies. Spatial Vision 10, 437–42. http://dx.doi.org/10.1163/
156856897X00366 , 9176953 .
Pierce, K, M uller, RA, Ambrose, J, Allen, G, Courchesne, E, 2001. Face processing occurs outside the fusiform ‘face area ’ in autism: evidence from functional MRI. Brain : A
Journal of Neurology 124, 2059–73. http://dx.doi.org/10.1093/brain/124.10.2059 , 11571222 .
Raven, J, 1976. Progressive Matrices. Toronto, Canada: Psychological Corporation. Rojas, DC, Bawn, SD, Benkers, TL, Reite, ML, Rogers, SJ, 2002. Smaller left hemisphere
planum temporale in adults with autistic disorder. Neuroscience Letters 328, 237–
40. http://dx.doi.org/10.1016/S0304- 3940(02)00521- 9 , 12147315 . Rojas, DC, Camou, SL, Reite, ML, Rogers, SJ, 2005. Planum temporale volume in children
and adolescents with autism. Journal of Autism and Developmental Disorders 35,
479–86. http://dx.doi.org/10.1007/s10803- 005- 5038- 7 , 16134033 .
Salowitz, NM, Eccarius, P, Karst, J, Carson, A, Schohl, K, Stevens, S et al, 2013. Brief report: visuo-spatial guidance of movement during gesture imitation and mirror
drawing in children with autism spectrum disorders. Journal of Autism and Devel- opmental Disorders 43, 985–95. http://dx.doi.org/10.1007/s10803- 012- 1631- 8 ,
22898762 .
Samson, F, Mottron, L, Souli eres, I, Zeffiro, TA, 2012. Enhanced visual functioning in autism: an ALE meta-analysis. Human Brain Mapping 33, 1553–81. http://dx.doi.
org/10.1002/hbm.21307 , 21465627 . Scherer, SW, Dawson, G, 2011. Risk factors for autism: translating genomic discov-
eries into diagnostics. Human Genetics 130, 123–48. http://dx.doi.org/10.1007/ s00439- 011- 1037- 2 , 21701786 .
Scherf, KS, Luna, B, Minshew, N, Behrmann, M, 2010. Location, location, location: alter- ations in the functional topography of face- but not object- or place-related cortex
in adolescents with autism. Frontiers in Human Neuroscience 4, 26, 20631857 .
Souli eres, I, Dawson, M, Samson, F, Barbeau, EB, Sahyoun, CP, Strangman, GE et al, 2009. Enhanced visual processing contributes to matrix reasoning in
autism. Human Brain Mapping 30, 4082–107. http://dx.doi.org/10.1002/hbm. 20831 , 19530215 .
Tahmasebi, AM, Davis, MH, Wild, CJ, Rodd, JM, Hakyemez, H, Abolmaesumi, P et al, 2012. Is the link between anatomical structure and function equally strong at all
cognitive levels of processing? Cerebral Cortex (New York, N.Y. : 1991) 22, 1593–
603. http://dx.doi.org/10.1093/cercor/bhr205 , 21893681 . Tanaka, S, Inui, T, 2002. Cortical involvement for action imitation of hand / arm postures
versus finger configurations: an fMRI study. Neuroreport 13, 1599–602. http://dx. doi.org/10.1097/00001756- 200209160- 00005 , 12352609 .
Wallace, GL, Robustelli, B, Dankner, N, Kenworthy, L, Giedd, JN, Martin, A, 2013. In- creased gyrification, but comparable surface area in adolescents with autism spec-
trum disorders. Brain : A Journal of Neurology 136, 1956–67. http://dx.doi.org/10.
1093/brain/awt106 , 23715094 . Williams, JH, Whiten, A, Singh, T, 2004. A systematic review of action imitation in
autistic spectrum disorder. Journal of Autism and Developmental Disorders 34, 285–99. http://dx.doi.org/10.1023/B:JADD.0000029551.56735.3a , 15264497 .
Zoghbi, HY, Bear, MF, 2012. Synaptic dysfunction in neurodevelopmental disorders as- sociated with autism and intellectual disabilities. Cold Spring Harbor Perspectives
in Biology 4, 22258914 .
Copyright © 2022 FDOKUMEN