Consumer Intention to Participate in E-Waste ... - MDPI
28
sustainability Article Consumer Intention to Participate in E-Waste Collection Programs: A Study of Smartphone Waste in Indonesia Diana Puspita Sari 1,2, *, Nur Aini Masruroh 1 and Anna Maria Sri Asih 1 Citation: Sari, D.P.; Masruroh, N.A.; Asih, A.M.S. Consumer Intention to Participate in E-Waste Collection Programs: A Study of Smartphone Waste in Indonesia. Sustainability 2021, 13, 2759. https://doi.org/ 10.3390/su13052759 Received: 25 December 2020 Accepted: 28 February 2021 Published: 4 March 2021 Publisher’s Note: MDPI stays neutral with regard to jurisdictional claims in published maps and institutional affil- iations. Copyright: © 2021 by the authors. Licensee MDPI, Basel, Switzerland. This article is an open access article distributed under the terms and conditions of the Creative Commons Attribution (CC BY) license (https:// creativecommons.org/licenses/by/ 4.0/). 1 Department of Mechanical and Industrial Engineering, Universitas Gadjah Mada, Yogyakarta 55281, Indonesia; [email protected] (N.A.M.); [email protected] (A.M.S.A.) 2 Department of Industrial Engineering, Diponegoro University, Semarang 50275, Indonesia * Correspondence: [email protected] Abstract: Indonesia is a developing country with a low-level e-waste management system based on a limited number of informal initiatives. E-waste requires proper management procedures, which involve the design of a reverse logistics management network. Consumers play a critical role in such a network, because the network runs when they willingly participate as suppliers of waste. This paper applies the Theory of Planned Behavior framework and extends it using reverse logistics drivers, the value belief norm theory, and facility accessibility to explain consumer intention to participate in e-waste collection programs. A survey was conducted on smartphone users in Indonesia, with a total of 324 valid questionnaires. The results showed that government drivers, facility accessibility, and personal attitudes significantly influence consumer intentions. Environmental concern has a positive influence on consumer intentions through the variables of the Theory of Planned Behavior and perceived behavioral control through government drivers. This study shows the need for integration, because the variables reinforce each other. However, neither economic drivers nor subjective norms significantly influence consumer intentions. This finding distinguishes Indonesia from other countries, especially developed countries, in that e-waste collection programs have not become part of the culture in Indonesia. For this reason, Indonesia needs regulations, as the most influential variable, to regulate the implementation of such a program. Keywords: Theory of Planned Behavior; reverse logistics drivers; value belief norm theory; facility accessibility; consumer intentions; e-waste 1. Introduction The rapid development of technology and the economy in the last few decades has led to a more diverse choice of electronic products at an affordable price, thus increasing their consumption [1]. When people’s consumption of electronic products increases, the potential for e-waste also rises. Electronic waste (e-waste) management has become one of the most challenging problems worldwide, especially in developing countries [2]. This is because it is one of the fastest-growing waste categories globally, reaching an annual growth rate of 3–5% [3]. Developing countries, such as Indonesia, struggle to handle large volumes of e-waste [4]. The Global E-waste Monitor 2017—Quantities, Flows, and Resources—states that the e-waste produced by the Indonesian population is estimated to have been 1.274 million tons or an average of 4.9 kg per capita in 2016. These data position Indonesia as the 9th producer of e-waste worldwide. Smartphones are among the electronic products with the largest proportion of e-waste. Due to the coronavirus pandemic, there was a surge in smartphone usage worldwide. During this pandemic, people worked and studied online, leading to electronic commu- nication devices, especially smartphones. The usage proportions are 70%, 40%, and 32% for smartphones, laptops, and personal computers, respectively [5]. However, the high potential for this flow has not been matched by good waste management [6]. In Indonesia, no regulations control the system for collecting and transporting e-waste until the final Sustainability 2021, 13, 2759. https://doi.org/10.3390/su13052759 https://www.mdpi.com/journal/sustainability
-
Upload
khangminh22 -
Category
Documents
-
view
0 -
download
0
Transcript of Consumer Intention to Participate in E-Waste ... - MDPI
sustainability
Article
Consumer Intention to Participate in E-Waste CollectionPrograms: A Study of Smartphone Waste in Indonesia
Diana Puspita Sari 1,2,*, Nur Aini Masruroh 1 and Anna Maria Sri Asih 1
�����������������
Citation: Sari, D.P.; Masruroh, N.A.;
Asih, A.M.S. Consumer Intention to
Participate in E-Waste Collection
Programs: A Study of Smartphone
Waste in Indonesia. Sustainability
2021, 13, 2759. https://doi.org/
10.3390/su13052759
Received: 25 December 2020
Accepted: 28 February 2021
Published: 4 March 2021
Publisher’s Note: MDPI stays neutral
with regard to jurisdictional claims in
published maps and institutional affil-
iations.
Copyright: © 2021 by the authors.
Licensee MDPI, Basel, Switzerland.
This article is an open access article
distributed under the terms and
conditions of the Creative Commons
Attribution (CC BY) license (https://
creativecommons.org/licenses/by/
4.0/).
1 Department of Mechanical and Industrial Engineering, Universitas Gadjah Mada,Yogyakarta 55281, Indonesia; [email protected] (N.A.M.); [email protected] (A.M.S.A.)
2 Department of Industrial Engineering, Diponegoro University, Semarang 50275, Indonesia* Correspondence: [email protected]
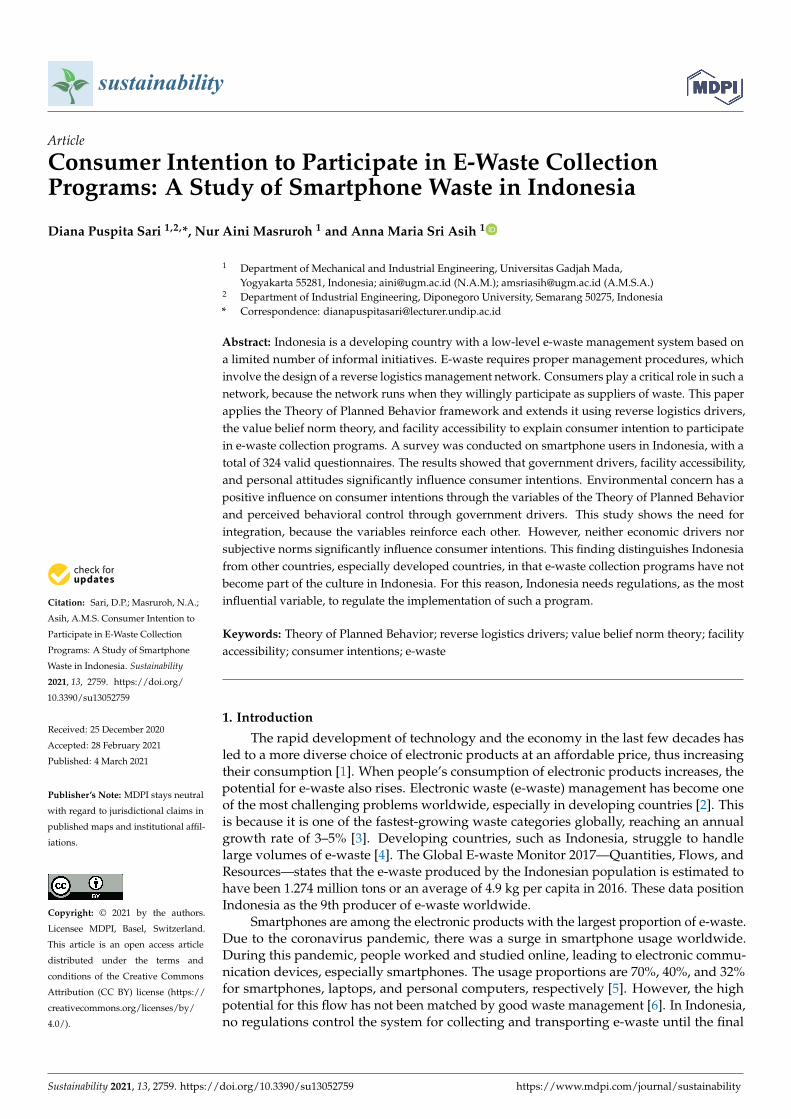
Abstract: Indonesia is a developing country with a low-level e-waste management system based ona limited number of informal initiatives. E-waste requires proper management procedures, whichinvolve the design of a reverse logistics management network. Consumers play a critical role in such anetwork, because the network runs when they willingly participate as suppliers of waste. This paperapplies the Theory of Planned Behavior framework and extends it using reverse logistics drivers,the value belief norm theory, and facility accessibility to explain consumer intention to participatein e-waste collection programs. A survey was conducted on smartphone users in Indonesia, with atotal of 324 valid questionnaires. The results showed that government drivers, facility accessibility,and personal attitudes significantly influence consumer intentions. Environmental concern has apositive influence on consumer intentions through the variables of the Theory of Planned Behaviorand perceived behavioral control through government drivers. This study shows the need forintegration, because the variables reinforce each other. However, neither economic drivers norsubjective norms significantly influence consumer intentions. This finding distinguishes Indonesiafrom other countries, especially developed countries, in that e-waste collection programs have notbecome part of the culture in Indonesia. For this reason, Indonesia needs regulations, as the mostinfluential variable, to regulate the implementation of such a program.
Keywords: Theory of Planned Behavior; reverse logistics drivers; value belief norm theory; facilityaccessibility; consumer intentions; e-waste
1. Introduction
The rapid development of technology and the economy in the last few decades hasled to a more diverse choice of electronic products at an affordable price, thus increasingtheir consumption [1]. When people’s consumption of electronic products increases, thepotential for e-waste also rises. Electronic waste (e-waste) management has become oneof the most challenging problems worldwide, especially in developing countries [2]. Thisis because it is one of the fastest-growing waste categories globally, reaching an annualgrowth rate of 3–5% [3]. Developing countries, such as Indonesia, struggle to handlelarge volumes of e-waste [4]. The Global E-waste Monitor 2017—Quantities, Flows, andResources—states that the e-waste produced by the Indonesian population is estimated tohave been 1.274 million tons or an average of 4.9 kg per capita in 2016. These data positionIndonesia as the 9th producer of e-waste worldwide.
Smartphones are among the electronic products with the largest proportion of e-waste.Due to the coronavirus pandemic, there was a surge in smartphone usage worldwide.During this pandemic, people worked and studied online, leading to electronic commu-nication devices, especially smartphones. The usage proportions are 70%, 40%, and 32%for smartphones, laptops, and personal computers, respectively [5]. However, the highpotential for this flow has not been matched by good waste management [6]. In Indonesia,no regulations control the system for collecting and transporting e-waste until the final
Sustainability 2021, 13, 2759. https://doi.org/10.3390/su13052759 https://www.mdpi.com/journal/sustainability

Sustainability 2021, 13, 2759 2 of 28
processing. The United Nations University ranks the waste management system in Indone-sia at the lowest level, because it is still limited to informal initiatives. This managementpattern differentiates Indonesia from developed countries [7].
Improper waste handling can cause environmental pollution. In general, e-waste isone of the most ozone-depleting substances, with high environmental impacts [8]. For thisreason, it is necessary to design an e-waste management system to aid in the minimizationof the impact on the environment and increase the economic value of waste. While e-wasteis classified as hazardous waste, it has a significant value recovery potential [3]. Due to thenegative impacts on humans and the environment caused by the mishandling of e-waste,proper e-waste management procedures, including a reverse logistics (RL) managementnetwork, should be in place. RL reuses used products in order to reduce waste and improveindustrial environmental performance [9]. Goods and information flow in the oppositedirection from forward logistics activities, which support a product and return goods forrecycling, manufacturing, reuse, or destruction for disposal [10]. Collection is the startingpoint of the RL process, with the consumer as the supplier. A sorting process is then carriedout, and the appropriate further handling process is determined, which may include repair-ing, reusing, remanufacturing, recycling, or disposing of the waste [11]. RL drivers includethe economy, laws and regulations, and corporate responsibility [12,13]. Srivastava [14]and Mwanza et al. [15] also stated that the economy and laws and regulations are thedriving factors of the implementation of RL, but the third factor is not the company’sresponsibility, but rather environmental concern. This contradicts Chileshe et al. [16] andChiou et al. [17], who stated that economic, environmental, and social factors drive thesuccess of RL in practice. Encouragement from consumers who are aware of environmentalfriendliness and government support are two external factors that play an essential role inencouraging RL’s creation [18]. Agrawal et al. [19] stated that the most important drivingfactors for RL in practice are 12 supporting factors, including government regulations; eco-nomic factors; environmental concern; top management awareness; resource management;management information systems; requirements and contract terms; direct and indirecttaxes; forward and backward supply chain integration, joint consortia, process capabilities,and skilled workers; and consumer awareness and social acceptance. According to Manglaet al. [20], RL practice is driven by regulatory, human and organizational, economic, andstrategic factors.
The collection and management of waste is an effort to create a sustainable supplychain. For this reason, an e-waste RL management network whose implementation issupervised and regulated by the government is needed. Consumers play a critical role inthe successful implementation of waste management networks. Whether the network oper-ates or not is contingent upon consumers’ willingness to participate as suppliers of waste.The Theory of Planned Behavior (TPB) model is often used to analyze consumer behavior.Research related to consumer behavior in relation to environmental issues using TPB hasbeen conducted. TPB is used to analyze the end-of-life (EoL) handling of recycling [21–26].Santoso and Farizal [27] measured community participation in household waste man-agement, while Arifani and Haryanto [28], Chen and Deng [29], Yadav and Pathak [30],Liobikiene et al. [31], and Mancha and Yoder [32] used TPB to analyze green behavior.Pramod [33] and Tolkes and Butzmann [34] analyzed pro-environmental behavior in gen-eral. Apart from TPB, the Norm Activation Model (NAM) is often used. Werff et al. [35] andZhang et al. [36] used NAM to analyze EoL behavior. Similarly, Moller et al. [37] used NAMto analyze behavior in the transportation sector, while in [38], NAM is used to determinebehavior in relation to clothing consumption and reduce it. Pro-environmental behaviorhas been determined on the basis of NAM [39–42]. Another model commonly used isthe Value Belief Norm Theory (VBNT). It was used by Dursun et al. [43], for example,to analyze responsible post-consumption behavior in the form of recycling and reuse intransport. Additionally, Liobikiene and Poškus [44], Ghazali et al. [45], Han et al. [46], andWynveen et al. [47] used it to analyze pro-environmental consumer behavior.
Sustainability 2021, 13, 2759 3 of 28
TPB is one of the most frequently used theoretical models to explain the relationshipbetween intention and behavior. According to this model, behavior is determined bypersonal intention, which is, in turn, based on attitude, subjective norms, and perceivedbehavioral control. However, TPB has often been criticized for contradicting the weakcorrelation of attitudes in social psychological studies [48]. In pro-environmental behavior,individual attitudes reflect personal norms regarding environmental protection. In thecontext of pro-environmental behavior, individual attitudes reflect personal norms towardsenvironmental protection. However, the influence of personal norms on behavior issimplified in the TPB model, so it is necessary to include indicators of personal normsin the further development of the TPB model [36]. NAM highlights the importance ofpersonal norms for predicting individual behavior. Several studies have expanded the TPBmodel by integrating NAM [36,49–51]. VBNT combines the components of values andnorms from NAM and the New Environmental Paradigm (NEP), including common beliefsand concerns about the environment and the need for action to address problems [44].
The purpose of this study is to analyze consumer intention to participate in e-wastecollection programs using the TPB model, which is extended by employing RL drivers andthe values of NEP from VNBT and accessibility facility. Consumers bring their used smart-phones to collection centers provided by the government or organizations. They participatein e-waste collection programs by bringing their used smartphones to collection centers.This study explores the factors that influence consumer intention to participate in e-wastecollection programs and provides suggestions for improvements. The main objective of thewaste management process is to protect the environment. TPB is disadvantageous becauseit is not explicitly structured to recognize moral support for environmental action, and itdoes not offer psychological constructs to support moral pro-environmental behavior [48].By integrating TPB and VBNT, the TPB model is refined by emphasizing morality, whichcombines components of values and norms with a new environmental paradigm. TPBis based on self-interest and considerations following rational choices (factors that reflectperceived attitudes and possibilities), while VBNT focuses on moral values and norms [52].The values of the new environmental paradigm from the VBNT include biospheric, al-truistic, and egoistic values [53]. The integration of TPB and VBNT was used to assessthe effect of altruistic values on purchasing decisions in relation to energy-efficient equip-ment [54] and investigate the intention to purchase organic food [55] in Vietnam, SoutheastAsia. Waste collection activities are highly dependent on the participation of consumers assuppliers. RL drivers encourage companies to carry out reverse logistics activities, whichpromote consumer participation [56]. Previous studies showed that there are three mainsupporting factors that have been agreed upon: economic reasons, government regulations,and concern for the environment [14,15,18,19]. This study includes facility accessibility,because consumers need easy access to collection centers for participating in e-waste collec-tion programs. According to Zhang et al. [36] and Zhang et al. [48], facility accessibilitysignificantly affects waste sorting behavior and individual intentions to recycle waste.
2. Conceptual Models and Hypotheses
Consumers play a critical role as suppliers in reverse logistics activities. An actiontaken by a consumer has an impact on reverse logistics activities [57]. Specifically, consumerbehavior affects the effectiveness of reverse logistics activities, including reusing, recycling,and remanufacturing waste, as well as participation in waste management [56].
The intention to behave in a certain way is a stage where a person wishes to performcertain actions or behaviors. It is the direct antecedent of behavior [58] and is accepted asits best predictor because it represents a person’s motivation to exert effort in order to actor behave in a certain way [59,60].
Reverse logistics drivers are factors that influence consumer intention to participatein e-waste collection programs. When these factors encourage companies to carry outreverse logistics activities, they affect consumer participation behavior [56]. Reverse logis-
Sustainability 2021, 13, 2759 4 of 28
tics drivers include government drivers and economic drivers, as well as environmentalconcern [14,15,18,19].
According to Verma et al. [61], environmental concern is influenced by the new envi-ronmental paradigm (NEP) from the VBNT, including biospheric, altruistic, and egoisticvalues. VBNT includes values and personal norms that are not considered in the TPB [48].In this study, personal attitudes, specifically the integration of personal norms and attitudes,are used [36]. Environmental concern can have a direct effect on behavioral intentionsand an indirect effect by passing the TPB variables first, which include attitudes, sub-jective norms, and perceived behavioral control [62,63]. According to Verma et al. [61],Prakash et al. [64], and Setyawan et al. [65], only one TPB variable is passed, namely, the atti-tude before the intention variable. Facility accessibility, besides having a significant positiveeffect on consumer intentions, also significantly affects perceived behavioral control, whichis one of the TPB variables [36]. Perceived behavioral control indirectly affects consumers’intention to participate through government drivers as a mediator variable [56,66,67].
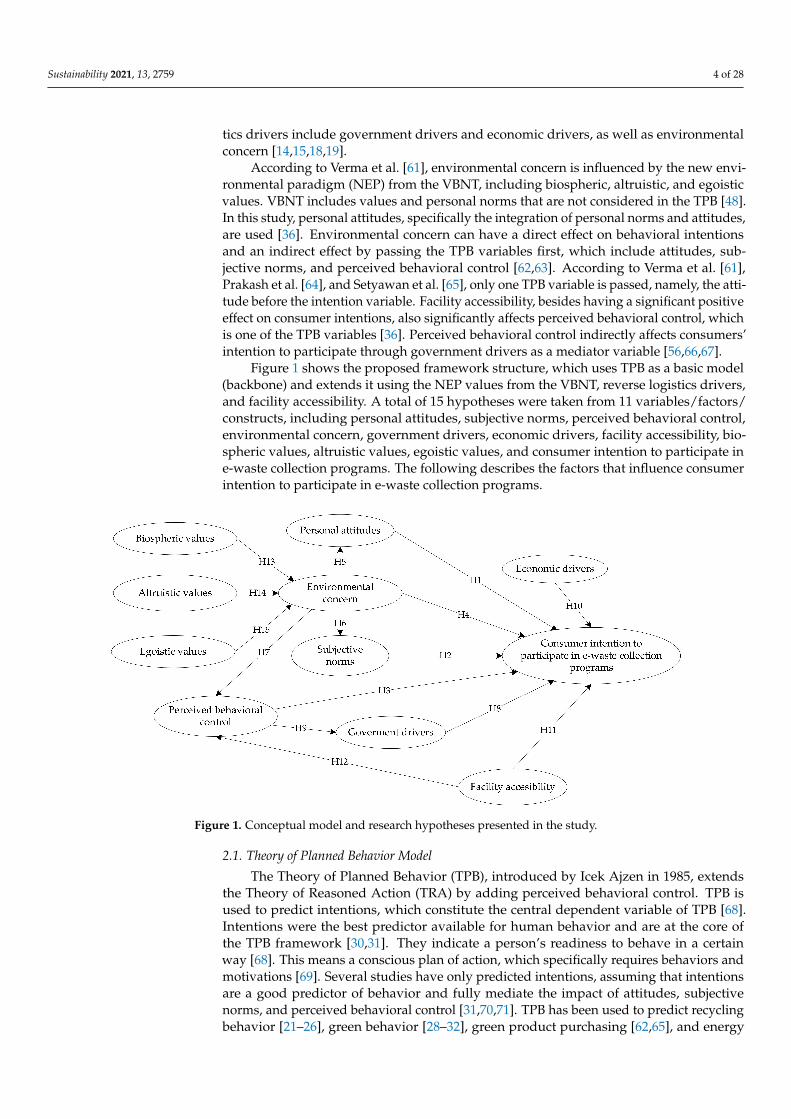
Figure 1 shows the proposed framework structure, which uses TPB as a basic model(backbone) and extends it using the NEP values from the VBNT, reverse logistics drivers,and facility accessibility. A total of 15 hypotheses were taken from 11 variables/factors/constructs, including personal attitudes, subjective norms, perceived behavioral control,environmental concern, government drivers, economic drivers, facility accessibility, bio-spheric values, altruistic values, egoistic values, and consumer intention to participate ine-waste collection programs. The following describes the factors that influence consumerintention to participate in e-waste collection programs.
Figure 1. Conceptual model and research hypotheses presented in the study.
2.1. Theory of Planned Behavior Model
The Theory of Planned Behavior (TPB), introduced by Icek Ajzen in 1985, extendsthe Theory of Reasoned Action (TRA) by adding perceived behavioral control. TPB isused to predict intentions, which constitute the central dependent variable of TPB [68].Intentions were the best predictor available for human behavior and are at the core ofthe TPB framework [30,31]. They indicate a person’s readiness to behave in a certainway [68]. This means a conscious plan of action, which specifically requires behaviors andmotivations [69]. Several studies have only predicted intentions, assuming that intentionsare a good predictor of behavior and fully mediate the impact of attitudes, subjectivenorms, and perceived behavioral control [31,70,71]. TPB has been used to predict recyclingbehavior [21–26], green behavior [28–32], green product purchasing [62,65], and energy
Sustainability 2021, 13, 2759 5 of 28
conservation [72]. Several studies conducted in developing countries in the SoutheastAsia region have used the TPB to analyze intentions to adopt climate change mitigationbehavior, green purchase behavior, and recycling behavior [73–75].
2.1.1. Personal Norms and Attitudes
An attitude towards a behavior refers to the extent to which a person has a favorable orunfavorable evaluation of a certain behavior [68]. This is an interaction in memory betweena given object and a summary of its evaluation [62]. An attitude is a psychological emotion,which is directed through consumer evaluation. A behavior tends to be more positiveif the psychological emotion is positive [76]. Personal norms are intrinsic factors thatreflect individual subjective desires and relate to self-expectations and individual attitudesstemming from related norms and values regarding certain behaviors [36]. Collectingpost-use products is an altruistic behavior, where people need to sacrifice their time andconvenience for the benefit of recycling practices. A person’s intention to engage inaltruistic behavior in collecting waste cannot be cultivated without the intrinsic motivationof personal norms. Previous studies show that the behavioral intention to buy greenproducts and engage in waste recycling depends on attitudes [21,23,29,30,62,63]. Personalnorms significantly influence the behavioral intention to reduce clothing consumptionand purchase green products [38,41,47]. According to Liu et al. [49] and Zhang et al. [36],the integration between attitudes and personal norms has a significant positive effect onreducing car travel intentions and increasing waste-sorting intentions. By combining TPBand VBNT, personal norms and attitudes, referred to as personal attitudes, are likely toincrease waste collection behavior, which can be explained through behavioral intentions.Therefore, the following hypothesis was formulated.
Hypothesis 1 (H1). Personal attitudes are positively related to consumer intention to participatein e-waste collection programs.
2.1.2. Subjective Norms
In the TPB model, the second antecedent of a behavioral intention is a subjective norm,which is a felt social pressure to do or not do something [62,68], highlighting the influence ofother people who are close/important to the actors, such as family, close friends, relatives,and colleagues. Consumers with positive subjective norms often have positive behavioralintentions [70]. Subjective norms promote the intention to recycle agricultural waste inChina [77] and encourage the behavioral intention to recycle plastic waste in developingcountries [78]. For this reason, the following hypothesis was formulated.
Hypothesis 2 (H2). Subjective norms are positively related to consumer intention to participatein e-waste collection programs.
2.1.3. Perceived Behavioral Control
The third TPB antecedent is perceived behavioral control, which is the ease or diffi-culty that a person feels in performing certain behaviors [62]. Perceived behavioral controland motivation determine behavior [79]. According to Coskun et al. [80], it is the mostimportant predictor of the intention to reduce food waste among all TPB independentvariables. There was a positive relationship between perceived behavioral control andwaste sorting behavior associated with household kitchens in Beijing, China [81]. Simi-larly, Nguyen et al. [75] proved that there is a significant relationship between perceivedbehavioral control and the intention to separate household waste in developed countriesusing case studies in Vietnam. Nadlifatin et al. [66] and Persada et al. [67] said that per-ceived government regulations/support regarding environmental factors positively affectenvironmental behavior. Perceived government regulations have a strong indirect effecton takeback intentions through government drivers [56]. For this reason, the followinghypotheses were formulated.
Sustainability 2021, 13, 2759 6 of 28
Hypothesis 3 (H3). Perceived behavioral control is positively related to consumer intention toparticipate in e-waste collection programs.
Hypothesis 4 (H4). Perceived behavioral control is positively related to government drivers.
2.2. Reverse Logistics Drivers
Previous studies have shown that there are three driving factors of RL for the successof reverse logistics. The first driving factor is environmental concern [14–19], followed byregulation/government [12,13,18–20] and the economy [12,13,16,17,19,20].
2.2.1. Environmental Concern
Environmental concern is the extent to which people are aware of environmentalproblems and their willingness to solve them [62] and contribute personally to their so-lutions [82]. These problems have long been considered important predictors of ecological de-cisions [61,63,64,83–85]. Therefore, individual concern is a valuable driver of environmentallyconscious behavior, which ranges from green purchasing behavior and recycling to energyconservation [43,62–65,72]. Previous studies have proven that environmental concern affectsconsumer attitudes [55,61,64,65,86]. According to Maichum et al. [62] and Paul et al. [63],environmental concern also affects subjective norms and perceived behavioral control, leadingto purchasing intentions. Therefore, the following hypotheses were formulated.
Hypothesis 5 (H5). Environmental concern significantly and positively influences consumerintention to participate in e-waste collection programs.
Hypothesis 6 (H6). Environmental concern has a positive and significant effect on personal attitudes.
Hypothesis 7 (H7). Environmental concern has a positive and significant effect on subjective norms.
Hypothesis 8 (H8). Environmental concern has a positive and significant effect on perceivedbehavioral control.
2.2.2. Government Drivers (Regulation)
Government drivers refer to government authorities’ regulations or actions that relateto the minimization of the effects of end-of-life products on the environment [19]. E-wastepolicies and laws play an essential role in establishing the principles and responsibilities ofstakeholders [2]. Legislation is one of the determinants of RL’s success, because the law isthe driving force of the system [87]. In many developed countries, conceptual laws workwhen the government forces companies to address the problem of proper disposal andrestore the value of end-of-life products [88]. The influence of legislation regarding RLproducts has been noticed in the electronics industry. Environmental problems caused bywaste disposal practices can trigger a country to issue rules and regulations governingwaste practices [89]. For instance, Lambert et al. [90] described the European Union (EU)directive on waste electrical and electronic equipment (WEEE). Laws and regulationscompel manufacturers to set up product recovery and safe disposal systems in severalindustries [15]. Compliance with regulations is the most vital element for motivatingrecycling behavior [25]. Therefore, the following hypothesis was formulated.
Hypothesis 9 (H9). Government drivers have a significant and positive effect on consumerintention to participate in e-waste collection programs.
2.2.3. Economic Drivers
Economic benefits contribute significantly to product recovery [15]. Economic reasonsare the motivation for implementing RL, because incentives stimulate citizens to sort andplace waste properly in designated collection points [91]. According to Akdogan andCoskun [13], direct and indirect benefits in all recovery measures are related to economic
Sustainability 2021, 13, 2759 7 of 28
benefits. Economic measures in the form of incentives and penalties are needed to orientmotivations in the desired direction [87]. The community ranks economic incentives as themain driver of waste recycling [25]. Therefore, the following hypothesis was formulated.
Hypothesis 10 (H10). Economic drivers have a significant and positive effect on consumerintention to participate in e-waste collection programs.
2.3. Facility Accessibility
Accessibility reflects comfort and convenience, though it is different from perceivedbehavioral control [36]. It has a very similar connotation to availability [48]. According tothe TPB model [68], perceived behavioral control, which refers to an individual’s perceptionof their ability to perform certain behaviors, is one of the main predictors of behavioralintention. Accessibility is an objective condition for implementing a certain behavior.Facility accessibility sometimes affects perceived behavioral control, for example, when aperson is aware of it [36]. The facility’s location plays a vital role in building a financiallysustainable waste management system [92]. Perceived distance is an essential factorinfluencing recycling behavior [93]. Shorter distances and easier access to sorting facilitiessave time in recycling waste and encourage personal behaviors [94]. Having adequatespace for the temporary storage of sorted materials can increase waste-sorting rates andrecycling behavior [95]. Roadside facilities for sorting waste, including a clear classificationlogo on trash and a sufficient capacity at each waste sorting place, are aspects of accessibilityrelated to waste separation behavior [36]. The following hypotheses were proposed.
Hypothesis 11 (H11). Facility accessibility is positively related to consumer intention to partici-pate in e-waste collection programs.
Hypothesis 12 (H12). Facility accessibility is positively related to individual perceived behav-ioral control.
2.4. Value Belief Norm Theory (VBNT)
Value Belief Norm Theory (VBNT) focuses on moral values and norms [52]. It com-bines NAM’s values and norms and the new environmental paradigm (NEP) [44]. Thenew environmental paradigm values of VBNT include biospheric, altruistic, and egois-tic values [53]. One’s value orientation—especially biospheric, altruistic, and egoisticorientations—determines one’s pro-environmental behavior [45,46,96]. People with strongbiospheric values focus on consequences for nature and the environment, while those withstrong altruistic values focus more on the consequences for other people. People with strongegoistic values will respect and focus on the consequences for their own resources [97].
2.4.1. Biospheric Values
Biospheric values constitute a person’s pro-environmental behavior, which is basedon the perceived costs and benefits for an entire ecosystem [96]. Individuals with strongbiospheric values have a primary concern for nature (environment) and make decisionsbased on the costs and benefits to an ecosystem [98]. The concern for the biosphere,environment, and ecosystem involves values that emphasize the environment and thebiosphere [45]. Biospheric values emphasize the quality of the environment, rather thanthe benefits it provides to humans [99]. Previous studies have shown that biosphericvalues could be a strong predictor of the new environment paradigm, ecological worldview,behavioral intentions, attitudes towards pro-environmental behavior, and environmentalnorms [46,52,96,100]. The biospheric value orientation is consistently and significantlyrelated to individual environmental behavior [101,102]. Additionally, Hiratsuka et al. [97]and Ghazali et al. [45] argued that consumers with a strong biospheric value orientationwould have a high awareness of the environmental consequences. The biospheric valueorientation significantly influences environmental concern [61]. When associated with

Sustainability 2021, 13, 2759 8 of 28
one of the RL drivers, especially environmental concern, the following hypothesis canbe developed.
Hypothesis 13 (H13). Biospheric values have a significant and positive effect on environmen-tal concern.
2.4.2. Altruistic Values
Altruistic values are related to the concern for the welfare of others. They are basedon understanding morals and show that a person intends to focus on others, rather thanhim/herself in making judgments regarding the environment and increasing the bene-fits to the general public, other people, and other living species [45,96]. According toVerma et al. [61], altruistic values have a significant and positive influence on environmen-tal concern. Furthermore, Sánchez et al. [52] and Nguyen et al. [103] stated that altruisticvalues enable consumers to reduce pollution and buy green energy products by increas-ing their environmental protection attitudes. Individuals only make personal sacrificesto protect the environment when these actions help other humans. Altruistic behaviors,especially those relating to the sacrifice of one’s interests for others’ welfare, are a functionof personal norms [104]. Altruistic values influence environmental attitudes, subjectivenorms, and perceived behavioral control [54]. Supposing that environmental concernis based on biospheric values, an individual will take action based on moral principles,including other species and nature, as goals [61]. Based on one of the RL drivers, namelyenvironmental concern, the following hypothesis was formulated:
Hypothesis 14 (H14). Altruistic values significantly and positively affect environmental concern.
2.4.3. Egoistic Values
Egoistic values emphasize the maximization of individual benefits. They focus onhow individuals value themselves in relation to other people and the environment andconcentrate on their own welfare, such as strength and achievement, promoting short-termdesires and long-term interests [45,96]. Egoistic values are related to the improvementof one’s self or attributes. Therefore, people who show a strong egoistic orientationdeliberately analyze certain actions in terms of the costs and benefits for themselves [61].For instance, when the perceived benefits exceed the costs, green hotels are chosen andvice versa. Egoistic values affect environmental concern [61]. Therefore, the followinghypothesis was formulated.
Hypothesis 15 (H15). Egoistic values significantly and positively affect the environmental concern.
3. Methods3.1. Sampling and Data Collection
The study used a purposive sampling technique. Purposive sampling is a non-randomsampling technique that determines the sample based on criteria that follow the researchobjectives so that the technique is expected to be able to answer the research problems [105].The criteria used in this study are men and women aged 17 years and over who aresmartphone consumers/users. This minimum age was adopted because consumers inthis range can decide to participate in e-waste collection programs by bringing their usedsmartphones to collection centers. The data collection method used by the researcherswas a questionnaire. A questionnaire consists of several written questions that are used toobtain information from the respondent in the sense of reports about his/her personalityor things that he/she knows. Questionnaires can be in the form of closed or open ques-tions/statements [106]. The questionnaire used in this study was a closed questionnaire.The distribution of the research questionnaire was carried out online through the Googleform application from August to September 2020. Before the formal data collection, twotrials were conducted. The first one tested the validity and reliability of the questionnaire

Sustainability 2021, 13, 2759 9 of 28
on 15 smartphone users. Comments and suggestions from these respondents were used toimprove the questionnaire, specifically its ease of understanding. After the first revision,a second trial was carried out on 50 other users to evaluate its reliability. Finally, thequestionnaire for data collection was created.
This study used Structural Equation Modeling (SEM). A total of 324 questionnaireswere filled and processed to meet the recommended requirements. When the sample sizeis less than 100, almost any SEM type may not be sustainable, unless very simple modelsare evaluated [107]. Table 1 shows the sample distributions of the respondents.
Table 1. Sample distributions (n = 324).
Variable Category Frequency Percentage
Gender Male 139 42.90Female 186 57.10
Ages 17–25 years 67 20.3726–35 years 121 37.3536–45 years 99 30.8646–55 years 32 9.8856–65 year 3 0.93
66 years or older 2 0.62Marital Status Single 210 64.81
Married 110 33.95Divorced/Widowed 4 1.23
Monthly Income (USD) ≥1.000 33 10.19666.67–999.99 40 12.35333.33–666.66 104 32.1066.67–333.32 103 31.79
<66.67 44 13.58Education Degree Doctoral degree 12 3,70
Master’s degree 62 19.14Bachelor’s degree 194 59.88
Diploma 16 4.94Senior high school 35 10.80Junior high school 3 0.93
Primary school 2 0.62
From the descriptive statistics shown in Table 1, the majority of respondents werefemale (57.10%), aged 26–35 years (37.35%), single (64.81%), and had a bachelor’s degree(59.88%), with monthly income ranging from 66.67–333.32 USD to 333.33–666.66 USD(31.79% and 32.10%, respectively).
3.2. Measurement
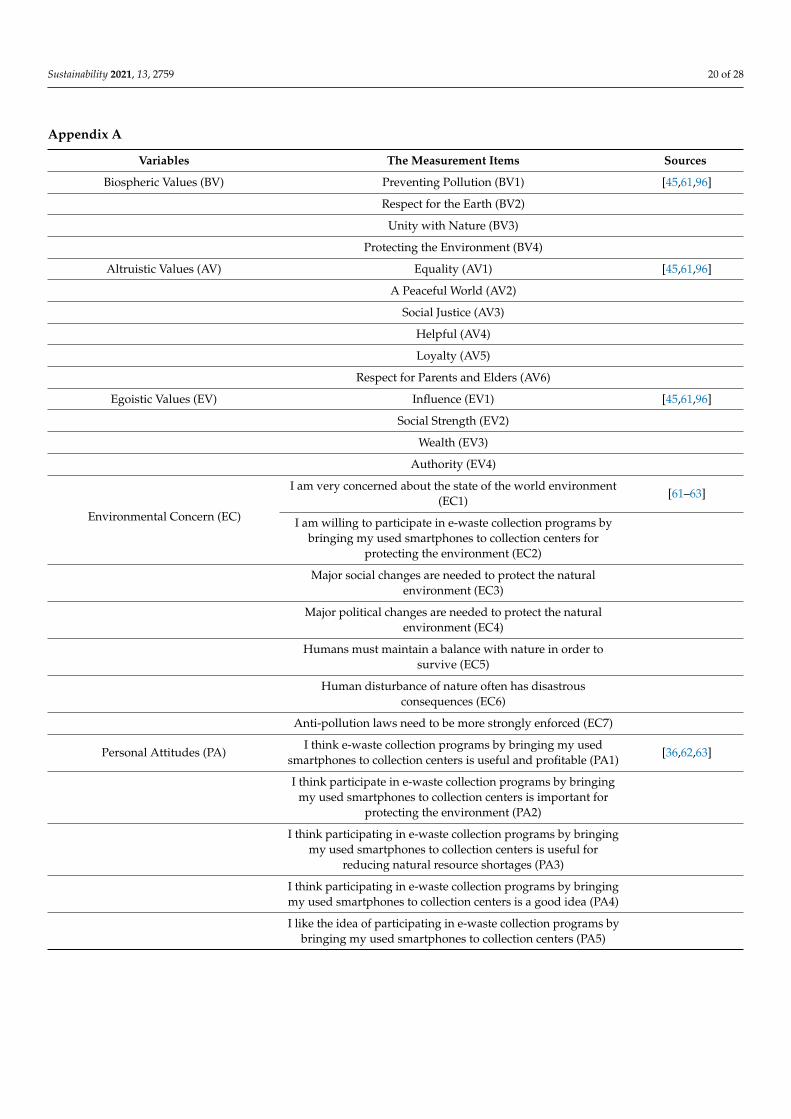
The measurement variables shown in Table 2 were considered for each variable usedin this study and were either selected or modified from previous studies. A total of elevenvariables were used, including personal attitudes (6 indicators), subjective norms (4 indi-cators), perceived behavioral control (7 indicators), environmental concern (7 indicators),government drivers (4 indicators), economic drivers (3 indicators), facility accessibility(6 indicators), biospheric values (4 indicators), altruistic values (6 indicators), egoisticvalues (4 indicators), and consumer intention to participate in e-waste collection programs(5 indicators). The process of decreasing each variable/construct’s indicators is based onthe results of literature reviews from previous studies. For the biospheric values variable,there were three research results, namely those of Ghazali et al. [45], Verma et al. [61], andShin et al. [96]. These scholars identified the indicators of the biospheric values variable aspreventing pollution, respect for the earth, unity with nature, and protecting the environ-ment. The results of decreasing the indicators of all the variables and references referred tocan be seen in Appendix A. The Likert scale was used to measure the research variables.It is designed to test how strongly subjects agree or disagree with statements on a pointscale, ranging from “strongly disagree” to “strongly agree” [108–110]. The questionnaireused a five-point Likert scale, ranging from 1 (strongly disagree/very not important/veryunlikely) to 5 (strongly agree/very important/very likely). This scale asks respondents

Sustainability 2021, 13, 2759 10 of 28
to indicate how much they disagree or agree with something or whether they considersomething to be inessential or essential, impossible or possible.
Table 2. Description of the measurement items in our questionnaire.
Variables Indicators Mode Median Loading Factor Cronbach’s Alpha AVE CR
Biospheric Values(BV)
BV1 5 5 0.856 0.852 0.693 0.900BV2 5 5 0.847BV3 5 5 0.847BV4 5 5 0.777
Altruistic Values(AV)
AV1 4 4 0.695 0.831 0.539 0.875AV2 5 5 0.717AV3 5 5 0.809AV4 5 5 0.746AV5 4 4 0.761AV6 5 5 0.669
Egoistic Values (EV)
EV1 4 4 0.840 0.791 0.613 0.873EV2 4 4 0.840EV3 4 4 0.609EV4 4 4 0.818
EnvironmentalConcern (EC)
EC1 4 4 0.663 0.832 0.496 0.873EC2 4 4 0.684EC3 4 4 0.802EC4 4 4 0.684EC5 5 5 0.750EC6 4 4 0.679EC7 4 4 0.655
Personal Attitudes(PA)
PA1 4 4 0.832 0.923 0.726 0.941PA2 4 4 0.864PA3 4 4 0.717PA4 4 4 0.900PA5 4 4 0.905PA6 4 4 0.880
Subjective Norms(SN)
SN1 3 4 0.837 0.917 0.801 0.941SN2 3 3 0.944SN3 3 3 0.930SN4 3 3 0.864
Perceived BehavioralControl (PC)
PC4 4 3.5 0.859 0.803 0.718 0.884PC5 4 4 0.799PC6 4 4 0.882
Facility Accessibility(FA)
FA1 4 4 0.849 0.927 0.732 0.943FA2 4 4 0.858FA3 4 4 0.877FA4 4 4 0.849FA5 4 4 0.870FA6 4 4 0.831
Economic Drivers(ED)
ED1 4 4 0.687 0.762 0.674 0.860ED2 4 4 0.921ED3 4 4 0.839
Government Drivers(GD)
GD1 4 4 0.899 0.844 0.765 0.907GD2 4 4 0.938GD3 4 4 0.780
Consumer Intentionto Participate in
e-waste CollectionPrograms (CI)
CI1 4 4 0.866 0.921 0.763 0.941CI2 4 4 0.923CI3 4 4 0.870CI4 4 4 0.901CI5 4 4 0.800
Sustainability 2021, 13, 2759 11 of 28
The mode and median values of each indicator are shown in Table 2. The highestmode value in the biospheric variable is 5 for all indicators, showing that Indonesians havea significant concern for nature and the environment. The mode value for the subjectivenorm variable (3 for all indicators) is lower than that for the other variables. This is becausee-waste collection programs involving bringing used smartphones to collection centers arestill not common in Indonesia.
3.3. Tools for Analysis
This study uses Variance Based Structural Equation Modeling (VB-SEM), with thePartial Least Squares–Structural Equation Modeling (PLS-SEM) technique. SEM is dividedinto two sub-models, including the measurement model consisting of different variables, toform potential variables and structural models, which refer to the linear regression modelconsisting of several potential variables [111]. The PLS design is intended to overcomethe limitations of regression analysis using the OLS (Ordinary Least Square) technique,because there are problems with the data characteristics such as a small data size, missingvalues, abnormal form of data distribution, and the presence of multicollinearity symptoms.PLS-SEM was used in this study, because the sample size was less than 500, and the datawere not normally distributed [112,113].
The research included (1) modeling, estimating, and simultaneously testing the indi-cator coefficient, which also means checking the validity and reliability of the variables’indicators; (2) modeling, estimating, and simultaneously testing the path coefficients be-tween the existing variables; (3) testing the goodness of fit; and (4) testing the hypothesizedrelationship between the variables. SEM verification can be divided into two steps, i.e.,verifying the measurement model and evaluating the reliability and validity of the potentialvariables. The measurement model evaluation index also includes reliability and validity.Furthermore, the model’s goodness of fit is measured with a fitting index model, such asthe standardized root mean square residual (SRMR) and R-square. The PLS method is usedto verify the structural model, while the standard path coefficients and their significance aresimultaneously calculated. The standard path coefficient refers to the degree of correlationbetween two variables. Supposing that the path coefficient is significant, the hypotheticalrelationship is supported [114].
The analysis tool used is smartPLS. SmartPLS is a free software of the PLS-SEM soft-ware packages; therefore, this software is freely available to research communities world-wide [115]. With PLS, confirmatory factor analysis (CFA) was used to assess the validity,reliability, and the model’s goodness of fit, followed by SEM to test the hypothesis [116].
4. Results4.1. Preliminary Analysis
In the data collection in this study, the respondents who assessed the predictor andthose who assessed the dependent variables were the same person (self-reported methods).Self-reported methods can cause biases in judgment (e.g., the common method bias) [55].The common method bias/variance is the systematic error variance between variablesmeasured by a function of the same method and/or source [117]. A general method biasusually occurs in research when data for the independent and dependent variables areobtained from the same person in the context of a measurement using the same contextitems and similar item characteristics [118]. This bias can increase or decrease the observedcorrelation between constructs [119]. To ensure that a common method bias did not appearin this study, testing was needed to check for its presence. The widely used technique fortesting for the common method bias is the Harman single-factor test [117,120]. This testincorporates all variables into an exploratory factor analysis and examines the non-rotatedfactor solution to determine the number of factors needed to explain the variance of thevariables. A common method bias occurs when the test results show that there is one factorthat can explain most of the data variance. The results of testing all variables using factor

Sustainability 2021, 13, 2759 12 of 28
analysis showed that one factor that was formed could explain 28.284% of the variance.Thus, it can be concluded that there was no common method bias in this study [121].
4.2. Reliability and Validity Analysis
Reliability refers to the internal consistency of the observed variables. Cronbach’sAlpha is used to show the value of reliability. A Cronbach’s Alpha coefficient value of0.7 is acceptable, though the higher the value, the higher the reliability [122]. Where theCronbach’s Alpha coefficient exceeds 0.8, the internal consistency is excellent. Supposingthat it ranges between 0.7 and 0.8, the internal consistency is good. However, if it is lessthan 0.7, the internal consistency is poor [123]. From the survey data, the Cronbach’s Alphacoefficient for biospheric values, altruistic values, egoistic values, environmental concern,personal attitudes, subjective norms, perceived behavioral control, facility accessibility,government drivers, economic drivers, and consumer intention to participate in e-wastecollection programs were 0.852, 0.831, 0.791, 0.832, 0.923, 0.917, 0.803, 0.927, 0.844, 0.762, and0.921, respectively. All of the variables had Cronbach’s Alpha coefficient values exceeding0.7. All the variables also had a composite reliability (CR) value above 0.8. Therefore, allscales and subscales in this study had a good internal consistency and high reliability.
Validity analysis tests whether the observed variables can measure the latent variables.When the observed variable loading factor value is higher than 0.5, the latent variable hasa good validity [122]. There are five indicators to be discarded from the processing resultsbecause they are below 0.5, namely, PC1, PC2, PC3, PC7, and GD4. Table 2 shows thecomplete results (with a significant probability value p < 0.001). The convergent validity ismeasured from the average variance extracted (AVE) value. Table 2 shows that the AVEvalue is greater than the threshold of 0.5 [122], and there is one variable whose value isclose to 5 (0.496). Based on the loading factor and AVE values, the convergent validityis confirmed.
The discriminant validity is measured from the square root of the AVE in each latentvariable. If this value of the same latent variable has a more significant correlation valuethan the other latent variables, the discriminant validity is well established [115]. Table 3shows that the AVE’s square root value on the same variable has a greater correlation valuethan the other variables, proving that the discriminant validity is well established.
Table 3. Discriminant validity test results.
VariablesItem
IndicatorsCorrelations
AV BV CI ED EV EC FA GD PC PA SN
AV 6 0.734BV 4 0.629 0.832CI 5 0.151 0.192 0.873ED 3 0.055 0.099 0.111 0.821EV 4 0.318 0.227 0.152 0.233 0.783EC 7 0.529 0.572 0.465 0.088 0.331 0.704FA 6 0.215 0.316 0.516 0.118 0.220 0.540 0.856GD 3 0.211 0.295 0.634 0.096 0.202 0.414 0.510 0.875PC 3 0.141 0.199 0.514 0.147 0.194 0.401 0.418 0.566 0.847PA 6 0.353 0.425 0.570 0.100 0.330 0.686 0.525 0.564 0.529 0.852SN 4 0.273 0.219 0.528 0.129 0.325 0.483 0.428 0.553 0.591 0.654 0.895
All CFA results indicate that the measurement model is convergent and acceptablydiscriminant. The hypothesized measurement model is reliable and examines the structuralrelationships between constructs/variables. The fit index was obtained from SRMR and R-square. A model has a good fit when the SRMR is less than 0.08 [113]. The R-square cut-offsmust be 0.67, 0.33, and 0.19 to be substantial, moderate, and weak, respectively [113,124].The SRMR value and R-square in this study were 0.063 and 0.506, respectively. The SRMR

Sustainability 2021, 13, 2759 13 of 28
value exceeded the general acceptance level, meaning that the measurement model alignswith the data. The R-square here would be considered to be of a moderate strength or effect.
4.3. Testing of the Structural Equation Model
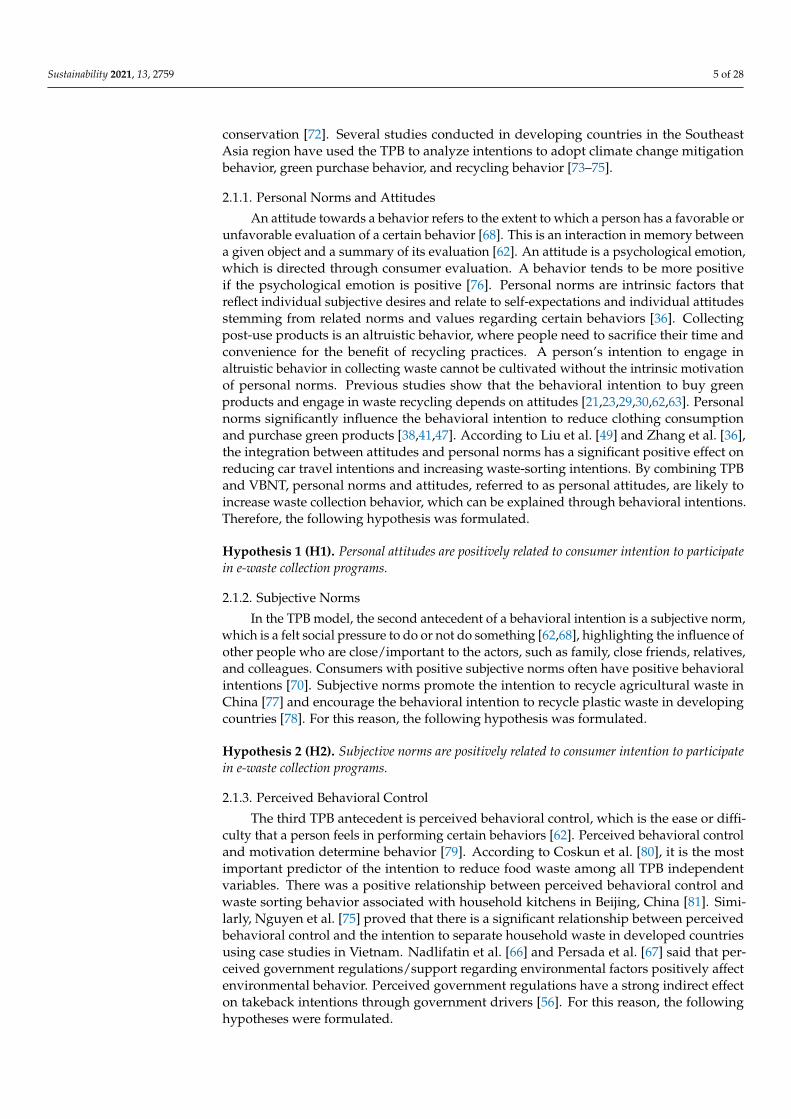
SEM was conducted by SmartPLS to evaluate the conceptual model hypothesizedfrom the study, as shown in Figure 2. Table 4 shows the SEM processing results, while thecomplete SEM processing results are shown in Appendix B. The SEM test results showthe effect of the statement items in the questionnaire (indicators) on the latent variables.The indicator is said to have a positive and significant effect when the T-statistic value isgreater than 1.96 [122]. From the figure in Appendix B, all indicators have a T-value greaterthan 1.96, so all indicators have a positive and significant effect on the latent variables.An indicator with a greater T-statistic value shows a more dominant influence than otherstatements/indicators on one latent variable. For example, the BV 3 indicator has thelargest T-statistic value compared to the other indicators of the biospheric values variable.This shows that unity with nature has a more dominant influence on biospheric valuesthan other variables.
Figure 2. Structural equation model results. Notes: p = significant probability, where * p < 0.05; ** p < 0.01; *** p < 0.001.
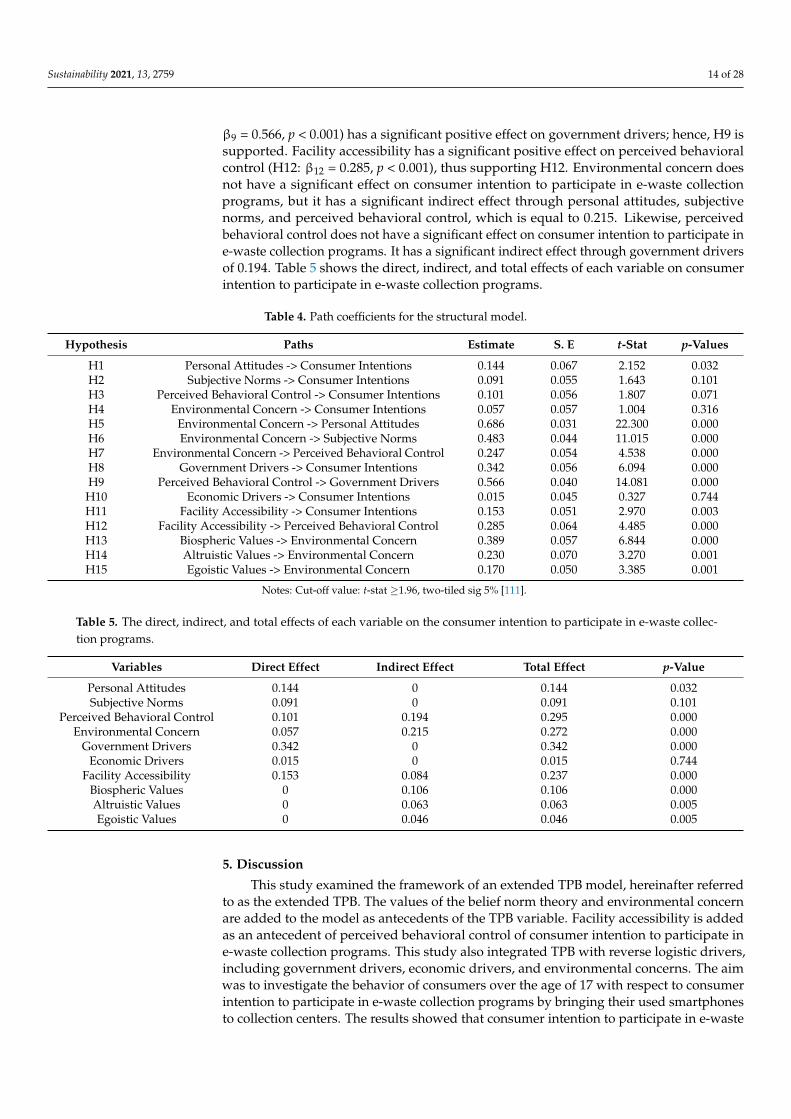
The structural model results and the standard path coefficients show a positive in-fluence on the structural model constructs. In total, eleven of the fifteen hypotheses weresupported. The effects of personal attitudes, subjective norms, perceived behavioral control,environmental concern, government drivers, economic drivers, and facility accessibilityon consumer intention to participate in e-waste collection programs were (H1: β1 = 0.144,p = 0.032), (H2: β2 = 0.091, p = 0.101), (H3: β3 = 0.101, p = 0.071), (H4: β4 = 0.057, p = 0.316),(H8: β8 = 0.342, p < 0.001), (H10: β10 = 0.015, p = 0.774), and (H11: β11 = 0.153, p = 0.03), re-spectively. This means that H1, H8, and H11 are supported, while H2, H3, H4, and H10 arerejected. According to H5, H6, and H7, the estimated positive coefficient of environmentalconcern for personal attitudes, subjective norms, and perceived behavioral control has asignificant positive effect, which is (H5: β5 = 0.686, p < 0.001), (H6: β6 = 0.483, p < 0.001),and (H7: β7 = 0.247, p < 0.001), respectively. Therefore, H5, H6, and H7 are supported.The effects of biospheric values, altruistic values, and egoistic values on environmentalconcern are (H13: β13 = 0.389, p < 0.001), (H14: β14 = 0.230, p = 0.001), and (H15: β15 = 0.170,p < 0.001), respectively. These values have a significant positive effect on environmentalconcern; therefore, H13, H14, and H15 are supported. Perceived behavioral control (H9:
Sustainability 2021, 13, 2759 14 of 28
β9 = 0.566, p < 0.001) has a significant positive effect on government drivers; hence, H9 issupported. Facility accessibility has a significant positive effect on perceived behavioralcontrol (H12: β12 = 0.285, p < 0.001), thus supporting H12. Environmental concern doesnot have a significant effect on consumer intention to participate in e-waste collectionprograms, but it has a significant indirect effect through personal attitudes, subjectivenorms, and perceived behavioral control, which is equal to 0.215. Likewise, perceivedbehavioral control does not have a significant effect on consumer intention to participate ine-waste collection programs. It has a significant indirect effect through government driversof 0.194. Table 5 shows the direct, indirect, and total effects of each variable on consumerintention to participate in e-waste collection programs.
Table 4. Path coefficients for the structural model.
Hypothesis Paths Estimate S. E t-Stat p-Values
H1 Personal Attitudes -> Consumer Intentions 0.144 0.067 2.152 0.032H2 Subjective Norms -> Consumer Intentions 0.091 0.055 1.643 0.101H3 Perceived Behavioral Control -> Consumer Intentions 0.101 0.056 1.807 0.071H4 Environmental Concern -> Consumer Intentions 0.057 0.057 1.004 0.316H5 Environmental Concern -> Personal Attitudes 0.686 0.031 22.300 0.000H6 Environmental Concern -> Subjective Norms 0.483 0.044 11.015 0.000H7 Environmental Concern -> Perceived Behavioral Control 0.247 0.054 4.538 0.000H8 Government Drivers -> Consumer Intentions 0.342 0.056 6.094 0.000H9 Perceived Behavioral Control -> Government Drivers 0.566 0.040 14.081 0.000
H10 Economic Drivers -> Consumer Intentions 0.015 0.045 0.327 0.744H11 Facility Accessibility -> Consumer Intentions 0.153 0.051 2.970 0.003H12 Facility Accessibility -> Perceived Behavioral Control 0.285 0.064 4.485 0.000H13 Biospheric Values -> Environmental Concern 0.389 0.057 6.844 0.000H14 Altruistic Values -> Environmental Concern 0.230 0.070 3.270 0.001H15 Egoistic Values -> Environmental Concern 0.170 0.050 3.385 0.001
Notes: Cut-off value: t-stat ≥1.96, two-tiled sig 5% [111].
Table 5. The direct, indirect, and total effects of each variable on the consumer intention to participate in e-waste collec-tion programs.
Variables Direct Effect Indirect Effect Total Effect p-Value
Personal Attitudes 0.144 0 0.144 0.032Subjective Norms 0.091 0 0.091 0.101
Perceived Behavioral Control 0.101 0.194 0.295 0.000Environmental Concern 0.057 0.215 0.272 0.000
Government Drivers 0.342 0 0.342 0.000Economic Drivers 0.015 0 0.015 0.744
Facility Accessibility 0.153 0.084 0.237 0.000Biospheric Values 0 0.106 0.106 0.000Altruistic Values 0 0.063 0.063 0.005Egoistic Values 0 0.046 0.046 0.005
5. Discussion
This study examined the framework of an extended TPB model, hereinafter referredto as the extended TPB. The values of the belief norm theory and environmental concernare added to the model as antecedents of the TPB variable. Facility accessibility is addedas an antecedent of perceived behavioral control of consumer intention to participate ine-waste collection programs. This study also integrated TPB with reverse logistic drivers,including government drivers, economic drivers, and environmental concerns. The aimwas to investigate the behavior of consumers over the age of 17 with respect to consumerintention to participate in e-waste collection programs by bringing their used smartphonesto collection centers. The results showed that consumer intention to participate in e-waste

Sustainability 2021, 13, 2759 15 of 28
collection programs could be predicted by personal attitudes, subjective norms, perceivedbehavioral control, environmental concern, economic drivers, government drivers, andfacility accessibility.
Government drivers, facility accessibility, and personal attitudes have a significantdirect effect on consumer intention to participate in e-waste collection programs. Govern-ment drivers have the most significant influence on consumer intentions. This means thatthey are the strongest predictor of consumer intentions, followed by facility accessibilityand personal attitudes. Perceived behavioral control does not have a significant directeffect on consumer intentions. It has a significant indirect effect on government drivers,which mediates between perceived behavioral control and consumer intentions. Likewise,environmental concern does not have a significant direct positive effect on consumer in-tentions. It indirectly affects consumer intentions through TPB variables, which includepersonal attitudes, subjective norms, and perceived behavioral control. Furthermore, envi-ronmental concern is significantly influenced by biospheric values, altruistic values, andegoistic values. This shows that it is necessary to integrate RL drivers and VBNT in theTPB framework, because the variables reinforce each other. The results of this study arein line with those of Nguyen and Johnson [125], who indicated that the determinants ofpro-environmental behavior are complex, and an integrative model is therefore needed.
Government drivers constitute the most significant factor and illustrate the regu-lations regarding the e-waste collection programs by bringing their used smartphonesto the collection centers. Currently, Indonesia is about to apply these rules; hence, thequestion in the questionnaire used the words, “if it is actually applied”. The results showthat this factor has the highest influence on consumer intention to participate in e-wastecollection programs. This means that if the Indonesian government makes special rules tosupport e-waste collection programs, these rules will significantly encourage consumersto participate in the program. Therefore, consumers need encouragement in the formof government regulations to participate in e-waste collection programs. This is in linewith Yuan [124], who established that government regulation is one of the critical factorsin waste management success. Compliance with regulations is the most vital element inpromoting the use of modes of construction and demolition that are compatible with recy-cling [25]. Legal and regulatory policies are the main instruments for the implementation ofe-waste management. However, these policies are not well implemented by the electronicsindustry [90]. According to Zhang et al. [36], government stimulus has a positive andsignificant effect on waste sorting behavior.
Facility accessibility has a significant effect, either directly on consumer intentionto participate in e-waste collection programs or indirectly through PCB. This shows thatpeople need facility accessibility to participate in e-waste collection programs. Facilityaccessibility includes short distances and travel times, directions to the location of theused smartphones collection centers, road conditions, ease of use of collection centers,and collection centers capacity. In general, facility accessibility support from the govern-ment has improved consumer intentions. This is in line with the findings presented inZhang et al. [36], in which it was concluded that facility accessibility significantly influ-ences waste sorting behavior. According to Zhang et al. [48], facility accessibility affectsindividual intentions to recycle waste. Ease of access in the form of doorstepping increasesindividual intentions to engage in waste recycling behavior. A waste collection service,involving the picking up of waste from a site in Shanghai, China, increased the averagerecycling growth by 12.5% [126]. In general, shorter distances mean easier access to sortingfacilities, thus encouraging personal behavior. Perceived distance is a more importantfactor influencing recycling behavior [93,94]. Determining the location of waste facilities isone of the steps in waste management planning [127,128].
The third-order factor that significantly influences consumer intention to participatein e-waste collection programs is personal attitudes. Compared to government driversand facility accessibility, personal attitudes are intrinsic factors that reflect individualsubjective desires. They deal with self-expectations and individual attitudes regarding

Sustainability 2021, 13, 2759 16 of 28
specific behaviors that stem from norms and values related to behavior. These resultsindicate that individual attitudes towards the environment influence consumer intention toparticipate in e-waste collection programs. Therefore, it is necessary to include the VBNTpersonal norm as a TPB attitude variable. These results are in line with the TPB presentedby Ajzen [68], as a reference in modeling behavior. Furthermore, the results are also inline with those presented in previous studies, which showed a positive and significantinfluence on personal attitudes towards waste sorting behavior intentions and reducing cartravel [36,49]. This is also reinforced by previous studies that showed that attitudes havea positive and significant effect on the intention to visit green hotels [61], the intention topurchase eco-friendly packaged products [64], the intention to recycle [21,23,24], ecolabelproduct usage [86], purchasing reusable shopping bags [28], green behavior [32], greenpurchasing [29], the behavioral intention to buy green products [30,63], and the intentionto purchase green products [62]. Personal norms significantly influence behavioral in-tentions [41], reduce intentions to consume clothing [38,41], and increase the intention toengage in green purchasing behavior [47]. Some studies stated that attitudes do not affectthe intention to use cars for traveling to campus, recycling intentions, and intentions topurchase green products [22,50,65]. According to Macovei [72], attitudes harm intentionsto conserve energy.
Environmental concern does not directly affect influence consumer intention to par-ticipate in e-waste collection programs, but it indirectly affects consumer intention toparticipate in e-waste collection programs through the three TPB variables, includingpersonal attitudes, perceived behavioral control, and subjective norms. It has a significantpositive effect on personal attitudes, subjective norms, and perceived behavioral control.Environmental concern has been studied in many different contexts, including environ-mental worldviews, ecological or environmental values [129], and motivating people toparticipate in environmentally friendly activities and consider themselves as saviors ofthe environment [130]. This is a stage in environmental literacy that helps determinepeople’s values and attitudes regarding the environment and uses them to guide behav-ior [131]. This study’s results are in line with those presented in Setyawan et al. [65], andPaul et al. [63], which also showed that environmental concern has an indirect positiveand significant effect on consumer intentions but does not directly influence the intentionto buy green products. Similarly, Verma et al. [61] and Dursun et al. [43] established thatthe effect of environmental concern is stronger on attitudes than directly on intentions tovisit green hotels. The two studies also concluded that environmental concern has a strongeffect on personal norms. According to Paul et al. [63], the effect of environmental concernon personal attitudes, subjective norms, and perceived behavioral control is greater thanthe direct effect on purchase intentions.
Perceived behavioral control does not directly affect influence consumer intentionto participate in e-waste collection programs but has a significant and indirect positiveeffect through government drivers. Primarily, perceived behavioral control is the easeor difficulty that a person feels in carrying out certain behaviors [62]. Currently, manypeople do not know about e-waste collection programs. A small number of cities haveprovided collection center facilities; hence, the community has not assessed the ease ordifficulty they face, which necessitates regulations. This finding is in line with Arifani andHaryanto [28], who established that the influence of perceived behavioral control on theintention to buy reusable shopping bags is not strong. Similarly, Budijati [56] showed thatthe direct effect of perceived government regulations/support on environmental behavioris insignificant and not strong. Furthermore, this study is supported by Nadlifatin et al. [66]and Persada et al. [67], who showed that the indirect effect of perceived governmentregulations/support on environmental behavior is vital and significant. However, severalstudies show that perceived behavioral control has a positive and significant effect onintentions, such as the intention to recycle [21,23], use cars for traveling to campus [50],reduce car travel [49], engage in green behavior [32], conserve energy [72], and purchasegreen products [29,30,62,63,65].
Sustainability 2021, 13, 2759 17 of 28
Subjective norms do not affect influence consumer intention to participate in e-wastecollection programs, because only a small number of cities have provided e-waste collectioncenters. Many people do not know and are not familiar with the program. Due to theirignorance, families, colleagues, friends, and important people cannot remind, encourage,or invite each other to participate in the program. This is in line with previous studies,which concluded that subjective norms do not affect willingness to pay to reduce noisepollution in land transportation [52], the intention to reduce car travel, energy conservationbehavior, and the intention to purchase green products [49,51,63]. However, several studiesprovided different results. Subjective norms have a positive and significant effect onintention, including the intention to use ecolabel products, reduce the use of cars to travelto campus, purchase reusable shopping bags, purchase green products, recycle, and sortwaste [23,24,29–31,36,50,62,65,86].
Economic drivers also do not affect influence consumer intention to participate ine-waste collection programs. Economic drivers describe offers of financial benefits toconsumers if they participate in waste collection programs. Therefore, incentives do notinfluence consumer intentions to participate in e-waste collection programs. This assertionis reinforced by the fact that economic drivers received mode values of 3 on a scale of 5,showing that the respondents were willing to bring their used smartphones to collectioncenters without expecting incentives. There is no incentive for consumers to bring theirused smartphones to the collection centers. Previous studies have shown that economicincentives are quite successful in influencing consumer environmental behavior, includingthe adoption of electric vehicles, saving energy, and waste separation [132–134]. However,this study is in line with Wang et al. [135] from Shenzhen, who stated that economicincentives are the least important factor.
Biospheric, altruistic, and egoistic values have a positive and significant effect onenvironmental concern. According to Verma et al. [61], these three values have a signif-icant positive effect on environmental concern. Furthermore, Lind et al. [100] showedthat biospheric and egoistic values positively and negatively affect the new environmentalparadigm. Biospheric values have a positive and significant effect on environmental concern.Biospheric values include preventing pollution, respecting the earth, unity with nature,and protecting the environment. This is in line with Verma et al. [61], Lind et al. [100], andHan et al. [46], who stated that biospheric values significantly affect environmental concern.Furthermore, Hiratsuka et al. [97] and Ghazali et al. [45] used the VBNT model and estab-lished that biospheric values positively and significantly affect awareness of environmentalconsequences. Altruistic values positively and significantly affect environmental concernand include equality, a peaceful world, social justice, help, loyalty, and respecting parents orthe elderly. Similarly, Verma et al. [61] stated that altruistic values have a significant positiveeffect on environmental concern, though other studies show that they have a significantpositive effect on the awareness of environmental consequences and a negative effect onpersonal norms [45,102]. Conversely, the result of Han et al. [46] showed that altruisticvalues do not significantly affect ecological worldview. Egoistic values, which includeinfluence, social strength, wealth, and authority, positively and significantly affect environ-mental concern. This is in line with Verma et al. [61] and strengthened by Sánchez et al. [52]and Kim and Seock [136], who showed that egoistic values have a positive effect on atti-tudes and personal norms, while Lind et al. [100], Han et al. [46], Hiratsuka et al. [97], andLauper et al. [102] showed a negative effect. The results of Ghazali et al. [45] showed thategoistic values do not affect awareness of environmental consequences.
This study provides several implications that can aid in the development of the rightstrategy for promoting influence consumer intention to participate in e-waste collectionprograms by bringing their used smartphones to collection centers. Government drivers,facility accessibility, and personal attitudes have a significant effect on influencing consumerintention to participate in e-waste collection programs. Government drivers have thestrongest influence, followed by facility accessibility and, finally, personal attitudes.
Sustainability 2021, 13, 2759 18 of 28
Because government drivers constitute the factor that has the most substantial influ-ence on consumer intention to participate in e-waste collection programs, it is time forIndonesia to introduce regulations for the handling of electronic waste. Some countrieshave already established regulations regarding the re-management of electronic productsthat are no longer used by consumers, such as the WEEE (Waste Electrical and ElectronicEquipment) Directive 2002, which regulates the collection and management of environ-mentally friendly electronic equipment for countries in Europe; Royal Decree 208/2005; theregulations for WEEE collection and handling in Spain [137]; the EPA-HQ-RCRA-2004-0012regulations, namely, the Hazardous Waste Management System, Modification of the Haz-ardous Waste Program, Cathode Ray Tubes, and Final Rule in the United States [138]; theOrdinance on the Return, Taking back, and Disposal of Electrical and Electronic Equipment(ORDEE) applied in Switzerland; the Environmental policy agreement on the mandatorytake-back of waste from electrical and electronic equipment, which is implemented in Bel-gium [139]; the San Luis Obispo (SLO) system, which mandates a retail take-back programfor household hazardous waste and materials (HWWM) in the state of California [140];and E-waste Management and Handling Rules in India [141]. Electronic waste handlingin China is regulated by the Regulations on the Recovery Processing of Waste from Elec-trical and Electronic Products [142]. Malaysia has the Environmental Quality (ScheduledWastes) Regulations 2005 [143]. Meanwhile, Japan has the Law for the Promotion of theEffective Utilization of Resources (LPUR) and the Law for Recycling Specified Kinds ofHome Appliances (LRHA) [144].
Sweden has one of the best waste management systems in the world. It can beconsidered a reference country, as it is very concerned with the waste problem. Swedenis also the country with the highest recycling rate in the world, accounting for 99% ofits waste [145]. In Sweden, there is a government policy that stipulates that a wasterecycling center must be available within 300 m of any settlement. This policy aims toorient community behavior toward disposing and treating waste properly [146]. E-wastecollection in Sweden shows a collection rate of over 60% [147]. This Swedish policy canbecome a reference for waste management in Indonesia, because the accessibility of publicfacilities is a determining factor for influence consumer intention to participate in e-wastecollection programs. The government must provide e-waste collection center facilities atan affordable distance for the community to recycle their e-waste. Considering Indonesia’smore expansive territory in comparison with that of Sweden, the distance does not haveto be as close as that employed in the Swedish policy, but it must still be affordable forpeople to access. The regulations in Malaysia stipulate that people are prohibited fromthrowing electronic waste into landfills; electronic waste must be recycled and recovered ina designated and licensed place. Through the Ministry of Environment (DOE), Malaysiahas issued permits for 18 full recovery facilities and 128 partial recovery facilities toconvert various types of electronic waste into source materials [143]. To ensure recyclingactivities do not endanger the environment, Indonesia can refer to Malaysia’s electronicwaste management system; only licensed recyclers can recycle. Moreover, the number ofrecycling bins should be set up as needed, taking into account the volume of waste. Thisshould be conducted in accordance with Malaysian regulations. In Malaysia, many fullrecyclers cannot operate at full capacity due to a lack of e-waste supply. In campaigning forthe e-waste collection program, the government can use environmental issues that touchthe community or consumers and collaborate with non-governmental organizations. WhenIndonesia succeeds in managing its e-waste properly, it is hoped that the environment willbe clean, that there will be no soil and environmental pollution, and that there will be noflooding due to clogged garbage.
Sustainability 2021, 13, 2759 19 of 28
6. Conclusions
The extended TPB variable influences consumer intention to participate in e-wastecollection programs by bringing their used smartphones to collection centers. The resultsshowed that government drivers constitute the most influential factor in the extended TPBmodel, followed by facility accessibility and, finally, personal attitudes. Therefore, gov-ernment drivers greatly influence consumer intention to participate in e-waste collectionprograms in Indonesia. Furthermore, facility accessibility is the second most influentialfactor, after government drivers. The third most influential factor that significantly influ-ences consumer intentions is personal attitudes. Environment concern positively influencesconsumer intentions through the Theory of Planned Behavior variables. Meanwhile, per-ceived behavioral control positively influences consumer intentions through governmentdrivers. The results show the need for integration, because the variables reinforce eachother. However, neither economic drivers nor subjective norms significantly influenceconsumer intentions. This finding distinguishes Indonesia from other countries, especiallydeveloped countries, because e-waste collection programs have not become part of theculture in Indonesia; therefore, Indonesia needs regulations, as the most influential variable,to regulate the implementation of such a program. Based on this study’s findings, theIndonesian government is expected to draft e-waste management regulations that willoblige consumers to participate in e-waste collection programs and set up collection centersthat are easy and affordable to access. To orient personal attitudes in a sustainable directionrequires campaign enforcement. The government can take advantage of environmentalissues that affect the community in campaigning for e-waste collection programs.
This study has several limitations that need to be resolved in future research. For in-stance, it only focused on smartphones. Thus, future research should extend the findings ofthis paper to other products with a larger volume, such as refrigerators, washing machines,televisions, etc. The greater volume would also help to determine the effectiveness of thecollection process. Moreover, this research added only RL drivers and the values of a newenvironmental paradigm to extend the TPB, and other variables could be included in thefuture. This may include knowledge, past experiences, inconvenience, openness to change,awareness, responsibility, environmental awareness and knowledge, and social and moralnorms [22,38,45,97,136,148]. These factors can be considered variables that may be added tothe TPB in order to analyze consumer intention relating to the e-waste collection programsmore comprehensively.
Author Contributions: Conceptualization, D.P.S., N.A.M. and A.M.S.A.; methodology, D.P.S., N.A.M.and A.M.S.A.; software, D.P.S.; validation and analysis, D.P.S., N.A.M. and A.M.S.A.; data curation,D.P.S.; writing—original draft preparation, D.P.S.; writing—review and editing, N.A.M. and A.M.S.A.;visualization, D.P.S.; supervision, N.A.M. and A.M.S.A. All authors have read and agreed to thepublished version of the manuscript.
Funding: This research was funded by the BUDI DN Grant from the Lembaga Pengelola DanaPenelitian (LPDP), Ministry of Finance, and Ministry of Education and Culture, Republic of Indonesia,grant number KET-193/LPDP.4/2020.
Institutional Review Board Statement: Not applicable.
Informed Consent Statement: Not applicable.
Data Availability Statement: The data used to support the findings of this study are available fromthe corresponding author by request.
Acknowledgments: We would like to thank the survey respondents for taking the time to answerthe questionnaire and the reviewers of this paper for their valuable comments.
Conflicts of Interest: The authors declare no conflict of interest.
Sustainability 2021, 13, 2759 20 of 28
Appendix A
Variables The Measurement Items Sources
Biospheric Values (BV) Preventing Pollution (BV1) [45,61,96]
Respect for the Earth (BV2)
Unity with Nature (BV3)
Protecting the Environment (BV4)
Altruistic Values (AV) Equality (AV1) [45,61,96]
A Peaceful World (AV2)
Social Justice (AV3)
Helpful (AV4)
Loyalty (AV5)
Respect for Parents and Elders (AV6)
Egoistic Values (EV) Influence (EV1) [45,61,96]
Social Strength (EV2)
Wealth (EV3)
Authority (EV4)
Environmental Concern (EC)
I am very concerned about the state of the world environment(EC1)
[61–63]
I am willing to participate in e-waste collection programs bybringing my used smartphones to collection centers for
protecting the environment (EC2)
Major social changes are needed to protect the naturalenvironment (EC3)
Major political changes are needed to protect the naturalenvironment (EC4)
Humans must maintain a balance with nature in order tosurvive (EC5)
Human disturbance of nature often has disastrousconsequences (EC6)
Anti-pollution laws need to be more strongly enforced (EC7)
Personal Attitudes (PA)I think e-waste collection programs by bringing my used
smartphones to collection centers is useful and profitable (PA1)[36,62,63]
I think participate in e-waste collection programs by bringingmy used smartphones to collection centers is important for
protecting the environment (PA2)
I think participating in e-waste collection programs by bringingmy used smartphones to collection centers is useful for
reducing natural resource shortages (PA3)
I think participating in e-waste collection programs by bringingmy used smartphones to collection centers is a good idea (PA4)
I like the idea of participating in e-waste collection programs bybringing my used smartphones to collection centers (PA5)
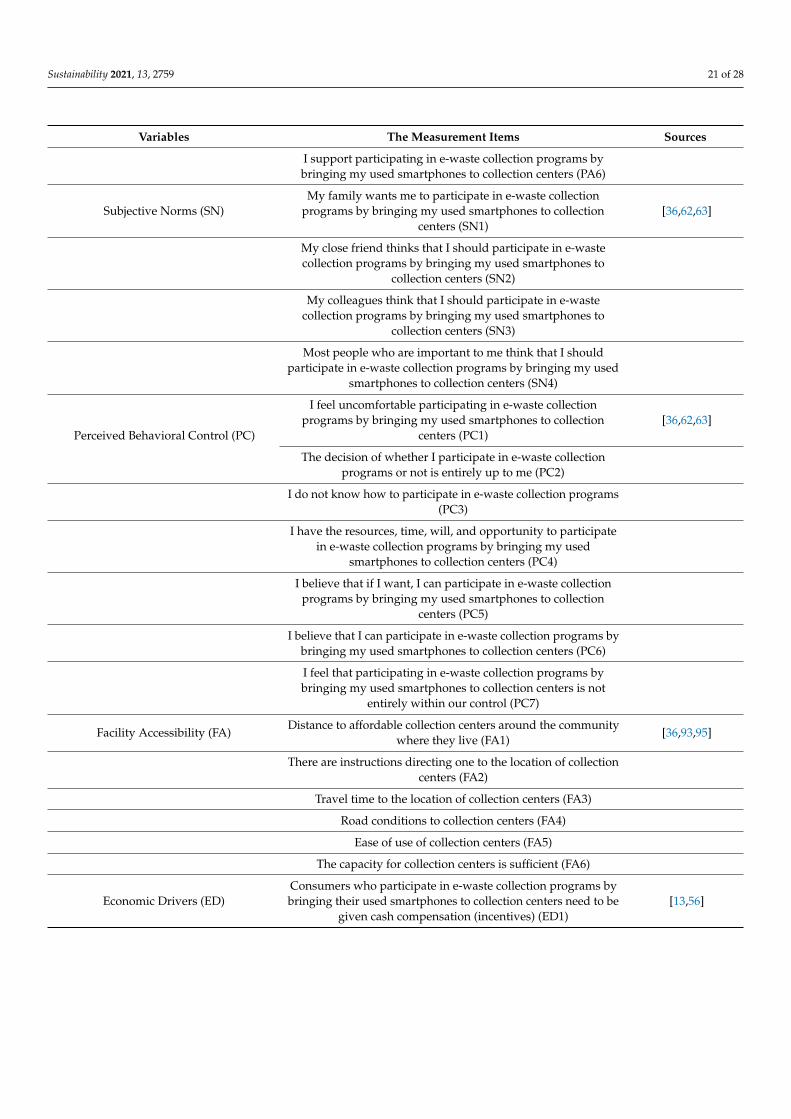
Sustainability 2021, 13, 2759 21 of 28
Variables The Measurement Items Sources
I support participating in e-waste collection programs bybringing my used smartphones to collection centers (PA6)
Subjective Norms (SN)My family wants me to participate in e-waste collection
programs by bringing my used smartphones to collectioncenters (SN1)
[36,62,63]
My close friend thinks that I should participate in e-wastecollection programs by bringing my used smartphones to
collection centers (SN2)
My colleagues think that I should participate in e-wastecollection programs by bringing my used smartphones to
collection centers (SN3)
Most people who are important to me think that I shouldparticipate in e-waste collection programs by bringing my used
smartphones to collection centers (SN4)
Perceived Behavioral Control (PC)
I feel uncomfortable participating in e-waste collectionprograms by bringing my used smartphones to collection
centers (PC1)[36,62,63]
The decision of whether I participate in e-waste collectionprograms or not is entirely up to me (PC2)
I do not know how to participate in e-waste collection programs(PC3)
I have the resources, time, will, and opportunity to participatein e-waste collection programs by bringing my used
smartphones to collection centers (PC4)
I believe that if I want, I can participate in e-waste collectionprograms by bringing my used smartphones to collection
centers (PC5)
I believe that I can participate in e-waste collection programs bybringing my used smartphones to collection centers (PC6)
I feel that participating in e-waste collection programs bybringing my used smartphones to collection centers is not
entirely within our control (PC7)
Facility Accessibility (FA)Distance to affordable collection centers around the community
where they live (FA1)[36,93,95]
There are instructions directing one to the location of collectioncenters (FA2)
Travel time to the location of collection centers (FA3)
Road conditions to collection centers (FA4)
Ease of use of collection centers (FA5)
The capacity for collection centers is sufficient (FA6)
Economic Drivers (ED)Consumers who participate in e-waste collection programs bybringing their used smartphones to collection centers need to be
given cash compensation (incentives) (ED1)[13,56]

Sustainability 2021, 13, 2759 22 of 28
Variables The Measurement Items Sources
Consumers who participate in e-waste collection programs bybringing their used smartphones to collection centers need to begiven replacements (incentives) as discounts in purchasing new
products (ED2)
Consumers who participate in e-waste collection programs bybringing their used smartphones to collection centers need to be
given replacements (incentives) as new products by addingcertain costs (ED3)
Government Drivers (GD)
If the government actually implements rules that urgeconsumers to bring their used smartphones to collection centersto be managed in order to prevent environmentally damagingdisposal, you intend to participate in the collection program
(GD1)
[19,56]
If the government actually enforces a rule that encouragesconsumers to bring their used smartphones to collection centersto be managed in order to prevent environmentally damaging
disposal, then you intend to participate in the collectionprogram (GD2)
If the government actually enforces a rule requiring bring theirused smartphones to collection centers to be managed in orderto prevent environmentally damaging disposal, then you intend
to participate in the collection program (GD3)
If the government really applies sanctions/fines for consumerswho do not bring their used smartphones to collection centersto recycle their used smartphones, you intend to participate in
the collection program (GD4)
Consumer Intention to Participate ine-waste Collection Programs (CI)
I plan to participate in e-waste collection programs by bringingmy used smartphones to collection centers (CI1)
[36,62,63]
I am willing to participate in e-waste collection programs bybringing my used smartphones to collection centers (CI2)
I would consider participating in e-waste collection programsby bringing my used smartphones to collection centers (CI3)
I hope to participate in e-waste collection programs by bringingmy used smartphones to collection centers (CI4)
I want to participate in e-waste collection programs by bringingmy used smartphones to collection centers soon (CI5)
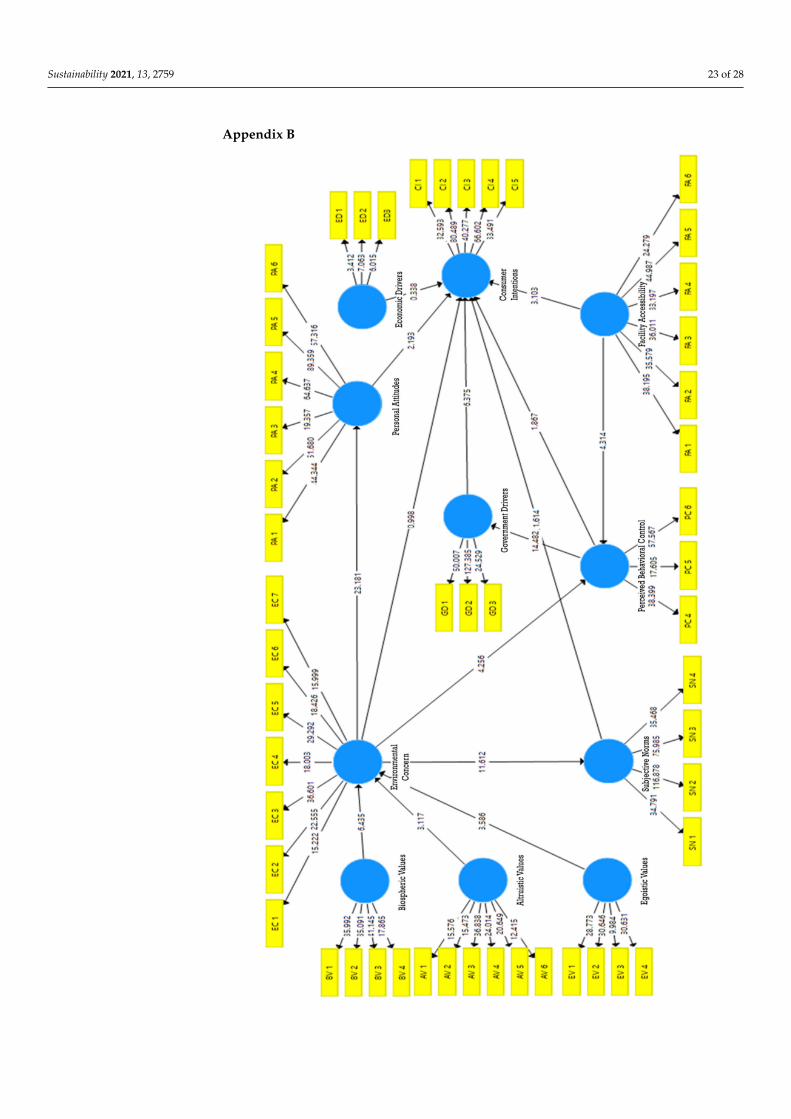
Sustainability 2021, 13, 2759 23 of 28
Appendix B

Sustainability 2021, 13, 2759 24 of 28
References1. Andarani, P.; Goto, N. Potential e-waste generated from households in Indonesia using material flow analysis. J. Mater. Cycles
Waste Manag. 2014, 16, 306–320. [CrossRef]2. Arya, S.; Kumar, S. E-waste in India at a glance: Current trends, regulations, challenges and management strategies. J. Clean. Prod.
2020, 271, 122707. [CrossRef]3. Ilankoon, I.M.S.K.; Ghorbani, Y.; Chong, M.N.; Herath, G.; Moyo, T.; Petersen, J. E-waste in the international context—A review
of trade flows, regulations, hazards, waste management strategies and technologies for value recovery. Waste Manag. 2018, 82,258–275. [CrossRef] [PubMed]
4. Kumar, A.; Dixit, G. An analysis of barriers affecting the implementation of e-waste management practices in India: A novelISM-DEMATEL approach. Sustain. Prod. Consum. 2018, 14, 36–52. [CrossRef]
5. Increased Media Device Usage Due to the Coronavirus Outbreak among Internet Users Worldwide as of March 2020, by Country.Available online: https://www.statista.com/statistics/1106607/device-usage-coronavirus-worldwide-by-country/ (accessed on20 July 2020).
6. Baldé, C.P.; Forti, V.; Gray, V.; Kuehr, R.; Stegmann, P. The Global E-waste Monitor 2017 Quantities, Flows, and Resources; UnitedNations University (UNU): Bonn, Germany; International Telecommunication Union (ITU): Geneva, Switzerland; IInternationalSolid Waste Association (ISWA): Vienna, Austria, 2017.
7. Sutanto, A.; Yuliandra, B.; Pratama, W. Manufaktur yang berkelanjutan pada sampah elektronik (e-waste) di kota Padang:Tinjauan kasus sampah kulkas. J. Optimasi. Sist. Ind. 2017, 16, 1–25. [CrossRef]
8. United Nation Environment Program (UNEP). The Montreal Protocol on Subtances that Deplete the Ozone Layer; UNEP: Nairobi,Kenya, 1987.
9. Diabat, A.; Kannan, D.; Kaliyan, M.; Svetinovic, D. An optimization model for product returns using genetic algorithms andartificial immune system. Resour. Conserv. Recycl. 2013, 74, 156–169. [CrossRef]
10. De Brito, M.P.; Dekker, R. Modelling product returns in inventory control-Exploring the validity of general assumptions. Int. J.Prod. Econ. 2003, 81–82, 225–241. [CrossRef]
11. Guide, V.D.R.; Harrison, T.P.; Van Wassenhove, L.N. The Challenge of Closed-loop Supply Chains. Interfaces 2003, 33, 3–6.[CrossRef]
12. De Brito, M.P.; Dekker, R. A Framework for Reverse Logistics. In Reverse Logistics; Springer: Berlin/Heidelberg, Germany, 2004.13. Akdogan, M.S.; Coskun, A. Drivers of reverse logistics activities: An empirical investigation. Procedia-Soc. Behav. Sci. 2012,
58, 1640–1649. [CrossRef]14. Srivastava, S.K. Network design for reverse logistics. Omega 2008, 36, 535–548. [CrossRef]15. Mwanza, B.G.; Mbohwa, C.; Telukdarie, A. Drivers of reverse logistics in the plastic industry: Producer’s perspective. In
Proceedings of the International Conference on Industrial Engineering and Operations Management, Bogota, Colombia,25–26 October 2017.
16. Chileshe, N.; Rameezdeen, R.; Hosseini, M.R.; Martek, I.; Li, H.X.; Panjehbashi-Aghdam, P. Factors driving the implementation ofreverse logistics: A quantified model for the construction industry. Waste Manag. 2018, 78, 48–57. [CrossRef]
17. Chiou, C.Y.; Chen, H.C.; Yu, C.T.; Yeh, C.Y. Consideration factors of reverse logistics implementation -A case study of Taiwan’selectronics industry. Procedia-Soc. Behav. Sci. 2012, 40, 375–381. [CrossRef]
18. Manik, D.R.; Lumbantoruan, R.S.; Nasution, A.A. Faktor pendorong dan penghambat penerapan green supply chain management.In Talenta Conference Series: Energy and Engineering (EE); Talenta: Medan, Indonesia, 2019.
19. Agrawal, S.; Singh, R.K.; Murtaza, Q. Prioritizing critical success factors for reverse logistics implementation using fuzzy-TOPSISmethodology. J. Ind. Eng. Int. 2016, 12, 15–27. [CrossRef]
20. Mangla, S.K.; Govindan, K.; Luthra, S. Critical success factors for reverse logistics in Indian industries: A structural model. J.Clean. Prod. 2016, 129, 608–621. [CrossRef]
21. Botetzagias, I.; Dima, A.F.; Malesios, C. Extending the Theory of Planned Behavior in the context of recycling: The role of moralnorms and of demographic predictors. Resour. Conserv. Recycl. 2015, 95, 58–67. [CrossRef]
22. Sulaiman, N.; Chan, S.W.; Ong, Y.S. Factors influencing recycling intention among University students. Int. J. Innov. Technol.Explor. Eng. 2019, 8, 336–340.
23. Pamuk, S.; Kahriman-Pamuk, D. Preservice teachers’ intention to recycle and recycling behavior: The role of recycling opportuni-ties. Int. Electron. J. Environ. Educ. 2019, 9, 33–45.
24. Strydom, W.F. Applying the theory of planned behavior to recycling behavior in South Africa. Recycling 2018, 3, 43. [CrossRef]25. Mak, T.M.W.; Yu, I.K.M.; Wang, L.; Hsu, S.C.; Tsang, D.C.W.; Li, C.N. Extended theory of planned behavior for promoting
construction waste recycling in Hong Kong. Waste Manag. 2019, 83, 161–170. [CrossRef]26. Tong, X.; Nikolic, I.; Dijkhuizen, B.; van den Hoven, M.; Minderhoud, M.; Wäckerlin, N. Behavior change in post-consumer
recycling: Applying agent-based modelling in social experiment. J. Clean. Prod. 2018, 187, 1006–1013. [CrossRef]27. Santoso, A.N. Community Participation in Household Waste Management: An Exploratory Study in Indonesia. E3S Web Conf.
2019, 125, 07013. [CrossRef]28. Arifani, V.M.; Haryanto, H. Purchase intention: Implementation theory of planned behavior (Study on reusable shopping bags in
Solo City, Indonesia). IOP Conf. Ser. Earth Environ. Sci. 2018, 200, 012019. [CrossRef]
Sustainability 2021, 13, 2759 25 of 28
29. Chen, K.; Deng, T. Research on the green purchase intentions from the perspective of Product knowledge. Sustainability 2016, 8,943. [CrossRef]
30. Yadav, R.; Pathak, G.S. Determinants of Consumers’ Green Purchase Behavior in a Developing Nation: Applying and Extendingthe Theory of Planned Behavior. Ecol. Econ. 2017, 134, 114–122. [CrossRef]
31. Liobikiene, G.; Mandravickaite, J.; Bernatoniene, J. Theory of planned behavior approach to understand the green purchasingbehavior in the EU: A cross-cultural study. Ecol. Econ. 2016, 125, 38–46. [CrossRef]
32. Mancha, R.M.; Yoder, C.Y. Cultural antecedents of green behavioral intent: An environmental theory of planned behavior. J.Environ. Psychol. 2015, 43, 145–154. [CrossRef]
33. Pramod, V.B.D. Correlates of Pro-Environmental Behavior at Railway Station. IOSR J. Humanit. Soc. Sci. 2014, 19, 22–30.[CrossRef]
34. Tolkes, C.; Butzmann, E. Motivating pro-sustainable behavior: The potential of green events-A case-study from the MunichStreetlife Festival. Sustainability 2018, 10, 3731. [CrossRef]
35. Van der Werff, E.; Vrieling, L.; Van Zuijlen, B.; Worrell, E. Waste minimization by households—A unique informational strategy inthe Netherlands. Resour. Conserv. Recycl. 2019, 144, 256–266. [CrossRef]
36. Zhang, B.; Lai, K.H.; Wang, B.; Wang, Z. From intention to action: How do personal attitudes, facilities accessibility, andgovernment stimulus matter for household waste sorting? J. Environ. Manag. 2019, 233, 447–458. [CrossRef]
37. Moller, M.; Haustein, S.; Bohlbro, M.S. Adolescents’ associations between travel behavior and environmental impact: A qualitativestudy based on the Norm-Activation Model. Travel Behav. Soc. 2018, 11, 69–77. [CrossRef]
38. Joanes, T. Personal norms in a globalized world: Norm-activation processes and reduced clothing consumption. J. Clean. Prod.2019, 212, 941–949. [CrossRef]
39. Fang, W.T.; Chiang, Y.T.; Ng, E.; Lo, J.C. Using the norm activation model to predict the pro-environmental behaviors of publicservants at the central and local governments in Taiwan. Sustainability 2019, 11, 3712. [CrossRef]
40. Onwezen, M.C.; Antonides, G.; Bartels, J. The Norm Activation Model: An exploration of the functions of anticipated pride andguilt in pro-environmental behavior. J. Econ. Psychol. 2013, 39, 141–153. [CrossRef]
41. Han, H. The norm activation model and theory-broadening: Individuals’ decision-making on environmentally-responsibleconvention attendance. J. Environ. Psychol. 2014, 40, 462–471. [CrossRef]
42. Benyamin, A.; Djuwita, R.; Ariyanto, A.A. Norm activation theory in the plastic age: Explaining children’s pro-environmentalbehavior. E3S Web Conf. 2018, 74, 08008. [CrossRef]
43. Dursun, I.; Tümer Kabadayı, E.; Tuger, A.T. Application of Value-Belief-Norm theory to responsible post consumption behaviors:Recycling and reuse. In Proceedings of the International Congress of the New Approaches and Technologies for SustainableDevelopment, Isparta, Turkey, 21–24 September 2017; pp. 21–24.
44. Liobikiene, G.; Poškus, M.S. The importance of environmental knowledge for private and public sphere pro-environmentalbehavior: Modifying the Value-Belief-Norm theory. Sustainability 2019, 11, 3324. [CrossRef]
45. Ghazali, E.M.; Nguyen, B.; Mutum, D.S.; Yap, S.F. Pro-Environmental Behaviors and Value-Belief-Norm Theory: AssessingUnobserved Heterogeneity of Two Ethnic Groups. Sustainability 2019, 11, 3237. [CrossRef]
46. Han, H.; Hwang, J.; Lee, M.J. The value–belief–emotion–norm model: Investigating customers’ eco-friendly behavior. J. Travel.Tour. Mark. 2017, 34, 590–607. [CrossRef]
47. Wynveen, C.J.; Wynveen, B.J.; Sutton, S.G. Applying the value-belief-norm theory to marine contexts: Implications for encouragingpro-environmental behavior. Coast. Manag. 2015, 43, 84–103. [CrossRef]
48. Zhang, S.; Zhang, M.; Yu, X.; Ren, H. What keeps Chinese from recycling: Accessibility of recycling facilities and the behavior.Resour. Conserv. Recycl. 2016, 109, 176–186. [CrossRef]
49. Liu, Y.; Sheng, H.; Mundorf, N.; Redding, C.; Ye, Y. Integrating norm activation model and theory of planned behavior tounderstand sustainable transport behavior: Evidence from China. Int. J. Environ. Res. Public Health 2017, 14, 1593. [CrossRef][PubMed]
50. Setiawan, R.; Santosa, W.; Sjafruddin, A. Integration of theory of planned behavior and norm activation model on studentbehavior model using cars for traveling to campus. Civ. Eng. Dimens. 2014, 16, 117–122.
51. Rasool, F.; Zuberi, N.A.; Siddiqui, N.U.; Madni, M. Individual energy conservation behavior in Karachi, Pakistan. Int. J. Econ.Environ. Geol. 2019, 10, 93–99. [CrossRef]
52. Sánchez, M.; López-Mosquera, N.; Lera-López, F.; Faulin, J. An extended planned behavior model to explain the willingness topay to reduce noise pollution in road transportation. J. Clean. Prod. 2018, 177, 144–154. [CrossRef]
53. Stern, P.C. Toward a coherent theory of environmentally significant behavior. J. Soc. Issues 2000, 56, 407–424. [CrossRef]54. Nguyen, T.N.; Lobo, A.; Greenland, S. The influence of Vietnamese consumers’ altruistic values on their purchase of energy
efficient appliances. Asia Pac. J. Mark. Logist. 2017, 29, 759–777. [CrossRef]55. Nguyen, H.V.; Nguyen, N.; Nguyen, B.K.; Greenland, S. Sustainable food consumption: Investigating organic meat purchase
intention by Vietnamese consumers. Sustainability 2021, 13, 953. [CrossRef]56. Budijati, S.M. Model Pengelolaan Reverse Logistics Jalur Formal Dan Informal Serta Mengakomodasi Perilaku Konsumen.
Ph.D. Thesis, Universitas Gadjah Mada, Yogyakarta, Indonesia, 2016.57. Hazen, B.T.; Hall, D.J.; Hanna, J.B. Reverse logistics disposition decision-making: Developing a decision framework via content
analysis. Int. J. Phys. Distrib. Logist. Manag. 2012, 42, 244–274. [CrossRef]
Sustainability 2021, 13, 2759 26 of 28
58. Ajzen, I. Residual effects of past on later behavior: Habituation and reasoned action perspectives. Personal. Soc. Psychol. Rev. 2002,6, 107–122. [CrossRef]
59. Kim, Y.; Han, H. Intention to pay conventional-hotel prices at a green hotel—A modification of the theory of planned behavior. J.Sustain. Tour. 2010, 18, 997–1014. [CrossRef]
60. Sommer, L. The theory of planned behavior and the impact of past behavior. Int. Bus. Econ. Res. J. 2011, 10, 91–110.61. Verma, V.K.; Chandra, B.; Kumar, S. Values and ascribed responsibility to predict consumers’ attitude and concern towards green
hotel visit intention. J. Bus. Res. 2019, 96, 206–216. [CrossRef]62. Maichum, K.; Parichatnon, S.; Peng, K.C. Application of the extended theory of planned behavior model to investigate purchase
intention of green products among Thai consumers. Sustainability 2016, 8, 1077. [CrossRef]63. Paul, J.; Modi, A.; Patel, J. Predicting green product consumption using theory of planned behavior and reasoned action. J. Retail.
Consum. Serv. 2016, 29, 123–134. [CrossRef]64. Prakash, G.; Choudhary, S.; Kumar, A.; Garza-Reyes, J.A.; Khan, S.A.R.; Panda, T.K. Do altruistic and egoistic values influence
consumers’ attitudes and purchase intentions towards eco-friendly packaged products? An empirical investigation. J. Retail.Consum. Serv. 2019, 50, 163–169. [CrossRef]
65. Setyawan, A.; Noermijati, N.; Sunaryo, S.; Aisjah, S. Green product buying intentions among young consumers: Extending theapplication of theory of planned behavior. Probl. Perspect. Manag. 2018, 161, 45–54. [CrossRef]
66. Nadlifatin, R.; Razif, M.; Lin, S.C.; Persada, S.F.; Belgiawan, P.F. An assessment model of Indonesian citizens’ intention toparticipate on environmental impact assessment (EIA): A behavioral perspective. Procedia Environ. Sci. 2015, 28, 3–10. [CrossRef]
67. Persada, S.F.; Lin, S.C.; Nadlifatin, R.; Razif, M. Investigating the citizens’ intention level in environmental impact assessmentparticipation through an extended theory of planned behavior model. Glob. Nest J. 2015, 17, 847–857.
68. Ajzen, I. The theory of planned behavior organizational behavior and human decision processes. Organ. Behav. Hum. Decis.Process. 1991, 50, 179–211. [CrossRef]
69. Patch, C.S.; Tapsell, L.C.; Williams, P.G. Attitudes and intentions toward purchasing novel foods enriched with omega-3 fattyacids. J. Nutr. Educ. Behav. 2005, 37, 235–241. [CrossRef]
70. Han, H.; Hsu, L.T.; Sheu, C. Application of the Theory of Planned Behavior to green hotel choice: Testing the effect of environ-mental friendly activities. Tour. Manag. 2010, 31, 325–334. [CrossRef]
71. Wu, S.I.; Chen, J.Y. A Model of green consumption behavior constructed by the theory of planned behavior. Int. J. Mark. Stud.2014, 6, 119–132. [CrossRef]
72. Macovei, O.I. Applying the theory of planned behavior in predicting pro-environmental behavior: The case of energy conservation.Acta Univ. Danub. Œcon. 2015, 11, 15–33.
73. Nguyen, Q.A.; Hens, L.; Nguyen, N.; MacAlister, C.; Lebel, L. Explaining intentions by vietnamese schoolchildren to adoptpro-environmental behaviors in response to climate change using theories of persuasive communication. Environ. Manag. 2020,66, 845–857. [CrossRef]
74. Nguyen, T.N.; Lobo, A.; Greenland, S. The influence of cultural values on green purchase behavior. Mark. Intell. Plan. 2017, 35,377–396. [CrossRef]
75. Nguyen, T.T.P.; Zhu, D.; Le, N.P. Factors influencing waste separation intention of residential households in a developing country:Evidence from Hanoi, Vietnam. Habitat Int. 2015, 48, 169–176. [CrossRef]
76. Chen, M.F.; Tung, P.J. Developing an extended theory of planned behavior model to predict consumers’ intention to visit greenhotels. Int. J. Hosp. Manag. 2014, 36, 221–230. [CrossRef]
77. Jiang, L.; Zhang, J.; Wang, H.H.; Zhang, L.; He, K. The impact of psychological factors on farmers’ intentions to reuse agriculturalbiomass waste for carbon emission abatement. J. Clean. Prod. 2018, 189, 797–804. [CrossRef]
78. Khan, F.; Ahmed, W.; Najmi, A. Understanding consumers’ behavior intentions towards dealing with the plastic waste: Perspec-tive of a developing country. Resour. Conserv. Recycl. 2019, 142, 49–58. [CrossRef]
79. Zhou, Y.; Thøgersen, J.; Ruan, Y.; Huang, G. The moderating role of human values in planned behavior: The case of Chineseconsumers’ intention to buy organic food. J. Consum. Mark. 2013, 30, 335–344. [CrossRef]
80. Coskun, A.; Yetkin Özbük, R.M. What influences consumer food waste behavior in restaurants? An application of the extendedtheory of planned behavior. Waste Manag. 2020, 117, 170–178. [CrossRef] [PubMed]
81. Yuan, Y.; Nomura, H.; Takahashi, Y.; Yabe, M. Model of Chinese household kitchen waste separation behavior: A case study inBeijing City. Sustainability 2016, 8, 1083. [CrossRef]
82. Dunlap, R.E.; Jones, R.E. Environmental Concern: Conceptual and Measurement Issues. Handbook of Environment Sociology; GreenwoodPress: London, UK, 2002; Volume 3, pp. 482–524.
83. Chen, S.C.; Hung, C.W. Elucidating the factors influencing the acceptance of green products: An extension of theory of plannedbehavior. Technol. Forecast Soc. Chang. 2016, 112, 155–163. [CrossRef]
84. Ong, T.F.; Musa, G. SCUBA divers’ underwater responsible behavior: Can environmental concern and divers’ attitude make adifference? Curr. Issues Tourism. 2012, 15, 329–351. [CrossRef]
85. Verma, V.K.; Chandra, B. Hotel guest’s perception and choice dynamics for green hotel attribute: A mix method approach. IndianJ. Sci. Technol. 2016, 9, 1–9. [CrossRef]
86. Nadlifatin, R.; Lin, S.C.; Rachmaniati, Y.P.; Persada, S.F.; Razif, M. A pro-environmental reasoned action model for measuringcitizens’ intentions regarding ecolabel product usage. Sustainability 2016, 8, 1165. [CrossRef]

Sustainability 2021, 13, 2759 27 of 28
87. Cossu, R.; Masi, S. Re-thinking incentives and penalties: Economic aspects of waste management in Italy. Waste Manag. 2013, 33,2541–2547. [CrossRef]
88. Kinobe, J.R.; Gebresenbet, G.; Niwagaba, C.B.; Vinnerås, B. Reverse logistics system and recycling potential at a landfill: A casestudy from Kampala City. Waste Manag. 2015, 42, 82–92. [CrossRef]
89. Rosov, K.A.; Mallin, M.A.; Cahoon, L.B. Waste nutrients from U.S. animal feeding operations: Regulations are inconsistent acrossstates and inadequately assess nutrient export risk. J. Environ. Manag. 2020, 269, 110738. [CrossRef] [PubMed]
90. Lambert, S.; Riopel, D.; Abdul-Kader, W. A reverse logistics decisions conceptual framework. Comput. Ind. Eng. 2011, 3, 561–581.[CrossRef]
91. Jiang, P.; Van Fan, Y.; Zhou, J.; Zheng, M.; Liu, X.; Klemeš, J.J. Data-driven analytical framework for waste-dumping behavioranalysis to facilitate policy regulations. Waste Manag. 2020, 103, 285–295. [CrossRef]
92. Yadav, V.; Karmakar, S.; Dikshit, A.K.; Bhurjee, A.K. Interval-valued facility location model: An appraisal of municipal solidwaste management system. J. Clean. Prod. 2018, 171, 250–263. [CrossRef]
93. Lange, B.P.; Schwarz, S.; Zaretsky, E.; Euler, H.A. Sounding hot? Experimental research on verbal proficiency as a menstrualcycle-dependent female mate choice criterion. Acta Linguist. 2014, 8, 133–139.
94. Ertz, M.; Karakas, F.; Sarigöllü, E. Exploring pro-environmental behaviors of consumers: An analysis of contextual factors,attitude, and behaviors. J. Bus. Res. 2016, 69, 3971–3980. [CrossRef]
95. Ando, A.W.; Gosselin, A.Y. Recycling in multifamily dwellings: Does convenience matter? Econ. Inq. 2005, 43, 426–438. [CrossRef]96. Shin, Y.H.; Moon, H.; Jung, S.E.; Severt, K. The effect of environmental values and attitudes on consumer willingness to pay more
for organic menus: A value-attitude-behavior approach. J. Hosp. Tour. Manag. 2017, 33, 113–121. [CrossRef]97. Hiratsuka, J.; Perlaviciute, G.; Steg, L. Testing VBN theory in Japan: Relationships between values, beliefs, norms, and acceptability
and expected effects of a car pricing policy. Transp. Res. Part F Traffic Psychol Behav. 2018, 53, 74–83. [CrossRef]98. Steg, L.; Bolderdijk, J.W.; Keizer, K.; Perlaviciute, G. An integrated framework for encouraging pro-environmental behavior: The
role of values, situational factors and goals. J. Environ. Psychol. 2014, 38, 104–115. [CrossRef]99. The Oxford Handbook of Environmental and Conservation Psychology; Oxford University Press: Oxford, UK, 2012.100. Lind, H.B.; Nordfjærn, T.; Jørgensen, S.H.; Rundmo, T. The value-belief-norm theory, personal norms and sustainable travel mode
choice in urban areas. J. Environ. Psychol. 2015, 44, 119–125. [CrossRef]101. Katz-Gerro, T.; Greenspan, I.; Handy, F.; Lee, H.Y. The relationship between value types and environmental behavior in four
countries: Universalism, benevolence, conformity and biospheric values revisited. Environ. Values 2017, 26, 223–249. [CrossRef]102. Lauper, E.; Moser, S.; Fischer, M.; Matthies, E. Explaining car drivers’ intention to prevent road-traffic noise: An application of the
norm activation model. Environ. Behav. 2014, 48, 826–853. [CrossRef]103. Nguyen, T.N.; Lobo, A.; Greenland, S. Energy efficient household appliances in emerging markets: The influence of consumers’
values and knowledge on their attitudes and purchase behavior. Int. J. Consum. Stud. 2017, 41, 167–177. [CrossRef]104. Park, J.; Ha, S. Understanding consumer recycling behavior: Combining the theory of planned behavior and the norm activation
model. Fam. Consum. Sci. Res. J. 2014, 42, 278–291. [CrossRef]105. Mishra, S.B.; Alok, S. Handbook of Research Methodology; Educreation Publishing: Chhattisgarh, India, 2011.106. Sugiyono. Metode Penelitian Kuantitatif Kualitatif dan R&D; Alfabeta: Bandung, Indonesia, 2011.107. Kline, R.B. Principles and Practice of Structural Equation Modeling, 3rd ed.; Guilford Press: New York, NY, USA, 2011.108. Sekaran, U.; Bougie, R. Research Methods for Business: A Skill Building Approach; John Wiley & Sons: Hoboken, NJ, USA, 2016.109. Singh, Y.K. Fundamental of Research Methodology and Statistics; New Age International Publishers: New Delhi, India, 2006.110. Joshi, A.; Kale, S.; Chandel, S.; Pal, D.K. Likert Scale: Explored and Explained. Br. J. Appl. Sci. Technol. 2015, 7, 396–403. [CrossRef]111. Bamberg, S. How does environmental concern influence specific environmentally related behaviors? A new answer to an old
question. J. Environ. Psychol. 2003, 23, 21–32. [CrossRef]112. Vinzi, V.E.; Wynne, W.; Chin, W.W.; Henseler, J.; Wang, H. Handbook of Partial Least Squares: Concepts, Methods and Applications;
Springer: Berlin/Heidelberg, Germany, 2010.113. Garson, G.D. Partial Least Squares; Regression and Structural Equation Models; Statistical Associates Publishing: Asheboro, NC,
USA, 2016.114. Liu, J.; Yi, Y.; Wang, X. Exploring factors influencing construction waste reduction: A structural equation modeling approach. J.
Clean. Prod. 2020, 276, 123185. [CrossRef]115. Wong, K.K. Partial Least Squares Structural Equation Modeling (PLS-SEM) Techniques Using SmartPLS. Mark. Bull. 2013, 24,
1–32.116. Ringle, C.M.; Wende, S.; dan Becker, J.M. SmartPLS 3. Boenningstedt: SmartPLS GmbH. 2015. Available online: http://www.
smartpls.com (accessed on 12 January 2021).117. Richardson, H.A.; Simmering, M.J.; Sturman, M.C. A tale of three perspectives: Examining post hoc statistical techniques for
detection and correction of common method variance. Organ. Res. Methods 2009, 12, 762–800. [CrossRef]118. Podsakoff, P.M.; MacKenzie, S.B.; Lee, J.Y.; Podsakoff, N.P. Common method biases in behavioral research: A critical review of
the literature and recommended remedies. J. Appl. Psychol. 2003, 88, 879–903. [CrossRef]119. Williams, L.J.; Brown, B.K. Method variance in organizational behavior and human resources research: Effects on correlations,
path coefficients, and hypothesis testing. Organ. Behav. Hum. Decis. Processes. 1994, 57, 185–209. [CrossRef]
Sustainability 2021, 13, 2759 28 of 28
120. Bagozzi, R.P.; Yi, Y. Assessing method variance in multitrait-multimethod matrices: The case of self-reported affect and perceptionsat work. J. Appl. Psychol. 1990, 75, 547–560. [CrossRef]
121. Malhotra, N.K.; Kim, S.S.; Patil, A. Common method variance in IS research: A comparison of alternative approaches and areanalysis of past research. Manag. Sci. 2006, 52, 1865–1883. [CrossRef]
122. Hair, J.F., Jr.; Black, W.C.; Babin, B.J.; Anderson, R.E. Multivariate Data Analysis, 7th ed.; Pearson Education Inc.: Hoboken, NJ, USA, 2010.123. Chin, W.W. The Partial Least Squares Approach to Structural Equation Modeling. In Methodology for Business and Management.
Modern Methods for Business Research; Marcoulides, G., Ed.; Lawrence Erlbaum Associates Publishers: Mahwah, NJ, USA, 1998.124. Yuan, H. Critical management measures contributing to construction waste management: Evidence from construction projects in
China. Proj. Manag. J. 2013, 44, 101–112. [CrossRef]125. Nguyen, N.; Johnson, L.W. Consumer behavior and environmental sustainability. J. Consum. Behav. 2020, 19, 539–541. [CrossRef]126. Dai, Y.C.; Gordon, M.P.R.; Ye, J.Y.; Xu, D.Y.; Lin, Z.Y.; Robinson, N.K.L. Why doorstepping can increase household waste recycling.
Resour. Conserv. Recycl. 2015, 102, 9–19. [CrossRef]127. Bal, A.; Satoglu, S.I. A goal programming model for sustainable reverse logistics operations planning and an application. J. Clean.
Prod. 2018, 201, 1081–1091. [CrossRef]128. Abdallah, M.; Abu Talib, M.; Feroz, S.; Nasir, Q.; Abdalla, H.; Mahfood, B. Artificial intelligence applications in solid waste
management: A systematic research review. Waste Manag. 2020, 109, 231–246. [CrossRef] [PubMed]129. Boeve-de Pauw, J.; Van Petegem, P. A cross-cultural study of environmental values and their effect on the environmental behavior
of children. Environ. Behav. 2013, 45, 551–583. [CrossRef]130. Latif, S.A.; Omar, M.S.; Bidin, Y.H.; Awang, Z. Environmental values as a predictor of recycling behavior in urban areas: A
comparative study. Procedia-Soc. Behav. Sci. 2012, 50, 989–996. [CrossRef]131. Qi-Yan, W.; Yan-Li, L.I. Research on Status and Influence Factors of Citizen’s Environmental Behaviors in Beijing. Energy Procedia
2011, 5, 2103–2107. [CrossRef]132. Sierzchula, W.; Bakker, S.; Maat, K.; Van Wee, B. The influence of financial incentives and other socio-economic factors on electric
vehicle adoption. Energy Policy 2014, 68, 183–194. [CrossRef]133. Mizobuchi, K.; Takeuchi, K. The influences of financial and non-financial factors on energy-saving behavior: A field experiment
in Japan. Energy Policy 2013, 63, 775–787. [CrossRef]134. Owusu, V.; Adjei-Addo, E.; Sundberg, C. Do economic incentives affect attitudes to solid waste source separation? Evidence from
Ghana. Resour. Conserv. Recycl. 2013, 78, 115–123. [CrossRef]135. Wang, J.; Li, Z.; Tam, V.W.Y. Critical factors in effective construction waste minimization at the design stage: A Shenzhen case
study, China. Resour. Conserv. Recycl. 2014, 82, 1–7. [CrossRef]136. Ponce-Cueto, E.; Manteca, J.Á.G.; Carrasco-Gallego, R. Reverse logistics practices for recovering mobile phones in Spain. Supply
Chain Forum Int. J. 2011, 12, 104–114. [CrossRef]137. Ongondo, F.O.; Williams, I.D.; Cherrett, T.J. How are WEEE doing? A global review of the management of electrical and electronic
wastes. Waste Manag. 2011, 31, 714–730. [CrossRef] [PubMed]138. Khetriwal, D.S.; Kraeuchi, P.; Widmer, R. Producer responsibility for e- waste management: Key issues for consideration—learning
from the Swiss experience. J. Environ. Manag. 2009, 90, 153–165. [CrossRef] [PubMed]139. Wagner, T.P.; Toews, P.; Bouvier, R. Increasing diversion of household hazardous wastes and materials through mandatory retail
take-back. J. Environ. Manag. 2013, 123, 88–97. [CrossRef]140. Borthakur, A.; Singh, P. Electronic waste in India: Problems and policies. Int. J. Environ. Sci. 2012, 3, 353–362.141. Wang, Z.; Zhang, B.; Yin, J.; Zhang, X. Willingness and behavior towards e-waste recycling for residents in Beijing City, China. J.
Clean. Prod. 2011, 19, 977–984. [CrossRef]142. Suja, F.; Rahman, R.A.; Yusof, A.; Masdar, M.S. e-Waste management scenarios in Malaysia. J. Waste Manag. 2014. [CrossRef]143. Kumar, U.; Singh, D.N. E-waste management through regulations. Int. J. Eng. Invent. 2013, 3, 6–14.144. Nathania, L. Swedia Negara Yang Telah Berhasil Mendaur Ulang 99% Sampahnya. 2016. Available online: http://intisari-online.com/
read/swedia-negara-yang-telah-berhasil-mendaur-ulang-99-sampahnya (accessed on 16 January 2021).145. Pengelolaan Sampah Terbaik di Dunia dari Swedia. 2019. Available online: https://suneducationgroup.com/news-id/pengelolaan-
sampah-terbaik-di-dunia-dari-swedia/ (accessed on 16 January 2021).146. Baldé, C.P.; Wang, F.; Kuehr, R.; Huisman, J. The Global e-Waste Monitor; UNU- IAS: Bonn, Germany, 2014.147. Kim, S.H.; Seock, Y.K. The roles of values and social norm on personal norms and pro-environmentally friendly apparel product
purchasing behavior: The mediating role of personal norms. J. Retail. Consum. Serv. 2019, 51, 83–90. [CrossRef]148. Razali, F.; Daud, D.; Weng-Wai, C.; Anthony Jiram, W.R. Waste separation at source behavior among Malaysian households: The
Theory of Planned Behavior with moral norm. J. Clean. Prod. 2020, 271, 122025. [CrossRef]