Ornamental plants for micropollutant removal in wetland systems
c© Indian Academy of Sciences
RESEARCH ARTICLE
Construction of genetic linkage map of the medicinal andornamental plant Catharanthus roseus
SARIKA GUPTA1,2, SASHI PANDEY-RAI1, SUCHI SRIVASTAVA1, SUBHAS CHANDRA NAITHANI2,MANOJ PRASAD1 and SUSHIL KUMAR1, ∗
1National Institute for Plant Genome Research (NIPGR), Aruna Asaf Ali Marg,Post Box No. 10531, New Delhi 110 067, India
2School of Life Sciences, Pandit Ravi Shankar Shukla University, Raipur 492 010, India
Abstract
An integrated genetic linkage map of the medicinal and ornamental plant Catharanthus roseus, based on different types ofmolecular and morphological markers was constructed, using a F2 population of 144 plants. The map defines 14 linkagegroups (LGs) and consists of 131 marker loci, including 125 molecular DNA markers (76 RAPD, 3 RAPD combinations; 7ISSR; 2 EST-SSR from Medicago truncatula and 37 other PCR based DNA markers), selected from a total of 472 primersor primer pairs, and six morphological markers (stem pigmentation, leaf lamina pigmentation and shape, leaf petiole andpod size, and petal colour). The total map length is 1131.9 cM (centiMorgans), giving an average map length and distancebetween two markers equal to 80.9 cM and 8.6 cM, respectively. The morphological markers/genes were found linked withnearest molecular or morphological markers at distances varying from 0.7 to 11.4 cM. Linkage was observed between themorphological markers concerned with lamina shape and petiole size of leaf on LG1 and leaf, stem and petiole pigmentationand pod size on LG8. This is the first genetic linkage map of C. roseus.
[Gupta Sarika, Pandey-Rai Sashi, Srivastava Suchi, Naithani Subhas Chandra, Prasad Manoj and Kumar Sushil 2007 Construction of geneticlinkage map of the medicinal and ornamental plant Catharanthus roseus. J. Genet. 86, 259–268]
IntroductionCatharanthus roseus is simultaneously an ornamental anda medicinal plant species. It belongs to the family Apoc-ynaceae, consisting of 411 genera and 4650 species, manyof them are of ornamental and medicinal values (Simp-son 2006). The genus Catharanthus includes seven speciesbesides C. roseus, namely C. coriaceus, C. lanceus, C.longifolius, C. ovalis, C. pusillus, C. scitulus and C.trichophyllus, of which C. pusillus is endemic to Indiawhereas others are endemic to Madagascar. The speciesC. roseus and C. trichophyllus are crosshybridizable. Sev-eral scores of ornamental cultivars of C. roseus, bredfor differing shoot habit, time of blooming, petal col-oration and suitability for cultivation in homes and gar-dens are in vogue worldwide (Snoeijer 2001; van der Hei-jden et al. 2004). An important breeding objective for
*For correspondence. E-mail: sushil2000 [email protected].
the genetic improvement of ornamental cultivars is the incor-poration of resistance towards the fungal pathogens Pythiumaphanidermatum and Phytopthera nicotinae to which mostof the ornamental cultivars are susceptible. C. roseus haspotent secondary metabolism responsible for monoterpenoidglucosides and other terpenoid compounds, steroids, pheno-lics, flavanoids, anthocyanins and 130 terpenoid indole al-kaloids (TIAs) (Facchini 2001; van der Heijden et al. 2004;Pandey-Rai et al. 2006). The widely used anticancer TIAdrugs vinblastine and vincristine (Leveque et al. 1996) aresemisythesized from their natural precursors vindoline andcatharanthine that are obtained fromC. roseus root and shootorgans. Ajmalicine, a cardiactonic TIA drug is also extractedfrom C. roseus roots (Leveque et al. 1996). The high cost ofproduction of pharmaceutically important TIAs is related totheir low level of accumulation in C. roseus organs. Thus, toincrease the concentrations of TIAs in plant organs is anotherimportant objective of genetic work on C. roseus.
Keywords. medicinal plant; ornamental plant; linkage map; RAPD; EST-SSR; ISSR; sequence specific markers; Catharanthus roseus.
Journal of Genetics, Vol. 86, No. 3, December 2007 259
Sarika Gupta et al.
C. roseus is one of the highly investigated plant species,with genetic, proteomic, metabolomic and biotechnologicalstudies in progress (Kulkarni et al. 1999; van der Heijdenet al. 2004; Jacobs et al. 2005; Memelink 2005; Ledue etal. 2006; Rischer et al. 2006). Some of the features of C.roseus that make it a suitable genetic system are the bian-nual, seed cyclable, herbaceous perennial habit, diploidy(2n = 16; 1500 Mbp = 12 × Arabidopsis thaliana genome)and amenability to controlled pollination and micropropa-gation (Mishra and Kumar 2000; van der Fits et al. 2000;Debnata et al. 2006). Many of the genes involved in TIAbiosynthesic pathway of C. roseus have been cloned and se-quenced for the analysis of their expression in various plantorgans (Geerlings et al. 2001; van der Fits and Memelink2001; Facchini and St-Pierre 2005; Mahroug et al. 2006). Alarge number of proteins/enzymes involved in the primarymetabolism of C. roseus have been shown to be highly ho-mologous to corresponding ones already characterised andsequenced in one or more other plant species (Jacobs et al.2005). Several mutant loci affecting the development of or-gans have been reported inC. roseus (Pandey-Rai and Kumar2000, 2001; Pandey-Rai et al. 2003). A genetic linkage mapof C. roseus constructed with the use of molecular and mor-phological markers is required to eventually localise the lociconcerned with TIA yield, disease resistance and ornamentalfeatures on the map for their possible assistance in the breed-ing programmes.
A variety of DNA markers, including restriction fragmentlength polymorphism (RFLP), random amplified polymor-phic DNA (RAPD), inter simple sequence repeats (ISSR),simple sequence repeats (SSR), amplified fragment lengthpolymorphism (AFLP) and their variants have proved use-ful for studying segregation in mapping populations and helpin genetic linkage determination for map construction (Lorzand Wenzel 2005). F2, double haploid (DH) and recombinantinbred lines (RILs) derived from crosses between geneticallydivergent parents have been successfully used as mappingpopulations in a large number of food and industrial plants(Lorz and Wenzel 2005; Meksem and Kahl 2005).
In C. roseus, a number of microsatellite markers have re-cently been developed and deployed for the study of intraspe-cific and interspecific as well as intrageneric and intergenericgenetic polymorphism (Shokeen et al. 2005, 2007). In thepresent work we studied the segregation of RAPD, ISSR,EST-SSR and sequence-specific markers in the F2 progenyplants of a cross between two morphologically differentiableand genetically distant lines to construct a framework geneticmap of C. roseus.
Materials and methodsPlant materials and DNA extraction
We used 144 F2 plants of C. roseus, developed by cross-ing the accession ‘Pink Delhi’ (pink coloured flower petals
and stem, dark green leaf lamina bearing elliptic apex andborne on small petiole, long pods, tall habit, less salt anddrought sensitivity, and high in alkaloid yield) and accessiongsr8 (white flower petals, yellow green stem and leaf laminabearing oblong apex and borne on large petiole, small pods,semidwarf habit, more salt and drought tolerance, low in al-kaloid yield) as mapping population. Genomic DNA was ex-tracted from leaf material of field grown plants using a CTABmethod (Saghai-Maroof et al. 1984). The DNA was RNAasetreated and subsequently quantified on agarose gel by com-parison with standard lambda DNA marker (Amersham Bio-sciences, USA).
RAPD and ISSR marker analysis
A total of 260 decamer RAPD primer (sets A to M, OperonTechnologies Inc., Alameda, CA, USA) and 42 ISSR primers(UBC Primer Set No. 9, Vancouver, BC, Canada) werescreened on the two parents (‘Pink Delhi’ and gsr8) to de-termine their potential of clear polymorphisms and repro-ducibility. The selected primers were examined on 144 F2plants. The PCR reactions were carried out in a 25 μl volumecontaining 1 U of Taq polymerase (Invitrogen Corporation,USA), 50 ng of genomic DNA, 0.80 μM of RAPD and ISSRprimers, 0.1 mM of each dNTPs, 2.5 μl of 10× PCR reac-tion buffer (500 mM KCl, 200 mM Tris-HCl (pH 8.4)), 1%Triton × (for ISSR) and 3 mM MgCl2. DNA amplificationswere carried out in a iCycler thermal controller (Bio-Rad).The following two steps were used for RAPD: 1 cycle con-sisting of 60 s at 94◦C, 30 s at 36◦C and 60 s at 72◦C followedby 45 cycles of 5 s at 94◦C, 15 s at 36◦C and 60 s at 72◦C,and a final cycle of 7 min at 72◦C. The ISSR amplificationswere carried out with a preliminary cycle of 2 min at 94◦C,followed by 35 cycles of 20 s at 94◦C, 50 s at 50◦C, and 90 sat 72◦C, and a final cycle of 7 min at 72◦C. The amplificationproducts were resolved on 1.2% (for RAPD) and 1.5% (forISSR) agarose gels in Tris-borate EDTA buffer (45 mM Tris-borate and 1 mM EDTA) and stained with ethidium bromide.
EST-SSR marker analysis
We used 42 barrel medic (Medicago truncatula) EST-derivedSSR primers to screen for polymorphism between the twoparents (‘Pink Delhi’ and gsr8). Eight of the EST-SSRprimers that were detected for polymorphism between thetwo parents were used to assess the mapping population. Thereactions were carried out in a 20 μl volume containing 1U of Taq polymerase (Invitrogen Corporation, USA), 50 ngof genomic DNA, 0.80 μM of each primer, 0.2 mM of eachdNTPs, 2.0 μl of 10× PCR reaction buffer (500 mM KCl,200 mM Tris-HCl (pH 8.4)), and 3 mM MgCl2. DNA ampli-fications were carried out in a MyCycler thermal controller(Bio-Rad). EST-SSR amplifications were performed using apreliminary step of 3 min at 94◦C, followed by 45 cycles of60 s at 94◦C, 60 s at 50◦C and 120 s at 72◦C, and a final
260 Journal of Genetics, Vol. 86, No. 3, December 2007

Linkage map of Catharanthus roseus
step of 10 min at 72◦C. The amplification products were re-solved on 1.5% agarose gels in Tris-borate EDTA buffer (45mM Tris-borate and 1 mM EDTA) and stained with ethidiumbromide.
Other PCR-based sequence-specific markers
We developed 49 primers named as ‘designed’ and 55primers named as ‘designed forward/reverse + RAPD’ forscreening the genetic resources ofC. roseus, and these primersets were also used as DNA markers in the present study.The nomenclature for these primers is given in the sectioncalled ‘marker nomenclature’. Primer sequences, their re-sources and product sizes for the above mentioned primersets are presented in table 1. The reactions were carried outin 25 μl volume containing 1 U of Taq polymerase (Invitro-gen Corporation, USA), 50 ng of genomic DNA, 0.80 μM ofdesigned or designed forward/reverse + RAPD primers, 0.1mM of each dNTPs, 2.5 μl of 10× PCR reaction buffer (500
mM KCl, 200 mM Tris-HCl (pH 8.4)), and 3 mM MgCl2.DNA amplifications were carried out in a iCycler thermalcontroller (Bio-Rad). Designed primer based amplificationswere carried out in three steps: first step consisted of a cy-cle of 30 s at 94◦C second step consisted of a cycle of 30 s at94◦C, 60 s at 45◦C and 60 s at 72◦C for 10 cycles followed by35 cycles of 30 s at 94◦C, 60 s at 52◦C and 60 s at 72◦C and afinal step of a cycle of 10 min at 72◦C. The designed+RAPDprimer based amplifications were also carried out in 3 steps:first step consisted of a cycle of 60 s at 94◦C, 30 s at 50◦C, 60s at 72◦C; second step consisting of a cycle of 60 s at 94◦C,30 s at 36◦C, 60 s at 72◦C followed by 45 cycles of 5 s at94◦C, 15 s at 36◦C and 60 s at 72◦C and a final step of a cycleof 7 min at 72◦C. The amplification products were resolvedon 1.5% agarose gels in Tris-borate EDTA buffer (45 mMTris-borate and 1 mM EDTA) and stained with ethidium bro-mide. The parents were screened for the presence/absence ofbands and polymorphic, repeatable and clear markers wereused on the whole of F2 population.
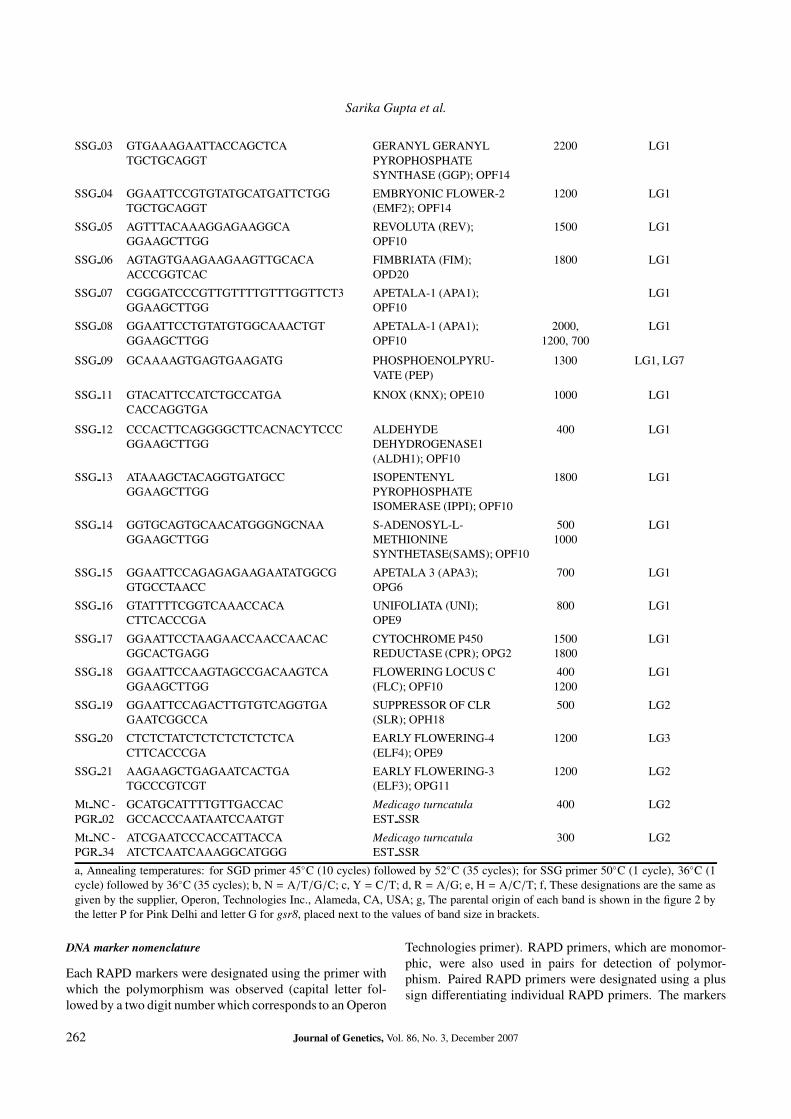
Table 1. Designed, designed forward/reverse + RAPD and EST-SSR primer sequences investigated for use in genetic map constructionin Catharanthus roseus.
Locus Primer sequences (5′ to 3′)a
Gene product for which primerdesigned and used, and identityof the RAPD primer usedf
Size(s) (bp)of the DNAmarkerband(s)realizedg
Linkagegroup (LG)number onwhichmapped
SGA 07 TCCGGTTCCCCACCACNbAAYcCARdAC PUTATIVEGGGACCGGTAGAACTTGGCRAAYTTNTC CYTOCHROME-C 250 LG3
OXIDASE (COX)
SGD 21 CCATCCGGTTCCTGGCNATHcGAYGC TRANSKETOLASE 1 250 LG2GGCCTCCTTGGAGATGCCYTCCATYTG (TKL 1)
SGD 28 GCCCACCATCGTCACCAAYGCNGARGG HEAT SHOCK PROTEIN 70 750 LG2CCGGAGGTGGACAGCACYTCRAANAC (HSP70)
SGD 32 GGACGTGCAGCGGATCATHAAYGARCC HEAT SHOCK PROTEIN 68 800 LG2CTCGGACACGACCTCCTGNACYTTNGG (HSP68)
SGD 36 GCAACGCCCTGATGCARGAYCC ANKYRIN-REPEAT 500 LG2AGGGTCACGGCGGCNCCRTTYTC PROTEIN HBP1 (ANK HBP1) 900
SGD 42 ACCGTGAACGAGTGGGGNTGGTG ENOLASE (ENO) 1200 LG2GCAGCTCCAGGCCCTCYTTRTTYTC
SGD 43 CCGTGGTGCTGGCCAARGTNGAYGC DISULPHIDE 1100 LG2CCAGGGTGTGGCCGAANTCRTARTC ISOMERASE (DI)
SGD 44 GGGCGGCAACTGGAARTGYAAYGG PUTATIVE 800 LG2CAGGGCGTAGGCGGCYTTYTTNCC TRIOSEPHOSPHATE
ISOMERASE (TRI)
SGD 48 CACCCCCTACTGCATCATGTTYGGNCC CALRETICULIN (CRT) 1800 LG2GGGCTTCCATGGGCCYTTRTAYTC
SSG 01 GGAATTCCTAGCTTGTGTGGCAAGA ANTHRANILATE 1000 LG1GTGTGCCCCA SYNTHASE (ANS);
OPD8
SSG 02 CAAAGTTTCCACACAGCACA TRYPTOPHAN LG1GGCTGCAGAA DECARBOXYLASEF (TDC); 1200, 900
OPF13
Journal of Genetics, Vol. 86, No. 3, December 2007 261
Sarika Gupta et al.
SSG 03 GTGAAAGAATTACCAGCTCA GERANYL GERANYL 2200 LG1TGCTGCAGGT PYROPHOSPHATE
SYNTHASE (GGP); OPF14
SSG 04 GGAATTCCGTGTATGCATGATTCTGG EMBRYONIC FLOWER-2 1200 LG1TGCTGCAGGT (EMF2); OPF14
SSG 05 AGTTTACAAAGGAGAAGGCA REVOLUTA (REV); 1500 LG1GGAAGCTTGG OPF10
SSG 06 AGTAGTGAAGAAGAAGTTGCACA FIMBRIATA (FIM); 1800 LG1ACCCGGTCAC OPD20
SSG 07 CGGGATCCCGTTGTTTTGTTTGGTTCT3 APETALA-1 (APA1); LG1GGAAGCTTGG OPF10
SSG 08 GGAATTCCTGTATGTGGCAAACTGT APETALA-1 (APA1); 2000, LG1GGAAGCTTGG OPF10 1200, 700
SSG 09 GCAAAAGTGAGTGAAGATG PHOSPHOENOLPYRU- 1300 LG1, LG7VATE (PEP)
SSG 11 GTACATTCCATCTGCCATGA KNOX (KNX); OPE10 1000 LG1CACCAGGTGA
SSG 12 CCCACTTCAGGGGCTTCACNACYTCCC ALDEHYDE 400 LG1GGAAGCTTGG DEHYDROGENASE1
(ALDH1); OPF10
SSG 13 ATAAAGCTACAGGTGATGCC ISOPENTENYL 1800 LG1GGAAGCTTGG PYROPHOSPHATE
ISOMERASE (IPPI); OPF10
SSG 14 GGTGCAGTGCAACATGGGNGCNAA S-ADENOSYL-L- 500 LG1GGAAGCTTGG METHIONINE 1000
SYNTHETASE(SAMS); OPF10
SSG 15 GGAATTCCAGAGAGAAGAATATGGCG APETALA 3 (APA3); 700 LG1GTGCCTAACC OPG6
SSG 16 GTATTTTCGGTCAAACCACA UNIFOLIATA (UNI); 800 LG1CTTCACCCGA OPE9
SSG 17 GGAATTCCTAAGAACCAACCAACAC CYTOCHROME P450 1500 LG1GGCACTGAGG REDUCTASE (CPR); OPG2 1800
SSG 18 GGAATTCCAAGTAGCCGACAAGTCA FLOWERING LOCUS C 400 LG1GGAAGCTTGG (FLC); OPF10 1200
SSG 19 GGAATTCCAGACTTGTGTCAGGTGA SUPPRESSOR OF CLR 500 LG2GAATCGGCCA (SLR); OPH18
SSG 20 CTCTCTATCTCTCTCTCTCTCA EARLY FLOWERING-4 1200 LG3CTTCACCCGA (ELF4); OPE9
SSG 21 AAGAAGCTGAGAATCACTGA EARLY FLOWERING-3 1200 LG2TGCCCGTCGT (ELF3); OPG11
Mt NC - GCATGCATTTTGTTGACCAC Medicago turncatula 400 LG2PGR 02 GCCACCCAATAATCCAATGT EST SSR
Mt NC - ATCGAATCCCACCATTACCA Medicago turncatula 300 LG2PGR 34 ATCTCAATCAAAGGCATGGG EST SSR
a, Annealing temperatures: for SGD primer 45◦C (10 cycles) followed by 52◦C (35 cycles); for SSG primer 50◦C (1 cycle), 36◦C (1cycle) followed by 36◦C (35 cycles); b, N = A/T/G/C; c, Y = C/T; d, R = A/G; e, H = A/C/T; f, These designations are the same asgiven by the supplier, Operon, Technologies Inc., Alameda, CA, USA; g, The parental origin of each band is shown in the figure 2 bythe letter P for Pink Delhi and letter G for gsr8, placed next to the values of band size in brackets.
DNA marker nomenclature
Each RAPD markers were designated using the primer withwhich the polymorphism was observed (capital letter fol-lowed by a two digit number which corresponds to an Operon
Technologies primer). RAPD primers, which are monomor-phic, were also used in pairs for detection of polymor-phism. Paired RAPD primers were designated using a plussign differentiating individual RAPD primers. The markers
262 Journal of Genetics, Vol. 86, No. 3, December 2007

Linkage map of Catharanthus roseus
namely designed, designed + RAPD and ISSR were namedas ‘SGD’, ‘SSG’ and ‘U’ followed by two or three digit num-bers, respectively. The two mapped EST derived microsatel-lite markers (fromM. truncatula) were named as ‘Mt ESSR’followed by a two digit number. The subscript of each DNAmarker gives the size of the marker in terms of base-pairlength.
Morphological markers
The six morphological markers for which the F2 mappingpopulation was scored are shown in figure 1 and table 2. Themorphological observations were recorded on twenty weekold plants. Three letter designations assigned to the differentcharacters (table 2) were placed on the genetic map.
Inheritance and linkage analysis
The markers were analysed by a chi-square test for goodness-of-fit to the expected Mendelian segregation ratio (3:1) of adominant locus in an F2 population (P < 0.01). Linkageanalysis was performed using the software MAPMANAGERQTX v0.30 (Manly et al. 2001). Linkage groups were estab-lished at a lod score of 3.0 by using the command “MakeLinkage Groups”. The order of the loci within the linkagegroup was refined by the “ripple” command. The Kosambimapping function (Kosambi 1944) was used to convert therecombination fractions into additive genetic distances incM. Final linkage maps were drawn with the help of graphi-cal package MapChart (Voorrips 2002).
Figure 1. Morphological features of leaf, stem, flower and fruit in the ‘Pink Delhi’ (left)and gsr8 (right) accessions of Catharanthus roseus which were used as the parents forderiving the mapping population of F2 progeny plants. (A) Leaf, dark green lamina,elliptic apex and short petiole in ‘Pink Delhi’, and yellow green lamina, oblong apexand long petiole in gsr8, (B) Stem, pigmented in ’Pink Delhi’ and light green in gsr8,(C) Fruit, long pods in ‘Pink Delhi’ and short pods in gsr8 and (D) Flower, pink colouredflower petals in ‘Pink Delhi’ and white petals in gsr8.
Journal of Genetics, Vol. 86, No. 3, December 2007 263
Sarika Gupta et al.
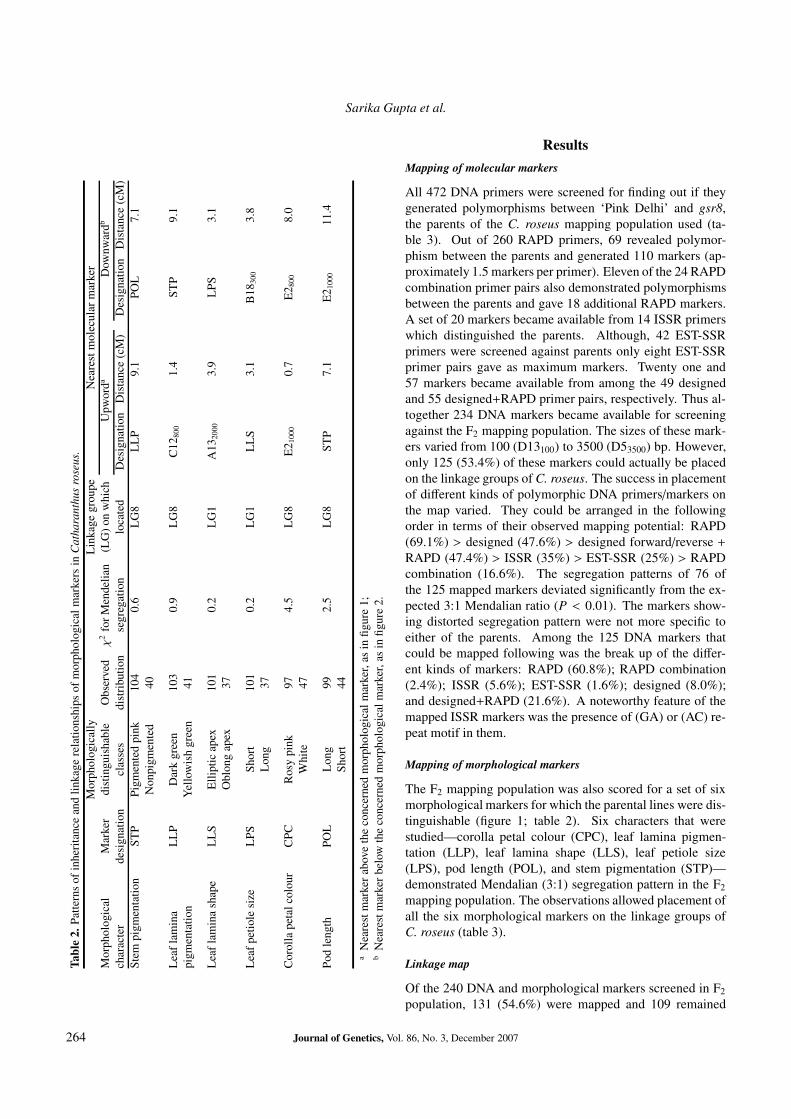
Table2.
Patte
rns
ofin
heri
tanc
ean
dlin
kage
rela
tions
hips
ofm
orph
olog
ical
mar
kers
inCatharanthusroseus.
Mor
phol
ogic
ally
Lin
kage
grou
peN
eare
stm
olec
ular
mar
ker
Mor
phol
ogic
alM
arke
rdi
stin
guis
habl
eO
bser
vedχ
2fo
rMen
delia
n(L
G)o
nw
hich
Upw
orda
Dow
nwar
db
char
acte
rde
sign
atio
ncl
asse
sdi
stri
butio
nse
greg
atio
nlo
cate
dD
esig
natio
nD
ista
nce
(cM
)D
esig
natio
nD
ista
nce
(cM
)St
empi
gmen
tatio
nST
PPi
gmen
ted
pink
104
0.6
LG
8L
LP
9.1
POL
7.1
Non
pigm
ente
d40
Lea
flam
ina
LL
PD
ark
gree
n10
30.
9L
G8
C12
800
1.4
STP
9.1
pigm
enta
tion
Yel
low
ish
gree
n41
Lea
flam
ina
shap
eL
LS
Elli
ptic
apex
101
0.2
LG
1A
1320
003.
9L
PS3.
1O
blon
gap
ex37
Lea
fpet
iole
size
LPS
Shor
t10
10.
2L
G1
LL
S3.
1B
1830
03.
8L
ong
37
Cor
olla
peta
lcol
our
CPC
Ros
ypi
nk97
4.5
LG
8E
2 100
00.
7E
2 800
8.0
Whi
te47
Pod
leng
thPO
LL
ong
992.
5L
G8
STP
7.1
E2 1
000
11.4
Shor
t44
aN
eare
stm
arke
rabo
veth
eco
ncer
ned
mor
phol
ogic
alm
arke
r,as
infig
ure
1;b
Nea
rest
mar
kerb
elow
the
conc
erne
dm
orph
olog
ical
mar
ker,
asin
figur
e2.
ResultsMapping of molecular markers
All 472 DNA primers were screened for finding out if theygenerated polymorphisms between ‘Pink Delhi’ and gsr8,the parents of the C. roseus mapping population used (ta-ble 3). Out of 260 RAPD primers, 69 revealed polymor-phism between the parents and generated 110 markers (ap-proximately 1.5 markers per primer). Eleven of the 24 RAPDcombination primer pairs also demonstrated polymorphismsbetween the parents and gave 18 additional RAPD markers.A set of 20 markers became available from 14 ISSR primerswhich distinguished the parents. Although, 42 EST-SSRprimers were screened against parents only eight EST-SSRprimer pairs gave as maximum markers. Twenty one and57 markers became available from among the 49 designedand 55 designed+RAPD primer pairs, respectively. Thus al-together 234 DNA markers became available for screeningagainst the F2 mapping population. The sizes of these mark-ers varied from 100 (D13100) to 3500 (D53500) bp. However,only 125 (53.4%) of these markers could actually be placedon the linkage groups of C. roseus. The success in placementof different kinds of polymorphic DNA primers/markers onthe map varied. They could be arranged in the followingorder in terms of their observed mapping potential: RAPD(69.1%) > designed (47.6%) > designed forward/reverse +RAPD (47.4%) > ISSR (35%) > EST-SSR (25%) > RAPDcombination (16.6%). The segregation patterns of 76 ofthe 125 mapped markers deviated significantly from the ex-pected 3:1 Mendalian ratio (P < 0.01). The markers show-ing distorted segregation pattern were not more specific toeither of the parents. Among the 125 DNA markers thatcould be mapped following was the break up of the differ-ent kinds of markers: RAPD (60.8%); RAPD combination(2.4%); ISSR (5.6%); EST-SSR (1.6%); designed (8.0%);and designed+RAPD (21.6%). A noteworthy feature of themapped ISSR markers was the presence of (GA) or (AC) re-peat motif in them.
Mapping of morphological markers
The F2 mapping population was also scored for a set of sixmorphological markers for which the parental lines were dis-tinguishable (figure 1; table 2). Six characters that werestudied—corolla petal colour (CPC), leaf lamina pigmen-tation (LLP), leaf lamina shape (LLS), leaf petiole size(LPS), pod length (POL), and stem pigmentation (STP)—demonstrated Mendalian (3:1) segregation pattern in the F2
mapping population. The observations allowed placement ofall the six morphological markers on the linkage groups ofC. roseus (table 3).
Linkage map
Of the 240 DNA and morphological markers screened in F2
population, 131 (54.6%) were mapped and 109 remained
264 Journal of Genetics, Vol. 86, No. 3, December 2007

Linkage map of Catharanthus roseus
Table 3. Molecular and morphological markers used for the construction of genetic linkagemap of catharanthus roseus.
Number ofPrimers/primer polymorphic primers/ Polymorphic Mapped
Marker type pairs screened primer pairs markers markersRAPD 260 69 110 76RAPD combination 24 11 18 3ISSR 42 14 20 7EST-SSR 42 8 8 2Designed 49 19 21 10Designed + RAPD 55 38 57 27Morphological 6 - 6 6Total 478 159 240 131
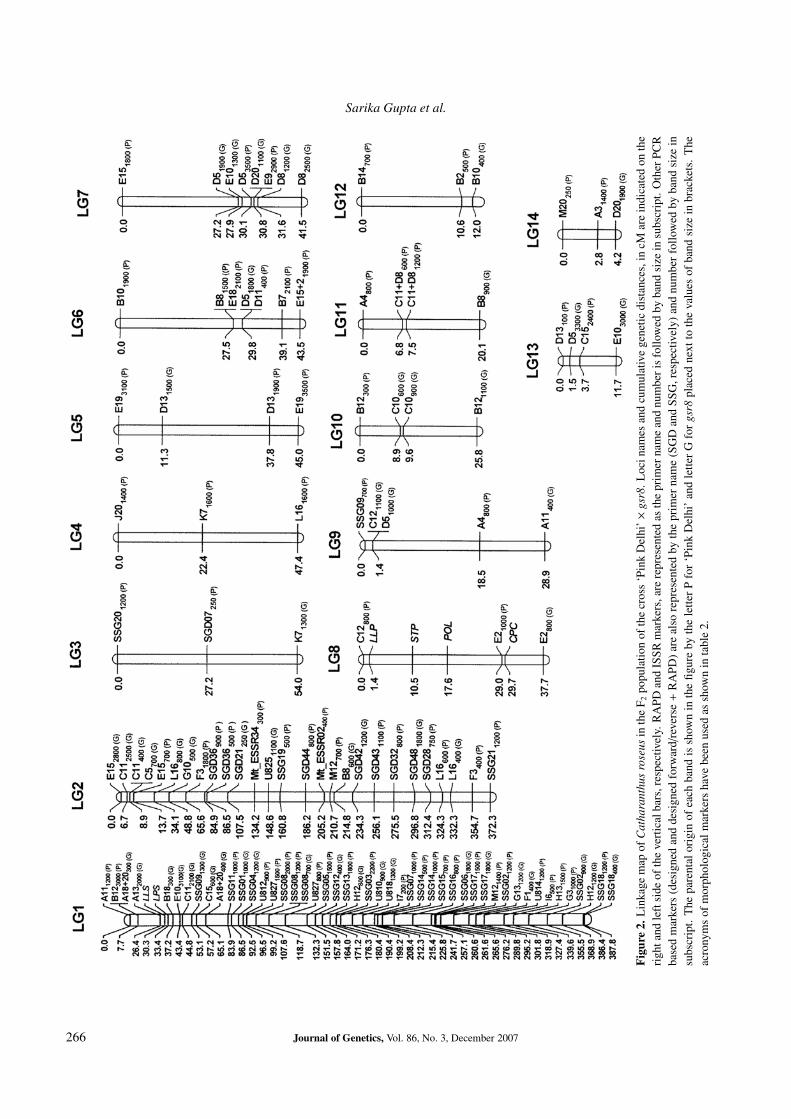
unlinked. Fourteen linkage groups were formed as opposedto the expected eight on the basis of haploid chromosomenumber of the species (figure 2). The linkage groups var-ied widely in length, from 4.2 to 387.8 cM (table 4). Twolinkage groups (LG1 and LG2), were longer than 300 cM,whereas 9 linkage groups (LG3 to LG11), were less than 55cM but longer than 20 cM. Only three linkage groups (LG 12to LG14), were less than 20 cM in length. The map covereda total length of 1131.9 cM with an average marker densityof 8.6 cM between two adjacent markers. A total of 45 gaps(a gap is equal to the distance between two adjacent mark-ers) were found, of which 31 and 14 are of the sizes 10 to20 cM and 20 to 30 cM, respectively (table 4). The maxi-mum number of markers and gaps were found in the linkagegroups LG1 and LG2, respectively. Among the 131 markersplaced on the genetic linkage map of C. roseus (figure 2), 49are distributed on LG1, 27 on LG2, 8 on LG7, 7 on LG6 andLG8, 5 on LG9, 4 on LG5, LG10, LG11 and LG13, 3 onLG3, LG4, LG12 and LG14. The six morphological markersgot placed on 2 linkage groups, LLS and LPS on LG1 andLLP, STP, POL and CPC on LG8.
Discussion
Detailed genetic linkage maps of crop plant, on which molec-ular DNA markers are tightly placed and in which loci formorphological features, quantitative traits and specific geneshave been located with reference to molecular markers arevery useful, especially for cloning of desired chromosomesegment/gene(s) and early selection of desirable recombi-nants in cross breeding programmes. Such highresolutionmap of a species evolves by progressive integration of mapsdeveloped by the study of several to many mapping popula-tions having origin in different intraspecies and interspeciescrosses, to maximise the coverage of genetic polymorphismsprevalent in the species. Induced mutations are also usedto enrich the genetic variability of crop species where thegenetic resources demonstrate narrow spectrum of geneticpolymorphism. Additionally, all possible kinds of DNAmarkers are deployed to densely cover both euchromatin
and heterochromatin rich genome regions. A detailed ge-netic linkage map is required for efficient implementation ofbreeding programmes aimed at incorporation of disease re-sistance and high alkaloid yield related traits in C. roseus.The present work achieved its goal to develop a primary mapof C. roseus, which may serve as the backbone for futurework. The genetic linkage map of C. roseus presented herewas constructed using an intraspecies F2 population. Themap consists of 125 molecular and six morphological mark-ers and covers 1132 cM of the genome in two large (LG1and LG2) and 12 small linkage groups (LG3 to LG14). Thus14 numbers of linkage groups exceed the haploid numberof chromosomes (n = 8) of the species. The initial maps
Table 4. Summary of genetic linkage map of Catharanthusroseus.
Number of gapsa
Linkage Length Number of of different lengths (cM)group (cM) markers 10–20 20–30
LG1 387.8 49 14 0LG2 372.3 27 11 77LG3 54.0 3 0 2LG4 47.4 3 0 2LG5 45.0 4 1 1LG6 43.5 7 0 1LG7 41.5 8 0 1LG8 37.7 7 1 0LG9 28.9 5 2 0LG10 25.8 4 1 0LG11 20.1 4 1 0LG12 12.0 3 0 0LG13 11.7 4 0 0LG14 4.2 3 0 0Total 1131.9 131 31 14
a Gap is the distance between two adjacent markers.
Journal of Genetics, Vol. 86, No. 3, December 2007 265
Sarika Gupta et al.
Figure2.
Lin
kage
map
ofCatharanthusroseus
inth
eF 2
popu
latio
nof
the
cros
s‘P
ink
Del
hi’×gsr8
.Loc
inam
esan
dcu
mul
ativ
ege
netic
dist
ance
s,in
cMar
ein
dica
ted
onth
eri
ghta
ndle
ftsi
deof
the
vert
ical
bars
,res
pect
ivel
y.R
APD
and
ISSR
mar
kers
,are
repr
esen
ted
asth
epr
imer
nam
ean
dnu
mbe
ris
follo
wed
byba
ndsi
zein
subs
crip
t.O
ther
PCR
base
dm
arke
rs(d
esig
ned
and
desi
gned
forw
ard/
reve
rse+
RA
PD)a
real
sore
pres
ente
dby
the
prim
erna
me
(SG
Dan
dSS
G,r
espe
ctiv
ely)
and
num
ber
follo
wed
byba
ndsi
zein
subs
crip
t.T
hepa
rent
alor
igin
ofea
chba
ndis
show
nin
the
figur
eby
the
lette
rPfo
r‘Pi
nkD
elhi
’and
lette
rGfo
rgsr8
plac
edne
xtto
the
valu
esof
band
size
inbr
acke
ts.
The
acro
nym
sof
mor
phol
ogic
alm
arke
rsha
vebe
enus
edas
show
nin
tabl
e2.
266 Journal of Genetics, Vol. 86, No. 3, December 2007
Linkage map of Catharanthus roseus
of several plant species, including pea (Pisum sativum), oat(Avena sativa) and Bengal gram (Cicer arietinum), also ex-hibits this feature (Weeden et al. 1996; Laucou et al. 1998;Loridon et al. 2005; Weising et al. 2005; Becher 2007). Forexample, the high density integrated map of Cicer arietinum(n = 8) based on RAPD, ISSR, AFLP, SSR and sequencedspecific markers defined 13 linkage groups (Weising et al.2005). This effect arises on account of large gaps betweenmarkers. It is expected that some of the linkage groups willcoalesce when maps constructed by use of several other map-ping populations, and with wider range and larger numberof DNA markers, are integrated to develop a more detailedgenetic linkage map. C. roseus is diploid with 2n = 16and genome size approximately 12 times bigger than that ofA. thaliana, which is also diploid but has 2n = 10. It isexpected that the present form of C. roseus genome (chro-mosome complement) must be an outcome of duplications,deletions and a variety of rearrangements in the course of itsevolution. The observed preponderance of mapped markerson LG1 and LG2 may be a consequence of the past eventsrelated to the evolution of the structures of individual chro-mosomes of C. roseus chromosomal complement. Furtherwork, specially phylogenomic studies in C. roseus and theother model systems, will be helpful in revealing the bases ofdifferential distribution of euchromatin and heterochromatinamong sister chromosomes of a complement.
The molecular markers mapped in this study were of theRAPD, ISSR, EST-SSR and sequence specific types. Thefingerprinting RAPD and ISSR markers are known to be use-ful in increasing the map density in both euchromatic andheterochromatic regions. Indeed, 86 (68.8%) of the 125DNA markers placed on the C. roseus map are of RAPD andISSR kinds. The sequence specific and EST-SSR markers areknown to cover the euchromatic regions of genome/map. Atotal of 12 such markers were placed on the map. Thirtymarkers have their origin in RAPD combinations (3) andRAPD + sequence specific combinations (27). The combina-tions apparently gave markers by promoting new amplifica-tions in regions not covered by a single RAPD and sequencespecific primers. The sequence specific + RAPD markers arealso expected to have covered the euchromatic regions of C.roseus map. This study showed that combining of RAPDwith other kinds of primers can be a reliable means to gener-ate new markers.
Interestingly, none of the ISSR primers possessing (AT)8or (TA)8 repeat sequence produced amplification products inC. roseus. A similar result was also reported in lentil Lensculinaris (Rubeena et al. 2003). The result was surprisingsince (AT) repeats are most abundant repeat type in plantgenomes (Wang et al. 1994; Gupta and Varshney 2000). Inthe present study, six out of eight mapped ISSR markers wereobtained, three each from (GA) and (AC) repeat motifs. The(GA) and (AC) repeat motifs were also found to be abun-dant and useful for mapping in Bengal gram, lentil, wheat(Triticum aestivum) and other plant species (Ratnaparkhe et
al. 1998; Kojima et al. 1998; Gupta and Varshney 2000; Am-miraju et al. 2001).
Morphological features of the kind included in this studyare expected to be a result of coordinated expression of multi-genes. However, the genetic backgrounds of the parents maybe polymorphic for only one to several genes determiningthe traits. Segregation patterns of the six characters studiedfitted the Mendelian 3:1 ratio. In this study the inheritancepattern of the corolla petal colour, known to be multigenic inother studies (Kulkarni et al. 2005), was seen to be mono-genic. The distances between morphological markers thatcolocalized on LG1 and LG8 was large (from 3.1 to 9.1 cM),such that their coordinated regulation based on linkage is notindicated.
The linkage map constructed from the cross between‘Pink Delhi’ × gsr8 using PCR-based markers is the first tobe reported forC. roseus. It is hoped that the genetic map willprove useful in locating and manipulation of genes of interestand in selection of TIA yield determining traits found linkedwith molecular markers in segregating populations.
Acknowledgements
Grateful thanks are due to the Director, National Institute forPlant Genome Research, for providing facilities, the Department ofBiotechnology, Government of India and Indian National ScienceAcademy for providing financial support, and to S. K. Rai, VinodKumar and Sunil Kumar for their assistance in field work.
ReferencesAmmiraju J. S. S., Dholakia B. B., Santra D. K., Singh H.,
Tamhankar S. A., Dhaliwal H. S. et al. 2001 Identification ofsimple sequence repeat (ISSR) markers associated with seed sizein wheat. Theor. Appl. Genet. 102, 726–732.
Becher R. 2007 EST-derived microsatellites as a rich sourceof molecular markers for oats. Plant Breeding DOI:10.1111/j.1439–0523.2007.010330.x.
Debnata M., Malik C. P. and Bireu P. S. 2006 Micropropagationa tool for the production of high quantity plant. Curr. Pharm.Biotech. 7, 35–39.
Facchini P. J. 2001 Alkaloid biosynthesis in plants: biochemistry,cell biology, molecular regulation and metabolic engineering ap-plications. Annu. Rev. Plant Physiol. Plant Mol. Biol. 52, 29–66.
Facchini P. J. and St-Pierre B. 2005 Synthesis and trafficking of al-kaloid biosynthetic enzymes. Curr. Opin. Plant Biol. 6, 657–666.
Geerlings A., Redondo F. J., Contin A., Memelink J., van der Hei-jden R. and Verpoorte R. 2001 Biotransformation of tryptamineand secologanin into plant terpenoid indole alkaloids by trans-genic yeast. Appl. Microbiol. Biotechnol. 56, 420–424.
Gupta P. K. and Varshney R. K. 2000 The development and useof microsatellite markers for genetic analysis and plant breedingwith emphasis on bread wheat. Euphytica 113, 163–185.
Jacobs D. I., Gaspari., van der Greef J., van der Heijden R. and Ver-poorte R. 2005 Proteome analysis of the medicinal plant Catha-ranthus roseus. Planta 221, 690–704.
Kojima T., Nagaoka T., Noda K. and Ogihara Y. 1998 Genetic link-age map of ISSR and RAPD markers in Einkorn wheat in relationto that of RFLP markers. Theor. Appl. Genet. 96, 37–45.
Kosambi D. D. 1944 The estimation of map distance from recom-bination values. Ann. Eugen. 12, 172–175.
Journal of Genetics, Vol. 86, No. 3, December 2007 267

Sarika Gupta et al.
Kulkarni R. N., Baskaran K. and Sreevalli K. 2005 Genetics ofnovel corolla colours in periwinkle. Euphytica 144, 101–107.
Kulkarni R. N., Baskaran K., Chandrashekhara R. S. and KumarS. 1999 Inheritance of morphological traits of periwinkle mu-tants with modified contents and yields of leaf and root alkaloids.Plant Breeding 118, 71–74.
Laucou V., Haurogne K., Ellis N. and Rameau C. 1998 Geneticmapping in pea. 1. RAPD-based genetic linkage map of Pisumsativum. Theor. Appl. Genet. 97, 905–915
Ledue M., Tikhomiroff C., Cloutier M., Perrier M. and JolicoeurM. 2006 Development of a kinetic metabolic model: applicationto Catharanthus roseus hairy root. Biopro. Biosystem. Eng. 28,295–313.
Leveque D., Wihlm J. and Jehl F. 1996 Pharmacology of Catharan-thus alkaloids. Bull. Cancer 83, 176–186.
Loridon K., McPhee K., Morin J., Dubreuil P., Pilet-Nayel M. L.,Aubert G. et al. 2005 Microsatellite marker polymorphism andmapping in pea (Pisum sativum L.). Theor. Appl. Genet. 111,1022–1031.
Lorz H. and Wenzel G. 2005 Molecular Marker Systems in PlantBreeding and Crop Improvement. Springer, Berlin.
Mahroug S., Courdavault V., Thiersault M., St-Pierre B. and BurlatV. 2006 Epidermis is a pivotal site of at least four secondarymetabolic pathways in Catharanthus roseus aerial organs. Planta223, 1191–2000.
Manly K. F., Cudmore Jr. R. H. and Meer J. M. 2001 Map Man-ager QTX, cross-platform software for genetic mapping. Mam-mal. Genome 12, 930–932.
Meksem K. and Kahl G. 2005 The handbook of plant genome map-ping: genetic and physical mapping. Wiley-VCH Verlag GmbH,Weinheim.
Memelink J. 2005 The use of genetics to dissect plant secondarypathways. Curr. Opin. Plant Biol. 8, 230–235.
Mishra P. and Kumar S. 2000 Emergence of periwinkle Catharan-thus roseus as a model system for molecular biology of alkaloids:phytochemistry, pharmacology, plant biology and in vitro and invivo cultivation. J. Med. Aromat. Plant Sci. 22, 306–337.
Pandey-Rai S. and Kumar S. 2000 Induced mutation to monocotyle-dony in periwinkle, Catharanthus roseus, and suppression of mu-tant phenotype by kinetin. J. Genet. 79, 1–18.
Pandey-Rai S. and Kumar S. 2001 Heterocarpous flowers resultingfrom a recessive mutation in periwinkle, Catharanthus roseus.Curr. Sci. 80, 1581–1584.
Pandey-Rai S., Luthra R. and Kumar S. 2003 Salt-tolerant mutantsin glycophytic salinity response (GSR) genes in Catharanthusroseus. Theor. Appl. Genet. 106, 221–230.
Pandey-Rai S., Mallavarupa G. R., Naqvi A. A., Yadav A., RaiS. K., Srivastava S. et al. 2006 Volatile compounds of leavesand flowers of periwinkle Catharanthus roseus (L.) G. Don fromNew Delhi. Flavour and Fragm. J. 21, 427–430.
Ratnaparkhe M. B., Tekeoglu M. and Muehlbauer F. J. 1998 In-ter simple sequence repeat (ISSR) polymorphisms are useful forfinding markers associated with disease resistance gene clusters.Theor. Appl. Genet. 97, 515–519.
Rischer H., Oresic M., Seppaenen-Laakso T., Katajamaa M., Lam-mertyn F., Ardiles-Diaz W. et al. 2006 Gene-to-metabolite net-works for terpenoid indole alkaloid biosynthesis inCatharanthusroseus cells. Proc. Natl. Acad. Sci. USA 103, 5614–5619.
Rubeena, Ford R. and Taylor P. W. J. 2003 Construction of an in-traspecific linkage map of lentil (Lens culinaris ssp. culinaris).Theor. Appl. Genet. 107, 910–916.
Saghai-Maroof M. A., Soliman K. M., Jorgensen R. A. and AllardR.W. 1984 Ribosomal DNA spacer-length polymorphism in bar-ley: Mendelian inheritance, chromosomal location, and popula-tion dynamics. Proc. Natl. Acad. Sci. USA 81, 8014–8018.
Shokeen B., Sethy N. K., Choudhary S. and Bhatia S. 2005 Devel-opment of STMS markers from the medicinal plant Madagascarperiwinkle [Catharanthus roseus (L.) G. Don.]. Mol. Biol. Notes5, 818–820.
Shokeen B., Sethy N. K., Kumar S. and Bhatia S. 2007 Isola-tion and characterization of microsatellite markers for analysisof molecular variation in the medicinal plant Madagascar peri-winkle [Catharanthus roseus (L.) G. Don.]. Plant Science 172,441–451.
Simpson M. G. 2006 Plant systematics. Elsevier, Amsterdam, TheNetherlands.
Snoeijer W. 2001 International register of Catharanthus roseus. Lei-den/Amsterdam Centre for Drug Research, Division of Pharma-cogrosy, Leiden.
van der Fits L. and Memelink J. 2001 The jasmonate inducibleAP2/ERF-domain transcription factor ORCA3 activates gene ex-pression via interaction with a jasmonate-responsive promoter el-ement. Plant J. 25, 43–53.
van der Fits L., Deakin E. A., Hoge J. H. and Memelink J. 2000The ternary transformation system: constitutive VirG on a com-patible plasmid dramatically increases Agrobacterium-mediatedplant transformation. Plant Mol. Biol. 43, 495–502.
van der Heijden R., Jacobs D. I., Snoeijer W., Hallard D. and Ver-poorte R. 2004 The Catharanthus alkaloids: pharmacognosy andbiotechnology. Curr. Med. Chem. 11, 607–628.
Voorrips R. E. 2002 MapChart: software for the graphical presenta-tion of linkage maps and QTLs. J. Hered. 93, 77–78.
Wang Z., Weber J. L., Zhong G. and Tanksley S. D. 1994 Survey ofplant short tandem DNA repeats. Theor. Appl. Genet. 88, 1–6.
Weeden N. F., Swiecicki W. K., Timmerman-Vaughan G. M., El-lis T. H. N. and Ambrose M. 1996 The current pea linkage map.Pisum Genet. 28, 1–4.
Weising K., Nybom H., Wolff K. and Kahl G. 2005 DNA finger-printing in plants: principles, methods, and applications, 2nded. CRC Press, Boca Raton, FL.
Received 22 March 2007
268 Journal of Genetics, Vol. 86, No. 3, December 2007
Copyright © 2022 FDOKUMEN


![[Evaluation of composts from liquid manures for production of forest and ornamental plants]](https://static.fdokumen.com/doc/165x107/63417e5042b596795b0f72a7/evaluation-of-composts-from-liquid-manures-for-production-of-forest-and-ornamental.jpg)