
Constitutive behavior modeling of steels under hot-rolling ...
116
NATL INST. OF STAND & TECH R.I.C AlllDS fl52TS7 iliiiiiiM^^^ NJST i PUBLICATJONS Nisr United States Department of Commerce Technology Administration National Institute of Standards and Technology NIST Technical Note 1500-6 Materials Reliability Series Constitutive Behavior Modeling of Steels Under Hot-Rolling Conditions Y.W. Cheng R.L. Tobler B.J. Filla K.J. Coakley QC 100 .U5753 10.1500- 999
-
Upload
khangminh22 -
Category
Documents
-
view
1 -
download
0
Transcript of Constitutive behavior modeling of steels under hot-rolling ...
NATL INST. OF STAND & TECH R.I.C
AlllDS fl52TS7
iliiiiiiM^^^
NJST i
PUBLICATJONS
Nisr United States Department of CommerceTechnology AdministrationNational Institute of Standards and Technology
NIST Technical Note 1500-6Materials Reliability Series
Constitutive Behavior Modeling of Steels
Under Hot-Rolling Conditions
Y.W. ChengR.L. Tobler
B.J. Filla
K.J. Coakley
QC100.U575310.1500-999


NIST Technical Note 1500-6Materials Reliability Series
Constitutive Behavior IVIodeling of Steels
Under Hot-Rolling Conditions
Y.W. ChengR.L. Tobler
B.J. Filla
K.J. Coakley
Materials Reliability Division
Materials Science and Engineering Laboratory
National Institute of Standards and Technology
325 BroadwayBoulder, Colorado 80303-3328
April 1999
''4TES O*
U.S. DEPARTMENT OF COMMERCE, William M. Daley, SecretaryTECHNOLOGY ADMINISTRATION, Gary R. Bachula, Acting Under Secretary for Technology
NATIONAL INSTITUTE OF STANDARDS AND TECHNOLOGY, Raymond G. Kammer, Director

National Institute of Standards and Technology Technical Note
Natl. Inst. Stand. Technol., Tech. Note 1500-6, 112 pages (April 1999)CODEN:NTNOEF
U.S. GOVERNMENT PRINTING OFFICEWASHINGTON: 1999
For sale by the Superintendent of Documents, U.S. Government Printing Office, Wasfiington, DC 20402-9325

Contents
Foreword v
1. Introduction 2
2. Background 2
3. Constitutive Equations and Factors Affecting Flow Stress 5
3.1 Temperature and Strain Rate 5
3.1.1 Apparent Activation Energy Q 6
3.1.2 Constants A and a 6
3.1.3 Value for /w 6
3.2 Dynamic Recrystall ization 7
3.3 Chemical Composition : 7
3.4 Austenite Grain Size 7
3.5 Precipitation 8
3.6 Adiabatic Heating 8
4. Experimental Approach 9
4.1 Materials 10
4.2 Test Specimen 10
4.3 Apparatus 10
4.3.1 Computer and Peripherals for Machine Control and Data Acquisition .. 11
4.3.2 Load Frames 11
4.3.3 Heating, Cooling, and Vacuum 12
4.3.4 Machine Performance and Reproducibility 13
4.3.4.1 Alignment 13
4.3.4.2 Reproducibility 13
4.3.4.3 Strain Rates 13
4.3.4.4 Specimen Strength 14
4.3.4.5 Adiabatic Heating 14
5. Results and Discussion 14
5.1 Raw Data and Data Analysis 14
5.2 Round-Robin Test Program with UBC 15
5.3 Machine Compliance 17
5.4 Mathematical Description of Stress-Strain Curves 18
5.5 Determination ofModel Parameters 20
5.5.1 Parameter Estimation 21
5.5.2 Uncertainty Analysis 22
5.6 Experimental Stress-Strain Curves and Model Predictions 23
5.6.1 A36 23
5.6.2 DQSK and HSLA-V 23
5.6.3 HSLA-Nb, HSLA-50/Ti-Nb, and IF Steels 24
5.6.4 HSLA-80/Ti-Nb 25
5.7 Strain at Peak Stress 25
in

Contents (continued)
5.8 Boundary Separating Dynamic Recrystallization and
No-Dynamic Recrystallization 26
5.9 Effects of Prior Heat Treatments: HSLA-Nb 26
5.10 Effects of Reheating Temperature and Model Adjustments: HSLA-80/Ti-Nb . 27
5.11 Effects of Retained Strain: HSLA-Nb 28
5.12 Comparison with Data from CANMET 28
5.13 Calculation of Roll-Separating Forces 29
6. Summary and Conclusions 31
7. References 33
Figures 37
IV
Foreword
The Materials Reliability Series ofNIST Technical Notes are reports covering significant research
accomplishments of the Materials Reliability Division. The Division develops measurement
technologies that enable the producers and users of materials to improve the quality and reliability of
their products. Measurement technologies are developed for process control to improve the quality and
consistency of materials, for nondestructive evaluation to assure quality of finished materials and
products, and for materials evaluation to assure reliable performance. Within these broad areas of
measurement technology, the Division has focused its resources on three research themes:
• Intelligent Processing of Materials—To develop on-line sensors for measuring the materials'
characteristics and/or processing conditions needed for real-time process control.
• Ultrasonic Characterization of Materials—To develop ultrasonic measurements for
characterizing internal geometries of materials, such as defects, microstructures, and lattice
distortions.
• Micrometer-Scale Measurements for Materials Evaluation—To develop measurement techniques
for evaluating the mechanical, thermal, and magnetic behavior of thin films and coatings at the
appropriate size scale.
This report is the sixth in the series. It covers research on constitutive behavior of steels under hot-rolling
conditions, one of the projects on Intelligent Processing of Materials. Previous reports in this series are:
Technical Note 1500-1 Tensile Testing of Thin Films: Techniques and Results,
byD.T. Read, 1997
Technical Note 1500-2 Procedures for the Electron-Beam Moire Technique,
by E.S. Drexler, 1998
Technical Note 1500-3 High-Energy, Transmission X-ray Diffraction for Monitoring
Turbine-Blade Solidification, by D.W. Fitting, W.P. Dube,
and T.A. Siewert, 1998
Technical Note 1500-4 Nondestructive Characterization of Reactor Pressure Vessel Steels:
A Feasibility Study, by H.I. McHenry and G.A. Alers, 1 998
Technical Note 1500-5 Electron-Beam Moire Technique: Advances, Verification, Application,
by E.L. Drexler, 1998


CONSTITUTIVE BEHAVIOR MODELING OF STEELS
UNDER HOT-ROLLING CONDITIONS
Y. W. Cheng, R. L. Tobler, and B. J. Filla
Materials Reliability Division
National Institute of Standards and Technology
Boulder, CO 80303
K. J. Coakley
Statistical Engineering Division
National Institute of Standards and Technology
Boulder, CO 80303
The purpose of this work is to develop constitutive equations that predict the
stress-strain curves of steels as functions of hot-rolling process variables, such as
temperature, strain rate, and microstructural features. Eight steels, A36, DQSK,HSLA-V, HSLA-Nb, HSLA-50/Ti-Nb, HSLA-80/Ti-Nb and two interstitial-free
(IF) grades, were selectively tested at temperatures in the range from 900 to 1200
°C, strain rates from 1 to 50 s'\ and austenite grain sizes from 0.012 to 0.29 mm.The data were analyzed to support the development of constitutive models.
To cover a wider range of strain rates, a new computer-controlled servo-
hydraulic laboratory apparatus was designed and built for high strain-rate
experiments. The machine has a load capacity of 100 kN and controllable
constant strain rate of 50 s\ It has been used to generate all the data with the
strain rate of 50 s'' in this project. Data for lower strain rates were generated with
existing equipment.
Models for predicting stress-strain behaviors for the eight steel grades listed
above have been developed. Model predictions correlate well with the
experimental data, indicating that the models adequately describe the stress-strain
behaviors of various steel grades under hot-rolling conditions. Model predictions
for A36 and DQSK are further validated with high strain-rate (up to 150 s"') data
obtained at CANMET.
The models have been used in the Sims equations to calculate the roll-
separating forces which agree well with mill measurements. The models are
currently used in the Hot-Strip Mill Model developed at UBC, Canada.
Key words: Constitutive behavior; dynamic recrystallization; elevated-
temperature mechanical properties of steels; hot-strip rolling; IF
steels; microalloyed steels; plain-carbon steels; thermomechanical
process simulation.

1. Introduction
In 1993, the American Iron and Steel Institute (AISI) sponsored a research project on
microstructural engineering in hot-strip mills. The objective was to develop a predictive tool that
quantitatively links the properties of hot-rolled products to mill processing parameters. The
predictive tool will be a user-friendly computer model that incorporates knowledge of heat flow,
microstructural phenomena (recrystallization, grain growth, precipitation, and austenite
decomposition), and structure-composition-property relationships. It will compute the thermal
and microstructural evolution of steel during hot rolling, as well as the final product properties,
as a function of hot-strip mill design and operating practices.
The AISI project is a cooperative effort involving the National Institute of Standards and
Technology (NIST), the University of British Columbia (UBC-Canada), and U.S. Steel. Major
portions of the research have been performed at NIST and UBC. The University of British
Columbia conducts heat-transfer studies, quantitative characterization of kinetics of
microstructural evolution, and model verification with plant and pilot-plant measurements.
NIST focuses on constitutive behavior and structure-composition-property relationships. The
goal of the constitutive-behavior studies is to model the flow behavior of steels as functions of
chemistry, temperature, strain rate, and other processing variables. This report presents the
results of the constitutive-behavior studies, including experiments to provide stress-strain data
and to understand the effects of different parameters and models to predict stress-strain curves
under hot-rolling conditions.
2. Background
Characterizing the plastic flow of steels is essential to improve industrial hot-forming
operations. During forging or hot rolling, the plastic-flow properties determine the power
requirements of industrial equipment, as well as the mechanical properties and dimensional
accuracy of finished products.
Forming at high temperatures and high strain rates involves a sizable number of
variables. Material response is affected by changes in temperature and strain rate, as well as
steel chemistry and microstructural factors including grain size, grain growth, recrystallization,
and precipitation during processing. The demand for accurate flow-property predictions under
hot-forming conditions has increased in recent years due to research pursuits in the field of
deformation simulation and to commercial needs to manufacture products with ever increasing
efficiency.
Figure 1 presents the block diagrams (rectangular blocks) of a typical hot-strip rolling
operation and the various computer models for different stages (oval-shape blocks) of the
operation. Steel experiences the following conditions during its conversion from slab to hot
strip;
• Temperature may reach 1250 °C at the first stand of the roughing mill, and 900 °C or
lower at the last stand of the finishing mill.

• Strain rate may reach 1 s'^ at the first stand of the roughing mill, and 100-200 s'' or
higher at the last stand of the finishing mill.
• Grain size may exceed 0.25 mm at the first stand of the roughing mill, but may be as
small as 0.015 mm at the last stand of the finishing mill.
Obviously, the material's flow stress varies considerably during different stages of
processing. The research objective is to develop and validate constitutive equations for use in
strip-rolling simulations using numerical techniques, such as the finite element method.
Constitutive equations describe the nonlinear relationships that exist among the process variables
and the internal structures of materials, and they permit us to predict or estimate the steel's flow
properties for specific strip-rolling conditions.
Figure 2 shows some experimentally determined flow-stress curves for DQSK steel. The
relationship between true stress and true strain is called the flow-stress curve because it plots the
stress required for plastic flow at a given strain. The shape of the flow-stress curve relates to
different structural changes going on in the steel as it undergoes hot deformation in the austenite
phase. The three shapes of these curves indicate three possible responses to hot deformation at
high temperatures and high strain rates. The Type I flow-stress curve (at 900 °C) rises
continuously, owing to strain hardening in the austenite. The Type II curve (at 1000 °C) rises at
first, and then reaches a plateau. This plateau is caused by the occurrence of dynamic recovery
in amounts sufficient to counterbalance the effect of strain hardening in austenite. Finally, the
Type III curve (at 1 100 °C) rises to a peak and then subsequently decreases. The decline of the
flow stress in a Type III curve is caused by dynamic recrystallization, which begins when the
critical strain ec is reached.
An important factor that determines which type of the flow-stress curve will manifest is
the Zener-Hollomon parameter [1]:
Z- e expQ_RT (1)
Here, 8 is strain rate, T'\s temperature, R is the universal gas constant, and Q is the apparent
activation energy of the rate-controlling dynamic softening process. High Z promotes strain
hardening, whereas low Z favors dynamic recrystallization, which fosters the decline of flow
stresses following a peak stress. Deformation at intermediate Z corresponds to a balance
between strain hardening and dynamic recovery, which is characterized by a constant flow stress
after initial hardening. If strain rate is held constant in eq (1), then Z increases with decreasing
temperature and the flow stress at low temperature increases. Conversely, the flow stress will
decrease at low strain rates.
The flow-stress curve is fundamental to materials engineering. From it, the important
properties of a steel are interpolated, and the mechanisms of deformation can be determined.
Many attempts have been made to fit mathematical expressions to empirical flow curves at
selected temperatures and strain rates. Exponential equations or power laws and their derivatives

Table 1 . Stress-strain relationships cited in the literature.
Equations References
(2) 2
(3) 3
(4) 4
(5) 5
(6) 6
(7) 7
(8) 7
(9) 8
(10) 7,9
(11) 10
a = Ks"
(T = C7o + Ks"
a - K[£q + £)
a - K£"' + exp(/r + n^£)
0" = cro + (5+ £)"
O = 0ro + 51og(f)
o- = o-,[l-exp(-5f)]"
cr = cTq + ^1 - exp(-C£')]"
cr =(7o
- (/^ - 5) • exp(-C£')
o^B l-exp(-C^"")]" (12)
o- = 1.64-o-^^''
Gp = peak stress; n = 0.22 + 0.001 -ap(13) 11
are commonly used. The parametric constants that relate true stress a, and true strain £, in these
equations must be determined experimentally.
Table 1 lists the various equations that are cited in the literature [2-11] and have been
proposed for use in modeling. These equations were applied to describe Type I or Type II
behaviors. Most equations in table 1 were developed to fit stress-strain relationships at relatively
low temperatures; they may fit the experimental data well, but only for certain materials, and for
limited experimental ranges. For steels at elevated temperatures, eq (4), which is a modified
form of Ludwik's power-law equation of eq (3), has been shown to fit some experimental data
rather well [4]. At NIST, we successfully used eq (9) to describe the stress-strain behavior of bar
steels [8]. The parameters B and n are nearly constant for medium-C microalloyed steels when
as is taken as the flow stress in the steady state. Regarding Type III flow curves, no single
governing equation has been found. Different approaches [9,12-14] have been used to account
for the amount and kinetics of softening due to dynamic recrystallization.

3. Constitutive Equations and Factors Affecting Flow Stress
Constitutive equations describe nonlinear relationships that exist among the process
variables such as effective stress, effective strain rate, and temperature at different strains. Such
equations are unique for each material and processing condition. Usually, for practical
applications they are developed using data obtained under simplified experimental conditions.
The constitutive equations are usually described using a rate expression
e = f{<jJ,S), (14)
where e is strain rate, cr is stress, Tis temperature, and S is the structural state of the material. In
general, S is affected by deformation (strain and strain rate), and temperature.
One of the goals in constitutive-behavior modeling is to predict the flow stress of a given
steel under various processing conditions. For this purpose, rate expressions, such as eq (14), are
rearranged to express the flow stress explicitly as a function of strain, temperature, and strain
rate.
3.1 Temperature and Strain Rate
The rate at which strain is applied can have an important influence on the flow stress. In
general, increasing strain rate increases flow stress. Also, the shape of the stress-strain curve
depends strongly on temperature. Decreasing temperature, in general, increases flow stress.
Typically, the temperature and strain-rate dependence of the rate expression is described by the
hyperbolic sine equation [15]
s - yl[sinh(«o-)]'" expQRT (15)
where .4, a, and m are experimentally determined constants. At low stresses (Qro-<0.8), the
equation is reduced to a power relation such as the equation used to describe creep behavior,
£ = A^g"^ expQRT (16)
and at high stresses {a<j>\.2), it reduces to an exponential relation.
£ = A2 expyfimjcr) expRT (17)
Equation (15) was derived based on results of steady-state creep experiments. It has been
observed that the parameters in eq (15) decrease with strain, especially at small strains, where
steady state has not been reached. After the steady-state stress is reached, these parameters

approach a constant with little variation. It has been shown that eq (15) describes the hot-
deformation behavior of steels better than eqs (16) and (17) [16]. Rearranging and expressing
the steady-state stress as a function of Z, we find from eq (1 5) that
a- ^ 08)
Low Z promotes dynamic recrystallization (Type III behavior in figure 2). As Zincreases, the peak in the curve broadens and the strain that corresponds to the peak stress also
increases. With further increase of Z, Type III behavior approaches Type II behavior and the
peak disappears.
Many hot-deformation studies are devoted to determining the constants A, a, m, and Q in
eq (15). Once these constants are determined for a given steel, eq (15) can be used to interpolate
or extrapolate to conditions for which data are unavailable.
3.1.1 Apparent Activation Energy Q
For C-Mn steels the values ofO fall in the range 262 to 366 kJmol"' [1,4, 17-20]. The
values ofO tend to increase with additions of certain alloying elements including Nb. Values
reported for some Nb microalloyed steels fall in the range 325 to 461 kJ-mof' [12,20,21]. The
apparent activation energy is frequently related to the activation energy for self-diffusion of iron
in austenite, and the reported values are similar. However, some materials show distinct
differences between activation energies determined under hot-working conditions and those
measured during creep [22]. Such materials include steels [22]. In such cases, one should
beware not to extrapolate to conditions beyond the range of actual experimental observations
since Q might vary with strain rate. Abnormal behavior of (7 has been reported for Nb steels [4].
3.1.2 Constants /i and a
The unit for the constant A is s"', and values are usually expressed in \xhA. Some reported
values for In^^ are in the range 25 to 32 [4,12]. The values of a are usually fixed at 0.012 [12] or
0.013 MPa' [4].
3.1.3 Value for m
The values of /w reported in the literature range from 3.2 to 5.0 [4,12,20,22]. This
dimensionless parameter relates to the strain-rate sensitivity of the material, and this parameter is
a measure of the dependence of flow stress on strain rate. The higher the strain rate, the higher
the flow stress. It is widely reported that the strain-rate sensitivity increases with increasing
temperature [23,24]. However, for hot-worked steels, the value of /w remains constant after the
steady-state condition is reached [16]. Note that m, as expressed in eq (15), decreases with an
increase of the strain-rate sensitivity.

3.2 Dynamic Recrystallization
The occurrence of dynamic recrystallization may profoundly affect the flow stress, as
shown in figure 2. Although dynamic recrystallization and its effects have been widely studied,
it has been argued that prospects for the occurrence of dynamic recrystallization during rolling in
a single pass are remote since the critical strain Sc for dynamic recrystallization is seldom
achieved [20,25]. However, the attainment of this critical strain is more probable during multi-
pass rolling in the finishing stands. The interpass time in that case is short, and the rolling
temperature is low; therefore grains deformed in a previous pass do not have sufficient time to
statically recrystallize after deformation, and the strain is retained to the next pass. Thus, strain
increments accumulated in the process of several passes can reach e^ and induce dynamic
recrystallization. Although the occurrence of dynamic recrystallization in an industrial rolling
process seems likely, there has been no report in the literature to substantiate the hypothesis.
A model that considers the occurrence of dynamic recrystallization on stress-strain
behavior has been reported [13,14,24]. This model derives from the ftindamental theories of
hardening and softening (recovery and recrystallization), and it applies to a wide range of
materials and test conditions. As a consequence of its broad applicability, this model contains a
large number of constants that must be determined experimentally. This necessitates some creep
test experiments.
A simpler model that involves four constants has also been proposed for hot-worked
steels [12]. Two of these four constants are material properties: the steady-state flow stress after
dynamic recrystallization and Sc, which is a ftinction of the initial grain size and Z. The steady-
state flow stress after dynamic recrystallization Orexd for a Nb-B steel is expressed as
^rexd = 84.34 sinh-1
5.2x10"
0.2
(19)
3.3 Chemical Composition
In general, the effects of chemical composition on flow properties are embedded in the
constants of the stress-strain equations. For example, additions ofNb increase Q in eq (15), as
noted previously. Few attempts have been made to express the flow stress in terms of
composition [26]. But systematic research quantifying the effects of individual alloying
elements is scarce.
3.4 Austenite Grain Size
Grain size is an important parameter governing the low-temperature mechanical
properties of steels, such as strength and toughness. However, the existing literature for steels
contains little information describing the effects of grain size on flow stress under hot-working
conditions, aside from its effects on the occurrence of dynamic recrystallization.

It is stated that equilibrium subgrain structures are established early during deformation at
high temperatures [22,27]. These subgrain structures determine the flow stress under hot-
working conditions, except at the very early stage of deformation before the subgrain structures
are established. Thus, the initial austenite grain size plays little role in determining the flow
stress of steels. Nevertheless, the austenite grain size does change from one pass to another
during rolling. And the initial grain size influences the value of £c, which increases with an
increase of grain size [1]. Therefore, more research is needed to arrive at conclusive results
about the effects of grain size on the flow behavior of steels.
3.5 Precipitation
Precipitation is another factor that has potent effects on low-temperature mechanical
properties but is not widely discussed in the field of high-temperature flow properties. During
hot rolling, precipitation in C-Mn steels is insignificant, but it does occur in microalloyed steels.
Dynamic precipitation is not likely to take place in single-pass rolling because insufficient time
is available [12,25]. However, the conditions for strain-induced precipitation seem to be
sufficient in the finishing stands of a multipass rolling operation, especially in the case of Nb-
alloyed steels. Temperature is relatively low during rolling in the finishing stands, and strain is
accumulated over several passes. However, even if precipitates do form during rolling, their
potency remains at issue.
3.6 Adiabatic Heating
Adiabatic heating is a factor in tests at high strain rates. Typically, at strain rates
exceeding 1 s'\ the temperature of a test specimen will increase continuously while the test is
progressing. The heat generated in a specimen during deformation at such rates cannot be
dissipated quickly enough to maintain an isothermal condition. If we assume that all the
mechanical energy is converted into heating the specimen, then the temperature increase AT due
to deformation can be estimated [4]:
^T-^. (20)
{am 5e) is the area under the stress-strain curve without temperature correction, p is the steel's
density, and Cp is its heat capacity. The incremental stress decrease due to the adiabatic heating
is
Ao- =\maR)\T T + d^T.'
'
^^^
Depending on test conditions, the specimen's temperature rise can be as high as 30 °C at
a strain of 0.7 [4]. An increase in temperature of 10 °C will generally decrease the flow stress by
2 to 5 MPa. According to one report, the measured and calculated temperature increases due to
adiabatic deformation agree well [4].

4. Experimental Approach
The goal of constitutive modeling is to predict material flow properties. Knowledge of
the stress-strain curve is needed for efficient processing, along with the yield- and flow-strength
data. Experiments provide an accurate mechanical-property database for each steel composition.
Models must then be developed, based on equations that relate the deformation parameters.
In this study, we used uniaxial compression tests and right-circular cylindrical specimens
to characterize the mechanical behavior of selected steels. There are no standard test procedures
for determining flow-stress curves at the relatively high temperature and strain-rate conditions
encountered in industrial processing and metalworking. Compression testing offers advantages
over other test methodologies, especially in simplicity and economy of experimental apparatus.
Tension and torsion tests are viable alternatives. Tension test specimens are not desirable
for hot-deformation studies because they typically neck at strains in the range 10 to 30 %. Muchlarger strains without plastic instability can be achieved using torsion or compression tests.
However, the strain and strain rate in torsion tests will vary from a maximum at the surface of
the cylindrical specimen to at the center. The measured flow stress is then an average stress
over a certain volume of material at the outer layer of the specimen. The strain and strain rate in
torsion tests are likewise averages. It is assumed that the outer layer of the torsion specimen
provides the major contribution to the flow stress because of the stress distribution and work
hardening [28]. Torsion test specimens are usually rigidly fixed in the drive system. Therefore,
the strain-rate transient depends on the time needed to attain the operating speed. The strain rate
in this transient period is usually limited to less than 10 s"' [29],
The right-circular cylinder is often used in tests of metals to simulate thermomechanical
processing effects. Cylindrical specimens are small and readily machinable compared to
specimens used in other test methodologies. The cylindrical specimen is also recognized in the
ASTM Standard Practice for Compression Tests of Metallic Materials at Elevated Temperatures
with Conventional or Rapid Heating Rates and Strain Rates (ASTM E 209 - 65).
A disadvantage of the cylindrical specimen is that it barrels during compression testing.
Barreling in axisymmetrical compression testing is caused by (1) the friction at the platen-
specimen interface, and (2) the temperature gradient between the platen-specimen interface and
the middle of the specimen.
Barreling in compression tests causes nonuniform strain and strain rates. Nevertheless,
reports show that barreling does not affect the measured flow stress if the specimen aspect ratio
(the specimen diameter divided by its height) is kept between 0.5 and 0.8 [30,3 1]. Higher loads
are needed to deform a specimen when friction is present. However, barreling is usually
accompanied by shear instability, which reduces the load. In certain specimen geometries the
load increase due to friction is possibly compensated by the load reduction due to shear
instability. For this reason, we used no lubricants for the experiments described in this study.
Lubricants at the platen-specimen interface may reduce barreling, but they introduce other
complications.

Nonuniform deformation from barreling does cause problems in the interpretation of
microstructures that are developed during deformation [32,33]. Strain imposed on the specimen
during deformation is a major factor influencing the recrystallized austenite grain size after
deformation. The nominal strain that is measured during deformation differs significantly from
the actual strain of the specimen [33]. Therefore, barreling may be ignored if the testing is solely
for the measurement of flow stress, but it must be taken into account if microstructural
evaluation is involved.
4.1 Materials
Two plain C steels, two interstitial-free (IF) steels, and four microalloyed steels were
tested in this study. Table 2 identifies the eight steels and their chemical compositions.
Mechanical properties of the steels at room temperature are reported in a different report [34].
4.2 Test Specimen
The cylindrical test specimen was 10 mm in diameter and 15 mm high. The cylindrical
specimens were machined from crop samples such that the cylindrical axis coincided with the
through-thickness direction. The steel types were identified in table 2.
4.3 Apparatus
Two servohydraulic test machines are available in our laboratory: one has a load capacity
of 250 kN and the other 100 kN. In addition to this difference in load capacity, the two machines
differ in attainable strain rates, and in heating and cooling techniques. The 250 kN machine is an
existing machine, and the 100 kN machine was developed and commissioned during the
Table 2. Chemical compositions (mass %).
Elem.HSLA-V
HSLA-Nb
HSLA-50
Ti-Nb
HSLA-80
Ti-NbA36 DQSK
IF
Nb rich
IF
Nb lean
C 0.045 0.082 0.071 0.07 0.17 0.038 0.0028 0.002
Mn 0.45 0.48 0.758 1.35 0.74 0.30 0.17 0.106
S 0.005 0.005 0.013 0.003 0.008 0.008 0.006 0.008
Si 0.13
V 0.080
Ti 0.013 0.042 0.035 0.059
Nb 0.036 0.023 0.085 0.035 0.009
AI 0.078 0.024 0.053 0.039 0.040 0.040 0.027 0.033
N 0.0072 0.0054 0.0067 0.0075 0,0047 0.0052 0.0029 0.0041
10
investigation of this project. Using these machines, we compressed specimens between quartz or
ceramic platens located inside an evacuated test chamber at elevated temperatures.
Fused quartz or ceramic rods are used for platens. The ceramic platens are
transformation-toughened zirconia (TTZ) in the form of solid white rods. The TTZ rods are
more expensive than quartz rods, but are preferable in our experience since quartz rods are more
susceptible to crack after repeated use.
The apparatus are described elsewhere [35,36], and only brief descriptions of the
apparatus are given here. The subcomponents of the apparatus include a computer-controlled
servohydraulic load frame, a test chamber providing vacuum environment, a furnace equipped
with a programmable temperature controller, a microcomputer, and a storage oscilloscope. The
axisymmetric compression test methodology offers benefits since the required specimen size is
relatively small. This facilitates system design by minimizing the volume and mass of test
fixtures.
4.3.1 Computer and Peripherals for Machine Control and Data Acquisition
Figure 3 is a flowchart of the plan for machine control and data acquisition. The
computer is a 25 MHz 80486 personal computer (PC), equipped with a board-level analog-digital
(A/D) plug-in board having a 45 kHz throughput and an IEEE GPIB board. The A/D board
contains eight differential A/D channels (input) and two digital-analog (D/A) channels (output).
Peripherals include a line printer, a 340 MB hard disk, a 1 .2 MB floppy disk drive, and a 360 KBfloppy disk drive.
The apparatus is equipped with a programmable digital storage oscilloscope for high-
speed data acquisition. The oscilloscope includes four 15 bit, 100 kHz digitizers. Each channel
stores up to 4000 data points when all four channels are operating simultaneously. The same
computer and the storage oscilloscope are used interchangeably with the two test machines.
The computer components and accessories described here are existing pieces of
equipment that serve multiple uses in our laboratory. They do not represent up-to-date
technology. Different types of components may perform the same functions. For example, the
storage oscilloscope is used for data acquisition simply because it is readily available and has
been used for such purposes at NIST for the past 15 years [37,38]. More affordable board-level
A/D plug-in boards are available and may be substituted for the oscilloscope described here.
Also, the capabilities of today's personal computer and its peripherals, such as disk drives, are
much superior to those described in this investigation.
4.3.2 Load Frames
Each machine is equipped with a closed-loop servohydraulic load frame. One machine
has a load capacity of 250 kN and the other 100 kN. These machines are not conventional in
terms of actuator travel speed. The machines have been modified by using high flow-rate
servovalves and large accumulators. The modification gives attainable actuator speeds up to 500
11

mms"'. With the currently used specimen geometry, this travel speed produces controllable
strain rates up to 25 s*' for the 250 kN machine, and 50 s'' for the 100 kN machine.
The most desirable deformation mode for rolling simulation is a constant true-strain-rate
compression, which greatly eases data analysis and interpretation. Constant true-stain-rate
compression is accomplished through displacement control of the load train by a PC using the
equation
h{t)^ h,exp{-i£). (22)
Here, h{t) is the specimen's instantaneous height at time /, h, is the initial height, and ^is the
desired constant true strain rate.
In a high strain-rate experiment, the actuator's travel starts from a rest position and then
accelerates to the desired speed that results in slow rates at the very beginning of the experiment.
To overcome the problem, we retract the actuator at the beginning of a test so that the specimen
is compressed using only that portion of the actuator travel that produces constant rate. Then, the
value of ^is calculated using the actual signals recorded by the data acquisition system [39].
4.3.3 Heating, Cooling, and Vacuum
For the 100 kN machine, a vertically mounted electrical tube furnace (power rating is 6.0
kW at 240 V and 21 .6 A) is used for heating. The heating elements are four tubular tungsten-
filament quartz lamps, each backed by an elliptical reflecting wall. The vacuum chamber is a
quartz tube that encapsulates the ceramic rods and the specimen. The tube is 50.8 mm in
diameter and 264 mm long. The elliptical reflectors, which surround the quartz tube, focus
radiant energy from the tungsten lamps to the outer surfaces of the specimen in the quartz tube at
the center of the heating chamber. The physical sizes of this furnace and its power supply are
small, which contributes substantially to the compact design and efficiency of the entire test
facility.
Heating of a specimen is achieved through radiation and the heating rate is limited to
about 2 °C-s''. There is no forced cooling device for fast cooling of a heated specimen. The
cooling is achieved through radiation to the surrounding and through conduction to the loading
rods. Thus, cooling of a heated specimen after a test is slow, and it takes 2 to 3 h to furnace-cool
the specimen. The vacuum system consists simply of a pressure gage and a mechanical pump by
which the chamber is evacuated during a test to minimize oxidation of the specimen at high
temperatures.
The 250 kN apparatus uses an induction furnace and a controlled gas-flow cooling
process. A 10 kW, 450 kHz radio-frequency (rf) induction generator generates the heat
demanded by the temperature controller. The heating coil is a Cu tube 4.76 mm in diameter. Astainless-steel vacuum chamber encloses the specimen, and the heating and cooling coils. Avacuum is obtained with a 100 mm diffusion pump which can achieve a vacuum of 1 .33 x 10
Pa (1 X 10'^ Torr) within 20 min. At a pressure of about 1.33 x 10'' Pa (lO"' Torr), gasses are
12
-3

ionized between the specimen and the heating coils. At this pressure, it is impossible to heat the
specimen because the rf field arcs and shuts off the rf generator.
Cooling of a specimen for the 250 kN machine is controlled with a PC that regulates gas
flow onto the specimen through a Cu coil 6.35 mm in diameter and concentric with the heating
coil. The side of the cooling coil facing the specimen is perforated to provide a gas flow that
cools the specimen uniformly. Either He or N gas is used for cooling. Because of its higher
specific heat (5230 versus 1030 J-kg'^K"' at 25 °C) and greater mobility, He is more efficient
than N in rapid cooling. For a cylindrical steel specimen 10 mm in diameter by 18 mm in height,
the cooling rate is controllable to a maximum rate of 25 °Cs"\
Both furnaces are operated automatically by means of a programmable temperature
controller that has ramp-and-soak and multiple set-point capabilities. Before testing, the desired
thermal profile is selected and preprogrammed into the controller. The temperature at any phase
ofthe experiment is then monitored by means of an S-type thermocouple (Pt and Pt-10%Rh) that
is spot-welded to the surface of the cylindrical specimen at the midpoint of height.
4.3.4 Machine Performance and Reproducibility
4.3.4.1 Alignment
Both test machines are rigidly constructed. The specimen dimensions were measured
before and after compression using a micrometer to confirm the final value of strain, and to
confirm that good axial symmetry is retained after testing. The fact that the top and bottom
surfaces of specimens remain parallel after compression testing is a qualitative indication of
good mechanical alignment.
4.3.4.2 Reproducibility
Figure 4 shows the results of triplicate tests ofDQSK specimens using the 250 kNmachine. The results demonstrate excellent reproducibility of the machine. Figure 5 shows a
pair of stress-strain curves for DQSK specimens that were tested using the 100 and 250 kNmachines at nominally identical test conditions. In this example, the grain size of the steel is
0.114 mm, the test temperature is 1000 °C, and the strain rate is 25 s'' (the maximum possible
strain rate of the 250 kN apparatus). The near equivalence of the stress-strain curves presented
in this figure demonstrates acceptable reproducibility.
4.3.4.3 Strain Rates
At low strain rates, the actuator of the machine follows the command signals quite well.
As a result, the nominal constant strain rate can be achieved and maintained. Figure 6 shows the
results of tests at nominal constant strain rates of 1 and 10 s'\ Here, the strain rates were
calculated using the actuator's displacement-versus-time signals.
If the command signals call for instant high speeds, the actuator is not capable of
following the demands instantaneously due to inherent characteristics of servohydraulic test
13

machines. The actuator's speed will be slower than the command signals at the beginning and at
the end of a command cycle. After receiving the commands at the onset of a test, the actuator
needs time to accelerate from a rest position to the desired speed. Similarly, it needs time to
decelerate from a high-speed travel to rest as called for by the command signals at the end of the
test. This behavior is clearly demonstrated in figure 7.
As mentioned in section 4.3.2, the problem of slower speed at the beginning of a test has
been remedied by actuator retraction. However, the problem at the end of a test has not been
corrected in our laboratory. The problem limits the valid strain range during a high strain-rate
test. Thus, the actual strain rate during a high-speed test varies instantaneously, so specified
values are necessarily quoted in nominal terms.
4.3.4.4 Specimen Strength
The machine's performance is slightly affected by secondary factors such as the
specimen's size and flow strength. The data in figure 8 show implicitly that the machine's
performance is influenced by the properties of the test material. Here, machine performance is
gaged in terms of the ratio ///////„,. The measured and commanded final heights are Hfm and Hfc,
respectively. A ratio of 1 means the commanded strain value is precisely achieved. Specimens
in this series were tested at the same nominal strain rate, using identical machine settings (span
of ram travel fixed at a constant value). Larger grain size and higher temperature implies softer
steel; so the trend of resuhs in figure 8 reflects the 100 kN machine's ability to meet a
commanded value of compressive strain at high strain rate, and how that is affected by the
specimen response.
4.3.4.5 Adiabatic Heating
Figure 9 is an example of specimen self-heating during a typical compression test at a
strain rate of 50 s"\ Experiments indicate that the temperature rise zlTat a strain of 0.7 ranges
from 5 to 10 °C, with modest variation depending on test conditions. Normally, zlT values less
than 10 °C may be considered negligible for engineering purposes. On the other hand, the
observed values here are certainly smaller than expected. Based on predictions from
mechanical-equivalence equations assuming all deformation energy is converted into heat as
described in section 3.6, the calculated zlT^ is about 20 °C. The disparity may be due to
nonuniform heating throughout the specimen. Therefore, additional analysis is needed to clarify
the role of adiabatic heating in hot-deformation studies. Because of this uncertainty, the stress-
strain results presented in this report are not adjusted for the adiabatic heating correction.
5. Results and Discussion
5.1 Raw Data and Data Analysis
During each test, the load, actuator's displacement, temperature, and time were measured,
recorded by the storage oscilloscope, and saved onto floppy disks for processing. Outputs of
interest are the curves of true stress as a function of true strain, the true strain rate as a function
14
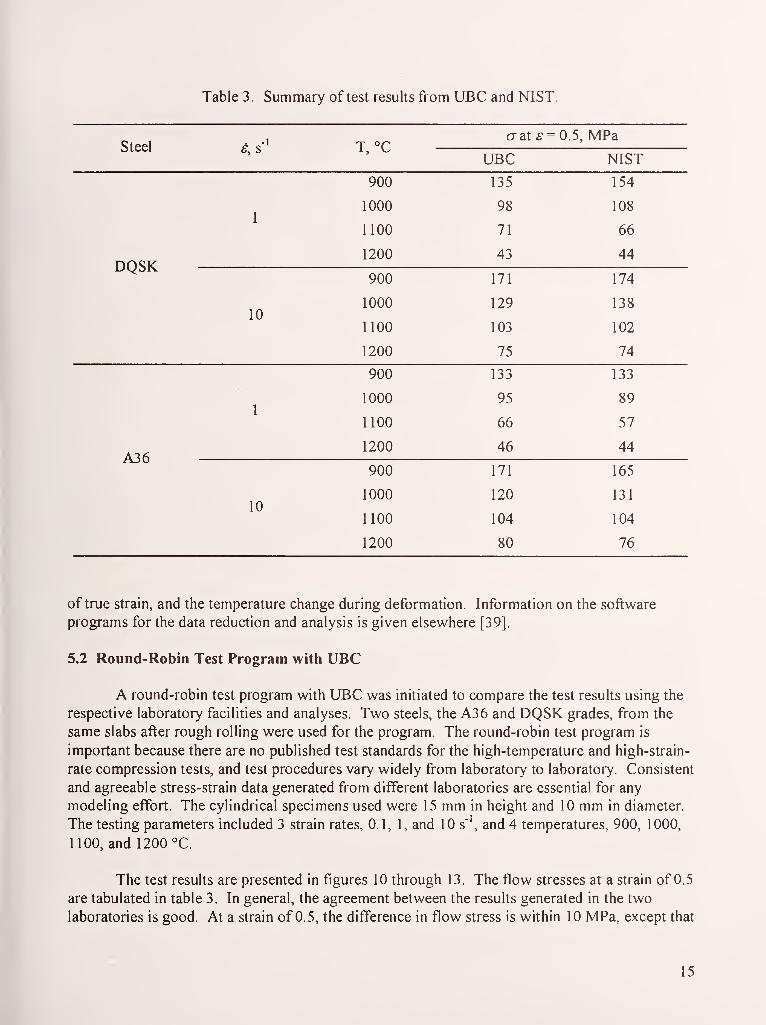
Table 3. Summary of test results from UBC and NIST.
Steel ^,s-^ T, °C(Tat f == 0.5, MPa
UBC NIST
900 135 154
1
1000 98 108
1100 71 66
DQSK1200 43 44
900 171 174
101000
1100
129
103
138
102
1200 75 74
900 133 133
1
1000 95 89
1100 66 57
A361200 46 44
900 171 165
101000
1100
120
104
131
104
1200 80 76
of true strain, and the temperature change during deformation. Information on the software
programs for the data reduction and analysis is given elsewhere [39].
5.2 Round-Robin Test Program with UBC
A round-robin test program with UBC was initiated to compare the test results using the
respective laboratory facilities and analyses. Two steels, the A3 6 and DQSK grades, from the
same slabs after rough rolling were used for the program. The round-robin test program is
important because there are no published test standards for the high-temperature and high-strain-
rate compression tests, and test procedures vary widely from laboratory to laboratory. Consistent
and agreeable stress-strain data generated from different laboratories are essential for any
modeling effort. The cylindrical specimens used were 15 mm in height and 10 mm in diameter.
The testing parameters included 3 strain rates, 0.1, 1, and 10 s"\ and 4 temperatures, 900, 1000,
1100, and 1200 °C.
The test results are presented in figures 10 through 13. The flow stresses at a strain of 0.5
are tabulated in table 3. In general, the agreement between the results generated in the two
laboratories is good. At a strain of 0.5, the difference in flow stress is within 10 MPa, except that
15

Table 4. Constants in hyperbolic sine equation for DQSK and A36 steels.
Steel Laboratory a, MPa"^ Q. kJmor' m \r^A
DQSKUBCNIST
0.013
0.013
293
326
4.07
4.41
25.6
28.4
A3 6UBC
NIST
0.013
0.013
314
321
4.34
4.39
27.6
28.4
C-Mn Literature 0.013 l(il to 366 3.2 to 5.0 25 to 32
in two cases, where one difference is 19 and the other is 1 1 MPa. This is within the variability
observed for the same steel tested with the same machine.
The flow stresses at a strain of 0.5 were used to fit eq (15). The results are presented in
table 4. Here again the agreement between the results from the two laboratories is good. The
results also agree well with those published in the literature.
However, there is a consistent difference observed in the results from the two
laboratories; that is the hardening behavior at strains below about 0. 1 . This is due to the
difference in the way strain has been calculated. At UBC, the uniaxial strain was inferred from
the direct measurement of diametrical changes during testing. The measurement was performed
directly on the specimen at its mid-section. At NIST, the axial strain was calculated from the
displacement signals of load train with the assumption of incompressibility of steel during plastic
deformation (constant-volume assumption). Implicit in this strain calculation is the assumption
of uniform deformation.
As mentioned previously, at NIST the displacement signals were not measured directly
on the specimen. The displacement signals also contained the displacement of the load train in
addition to the displacement due to specimen. With rigid machines such as those at NIST, the
displacement due to the load train was negligible. However, even this usually negligible
displacement due to the machine becomes noticeable at small strains. This results in a slight
overestimation of strain in the results produced at NIST. The correction for displacement due to
machine compliance will be discussed in section 5.3, "Machine Compliance."
In addition to the difference in strain calculations, there is another significant difference
between the machines at UBC and at NIST. That is the heating method. At UBC, resistance
heating was used, and the jaws were water-cooled. This produced a temperature gradient along
the specimen axis from the mid-section of the specimen to the interface between the specimen
and the anvils. The temperature difference was between 50 and 70 °C. At NIST, induction
heating was used, and the specimen was placed on a quartz platen. The upper platen was
retracted; thus it was not in contact with the specimen before testing. This specimen-platen
arrangement produced a slight temperature gradient with higher temperature at the top of the
specimen and lower temperature at the bottom. However, because of the low thermal
conductivity of quartz platen plus poor contact between the specimen and the platen before
testing, the temperature gradient should be small.
16

Induction heating is inherently slower than resistance heating, such as used at UBC. For
tests at NIST, with a strain rate less than 0.5 s'\ heat loss from the specimen to the platen
through conduction was significant during deformation. The heater control cannot respond to
this heat loss until about halfway through the test at a strain of about 0.5. Therefore, heat loss in
tests of a strain rate of 0. 1 s'^ is significant. The temperature of the test specimen decreased
slowly from the start of the test and then slowly increased again after a strain of about 0.5 whenthe heater control started to respond to the temperature decrease. The isothermal test condition
had not been maintained. Flow stress from these tests (strain rate of 0. 1 s"') showed higher
values due to temperature drop during test. Due to this effect, the results of testing at the strain
rate of 0. 1 s'^ are not presented in this report. Under hot-rolling conditions, the strain rate is
expected to be much higher than 0. 1 s'\ so the results at this strain rate are much less important
than those at high strain rates.
Another point worth mentioning is the friction between the specimen and the anvil. At
UBC, because heating is resistive, the contact between specimen and anvil has to be good in
order for the electrical current to go through. This specimen-anvil arrangement increases the
friction between the specimen and the anvils. Large friction between specimen and anvil
(platen) causes barreling and increases the deformation loads. This is evidenced in most of the
UBC's results at large strains; the flow stress increases at strains greater than about 0.7. This
increase in flow stress at strains greater than 0.7 is not real, but due to large friction between
specimen and anvil. However, barreling is usually accompanied by shear instability that reduces
the load. Specimens tested at both laboratories did show barreling after deformation. Reports in
the literature [4,31] have shown that with the specimen dimension used in this round-robin
program, barreling will not affect the measured flow stresses, at least at strains less than 0.7, in
both laboratories. This is probably because the increase in load due to friction is cancelled out
by reduction in load due to shear instability.
Despite all these differences between the test machines at UBC and at NIST, the
agreement between the test results is reasonably good. Although detailed comparison between
the results obtained from this program with those published in the literature is impossible
because of the differences in steel grades and testing details, computed results using Shida's
equation [26] with comparable C contents and testing conditions agree well with present results.
This confirmation seems to exclude the possibility that both laboratories produce erroneous data.
5.3 Machine Compliance
The accurate way to measure strain is to measure the displacement, from which strain is
calculated, directly on specimen with strain gages, extensometers, or optical devices. In our
experiments, however, the strain has been calculated using displacement signals that are not
taken directly on the specimen (due to experimental difficulties), but away from the specimen.
The experimental difficulties arise because of space constraints resulting from heating furnace,
high temperature, and large strain. The displacement signals recorded away from the specimen
consist of the displacement due to the specimen plus the displacement of the load train.
Our experimental setup measures the displacement at a location about one meter away
from the specimen with a linear variable displacement transducer (LVDT). The displacement of
17

the load train typically consists of two parts. First, it comes from the loose contact between the
anvils and the specimen at the beginning of test. This portion of the displacement will vary from
specimen to specimen and is relatively large. The other is the elastic deformation of the load
train. This portion of the displacement is proportional to the applied load and is reproducible
from test to test.
Using aluminum specimens at room temperature (investigation at high temperature is
difficult to conduct, if not impossible), we determined the displacement of the load train as a
function of load experimentally. In this experiment, a clip-on gage was attached to measure the
gap between the two anvil surfaces that compress the specimen. This device measured the actual
specimen displacement. At the same time the displacement was recorded away from the
specimen just like those experiments conducted at high temperatures. The difference between
these two quantities is the displacement due to machine. Except for those results in section 5.2,
the stress-strain results presented in this report have been corrected for the machine
displacement.
5.4 Mathematical Description of Stress-Strain Curves
The goal of this study is to provide models that estimate the stress-strain curves of steels
under hot-rolling conditions. These models are then used to calculate the roll-separating forces
during rolling and to provide data as input to the numerical tools, such as finite-element method,
for detailed calculations of stress, strain, and related properties. The focus has been on modeling
the stress-strain behavior as functions of temperature, strain rate, and austenite grain size. Little
has been performed to detail the effects of individual parameters.
Besides chemical composition, three other major parameters have significant influence
on the flow behavior of steels: temperature, strain rate, and austenite grain size. For models to
be useful, they have to consider these parameters explicitly. In this study, there are not enough
systematic variations of chemical compositions to provide enough data for modeling. Thus,
there is no general modeling effort in this area and each grade of steel will have its own model
that considers the effects of temperature, strain rate, and austenite grain size.
The effects of temperature, strain rate, and austenite grain size on flow behavior are given
in figures 14 through 16. As expected, decreasing temperature increases flow stress (figure 14).
Also, increasing strain rate increases flow stress (figure 15).
The influence of austenite grain size is more complicated. As indicated in figure 16,
reduction of grain size promotes dynamic recrystallization. Grain-size reduction also increases
the flow stress and the rate of hardening in the early stage of deformation. As for the effects of
grain size on the steady-state flow stresses, either with or without dynamic recrystallization, the
results are not very conclusive. However, observations support the theory that grain size has
little effect on the steady-state flow stresses [22,27]. Equilibrium subgrain structures are
established in the early stage of deformation. The development of subgrain structure controls the
early stage of deformation and the equilibrium subgrain structure controls the steady-state
stresses. So, the initial grain size has little influence on the steady-state flow stresses.
18

To describe the stress-strain curve mathematically, our initial choice was eq (9), which
fitted the elevated-temperature experimental data well for the stress-strain portion that was prior
to dynamic recrystallization. Later, UBC suggested that we use the rigid-plastic model to
describe the flow behavior and incorporate yield stress at the start of the stress-strain curve.
Thus, eq (9) was modified and the following equation was used.
0-, = o-o + {(T^^ - o-o)[l - exp(-^f)]".
(23)
Here, oo is the 0.2 % offset yield stress in MPa, oisi is the steady-state stress without dynamic
recrystallization in MPa, /9is a dimensionless constant related to the hardening behavior, and n is
a constant related to the relationship between applied stress and dislocation density.
The hyperbolic sine equation (eq (15)) is used to describe the combined effects of
temperature and strain rate on the steady-state stresses. Grain size is considered to have no
influence on the steady-state stresses. The effects of temperature, strain rate, and grain size on
Ob and y9 are treated separately. The constant n is considered to be independent of temperature,
strain rate, and grain size.
Different equations have been proposed to treat the effects of temperature, strain rate, and
grain size on oo and /?. The task has proven to be difficult because the equations must describe
the effects that follow some physical principles and still cover a wide range of conditions. The
equations are required to meet the following conditions:
• ao increases with decreasing temperature, increasing strain rate, and decreasing grain
size.
• Within the range of interest, /? increases with increasing temperature, decreasing strain
rate, and decreasing grain size.
• Within the experimental range, where the machines are capable of generating reliable
data, the equations should be able to reproduce the stress-strain curves.
• Outside the experimental range, where no reliable experimental data exist, the equations
should be able to estimate the stress-strain curves reasonably well. The operational
ranges are temperature from 800 to 1300 °C, strain rate from 1 to 400 s'', and grain size
from 0.02 to 0.5 mm.
After some trial and error, we found that the power law performs well and used the
following equations.
£70=^1 -V' (24)
^ = b,
f TXH £\^( d^^'
\Tr,J
£
Wo.(25)
19
where a\ and b\ are constants to be determined experimentally, and To = 1273, £q= 10, and do
= 0.08 are scaling factors. T, e, and d are temperature, strain rate, and grain size in K, s'*, and
mm, respectively.
To account for the softening due to dynamic recrystallization, we introduced,
Act - max 0,(c^.„-o-„,)
// (8\
\m^^
1-- exp -*
V V \£ J ^ J
(26)
where Zlcris the amount of softening due to dynamic recrystallization after the peak stress in the
stress-strain curve has been reached, £•* is a scaling factor depending on temperature, strain rate,
and grain size, and m^ is a constant to be determined experimentally. A simple power law
f ^\
kT^j
ni( • N '?3 / ,\')i
yd., J(27)
is used to describe the dependence of £:* on temperature, strain rate, and grain size. o'ss2 is the
steady-state stress after the occurrence of dynamic recrystallization. The dependence of crss2 on
temperature and strain rate is treated with the hyperbolic sine equation (eq (15)). Grain size is
assumed to have no influence on crss2-
Equation (27) is substracted from eq (23) after the peak stress in the stress-strain curve is
reached, and the overall stress component becomes
(7 = a, - Act. (28)
The determinations of the strain at peak stress and the boundary separating dynamic
recrystallization and no dynamic recrystallization are treated in sections 5.7 and 5.8 later in this
report.
The combination of eq (18) and eqs (23) through (28) ftilly describes the stress-strain
curve. The subsequent task is to determine the coefficients in these equations.
5.5 Determination of Model Parameters
At the beginning of the modeling effort in this project, experimental data were fitted to
obtain the coefficients in eq (23) for each individual specimen. Then, coefficients in other
equations were obtained individually and separately. This procedure has the advantage for
detailed analyses of the effects of individual parameters on the overall stress-strain curve, and of
the deformation mechanisms. But it is very tedious and time-consuming. For the purpose of this
study, which is to provide models that estimate the stress-strain curve for hot-rolling simulations,
some statistical techniques that estimate all the coefficients in all the equations with one
computer run are available.
20

This latter approach, which we adopted, is fast in obtaining the coefficients that describe
the stress-strain behavior adequately. It also tends to smooth out the experimental abnormalities.
However, it loses the details of the effects of individual parameters. Also, the original meanings
of some parameters are lost. These include the steady-state stresses without or after dynamic
recrystallization. And the significance of the value of £* , which was originally proposed to be
the critical strain for dynamic recrystallization [9], no longer exists. Therefore the reader is
cautioned that, as presented in this report, the parameters should not be interpreted as necessarily
having their intended original meanings. They must be regarded only as fitting parameters.
5.5.1 Parameter Estimation
The empirical mathematical model just described has 20 adjustable parameters, with oisi
and (Tss2 expressed as
^ssl=
sinh-'(^,Z,^^)
a(29)
and
^ss2=
sinh-'(^3Z/^)
a(30)
Here, Zi (i = 1 and 2) is the Zener-Hollomon parameter
Z, = e expRT
(31)
For each material, there are K experimental stress-strain curves. The empirical mode! was fitted
to the data in two stages. Yield stress, as described in eq (24), was modeled and fitted separately.
To estimate the constants ai, a2, 03, and ^4, we minimized
L = Y,(ao{k)-aM)'' (32)
k=\
In this expression, <Jo(k) and ao(k) denote the predicated and observed true stress for the ^-th
curve (at true strain equal to 0). We minimized L using quasi-Nev4on method, where the
Hessian matrix and gradient are approximated numerically [40].
Once the fitted values of ^i, i= 1, 2, 3, 4, were obtained, we determined the value of the
other 16 parameters by a "penalized" least-squares fit. Specifically, we minimized
k=\ 1=1
(33)
21

where, oik,i) and 6-(k,i) denote the measured and predicted true strain for the /-th sample in the
k-xh experimental curve. For the k-th curve, there are A^k samples in the stress-strain curve. The
first term on the right side is the sum of the squared prediction errors. The second term is a
penalty function which increases L when the predicted asymptotic stress d-ss2, varies from a
reasonable guess a ss2 of the asymptotic stress. The relative contribution of the penalty function
was controlled by the value of the (positive) parameter /^. Estimates of d-ss2 are not available for
all experimental curves. For curves where there was no prior information, we set /Ik - 0. Whenwe have prior information, we set Ak = 0. 1. For the cases studied, for ?tk ^ 0. 1, the agreement
between the observed and predicted data is about the same. However, when extrapolating the
model to higher strains, our judgement is that a nonzero value of Xk improves the quality of the
prediction.
In the fitting procedure, the parameters were constrained to fall between selected lower
and upper bounds. For the /-th parameter, if the bounds are L, and f/i, we expressed the
constrained parameter a, in terms of an unconstrained parameter cj^:
a,=L, +/^'~f' y (34)l + exp(<r/,j
We minimized L as a fianction of the unconstrained parameters using a quasi-Newton method
where the Hessian matrix and gradient are approximated numerically [40]. In a complicated
optimization problem such as ours, results may depend on the initial guess for the model
parameters and on the type of algorithm used to estimate the parameters. As a check, for each
material, we refitted the model at least 20 additional times. In each additional run, the initial
parameter values were randomly perturbed. In all cases, additional runs did not yield a lower
value of Z. However, sometimes a large value ofL was obtained.
This analysis generated values for all the coefficients: a\-a4, bx-b^, kx-k^, a, Qx, Q2, t]i-
774, n, and /W4. They were generated separately for grades HSLAVTi-Nb, HSLA-Nb, DQSK, and
A36. The stress-strain behaviors of grades HSLA-50/Ti-Nb, and the two IF steels were found to
be similar to that ofHSLA-Nb. As a result, we used the model for HSLA-Nb for these steels.
For the same reason, the DQSK model was used for the HSLA-V grade. The units for the
parameters in the model are a in MPa, £ in s"\ Tin K, t/in mm, and Q in J-mol''. R = 8.314
J-mor'-K'' is the universal gas constant. The range of experimental conditions that were used for
the determination of model parameters is tabulated in table 5. It should be noted that in DQSK,the data of strain rate higher than 50 s'' are from CANMET, and those lower than 0. 1 s'' in A36are from UBC. All other data were generated at NIST.
5.5.2 Uncertainty Analysis
We estimated the random statistical error in the parameter estimates by a bootstrap
resampling procedure [41,42]. For each material, we have data from K experiments. Weindexed the experimental curves as / = (1,2, ...K) and simulated synthetic data by bootstrap
resampling. First, we simulated a new index set /* = (/i, /2, ../k) In this resampled index set, /j
is a random integer which is uniformly distributed between 1 and K. All of the /j were simulated
22

Table 5. Range of experimental conditions used for statistical regression.
Steel r, °c ^,s-' d, mm
HSLA-80/Ti-Nb 900 to 1200 lto25 0.012 to 0.2
HSLA-Nb 900 to 1200 1 to50 0.015 to 0.249
DQSK 884 to 1200 1 to 163 0.04 to 0.29
A36 900 to 1200 0.1 to 50 0.014 to 0.244
independently. For instance, \iK= 5, a simulated index set might be (3,1,2,1,4). For this case,
data from experiment 1 are represented twice and data from experiments 2, 3, and 4 are
represented once. Data from experiment 5 are not represented. To the w-th synthetic data, wefitted the model and got a bootstrap replication of the model parameters. The fitting procedure
was the same as used for the observed data. That is, we got a new set of parameter estimates (20
in all) for each synthetic data set. From this set of parameter estimates, we estimated the
standard deviation of each of the 20 model parameters. We divided the bootstrap estimate of the
standard deviation of the model parameter by the model parameter to get a fractional standard
deviation. When this fractional error is high, it means the model parameter is not well
determined. In general, except in a few cases, the parameters were well determined.
5.6. Experimental Stress-Strain Curves and Model Predictions
This section presents the results of model predictions versus experimental data for each
individual grade of steel. The experimental conditions are given on the graphs.
5.6.1 A36
The results for A36 are presented in figures 17 through 24. In general, the agreement
between the experimental data and the model predictions is excellent.
5.6.2 DQSK and HSLA-V
The results for DQSK are presented in figures 25 through 36. In general, the agreement
between the experimental data and the model predictions is excellent.
For HSLA-V grade, the test matrix covers a range of temperature from 900 to 1200 °C,
strain rate from 1 to 50 s'\ and grain size from 0.03 to 0.3 mm. After completing the
experiments, we compared the data ofHSLA-V specimens with predictions obtained using the
DQSK model. Figure 37 presents some of the typical results showing that the DQSK model
predictions agree well with the HSLA-V experimental data.
We believe that V has little effect on the flow response of the steel in the process
variable ranges of interest and that the model developed for the DQSK grade steel is suitable for
the HSLA-V steel because the two steels have similar chemical compositions. Figure 37
23
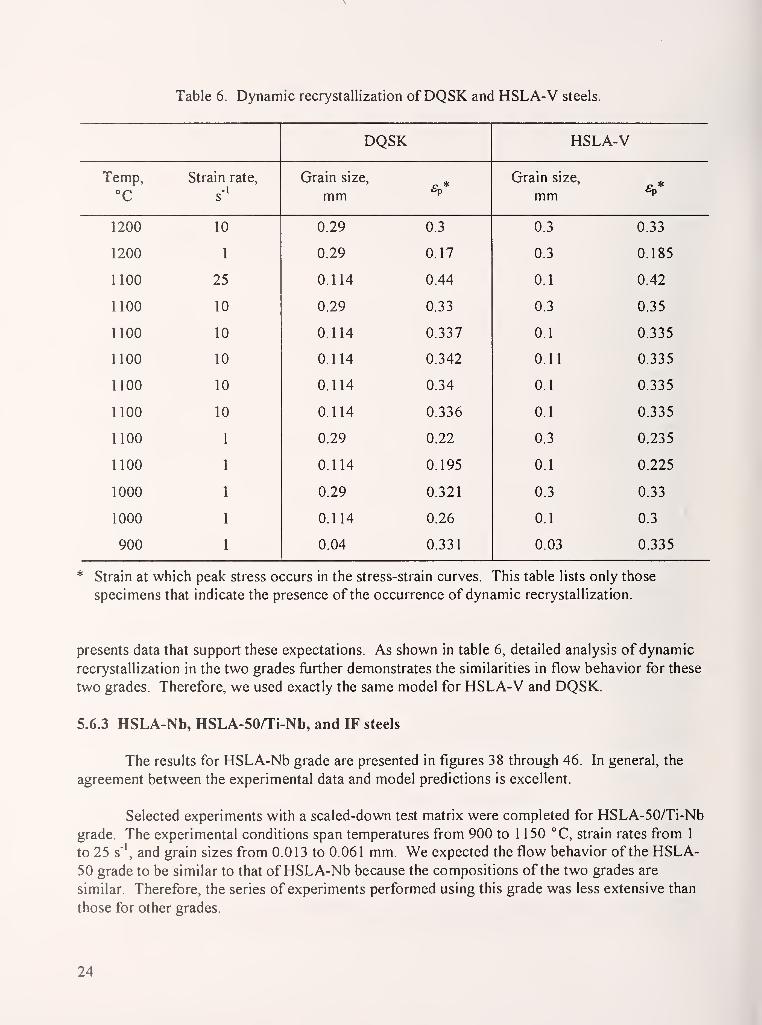
Table 6. Dynamic recrystallization ofDQSK and HSLA-V steels.
DQSK HSLA-V
Temp,
°C
Strain rate. Grain size,
mm fcp
Grain size,
mm 8,*
1200 10 0.29 0.3 0.3 0.33
1200 1 0.29 0.17 0.3 0.185
1100 25 0.114 0.44 0.1 0.42
1100 10 0.29 0.33 0.3 0.35
1100 10 0.114 0.337 0.1 0.335
1100 10 0.114 0.342 0.11 0.335
1100 10 0.114 0.34 0.1 0.335
1100 10 0.114 0.336 0.1 0.335
1100 0.29 0.22 0.3 0.235
1100 0.114 0.195 0.1 0.225
1000 0.29 0.321 0.3 0.33
1000 0.114 0.26 0.1 0.3
900 0.04 0.331 0.03 0.335
* Strain at which peak stress occurs in the stress-strain curves. This table lists only those
specimens that indicate the presence of the occurrence of dynamic recrystallization.
presents data that support these expectations. As shown in table 6, detailed analysis of dynamic
recrystallization in the two grades further demonstrates the similarities in flow behavior for these
two grades. Therefore, we used exactly the same model for HSLA-V and DQSK.
5.6.3 HSLA-Nb, HSLA-50/Ti-Nb, and IF steels
The results for HSLA-Nb grade are presented in figures 38 through 46. In general, the
agreement between the experimental data and model predictions is excellent.
Selected experiments with a scaled-down test matrix were completed for HSLA-50/Ti-Nb
grade. The experimental conditions span temperatures from 900 to 1 150 °C, strain rates from 1
to 25 s'\ and grain sizes from 0.013 to 0.061 mm. We expected the flow behavior of the HSLA-50 grade to be similar to that ofHSLA-Nb because the compositions of the two grades are
similar. Therefore, the series of experiments performed using this grade was less extensive than
those for other grades.
24

Some flow stress measurements for HSLA-50 were compared with predictions using the
model developed for HSLA-Nb, and the results are presented in figure 47. As expected, the flow
curves agree well with predictions from the HSLA-Nb model. On this basis, we conclude that
the model developed for the HSLA-Nb grade is in fact suitable for HSLA-50 also.
Two IF steel grades, Nb-rich and Nb-lean, were tested. Identical experimental conditions
were used for both grades. Our results lead to the conclusion that the flow behaviors of both
grades of IF steel are similar to that of the HSLA-Nb grade within the range of experimental
variables studied.
For the Nb-rich IF grade, figure 48 shows some of the results, wherein the experimental
stress-strain curves for the EF grade are compared with predictions made using the model for the
HSLA-Nb grade. The flow behavior of this IF grade is very similar to that of the HSLA-Nbgrade. The same conclusion is obtained from torsion experiments conducted at UBC. The
results of the torsion experiments are presented in figure 49. We conclude that the model
developed for the HSLA-Nb grade also predicts the flow behavior of the Nb-rich IF steel.
For the Nb-lean grade, figure 50 shows some of the experimental data compared with
predictions made using the HSLA-Nb model. We find that the flow behavior of this grade is also
similar to that of the HSLA-Nb. However, results obtained in multiple-hit torsion tests at UBCshow that the flow stresses of this grade are lower than those of the Nb-rich IF grade when
temperatures are below 980 °C and total true strains are larger than 1 .2.
Scrutiny of the torsion test results has indicated that little softening takes place in Nb-rich
grade between the hits which produce higher flow stresses, whereas substantial softening occurs
in the Nb-lean grade. This means that there is little static recrystallization between hits for the
Nb-rich grade, whereas the Nb-lean grade almost fully recrystallized. This is probably due to Nbin retarding the static recrystallization for the Nb-rich grade and explains why the Nb-rich grade
has higher flow stresses in later stages of deformation in multiple-hit experiments and at low
temperatures.
5.6.4 eSLA-SOATi-Nb
The results for HSLA-80/Ti-Nb grade are presented in figures 51 through 62. In
general, the agreement between the experimental data and model predictions is excellent.
5.7 Strain at Peak Stress
Dynamic recrystallization is an important phenomenon in hot deformation. It not only
softens material's resistance to deformation, but also refines the microstructure. It is useful to
estimate the conditions under which it will occur.
Based on the experimental data generated in this study, we developed models correlating
the strain at the peak stress in the stress-strain curve with temperature, strain rate, and grain size
for the A36, DQSK, HSLA-Nb, and HSLA-80 grades. Two different forms of equations were
used to make the correlation. One used the power law, and the other used the conventional
25
approach involving the Zener-Hollomon parameter. For the power-law approach, we used the
equation
£p = AV^o-
^4
(35)
where £p is the strain at which the peak stress appears in the stress-strain curve. Aj, A2, A3, and
A4 are constants. Other parameters were previously defined in section 5.4. The results are
plotted in figure 63.
For the conventional approach incorporating the Zener-Hollomon parameter, we used the
equation
e^ = B,Z'^d'\ (36)
where Bj, B2, and B3 are constants. Other parameters were previously defined. The results are
plotted in figure 64. It should be noted that the reported value of .^2 in the literature is 0. 1 5,
while the values for ^3 range from 0. 18 to 0.5 [29,43]. As shown in figures 63 and 64, the two
approaches have a similar statistical correlation.
5.8 Boundary Separating Dynamic Recrystallization and No-Dynamic Recrystallization
As described in section 5.7, if strains exceed Sp as described by eq (35) or (36) the steel
will undergo dynamic recrystallization. However, there is experimental evidence suggesting that
under certain conditions, dynamic recrystallization will not occur with a single deformation even
though strains exceed those described by eq (35) or (36). To determine whether dynamic
recrystallization will occur during a single deformation regardless of the conditions set forth by
eq (35) or (36), we used the Zener-Hollomon parameter as a criterion. IfZ is greater than a
critical value Zc, then dynamic recrystallization will not occur in a single deformation. The
model, as described by the equation
Z^ = AQxp{Bd) + C, (37)
also takes grain size into consideration, where ^, B, and C are experimentally determined
constants. Z and d are defined previously.
5.9 Effects of Prior Heat Treatments: HSLA-Nb
We also conducted experiments to evaluate the effects of precipitates on the flow
behavior ofHSLA-Nb steel. In earlier experiments we obtained small austenite grain sizes using
low reheating temperatures. Under these conditions, the Nb precipitates were not dissolved in
the matrix when the experiments were conducted. This represents a departure from mill
conditions, where the reheafing temperature is high and the Nb precipitates are dissolved.
26

Specimens used in this series of experiments were reheated to 1200 °C , held for 30 min,
and water-quenched to the ambient temperature. The majority of the precipitates would be
dissolved after this treatment. The specimens were then reheated to 1000 °C with a heating rate
of 5 °C-s"\ held at that temperature for 150 s, cooled to 900 °C at a rate of 1 °Cs"', and held for
30 s before testing. In tests at 1000 °C, the specimens were tested immediately after the 150 s
hold at that temperature.
Figures 65 through 68 present the experimental results. For some test conditions, there is
no discernible difference in the flow behavior with or without prior heat treatment. However, at
the test condition of 900 °C and 1 s"' (figure 65), there is a significant difference in flow
behavior after a strain of 0.4. In this case, the specimen without prior heat treatment shows
evidence of dynamic recrystallization, whereas the specimen with prior heat treatment shows
continuous hardening, with no indication of dynamic recrystallization. It is likely that the
dissolved Nb retards the process of dynamic recrystallization in the specimen with heat
treatment.
Although mill conditions will not produce a strain rate of 1 s'^ at 900 °C, the observed
experimental effect deserves closer attention, particularly in cases where dynamic
recrystallization could occur. The effect vanishes at higher strain rates or higher temperatures.
5.10 Effects of Reheating Temperature and Model Adjustments: HSLA-80/Ti-Nb
In comparison with those samples that were reheated to 1200 °C, UBC has observed that
in torsion experiments, the flow stresses are lower when samples were reheated to 1250 °C and
held for 30 min. To confirm this observation, we conducted experiments with the following two
different reheating conditions:
1. Reheated at 1250 °C and held 10 min to obtain a grain size of 0.3 mm2. Reheated at 1250 °C and held 10 s to obtain a grain size of 0. 1 mm
Typical results of the experiments are presented in figures 69 through 72. As shown in
figures 69 and 70, under condition 2 there is no significant difference between the experimental
data and the model predictions, which were based on the experiments using lower reheating
temperatures. However, as figures 71 and 72 indicate, a higher reheating temperature and a
longer holding time (condition 1), appears to lower the flow stress.
The effects of reheating temperature on the flow behavior ofHSLA-80 were examined
fiirther in experiments using different test temperatures. The flow stresses for specimens with
reheating temperature of 1250 °C and holding time of 10 min appear to be approximately 9 %lower than those for specimens reheated at a lower reheat temperature. This 9 % drop is
consistent throughout the whole stress-strain curve and has been observed for specimens tested at
various temperatures. Thus, the model described in section 5.5 should be adjusted for this effect
ifthe reheating temperature and holding time are high and long.
The effect of reheating temperature has not been studied with other grades. The effect
might be due to larger grains resulting from a higher reheating temperature and longer holding
27

Table 7. Test matrix for double-hit experiments: HSLA-Nb.
Case
#
Soaking
temp., °C
Soaking
time, s
Grain size,
mmTesting
temp., °C
Strain for
the first hit
Strain
rate, s''
Inter-hit
time, s
1 1200 600 0.249 900 0.2 10 20
2 1200 600 0.249 900 0.6 10 10
3 1200 600 0.249 900 0.6 25 5
4 1200 600 0.249 1000 0.2 10 5
5 1000 150 0.015 900 0.2 10 5
time. If this is the cause for lowering the flow stress, then the effect should also be observed for
other grades of steels. The other potential cause for the effect is due to the dissolution of
precipitates of microalloying elements, also resulting from a higher reheating temperature and
longer holding time. If this is the factor, then the effect will be observed in the Ti-Nb- and Nb-
bearing grades because the precipitates of these grades will not dissolve unless the reheating
temperature is high and the holding time is long. The effect on plain-C or V-bearing grades
should be minimal because precipitates in these grades usually dissolve at lower temperatures
during reheating.
5.11 Effects of Retained Strain: HSLA-Nb
Using a double-hit experiment, we evaluated the effects of retained strain on the flow
behavior ofHSLA-Nb steel. The strain retained from one pass to the next not only significantly
increases the rolling forces but also affects microstructural development. The retained strain is
usually small, and the effects are negligible in plain-C (A36 or DQSK grades) and V-treated
steels because static recrystallization is rapid in these steels. Retained strain is important for the
HSLA-Nb grade in the last few finishing passes because the interpass time is short and the
process of static recrystallization is comparatively sluggish.
The test matrix of the double-hit experiments is given in table 7. Figure 73 presents
results which suggest that, under the experimental conditions described in table 7, little softening
takes place between the two hits. As indicated in these figures, the established model predicts
the flow behavior well once the retained strain is taken into consideration.
5.12 Comparison with Data from CANMET
We received from CANMET sets of high-strain-rate stress-strain data for three steels:
A36, DQSK, and HSLA-Nb. These experimental data covered temperatures from 900 to 1 100
°C and strain rates from 10 to 150 s'\ Austenite grain sizes ranged from 0.014 to 0.25 mm for
A36, from 0.038 to 0.155 mm for DQSK, and from 0.015 to 0.249 mm for HSLA-Nb.
We compared CANMET's data with our own model predictions for A36 and DQSK.Figure 74 compares some CANMET's data with our model predictions for the DQSK grade.
28

The agreement is generally good for stresses in regions of high strain (larger than 0.6).
However, poor agreement is observed in the regions of small strain (less than 0.4).
A similar trend is found for the A36 grade, as shown in figure 75. In general, the
agreement between CANMET's data and our model predictions for A36 is not as good as that for
DQSK, and in a few cases the agreement is poor for the entire stress-strain curve, as shown for
example in figure 76.
Two reasons are advanced to explain the disagreement between the observed trend at
small strains. First, CANMET's strain values include displacements due to machine compliance,
which are accounted for in NIST's analyses. As discussed earlier, including displacements due
to machine compliance in strain calculations promotes large errors in the stress-strain curve at
small strains. Second, we have assumed rigid-plastic behavior in our models, so the flow stress
begins at the yield stress when strain is 0.
In view of these differences in data treatment, we performed a second comparison. Wecompared our experimental data (without machine compliance correction) with CANMET's data
at similar test conditions. The results in figures 77 through 79 show fair, but better, agreement.
CANMET's data tend to exhibit lower strain hardening at the onset of deformation, and the
hardening continues to large deformations (large strains). In contrast, NIST's data tend to show
a rapid increase in stress due to a high strain hardening rate at the onset of deformation, and
thereafter the stress levels off at large deformations. Thus, CANMET's data exhibit lower
stresses at small strain regions and higher stresses at large strain regions. The cause of this
difference in hardening behaviors between results obtained at CANMET and NIST remains
unclear. It should be noted that the hardening behavior observed at NIST is more consistent with
some findings reported at UBC.
Efforts have been made to correct for the effect of machine compliance in CANMET'sdata. When machine compliance is accounted for, the stresses in the early portion of the flow
curve increase; thus the agreement between NIST's model predictions (or data) and CANMET'sdata improves. Figure 79 is a typical example showing good agreement between NIST's model
prediction and CANMET's data for A36 after correction for compliance.
5.13 Calculation of Roll-Separating Forces
One of the important applications of constitutive equations in hot rolling is the roll-force
calculation, which requires other parameters, such as roll diameter during rolling, thickness of
slab at roll entry and roll exit, and the friction between the workpiece and the rolls. One of the
commonly used models for roll-force calculations is the Sims method [44], which simplified the
slab analysis [45] and assumed that only sticking friction exists in the roll contact zone. The roll-
separating force per unit width is given by Sims as
F=2kR — - In —;— + —4 h, 2
( 1 ^
Kh^j(38)
29

where k is defined as the yield strength of the workpiece in pure shear, R'\s the radius of
deformed roll, hj and h2 are the entry and the exit slab thicknesses, and A/? is the draft, which
equals to {h] - hi), (p is the contact angle, which is approximated as
(j) = yJRAh, (39)
and h((f)n) is the slab thickness at the neutral point, which is the point along the surface of contact
between the roll and the workpiece where the surface velocity of the roll is equal to the velocity
of the workpiece.
According to the von Mises yielding criterion, k is equal to 57.7 % of the yield strength
of the workpiece in uniaxial tension or compression; it is only 50 % if the Tresca criterion is
applied. In this investigation, the von Mises criterion is adopted and the yield strength under
uniaxial compression is taken to be the stress calculated with models presented in section 5.5.
The strain used to calculate the stress is the true strain computed from hj and h2 or the
cumulative strain if there are retained strains from previous passes.
The value of 7? 'depends on the roll material, the original roll radius R, the roll-separating
force, and the draft. The relationship among these parameters is [26]
R CF— = 1 +R Ah
(40)
For steel rolls, the value of C is between 2. 1 x lO""* and 2.5 x 10"'* mm'^N'\ and is taken to be
2.21 X 10"'* in the present investigation [46].
The angle at the neutral point is calculated from
— In4 \hj
fR'
\
[}k J
tan (41)
The thickness at the neutral point is
h[(t>,) = 2R[\-cos[<l>„))^h^. (42)
The results of roll-force calculations along with actual mill measurements for a 13-pass
rolling on HSLA-80 steel are presented in table 8 and figure 80. Based on precipitation
calculation using the model developed by Dutta and Sellars [47], precipitation ofNb(CN)
particles occurred after the first pass at 965 °C. No static recrystallization between passes in all
13 passes was assumed and strain was accumulated from one pass to the subsequent passes. Thepredicted results agree reasonably well with the actual measurements. Due to the assumption of
sticking friction, however, the Sims equations are expected to slightly overestimate the rolling
loads.
30
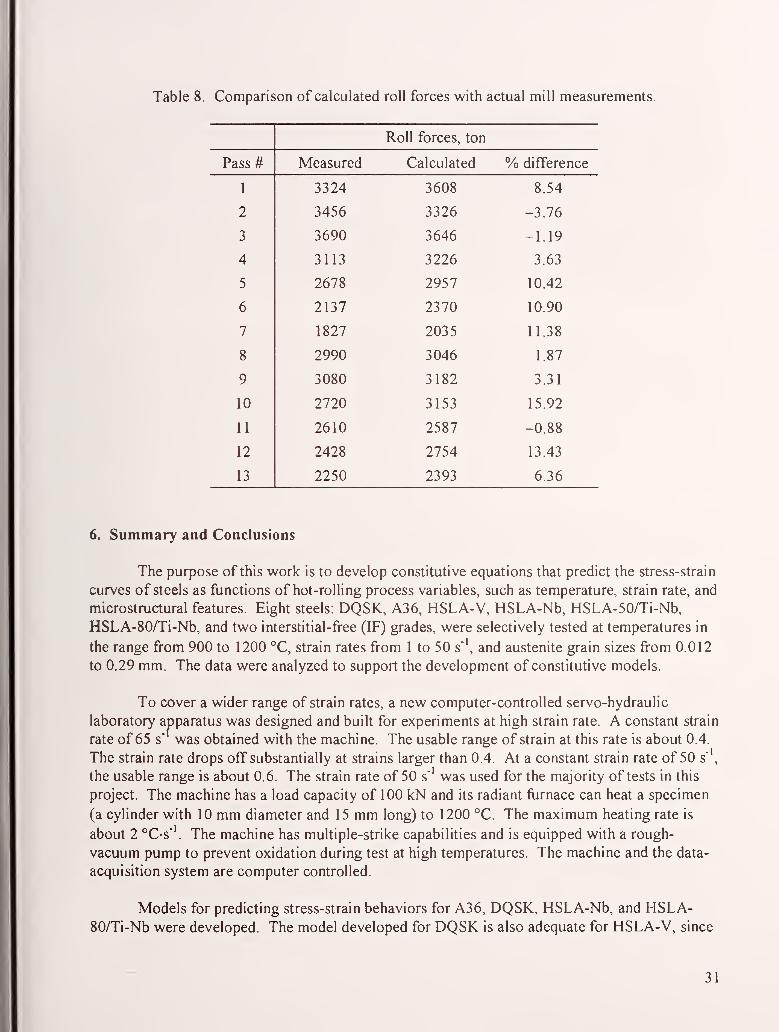
Table 8. Comparison of calculated roll forces with actual mill measurements.
Roll forces, ton
Pass# Measured Calculated % difference
1 3324 3608 8.54
2 3456 3326 -3.76
3 3690 3646 -1.19
4 3113 3226 3.63
5 2678 2957 10.42
6 2137 2370 10.90
7 1827 2035 11.38
8 2990 3046 1.87
9 3080 3182 3.31
10 2720 3153 15.92
11 2610 2587 -0.88
12 2428 2754 13.43
13 2250 2393 6.36
6. Summary and Conclusions
The purpose of this work is to develop constitutive equations that predict the stress-strain
curves of steels as functions of hot-rolling process variables, such as temperature, strain rate, and
microstructural features. Eight steels: DQSK, A36, HSLA-V, HSLA-Nb, HSLA-50/Ti-Nb,
HSLA-80/Ti-Nb, and two interstitial-free (IF) grades, were selectively tested at temperatures in
the range from 900 to 1200 °C, strain rates from 1 to 50 s\ and austenite grain sizes from 0.012
to 0.29 mm. The data were analyzed to support the development of constitutive models.
To cover a wider range of strain rates, a new computer-controlled servo-hydraulic
laboratory apparatus was designed and built for experiments at high strain rate. A constant strain
rate of 65 s' was obtained with the machine. The usable range of strain at this rate is about 0.4.
The strain rate drops off substantially at strains larger than 0.4. At a constant strain rate of 50 s'',
the usable range is about 0.6. The strain rate of 50 s'' was used for the majority of tests in this
project. The machine has a load capacity of 100 kN and its radiant furnace can heat a specimen
(a cylinder with 10 mm diameter and 15 mm long) to 1200 °C. The maximum heating rate is
about 2 °C-s"\ The machine has muUiple-strike capabilities and is equipped with a rough-
vacuum pump to prevent oxidation during test at high temperatures. The machine and the data-
acquisition system are computer controlled.
Models for predicting stress-strain behaviors for A36, DQSK, HSLA-Nb, and HSLA-80/Ti-Nb were developed. The model developed for DQSK is also adequate for HSLA-V, since
31

we find that V has little influence on the flow behavior of low-C steels, and the chemical
compositions of the two grades are similar (except for the V addition in the HSLA-V grade).
The model developed for HSLA-Nb was also found to be suitable for predicting the stress-strain
behaviors of HSLA-50/Ti-Nb, and two Nb-treated IF steels, which all contain Nb. Model
predictions correlate well with the experimental data, indicating that the models adequately
describe the stress-strain behaviors of various steel grades under hot-rolling conditions.
Models were also developed for correlating the strain at peak stress in the stress-strain
curve with temperature, strain rate, and austenite grain size for the following four steels: A36,
DQSK, HSLA-Nb, and HSLA-80/Ti-Nb. In addition, we proposed models for predicting the
conditions under which there will be no dynamic recrystallization for the same steels. This will
precede the former conditions.
We also conducted experiments to evaluate the effects of precipitates on the flow
behavior ofHSLA-Nb grade. It was found that under one condition with low strain rate (1 s'*)
and low temperature (900 °C), the specimen with undissolved precipitates displayed occurrence
of dynamic recrystallization, while the specimen with prior high-temperature soaking heat
treatment (precipitates dissolved at the time of experiment) did not show the same behavior. It is
likely that the dissolved Nb retards the process of dynamic recrystallization under this condition.
At high temperatures and higher strain rates, there is no difference in flow behavior between the
specimens (with or without the high-temperature soaking heat treatment). It should be noted that
mill conditions rarely encounter a strain rate as low as 1 s'' at 900 °C.
For the HSLA-80/Ti-Nb grade, it was found that specimens with treatment of reheating at
1250 °C and holding for 10 min (0.3 mm in grain size) reduced the flow stress about 9 % whencompared with those specimens that were reheated at lower temperatures. This behavior has
been observed for various experiments with testing at different temperatures and strain rates. It
is, therefore, suggested that the 9 % reduction in flow stress be corrected if the actual conditions
are close to our experimental conditions (reheated at 1250 °C and held for 10 min).
In HSLA-80/Ti-Nb, we found the static recrystallization to be sluggish. Our double-hit
experiments show that at testing temperatures of 900 and 1000 °C and inter-hit times of 5 to 20 s,
little softening occurred between hits. If retained strain is properly considered, the model based
on single-hit deformation is adequate to describe the stress-strain behaviors under multiple-hit
conditions.
Our model predictions for A36 and DQSK were compared with Camplastometer's high
strain-rate data obtained at CANMET. CANMET's data cover the strain-rate range from 10 to
150 s'\ which are beyond NIST's experimental capability. The agreement between CANMET'sdata and NIST's model predictions is good at large strains (> 0.6) but poor at small strains (<
0.4). The discrepancy mainly comes from the different treatment of data in the two laboratories.
NIST corrected the data for displacements due to machine compliance and used rigid-plastic
model to describe the stress-strain behavior, whereas CANMET did not correct for machine
compliance and reported the data as generated (no stress-strain model had been used). After
correction for machine compliance in CANMET's data, the agreement was improved, and the
results indicated that NIST's models can be extrapolated beyond the experimental range that
32
were used to obtain the coefficients in the constitutive equations. However, caution should be
exercised in extrapolation because the results might not be reliable.
Finally, we used the Sims equation with NIST's constitutive model to calculate the roll-
separating forces for rolling an HSLA-80 slab. The calculated results were compared with the
actual mill measurements. The results are encouraging. For 8 of the 13 passes, the calculated
loads are within 10 % of the measured loads. The worst discrepancy is an overestimation by
15.9 %. For the other 4 passes, the discrepancy is slightly over 10 %. For 10 of the 13 passes,
the calculated loads are higher than the measured. This is to be expected since the Sims equation
assumes the presence of sticking friction (maximum friction) between the rolls and the
workpiece.
This work represents one subtask of the Microstructural Engineering in Hot-Strip Mill
Project, a cooperative research project sponsored by the AISI Advanced Process Control
Program. Other tasks of this project have been performed at the University of British Columbia
and at the U.S. Steel Technical Center. We gratefully acknowledge the support and sponsorship
of the American Iron and Steel Institute, particularly the two directors of the Project: L. W.Kavanagh and J. R. Vehec.
The actual values for the coefficients for the constitutive equations are not published in
this report, as these are considered proprietary data of AISI.
This work was performed under the supervision of G. Alers and H. I. McHenry. We also
acknowledge J. R. Orth (Rocket Seals Corporation, Denver, CO), and C. McFadeen (Coors
Ceramics Division, Golden, CO) for providing advice and information about the high-
temperature polymer seals and ceramic materials used in the construction of the hot-deformation
test apparatus.
7. References
[1] Sellars, C. M. The physical metallurgy of hot working. Sellars, C. M.; Davies, G. J., eds.
Proc, int. conf on hot working and forming processes; 1979 July 17-20; University of
Sheffield, U.K.; The Metals Society, London; 1979. 3-15.
[2] Hollomon, J. H. Tensile deformation. Trans. AIME. 162; 268-290; 1945.
[3] Ludwik, P. Elemente der Technologischen Mechanik, Verlag Von Julius Springer,
Leipzig; 1909. 32.
[4] Baragar, D. L. The high temperature and high strain-rate behavior of a plain carbon and
an HSLA steel. J. Mech. Working Technol. 14: 295-307; 1987.
[5] Swift, H. W. Plastic instability under plane stress. J. Mech. Phys. Solids. 1: 1-18; 1952
Oct.
[6] Ludwigson, D. C. Modified stress-strain relation for FCC metals and alloys. Metall.
Trans. 2: 2825-2828; 1971.
[7] ASM Metals Handbook, 9th edition. Vol. 14, Forming and Forging; ASM Int., Metals
Park, OH; 1988.
33

[8] Cheng, Y. W. Unpublished results, NIST, Boulder, CO.
[9] Benyon, J. H.; Sellars, C. M. Modeling microstructure and its effects during multipass
hot rolling. ISIJ Int. 32(3): 359-367; 1992.
[10] Voce, E. The relationship between stress and strain for homogeneous deformation. J.
Inst. Mets. 74: 537-562; 1948.
[11] Hatta, N.; Kokado, J.; Kikuchi, S.; Takuda, H. Modeling on flow stress of plain carbon
steel at elevated temperatures. Steel Res. 56: 575-582; 1985.
[12] Laasraoui, A.; Jonas, J. J. Prediction of steel flow stress at high temperatures and strain
rates. Metall. Trans. 22A: 1545-1558; 1991 July.
[13] Adebanjo, R. O.; Miller, A. K. Modeling the effects of recrystallization on the flow
behavior during hot deformation by modifying an existing constitutive model. 1.
conceptual development of the MATMOD-REX equations. Mat. Sci. Engr. Al 19: 87-94;
1989.
[14] Adebanjo, R. O.; Miller, A. K. Modeling the effects of recrystallization on the flow
behavior during hot deformation by modifying an existing constitutive model. 2.
predictive and fitting capabilities. Mat. Sci. Engr. Al 19: 95-101; 1989.
[15] Sellars, C. M.; McG Tegart, W. J. Mem. Sci. Rev. Metall. 63: 731-746; 1966.
[16] Rao, K. P.; Hawboh, E. B. Assessment of simple flow-stress relationships using
literature data for a range of steels. J. Mater. Proc. Technol. 29(1-3): 15-40; 1992.
[17] Hodgson, P. D.; Gibbs, R. K. A mathematical model to predict the mechanical properties
of hot rolled C-Mn and microalloyed steels. ISIJ Int. 32: 1329-1338; 1992.
[18] Nakamura, T.; Ueki, M. The high temperature torsional deformation of a 0.06 % C mild
steel. Trans. ISIJ. 15: 185-193; 1975.
[19] Sakai, S.; Sakai, T.; Takeishi, K. Hot deformation of austenite in a plain carbon steel.
Trans. ISIJ. 17:718-725; 1977.
[20] Devadas, C; Baragar, D. L.; Ruddle, G.; Samarasekera, I. V.; Hawbolt, E. B. The
thermal and metallurgical state of steel strip during hot-rolling. 2. factors influencing
rolling loads. Metall. Trans. 22A(2): 321-333; 1991.
[21] Sankar, J.; Hawkins, D.; McQueen, H. J. Behavior of low-carbon and HSLA steels
during torsion-simulated continuous and interrupted hot-rolling practice. Met. Technol.
6(9): 325-331; 1979.
[22] Roberts, W. Dynamic changes that occur during hot working and their significance
regarding microstructural development and hot workability. Krauss, G. ed. Proc,
seminar on deformation, processing, and structure; 1982 October 23-24; St. Louis MO.ASM, Metals Park, OH; 1984. 109-184.
[23] Dieter, G. E. Mechanical metallurgy, second edition. New York: McGraw-Hill BookCompany, 1976. 774 p.
[24] Miller, A. K. An inelastic constitutive model for monotonic, cyclic, and creep
deformation: part 1 - equations development and analytical procedures. J. Engr. Mat.
Technol. 98H: 97-105; 1976 April.
[25] DeArdo, A. J. Modeling of deformation processing: wonderful tool or wishful thinking.
Yue, S. ed. Proc, Mathematical modeling of hot rolling of steel; 1990 August 26-29;
Hamilton, Ontario, Canada. AIME, Warrendale, PA; 1990. 220-238.
[26] Pietrzyk, M.; Lenard, J. G. Thermal-mechanical modeling of the flat rolling process.
Heidelberg, Germany: Springer-Verlag; 1991. 187 p.
34

[27] Jonas, J. J.; Sellars, C. M.; McG Tegart, W. J. Strength and structure under hot-working
conditions. Metall. Rev. 14: 1-24; 1969 Jan.
[28] McQueen, H. J. Deformation mechanisms in hot working. J. Metals: 31-38; 1968 April.
[29] Sellars, C. M. Physical simulation to determine hot forming behavior. Proc, Physical
simulation of welding, hot forming, and continuous casting; 1988 May 2-4; Ottawa,
Ontario, Canada; 1988. in-1-14.
[30] Baragar, D. L.; Crawley, A. F. Frictional effects on flow stress determination at high
temperatures and strain rates. J. Mech. Working Technol. 9: 291-299; 1984.
[31] Gelin, J. C; Oudin, J.; Ravaland, Y. Determination of flow stress-strain curves for
metals from axisymmetric upsetting. J. Mech. Working Technol. 5: 297-308; 1981.
[32] Cheng, Y. W.; McHenry, H. A hot-deformation apparatus for thermomechanical
processing simulation. Proc, Physical simulation of welding, hot forming, and
continuous casting; 1988 May 2-4; Ottawa, Ontario, Canada; 1988. Ill- 15-22.
[33] Kuziak, R. M.; Cheng, Y. W. Microstructural evolution in microalloyed medium-carbon
forging steels during thermomechanical processing. DeArdo, A. J. ed. Proc, Int. conf
on processing, microstructure, and properties of microalloyed and other modern high
strength low alloy steels. ISS, Warrendale, PA.; 1992. 51-64.
[34] Purtscher, P. T; Cheng,Y. W. Structure-properties relations in steels. To be published as
NIST Technical Note; NIST, Boulder, CO.
[35] Cheng, Y. W.; Rosenthal, Y.; McHenry, H. I. Development of a computer-controlled
hot-deformation apparatus at NIST. Natl. Inst. Stand. Technol, NISTIR 89-3925; 1989
October. 92 p.
[36] Cheng, Y. W.; Filla, B. J.; Tobler, R. L. Design and performance of an automated test
facility for hot-compression testing. J. Testing Eval., JTEVA. 26(1): 38-44; 1998 Jan.
[37] Cheng, Y. W.; Read, D. T. An automated fatigue crack growth rate test system. Cullen,
W. H.; Landgraf, R. W.; Kaisand, L. R.; Underwood, J. H. eds. Proc, symp. on
automated test methods for fracture and fatigue crack grov4h. ASTM 877, Amer. Society
Testing Mater.; Philadelphia, PA.; 1985. 213-223.
[38] Tobler, R. L.; Cheng, Y. W. Automatic near-threshold fatigue crack growth rate
measurements at liquid helium temperature. Int. J. Fatigue, 7(4): 191-197; 1985.
[39] Cheng, Y. W.; Sargent, C. L. Data reduction and analysis procedures used in NIST's
thermomechanical research. Natl. Inst. Stand. Technol. NISTIR 90-3950; 1990 August.
61 p.
[40] Dennis, J. E.; Schabel, R. B. Numerical methods for unconstrained optimization and
nonlinear equations. Englewood Cliffs, NJ: Prentice-Hall; 1983,
[41] Efron, B. The Jacknife, the bootstrap, and other resampling plans, Proc, CBMS-NSFregional conf series in applied mathematics, SIAM; Philadelphia, PA; 1982,
[42] Efron, B.; Tibshirani, R. An introduction to the bootstrap. New York: Chapman and
Hall; 1993.
[43] Kuziak, R. M.; Cheng, Y. W.; Glowacki, M.; Pietrzyk, M. Modeling of the
microstructure and mechanical properties of steels during thermomechanical processing.
Natl. Inst. Stand. Technol. NIST Tech. Note 1393; 1997 Nov. 72 p.
[44] Sims, R. B. The calculation of roll force and torque in hot rolling. Proc, Inst. Mech.
Engr. 168: 191-200; 1954.
[45] Orowan, E. The calculation of roll pressure in hot and cold flat rolling, Proc, Inst,
Mech. Engr. 150: 140-167; 1943.
35

[46] D. Q. Jin, University of British Columbia, Vancouver, Canada, private communication.
[47] Dutta, B.; Sellars, C. M. Effect of composition and process variables on Nb(CN)precipitation in niobium microalloyed austenite. Mater. Science and Technol. 3: 197-
206; 1987.
36
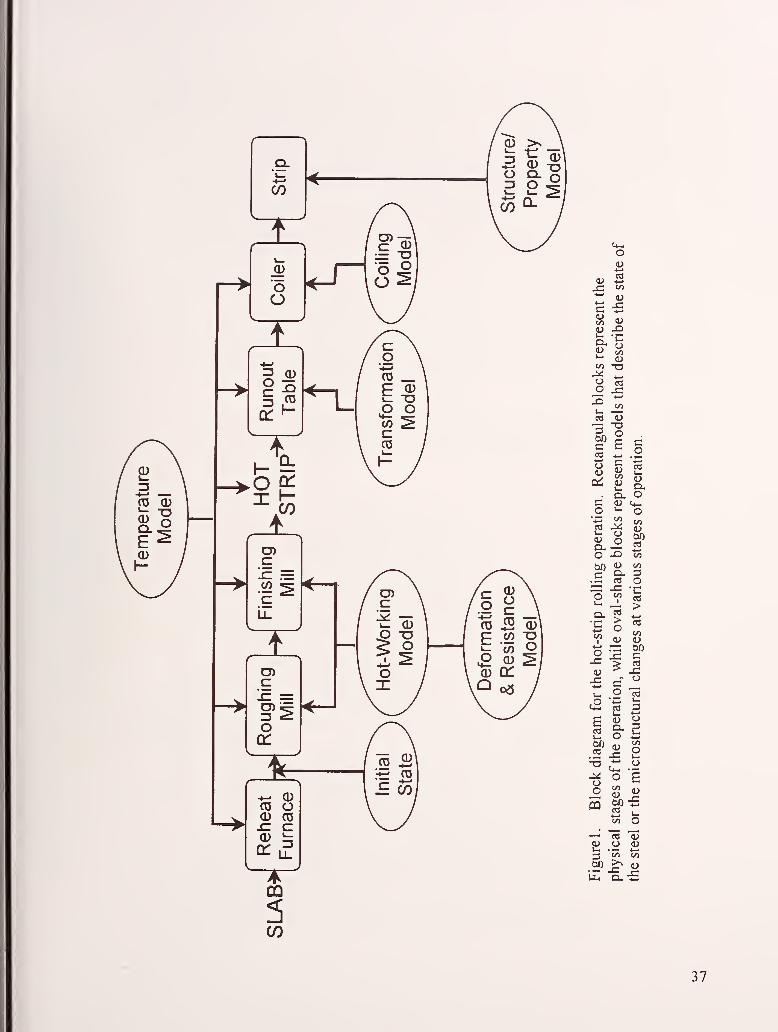
<4-l
o
I-(U
c«24)
co
^ Oa> o
.- c^ O= J= -c
^ S"D. O
Oc/i
00
Q- S? +-
h b ed
O— 00x: c
o 15c2 '-S 3
E ?^ 3I o 2U. UJ -4—
'
00cd
C/5
o•n o
(Mo s
o C/5
00(U
PQ »-<
1—
(U O 0)k- .— •4—1
3 CO c/5
00 >^ (U
37
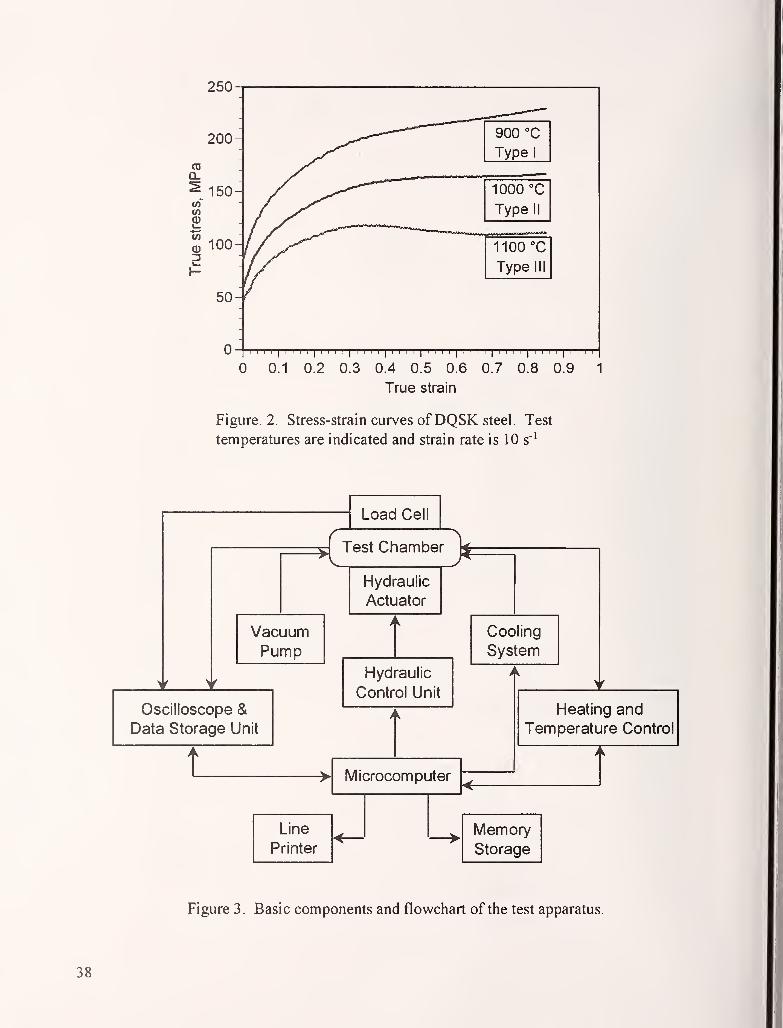
250
200
(0
Q.
150-
(/)
0)
100-
I' ' ' '
I
' ' ' '
I' ' ' '
I' ' ' '
I
' ' ' '
I
' ' '
'
0.1 0.2 0.3 0.4 0.5 0.6 0.7 0.8 0.9 1
True strain
Figure. 2. Stress-strain curves ofDQSK steel. Test
temperatures are indicated and strain rate is 10 s''
Load Cel
Test Chamber
Hydraulic
Actuator
Oscilloscope &Data Storage Unit
Hydraulic
Control Unit
Microcomputer
Heating andTemperature Control
Line
Printer<
—
Figure 3. Basic components and flowchart of the test apparatus.
38

150
120-
30- GS = 0.114 mmT= 1100 °C
Strain rate = 10 s"^
1 1 1 1
1
1 1 1 1
1
1 1 1 1
1
1 1 1 1
1
1 1 1 1
1
1 1 1 11
1 1 1 1
1
1 1 1 1
1
1 1 1 1
1
1
0.0 0.1 0.2 0.3 0.4 0.5 0.6 0.7 0.8 0.9 1.0
True strain
Figure 4. Triplicate tests ofDQSK steel. The results show good
reproducibility of the machine.
(DQ_
V)
0)3
£.^J\J
200- 250 kN machine
• ....^Jl_iJ
150- 100 kN machine
100-
50-GS = 0.114 mm
-
T = 1 000 °C
0-Strain rate = 25 s"^
''
'
' 1'
''
' 1
'
'
'
' 1
'
'
' '
1' ' ' ' 1
'
''
' 1
'
'
' '
1
'
'
' '
1
'
'
'
' 1'
' '
'
0.0 0.1 0.2 0.3 0.4 0.5 0.6 0.7 0.8 0.9 1.0
True strain
Figure 5. Stress-strain curves for two specimens ofDQSK using
different test machines. The results show the consistency
between the two machines.
39
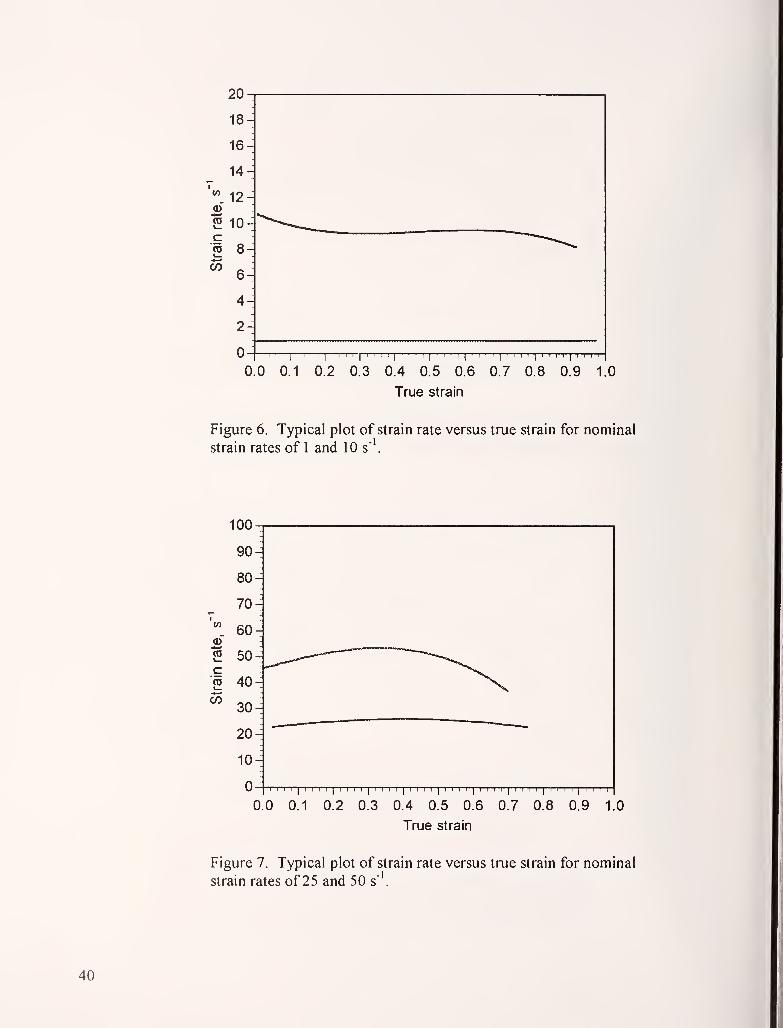
£.\J
18-
16-
14-
<« 12-<D
2 10-cCO 8-
^ 6-
^4-
2-
nu ^0.0 0.1 0.2 0.3 0.4 0.5 0.6 0.7 0.8 0.9 1.0
True strain
Figure 6. Typical plot of strain rate versus true strain for nominal
strain rates of 1 and 10 s'\
100
90-
80-
70-
'^60 ^
a>
2 50cCO 40-
^ 30
20
10^
I I I I
II I I I
II I I I
II I I I
II I I I
Ii I I I
II I I I
II I I I
II I I I
II I II I I I I
I
I I I I
I
1 I I I
I I
' ' ' '
I
0. 0.1 0.2 0.3 0.4 0.5 0.6 0.7 0.8 0.9 1.0
True strain
Figure 7. Typical plot of strain rate versus true strain for nominal
strain rates of 25 and 50 s"'.
40

w 1.1SIO)<BSITJ(D73CCO
EEouI
oD
OT(0<D
E
oOJ
1.05-
0.95
A36 steel
Commanded Hr = 6 mm(span = 6.4)
GS = 0.105 mm
GS = 0.192 mm
I I I—I—]—I—I—I—I—I—I—I—r—I—I—I—1—1—I—I—I—I—I—I—I—1—1—I—
r
850 900 950 1000 1050 1100 1150
Temperature °C
Figure 8. Ratio of measured-to-commanded final heights for A36steel sample tested at various temperatures and grain sizes.
Time, ms
5.4 7.2
T T9.0 10.8 12.6
—I
1—r—I—I—I—I—I
—
\—II
I—n—I II—I—I—
r
1
0.3 0.4
True strain
0.5 0.6 0.7
Figure 9. Temperature versus true strain of an A36 steel
specimen showing self-heating during a high strain-rate test.
41

Bdl/M 'SS94S 9nji BdlAI 'SS9JIS 9nji
s
feb
p
*-"
c'.5
2I
co(U
c
W OCD
Oo
CD OCO ^< T-
ooCM
OIf)
OO
00
o
O (0
(O
b I-
b
ob
o
0)
o
3C/3
<uHo
BdlAI ss9j;s 9nji BdlAI SS9JJS 9nji
42

BdlAI 'SS9JJS enji Bdl/M 'SS9JJS 9nji
S
o
2T3C3OWi
HC/3
Bdl/\| 'ssej^s ami
CO
B
co CO
o
CD c 3o CO (U
u. t-i
•4->
C/5
^ HH -
a>
300
BdlAI SS9J1S 9nji
43
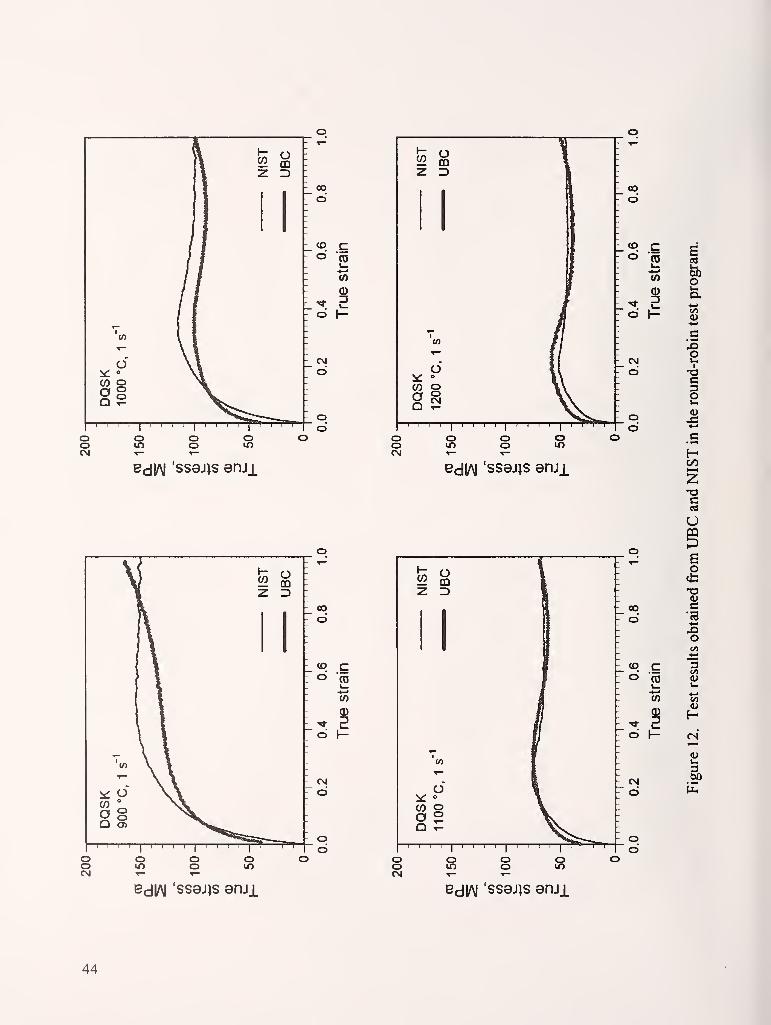
o^ °
W O
ooCM
Om
BdlAI ss9J)s enji BdlAI 'ss9J)s enJi
S
p
9J
Xi
2
c
2
HCO
T3csi
U
BdlAI 'SS9J1S enji
o
c
x>o
30)
CO0)
HfS
2300
BdlAI SS9J1S 9nji
44

s
S feb
Bdl/\| 'SS9J1S 9nj_L BdlAI SS9JJS 9nji
C/5
o
c3o(U
HC/3
T3
CCD
V)
CD
o
C
t-'
X)o
3
t/5
Hen
3&0
BdlAI 'SS9JJS 9nji BdlAI 'SS9JJS 9nji
45

200DQSKStrain rate: 1 s
GS: 0.29 mm
1
900 °C
1000 °C
1100 °C
1200 °CI
I I I I I I I I I
II I I I I I I I I I I ''' I I ' I I
II '' I I I '''
II I I I ''' I I
0.0 0.2 0.4 0.6
True strain
0.8 1.0
Figure 14. Dependence of flow stress on temperature.
250
200
a.
V)o
150
100
DQSKTemperature: 1000 XGS: 0.114 mm
50 s'
10s
1 s"
I I I—I I I I I—r—1—n—r—n—i—n—i—i—i—n—i—i i i i i i i—n—i—i—n—i—
r
0.0 0.2 0.4
True strain
0.6 0.8
Figure 15. Dependence of flow stress on strain rate.
46

EE
EE
/Imo
- o(i o
v> Vo
S^ o
CO O§1
- d
d
- d
eg
d
c
To
seg
od
6\
—
-
E -
EJ
-
in 1 -
/I _
o /I-
o EE
~
1 1 O)-
T 1 1 CM</)i I O -
°\\ -_
^A '^ _^° \\ _
w 2 W -
§1 \;^ \
'
1
'
'
oo
d
CD CO (0
(/)
o H
CM
d
od
o oin
BdlAI 'SS9J)S 9nji
ooCM
Oin
oo om om
BdlAI 'SS8JJS ami
EI
\F \
boo 1 ECJ>
\ •<!l-o\
*o CM
d\
>
a>
o
co(U
'53
c'S
00<L>«->
'c
c«
3ca
o
W
3op
Bdl/\| 'ssBJ^s anji BdlAI 'SS9J1S enji
47

EE«*
CM
d
V)
o
do
oo
^ a0)
03 I--1
U too CD
CO OJ
O 2
00
d
CD cO CD
w
o I-
CM
d
o O o oo lO o mCM
BdlAI SS9JJS snji
- d
BdlAI SS9J1S 9nJl
\
E
-_
E -_
•*-
^ ^^1"
o-js ail
—- 3 4=1 W 1 _
(/) U CD 1 -
2 5l\ :
O \ —o \O \ -
O \ "
o X. .
T
—
X -
"--^ -—1—r—1—
r
1'
CO co CO
CO vo
* I—3
o H
CM->
o 0)
e'Sa.
o Xd CA
3
>V)Co
1-5
o iZ
o
CO<4-io o
C/3
CD c oid CDi_
t--CO
* 8 2i3
o 1- Op
CM
d
ooCM
o oo oin
BdlAJ ssaj^s enji BdlAI SS9JJS 9nji
48

-
]
-
,
':
E':
E -
S "O T3-
'* (D 03OJ ••- 1- _
-J ^ 3 _
1 o -=i w -
\ -^ ' o ^ "
\ 'to TO ^ ':
\ d -
„
X o -
X. o _A^ CI;—1—1—1—r-|—
r
-1—1—1—[ - r -I j^Y' "—1—1
—
t
—
00
o
ooCM
oin
oo oin
BdlAI sssjjs enji BdlAI 'SS9J1S emi
EE
d
tf)
Oo
OoCM
I iO CO
CO a>
O S
ooCM
1^
om1^
oo
00
d
(O co CD
1 '
(/)
^ ^o H
CM- d
oCD
':
E
-
E -
Z V. V. 1
:
CM -
E iCD --
3 W -
^— J 03-
1
5 OJ -
^ o ^ ]:
d . \ 1_
^ "
o \ -
o VIk.-
o >A^~ ^ ;
1
, , ,1
CO co
vd^ m
* I— <o 1-
TD
CM
o C
o a.
d
U.
>COC-4—*
o•5
o ua.
-ooB
00 ^o o
30)
CD c C^d roi_
00CO >—
<
(D <u
"*r 3o H &P
CM
d
CD
dooCNI
Om oo om
BdlAI 'SS9JIS emi BdlAI SS9J1S ami
49

-1—I—I II
I—
r
OO
d
o o o o oIf) o m o meg CM ^—
Bdl/\l 'SS9JIS ami Bdl/\| SS9J1S snji
CO co
2vd
* 3o H
cd
1Csl cd
•4-^
o c
E
o a.
CD (U
i
co
1o £;
13
oOO tMo o
->
10)
CO c e<d (0l_
as(O I—
'
* s 3o 1- 01)
CM
O
Od
o O O o olO O in o mCM CM •»— T-
Uh
Bdl/\j SS9J1S enji Bdl/\| 'SS9JJS 9nJi
50

EEo
O -£
V)
3 0)(0
(5 «O 2
Oo
ooo
ooeg
1^
o
- o
(D cO ro
i-
OT
'* I—O 1-
o
od
Bdl/\| SSaJlS SDJl Bdl/M SS9J1S enji
<
E*ca>o.X.a>
3
>
co
(L>
oS
o
3
o
3
o o o o oin o lO o If)
CN CM T-
Bdl/\| 'SS9J1S 9nji BdlAI 'ssajis ami
51
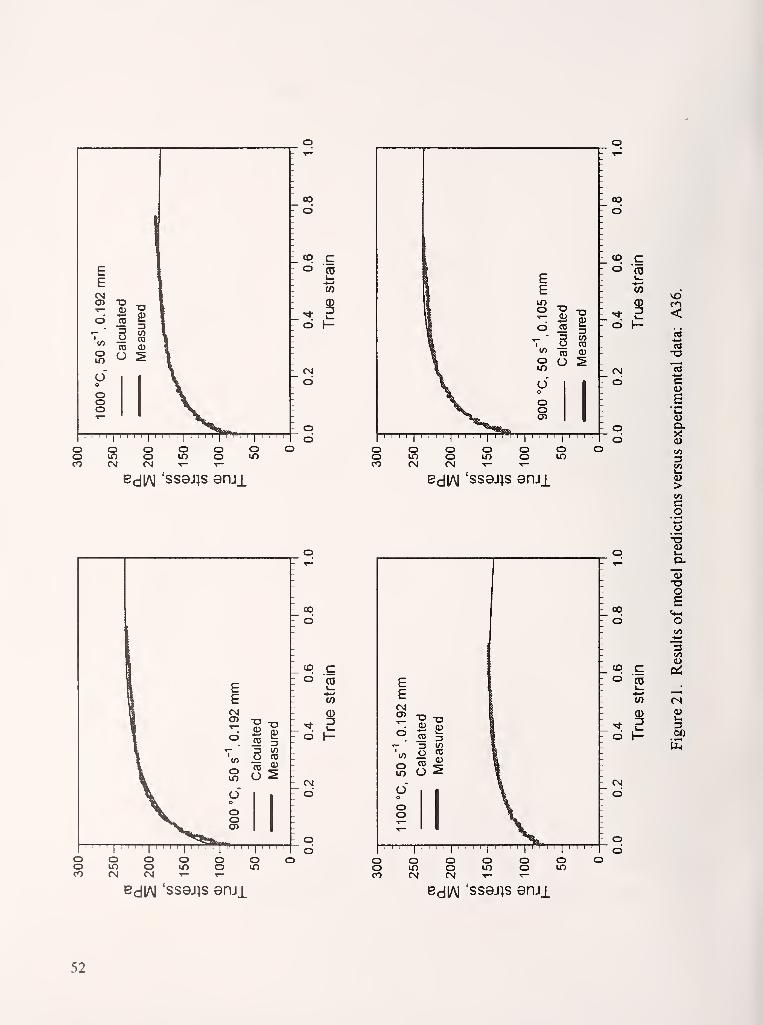
GO
d
(O co CD
1 '
(/)
^ 8o H
d
- od
o o oo in oCO (N CM
00
d
o o o o o oo m o lO o lOCO Csl Csl T— T—
BdlAI SS9JJS enji BdlAI SS9JJS 9nji
\
E
I
E -
CM .
O)"S "O '
"
<D D-
O 00 5 -
^— 3 ^ &o T3 1 _
oin o ^ 1
':
^ s -
O \ —O 'L _
o \ -
o »^ _
•x— ^b -
T— \^ :
1
1
1 1 1 1
1
1
(O co (0
<>
* 3o 1-
CO
CNJ*->o c
sa>
o ^d3
>(Aco
o £:
oCO «-o o
lU(O c oid
i_•A—* 1—^
V) (N
* 8I— 3
o H
CMd
o o o o o oo in o in o inCO CM CM T—
o o o o o oo in o in o inCO CM r\i T— ^
—
edlM 'SS9J1S 9nji BdlAI 'SS9JJS 9nji
52
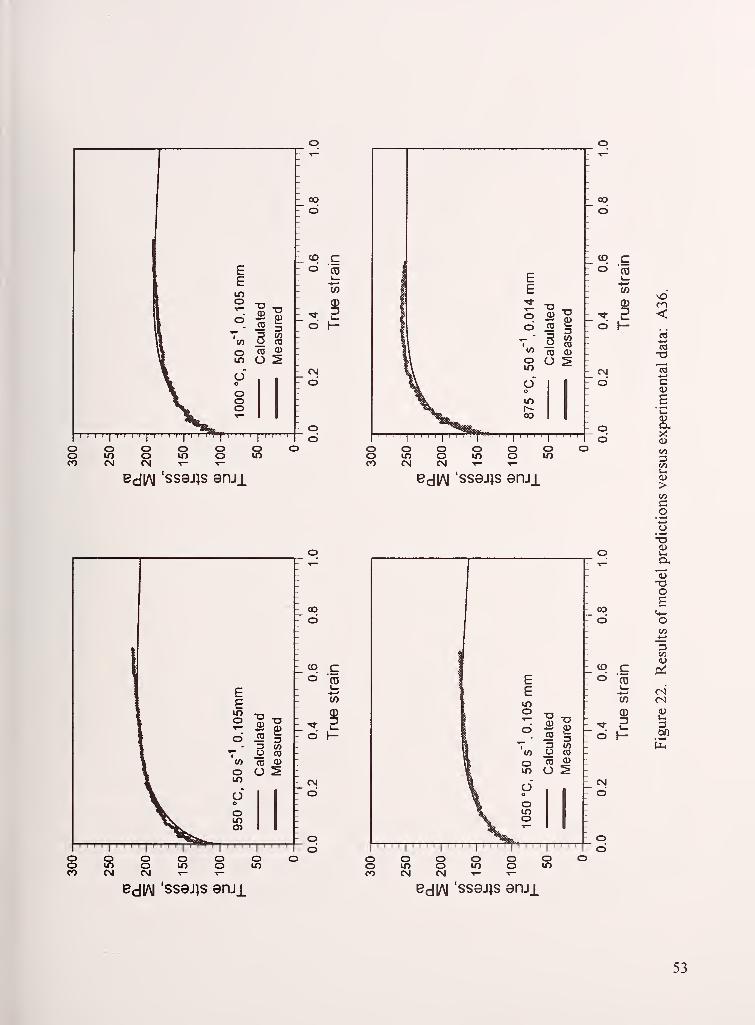
o o o O o oo m o m o inCO CM CM r—
CO
o
o o o o o oo in o m o inCO CM CM
BdlAI 'SS9J1S enji BdlAI 'SS9JJS 9nji
00- d
(O co (0
I—
(/)
a)^ 3
I-o 1-
CM
d
oo
CO co 05
^«* 8
l_ <o h-
CM CO
O c<u
B
a>
OO <t>
>
co
%'-5
O u.
-oo
CO t^-O oC/J
CO c ccio rol—
(NCO (N
0) (U
^ D 3o 1- .2P
CM
O
o o o o o oo m o m o mCO CM CM T— T-
o o o o o oo in o in o inCO CM CM T—
Bdl/\| 'SS9J)S 9nji BdlAI SS9JtS 9nji
53
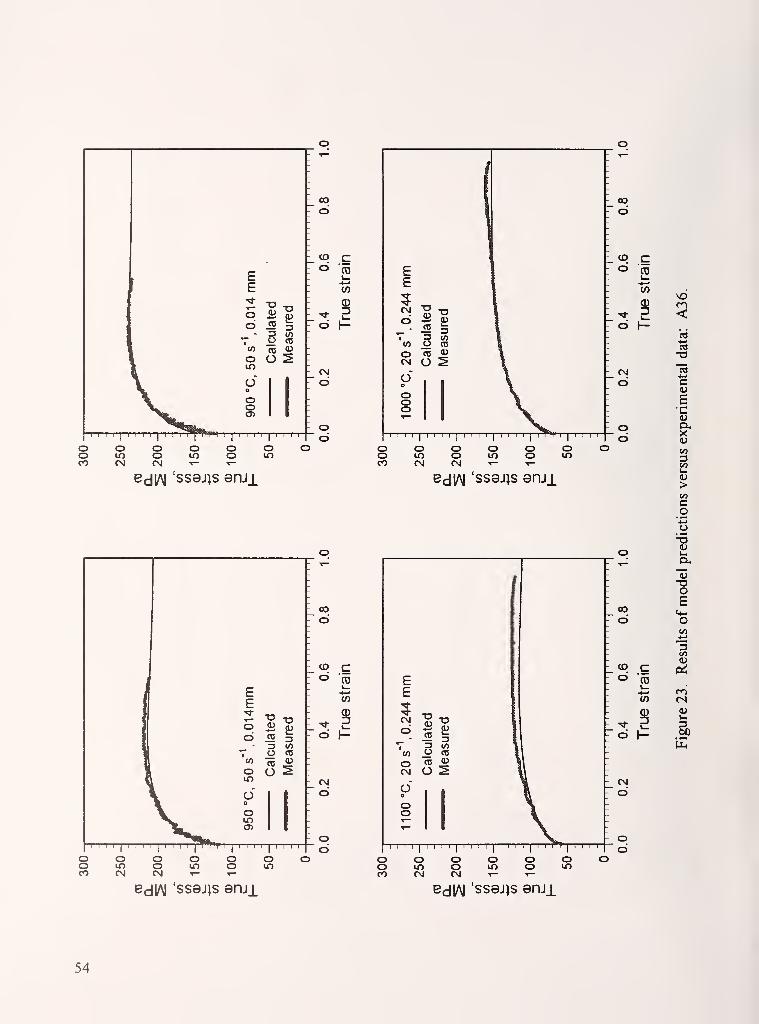
EErr
od
omdo
Oo
O CD
O 2
oo
d
(O co ra
k_<*-^
(0
-*
o 1-
d
EE
(U
W O CD
o ro <u
CM O ^oo
ooo
00
d
o o o o o oo in o in o lOCO CM CM
o o o o o oo in o in o mCO CM CM T— »—
BdlAI 'SS9JJS ami BdlAI 'SS9JJS enji
(O cos
vd
* 5o H
CM
o
o a.Xd3
>CMCo
1o t-
i00 «+-o o
CA<->
3(O c C^d
i_-4-' mw <N
•^ 5U- 5o 1- 2P
CM
d
o o o o o oo m o in o mCO CM CM T— X—
Uh
BdlAI SS9J1S enji BdlAI 'SS9JJS 9nji
54

m<'d
CLX(L>
3b>
>
Co
o
o
3
Bdl/\| 'SS9J1S 9nji
55

o
do
oo
*1
00
d
(O co (0
\—
(/)
«d-^
o H
CM
d
o o o o om o in o vnCM CM T— »—
c
o o o o oin o in o inCM CM T—
BdlAI 'SS9JJS enji BdlAI ss9j;s enji
aQ
-o
c0)
S'C
o.XD(A3CA
>
co
00- d
E
^ - -^ §3 (/)
(/) _o CC
O CO <i^
^ O SdooCM
CD cO ro
i-
(o
0)"4- I—O 1-
CM
d
od
o o o o om o m o mCM CM T— ^
—
BdlAJ SS9JJS ami
|- 00
d
do
oB
o
to c (U
o2 Cti
w m'
(D(N
* 3 2i
o h-
11^
CM
O
BdlAI SS9JJS ami
56

00
o
Bdl/M 'ssejjs 9nji BdlAI SS9JJS 9nji
oo
o
CO co CD
I—
y) E0) E
* 3CNJo 1- d
<N .
d Oo
OOo
^ CO
CD <U
ooeg
om
00- d
to co
2to
0) ^D ODa
Q
CN4 T3o
"cd*—
»
c4)
Eo u^
o Hia-X0)
on3C/5
b>
>
co
o T3
13
o
CD cO ei
(O VT)
(1)(N
*O 1- 3
00
CNJ
d
od
Uh
Bdl/\| 'SS9J1S 9nji BdlAI SS9J1S 9nji
57

o O o o olO O IT) o inCN eg T-
oo
d
o o o O oin o in O IDCM CM r- T-
BdlAI 'SS9JJS snji BdlAI SS9JIS ami
oCM
00
d
CD cO (0
l_
V)
0)
-"^
o H
CM
C3
OCD
CD cO (0
CO ^
o
00aQ
13CM ^^C>
«3
1O
a.d Xa>
1>
co
o T3
T3O
00 £o
O
CD c a>
o2 D^
(/) r-'
^r
CN
o H ^
CM
d
od
o o o o oin o in o mCM CM »—
Uh
BdlAI SS9J1S 9nj_L BdlAI SS9JIS 9nj_L
58
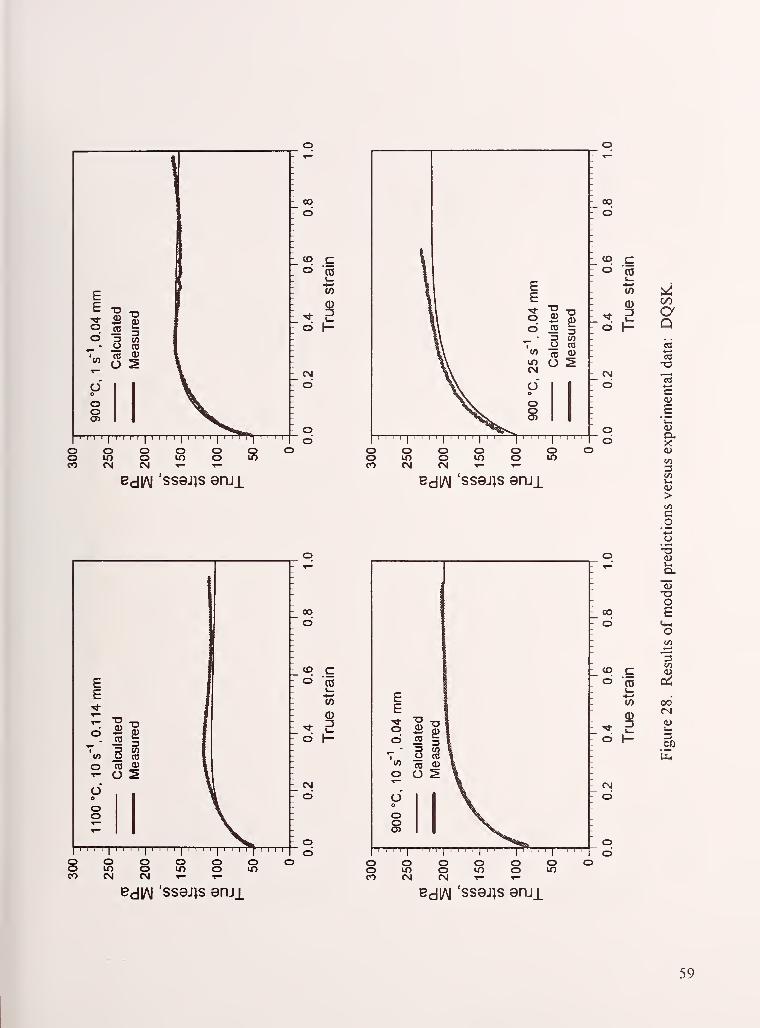
EE
s CO
a3o 3
- U CO
tn (T3 (U
o
oo
oo
II
I I I II
I
oo
o
(O co CD
i_
y>
-*
o 1-
CMO
oo
o o o o o oo m o IT) o mCO CnI CM T— T—
oo
d
o o o o o oo m o un o mCO CM CN T— T—
Bdl/\l 'SS9JJS ami BdlAI SS9J1S 9nji
to co (0
(0 ^CD C/2
dD a\- Q
cd4->«J-a
CM 1
d 4—
•
c
.1
o 0)a.d<u
en
>
o
o
o00 eo
o•4-*
=sC/3
(O c (U
o Oi
(0 00
a)<N
<*
o H 3
CM
d
od
o o O O o oo to O in o IT)
CO CM CM
Bdl/\| 'SS9JIS 9nji BdlAI SS9J1S 9nji
59

ooCM
00
d
BdlAI 'SS9J1S 9nji BdlAI ss9J)s enjx
aQ
T3
uOJO.X0)
CM3
>
co
o o o oo in o mCM T—
oo
EE
o
inCM
do
ovno
^ CD
CD <U
O ^
-_ CO- o
CO co ro
1 '
(0
0)
* 3o I-
CN4
CD
OO
Oin
<L>
(1>
oE
O
3
c;n
CN(U
300
BdlAI SS9JJS ami BdlAI 'SS9J1S 9nj_L
60

EE
1?O CT3
S ^ ^CO
Oo
in
y I I I
oo
ci
- CD c- O ro
- w- 0)
^- o \-
d
oo
o O O o oU) O in o inCM CM
CD
O
o o o o oin o in o inCM CM T— T—
BdlAI 'SS9JIS 9nji BdlAI SS9J1S 9nji
00
d
- CD cr° CD
I—*-'
- (0
- (D- -* i_- o H
CM
CD
Od
CD cO (0
CO ^0) on
d13
1-aQcd
T3CM ^Md
C
e
oa.d X(U
a>>
C-4—*
oo T3
13
O00 £o
o
1CD c (U
o (0 ai
CO o(D
m* ZJ
b.
o H 300
CM
d
o o o o oin o in o inCM CM »— T—
Bdl/\| 'SS9J)S 9nji Bdl/\| SS9JJS 9nji
61

':
':
--
E -
E -
0.078 ulatedsured
r
11 -Ore "
\ 'i',« ro *i> _
\ '^ O 2 -
^ "" -
\ ^ -
_
\^ o -
^ o -
^V^ o>;
1 1 1 1
1
1 1 1 1 1 1 1 r 1 1 1
oo
d
o o o o om o lO o inCM CM T— T—
o o o o oin o in o inCM CM T—
BdlAI 'SS9JJS 9nji BdlAI SS9J1S enji
EE00
o Si
CD <D
CM Oooo
oinCM
ooCM
oin
oo
o
CD cO OJ
I—^^05<D
*i_o H
CM
d
h Oo
o
CO co (0
l—
en ^
C=>
8C/3
H ocd*jC4TS
CM ,
d0)
E
oo
>
c
Oo T3
a
Ooo Bo «4_
o
3CO c
in(L>
o2 ei
CO 1-^
0)m
">* ZJl_
a>
o 1-
CM
o
o o o o om o m o mCM CM T— T—
BdlAI 'SS9J1S 9nji BdlAI 'SS9J1S 9nji
62

oo
o
(O co (0
^^(/>
•* I—o 1-
O
od
o o O O o oo If) O m o lOCO CN CM T—
oo
d
o o o o o oo m o in o inCO CNJ CM T—
BdlAI 'ss9j;s snji BdlAI SS9JJS 9nJi
c
55
o o o o o oo in o m o inCO CM CM T—
(O co CD
I—
w ^CD C/2
>*
dD a
Q«j«-•
Ri"O
CM ^.^
d
o 0)a.d X(U
C/S
>
co
ocx
13
ooo So
o
3C/5
CD c Do ca
i_Cci
w (N
(1)m
t i_o H ^n
CM
d
o o o o o oo in o in o inCO Cn4 CM »—
Bdl/\| 'SS9J1S 9nji BdlAI SS9J}S 9nji
63
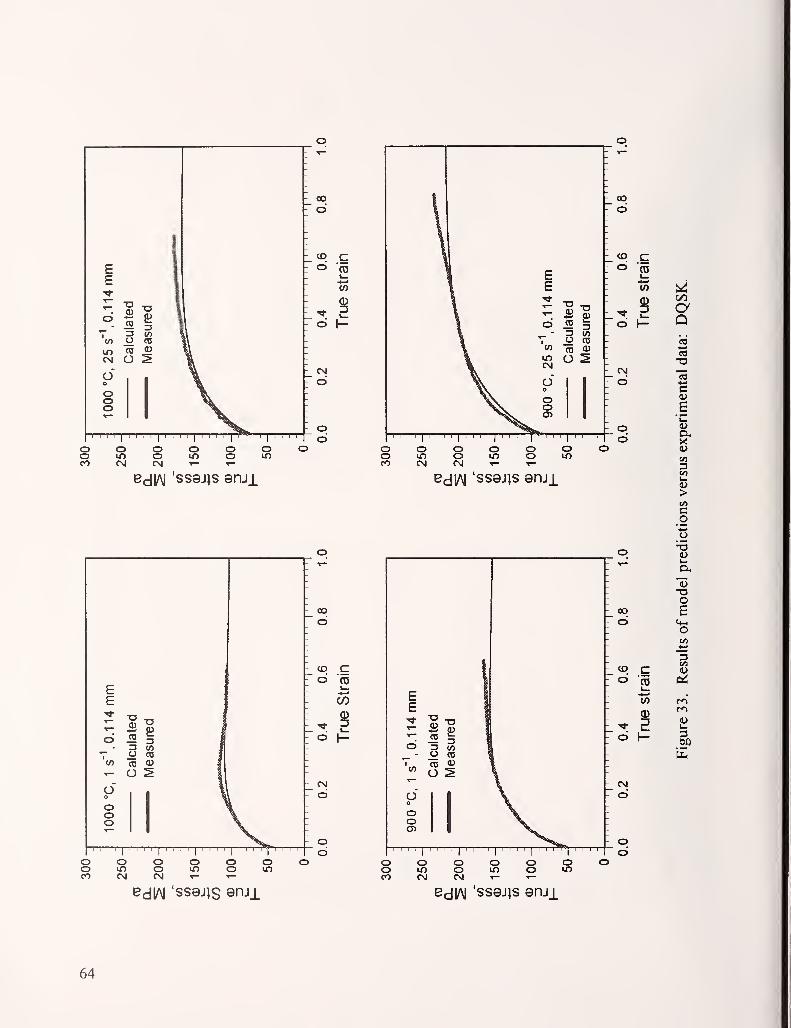
EE
in
O CO
05 <U
[- 00
o"
CM O
ooo
CD cO OJ
I—
V)
^ 8o 1-
eg
d
o o o o oo in o ID oCO Cvl Cvl T- <-
BdlAI 'SS9J1S enji
oin
00
d
o o o oin o in oOJ CM -r- T-
BdlAI 'SS9JJS 9nji
BdlAI 'SS9J1S 9nji
CD cO
U) ^
CD
8k_
aQ
CM 1
d
oo X
(U
c«
>CACo5
o<L>
a.
13
ooo Eo
o
CD c (L>
o2 (ii
V) rn
0)m
^ =3 2i
o 1- 3
b
BdlAI SS9J1S 9nji
64
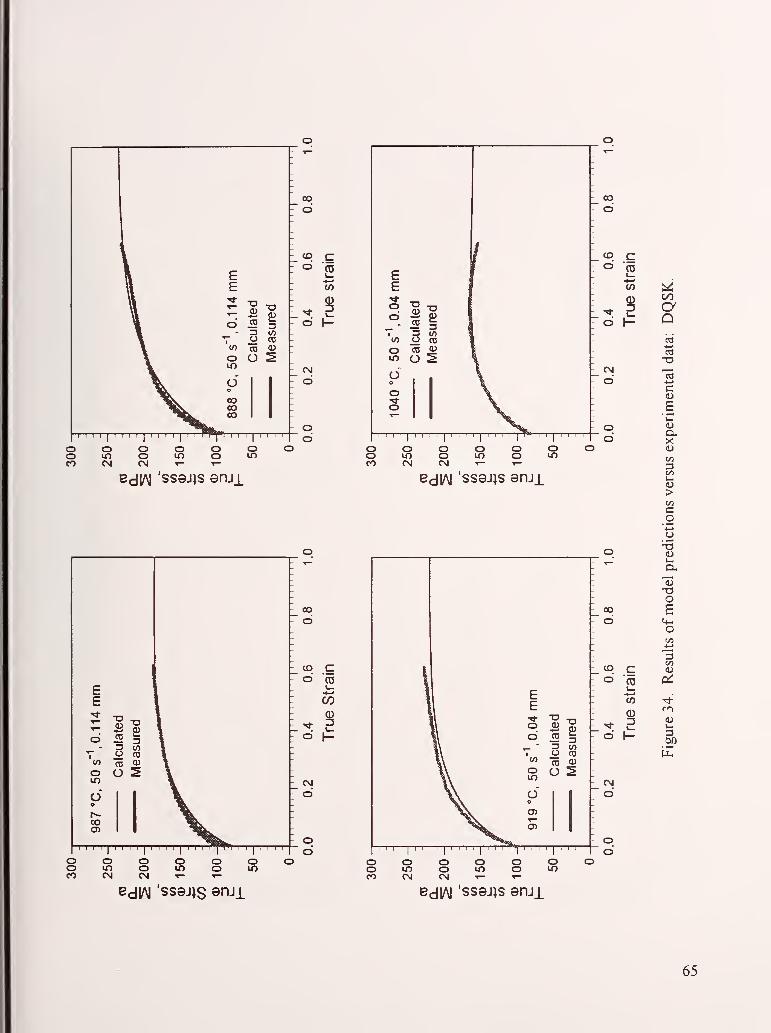
oo
o
':
E 1
-
E '-
"\0.04ulated
sured
-
w o cc 1 -
o ro 0^ 1 _
in O ^ \ 2
O i —o \
~
o » -
Tj- ^L -
o TL"*"
x. :
00
d
o o o o o oo m o in o inCO <N eg T—
o o o o o oo IT) o in o inCO CN CM T— T—
BdlAI SS9J1S enji BdlAI 'SS9JIS enji
;3;T30)
T3
3o TO" 3 V)O m
</>(Tl 0)
o () ^U)
I I I II
I I I I
CD cO CD
CO i^
CD
8K
aQ
CNj"eS
cJC
E
q 0)Cl.d
3
>
c
oo -s
a-
oCO Eo
o4-'
C/5CD c (U
o 03
•4—'
oi
w ^"
CDf<^
"*
o 1- 300
CN
O
o o o o o oo in o in o inCO CNI CM T— t—
Bdl/\| 'SS9J1S snji BdlAI 'SS9J1S 9nji
65

o o o o o oo in o m o mCO CM CM T— T—
BdlAI SS9JIS 9nji BdlAI ssQj^s enji
>400aQd
c
S
o.x<u
(A3Mh«0)>
cO
EEoo1^o
T30)
3o CO' 3 (/)O CO
(0CO Q)
o () >U)
CO- d
Oo
inCJ>
en
I I I I I II
I I I I II I I I
o (0
o H
CN4
OCD
rg CM T- T-
o o o o o oo in o in o inCO eg CM T- «-
BdlAI 'SS94S enji
Os
oen
CO
iri
300
66

c(0
CO
0)
aQ
-o
•4—'
c
£
o-
<u
31/3
k.
>1/1
coo
O
31/5
300
Bdl/\| 'SS9J)S 9nji
67

-
—
0) -
/-
f o1 E -
1 ^ -
1 (0 -
1 ^on
-_
I E -
1 COa
T3-
1 ° a>
1 o m 3 -
X =j (0» *~ o CO -
* '</) TO 0)-
1 <=> O :^ -
\ "^ .
* —
\ ^ -
^
^k- o -
^fe_ o _
^feo» °^I
1
oo
d
(O co (0
k_4—
f
tf)
-*
o 1-
o
oo"
o o o o o oo in o m o mCO CN CNJ T—
o
00
o
BdlAI SS9J1S enji BdlAI 'ssejjs 9nji
oo
d
i_
00
0)
o I-
C\J
o
od
<D cO (0
>1
''t 1_
<C/5o 1-
CNJ -oO "(3
q 4>cJ a,
X<u
>CM
Jo -o
(L>
O.
-aen od
o
CD c 3o (0
I—4-'
^
-t (U
o 1- 300
c O o o o'
' 1
oo in o in o inpT CNJ eg T—
CNJ
d
od
BdlAI 'ss9Jis enji Bdl/\l 'ssejjs 9nji
68

EE
CM
Q SS.
WCO <u
O 5V o COV)
CM
o"o
OoCM
-m—I II
I
00
o
o CO
o I-
CM
d
o o o oo in o mCM T—
Bdl/M 'SS9JJS enji
o o o Oo lO o UOCM ^p- ^r-
BdlAI 'SS9JIS snji
X)2<
+-»
COT3
154-J
c<u
E
(L>
O.XlU
C/3
3CM
>C/5
co
oE
o
3c/i
ooCO
300
o O o oo m o mCM T— T—
Bdl/M 'SS9JIS enji BdlAI 'SS9J1S 9nji
69

o o o o o oo m o U1 o inCO CM C\J
o o o o o oo IT) o in o inCO CNJ CNj
BdlAI SS9JiS 9nji BdlAI 'ss9J)s enji
<:
00
X'ei*->
«JT3
15
C(U
B
x:9i
CA3VIb«0)>
Co
o o o o o oo m o in o inCO (N (N T— T—
-a(L>
o£
o
(O c 3o (0
C/3
4—
«
ffj(/>
o5I—
On
2i300
BdlAJ 'SS9J1S 9nj_|_ BdlAI SS9J1S 9njj_
70

CM CNJ 1- T-
Bdl/\| 'SS9JJS snji
ooCO
00
o
o
o
CM
C5
c
BdlAI 'SS9JJS enji
JO
I
<C/D
X4—
'
a
4-.»
c
E
a.X(U
3COv>
>
Coo•5
0)
oS
o
3
O
300
o o o O o oo «r) o m o inCO CM CM T—
Bdl/\| SS9JiS 9nji BdlAI 'SS9J1S 9nji
71
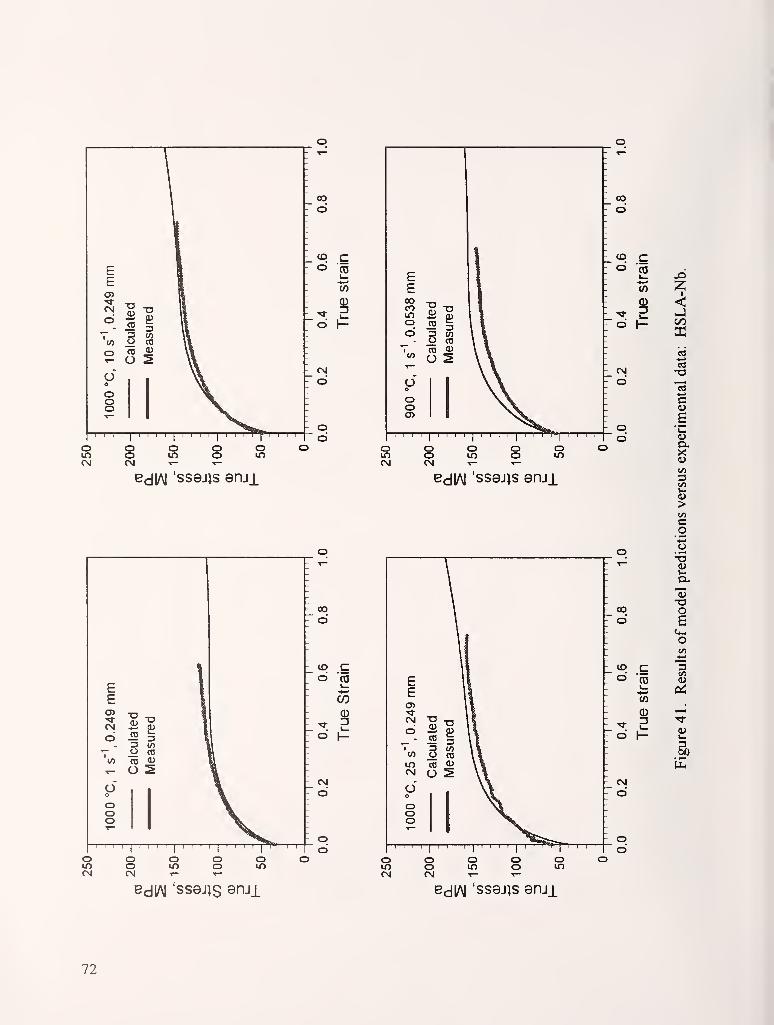
oo
o
o o o o om o to o inCM CNJ
o o o o oin o IT) o inCM CNJ T— T—
BdlAI 'ss9j;s 9nji BdlAI SS9J1S enji
(O co CO
k_ -d•4-1
^-* 8 <o \-
15CM T3o "3
o k-o1
>
co
(3 '"3
"53
OO oo B
o
(O c 3o ro (U
l_ffi
</)
(D^-
-* I-o H
3«50
- CM
O
OO
o o o o oin o in o inCM CM T— 1—
(Xh
BdlAI SS9JJS 9nji BdlAI SS9JJS 9nji
72

'
\
EE
1.
10s"\
0.0538
CalculatedMeasured
1
-
d \-
Ooo :
oo
o
o
o
d
oo
cCO
in
o o o o o oo in o in o inCO (N eg •»— —
BdlAI 'ss9J)s enji BdJAI 'SS9J1S enJi
I
<
4-J
*-•
C
£(Ua,X
3Ui
>CAco
ooCO
oq- d
CO co CD
I—-•-»
CO
oTf
o H
rg
d
00
d
CM
d
T3OE
o
(O c 3o (0 (U
OiW)
(D (N
* =3
d 1— u.
3GO
BdlAI 'SS9J1S Qi^Jl BdlAI 'SS9J1S 9nji
73

to cEE
o*-*(0 CO
CO0) in
d3 o
d
c3 O o o1 1
11 1
o'
' 1
oo in o m o inc> CM CM T—
in
oo
1|O CO
CO <u
CM Od
00
d
dc(0l_
(/)
D
o o o o o oo in o in o inCO CM CM T— T-
BdlAI 'SS9J1S 9nji BdlAI ssejjs enji
<Jon
cd
-o
c0)
B'C(L>
O.Xa>
CA3
>
o
c
O)0)3
c3
''
1' '
o' '
1'
'
o' '
1'
'
o' '
1'
'
o' '
1
oo m o in o inc•> CM CM T—
\
1
-
EE
-
10
s"\
0.0538
CalculatedMeasured
I
'-
do \
-
Oo \ :
"*" \^ ;
1111,1
00
d
to c
(O
d H
CM
d
od
o o o o o oo m o in o inCO CM CM T— T-
4>
OS
O
3
-^
300
BdlAI 'SS9JIS enji BdlAI 'SS9JIS 9nji
74

oo
o
Bdl/\| SS9J1S 9nji
O O O O '
IT) O lO O I
CM CNJ «- T-
BdlAI 'SS9J1S ami
EEin
ooI
CM
Oo
3 COO CO
CD <ii
CO co (D .
I— x>(/> ^
•^ 8o 1-
1?1CM -oO {3
sO u.
O
>CACo
CJ -3
ex
13
00 oo B
o(A4-'
CD c 3O (D
C/5
L_ WiV)
* 8I—
O 1-30/)
Uh
CM
O
o O o o o oO in o in o mCO CM CM T— T—
BdlAI 'ss9JiS 9nji BdlAI SS9J1S 9njj_
75
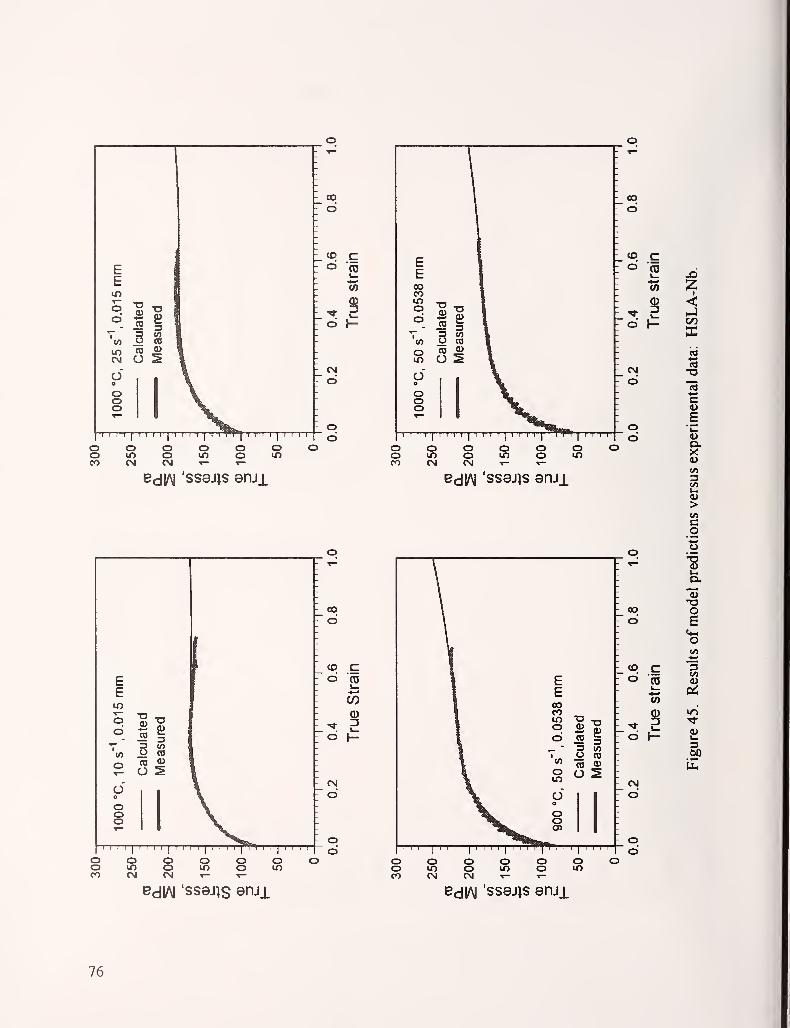
00
o
o o o o o oo m o lO o lOCO <N CNJ
o o o o o oo m o m o If)
CO CNJ CM
BdlAI 'SS9JIS ami BdlAI SS9JJS enji
EEIf)
ooI
U)
o
do
ooo
SiO CD
CO 0)
O 5
ooCO
'
I
'
' ' '
I
'
' ' '
I
'
o o om o u)CM C>4 T-
00
o
CD (0
CO
0)
-r E
CM
d
oCD
O
(O co (0
k_ x>(0 iz;
-* B ^o H C/3
1CM -oo
0)
£o k«
o 0)a.X0)
i>CA
p'"B
2i
T300 Oo s
CO c 3o m
C/)
L_ oi(0
-"I- I-
IT)
o 1-300
CM
CD
OCD
o o O O o oo If) O If) o If)
CO CM CM ^— »—
Bdl/\| 'SS9JIS 9nji BdlAI 'SS9J1S 9nji
76

•o
B3O
o
T3
30}0)
- 00
o
111111111
oin
(O co (0
l_
w
* 5o H
- CM
d
od
BdlAI 'SS9J)S 9nji
Xi
or)
K03(->
-a
4—
>
cdi
B
a.X(U
O)3t/3V-i
>
Co
h CO
d
CM
d
o o O O o oo UO O m o mCO CM CM T—
(L>
Oe
O
(O c 3o "ro
i- Oi<n
VO
d3
300
BdlAI 'ss9j;s 9nji BdlAI 'ssejjs enji
77

c
o o o o o oo in o in o IDCO rg CNJ T—
BdlAI 'SS9JIS enji BdlAI 'SS9J1S emi
oI
<
X
e
x(L>
CO
3COu>co
\
^-^
'_
a> _o -
o -
E -
£i -
Z -
<: -
—1F (/)
-
E ^ :
CO ? T3-
o ^ ^ —
o i5 =33 (/)
-
^_ O TOI
'«O 2
I\
d 1 \ -
o \o \ -
m \l _
o>
>-r \
1
CO
d
(O co ra
I—^^CO
0)
"to \-
d
od
o o o o o oo m o lO o inCO CM CNJ T— T—
(U
o
•ooe
3CA
Pi.
a>
300
BdlAI 'ssejjs 9nji BdlAI 'SS9JJS 9nji
78

1
"
o —"2 ' _
o -
E I
ID .
z -
< —_J -
(0 ;
E £ ;
.04
mated r
° 5 ^ \-_
'^-Sl \ -
^ \ -
\ —o \ -
o V _
O V -
O V. _
O) %^ -
"^^^^S***-^-
1 < 1 1
,
00
d
(O co (0
l_^^(0
*o H
oo
EE00o
in
do
OO
T3OEr>Z<_jCO
O CO
TO 0^
O 2
I I I II
I I I I
o o o o o oo in o in o inCO CM eg T—
o o o o o oo in o in o mCO eg rg T— T—
00
o
BdlAI 'SS9JJS enji BdlAI 'ssejjs enji
-o
S
a,X(U
CO
3COk_D>
Co
T3(L>
OoCO
o
I
oB
o
3
00
0)
300
o o o o o oo in o in o inCO CJ rg T" ^—
BdlAI 'SS9J1S 9nji BdlAI SS9J1S 9nji
79

Soaking: 5 "C/s to 1200 °C hold 15 min; strain rate=1/s; strain=1, 0.36, 0.51. 0.41, 0.33. 0.30, 0.25, 0.10;
inlerpass time=10, 8.0, 4.8, 3.2. 2.3. 1.7. 1.3 s; target lemperature=1100. 1041. 979. 955, 934, 919, 908, 898 'C.
160
CO
Q.
UiCOd)
CO
0)
CO>
orliJ
140
120 -
100 -
Equivalent Strain
Figure 49. Torsion test results which show similar flow behavior
between the Nb-rich IF steel and the HSLA-Nb grades.
80

-
(U—
a "
o ,
E -
nZ -
< --1 _
w -
E £ -
^ ^ ^ I
? ^ i 1-
°- 3 J8 \:
^«SI \ \
'^ \ .
o \~
o Vo v -
lO Vo> ^^ -
^^•*-— -
1 1 1 1 1 1 1 1 1 1 1 1 1 1 1 1 T 1 1
CO
o
<q co (0
0)
d H
CM
o"
Od
oo o om o oin
oo o
Bdl/\| 'SSQJJS 9nj_L Bdl/M 'SS9J1S 9nJl
EE
o
in
o"o
oin
0)
OE
(0
o re
re <u
O S
I
II I I I
II I I I
II I
oo (U
oc/i
&c
dc(0
0) f<D
'^
o H, ,
ee«-•
ca>
CNJ Eo
o 3d 2>
co5-5
2^a.
o VT3Os
oo ^o <
(O
dc IS
I— o£
0) c+i
do
3
CNJ
o O
3)o Mld
BcJ|/\| 'SS9JIS 9nji
o o o o o oo in o in o inCO csj eg T- «-
Bdl/\| 'SS9JJS 9nJl
81

CM
d
w -s;
" i7? ««O CC
dTO <D
OO
T—I—r—
r
CO
d
OD cO OJ
l_
(/)
a)
* I—o 1-
CNJ
d
o o o oo in o ineg T— T—
BdlAI SS9J1S enji
oo
d
BdlAI SS94S enji
EECM
d
tn
inCM O
§1O CD
CD QJ
ooCM
OOCM
Oin
CO c JOo CD
l-
w H
d8
ooo
<
KCM c3
O 13
4-1
cO a>
O J
CA
>
CO o
-5
OO"oSd
iCmO
(O c c/)o (0!->
1_ 3^^ Ol(/) (U
0) fti
-t ZJ
o h-
CM
d
od
BdlAJ SS9J1S emi BdlAI SS9J1S 9nji
82

00
o
CO cO CD
*->
o H
CM
d
oo
ooCM
oo
o
<D cO TO
L-
w
«« 5O H
CNJ
d
Bdl/\l 'SS9J1S enji BdlAI SS9JJS enji
EE(Nl
d
Oo
Ooo
ooeg
oo
d
(D co CO
"to
0)
o I-
cg
d
od
J3
o00
I
<
CO
cID
.1
o.
V
3
>
co
T3
o
o
3(U
300
BdlAI 'SS9JJS snjx BdlAI 'SS9JJS ami
83

EECM
O
oo
oo
c3
. .
,, ,
o o o'
'
1
'
'
o' '
1
oo m o to o IDpt CM CM T—
00
o
(D cO (0
i_
0)
"t
O H
CM
h O
Oo
ooCO
oo
d
O (0
o h-
CMCD
Oc=>
BdlAI 'ss9Jis enjiCM CM T- T-
BdlAI 'SS9J]S 9nji
EECNJ
d
V)
IDCM
do
ooo
1- oo
d
' ' '
I' ' ' '
I' ' ' '
I' ' ' '
I
o o o o o oo to o IT) o inCO CM CM T- T-
Bdl/\| 'SS9J1S Sf^Jl
dc(0
CO
d
CM
o
od
oo
d
w
o H
CM
d
od
o o o o o oo m o lO o mCO CM CM T— T—
o00
I
<
DC
«j^
c
s
a.X0)
>
co
k«o.
T3O
O
3CO
300
BdlAI 'SS9J1S 9nji
84

EE
oo 2 5T O CD
»o O 5
ooCM
oo O
oo
o
to cO (0
(O
8o H
CM- o
oo
Bdl/\| 'SS9J1S 9nji
oo
o
Bdl/M SS9J)S 9nji
Bdl/\| 'SS9J1$ 9nji
(O c X)o 'ro
/iL_
e
o8I—1-
o00
1
<
tn
CM «j
O
1o Oo £
i>
co o
o
1el-
00'sdoE
t+-l
oto c t/)o (0
»^
l_ 3-< iy5M <u
d
300
CM Uho
oo
Bdl/M SS9JIS 9nji
85

oo04
O CD
I" O 2
00
d
- to c- O CD
k_^^- (/)
•D
BCO
a—s
- o 1^
O
OO
BdlAI 'SS9JJS enji BdlAI SS9JIS enji
1
ooo
U)
do
oo
Si
CD OJ
O 2
ooCM
om
oo
C3
to cO (0
o h-
d
od
cCO
0)3
o00
I
<
'c64->
T3"3+->
C(U
e
(XXCA3(A
>CAco
•T3
T3O£
o
3
3£30
BdlAI SS9J1S 9nji BdlAI 'SS9J1S 9nji
86
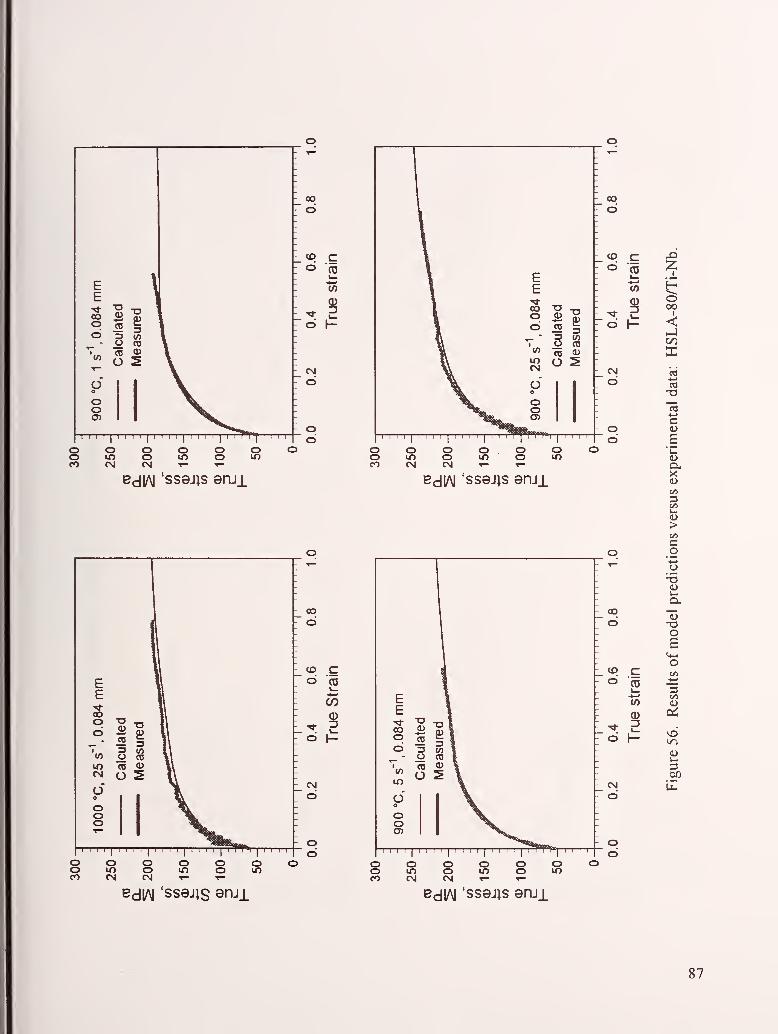
EE
od
T3
BCO
3
T3
- O (0
',« CQ (D
o
oo
oo
ooCO
omCV4
00
d
(D cO ra
I—
tn
->* 8O 1-
d
- od
o
BdlAI 'ss9j;s enji
00
d
(O c X)o CO
'^u.
w H0) o
d31-
oo
<
d
od
BdlAI ssejjs ami
':
E
'l
-_
E « I
s jl j
od
aBCO 3 i\
r1 _ 3 (/) l\
-
(/5 O TO \\-
to TO 0) \\ -
CM o 5 l\"
O \ _o ^\o 1^ -
o l^k ~
o iHk. _^^|%_ i
1 J 1 1
1
'
-r
oo
d
d (0I—
CO
CNJ
d
odo o o o o oo m o vn o in
CO eg CM
o o o o o oo in o in o inCO CM CM »— »—
X
c3
-o
4->
c
£
(U
X<u
C/5
3(/5U.
>
Co
T3
"OoB
<+-
oCO•4—
»
3C/5
(Uu.
300
BdlAI 'SS9J1S 9nji BdlAI 'SS9J1S enji
87
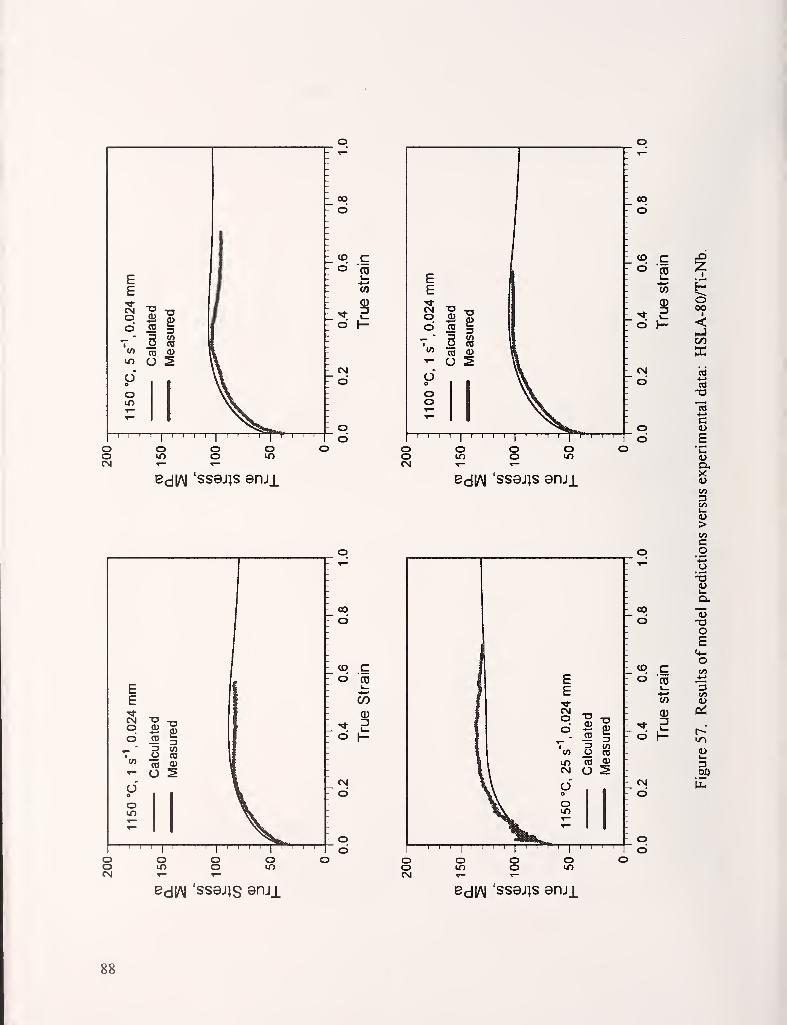
Bdl/M 'SS9JJS 9nji
00
d
(O c X)o (D
:z:
1—
e
d5K
o00
<
d
od
BdlAI SS9J1S enji
EE«*CMO
oo
oin
B 23 COo m03 <U
O 2
-I—I—I—I—r~i—I""!"
oo
d
CD Cd 03
CO
Q)
eg
d
od -I—I—I—I I I I—I—
r
EE
CMOdI
V)
inCNJ od
Si
CO Oi
oin
T—T—I—I
—
r—r
OO
d
CO
d
d
CM
d
od
g
to
u
o o o o oo m o inOJ -I- T-
o o o oo in o inCM -r- T-
DC
-o
>
co
T3
(L>
oa
«+-
o
3C/5
BdlAI SS9J1S 9njx
88
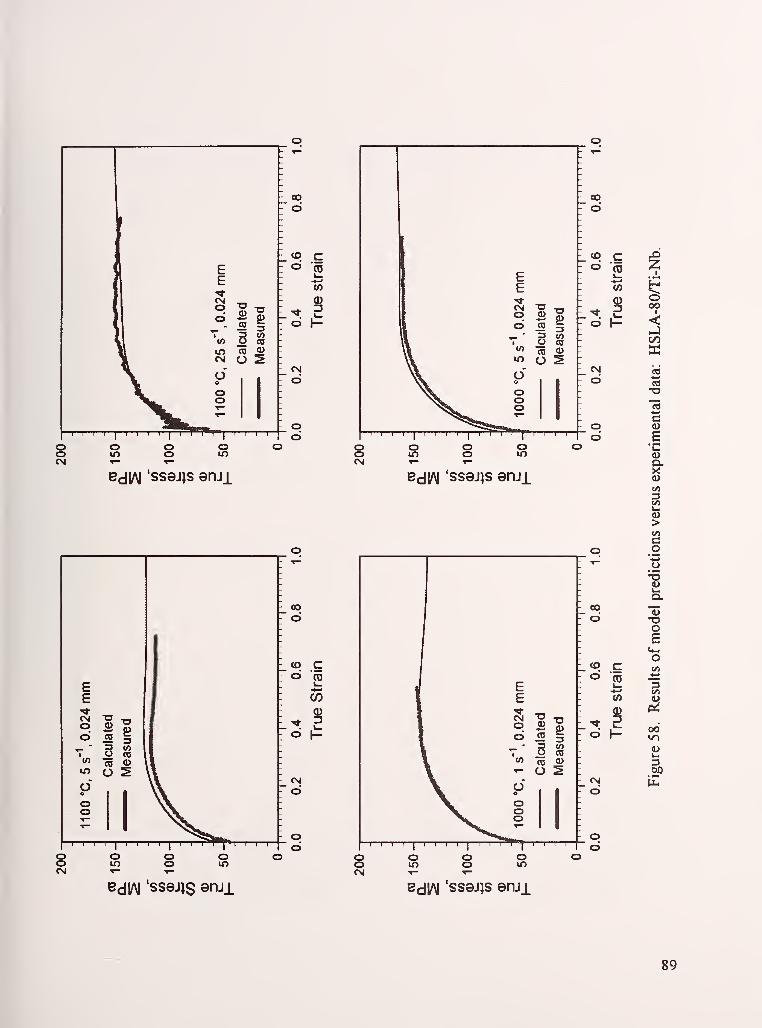
Bdl/\| 'SS9J1S ami BdlAI 'ssejjs enji
o00
I
<C/3
XCO
B'C
a.X4>
en
>
co
o
o
31/5
00
3
Bdl/\| 'ss9J)S ©nji Bdl/\| 'SS9JiS 9nji
89

c2if)
r 00
d
(O c ^o (D ^
V-
(0 H
d
o00
o o o o o oo in o m o inCO CM CM T— •»—
c3
'' 1 '
'
o' '
1'
'
o' '
1' '
o o' '
1
oo in o m o inc"i CM CM
CMd
od
Bdl/\| 'SS9JIS enji Bdl/\| 'SS9JJS QDJl
00
o o o o o oo in o in o mCO CM CM T" T—
C/5
a.
>
co
•T3
. (Uo
io
(O c C/)o (04->
I.. 3^^ C/3
(0 OJ
d5l_ ON
CM tin
o
BdlAI 'SS9J1S enji Bdl/\| 'SS9JJS ami
90
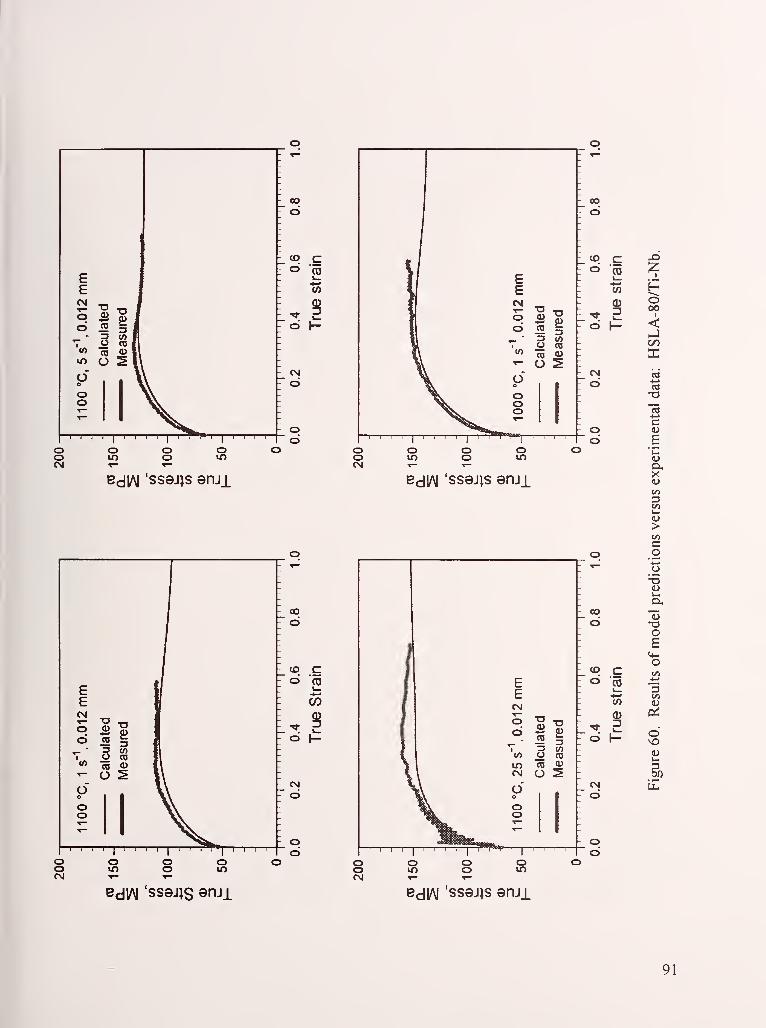
ooCM
OO
O
(OO
c(0
w(D
CM
O
OO
Bdl/\| 'SS9J1S 9nJl BdlAI SS9J1S ami
1
1E
:
J E -
( CM-
1' O
d ulatedsured r
(/) O CD -
\ in TO QJ-
a \ ^ O 2 -
W O —%\ o "
^^ o -
^TOk o -
*TOtt ^~
llfeasu^ ^ \
"^
Ti-
es
CM
O
c
0)
ooCM
OlO
OO Oin
X);z;
o00
I
<
DC
S<u
xCA3u>
£3O
T3oE
o
3
O<a
3ap
Bdl/\| 'SS9J)S 9nji BdlAI SS9JJS 9nji
91
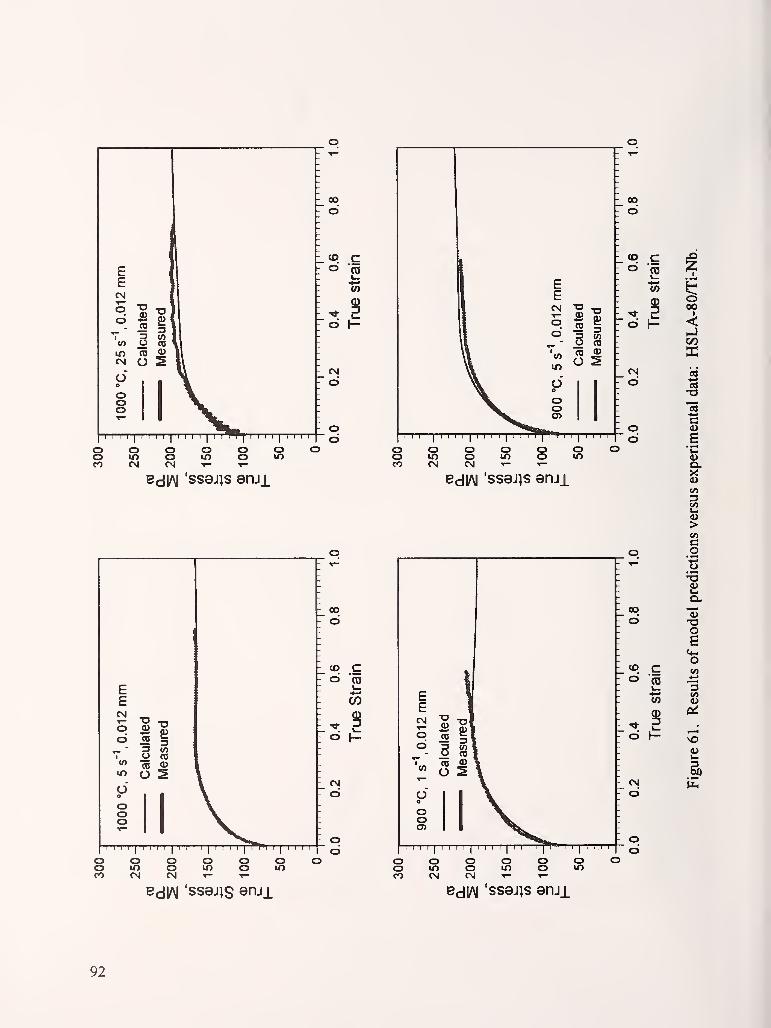
111111111
00
d
to co (0
u.
ui
-* 8o h-
CM
d
o o o O o oo If) o in o mCO CM CM T—
oo
d
o o o o o oo icy o in o mCO CM CM
Bdl/M 'SS8J1S ami BdlAI 'SS9JJS ami
EECM
odI
CO
U)
do
ooo
i5 iO to
O S
ooCO
oin
oo
00
d
CO co CD
L_-•-'
CO
^ 8o 1-
CM
O
(O c ^o (0L_
w ^
d H
o00
<
CM cd
o
o 9i
o B
CO
1>c«C
o ot3
100
"oSdo
(4-1
o(O c c/)o (0
->
k. 3^^ C/)w (L>
Tj-
Oi
o H
CM Ph
- o
CM CM T- T-
Bdl/\J 'ss9J)S snji
o o o o o oo m o lO o inCO CM CM »— ^r-
BdlAI ssajjs ami
92
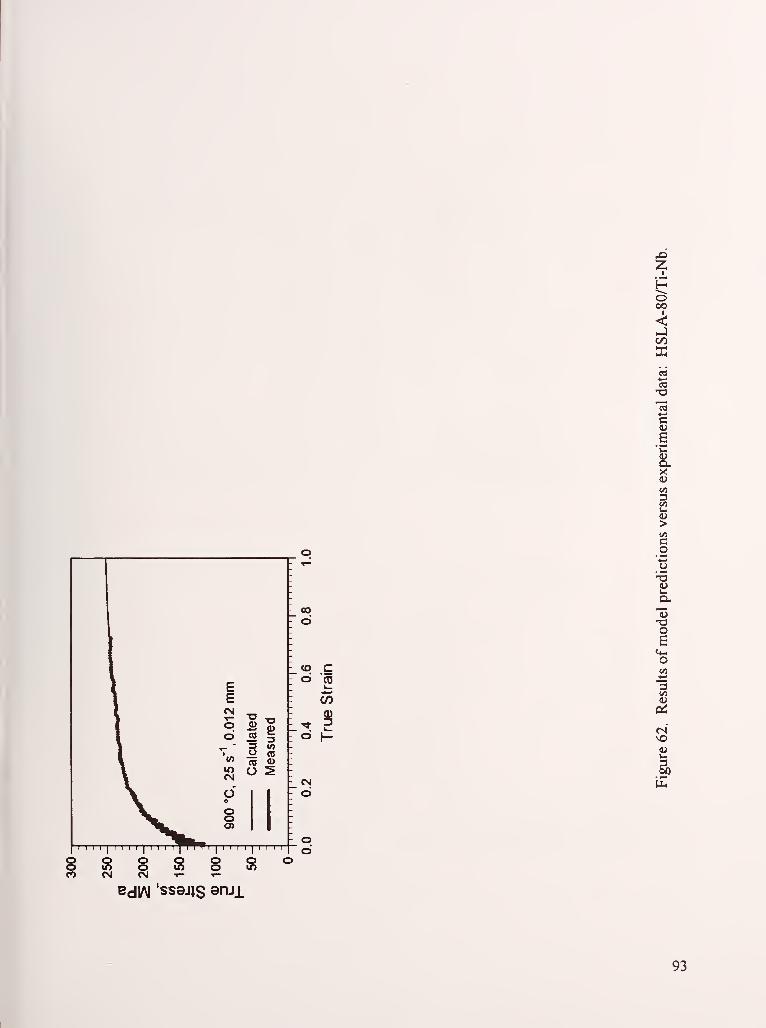
c(D
CO
o00
Xei
*c
o.X
>CAco
<1>
T3O
(4-1
o
Bdl/\| 'ss9j;s 9nji
93

D0)i_
WCO0)
cCD
-4-'
wJ*:
ro0)
Q-
(p9lB|n0|B0) UjBJJS >|B9d
o o o o o o(p9)B|nO|BO) UjBJlS >1B9d
o o°
OQ
O O
I
o o o o o o(p9|B|n0|B0) UjBJJS >|B9d
I I I
I
I I I I
I
I I I I
I
I I I I
I
I I I I
I
I I I I
CO m •^ CO CN4 T- (
o o o o o o(p91B|n0|B0) UjBJ^S >|B9d
(L>
T3O£
(O ^oJ2
in
d D0) oD O-
<i- «)
o0)
ECO ^--^^
,
o cCD
eg(/) Id
oCD o.
.,_ (D Xd CL
o>
c_o
o-5
a,
i(D cO o
1in ^ .—d
(xiL_ •4^
D crt
d CD(D (U
F l->
CO oo c e
CD KJc:
CM *—
'
>>d (/) 13^ Cm
CD O,^_ Crt
d Q_CO
omvo
t>0
94

- o
in oo2
Ti- tfi
d (00)
ECO
o ci3
CO zw bJ^ o(D ^v
.,_ <D <d CL _l
II I I I
I
I I I I
I
I I I I
I
I I I I
I
I I I I
I
I I I I
(O m -^ CO eg T- od d d d d d
(p91B|n0|B0) UIBJJS >)e9d
oQD O
(O mI I I
I
I I I I
I
I I I I
I
I I I
CO CM f-
(p91B|n0|B0) UjBJlS >lB9d
JSueaokri
o.o.BJ
baa>4^a>
sed
<o Ua
o a,c
%T\^i*^ o
d Do
D ^^ (/) od CO
a)DC
1
F (U
CO cd c Neg c3
o «Jj<: T3CD
d0)
CL
so u.
a,X4)
c/)
(-1
0)>
C.2'«->
CO tz
o13
in ^ Od 0) dD c
«t (O od t3
E .—CO —
cjo c -4—*
C/5
2:^
egW)
od ^ v«
CD o.,_ (D
d Q-
(p9;B|no|Bo) u!Bj;s >iB9d
'"i- CO eg 1- od d d c6
(p9)B|n0|B0) UjBJJS >1B9d3
95

300
250 H
£200
2 100
50-
900 °C. 1 s-"", 0.015 mm
Case 1
Case 2
0.0
-I—I—I r
0.2 0.4 0.6
True strain
I I I II
I I I I
0.8 1.0
Figure 65. Effect of prior heat treatment on flow behavior: HSLA-Nb. There is no
discernible differences in the flow behavior below strain of 0.4 between the two cases.
Above 0.4, the behavior of Case 2 shows dynamic recrystallization while Case 1 shows
continuous hardening. Case 1 : with prior heat treatment; Case 2: without prior heat
treatment.
300
250-
900 X, 25 s-'', 0.015 mmCase 2
50-
0.0 0.2 0.4 0.6
True strain
0.8 1.0
Figure 66. Effect of prior heat treatment on flow behavior: HSLA-Nb. The differences
in the two cases are within the scattering band of experimental data. Case 1 : with prior
heat treatment; Case 2: without prior heat treatment.
96
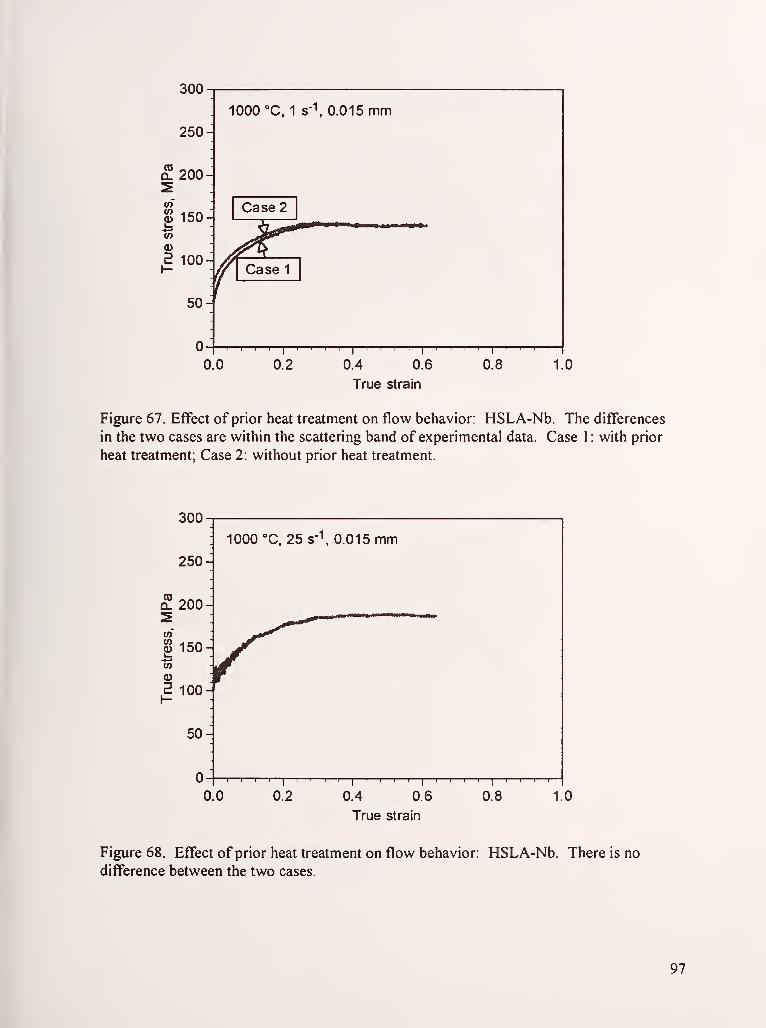
ouu--
1000 °C, 1 s-l, 0.015 mm250-
2 200-
^ 150-Case 2
str ^^'^0)
2 100- Af^f Case 1
50-1
0-
0.0 0.2 0.4 0.6
True strain
0.8 1.0
Figure 67. Effect of prior heat treatment on flow behavior: HSLA-Nb. The differences
in the two cases are within the scattering band of experimental data. Case 1 : with prior
heat treatment; Case 2: without prior heat treatment.
300
250-1
; 1000 °C, 25 s-'', 0.015 mm
2 200H
S 150H
50-
I I I I
0.0 0.2
T 1I
I I 1 II
I I I II
I I I I
0.4 0.6
True strain
0.8 1.0
Figure 68. Effect of prior heat treatment on flow behavior; HSLA-Nb. There is no
difference between the two cases.
97

(0Q-
w(U
w
:3
200-
IIOOX. 25s'\ 0.1 mm
Experimental data
150-
^^^...^.^===1=—
100-/^ Model predictions
50-
0-
f0.0 0.1 0.2 0.3 0.4 0.5 0.6 0.7 0.8 0.9 1.0
True strain
Figure 69. Effect of reheating temperature on flow behavior: HSLA-80. The differences
between the experimental data and model predictions are insignificant.
250
200-
(0Q_
150-M
a?
CO
0)13
-1
1000 "C, 25 s", 0.1 mm
Experimental data
Model predictions
100
50-
I1
1 I I I I I I I 1 1I
I I I1
1 I I I I
I
I I I1
1 I I I1
1 I I I I
I
I I I I
I
1 1 I
0.0 0.1 0.2 0.3 0.4 0.5 0.6 0.7 0.8 0.9 1.0
True strain
Figure 70. Effect of reheating temperature on flow behavior: HSLA-80. There is no
significant difference between the experimental data and model predictions.
98

250
200
(0CL
150
V)
(D3100-
1200X, 25s-\0.3mm
Model predictions
Experimental data
I 1 1
I
I I 1 1
I
1 1 I
11 I 1 1 I
1
1 I 1 1
I
I I I
11 I I I I
I
I 1
1
I
I
I I II
I
1 1 I
0.0 0.1 0.2 0.3 0.4 0.5 0.6 0.7 0.8 0.9 1.0
True strain
Figure 71. Effect of reheating temperature on flow behavior: HSLA-80. Experimental
data are about 9 % lower than the model predictions.
250
200-
(0Q.
150toto(Ut_
w0)3
100-
1000 °C, 25 s-''. 0.3 mm
Model predictions
Experimental data
I 1 1 1 I I I
II { I
11 I I
I '
' ' '
I
'
'
' '
I' ' ' '
I
' ' ' 'I
0.0 0.1 0.2 0.3 0.4 0.5 0.6 0.7 0.8 0.9 1.0
True strain
Figure 72. Effect of reheating temperature on flow behavior: HSLA-80. Experimental
data are about 9 % lower than the model predictions.
99

\-
co•^
Q.-0
-
O -
r1
Cr
8 xiT
*-*
"55
-
''
1
1 1 1
' 1
'
1 1 1
,< <
.
'T '
CO
d
d
od
o o o O o oo in o If) o mCO CM (N T— T—
o o o o o oo ifi o in o inCO eg (N T— T—
Bdl/M SS9JIS enji Bdl/\| ssejis enji
\-
\ </)-
\ c _
\ o -
1 '-t—
'
\o _
\^ ^~
\/v- ' ^1 * CL _
^.^ \ > _
^ri\
-
D "CSli oCM Ij ^ —
L\;
•
':
\ -_
CO x: rk-
0) .^ ^?Cs. -
tf) w Xv ~
5*" x_ :
-
' 1
'
1
1
1
1
1 1 1
oc
*—« <—
•
.22 -S"
2 e
•— 4) C(0 C 3
*^ « .2
-2 ^c o
•^ O
^ o
^ .2O T3O D
00 ^c *-
•— oc «« a>
o 2^ a-
.s ««
1-4 t/i
00
d
d
o o o o o oo in o in o inCO CN CM T- -1—
Bdl/\J 'SS9J1S ami BdlAI 'SS9J1S ami
(L>
C -' <->•— c •—(0 (U -C
To .i ^
d h-
CM
d
od
Xd)
00c
_2>
3O
30)
coXJ(UCOc<3
X)
"ST3OS
co
O)
CO •+S>- ft*«J
3 52 ,0• — o 1>
100

300
: 878°C, 146s'\0.04mm
250-
(?200
.2 100
50-
INIST's model predictions
- CANMETs data
0.2
1
0.4 0.6
True strain
I I II
I I 1 1 1 1 I I 1 1 1 I 1
1
0.8 1
(a)
300- 986 X, 140.5 s-\ 0.114 mm
250
2 200
(A
$ 150
100-
50-
NIST's model predictions5==?^^
CANMET'sdata
I 1 1 1 1 I 1 1 1 1 1 1 1
1
1 1 1 I
0.2 0.4 0.6
True strain
0.8 1
(b)
Figure 74. Examples of comparison between CANMET's high strain-rate results and
NIST's model predictions: DQSK.
101

300
250
£^200
(A
0) 150i_
a>
.5 100
50
/
-^^^S^00""^ ^ ^^^ 4^
..^-' NISTs model predictions
•A/
•' - CANMET's data
H
>
880 °C, 140 s'\ 0.014 mm1
1 1 1 1 1 1 1 1 1 1 1 1 1 1 1 1 1 1 1 1
11 1 1 1 1 1 1 1 1
11 1 1 1 1 1 1 1
0.2 0.4 0.6
True strain
0.8
(a)
300
250
t^200
50-
992 °C, 134.6 s'V 0.25 mm
NIST's model predictions
CANMET's data
0.2 0.4 0.6
True strain
0.8
I I I I I I I—I I II I
(b)
Figure 75. Examples of comparison between CANMET's high strain-rate results and
NIST's model predictions: A36.
102

300
250
2 200
50-
997 °C, 96.1 s-"", 0.25 mm
NIST's model predictions
CANMETs data
I 1 1 I I I II
I I I I I I I I I I I II
I I I I I I I I I I I I I I I I I I I
0.2
1
0.4 0.6
True strain
0.8
Figure 76. Example of comparison between CANMET's high strain-rate results and
NIST's model predictions: A36. The agreement is poor.
300
250
1^200
v>
$ 150
N 1ST: 1 000 X, 50 s'"" , 0. 1 05 mmCANMET: 1017 °C, 46.5 s-\ 0.105 mm
NIST's data
CANMET's data
I I I I I I I
1
1 I
0.2
' '
I
' '
' I I I I I I
II I I I I I I I I
0.4 0.6
True strain
0.8
Figure 77. Example of comparison between CANMET's high strain-rate data and NIST's
data: A36. Neither set of data corrected for machine compliance. The agreement is fair.
103

owu
NIST: 1000 °C, 10 s-\ 0.114 mm250- CANMET: 985 °C, 9.5 s-\ 0.1 14 mm
2 200-CANMET's data
^ 150^- ^.«
jft"^^^^ A0)
2 100-NIST's data
/^
50- (Oh
0.2 0.4 0.6
True strain
0.8
(a)
300
250-
2 200H
$ 150-1
3 100
50
NIST: 1000 °C, 50 s-\ 0.114 mmCANMET: 987 X, 49.3 s-\ 0.1 14 mm
oi 1 1
11 1 1 1 1 1 1 1 1
11 1 1 1 1 1 1 1 1
11 1 1 1 1 1 1 1 1
11 1 1 1 1 1 1 1 1
1
r
0.2 0.4 0.6
True strain
0.8
(b)
Figure 78. Examples of comparison between CANMET's iiigh strain-rate data and
NIST's data: DQSK. Neither set of data corrected for machine compliance. The
agreement is fair.
104

200
150(0a.
^ 100 H
50-
1097 °C, 50.1 s-\0.25mm
No compliance correction
(CANMETdata)
Compliance corrected
(CANMETdata)
NISTs model predictions
I I I I
II I I I I I I I I
II I I I I I I I I
II I I I I I I I I
II I I I I I I I I
0.2 0.4 0.6
True strain
0.8
Figure 79. Comparison ofCANMET's data (A36) with NIST's model prediction.
Agreement is improved after correction for machine compliance.
4000
3500 H
3000
2500 -
(D
^ 2000 ^
1 1500-1
1ooo^
500Open symbol: predicted values
Solid symbol: measured values
-11 1 \ 1 \ 1 \ \ \ \ \ T"
1 2 3 4 5 6 7 8 9 10 11 12 13 14
Pass number
Figure 80. Results of roll-separating-force calculations. The agreement between the
measurements and predictions is very good.
105
U.S.GPO 19 9 9-0-773-022/40139


NIST Technical Publications
Periodical
Journal of Research of the National Institute of Standards and Technology—Reports NIST research
and development in those disciplines of the physical and engineering sciences in which the Institute is
active. These include physics, chemistry, engineering, mathematics, and computer sciences. Papers
cover a broad range of subjects, with major emphasis on measurement methodology and the basic
technology underlying standardization. Also included from time to time are survey articles on topics
closely related to the Institute's technical and scientific programs. Issued six times a year.
Nonperiodicals
Monographs—Major contributions to the technical literature on various subjects related to the Institute's
scientific and technical activities.
Handbooks—Recommended codes of engineering and industrial practice (including safety codes)
developed in cooperation with interested industries, professional organizations, and regulatory bodies.
Special Publications—Include proceedings of conferences sponsored by NIST, NIST annual reports, and
other special publications appropriate to this grouping such as wall charts, pocket cards, andbibliographies.
Applied Mathematics Series—Mathematical tables, manuals, and studies of special interest to physicists,
engineers, chemists, biologists, mathematicians, computer programmers, and others engaged in scientific
and technical work.
National Standard Reference Data Series—Provides quantitative data on the physical and chemical
properties of materials, compiled from the world's literature and critically evaluated. Developed under a
worldwide program coordinated by NIST under the authority of the National Standard Data Act (Public
Law 90-396). NOTE: The Journal of Physical and Chemical Reference Data (JPCRD) is published bi-
monthly for NIST by the American Chemical Society (ACS) and the American Institute of Physics (AIP).
Subscriptions, reprints, and supplements are available from ACS, 1155 Sixteenth St., NW, Washington,
DC 20056.
Building Science Series—Disseminates technical information developed at the Institute on building
materials, components, systems, and whole structures. The series presents research results, test
methods, and performance criteria related to the structural and environmental functions and the durability
and safety characteristics of building elements and systems.
Technical Notes—Studies or reports which are complete in themselves but restrictive in their treatment
of a subject. Analogous to monographs but not so comprehensive in scope or definitive in treatment of
the subject area. Often serve as a vehicle for final reports of work performed at NIST under the
sponsorship of other government agencies.
Voluntary Product Standards—Developed under procedures published by the Department of Commercein Part 10, Title 15, of the Code of Federal Regulations. The standards establish nationally recognized
requirements for products, and provide all concerned interests with a basis for common understanding of
the characteristics of the products. NIST administers this program in support of the efforts of private-
sector standardizing organizations.
Consumer Information Series—Practical information, based on NIST research and experience, covering
areas of interest to the consumer. Easily understandable language and illustrations provide useful
background knowledge for shopping in today's technological marketplace.
Order the above NIST publications from: Superintendent of Documents, Government Printing Office,
Washington, DC 20402.
Order the following NIST publications—FIPS and NISTIRs—from the National Technical Information
Service, Springfield. VA 22161.
Federal Information Processing Standards Publications (FIPS PUB)—Publications in this series
collectively constitute the Federal Information Processing Standards Register. The Register serves as the
official source of information in the Federal Government regarding standards issued by NIST pursuant to
the Federal Property and Administrative Services Act of 1949 as amended. Public Law 89-306 (79 Stat.
1127), and as implemented by Executive Order 11717 (38 FR 12315, dated May 11, 1973) and Part 6 of
Title 15 CFR (Code of Federal Regulations).
NIST Interagency Reports (NISTIR)—A special series of interim or final reports on work performed byNIST for outside sponsors (both government and non-government). In general, initial distribution is
handled by the sponsor; public distribution is by the National Technical Information Service, Springfield,
VA 22161, in paper copy or microfiche form.

U.S. Department of CommerceNational Institute of Standards and Technology325 BroadwayBoulder, Colorado 80303-3337
Official BusinessPenalty for Private Use, $300