Connections between wide-field monocular and binocular movement detectors in the brain of a hawk...
31
Z. vergl. Physiologic 75, 1--31 (1971) by Springer-Verlag 1971 Connections between Wide-field Monocular and Binocular Movement Detectors in the Brain of a Hawk Moth THOMAS COLLETT School of Biological Sciences, University of Sussex, Brighton, Sussex Received June 7, 1971 Summary. Recordings were made in the brain of Sphinx ligustri of pairs of directionally selective movement detectors, and the spike trains analysed with a computer for possible synaptic connections between two classes of movement detector. (1) Neurones with large binocular fields which arise in the mediM proto- cerebrum and project to the medulla or lobula of one optic lobe, or to the ventral nerve cord. (2) Movement detectors which project from the lobula complex of one optic lobe to the opposite medial protocerebrum. The majority of the second group had back-to-front preferred directions over the ipsilateral eye, and of these many were weakly sensitive to stimuli to the opposite eye. The ipsilaterM receptive field covered most of the eye. Optic lobe output cells with the appropriate preferred direction provide a powerful excitatory input to the binocular movement detectors centrifugal to the medulla. Each centrifugal movement detector probably receives excitatory inputs from no more than two optic lobe output cells with back-to-front preferred direction. The same set of optic lobe output neurones probably feeds several cells projecting to the medulla and lobula of both optic lobes, and, possibly, to the ventral nerve cord. Evidence was obtained that the optic lobe output cells themselves receive few excitatory inputs, and that therefore the receptive fields of their input cells are large. Two moving stimuli were presented in different areas of the receptive field. Movement through the null direction in one area inhibited the response to movement in the preferred direction in another area. This suppression was stronger in optic lobe output cells with front-to-back preferred direction than in units with back-to- front preferred direction. Thus the optic lobe output cells, or wide-field units feeding them, receive inhibitory inputs from wide-field units with the opposite preferred direction. Similar tests in which moving stimuli were presented to both eyes gave results indicating that the binocular centrifugal movement detectors may receive inhibitory inputs from movement detectors with back-to-front preferred direction. The possible functional significance of these inhibitory inputs is discussed. Introduction The most commonly recorded output neurones of the insect optic lobe are those with very large receptive fields. Because they may be so easily and thoroughly studied there have been a number of attempts to deduce local connectivity patterns within the optic lobe from the behaviour of wide-field movement detectors (Bishop, Keehn and McCann, 1968; 1 Z. vergl. Physiologie,Bd. 75
-
Upload
independent -
Category
Documents
-
view
1 -
download
0
Transcript of Connections between wide-field monocular and binocular movement detectors in the brain of a hawk...

Z. vergl. Physiologic 75, 1--31 (1971) �9 by Springer-Verlag 1971
Connections between Wide-field Monocular and Binocular Movement Detectors in the Brain of a Hawk Moth
THOMAS COLLETT
School of Biological Sciences, University of Sussex, Brighton, Sussex
Received June 7, 1971
Summary. Recordings were made in the brain of Sphinx ligustri of pairs of directionally selective movement detectors, and the spike trains analysed with a computer for possible synaptic connections between two classes of movement detector. (1) Neurones with large binocular fields which arise in the mediM proto- cerebrum and project to the medulla or lobula of one optic lobe, or to the ventral nerve cord. (2) Movement detectors which project from the lobula complex of one optic lobe to the opposite medial protocerebrum. The majority of the second group had back-to-front preferred directions over the ipsilateral eye, and of these many were weakly sensitive to stimuli to the opposite eye. The ipsilaterM receptive field covered most of the eye.
Optic lobe output cells with the appropriate preferred direction provide a powerful excitatory input to the binocular movement detectors centrifugal to the medulla. Each centrifugal movement detector probably receives excitatory inputs from no more than two optic lobe output cells with back-to-front preferred direction. The same set of optic lobe output neurones probably feeds several cells projecting to the medulla and lobula of both optic lobes, and, possibly, to the ventral nerve cord.
Evidence was obtained that the optic lobe output cells themselves receive few excitatory inputs, and that therefore the receptive fields of their input cells are large.
Two moving stimuli were presented in different areas of the receptive field. Movement through the null direction in one area inhibited the response to movement in the preferred direction in another area. This suppression was stronger in optic lobe output cells with front-to-back preferred direction than in units with back-to- front preferred direction. Thus the optic lobe output cells, or wide-field units feeding them, receive inhibitory inputs from wide-field units with the opposite preferred direction.
Similar tests in which moving stimuli were presented to both eyes gave results indicating that the binocular centrifugal movement detectors may receive inhibitory inputs from movement detectors with back-to-front preferred direction. The possible functional significance of these inhibitory inputs is discussed.
Introduction
The m o s t c o m m o n l y r eco rded o u t p u t neu rones of t h e insec t op t ic lobe are t hose w i t h v e r y large r e c e p t i v e fields. Because t h e y m a y be so eas i ly
a n d t h o r o u g h l y s t u d i e d t he r e h a v e been a n u m b e r of a t t e m p t s to deduce local c o n n e c t i v i t y p a t t e r n s w i t h i n t h e op t ic lobe f r o m t h e b e h a v i o u r of
wide- f ie ld m o v e m e n t de t ec to r s (Bishop, K e e h n a n d McCann , 1968;
1 Z. vergl. Physiologie, Bd. 75

2 Th. Collett:
MeCann and Dill, 1969). For the interpretation of such analyses and to learn more about the organisation of the optic lobe it would be helpful to know whether these cells are fed by many small-field neurones, or whether spatial summation is multi-layered, so tha t the output cells receive inputs from few neurones which themselves have relatively large receptive fields. However, there is little definite information about the input or output connections of any insect wide-field visual interneurones.
Neurones with large binocular receptive fields may be sampled in a var iety of sites in the brain and ventral nerve cord. In some moths, bin- ocularly sensitive, directionally selective movement detectors project from the medial protocerebrum centrifugally to the medulla of one optic lobe ; others project from the medial protoeerebrum to the ventral nerve cord (Collett, 1970). I t seems a likely hypothesis that large-field units projecting from the optic lobe provide the inputs for these binocular movement detectors. One might also suppose that binocular neurones with the same visual properties, but which project to different areas of the brain, receive common inputs. However, little is known about the synaptic interactions that occur between wide-field visual interneurones in the medial protoeerebrum.
This paper discusses the input connections of a small group of diree- tionally selective movement detectors which project from the lobula complex of the optic lobe to the medial protocerebrum, and the eonnec- tions these neurones make with binocular neurones which originate in the medial protoeerebrum. The evidence for synaptie connections was obtained by statistical analysis of impulse trains from pairs of neurones recorded simultaneously. A special purpose computer was used to show whether the firing of one neurone was associated with an enhanced or diminished probabili ty of firing of the second neurone. Experiments of this kind do not supply conclusive evidence of particular synaptie connections. Nevertheless, they are a useful adjunct to more direct methods employing intraeellular stimulation and recording, as studies on insect flight have so elegantly demonstrated (Waldron and Wilson, 1969; Wilson, 1966; Wyman, 1966, 1969). The advantages and pitfalls of these methods are considered in detail in papers by Moore, Perkel, Segundo and their co-workers (Moore et al., 1966, 1970; Perkel et al., 1967).
The approach is only feasible if there are few large-field neurones sensitive to the same stimuli; there is then a good chance that units with related properties are synaptically linked.
Materials and Methods
Experiments were performed on unanaesthetised adult Sphinx ligustri L. prepared essentially as described earlier (Collett, 1970); in most experiments the thoracic nervous system was excised to minimise movement.

Connections between Insect Visual Neurones
(A) I
II b " . . . . .
II
TRIGGERING SPIKES
2 3
II Ill l l II Ill ql- . . . . . -I ~ . . . . .
'DEPENDENT ~ SPIKES
t* It l llt (B) 1
TRIGGERING SPIKES 3 45 6 7 8
Iti I L 'DEPENDENT ~ SPIKES
ill IlL Fig. 1 A and B. Simulated nerve spikes to show the two methods of preparing coupling distributions from spike trains. A The numerals above the triggering spikes indicate which spikes init iate sweeps. The dashed line below the t ra in shows the durat ion of the sweep. The dependent spikes with asterisks above them occur between sweeps and so are not included in the analysis. B Every triggering spike
begins a sweep of variable length
1. The Analysis o/Neuronal Interactions Spike trains recorded at two independently positioned, lacquered tungsten
microelectrodes were stored on magnetic tape. For analysis, the tape was replayed through a Tektronix 565 oscilloscope. Spike t rains fed the two trigger circuits of the oscilloscope, and the "ga te ou t " pulses resulting from each provided inputs to a special purpose computer (Biomac 1000). Analyses were also made during the experiment.
One method used to s tudy interactions between spike trains was to have spikes from one neurone (the triggering neurone) trigger the computer to sweep through all the addresses of its store, while each spike from the other neurone (the dependent neurone) was added to the store at the appropriate address. The number of counts in each address gave a relative measure of the likelihood tha t a spike will be generated by the dependent neurone a t different times after the trigger. This analysis is essentially a post-stimulus t ime histogram (Moore et al., 1966) with impulses from one neurone providing the stimulus. The histograms generated in this way have been called coupling distributions. On occasion, the dependent spike t ra in was passed through a 3.5 or 7 msec delay line, which made it possible to s tudy the likelihood of spike occurrence before the triggering spike.
If the two spike t rains are independent, the distribution of counts in each address should be equal. Any dependency will show up as a t rough or a peak. A disadvantage of the method is t ha t not all triggering spikes contribute to the data, because the sweep-time selected may be longer than the interval between successive impulses (Fig. 1 A). Thus a dependent spike which is evoked by a triggering spike may not be coupled to the beginning of the sweep. This method cannot be used to give a
t*

4 Th. Collett:
numerical estimate of the probability that a spike at the triggering neurone will be followed by the firing of the dependent neurone.
However, a slightly more elaborate analysis does lead to a rough indication of two quantities: (1) The proportion of dependent spikes which occur within a given period after the triggering spike (2). The probability that, within a given period, a triggering spike will be followed by a dependent spike. The method is to count the number of triggering and dependent spikes in a sample, and to set the computer so that each triggering spike of the sample initiates a new sweep through the addresses (Fig. 1 B). Thus all the triggering and all the dependent spikes contri- bute to the analysis. However, the sweep duration will vary, depending on the inter- spike interval of the triggering neurone. If the two neurones are independent, the expected distribution of dependent spikes after the trigger will be flat from zero until the shortest interspike interval of the triggering neurone. Thereafter the number of dependent spikes will drop at a rate which is related to the shape of the interval histogram of the triggering neurone. Histograms prepared in this way have been called type 2 coupling distributions. To obtain a "control" distribution, the train of dependent spikes was passed through a second tape-recorder, so that events were delayed by about 1 sec relative to the trigger. This effectively destroyed any dependency between triggering and dependent spikes. The control distribution was then roughly subtracted from the type 2 coupling distribution. I t was then possible to count the number of " e x t r a " dependent spikes occurring within any given period after the trigger. An example of this procedure is given in Fig. 9. Except where stated, at least two neurone pairs of each type have been studied; in each case the pairs gave very similar results.
2. Interpretation o] Coupling Distributions The physiological interpretation of cross correlation functions from simultane-
ously recorded neurones has recently been discussed extensively by Moore et al. (1970). They simulated simple open loop networks and found the cross correlation functions of various excitatory and inhibitory connections between pairs of neurones. Although the statistical methods used differ, the main conclusions they reach are applicable to the present coupling distributions. Peaks in coupling distributions arise from mono- or poly-synaptic excitatory connections between pairs of neurones, and from shared excitatory inputs. Broader peaks can result from shared inhibitory inputs, or from simultaneous changes in firing rate. Troughs will appear when there are monosynaptic or polysynaptic inhibitory connections between neurones, or when shared inputs act with opposite sign on two neurones. Broader troughs are seen when a change in the firing rate of one cell is opposite to that of the other.
The physiological interpretation of a peak or trough depends on the width of the peak or trough and its position relative to the triggering spike. Consider a neurone A which provides excitatory inputs to B and C. The width of the coupling distributions between A and B, or between A and C, should be narrower than that between B and C. The peak of the coupling distribution between A and B, when A is the trigger, should occur after the triggering spike, whereas the peak of the coupling distribution between B and C should occur simultaneously with the trigger. The position of the peak will, of course, vary with the location of the recording electrode along the fibre.
3. Mapping the Course o/ a Neurone The rough course of some neurones within the brain was mapped using a method
described previously (Collett, 1970). :Nerve impulses at one electrode, the reference

Connections between Insect Visual Neurones
electrode, were used to trigger a sweep through the 100 bins of an analogue signal averager (Medelec). Signals from a second electrode, the roving electrode, passed through a 3.5 msec delay line before reaching the averager. The averager thus extrac- ted those signals that were coupled to spikes at the reference electrode. Systematic probing of the brain with the roving electrode revealed sites of maximum negativity at different times before and after spikes at the reference electrode.
4. Visual Stimulation The moth was placed at the centre of a translucent, plexiglass hemisphere
(43 cm diameter) so that the right eye looked into the bowl. Two projectors were used to throw images on to the back of the dome. One provided oscillating bars or gratings, the other presented a continuously moving grating which could cover the whole, or an appropriate part, of the hemisphere. The left eye could also be stimulated by a continuously moving grating presented via a fibre optic image guide. The face of the guide was covered with tracing paper and placed 5 mm from the eye, where the image subtended horizontally 110 ~ and vertically 60 ~ of the visual field. The period of the grating was roughly 30 ~ , and the speeds used ranged between 20 and 40~ The image of any large stimulus projected on to the back of the dome suffers serious distortions at the edges. These distortions seemed of little significance in the experiments reported here. They do, however, mean that the values of the various stimulus parameters hold only for one part of the field. The background illumination was 0.02 cd/m 2, the oscillating bars and spots were 0.12 cd/m 2, and the light stripes of the grating were 0.05 ed/m 2.
To analyse the effects of visual stimulation, the computer was set to count the number of spikes occurring in successive 250, 500 or 1000 msec intervals. In the figures the responses are expressed as an average frequency for the integration time.
Some coupling distributions were obtained from neurones during visual stimula- tion. The stimulus always moved through the whole receptive field of a unit. In some cases large stimuli were moved by hand, close to the right eye, back and forth through the receptive field, at other times a grating projected on to the sphere moved continuously in the preferred direction. The former method was used because it often yielded more powerful responses than controlled stimulation.
5. Electrode Marking Electrode sites were on occasion marked by passing 2-3 fza for 1-2 secs (tip
negative). The electrolytic lesions were located on 10 ~zm serial sections, stained with Blest's (1961) modification of Holmes' method.
T h e Tab l e l ists t he t y p e s
d i s t r i b u t i o n s were e x a m i n e d .
Results
of neu rones b e t w e e n wh ich coup l ing
1. Simultaneous Recordings /rom Binocularly Sensitive, Directioually Selective Movement Detectors with the Same Pre/erred Direction
C o m p u t e r s i m u l a t i o n e x p e r i m e n t s (Segundo et al., 1968) h a v e s h o w n
t h a t i f cells a re fed b y few, e .g. 6, i n p u t s wh ich d e v e l o p la rge pos t -
s y n a p t i c po ten t i a l s , t h e n t h e p a t t e r n of f i r ing of t he p o s t - s y n a p t i c cell

Th. Collett:
Table. Types o/directionally selective neurones examined
Receptive field Preferred direction Probable course of neurone within the brain
Monocular forwards (weakly sensitive (strong response) over other eye)
Monocular fGrwards (weak response)
Monocular backwards
Binocular
Binocular
Binocular
lobula complex of optic lobe to contra- lateral medial protocerebrum
forwards across eye, backwards across other eye (i.e. clockwise or anticlockwise)
forwards one eye,
lobula complex of optic lobe to medial protocerebrum
lobula complex of optic lobe to contra- lateral medial protoeerebrum
medial protocerebrum to medulla of one optic lobe
medial protocerebrum to lobula complex backwards other eye of one optic lobe
forwards one eye, medial protocerebrum to ventrM nerve backwards other eye cord
follows the t empora l p a t t e r n of the p re - synap t i c cell. However , if a cell has m a n y independen t inpu t s each p roduc ing small pos t - synap t i e potent ia ls , t hen the t empora l s t ruc ture of the spike t r a in f rom the post- synap t i c cell is not de t e rmined b y t h a t of the p re - synap t i e cell. The l a t t e r only controls the average level of o u t p u t of the pos t - synap t i e cell.
Consequently, if coupling d i s t r ibu t ions are found which suggest t h a t two cells share exc i t a to ry inputs , the neurones poss ib ly receive ra the r few common inputs . Thus coupl ing d i s t r ibu t ions between b inocular m o v e m e n t de tec tors wi th the same prefer red d i rec t ion m a y reveal not only t h a t the neurones receive common inputs , but , b y impl ica t ion , t h a t the inpu t s are f rom large field m o v e m e n t detectors .
Pairs o/ Centri/ugal MovemeNt Detectors with the Same Pre/erred Direction. I n this pape r centr i fugal m o v e m e n t de tec tors refer to a class of b inocular ly sensi t ive, d i rec t iona l ly selective m o v e m e n t de tec tors which pro jec t cent r i fugal ly f rom the media l p ro toce reb rum to the medul la of one or o ther opt ic lobe, where i t is supposed t h e y make exten- sive con tac t wi th cen t r ipe ta l cells of the visual p a t h w a y (Collett, 1970). The un i t s are most easi ly recorded in the an te r io r medulla . Their recept ive fields, def ined b y the area over which there is a d i rec t ional response to move- ment , cover a lmos t the to ta l b inocular field. Their nul l -prefer red axes are a lways ei ther ver t i ca l or hor izonta l , and the prefer red d i rec t ions across the two eyes are opposi te , so some neurones respond op t ima l ly

Connections between Insect Visual Neurones
I ,llt 17468 tr igger
T16 spikes 9214 t s. n
I I F
17778 t . s .
- -5 0 + 5 10 msec Fig. 2. Coupling distributions between two centrifugal movement detectors with
clockwise preferred direction. 20 ~sec bin width. See text for further details
when the insect rotates in one direction about a vertical axis, others to rotation about a horizontal axis. There is probably only a single neu- tones of each of the four possible types in each medulla.
Their visual properties are in many respects similar to those of direetionally selective neurones found in other preparations (Grfisser and Grfisser-Cornehls, 1969). They fire optimally to stripes moving continuously through the preferred direction at about 50~ and respond almost equally well to black-white or to white-black edges. Their resting rate is inhibited by movement through the null direction and commonly unaffected by movement perpendicular to the null- preferred axis (Cotlett and Blest, 1966).
Pairs of centrifugal movement detectors with the same preferred direction were recorded boom two electrodes, one in each medulla. I t is clear from visual examination of impulse trains from such pairs that bursts of activity in the two units occur together (Collett, 1970, Fig. 9). Fig. 2 shows the coupling distribution found between two units with

8 Th. Collett:
clockwise preferred direction. For about 2.5 msec before and after the triggering spike there is an enhanced probabili ty of occurrence of a dependent spike. For the top and middle traces, the units in the left optic lobe provided the triggering spike, for the bot tom trace, the trig- gering spike was from the right optic lobe unit. The spike trains analysed in the top and bot tom traces were taken when there were no moving stimuli; those analysed in the middle trace were taken while stripes moving in the preferred direction greatly increased the firing rate. The shape of the distributions suggest tha t the two neurones share common inputs. The similarity between the top and middle traces suggests further that the common inputs are visual ones. The peaks of the distribu- tions will be centred around zero, since the conduction times from the medial protoeerebrum, where the centrifugal movement detectors receive their inputs, to the recording sites in the medulla will be nearly the same for both neurones.
A Centri/ugal Movement Detector Recorded Simultaneously with a Binocular Unit which Projected /rom the Medial Protocerebrum to the Ventral Nerve Cord. Fig. 3 shows the coupling distribution of the only pair of this type to be analysed. Both units had clockwise preferred directions and responded very similarly to moving stripes (Collett, 1970, Fig. 11). One neurone was sampled in the ventral nerve cord, the other in the anterior medulla. The conduction times from the medial proto- cerebrum to the recording sites may be estimated from other data as roughly 1.8 msecs to the ventral nerve cord, and 0.7 insec to the medulla. If the two units received a common input, the peak of the coupling distri- bution should be about i msec before the triggering spike when the ventral nerve cord unit provided the trigger, and 1 msec after the triggering spike when the centrifugal movement detector was the trigger. Thus their coupling distributions suggest they received similar inputs, not that one unit was presynaptic to the other. The peak is insufficiently sharp to be confident that the neurones received common inputs and were not fed by different neurones which themselves received common inputs.
A Centri]ugaI Movement Detector Recorded with a Binocular Movement Detector which Projected /rom the Medial Protoeerebrum to the Lobula Complex. Another class of binocular movement detector recorded rarely in the medial protocerebrum runs centrifugally to the optic lobe, but to a different region from the medullary centrifugM movement detector. The limited mapping tha t has been carried out on these neurones suggests they project no further peripherally than the lobula complex. On a single occasion a unit of this type was recorded simultaneously with a medullary centrifugal movement detector. Both neurones had the same preferred direction, and projected to the same optic lobe. The coupling distribution, examined during the course of the experiment,

Connections between Insect Visual Neurones
32 spikes
A 1977 t.s.
I I I I 0 10 20 30
!
I I I I 0 10 ms 20 30
Fig. 3A and B. Coupling distributions between two binocular movement de- tectors with clockwise preferred direction. One recorded in the ventral nerve cord, the other a centrifugal movement detector, recorded in the right optic lobe. In (A) the trigger was provided by the ventral nerve cord neurone, in (B) the trigger came from the centrifugal movement detector. Sample of resting activity. 320 ~xsec bin
width
was similar to tha t i l lustrated in Fig. 2, with the peaks equally pronoun- ced. The ten ta t ive conclusion is tha t centrifugal uni ts project ing to different parts of the optic lobe receive few common inputs .

10 Th. Co]lett:
64 spikes per ser
1 min
Fig. 4. The effect of a grating moving forwards across the left eye on the response of a centrifugal movement detector with anticlockwise preferred direction to a grating oscillating back and forth across the right eye. Peaks in the trace result from 30 ~ movement of the grating in the preferred direction. Each sweep through the field took 1 sec. The bar beneath the computer print-out indicates when the
grating moved. 250 msec bin width
2. Inhibitory Inputs to the Centri/ugal Movement Detectors
Evidence t h a t centr i fugal movemen t detec tors p r o b a b l y receive inh ib i to ry as well as exc i t a to ry inpu t s comes from exper iments in which the two eyes were s t imu la t ed s imul taneously . Movement of a g ra t ing in the null d i rect ion across one eye m a y suppress the response to movemen t of a second gra t ing in the prefer red d i rec t ion across the other eye. Fig. 4 shows a centr i fugal movemen t de tec to r wi th ant i -clockwise prefer red direct ion. The r ight eye was s t imu la t ed by a gra t ing which swept th rough the field a l t e rna t e ly in the null (backwards) and prefer red (forwards) d i rec t ions ; a t the end of each sweep, the g ra t ing remained s t a t i ona ry for several seconds. The peaks in the t race resul t f rom sweeps in the prefer red direct ion, the t roughs f rom sweeps in the nu]] direct ion. I n the middle sect ion of the t race, as ind ica t ed b y the bar , the gra t ing seen by the left eye moved in the null d i rect ion (forwards). There is clear suppression of the response to r ight eye s t imula t ion . The effect was seen in 8 of the 12 uni ts t e s t ed in this way. The suppression is only s t rong when the null d i rect ion th rough which the inhib i t ing gra t ing moves is forwards. F o r instance, the response of uni ts wi th clockwise prefer red d i rec t ion to a gra t ing osci l lat ing in the nul l -preferred axis was usua l ly unaffected, or more ra re ly weak ly inhibi ted , b y backwards movemen t of a g ra t ing

Connections between Insect Visual Neurones 11
across the left eye. Weak inhibition caused by backwards movement has been detected in 3 out of 9 eases examined.
These tests therefore suggest that a neurone with, say, clockwise pre- ferred direction receives excitatory inputs from movement deteetor(s) with backwards preferred direction across the right eye, and inhibitory inputs from complementary movement detector(s) with a similar receptive field also covering the right eye, but with forwards preferred direction. However, the unit should receive excitatory, but no inhibitory, inputs from movement detectors sensitive to stimuli travelling across the left eye.
3. Recordings from Pairs of Centri[ugal Movement Detectors with Opposite Preferred Directions
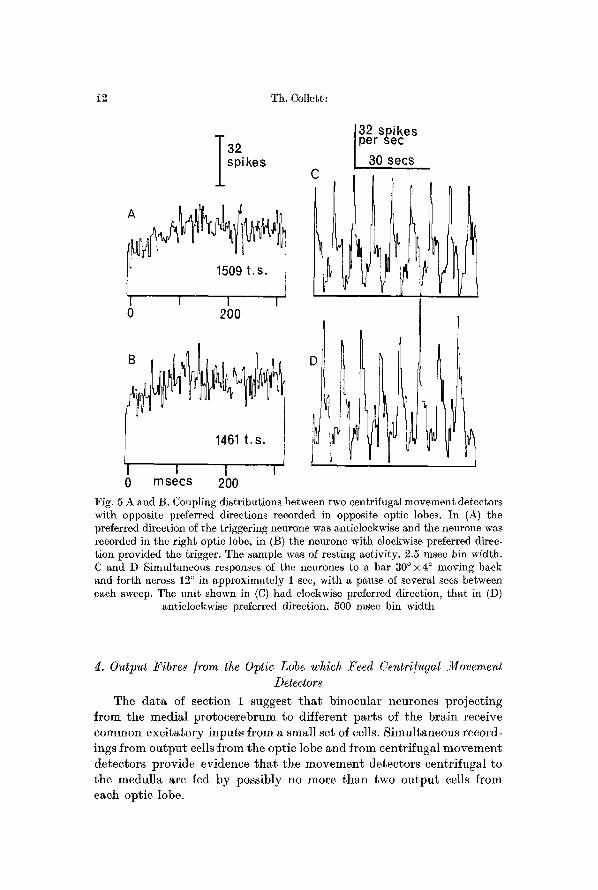
In order to learn something about these inhibitory inputs recordings were made from pairs of centrifugal movement detectors with opposite preferred directions. These pairs may be composed of neurones which project either to the same or to the opposite medulla. Records from both kinds of pairs (Collett, 1970, Fig. 9; Coliett and Blest, 1966, Fig. 1) show that in the absence of stimulation, bursts of firing in one unit are aceom- panied by silence in the other. However, coupling distributions from such pairs are flat immediately before and for 20 msecs after the triggering spike. I f the sweep duration of the computer is lengthened so that longer periods can be examined, it appears tha t the probabil i ty of occurrence of a dependent spike is slightly reduced for some 100 msee after the trig- gering spike (Fig. 5). This depression was regularly seen in pairs in which the neurones projected to opposite medullas, but was not evident in the single pair examined in which both neurones projected to the same medulla.
The depression is merely a reflection of the finding that the neurones exhibit changes in firing rate of opposite sign and is of little help in defining the postulated inhibitory inputs to the centrifugal movement detectors. I t does, however, argue against two possible networks. (1) I t is unlikely that there are direct reciprocal inhibitory conneetions between the units. Fig. 5 shows tha t the probabili ty of occurrence of the dependent spikes has dropped at least 7 msee before the triggering spike, whereas reciprocally inhibitory connections would generate distributions with troughs which occurred sometime after the triggering spike. (2) The units probably do not receive a common input with direct excitatory action on one of the units and a direct inhibitory action on the other (Kandel et al., 1967). In this ease there should be a narrow trough in the coupling distribution centred around zero with very roughly twice the duration of the post-synaptie potential (i. e. a trough to match the peak of Fig. 2).
i2 Th. Collett:
132 spikes
I 32 [ per sec spikes I 30sees
C
I I I I 0 200
1461 t. s,
I I I 0 msecs 200
/ Fig. 5 A and B. Coupling distributions between two centrifugal movement detectors with opposite preferred directions recorded in opposite optic lobes. In (A) the preferred direction of the triggering neurone was anticlockwise and the neurone was recorded in the right optic lobe, in (B) the neurone with clockwise preferred direc- tion provided the trigger. The sample was of resting activity. 2.5 msec bin width. C and D Simultaneous responses of the neurones to a bar 30~215 ~ moving back and ~orth across 12 ~ in approximately 1 sec, with a pause of several secs between each sweep. The unit shown in (C) had clockwise preferred direction, that in (D)
anticlockwise preferred direction. 500 msec bin width
4. Output Fibres /rom the Optic Lobe which Feed Centri/ugal Movement Detectors
The data of section 1 suggest t ha t binocular neurones project ing from the medial protocerebrum to different parts of the bra in receive common exci ta tory inpu ts from a small set of cells. S imul taneous record- ings from ou tpu t cells from the optic lobe and from centrifugal movemen t detectors provide evidence t ha t the movemen t detectors centrifugal to the medulla are fed by possibly no more t han two ou tpu t cells from each optic lobe.

Connections between Insect Visual Neurones 13
The class of output cells which are shown to provide an input to the centrifugal movement detectors project from the lobula complex of one optic lobe to the medial protocerebrum. Their receptive fields cover a very large proportion of one eye- - the side on which impulse act ivi ty or iginates--and is roughly coextensive with the ipsilateral field of the centrifugal movement detectors. Their responses to moving stripes are also similar to those of the binocular movement detectors. I t seems likely that there are very few units with each preferred direction.
One interesting feature of the units with back-to-front preferred direction was tha t they frequently showed a directionally selective response to stimuli moving forwards over the other eye. This response was often erratic and generally much weaker than that to ipsilateral stimulation. However, since it persisted when the ipsilateral eye was masked and it could be evoked by hand movements when the hand was lit only by background illumination, it is unlikely to be caused by light scatter to the ipsilateral eye. The response to contralateral stimulation can be greatly enhanced by prior ipsilateral stimulation, in either the null or preferred directions. Too few units with front-to-back preferred direction have been recorded to be sure tha t these units arc also sensitive to contralateral stimulation.
The contralateral response of the output neurones may have no functional significance, since the units feed centrifugal movement detectors with back-to-front preferred direction across the ipsilateral eye, but with front-to-back preferred direction across the contralateral eye.
Fig. 6 shows the coupling distributions between an optic lobe output cell with back-to-front preferred direction across the right eye and two centrifugal movement detectors with anticlockwise preferred direction. The output unit was recorded in the right medial protocerebrum, the two centrifugal neurones were recorded successively in the right (top trace) and left (second trace) medullas. Two to three resets after a triggering spike, there is an enhanced probabili ty of a spike arising at the centrifugal neurone. (Note that the width of the peak is roughly half tha t of the peak in Fig. 2.) Thus a movement detector projecting from one optic lobe probably feeds centrifugal movement detectors projecting to both optic lobes.
The third trace shows the coupling distribution produced when the centrifugal unit recorded in the right medulla provided the trigger. For this trace, the impulse train from the output unit was delayed by 7 resets. The prominent peak indicates tha t a high proportion of spikes from the output unit trigger spikes from the centrifugal unit, as is shown quanti- ta t ively below.
In the bot tom trace the same output unit provided the trigger while the dependent neurone was a centrifugal movement detector with clock-

14 Th. Collett:
~0 IS _ I I0 ~15
.
IO '5 WlO '15
~~,, 5827 t.s.
15 IO + '5 -- msec '10 4 5 9 4 3 t.s.
Fig. 6. Coupling distributions between optic, lobe output cell and centrifugal movement detectors. Samples from resting neurones 20 ~zsec bin width. See text
for further details
wise prelerred direction recorded in the right medulla. There is a slight indication that Che centrifugal neurone had a lowered probability of firing three msees after the triggering spike. I-Iowever, the effect was small and in several such pairs analysed it was absent. I t is unlikely, therefore, that this class of monocular unit provides a powerful post- synaptie inhibitory input to centrifugal movement detectors.
The coupling distribution had a similar time course, though the peak was more pronounced, when the units were excited by visual stimulation. Fig. 7 shows coupling distributions generated during rest and during visual stimulation. The triggering neurone was a movement detector projecting from the right optic lobe with back-to-front preferred direc- tion, the dependent neurone a eentrifugM unit with antieloekwise pre- ferred direction.

Connections between Insect Visual Neurones t5
8 0 4 5 trigger spikes Jl, no st i mu lotion
I0 15 I10 115
S
' " "
0 15 msec I10 115 ~~ 9846 trigger spikes
t, l
10 '5 110 115
Fig. 7. Coupling distributions between optic lobe output and centrifugal movement detectors. Top and middle traces show samples obtained respectively with and without visual stimulation. Bottom trace shows coupling distribution between the optic lobe output movement detector whose course is mapped in Fig. 10 and a centrifugal movement detector with antieloekwise preferred direction. 20 ,asec bin
width. Further details in text
The coupling between ou tpu t m o v e m e n t de tec tors wi th f ront - to- back prefer red d i rec t ion and centr i fugal movemen t detec tors is ve ry similar , bu t has been s tud ied on only three occasions.
Fig. 8 shows how a centr i fugal m o v e m e n t de tec to r wi th ant ie loekwise prefer red d i rec t ion and an opt ic lobe ou tpu t cell wi th back- to - f ron t prefer red d i rec t ion across the r ight eye respond to ver t ica l bars of increasing height osci l la t ing in the nul l -preferred axis. Not ice the simila- r i t y of the responses of the two uni t s to the increasing size of the s t imulus. A type 2 coupl ing d i s t r ibu t ion between these two s imul taneous ly recorded uni ts is shown in Fig. 9

i6 Th. Collett:
S
r
r
5
s
% - -
~ %
o ~ -~
O m
e ~
. i
~ ' ~ g~
~ e ~ o
m ~
. ~

Connect ions be tween In sec t Visual Neurones 17
I 3262 trigger spikes 4694 dependent spikes
]~ 1088 spikes in hatched area
230 sec sample
I I I I I 10 30 msec 50
Fig. 9. Type 2 coupling distribution between an optic lobe output cell and a centri- fugal movement detector. 640 izsec bin width. See text for further details
A rough estimate indicates that probably no more than two optic lobe output cells with back-to-front preferred direction feed each centrifugal unit. The type 2 coupling distribution and control distribution of Fig. 9 were prepared from samples taken when no visual stimulation was given. The hatched area in the upper distribution gives the number of " e x t r a " spikes between 0.6 msecs and 3.8 mesees after the trigger (see Methods). Thus, under resting conditions, approximately 1/3 of the triggering spikes gave rise to a dependent spike, and just under 1/4 of the dependent spikes resulted from a triggering spike.
Another sample was taken from the same pair during visual stimula- tion. In this ease there were 1074 triggering spikes and 1245 dependent spikes, while 448 "ex t ra"sp ikes occurred between 0.6 and 3.2 msees after the trigger. An interval histogram of the dependent train revealed that almost no intervals were shorter than 3 msecs, so there was no strong tendency for a single pre-synaptie spike to evoke two or more spikes in the pos t synap t i c cell. Thus, during stimulation, roughly 2/5 of the triggering spikes were followed by a dependent spike, and 1/3 of the dependent spikes were ': dr iven" by triggering spikes.
2 Z. vergl. Physiologie, ~Bd. 75

18 Th. Collett: Connections between Insect Visual Neurones
To arrive at an estimate of the number of output cells with back-to- front preferred direction feeding the centrifugal movement detector, a comparison is first made of the increase in firing rate of the two units caused by visual stimulation. Although the resting rates of the two units differed markedly, visual stimulation increased the firing rate of the centrifugal unit marginally less than that of the optic lobe output cell (e. g. Fig. 8). Now, during stimulation, 2/5 of the output spikes produced a centrifugal spike. So, the best estimate is that the centrifugal unit was fed by two similar optic lobe output cells.
Identical analyses were performed on two more such pairs. In the first case it was concluded that the centrifugal unit received inputs from a single output cell; in the second case the estimate was two output cells.
Assume that the centrifugal neurones of the pair analysed in Fig. 9 received equally powerful inputs from two movements detectors with back-to-front preferred direction arising in the right optic lobe, and from two with front-to-back preferred direction arising in the left optic lobe. With no visual stimulation about 1/4 of the centrifugal spikes result from activity in a single optic lobe output cell, so possibly all of the resting activity of this centrifugal unit can be accounted for by the resting activity of the four movement detectors which are assumed to provide
its input.
5. The Course within the Brain o/the Optic Lobe Output Cells The course of movement detectors with back-to-front preferred direc-
tion projecting from the optic lobe has been mapped in several experi- ments after the unit was recorded simultaneously with a centrifugal neurone. In each case the output neurone probably arose in the lobula complex and projected to the contralateral medial protocerebrum.
Fig. 10 shows the mapping of a unit whose coupling distribution was given in the bottom trace of Fig. 7. This unit was sensitive to movement across the right eye. The reference electrode was placed in the right medial protocerebrum and the roving electrode explored both optic lobes and the medial protocerebrum. The coupled potentials at the roving electrode show that activity arose in the right optic lobe and travelled as far as the left medial protoeerebrum. In the left optic lobe coupled potentials were
Fig. 10. A Averaged potentials at different recording sites in the brain coupled to nerve impulses from an optic lobe output cell recorded at re/. The response, re], shows the triggering nerve impulse after passing through the delay line and averager, and the vertical lines indicate the time of occurrence of its peak. Note that the responses, i and ret, have their own amplitude calibration bars. B Horizontal section through the brain showing the approximate locations of the recording sites. (M) medulla;
(L) Iobula; (LP) lobula plate. 500 ~ calibration bar

I k ""
o ."~
+ 1 m s e c
100 ijv
]3 FRONT
A
m
a_.._ ~'i., / ' ~ - ~ - r
ref 250 t~vT
v i - 1
]
i < ~ _ n_ . . . . . . ,: : ~ f _
�9 1 r ~ w , . .
W . " - , _ ~ ~ U _ _ ~ _ , / , . . .
I i
!
/
Fig. 10A~nd B
2*

20 Th. Collett:
small and of a similar latency to the larger potentials in the left medial protocerebrum. Probably, potentials recorded there were a result of current spread from the medial protocerebrum.
6. Simultaneous Recordings /rom Output Cells /rom Optic Lobe with Back-to-/rout Pre/erred Directions
To charaeterise the inputs to wide-field movement detectors projecting from the optic lobe, an indirect approach has had to be adopted, that of sampling the activity of two wide-field movement detectors and deducing the properties of their common inputs. Pairs of output cells with back-to-front preferred directions and the same receptive field have been sampled on three occasions. As judged by the visual properties of the neurones and the similarity of the coupling distributions, the same pair may have been studied in each case. Activity in both neurones originated in the optic lobe and projected to the medial lobes. One of the neurones always responded much more vigorously to visual stimulation than the other, and is one of the cells known to feed the centrifugal movement detectors. I t is unknown whether the unit with the weaker response also provides an input to the centrifugal movement detectors.
Fig. 11A S and B 2 show the responses of a pair of such units to a 23 ~ by 1 ~ stripe sweeping backwards and forwards through 30 ~ across the right eye. The coupling distributions of this pair (Fig. 11, C, C 1 and D) suggest the two neurones received common inputs. The fact tha t the peaks do not centre around zero is part ly explained by the recording sites. Neurone A, the unit with the more powerful response, was recorded in the left medial protocerebrum and provided the trippering spikes for distributions C and C 1. Neurone B, which provided the trigger for distribution D, was recorded in the right medial protocerebrum.
Distribution C was prepared from a sample obtained during visual stimulation, and C1 from a sample of resting acticity. A glance at the interval histograms of the two units during rest (A1, Bt) and during stimulation (A, B) will convince you tha t most of the triggering spikes contributing to distribnttion C must have resulted from visual stimula- tion. Since the coupling distributions C and C~ are so similar it follows that the common input(s) must have included visual one(s).
Fig. 12 shows coupling distributions from another, similar pair of neurones, also projecting from the right optic lobe. The neurone which responded more powerfully to stimulation was recorded in the right optic lobe, and the other unit was sampled in the right protoccrebrum. The distributions again indicate that the neurones receive common input(s).

Connections between Insect Visual Neurones 21
1397 A
9 8 9 A 1
0 80 160
t 1399 B
I I I I
0 80
I I I " / " j " - ' - - I 0 80 160 mil l iseconds
A 2
I I 0 20
I [ 40 seconds
~ t l 1994 C
0 10
I I , ~ J ,, 1965 c 1
I I I I 0 10
] ~ 2009 O
-- 0 "~- lO mill iseconds
Fig. l l . A , A 1, B, B1 show spike interval histograms from optic lobe output cells A and B. Histograms A and B are from samples t aken during visual stimulation, histograms A 1 and 131 from samples of resting neurones. The nmnber of intervals counted is shown above each trace. 640 ~zsee bin width. C, C~, and D give coupling distributions between units A and B. Uni t A provided the trigger for C and C1, uni t B was the trigger for D. Distr ibution C is from a sample obtained during visual s t imulat ion; C~ and D are samples from resting neurones. The number of triggering spikes is given above each trace. 80 ~xsec bin width. A s and B 2 show the response of the two neurones to a light vertical bar 23 ~ by 1 ~ sweeping through 30 ~ in 2 sees along the null-preferred axis. 200 msec bin width. The amplitude calibration bar equals 64 spikes for A, n l , B, B1, C, C 1 and D, and equals 80 spikes/see for A s and B2

22 Th. Collett:
A , 7 , o , . s
i I
I I I I 0 10 20 30
I[1, T32 ~pik~ B i ln, | ,s,2,.,.
Ud ' J-
I I I I 0 10 ms 20 30
Fig. 12A and B. Coupling distributions between two optic lobe output cells wi th back-to-front preferred directions, one with a weak response (unit A) and one with
powerful response (unit B) to visual stimulation. In the top trace unit A provided the trigger, in the bottom trace unit B provided the trigger. Sample of resting
activity. 320 ~zsec bin width
The most likely interpretation of the coupling distributions is that there are few visual inputs to the wide-field movement detectors. However, it cannot be excluded that there are many input neurones with coupled activity, as is the case in the cerebellum where numerous parallel fibres provide a synchronous input to Purkinje cells (Freeman, 1969). While a further possibility is that the ouput neurones have many independent impulse initiating zones, each fed by few inputs. But if we accept the more attractive hypothesis of few input cells, it follows that the input neurones have relatively large receptive fields.
7. Inhibitory Inputs to Direetionally Selective Output Cells /rom the Optic Lobe
If two separate areas of the receptive field are stimulated inde- pendently with moving gratings, then movement in the null direction

Connections between Insect Visual Neurones 23
BACK TO FRONT FRONT TO BACK TOP TOP
50 SPIKES T PER SEC # I
BACK TO FRONT FRt BOTTOM BOTTOM
Fig. 13. The effect of two moving gratings, one covering the bottom half of the field, the other the top half of the field, on the response of a wide-field optic lobe output cell with front-to-back preferred direction. One grating moved continuously in one direction for periods indicated by the bars beneath the traces, the other grating oscillated back and forth through about 30 ~ In the upper trace the continuously moving grating covered the top half of the field and the oscillating grating the bottom half. In the lower trace the positions of the gratings were reversed. The two
gratings were separated by l0 ~ 250 msec bin width
)NT TO BACK
through one area suppresses the response to movemen t in the preferred direction in the second area (Figs. 13 and 15). These tests suggest t ha t the units , or very large field cells feeding them, receive inh ib i to ry inpu ts from movemen t detectors with similarly located large receptive fields, bu t opposite preferred dh'eetions. The inh ib i tory in teract ions between different areas were seen more f requent ly in uni ts with f ront- to-back preferred direction (2 out of 3 units) t h a n in uni ts with back-to-front preferred direction (1 out of 6 units) . When the eentrifugM movemen t detectors were tested monoeular ly with two independent s t imuli they behaved in the same way. I n 4 out of ~ eases when the preferred direct ion of the side tested was from front to back the suppression was marked, whereas there was no suppression in ~he two eases when the preferred

24 Th. Collett:
A 19114 t.s.
I I I 0 10 20 30
B 10749 t .s .
C 11435 t.s.
I I I 0 10 20 30
- r D 10114 t.s, I~ 2 pikes
f
1 ! | I I I 0 10 2 0 3 0 MSEC 0 10 2 0 3 0
Fig. 14A-D. Coupling distributions between two pairs of optic lobe output cells with opposite preferred directions : A and B give the distributions of one pair. In (A) the trigger comes from the unit with front-to-back preferred direction recorded in the right medial protocerebrum; in (B) the trigger was provided by the unit with back-to-front preferred direction recorded in the left medial protocerebrum. The coupling distributions from the second pair are shown in (C) and (D), In (C) the trigger was from the unit with front-to-back preferred direction recorded in the right medial protocerebrum; in (D) the trigger came Item the unit with back-to-front preferred direction recorded in the left medial protoeerebrum. Samples taken from
resting neurones 320 ~xsee bin width
direct ion of the side tested was from back to front. I t seems tha t for both monocular and binocular uni ts this inhib i t ion is stronger when induced by forward movement . The difference between uni ts with oppo-

Connections between Insect Visual Neurones 25
32 spikes per sec
60 secs
backwards forwards
Fig. 15. Responses of neurones, with coupling distributions illustrated in Fig. 14A and B, to a 40 ~ by 3 ~ light, vertical bar moving back and forth through 40 ~ in 3 sees in an anterior region of the field. As indicated by the bars beneath the traces, a continuous grating moved in the posterior half of the field. The top trace shows the neurone with back-to-front preferred direction, the bottom trace the neurone with
front-to-back preferred direction. 1 sec bin width
site preferred directions indicates the interact ions t h a t are found do not
result f rom l ight scat ter f rom the area of re t ina covered by one st imulus
to tha t covered by the other.
8. Simultaneous Recordings /tom Movement Detectors Projecting /rom the Optic Lobe with Opposite Pre]erred Directions
Recordings f rom such pairs were made to t ry and characterise the
inh ib i tory inputs described in the previous section. The procedure was
to record one optic lobe ou tpu t neurone concurrent ly with a centrifugal
m o v e m e n t detector and to examine the coupling between them. If the

26 Th. Co]left:
output movement de tec tor" fed" the centrifugal neurone, a secound optic lobe output unit with opposite preferred direction was located, and the coupling distribution between the two output neurones examined. The last stage was to test whether the second output neurone provided an input to the appropriate centrifugal movement detector.
Two pairs of optic lobe output neurones were tested in this way: in one of the pairs the second output cell was lost before the last step of the experiment was complete. But the coupling distributions of the two pairs are so similar tha t data from both are presented. Fig. 14A and B show the coupling distributions from one pair, C and D the distributions from the other pair. In every case there is a slight dip in the distribution which occurs a few msecs after the triggering spike and lasts for about 15 msecs. The dip is so shallow that it is unwise to draw any conclusions from the distributions. However, it is safe to eliminate the possibility tha t the neurones receive direct inputs of opposite sign from a common source.
Fig. 15 shows the response of one of these pairs to a bar oscillating backwards and forwards in the anterior half of the field. A grating cover- ing the posterior half of the field was made to move continuously for- wards or backwards as indicated in the figure. The response of the unit with front-to-back preferred direction was suppressed by forwards movement of the grating, whereas the response of the other unit was unaffected by backwards movement of the grating.
Discussion
1. Connections between Movement Detectors in the Medial Protocerebrum
The coupling distributions lead to two main conclusions: (1) Bin- ocularly sensitive, directionally selective movement detectors which originate in the medial protocerebrum are fed by rather few wide-field movement detectors which arise in the lobula complex of the optic lobe. (2) These optic lobe output cells each provide inputs to several binocular movement detectors which project from the medial protoeerebrum to different areas of both optic lobes and possibly to cells which project to the ventral nerve cord.
The similarity of the visual responses of the optic lobe output cells and the binocular movement detectors suggests tha t the synapses between them are simple relays enabling the binocular neurones to combine information from the two optic lobes. As gauged from the time course of the coupling distribution between the two neurones (Figs. 6 and 7), the excitatory effect of a presynaptie spike is brief. There is, however, some at tenuation at the synapse; in the example given no more than 1/3 of the presynaptic spikes induce an impulse in the post- synaptic cell.

Connections between Insect Visual Neurones 27
I n addit ion to the exci ta tory inputs the binocular movement detectors probably receive inhibi tory inputs f rom wide-field movement detectors (section 2). There is no evidence to decide whether the in- hibition is pre- or post-synaptic. One function of the inhibition m a y be to suppress unwanted responses of the optic lobe ou tpu t ceils. This possibility is best explained with a concrete example. Outpu t cells with back-to-front preferred direction across the r ight eye which originate in the r ight optic lobe were often weakly excited by forwards movement across the left eye. However, such a neurone feeds binocular movemen t detectors with back-to-front preferred direction across the r ight eye, bu t with f ront- to-back preferred direction across the left eye. Indeed, for- wards movement across the left eye inhibits the response of the binocular movement detector to forwards movement across the r ight eye. The postulated inhibi tory input to the binocular neurone is therefore act ivated by forwards movement across the left eye, and so would obviously cancel the exci ta tory response the optic lobe output cell gives to forwards movement across the left eye.
The contralateral sensit ivity m a y thus be of no significance to the wide-field optic lobe ou tpu t cells, bu t merely a by-product of functional eontralateral effects on other movement detectors which share a common pa thway at a more peripheral level. Thus, one m a y have a si tuat ion where the same peripheral feature detectors supply inputs to two distinct systems. One system m a y be interested in one set of features to which the peripheral detectors respond, the second to another, par t ly overlapping set. I t m a y be more economical to suppress the response to the unwanted features at a late stage in the system, than to incorporate two parallel sets of peripheral detectors.
2. The Inputs to Wide-/ield Movement Detectors which Project ]tom the Optic Lobe
Coupling distributions between pairs of wide-field movement detectors which project f rom the optic lobe suggest tha t these neuroncs receive few visual inputs, and tha t therefore the input neurones to them m a y have relatively large receptive fields ~. Consequently, the spatial summat ion needed to give the very wide fields of the optic lobe ou tpu t ceils m a y occur in several stages. Alternatively, the ou tpu t cells m a y receive their
1 Note added in pro@ The argument that these cells have few common inputs is weakened, because there is a real possibility that some neurones may have many independent impulse initiating regions. N. tt. Sabah and J. T. Murphy have recently estimated, albeit roughly, that cat cerebellar Purkinje cells may have up to 150 independent firing zones [Biophys. J. 11, 414428 (1971)]. If the optic lobe output cells have a similarly large number of triggering zones, each fed by few inputs, it is likely that coupling distributions between pairs of these neurones would show pronounced peaks.

28 Th. Collett:
A
1
2
3
4
1
2 Fig. 16A and B. Diagram of multi and single-layered summation. In both (A) and
(B) the cells in layer 1 are assumed to have the same small receptive field size
major input from a relay cell which has a receptive field coextensive with tha t of the output cell it feeds.
Movement detectors with very extensive fields fall roughly into two categories ; those which only give a powerful response if there is spatial. summation over a large proportion of their receptive field, and those which respond well to relatively small stimuli anywhere in the receptive field. The first kind may, for instance, be used to monitor movements of the whole background which are generated by the animal's own acti- vities, whereas the second kind wonld detect moving objects anywhere in the field. I t may be easier with a multi-layered system to organise spatial summation so that stimulation of a small part of the field leads to a powerful response. Synapses in the scheme of Fig. 16A could be given appropriate transfer function so tha t stimulation of a single unit in layer 1 produces a strong response in the unit of layer 4. To do the same job with the scheme of Fig. 16B might mean using a summating neurone which has many impulse initiating regions.
Intermediate between these two classes would be units which are sensitive to specific stimuli situated anywhere within a large receptive field, but which respond strongly to stimuli in some regions of the field and weakly to stimuli in others. These neurones might receive many in puts of unequal strength from small field detectors. Coupling distributions between similar units of this kind would then have pronounced peaks because

Connections between Insect Visual Neurones 29
only a few of the many common inputs are powerful. I f the strengths of the inputs were graded across the field, the frequency of firing of the unit would be related to the position of the stimulus. Such units might be an economical way of providing a command to control an orientation response to an object which may lie anywhere in the visual field (e.g. Land, 1971).
Summation over a large area within a single synaptic layer may in fact occur in the periphery of the medulla. Some tangential cells in the medulla have terminal processes which cover the majori ty of the projec- tion of the retinal mosaic (Strausfeld and Blest, 1970). Some of these cells t ransmit information centrifugally to the medulla, but at least one is centripetal and collects information from a large area of the visual field (Collett, 1970). This unit is sensitive to changes in the level of illumina- tion, but not to movements within the field.
3. Asymmetrical Inhibitory Inputs The output cells with front-to-back preferred direction seem to
receive inhibitory inputs from wide-field movement detectors with back- to-front preferred direction, since movement in the null direction across one area of the field suppresses the response to movement in the pre- ferred direction across another area. This type of null inhibition is much weaker or absent in units with back-to-front preferred direction. Un- fortunately, too few units with each preferred direction have been studied for this difference to be statistically significant; nonetheless, it must be kept in mind when discussing the functional significance of the null inhibition.
These movement detectors may be involved in the optomotor response, since they, or units with very similar activity, feed movement detectors which project to the thoracic nervous system. If this is the case, it should be possible to confirm the asymmetry of inhibitory inputs to movement detectors with opposite preferred directions by open loop measurements of the optomotor response in the following test. Two stimuli moving in opposite directions are seen by different areas of one eye. The stimulus parameters are adjusted so tha t when the two stimuli are presented separately the torque induced by each pat tern is equal and opposite. When the two stimuli are presented together there should be a net response to the forwards moving stimulus.
Such differences between movement detectors may be relevant in flight, when the background is continuously travelling backwards across both eyes. If any object approaches from behind, its image will move forwards over the retina. Units responding to the background would be suppressed by the image of the moving object, but units responding to
30 Th. Collett:
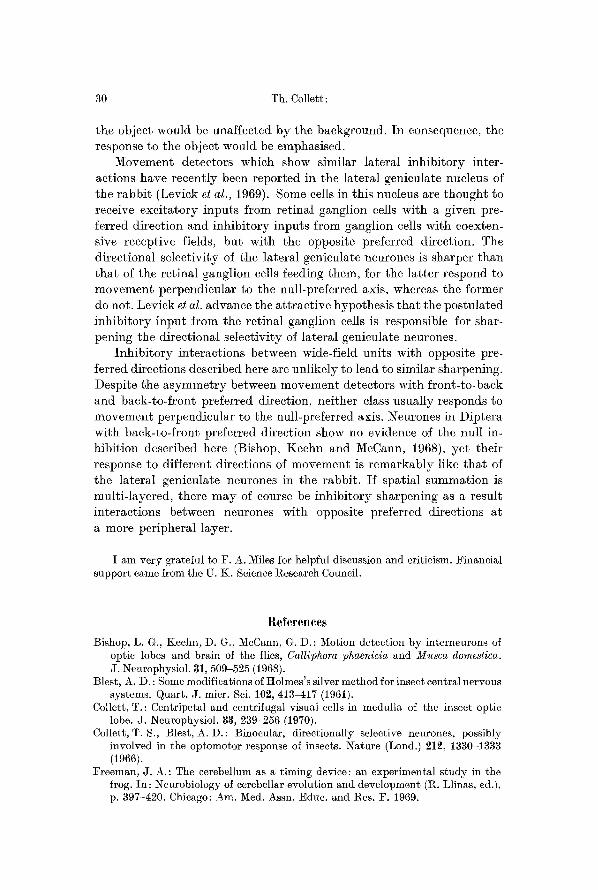
the object would be unaffected by the background. In consequence, the response to the object would be emphasised.
Movement detectors which show similar lateral inhibitory inter- actions have recently been reported in the lateral geniculate nucleus of the rabbit (Levick et al., 1969). Some cells in this nucleus are thought to receive excitatory inputs from retinal ganglion cells with a given pre- ferred direction and inhibitory inputs from ganglion cells with coexten- sive receptive fields, but with the opposite preferred direction. The directional selectivity of the lateral geniculate neurones is sharper than that of the retinal ganglion cells feeding them, for the latter respond to movement perpendicular to the null-preferred axis, whereas the former do not. Levick et al. advance the attractive hypothesis that the postulated inhibitory input from the retinal ganglion cells is responsible for shar- pening the directional selectivity of lateral gcniculate neurones.
Inhibitory interactions between wide-field units with opposite pre- ferred directions described here are unlikely to lead to similar sharpening. Despite the asymmetry between movement detectors with front-to-back and back-to-front preferred direction, neither class usually responds to movement perpendicular to the null-preferred axis. Neurones in Diptera with back-to-front preferred direction show no evidence of the null in- hibition described here (Bishop, Keehn and McCann, 1968), yet their response to different directions of movement is remarkably like that of the lateral geniculate neurones in the rabbit. If spatial summation is multi-layered, there may of course be inhibitory sharpening as a result interactions between neurones with opposite preferred directions at a more peripheral layer.
I am very grateful to F. A. Miles for helpful discussion and criticism. Financial support came from the U. K. Science Research Council.
References
Bishop, L. G., Keehn, D. G., McCann, G. D.: Motion detection by interneurons of optic lobes and brain of the flies, Calliphora phaenicia and Musca domestica. J. Neurophysiol. 31,509-525 (1968).
Blest, A. D. : Some modifications of Hohnes's silver method for insect central nervous systems. Quart. J. micr. Sci. 102, 413-417 (1961).
Collett, T. : Centripetal and centrifugal visual cells in medulla of the insect optic lobe. J. Neurophysiol. 33, 239-256 (1970).
Collett, T. S., Blest, A. D.: Binocular, directionally selective neurones, possibly involved in the optomotor response of insects. Nature (Lond.) 212, 1330-1333 (1966).
Freeman, J. A. : The cerebellum as a timing device: an experimental study in the frog. In: Neurobiology of cerebellar evolution and development (R. Llinas, ed.), p. 397-420. Chicago: Am. Med. Assn. Educ. and Res. F. 1969.

Connections between Insect Visual Neurones 31
Gr/isser, O.J . , Griisser-Cornehls, U. : Neurophysiologie des Bewegungssehens. Ergebn. Physiol. 61, 178-265 (1969).
Kandel, E. R., Frazier, W. T., Coggeshall, R. E. : Opposite synaptie actions media- ted by different branches of an identified interneuron in Al)lysia californica. Science 15~, 346--349 (1967).
Land, M. F. : Orientation by jumping spiders in the absence of visual feedback. J. exp. Biol. 54, 119-140 (1971).
Levick, W. R., Oyster, C. W., Takahashi, E.: Rabbit lateral genieulate nucleus: sharpener of directional information. Science 165, 712-714 (1969).
McCann, G. 9. , Dill, J. C. : Fundamental properties of intensity, form and motion perception in the visual nervous system of Callilghora phaenicia and Musca domestica. J. gen. Physiol. NI, 385--413 (1969).
Moore, G. P., Perkel, D. It., Segundo, J. P. : Statistical analysis and funetionaI interpretation of neuronal spike data. Ann. Rev. Physiol. 28, 493-522 (1966).
- - Segundo, J. P., Perkel, D. It., Levitan, H. : Statistical signs of synaptie inter- action in neurons. Biophys. J. 10, 876 900 (1970).
Perkel, D. H., Gerstein, G. L., Noore, G. P. : Neuronal spike trains and stochastic point processes. 11. Simultaneous spike trains. Biophys. J. 7, 419-44:0 (1967).
Segundo, J .P . , Perkel, 9 . H., Wyman, H., Hegstadt, H., Moore, G.P. : Input- output relations in computer simulated nerve cells. Influence of the statistical properties, strength, number and inter-dependence of excitatory pre-synaptie terminals. Kybernetik 4, 157--171 (1968).
Strausfeld, N. J., Blest, A. D.: Golgi studies on insects. 1. The optic lobes of Lepidoptera. Phil. Trans. B ~gS, 81-134 (1970).
Waldron, I., Wilson, D. M. : Latency relationships between loosely coordinated locust flight motor neurons. J. exp. Zool. 170, 293-300 (1969).
Wilson, D. M. : Central nervous mechanisms for the generation of rhythmic behav- iour in arthropods. Symp. Soe. exp. Biol. ~0, 199-228 (1966).
Wyman, R. J. : Multistable firing patterns among several neurons. J. Neurophysiol. 29, 807-833 (1966).
- - Lateral inhibition in a motor output system. 1. Reciprocal inhibition in dipteran flight motor system. J. Neurophysiol. 112, 297-306 (1969).
Dr. Thomas Collett School of Biological Sciences University of Sussex Brighton, Sussex England