Conflicts between macro level policy and micro level implementation : the case of social exclusion
19
Institute of Transport Studies, Monash University Social Research in Transport (SORT) Clearinghouse Social Research in Transport (SORT) Clearinghouse 1-1-2007 Conflicts between macro level policy and micro level implementation : the case of social exclusion Roger L. Mackett Kamalasudhan Achuthan Helena Titheridge This Conference Paper is brought to you for free and open access by Social Research in Transport (SORT) Clearinghouse. It has been accepted for inclusion in Social Research in Transport (SORT) Clearinghouse by an authorized administrator of Social Research in Transport (SORT) Clearinghouse. For more information, please contact [email protected]. Recommended Citation Mackett, R, Achuthan, K, Titheridge, H 2007, 'Conflicts between macro level policy and micro level implementation - the case for social exclusion', paper presented at the World Conference on Transport Research, held at Berkeley, California, USA in June, 2007
Transcript of Conflicts between macro level policy and micro level implementation : the case of social exclusion

Institute of Transport Studies,Monash University
Social Research in Transport(SORT) Clearinghouse
Social Research in Transport (SORT) Clearinghouse
1-1-2007
Conflicts between macro level policy and microlevel implementation : the case of social exclusionRoger L. Mackett
Kamalasudhan Achuthan
Helena Titheridge
This Conference Paper is brought to you for free and open access by SocialResearch in Transport (SORT) Clearinghouse. It has been accepted forinclusion in Social Research in Transport (SORT) Clearinghouse by anauthorized administrator of Social Research in Transport (SORT)Clearinghouse. For more information, please [email protected].
Recommended CitationMackett, R, Achuthan, K, Titheridge, H 2007, 'Conflicts between macro level policy and micro level implementation - the case forsocial exclusion', paper presented at the World Conference on Transport Research, held at Berkeley, California, USA in June, 2007

1
Paper presented at the World Conference on Transport Research, Berkeley,California, USA, June 2007
Conflicts between macro level policy and micro level implementation -the case of social exclusion
Professor Roger L Mackett, Mr Kamalasudhan Achuthan and Dr HelenaTitheridgeCentre for Transport Studies,University College London,Gower Street,London,WC1E 6BT,United Kingdom
E-mail: [email protected]

2
Conflicts between macro level policy and micro level implementation -the case of social exclusion
Professor Roger L Mackett, Mr Kamalasudhan Achuthan and Dr HelenaTitheridgeCentre for Transport Studies, University College London, London, UK
Abstract
Transport policy should take into account the needs of those who are sociallyexcluded. To help do this, a software tool, AMELIA, is being developed. Datahave been collected in the city centre of St Albans in Great Britain onbuildings and street characteristics. Various aspects of accessibility areconsidered in the paper: access to buildings, obstacles such as widthrestrictions and lack of dropped kerbs, and the distance from car parks andbus stops to reach facilities. Even in an apparently accessible city, there aremany barriers to movement, which will be taken into account in designingAMELIA.
Keywords: Transport policy; Social exclusion; Social inclusion; Accessibility
1 Introduction
Social exclusion is an area of growing concern. It is increasingly beingrecognised that transport policy should take into account explicitly the needsof those who are socially excluded. There is a wide range of characteristicsthat are associated with being socially excluded: having a disability whichincludes being in a wheelchair, having learning difficulties, and being visuallyimpaired; being elderly; being aged about 13 to 20; being a member of anethnic minority; having a low income; being unemployed; not having access toa car; living in a rural area; and being a single parent (Mackett et al, 2004).Usually those who are socially excluded are in two or more of thesecategories, for example unemployed teenagers and low-income people livingin rural areas. There are many policies which can be adopted to help addressthe issues that cause social exclusion. However, the difficulties faced by someof the people who are socially excluded are very micro, for example, obstacleson the pavement which can hinder access in a wheelchair. Hence, micro leveldetails may cause difficulties in the implementation of policies which havebeen designed at the macro or strategic level.
These issues are being explored in a research project being carried out in theCentre for Transport Studies at University College London as part of the workprogramme of the AUNT-SUE consortium (Accessibility and User Needs inTransport in a Sustainable Urban Environment) (see http://www.aunt-sue.info/). In this part of the programme, entitled BAPTIST (Benchmarks andPolicies Towards Inclusive Sustainable Transport), a software tool, AMELIA(A Methodology for Enhancing Life by Increasing Accessibility) is beingdeveloped to test the extent to which transport policies can increase socialinclusion. AMELIA is partially based on existing accessibility models, andincludes availability of modes of travel, trip purpose, socio-economic

3
differentiation, travel time and travel cost. The interface with the user isthrough a GIS (Geographical Information System). The tool is being used toestablish how many people meet accessibility benchmarks defined elsewherein the project with and without policy interventions. As part of the designprocess for AMELIA, the database is being explored to see the extent towhich micro-level barriers to movement can be identified, and how thesemight conflict with accessibility policies. These issues are considered in thispaper.
2 Modelling social inclusion
There are a number of issues that make trying to model the impact oftransport policy on social inclusion rather difficult. Firstly, it should beacknowledged that social inclusion involves many issues that have nothing todo with transport, including politics, poverty and the nature of society.However, better transport can help to overcome many problems associatedwith social exclusion by enabling people to reach opportunities that can helpthem earn money, improve their health and enjoy a rich social life, all of whichcan help make people to feel more included.
The approach being adopted, based on models of accessibility and GIS,means that the aspects of social exclusion that are represented are mainlyphysical, for example, barriers to movement on the pavement, changes oflevel, inaccessible vehicles and high public transport fares. Even within thetransport sphere there are many aspects that are very difficult to address, forexample, information provision, using conventional transport models. Thismeans that the types of barrier to access that can be investigated withAMELIA are physical ones, and so the types of social exclusion that can beaddressed are ones related to physical access, such as being in a wheelchair,or related to travel cost and time, such as reaching employment by publictransport. These are important issues, and can be examined using a GISapproach, as shown, for example in research into wheelchair access usingGIS (Matthews et al 2003; Beale et al, 2006).
In England, local authorities outside London with transport planningresponsibilities are required to produce a Local Transport Plan (LTP) which ispart of a bidding process to obtain funding from central government forexpenditure on local transport policies and projects. Local authorities arerequired to ensure that their LTP shows clear connections between targets forlocal transport, and targets for social inclusion (and economic growth andhousing) (Department for Transport, 2004). This is the rationale behind thedevelopment of AMELIA, since it will enable planners to test explicitly thattheir policies do increase social inclusion (within the limitations discussedabove). There are other tools available to assist transport planners in this area(Mackett and Titheridge, 2004), in particular Accession (2006), which issoftware that was commissioned by the Department for Transport to assist inthe process by showing changes in accessibility brought about by changes inthe transport system. AMELIA will take this further by explicitly linking policieswith the changes in accessibility and incorporating benchmarks, so that

4
planners can explore policy options to test how many more people reach thebenchmarks with each option (Mackett, 2006).
3 Social inclusion policy
The design of AMELIA requires an area to be defined for testing the toolagainst and local authority involvement in the design process. The county ofHertfordshire, which is the county immediately north of London, has beenchosen for this purpose. This research is being conducted in co-operation withHertfordshire County Council (HCC). HCC has produced an LTP which hasnine objectives to help achieve its vision of the future of transport inHertfordshire over the next 20 years. The vision statement in the LTP startswith the phrase “To provide a safe, efficient and affordable transport systemthat allows access for all to everyday facilities” (Hertfordshire County Council,2006a, page 42). This puts inclusion right at the heart of the vision. Theobjective specifically concerned with accessibility states: “To develop atransport system that provides access to employment, shopping, education,leisure and health facilities for all, including those without a car and those withimpaired mobility” (Hertfordshire County Council, 2006a, page 43).
The Accessibility Strategy part of the LTP has three objectives, derived fromdiscussion with key partners and stakeholders: To support those who are disadvantaged to achieve their potential and to
access sustainable employment; To work in partnership with transport providers to achieve an efficient,
affordable and enhanced transport system; To develop a transport system that provides access to employment,
shopping, education, leisure and health facilities for all, including thosewithout a car and those with disabilities (Hertfordshire County Council,2006b, page 5).
This makes it clear that social inclusion is central to HCC’s transport strategy,but that other objectives of being efficient, affordable and enhanced are alsoimportant. In fact, these latter objectives should also increase accessibility forall.
The following priority groups are identified in the Accessibility Strategy(Hertfordshire County Council, 2006b): Primary school children receiving free school meals; Secondary school children receiving free school meals; 16-19 year olds attending college; People without a car; Job Seekers Allowance claimants; Disabled people; People with learning difficulties; People living in rural areas; Older people.
These can be regarded as the groups of people for whom HCC wishes toincrease social inclusion through policies within its LTP. HCC has also defined

5
the facilities that are important for social inclusion in its strategic audit. Theseare shown in Table 1, with the reason they were included and the benchmarkthat is used. The benchmark is the value used to test how many people areable to reach the facility. About half of the types of facility have been definedby the Department of Transport (DfT), but the rest have been introduced byHCC following consultation with local stakeholders.
These policies need to be translated into action. An example relevant to theresearch being described in this paper is the St Albans City CentreSafety/Enhancement Scheme¸ which is one of ten mixed route demonstrationprojects being promoted by the Department for Transport. “In terms ofaccessibility this scheme aims to: Improve accessibility to bus stops by removing current level differences in
the footway and provide dropped kerbs at crossing places; Reduce street clutter and consider street furniture layout to ensure less
obstruction to movement; Consider routes that may be used by visually impaired people and keep
them clear of obstructions; Improve pedestrian signing to locations and consider the needs of visually
impaired people in terms of signing.” (Hertfordshire County Council, 2006a,page 58).
The construction of new infrastructure and changes to the street layout mustnow comply with the Disability Discrimination Act 1995, which gives peoplewith disabilities a right of access to goods, facilities, services and premises. Inorder to help in this process DfT has issued inclusive mobility guidelines(Department for Transport, 2005). These provide guidance on the design ofthe following: Footways, footpaths and pedestrian areas; Tactile paving surfaces; Car parking; Bus stops; Taxi ranks; Access to and within transport-related buildings; Transport building facilities; Signage and information; Lighting; Access in the countryside; Consultation, training and management.

6
Table 1Critical facilities defined in HCC’s Accessibility Strategy.
Type of facility Reason for auditing Benchmark: thresholdlength of journey
Hospitals DfT guidance 60 minutesGPs DfT guidance 30 minutesOther healthcarefacilitiesDentists From local stakeholder
consultation30 minutes
Opticians From local stakeholderconsultation
30 minutes
Pharmacists,chiropodists, facilitiesfor mental health
From local stakeholderconsultation
To be assessed at alater date
SchoolsPrimary schools DfT guidance Not defined because of
statutory requirement forlocal authorities toprovide home to schooltransport
Secondary schools DfT guidance Not defined because ofstatutory requirement forlocal authorities toprovide home to schooltransport
Further educationFE colleges (including1 university)
DfT guidance 60 minutes
Libraries From local stakeholderconsultation
40 minutes
Employment DfT guidance 40 minutesFood shopping DfT guidance 30 minutesOther facilitiesPost offices From local stakeholder
consultationTo be assessed at alater date
Rural tourist facilities From local stakeholderconsultation
To be assessed at alater date
Leisure facilities From local stakeholderconsultation
To be assessed at alater date
Source: Hertfordshire County Council (2006b).
This list indicates the range of detail to which infrastructure must be designedto comply. However, the basis for the advice is not clear. There is someguidance in the inclusive mobility guidelines on the physical parameters ofpeople with different mobility characteristics (Department for Transport, 2005).The sources of these figures are not clear, with the text saying “Walkingdistances were researched in some detail in the late 1980s and, based on thefindings from these studies, the following are recommended”, referring to a

7
table from which the maximum distances shown in Table 2 have been taken.It is stated in the inclusive mobility guidelines that seats should be provided atintervals of no more 50 metres in commonly used pedestrian areas, but noevidence is offered to support this assertion. There are also some anomalies.For example, very detailed specification is given for the dimensions of toiletfacilities within transport buildings such as stations, but there is no guidanceon the number of public conveniences that are required on the street. Formany people, the lack of suitable facilities is a very real barrier to makingjourneys on foot.
Table 2Physical parameters of people with different mobility characteristics
Minimum horizontal gap Maximum walkingdistance without arest
Reasonably fitadult
700 mm Not defined
Adult with child 1100 mm Not definedPerson with limitedmobility, who usesno walking aid
700 mm 100m
Person who usesa walking aid
Walking stick: 750 mm.Two walking sticks, crutches ora walking frame: 900 mm
50 m
Person who usesa wheelchair
Unaccompanied: 900 mm.With ambulant person by side:1500 mm
150 m
Person with avisual handicap
Person using a long cane orassistance dog: 1100 mm.Person being guided: 1200 mm
150 m
Source: Department for Transport (2005).
Anomalies such as this, plus the fact that older areas do not comply with theguidelines means that even with comprehensive inclusion policies such asthose of HCC there may be barriers to access for members of groups such asthose listed above who wish to reach the facilities such as those listed inTable 1. Developing a methodology to help address these possiblediscrepancies is part of the research being described here. This paperfocuses on demonstrating some of the issues involved in trying to developsuch a methodology.
4 Data collection
A database is being set up for Hertfordshire. Macro level data based upon thelocal authority’s information systems and other sources such as the 2001Census of Population, are being assembled for the whole county. Micro-leveldata based upon street audits, including details such as steps, slopes, accessto individual buildings and obstructions on the pavement are being beincorporated into the database. These more detailed data are only for the city

8
of St Albans since it is not feasible to collect such data for the whole ofHertfordshire.
The detailed data for St Albans had to be collected on the street. The threeauthors collected data in the centre of St Albans on 16 May, 29 June, 7 July,and 19 July 2006. The following equipment was used: an inclinometer formeasuring the gradient of slopes, a tape measure for measuring shortdistances, such as between obstacles on the pavement and the kerb, and ameasuring wheel for measuring longer distances, such as the width of roads.Data were collected on the following: buildings, characteristics of the footway,road crossings, bus stops, car parking and features, with one personcollecting the building data, one collecting the other data and the third personusing the measuring instruments. Each item was given a unique numericalcode within its category. The codes were marked by hand using colouredpens onto A3-sized maps printed out from the Ordnance Survey Land-LinePlus database which is being used in the GIS.
The information on buildings was for buildings that members of the publicaccess, but not private buildings or those that only employees access. Foreach building the following was recorded: the unique reference number, thestreet address, the type of building (shop, bank, café, and so on), the name ofit, and the access (level, slope, ramp, or steps, including the number of steps,or the height if it was a single step). The difference between a ramp and aslope is that a ramp is an incline constructed especially to enable people inwheelchairs to reach a different level which others reach by means of steps,while a slope is a small incline to the top of the lip designed to keep rainwaterout of the building. It was perceived that the latter would not pose a significantobstacle to those in wheelchairs, with a gradient of, typically, 2%. According tothe inclusive mobility guidelines (Department for Transport, 2005), a ramp is apathway with a gradient of more than 5 degrees.
Data collected on footways included obstacles to movement, width where itwas narrow enough to pose a possible problem, the material, and its condition,and the gradient where it was steep enough to pose a possible problem. Datacollected on road crossings included the location, the width of the road at thecrossing, the width of the island, if there was one, the type of crossing (zebra,pelican, toucan, school, unmarked or other), and the material. Bus stops wererecorded in terms of location, the type and number of seats, whether or notthere was a shelter, the routes served and the information provided. Data oncar parks included the location, the type (off street or on-street, and in theformer case whether it was ground level, underground or multi-storey, and thelatter case, marked or unmarked bays), capacity, restrictions, cost of parking,length of permitted stay and operating hours. The final data set collected wason features, which included telephone boxes, letter boxes, cash dispensersand seats, which were recorded in terms of type and location. Location wasrecorded on the map using a unique reference number and the street name.

9
Figure 1 GIS layers, for the centre of St Albans. The small map shows theoutput areas from the Census of Population 2001 used as the residentialareas used for the figures in Table 3.Base maps © Crown Copyright 2 006. An Ordnance Survey supplied service

10
5 GIS database
A GIS database was compiled for St Albans using the digital data from theOrdnance Survey Land-Line Plus data as the base. The building polygonswere extracted from it and populated with the data collected in the field asattributes. The buildings were further grouped into different category levelsbased on the Ordnance Survey Points of Interest (POI) classification scheme(Ordnance Survey, 2006). The location data for car parking and features weremapped as point features and linked with their attributes. Using the footwaysand crossing data collected, a detailed pedestrian network layer of the link-node structure was created by manually digitizing the pavements andcrossings using the Land-line data as a backdrop. Once digitized, the networkdata were subject to further editing to include nodes at all decision points suchas crossings and intersections. The links representing footways and crossingswere used to store the respective attribute information collected, which couldbe modelled for network analysis purposes as the cost of traversing aparticular link or as a barrier. Output areas of St Albans were also extractedand linked with Census of Population 2001 data for accessibility analysis ofspecific groups of people. Figure 1 shows the GIS layers modelled for thecentre of St Albans as an example of the GIS.
6 Analysis
Some analysis has been carried out using the data collected in St Albans aspart of the design process, in order to help establish ways of representing thedata and ensuring that AMELIA is sensitive to the type of issue that will beanalysed with it.
One aspect that needs to be considered is whether there are variations inaccessibility if various obstructions are taken into account. For this purposethree types of obstruction are being considered: Crossings without dropped kerbs; Footways with an effective width of less than 1.0 metres; A dropped kerb with a gradient of more than 5 degrees.
People in wheelchairs may not be able to cross the road without a droppedkerb. Furthermore, people who need dropped kerbs to make a journey, needthem at every crossing that they use to reach their destination. Also, theyneed them not to be too steep. The figure of five degrees being used here, isbased on guidance in the inclusive mobility guidelines (Department forTransport, 2005). The width of the footway is also an issue, as indicated inTable 2. For illustrative purposes, a minimum width of 1000 mm is beingconsidered here. To show the possible impact of these obstructions to the1436 people aged 60 or over living the city centre, the effects of theobstructions to three key places in St Albans are shown in Table 3. The keyplaces are the Old Town Hall, which houses the tourist information point andis adjacent to the street market, the City railway station, from which trains goto London, and the City Hospital. 19% of the people aged 60+ cannot reachany of the key places if they need to use dropped kerbs at road crossings.
11
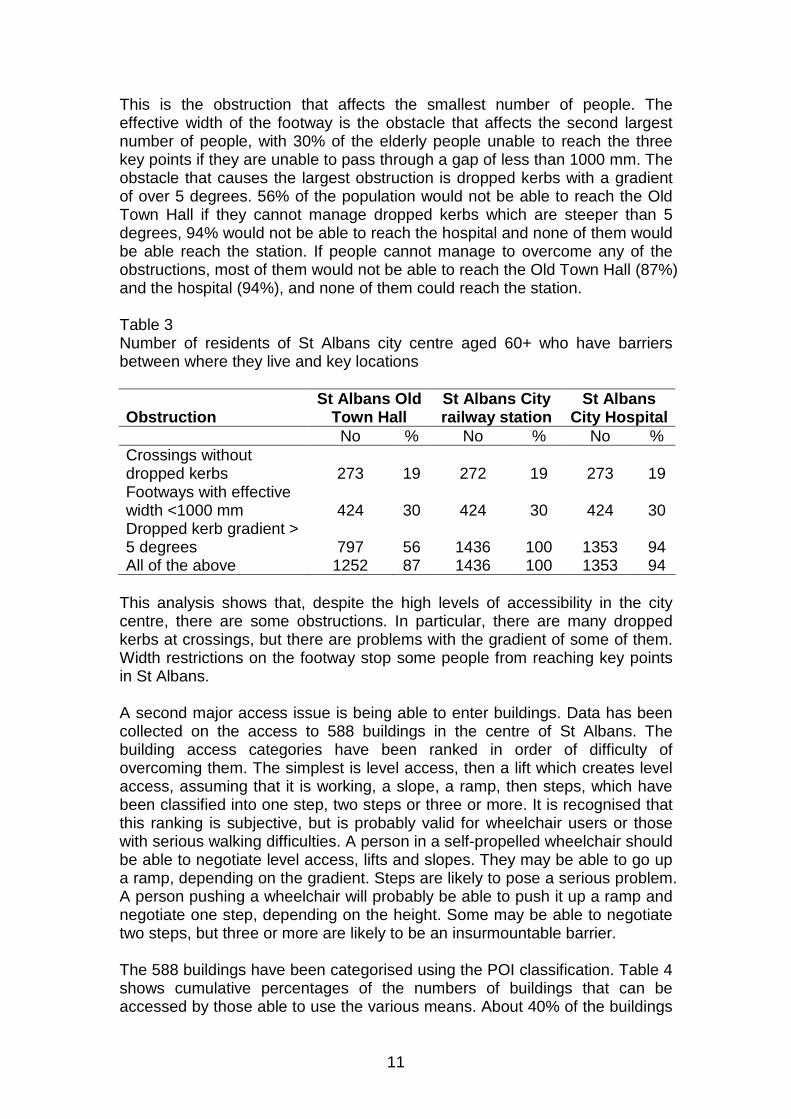
This is the obstruction that affects the smallest number of people. Theeffective width of the footway is the obstacle that affects the second largestnumber of people, with 30% of the elderly people unable to reach the threekey points if they are unable to pass through a gap of less than 1000 mm. Theobstacle that causes the largest obstruction is dropped kerbs with a gradientof over 5 degrees. 56% of the population would not be able to reach the OldTown Hall if they cannot manage dropped kerbs which are steeper than 5degrees, 94% would not be able to reach the hospital and none of them wouldbe able reach the station. If people cannot manage to overcome any of theobstructions, most of them would not be able to reach the Old Town Hall (87%)and the hospital (94%), and none of them could reach the station.
Table 3Number of residents of St Albans city centre aged 60+ who have barriersbetween where they live and key locations
ObstructionSt Albans Old
Town HallSt Albans Cityrailway station
St AlbansCity Hospital
No % No % No %Crossings withoutdropped kerbs 273 19 272 19 273 19Footways with effectivewidth <1000 mm 424 30 424 30 424 30Dropped kerb gradient >5 degrees 797 56 1436 100 1353 94All of the above 1252 87 1436 100 1353 94
This analysis shows that, despite the high levels of accessibility in the citycentre, there are some obstructions. In particular, there are many droppedkerbs at crossings, but there are problems with the gradient of some of them.Width restrictions on the footway stop some people from reaching key pointsin St Albans.
A second major access issue is being able to enter buildings. Data has beencollected on the access to 588 buildings in the centre of St Albans. Thebuilding access categories have been ranked in order of difficulty ofovercoming them. The simplest is level access, then a lift which creates levelaccess, assuming that it is working, a slope, a ramp, then steps, which havebeen classified into one step, two steps or three or more. It is recognised thatthis ranking is subjective, but is probably valid for wheelchair users or thosewith serious walking difficulties. A person in a self-propelled wheelchair shouldbe able to negotiate level access, lifts and slopes. They may be able to go upa ramp, depending on the gradient. Steps are likely to pose a serious problem.A person pushing a wheelchair will probably be able to push it up a ramp andnegotiate one step, depending on the height. Some may be able to negotiatetwo steps, but three or more are likely to be an insurmountable barrier.
The 588 buildings have been categorised using the POI classification. Table 4shows cumulative percentages of the numbers of buildings that can beaccessed by those able to use the various means. About 40% of the buildings

12
have level access. It can be seen that the most accessible type of building isclothing and accessories shops, with 64% offering level access. The threeother retailing categories are the next three most accessible types of building,with food, drink and multi-item shops the least accessible type of shop interms of level access. Only five buildings have only lift access (a number havelift access to upper floors, but this study is focusing on access up to andincluding the entrance, but not beyond). Some of these were on the upperfloor of a modern shopping centre. None of the sports and entertainmentfacilities have level access, but some have lifts. About six per cent of thebuildings have a slope for access, and another four per cent a ramp. The typeof amenity with fewest buildings offering a ramp or better access is eating anddrinking facilities, that is restaurants, cafés, bars and public houses. Whenone step is including in the access categories, retailing is still the mostaccessible, followed by other commercial services, followed by education andhealth. The least accessible type of building are the attractions of which thereare only six, then sport and entertainment, and legal and financial services.The last is the largest of these categories. Many of these are in offices aboveshops, often up rather narrow staircases. Overall, it can be seen that there isconsiderable variety in the access to the buildings in the centre of St Albans.
Whilst some people may be able to reach the city centre by foot (or live there),many others will need to arrive, by mechanized modes, either bus or car. AsTable 2 shows, many people with mobility difficulties can only walk limiteddistances without a rest. Table 5 shows the percentages of the various typesof building within various distances of bus stops. This means that, for example,20 per cent of eating and drinking facilities are within 50 metres of a bus stop,and 46 per cent are within 100 metres of one. To some extent, this is ameasure of dispersal, with food, drink and multi-item shops with most within50 metres of a bus stop. They also have the greatest number within 100 and150 metres. The types of building which tend to be least well served by busstops are clothing and accessories shops, sports and entertainment facilitiesand eating and drinking establishments. Not surprisingly, the facilities whichare least well served by bus stops, as shown by the percentage beyond 200metres from any bus stop, are the smallest categories of motoring shops andattractions. The buildings best served by bus stops within 200 metres arelegal and financial services and food, drink and multi-item shops.
It is possible to take into account the three obstacles shown in Table 3(crossings without dropped kerbs, footways with an effective width of less than1000 mm, and dropped kerbs with a gradient of more than five degrees).Table 6 shows the number of buildings within the various distance bands ofthe bus stops avoiding all three types of obstacle. This reduces the number ofbuildings within 50 metres of bus stops from 26 per cent to 21 per cent. Thefacilities that have the biggest decrease in terms of being within 50 metres ofa bus stop are eating and drinking facilities and sports and entertainmentfacilities. There are reductions in the number of buildings within all thedistance bands if the obstacles are considered. For the 200 metres band, theoverall reduction is from 77 per cent to 64 per cent.

13
Table 4Cumulative percentages of various types of building that can be accessed by those able to overcome various barriers to entry
Access typeSteps
Building ClassLevel Lifts Slope Ramp
1 step 2 steps 3+ steps
Totalnumber ofbuildings
Eating and drinking 32 32 37 37 81 88 100 113Commercial services
Legal and financial 32 32 41 46 68 76 100 37Other commercial services 34 34 38 38 88 95 100 97
Attractions 33 33 33 50 67 67 100 6Sport and entertainment 0 13 38 56 75 75 100 16Education and health 35 35 42 50 85 88 100 48Public Infrastructure 30 37 50 57 77 87 100 30Retail
Clothing and accessories 64 65 65 65 93 99 100 84Food, drink and multi-item 37 37 50 53 93 100 100 30
Household, office, leisure andgarden 47 47 54 55 95 99 100 123
Motoring 50 50 100 100 100 100 100 4Overall percentage 40 41 47 50 86 92 100Total number of buildings 234 5 38 15 216 35 45 588

14
Table 5Percentage of various types of buildings in St Albans’ city centre accessiblewithin distance bands from bus stops
Distance (m)Building Class50 100 150 200
Total no. ofbuildings
Eating and drinking 20 46 67 75 113Commercial services
Legal and financial 51 68 86 95 37Other commercial services 27 65 84 87 97
Attractions 33 50 50 50 6Sport and entertainment 19 50 69 69 16Education and health 27 58 63 69 48Public Infrastructure 20 40 50 57 30Retail
Clothing and accessories 18 51 69 75 84Food, drink and multi-item 47 80 90 90 30
Household, office, leisure andgarden 26 54 70 74 123
Motoring 25 25 25 25 4Total 26 55 71 77 588
Table 6Percentage of various types of buildings in St Albans’ city centre accessiblewithin distance bands from bus stops, taking into account obstructions
Distance (m)Building Class50 100 150 200
Total no. ofbuildings
Eating and drinking 13 31 52 58 113Commercial services
Legal and financial 41 51 68 68 37Other commercial services 24 53 71 76 97
Attractions 33 33 33 50 6Sport and entertainment 13 25 38 44 16Education and health 23 44 52 56 48Public Infrastructure 17 27 37 40 30Retail
Clothing and accessories 17 44 64 71 84Food, drink and multi-item 37 57 70 70 30
Household, office, leisure andgarden 19 41 59 64 123
Motoring 25 25 25 25 4Total 21 42 59 64 588

15
Tables 7 and 8 show the equivalent figures for access from car parks. It canbe seen that, overall, more buildings are within the various distance bandsfrom the car parks than the bus stops. This suggests that the buildings in thecentre of St Albans are more accessible from car parks than from bus stops. Ifthe obstacles are ignored (Table 7), then the buildings best served by carparks, being within 50 metres, are the attractions, followed by clothing andaccessories shops. When a greater distance is considered, the types ofbuilding with the greatest number within 200 metres are food, drink and multi-item shops, and the two commercial services. The least accessible type ofbuilding with only 23 per cent within 50 metres of the car parks is the publicinfrastructure. The attractions are at the same level of 50 per cent for all fourdistance bands, implying that half of them are well served with car parks closeby, and half are not.
Table 7Percentage of various types of buildings in St Albans’ city centre accessiblewithin distance bands from car parks
Taking into account the obstacles (Table 8), the number of buildings within 50metres drops to 28 per cent, which is a larger drop than occurred with busstops, suggesting that the obstacles are more significant barriers for thosecoming by car than by bus. When the obstacles are taken into account, theaccess to public infrastructure decreases even further, with only 10 per centwithin 50 metres of a car park and 40 per cent within 200 metres. The mostaccessible types of building are those housing attractions, education andhealth, commercial services and clothing and accessories shops with aboutone third of the buildings within 50 metres of a car park when the obstructionsare taken into account.
Distance (m)Building Class50 100 150 200
Total no. ofbuildings
Eating and drinking 37 73 81 84 113Commercial services
Legal and financial 41 68 92 95 37Other commercial services 40 76 94 94 97
Attractions 50 50 50 50 6Sport and entertainment 38 69 81 81 16Education and health 38 56 71 75 48Public Infrastructure 23 47 57 60 30Retail
Clothing and accessories 49 81 89 89 84Food, drink and multi-item 37 70 97 100 30
Household, office, leisure andgarden 40 69 86 86 123
Motoring 25 25 25 25 4Total 39 70 84 86 588

16
Table 8Percentage of various types of buildings in St Albans’ city centre accessiblewithin distance bands from car parks, taking into account obstructions
7 Conclusions
This paper has discussed part of the development of the software toolAMELIA which is designed to show the impacts of transport policy on socialinclusion. In order to do this, the aspects of policies that are currently beingintroduced in Britain through the LTP process to take social inclusion intoaccount, have been discussed, using Hertfordshire as an example. Thisanalysis requires integration of information from the policy process, which isstrategic or macroscopic, with detailed information from the inclusive mobilityguidelines, which is microscopic. It was suggested that that the policies maynot work completely because of difficulties at the micro level, that is, out onthe street.
Data have been collected for the city centre of St Albans in Hertfordshire.Despite the very good levels of access in St Albans there are still difficultiesmoving about. It is not possible to reach some key points in the city centrefrom all parts of the city centre without finding crossings without droppedkerbs, or steep gradients on them, or pavements with obstructions whichmake it too narrow for some people to use them. Many of the buildings offerlevel access, but over half of them involve using either a ramp or one or moresteps, which may be difficult for many people. Fourteen per cent of thebuildings involve going up two or more steps, of which eight per cent requireascending three or more. The worst example found was the police station withfifteen steps and a notice saying ‘Unfortunately we are unable to provide levelaccess at this Station. Your nearest station with level access is Hatfield Police
Distance (m)Building Class50 100 150 200
Total no. ofbuildings
Eating and drinking 26 58 65 72 113Commercial services
Legal and financial 32 57 78 84 37Other commercial services 31 58 79 85 97
Attractions 33 50 50 50 6Sport and entertainment 25 44 50 56 16Education and health 33 50 60 69 48Public Infrastructure 10 17 33 40 30Retail
Clothing and accessories 32 64 77 83 84Food, drink and multi-item 23 47 63 77 30
Household, office, leisure andgarden 28 55 72 76 123
Motoring 25 25 25 25 4Total 28 54 69 75 588

17
Station, St Albans Road, Hatfield, Herts, AL10 0EN’. This is a distance of over9 km, which would be rather difficult for anyone in a wheelchair without a car.
It is possible to reach at least some of the buildings in the eleven categoriesdefined within 50 metres of both car parks and bus stops. However, some ofthe buildings are unique, and for some purposes, such as clothes shopping, itis usual to look at several shops in order to make a choice. People eating outwill wish to have a reasonable range, in terms of price and style. In order to besocially inclusive, those with limited mobility should have as wide a range ofchoice as other members of society.
This analysis has shown that data can be collected to demonstrate thataspects of the physical environment can affect social inclusion, and that thesecan be represented in a GIS database of the type to be used with AMELIA.This means that it can be used to show how changes to the physicalenvironment can affect social inclusion. However, it must be remembered thattransport policy is about much more than changing the physical environment,and that most types of social inclusion are less well-defined than the physicalaspects being implied here. This is not to say that physical aspects areunimportant, but to acknowledge that there is much more research to be donein this very important area.
Acknowledgements
This paper has been written as part of a project entitled ‘Accessibility and UserNeeds in Transport’ which is being funded by the UK Engineering and PhysicalSciences Research Council (EPSRC) under grant GR/S90867/01 as part of itsSustainable Urban Environments Programme. The co-operation of theEnvironment Department of Hertfordshire County Council is greatly appreciated.
References
Accession (2006) ‘Helping make places more accessible’, available fromhttp://www.accessiongis.com/.
Beale, L., Field, K., Briggs, D., Picton, P., Matthews, H. (2003) ‘Mapping forwheelchair users: route navigation in urban spaces’, The Cartographic Journal,43 (1), 68-81.
Department for Transport (2004) ‘Full guidance on Local Transport Plans:Second edition’, available fromhttp://www.dft.gov.uk/stellent/groups/dft_localtrans/documents/page/dft_localtrans_504005.hcsp.
Department for Transport (2005) ‘Inclusive mobility’, originally published 2002,updated 2005, available fromhttp://www.dft.gov.uk/stellent/groups/dft_mobility/documents/page/dft_mobility_503282.hcsp.

18
Hertfordshire County Council (2006a) ‘Hertfordshire’s Local Transport Plan,2006/07 – 2010/11’, available fromhttp://www.hertsdirect.org/yrccouncil/hcc/env/plan/transplan/loctranspln/.
Hertfordshire County Council (2006b) ‘Hertfordshire’s Local Transport Plan,Accessibility Strategy, 2006/07 – 2010/11’, available fromhttp://www.hertsdirect.org/yrccouncil/hcc/env/plan/transplan/loctranspln/.
Mackett, R.L. (2006) ‘Benchmarking accessibility’, Presentation at the AUNTSUE Symposium on Inclusive Transport and Urban Design, held at LondonMetropolitan University, 18 January 2006, available fromhttp://www.londonmet.ac.uk/aunt-sue/events.html.
Mackett, R.L., Paskins, J., Titheridge, H. (2004) ‘The incorporation of socialinclusion into policies in Local Transport Plans (LTPs)’, AUNT-SUE ScopingStudy Report, available from http://www.londonmet.ac.uk/aunt-sue/publications.html.
Mackett, R.L., Titheridge, H. (2004) ‘A methodology for the incorporation ofsocial inclusion into transport policy’. Paper presented at the WorldConference on Transport Research, Istanbul, Turkey.
Matthews, H., Beale, L., Picton, P., Briggs, D. (2003) ‘Modelling Access withGIS in Urban systems (MAGUS): capturing the experience of wheelchairusers’, Area, 35 (1), 34-45.
Ordnance Survey (2006) ‘Ordnance Survey Points of Interest ClassificationScheme’, available fromhttp://www.ordnancesurvey.co.uk/oswebsite/products/pointsofinterest/pdf/classification_scheme_v2.00.pdf.