Conflict Technology As a Catalyst of State Formation - Michael ...
49
Conflict Technology As a Catalyst of State Formation Michael-David Mangini and Casey Petroff * January 2022 Word Count: 9,306 Abstract The rapid introduction of artillery to late medieval Europe initiated a massive security crisis by rendering existing urban fortifications obsolete. Instead of turning to existing networks of alliance and patronage to strengthen collective security, cities surrendered their sovereignty and agglomerated into states. How were nascent states able to consolidate authority over the formerly sovereign polities? We propose that cities had to surrender sovereignty to states because the gunpowder revolution forced them to construct new fortifications that required external financing. States were better positioned to use concentrated political authority to efficiently finance the new fortifications and coordinate inter-city security cooperation. We test the theory using detailed data on city-level urban defensive investment, the locations of artillery manufacturers, and the changing locations of national borders. We find that after the development of gunpowder technology, new defensive investments were more likely to be located in areas where borders disappeared, were built closer to politically relevant national borders, and were further from the sites of raw building materials. These findings are consistent with the theory that states arose in part as a consequence of changes in the technology of warfare. 1 Introduction On May 29, 1453, the walls of Constantinople were breached by Ottoman forces, effectively ending the Byzantine Empire and introducing a major new power into the geopolitics of Europe. The * Mangini ([email protected]) and Petroff (petroff@g.harvard.edu) are PhD Candidates in Political Economy and Government at Harvard University. They are grateful to Scott Abramson, Stephen Chaudoin, James Fenske, Jeffry Frieden, Kosuke Imai, Torben Iversen, Anne E. C. McCants, Massimiliano Gaetano Onorato, Christina Davis, Claudia Rei, Hans-Joachim Voth, the Imai Research Group at Harvard University, and participants at the University of Warwick CAGE Summer School, Young Scholars Initiative-EHES Economic History Graduate Webinar, Harvard Economic History Workshop, and Harvard Political Economy Workshop for valuable feedback; to Scott Walker of the Harvard Map Collection for GIS assistance; and to Benjamin A. Sunderland for his expertise on early modern foundry technology. Any remaining errors are our own. 1
-
Upload
khangminh22 -
Category
Documents
-
view
0 -
download
0
Transcript of Conflict Technology As a Catalyst of State Formation - Michael ...
Conflict Technology As a Catalyst of State Formation
Michael-David Mangini and Casey Petroff∗
January 2022
Word Count: 9,306
Abstract
The rapid introduction of artillery to late medieval Europe initiated a massive security crisisby rendering existing urban fortifications obsolete. Instead of turning to existing networks ofalliance and patronage to strengthen collective security, cities surrendered their sovereignty andagglomerated into states. How were nascent states able to consolidate authority over the formerlysovereign polities? We propose that cities had to surrender sovereignty to states because thegunpowder revolution forced them to construct new fortifications that required external financing.States were better positioned to use concentrated political authority to efficiently finance the newfortifications and coordinate inter-city security cooperation. We test the theory using detaileddata on city-level urban defensive investment, the locations of artillery manufacturers, andthe changing locations of national borders. We find that after the development of gunpowdertechnology, new defensive investments were more likely to be located in areas where bordersdisappeared, were built closer to politically relevant national borders, and were further from thesites of raw building materials. These findings are consistent with the theory that states arose inpart as a consequence of changes in the technology of warfare.
1 Introduction
On May 29, 1453, the walls of Constantinople were breached by Ottoman forces, effectively ending
the Byzantine Empire and introducing a major new power into the geopolitics of Europe. The∗Mangini ([email protected]) and Petroff ([email protected]) are PhD Candidates in Political Economy
and Government at Harvard University. They are grateful to Scott Abramson, Stephen Chaudoin, James Fenske,
Jeffry Frieden, Kosuke Imai, Torben Iversen, Anne E. C. McCants, Massimiliano Gaetano Onorato, Christina Davis,
Claudia Rei, Hans-Joachim Voth, the Imai Research Group at Harvard University, and participants at the University
of Warwick CAGE Summer School, Young Scholars Initiative-EHES Economic History Graduate Webinar, Harvard
Economic History Workshop, and Harvard Political Economy Workshop for valuable feedback; to Scott Walker of the
Harvard Map Collection for GIS assistance; and to Benjamin A. Sunderland for his expertise on early modern foundry
technology. Any remaining errors are our own.
1

Ottoman victory was made possible by new technology – a massive bombard designed by the
Hungarian gunmaker Orban. It was not the first cannon used in European siege warfare, but
it exemplified how gunpowder had transformed the nature of conflict. Within a relatively short
period of time, nearly all of Europe’s urban defensive fortifications were rendered obsolete by
advances in artillery. The same period also saw the upheaval and evolution of the European political
system. When Constantinople fell, most states in Europe were city-states, kingdoms, or empires —
either small, autonomous polities or large ones without centralized, differentiated, and autonomous
structures (Tilly 1990). Within three hundred years, however, Europe was characterized by states
that used consolidated political authority to collect taxes, make laws, and support standing armies.
The old system of cities that autonomously made alliances during wartime and cooperated to form
trade unions was dismantled as cities were absorbed by territorial states. How were nascent states
able to consolidate authority over the formerly sovereign polities?
We contend that the “gunpowder revolution” created an unprecedented security crisis in Europe
requiring massive investments in defensive technology that could not be managed by cities acting on
their own. Cities whose defenses had been effective protection for decades or even centuries became
vulnerable to cannon fire within a single generation. All but the wealthiest cities required external
financing to construct the massively expensive new fortifications that were needed to resist artillery
fire. Security cooperation became essential because a perimeter of walled cities could protect interior
cities far more economically. In principle, cities and kingdoms could have drawn on existing alliances,
such as networks of feudal patronage or trade confederations, for mutual support and assistance.
However, the severity and suddeness of the gunpowder revolution created strong incentives for cities
to secure their own limits before contributing to collective resources even if collective security was
stronger. The authority of national states was required to ensure that 1) cities could not free ride
on the investments of others and 2) that wealthy cities did not waste resources by constructing
expensive walls in strategically inferior locations. Cities agglomerated, either willingly by treaty
or involuntarily by force, into states that could use coercive authority to overcome obstacles to
inter-city security cooperation and manage the security crisis caused by the gunpowder revolution.1
To validate our theory, we empirically test the spatial and temporal relationship between the
impact of the gunpowder revolution and the rise of modern states in Europe. We contribute a new1For our purpose, we use “city” to refer to any stand-alone settlement, regardless of size or formal legal status.
2

dataset on the construction timelines of urban fortifications for over 4000 European population
centers in the medieval and early modern periods by geolocating the work of Stoob (1988). We
combine these data with information on the locations of artillery manufacturers from Kennard
(1986) and state borders in five-year increments from Abramson (2017).2 Our first test compares the
spatial distribution of sophisticated urban fortifications and a measure of territorial consolidation.
Consistent with the theory, we find that fortifications capable of resisting artillery were constructed
in places where states consolidated authority over territory. Second, we show that sophisticated
fortifications were more likely to be constructed in strategic locations for the defense of states after
artillery were introduced. Third, an analysis of the timelines of defensive investment supports
the theory that states actively redistributed resources to support wall construction in strategically
important cities.
The work that most directly relates to ours, Tilly (1990), studies the variation in paths to state
formation in Europe. Tilly and the literature his work inspired describes state development in
Europe as a positive feedback cycle in which states “accumulated coercion and capital” from cities
for the purpose of waging war against other states (Bean 1973; Spruyt 1996, 2017; Gennaioli and
Voth 2015; Kaspersen and Strandsbjerg 2017). We further develop Tilly’s pioneering work in two
main ways. First, we explain why Tilly’s cycle where “war made the state and the state made
war” began in Europe when it did (Tilly 1975). We assert that the relatively rapid introduction of
gunpowder and the sudden obsolescence of existing defensive technology were necessary catalysts.
Second, we explain why it was necessary for cities and smaller territories to lose the sovereignty
and autonomy they had maintained for centuries. Our answer is that only a national state had the
necessary political authority to overcome obstacles to investments in collective security.
Our theory also demonstrates how the political economy of security cooperation relates to the
process of state formation. We argue that the costs of cooperation determine whether security
is provided by alliances or by extending the state’s borders. The argument echoes the work of
Coase (1960) and Williamson (1979), which invokes transactions costs to explain the division of
activities between markets and firms. Our work also contributes to the literatures on the economic
determinants of state size and urbanization. Alesina and Spolaore (1997) and Alesina and Spolaore
(2005) argue that the number and size of nations depend on the costs of providing public goods to2We owe a debt of gratitude to Scott Abramson for sharing data on state borders from Abramson (2017).
3
heterogenous populations. Our contention is that economies of scale in the provision of a particular
public good – collective security – encourage states to consolidate political authority. Dincecco and
Onorato (2016) shows that populations flocked to cities in Europe because they were “safe harbors”
from violence. Our work describes how the high costs of maintaining fortifications to create safe
harbors in the face of an evolving threat from gunpowder necessitated support from states.
Our work also speaks to recent debates about the internal and external validity of the bellicist
theory of state formation. Abramson (2017) argues that the bellicist thesis is unpersuasive because
small states persisted long into the post-Westphalian era.3 Our study partially reconciles Abramson’s
critique with the bellicist theory by explaining why some cities could resist incentives to agglomerate
and persist as city-states. Cities that were rich enough to upgrade their defensive technology without
outside help resisted agglomeration for longer. Other critiques of the bellicist theory come from
studies of state-making outside Europe. Centeno (1997), Centeno (2002), and Herbst (2014) find
negative relationships between conflict and state formation in South America and Africa. Our study
supports an explanation for why the bellicist theory appears better suited to Western and Central
Europe: the relatively rapid and relatively equal introduction of gunpowder in late medieval Europe
created a security crisis best addressed by agglomerating the existing polities into states.4
Our work also relates to the literatures on international cooperation and conflict. A large
literature studies how states use international organizations to overcome collective action problems
(Keohane and Nye Jr 1973; Axelrod and Keohane 1985; Keohane 1986; Gowa 1986; Powell 1991).
A subliterature applies this theory to the provision of collective security (Kupchan and Kupchan
1995; Acharya 2004; Thakur 2016; Hough 2020; Meijer and Brooks 2021). Our work describes
what happens when existing international institutions are insufficient to overcome obstacles to
cooperative investments in collective security. We find that polities are ultimately forced to surrender
their sovereignty and voluntarily join a national state for protection or be conquered and forcibly
assimilated. Thus, we find that the strength and boundaries of national states depend on the costs
to enforcing inter-polity cooperation.
Some literature has previously considered the relationship between the military revolution and3See Appendix Figure A1 on changes in the size and number of states in Europe over time.4Hoffman (2015) provides a theoretical foundation for this claim. He shows that relatively even costs of conflict
were a necessary precondition for the tournament structure of state development that characterized European politicaldevelopment.
4

state formation. Bean (1973) discusses how various changes in the technology of war incentivized
states to develop tax capacity. Our work differs from his by describing 1) the unique importance of
defensive fortifications and 2) the logics of interstate conflict and cooperation that resulted in the
agglomeration of states. McNeill (1982), particularly Chapters 3-5, traces the concomitant political
and military developments in Europe during the early modern period. Spruyt (1996) in Chapter
8 considers why the Hanseatic League was supplanted by states. His argument emphasizes the
superiority of the state at managing inter-city economic affairs and markets. Following Spruyt, our
argument acknowledges the role of economics in encouraging cities to agglomerate into states. We
additionally explain that agglomeration occurred when it did because of the security crisis initiated
by the gunpowder revolution.
2 Historical Background on the Technology of Conflict and the
Gunpowder Revolution
Prior to the introduction of cannons, fortified settlements provided very effective defense against
conflict. Thus, while siege warfare was a relatively common offensive strategy, it was frequently
unsuccessful (Eltis 1989; Tracy 2000). The best defense against a besieging army was a tall city
wall – the purpose of the fortification was to keep soldiers and projectile fire from trebuchets from
coming into the city. Early walls were relatively thin because it was wasteful to use stone to thicken
a wall rather than build it higher. While sieges were much more common than pitched battles in
the medieval era, they were also unlikely to succeed against walled cities. Most cities that were
conquered during this period were brought down by domestic insurrection rather than a foreign
menace (Parker 1976; McNeill 1982; DeVries 2012).
The domestic politics of towns and cities, including the politics of self-defense, were intertwined
with the incentives of local and regional powers. Local nobility frequently contributed to the
financing of fortifications, which not only protected urban residents but also provided safety for
the rural population that worked the land immediately around the town. Other wealthy urban
residents frequently contributed large sums as money as well. Regardless of whether the local lord
contributed monetarily, his permission was generally required to erect a wall, as doing so made a
city more self-sufficient and thus lowered the cost of revolt (Tracy 2000; Wolfe 2000). If no local
5

Table 1: Timeline of major innovations in ordnance technology (adapted from McNeill 1982).
Date Event
1346 First recorded military use of gunpowder at Battle of Crécy(Hundred Years’ War)
1453 Constantinople’s walls destroyed by Ottoman ordnancec. 1470 Smaller, more transportable cannons developed in France and
Burgundy; the design for siege weapons remains stable until 19th c.c. 1525 Trace italienne designed in Northern Italy
1543 Improvements in ironworking technology make iron cannoncost-effective, although bronze is preferred until late 17th c.
c. 1625 Gustavus Adolphus of Sweden pioneers use of field artillery
power was dominant, a city might bargain with potential aggressors or support one side in a conflict
in order to improve their material interests. For instance, in 1159, the town of Cremona, Italy,
allegedly paid Frederic Barbarossa to launch an attack against its regional rival, the neighboring
city of Crema. In a case of a successful siege, Barabossa attacked and destroyed Crema after its
citizens refused to voluntarily demolish their walls in surrender (Freed 2016, 245).
However, the introduction of gunpowder artillery altered the strategic situation of European
cities. There was no single year when cannons came to dominate the European landscape. Instead,
they rose to prominence over a period of roughly 75 years (Table 1) – still a relatively short period
of time. Among the earliest confirmed uses of cannons was at the Battle of Crécy in 1346, where the
English deployed small bombards against their French adversaries in an open field. In the 1430s and
1440s, King Charles VII relied on bombards to reconquer English towns and cities in France (Parker
1976, 203). These early bombards were large, heavy, and unwieldy because in these early years the
easiest way to increase the force of a cannonball was to increase its mass. Nonetheless, they were
extraordinarily potent weapons against the thin walls that dominated European fortification design.
Cities that had previously been secure were suddenly under threat.
It was not until around 1450 that a solution was discovered to close the offense-defense gap
(Levy 1984; Hopf 1991; Van Evera 1998).5 Italian military engineers, who had been experimenting
with different fortification designs, converged on a new type of design that became known as the
trace italienne.6 Early versions involved propping up existing walls with earthen barriers that could
absorb the impact of cannon fire. Later versions of the design featured low and thick walls with5For more theoretical treatments of the offense-defense balance, see Jervis (1978), Fearon (1997), and Gortzak,
Haftel, and Sweeney (2005).6Similar defensive structures were developed in parallel by Northern European military engineers, but for brevity,
we will use the term trace italienne to refer to all early modern bastioned star-shaped walls and fortresses.
6

tapered edges that gave defenders unobstructed access to fire their own artillery down on attackers.
These new walls were tremendously effective. Besieging armies had to resort to encircling and
starving out their adversaries, an extremely long and expensive process (Parker 1976).
However, the new fortifications came with a large price tag. Their construction required enormous
resources. The expense was significant enough that local elites could generally no longer afford
to construct the walls using local resources alone. In 1553, the city-state of Siena attempted to
construct a trace italienne when faced with a threat from Florence. The city was successful at
constructing the new walls before the Florentine army arrived, but they had spent so much that the
city could not afford to pay enough mercenaries to defend the new walls and surrendered quickly
(Parker 1996, 12). The Dutch city of Antwerp successfully invested in upgrading its fortifications
beginning in 1542, but the heavy price tag put a permanent strain on the city’s fiscal situation,
compromising its ability to defend itself during the religious conflicts of the 1560s (Limberger
2016). Even after initial construction was completed, defensive walls required further expenses for
maintenance and modification. Especially in the early years, cities needed to continuously update
their fortifications in response to the evolving technology of gunpowder; there are cases of defensive
fortifications rendered obsolete while still under construction (Parker 1996).
3 Theory of Agglomeration and the Technology of Conflict
Centralized states offered real advantages in an international system characterized by potent siege
weapons that could only be countered with costly defenses. The first advantage was that states
are territorial – they consist of both a border and an interior. Defenses at the border provided
indirect security for cities in the interior.7. Second, states could use coercive authority to alleviate
commitment and free riding problems in the provision of defense. Without states, commitment
problems unique to the challenges of the gunpowder revolution would have undermined the provision
of collective security.
States could provide security much more efficiently than any individual city by using investments
in defensive fortifications at the border to protect cities on the interior (Tracy 2000). It was usually
not an effective strategy for attackers to simply bypass border cities. Conquering border cities was7Indirect security matters even in the absence of a continuous border wall. Continuous walls have been favored in
other contexts, for instance, by the Chinese Ming dynasty and the Roman Empire
7

often itself an objective of invading forces who wanted access to their tax bases and economic assets.
Fortifying border cities, therefore, forced invaders to expend extra effort and stretch their campaigns
further in search of softer cities. Cities could also act as garrisons for a state’s armies from which
they could mobilize defenses and counteroffensives against threats.
Establishing strong border defenses required interior cities to contribute resources for border
defense in return for indirect protection. Before gunpowder, this type of security cooperation was
not essential. Sieges against walled cities were costly and risky, and domestic insurrection was a more
potent security threat (Eltis 1989). Once gunpowder was introduced, it increased the probability
of a successful siege, which also increased the salience of external threats to cities. The extreme
costs of protecting a city against artillery dramatically increased the rewards to this type of security
cooperation. At the same time, the proliferation of strong states meant that the primary threat
to cities shifted from domestic insurrection and inter-city conflict to encroachment by expanding
regional powers.
There are at least three obstacles to security cooperation that the state’s consolidated central
authority could alleviate. First, interior cities had incentives to free ride on the financial contributions
of others – they could benefit from the security provided by border cities without contributing
resources of their own. A central state with the coercive authority to extract and redirect resources
could prevent free riding by requiring each city contribute. In the absence of a state to coordinate
defense, cities might nevertheless have cooperated among themselves on security under threat from
the “shadow of the future” (Axelrod 1986; Powell 1993). However, the shadow of the future was a
less powerful incentive when cities were constantly under threat and could not guarantee future
cooperation in the event that they were conquered. The coercive power of the state was necessary
to solidify cooperation in an environment where the shadow of the future was potentially short.
Second, border cities might have underinvested in defenses unless they valued the security
indirectly provided to other cities. The first priority of any city was to secure its immediate vicinity
and its food supplies. Any security indirectly benefiting other cities was a byproduct of investments
made to achieve these priorities. There was a principal-agent relationship between the interior cities
and the border cities – the interior cities were dependent on the border cities to stop attackers.
States could use their authority to compel border cities to take additional steps to ensure the
security of the interior.
8

Third, wealthy interior cities may have attempted to construct a trace italienne to assure their
own security rather than contribute resources to border cities. Cities in a defensive league sometimes
withheld their financial contributions to collective security in order to prioritize their own defense.
The severity of the security threat from gunpowder meant that the stakes for cities were very high,
which exacerbated the commitment problems. A strong national state solved the commitment
problems by forcing individual cities to make sacrifices in order to provide stronger security for all.8
One alternative to states was a defensive league. These leagues were common in Europe during
the medieval period, but they ultimately fell prey to the kinds of problems we describe above. For
instance, in the late 1300s, the cities of the Hanseatic League successfully waged war on the Kingdom
of Denmark and seized Danish territory in Sweden. However, the League eventually relinquished the
territory due to internal disagreements over which members should bear the cost of maintaining its
security; no cities were willing to bear the cost on their own to the benefit of free-riders (Postel 1996).
The Dutch Republic, a hybrid polity that combined aspects of a centralized state and independent
city-states, faced serious problems balancing the security objectives of its constituent cities. The
city of Delft prevented its rival, the Hague, from fortifying because of the threat the Hague would
pose to other members if it became too powerful. Then, when the Dutch Republic was threatened
by Spain, Delft suggested that the unfortified Hague should be burned down to prevent a Spanish
occupation (Hart 1989). The Swiss Confederacy fell prey to a coordination failure on an even greater
scale in 1529 and 1531, when Protestant and Catholic members of the alliance waged war on one
another in sectarian conflict (Greengrass and Gordon 2002). A strong state that could successfully
monopolize violence and extract and allocate resources for defense of its territory could avoid all of
these pitfalls.
Cities agglomerated into national states both voluntarily and involuntarily. Our theory does
not necessarily predict whether cities would resist or embrace agglomeration – rather, we contend
that agglomeration is an equilibrium characteristic of the European political system following the
gunpowder revolution. Some cities might voluntarily concede sovereignty to a central state in
anticipation of receiving the necessary security. When facing substantial foreign threats, some cities
might choose to join a central state on their own terms rather than be conquered. The cities that8Of course, the state may have chosen to allow wealthy interior cities to construct strong fortifications if doing so
were in the state’s interest.
9

were either unable or unwilling to join states would be conquered and incorporated into stronger
national states. Other cities could agglomerate in a piecemeal fashion over time, or en masse as the
result of an impetus like the religious conflicts of the Thirty Years’ War.
Not all cities had the same incentives to coordinate their defenses, and not all states were
successful at providing security guarantees. Some cities in Europe were rich enough to construct
their own trace italienne without outside resources. These cities did not need to agglomerate
to states. To the extent that these cities constitute the persistent urban centers emphasized by
Abramson (2017), we can reconcile our primarily bellicist theory of state formation with his economic
approach – richer cities had fewer incentives to agglomerate and more resources to resist conquest.
Abramson (2017)’s finding that larger states were less likely to survive also comports with our
theory. Once a state’s border was breached by an enemy, its relatively vulnerable interior could be
attacked. Large states might survive if they could quickly consolidate their coercive authority, but
they faced the additional challenge of asserting control over a larger area. Any existing empires that
were too decentralized and unable to redistribute resources from the interior to fortify the border
defenses were at risk of conquest regardless of their geographic size.
Positive feedback was an important feature of state formation in Europe. The feedback process
between the threat of conflict and the formation of states has previously been studied by Tilly
(1990). The standard theory emphasizes how the proliferation of strong states in Europe caused
a surge in military threats, which encouraged the concentration of coercive authority and led to
stronger and more threatening states (Spruyt 1996, 2017; Voigtländer and Voth 2013; Gennaioli
and Voth 2015; Kaspersen and Strandsbjerg 2017). Our theory modifies the existing literature by
studying how the geopolitical component of this feedback process interacts with the technology
of conflict. One key component of our geopolitical theory is the relative salience of internal and
external threats. Collective security was more effective when cities faced external threats because
the defense of any one city also benefitted the polity as a whole. The gunpowder revolution increased
the salience of external threats by rendering traditional defenses obsolete. The concentration of
coercive authority in states also meant that the origins of external threats became more predictable.
As threats increasingly originated from foreign states, the concept of border defense became more
essential, encouraging cities to invest in border fortifications.
10

4 Research Design
Our theory is that states supplanted existing political networks of cities in medieval Europe in part
because they were better positioned to coordinate necessary investments in urban fortifications that
could defend against artillery. To provide empirical support for this theory and to illustrate the
political implications of the economics of conflict in the medieval period, we subject the theory to
several tests. Additional analyses and robustness checks can be found in the Appendix.
First, we test whether localities that constructed walls in the post-gunpowder period were also
places that saw the most political consolidation into states. Our work introduces a new measure of
political consolidation based on territorial agglomeration, or the disappearance of political borders.
If the need for updated walls were an important factor driving consolidation, then we expect a
positive relationship between the locations of new defensive investment and agglomeration. Our
primary objective in the statistical analysis is to evaluate whether there exists a positive relationship
between these variables after accounting for potential confounders.9 Questions related to the precise
timing of wall construction are additionally investigated in a case study of France.
Second, we test whether new walls were constructed near the borders of states, where they
were more strategically valuable for defense. Our theory portrays economies of scale in defensive
investment as an important reason that states were better suited to the post-gunpowder world.
Before gunpowder raised the costs of effective defense, many cities could afford protection. States,
however, could mitigate the expense of upgraded fortifications by spreading the cost among many
cities. Our second test, conducted at city level, examines this important aspect of the theory by
comparing the relative proximity of new defensive investments to borders across time.
Third, we test whether states were able to effectively redistribute resources for the purpose of
coordinating defenses. Our theory predicts that the rise of states changed the spatial distribution
of defensive investment as states redirected resources to their borders. To test this theory, we
construct a panel dataset about historic defensive investments in each city over time.10 Empirically,
we observe that the cities that upgraded their walls to protect against artillery were not always the
same as the cities that built the strongest walls before the gunpowder revolution. We find that the9We perform this analysis using a grid of 0.5 × 0.5 degree cells. See Section 4.1.1 for data construction details.
10Details on the construction of this dataset are available in Appendix XX.
11

cities that “caught up” to the technological frontier were located in places that experienced political
consolidation.
Our work also includes a direct test of resource redistribution. We examine whether proximity to
an important construction material, limestone, predicts wall construction. Before states, cities had
to rely on local resources to construct walls. We find that in the pre-gunpowder period, distance to
limestone predicts wall construction because it was very costly to move raw building materials across
long distances. However, as states gained political authority, they could subsidize construction costs,
weakening the link between access to resources and local investment.
4.1 Data
4.1.1 Agglomeration and Borders
Pre−1450 Post−1450
5°E 10°E 15°E 20°E 25°E 5°E 10°E 15°E 20°E 25°E
42°N
44°N
46°N
48°N
50°N
52°N
54°N
56°N
1 10 100Border Length Disappeared (km)
Figure 1: Heatmaps of border changes. The scale corresponds to the summed length of smoothed borderthat disappears within each cell.
We want to measure political consolidation, which was marked by the territorial agglomeration
of small polities into larger states. We measure agglomeration by observing the disappearance of
12

political borders from one period to another. The agglomeration of polities into states almost always
results in the disappearance of a border. The border could disappear as a result of conquest or
voluntary cession. We omit new borders from the analysis because they could contaminate our
measure with instances of political fragmentation. More specifically, the sample space is divided into
grid cells and the length of borders eliminated across five-year periods in each cell is calculated.11
From 1190-1450, the mean (median) amount of border eliminated in one grid cell is 49.16 km (41.86
km); for the post period, lasting from 1450 to 1790, the mean (median) is 94.52 km (66.31 km).
Amsterdam
51.8°N
52°N
52.2°N
52.4°N
52.6°N
52.8°N
53°N
4°E 4.5°E 5°E 5.5°E 6°ELon.
Lat.
1470
Amsterdam
51.8°N
52°N
52.2°N
52.4°N
52.6°N
52.8°N
53°N
4°E 4.5°E 5°E 5.5°E 6°ELon.
Lat.
1475
Name Burgundians Cleves−Mark The Holy Roman Empire
Figure 2: This example demonstrates our border elimination measure. The left-hand figure shows bordersaround the city of Amsterdam as they stood in 1470. The right-hand figure shows borders five years later, in1475. The red line in the bottom right-hand corner of 1475 image shows a border that is counted as eliminatedsince 1470 due to victories of Charles the Bold, Duke of Burgundy, against the Holy Roman Empire nearAmsterdam between 1470 and 1475. Only parts of the 1475 border that fall outside of a 10-km buffer zonearound 1470 borders are counted as a significant eliminated border. The 0.5-by-0.5-degree grid is overlaid.
A heat map showing border changes is included in Figure 1 using the cells discussed in Appendix
B. Consistent with the literature, the map shows that states consolidated their territory much more11The grid cells are 0.5 × 0.5 degree polygons (roughly 55 square kilometers). To avoid capturing noise arising from
small, politically insignificant border changes, we only count borders that are outside of a 10-kilometer buffer zone ofnewly created borders. To avoid falling prey to the “coastline problem,” borders are smoothed before the length ofeliminated borders is summed (Mandelbrot 1967). More details are available in Appendix B.
13

aggressively after 1450.12 But it also shows that they did so in two complementary ways. First, the
map shows that grid cells saw more borders disappear during this period. This is evidence that
territory was consolidated along an intensive margin: the average cell saw more consolidation in
this period. Second, the map shows that more grid cells saw borders disappear after 1450. This
is evidence of consolidation along an extensive margin. An example illustrates precisely how our
variable measures agglomeration. Appendix Figure 2 shows an example of our methodology in action
for the grid cell containing Amsterdam, which experienced a significant border change between 1470
and 1475 due to the seizure of territory by the Duke of Burgundy during the Burgundian Wars.
We test hypotheses relating to the distribution of walls within states by calculating the distance
from every wall construction to the nearest border. For each city, we construct a measure of the
border-centroid ratio, the ratio of the city’s distance from the nearest border to its distance from the
geographic centroid of its state. Our theory indicates that states will make defensive investments
where they are most strategically useful: near the state’s borders. Smaller values indicate that the
city is relatively far from the geographic centroid of the state and relatively close to the border. For
example, a border-centroid ratio of 1/2 indicates that the city is twice as far from the centroid as it
is from the nearest border. One challenge in calculating the border-centroid ratios is that while we
observe European borders in five-year increments, we can only observe wall construction at longer
horizons (as discussed in Section 4.1.2). We calculate the border centroid ratio for every wall in
every map and then use the minimum distance over a defined period as the outcome variable. The
minimum ratio is appropriate because it represents the maximum strategic value of the city to the
state’s defense.
We use the border-centroid ratio instead of simply the border distance to ensure our results do
not mechanically depend on the shape of the borders or the state’s size.13 To the extent that a
state’s size can be substantively linked to the border-centroid ratio, the relationship is endogenous to
our theory. For example, small states may contain only a single city near their geographic centroid.
These instances may reflect wealthy cities that can update their walls without external support.12In particular, we can recreate figures similar to the key graphs of Abramson (2017) in our sample space. See
Appendix Figure A1.13We demonstrate by simulation in Appendix D.
14

4.1.2 Changes in Defensive Technology
For data on the development of urban defenses, we geocode a map from Stoob (1988), which
documents the locations of 6,378 fortified cities. The map covers territory stretching from modern-
day Central France to the Polish-Russian border longitudinally and from the North Sea to the
Swiss-Italian Alps latitudinally. It encodes the construction dates and construction types of each
city’s defenses. The map breaks down construction dates into four broad time periods: pre-1190,
1190-1250, 1250-1450, and 1450-1800, corresponding to the early, high, and late medieval eras and
the long early modern era. The map details six distinct types of wall construction: earthen, wooden,
stone, reinforced stone, bulwarks, and bastions. Figure 3 illustrates the spatial distribution of wall
construction over time. Appendix Table A1 shows the number of walls by type and period.
15

Simple Complex
Pre−
1450P
ost−1450
Figure 3: Each red point represents new simple (stone or reinforced) and complex (bulwarks and bastions)wall construction in that period for the specified wall type. Definitions for each construction type can befound in the text. While Stoob (1988) originally reported the data in four periods (pre-1190, 1190-1250,1250-1450, and 1450-1800), for ease of viewing, we have collapsed the data into just two: pre-1450 (largelypre-gunpowder, except for the very end of the period) and post-1450 (clearly post-gunpowder). Each bluediamond represents the location of a gunmaker (Kennard 1986). The shaded area represents the part of themap for which fortification data is available. Modern borders are shown for reference.
Earthen fortifications were typically large defensive trenches dug around a town and only appear
before 1250; wooden fortifications were palisades that could be built in combination with earthworks
or stone gates. Stone walls were typically the tall and thin walls described above. Reinforced walls
were stone walls that had been substantially modified for height or strength. Collectively, we refer
to these stone and reinforced permanent structures as “simple” walls, to contrast them with the
16

later “complex” walls designed to withstand gunpowder. However, early stone and reinforced styles
were advanced defensive construction compared to earthworks or wooden palisades.14
Only two types of walls reported in Stoob’s dataset could certainly have withstood cannon fire:
bulwarks and bastions, which we term “complex” construction. Bulwarks were typically quadrilateral
walls effectively reinforced with earth. Bastions were the trace italienne described above: tapered
walls in a star shape whose corners were reinforced with bastions (DeVries 2012). The time periods
delineated by the map do not cleanly correspond to the timeline of the introduction of gunpowder
to Europe. Cannons become relevant as effective weapons against walled cities in the last several
decades of the third period as delineated by Stoob (1988), and the 65 complex walls that predate
1450 were built late in the period. Similarly, this source fails to date the exact years in which the
2,104 simple stone and reinforced stone walls constructed between 1250 and 1450 were built (and,
as discussed in Section 5.4, it is usually infeasible to assign a single year of construction to any
fortification), but cannons were not yet a threat to cities for the bulk of that 200-year span. We
therefore choose to simplify the timeline and consider 1450 to be the dividing line between the world
before vs. after effective gunpowder artillery in Europe.
4.1.3 Offensive Technology
Our offensive technology data comes from Kennard (1986), which documents the locations and first
known year of operation of 422 artillery manufacturers located in 129 unique European cities. We
drop all observations without a specific city identified, as well as those that began operations after
1800 or that were based outside of the area also covered by the Stoob wall construction dataset.
The Kennard data is drawn from the records of museum collections and historical records and is
thus confined to the set of manufacturers for whom at least one physical specimen, or historical
documentation, survived. Figure 3 shows a map of the locations of manufacturers alongside those of
new fortifications. The earliest manufacturer included in this dataset began operations in 1358 in
Laon, Northern France, twelve years after the first known use of artillery in 1346.15
14A very small number of “partial bastions” and “partial walls” reported by Stoob were dropped entirely from thedataset.
15Appendix Figure A3 shows the number of new entrants into the European artillery industry by 50-year periods.
17

4.1.4 Geographic and Historical Covariates
Our analyses use a slate of control variables to account for geographic and historical pre-conditions
that could be potential confounders. Rivers and coastal access both promote economic activity,
which is a potential competing explanation for political development; thus, our analyses account
for the locations of major navigable rivers (based on data collected by Bosker, Buringh, and Van
Zanden 2013) and proximity to the Atlantic coastline. On a similar note, we use natural variation
in suitability for rain-fed wheat growth as a measure of agricultural productivity, which is both a
correlate of wealth and a measure of ability to support population (FAO Geospatial Unit - CBDS
2021). We use the location of major Roman roads to account for historical presence of the Roman
Empire (McCormick 2021). Rugged terrain could influence cities’ outcomes by affecting economic
activity and providing a natural substitute for man-made fortifications, thus, we also include a
terrain ruggedness index (Nunn and Puga 2012).
5 Analysis
5.1 Agglomeration and Technological Change
Our central contention is that cities agglomerated into states because they could not otherwise
commit to making the investments in collective security that were necessary in the gunpowder era.
This section conducts an empirical analysis to determine whether variables associated with the
threat from artillery can predict the observed agglomeration of small territories into larger ones.
We first demonstrate a corresponding link between defensive investment and agglomeration.
We examine dynamic relationships between wall construction and agglomeration using a
differences-in-differences estimator suggested by De Chaisemartin and d’Haultfoeuille (2020).16
The estimator, which we implement dynamically at fifty-year intervals, is designed to be robust
to heterogeneous effects and differential timing of treatment.17 Figure 4 shows no evidence of any16Due to the potential presence of these unobserved confounders, we employ the DIDM estimator of De Chaisemartin
and d’Haultfoeuille (2020) which guarantees that all observations are given non-negative weights when forming theestimates. Other approaches to estimating a differences-in-differences model in the presence of heterogenous effectscould sometimes assign negative weights to some observations, potentially leading to a scenario where the estimatedeffect within every subgroup has the opposite sign of the overall average effect. Effect sizes for OLS and standarddifferences-in-differences specifications are available in Appendix H.1.
17Our primary specification compares grid cells that eventually contain at least one complex wall to those in whicha complex wall is never built.
18

such relationship before the gunpowder era. In every 50-year period before 1450, grid cells that
eventually contain a complex wall experience roughly the same amount of agglomeration as those
that never do. Between 1450 and about 1550, there is similarly little difference, but by 1600, there
is a clear relationship between the elimination of national borders and the construction of walls that
could withstand modern artillery.18
We interpret these results in the context of an evolving offense-defense balance between walls and
artillery. The trace italienne did not develop into a consistently effective defense against artillery until
at least 1525. Until then, the offense-defense balance shifted erratically as technological advances
in artillery were countered by new types of defenses (Parker 1976). Initially, cities were able to
repel attacks by constructing earthen supports behind existing walls, but as cannons became more
powerful, this approach was rendered obsolete. The strategic implications of the new geopolitical
environment were only made clear to all cities once both types of technology had matured.
The concentration of the observed effects during a period covering 1618 to 1648 suggests the
importance of the Thirty Years’ War to the agglomeration process. As discussed in the historical
background, the introduction of artillery occurred earlier and the trace italienne was developed
by 1525. The difference in timing is consistent with our theory which claims that the gunpowder
revolution was necessary but not sufficient to stimulate political consolidation. Agglomeration only
occurs after cities experience a threat of conflict – no city would consider surrendering its sovereignty
without facing some external threat. The Thirty Years’ War was the first time that nearly every
city in our sample space experienced a threat of conflict. Thus, the effect of the changed nature of
conflict does not manifest until this time.18Appendix Section H.1 provides supplementary, qualitatively similar results for this exercise varying the size of
grid cells.
19

−5
0
5
10
15
20
1250 1350 1450 1550 1650Year
Bor
der
elim
inat
ed (
km)
Figure 4: The dynamic relationship between complex wall construction and agglomeration at the grid celllevel. Agglomeration is measured by meters of border eliminated from the grid cell. Complex walls includepoints marked as either bastions or bulwarks in Stoob (1988). The placebo tests show that grid cells whicheventually build complex walls are on parallel trends with those that do not. The relationship is strongestduring and following the Thirty Years’ War (gray band).
Observing which cities upgraded to complex walls is a useful way to track the impact of
artillery on the European landscape, since upgraded fortifications are immobile, permanent, and
well-documented. However, we can also gain additional information from observing the geographic
distribution of artillery manufacturers documented by Kennard (1986).19
The early bombards were enormously heavy and could generally be carried long distances only
at high cost. For example, the Dardanelles Gun of the Ottoman Empire (manufactured in 1464 and
inspired by the Orban cannon) weighed around 16, 800 kilograms (37, 000 pounds) (Blackmore 1976).
Therefore, especially in the early years of gunpowder, cities near the point of artillery manufacture
faced a higher threat level. Over time the weapons became smaller, more powerful, and more mobile,
meaning that they could be transported more easily. Cannons had a secondary role as defensive19Artillery technology was developed by a pre-existing European metallurgy industry. The technology needed to
make a cannon is similar to that needed to make church bells and was pioneered by those same experts.
20
complements to fortifications. The star shape of the classic trace italienne is intended to eliminate
blind spots of wall-mounted cannons that defend the fortified city from attackers. Thus, having a
local gunmaker improved the defensive resources of the city.
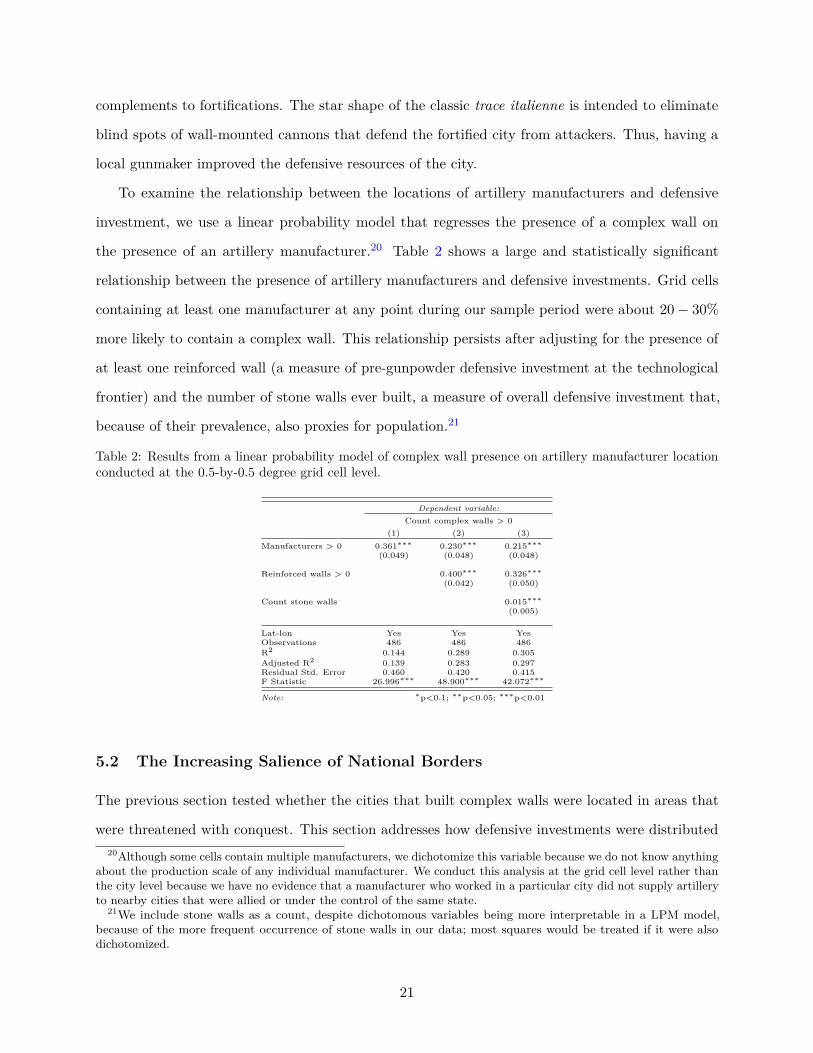
To examine the relationship between the locations of artillery manufacturers and defensive
investment, we use a linear probability model that regresses the presence of a complex wall on
the presence of an artillery manufacturer.20 Table 2 shows a large and statistically significant
relationship between the presence of artillery manufacturers and defensive investments. Grid cells
containing at least one manufacturer at any point during our sample period were about 20− 30%
more likely to contain a complex wall. This relationship persists after adjusting for the presence of
at least one reinforced wall (a measure of pre-gunpowder defensive investment at the technological
frontier) and the number of stone walls ever built, a measure of overall defensive investment that,
because of their prevalence, also proxies for population.21
Table 2: Results from a linear probability model of complex wall presence on artillery manufacturer locationconducted at the 0.5-by-0.5 degree grid cell level.
Dependent variable:Count complex walls > 0
(1) (2) (3)Manufacturers > 0 0.361∗∗∗ 0.230∗∗∗ 0.215∗∗∗
(0.049) (0.048) (0.048)
Reinforced walls > 0 0.400∗∗∗ 0.326∗∗∗
(0.042) (0.050)
Count stone walls 0.015∗∗∗
(0.005)
Lat-lon Yes Yes YesObservations 486 486 486R2 0.144 0.289 0.305Adjusted R2 0.139 0.283 0.297Residual Std. Error 0.460 0.420 0.415F Statistic 26.996∗∗∗ 48.900∗∗∗ 42.072∗∗∗
Note: ∗p<0.1; ∗∗p<0.05; ∗∗∗p<0.01
5.2 The Increasing Salience of National Borders
The previous section tested whether the cities that built complex walls were located in areas that
were threatened with conquest. This section addresses how defensive investments were distributed20Although some cells contain multiple manufacturers, we dichotomize this variable because we do not know anything
about the production scale of any individual manufacturer. We conduct this analysis at the grid cell level rather thanthe city level because we have no evidence that a manufacturer who worked in a particular city did not supply artilleryto nearby cities that were allied or under the control of the same state.
21We include stone walls as a count, despite dichotomous variables being more interpretable in a LPM model,because of the more frequent occurrence of stone walls in our data; most squares would be treated if it were alsodichotomized.
21

within states before vs. after the gunpowder revolution. Our theory predicts that centralized states
redistributed resources from the interior of a state to the border to amortize the costs of defense
over a consolidated territory.
We run variations on the following OLS regression to model the relationship between fortification
construction and border proximity:
LBC = α+ βtype + Xγ + ε (1)
where N is the number of cities included in the regression, LBC is an N vector of minimum
log border-centroid ratios observed during a given period, α is a scalar intercept, β is the scalar
coefficient of interest, type is a vector of indicators describing the type of wall in each city, X is
an N ×K matrix containing K control variables, γ is a K vector of coefficients, and ε is an error
vector of size N . Our slate of historical and geographic covariates is described further in Section
4.1.4. A log border-centroid ratio of zero indicates that the wall is equally far from the centroid
and the border. Negative values indicate that the wall is closer to the border, and positive values
indicate that the wall is closer to the centroid.22
Results are reported in Table 3. The first column compares the log border-centroid ratios of
walls built during the pre-gunpowder period to walls built during the post-gunpowder period. Cities
with new wall construction post-1450 have smaller log border-centroid ratios compared to cities
that received new construction pre-1450. This indicates that they are located closer on average to a
border and further from the center of the state or other political entity in which they are located.
The second column compares only complex walls built post-1450 to all other wall types (wooden,
stone, and reinforced). The point estimate is negative, consistent with our theory. The third column
indicates why this is the case: cities with bastions – the largest, most technically complex, and most
expensive defensive structure available to counter artillery – are significantly closer to borders than
cities with relatively less-advanced bulwarks. Relative to the centuries before gunpowder became
a serious threat, borders became better-defended overall, and after 1450, the most expensive and22We use the log of the border-centroid ratios because the distribution of border centroid ratios are log-normally
distributed (see Appendix Table A7). Log-normal distributions are common in studies of economic geography; forinstance, see Gabaix (1999) and Dittmar (2009).
22

effective resources were devoted to protecting cities located in areas of maximal external threat.
23

Table 3: The first three columns compare the log border-centroid ratios of all walls build pre-1450 to those built post-1450. The fourth through sixthcolumns compares post-1450 complex walls to post-1450 simple walls, and the last three compare post-1450 complex walls classified as bastions topost-1450 walls classified as less-sophisticated constructions, including bulwarks meant to counter artillery that were not as effective as the bastionedtrace italienne. Controls are a dummy for proximity to the Atlantic Ocean, log distance a large navigable river (defined following Bosker, Buringh, andVan Zanden 2013), and log distance to a major Roman road, as well as indices for soil quality and terrain ruggedness. Standard errors are clusteredusing the Voronoi polygon approach described in the accompanying Appendix B. Appendix Table A3 shows alternate specifications using Conleystandard errors, which produce qualitatively similar results.
Dependent variable:Log border-centroid ratio
(1) (2) (3) (4) (5) (6) (7) (8) (9)Post-1450 (v. pre-1450) −1.041∗∗∗ −1.021∗∗∗ −1.032∗∗∗
(0.100) (0.104) (0.105)
Complex post-1450 (v. simple post-1450) −0.154 −0.269∗ −0.346∗∗
(0.153) (0.154) (0.144)
Bastion post-1450 (v. bulwark post-1450) −0.374∗ −0.363∗ −0.394∗∗
(0.191) (0.191) (0.194)
Atlantic coastline −0.594∗∗∗ −0.661∗∗ −0.772∗∗
(0.182) (0.269) (0.328)
Log dist. to river −0.051 −0.120∗∗∗ −0.128∗∗
(0.033) (0.046) (0.050)
Ag. prod. −0.0001 0.0004 0.001∗∗
(0.0001) (0.0003) (0.0003)
Ruggedness −0.001 −0.002 0.0002(0.0005) (0.002) (0.002)
Log dist. to Roman road −0.047 0.119∗∗ 0.089(0.037) (0.055) (0.059)
Lat-lon No Yes Yes No Yes Yes No Yes YesObservations 6,559 6,559 6,559 735 735 735 483 483 483R2 0.040 0.042 0.050 0.002 0.031 0.073 0.009 0.021 0.073Adjusted R2 0.040 0.042 0.049 0.0004 0.027 0.063 0.007 0.015 0.057Residual Std. Error 1.611 1.609 1.603 1.725 1.702 1.670 1.696 1.690 1.653F Statistic 272.607∗∗∗ 96.414∗∗∗ 43.479∗∗∗ 1.326 7.785∗∗∗ 7.195∗∗∗ 4.227∗∗ 3.369∗∗ 4.633∗∗∗
Note: ∗p<0.1; ∗∗p<0.05; ∗∗∗p<0.01
24

5.3 The Changing Spatial Distribution of Defensive Investment
Our theory predicts that states strategically allocated investment to cities that were particularly
useful for defending the state’s territory. Thus, we expect that in the post-gunpowder period, states
directed resources to where they were needed bolster their defenses. Some cities developed new
strategic significance due to their location near their state’s borders. We expect some of these cities,
which may have never previously constructed strong walls, to receive significant defensive investment
after the gunpowder revolution. We also hypothesize that some cities fell off the technological
frontier after the gunpowder revolution as they sent resources to the borders in exchange for the
state’s protection.
We test this hypothesis by regressing the distance of a city to a border that was dissolved
in the post-gunpowder period on a city’s progression path of defensive technology controlling for
historical and geographic covariates. We define several paths. “Progressive development” denotes a
city that always received the most advanced fortification available. “Falls off” denotes a city that
had a state-of-the-art wall in the pre-gunpowder era, and thus was at the forefront of defensive
technological development, but failed to acquire a bastion or bulwark once gunpowder became a
threat. “Catches up” denotes a city that did not have a stone or reinforced wall in the pre-gunpowder
era when these were the most effective defensive technology but which leapfrogged to a bastion
or bulwark after 1450. The reference group is all cities that never acquired even a stone wall,
permanently stalling at earthworks or wooden defenses. The results in Table 4 show the results the
following OLS regression:
Border Change Distance = α+ pathwayβ + Xγ + ε (2)
where N is the number of cities included in the regression, Border Change Distance is an N
vector of minimum distances to border disappearances in the post gunpowder period, α is a scalar
intercept, β is a 3 vector of coefficients of interest, pathway is an N × 3 matrix of indicators
describing which pathway a city followed, X is an N ×K matrix containing K control variables, γ
is a K vector of coefficients, and ε is an error vector of size N .23
23The pathways "Progressive Development", "Catches Up", and "Falls Off" are represented in pathway. The residual
25

Table 4 shows that cities which built strong fortifications capable of resisting artillery even
despite having been slow to build reinforced and stone walls were located closer to areas that
agglomerated. The results are robust to the inclusion of a set of control variables and are classically
statistically significant. We interpret these results as evidence that states were redirecting resources
to these cities. As states expand their borders they must continuously invest in border defenses. This
phenomenon is observed in the France case study in Section 5.4. As cities receive those investments
they construct stronger defenses.
Table 4: City-level regression of distance to post-1450 border elimination on development path of cities’defensive investments. Standard errors are clustered using the Voronoi polygon approach described in theaccompanying Appendix B. Appendix Table A4 shows alternate specifications using Conley standard errors,which produce qualitatively similar results.
Dependent variable:Log dist. to border eliminiation post-1450
(1) (2) (3)Falls behind 0.100 0.040 0.079
(0.105) (0.102) (0.099)
Catches up −0.161 −0.136 −0.223∗∗
(0.100) (0.103) (0.098)
Progressive development −0.036 −0.041 −0.100(0.176) (0.167) (0.164)
Atlantic coastline 1.216∗∗∗
(0.160)
Log dist. to river −0.023(0.031)
Ag. prod. −0.001(0.001)
Ruggedness −0.071∗
(0.042)
Log dist. to Roman road −0.0003∗∗∗
(0.0001)
Lat-lon No Yes YesObservations 4,489 4,489 4,489R2 0.002 0.026 0.059Adjusted R2 0.001 0.025 0.057Residual Std. Error 1.382 1.366 1.343F Statistic 2.327∗ 23.808∗∗∗ 27.894∗∗∗
Note: ∗p<0.1; ∗∗p<0.05; ∗∗∗p<0.01
Our theory implies that states redistributed resources internally to provide collective security.
States ensured that strategically important cities would receive the necessary resources to construct
walls capable of withstanding artillery fire. Even before the trace italienne, walls were still large
projects that required non-trivial expense to build and maintain. These expenses were lower in places
that had easy access to the raw materials needed to construct large structures using pre-modern
building methods and materials. We hypothesize that before the gunpowder revolution when cities
category "Other" is the omitted category.
26
and local rulers were responsible for funding their own defense, cities located near building materials
were more likely to construct defensive fortifications. In the early modern period, however, when
cities required substantial new investment to make their fortifications capable of resisting artillery,
we expect states to bring resources wherever they are needed to ensure security. Thus, we anticipate
a that the link between proximity to building materials and wall construction should weaken after
the gunpowder revolution.
Limestone was the preferred building material for large structures such as walls in medieval
Europe. It has the advantages of being both durable (compared to sandstone and softer substitutes)
and flexible (compared to granite). In the absence of access to limestone, other quarried materials
(or brick) could be used. However, limestone was also a key ingredient in the mortar that bound
components of walls together. Cities located near deposits of limestone (composed of calcium
carbonate) had cheaper access to materials for building large projects like defensive walls relative to
those far away.24 We therefore use proximity to natural limestone deposits in the earth to proxy
the costs of building a wall in a particular location.
Our data on the locations of limestone deposits comes from the Federal Institute for Geosciences
and Natural Resources, which produces a high-resolution map of the four top geological components
of each point on the European landmass (Asch 2003). We designate any area with limestone as one
of these top components as being a potential source of limestone for building large structures such
as city walls. This avoids concerns about endogeneity that might result from using the locations
of known historical limestone quarries instead of natural deposits in the earth. Because calcium
carbonate can also affect soil quality by changing its pH, and therefore agricultural productivity, we
control for rain-fed wheat growing suitability (as well as for the other control variables discussed
in Section 4.1.4) as well as a measure of soil quality.25 We run the following OLS regression
specification:
wall construction = α+β0limestone distance + β1post-gunpowder+
β2interaction + Xγ + ε
(3)
where N is the number of cities included in the regression, wall construction is an N vector24See, for instance, an archaeological analysis from the Swedish city of Visby (Balksten and Thelin 2014).25Soil quality is sourced from Van Liedekerke (2008).
27

indicating whether the city constructed walls of a given type during a particular period, α is a scalar
intercept, β is a scalar coefficient, limestone distance is an N vector of distances to the nearest
limestone deposit, post-gunpowder is an indicator for the post gunpowder period, interaction is
an interaction of limestone distances and time period, X is an N ×K matrix containing K control
variables, γ is a K vector of coefficients, and ε is an error vector of size N .
Table 5: Results from a city-level OLS regression of whether a city ever built any defensive structure usingstone-and-mortar construction on log distance to nearest limestone deposit, a dummy for post-1450, and theinteraction of the two. Standard errors are clustered using the Voronoi polygon approach described in theaccompanying Appendix B. Appendix Table A5 shows alternate specifications using Conley standard errors,which produce qualitatively similar results.
Dependent variable:Builds any stone-and-mortar wall
(1) (2) (3)Log dist. to limestone −0.007∗∗∗ −0.004∗∗∗ −0.004∗∗∗
(0.001) (0.001) (0.001)
Post-1450 −0.315∗∗∗ −0.319∗∗∗ −0.321∗∗∗
(0.021) (0.020) (0.020)
Log dist. to limestone x post-1450 0.007∗∗∗ 0.006∗∗∗ 0.006∗∗∗
(0.002) (0.001) (0.001)
Atlantic coastline 0.028(0.040)
Log dist. to river 0.007∗
(0.004)
Ag. prod. 0.00001(0.00001)
Ruggedness −0.0002∗∗
(0.0001)
Log dist. to Roman road −0.021∗∗∗
(0.006)
Soil quality 0.00005∗∗∗
(0.00002)
Lat-lon No Yes YesObservations 10,893 10,893 10,893R2 0.092 0.142 0.160Adjusted R2 0.092 0.142 0.159Residual Std. Error 0.435 0.422 0.418F Statistic 367.737∗∗∗ 361.709∗∗∗ 188.340∗∗∗
Note: ∗p<0.1; ∗∗p<0.05; ∗∗∗p<0.01
The coefficient on log distance between a potential city site and limestone is negative, consistent
with our hypothesis that access to raw building materials increases the likelihood of a city building
a stone wall, reinforced stone wall, bulwarks, or bastions, all of which can be built from limestone
and require mortar. Construction after 1450 is negatively associated with building using limestone
materials because earthen and stone walls are almost always built early in our sample period. The
interaction of distance to limestone and post-1450 construction is negative and approximately of
the same size as the coefficient on limestone alone. This is consistent with a theory that states
supported the construction of walls in strategically important locations, reducing their reliance on
28

easy access to raw materials obtained using only the city’s own resources.
5.4 Case Study: France
As we have discussed above, a limitation of the wall construction data from Stoob (1988) is that
it does not give the precise date in which walls are constructed. However, it is not historically
appropriate to designate a single year, or even small range of years, in which fortifications were
constructed, since these large investments could take years or decades to complete. Walls could
require continuous maintenance and upgrades as offensive technology continued to improve, so a
city or state that built one also committed to future investment if they wanted the structure to
remain useful. Given these limitations, it can be difficult to clearly ascertain which political entity
deserves credit for upgrades. For instance, the city of Gravelines was contested on multiple occasions
by France and Spain, each of which made continuous improvements to its fortifications. Various
additions and upgrades to the walls were made by the Spanish from 1528-1536 and again beginning
in 1556 and 1640. Upon its capture by France in the 1650s, it was incorporated into the engineer
Vauban’s comprehensive plan of defenses along the new French border and upgraded yet again
(Lepage 2009). Our theory is consistent with more than one possible ordering of events: cities that
could not bear the fiscal burden of construction might choose to never even start a construction
project, knowing that they could not complete it - or cities might attempt to invest in new defenses
but find that they could not complete them without facing financial ruin, making them military
vulnerable to conquest, as in the above-cited cases of Siena and Antwerp.
We shed further light on the question of the timing of investments relative to state expansion using
a case study of France. France is well-known as a case that centralized power and bureaucratized its
tax system well before many other European polities made the transformation to modern statehood.
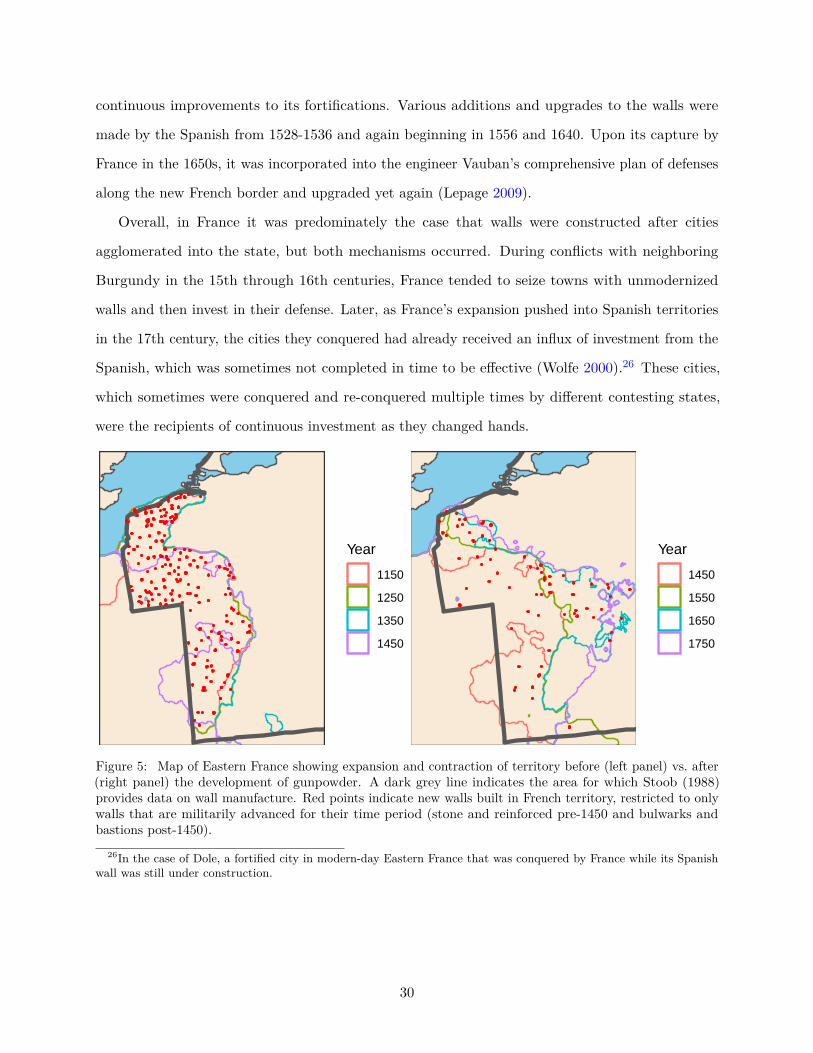
Figure 5 shows the simultaneous agglomeration of Western European territory by France after
1450 and the deployment of defensive investment to France’s newly acquired territory. Before 1450,
permanent fortifications (stone and reinforced walls) were not particularly concentrated near the
French border. After 1450, militarily relevant walls (bulwarks and bastions) were constructed near
the expanding French border as France pushed into Western Europe.
The two mechanisms can be illustrated by the experience of different French cities. For instance,
the city of Gravelines was contested on multiple occasions by France and Spain, each of which made
29
continuous improvements to its fortifications. Various additions and upgrades to the walls were
made by the Spanish from 1528-1536 and again beginning in 1556 and 1640. Upon its capture by
France in the 1650s, it was incorporated into the engineer Vauban’s comprehensive plan of defenses
along the new French border and upgraded yet again (Lepage 2009).
Overall, in France it was predominately the case that walls were constructed after cities
agglomerated into the state, but both mechanisms occurred. During conflicts with neighboring
Burgundy in the 15th through 16th centuries, France tended to seize towns with unmodernized
walls and then invest in their defense. Later, as France’s expansion pushed into Spanish territories
in the 17th century, the cities they conquered had already received an influx of investment from the
Spanish, which was sometimes not completed in time to be effective (Wolfe 2000).26 These cities,
which sometimes were conquered and re-conquered multiple times by different contesting states,
were the recipients of continuous investment as they changed hands.
Year
1150
1250
1350
1450
Year
1450
1550
1650
1750
Figure 5: Map of Eastern France showing expansion and contraction of territory before (left panel) vs. after(right panel) the development of gunpowder. A dark grey line indicates the area for which Stoob (1988)provides data on wall manufacture. Red points indicate new walls built in French territory, restricted to onlywalls that are militarily advanced for their time period (stone and reinforced pre-1450 and bulwarks andbastions post-1450).
26In the case of Dole, a fortified city in modern-day Eastern France that was conquered by France while its Spanishwall was still under construction.
30
6 Conclusions
The central contention of our work is that the gunpowder revolution created a collective security
crisis that cities could only manage by surrendering their sovereignty to central states. We argue
that the use of artillery in Europe from around the year 1450 radically shifted the balance of military
power in favor of the offensive side, rendering existing investments in urban security obsolete.
When defensive technology caught up, the new, complex urban fortifications needed to effectively
counter the artillery threat required economies of scale to fund and support. Drawing on existing
networks for allies was often an insufficient solution to this problem, as the failures of the Hanse, the
Swiss Confederacy, and other non-centralized alliances to successfully coordinate mutual security
demonstrates. Commitment and free-rider problems made non-territorial, non-centralized networks
suboptimal relative to centralized states with the necessary political authority to enforce cooperation.
These economies of scale could better be borne by states, which could optimally coordinate the
allocation of resources. This put pressure on cities and other small territorial entities to agglomerate
into modern states voluntarily or involuntarily.
Our paper tests the theory by bringing together detailed data on the locations of artillery
manufacturers, the locations and construction dates of urban fortifications, and fine-grained data
on border changes of territorial political entities. We find evidence for a relationship between new
offensive military threats and shifts in national borders consistent with our theory. Places where
walls capable of withstanding artillery were constructed experienced more territorial agglomeration
as measured by the disappearance of borders. We interpret this agglomeration, which became
increasingly common over time, as evidence of the emergence of modern states that successfully
contested and absorbed territory from neighboring polities. Areas with agglomeration were more
likely to invest - or receive investment to build - cutting-edge fortifications. Furthermore, we
demonstrate that borders became increasingly hardened after 1450. This is consistent with our
theory that states strategically allocated resources towards cities that faced the greatest threat
and which, if reinforced, could protect the interior. Cities that suddenly leapt to the front of the
defensive technological frontier were closer to sites of agglomeration, and proximity to raw materials
mattered less to whether a city built permanent defensive infrastructure post-1450, when states
could redistribute resources to key locations.
31

Our findings, which build on the work of Tilly (1990) and Parker (1976), shed light on the
relationship between conflict and economic and political development. Scholars including Herbst
(2014), Centeno (1997), and Abramson (2017) have questioned whether Tilly’s bellicist thesis that
conflict led to the development of states is well supported. We provide a mechanism linking conflict
to political change and explain why it functioned in Europe in the 15th, 16th, and 17th centuries.
Specifically, a new kind of military threat raised the cost of defense, encouraging the agglomeration
of previously disparate political entities into new, more efficient units of governance. We argue that
other forms of conflict do not necessarily entail political agglomeration as an optimal response and
will therefore not have the kind of positive externalities in growth and development that we observe
in Europe. Gunpowder, which forced cities to either invest in new defenses or be absorbed by a
state that could provide geographic economies of scale in defense, made the relationship between
conflict and political development in late medieval and early modern Europe a positive one.
7 References
Abramson, Scott F. 2017. “The Economic Origins of the Territorial State.” International Organiza-tion 71 (1). Cambridge University Press: 97–130.
Acharya, Amitav. 2004. “How Ideas Spread: Whose Norms Matter? Norm Localizationand Institutional Change in Asian Regionalism.” International Organization 58 (2). CambridgeUniversity Press: 239–75.
Alesina, Alberto, and Enrico Spolaore. 1997. “On the Number and Size of Nations.” TheQuarterly Journal of Economics 112 (4). MIT Press: 1027–56.
———. 2005. The Size of Nations. MIT Press.Asch, K. 2003. “The 1:5 Million International Geological Map of Europe and Adjacent Areas:
Development and Implementation of a Gis-Enabled Concept.” Geologisches Jahrbuch, SA 3. E.Schweizerbart´sche Verlagsbuchhandlung.
Axelrod, Robert. 1986. “An Evolutionary Approach to Norms.” The American Political ScienceReview. JSTOR, 1095–1111.
Axelrod, Robert, and Robert O Keohane. 1985. “Achieving Cooperation Under Anarchy:Strategies and Institutions.” World Pol. 38. HeinOnline: 226.
Balksten, Kristin, and Carl Thelin. 2014. “Construction and Materials of Visby Medieval CityWall–Risk of Damage.” In 9th International Masonry Conference 2014, Guimarães, Portugal, July7-9, 2014.
Bean, Richard. 1973. “War and the Birth of the Nation State.” The Journal of EconomicHistory 33 (1). Cambridge University Press: 203–21.
Blackmore, H.L. 1976. “The Armouries of the Tower of London, Ordnance Catalogue.” OrdnanceCatalogue.
Bosker, Maarten, Eltjo Buringh, and Jan Luiten Van Zanden. 2013. “From Baghdad to London:Unraveling Urban Development in Europe, the Middle East, and North Africa, 800–1800.” Review
32

of Economics and Statistics 95 (4). MIT Press: 1418–37.Centeno, Miguel Angel. 1997. “Blood and Debt: War and Taxation in Nineteenth-Century Latin
America.” American Journal of Sociology 102 (6). The University of Chicago Press: 1565–1605.———. 2002. Blood and Debt: War and the Nation-State in Latin America. Penn State Press.Coase, R H. 1960. “The Problem of Social Cost.” Journal of Law and Economics 3.Conley, Timothy G. 1999. “GMM Estimation with Cross Sectional Dependence.” Journal of
Econometrics 92 (1). Elsevier: 1–45.De Chaisemartin, Clément, and Xavier d’Haultfoeuille. 2020. “Two-Way Fixed Effects Estimators
with Heterogeneous Treatment Effects.” American Economic Review 110 (9): 2964–96.DeVries, Kelly. 2012. Medieval Military Technology. University of Toronto Press.Dincecco, Mark, and Massimiliano Gaetano Onorato. 2016. “Military Conflict and the Rise of
Urban Europe.” Journal of Economic Growth 21 (3). Springer: 259–82.Dittmar, Jeremiah. 2009. “Cities, Institutions, and Growth: The Emergence of Zipf’s Law.”
University of California, Berkeley.Eltis, David. 1989. “Towns and Defence in Later Medieval Germany.” Nottingham Medieval
Studies 33. Brepols Publishers: 91–103.FAO Geospatial Unit - CBDS. 2021. “Agricultural Suitability and Potential Yields.”Fearon, James D. 1997. “The Offense-Defense Balance and War Since 1648.” In Annual Meeting
of the International Studies Association, Chicago, 379–414.Freed, J.B. 2016. Frederick Barbarossa: The Prince and the Myth. Yale University Press.
https://books.google.com/books?id=tng8DAAAQBAJ.Gabaix, Xavier. 1999. “Zipf’s Law for Cities: An Explanation.” The Quarterly Journal of
Economics 114 (3). MIT Press: 739–67.Gennaioli, Nicola, and Hans-Joachim Voth. 2015. “State Capacity and Military Conflict.” The
Review of Economic Studies 82 (4). Oxford University Press: 1409–48.Gortzak, Yoav, Yoram Z Haftel, and Kevin Sweeney. 2005. “Offense-Defense Theory: An
Empirical Assessment.” Journal of Conflict Resolution 49 (1). Sage Publications Sage CA: ThousandOaks, CA: 67–89.
Gowa, Joanne. 1986. “Anarchy, Egoism, and Third Images: The Evolution of Cooperation andInternational Relations.” JSTOR.
Greengrass, M., and B. Gordon. 2002. The Swiss Reformation. New Frontiers Series. ManchesterUniversity Press. https://books.google.com/books?id=M0W8AAAAIAAJ.
Hart, Marjolein ’T. 1989. “Cities and Statemaking in the Dutch Republic, 1580-1680.” Theoryand Society 18 (5). Springer: 663–87. http://www.jstor.org/stable/657615.
Herbst, Jeffrey. 2014. States and Power in Africa: Comparative Lessons in Authority andControl. Princeton University Press.
Hoffman, Philip T. 2015. Why Did Europe Conquer the World? Princeton University Press.Hopf, Ted. 1991. “Polarity, the Offense-Defense Balance, and War.” American Political Science
Review 85 (2). Cambridge University Press: 475–93.Hough, Peter. 2020. “Regional Security Organizations.” International Security Studies. Rout-
ledge, 348–62.Jervis, Robert. 1978. “Cooperation Under the Security Dilemma.” World Politics 30 (2).
Cambridge University Press: 167–214.Kaspersen, Lars Bo, and Jeppe Strandsbjerg. 2017. Does War Make States?: Investigations of
Charles Tilly’s Historical Sociology. Cambridge University Press.Kennard, Arthur Norris. 1986. Gunfounding and Gunfounders: A Directory of Cannon Founders
from Earliest Times to 1850. Arms & Armour Press.
33

Keohane, Robert O. 1986. “Reciprocity in International Relations.” International Organization.JSTOR, 1–27.
Keohane, Robert O, and Joseph S Nye Jr. 1973. “Power and Interdependence.” Survival 15 (4).Taylor & Francis Group: 158–65.
Kupchan, Charles A, and Clifford A Kupchan. 1995. “The Promise of Collective Security.”International Security 20 (1). The MIT Press: 52–61.
Lepage, J.D.G.G. 2009. Vauban and the French Military Under Louis Xiv: An Illustrated Historyof Fortifications and Strategies. McFarland, Incorporated, Publishers. https://books.google.com/books?id=Fzp3MWRNPFAC.
Levy, Jack S. 1984. “The Offensive/Defensive Balance of Military Technology: A Theoreticaland Historical Analysis.” International Studies Quarterly 28 (2). Blackwell Publishing Ltd Oxford,UK: 219–38.
Limberger, Michael. 2016. “‘The greatest marketplace in the world’. The role of Antwerp in theeconomic and financial network of the Habsburg Empire.” In Les Villes Des Habsbourg Du Xve AuXixe Siecle : Communication, Art et Pouvoir Dans Les Reseaux Urbains, edited by Ludolf Pelizaeus,45–62. Reims.
Mandelbrot, Benoit. 1967. “How Long Is the Coast of Britain? Statistical Self-Similarity andFractional Dimension.” Science 156 (3775). American Association for the Advancement of Science:636–38.
McCormick, Michael. 2021. “Mapping Past Societies.”McNeill, William H. 1982. The Pursuit of Power: Technology, Armed Force, and Society Since
Ad 1000. University of Chicago Press.Meijer, Hugo, and Stephen G Brooks. 2021. “Illusions of Autonomy: Why Europe Cannot
Provide for Its Security If the United States Pulls Back.” International Security 45 (4). MIT PressOne Rogers Street, Cambridge, MA 02142-1209, USA journals-info . . . : 7–43.
Nunn, Nathan, and Diego Puga. 2012. “Ruggedness: The Blessing of Bad Geography in Africa.”Review of Economics and Statistics 94 (1). MIT Press: 20–36.
Parker, Geoffrey. 1976. “The "Military Revolution," 1560-1660–a Myth?” The Journal ofModern History 48 (2). The University of Chicago Press: 196–214.
———. 1996. The Military Revolution: Military Innovation and the Rise of the West, 1500-1800.Cambridge University Press.
Postel, Rainer. 1996. “The Hanseatic League and its Decline.” Central Connecticut StateUniversity, New Britain, CT.
Powell, Robert. 1991. “Absolute and Relative Gains in International Relations Theory.” TheAmerican Political Science Review. JSTOR, 1303–20.
———. 1993. “Guns, Butter, and Anarchy.” American Political Science Review. JSTOR,115–32.
Reyerson, Kathryn L. 1999. Commerce and Communications. na.Spruyt, Hendrik. 1996. The Sovereign State and Its Competitors: An Analysis of Systems
Change. Princeton University Press.———. 2017. “War and State Formation: Amending the Bellicist Theory of State Making.” In
Does War Make States?: Investigations of Charles Tilly’s Historical Sociology, 73–97. CambridgeUniversity Press.
Stoob, Heinz. 1988. “Die Stadtbefestigung: Vergleichende überlegungen Zur BürgerlichenSiedlungs- Und Baugeschichte, Besonders Den Frühen Neuzeit.” In Städteforschung: EuropäischeStädte Im Zeitalter Des Barock, edited by Kersten Krüger. Böhlau.
Thakur, Ramesh. 2016. The United Nations, Peace and Security: From Collective Security tothe Responsibility to Protect. Cambridge University Press.
34

Tilly, Charles. 1975. The Formation of National States in Western Europe. Princeton UniversityPress. https://books.google.com/books?id=0u0jAQAAIAAJ.
———. 1990. Coercion, Capital, and European States, Ad 990–1990. Cambridge, Mass., USA:Basil Blackwell.
Tracy, James D. 2000. “To Wall or Not to Wall: Evidence from Medieval Germany.” In CityWalls: The Urban Enceinte in Global Perspective, edited by James D. Tracy. Cambridge UniversityPress.
Van Evera, Stephen. 1998. “Offense, Defense, and the Causes of War.” International Security22 (4). MIT Press: 5–43.
Van Liedekerke, Marc. 2008. “Map of Soil pH in Europe.” Hamburger Beiträge Zur PhysischenGeographie Und Landschaftsökologie 19. Universität Hamburg, Institut für Geographie.
Voigtländer, Nico, and Hans-Joachim Voth. 2013. “The Three Horsemen of Riches: Plague,War, and Urbanization in Early Modern Europe.” Review of Economic Studies 80 (2). OxfordUniversity Press: 774–811.
Williamson, Oliver E. 1979. “Transaction-Cost Economics: The Governance of ContractualRelations.” Journal of Law and Economics 22 (2): 233–61.
Wolfe, Michael. 2000. “Walled Towns During the French Wars of Religion (1560-1630).” In CityWalls: The Urban Enceinte in Global Perspective, edited by James D. Tracy. Cambridge UniversityPress.
35
Conflict Technology As a Catalyst of State FormationOnline Appendix
Michael-David Mangini and Casey Petroff
January 2022
A1

A Count of States Over Time
Abramson (2017) documents the declining physical size of polities, and increasing number ofpolities, in Europe between the medieval and early modern periods. This broad pattern masksboth substantial regional variation and variation in the trends of state geography over time, whichAbramson (2017) explores in depth.1 Figure A1 shows the number of states (top) and the averagesize of a state (bottom) existing on the continental European landmass in five-year intervals.2The graphs show the fragmentation of Europe through the High Middle Ages (pre-1250) and thebeginning of the Late Middle Ages before stabilizing in the 1260s before consolidating again after1500. The timing of the reconsolidation of Europe corresponds to the invention of the trace italienneand its counterparts in Northern Europe.
3e+05
4e+05
5e+05
6e+05
1200 1400 1600 1800Year
Are
a (s
q. k
m)
150
200
250
1200 1400 1600 1800Year
Num
ber
of s
tate
s
Figure A1
1We use the neutral noun "polity" to avoid conflating early medieval political units, which included city-states,feudal territories, and other entities, with modern nation-states.
2Territory held by Eurasian powers such as Russia on the Asian continent is excluded.
A2
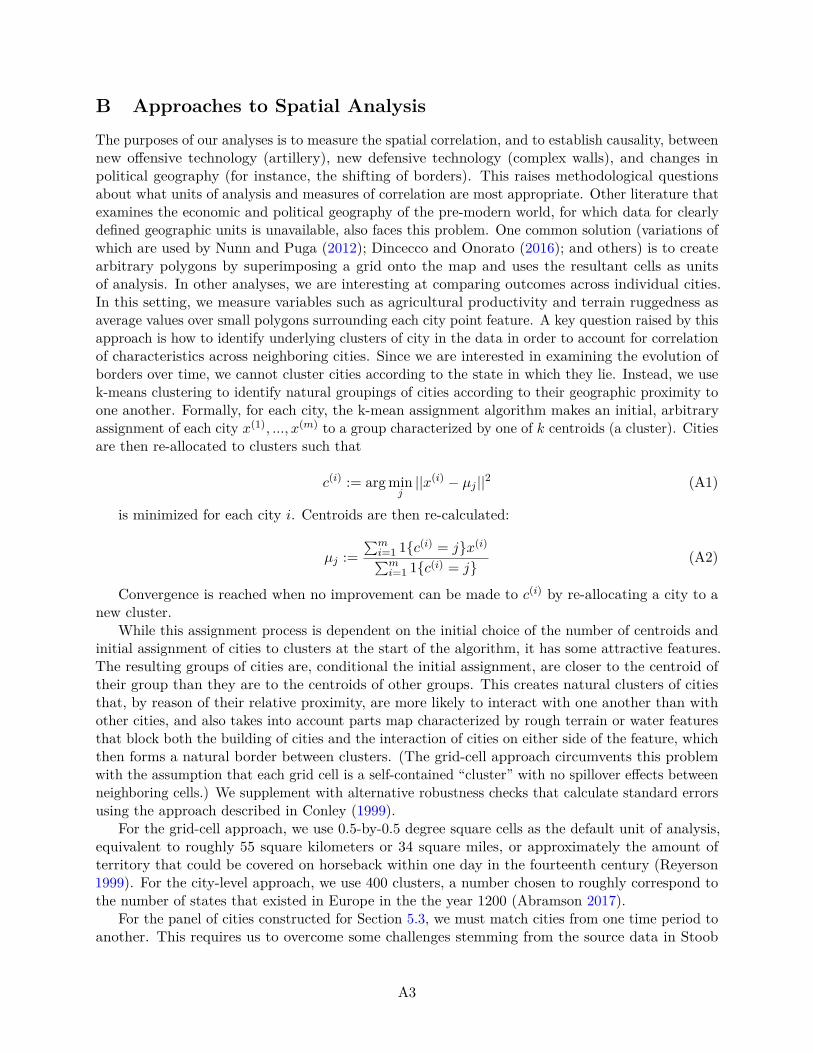
B Approaches to Spatial AnalysisThe purposes of our analyses is to measure the spatial correlation, and to establish causality, betweennew offensive technology (artillery), new defensive technology (complex walls), and changes inpolitical geography (for instance, the shifting of borders). This raises methodological questionsabout what units of analysis and measures of correlation are most appropriate. Other literature thatexamines the economic and political geography of the pre-modern world, for which data for clearlydefined geographic units is unavailable, also faces this problem. One common solution (variations ofwhich are used by Nunn and Puga (2012); Dincecco and Onorato (2016); and others) is to createarbitrary polygons by superimposing a grid onto the map and uses the resultant cells as unitsof analysis. In other analyses, we are interesting at comparing outcomes across individual cities.In this setting, we measure variables such as agricultural productivity and terrain ruggedness asaverage values over small polygons surrounding each city point feature. A key question raised by thisapproach is how to identify underlying clusters of city in the data in order to account for correlationof characteristics across neighboring cities. Since we are interested in examining the evolution ofborders over time, we cannot cluster cities according to the state in which they lie. Instead, we usek-means clustering to identify natural groupings of cities according to their geographic proximity toone another. Formally, for each city, the k-mean assignment algorithm makes an initial, arbitraryassignment of each city x(1), ..., x(m) to a group characterized by one of k centroids (a cluster). Citiesare then re-allocated to clusters such that
c(i) := arg minj||x(i) − µj ||2 (A1)
is minimized for each city i. Centroids are then re-calculated:
µj :=∑m
i=1 1{c(i) = j}x(i)∑mi=1 1{c(i) = j}
(A2)
Convergence is reached when no improvement can be made to c(i) by re-allocating a city to anew cluster.
While this assignment process is dependent on the initial choice of the number of centroids andinitial assignment of cities to clusters at the start of the algorithm, it has some attractive features.The resulting groups of cities are, conditional the initial assignment, are closer to the centroid oftheir group than they are to the centroids of other groups. This creates natural clusters of citiesthat, by reason of their relative proximity, are more likely to interact with one another than withother cities, and also takes into account parts map characterized by rough terrain or water featuresthat block both the building of cities and the interaction of cities on either side of the feature, whichthen forms a natural border between clusters. (The grid-cell approach circumvents this problemwith the assumption that each grid cell is a self-contained “cluster” with no spillover effects betweenneighboring cells.) We supplement with alternative robustness checks that calculate standard errorsusing the approach described in Conley (1999).
For the grid-cell approach, we use 0.5-by-0.5 degree square cells as the default unit of analysis,equivalent to roughly 55 square kilometers or 34 square miles, or approximately the amount ofterritory that could be covered on horseback within one day in the fourteenth century (Reyerson1999). For the city-level approach, we use 400 clusters, a number chosen to roughly correspond tothe number of states that existed in Europe in the the year 1200 (Abramson 2017).
For the panel of cities constructed for Section 5.3, we must match cities from one time period toanother. This requires us to overcome some challenges stemming from the source data in Stoob
A3
(1988), which is presented in its original form as a reprinted version of a physical map. Each city’snew defensive construction is hand-stamped using a stamp of a different color and shape. Thisleads to noise in the geolocation process whenever stamps are slightly off-center from one another,introducing the risk of associating new construction to the wrong city if two cities are close to oneanother. We find that the distance between two cities is rarely smaller than 4 kilometers, and thedistance between new build layers for each city is much smaller than that. We therefore createa panel dataset by overlaying a grid cell layer where each grid cell is 4 km2. Each grid cell is apotential city site, and all new layers of wall construction falling within the grid cell polygon areassigned to one city.
C Agglomeration Measure Technical DetailsWe denote a substantial border change as one where a border moves at least X kilometers from itsoriginal location. For two maps dating from t1 and t2, we build X-km buffers around all nationalborders and then count a t1 border as eliminated if its buffered region fails to intersect with anybuffered border that exists in t2. We simplify the resulting polylines and then measure the length ofborder eliminations per grid cell for the grid cell spatial approach; for the city-level spatial approach,we measure the distance from each city to the nearest border elimination. This outcome puts thefocus not on individual expanding states per se but on regional trends in political change over time.
A4

D Border-Centroid Measure Technical DetailsTo demonstrate that border-centroid ratios are not affected by the size of states, we simulatefields of randomly-placed points on polygons of different sizes. Figure A2 shows the distribution ofborder-centroid ratios of 10,000 points on polygons with radius 1, 10, and 100.
0.0
0.1
0.2
0.3
−10 −5 0 5Log border−centroid ratio
Den
sity
Radius
1
10
100
Figure A2: Border-centroid ratios of fields of simulated points on polygons of different size.
A5

E Wall Construction by Type and Period
Table A1: Number of structures identified in Stoob 1988 by construction type and period. Many cities buildmultiple defensive structures over time.
Type Pre-1190 1190-1250 1250-1450 Post-1450
Earthen 1463 0 0 0Wooden 255 398 614 59Stone 158 491 1982 122Reinforced 3 104 450 76Bulwarks 0 0 60 56Bastions 0 0 5 377
A6

F Gunmakers Over Time
0
20
40
60
80
1350 1400 1450 1500 1550 1600 1650 1700 1750Period (starting year)
Cou
nt o
f new
man
ufac
ture
rs
Figure A3: Number of unique artillery manufacturers by period of first known operation (Kennard 1986).
A7

G Summary Statistics of Covariates
Table A2 shows city-level summary statistics (relevant for Sections 5.2 and 5.3) for the covariatesdiscussed in Section 4.1.4. All distances are given in kilometers. The ruggedness index providedby Nunn and Puga (2012) is divided by 1000 for interpretability when reporting regression results.City-level measures for the ruggedness, agricultural productivity, and soil quality measures areconstructed by taking the raster value at the point where a city is geolocated.
Table A2: Summary statistics of city-level covariates.
Statistic N Mean St. Dev. Min Pctl(25) Pctl(75) MaxAtlantic coastline 6,559 0.022 0.148 0 0 0 1Distance to large river 6,559 54.361 45.523 0.008 16.370 81.764 218.548Agricultural productivity 6,559 5,913.376 621.486 0 5,684 6,201 7,167Distance to major Roman road 6,559 146.178 171.192 0.027 11.851 234.355 828.142Soil quality index 6,559 5,894.224 616.954 0.000 5,682.500 6,192.000 7,048.250Terrain ruggedness index 6,559 76.788 98.977 0.000 19.961 94.288 901.970Distance to limestone deposit 6,559 32.514 56.224 0.000 1.311 37.919 411.365
A8

H Additional Analyses and Robustness Checks
H.1 Border Disappearance
Figure A4 compares the point estimates and 95% confidence intervals for a naive linear regressionof agglomeration and complex wall construction, a standard two-way fixed-effects specification thatcontrols for grid cell and time period, and the de Chaisemartin-d’Haultfoeuille estimator. Theregression shows a positive correlation consistent with the theory. However, this specification isvulnerable to a host of confounding variables. Perhaps the most serious confounder among theseis the initial distribution of population and wealth: large, wealthy cities have the resources toconstruct sophisticated fortifications but are also more valuable targets for nascent states. (It isimportant to emphasize that we only consider the initial distribution as a possible confounder.Wealth and population are endogenous to security, so it would not be appropriate to include timevarying measures as control variables because the regressions would be subject to post-treatmentbias.) Even without precise measures of historical wealth and population it is possible to control forthese unobserved time-invariant confounders when estimating the model by differences-in-differences(shown in the middle of the figure). The technique controls for time invariant confounders becauseall effects are found using within grid cell variation over time. Note that the de Chaisemartin-d’Haultfoeuille estimator is a different estimator than the classic two-way fixed-effects estimatorand will thus not have the same point estimate.
Figure A5 shows a different visualization of the intuition conveyed in the other analyses. Itcompares the distribution of the log km of borders eliminated before vs. after 1450 in grid cells thatdid vs. did not eventually receive complex fortification investments. Before 1450, the outcomes foreach type of cell was almost precisely the same; after 1450, grid cells with complex walls experiencedsignificantly more major eliminations.
de Chaisemartin−d'Haultfoeuille
TWFE
OLS
20 30 40 50Borders eliminated (km)
Mod
el
Figure A4
A9
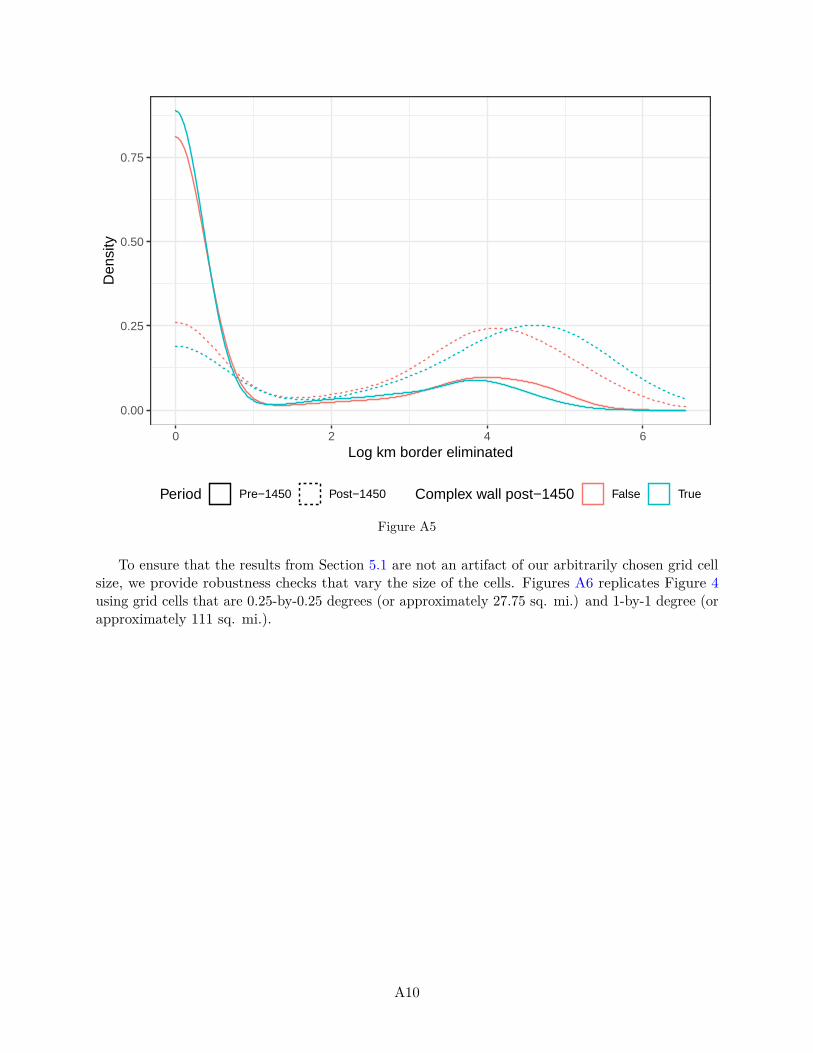
0.00
0.25
0.50
0.75
0 2 4 6Log km border eliminated
Den
sity
Period Pre−1450 Post−1450 Complex wall post−1450 False True
Figure A5
To ensure that the results from Section 5.1 are not an artifact of our arbitrarily chosen grid cellsize, we provide robustness checks that vary the size of the cells. Figures A6 replicates Figure 4using grid cells that are 0.25-by-0.25 degrees (or approximately 27.75 sq. mi.) and 1-by-1 degree (orapproximately 111 sq. mi.).
A10

0
2
4
1250 1350 1450 1550 1650Year
Bor
der
elim
inat
ed (
km)
0
40
80
120
1250 1350 1450 1550 1650Year
Bor
der
elim
inat
ed (
km)
Figure A6: These figures replicate figure 4 using 0.25-by-0.25 (top) and 1-by-1 degree (bottom) grid cells.
A11

H.2 Border-Centroid Ratios
0.0
0.1
0.2
−10 −5 0 5Log border−centroid ratio
Den
sity Period
Pre−1450
Post−1450
Figure A7: Density graphs of minimum log border centroid ratios pre- and post-1450 as described in Section5.2.
A12
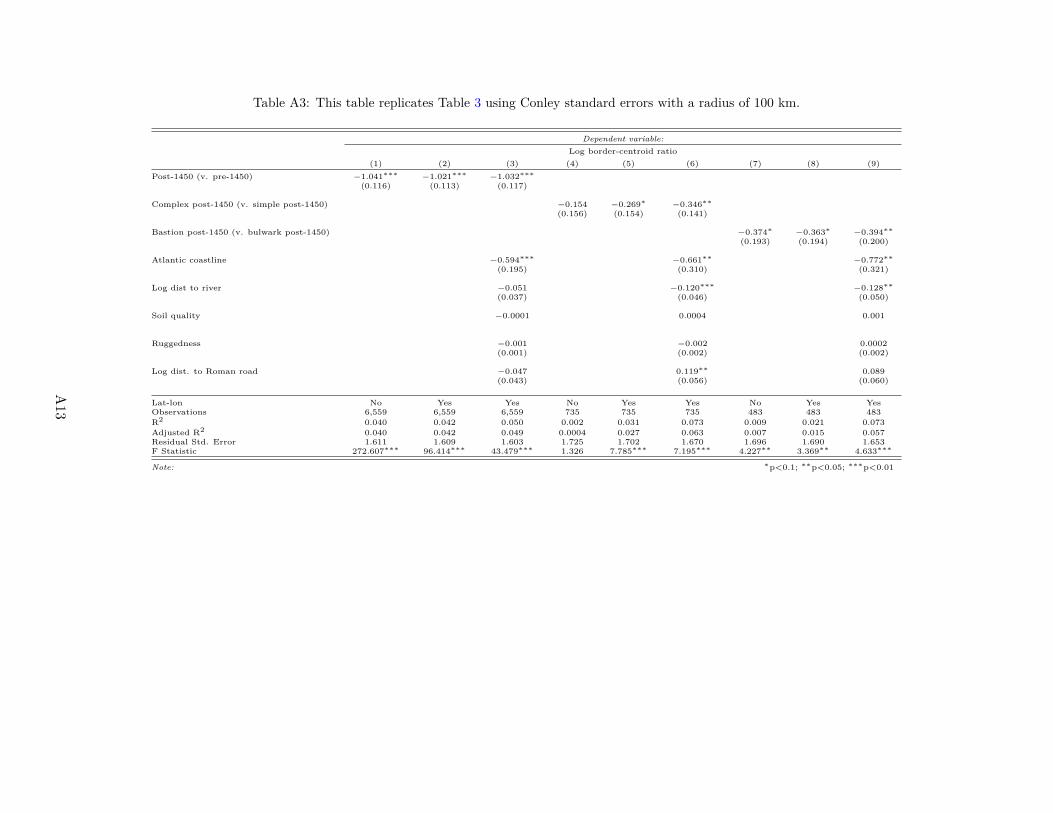
Table A3: This table replicates Table 3 using Conley standard errors with a radius of 100 km.
Dependent variable:Log border-centroid ratio
(1) (2) (3) (4) (5) (6) (7) (8) (9)Post-1450 (v. pre-1450) −1.041∗∗∗ −1.021∗∗∗ −1.032∗∗∗
(0.116) (0.113) (0.117)
Complex post-1450 (v. simple post-1450) −0.154 −0.269∗ −0.346∗∗
(0.156) (0.154) (0.141)
Bastion post-1450 (v. bulwark post-1450) −0.374∗ −0.363∗ −0.394∗∗
(0.193) (0.194) (0.200)
Atlantic coastline −0.594∗∗∗ −0.661∗∗ −0.772∗∗
(0.195) (0.310) (0.321)
Log dist to river −0.051 −0.120∗∗∗ −0.128∗∗
(0.037) (0.046) (0.050)
Soil quality −0.0001 0.0004 0.001
Ruggedness −0.001 −0.002 0.0002(0.001) (0.002) (0.002)
Log dist. to Roman road −0.047 0.119∗∗ 0.089(0.043) (0.056) (0.060)
Lat-lon No Yes Yes No Yes Yes No Yes YesObservations 6,559 6,559 6,559 735 735 735 483 483 483R2 0.040 0.042 0.050 0.002 0.031 0.073 0.009 0.021 0.073Adjusted R2 0.040 0.042 0.049 0.0004 0.027 0.063 0.007 0.015 0.057Residual Std. Error 1.611 1.609 1.603 1.725 1.702 1.670 1.696 1.690 1.653F Statistic 272.607∗∗∗ 96.414∗∗∗ 43.479∗∗∗ 1.326 7.785∗∗∗ 7.195∗∗∗ 4.227∗∗ 3.369∗∗ 4.633∗∗∗
Note: ∗p<0.1; ∗∗p<0.05; ∗∗∗p<0.01
A13

H.3 Spatial Patterns of Investment
Table A4: This table replicates Table 4 using Conley standard errors with a radius of 100 km.
Dependent variable:Log dist. to border eliminiation post-1450
(1) (2) (3)Falls behind 0.100 0.040 0.079
(0.148) (0.127) (0.128)
Catches up −0.161 −0.136 −0.223∗∗
(0.105) (0.111) (0.097)
Progressive development −0.036 −0.041 −0.100(0.207) (0.182) (0.179)
Atlantic coastline 1.216∗∗∗
(0.220)
Log dist. to river −0.023(0.040)
Ag. prod. −0.001(0.001)
Ruggedness −0.071(0.055)
Log dist. to Roman road −0.0003∗∗∗
(0.0001)
Lat-lon No Yes YesObservations 4,489 4,489 4,489R2 0.002 0.026 0.059Adjusted R2 0.001 0.025 0.057Residual Std. Error 1.382 1.366 1.343F Statistic 2.327∗ 23.808∗∗∗ 27.894∗∗∗
Note: ∗p<0.1; ∗∗p<0.05; ∗∗∗p<0.01
Table A5: This table replicates Table 5 using Conley standard errors with a radius of 100 km.
Dependent variable:Builds any stone-and-mortar wall
(1) (2) (3)Log dist. to limestone −0.007∗∗∗ −0.004∗∗ −0.004∗∗
(0.002) (0.002) (0.001)
Post-1450 −0.315∗∗∗ −0.319∗∗∗ −0.321∗∗∗
(0.024) (0.024) (0.024)
Log dist. to limestone x post-1450 0.007∗∗∗ 0.006∗∗∗ 0.006∗∗∗
(0.002) (0.002) (0.002)
Atlantic coastline 0.028(0.046)
Log dist. to river 0.007(0.005)
Ag. prod. 0.00001(0.00001)
Ruggedness −0.0002∗∗
(0.0001)
Log dist. to Roman road −0.021∗∗∗
(0.007)
Soil quality 0.00005∗∗
(0.00002)
Lat-lon No Yes YesObservations 10,893 10,893 10,893R2 0.092 0.142 0.160Adjusted R2 0.092 0.142 0.159Residual Std. Error 0.435 0.422 0.418F Statistic 367.737∗∗∗ 361.709∗∗∗ 188.340∗∗∗
Note: ∗p<0.1; ∗∗p<0.05; ∗∗∗p<0.01
A14