Conflict and cooperation in water governance - Namwala District, Zambia
64
1 DIIS WORKING PAPER 2010:15 Conflict and cooperation in local water governance – inventory of local water- related events in Namwala District, Zambia Carol Emma Mweemba, Imasiku Nyambe, Mikkel Funder and Barbara Van Koppen DIIS Working Paper 2010:15 WORKING PAPER DIIS WORKING PAPER
Transcript of Conflict and cooperation in water governance - Namwala District, Zambia

1
DIIS WORKING PAPER 2010:15
Conflict and cooperation in local water governance – inventory of local water-related events in Namwala District, Zambia
Carol Emma Mweemba, Imasiku Nyambe, Mikkel Funder and Barbara Van Koppen
DIIS Working Paper 2010:15
WO
RKIN
G P
APE
RDIIS WORKING PAPER

2
DIIS WORKING PAPER 2010:15
CAROL EMMA MWEEMBAResearch Associate at the Integrated Water Resources Management Centre at University of Zambia.
IMASIKU NYAMBEAssociate Profesor and Coordinator of the Integrated Water Resources Management Centre at University of Zambia.
MIKKEL FUNDER Researcher at Danish Institute for International Studies
BARBARA VAN KOPPEN Principal Scientist at the International Water Management Institute, South Africa.
DIIS Working Papers make available DIIS researchers’ and DIIS project partners’ work in progress towards proper publishing. They may include important documentation which is not necessarily published elsewhere. DIIS Working Papers are published under the responsibility of the author alone. DIIS Working Papers should not be quoted without the express permission of the author.
DIIS WORKING PAPER 2010:15© Copenhagen 2010Danish Institute for International Studies, DIIS Strandgade 56, DK-1401 Copenhagen, DenmarkPh: +45 32 69 87 87Fax: +45 32 69 87 00E-mail: [email protected]: www.diis.dk
Cover Design: Carsten SchiølerLayout: Allan Lind JørgensenPrinted in Denmark by Vesterkopi AS
ISBN: 978-87-7605-394-9
Price: DKK 25.00 (VAT included) DIIS publications can be downloaded free of charge from www.diis.dk

3
DIIS WORKING PAPER 2010:15
ACKNOWLEDGEMENT
Foremost many thanks go to the Danish Research Council, Danish Ministry of Foreign Affairs for financing the Competing for Water Programme (2007-2010).
This paper draws on the collective thinking of the Competing for Water research partners for developing the conceptual and methodological framework for undertaking the inventory of conflictive and cooperative water-related events at the district level. The Competing for Water partners who participated in the developing the inventory framework are Moussa Djiré and Abduolaye Cissé, Groupe de Recherche en Sociologie et Droit Appliqué, Université de Bamako (Mali), Ligia Gómez, Tania Paz and Roberto Rivas, Nitlapan, Universidad Centroamericana (Nicaragua), Phuong Le, Yen Nguyen and Huong Pham, Centre for Agro-ecological Research and Environmental Studies, Hanoi Agricultural University (Vietnam), Carol Mweemba and Imasiku Nyambe, Centre for Integrated Water Resources Management, University of Zambia (Zambia), Barbara Van Koppen, International Water Management Institute (South Africa), Lorenzo Cotula, International Institute for Environment and Development (United Kingdom), Thomas Skielboe, Nordeco (Denmark), Jens Sjørslev, DHI Water and Environment (Denmark) and Mikkel Funder, Julie Koch, Helle Munk Ravnborg and Signe Marie Cold-Ravnkilde, Danish Institute for International Studies (Denmark).
We thank the University of Zambia – School of Mines for hosting the Competing for Water Programme in Zambia under the Integrated Water Resources Management Centre. We also thank the Patron for the Project; Ms. Silvia Masebo, Minister of Local Government and Housing and members of the National Working Group for their invaluable contributions to the project.
Finally, most important thanks go to the people of Namwala District for their support in allocating time to the research as respondents and providing necessary information in the research.
List of available papersCossio, Vladimir, Rocío Bustamante and Thomas Skielboe: Cooperation and Conflict in
Local Water Management. Conflict and cooperation in local water governance – inventory of local water-related events in Tiraque District, Bolivia. DIIS Working Paper 11/2010. Copenhagen: Danish Institute for International Studies.
Djiré, Moussa, Abdoulaye O. Cissé, Signe Marie Cold-Ravnkilde, Amadou Keita and Anna Traoré: Conflict and cooperation in local water governance – inventory of local water-related events in Douentza District, Mali. DIIS Working Paper 12/2010. Copenhagen: Danish Institute for International Studies.
Rivas Hermann, Roberto, Tania Paz Mena, Ligia Gómez and Helle Munk Ravnborg: Cooperación y Conflicto en torno a la Gestión Local del Agua en el municipio de Condega, Nicaragua. DIIS Working Paper 13/2010. Copenhagen: Danish Institute for International Studies.
Nguyen, Yen Thi Bich, Le Thi Thanh Phuong, Thomas Skielboe and Pham Thi Mai Huong: Conflict and cooperation in local water governance – inventory of local water-related events in Con Cuong District, Nghe An Province, Vietnam. DIIS Working Paper 14/2010. Copenhagen: Danish Institute for International Studies.

4
DIIS WORKING PAPER 2010:15
CONTENTS
Abstract 6
Abbreviations and Acronyms 8
CHAPTER 1 91.1 Introduction and Background 91.2 Research Objectives and Expected Results 101.3 Conceptual Framework 11
CHAPTER 2 122.1 Methodology 12
2.1.1 Research Definitions 122.1.2 Sampling Strategy 142.1.3 Overview of Event and Situation Formats 172.1.4 Sources of Data for Checking on Events 182.1.5 Reported and Unreported Events 202.1.6 Biases and Limitations in the Data 21
CHAPTER 3 22
3.1 General Overview of Zambia 223.1.1 Climate 223.1.2 Relief 233.1.3 Drainage 253.1.4 Vegetation 253.1.5 Demographic Profile of Zambia 25
3.2 Main Characteristics of Study Area – Namwala District 263.2.1 Geophysical Location of Namwala District 263.2.2 Population Distribution 27
3.3 Context Data of Namwala District 273.3.1 Water Availability, Use and Access 273.3.2 Land and Land Use 283.3.3 Governance 28
CHAPTER 4 30
4.1 Distribution of Events in Space and Time 304.1.1 Distribution of Events across Communities 314.1.2 Inter- and Intra-Community Events 334.1.3 Events Duration 344.1.4 Event Years 34
CHAPTER 5 37
5.1 Extent to which Events are Conflictive and Cooperative 375.1.1 Character of Events 37

5
DIIS WORKING PAPER 2010:15
5.1.2 Intensity of Water Events 37
CHAPTER 6 40
6.1 Driving Factors for Water Events 406.1.1 Types of Water Uses 406.1.2 Intra, Inter and User/Regulator Events 416.1.3 Issues of the Events 426.1.4 Types of Water Sources 436.1.5 Type of Infrastructure in the Events 446.1.6 Ownership of Water Sources in the Events 45
CHAPTER 7 46
7.1 Event Stakeholders and Their Actions 467.1.1 Direct Parties to the Events 467.1.2 Number of People Involved in Events 487.1.3 Number of People Affected by/Benefiting from Events 487.1.4 Share of Women/Men Involved in Events 497.1.5 Share of Women/Men Affected by/Benefiting from Events 497.1.6 Types of Actions Taken During Events 507.1.7 Ways in Which Claims of Access are Supported 51
CHAPTER 8 53
8.1 Third Party Involvement 538.1.1 Formal Demands Submitted to External Authorities 538.1.2 Calls upon Third Parties 538.1.3 Stakeholders Calling upon Third Parties 548.1.4 Types of Third Parties Called upon 55
CHAPTER 9 42
9.1 Event Outcomes 569.1.1 Assessment of Who Gained in the Events 569.1.2 Assessment of Who Lost in the Events 57
CHAPTER 10 59
10.1 Situations and Events 59
CONCLUSIONS 59Notes 61
References 62
Extent to which Events are Conflictive and Cooperative

6
DIIS WORKING PAPER 2010:15
ABSTRACT
Recent years have witnessed an increasing focus on water as a source of con-flict. So far, much of the focus has been on the risk for transboundary water conflicts. Our current knowledge on local water conflicts is however more lim-ited, and tends to be based on sporadic accounts of local water conflicts rather than on systematic empirical evidence. At the same time, the extent and nature of local water cooperation is often overlooked, just as we know little about the particular role of the poorest in water conflict and cooperation.
The lack of such knowledge jeopardizes current initiatives taken in many de-veloping countries to ensure a more efficient and equitable water governance. To fill this gap, the Competing for Water research programme developed a conceptual and methodological framework for developing comprehensive in-ventories of local water-related conflict and cooperation. This report docu-ments the results of applying this framework in Namwala District, Southern Province, Zambia and discusses the implications.
7
DIIS WORKING PAPER 2010:15

8
DIIS WORKING PAPER 2010:15
ABBREVIATIONS AND ACRONYMS
DC District Commissioner DDCC District Developmental Coordinating CommitteeDWA Department of Water Affairs D-Washe District Water and Sanitation Health EducationECZ Environmental Council of ZambiaESCO Engineering Services Co-operationFAN Fishermen’s Association of NamwalaFAWEZA Forum for Women EducationistGRZ Government of the Republic of ZambiaGWP Global Water PartnershipMACO Ministry of Agriculture and CooperativesMCDSS Ministry of Community Development and Social ServicesMEWD Ministry of Energy and Water DevelopmentMLGH Ministry of Local Government and HousingMTENR Ministry of Tourism, Environment and Natural ResourcesNDWA Namwala District Women’s AssociationNFA Namwala Farmer’s AssociationNGOs Non Governmental OrganisationsNWASCO National Water and Sanitation CouncilPDCC Provincial Developmental Coordinating CommitteePPAZ Planned Parenthood Association of ZambiaSWASCO Southern Water and Sewerage CompanyTFR Total Fertility RateWAZ Water Aid ZambiaWWF World Wide Fund for NatureZAMPOST Zambia Postal Services LimitedZAMTEL Zambia Telecommunications LimitedZANACO Zambia National Commercial BankZAWA Zambia Wildlife AuthorityZDHS Zambia Demographic and Health SurveyZESCO Zambia Electricity Supply Co-operation

DIIS WORKING PAPER 2010:15
9
CHAPTER 1
1.1 Introduction and Background Water and poverty are increasingly being linked in the public debate, not least due to the Millennium Development Goals and the explicit target to halve by 2015 the propor-tion of people without sustainable access to safe drinking water and improved sanitation. However, particularly in rural areas, the rela-tionship between poverty and water reaches far beyond the lack of access to safe drinking water. Secure access to water for productive purposes, e.g. irrigation and water retention for crop production; watering of animals; ecosystem protection to ensure fish and graz-ing availability, as well as for environmental services (e.g. flood and drought control), is key to a significant part of the rural poor if they are to move out of poverty (Bruns and Meinzen-Dick, 2005; GWP, 2003; Hodgson, 2004; Hope, 2006; PEP, 2005; Molden et al., forthcoming; UNESCO, 2006; World Bank, 2005).
As competition for water increases be-tween users and uses, the poor and otherwise disadvantaged groups tend to do less well than others in securing their access to water. In particular, entitlements to access water for productive purposes are often the first to be lost by the rural poor (Barker et al., 2000; Bruns and Meinzen-Dick, 2005). In this context, the current tendency to focus upon drinking water at the expense of the recognition of the wider importance of water to the rural poor (Black and Hall, 2003; GWP, 2003; PEP, 2005; Sous-san and Frans, 2003) is unfortunate, among other reasons because it diminishes the likeli-hood that access to water, e.g. for productive uses for the rural poor, is catered for in the legal, administrative and institutional water re-forms currently taking place in many develop-ing countries (Bruns et al., 2005).
Besides the fear that increased competition for water leads to poor people losing their access to water and thus further limits their options for moving out of poverty, there is a fear that increased competition for wa-ter leads to increasing conflict among users within as well as among different sectors. However, there is little empirical basis to sup-port firm conclusions on causal relationships between increased competition for water and the emergence of conflict and subsequently about their nature, intensity and impact.
Inspired by Wolf and his colleagues (2003), we identify several shortcomings associated with the current evidence of the relationship between water competition and conflict:
• Sporadic events. Most people’s understand-ing of the relationship between water competition and conflict has been based upon reports from sporadic events, rath-er than upon systematic overview of the complete range of water-related events within a given locality. Thus, the wide-spread sense that the number and intensity of water-related conflict is increasing, may just as well be a reflection of improved means of registering and communicating such as conflicts, rather than a reflection of the number and intensity of the con-flicts themselves.
• Excludes cooperative events. Conflicts tend to be more spectacular and thus easier to iden-tify than events of cooperation. Moreover, as norms, rules, and interests tend to be more explicit during conflictive situations than during times of cooperation, focusing upon conflict often entails methodological advantages. However, excluding coopera-tive events implies that conclusions about causality between increased competition for water and conflict are, at best, incom-plete. Accentuating this, and contrary to

10
DIIS WORKING PAPER 2010:15
prevailing wisdom, Wolf and his colleagues (2003) found that there was no causal rela-tionship between water stress and the like-lihood of conflict in transboundary basins, and that often water acts as a unifier.
• Lack of a temporal dimension. Conflicts do get resolved. Over time and often through efforts of mediation and negotiation, con-flicts, disputes and tensions get resolved and agreements to share or cooperate with respect to given water resources are reached. Snapshots of sporadic events – most commonly conflicts – fail to capture such processes of conflict resolution.
• Loose definitions. Terms such as conflict, dispute, tension and war tend to be used interchangeably and without clear defini-tions with respect to nature and intensity. The identification of these shortcomings had informed the design of this research programme. Thus, the research wanted to:
• develop comprehensive inventories of water-related events within the selected site for the research;
• ensure that the selected site covers a wide variety of situations encountered in the rural areas of the sub-humid wetlands of Zam-bia. Although not representative in a statis-tical sense, this range of cases provides a sound basis for drawing reliable and more general conclusions;
• identify conflictive as well as cooperative water-related events;
• include a temporal dimension so that invento-ries of conflictive and cooperative water-related events are developed for a 10-year period (1995-2005); and
• define a water-event intensity scale, as an ini-tial programme activity, ranging from vio-lent conflict, through milder conflicts in the form of discontent expressed through formal, e.g. legal or informal but legitimate, channels to signing a formal agreement.
1.2 Research Objectives and Expected ResultsWater is vital to local livelihoods and a key pre-requisite for development. In recognition of this, recent years have seen an increasing fo-cus on efforts to ensure effective water man-agement in developing countries, reflected most clearly in the widespread water reforms taking place, often supported through asso-ciated donor-funded programmes. Alongside these developments, there is an increasing fo-cus on water as a source of conflict. This has included growing attention to transboundary water conflicts and collaboration, and more recently also a spreading perception that the number and intensity of local water conflicts are growing (Carius et al., 2004; Thomasson, 2005).
However, while transboundary water con-flicts are quite well-documented (Wolf et al., 2003), the perception of growing local con-flicts is based mostly on sporadic accounts of local water conflicts rather than on systematic empirical evidence. Even less is known with respect to how the poor, women and other-wise disadvantaged groups fare in such local conflict and cooperation, and, in general, how they are affected by increasing competition for water (UNESCO, 2006). The lack of bet-ter insight into these issues limits the ability of governments and donors to ensure that water policies are consistent with Poverty Re-duction Strategies and with the overall objec-tives of poverty reduction and equal access to resources for men and women as well as for different ethnic groups.
The research programme aimed to contrib-ute to sustainable local water governance in support of the rural poor and otherwise disadvantaged groups in developing countries by improving the knowledge among researchers and practitioners of the nature, ex-tent and intensity of local water conflict and coopera-tion and their social, economic and political impacts,

DIIS WORKING PAPER 2010:15
11
and how this may change with increased competition for water. Beyond its cognitive importance, such empirically-based understanding has significant implications for the water policy, legal and administrative reforms currently taking place in many developing countries, which – if poorly informed on the relation-ship between competition for water, conflict and poor people’s access to water – may cause such reforms to be ineffective and exacerbate rather than reduce rural poverty.
Based on comparative research conducted in five countries (Mali and Zambia in sub-Sa-haran Africa; Vietnam in south-east Asia; and Bolivia and Nicaragua in Latin America), the research programme sought to provide the following main results:
• Quantitative inventories and qualitative case studies of the origin, nature, extent and intensity of local water conflicts and cooperation in five countries in Africa, Asia and Latin America, and of their so-cial, economic and political impacts
• Cross-cutting analysis and synthesis of findings from national studies, including typologies of water conflicts and coopera-tion and contributions to the theoretical understanding of the impact of economic and political inequality on the nature and outcomes of water-related conflict and co-operation
• Recommendations for ongoing water pol-icy, legal and administrative reforms devel-oped and disseminated to national deci-sion-makers, practitioners, researchers and relevant Danida sector support and Danida support provided through multilateral or-ganizations
• Enhanced capacity and experience in the partner institutions within poverty-orient-ed analysis of water conflicts and coopera-tion.
1.3 Conceptual FrameworkAs witnessed by the many ongoing water reform efforts around the world, the need for better rules for coordinating water use and resolving conflicts accentuates with increasing competition for water. As not-ed by Bruns and Meinzen-Dick (2005:3), “similar pressures to define property rights have emerged for land as it has become scarcer, but whereas changes in land ten-ure institutions are more familiar, studied, and debated, changes in water tenure have received much less attention.” With water as a fluid and highly variable resource in quantity, quality and time, water tenure is more difficult to specify than land tenure. Yet, considerable advancement has been made, however, during the past decades to conceptualize water rights (Bruns and Meinzen-Dick, 2000 and 2005; Meinzen-Dick, 2003), and efforts are emerging which seek to accommodate and integrate formal and customary water rights (Bruns et al., 2005; Rogers and Hall, 2003).
However, as is the case for other re-sources, holding ‘rights’ – whether formal or customary – is neither a sufficient nor a necessary precondition to enjoy access to water (Bruns et al., 2005). In their Theory of Access, Ribot and Peluso (2003) distinguish between property and access as “the right to benefit from things” versus “the ability to benefit from things,” the latter in turn being gained, maintained or controlled through structural and relational mechanisms. These structural and relational access mechanisms include capital and technology, labour and labour opportunities, markets, knowledge, authority, social identity and social relations of friendship, trust, reciprocity, patron-age, dependence and obligation (Ribot and Peluso, 2003). Politically or economically powerful stakeholders might obtain access

12
DIIS WORKING PAPER 2010:15
to water to which they have no formal or customary rights, just as poor farmers with landownership-based rights to water may not enjoy access to that water due to lack of capital and technology for making effective use of that water. In this way, poor people’s access to water does not only depend upon their rights to water but also upon the nature and level of political and economic inequal-ity which shape the institutions – whether formal or customary – registering, sanction-ing and enforcing these rights as well as the economic and technological opportunities to benefit from existing water rights.
Recent empirical studies of natural re-source management and conflicts further-more suggest that processes of gaining, maintaining and controlling access are high-ly dynamic processes in which stakeholders actively negotiate maneuver and shift posi-tions (e.g. Juul and Lund, 2002). In doing so, they draw on but also actively recreate exist-ing institutional frameworks and social, eco-nomic and cultural structures (Berry, 1993; Cleaver, 2002). In order to capture this dy-namic, the research project will apply a com-bined structure/actor perspective (Giddens, 1984; Bourdieu, 1998). Hence, apart from the structural features mentioned above (the institutions, rules and socio-economic re-sources held by stakeholders), the study will also explore the actual processes of water con-flict and cooperation.
Thus, in addition to assessing the social impacts of water-related conflict and co-operation, the research programme aims to contribute to the understanding of the mechanisms through which political and economic inequality shapes the nature and outcomes of water-related conflict and co-operation.
CHAPTER 2
2.1 MethodologyThe mapping of water events involved both qualitative and quantitative methods of re-search. Qualitative methods involved estab-lishing comparative working methods suit-able for all five research countries – Bolivia, Mali, Nicaragua, Vietnam and Zambia, where research was collaboratively conducted, and this was facilitated by the Danish Institute for International Studies (DIIS). Methods designed included defining working termi-nologies in the research programme, design-ing entry strategies into communities for the collection of unreported events and identify-ing sources of institutional data and defining which data on both reported and unreported events needed to be collected.
The selection of study site was done quan-titatively by narrowing down the study area to a manageable but representative sample; including the selection of communities.
2.1.1 Research Definitions Working terminologies/concepts in the re-search were defined to include conflict and cooperation, situations and events, reported and unreported.
Conflict and Cooperative EventsAn event is conflictive if one or more parties challenge other actors’ access to a particu-lar water resource. This may range from e.g. petty water theft (which essentially challenges the access rights of the rightful water user) to open violence and aggression. The ‘chal-lenge’ may include the amount of water being withdrawn, or the basic right to access water in the first place.
An event is cooperative if one or more par-ties engage in jointly coordinated actions with other actors to secure shared water access.

DIIS WORKING PAPER 2010:15
13
This may range from verbal acknowledge-ment of the rights of others, through joint water management mechanisms. The ‘shar-ing’ does not necessarily mean a common pool arrangement – it can also include alloca-tion of individual/private water allocation. To qualify as cooperative, events must have an ac-tive element: While general co-existence does involve some form of passive recognition of the other, actual cooperation requires some form of active behaviour vis-à-vis the other.
Situations and Events Competition for water takes place within particular situations. A water situation is a social situation where two or more parties have competing interests in the same water resource. The competition takes place through water events. Water situations may be cooperative when parties manage to negotiate and/or sustain agreements for wa-ter use or they may be conflictive when water access and use of one or more parties is con-tested. Competitive water situations can be characterized as ‘mainly cooperative’, ‘mainly
conflictive’ or an equal mix of both.An event is an action (or set of actions) that
seeks to secure a party’s water access by either challenging the access of other parties, or col-laborating with other parties to secure shared water access. The parties in events may in-clude individuals, groups and organisations. Examples of parties are households, user groups, communities, companies, regulating agencies and authorities, etc.. ‘Seeking access’ may include seeking direct access to water use (by e.g. farmers or pastoralists), or seeking to regulate and allocate that water resource (by e.g. state or traditional authorities).
Water conflict and cooperation take place within a particular national and local context or setting. This includes the local and wider physical and hydrological regime, the socio-economic, cultural and political setting, the various policies and legal and administrative frameworks, and the local natural resource management practices.
The nested relationship of the context, sit-uation and event is illustrated in figure 1.
Figure 1. The nested relationship of the context, water situation and water event

14
DIIS WORKING PAPER 2010:15
Reported and Unreported EventsBy ‘reported events’ we refer to events about which information has been obtained from institutional sources outside the location of the event. That could be local or national authorities, the media, NGOs, etc. By ‘un-reported events’ we refer to events about which information has been obtained from local sources, meaning citizens or local insti-tutions at the location of the event. Some events were both reported and unreported, meaning that information had been obtained both from institutional sources outside the location of the event, and from sources at the location of the event.
2.1.2 Sampling Strategy Sampling for inventory was done at 3 differ-ent levels. Firstly, the selection of the site, secondly, village selection and lastly selec-tion of informants for inventory. All three selections were of great significance to the research methodology in paving way for a successful and comprehensive review of water events in Namwala District. Different methods of selection for site, village and informants were used with each criteria be-ing guided by methods developed collabora-tively with partner research countries (Mali, Vietnam, Bolivia, Nicaragua and Denmark – the lead).
Site SelectionSite selection was diverse in all five research countries. In Zambia the selection of the study area was guided by the presence of a multitude of water uses such as small-scale farming, domestic water consumption, irriga-tion, and livestock keeping, including hydro power generation. There was also recognition of the importance to avoid exclusive focus on sites with extreme records of water-related conflicts.
Figure 2. Motivating conditions for the selection of research site
��
�
�
���������������������
�����������������
��������
�������������������������������
���������������������������
������������������������������������������
�������������������������
�
�
�
�
���������������������
�����������������
��������
�������������������������������
���������������������������
������������������������������������������
�����������������������
�
�
�
�
���������������������
�����������������
��������
�������������������������������
���������������������������
������������������������������������������
���������������������������
��
�
�
���������������������
�����������������
��������
�������������������������������
���������������������������
������������������������������������������
����������������������������
�
�
�
�
���������������������
�����������������
��������
�������������������������������
���������������������������
������������������������������������������
�������������������������

DIIS WORKING PAPER 2010:15
15
At a global level, selection of sites for re-search was guided by the geographical spread of sites across continents and agro-ecological zones were considered, including the repre-sentation of diverse conditions with respect to water availability and population density, as shown in figure 2.
Preference was given to Zambia as a coun-try that had previously undertaken Danida programmes and presently has Danida pro-grammes running. In addition, the selection of Zambia as a site for research was moti-vated by the existence of previous research experiences and established research partner-ships.
Village Sampling For the identification of unrecorded events, a random sample of 10 villages was made from the total of 427 village communities identi-fied in Namwala District. Identification of village communities was done by reviewing community records from Namwala Council
Office as well as records from 2000 Census Reports. Local level organisations, i.e. tradi-tional structures, were consulted for recog-nised village communities in their traditional jurisdiction where community registers were provided.
The selection started by making complete lists of all the communities within Namwala District. In order to ensure that all commu-nities (small and big) were included in the sample, complete lists of communities were ‘weighted’, so that a community with 10 in-habitants was weighted differently from one with 100. Weighting a community increased its likelihood for being selected by its size in terms of the number of inhabitants. From the weighed list of communities, we proceed-ed to select 10 in a lottery form – assigning each community number(s) and then ran-domly selecting 10 numbers corresponding to 10 communities. Map 1 shows the number of communities selected in each of the four chiefdoms.
Map 1. Number of communities selected per chiefdom, Namwala District

16
DIIS WORKING PAPER 2010:15
Informant SelectionThe selection of informants for review of water events that had been formally report-ed was guided by identifying institutions and departments of water relevance both at na-tional and district level. Consideration was put on regulatory organisations as well as law enforcing institutions for the regulatory of water uses/management and maintaining law and order in water access, respectively. Both at national and district levels, informants for inventory for recorded events included per-sons from government tiers; Ministry of Local government and Housing (MLGH), Ministry of Energy and Water Development (MEWD), Ministry of Agriculture and Coop-eratives (MACO), Ministry of Transport and Communication, Ministry of Community Development and Social Services (MCDSS), Ministry of Tourism, Environment and Nat-
ural Resources (MTENR), Ministry of Justice – local courts, extension workers; fisheries, agriculture, livestock, water and health.
The quasi governments and institutions were also contacted as sources of informa-tion for inventory. Contacted institutions included; Environmental Council of Zam-bia (ECZ), National Water and Sanitation Council (NWASCO), Southern Water and Sewerage Company (SWASCO) and Zambia Wildlife Authority (ZAWA). The media was also a key source of information for reported events.
Other key informants of great importance were personnel from Namwala Rural Coun-cil, and District Commissioner for Namwala District.
Selection of community level informants required knowledge and access to certain inhabitants and key informants who knew
Table 1. Community sample description, Namwala District, ZambiaSampling stratum: Composed of number of villages in chiefdoms, total number of households and ideal number of villages to be selected per sampling chiefdom.
Source: Central Statistical Office, Namwala Council Office and Namwala traditional leaders

DIIS WORKING PAPER 2010:15
17
about other people’s livelihood. Key inform-ants included community representatives including traditional leaders and members of various local organisations. For compre-hensive inventory of all water events in the district, the four traditional rulers (chiefs) in the district were contacted as key informants of water events in their chiefdoms. Head-men and ward councillors also composed the pool of key informants for water events in Namwala District.
However, in order to ensure maximum var-iation sampling, ordinary citizens with varying backgrounds and in different segments of the community were interviewed. For the com-prehensive inventories of all water events, community samples included:
• Women and men, young and old• People from different geographical parts
of the community• Water Committee members• Resident water users as well as absentee
water users• Pastoralists, crop farmers and domestic
water users.
2.1.3 Overview of Event and Situation Formats
The inventory format developed was the same for all five research partner countries, to allow for cross-country comparison. It con-tained various data needed to obtain both re-corded and unrecorded events. The formats were sufficient to capture data on all water uses and use types, including issues which the events and situations were about, whether events where on water access or management. Given the varied issues addressed, the events and situation formats addressed issues of the actual locations where events and situations took place. Inventory formats required and addressed data on the country, district, zone,
community and sector or neighbourhood or sub village. Basins, watersheds, micro-water-shed and the actual locations (longitudinal and latitudinal) were mapped out to show the exact locations where events and situations took place.
The formats used to register events ad-dressed types of water uses, including drink-ing water for both rural and urban water supply, irrigation, discharge of contaminat-ing substances, fishing, consumptive uses, hydropower generation, navigation purposes, environmental uses, recreation, tourism and drinking water for animals. The design of the formats was sufficient to establish the types of water uses that attracted most events of conflict and cooperation.
Further, events formats disaggregated all types of water uses into more conclusive wa-ter use types where an analysis was made to establish whether events involved different uses (inter-use event), or same type of uses (intra-use event) or if events were between users and regulating authorities (user-regula-tor event).
Different issues of the water events were reviewed. Issues of water events were about competing claims of access for con-sumptive uses, types of consumptive uses, contamination, depletion of ground water, deviation of water, water regulation/flood-ing, privatisation of water supply, privatisa-tion/concessions of water resource, timing for watering animals, timing for watering crops, contested/competing rules for water management, water scarcity, environmental protection, dam/hydropower construction, damaged drinking water supply infrastruc-ture (well, small-scale piped water system; etc.), the need for drinking water supply, damaged irrigation infrastructure and the need for irrigation infrastructure, including other infrastructural developments.

18
DIIS WORKING PAPER 2010:15
The formats used for the water events sufficiently established interest groups that formed part of water events. In any com-petition, including competition for water, various stakeholders are involved as interest groups with varying motives for wanting to seek access, while others act as mediators or regulators. Importantly, inventory for-mats identified parties directly or indirectly involved in water events both as competi-tors for water access and as responsible par-ties for water management. Additionally, it was of great importance to identify parties in numbers directly or indirectly involved in water events and the share of women and men in those participations of water events. To a larger extent, the former reflects the gravity of the need for water access while the latter establishes the gender most in-volved and affected in water competition and access issues.
Provision was made in the formats to es-tablish sources of information for the re-search. The data for the research was obtained through archival research (documents, news-papers, administrative records, etc.), on one hand and through interviews with authori-ties, community members and other relevant stakeholders on the other. The use of events formats became important in the latter as the realisation of comprehensiveness in review of events was seen vital.
In order to provide a checklist for the time frame of events occurrence, the for-mats addressed in detail the months, seasons and years when events started or ended and whether or not events were ongoing. The analysis of time frame provided answers as to why events were spaced in time. Water scar-city is most prominent in the dry season in Namwala when people tended to compete over access more than in the rainy season. With such a situation, most water events re-
corded were for the dry season. It should be mentioned here, however, that the rainy also recorded significant water events.
Finally, the formats provided an assess-ment of parties who gained and those who lost water access from water events. The idea was to envisage favoured and less favoured parties/actors when seeking the common goal.
2.1.4 Sources of Data for Checking on Events Several organisations and institutions were identified as important sources of informa-tion for checking on reported and unreported events and events which, in addition to hav-ing been reported, had also been identified through community interviews.
Reported eventsAmong sources for reported events were the media, with a focus on public and private newspapers, national and local radio and tel-evision stations, including the internet.
Checking for more reported events was done at government ministries and depart-ments in Namwala District. Focus of such events was on the Office of the District Commissioner (DC) as the main overseer of administrative/political issues in the district, the Department of Water Affairs (DWA), under the Ministry of Energy and Water Development (MEWD) as a water relevant department, the Veterinary, Fisheries and Ag-riculture departments under the Ministry of Agriculture and Cooperatives (MACO) as ad-ministrators of major economic activities in the district that demand the use of the water resource. The District/rural council author-ity, the Police department under the Ministry of Home Affairs and the local and magistrate courts under the Ministry of Justice formed part of sources of data for checking on water events.

DIIS WORKING PAPER 2010:15
19
Other sources of information for checking on water events were the water utility com-pany in the District – Southern Water and Sewerage Company (SWASCO), and Non Governmental Organisations (NGOs). Also international organizations such as World Wide Fund for Nature (WWF) were impor-tant sources of information for checking on reported events.
Unreported eventsSources of information for checking on un-reported events included traditional water monitors, extension workers, shopkeepers, community leaders (elected or appointed), village headman/chief, elders’ councils, women’s groups, water committees, irrigation commit-tees, drinking water committees and the vil-lage representatives.
Events mentioned by community leaders (elected or appointed) had the highest count of 75 reflecting the high knowledge of com-munity leaders in activities that occur at community level. Events mentioned by the village government had the count of 67, while those mentioned by drinking water committees had the count of 53 and events mentioned by headmen/chiefs had the count of 47.
The lowest number of events was men-tioned by shopkeepers accounting for only two, as shown in figure 3.
Individual interviews with male and fe-male citizens were important sources of in-formation for the review of water events. In some cases, group interviews – either jointly with men and women or separately with men and women – were also used as most
Figure 3. Sources of information for unreported eventsNumber of events

20
DIIS WORKING PAPER 2010:15
important sources of information, as shown in figure 4.
Events not mentioned by ordinary com-munity citizens where represented by institu-tional sources of information. However, oth-er events mentioned by institutional sources of information were also reported through community interviews.
2.1.5 Reported and Unreported EventsRather than discussing actual events report-ed and those that are formally unreported, emphasis is put on the ratio of reported to unreported events. Figure 5 shows the ratio between events reported and unreported events.
In Namwala, most events reviewed were unreported events accounting for 55% as opposed to events reviewed to have been re-ported which accounted for 45%. Despite the existence of institutions where occurrences of events can be reported formally, not much is achieved in terms of actual reporting, as
observed in figure 5. Long distances that peo-ple have to cover from their villages to the Boma are a hindrance to formal reporting of water events.
Figure 4. Event mentioned by ‘ordinary’ community members
Figure 5. Reported and unreported eventsNumber of events

21
DIIS WORKING PAPER 2010:15
Rural areas where events take place are far spaced and not easily accessible by authori-ties to document all events that occur. The difficulty in reaching for information on the occurrence of water events causes a decline in reported events documented at formal in-stitutions and authorities, hence most events are unreported formally. In addition, the re-luctance by people affected and by people be-ing the direct parties to the events to report events and make known of events that occur, formally challenges the documentation of all water events for formal authorities to docu-ment.
In a more elaborate form, figure 6 disag-gregates the reported and unreported events into character types.
Conflictive events are high for reported and unreported events; reported events at 59 while unreported events are at 62.
2.1.6 Biases and Limitations in the DataFocus for community interviews for inven-tory of water events was on 10 village com-munities within the district with a sample size of not more than 15 respondents in each village community. The selection cri-terion of communities was representative of the whole community but did not cap-ture all events that occurred in other com-munities. In addition, the review of water events focused on events at water points and water bodies in the study areas because events were about water access. However, some communities had less water resource availability in terms of water points and wa-ter bodies, rendering a reduction of events recorded in those areas. In other cases, the less availability of water resources meant in-creased competition for water access at few water sources and hence more water events would be reviewed. Therefore it can not be deduced that all events were reviewed in the area of study because hydro-geological disparities in communities distorted percep-tions of the availability of water events to be reviewed. Further, informants in com-munities of water deficiencies discussed events that resulted from water inadequacies leaving out other important aspects of ac-cess and management that the study sought to establish.
In most cases, community respondents tended to recite events of particular charac-teristic of conflict and cooperation, and of-ten initially focused on high-profile events that they remembered well or which were particularly important to them. Community interviews were challenged when respond-ents associated the research to past unpleas-ant experiences they had with some named projects that had previously been executed in the project area. In one part of the district, some individuals suspected that the research
Figure 6. Ratio of reported to unreported events by event character Number of events

22
DIIS WORKING PAPER 2010:15
programme was a ‘mask’ to seize part of the flood plains from pastoral farmers using it as grazing land for their cattle and use it for oth-er developmental purposes, e.g. crop fields at commercial level. In these cases, creating conversations and getting information on events from suspecting respondents proved difficult.
Poor documentation of events at local authorities, media and government depart-ments meant that our identification of re-ported events in some cases relied on the recollections of government staff, rather than written records. Institutions and or-ganisations identified as resource institu-tions for information in the review of events were not entirely willing to allocate time to the researchers. Review of reported events from media libraries also had limi-tations. The major limitation was entry to and/or access to the libraries and archives that were restricted to be accessed by re-search personnel.
On this basis it cannot be ruled out that a minor proportion of events have been missed in the development of the inventory. We have, however, sought to minimize this by interviewing multiple informants with different characteristics in the same sites, by careful probing during interviews, and by checking our data with key informants at village and district levels. It should fur-thermore be kept in mind that our study and findings are focused on public events involv-ing multiple actors, which must be expected to be more easily traceable than events of a more discrete and private nature (which are not included in the inventory). It is therefore believed that the inventory provides a sound and extensive database on which to base an analysis of conflict and cooperation events in Namwala District.
CHAPTER 3
3.1 General Overview of ZambiaZambia is a landlocked country, lying between latitudes 8° to 18° south and longitudes 22° to 34° east. The country shares boundaries with eight other countries, Democratic Republic of Congo and Tanzania in the North; Malawi and Mozambique in the East; Zimbabwe and Botswana in the South; Namibia in the South West; and Angola in the West.
Zambia covers a total area of 752,612km2
and is administratively divided into nine prov-inces and 72 districts. Two of the provinces, Copperbelt and Lusaka, are predominantly urban while the seven other provinces (Cen-tral, Western, Luapula, Northern, North Western, Eastern and Southern) are largely rural. About 64% of the population lives in rural areas and 36% in urban areas. (National Statistics, 1996:10,15)
3.1.1 ClimateZambia, though situated within the tropics, enjoys a moderate temperate climate largely because of its elevation. Rainfall is the most important element in distinguishing the three seasons:
• Rainy season: a warm and wet season from November to April
• Cold season: a cold and dry season from April to August
• Hot season: a hot and dry season from Au-gust to November.
The rain starts in the north-west and progress-es towards the south-west. The annual rain-fall amounts to approximately 1,250 mm in the north and under 700 mm in south-west. A lot of rain falls from December to March. The mean daily temperature ranges from 2°C to 15°C during the cold season and 27°C to

DIIS WORKING PAPER 2010:15
23
37°C during the dry season. The humidity in the valley basins during the hot and wet sea-sons can be oppressive.
3.1.2 ReliefZambia’s characteristic features of relief are a series of undulating and flat plateaus which are broken by isolated hills into low ranges of resistant rocks. The plateaus are also di-vided by well-defined deep-cut linear valleys (related to the East African rift system) into very shallow broad-based depressions known as dambos and smaller semi-circular depres-sions called pans. The plateau, with an aver-age elevation of 1,300 metres above sea level, consists of a series of terraced surface which
either merge gradually or become separated by intensely dissected escarpment zones.
The plateau reaches its maximum height of 2,164 m in the east on the Malawi border and decreases gradually in a south-westerly direc-tion to a minimum height of 325 m at the Zambezi River, on the border with Mozam-bique. The greater part of the country lies be-tween 900 and 1,500 m above sea level. These significant erosion surfaces characterise the plateau, the larger between 1,300 m and 1,400 m and the smaller between 1,000 m and 1,300 m. The third lies beneath the cover of loose sediments in Western Zambia. The warping of the surface has resulted in swamps and a faulting into rift valleys. (Monley, 1986).
Map 2. Location of Zambia in the African Southern Region

24
DIIS WORKING PAPER 2010:15
Map 3. Zambia’s drainage areas and catchment systems
Figure 7. Major river basins within Zambia in km2 per basin area

DIIS WORKING PAPER 2010:15
25
3.1.3 DrainageZambia has five main rivers: the Zambezi, Kafue, Luangwa, Luapula and Chambeshi. In addition to these rivers, the country also has the lakes Tanganyika, Mweru, Mweru wa Ntipa, Bangweulu, and the man-made lakes Kariba and Itezhi Tezhi. Zambia and Zimba-bwe share the renowned and beautiful Victo-ria Falls, one of the natural wonders of the world.
Zambia surface waters flow within two major drainage basins, namely the Zambezi and the Congo River Basins. Zambia can be subdivided into six catchments includ-ing the Zambezi, Kafue, Luangwa, Luapula, Chambeshi and Tanganyika. She also has enormous ground water reserves which re-main largely as unexploited potential that can be developed. Figure 7 shows major river ba-sins in square kilometres per basin area.
Given her huge rivers, Zambia has substan-tial hydroelectric potential. The Kariba Dam on the Zambezi River is the country’s main power source. Zambia shares the Kariba sys-tem with Zimbabwe. Other stations on the Lunsemfwa and Mulungushi rivers serve Ka-bwe town. Installations have also been built on the Kafue River. In 2001, the total output of electricity in the country was 7.8 billion kilowatt-hours, and nearly all of it was pro-duced from hydroelectric plants.
3.1.4 VegetationThe natural vegetation of Zambia is mainly woodland savannah with a great variety of trees and isolated small areas of grassland and swamps.
Savannah woodland includes a close mix-ture of trees standing in tall growth of grass, the latter being dominant. The crowns of the trees are far enough apart not to touch each other. Savannah denotes an open mixture of shrubs and trees standing in a tall growth of
grass; the latter being as much as 80 cm tall where not grazed.
Grasslands denote areas covered by natu-ral grass and are confined to alluvial plains, dambos, and swamps and to permanently wet areas. Reeds of various types and aquatic plants are dominant in permanently flooded areas of the Bangweulu, Mweru Wantipa and Lukanga-Busangu swamps.
Deforestation, especially through for-est fires, for firewood and charcoal and the clearing for agriculture, is having an adverse impact on the Kafue basin. Charcoal used in the Lusaka region is now obtained at a dis-tance as far as 150 km from the city. Until the emergence of forest plantations on the Copperbelt, mining was an important agent of deforestation. Deforestation by overgraz-ing has led to noticeable erosion of grazing lands in the Kafue flats and where cattle has caused eutrophication of lagoons (Kasonde, 1990).
3.1.5 Demographic Profile of ZambiaPopulation census reports of 1980, 1990 and 2000 reported total populations of 5.7 mil-lion, 7.8 million and 9.9 million, respectively. Population densities were estimated at 7.5 persons per square kilometre in 1980, 10.4 in 1990 and 13.7 in 2000. The highest popula-tion density is found in Lusaka Province with 65 persons per square kilometre and the low-est in North-Western Province with nine per-sons per square kilometre.
According to estimates from the census data, fertility has been declining at a slow pace, the Total Fertility Rate (TFR) going from 7.1 in 1980 to 6.7 in 1990 to 6.0 in 2000. The 2000-2001 Zambia Democratic and Health Survey (ZDHS) found the TFR to be 4.3 in urban areas, 6.9 in rural areas and 5.9 overall.
According to census data, infant mortal-ity increased from 99 per 1000 live births in

26
DIIS WORKING PAPER 2010:15
1980 to 123 per 1000 live births in 1990, and declined to 110 per 1000 live births in 2000. The 2000-2001 ZDHS reported under-five mortality to be at 140 per 1000 in urban ar-eas, 182 per 1000 in rural areas and 168 per 1000 overall.
Life expectancy at birth has declined since 1980, when it was estimated to be 52.0 years for males and 52.5 years for females. In 1990, the estimates were 46.1 years for males and 47.6 years for females. By 2000 life expectan-cy had increased somewhat, to 48.0 for males and 52.0 for females. (CSO, 2002:124)
3.2 Main Characteristics of Study Area – Namwala District
3.2.1 Geophysical Location of Namwala DistrictNamwala District is located in the South-ern Province of Zambia. The district shares boundaries with four districts, i.e. Monze (South East), Choma (South), Kalomo (South) and Itezhi-tezhi (North West). It is lo-cated 170km North West of Choma District and 158km from Monze. About a quarter of its traditional land is covered by the plain that stretches from a point beyond Kafue Road Bridge in Kafue District to Itezhi-Itezhi Dam. It covers an estimated total area of about 10,000 square kilometres and lies between lat-itudes 15 and 17 degrees south of the equator and longitude 25 and 27 degrees east.
Climate Namwala District is divided into three eco-logical zones namely:
• The Kafue basin covering the Southern bank with heavy alluvial clay soils. The av-erage annual rainfall is 800 mm.
• Semi-arid zone covering Ngabo/Kaluwe-za, Luubwe and Baambwe. The soils are
generally light brown to grey silt or sand loam (covering the Central part of the Dis-trict) and the annual range of rainfall is 600-1,000 mm.
• The plateau zone covering Mbeza, Nakam-boma, Muchila and Chitongo areas. The soils are generally rich red clay/red brown loams. The annual range of rainfall is 800-1,100 mm.
Generally most of the district is covered by alluvial derivative soils varying in texture and colour from dark-coloured topsoil to sandy loamy soils. The district is characterised by a dry and hot weather from September to Oc-tober, warm to hot and rainy weather from November to April, cool to cold and windy weather from May to August.
HydrologyThe main rivers in Namwala is the Kafue and a braided channel of the Kafue called Namwala River. The latter comes out of the Kafue and joins it again. It is the main source of water for domestic use and animal water-ing. The other usages of the two rivers are small-scale agriculture and fishing. The abun-dant water resources from the rivers and the fertile plains give the district great potential for irrigation on a large scale. The other riv-ers that drain the district are Chitongo and Mbeza, which flow intermittently.
TopographyMost of the land is flat but slants slightly to-wards the Kafue River basin. The altitude of the district is between 1,100 m and 1,300 m above sea level.
VegetationNamwala District has three types of vegeta-tion, namely: closed forests, open forest or woodland and grassland. A closed forest is

DIIS WORKING PAPER 2010:15
27
a two-strayed forest with a closed canopy, whereas an open forest has an open canopy. Grassland is land which is naturally without trees and is found in places with a perma-nently high water table.
Natural Endowment/Resources by Ecological ZoneThe district falls in agro ecological zone 1. It has a variety and abundant natural resources with rich soils for agricultural development. The Kafue River and the flood plains are used for cattle grazing, wildlife, fisheries and forests.
3.2.2 Population DistributionAccording to the 2002 census of population and housing, the population of Namwala District is about 83,000 and is concentrated in major settlement areas of the District such as Namwala town, Kabulamwanda, Muchi-
la, Maala, Mbeza and Chitongo. The annual growth rate of the population is estimated at 4%.
3.3 Context Data of Namwala DistrictNamwala District is basically a rural district located on the low-lying plains with pastoral farming as a major economic activity prac-ticed. Namwala District holds a higher per-centage of stock compared to all districts in the Southern Province of Zambia. The Kafue River that drains the district gives it opportu-nities for fishing and crop irrigation at small scale. 3.3.1 Water Availability, Use and AccessWater resources are available to meet all needs in Namwala District. However, most rural parts of the district lack developed
Table 2. Population distribution by ward and genderThe percentage of males is 49 and that of females is 51.
Source: Namwala District Development Plan 2006 -2010
28
DIIS WORKING PAPER 2010:15
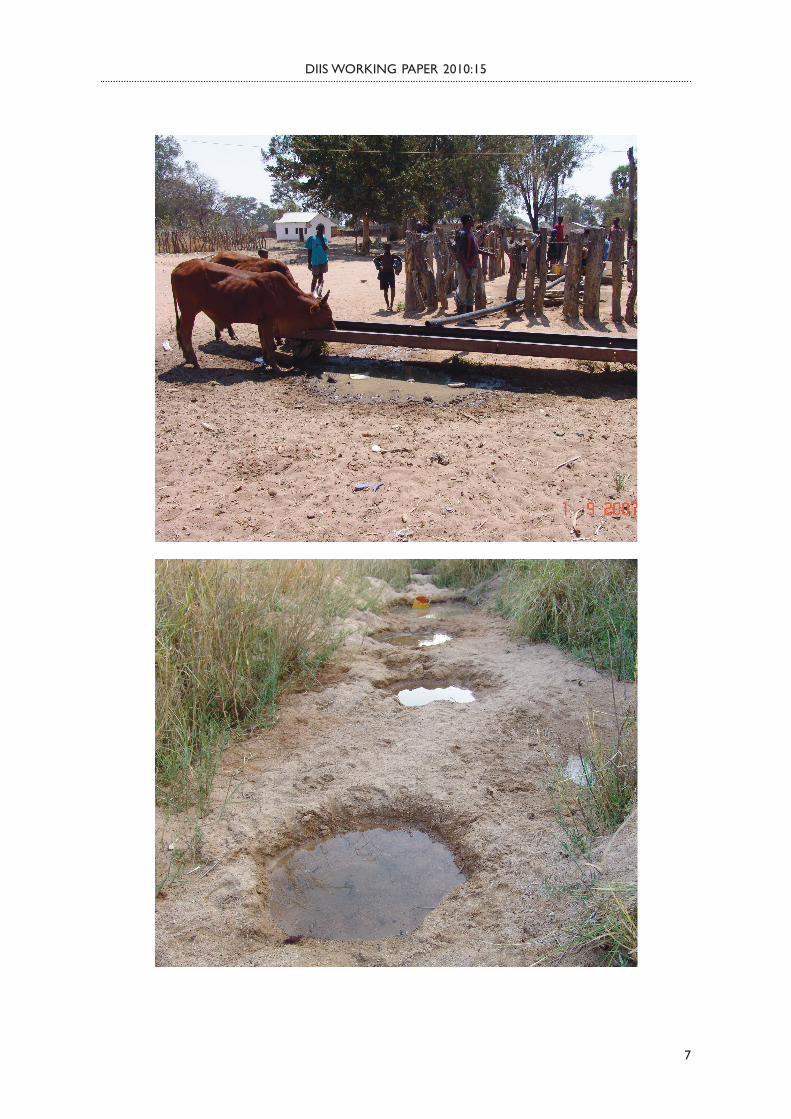
water infrastructures to enable easy ac-cess of water for all uses such as domes-tic uses. Generally, boreholes, wells, dams, dambos, rivers and streams are the major water resources found in the district. The average distance between water sources is about 2.8 km for most areas. The distance increases in the dry season, as most water sources nearby dry up, silt or break down, causing people, especially women and chil-dren, to walk more than 3 km in search of domestic water. The situation challenges people in accessing water for various uses. In addition, consumption of clean water is compromised in water scarce situations; be-cause people tend to get water for drinking from any available sources, whether or not the water is clean is usually the last concern. Namwala D-WASHE reports that only 46% have access to safe drinking water, out of the total population of 82,708 people. (Namwala D-WASHE Strategic Plan Re-port, 2006-2008)
Wells and boreholes are the main sources of water mostly used by the rural people of Namwala for domestic purposes, i.e. drink-ing, washing and bathing. Construction, crop and stock watering are usually done at rivers, dambos and streams. However, wells and boreholes are still used for these purposes when streams within the communities dry out. The peri-urban part of the district uses tap water for domestic purposes. However, the water reticulation network in the peri-urban area of the district is old. Pipes and the two available pumps used to supply wa-ter to the communities are old and the water tanks are dilapidated. The peri-urban com-munity of Namwala receives water supplies for 16 hours a day. The population within the peri-urban district with access to water is above 70%. The organisation responsible for supplying water is the Southern Water
and Sewage Company (Environmental Pol-icy Situation Analysis – Namwala District, December 2004).
3.3.2 Land and Land UseThe district is characterized by two main forms of land tenure: trust land and traditional land. The largest part of the trust land is a forest reserve. The gazetted forest area, Ila natu-ral forest, covers 44,880 hectares. The land has two main plantations, i.e. Chinyemu and Ngabo. However, the plantations are poorly managed due to lack of funds and machinery. Traditional land is owned and controlled by traditional leaders. Most farmers under the traditional system do not have title deeds to their land, with only a few knowing the im-portance of titles and beginning to acquire them for their land. The district also has two settlement schemes, i.e. Ngabo and Muchila. Other parts of the district are characterized by pastoral commercial farmers, while the most prominent in the entire district are the small-scale and emergent farmers.
A relatively big portion of the district is covered by the plains and is used for cattle grazing. Other parts of the district are cov-ered by traditional land covering four Chief-doms: Mukobela, Mungaila, Nalubamba and Muchila. The chiefdoms are characterized by mixed forms of farming with pastoral farm-ing as the most important economic form of farming. Crop farming is also practiced in the district, however at a smaller scale.
3.3.3 GovernanceGovernment is represented through the full council in Namwala District. The district has one parliamentary constituency which is sub-divided into 12 wards, namely Namwala Central, Kaluweza/Ngabo, Baambwe, Maala, Kantengwa, Kabulamwanda, Chitongo, Na-kamboma, Mbeza, Ndema, Namakube and

DIIS WORKING PAPER 2010:15
29
Moobola. An elected ward councillor repre-sents each ward. The head of the full council is the Council Chairman.
Traditionally the District is divided into four chiefdoms. The chiefdoms are governed by chiefs as the highest persons in ranking and have several headmen/women governing sub-divisions of the chiefdoms.
District AdministrationThe district is headed by the District Com-missioner (DC) and is assisted by the District Administrative Officer (DAO) responsible for the coordination of developmental activi-
ties in the district. Administratively, all De-partmental Heads report directly to the DC and technically to their Provincial Heads.
Namwala District Development plan 2006-2010 reports that the district has 19 existing government departments, seven parastatal organizations and nine non-governmental organizations.
Government DepartmentsGovernment departments represented in the district are Office of the President (District Administration), Health, Educa-tion, Fisheries, Agriculture, Forestry, Water
Table 3. Number of males and females in formal employment
Source: Namwala District Development Plan 2006 -2010

30
DIIS WORKING PAPER 2010:15
Affairs, Veterinary, Community Develop-ment, Social Welfare, National Registration, Buildings, Roads, Police, Prisons, Judiciary, Central statistics, Marketing and Co-opera-tives.
Parastatal OrganizationsParastatal companies represented in Namwa-la District include; Zambia Electricity Supply Co-operation Limited (ZESCO), Zambia Na-tional Commercial Bank (ZANACO), Zam-bia Postal Services Limited (ZAMPOST), Zambia Telecommunication Limited (ZAM-TEL), Engineering Services Co-operation (ESCO), Southern Water and Sewerage Com-pany (SWASCO), and Zambia Wild Life Au-thority (ZAWA).
Non-Governmental Organizations (NGOs) Non Governmental Organisation present in the district include Planned Parenthood Association of Zambia (PPAZ), Namwala District Women’s Association (NDWA), Red Cross Society, District Water Sanitation Health Education (D-washe), Forum for Women Educationists (FAWEZA), Namwala Farmers Association (NFA), Fishermen’s As-sociation of Namwala (FAN), and Water-Aid Zambia (WAZ).
All the above organizations are coordi-nated through an integrated institution called the District Development Co-ordination Committee (DDCC) which is chaired by the District Administrator. The District council, through the council secretary, is the secre-tariat. The committee reports its proceeding to the Provincial Development Coordinating Committee (PDCC) which in turn reports to a higher organ at the national level. Table 3 shows the number of employees in a formal setting of administration in Namwala Dis-trict.
CHAPTER 4
4.1 Distribution of Events in Space and TimeIn most cases, water events distributions are highly linked to the geographical locations of the communities and water resource availability. Obviously, areas rich in wa-ter resources are most likely to have fewer challenges in water access as compared to areas of water scarcity. Similarly, communi-ties situated in the ‘rain shadows’ are more prone to drought and lack sufficient water required to fill up water bodies in their areas, such as rivers and lakes, including supplying the water table with sufficient ground water in wells and boreholes. Zambia is well en-dowed with water resources. Estimates of water generated are at 100 km3 per year of surface water and an estimate of 49.6 km3 of annual ground water potential per year1. The surface water is unevenly distributed, with high runoffs and high density of riv-ers in the north. To the south, there are very few large rivers, which makes general access to surface water very difficult. Zambia has well-distributed ground water resources,, but unforfunately there is inadequate data to make an accurate assessment of the ground water availability for exploitation.
Over the years, several provinces have ex-perienced droughts. A reduction in rain over the years has caused reduced runoffs in ma-jor rivers that feed small rivers and streams with water, making them become seasonal and drying out soon after the end of the rainy season. The situation is similar for many small rivers in Namwala District. Water sources, such as shallow wells, on which the majority of Namwala’s communities depend lack sufficient water to last the whole year, because they dry out in the months starting late August to early November. In commu-

DIIS WORKING PAPER 2010:15
31
nities of water-scarce situations, more events resulting from competitions over water are expected.
4.1.1 Distribution of Events across Communities Results from this study suggest that there is uneven distribution of water events in Namwala District. Generally, the largest num-bers of events were recorded in communities found in the northern part of the district near the Kafue River. In the southern and south-
east parts of the District water events tend to build up following a trail of streams in Na-makube and Moobola Wards and Munyeke/Chitongo River. Most events in these areas took place in the dry season and mainly about stock watering, which was the major user of water in the district. However, the dry sea-son create a critical water-stressed situation, especially for stock watering, because most rivers and streams dry out. The estimated cat-tle population is about 110,280 in the entire district, thus the total water demand for stock
Map 4: General distribution of water events in Namwala District
Note: Some points are on top of each other and represent more that one event because coordinates recorded represented more than one event.

32
DIIS WORKING PAPER 2010:15
water is 4.5 million litres per day2. The lack of sufficient inland water causes people to move most of their cattle northwards toward the main channels of the Kafue River and other smaller streams/rivers, while a few re-main within their communities. However, the events distribution for community interviews within drylands were water point based, e.g. at wells, boreholes, rivers and streams. The oc-currence of these events is multiplied by the number of people using same water sources for various uses. Map 4 shows the location of the water events identified in Namwala dis-trict.
Communities with high populations re-corded a high number of events as compared to communities of sparse populations. For the reported events that had taken place outside the 10 sample communities, the inventory of water events shows high numbers of occur-rence of reported events in densely populated areas. Figure 8 shows that Namwala peri-ur-
ban recorded the highest number of events accounting for 5% of the total number of events identified in Namwala District.
The rain-fed water sources form impor-tant water sources for dry lands of Namwala District. Rainwater fills dambos and all open water sources, including seasonal rivers in the District. The situation changes drastically in the dry season as the waters from all seasonal streams/rivers and open sources, including shallow wells, begin to dry up. This leaves a few deep wells and boreholes with insuffi-cient water for tthe various water needs.
The events (reported as well as unreported) identified in the sample communities showed high numbers of events in Chisenda/Belina accounting for 19% of all events identified followed by Shimukopola accounting for 11% of events reviewed in the village com-munities selected for inventory. Least events in selected village communities were recorded in Mwanamwale and Mazhiba, both at 3%.
�������
�������
�����
����������
���������
������
��������
��������
������������
�����
�����������������������
� � � � � ��
Figure 8. Distribution of reported events by community Number of events
DIIS WORKING PAPER 2010:15
33
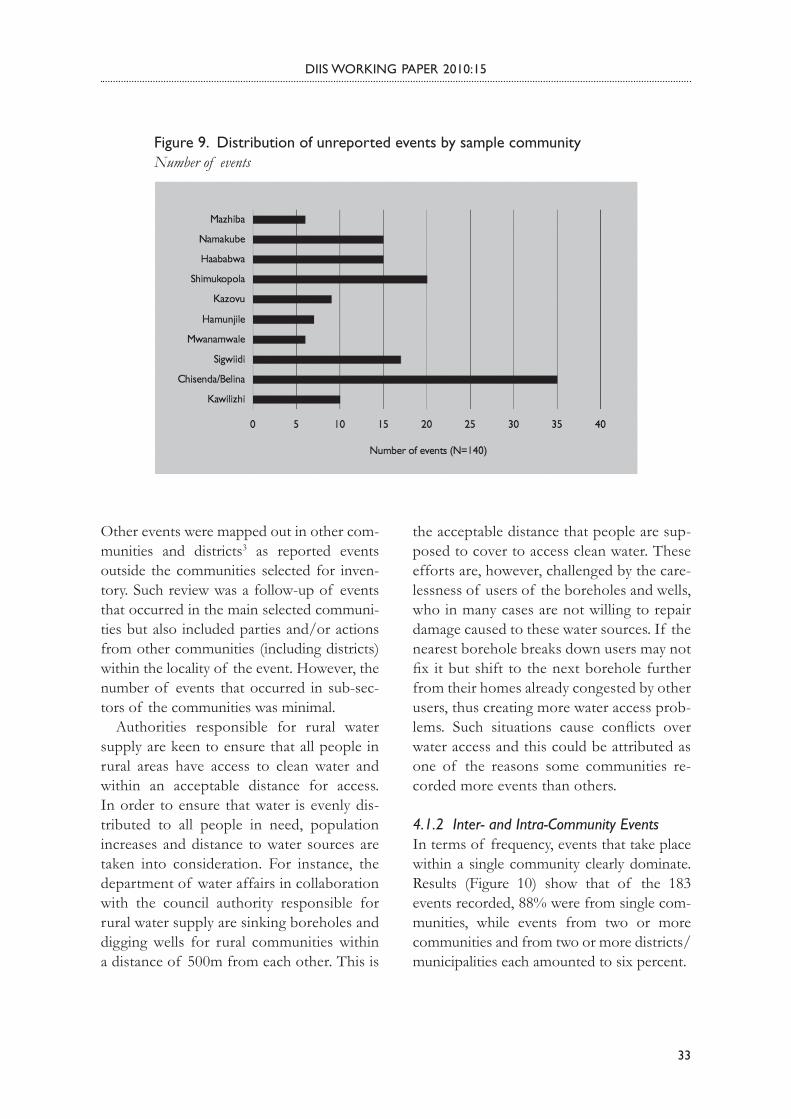
Other events were mapped out in other com-munities and districts3 as reported events outside the communities selected for inven-tory. Such review was a follow-up of events that occurred in the main selected communi-ties but also included parties and/or actions from other communities (including districts) within the locality of the event. However, the number of events that occurred in sub-sec-tors of the communities was minimal.
Authorities responsible for rural water supply are keen to ensure that all people in rural areas have access to clean water and within an acceptable distance for access. In order to ensure that water is evenly dis-tributed to all people in need, population increases and distance to water sources are taken into consideration. For instance, the department of water affairs in collaboration with the council authority responsible for rural water supply are sinking boreholes and digging wells for rural communities within a distance of 500m from each other. This is
the acceptable distance that people are sup-posed to cover to access clean water. These efforts are, however, challenged by the care-lessness of users of the boreholes and wells, who in many cases are not willing to repair damage caused to these water sources. If the nearest borehole breaks down users may not fix it but shift to the next borehole further from their homes already congested by other users, thus creating more water access prob-lems. Such situations cause conflicts over water access and this could be attributed as one of the reasons some communities re-corded more events than others.
4.1.2 Inter- and Intra-Community EventsIn terms of frequency, events that take place within a single community clearly dominate. Results (Figure 10) show that of the 183 events recorded, 88% were from single com-munities, while events from two or more communities and from two or more districts/municipalities each amounted to six percent.
Figure 9. Distribution of unreported events by sample community Number of events

34
DIIS WORKING PAPER 2010:15
Figure 10. Inter- or intra-community eventsNumber of events
We deduce from the data that most water events are restricted within single commu-nities because most water sources, such as boreholes and wells, are localized within sin-gle communities.
In the Namwala District, seasonal streams and rivers drain more than one community. However, water events at these water sources are point-based, meaning that events occur at specific points within single communities.
On the other hand, there are events that occur within two or more communities and within two or more districts, however minimal. Simply put, the fewer the water sources shared among several communities and districts, the fewer the occurrence of events in those plac-es, explaining the low occurrence levels of water events within two or more communities and within two or more districts.
4.1.3 Events DurationThe time dimension is important in under-standing the occurrence of events. The un-derstanding of when water events occur helps
explain differences in numbers of events at different times in a year. The dry season runs from early April to late October and has the highest occurrence of events recorded, mainly, about insufficient water resources and problems with access and management, accounting for 133 of the events recorded, while the rainy season, when water access opportunities for people and stock are im-proved, accounted for 29 events (figure 11). Events recorded with data missing on period were 21.
Figure 11. Event seasonsNumber of events
4.1.4 Event YearsThe mapping of events undertaken in Namwala sought to review events that oc-curred during a 10 year period, from 1995 to 2005. An inclusion of events after 2005 was done for purposes of analysis and to enhance the understanding of how events unfold over time. The highest numbers of events were recorded in 2005, accounting for 16%, while the least numbers were recorded in 2001, accounting for 0.1%. In most in-

DIIS WORKING PAPER 2010:15
35
stances, hydro-related events draw influence from social-cultural situations that provoke their occurrence. In other cases, the occur-rences of events in particular years interact with water-related hazards. Such hazards in Zambia are flooding and drought conditions, negatively affecting the livelihoods of peo-ple in that excess of water cause destruction to crops and property, while scarcities cause food insecurities and lack of the resource for everyday uses. The years 2005 and 1995 recorded high numbers of events because of drought conditions in Zambia. In order to preserve the water resource, people in communities were forced to give up some of their economic activities that demand the use of water to secure that water for drinking be available for most of the year, especially in the dry season. However, some parties were not always agreeable to such ideas. The claim was that they would have no means of survival if they gave up build-ing and crop growing, for instance, because these were a means of earning a living and
supporting their families. Because of such situations, conflicts of interest occurred.
In the 2007/2008 rainy season, Zambia ex-perienced flooding in most parts of the coun-try. People were displaced from their homes, property destroyed, including crops grown, posing a threat on food security. Namwala was also hit by the scourge. The understand-ing by many is that people cooperate in cases of disasters and try to find measures to al-leviate the chaotic situations. On the other hand, disasters such as floods are a source of conflict and can fuel more arguments among communities. As expected, lots of conflictive or cooperative events occurred and could be recorded. However, results from the review show no significant records of conflict or co-operation events in relation to water access as a result of flooding. Events recorded in 2007 were about de facto ownership of water sourc-es and water contamination at boreholes and wells. Figure 12 show the number of events taking their beginning in the years from 1995 to 2007.
Figure 12. Year in which event startedNumber of events

36
DIIS WORKING PAPER 2010:15
Table 4 disaggregates the year of start of events by event character. Results show that 2004 recorded the highest numbers of conflictive events with a count of 22 of all the conflictive events recorded from 1995 to 2007, while 2005 recorded the highest numbers of cooperative events accounting for 13.
There are more conflictive than coopera-tive events recorded during the review period. Conflictive events were recorded for all the years except 1996 where no events were re-corded. Overall, conflictive events constitute
66% of all events identified while cooperative events constitute 34% showing that conflicts are more pronounced than events of coop-eration in Namwala District. The situation is attributed to the high competition over water and poor coordination of management struc-tures for water resources to enhance coop-eration, including the unwillingness of water users to manage their water resources prop-erly in order to harmonise the water access process. Cooperative events were recorded for the whole review period, except the year 2001.
Table 4. Event years disaggregated into character of eventsNumber of events

37
DIIS WORKING PAPER 2010:15
CHAPTER 5
5.1 Extent to which Events are Con-flictive and Cooperative
5.1.1 Character of EventsEvent characters are conflictive and coopera-tive. Conflictive events recorded the highest percentage (62%), as compared to coopera-tive events (34%) (figure 13).
Figure 13. Character of EventsNumber of events
Rural communities in Namwala District have sufficient water supplies to cater for all their water needs. However, inadequacies in de-veloped water infrastructures, such as bore-holes, wells and dams, challenge water supply and access for domestic uses, stock watering and small-scale irrigation. The inadequacies in water infrastructure cause water to be in short supply, yielding high competition over access. Wrangles at water sources such as boreholes are prevalent because of insuffi-cient infrastructure to accommodate all peo-ple. Conflictive events are more prominent than events of cooperation in water wrangles
at water points. This explains the high per-centage of conflictive events compared to cooperative events.
During the mapping of water event, re-spondents found it much more convenient to recite events of conflict than of cooperation, because such events related to the difficulties people faced in accessing water for various uses. Cases of denied water access among dif-ferent sexes, ages and statuses in society were prominent at most water points in Namwala. This suggests that conflict does not only take place as a result of changing environmen-tal conditions, but that also features such as wealth, poverty, gender and identity play im-portant roles in water access.
At the same time, acts of cooperation and conflict resolution do in fact take place within these ongoing local competitions over water, suggesting that we need to see local water competition not only as a downward spiral but also as an opportunity for develop-ing new forms of cooperation or revitalizing and scaling-up customary conflict resolution practices.
5.1.2 Intensity of Water EventsAn event intensity scale was developed by the Competing for Water programme to measure the intensity of conflict and cooperation in connection with water events. On the scale, -7 represented the highest level of conflict while 7 represented the highest level of coop-eration. 0 signified neutral or non-significant acts (coexistence).
The highest levels of conflict involve en-gaging in organised or collective violence, while the highest level of cooperation in-volves merging formally to foster individual access rights. However, no events of these levels of intensity of conflict and coopera-tion were identified in Namwala, as shown in figure 14.

38
DIIS WORKING PAPER 2010:15
The intensity scale shows that riots or un-planned collective violence are not com-mon in the research area. This is the case because rural people are accustomed to pas-sive reactions in conflict resolution rather than adopting violence measures. However, denouncements to authorities and/or third parties (formal/customary) are the most frequently occurring intensity level for the
water events. The situation is common in rural settings because village structures4 in the Zambian rural areas are held in very high esteem and are regarded as important insti-tutions for conflict resolution at the local level. This, however, is not the situation for authorities at district or national levels. Ru-ral people seldom interact and involve third parties from the district or national levels
Figure 14. Event intensity according to local water-event intensity scaleNumber of events

DIIS WORKING PAPER 2010:15
39
because of hindrances in distance to access them. Communication barriers and differ-ent perceptions cause people in rural areas to reduce contacts with officials at district and national levels.
The distribution of events according to the intensity scale further show that conflictive events have the highest percentage as com-pared to cooperative events. However, the
higher percentage in intensity for all conflic-tive events does not rule out that cooperation does occur. Though to a minimum, people employ measures of conflict management and strive to engage in jointly coordinated ac-tions with other parties to secure shared wa-ter access.
Table 5. Water event intensity scale
�������������������������������������
������������������������������������
��������������������������������������������������������������
����������������������������������������
�����������������������������������������������������������������
�������������������������������������������������������������
���������������������������������������������������������������
��������������������������������������������
������������������������������������������������
����������������������������������������������
�������������������������������������������������������
������������������������������������������������������������
�������������������������������������������
��������������������������������������������������������������
��������������������������������������������
��
��
��
��
��
��
��
�
�
�
�
�
�
�
�
�������
����������
����������

40
DIIS WORKING PAPER 2010:15
CHAPTER 6
6.1 Driving Factors for Water Events
6.1.1 Types of Water UsesMost of the water in Zambia is used for non-consumptive purposes in hydropower generation5. The rest of the water is used for consumptive uses, such as agriculture, indus-try, drinking water and domestic water sup-ply. This situation is generalised for the entire country. However, situations in rural areas do not reflect the overall situation for the entire country, as shown by the study undertaken in Namwala District.
In order to ascertain the types of water uses which events were about, the study explored uses on drinking water supply, irrigation, dis-charge of contaminating substances, fishing, consumptive uses other than drinking water, hydropower generation, navigation, environ-mental uses, recreation, tourism and drinking water for animals. However, the assessment showed that water events in Namwala were centred only on drinking water, irrigation, fishing and drinking water for animals.
Results reveal that drinking water for people was the most dominant water use type in the research area being associated with a total of 109 events. Stock watering was equally high being associated with 103 events. Of all use types, water used for fishing was the least use type recorded with a count of 14 (figure 15). There were no records for water used in tour-ism, recreation, environmental uses, naviga-tion, hydropower generation, consumptive uses (non-drinking, e.g. industry) and dis-charges of contaminating substances.
The dominance of water used for hu-man consumption (domestic) and stock wa-tering does not rule out the importance of other uses. Water used for crop irrigation is important in everyday use. Crop irrigation is practised at a small scale and not necessarily important for survival of the majority of the population of the district. However, some segments of Namwala District that do not centre their economic activities on pastoral farming, engage in small-scale farming/ir-rigation. In addition, a good portion of the population earns a living through fishing and fish selling. However, the population of fish-
Figure 15. Water use types associated with water events (one event may be associated with more than one water use type)Number of events
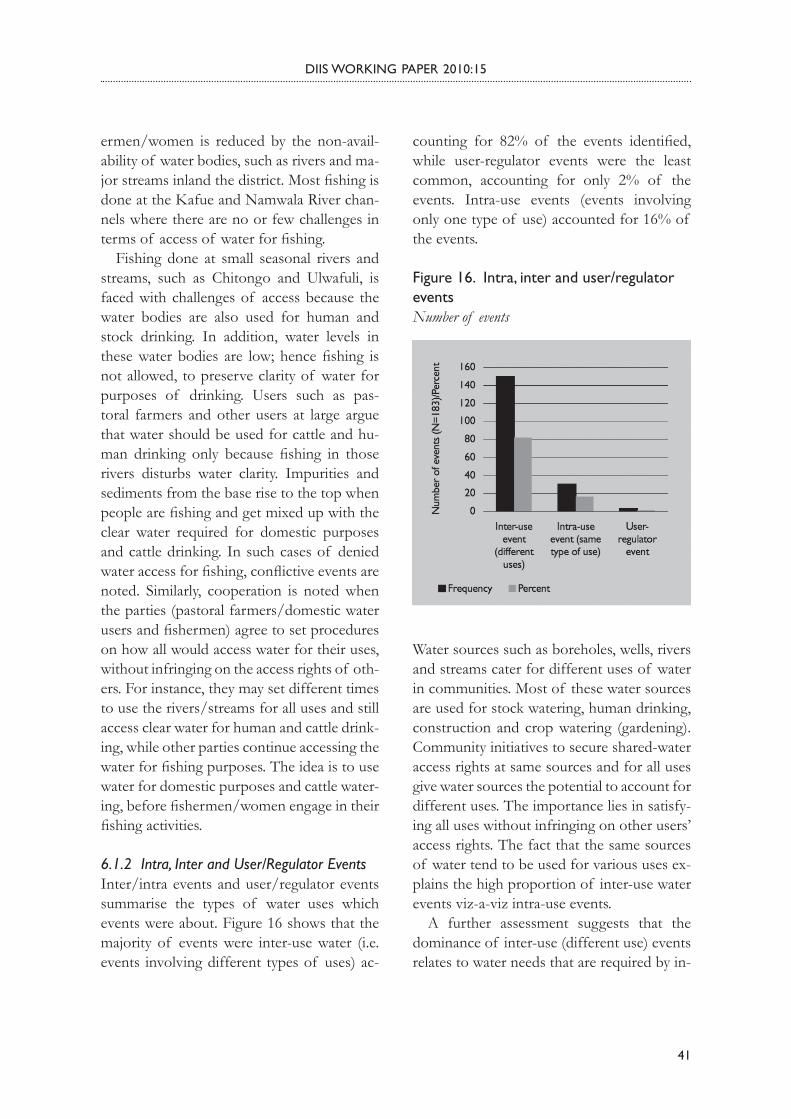
41
DIIS WORKING PAPER 2010:15
ermen/women is reduced by the non-avail-ability of water bodies, such as rivers and ma-jor streams inland the district. Most fishing is done at the Kafue and Namwala River chan-nels where there are no or few challenges in terms of access of water for fishing.
Fishing done at small seasonal rivers and streams, such as Chitongo and Ulwafuli, is faced with challenges of access because the water bodies are also used for human and stock drinking. In addition, water levels in these water bodies are low; hence fishing is not allowed, to preserve clarity of water for purposes of drinking. Users such as pas-toral farmers and other users at large argue that water should be used for cattle and hu-man drinking only because fishing in those rivers disturbs water clarity. Impurities and sediments from the base rise to the top when people are fishing and get mixed up with the clear water required for domestic purposes and cattle drinking. In such cases of denied water access for fishing, conflictive events are noted. Similarly, cooperation is noted when the parties (pastoral farmers/domestic water users and fishermen) agree to set procedures on how all would access water for their uses, without infringing on the access rights of oth-ers. For instance, they may set different times to use the rivers/streams for all uses and still access clear water for human and cattle drink-ing, while other parties continue accessing the water for fishing purposes. The idea is to use water for domestic purposes and cattle water-ing, before fishermen/women engage in their fishing activities.
6.1.2 Intra, Inter and User/Regulator EventsInter/intra events and user/regulator events summarise the types of water uses which events were about. Figure 16 shows that the majority of events were inter-use water (i.e. events involving different types of uses) ac-
counting for 82% of the events identified, while user-regulator events were the least common, accounting for only 2% of the events. Intra-use events (events involving only one type of use) accounted for 16% of the events.
Figure 16. Intra, inter and user/regulator eventsNumber of events
Water sources such as boreholes, wells, rivers and streams cater for different uses of water in communities. Most of these water sources are used for stock watering, human drinking, construction and crop watering (gardening). Community initiatives to secure shared-water access rights at same sources and for all uses give water sources the potential to account for different uses. The importance lies in satisfy-ing all uses without infringing on other users’ access rights. The fact that the same sources of water tend to be used for various uses ex-plains the high proportion of inter-use water events viz-a-viz intra-use events.
A further assessment suggests that the dominance of inter-use (different use) events relates to water needs that are required by in-

42
DIIS WORKING PAPER 2010:15
dividuals and groups at the same time. Wa-ter required for domestic purposes include water for drinking, bathing, and household cleaning. Some incidences of water access at boreholes, where events were recorded, were about more than one use event.
6.1.3 Issues of the Events The occurrence of water events has raised awareness on the need to better manage the water resources in many different places, but the urgent need is to first address the issues that prompt the occurrence of these events. It is assumed that the lack of water for various uses is often the result of unreliable supplies for most communities in Zambia. However, this assumption leaves much to be desired. In this study, several issues have been identified to be the perpetrators of the occurrence of
events, i.e. conflictive as well as cooperative events. Several issues were outlined as grounds for the occurrence of events. Issues of the events were about competing claims of access for consumptive uses, types of consumptive uses, contamination, depletion of ground water, deviation of water, timing of watering animals, timing of watering crops, contested/competing rules for water management, wa-ter scarcity, environmental protection, dam/hydropower construction, damaged drinking water supply infrastructure, drinking water supply, irrigation infrastructure, infrastruc-ture development and privatisation/conces-sion of water rights.
Results showed (figure 17) that competing claims of access for consumptive uses had the highest count being the issue of a total of 83
Figure 17. Issues that events were about (each event may have more than one issue)Number of events

DIIS WORKING PAPER 2010:15
43
events. Issue of water scarcity applied to 57 events, while the least count of event issues were those of contamination and environmen-tal protection, both with a count of 3 events.
Results suggest that most events recorded relate to competition over water because of inadequacies in availability of water required to satisfy various needs. Wrangles at water points, such as wells and boreholes, between different water users; domestic users, cat-tle watering and gardening are attributed to multiple uses at the same water sources that do not satisfy all uses at the same time. The importance of allocating different times for different uses has been used as a measure to cooperate in water access for different uses and bring sanitation to water users in the communities.
Other issues, such as drinking water sup-ply and/or damaged drinking water supply, timing for watering animals as well as rules for water management were among the issues that formed part of the causes for the occur-rence of water events.
Exploring water issues that events of con-flict and cooperation were about gives ideas of causes of events in the study area. How-ever, the complete understanding of issues that bring about conflicts and cooperation re-quires a complete understanding of the types of communities being studied. Results from the study undertaken in Namwala cannot depict the actual situation in the rest of the country, because economic and social issues vary from place to place and due to cultural and perceptual differences in Zambian com-munities.
6.1.4 Types of Water SourcesSurface and ground water resources form im-portant sources of water for different develop-mental purposes in Zambia. All types of water sources in Zambia have great potential to meet
present and future water demands. However, most of these water resources are not devel-oped to meet demands for different uses in most areas. The situation is exacerbated by the poor and uneven distribution of surface water in most areas of the country on the one hand and the lack of development for ground wa-ter resources on the other. This has resulted in major shortages of water, especially in the southern part of the country, of which the District of Namwala is part, and the district has not been spared from the scourge.
In Namwala District, water sources used for various purposes vary significantly. The use of water from natural ponds and rivers with counts of 14 and 35 (figure 18), respec-tively, are important for stock and crop wa-tering both in the wet and dry seasons. Rela-tively, a big portion of the northern part of the district is covered by the flood plains of the Kafue River used for cattle grazing and watering.
Figure 18. Water source types which events were aboutNumber of events
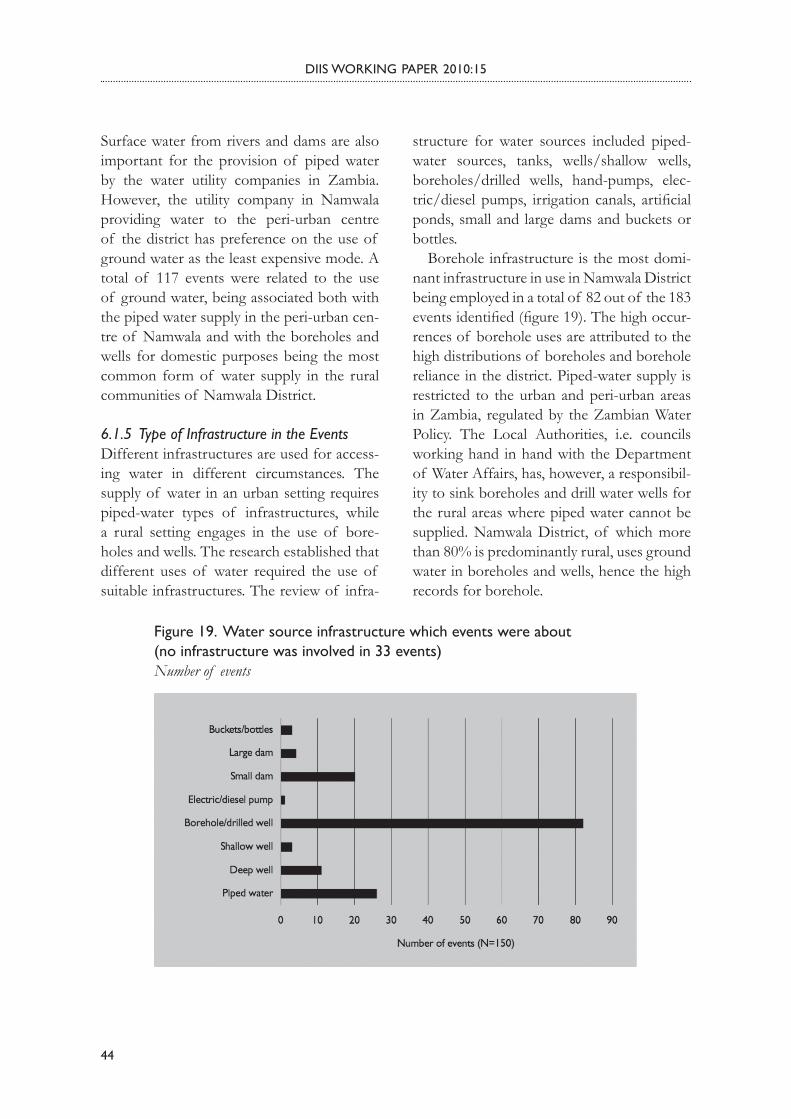
44
DIIS WORKING PAPER 2010:15
Surface water from rivers and dams are also important for the provision of piped water by the water utility companies in Zambia. However, the utility company in Namwala providing water to the peri-urban centre of the district has preference on the use of ground water as the least expensive mode. A total of 117 events were related to the use of ground water, being associated both with the piped water supply in the peri-urban cen-tre of Namwala and with the boreholes and wells for domestic purposes being the most common form of water supply in the rural communities of Namwala District.
6.1.5 Type of Infrastructure in the Events Different infrastructures are used for access-ing water in different circumstances. The supply of water in an urban setting requires piped-water types of infrastructures, while a rural setting engages in the use of bore-holes and wells. The research established that different uses of water required the use of suitable infrastructures. The review of infra-
structure for water sources included piped-water sources, tanks, wells/shallow wells, boreholes/drilled wells, hand-pumps, elec-tric/diesel pumps, irrigation canals, artificial ponds, small and large dams and buckets or bottles.
Borehole infrastructure is the most domi-nant infrastructure in use in Namwala District being employed in a total of 82 out of the 183 events identified (figure 19). The high occur-rences of borehole uses are attributed to the high distributions of boreholes and borehole reliance in the district. Piped-water supply is restricted to the urban and peri-urban areas in Zambia, regulated by the Zambian Water Policy. The Local Authorities, i.e. councils working hand in hand with the Department of Water Affairs, has, however, a responsibil-ity to sink boreholes and drill water wells for the rural areas where piped water cannot be supplied. Namwala District, of which more than 80% is predominantly rural, uses ground water in boreholes and wells, hence the high records for borehole.
Figure 19. Water source infrastructure which events were about (no infrastructure was involved in 33 events)Number of events

DIIS WORKING PAPER 2010:15
45
The least common infrastructure in use in the district was the electric/diesel pumps which was only involved in one event. The use of electric/diesel pumps is only popular among a few well-to-do people practicing crop irri-gation at small and sometimes large scale. In addition, the kind of technology is used to access water for domestic purposes by a few private individuals. Cattle watering at private sources with electric/diesel pumps is also practiced.
In order to give a comprehensive analysis of infrastructural uses for most types of wa-ter sources, it becomes important to acknowl-edge the importance of the use of buckets or bottles at most water sources. Small-scale irrigation at boreholes, wells, rivers and most open water sources requires the use of buck-ets to move water from water sources to crop fields. Similarly, water for domestic purposes is moved from water sources using buckets and bottles, usually done by women.
6.1.6 Ownership of Water Sources in the Events In many instances, water ownership is a con-tentious issue that requires adequate atten-tion.
The inventory finds that the most com-monly used water sources are publicly owned either within same communities or among several communities. In addition, the study establishes locations of these water sources to ascertain actual situations of events in the district. An analysis was done to establish de facto ownerships of water and water sources in Namwala District. In order to comprehen-sively understand the de facto ownerships of water and water sources in the district, five categories were used:
• water passes through/is at private property and is regarded as private
• water passes through private property and is regarded as communal
• water passes through/is at communal/public land and is regarded as private
• water passes through/is at communal/public land and is regarded as public/com-munal
• de facto ownership is contested.
Figure 20. De facto ownership of water which events were aboutNumber of events
Results show that 96 events were about water that passed through/was at communal/pub-lic land and regarded as public/communal (figure 20) and thus reflect the fact that wa-ter sources are shared resources in Namwala District. To avoid unnecessary claims of the water sources by powerful and influential peo-ple in societies, the placements are at neutral sites where nobody claims ownership of the water source. However, claims of ownership are still made by traditional leaders, in most cases because they have the responsibility to oversee the well-being of the community, in-cluding water sources.

46
DIIS WORKING PAPER 2010:15
Water that passes through or is at commu-nal/public land and being regarded as private was the least common type of de facto owner-ships of water, being related only to 11 events. The result depicts a reality of the rare possi-bility for private water sources to be found on public land. However rare, a few individuals choose to have their private boreholes and/or well at public land to facilitate easy access for the rest of the community members6.
Nineteen of the identified events were about water for which ownership was con-tested. Undefined ownerships of water have posed problems for a good number of peo-ple in rural areas. Some sources of water are claimed to be owned by the community or traditional leaders, while a segment of the population disputes such claims with refer-ence to government or NGOs providing wa-ter sources for the larger communities and not for individuals.
CHAPTER 7
7.1 Event Stakeholders and their Actions
7.1.1 Direct Parties to the Events Effective water resource management at the local levels often requires all stakeholders in water-relevant institutions and organisations to be involved. Some tasks are best performed by user organisations, while others require the involvement of organisations at a larger scale, e.g. at the sub-district or basin level. (Ittersum and Steenbergen, 2003). Stakeholders in water events vary in responsibility and roles played. Some roles are regulatory, while others are user roles. However, it is extremely important to understand that all roles are important in improving the well-being of the poor and disadvantaged groups in local societies. The
review of water events revealed that various interest groups were involved as stakeholders in addressing issues related to water events. In Namwala, water consumers were the ma-jor parties in water events with consumptive roles as a major role. However, regulators and authorities also played important roles as me-diators in addressing the occurrence of water events in the district.
The review of water events established that direct parties to the events were the wa-ter agency, urban and rural water consumers, rural domestic and community committees, village headmen/chiefs, community leaders (elected or appointed), traditional water mon-itors, irrigation committees, irrigation farm-ers, pastoral /livestock committees, groups and individual pastoralist/livestock keepers, farmers’ committee, groups and individual farmers, fishermen/fisherwomen’s commit-tee, groups and individual fishermen/fish-erwomen, individual landowners, industry, civil society, national and local government authorities and international organisations (figure 21).
The study revealed that the rural domes-tic water consumers were highly involved in water events, being involved as a direct party in 99 events (figure 21). Everyday livelihoods of domestic water uses depict the high fre-quency of rural water uses in rural Namwala which covers over 80% of the district.
Local and national government authorities were involved as direct parties in respectively 36 and 17 events. The involvement was with regard to rural water supply and ensuring eq-uitable water access and distribution in rural communities. The decentralisation policy de-veloped in 2002 reaffirms the district councils (local authorities) as the institutions respon-sible for water supply and sanitation. More importantly, it acknowledges the need for the government to decentralise with matching re-

DIIS WORKING PAPER 2010:15
47
sources some of its functions to the district, thus empowering the local authorities to un-dertake their responsibility with respect to ru-ral water supply and sanitation services. The district councils and ward councillors have the responsibility to sink boreholes and dig wells to ensure water supply in the rural parts of the country where they operate. Though this is the case, their efforts are challenged because the leadership at the national level is diffuse. In addition there are several other in-stitutions providing water supply services to rural areas. The situation contributes to the low profile of and the low resource flows to the district councils for execution of their wa-ter supply programmes.
Fishermen/women’s committees had the least counts of involvement as direct parties
to the events recorded. Individual and groups of pastoral/livestock keepers were actively involved in events at community levels with the former being involved in 55 events while the latter being involved in 40 events. Village headmen and chiefs were involved as direct parties in 48 events. Local leaders (head-men/chiefs) played an active role in address-ing events of water in their communities. In the same light, community gatherings to discuss water access rules and management were called upon by the traditional leaders to foster cooperation as people competed for the water resources. However, in some cases, the involvement of local leaders was about downplaying the water access of other mem-bers of the community because of their high influence in community activities.
Figure 21. Direct parties to the event (each event may have more than one type of direct party)Number of events

48
DIIS WORKING PAPER 2010:15
7.1.2 Number of People Involved in EventsResults from the inventory of water events show that small groups of 10-99 people are the most dominant numbers of people in-volved in events, accounting for 34% of the events (figure 22). The least dominant or least common groups of people to be actively in-volved in water events are those involving 10,000 to 99,999 accounting for 0.5% Groups of 100 to 999 persons are favourably high, accounting for 20%.
Figure 22. Estimated number of people involved in eventsNumber of events
munities negotiate to decide on water access and management issues involved all mem-bers living in particular localities. Similarly, reactions to unfair distribution of water sources, e.g. borehole sinking and well dig-ging, raised concerns from the entire com-munity.
7.1.3 Number of People Affected by/Benefit-ing from Events Results revealed that most events (36% of all events identified) affected or bene-fited between 100 and 999 persons. Only 10 events affected or benefited between 10,000 and 99,000 persons while one event affected or benefited less than 10 persons (figure 23).
Figure 23. Number affected by/or benefiting from water eventsNumber of events
For approximately a quarter (26%) of the identified events, it was not possible to esti-mate the number of persons being affected by or benefiting from the event.
The events that involve less than 10 persons typically are about decision makers such as headmen and local authorities over water ac-cess and management from various sectoral groups. More commonly, events involve be-tween 10 and 99 persons and involve small groups of people who which to use the same water sources for various uses.
Events involving groups of 100-999 peo-ple were typically events where whole com-

DIIS WORKING PAPER 2010:15
49
7.1.4 Share of Women/Men Involved in EventsThe many involvements in community ac-tivities that involve both men and women also include involvements in water events. However, the share of involvement for both sexes differs due to variances in water uses and access needs between the two sexes. The figure below (figure 24) shows estimates in shares of women and men involved in water events.
Direct involvement in water events is dominated by men. More men than women were involved as direct parties in 56% of the events, while in 9% of the events more women than men were involved as direct parties. From the results, it can be deduced that gender plays an important role in water events participation. This is explained by the distribution of power and control. In a rural community like Namwala District, decision making over livelihoods, including water access and management in villages, is mainly a responsibility of men because of the traditional way of influence men have over livelihoods and the respect they command in societies were they live. This fact transcends to their high involvement in water events involving access and man-agement. In other cases men’s involvement signify the dominance they have in access-ing the water resource. Water sources such as boreholes and wells are most patronised by females because they constantly draw water for daily domestic uses. However, men tend to demean women when access-ing water at boreholes and wells for cattle watering, which accounts for the major use of water in Namwala. In situations like these, women take a silent stance and leave men to wrangle over water access amongst themselves.
Furthermore, Namwala District is tradi-tionally a pastoralist district. Pastoral farm-
ing is an activity dominated by males in the district. Most water events are about water needs/access for cattle watering at boreholes, wells, rivers, streams and dambos. The vast numbers of cattle in the district require vast water resources, and men and young males have a responsibility to ensure that cattle re-ceive sufficient water to survive. Therefore men’s active involvement in water events is attributed to the importance of water use for cattle watering which has been given top pri-ority in the area.
Figure 24: Share of men and women ivolved in eventsNumber of events
7.1.5 Share of Women/Men Affected by/Ben-efiting from EventsWhile the majority of the events tend to have more men than women among their di-rect parties, the largest share of events were events that affect or benefit men and women equally (figure 25). Close to half (45%) of the events were assessed be affect/benefit men and women, equally.

50
DIIS WORKING PAPER 2010:15
7.1.6 Types of Actions Taken During Events With an understanding that people seeking access to resources care about their interests the most, it is very important to understand the underlying desires and concerns that mo-tivate certain actions to be taken. Engel and Korf (2005) observe that, in some cases par-ties’ interests are often compatible, and hence negotiable, even when their positions seem to be completely opposite. In other cases, par-ties’ interests are conflicting and not negoti-able, and hence people wishing to secure their interests take different actions.
Negotiations/discussions in meetings are some of the actions people take to secure wa-ter access rights. The study revealed that both private and public meetings between (some of) the parties involved in events were used to discuss issues of water access, vis-à-vis man-agement. Other means to communicate water access rights and management were through written and unwritten agreements sanctioned
or not sanctioned by third parties. The inven-tory revealed that the most dominant mes-sages conveyed to other parties in securing water access were conflictive. Records show a high occurrence for private statements of disagreement between (some of) the parties to the event with a total count of 54 out of the 183 events reviewed, as compared to pri-vate statements of agreement between (some of) the parties to the event made in 16 of the total of 183 events identified during the in-ventory (figure 26).
As noted, it is easier and more tangible for most people to discuss matters affecting people in small gatherings. Private meetings formed part of 51 of the 183 events identi-fied, while public meetings/hearings formed part of 40 events (figure 26). Public meet-ings/hearings are, however, important in the resolution of conflicts and for the discussion of rules to guide water management.
Other actions noted in the review of inven-tories for water events were oral agreements being made in 15 of the 183 events identi-fied, public oral agreements being made in 23 events, public oral disagreement, being stated in 24 event and public written statements of disagreement submitted to third parties/ex-ternal authorities (denouncements, etc.) being undertaken in four events. No records were revealed for actions of unconditional sharing of water and concession of water (temporal and/or for specific purposes).
In a number of events infrastructure was obstructed, stolen or destroyed or was re-paired or contructed. The construction and destruction of water infrastructure was undertaken in respectively seven and five events. Construction of water infrastruc-tures is undertaken to improve water avail-ability for the communities in Namwala. However, even the constructions of infra-structures may bring about conflict in de-
Figure 25. Share of women and men affected by or benefiting from eventsNumber of events

DIIS WORKING PAPER 2010:15
51
Figure 26. Actions taken as part of the event (more than one type of action may be taken in each event)Number of events
ciding which areas are in dire need of water. Communities suffering from water-scarce situations compete for a limited number of government boreholes and wells to be sunk in their communities. Theft and repair of water infrastructures took place in respec-tively one and two events, while the ob-struction of water infrastructure took place in three events.
Actions affected persons were also encoun-tered in some of the events. In many countries people would not stop at anything to ensure that they achieve access to what they require. Cases of killings and violations have been re-ported in countries competing over power and resources (mineral, water, oil, etc.). Few reports
specify the actions people take to secure their access rights to water. However, our review of events of conflict and cooperation carried out in Namwala show actions taken by parties for/against others in the bid for water access. In 12 of the identified 183 events, threats against others had been made by one of the parties competing for water, in most cases to demean other parties in water events.
7.1.7 Ways in Which Claims of Access are Supported Claims of access are increasingly becoming intense in competing situations. With an un-derstanding that people’s claims are varied and usually guided by certain criteria, the

52
DIIS WORKING PAPER 2010:15
review of an inventory of events identified the following ways in which claims were sup-ported in water events:
• land ownership• first-use/appropriation• ancestral rights to water• religious rights to water• the customary right to water• community sanctioned right • urgent and critical need for water• other (than mentioned above) social or
cultural or human right to water• externally sanctioned right to water (mu-
nicipal government, ministry, etc.)• water agency sanctioned right to water • payment of use fee to water agency• payment of use fee to the ‘owner’ of the
water source
• investment in infrastructure to use the water
• any other argument referred to by claim-ants.
The inventory revealed that most claims were supported by arguments of an urgent and critical need for water, applying to 95 of the 183 events identified in Namwala. Namwala District, just like many other areas has enough water resources (both ground and surface water) to meet all water demands (figure 27). The problem in accessing the water relates to insufficient infrastructure to facilitate easy water access. Infrastructural development in terms of wells and boreholes is lacking and consequently most rural people face water shortage. Similarly, people living on the banks of the main rivers are constrained in access-
Figure 27. Ways in which claims to water are supported (in each event, claims may be sup-ported in more than one way)Number of events

DIIS WORKING PAPER 2010:15
53
ing the water for purposes of irrigation and domestic uses because water abstraction us-ing pipes is also lacking. These situations have caused water access not to be easily attainable, and hence people’s perceptions are based on assumptions that there are inadequate water supplies to meet all their needs. There were no records of claims being sup-ported by a water-agencies sanctioned right to water.
Investment in water infrastructure and land ownership-based rights to water were used to support claims in 28 and 25 of the events, respectively. The referral to custom-ary rights to water as a claim applied in 32 events. Claims of customary rights to water show a relatively high percentage because of the general belief in Namwala District that natural waters are not guided by any rules and access should not be restricted. Events of conflict were dominant because peo-ple seldom acknowledged the importance of guidelines in water access at boreholes, wells, streams and rivers. The notion was that water was a natural resource and owned by everyone and that accessing it required no restrictions or rules.
CHAPTER 8
8.1 Third Party Involvement
8.1.1 Formal Demands Submitted to External AuthoritiesNamwala District like any other district in Zambia has institutions and structures that help resolve water issues in relation to con-flicts and promote or ensure that continu-ity in cooperation is maintained. However, the understanding of many people is that issues affecting community development, including water management and access,
are best resolved locally. Experience shows that despite having effluent standards and legislations, external authorities that act as mediators are often ineffective in the way they address community issues because they lack the understanding of issues that matter most for the people affected. Hence, the belief that submitting formal demands to external authorities would not yield the desired responses makes people involved in water events hold back from making such submissions. The belief is that wa-ter events, whether conflictive or coopera-tive, are best managed where local pressure is exerted by those directly affected and where local-level organisations and people affected assume responsibility in handling such issues.
The inventory of events revealed that the submission of formal demands to external authorities was made in 59 out of the 183 events, corresponding to approximately one-third of the events. People have various rea-sons for not making formal submissions to external authorities when water-related events occur. Some believe that certain events are not of significant importance to be submit-ted to external authorities, while to others the distance from the community to the locations where external authorities are found seems too far.
8.1.2 Calls upon Third PartiesApart from formal submissions made to ex-ternal authorities, third parties were called upon to solicit for mediation and post-event actions. Third parties were called upon in 38% of the events, corresponding to 69 events.
We note that people’s reactions to post-event occurrence are driven by whether they perceived that the event could significantly improve their well-being. Other people pre-ferred keeping the events to themselves with-

54
DIIS WORKING PAPER 2010:15
out wanting the events heard by third parties. Thus, some people interviewed stated that they did not call upon third parties because of not wanting to involve too many stake-holders. In many cases, rural people did not call upon external people for fear of being misunderstood and the local events becoming too public. In other cases, reports were not submitted to external authorities because of distrust among parties involved; that a party wishing to involve third parties would be per-ceived by others as biased. However, where intercession was deeply required and people felt that the local issues affecting them were beyond local-level intervention, third parties were called upon for intervention.
8.1.3 Stakeholders Calling upon Third PartiesStakeholders calling upon third parties base their foundations on the understanding that third parties help resolve diverse social/cul-tural issues among people of different char-acter and interest.
Results from inventories of water events showed that in 23 of the 69 events in which a third party had been called upon, the call had been made by rural domestic water consum-ers. Similarly, farmers and pastoral/livestock keepers were among those calling upon third parties. However, it is important to consider that for some users, water deficient situations become a way of life and hence, they rarely make submission to external authorities for intervention. In other cases, users prefer
Figure 28: Parties who called upon third partiesNumber of events

DIIS WORKING PAPER 2010:15
55
coming up with their own solutions to water problems, and third party involvement seems to be unnecessary.
8.1.4 Types of Third Parties Called uponAt critical levels of conflicts and coopera-tion in water access and management, gov-ernment ministries were called upon as third parties with mediation roles.
Results show (figure 29) that involvement of the water ministry as third party had a count of 4, while the ministry of home affairs, i.e. the police and courts, was at 10. The health ministry and the agricultural ministry both had a count of 1. No counts were observed for the fisheries, industry and environmental ministries in all events reviewed. The water and home affairs ministries had the highest counts of involvements as third parties, be-cause the former had direct contact with the people in rural areas with the rural water sup-ply programme, while the latter represented the courts and police responsible for conflict resolutions that could not be managed by the local leadership.
The district and municipal authorities were involved as third parties to the events reviewed. Parties called upon were depart-mental/provincial authorities in nine events and municipal authorities (municipal council, individual municipal council representatives and the municipal environmental council) in 25 events. Municipal councils have the responsibility to supply water and sanitation services to rural areas in collaboration with the department of water affairs. People fre-quently called upon them as third parties in events involving water access needs in com-munities.
Local level authorities, e.g. the headman or chief, community-based organizations etc., were called upon as third parties 26 events. Involvement of local leaders in water-related issues was based on the premise that they had a better understanding of issues affect-ing communities, because they lived among the people and were well able to mediate fa-vourably for all parties involved. However, in other cases their involvement was seen by others as worsening the situations, especially
Figure 29. Third parties called uponNumber of events

56
DIIS WORKING PAPER 2010:15
in conflict-related events, if their mediations were biased towards favoured parties.
Further, the review sought to establish oth-er stakeholders’ involvement (outside govern-ment departments and municipal councils), such as the church, international organisa-tions, non-governmental organisations and the media. Others were the local lawyers, at-torney generals, environmental attorneys and drinking water agencies. Results from the re-view showed that only one NGO (WWF) and the media were called upon as third parties to the events, the former in six events and the latter in two events.
CHAPTER 9
9.1 Event Outcomes
9.1.1 Assessment of Who Gained in the EventsWrangles over water access are a major cause of conflict in Namwala. In such wrangles, some parties benefit while others do not de-spite the efforts made to become part of the beneficiaries. The assessment of the conflic-tive and cooperative events in terms of who gained showed that most people did not gain from the events that occurred. In 74 of
Figure 30. Party assessed to gain in water-related event (in each event, more than one party may be assessed to gain)Number of events

DIIS WORKING PAPER 2010:15
57
the 183 events it was assessed that nobody gained.
Pastoral/livestock keepers are, as earlier noted, those who use the largest quantities of water for watering their stocks. As shown in figure 30, groups of pastoralist were as-sessed to gain in 31 events, while individual pastoralists were assessed to gain in 45 of the identified water events. Group actions towards certain goals are minimal compared to individual actions, explaining the high oc-currence of events for individual pastoralists as compared to groups of pastoralists. In ad-dition, actions taken by few individuals, such as coming together to deepen dams in order to increase water retention for stock water, end up benefiting multitudes owning cattle, even when they did not participate in deep-ening the dams. This explains why individual pastoralists have gained more than groups of pastoralists put together.
Furthermore, results show that rural do-mestic consumers were assessed to gain in 46 events, while ‘the poor’ and ‘the non-poor’ were assessed to gain in 13 and 3 events, re-spectively.
Farmers’ committees and irrigation com-mittees were assessed to gain in one event each. However, the groups they represent, i.e. groups of and individual farmers and ir-rigation farmers, gained considerably with percentages of 31 and 15 events, respectively (figure 30).
Other parties who gained from water events include the commercial farmers. Some events involved both upstream and downstream people. Upstream people gained more be-cause of the advantage they had in accessing cleaner waters of bigger volumes. Problems for people downstream came about when people upstream blocked water flows in small rivers and streams as conservative measures for stock water and domestic uses during dry
seasons. Such actions tend to harm people downstream because the quantities of water flowing downstream was reduced, hence de-nying them access to water even before rivers and streams dried out completely.
Notably, persons having relations to peo-ple in charge of water supplies and people in water community committees gained more than ordinary males or females in communi-ties who had no one to defend their access interests. The poor were even more disadvan-taged because in most cases their voices were not loud enough to be heard.
9.1.2 Assessment of Who Lost in EventsThe Government of the Republic of Zam-bia has the overall objective of “Ensuring that Zambia’s water resources are effectively developed to contribute to poverty reduction through increased access to safe water and sanitation and increased food security for low income rural and urban people”.7 The gov-ernment’s efforts are sufficient to enable the marginalised to have equal access to water in the same manner that the well-to-do persons have. However, disparities in access are inevi-table within rural communities where social differences exist with some competing par-ties having more to gain while others lose.
No events were identified where govern-ment ministries and departments with regu-latory and mediatory roles, including roles of water supply, or for the water agencies, the national and district government author-ities, departmental or district government authorities, including the civil societies and international organisation were assessed to lose. In contrast, a number of events were identified in which leaders and institutions at local levels, involved in mediatory and water management issues, were assessed to lose. In five events, the rural community committee was assessed to lose, while in six events, the

58
DIIS WORKING PAPER 2010:15
headmen/chiefs was assessed to lose. Com-munity leaders were assessed to lose in five events and traditional water monitors were assessed to lose in one event. had. Irrigation committees and farmers’ committee were assessed to lose in three and two events, re-spectively. However, these types of actors who often act – in part – as regulators, are not as frequently assessed to lose as the di-rect water users (figure 31).
Domestic water consumers were divided into two categories, i.e. peri-urban and ru-ral domestic water consumers. Peri-urban domestic water consumers were assessed to lose in three events, while rural domestic water consumers were assessed to lose in 36 events. These results represent the popula-tion distribution of persons in Namwala
District. The peri-urban area of the district occupies a small fraction of the estimated 10,000 km2 total surface area of the district. Its population is only 5,532 persons out of the estimated 83,000 persons for the entire district8.
Further, results show that pastoral/live-stock keepers also were assessed to lose in the water events. Groups of pastoralists/livestock keepers were assessed to lose in 20 events, while individual pastoralist/livestock keepers were assessed to lose in 37 events. We deduce from the results that benefits or losses mainly accrue to individuals because persons affected get the impacts as individ-uals and not as groups, hence the records showing higher percentages for individuals than for groups. The situation is similar for
Figure 31. Party assessed to gain in water-related event (in each event, more than one party may be assessed to gain)Number of events

DIIS WORKING PAPER 2010:15
59
farmers who lost in water events. Results show that groups of farmers were assessed to lose in nine water events, while individual farmers were assessed to lose in 20 water events.
In water-scarce situations, the poor are al-ways the ones to be disadvantaged. Results show that ‘the poor’ were assessed to lose in 29 water events whereas ‘the non-poor’ were assessed to lose in seven events. No records were given for events that showed everybody losing out completely from events. However, results that showed in 83 events, nobody was assessed to have lost.
CHAPTER 10
10.1 Situations and EventsWater events occur in particular situations. Situations in this study have been defined es-sentially as cases in which different parties compete for access to the same water sourc-es. However, competitions for water access and other actions taken in such situations were termed events. Results from the study showed that situations constituted a number of events. One situation had several events while a few were composed of only a single event.
Results from the study show that the high-est number of events recorded for a single situation was seven, as shown in figure 32 be-low. However, only two situations recorded such a high number of events. Results also show that seven situations recorded the least number of events that formed part of each situation with the count of one. Twelve situa-tions recorded two events while 13 situations recorded four events.
Three events per situation was the most dominant number of events recorded, apply-ing to a total of 17 situations.
CONCLUSIONS
The review of water events in Namwala de-scribed the variability in water access needs and how events transcend to benefit and/or disadvantage the parties involved. A thor-ough understanding of issues pertaining to water access and management required the use of a number of approaches. The review gave definitions of conflictive, cooperative and neutral events to explain and define what the research sought to establish. Additionally, a ranking was made by an intensity scale of the events to show extents of the conflicts and cooperation of the events that had taken place over the 10 year period, for the unre-ported events focusing on 10 selected village communities of the district, while a review for the reported events was undertaken in the entire district with all water-relevant institu-
Figure 32. Number of water events per situationNumber of situations

60
DIIS WORKING PAPER 2010:15
tasks they engage in to secure water. While tasks taken up by men requiring water could be minimized if water is unavailable, women always have to scout for the resource to pro-vide for their families.
Persons called upon as third parties to me-diate in events are trusted to play their roles effectively. The importance lies in maintain-ing the trust people have in them. However, maintaining the trust is often breached be-cause of the unwelcoming attitudes that third parties have towards the rural and poor peo-ple. Attitudes that are not pro-poor have kept people needing mediation away from authori-ties to avoid unpleasant situations as a result of involving parties that are not aware of ac-tual prevailing village situations. People also fail to call upon third parties in events for fear of being misunderstood.
The intensity of dispute is minimal for most communities because of the preference common among rural people for aiming to contain situations within acceptable limits. This also applies to events of conflict, as evidenced by fact that the highest levels of conflicts, such as killings and engaging in or-ganized collective violence, were not record-ed in the water events reviewed. The highest intensities of cooperation are also seemingly unattainable because of the impossibility of including each individual access rights to wa-ter in all decisions made over water access. Where individuals are involved, complete benefits would only accrue to the few fortu-nate and those with the capacity to stand up for themselves. The poor always lose out if made to stand alone.
The understanding of situations that per-petrate events requires addressing such issues with certain criteria put in place for the ben-efit of the disadvantaged. It is recommended that future works suggest measures to the law-enforcing institutions to come up with
tions, media, and governments ministries and offices as importance resource centres/per-sons for information.
From the study, we conclude that effective approaches to handle conflicts are available from regulatory and mediatory persons and institutions. The importance of these ap-proaches, however, lies in integrating them into water policies, laws and by-laws to be used as a measure to solicit for water that could benefit the rural communities so that conflict does not downplay the benefits of the poor.
Though water resources are generally am-ple, development of water infrastructure is lacking for the rural communities, giving the impression that water is in scarcity. The situ-ations are perpetrated by mushrooming set-tlements that are unplanned for in infrastruc-tural development. In addition, carelessness by water users at boreholes diminishes water access for various users in rural areas.
The inventory confirms that water access affects groups and individuals differently. The poor and non-poor, plus women and men also have differences in the ways that water ac-cess affects their livelihoods. Groups and the poor people’s benefits from water access are tied to the overall benefits of the community, while individuals and the non-poor benefit at the individual level. Men are more actively in-volved in water events and issues to do with access and see to it that benefits directly ac-crue to them as individuals. Women on the other hand have a silent voice that is heard if issues are raised by their male counterparts. Benefits to women hence are also seen to be tied to overall community benefits.
On face value, the burdens of water inad-equacies are seen to affect all persons living in communities with water-scarce situations. In reality, women are more affected than their male counterparts because of the tedious
DIIS WORKING PAPER 2010:15
61
regulations that would narrow down the gaps along gender lines and also along social status in terms of water access and control over wa-ter and water rights. The move is important in addressing the dynamics that put the poor and women at a disadvantage to the well-to-do and male gender when water access issues are a bone of contention.
Importantly, continuous assessments of existing water sources and infrastructures need to be done, encompassing upcoming communities not formerly recognised,to pro-vide sufficient data for actual prevailing situa-tions on the ground and ensure water adequa-cies to people involved. This would massively reduce disputes at water sources frequented by competing parties.
Further assessment needs to be done on the hotspot issues that perpetrate conflict. The importance lies in addressing these is-sues to reduce the problematic aspects and see how conflict can bring people together in cooperation over water access and manage-ment.
To address problems of water inadequa-cies, it is recommended that people affected see the need to formally file in reports to re-sponsible authorities. This move would en-able quick responses from people responsible for water supply services.
NOTES
1 Ministry of Energy; Report on Water Sector Programme Support – Component 3 of the support to Integrated Water Resources Management.
2 This estimate is based on a unit water requirement of 40.7 l iters per day (National Water Resources Master Plan – 1995)
3 Such as in Mapanza District.4 Village authority structures include chiefs,
headmen and area committee members. 5 Zambia Integrated Water Resources
Management and Water Efficiency Im-plementation Plan.
6 Only happens among communities with a sense of belonging and recognize the importance of water sharing.
7 The National Water Policy.8 Namwala District Development Plan
2006 -2010.

62
DIIS WORKING PAPER 2010:15
REFERENCES
Annual Report. 2002. Development Aid from People to People, Zambia. Annual Report for Western Region. 2003. Zambia Wildlife Authority, Ministry
of Tourism, Environment and Natural Resources.Barker, R., B. van Koppen and T. Shah. 2000. ”Water Scarcity and Poverty”.
Colombo, Sri Lanka: International Water Management Institute.Berry, Sarah. 1993. “No Condition Is Permanent: The Social Dynamics of
Agrarian Change in Sub-Saharan Africa”. Madison: University of Wisconsin Press.
Black, M., Hall, A., 2003 “Pro-poor Water Governance”. In: Water and Poverty – A Collection of Thematic Papers. Prepared by the Water and Poverty Initiative for the 3rd World Water Forum held in Kyoto, Shiga and Osaka, Japan, 16-23 March, 2003. Asian Development Bank, pp. 5-14. http://adb.org/Documents/Events/2003/3WWF/Thematic_papers.pdf.
Bourdieu, Pierre. 1998. “Practical Reason: On the Theory of Action”. Stanford, California: Stanford University Press.
Bruns, B.R., Meinzen-Dick, R. (eds.) 2000. “Negotiating Water Rights”. London: International Food Policy Research Institute, Intermediate Technology Publications.
Bruns, B.R. and R. Meinzen-Dick. 2005. “Frameworks for Water Rights: An Overview of Institutional Options“. In: Bruns et al. 2005.
Bruns, B.R., C. Ringler and R. Meinzen-Dick (eds) 2005. ”Water Rights Reform, Lessons for Institutional Design”. Washington: International Food Policy Research Institute, Chapter 1, pp.3-25. http://balwois.mpl.ird.fr/balwois/administration/files/waterrights- reform.pdf
Carius A., GD. Dabelko and A.T. Wolf. 2004. “Water, Conflict, and Cooperation”, Environmental Change and Security Project Report 10: 60-66.
Central Statistics Office (CSO) Zambia. 2002. 2000 Census of Population and Housing – Analytical Report Vol. 10. Lusaka, Zambia: Central Statistics Office, Government of Zambia.
Central Statistics Office (CSO) Zambia. 2004. Living Conditions Monitoring Survey report – 2004. Lusaka, Zambia: Central Statistical Office, Government of Zambia.
Cleaver, F., 2002. “Reinventing institutions: Bricolage and the social embeddedness of national resource management”. European Journal of Development Research Vol. 14, No 2, pp. 11-30.
District Assessment Guidelines for Development and Poverty Reduction. 2003. Ministry of Finance and national Planning.
Engel, A, and A. Korf. 2005. Negotiations and Mediation Techniques for Natural Resource Management. Rome: Food and Agriculture Organisation of the United Nations (FAO).
Giddens, Anthony.1984. “The Constitution of Society”. Cambridge: Polity Press.

63
DIIS WORKING PAPER 2010:15
GWP (Global Water Partnership). 2003. Poverty Reduction and IWRM. TEC Background Papers No. 8. Stockholm: Global Water Partnership.
Government of the Republic of Zambia/Ministry of Tourism Environment and Natural Resources. 2004. Environmental Policy Situation Analysis – Namwala District, Lusaka, Zambia.
Hodgson, S. 2004. “Land and Water – The Rights Interface”. Rome: FAO, Legislative Study.
Hope, R.A. 2006. “Evaluating Water Policy Scenarios Against the Priorities of the Rural Poor”, World Development, Vol. 34, No. 1, pp 167-179.
Ittersum, M. van, and F. van . 2003. “Ideas for Local Action in Water Management”. Stockholm: Global Water Partnership.
Juul, Kristine, and Christian Lund (eds). 2002. “Negotiating Property in Africa”. Portsmouth: Heinemann.
Kasonde, J.M. 1990. Environmental Pollution Studies on the Copperbelt in the Kafue Basin. Report on National Council for Scientific Research. Pp61.
Meinzen-Dick, Ruth. 2003. ‘Water Rights Issues in Agriculture’. In: Jinendradasa, Sithara.S. (ed.). “Issues of Water Management in Agriculture: Compilation of Essays”. Comprehensive Assessment, Colombo. Pp. 63-67.
Ministry of Tourism, Environment and Natural Resources. 2004. Environmental Policy Situation Analysis, Namwala District.
Molden, C. de Fraiture, M. Svendsen, R. Barker, N. Manning, R. Tharme, D. Vallee, B. Smedema and M. Lannerstad, forthcoming. “Water and Agriculture Development Trends – heading for turbulent or still water?” Comprehensive Assessment of Water Management in Agriculture.
Monley, N.J. 1986. “An Outline of the Geography and Geology of Zambia”. Issue on the seminar/workshop on gemstones, Lusaka, Zambia 10th November 1986. GSD occasion paper no. 31/122. Pp15.
Namwala District Council/D-Washe. 2006. Namwala D-WASHE Strategic Plan. Report, 2006-2008, Namwala, Zambia.
Namwala District Development Plan 2006 – 2010; Government of the Republic of Zambia.
Namwala District Situation Analysis Repor. 2001. District Council, Government of the Republic of Zambia.
National Population and Housing Census Report. 2000. Central Statistics Office, Ministry of Finance and National Planning.
National Statistics. 1996. Population Report and Economic Development. Lusaka: GRZ Publishers.
Poverty-Environment Partnership (PEP). 2006. “Linking Poverty Reduction and Water Management”, http://europeandcis.undp.org/WaterWiki/images/c/c2/PEP_Water_Publication.pdf
Ribot, J.C., and L. Peluso. 2003. “A Theory of Access”, Rural Sociology, Vol. 68, No. 2, pp 153-181.

64
DIIS WORKING PAPER 2010:15
Rogers, Peter, and Alan W. Hall. 2003. “Effective Water Governance”. TEC Background Papers No. 7. Stockholm: Global Water Partnership/SIDA.
Soussan, J., and D. Frans. 2003. “The Role of Water in the Development of Sustainable livelihoods of the Poor”. In: Asian Development Bank, Water and Poverty – A Collection of Thematic Papers. Prepared by the Water and Poverty Initiative for the 3rd World Water Forum held in Kyoto, Shiga and Osaka, Japan, 16-23 March, 2003. pp. 83-91. Asian Development Bank.
Thomasson, F. 2005. “Local Conflict and Water: Addressing Conflicts in Water Projects”. Stockholm: Swedish Water House. Pp.43.
UNESCO. 2006. “The Challenges of Water Governance” in Water a Shared Responsibility. The United Nations World Water Development Report 2, Section 1, Chapter 2, pp 45-84.
Wolf, Aaron T., Shira B. Yoffe and Mark Giordano. 2003. ‘International waters: identifying basis at risk’. Water Policy 5, pp. 29–60.
World Bank. 2005. Zambia Poverty & Vulnerability Assessment. World Bank 2005.