Conditions of perceptual selection and suppression during interocular rivalry in strabismic and...
46
Bauer, M., Oostenveld, R., Peeters, M., Fries, P. (2006) Tactile spatial attention enhances gamma-band activity in somatosen- sory cortex and reduces low-frequency activity in parieto-occipital areas. Journal of Neuroscience 26(2), 490-501. doi: 10.1523/JNEUROSCI.5228-04.2006 Published in final edited form as: Journal of Neuroscience 26(2), 490-501. doi: 10.1523/JNEUROSCI.5228-04.2006 Tactile stimulation accelerates behavioural responses to visual stimuli through enhancement of occipital gamma-band activity Markus Bauer 1,2 , Robert Oostenveld 1 , Pascal Fries 1 1 Donders Institute for Brain, Cognition and Behaviour, Radboud University Nijmegen, 6525 EN Nimegen, The Netherlands 2 UCL Institute of Cognitive Neuroscience, UCL, 17 Queen Square, WC1N 3AR London, UK Abstract We investigated how responses of occipital cortex to visual stimuli are modulated by simulta- neously presented tactile stimuli. Magnetoencephalography was recorded while subjects per- formed a simple reaction time task. Presence of a task-irrelevant tactile stimulus lead to faster behavioural responses and earlier and stronger gamma-band synchronization in occipital cor- tex, irrespective of the relative location of the tactile stimulus. While also other stimulus relat- ed responses in occipital cortex were modulated (alpha-band and evoked responses in parieto- occipital region), correlation analysis revealed induced gamma-band activity to be the best predictor of the faster behavioural response latencies, suggesting a key-role of oscillatory ac- tivity for cross-modal integration.
-
Upload
esi-frankfurt -
Category
Documents
-
view
0 -
download
0
Transcript of Conditions of perceptual selection and suppression during interocular rivalry in strabismic and...

Bauer, M., Oostenveld, R., Peeters, M., Fries, P. (2006) Tactile spatial attention enhances gamma-band activity in somatosen-sory cortex and reduces low-frequency activity in parieto-occipital areas. Journal of Neuroscience 26(2), 490-501. doi: 10.1523/JNEUROSCI.5228-04.2006
Published in final edited form as: Journal of Neuroscience 26(2), 490-501. doi: 10.1523/JNEUROSCI.5228-04.2006
Tactile stimulation accelerates behavioural responses to visual
stimuli through enhancement of occipital gamma-band activity
Markus Bauer1,2, Robert Oostenveld1, Pascal Fries1
1 Donders Institute for Brain, Cognition and Behaviour, Radboud University Nijmegen, 6525 EN
Nimegen, The Netherlands 2 UCL Institute of Cognitive Neuroscience, UCL, 17 Queen Square, WC1N 3AR London, UK
Abstract
We investigated how responses of occipital cortex to visual stimuli are modulated by simulta-neously presented tactile stimuli. Magnetoencephalography was recorded while subjects per-formed a simple reaction time task. Presence of a task-irrelevant tactile stimulus lead to faster behavioural responses and earlier and stronger gamma-band synchronization in occipital cor-tex, irrespective of the relative location of the tactile stimulus. While also other stimulus relat-ed responses in occipital cortex were modulated (alpha-band and evoked responses in parieto-occipital region), correlation analysis revealed induced gamma-band activity to be the best predictor of the faster behavioural response latencies, suggesting a key-role of oscillatory ac-tivity for cross-modal integration.

Hoogenboom, N., Schoffelen, J. M., Oostenveld, R., Parkes, L. M., Fries, P. (2006) Localizing human visual gamma-band activity in frequency, time and space. Neuroimage 29(3), 764-773. doi: 10.1016/j.neuroimage.2005.08.043
2
1. Introduction A prominent feature of the brain’s response to sensory stimulation is the emergence of synchronized oscillatory activity especially in early sensory areas. The role of this syn-chronized activity for information processing has received a great deal of attention during the last decades. Empirical studies and theoretical models have suggested a functional role of these oscillations for bottom-up sensory processing (Frien & Eckhorn 2000, Friedmann-Hill, Maldonado & Gray 2000), top-down modulation of sensory representa-tions (Gruber, Müller, Keil & Elbert 1999; Fries, Reynolds, Rorie & Desimone 2001; Bichot, Rossi & Desimone 2005; Buschman & Miller 2007; Taylor, Freiwald & Kreiter 2005) and the encoding of relations between different stimulus representations (e.g. Gray, König, Engel & Singer 1989; Rose & Büchel 2006). Many events in our environment stimulate multiple sensory modalities simultaneously and in recent years, evidence has accumulated for direct anatomical links between cortical areas ascribed to different mo-dalities. This applies even to those areas reflecting the earliest levels in the sensory hier-archy (Falchier, Clavagnier, Barone & Kennedy 2002; Rockland & Ojima 2003). While several studies have shown that presentation of stimuli may alter neuronal activity even in primary sensory areas of other modalities (Zangaladze, Epstein, Grafton & Sathian 1999; Amedi, Jacobson, Hendler, Malach & Zohary 2002; Schroeder & Foxe 2002; Kay-ser, Petkov, Augath & Logothetis 2005), still relatively little is known about the influence of heteromodal stimulation on synchronized oscillatory activity (but see e.g. Lakatos, Chen, O'Connell, Mills and Schroeder 2007). From psychophysical studies, it is well known that integration of information across sen-sory modalities occurs and is often beneficial for adaptive behaviour. For example, sub-jects are faster in detecting the onset of stimuli when these are presented multimodally (Murray, Molholm, Michel, Heslenfeld, Ritter, Javitt, Schroeder & Foxe 2005; Teder-Sälejärvi, Di Russo, McDonald & Hillyard 2005), and judgements about certain proper-ties of these objects may be more accurate when perceived through more than modality (Ernst & Banks 2002). Specifically, the human brain seems to be capable to weight and integrate information provided by different modalities even in a statistically optimal fash-ion (van Beer, Sittig & Gon 1999; Ernst & Banks 2002). This study was designed to address the question whether tactile stimulation modulates oscillatory activity in sensory areas and whether this leads to facilitated processing of stimulus information. Macaluso, Frith and Driver (2000) and Macaluso, Frith and Driver (2002) have reported an enhancement of the visual BOLD response in contralateral ex-trastriate visual cortex by a spatially congruent tactile stimulus. We designed an experi-ment that closely followed their design to investigate the electrophysiology of this cross-modal integration effect.
Hoogenboom, N., Schoffelen, J. M., Oostenveld, R., Parkes, L. M., Fries, P. (2006) Localizing human visual gamma-band activity in frequency, time and space. Neuroimage 29(3), 764-773. doi: 10.1016/j.neuroimage.2005.08.043
3
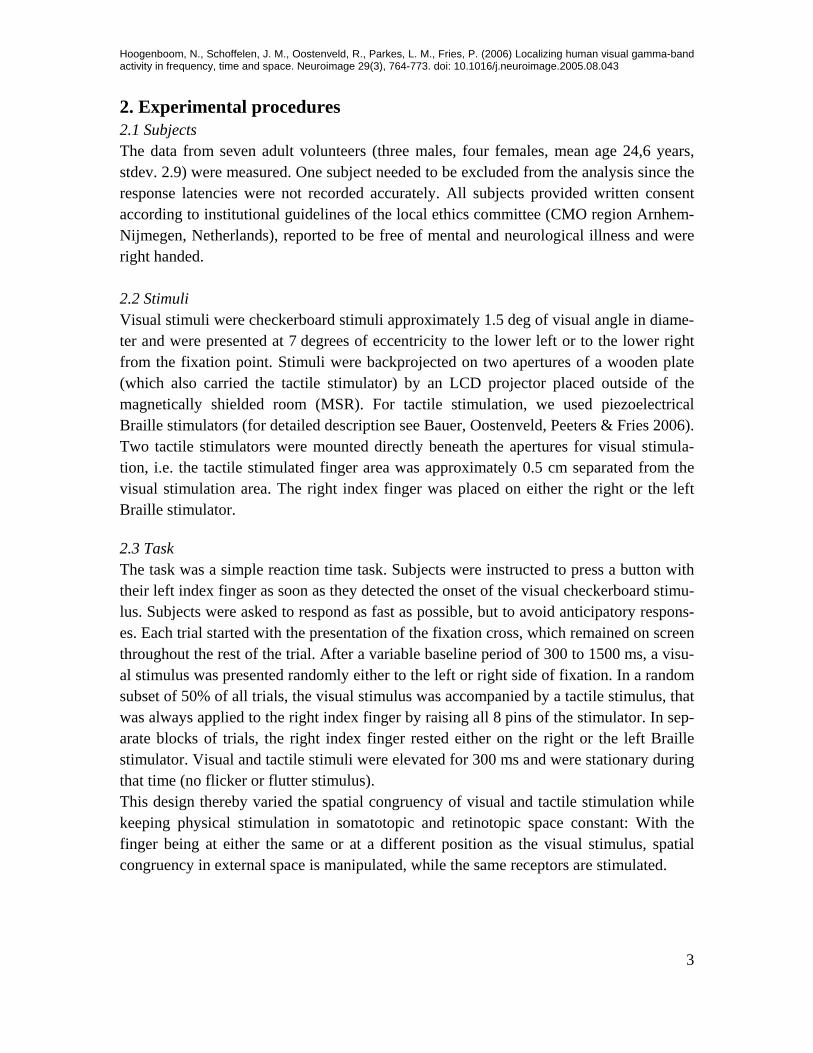
2. Experimental procedures 2.1 Subjects The data from seven adult volunteers (three males, four females, mean age 24,6 years, stdev. 2.9) were measured. One subject needed to be excluded from the analysis since the response latencies were not recorded accurately. All subjects provided written consent according to institutional guidelines of the local ethics committee (CMO region Arnhem-Nijmegen, Netherlands), reported to be free of mental and neurological illness and were right handed. 2.2 Stimuli Visual stimuli were checkerboard stimuli approximately 1.5 deg of visual angle in diame-ter and were presented at 7 degrees of eccentricity to the lower left or to the lower right from the fixation point. Stimuli were backprojected on two apertures of a wooden plate (which also carried the tactile stimulator) by an LCD projector placed outside of the magnetically shielded room (MSR). For tactile stimulation, we used piezoelectrical Braille stimulators (for detailed description see Bauer, Oostenveld, Peeters & Fries 2006). Two tactile stimulators were mounted directly beneath the apertures for visual stimula-tion, i.e. the tactile stimulated finger area was approximately 0.5 cm separated from the visual stimulation area. The right index finger was placed on either the right or the left Braille stimulator.
2.3 Task The task was a simple reaction time task. Subjects were instructed to press a button with their left index finger as soon as they detected the onset of the visual checkerboard stimu-lus. Subjects were asked to respond as fast as possible, but to avoid anticipatory respons-es. Each trial started with the presentation of the fixation cross, which remained on screen throughout the rest of the trial. After a variable baseline period of 300 to 1500 ms, a visu-al stimulus was presented randomly either to the left or right side of fixation. In a random subset of 50% of all trials, the visual stimulus was accompanied by a tactile stimulus, that was always applied to the right index finger by raising all 8 pins of the stimulator. In sep-arate blocks of trials, the right index finger rested either on the right or the left Braille stimulator. Visual and tactile stimuli were elevated for 300 ms and were stationary during that time (no flicker or flutter stimulus). This design thereby varied the spatial congruency of visual and tactile stimulation while keeping physical stimulation in somatotopic and retinotopic space constant: With the finger being at either the same or at a different position as the visual stimulus, spatial congruency in external space is manipulated, while the same receptors are stimulated.

Hoogenboom, N., Schoffelen, J. M., Oostenveld, R., Parkes, L. M., Fries, P. (2006) Localizing human visual gamma-band activity in frequency, time and space. Neuroimage 29(3), 764-773. doi: 10.1016/j.neuroimage.2005.08.043
4
2.4 Procedure In order to facilitate mapping of the somatosensory cortex, before and after the actual experiment, a set of 200 tactile stimuli were presented to the right index finger (in ab-sence of visual stimuli). Throughout the recording session, auditory white noise was pre-sented to the subjects through pneumatic earphones in order to mask the sound generated by the Braille cells - such that subjects could not detect the switching of the tactile stimu-lators anymore. The recording session consisted of 30 blocks of 40 trials each, resulting in approximately one hour of recording time. After the recording session, structural MRIs of each individual subject were made on a 1.5 T SIEMENS Sonata scanner (Siemens, Erlangen, Germany) using a standard T1 weighted sequence in order to enable recon-struction of each subject’s head shape for the later described interpolation and source reconstruction procedures. 2.5 MEG Recordings Neuromagnetic activity was recorded using the whole-head 151 channel axial-gradiometer MEG system (CTF Systems, Canada) at the F.C. Donders Centre for Cogni-tive Neuroimaging. In addition, the electrocardiogram and electrooculograms were rec-orded. The subject’s head position relative to the MEG sensors was measured with three magnetic coils. MEG data were low-pass filtered at 300 Hz and sampled continuously at a rate of 1200 Hz. 2.6 Data analysis Data were analyzed using the Fieldtrip software package (http://www.ru.nl/fcdonders/fieldtrip/), a MATLAB-based toolbox for the analysis of electrophysiological data that has been developed by our group. Data were artefact corrected and the line noise was removed using a narrow-band notch filter (bandwidth ~0.1 Hz). For details of this, we would like to refer the reader to our previous publication (Bauer et al. 2006). The artifact- and response-free data were inter-polated to a common sensor array template using a minimum-norm projection method (Knösche 2002). Subsequently, planar gradients of the MEG field distribution were cal-culated using a nearest neighbor method comparable to the method described by Bas-tiaansen and Knösche (2000). Evoked fields Artefact-free data were first averaged, baseline-corrected (baseline interval was from 100 to 0 ms before stimulus onset), realigned and then planar gradients were calculated. The signal-to-noise ratio was high and therefore no band-pass filter was applied. In order to assess statistical difference, a samplewise t-test for dependent samples was calculated, across subjects, for each time-point between the conditions of interest.

Hoogenboom, N., Schoffelen, J. M., Oostenveld, R., Parkes, L. M., Fries, P. (2006) Localizing human visual gamma-band activity in frequency, time and space. Neuroimage 29(3), 764-773. doi: 10.1016/j.neuroimage.2005.08.043
5
Spectral analysis Prior to spectral analysis, the evoked field was removed from individual trials (in the original axial gradiometer representation, nonrealigned), by subtraction of the respective time series. This was done to remove stimulus-phase-locked components from the time-frequency-representation. This minimizes ambiguities about the nature of particularly short-lived time-frequency-components, whether they truly reflect intrinsically generated synchronization phenomena or are simply the frequency-domain representation of (short-lived) transient responses. Two frequency ranges were analyzed separately with different window lengths and different taper functions. The lower frequency band from 5 to 45 Hz was analyzed with a window length of 200 ms and using a Hanning taper. The higher frequency band from 30 to 150 Hz was analyzed with a window length of 100 ms and a spectral concentration of ±20 Hz using multitapers. The different tapering techniques for high and low frequencies were chosen in order to adapt frequency analysis to the specific characteristics of the underlying signals: High-frequency oscillations (above ~30 Hz) with short period lengths and small amplitudes typically have a relatively broad spectral distribution and are more easily masked by the sensor noise. Therefore, the multitaper technique was chosen, because it allows to trade spectral resolution for reduced variance and optimally concentrates signal energy in a frequency range of interest, while minimiz-ing spectral leakage (Mitra & Pesaran 1999). Power spectra were separately computed for the horizontal and vertical planar gradients and the resultant vector length of both was computed to obtain the power at that sensor location irrespective of the orientation of the gradient. The variance of the power in each time-frequency bin was estimated using a jackknife procedure. Subsequently, t-statistics were calculated for the comparison of all time-bins with a mean baseline period (effective time window –400 to -100 ms), separately for each frequency bin. The resulting t-values were transformed into z-scores, averaged over local sensor groups and pooled across sub-jects. Those fixed-effect time-frequency z-images showed clear spectro-temporal components and allowed the definition of time-frequency windows of interest. To test the statistical significance of these effects on the population level, the average power in the time-frequency window of interest was calculated for each subject and condition and the sig-nificance of the difference between conditions was assessed using a t-test for dependent samples, across subjects. Source analysis For the reconstruction of the neuronal sources of the early components of the visual evoked field, we used an adaptive spatial filtering technique (van Veen, van Drongelen, Yuchtman & Suzuki 1997). Each subject’s brain volume was divided into a regular 5 mm grid and for each grid location, a spatial filter based on the leadfield- and the sensor-covariance-matrix was constructed. For details concerning the construction of the for-

Hoogenboom, N., Schoffelen, J. M., Oostenveld, R., Parkes, L. M., Fries, P. (2006) Localizing human visual gamma-band activity in frequency, time and space. Neuroimage 29(3), 764-773. doi: 10.1016/j.neuroimage.2005.08.043
6
ward model, we would like to refer the reader to our previous publication (Bauer et al. 2006), employing the same approach. To capture the effect of interest, a time-window (for covariance-calculation) was specified for all subjects, based on the time-course of the evoked field. A window of the same length was also placed into the baseline period. For each subject, the log-ratio of power during the post-stimulus window and the pre-stimulus-window was calculated. This metric has the advantage that it accounts for the naturally increased source power estimate at deeper brain locations (due to their further distance to the MEG-sensors), while being a linear function of the difference between the two time-intervals, allowing for meaningful summation across subjects. Using SPM2 (http://www.fil.ion.ucl.ac.uk/spm), the individual anatomical MRIs and the corresponding log-ratio-maps were spatially normalized toward the International Consor-tium for Brain Mapping template (Montreal Neurological Institute, Montreal, Quebec, Canada). Individual spatially normalized functional maps were subsequently averaged. Correlation of physiological measures with behavioural data In order to identify those components of the sensory response that showed the highest prediction for performance of the task, the trials of each experimental condition and each subject were first split into two classes: slow trials and fast trials, according to individual reaction times (median split). The trials were aggregated into two groups or conditions, one “visual” condition, containing those trials where only a visual stimulus was present-ed, and one “visuo-tactile” condition, containing those where both a visual and a tactile stimulus was presented. A dependent samples t-test across subjects was then calculated for the whole data-matrices (spatio-temporal and spatio-spectro-temporal). From this test – revealing those stimulation effects, that differed significantly between fast and slow trials - time-frequency-sensor and and time-sensor windows were defined according to those clusters that showed a maximal difference. Averaging over preselected windows of time and space (sensors) or time, frequency and space, leads to an improvement of the signal to noise ratio, allowing a closer investigation of the relation between physiological measures and response-latency on a trial-by-trial basis. The individual trial data were averaged over time and sensors for time-domain analysis data and the square root of the powerspectrum (since power is a squared amplitude measure) was averaged over the re-spective time-frequency-space windows for the frequency-domain. The so obtained scalar representations (one value per trial, representing the average in the specified window) of single trial neural responses were then z-transformed (over all trials from one condition, visual or visuo-tactile, from one subjects) to nivellate intersubject differences in mean and variance of the respective measures. This was done since overall amplitude, and hence also mean and variance, of the MEG signal can greatly differ between subjects (for instance because the amplitude of the MEG signal depends strongly on the distance of the head from the sensor array, which is not fixed in MEG). To further suppress noise unre-lated to the stimulus response, we binned the trials of (each condition separately) in seven

Hoogenboom, N., Schoffelen, J. M., Oostenveld, R., Parkes, L. M., Fries, P. (2006) Localizing human visual gamma-band activity in frequency, time and space. Neuroimage 29(3), 764-773. doi: 10.1016/j.neuroimage.2005.08.043
7
groups of trials, sorted according to reaction time. The so obtained seven data points for both physiological data and reaction times for each subject were then pooled across sub-jects (intersubject differences in variance and means in both, physiology and response latency, being eliminated by the z-transformation) and correlation and regression coeffi-cients were computed across all data points. Finally, this correlation analysis was repeat-ed while not splitting the data according to stimulation condition, i.e. with the “visual” and the “visuo-tactile” trials pooled.

Hoogenboom, N., Schoffelen, J. M., Oostenveld, R., Parkes, L. M., Fries, P. (2006) Localizing human visual gamma-band activity in frequency, time and space. Neuroimage 29(3), 764-773. doi: 10.1016/j.neuroimage.2005.08.043
8
3. Results Subjects fixated a point in the center of the screen. Small, full contrast checkerboard patches were presented unpredictably in the lower right or left quadrant and subjects pressed a button with their left index finger as soon as they detected the stimulus-onset. Two tactile stimulators were mounted directly beneath the two positions at which the checkerboards could appear. The right index finger always rested on one of these two tactile stimulators, alternating between the right and the left tactile stimulator across blocks of trials. Tactile stimulation was given unpredictably on half of the trials. This paradigm was designed in close analogy to the work of Macaluso et al. (2002), but also differed in some respects (see Discussion). In order to characterize the neural responses to tactile stimuli per se, we presented isolat-ed tactile stimuli, of same duration and strength, before and after the experiment.
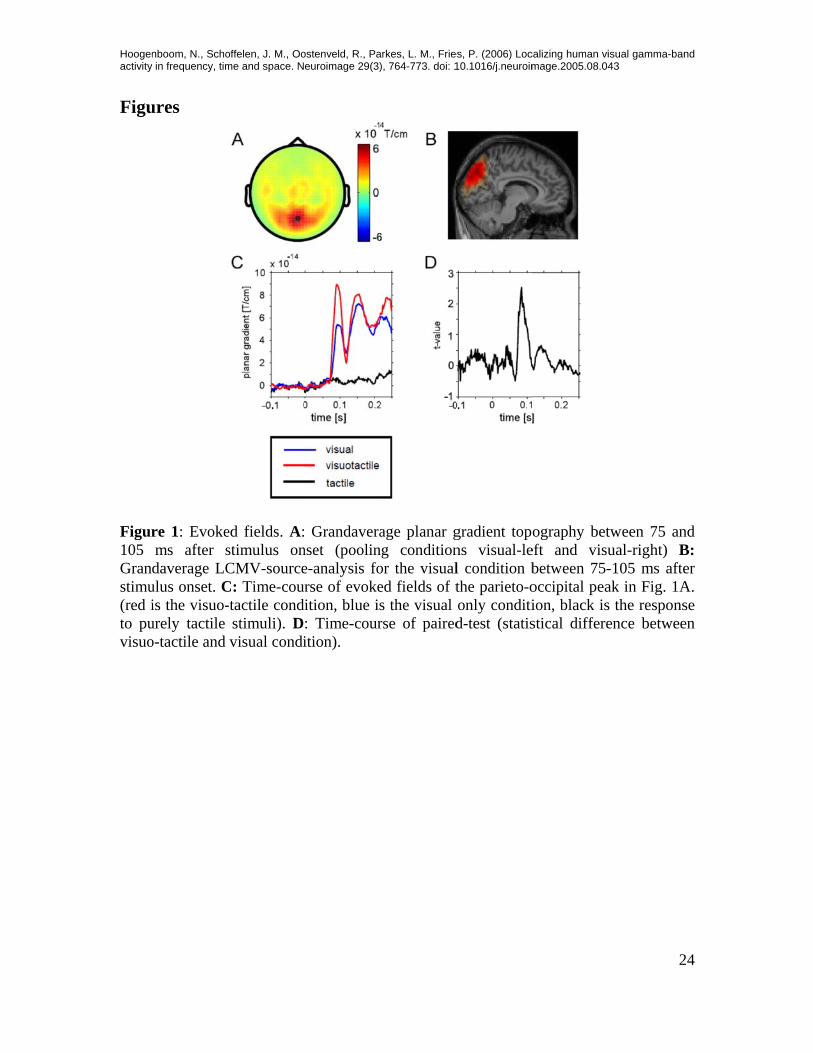
Behavior: Adding a tactile stimulus to the visual stimulus significantly shortened the average re-sponse latencies from 279.1 ms to 238.1 ms, i.e. by about 40 ms (t=8.32; p<0.0001). Ad-ditionally, the effect of spatial congruency between visual and tactile stimulus was as-sessed by an additional a priori t-test, which combined the conditions visual-left+tactile-left and visual-right+tactile-right into one congruent condition, and visual-left+tactile-right and visual-right+tactile-left into one incongruent condition. Reaction times did not differ significantly between the congruent and the incongruent condition (t=0.16; p>0,8) and this result held when the analysis was run over the stimulation sides independently. Analysis of neuronal responses - general approach: We analysed the recorded magnetic fields both for components time-locked to stimula-tion, i.e. event related fields, and for oscillatory components induced by stimulation (with the evoked field removed), i.e. time-frequency power spectra. Because neither the behavioral data nor the neuronal responses revealed any statistically significant effects of spatial congruency between visual and tactile stimulus, we will in the following ignore the location of the tactile stimulus and focus on the general effect of accessory tactile stimulation on neuronal responses to visual stimulation. We were primarily interested in the potential modulation of a unimodal visual response by an accessory tactile stimulus. We therefore focussed the analysis to MEG sensors lo-cated occipitally, over visual cortex. In response to isolated tactile stimuli, those sensors (using the planar gradient metric, giving a fairly local estimate of brain activity) did not show any response – neither a deflection in the evoked field (Fig. 1C, black line), nor an enhancement of power (see Figure 3), i.e. there was no significant (common) pick-up of responses to tactile stimuli originating from somatosensory cortex. This enabled us to directly compare the responses to isolated visual and combined visuo-tactile stimulation.

Hoogenboom, N., Schoffelen, J. M., Oostenveld, R., Parkes, L. M., Fries, P. (2006) Localizing human visual gamma-band activity in frequency, time and space. Neuroimage 29(3), 764-773. doi: 10.1016/j.neuroimage.2005.08.043
9
MEG data are presented in the planar gradient metric, which has the advantage that inter-individual differences in dipolar orientation do not lead to partial cancellation of the fields when grandaveraging. Furthermore, planar gradients provide a spatially focused representation with a maximum above the underlying source (Bastiaansen & Knösche 2000). Evoked fields Analysis of the early evoked fields to isolated tactile stimuli revealed the sequence of evoked fields with the same topography that has been described in several previous stud-ies (e.g. Braun et al. 2002, Bauer et al. 2006, Simoes et al. 2001): Activation of the con-tralateral primary somatosensory cortex (S1, peak time around 55 ms) followed by ipsi- and contralateral secondary somatosensory cortex (S2, peak time between approx. 80 and 100ms, data not shown). Early evoked fields (75-105 ms) in response to isolated visual stimuli were dominated by a medial occipital peak with two smaller lateral extensions (see Figure 1A). We per-formed a source analysis using spatial filters (van Veen et al 1997) and found an activa-tion that extended from the cuneus (Brodmann area 18) to the precuneus (Brodmann area 7), with a maximum in the parieto-occipital sulcus (see Figure 1B). Accessory tactile stimulation enhanced this parieto-occipital visual evoked response, with a peak latency of the effect around 85 ms (Fig. 1C and D). A paired t-test (across sub-jects) on the mean ERF amplitude between 75 and 105 ms after stimulus onset revealed the statistical significance of this effect (t=3.39, p<0.05, see also Fig 1D, for a sample-wise t-test between the two conditions). Importantly, this medial parieto-occipital source did not respond to tactile stimuli per se (Fig. 1C, the black line). Since for both, visual stimulation in the right and left hemifields, the maxima of the visual evoked response (as well as its tactile enhancement) were located in the same sensors, we pooled across these conditions. Oscillatory responses to visual and tactile stimuli Isolated visual stimulation resulted in an enhancement of rhythmic activity between 50 and 150 Hz (i.e. the higher gamma-band) in sensors covering large regions of occipital and occipito-temporal cortex. This gamma-band activity had an onset of approximately 100 ms in the visuo-tactile condition and approximately 150ms in the visual condition (note that, due to the applied window for frequency analysis, this cannot be determined exactly). The peak gamma-band response occured around 150 ms after stimulus onset for the visuo-tactile condition and between 200 and 250 ms for the visual condition, in sen-sors over visual cortex (Fig. 2 A, B). Since the evoked field was subtracted from individ-ual trials before frequency analysis, this activity is not phase-locked to stimulus onset and therefore is commonly termed induced gamma-band activity (e.g. Tallon-Baudry & Ber-trand 1999).

Hoogenboom, N., Schoffelen, J. M., Oostenveld, R., Parkes, L. M., Fries, P. (2006) Localizing human visual gamma-band activity in frequency, time and space. Neuroimage 29(3), 764-773. doi: 10.1016/j.neuroimage.2005.08.043
10
Analysis of the lower frequencies revealed that both visual and tactile stimulation led to the well-known suppression of alpha- and beta-activity (e.g. Pfurtscheller, Woertz, Mül-ler, Wriessnegger & Pfurtscheller 2002) over occipital and somatosensory cortex, respec-tively (see Figure 3). Isolated tactile stimulation resulted in gamma-band activity with a spectral peak at 60-100 Hz and rising before 100 ms after stimulation. The topography was in good agreement with an earlier study using the same approach (Bauer et al. 2006) and suggest-ed an origin in left primary somatosensory cortex, contralateral to the site of stimulation (data not shown here). Isolated tactile stimulation did not lead to any enhancement in power in occipital sensors. If any perturbation of occipital activity was observed, then a small tendency for suppression of all frequency bands (see Figure 4).
Tactile modulation of rhythmic activity in visual cortex The most prominent effect of adding a tactile stimulus was an enhancement of the early occipital gamma-band response. Figure 5 A,B shows the respective comparison and re-veals a strong increase of activity between ~80 ms and 200 ms after stimulus onset, rang-ing from 40 to 120 Hz. A paired t-test (across subjects) on this time-frequency window (as indicated in Fig. 5A) confirmed the statistical significance of the cross-modal en-hancement (t = 2.59, p < 0.05 for all occipital sensors as marked in Fig. 2 B,D; t=3.58; p<0.001 for the selected sensors in Fig. 5B). Note that while the comparison between combined visuotactile and isolated visual stimu-lations naturally also partially reveals the tactile induced gamma-band activity over so-matosensory cortex in the topography (Fig. 5B, right side), the local maximum over oc-cipital cortex is clearly separated from the local maximum over somatosensory cortex. Together with the fact that isolated tactile stimulation did not show any gamma-band-enhancement (if anything, a slight suppression, see Figure 4) in these occipital sensors, this is clear evidence that the cross-modal enhancement of gamma-band activity is not due to (common) pick-up of activity from sources in the somatosensory cortex. Figure 5B shows the corresponding analysis (combined visuotactile versus isolated visu-al) for the lower frequencies. The topography reveals a slightly stronger suppression of alpha and beta activity in sensors overlying right occipital cortex. This effect was weaker than the modulation of the gamma-band activity, it did not reach statistical significance when all occipital sensors were chosen (t = -0.81, p > 0.75) and just reached significance when the test was calculated for sensors where the effect was maximal (t=-2.3, p<0.05). Effects of spatial congruency between visual and tactile stimuli To investigate the effect of congruency on non-phaselocked responses, stimulus induced power for the congruent visuo-tactile pair presented to the left was compared to the in-congruent pair, where the visual stimulus was presented to the left and the tactile stimulus was applied to the right index finger via the stimulator on the right side from fixation.

Hoogenboom, N., Schoffelen, J. M., Oostenveld, R., Parkes, L. M., Fries, P. (2006) Localizing human visual gamma-band activity in frequency, time and space. Neuroimage 29(3), 764-773. doi: 10.1016/j.neuroimage.2005.08.043
11
The maximal difference of this comparison did not reach statistical significance, neither when a bilateral selection of sensors were chosen (t=1.01, p>0.35), nor when only contra-lateral sensors were chosen (t=0.65, p>0.5). The corresponding contrast was also calcu-lated for the congruent/incongruent pair presented to the right side of fixation (t=0.17, p>0.8 for bilateral selection, and t=0.53, p>0.6 for contralateral selection), as well as for both of these conditions pooled to potentially enhance signal to noise ratio (t=0.86, p>0.4). However, none of these comparisons reached significance, nore was there any clear effect visible in the time-frequency plot.
Correlation of physiological parameters with response latencies The main behavioural effect of cross-modal integration in this experiment was shortening of reaction times. In order to explore the potential causal relevance of the observed multi-sensory effects, we investigated which aspects of the neural response to stimuli gave the best prediction for this effect. To this end, trials within each condition (visual stimulation only and visuo-tactile stimulation only) were split according to the median reaction time into slow and fast response trials. The whole averaged spatio-temporal matrices (or, for spectral analysis, the whole spatio-spectro-temporal matrices) were then compared across subjects using paired t-tests. Space-time-(frequency-) windows that revealed a cluster of statistically significant differences were then selected and subsamples of reaction-time sorted data (binned according to reaction times) were computed and correlated to the mean reaction times (in order to enhance the signal-to-noise-ratio when compared to sin-gle trial data, see methods section for details of the approach). Comparison of slow response trials with fast trials in the time domain revealed primarily a stronger amplitude of the evoked field in sensors overlying motor areas contralateral to the response hand (between 180 and 260 ms after stimulus onset, Figure 6A, top and middle row), as well as a minor difference in sensors ipsilateral to the response hand (Figure 6A, middle and bottom row). The topographic pattern was similar for the visual and the visuo-tactile conditions. The effects tended to be stronger in the visual condition. The mean difference found for slow vs fast trials in sensors overlying motor cortex was confirmed as a negative linear correlation between EF amplitude and reaction time for the motor areas (visual condition: r=-0.59, p<0.001; visuo-tactile condition: r=-0.4, p<0.001), indicating that stronger amplitudes of this component led to faster responses (Figure 7B). The correlation for the ipsilateral region was only significant in the visual condition (data not shown; visual: r=-0.37, p<0.05; visuo-tactile: r=-0.056, p>0.7). The timing and spatial topography suggests that this effect is directly related to the preparation and execution of the motor response. Surprisingly, no significant effect was found for the posterior parietal source that expressed a rather strong modulation of amplitude by the presence of the tac-tile stimulus (cf. Figure 1 C and D). The correlation of this component (EF in the same sensor group as described in Figure 1A, 70-100ms post-stimulus) with reaction time was
Hoogenboom, N., Schoffelen, J. M., Oostenveld, R., Parkes, L. M., Fries, P. (2006) Localizing human visual gamma-band activity in frequency, time and space. Neuroimage 29(3), 764-773. doi: 10.1016/j.neuroimage.2005.08.043
12
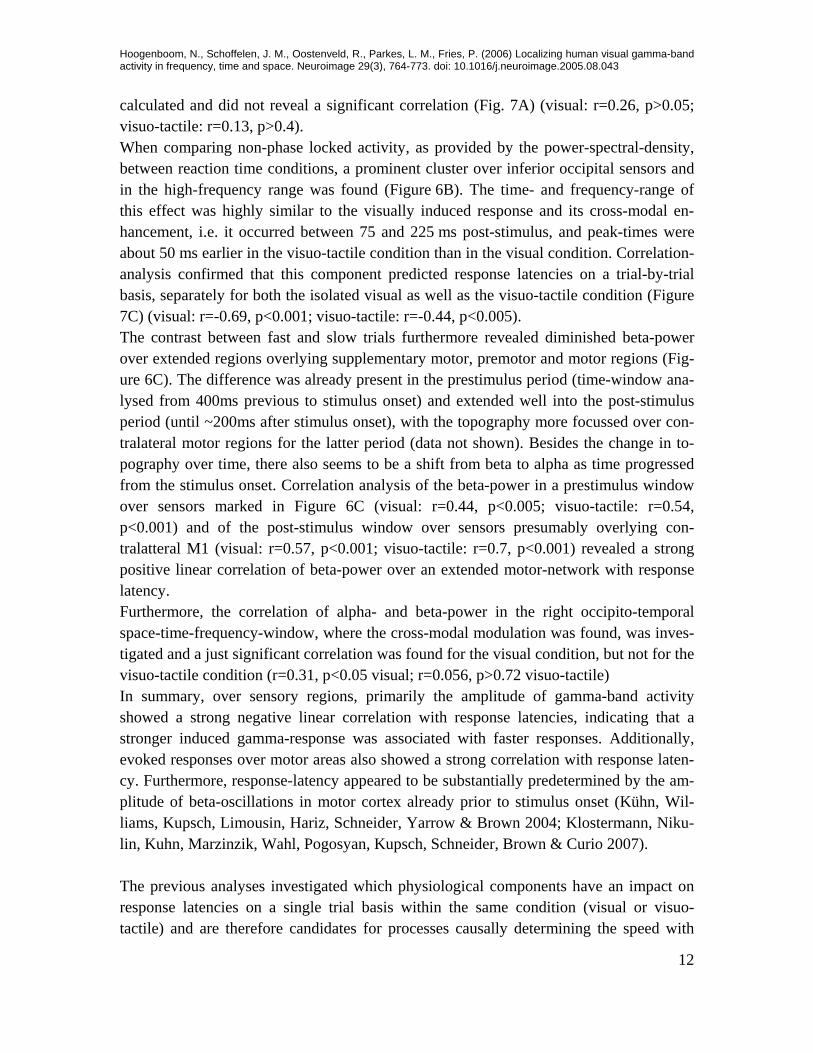
calculated and did not reveal a significant correlation (Fig. 7A) (visual: r=0.26, p>0.05; visuo-tactile: r=0.13, p>0.4). When comparing non-phase locked activity, as provided by the power-spectral-density, between reaction time conditions, a prominent cluster over inferior occipital sensors and in the high-frequency range was found (Figure 6B). The time- and frequency-range of this effect was highly similar to the visually induced response and its cross-modal en-hancement, i.e. it occurred between 75 and 225 ms post-stimulus, and peak-times were about 50 ms earlier in the visuo-tactile condition than in the visual condition. Correlation-analysis confirmed that this component predicted response latencies on a trial-by-trial basis, separately for both the isolated visual as well as the visuo-tactile condition (Figure 7C) (visual: r=-0.69, p<0.001; visuo-tactile: r=-0.44, p<0.005). The contrast between fast and slow trials furthermore revealed diminished beta-power over extended regions overlying supplementary motor, premotor and motor regions (Fig-ure 6C). The difference was already present in the prestimulus period (time-window ana-lysed from 400ms previous to stimulus onset) and extended well into the post-stimulus period (until ~200ms after stimulus onset), with the topography more focussed over con-tralateral motor regions for the latter period (data not shown). Besides the change in to-pography over time, there also seems to be a shift from beta to alpha as time progressed from the stimulus onset. Correlation analysis of the beta-power in a prestimulus window over sensors marked in Figure 6C (visual: r=0.44, p<0.005; visuo-tactile: r=0.54, p<0.001) and of the post-stimulus window over sensors presumably overlying con-tralatteral M1 (visual: r=0.57, p<0.001; visuo-tactile: r=0.7, p<0.001) revealed a strong positive linear correlation of beta-power over an extended motor-network with response latency. Furthermore, the correlation of alpha- and beta-power in the right occipito-temporal space-time-frequency-window, where the cross-modal modulation was found, was inves-tigated and a just significant correlation was found for the visual condition, but not for the visuo-tactile condition (r=0.31, p<0.05 visual; r=0.056, p>0.72 visuo-tactile) In summary, over sensory regions, primarily the amplitude of gamma-band activity showed a strong negative linear correlation with response latencies, indicating that a stronger induced gamma-response was associated with faster responses. Additionally, evoked responses over motor areas also showed a strong correlation with response laten-cy. Furthermore, response-latency appeared to be substantially predetermined by the am-plitude of beta-oscillations in motor cortex already prior to stimulus onset (Kühn, Wil-liams, Kupsch, Limousin, Hariz, Schneider, Yarrow & Brown 2004; Klostermann, Niku-lin, Kuhn, Marzinzik, Wahl, Pogosyan, Kupsch, Schneider, Brown & Curio 2007). The previous analyses investigated which physiological components have an impact on response latencies on a single trial basis within the same condition (visual or visuo-tactile) and are therefore candidates for processes causally determining the speed with

Hoogenboom, N., Schoffelen, J. M., Oostenveld, R., Parkes, L. M., Fries, P. (2006) Localizing human visual gamma-band activity in frequency, time and space. Neuroimage 29(3), 764-773. doi: 10.1016/j.neuroimage.2005.08.043
13
which sensory information is transmitted to motor structures. These analyses had been done separately for the visual and the visuo-tactile stimulation conditions. They are there-fore orthogonal to the cross-modal comparison and the results are no trivial consequence of the faster reaction times observed for visuo-tactile stimulation. In this task, tactile stimuli were given unpredictably and without any relevance to the task (by instruction and, implicitly, by task design, in that they carried no predictive information) and yet caused a substantial decrease of reaction times, by, on average, 40 ms (or 15% of the re-sponse time for the visual condition). In order to assess which (sensory) physiological components account best for the total variance of the reaction time data (including the cross-modal response facilitation), the same correlation analysis was rerun with all trials from both stimulus conditions pooled. Figure 8 shows the correlation of response laten-cies with all (as statistically significantly identified) neurophysiological cross-modal modulation effects - across conditions. Figure 8A shows a fairly strong negative correla-tion of occipital gamma-band with response latencies (r=-0.71, p<0.0001), confirming that gamma-band-activity predicted on a single trial basis (within and across conditions) faster responses. Occipital beta-activity (Figure 8B) showed a tendency for a (nonsignifi-cant) positive correlation (r=0.24, p>0.1), indicating that higher beta-amplitude may go along with slower responses. The evoked field in medial posterior-parietal areas showed a nonsignificant negative correlation with response latencies across conditions (r=-0.15, p>0.3). Notably, the sign of (the nonsignificant) correlation changed with respect to the correlation within trials, due to the stronger responses of this component for the generally faster visuo-tactile trials. In sum, of the cross-modal effects observed here, gamma-band activity in visual cortex showed the highest correlation with behavioral response laten-cies, both, within conditions, as well as across stimulation conditions.
4. Discussion We investigated the electrophysiological correlates of multisensory integration in a visuo-tactile sensorimotor task. The main finding was that accessory tactile stimulation short-ened reaction times and strongly enhanced early induced gamma band responses in visual cortex. The enhancement may have commenced as early as ~80 ms after stimulus onset and was maximal between 100 and 200 ms post-stimulus. This effect was similar in spa-tial, spectral and temporal extent to the difference between fast and slow behavioural re-sponse trials (both within and across conditions). Furthermore, the amplitude of gamma-band activity in this window explained a substantial part of the variance in the reaction times (r=-0.71 for binned data pooled across stimulus conditions). Tactile stimuli also lead to enhanced suppression of alpha- and lower beta-activity in right temporo-occipital regions, as well as to a substantial increase of an early evoked field component (70 -100 ms) localised to posterior parietal cortex (including cuneus and/or precuneus). While both these effects were statistically significant, none of them explained nearly as much of the variance in the reaction time data as the occipital gamma-band response.

Hoogenboom, N., Schoffelen, J. M., Oostenveld, R., Parkes, L. M., Fries, P. (2006) Localizing human visual gamma-band activity in frequency, time and space. Neuroimage 29(3), 764-773. doi: 10.1016/j.neuroimage.2005.08.043
14
This suggests that these components are less crucial for the shorterning of behavioral rection times and hence the transmission of visual information to motor structures.
Tactile modulation of oscillatory activity in visual cortex
Several previous studies investigated the effect of multisensory integration on visually induced gamma-band activity (Sakowitz, Quiroga, Schürmann & Basar 2001; Bhattacharya, Shams & Shimojo 2002; Senkowski, Talsma, Herrmann & Woldorff 2005). All these studies combined visual with auditory stimuli, in contrast to this study, which investigated the effect of tactile stimuli. Furthermore, previous studies focused on stimulus-locked gamma-band activity and/or did not analyse the source or sensor topog-raphy of multi-modal effects on gamma-band activity. Therefore, so far, there has been no unequivocal evidence for a cross-modal modulation of induced gamma-band activity over early sensory areas (since none of them investigated the underlying source distribu-tion or did a careful analysis of the topography of the effects). Kaiser, Hertrich, Acker-mann, Mathiak and Lutzenberger (2005) investigated the effect of congruent vs incon-gruent lip-movements and vowel-pairs (McGurk effect) and found altered gamma-oscillations over various cortical regions, including sensory brain areas. However, they did not investigate the effect of a task-irrelevant heteromodal stimulus on the response of a sensory region to a stimulus from its primary modality. We can only speculate about the pathways and mechanisms through which the tactile stimulus modulated visually induced gamma-band activity. One possibility are direct projections from somatosensory cortex to visual cortex. Recent studies demonstrated di-rect input to early visual cortex from auditory cortex (Falchier et al. 2002; Rockland & Ojima 2003). However, similar direct input from somatosensory cortex to visual cortex has so far not been found (Cappe & Barone 2005, for a review of the literature see Driver & Noesselt 2008). An alternative possibility is that the modulation of visually induced activity is mediated by higher-level multimodal areas feeding back into visual cortex (Driver & Spence 2000). Yet another possibility could be an unspecific stronger activa-tion of (evtl. subcortical) areas involved in the control of vigilance, such as e.g. the re-ticular formation (Rodriguez et al. 2004). Also about the mechanisms at the cellular level, we can only speculate. Excitatory input (as might be provided by either a heteromodal area, or a higher multisensory area in a feedback loop) into a neuronal population may enhance the amplitude of gamma-band oscillations and suppress alpha and beta oscillations (e.g. Whittington et al. 2000). An interesting finding is provided by Lakatos, Chen, O'Connell, Mills and Schroeder (2007), who presented auditory stimuli to passively listening monkeys, and found that activation of somatosensory regions by electrical median nerve stimulation alters the phase of ongo-ing oscillations in auditory cortex. The phase of ongoing theta and gamma oscillations corresponded to maximal neuronal excitability when somatosensory cortex contralateral

Hoogenboom, N., Schoffelen, J. M., Oostenveld, R., Parkes, L. M., Fries, P. (2006) Localizing human visual gamma-band activity in frequency, time and space. Neuroimage 29(3), 764-773. doi: 10.1016/j.neuroimage.2005.08.043
15
to the recorded auditory cortex was stimulated simultaneously to a sound played. This lead to an enhanced amplitude of gamma oscillations in auditory cortex in this condition.
Tactile enhancement of parieto-occipital evoked activity
Besides induced oscillatory activity, accessory tactile stimulation enhanced the amplitude of an early evoked component in parieto-occipital cortex by nearly 100%, while tactile stimuli alone did not significantly activate this source. A beamformer algorithm localized its source to the cuneus and/or pre-cuneus. Several previous studies also suggest a role of this region in multisensory integreation. Zangaladze et al. (1999) showed that a region with similar location is activated in a tactile orientation discrimination task (but not tex-ture discrimination) and even provided evidence for its causal relevance in this task. Misaki, Matsumoto and Miyauchi (2002) have shown that the region around medial parieto-occipital cortex is involved in coordinate transformations between the somatosen-sory and visual modality. Bauer et al. (2006) showed late evoked field activity (>300 ms) with a similar topography in a tactile pattern discrimination task. Rizzolatti, Fadiga, Matelli, Bettinardi, Paulesu, Perani and Fazio (1996) has described this region to be in-volved in the visual guidance of reaching/pointing movements. While this suggests a role of this area in the transmission of visual information into a motor response, to our sur-prise, we did not find a significant correlation of this activity to behavioural response latency.
Prediction of response latencies by physiological parameters
Several previous studies have investigated the neurophysiological processes that deter-mine behavioral response latencies. Jokeit and Makeig (1994) compared slowly and fast responding subjects (in a visuomotor task) and found that fast responding subjects had a stronger induced gamma-band response around 200 ms after stimulus onset, which is consistent with the effect we found. Two recent studies demonstrated a relation between gamma-band activity and reaction times on a trial-by-trial basis. Gonzalez Andino, Michel, Thut, Landis & Grave de Peralta (2005) found that anticipatory gamma-band activity in a fronto-parietal network predicted response times in a visual task. Wom-elsdorf, Fries, Mitra & Desimone (2006) showed that gamma-band synchrony in visual cortex predicted response latencies in a speed-change detection task (prior to behaviorally relevant speed change). Both of those trial-by-trial predictions focused on the gamma-band activity preceding the stimulus or stimulus change that actually triggered the behav-ioral response. By contrast, the present study focuses on the early stimulus induced gam-ma-band activity and confirms the relation between gamma-band activity and reaction times for this case. This strongly suggests that oscillatory synchrony in the high-frequency range is instrumental for the transmission of neural activity to downstream areas (Salinas & Sejnowski 2001, Fries 2005). Importantly, in this study, we show a significant prediction of behavioral response laten-cies by gamma-band-activity both within stimulation conditions and after pooling over

Hoogenboom, N., Schoffelen, J. M., Oostenveld, R., Parkes, L. M., Fries, P. (2006) Localizing human visual gamma-band activity in frequency, time and space. Neuroimage 29(3), 764-773. doi: 10.1016/j.neuroimage.2005.08.043
16
stimulation conditions: Tactile stimulation shortened reaction times and enhanced gam-ma-band activity, leading to a substantial correlation of gamma-activity with response latencies across conditions. It is noteworthy that the trial-by-trial correlation between physiological responses and reaction times were often smaller under visuo-tactile stimu-lation compared to visual stimulation. This may be due to a saturation effect, since reac-tion times in the visuo-tactile condition were usually very fast. In addition, we found that both evoked and non-phaselocked activity (in the beta-band) over motor areas predicted response times. This is as such not surprising, however, the fact that ongoing beta-oscillations in the prestimulus-period in a widespread cortical mo-tor network had a substantial predictive power for later response latencies, supports theo-ries about the impact of ongoing activity on information processing and routing of neural activity (Arieli, Sterkin, Grinvald & Aertsen 1996; Fries, Neuenschwander, Engel, Goe-bel & Singer 2001; Engel, Fries & Singer 2001) and speaks to the relevance of beta-oscillations for motor functions (Brovelli, Ding, Ledberg, Chen, Nakamura & Bressler 2004; Gross, Pollok, Dirks, Timmermann, Butz & Schnitzler 2005; Kühn, Williams, Kupsch, Limousin, Hariz, Schneider, Yarrow & Brown 2004; Klostermann, Nikulin, Kuhn, Marzinzik, Wahl, Pogosyan, Kupsch, Schneider, Brown & Curio 2007). The pre-cise mechanisms, and, in particular, the relevance of synchrony between these areas of the cortical motor-network require careful further investigation that goes beyond the scope of this paper.
Spatial stimulus congruency
Contrary to what we had expected, all these effects (behavioural and physiological) were independent of the relative positions of the visual and the tactile stimulus. Thus, in this experiment, multisensory enhancement of activity in visual cortex was independent of the spatial alignment of the visual and tactile stimulus. Since this study was designed to closely follow the study of Macaluso et al. (2002), we will first discuss the observed dis-crepancy to their findings. Macaluso reported that the fMRI BOLD response in extrastri-ate visual cortex around the fusiform gyrus was enhanced when a tactile stimulus was provided adjacent to a visual stimulus as compared to when it was not adjacent. There are several important differences between our experiment and their study:
1.) Macaluso et al. used visual flicker and tactile vibration stimuli, while we used sta-tionary stimuli in order to avoid entrainment of brain activity to externally op-pressed rhythms.
2.) While Macaluso et al. manipulated spatial correspondence by changing subjects’ gaze direction, we manipulated the position of the index finger.
3.) We measured MEG, whereas Macaluso et al. measured the fMRI BOLD re-sponse.
4.) Macaluso restricted the analysis of multimodal spatial correspondence to voxels showing a main effect of retinal hemifield for the visual target.

Hoogenboom, N., Schoffelen, J. M., Oostenveld, R., Parkes, L. M., Fries, P. (2006) Localizing human visual gamma-band activity in frequency, time and space. Neuroimage 29(3), 764-773. doi: 10.1016/j.neuroimage.2005.08.043
17
Any of these differences might explain the observed discrepancy. Nevertheless, besides the more technical differences between our study and the one of Macaluso, as pointed out above, several authors have also reported multisensory effects independent of spatial alignment (Murray et al. 2005, Teder-Sälejärvi et al. 2005), suggesting that spatial re-mapping between different modalities may not always necessarily occur. It should further be emphasized here, that in our task, spatial stimulus congruency was completely irrele-vant for successfully performing the task and given the easiness of the task, subjects may often have responded before the stimuli reached full perceptual awareness. To conclude, the present study shows that a task irrelevant tactile stimulus facilitates pro-cessing of visual input in that behavioural responses to the onset of visual stimuli given under speed conditions are substantially accelerated. The candidate mechanism for this behavioural facilitation seems to be a very early enhancement of local non-stimulus-locked activity in the gamma-band. While tactile stimulation altered additional response properties of visual cortex to visual stimulation, these show substantially less correlation with the functional consequences of multisensory integration in this experiment. This is indicative of a prominent role of synchronized oscillatory activity in multisensory inte-gration.

Hoogenboom, N., Schoffelen, J. M., Oostenveld, R., Parkes, L. M., Fries, P. (2006) Localizing human visual gamma-band activity in frequency, time and space. Neuroimage 29(3), 764-773. doi: 10.1016/j.neuroimage.2005.08.043
18
References
Amedi A., Jacobson G., Hendler T., Malach R., and Zohary E. (2002). Convergence of visual and tactile shape processing in the human lateral occipital complex. Cerebral Cor-tex 12, 1202-1212.
Arieli A, Sterkin A, Grinvald A, Aertsen A. (1996). Dynamics of ongoing activity: ex-planation of the large variability in evoked cortical responses. Science, 273(5283), 1868-1871.
Bauer,M., Oostenveld,R., Peeters,M., and Fries,P. (2006). Tactile spatial attention en-hances gamma-band activity in somatosensory cortex and reduces low-frequency activity in parieto-occipital areas. J.Neurosci. 26, 490-501.
Bastiaansen M.C., Knösche T.R. (2000). Tangential derivative mapping of axial MEG applied to event-related desynchronization research. Clin. Neurophysiol., 111,1300 –1305.
Bichot N.P., Rossi AF, Desimone R. (2005) Parallel and serial neural mechanisms for visual search in macaque area V4. Science, 308, 529-534.
Braun C, Haug M, Wiech K, Birbaumer N, Elbert T, Roberts LE. (2002). Functional or-ganization of primary somatosensory cortex depends on the focus of attention. Neu-roimage. 17(3), 1451-8.
Brovelli A., Ding M., Ledberg A., Chen Y., Nakamura R., Bressler S.L.. (2004). Beta oscillations in a large-scale sensorimotor cortical network: directional influences revealed by Granger causality. Proc Natl Acad Sci USA., 101(26), 9849-54.
Bhattacharya,J., Shams,L., and Shimojo,S. (2002). Sound-induced illusory flash percep-tion: role of gamma band responses. Neuroreport 13, 1727-1730.
Buschman TJ, Miller EK. (2007) Top-down versus bottom-up control of attention in the prefrontal and posterior parietal cortices. Science, 315, 1860-1862
Calvert,G.A., Campbell,R., and Brammer,M.J. (2000). Evidence from functional magnet-ic resonance imaging of crossmodal binding in the human heteromodal cortex. Curr.Biol. 10, 649-657.
Cappe, C. and Barone, P. (2005). Heteromodal connections supporting multisensory inte-gration at low levels of cortical processing in the monkey. Eur.J.Neurosci. 22, 2886-2902.
Hoogenboom, N., Schoffelen, J. M., Oostenveld, R., Parkes, L. M., Fries, P. (2006) Localizing human visual gamma-band activity in frequency, time and space. Neuroimage 29(3), 764-773. doi: 10.1016/j.neuroimage.2005.08.043
19
Cunningham M.O., Davies C.H., Buhl E.H., Kopell N., and Whittington M.A. (2003). Gamma oscillations induced by kainate receptor activation in the entorhinal cortex in vitro. J Neurosci. 23(30), 9761-9769.
Driver J, and Spence C. (2000). Multisensory perception: beyond modularity and conver-gence. Curr Biol. 10(20), R731-5.
Driver J, and Noesselt T. (2008). Multisensory interplay reveals crossmodal influences on 'sensory-specific' brain regions, neural responses, and judgments. Neuron. 57(1), 11-23.
Engel A.K., Fries P., Singer W. (2001). Dynamic predictions: oscillations and synchrony in top-down processing. Nat Rev Neurosci., 2(10), 704-16.
Ernst MO, Banks MS. (2002). Humans integrate visual and haptic information in a statis-tically optimal fashion. Nature., 415(6870), 429-433.
Falchier,A., Clavagnier,S., Barone,P., and Kennedy,H. (2002). Anatomical evidence of Multimodal integration in primate striate cortex. Journal of Neuroscience 22, 5749-5759.
Friedman-Hill S, Maldonado PE, Gray CM. (2000). Dynamics of striate cortical activity in the alert macaque: I. Incidence and stimulus-dependence of gamma-band neuronal oscillations. Cereb Cortex, 10, 1105-1116.
Frien A, Eckhorn R. (2000). Functional coupling shows stronger stimulus dependency for fast oscillations than for low-frequency components in striate cortex of awake monkey. Eur J Neurosci., 12(4), 1466-1478.
Fries,P., Reynolds,J.H., Rorie,A.E., and Desimone,R. (2001). Modulation of oscillatory neuronal synchronization by selective visual attention. Science 291, 1560-1563.
Fries P, Neuenschwander S, Engel AK, Goebel R, Singer W. (2001). Rapid feature selec-tive neuronal synchronization through correlated latency shifting. Nat Neurosci., 4(2), 194-200.
Fries,P. (2005). A mechanism for cognitive dynamics: neuronal communication through neuronal coherence. Trends Cogn Sci. 9, 474-480.
Fründ I, Busch NA, Schadow J, Körner U, Herrmann CS. (2007). From perception to action: phase-locked gamma oscillations correlate with reaction times in a speeded re-sponse task. BMC Neurosci., 17, 8-27.
Hoogenboom, N., Schoffelen, J. M., Oostenveld, R., Parkes, L. M., Fries, P. (2006) Localizing human visual gamma-band activity in frequency, time and space. Neuroimage 29(3), 764-773. doi: 10.1016/j.neuroimage.2005.08.043
20
Gonzalez Andino S.L., Michel C.M., Thut G., Landis T., Grave de Peralta R. (2005). Prediction of response speed by anticipatory high-frequency (gamma band) oscillations in the human brain. Hum Brain Mapp. 24(1), 50-58.
Gray C.M., König P., Engel A.K., Singer W. (1989). Oscillatory responses in cat visual cortex exhibit inter-columnar synchronization which reflects global stimulus properties. Nature, 338(6213), 334-337.
Gross J, Pollok B, Dirks M, Timmermann L, Butz M, Schnitzler A. (2005). Task-dependent oscillations during unimanual and bimanual movements in the human primary motor cortex and SMA studied with magnetoencephalography. Neuroimage. 26(1), 91-98.
Gruber T, Müller MM, Keil A, Elbert T (1999) Selective visual-spatial attention alters induced gamma band responses in the human EEG. Clin Neurophysiol., 110, 2074 – 2085.
Jokeit H, Makeig S. (1994). Different event-related patterns of gamma-band power in brain waves of fast- and slow-reacting subjects. Proc Natl Acad Sci U S A. 91(14), 6339-6343.
Kaiser,J., Lutzenberger,W. (2005) Human gamma-band activity: A window to cognitive processing. NeuroReport 16, 207-211
Kaiser J, Hertrich I, Ackermann H, Mathiak K, Lutzenberger W. (2005). Hearing lips: gamma-band activity during audiovisual speech perception. Cereb Cortex. 15(5), 646-653.
Kayser, C., Petkov, C.I., Augath,M., and Logothetis,N.K. (2005). Integration of touch and sound in auditory cortex. Neuron 48, 373-384.
Kennett, S., Eimer, M., Spence,C., and Driver,J. (2001). Tactile-visual links in exogenous spatial attention under different postures: convergent evidence from psychophysics and ERPs. J.Cogn Neurosci. 13, 462-478.
Klostermann F., Nikulin V.V., Kuhn A.A., Marzinzik F., Wahl M., Pogosyan A., Kupsch A., Schneider G.H., Brown P., Curio G. (2007). Task-related differential dynamics of EEG alpha- and beta-band synchronization in cortico-basal motor structures. Eur. J. Neu-rosci., 25, 1604-1615.
Knösche, T.R. (2002) Transformation of whole-head MEG recordings between different sensor positions. Biomed Tech (Berl), 47, 59–62.

Hoogenboom, N., Schoffelen, J. M., Oostenveld, R., Parkes, L. M., Fries, P. (2006) Localizing human visual gamma-band activity in frequency, time and space. Neuroimage 29(3), 764-773. doi: 10.1016/j.neuroimage.2005.08.043
21
Kühn AA, Williams D, Kupsch A, Limousin P, Hariz M, Schneider GH, Yarrow K, Brown P. (2004). Event-related beta desynchronization in human subthalamic nucleus correlates with motor performance. Brain, 127, 735-46.
Lakatos P, Chen CM, O'Connell MN, Mills A, Schroeder CE. (2007). Neuronal oscilla-tions and multisensory interaction in primary auditory cortex. Neuron, 53(2), 279-292.
Macaluso,E., Frith,C.D., and Driver,J. (2000). Modulation of human visual cortex by crossmodal spatial attention. Science 289, 1206-1208.
Macaluso,E., Frith,C.D., and Driver,J. (2002). Crossmodal spatial influences of touch on extrastriate visual areas take current gaze direction into account. Neuron 34, 647-658.
Misaki,M., Matsumoto,E., and Miyauchi,S. (2002). Dorsal visual cortex activity elicited by posture change in a visuo-tactile matching task. Neuroreport 13, 1797-1800.
Mishra J, Fellous JM, Sejnowski TJ. (2006). Selective attention through phase relation-ship of excitatory and inhibitory input synchrony in a model cortical neuron. Neural Netw., 19(9), 1329-1346.
Mitra PP, Pesaran B (1999) Analysis of dynamic brain imaging data. Biophys J., 76, 691–708.
Murray,M.M., Molholm,S., Michel,C.M., Heslenfeld,D.J., Ritter,W., Javitt,D.C., Schroeder,C.E., and Foxe,J.J. (2005). Grabbing your ear: rapid auditory-somatosensory multisensory interactions in low-level sensory cortices are not constrained by stimulus alignment. Cereb.Cortex 15, 963-974.
Pfurtscheller,G., Woertz,M., Müller,G., Wriessnegger,S., and Pfurtscheller,K. (2002). Contrasting behavior of beta event-related synchronization and somatosensory evoked potential after median nerve stimulation during finger manipulation in man. Neuro-sci.Lett. 323, 113-116.
Riesenhuber,M. and Poggio,T. (1999). Hierarchical models of object recognition in cor-tex. Nat.Neurosci. 2, 1019-1025.
Rizzolatti,G., Fadiga,L., Matelli,M., Bettinardi,V., Paulesu,E., Perani,D., and Fazio,F. (1996). Localization of grasp representations in humans by PET: 1. Observation versus execution. Exp.Brain Res. 111, 246-252.
Rockland,K.S. and Ojima,H. (2003). Multisensory convergence in calcarine visual areas in macaque monkey. Int.J.Psychophysiol. 50, 19-26.

Hoogenboom, N., Schoffelen, J. M., Oostenveld, R., Parkes, L. M., Fries, P. (2006) Localizing human visual gamma-band activity in frequency, time and space. Neuroimage 29(3), 764-773. doi: 10.1016/j.neuroimage.2005.08.043
22
Rodriguez R, Kallenbach U, Singer W, Munk MH (2004) Short- and longterm effects of cholinergic modulation on gamma oscillations and response synchronization in the visual cortex. J Neurosci., 24, 10369 –10378.
Rose M, Buchel C. (2005). Neural coupling binds visual tokens to moving stimuli. J. Neurosci., 25(44), 10101-10104.
Sakowitz,O.W., Quiroga,R.Q., Schürmann,M., and Basar,E. (2001). Bisensory stimula-tion increases gamma-responses over multiple cortical regions. Brain Res.Cogn Brain Res. 11, 267-279.
Schroeder C.E., Foxe J.J. (2002). The timing and laminar profile of converging inputs to multisensory areas of the macaque neocortex. Brain Res Cogn Brain Res., 14(1), 187-198.
Salinas,E. and Sejnowski,T.J. (2001). Correlated neuronal activity and the flow of neural information. Nat.Rev.Neurosci. 2, 539-550.
Schroeder,C.E. and Foxe,J.J. (2002). The timing and laminar profile of converging inputs to multisensory areas of the macaque neocortex. Brain Res.Cogn Brain Res. 14, 187-198.
Senkowski,D., Talsma,D., Herrmann,C.S., and Woldorff,M.G. (2005). Multisensory pro-cessing and oscillatory gamma responses: effects of spatial selective attention. Exp.Brain Res. 166, 411-426.
Simoes C, Mertens M, Forss N, Jousmäki V, Lütkenhöner B, and Hari R. (2001). Func-tional overlap of finger representations in human SI and SII cortices. J Neurophysiol. 86(4), 1661-5.
Singer,W. and Gray,C.M. (1995). Visual feature integration and the temporal correlation hypothesis. Annu.Rev.Neurosci. 18, 555-586.
Singer,W. (1999). Neuronal synchrony: a versatile code for the definition of relations? Neuron, 49-65, 111-125.
Tallon-Baudry C, Bertrand O. (1999). Oscillatory gamma activity in humans and its role in object representation. Trends Cogn Sci., 3, 151-162.
Taylor K, Mandon S, Freiwald WA, Kreiter AK. (2005). Coherent oscillatory activity in monkey area v4 predicts successful allocation of attention. Cereb. Cortex, 15, 1424-37.
Teder-Sälejärvi W.A., Di Russo F., McDonald J.J., Hillyard S.A. (2005). Effects of spa-tial congruity on audio-visual multimodal integration. J Cogn Neurosci. 17(9), 1396-409.
Hoogenboom, N., Schoffelen, J. M., Oostenveld, R., Parkes, L. M., Fries, P. (2006) Localizing human visual gamma-band activity in frequency, time and space. Neuroimage 29(3), 764-773. doi: 10.1016/j.neuroimage.2005.08.043
23
Tiesinga PH, Fellous JM, Salinas E, Jose JV, Sejnowski TJ.(2004). Inhibitory synchrony as a mechanism for attentional gain modulation. J Physiol Paris., 98(4-6), 296-314.
van Beers RJ, Sittig AC, Gon JJ (1999). Integration of proprioceptive and visual position-information: An experimentally supported model. J Neurophysiol., 81(3), 1355-64.
Van Veen,B.D., van Drongelen,W., Yuchtman,M., and Suzuki,A. (1997). Localization of brain electrical activity via linearly constrained minimum variance spatial filtering. IEEE Trans.Biomed.Eng 44, 867-880.
Wallace,M.T. and Stein,B.E. (1996). Sensory organization of the superior colliculus in cat and monkey. Prog.Brain Res. 112, 301-311.
Whittington MA, Traub RD, Kopell N, Ermentrout B, Buhl EH. (2000). Inhibition-based rhythms: experimental and mathematical observations on network dynamics. Int. J. Psychophysiol., 38(3), 315-36.
Womelsdorf,T., Fries,P., Mitra,P.P., and Desimone,R. (2006). Gamma-band synchroniza-tion in visual cortex predicts speed of change detection. Nature 439, 733-736.
Zangaladze,A., Epstein,C.M., Grafton,S.T., and Sathian,K. (1999). Involvement of visual cortex in tactile discrimination of orientation. Nature 401, 587-590.
Zhang,M., Weisser,V.D., Stilla,R., Prather,S.C., and Sathian,K. (2004). Multisensory cortical processing of object shape and its relation to mental imagery. Cogn Af-fect.Behav.Neurosci. 4, 251-259.
Hoogenactivity
Figu
Figur105 Granstimu(red ito puvisuo
nboom, N., Schoy in frequency, tim
ures
re 1: Evokems after sdaverage LC
ulus onset. Cis the visuo-urely tactile o-tactile and
offelen, J. M., Oome and space. N
ed fields. A:stimulus onCMV-sourceC: Time-cou-tactile condstimuli). Dvisual condi
ostenveld, R., Paeuroimage 29(3)
Grandaveranset (pooline-analysis fo
urse of evokedition, blue is: Time-courition).
arkes, L. M., Frie), 764-773. doi: 1
age planar gng conditionor the visualed fields of ts the visual rse of paired
es, P. (2006) Loc10.1016/j.neuroim
gradient topns visual-lel condition bthe parieto-oonly conditid-test (statis
calizing human vimage.2005.08.04
ography beteft and visubetween 75-occipital peaion, black isstical differe
isual gamma-ban43
2
tween 75 anual-right) B-105 ms afteak in Fig. 1As the responsence betwee
nd
24
nd B: er A. se en

Hoogenactivity
Figural+taturbaB: Tofect bgamm
nboom, N., Schoy in frequency, tim
re 2: High-fctile stimula
ation inducedopography oby visual stimma-band-enh
offelen, J. M., Oome and space. N
frequency osation effect. d by the visuof gamma-bamulus + tacthancement as
ostenveld, R., Paeuroimage 29(3)
scillatory actA: Time-freual stimulusand-enhancetile stimuluss shown in C
arkes, L. M., Frie), 764-773. doi: 1
tivity; A,B: Vequency-reprs in marked ement as shos applied to rC.
es, P. (2006) Loc10.1016/j.neuroim
Visual stimuresentation (occipital senown in A. Cright index f
calizing human vimage.2005.08.04
ulation effec(TFR) of thensors (as ind
C: TFR of stfinger. D: T
isual gamma-ban43
2
ct; C,D: Visue spectral perdicated in Btimulation eopography o
nd
25
u-r-
B). f-of

Hoogenactivity
Figurfor re
Figural+ta
nboom, N., Schoy in frequency, tim
re 3: High-fesponses to p
re 4: Low-frctile stimula
offelen, J. M., Oome and space. N
frequency ospurely tactile
frequency osation effect.
ostenveld, R., Paeuroimage 29(3)
scillatory acte stimulation
cillatory actA: Time-fre
arkes, L. M., Frie), 764-773. doi: 1
tivity in the n.
tivity; A,B: Vequency-repr
es, P. (2006) Loc10.1016/j.neuroim
same senso
Visual stimuresentation (
calizing human vimage.2005.08.04
ors as chosen
ulation effec(TFR) of the
isual gamma-ban43
2
n for figure
ct; C,D: Visue spectral per
nd
26
2
u-r-

Hoogenactivity
turbaB: Tovisuabeta-
Figurthe vtion enhansenso
nboom, N., Schoy in frequency, tim
ation inducedopography oal stimulus +suppression
re 5: Multisisuo-tactile in high-freqncement as iors as marke
offelen, J. M., Oome and space. N
d by the visuof alpha-beta+ tactile stim
as shown in
ensory-enhastimulation
quencies in indicated in d in D. D: T
ostenveld, R., Paeuroimage 29(3)
ual stimulusa-suppressionmulus appliedn C.
ancement-effagainst visusensors as mA. C: TFR
Topography o
arkes, L. M., Frie), 764-773. doi: 1
s in marked n as shown id to right ind
fect. Result oual stimulus marked in B
R of oscillatoof gamma-b
es, P. (2006) Loc10.1016/j.neuroim
occipital senin A. C: TFRdex finger. D
of the statistonly. A: TFB. B: Topoory modulatiand-enhance
calizing human vimage.2005.08.04
nsors (as indR of stimulaD: Topograp
tical comparFR of oscillaography of gion in low-fement as ind
isual gamma-ban43
2
dicated in Bation effect bphy of alpha
rison betweeatory modulagamma-bandfrequencies idicated in C.
nd
27
B). by a-
en a-d-in

Hoogenactivity
nboom, N., Schoy in frequency, tim
offelen, J. M., Oome and space. N
ostenveld, R., Paeuroimage 29(3)
arkes, L. M., Frie), 764-773. doi: 1
es, P. (2006) Loc10.1016/j.neuroim
calizing human vimage.2005.08.04
isual gamma-ban43
2
nd
28

Hoogenboom, N., Schoffelen, J. M., Oostenveld, R., Parkes, L. M., Fries, P. (2006) Localizing human visual gamma-band activity in frequency, time and space. Neuroimage 29(3), 764-773. doi: 10.1016/j.neuroimage.2005.08.043
29
Figure 6: Statistical comparison of fast vs slow trials (separated by median split) – for each condition separately. Left column: visual stimulation. Right column: Visuo-tactile stimulation. A: Comparison for evoked activity: Top row: Time-course of t-values for the sensors marked in the middle row in the left hemisphere. Middle row: Topographies of the time-window as marked in the top and bottom-row. Bottom-row: Time-course of t-values for the sensors over motor cortex marked in the middle row in the right hemi-sphere. B: Comparison for high-frequency-induced activity in occipital cortex: Top row: Time frequency representation of the comparison (t-test) fast vs slow from sensors marked in the the bottom-row. Bottom row: Topography of the spectral pattern marked in the the top row. C: Comparison for low-frequency ongoing activity over motor cortex: Top row: Time frequency representation of the comparison (t-test) fast vs slow from sen-sors marked in the the bottom-row. Bottom row: Topography of the spectral pattern marked in the the top row.

Hoogenactivity
Figurtime groupcy. Tvisuodistrifrom
nboom, N., Schoy in frequency, tim
re 7: Correl(x-axis). Th
ped in sevenThe fitted lino-tactile). Thbution of resensors ove
offelen, J. M., Oome and space. N
lation plots he plots sh
n bins (for eanear regressiohe data poinsponse latener medial p
ostenveld, R., Paeuroimage 29(3)
of different ow normaliach conditionon lines are ts on the rig
ncies. A: Coarieto-occipi
arkes, L. M., Frie), 764-773. doi: 1
features of zed values n separatelyshown for e
ght of each orrelation of ital cortex (
es, P. (2006) Loc10.1016/j.neuroim
f brain activifrom indiv
y), sorted acceach conditifigure are dthe mean am
(see Fig. 1A
calizing human vimage.2005.08.04
ity (y-axis) idual subjec
cording to reon (solid: vi
due to the tymplitude froA). B: Corre
isual gamma-ban43
3
with reactiocts that weresponse latenisual, dashed
ypically taileom 70-100 melation of th
nd
30
on re n-d: ed ms he
Hoogenactivity
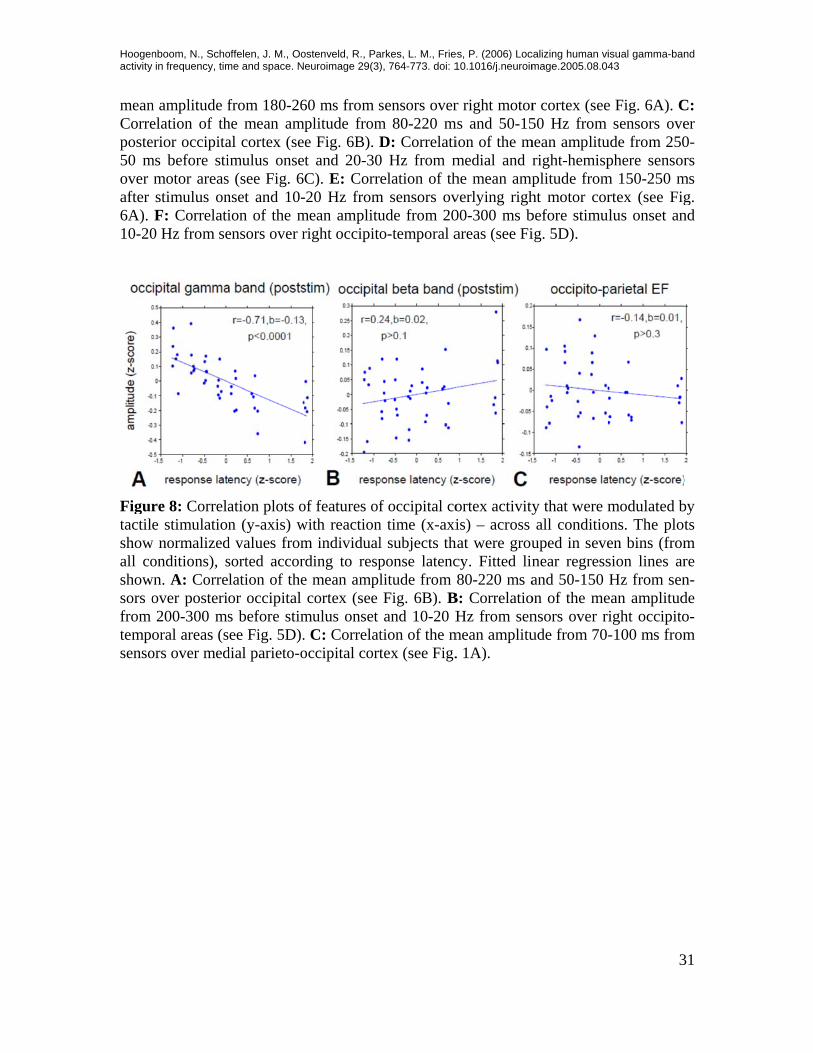
meanCorreposte50 mover after 6A). 10-20
Figurtactilshowall coshowsors ofrom tempsenso
nboom, N., Schoy in frequency, tim
n amplitude felation of therior occipitams before sti
motor areasstimulus onF: Correlati
0 Hz from se
re 8: Correlae stimulation
w normalizedonditions), s
wn. A: Correover posteri200-300 ms
oral areas (sors over med
offelen, J. M., Oome and space. N
from 180-26he mean amal cortex (seimulus onses (see Fig. 6nset and 10-ion of the mensors over r
ation plots on (y-axis) w
d values fromsorted accorlation of theor occipital s before stim
see Fig. 5D).dial parieto-o
ostenveld, R., Paeuroimage 29(3)
60 ms from smplitude from
e Fig. 6B). Dt and 20-30C). E: Corr-20 Hz frommean amplituright occipito
of features ofwith reactionm individualrding to respe mean amplcortex (see
mulus onset . C: Correlatoccipital cort
arkes, L. M., Frie), 764-773. doi: 1
sensors overm 80-220 mD: Correlati
0 Hz from melation of th
m sensors ovude from 20o-temporal a
f occipital con time (x-axil subjects thponse latenclitude from Fig. 6B). Band 10-20 H
tion of the mtex (see Fig.
es, P. (2006) Loc10.1016/j.neuroim
r right motorms and 50-15
ion of the mmedial and rhe mean ampverlying righ00-300 ms bareas (see Fi
ortex activityis) – across
hat were groucy. Fitted lin80-220 ms a
B: CorrelatioHz from sen
mean amplitu. 1A).
calizing human vimage.2005.08.04
r cortex (see50 Hz from
mean amplituright-hemispplitude fromht motor corbefore stimuig. 5D).
y that were mall conditio
uped in sevenear regressand 50-150
on of the mensors over riude from 70-
isual gamma-ban43
3
e Fig. 6A). Csensors ove
ude from 250phere sensor
m 150-250 mrtex (see Figlus onset an
modulated bons. The ploten bins (fromsion lines arHz from sen
ean amplitudight occipito-100 ms from
nd
31
C: er 0-rs
ms g.
nd
by ts m re n-de o-m

Hoogenboom, N., Schoffelen, J. M., Oostenveld, R., Parkes, L. M., Fries, P. (2006) Localizing human visual gamma-band activity in frequency, time and space. Neuroimage 29(3), 764-773. doi: 10.1016/j.neuroimage.2005.08.043
32
Supplementary material Figure legends Figure 1: The time frequency panels show the total induced power changes of the visuo-tactile (top row) and visual stimulus (middle row) on low frequencies from 2 – 8 Hz. The lowest panel shows the statistical comparison between the visuo-tactile and the purely visual stimulus (visuo-tactile – visual). All time-frequency representations (TFR) repre-sent an average of all occipital sensors. Figure 2: Same as figure 1, but here the power of the evoked field (i.e. the time-frequency-representation of stimulus-evoked activity) was subtracted from the individual trial’s time-frequency-representation. This measure is insensitive to small variations of the latency (phase) of the evoked response over trials. The purely induced power changes are shown here for the visuo-tactile (top) and visual stimulus conditions (middle) as well as the statistical comparison between visuo-tactile and visual conditions (lower). Com-parison between figure 1 and figure 2 suggests that the enhancement in the power of low frequencies are caused by the evoked field, while there is a suppression of non-stimulus locked power. As in figure 1, the time-frequency-representations were averaged across occipital sensors. Figure 3: Same as figure 2, the evoked field was subtracted from individual trials, but with a different method. Whereas in figure 1 the absolute power of the evoked field in the frequency domain was subtracted from the total power estimates of single trial data (thus neglecting the phase-information in both measures), here the time-domain estimate of the evoked field was subtracted from the individual trial raw (time-domain) data. This meth-od would be equivalent with subtracting the complex Fourier-spectra of the evoked field from single trial complex Fourier-spectra (preserving phase information in both measures). Since the phase of the stimulus-evoked response is likely to jitter between trials (due to latency differences) this can lead to false estimates of the non-phaselocked power, with presumably artificial enhancement effects remaining in the time-frequency responses. The view that the enhancement visible in figures 1 and 3 is due to an evoked response is further supported by figure 4, which shows that the frequency response of the stimulus-phase-locked changes is in precisely the same time-frequency range. Figure 4: The stimulus-phase-locking factor, or inter-trial-coherence. Plotted are pseudo-z-values that were matched to the p-values (under the assumption of a normal distribu-tion) obtained from a randomization statistics that compares the empirically found phase-locking value with the distribution of phase-locking values from phase-scrambled trials.

Hoogenboom, N., Schoffelen, J. M., Oostenveld, R., Parkes, L. M., Fries, P. (2006) Localizing human visual gamma-band activity in frequency, time and space. Neuroimage 29(3), 764-773. doi: 10.1016/j.neuroimage.2005.08.043
33
Figure 4 A shows the phaselocking-factor for occipital channels under purely tactile stimulation. The picture is dominated by noise, none of the z-values exceed a magnitude of 0.5. Figure 4 B shows the same statistics for trials where a visuo-tactile stimulus was presented, and Figure 4 C for trials where only a visual stimulus was presented (all 3 panels averaged over occipital channels). Figure 4 B and C show very clear phase-locking to the stimulus with z-values clearly exceeding values of 2. Z-values were trun-cated at 3, due to the limited resolution of the randomization statistics, so the panels B and C are a conservative estimate of the real phase-locking-statistics. Note the similarity of the time-frequency response compared to Supplementary figures 1 and 3. Figure 5: The figure shows, analogously to supplementary figure 1 for very low frequen-cies, the total induced power in the gamma-band-range. In comparison to figure 2 (which is identical with supplementary figure 6) of the main manuscript (where the time-domain evoked field was subtracted from individual trials prior to frequency analysis) there are hardly any differences, except for the slight increase at lower frequencies around 40 Hz at approximately 100 ms post.stimulus. The comparison with supplementary figure 8, which shows the time-frequency-representation of the (non-bandpass filtered) evoked field con-firms that evoked power in these data is restricted to frequencies lower than approximate-ly 40 Hz. Hence, subtraction of the evoked field does not dramatically alter the time-frequency representation of induced power changes. Figure 6: Time-frequency-representation of induced power changes for the gamma-band in occipital channels – with the time domain evoked field subtracted from the raw data prior to frequency analysis (same method as used in supplementary figure 3 for low fre-quencies). The figure is identical to figure 2 in the original manuscript and is presented here for purposes of direct comparison. Comparison to supplementary figure 5 shows that there are no notable differences observable except the low-frequency alterations at 40 Hz and approximately 100 ms. Figure 7: Time-frequency-representation of induced power changes for the gamma-band in occipital channels – with the total power of the evoked field subtracted from the single trial estimates of time-frequency resolved power (same method as used in supplementary figure 2 for low frequencies). Here, the results of the two different methods of eliminat-ing the effect of the evoked field are very consistent (in contrast to low frequencies): the results of this method are almost undistinguishable from supplementary figure 6. Figure 8: Time-frequency representation of the power changes in the evoked field over occipital sensors. The figure shows that the evoked field is primarily concentrated in fre-quencies up to 40 Hz but not beyond. Note that the stimuli were small and peripherally
Hoogenboom, N., Schoffelen, J. M., Oostenveld, R., Parkes, L. M., Fries, P. (2006) Localizing human visual gamma-band activity in frequency, time and space. Neuroimage 29(3), 764-773. doi: 10.1016/j.neuroimage.2005.08.043
34
presented and that evoked gamma power has been shown to be strongly dependent on stimulus size and eccentricity. Figure 9: Relationship of gamma-band-power to the phase of ongoing and stimulus in-duced oscillations in lower frequency bands. This figure shows the statistical comparison (randomization statistics) of the empirically found coherence of the envelope of the gamma-band-amplitude with the raw signal in channels overlying occipital cortex against all signals with randomized phases. A: Time frequency-representation of Coherence of the gamma-band amplitude-envelope with the raw signal across occipital channels. B: Coherence values at 2 Hz and 200-400 ms poststimulus time for all occipital channel combinations of each hemisphere (left panel: left occipital channels, right panel: right occipital channels). Plotted are z-values which correspond to the p-values obtained from the randomization statistics. Figure 10: Same as figure 9 B, but now for individual subjects. Figure 11: Coherence between gamma-band-amplitude-envelope and the signal in the theta band (as previously identified by Lakatos et al. 2006 and 2008). Though no gamma-theta coherence was visible in figure 9 A, this could have been due to averaging over occipital channels. Here we show that in our data there is no such theta-gamma-amplitude-phase relationship in any of the occipital channels. Figure 12: This figure shows the difference of the intertrial-coherence value (see also supplementary figure 4) between fast and slow trials, for several channel groups. While clear differences are visible during the post-stimulus phase (especially around the time of the motor-response in sensorimotor-channels, likely attributable to the different latency of the motor-response for fast vs slow trials), no differences exist in the anticipatory phase.

Supplementary Figure 1
Total induced power changes
visotactile
-0.5 -0.4 -0.3 -0.2 -0.1 0 0.1 0.2 0.3 0.4 0.5
2
3
4
5
6
7
8
-8
-6
-4
-2
0
2
4
6
8
visual
-0.5 -0.4 -0.3 -0.2 -0.1 0 0.1 0.2 0.3 0.4 0.5
2
3
4
5
6
7
8
-8
-6
-4
-2
0
2
4
6
8
visotactile-visual
-0.5 -0.4 -0.3 -0.2 -0.1 0 0.1 0.2 0.3 0.4 0.5
2
3
4
5
6
7
8
-2
-1
0
1
2

visual EF subtracted
-0.5 -0.4 -0.3 -0.2 -0.1 0 0.1 0.2 0.3 0.4 0.5
2
3
4
5
6
7
8
-8
-6
-4
-2
0
2
4
6
8
visotactile EF subtracted
-0.5 -0.4 -0.3 -0.2 -0.1 0 0.1 0.2 0.3 0.4 0.5
2
3
4
5
6
7
8
-8
-6
-4
-2
0
2
4
6
8
visotactile-visual EF subtracted
-0.5 -0.4 -0.3 -0.2 -0.1 0 0.1 0.2 0.3 0.4 0.5
2
3
4
5
6
7
8
-2
-1
0
1
2
Induced power changes EF total power subtracted
Supplementary Figure 2

Induced power changes EF subtracted
Supplementary Figure 3
visual total power
-0.5 -0.4 -0.3 -0.2 -0.1 0 0.1 0.2 0.3 0.4 0.5
2
3
4
5
6
7
8
-8
-6
-4
-2
0
2
4
6
8
visotactile total power
-0.5 -0.4 -0.3 -0.2 -0.1 0 0.1 0.2 0.3 0.4 0.5
2
3
4
5
6
7
8
-8
-6
-4
-2
0
2
4
6
8
visotactile-visual total power
-0.5 -0.4 -0.3 -0.2 -0.1 0 0.1 0.2 0.3 0.4 0.5
2
3
4
5
6
7
8
-2
-1
0
1
2

-0.5 0 0.5
2
4
6
8
10
12
14
16
18
20
-0.3
-0.2
-0.1
0
0.1
0.2
0.3
0.4
-0.5 0 0.5
2
4
6
8
10
12
14
16
18
20
-0.5 0 0.5
2
4
6
8
10
12
14
16
18
20
0
0.5
1
1.5
2
2.5
3
Supplementary Figure 4
Phase resetting in occipital cortex -Intertrial coherence or phase-locking-factor
tactile stimulus onlyA
visuo-tactile stimulusB visual stimulus onlyC
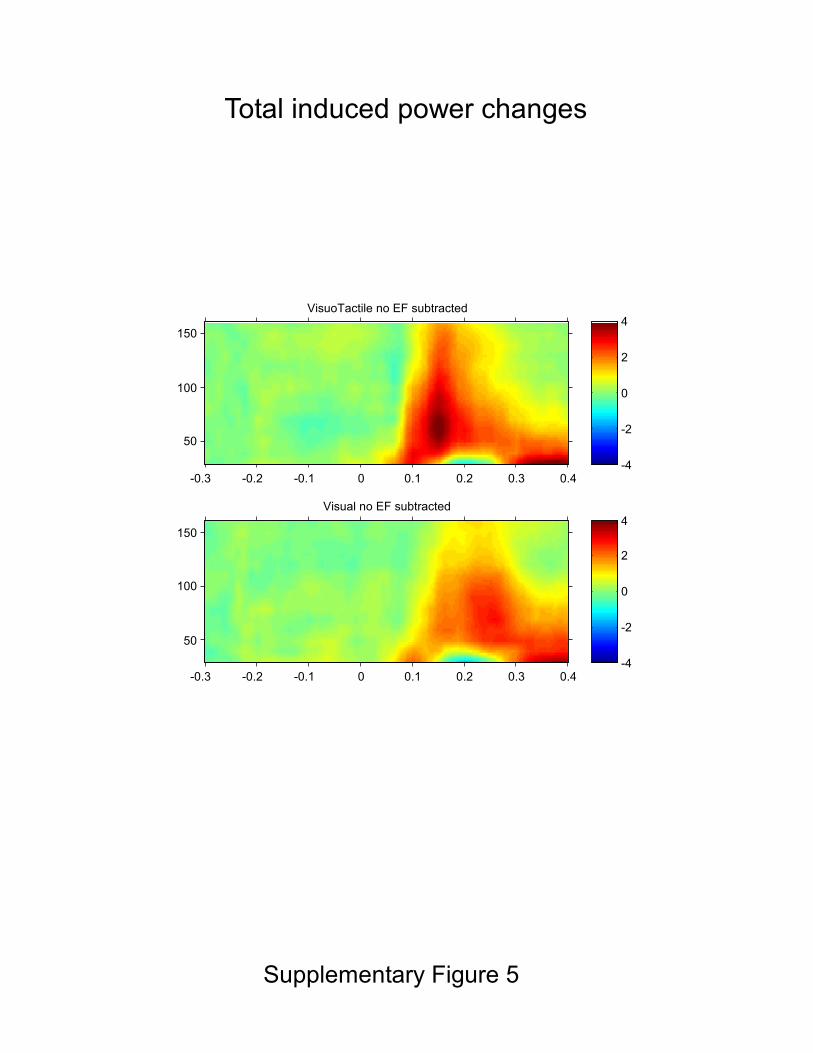
Supplementary Figure 5
Total induced power changes
VisuoTactile no EF subtracted
-0.3 -0.2 -0.1 0 0.1 0.2 0.3 0.4
50
100
150
-4
-2
0
2
4
Visual no EF subtracted
-0.3 -0.2 -0.1 0 0.1 0.2 0.3 0.4
50
100
150
-4
-2
0
2
4

Induced power changes raw EF subtracted
Supplementary Figure 6
VisuoTactile EF subtracted
-0.3 -0.2 -0.1 0 0.1 0.2 0.3 0.4
50
100
150
-4
-2
0
2
4
Visual EF subtracted
-0.3 -0.2 -0.1 0 0.1 0.2 0.3 0.4
50
100
150
-4
-2
0
2
4

Induced power changes EF pow subtracted
Supplementary Figure 7
VisuoTactile EFpow subtracted
-0.3 -0.2 -0.1 0 0.1 0.2 0.3 0.4
50
100
150
-4
-2
0
2
4
Visual EFpow subtracted
-0.3 -0.2 -0.1 0 0.1 0.2 0.3 0.4
50
100
150
-4
-2
0
2
4

Evoked power - TFR of EF
Supplementary Figure 8
VisuoTactile EF
-0.3 -0.2 -0.1 0 0.1 0.2 0.3 0.4
50
100
150
-2
-1
0
1
2
Visual EF
-0.3 -0.2 -0.1 0 0.1 0.2 0.3 0.4
50
100
150
-2
-1
0
1
2

Gamma envelope - Delta phase coherence
Supplementary Figure 9
-0.5 -0.4 -0.3 -0.2 -0.1 0 0.1 0.2 0.3 0.4 0.5
2
4
6
8
10
12
14
16
18
20
0
0.5
1
1.5
2
2.5
2.1
2.2
2.3
2.4
2.5
2.6
2.7
2.8
2.9
Average coherence between gamma-envelopeand raw signal averaged over occipital channels
Individual channel coherence between gamma-envelope and rawsignal at 2 Hz and 200 ms poststim
A
BLeft occipital Right occipital
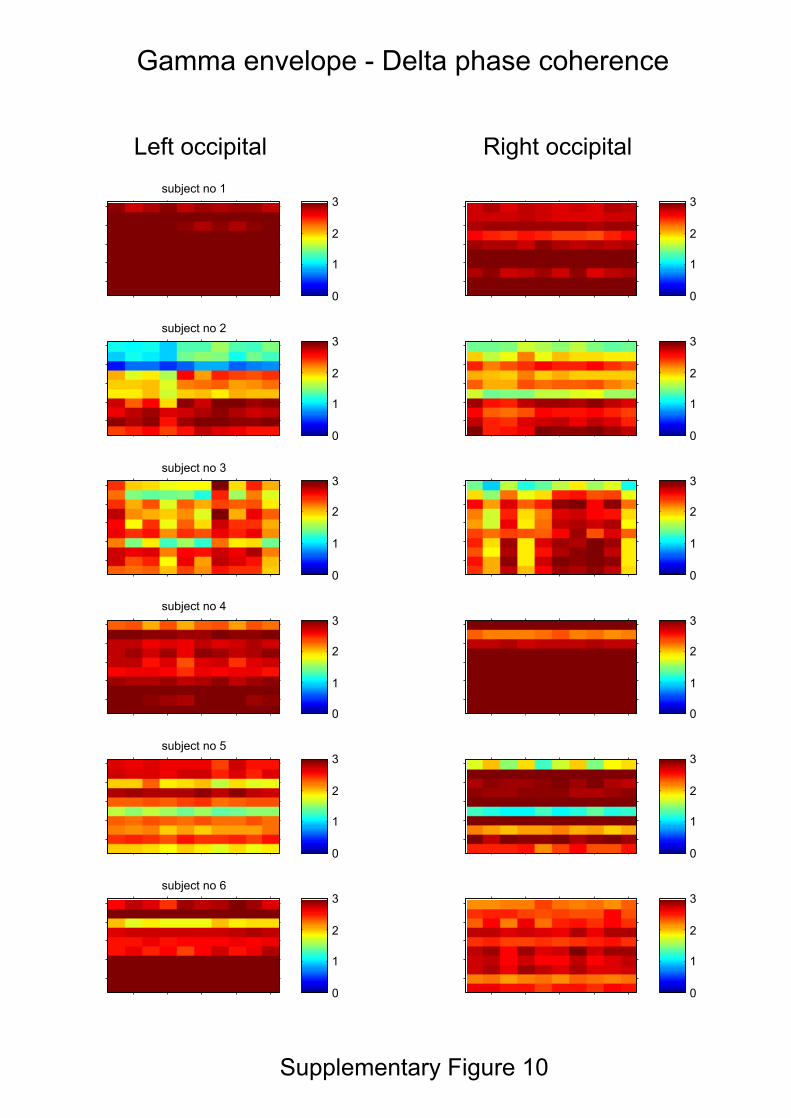
Gamma envelope - Delta phase coherence
Supplementary Figure 10
subject no 1
0
1
2
3
0
1
2
3
subject no 2
0
1
2
3
0
1
2
3
subject no 3
0
1
2
3
0
1
2
3
subject no 4
0
1
2
3
0
1
2
3
subject no 5
0
1
2
3
0
1
2
3
subject no 6
0
1
2
3
0
1
2
3
Left occipital Right occipital
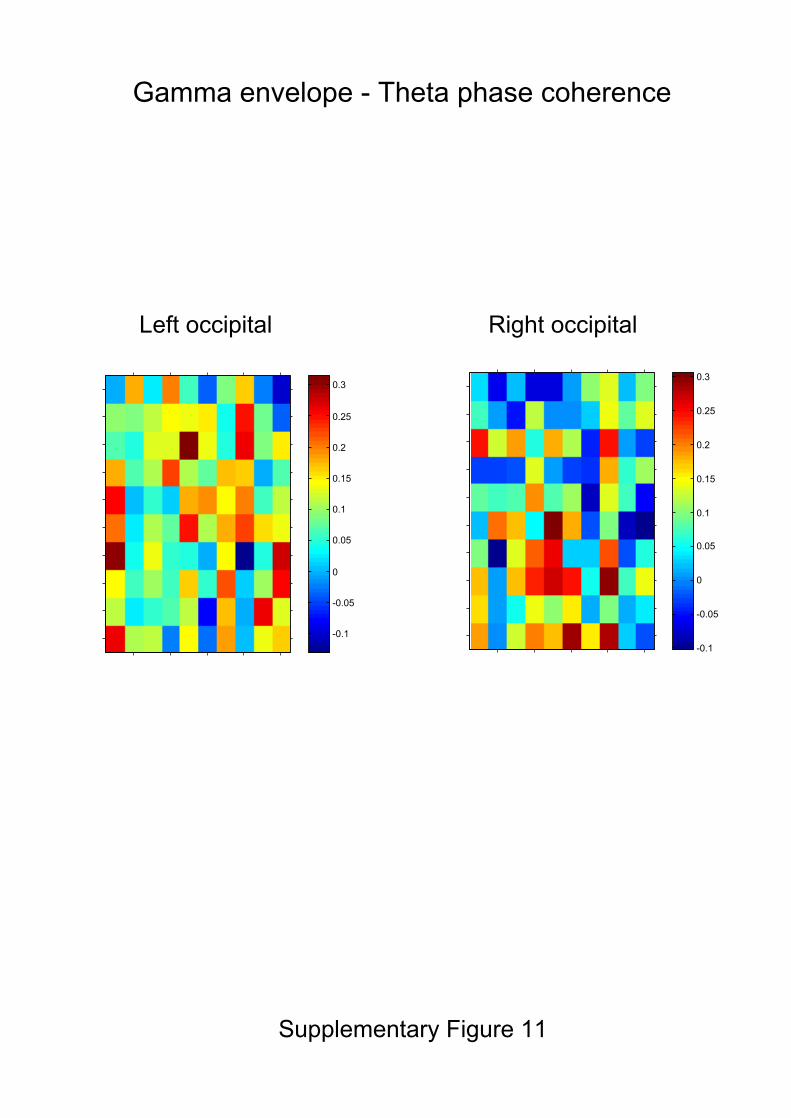
Gamma envelope - Theta phase coherence
Supplementary Figure 11
-0.1
-0.05
0
0.05
0.1
0.15
0.2
0.25
0.3
-0.1
-0.05
0
0.05
0.1
0.15
0.2
0.25
0.3
Left occipital Right occipital

Difference in stimulus-phaselocking between fastand slow trials
Supplementary Figure 12