Concept Mapping & Learning Styles - The ScholarShip at ECU
118
Abstract The Effect of Concept Mapping on Student Understanding and Correlation with Student Learning Styles by William G. Mosley May 1, 2013 Director: Dr. Elizabeth Doster Taft DEPARTMENT OF MATHEMATICS, SCIENCE, AND INSTRUCTIONAL TECHNOLOGY EDUCATION This study investigated the use of concept mapping as a pedagogical strategy to promote change in the learning styles of pre-nursing students. Students’ individual learning styles revealed two subsets of students; those who demonstrated a learning style that favors abstract conceptualization and those who demonstrated a learning style that favors concrete experience. Students in the experimental groups performed concept mapping activities designed to facilitate an integrative understanding of interactions between various organ systems of the body while the control group received a traditional didactic instruction without performing concept mapping activities. Both qualitative and quantitative data were collected in order to measure differences in student achievement. Analysis of the quantitative data revealed no significant change in the learning styles of students in either the control or experimental groups. Learning style groups were analyzed qualitatively for recurring or emergent themes that students identified as facilitating their learning. An analysis of qualitative data revealed that most students in the pre- nursing program were able to identify concepts within the class based upon visual cues, and a majority of these students exhibited the learning style of abstract conceptualization. As the laboratory experience for the course involves an examination of the anatomical structures of the human body, a visual identification of these structures seemed to be the most logical method to measure students’ ability to identify anatomical structures.
-
Upload
khangminh22 -
Category
Documents
-
view
1 -
download
0
Transcript of Concept Mapping & Learning Styles - The ScholarShip at ECU

Abstract
The Effect of Concept Mapping on Student Understanding and Correlation with Student
Learning Styles
by William G. Mosley
May 1, 2013
Director: Dr. Elizabeth Doster Taft
DEPARTMENT OF MATHEMATICS, SCIENCE, AND INSTRUCTIONAL TECHNOLOGY
EDUCATION
This study investigated the use of concept mapping as a pedagogical strategy to promote
change in the learning styles of pre-nursing students. Students’ individual learning styles
revealed two subsets of students; those who demonstrated a learning style that favors abstract
conceptualization and those who demonstrated a learning style that favors concrete experience.
Students in the experimental groups performed concept mapping activities designed to facilitate
an integrative understanding of interactions between various organ systems of the body while the
control group received a traditional didactic instruction without performing concept mapping
activities. Both qualitative and quantitative data were collected in order to measure differences in
student achievement. Analysis of the quantitative data revealed no significant change in the
learning styles of students in either the control or experimental groups. Learning style groups
were analyzed qualitatively for recurring or emergent themes that students identified as
facilitating their learning. An analysis of qualitative data revealed that most students in the pre-
nursing program were able to identify concepts within the class based upon visual cues, and a
majority of these students exhibited the learning style of abstract conceptualization. As the
laboratory experience for the course involves an examination of the anatomical structures of the
human body, a visual identification of these structures seemed to be the most logical method to
measure students’ ability to identify anatomical structures.


The Effect of Concept Mapping on Student Understanding and Correlation with
Student Learning Styles
A Thesis
Presented To
The Faculty of the Department of Mathematics, Science, and Instructional Technology
Education
East Carolina University
In Partial Fulfillment
of the Requirements for the Degree
Master of Arts in Science Education
by
William G. Mosley
May 1, 2013

©Copyright 2013
William G. Mosley

The Effect of Concept Mapping on Student Understanding and Correlation with
Student Learning Styles
by
William G. Mosley
APPROVED BY:
DIRECTOR OF THESIS:___________________________________________
Elizabeth Doster-Taft, PhD
COMMITTEE MEMBER:__________________________________________________
Frank Crawley, PhD
COMMITTEE MEMBER:__________________________________________________
Elizabeth Jones, PhD
CHAIR OF THE DEPARTMENT OF MATHEMATICS, SCIENCE, AND INSTRUCTIONAL
TECHNOLOGY EDUCATION:
________________________________________________
Susan Ganter, PhD
DEAN OF THE GRADUATE SCHOOL:
________________________________________________
Paul J. Gemperline, PhD

TABLE OF CONTENTS
LIST OF TABLES………………………………………………………………... vi
LIST OF FIGURES................................................................................................. vii
LIST OF ABBREVIATIONS…………………………………………………….
viii
CHAPTER 1: INTRODUCTION………..……………………………………….. 1
CHAPTER 2: REVIEW OF LITERATURE...........................................................
7
CHAPTER 3: METHODOLOGY………………………………………………... 16
CHAPTER 4: RESULTS…………………………………………………………. 27
Validity of Instruments…………………………………………………….. 27
Research Questions………………………………………………………… 32
Interview Results…………………………………………………………... 35
Interview Themes…………………………………………………………..
Analysis of Student Samples of Concept Maps…………………………….
CHAPTER 5: DISCUSSION……………………………………………………..
Research Questions…………………………………………………………
Discussion of Student Interviews…………………………………………..
Discussion of Concept Maps……………………………………………….
CHAPTER 6: CONCLUSIONS…………………………………………………..
47
47
64
64
68
69
70
REFERENCES........................................................................................................ 73
APPENDIX A: LESSON PLAN FOR ENDOCRINE/BLOOD…………………
APPENDIX B: IRB APPROVED INFORMED CONSENT FORM FOR
STUDY……………………………………………………………………………
APPENDIX C: UNIT ONE CONTENT SURVEY SCORING RUBRIC………
APPENDIX D: UNIT TWO CONTENT SURVEY SCORING RUBRIC………
75
78
79
81

APPENDIX E: UNIT THREE CONTENT SURVEY SCORING RUBRIC…….
APPENDIX F: INFORMED CONSENT FORMS FOR INTERVIEWS………
APPENDIX G: UNIT ONE CONTENT INTERVIEW PROTOCOL……………
APPENDIX H: UNIT TWO CONTENT INTERVIEW PROTOCOL…………
APPENDIX I: UNIT THREE CONTENT INTERVIEW PROTOCOL……….
APPENDIX J: INTRODUCTORY CONCEPT MAPPNG ACTIVITY……….
APPENDIX K: CONCEPT MAPPING ACTIVITY ONE………..……………
APPENDIX L: CONCEPT MAPPING ACTIVITY TWO………..……………
APPENDIX M: FINAL CONCEPT MAPPING ACTIVITY POWERPOINT...
APPENDIX N: PROTOCOL VIOLATIONS……………………………………
83
85
86
89
92
95
97
98
99
101

LIST OF TABLES
1. COMPARISONS OF STUDENT PERFORMANCE IN 2141 AND 2151 WITH
LEARNING STYLE…………………………………………………………………
4
2. TIMELINE OF DATA COLLECTION AND INSTRUMENT
ADMINISTRATION………………............................................................................
3. DATA SUMMARY OF ANOVA ANALYSIS OF CONCRETE
SUBSECTIONS OF LSIS AND SURVEYS………………………………………...
4. SUMMARY OF ANOVA ANALYSIS OF CONCRETE SUBSECTIONS OF
LSIS AND SURVEYS……………………………………………………………….
5. TUKEY HSD ANALYSIS OF ANOVA ANALYSIS OF CONCRETE
SUBSECTIONS OF LSIS AND SURVEYS………………………………………...
6. DATA SUMMARY OF ANOVA ANALYSIS OF ABSTRACT
SUBSECTIONS OF LSIS AND SURVEYS………………………………………...
7. SUMMARY OF ANOVA ANALYSIS OF ABSTRACT SUBSECTIONS OF
LSIS AND SURVEYS……………………………………………………………….
8. TUKEY HSD ANALYSIS OF ANOVA ANALYSIS OF ABSTRACT
SUBSECTIONS OF LSIS AND SURVEYS………………………………………...
9. DATA SUMMARY OF COMPARISONS OF ABSTRACT
CONCEPTUALIZERS……………………………………………………………….
10. T-TEST OF COMPARISONS OF ABSTRACT CONCEPTUALIZERS
ASSUMING UNEQUAL SAMPLE VARIANCES…………………………………
11. DIFFERENCES OF SCORES ON THE ABSTRACT
CONCEPTUALIZATION SUBSECTION BETWEEN GROUPS………………….
12. DIFFERENCES OF SCORES ON THE CONCRETE EXPERIMENTATION
SUBSECTION BETWEEN GROUPS……………………………………………….
13. FREQUENCIES OF THEMES THAT STUDENTS ATTRIBUTED THEIR
UNDERSTANDING OR A LACK OF UNDERSTANDING GROUPED BY
ACHIEVEMENT LEVEL……………………………………………………………
14. COMPARISON OF LEARNING STYLE CHANGES OBSERVED IN
CONTROL AND EXPERIMENTAL GROUPS…………………………………….
19
29
29
29
31
31
32
33
33
35
35
47
68

LIST OF FIGURES
1. INTRODUCTORY CONCEPT MAPPING ACTIVITY STUDENT WORK
SAMPLE OF AVERAGE-PERFORMING, ABSTRACT
CONCEPTUALIZATION STUDENT...................................................................
48
2. INTRODUCTORY CONCEPT MAPPING ACTIVITY STUDENT WORK
SAMPLE OF HIGH-PERFORMING, ABSTRACT CONCEPTUALIZATION
STUDENT...............................................................................................................
3. INTRODUCTORY CONCEPT MAPPING ACTIVITY STUDENT WORK
SAMPLE OF HIGH-PERFORMING, MEDIAN LEARNING STYLE
STUDENT...............................................................................................................
4. FIRST CONCEPT MAPPING ACTIVITY STUDENT WORK SAMPLE OF
LOW-PERFORMING, ABSTRACT CONCEPTUALIZATION STUDENT ......
5. FIRST CONCEPT MAPPING ACTIVITY STUDENT WORK SAMPLE OF
AVERAGE-PERFORMING, ABSTRACT CONCEPTUALIZATION
STUDENT...............................................................................................................
6. SECOND CONCEPT MAPPING ACTIVITY STUDENT WORK SAMPLE
OF HIGH-PERFORMING, ABSTRACT CONCEPTUALIZATION STUDENT
7. SECOND CONCEPT MAPPING ACTIVITY STUDENT WORK SAMPLE
OF AVERAGE-PERFORMING ABSTRACT CONCEPTUALIZATION
STUDENT...............................................................................................................
8. SECOND CONCEPT MAPPING ACTIVITY STUDENT WORK SAMPLE
OF HIGH-PERFORMING, MEDIAN LEARNING STYLE STUDENT .............
9. FINAL CONCEPT MAPPING ACTIVITY STUDENT WORK SAMPLE OF
AVERAGE-PERFORMING, ABSTRACT CONCEPTUALIZATION
STUDENT...............................................................................................................
10. FINAL CONCEPT MAPPING ACTIVITY STUDENT WORK SAMPLE
OF HIGH-PERFORMING, MEDIAN LEARNING STYLE STUDENT .............
11. FINAL CONCEPT MAPPING ACTIVITY STUDENT WORK SAMPLE
OF LOW-PERFORMING, ABSTRACT CONCEPTUALIZATION STUDENT
50
51
53
54
56
57
59
61
62
63

LIST OF ABBREVIATIONS
VARK Visual, Auditory, Read-write, and Kinesthetic ............................................ 9
CE Concrete Experience ................................................................................... 9
RO Reflective Observation ............................................................................... 9
AC Abstract Conceptualization ......................................................................... 9
AE Active Experimentation .............................................................................. 9
IRB Institutional Review Board ......................................................................... 18
LSI Learning Style Inventory ............................................................................ 20
P1LSI Phase I Learning Style Inventory ................................................................ 21
P2LSI Phase II Learning Style Inventory ............................................................... 21
HSD Honestly Significant Difference .................................................................. 28
A to C Abstract to Concrete ................................................................................... 68
A to M Abstract to Median ..................................................................................... 68
C to A Concrete to Abstract ................................................................................... 68
C to M Concrete to Median .................................................................................... 68
M to A Median to Abstract ..................................................................................... 68
M to C Median to Concrete .................................................................................... 68
RF Relative Frequency ..................................................................................... 68
SCOS Standard Course of Study ........................................................................... 75
NSES National Science Education Standards ........................................................ 75
A&P Anatomy & Physiology .............................................................................. 76
PTH Parathyroid Hormone ................................................................................. 79
GI Gastrointestinal........................................................................................... 81
HCl Hydrochloric Acid ...................................................................................... 81
FSH Follicle Stimulating Hormone ..................................................................... 99

LH Luteinizing Hormone .................................................................................. 99

The Effect of Concept Mapping on Student Understanding and Correlation with Student
Learning Styles
Despite educators’ efforts to carefully plan and implement instruction, it is a common
occurrence that not all students will develop a rich understanding of scientific concepts
introduced in university classrooms. When students are not successful in learning course
curriculum, the difficulty may be attributed to factors associated with the students, the instructor,
and/or the content. This study seeks to evaluate the use of concept mapping as a pedagogical
strategy to enhance student achievement. In doing so, this study also seeks to evaluate if concept
mapping is more effective for students of a particular learning style, as measured by the Kolb
Learning Style Inventory. Specifically, student responses to the Kolb Learning Style Inventory
were evaluated to determine if a student was closer to being identified as an abstract or concrete
learning style student.
A study by Binder, Westbury, McKiernan, Possing, and Medler (2005) indicated there
are distinct brain regions that are activated during concrete word processing that are less active
during the processing of abstract concepts. These findings indicate that there are biological
differences in the thought processes of abstract and concrete learners. Some learners may be
more capable of thinking of concrete or abstract terms because of increased activity, usage, or
development of particular region of the brain.
A meta-study by Hartman (2001) indicated that many students have difficulty learning
the health sciences because the discipline requires students to incorporate discreet concepts into a
holistic conceptual framework. The findings of the meta-study encourage metacognitive

2
strategies, like concept mapping, to enhance teaching practices and student learning, with
particular regard to the acquisition of concepts and the relationships between them.
Concept mapping can address the problem of discrepancies in abstract versus concrete
learning and logical disconnects in course material by facilitating the integration of concrete
concepts into an abstract framework, therefore benefitting both types of students. A study by
Karns (2006) indicated that active learning strategies are effective for students of all learning
styles. A study by Harpaz, Balik, and Ehrenfield (2004) reported that both students and
instructors indicated that concept mapping had a positive effect on student learning outcomes by
helping students to organize concepts in a theoretical framework, changing students into active
rather than passive learners, and in helping students find connections between concepts. Concept
mapping can not only function as an active learning tool but also serves to visually illustrate
student conceptions (Novak and Gowan, 1984). Bandura (1989) also found that concept mapping
facilitates student learning and performance by promoting encoding of information from short
term memory to long term memory.
The purpose of this study is to determine if concept mapping, regardless of student
learning style, is a constructive instructional strategy to address the problem of poor student
performance in developing an understanding of the relationships between biological concepts.
Professors and teaching assistants in the Department of Biology of a medium-sized southeastern
university have observed that relatively few students perform well (having a grade of 90 or
higher) in both the first and second sections of a two semester sequence course in anatomy and
physiology laboratory.

3
The few students who perform well in both sections tend to be very high achievers with
an overall average of 95% or greater. However, some students perform well in the first section of
the course but perform poorly in the second section of the course, while others perform well in
the second section of the course but perform poorly in the first section. This discrepancy in
student performance may be attributable to the fact that much of the material covered in the first
section of the course is highly concrete in nature and focuses on the identification of anatomical
structures, whereas the material covered in the second course is relatively more abstract and
involves an understanding of the human body as a holistic system with complex interacting
subsystems that maintain homeostasis.
For students studying the health sciences, a basic, concrete-level understanding of the
anatomical structures and their corresponding physiological functions is insufficient for the level
of care they are expected to provide their future patients, just as understanding a general
overview of how organ systems interact but having no knowledge of the structures involved is
insufficient. Without an understanding of the organ systems of the body, the structures that
comprise them, and the functions of those structures, a student in the health sciences program
will be unable to operate successfully in a clinical or laboratory setting.
When this discrepancy in student understanding was discovered by the investigator, a
pilot study was launched in the spring of 2011 to determine the learning styles of students who
perform well in both courses and students who perform well in one section of the course but not
the other (see Table 1). The results of the pilot study indicated that those students who perform
well in the first section of the course have a predominantly concrete learning style. Students who
have a concrete learning style are characterized by their ability to readily memorize, identify, and

4
describe concepts. The results of the pilot study also indicated that those students who perform
well in the second section of the course frequently have a more abstract learning style. Students
exhibiting an abstract learning style are characterized by their ability to readily delineate
relationships, develop hierarchies, and understand the interrelations between concepts.
Interestingly, those students who perform well in both sections of the course tended to not only
be very high-performing students, but also exhibited characteristics of both learning styles, that
is hereafter referred to as a median learning style (Mosley, 2011).
Table 1. Comparisons of Student Performance in 2141 and 2151 with Learning Style
Student 2141 Grade 2151 Grade
Learning
Style
TC 84 91 Abstract
EF 96 96 Median
HL 96 89 Concrete
AW 93 92 Concrete
EW 94 80 Concrete
SE 84 93 Median
JF 90 87 Concrete
BH 73 75 Concrete
EK 97 95 Median
AK 85 83 Concrete
AP 88 86 Concrete
TP 89 93 Concrete
MS 76 78 Concrete
LW 79 72 Concrete
AW 80 87 Abstract
The pilot study was conducted in order to identify a potential rationale for the
discrepancy in student achievement and to suggest a manner to improve instruction to alleviate
the discrepancy in achievement between the two courses. The discrepancy in student
performance was confirmed by the achievement level of students who exhibit grade

5
inconsistencies between the first section of the course and the second section of the course (or
vice-versa). The fact that this tendency is exhibited by many students indicates a problem with
the course material, the instructor, or other factors.
The discrepancy in student performance is a significant issue because health science
students must understand concrete anatomical structures and their corresponding functions as
well as have an abstract understanding of the interactions between the various anatomical
structures in the human body. The hypothesis of the study speculates that the arising problem is
reflected by a disconnect in the flow of ideas between the two courses. The disconnect occurs
when a student with a primarily concrete learning style is challenged with learning abstract
concepts such as the interactions between organ systems of the body. A disconnect also occurs
when a student with a primarily abstract learning style is asked to group concrete concepts within
their existing abstract framework.
The hypothesis of this study is that despite predominant learning styles, anatomy and
physiology students who use concept mapping as an instructional tool will have higher
achievement on course measures than their counterparts who do not. If so, then students who
engage in concept mapping as a learning tool should assume a more median learning style that
will facilitate their understanding of both concrete concepts and the relationships between those
concepts in an abstract framework.
The implications of this study are twofold. First, as this study will examine the
effectiveness of a specific instructional strategy on student achievement within an anatomy &
physiology laboratory course, any findings on the effectiveness of this strategy could be applied
to other science courses. Findings many also apply to any number of courses that require

6
students to integrate concrete scientific concepts within an abstract framework. Second, this
study will examine if a student’s learning style can be modified by the use of concept mapping as
an instructional strategy. If it is found to be so, then this study may challenge the notion that
learning styles can be changed only over extended periods of time.
The research questions addressed in this study are: 1.Does concept mapping increase
student achievement on understanding concrete concepts in abstract-learning style students;
2.Does concept mapping increase student achievement on understanding abstract concepts in
concrete-learning style students; and 3.Does the use of concept mapping change students’
learning style over a relatively short period of time?
To address the research questions, the population of students enrolled in the anatomy &
physiology laboratory course had to be divided into sample groups. There were three control
groups and three experimental groups. Data were collected in the form of unit surveys that were
used to determine student understanding of abstract and concrete concepts relating to the course
material, student self-reported learning style as determined by the Kolb Learning Style
Inventory, student grades on formative assessments as well as overall student grade, work
samples, and interviews. Students in the experimental groups also used a concept mapping
routine developed by the researcher which was designed to holistically integrate concepts from
various lessons. Those concept maps were scored and examined by the researcher for various
themes.

Review of Literature
A pilot study was launched to determine the learning styles of students who perform well
in both courses, students who perform well in the first section to perform poorly in the second
section, and students who perform well in the second section but perform poorly in the first
section. The results of this pilot study indicated that those students who performed well in the
first section of the course have a concrete learning style. A concrete learning style is defined as a
learning style that can readily memorize, identify, and describe concepts. The results of this pilot
study also indicated that those students who perform well in the second section of the course
frequently have a more abstract learning style. An abstract learning style is defined as a learning
style that can readily delineate relationships, develop hierarchies, and understand the
interrelations between concepts. Those students whom performed well in both sections of the
course were found to not only be very high-performing students, but also exhibited
characteristics of both learning styles, that is referred to as a median learning style (Mosley
2011).
In the review of literature, findings indicate that a student’s learning style can influence
their ability to learn and acquire concepts. There are various methods facilitating categorization
of student learning styles, but each has its own advantages. Kolb’s model of learning styles is
used as a diagnostic instrument in this study because it fits closely with the abstract vs. concrete
thinking spectrum addressed in this study. There is a biological distinction in the processing of
abstract and concrete words and concepts and that biological difference provides evidence that
student thinking patterns are an inherent trait (Binder et. Al, 2005). In order for students to
acquire and categories concepts with that they are unfamiliar or uncomfortable, they must be
8
aware of their thinking. Student awareness of their own thinking patterns is important in order to
evoke change in those thinking patterns. In order for those thinking patterns to change, learning
should be made meaningful. Concept mapping is an instructional tool that has been shown to
promote meaningful learning. Concept mapping benefits students by encouraging them to find
the connections between concepts and encouraging them to participate in active rather than
passive learning (Novak & Gowan, 1984). Concept mapping is beneficial to instructors because
it can serve as a diagnostic assessment for students, an illustration of student thinking patterns,
and serves as a powerful instructional tool (Clayton, 2006). It is the one of the hypotheses of this
study that concept mapping will facilitate changes in student learning style.
Tsai and Thomas (2011) indicated that student's learning style (whether concrete or
abstract) and their critical thinking skills can influence their ability to recall information,
especially if that information is presented in a coherent manner. They found that concrete
learners attribute equal importance to all information acquired rather than prioritizing the relative
importance of the information. In contrast, abstract learners place primary importance on central
concepts, and attribute importance to secondary concepts if the students' judgment determined
them to be significantly important. These results are applicable to this study because the results
delineate the reasons as to why abstract and concrete learners place the relative importance on
concepts taught in a typical lesson.
Abstract and concrete learners exhibit distinct thinking patterns and indeed use discreet
regions of their brain for processing. Binder et. Al (2005) found that while both concrete and
abstract words activate an area of the brain associated with linguistic processing, concrete words
activate the angular gyrus and dorsal portion of the prefrontal lobe in both hemispheres.

9
Interestingly, abstract words activate only the left hemisphere’s inferior frontal lobe regions
associated with linguistic working memory. This study asserts that there are distinct modes of
thinking activated in processing concrete and abstract words and provides a neurological basis
for distinguishing concrete and abstract thinking processes.
There are various methods of attempting to categorize learning styles including, but not
limited to: Kolb's model of learning styles (1984); the well-known Fleming VARK (Visual,
Auditory, Read-write, and Kinesthetic) model (Fleming and Mills 1992); and Honey and
Mumford's model (1982). These three models of learning styles are the most common in use
today and each has its advantages. Kolb’s model asks the person of interest to rate the methods in
that they learn best; requiring a degree of understanding of one’s thinking processes. Kolb’s
model was further refined by Honey and Mumford to survey the behaviors exhibited by the
person of interest rather than by asking them how they best learn. By far the most common
learning style model is Fleming’s VARK model. Fleming’s VARK model is commonly used
because of the ease of administration of a diagnostic survey to students.
Out of all learning style inventories, Kolb’s model of learning information on an abstract
conceptualization to a concrete experience spectrum is unique and was selected for the study as
an instrument to determine the students who have an abstract learning style or a concrete
learning style. Kolb’s model of learning styles was developed in 1982 and asserts that there are
four distinct modes of thinking: concrete experience (CE), reflective observation (RO), abstract
conceptualization (AC), and active experimentation (AE). The learning style of an individual is
determined by the extent to that they rely on each of the four modes of thinking, with generally
two modes being dominate, leading to a distinct learning style: converger (AC-AE), diverger

10
(CE - RO), assimilator (AC-RO), and accommodator (CE-AE). Convergers are able to find the
practical applications for abstract concepts. Divergers are able to see multiple points of view in
concrete experiences. Assimilators prefer to take abstract ideas and arrange them into logical
forms. Accommodators learn best thorough doing, rather than thinking (Kolb, 1984). Kolb’s
learning style inventory is relevant to this study because it will help to classify students as one of
four types of learners and student scores on the Learning style Inventory will be correlated with a
student’s learning style being either abstract or concrete.
Metacognition plays a minute role in the study because in order for an individual to
understand their own concrete and abstract modes of thinking, they must be able to understand
the methods in that they process information. This process is referred to by many as
metacognition. Metacognition allows a student to develop an awareness of their thinking and
learning processes and to become an active, rather than passive, learner. Hartman (2001)
examined the effect of metacognitive strategies in the enhancement of instruction and learning in
science courses. Hartman found that metacognition by the learner allows the development of
learning strategies effective for the student to understand difficult concepts. One such
metacognitive strategy explored was concept mapping. Hartman found that concept mapping
promotes meaningful learning by understanding the hierarchical organization of concepts.
Concept mapping has its roots in constructivism, which is the epistemological theory that
postulates learning is a student-centered active process of knowledge construction.
Constructivism began as a psychological theory by Vygotsky, who proposed that an individual’s
understanding of the world is framed by their experiences. Constructivism was expanded in the
work of Jean Piaget, a Swiss developmental psychologist whose theories on cognitive

11
development led to the espousal of various epistemological theories on learning and
understanding (Piaget, 1977). The work of Piaget is pertinent because it characterizes the
cognitive processes that students experience during acquisition of new concepts.
Following Piaget, there were many epistemologists to embrace his works and evolve his
propositions into various theories. One such philosopher was David Ausabel, who developed a
cognitive learning theory that postulated that learning only occurs when it is made meaningful to
the learner. Meaningful learning is defined as a student integrating new concepts into what the
student already knows, thereby incorporating the new information into their existing conceptions
(Ausabel, 1962). It has been found that students in a constructivist, theory-based learning
environment are more aware of their role as a learner and therefore have greater motivation to
understand essential concepts than students in a conventional learning environment (Gijbels et.
Al, 2006). The work of Ausabel and Gijbels informs the study because it concluded that there are
pedagogical methods that can enhance student learning.
Novak and Gowan (1984) applied the theories of Ausabel to education in their
development of concept mapping. Concept mapping is a pedagogical and learning method that
allows a learner to create a visual representation of new information in an attempt to integrate
that information into their knowledge structures. Concept mapping as a learning strategy
involves creating relationships between concepts proceeding from a general, broad abstraction to
how specific, tangible concepts are interrelated with those abstractions. This allows for
meaningful learning to occur as a student attempts to integrate new, unknown concepts in a
broad, general hierarchy generated from their prior understanding of the topic (Akinsanya &
Williams, 2004).

12
Bandura (1989) found that concept mapping facilitates student learning and performance
due to the vast amount of concepts covered in the traditional classroom that must be encoded in
order for learning to take place. Bandura’s findings are important to the study because they
suggest a mechanism through that concept mapping can facilitate learning. He proposed that
concept mapping facilitates learning outcomes by promoting encoding of information from short
term memory to long term memory. According to Bandura's social cognitive theory, this
encoding is accomplished by making the information significant in a cognitive representation
rather than the information itself.
In a study by Harpaz (2004), the perceived effects of concept mapping were examined
from both student and instructor viewpoints. They found that:
Students report that concept mapping "encourages them to think independently,
increased orientation in knowledge and in finding connections between the different
areas, (and) gave them more confidence in implementing their knowledge in clinical
work" (Harpaz, 2004, p.30).
Teachers report that concept mapping "helped organize the theoretical material in
an integrative way, changed the student from a passive learner to an active one, enabled
evaluation of a students' knowledge, (and) improved evaluation of the student's safety in
the clinical environment" (Harpaz, 2004, p.30).
While it may be intuitively plausible, there have been no specific studies on the use of
concept mapping on the development of specific abstract and concrete learning skills. There have
been several studies that measure the effect of concept mapping on student performance. In a
2006 meta-analysis of concept mapping studies, Clayton concluded that there were three major

13
themes that were prevalent in the literature: "1.Concept mapping results in generally positive
effects on academic performance; 2. Concept mapping improves students' critical thinking
abilities; 3. Concept mapping serves as an appropriate teaching method." In a meta-analysis by
Daley and Torre (2010), they found that concept mapping functioned to enhance student learning
in four ways: I. by promotion of student learning; II. By providing a resource for learning; III. by
enabling instructors to provide feedback, and IV. by conducting assessment. Most studies
conclude that concept mapping is not only an effective tool in enhancing student learning, but it
can also serve as a valuable diagnostic tool for instructors to explore students' understanding of
concepts.
In a study that explored concept mapping as a tool for illustrating students' developing
conceptions of course material, Kinchin, Hay, and Adams (2000) had middle grades science
students construct concept maps of scientific concepts relating to plant ecology. In their analysis
of student concept maps, they distinguished between three main types of concept maps: spoke,
chain, and net styles. The spoke style of concept map has concepts linked to a central concept but
with little or no linkages between peripheral concepts, that indicates an incomplete
understanding of the relationships between the subject matter concepts. The chain style of
concept map is a characteristic linear map with a logical sequence that demonstrates an ordinal
approach to understanding of the concepts rather than a hierarchical understanding. The net style
of concept mapping is the most cognitively sophisticated and implies that a student has a
thorough understanding of concepts, the hierarchical relationships between them, as well as the
interconnectedness of the concepts through a variety of cross-links. These results are appropriate
for the study because they indicate that the visual representation of a student’s concept map can
provide insight into the student’s knowledge structure.

14
While concept mapping has been shown to be effective as an instructional and
assessment tool, there have been studies that indicate that a student’s ability to construct a
concept map is not correlated with any particular learning style. The findings of a meta-study by
Laight (2004) indicate that there is no preference between a student’s use of concept mapping
and the student’s learning style. However, according to Laight: "The findings of this study
support the conclusion that a complex learning strategy, such as concept mapping, can be
effective for students with all kinds of learning style preferences" (p.230). This is applicable to
the study at hand because it indicates that all students, regardless of preferred learning style,
could potentially find concept mapping to be beneficial in instruction.
The use of concept mapping to modify or enhance student learning style (i.e. to help both
concrete and abstract learners develop their weaker spectrum of learning style), has not been
explored. Studies have explored the possibility that student learning styles may change over
time. Rakoczy and Money (1995) examined learning styles of nursing students and the change in
those learning styles over a three year period. Overall, the majority of students tested annually
were assimilators, and that pattern remained consistent throughout the three-year period of the
study. There was a slight change, but the difference was insignificant.
The problem at the center of the study is a discrepancy in student knowledge structure of
concepts covered in the first and second sections of a course of anatomy and physiology
laboratory. A pilot study determined the discrepancy in student knowledge structure to be the
result of concept acquisition and understanding. Results of the pilot study indicated that those
students who performed well in the first section of the course have a predominantly concrete
learning style and those students who perform well in the second section of the course frequently

15
have a more abstract learning style. Those students who performed well in both sections of the
course were found not only be very high-performing students, but also exhibited characteristics
of both learning styles, that is referred to as a medium learning style (Mosley 2011). There are
various methods of attempting to categorize learning styles, but Kolb’s model is the most
commonly used with four distinct learning styles: converger, diverger, assimilator, and
accommodator (Kolb, 1984). Each learning style has various strengths and weaknesses, with
some learning styles being more adept at the acquisition of concrete concepts and other learning
styles being more adept at the acquisition of abstract concepts. In the processing of abstract and
concrete words, neurological studies have shown that differing brain regions are activated,
providing a physiological basis for the distinction between abstract and concrete thinking. To
promote changes in student thinking and encourage active learning, strategies such as concept
mapping have been explored as an instructional tool to promote metacognition. Metacognition
encourages students to examine their thinking processes as an introductory step in a sequence of
processes designed to promote changes in student thinking. Concept mapping may facilitate
changes in thinking processes because it not only assists in the encoding of information from
short-term memory to long-term memory (Bandura 1989) but also facilitates student learning by
encouraging the student to assign meaning and value to concepts and to organize those concepts
into a theoretical framework.

Methodology
The focus of this study is the discrepancy in student performance in laboratory courses of
human anatomy and physiology. In an attempt to reduce that discrepancy in performance,
concept mapping was explored as a pedagogical method to enhance student understanding and
achievement. The study’s purpose was to determine the effects of the concept mapping activities
on students’ learning of concepts in the anatomy & physiology laboratory. The research design
incorporates a pragmatic parallel mixed-methods approach (Mertens, 2010). A pragmatic parallel
mixed-methods approach was chosen for this study because data were collected through both
quantitative and qualitative methodologies at three time points during the semester.
The research questions to be addressed were threefold:
1. Does the use of a concept mapping routine increase concrete concept acquisition in
students identified as having an abstract learning style?
2. Does the use of a concept mapping routine increase abstract concept acquisition in
students identified as having a concrete learning style?
3. Does the use of a concept mapping routine change student learning styles?
Answering the research questions involved the creation of groups from amongst a sample
of students. The sample for this study included students enrolled in an Anatomy & Physiology
Laboratory course during the fall semester of 2011 at a medium sized university in the
southeastern United States. This sample is a convenience sample because it consists of those
students who consented to participate. The typical student is a female undergraduate, health
professions major (although there are exceptions) in her sophomore year at twenty years of age.

17
The Anatomy & Physiology Laboratory course had seven sections consisting of a maximum of
24 students each. The sample was then divided into control and experimental course sections in
order to determine the effects of experimental treatments. There were three course sections in the
control group and three course sections in the experimental group. One section was not used for
the study as there was no baseline for the graduate teaching assistant’s performance as an
instructor. The remaining six sections consisted of a total of 129 students, with 63 students in the
control group and 66 students in the experimental group. The treatments applied were concept
mapping activities.
As the university assigns instructors to course sections, it is not in the investigator's
power to assign students or instructors to particular groups. Control groups were assigned to a
single graduate teaching assistant who instructed all three groups. The three experimental groups
were assigned to two instructors, with one section being taught by the investigator, and two
sections being taught by a graduate teaching assistant. Those instructors that were chosen for the
study were chosen because of prior teaching experience with this class, acceptable student
opinion of instruction data, and a consistent distribution of student grades.
In order to insure consistency in course content between different sections, lesson plans
included a diagnostic assessment at the beginning of the lesson to determine the student’s pre-
existing knowledge, a common lecture PowerPoint, extension activities for each lesson
(including concept mapping activities for experimental groups and self-study times for control
groups), as well as a common quiz used as a formative assessment administered at the end of
every lesson. Lesson plans were developed for every lesson. An example lesson plan is included
as Appendix A. In order to minimize variability in grading, the researcher was responsible for

18
grading all assignments of all students enrolled in the course. To ensure fidelity in the delivery of
the lesson plan, the lectures were recorded with an audio device and then screened by the
researcher with an observation protocol to verify that all activities were completed.
In order to conduct this study, approval of the University Institutional Review Board
(IRB) was received on October 11, 2011. The research study was eligible for expedited review
because the collection of data from voice, video, digital, or image recording made for research
purposes and research on individual or group characteristics or behavior (including, but not
limited to, research on perception, cognition, motivation, identity, language, communication,
cultural beliefs or practices, and social behavior) or research employing survey, interview, oral
history, focus group, program evaluation, human factors evaluation, and quality assurance
methodologies. The chairperson of the IRB deemed this unfunded study presented no more than
minimal risk requiring a continuing review at 12 months. Changes to this approved research
could not be initiated without IRB approval except when necessary to eliminate an apparent
immediate hazard to the participant. All anticipated problems involving risks to participants and
others were promptly reported to the IRB, but no such problems were incurred. The investigator
must submit a continuing review\closure application to the University institutional review board
prior to the date of study expiration. The chairperson of the IRB does not have a potential for
conflict of interest on this study.

19
Table 2. Timeline of Data Collection and Instrument Administration
Week
Group
Oct. 12 –
Oct. 14
Oct. 17 –
Oct. 21
Oct. 31 –
Nov. 4
Nov. 7 –
Nov. 11
Nov. 14 –
Nov. 18
Nov. 28 –
Dec. 2
Dec. 5 –
Dec. 9
Control
Group
-Consent
Forms
-U1
Content
Survey
-P1LSI
-Intro
Concept
Mapping
Activity
-U1
Content
Survey
Interview
s
-U2
Content
Survey
-U2
Content
Survey
Interview
s
-U3
Content
Survey
-P2LSI
-U3
Content
Survey
Interview
s
Experime
-ntal
Group
-Consent
Forms
-U1
Content
Survey
-P1LSI
-Intro
Concept
Mapping
Activity
-U1
Content
Survey
Interview
s
-U2
Content
Survey
-First
Concept
Mapping
Activity
-U2
Content
Survey
Interview
s
-Second
Concept
Mapping
Activity
-Third
Concept
Mapping
Activity
-U3
Content
Survey
-P2LSI
-U3
Content
Survey
Interview
s
An informed consent form for the study (Appendix B) was distributed to all students who
were present during the week of October 12-14 (see table 2). Students were instructed to sign the
first signature line to signify they were aware the study was occurring. Students were then
instructed to only sign the second signature line to signify their consent and willingness to
participate in the study. Students who consented agreed to participate in the study, to have their
completed class work and grades submitted as data, and consented to complete the surveys that
measure their understanding of abstract and concrete concepts delivered in the course of
instruction. Students who did not consent were not included in the study and were allowed to
leave the classroom before administration of the group surveys. If students were enrolled in

20
course sections that had been assigned as experimental groups and did not consent, during the
concept mapping activities those students were moved to a different classroom and allowed to
self-study using anatomical diagrams and models (similar to the control groups).
Data were collected in the form of surveys that were used to determine student
understanding of concrete and abstract concepts relating to the course material (surveys), student
self-reported learning style as determined by the Kolb Learning style Inventory (LSI) version
3.1, student grades on formative assessments as well as overall student grade, work samples, and
interviews. Student grades were used as measures of concept acquisition by the students. To
minimize intergroup variability in grades, the researcher was responsible for grading all work of
all students in all sections. Student work samples were selected by the researcher exemplifying
particular learning styles and traits.
The surveys were developed by the researcher to measure student acquisition of both
abstract and concrete concepts relating to the course material. All surveys were administered
under the supervision of the researcher with the exception of the unit 2 content survey that was
administered to Section 006, one of the sections of the control group. Students were given one
minute to answer each question and at the completion of the 10-minute time frame, students were
required to hand in all materials. Each survey had a corresponding PowerPoint presentation that
contained images or information used in the identification of concrete concepts relating to the
course material. To minimize variability, the researcher created a grading rubric and took
responsibility for scoring all surveys with one point being given for each correct answer. Odd-
numbered questions on the survey asked students to name structures or identify functions of
anatomical features, requiring the student to understand concrete concepts. This data should be

21
considered a measure of student acquisition of concrete concepts. Even-numbered questions
asked students to identify how one particular system, structure, component, or pathology of the
human body interacts with another system, structure, component, or pathology requiring the
student to understand the interconnectedness of concepts. This data should be considered a
measure of student acquisition of abstract, holistic concepts. Scoring rubrics for each of the
surveys are attached as Appendices C-E.
The Kolb LSI version 3.1 was administered under group conditions in the classroom
under the supervision of the researcher. The survey of Kolb’s LSI was used with the permission
of Experience-Based Learning Systems, Incorporated. Permission to use the survey was granted
on September 28, 2011. The Kolb LSI was administered at two time points: a phase I LSI
(P1LSI) was administered at the beginning of the study, and a phase II LSI (P2LSI) was
administered at the end of the study. Student learning styles were identified according to Kolb’s
model. Student scores on two categories of the Kolb LSI will be recorded and used to determine
student learning style. The two categories to be scored are abstract conceptualization (to
determine the degree that a student is an abstract thinker) and concrete experimentation (to
determine the degree that a student is a concrete thinker). In Kolb’s model, abstact
conceptualization is defined as a logical analysis of concepts and ideas and the framing of those
ideas within a larger hierarchy. Concrete experience is defined as learning through experiences
and feelings. The P1LSI and P2LSI were identical; therefore, any changes in student self-
reported learning style were due to the student’s perceptions. Student scores were calculated
using a scoring sheet provided by the Hay group.

22
Interviews with students were conducted in the classroom on a scheduled basis. Students
who were chosen for interview were required to sign an additional consent form allowing for the
recording of their interview sessions so that a transcript could be produced (Appendix F).
Students who did not sign the interview consent form were not interviewed. Students who agreed
to participate in interviews received a $10 Subway™ gift card for their time and participation.
Students were selected for interviews via deliberate sampling in order to identify the learning
styles and thinking processes that occur in each type of student, whether concrete or abstract and
high-, medium-, or low-performing. High-performing students are identified as having an A
average. Average-performing students are identified as having a B average. Low-performing
students are identified as having a C average or lower. By characterizing each type of student,
the researcher was able to identify characteristics of the type of learning style a student exhibits,
as well as identify an ideal learning style of a student who performs well as indicated by overall
grade. In order to maintain consistency between interviews, an interview protocol (Appendices
G-I) as well as a scoring rubric (Appendices C-E) was developed for each of the interviews that
contained specific instructions to the student as to the purpose of the interview, the questions to
be asked during the interview, and any additional follow-up questions that could be asked to
further elucidate the thinking processes of the student. The interviews were conducted one week
after the administration of the surveys. In the interviews, the students were expected to state their
answer(s) to a question on the survey, then to explain their thinking process. Intervews were
recorded and transcribed verbatim. Appropriate punction was used to signify pauses made by the
student. When the student paused for less than five seconds, the symbol “…” was used. When a
student paused for greater than five seconds, the designation “(long pause)” was used in the
transcript. In the vignettes, comments made by the researcher are signified with “R” in the

23
transcripts, while comments and explanations made by the student are signified with their
assigned psuedonym.
The independent variable, the use of concept mapping as a teaching/learning tool, was
applied to the experimental groups on a regular basis. The dependent variables included student
achievement on formative assessments, overall grade in the course, and student self-reported
learning style as determined by Kolb's LSI version 3.1. The control and experimental groups
were both introduced to concept mapping as a learning tool, however, only the experimental
group performed concept mapping on a regular basis.
An introductory activity (Appendix J) was developed that explained the theory
supporting concept maps, how to construct them, sample concept maps, as well as a concept
mapping activity that asked students to visually represent the effects of the sympathetic nervous
system on the respiratory, digestive, and reproductive systems. Both the control and
experimental groups were instructed in the construction and theory of concept maps to maintain
fairness in the sense that both groups were exposed to appropriate learning styles interventions.
Only those students who consented to participate in the study and who were in the experimental
group completed the remaining concept mapping activities. Concept mapping activity 1
(Appendix K) consisted of a researcher constructed concept map with preexisting nodes,
crosslinks, and prepositions linking some nodes. Concept mapping activity 1 was intended to
instruct students in the use of concept maps to link what may have seemed to some students as
disconnected concepts that were from various organ systems. Concept mapping activity 2
(Appendix L) consisted of a researcher constructed concept map with preexisting nodes,
crosslinks, and prepositions linking some nodes. Concept mapping activity 2 was intended to

24
instruct students in the use of concept maps to delineate hierarchical relationships within organ
systems. Students were still encouraged to insert their own cross-links that would link seemingly
disconnected concepts from differing organ systems. The final concept mapping activity
(Appendix M) consisted of a researcher-developed PowerPoint presentation that instructed
students to create a concept map on one or all of a selected group of organ systems that were
covered during instruction as a part of the lesson. Students were given a list of terms that should
be included for each organ system covered; therefore, this was a closed-ended concept mapping
activity. However, students were allowed to construct their concept maps from that list of terms.
Analysis. The study sought to determine if concept mapping was effective in increasing the
acquisition of concrete concepts in students with abstract learning styles. To determine if the data
supported that proposal, students’ learning styles were determined by analyzing the results of
both the P1LSI and P2LSI. In order to determine if a student was a predominantly abstract or
concrete learner according to the LSI, the difference in scores on the Abstract Conceptualization
(AC) subsection and the Concrete Experience (CE) subsection were compared. The average of
the difference between those scores for all students was calculated, and analyzed for standard
error. Students were classified as having an abstract learning style if their scores on the AC
subsection exceeded their scores on the CE subsection by more than the standard error. Only
those students who were identified as having a learning style dominated by Abstact
Conceptualization on both the P1LSI and P2LSI were evaluated for their ability to acquire
concrete concepts. Their ability to acquire concrete concepts over the course of the semester was
calculated by determining the difference in scores of the concrete subsections of the unit three
content survey (that was administered at the end of the semester) and the unit one content survey
(that was administered at the beginning of the semester).

25
Second, the study sought to determine if concept mapping was effective in increasing the
acquisition of abstract concepts in students with a concrete learning style. To determine if the
data supported that proposal, students’ learning styles were determined by analyzing the results
of both the P1LSI and P2LSI. In order to determine if a student was a predominantly abstract or
concrete learner according to the LSI, the difference in scores on the Abstract Conceptualization
(AC) subsection and the Concrete Experience (CE) subsection were compared. The average of
the difference between those scores for all students was calculated, and analyzed for standard
error. Students were classified as having a concrete learning style if their scores on the CE
subsection exceeded their scores on the AC subsection by more than the standard error. Only
those students who were identified as having a learning style dominated by Concrete Experience
on both the P1LSI and P2LSI were evaluated for their ability to acquire abstract concepts. Their
ability to acquire abstract concepts over the course of the semester was calculated by determining
the difference in scores of the abstract subsections of the unit three content survey (that was
administered at the end of the semester) and the unit one content survey (that was administered at
the end of the semester).
Finally, the study sought to determine if concept mapping was effective in changing
student learning styles over the course of the study. In order to determine if a change in student
learning style occurred, the difference in student scores on subsections on the P2LSI and the
P1LSI was calculated. Any potential changes in learning style were analyzed for correlation with
a student being a part of the control or experimental group.
To establish the validity of the surveys in measuring student achievement on abstract and
concrete concepts, student scores on the surveys were first correlated with grades to assess the
26
ability of the surveys to measure student achievement via an f-test. Student scores within the
abstract and concrete subsections of the surveys were then correlated with the degree to which
the students rely on Abstract Conceptualization or Concrete Experimentation as their dominant
mode of thinking using an ANOVA analysis.
Interviews with students were analyzed for recurring themes in students’ descriptions of
their understanding of concepts or a lack thereof. These recurring themes were then examined for
trends found within low-, average-, and high-performing students as well as trends found within
students who rely on Abstract Conceptualization or Concrete Experimentation as their dominant
mode of thinking.
Concept maps will be scored according to a scoring method provided by Novak and
Gowin (1984). This scoring model involves giving one point for meaningful, valid propositions,
five points for each level of valid hierarchical organization, ten points for each meaningful cross-
link used, and one point for each valid example given of a concept.

Results
Validity of Instruments. In order to assess the validity of the researcher-developed surveys in
measuring student achievement within the course, students’ total scores on the abstract and
concrete subsections (30 points total) for each survey were combined to obtain a total score out
of 90 possible points. This score was then converted to a percentage of correct responses on the
surveys. Each student’s percentage of correct responses on the surveys was compared to their
overall grade and analyzed via an f-test to determine significance. The resulting value of the f-
test was 0.0034, indicating that students’ performance on the survey is correlated with their
achievement in the classroom as determined by overall grade. These findings indicate that the
surveys are a valid measure of student achievement.
The first research question asks “does concept mapping increase student achievement on
understanding concrete concepts in abstract-learning style students.” In order to assess the
validity of the researcher-developed surveys as a measure of concrete concepts within the course,
the scores on the concrete subsection of the surveys were correlated with student learning style.
According to Kolb, Concrete Experience is the acquisition of concepts through experiences and
feelings. On the opposite end of Kolb’s spectrum is Abstract Conceptualization, which is the
ability to logically organize acquired concepts into a hierarchy. It would be expected that
students who fall predominantly on the Concrete Experience end of the spectrum (thus having a
higher CE score) would also have a higher score on the concrete subsections of the surveys.
To calculate the percentage of correct responses on the concrete subsections of the
surveys, each student’s survey was scored according to the rubric. Once each student’s survey
had been scored, their percentages of correct responses on the concrete subsections were

28
calculated. The number of correct responses within the concrete subsection of each unit survey
was calculated by dividing by 15 (the total number of possible correct responses on the concrete
subsection).
On each learning style inventory, there are a total of 120 possible points that are divided
amongst each of the four modes of thinking. To determine the percentage of points that were
devoted to Concrete Experience, each student’s learning style inventory was scored according to
a rubric provided by the Hay Group. The number of points calculated in the concrete subsection
of each student’s learning style inventory was divided by 120 to calculate the percentage of
points to indicate the degree that a student is a concrete learner.
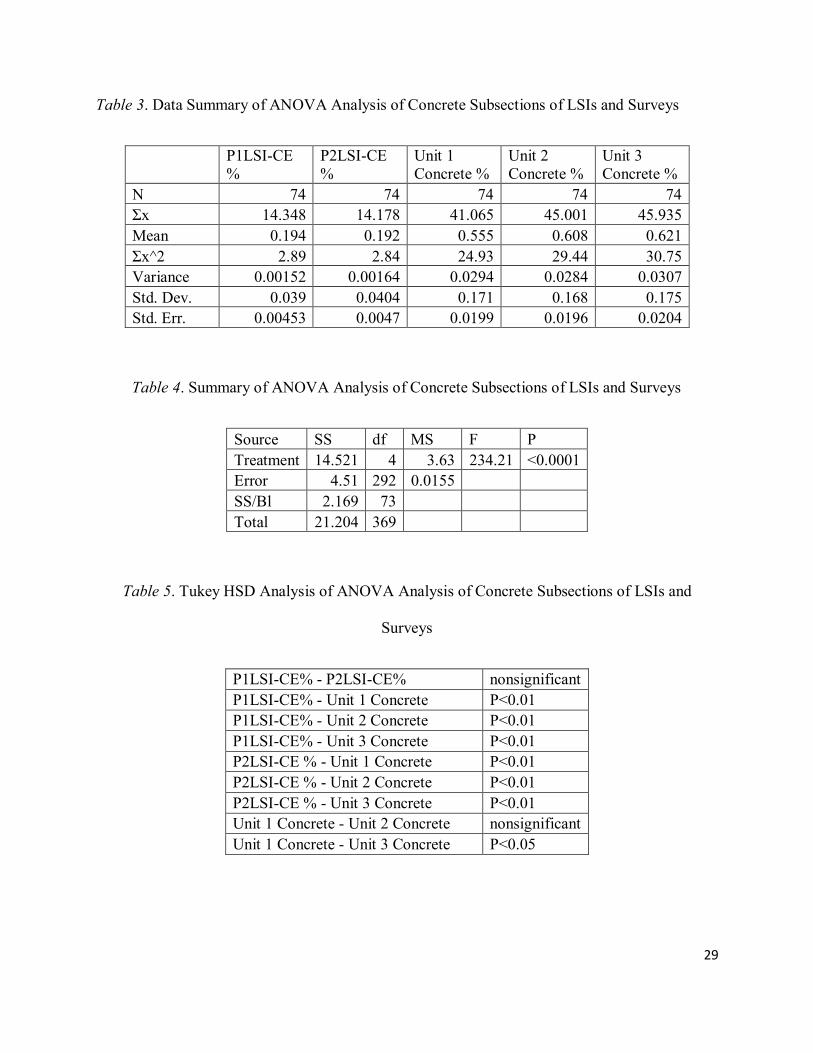
To determine if there is a correlation between the percentage of correct responses on the
concrete subsections of the surveys and the percentage of points devoted to Concrete Experience
on the learning style inventories, a five sample, correlated, standard weighted-means ANOVA
analysis was performed with each student’s percentage of correct responses on the concrete
subsections of all three unit surveys with the percentage of the Concrete Experience subsection
scores on both the P1LSI and P2LSI. An overall analysis revealed a p value of less than 0.0001
(see Table 4). The Tukey HSD Analysis indicates a strong correlation between student scores on
the Concrete Experience subsections of the LSIs with each student’s respective score on the
concrete questions of the surveys (see Table 5). This indicates that the higher a student’s score
on the Concrete Experience subsection, the higher their score on the concrete subsection of the
surveys. Based on all the aforementioned analyses, it can be concluded that the surveys are a
valid measure of student acquisition of concrete concepts.
29
Table 3. Data Summary of ANOVA Analysis of Concrete Subsections of LSIs and Surveys
P1LSI-CE
%
P2LSI-CE
%
Unit 1
Concrete %
Unit 2
Concrete %
Unit 3
Concrete %
N 74 74 74 74 74
Σx 14.348 14.178 41.065 45.001 45.935
Mean 0.194 0.192 0.555 0.608 0.621
Σx^2 2.89 2.84 24.93 29.44 30.75
Variance 0.00152 0.00164 0.0294 0.0284 0.0307
Std. Dev. 0.039 0.0404 0.171 0.168 0.175
Std. Err. 0.00453 0.0047 0.0199 0.0196 0.0204
Table 4. Summary of ANOVA Analysis of Concrete Subsections of LSIs and Surveys
Source SS df MS F P
Treatment 14.521 4 3.63 234.21 <0.0001
Error 4.51 292 0.0155
SS/Bl 2.169 73
Total 21.204 369
Table 5. Tukey HSD Analysis of ANOVA Analysis of Concrete Subsections of LSIs and
Surveys
P1LSI-CE% - P2LSI-CE% nonsignificant
P1LSI-CE% - Unit 1 Concrete P<0.01
P1LSI-CE% - Unit 2 Concrete P<0.01
P1LSI-CE% - Unit 3 Concrete P<0.01
P2LSI-CE % - Unit 1 Concrete P<0.01
P2LSI-CE % - Unit 2 Concrete P<0.01
P2LSI-CE % - Unit 3 Concrete P<0.01
Unit 1 Concrete - Unit 2 Concrete nonsignificant
Unit 1 Concrete - Unit 3 Concrete P<0.05

30
The second research question asks “does concept mapping increase student achievement
on understanding abstract concepts in concrete-learning style students.” In order to assess the
validity of the researcher-developed surveys as a measure of abstract concepts within the course,
the scores on the abstract subsection of the surveys were correlated with student learning style. It
would be expected that students who fall predominantly on the Abstract Conceptualization end
of the spectrum (thus having a higher AC score) would also have a higher score on the abstract
subsections of the surveys.
To calculate the percentage of correct responses on the abstract subsections of the
surveys, each student’s survey was scored according to the rubric. Once each student’s survey
had been scored, their percentages of correct responses on the abstract subsections were
calculated. To calculate their percentage, the number of correct responses within the abstract
subsection of each unit survey was calculated by dividing by 15 (the total number of possible
correct responses on the abstract subsection of each unit survey).
On each learning style inventory, there are a total of 120 possible points that are divided
among each of the four modes of thinking. To determine the percentage of points that were
devoted to the abstract subsection, each student’s learning style inventory was scored according
to a rubric provided by the Hay Group. The number of points obtained in the abstract subsection
of each student’s learning style inventory was divided by 120 to calculate the percentage of
points to indicate the degree that a student is an abstract learner.
To determine if there is a correlation between the percentage of correct responses on the
abstract subsections of the surveys and the percentage of points devoted to Abstract
Conceptualization on the learning style inventories, a five sample, correlated, standard weighted-

31
means ANOVA analysis was performed with each student’s percentage of correct responses on
the abstract subsections of all three unit surveys with the percentage of the Abstract
Conceptualization subsection scores on both the P1LSI and P2LSI. An overall analysis revealed
a p value of less than 0.0001 (see Table 7). The Tukey HSD Analysis indicates a strong
correlation between student scores on the Abstract Conceptualization subsections of the LSIs
with each student’s respective score on the abstract questions of the surveys (see Table 8). This
indicates that the higher a student’s score on the Abstract Conceptualization subsection, the
higher their score on the abstract subsection of the surveys. Based on all the aforementioned
analyses, it can thus be concluded that the surveys are a valid measure of student acquisition of
abstract concepts.
Table 6. Data Summary of ANOVA Analysis of Abstract Subsections of LSIs and Surveys
P1LSI-AC
%
P2LSI-AC
%
Unit 1
Abstract %
Unit 2
Abstract %
Unit 3
Abstract %
N 74 74 74 74 74
Σx 17.542 17.873 14.138 11.933 9.67
Mean 0.237 0.242 0.191 0.161 0.131
Σx^2 4.35 4.53 4.8 2.87 2.17
Variance 0.00257 0.00292 0.0288 0.0129 0.0124
Std. Dev. 0.0507 0.054 0.17 0.114 0.111
Std. Err. 0.00589 0.00628 0.0197 0.0132 0.0129
Table 7. Summary of ANOVA Analysis of Abstract Subsections of LSIs and Surveys
Source SS df MS F P
Treatment 0.68 4 0.17 19.1 <0.0001
Error 2.59 292 0.0089
SS/Bl 1.75 73
Total 5.02 369

32
Table 8. Tukey HSD Analysis of ANOVA Analysis of Abstract Subsections of LSIs and Surveys
P1LSI-AC % - P2LSI-AC % nonsignificant
P1LSI-AC% - Unit 1 Abstract P<0.05
P1LSI-AC% - Unit 2 Abstract P<0.01
P1LSI-AC% - Unit 3 Abstract P<0.01
P2LSI-AC % - Unit 1 Abstract P<0.01
P2LSI-AC% - Unit 2 Abstract P<0.01
P2LSI-AC % - Unit 3 Abstract P<0.01
Unit 1 Abstract - Unit 2
Abstract nonsignificant
Unit 1 Abstract - Unit 3
Abstract P<0.01
Research Questions. The first research question asks: “Does concept mapping increase student
achievement on understanding concrete concepts in abstract-learning style students?” In order to
answer that question, student scores on the P1LSI and P2LSI were analyzed to determine which
students used Abstract Conceptualization as a dominant mode of learning. In order for a student
to be considered an abstract learner, their scores on the Abstract Conceptualization subsection of
the LSI must exceed their scores on the Concrete Experimentation section by the standard error
of the overall difference between those scores, which was determined to be plus or minus 1 unit.
Only those students considered to be abstract learners on both the P1LSI and P2LSI were
examined. Within the experimental group, there were 25 students who were considered to be
abstract learners. Within the control group, there were 14 students who were considered to be
abstract learners.
To determine student achievement on understanding concrete concepts, student scores on
the concrete questions of the unit 3 content survey were compared to their respective scores on
the concrete questions of the unit 2 content survey to determine if their score had improved. The

33
results of these analyses are shown in tables 9 and 10. The p-value of 0.78 indicates that there is
no significant difference between the control and experimental groups when comparing student
scores on the concrete subsections of the unit 3 and unit 2 content surveys.
Table 9. Data Summary of Comparisons of Abstract Conceptualizers
U3-U2 Concrete of Experimental
Group
U3-U2 Concrete of Control
Group
n 25 14
Σx 16 13
Σx^2 272 125
SS 261.76 112.93
Mean 0.64 0.929
Table 10. T-Test of Comparisons of Abstract Conceptualizers Assuming Unequal Sample
Variances
Difference between
Means t df P-value
-0.289 -0.28 29.74 0.78
The second research question asks: “Does concept mapping increase student achievement
on understanding abstract concepts in concrete-learning style students?” In order to answer that
question, student scores on the P1LSI and P2LSI were analyzed to determine which students
used Concrete Experimentation as a dominant mode of learning. In order for a student to be
considered a concrete learner, their scores on the Concrete Experimentation subsection of the
LSI must exceed their scores on the Abstract Conceptualization section by the standard error of
the overall difference between those scores, which was determined to be plus or minus 1 unit.
Only those students considered to be concrete learners on both the P1LSI and P2LSI were

34
examined. Within the experimental group, there were only 3 students who were considered to be
concrete learners. Within the control group, there was only 1 student who was considered to be a
concrete learner.
To determine student achievement on understanding abstract concepts, student scores on
the abstract questions of the unit 3 content survey were compared to their respective scores on
the abstract questions of the unit 2 content survey to determine if their score had improved. With
such a small sample size, conducting a valid analysis is not possible. Due to an unknown factor,
there were very few students who rely on Concrete Experimentation as a dominant mode of
thinking within the Anatomy & Physiology Laboratory course. Speculations on the possible
reasons for this outcome are presented within the discussion chapter.
The third research question asks: “Does concept mapping change student learning style?”
To determine if that is the case, differences in student scores on the Abstract Conceptualization
subsection of the P1LSI and P2LSI were calculated. Student score differences in the Concrete
Experimentation subsection of the P1LSI and P2LSI were also calculated. The score differences
between control and experimental groups were then compared and analyzed via a t-test to
determine if there was a significant difference. As seen in table 11, there is no significant
difference between the control and experimental groups with respect to changes in the Abstract
Conceptualization subsection of the LSIs.
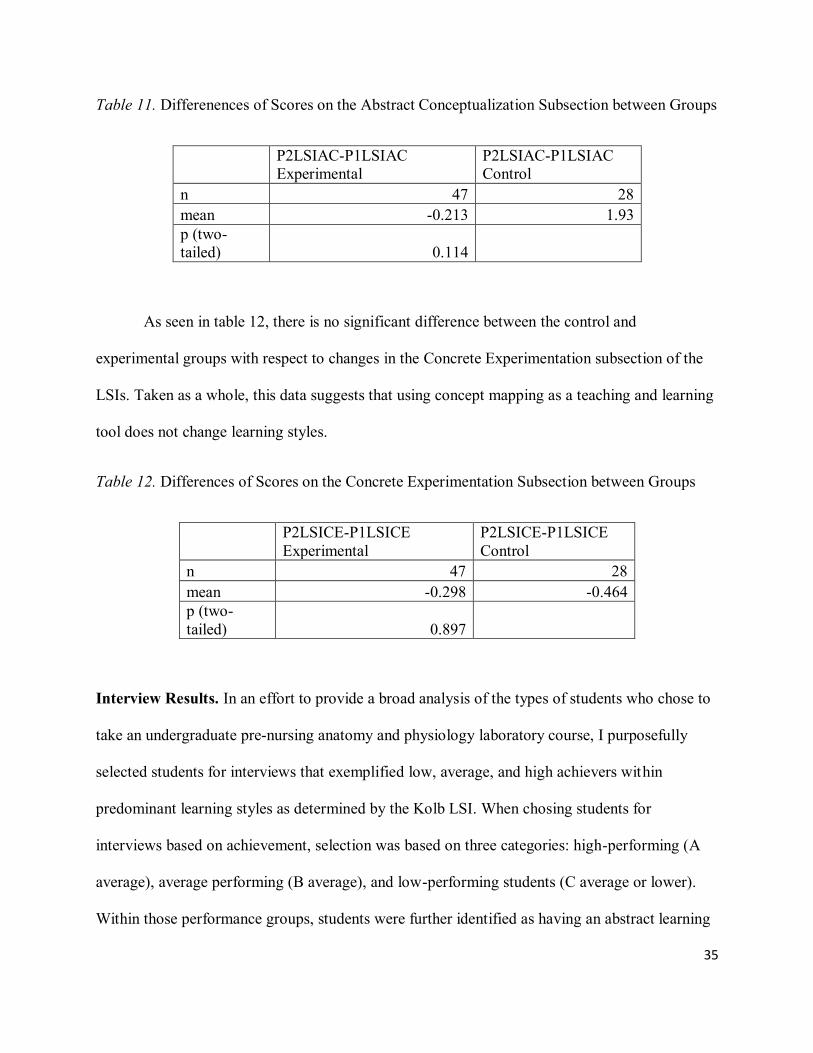
35
Table 11. Differenences of Scores on the Abstract Conceptualization Subsection between Groups
P2LSIAC-P1LSIAC
Experimental
P2LSIAC-P1LSIAC
Control
n 47 28
mean -0.213 1.93
p (two-
tailed) 0.114
As seen in table 12, there is no significant difference between the control and
experimental groups with respect to changes in the Concrete Experimentation subsection of the
LSIs. Taken as a whole, this data suggests that using concept mapping as a teaching and learning
tool does not change learning styles.
Table 12. Differences of Scores on the Concrete Experimentation Subsection between Groups
P2LSICE-P1LSICE
Experimental
P2LSICE-P1LSICE
Control
n 47 28
mean -0.298 -0.464
p (two-
tailed) 0.897
Interview Results. In an effort to provide a broad analysis of the types of students who chose to
take an undergraduate pre-nursing anatomy and physiology laboratory course, I purposefully
selected students for interviews that exemplified low, average, and high achievers within
predominant learning styles as determined by the Kolb LSI. When chosing students for
interviews based on achievement, selection was based on three categories: high-performing (A
average), average performing (B average), and low-performing students (C average or lower).
Within those performance groups, students were further identified as having an abstract learning

36
style, a concrete learning style, or a median learning style. Either due to the small sample size or
an unknown factor, students of all learning styles were not found in all performance groups.
Interviews were conducted on an individual basis in the classroom setting where students
were to reiterate their responses to the surveys as well as explain their thinking processes as they
formulated their answers. This was done in an effort to identify recurring themes in the students’
thinking processes as they described their understanding of concepts as well as the areas where
their understanding was inadequate. Following are the results of those interviews:
Interview with High-Performing, Abstract-Learning style Student from Experimental
Group. The first student chosen, known as “Ashley”, was a 20 year old undergraduate female
with an A average, therefore she is considered to be a high-performing student and was a
member of the experimental group. Ashley’s scores on the PILSI were higher on Abstract
Conceptualization than on Concrete Experience; therefore, her dominant mode of learning is
through Abstract Conceptualization. Her scores were similar on the P2LSI. Below is an example
of Ashley’s explanations:
R: Okay question two says identify the endocrine glands shown on the projector. So what
is structure a?
Ashley: Thymus.
R: And how you know that?
Ashley: No wait that is the thyroid.
R: How do you know that?
Ashley: Because that's what it is, because it is in the neck, and the thymus should be in
the chest.

37
R: So you know it because of location?
Ashley: Yes
R: Are there any other factors that help you to identify it?
Ashley: No.
R: Okay, what about structure B?
Ashley: It is the adrenal gland.
R: And how do you know that?
Ashley: Because it is on top of the kidneys.
R: So how were you able to identify that properly?
Ashley: Because of its location.
R: Okay, what about structure C?
Ashley: That is the hypothalamus.
R: And how do you know that?
Ashley: Because it is above the pituitary gland.
R: So again you know that because of location?
Ashley: Yes.
When analyzing the recurring themes to that she attributes her understanding, the most common
explanations are visual cues (11), usually based upon location, attributing importance to concepts
(5), and a hierarchical understanding (3). The fact that she attributes importance to concepts that
faciliates her understanding is consistent with prior studies on abstract learning style students as
examined by Tsai and Thomas (2011). When analyzing the recurring themes to that she
attributes a lack of understanding, the most common explanations are an absence of details (6)
and a lack of studying (4).

38
Interview with Average-Performing, Abstract-Learning style Student from Experimental
Group. The second student chosen for interviews, Brittany, was a 20 year old undergraduate
female with a B average; therefore, she is considered to be an average-performing student.
Brittany’s scores on the PILSI were higher in Abstract Conceptualization than in Concrete
Experience, therefore, her dominant mode of learning is through Abstract Conceptualization. Her
dominant mode of thinking did not change as evidenced by her subsection scores on the P2LSI.
Brittany was part of the experimental group.
R: Question one says explain the process by which aldosterone increases blood pressure.
Brittany: (Long pause) Aldosterone is from the pituitary and that is all I can give you
right now.
R: Why do you remember that?
Brittany: Mainly from pictures in the lab manual.
R: Okay, so when you say you remember the pictures in the lab manual, what are you
remembering about them?
Brittany: Just the diagrams and not so much the reading, but the diagrams and
explanations on the diagrams.
When analyzing the recurring themes she describes in her understanding, the most common
explanations are visual cues (18), usually based upon image recognition, a hierarchical
understanding (4), personal experience (3), prior knowledge from other classes (3), and auditory
cues (3). This student is a highly visual learner as evidenced by her explanations. When
analyzing the recurring themes to that she attributes a lack of understanding, the most common
explanations are a lack of prior knowledge (5) and a lack of studying (4).
39
Interview with High-Performing, Abstract-Thinking Student from Control Group
Exhibiting a Transition to Median-Thinking. The third student chosen for interviews was a
19-year old undergraduate female, Chelsea, from the control group. Chelsea had an A average;
therefore, she is considered to be a high-performing student. Chelsea’s scores on the phase I LSI
was significantly higher in the Abstract Conceptualization subsection (28) than in the Concrete
Experimentation subsection (19), indicating her dominant mode of learning is through Abstract
Conceptualization. Interestingly, her scores on the phase II LSI exhibited a significant change.
Chelsea’s scores within the Abstract Conceptualization subsection was slightly lower at 36 than
her score of 37 on the Concrete Experimentation subsection, implying that she has experienced a
transition to a median learning style centered on the continuum from Abstract Conceptualization
to Concrete Experimentation.
R: Question one says explain the process by which aldosterone increases blood pressure.
Chelsea: Okay, aldosterone is the hormone that…um, keeps… They keep sodium in the
blood which increases the pressure inside the arteries and causes the blood to push on
artery walls more.
R: How do you know that?
Chelsea: Um…for me, it is kind of like a photographic type of memory kind of thing. I
would study for the final exam and I am one of the people that would write out all the
notes in the lecture and writing it out helps me to remember and to recall which one
aldosterone was compared to the other hormones. I like picture my notes that I wrote out
my head and where it was on the page and like if it was in the lecture notes… I think it
was like a little arrow and I remember it said for one of them about raising blood
pressure… the long-term regulation of raising the blood pressure renin is released. It does

40
like the angiotensin and angiotensin can regulate it directly or it would go the other arrow
side but something about aldosterone being released from the kidney? I don't know. I just
did it based on photographic I guess.
R: So you picture the words in your head?
Chelsea: Yes.
R: So when you picture the words in your head are you picturing your notes of the notes
of the lecture?
Chelsea: My notes.
When analyzing the recurring themes in her understanding, the most common explanations are
visual cues (21), 12 of which were due to shape or location while nine of which were due to
visualization of her handwritten notes. Other common explanations were word associations (5)
and prior classroom exposure (3). This student is also a highly visual learner as evidenced by her
explanations. When analyzing the recurring themes to that she attributes a lack of understanding,
the most common explanations are a lack of studying (7) and non-translation to long-term
memory (4).
Interview with Average-Performing, Abstract-Thinking Student from Experimental
Group. The fourth student chosen for interviews from the experimental group is Derrick, a 41-
year old undergraduate male. Derrick has a B average; therefore, he is considered to be an
average-performing student. Derrick’s scores on the phase I LSI were higher in the Abstract
Conceptualization subsection (27) than in the Concrete Experimentation subsection (16),
indicating that his dominant mode of learning is through Abstract Conceptualization.
Interestingly, his scores on the phase II LSI exhibited a significant change. Derrick’s scores
within the Abstract Conceptualization subsection were higher at 34 than his score of 15 on the
41
Concrete Experimentation subsection, implying that his learning style has become even more
dependent upon Abstract Conceptualization.
R: Excellent, question number two says identify the endocrine glands shown on the
projector. What is structure A?
Derrick: That is the thyroid.
R: How do you know that?
Derrick: I remember from studying the lab manual and it is pure memorization.
R: Okay, when you remember it, is that words or pictures? What is it about that that clues
you in that that structure is the thyroid?
Derrick: The pictures.
R: What about the picture are you remembering? What led you to associate this picture
with thyroid?
Derrick: Well, in studying the lab manual, I noted that it is in the head it is on the neck.
R: So location is one thing. Any other factors?
Derrick: It just has that same picture that would be in the book. It has the texture in the
color in that sort of stands out.
R: How about structure B?
Derrick: That is the…um... Adrenaline… Gland.
R: Okay, how did you know what you did?
Derrick: Well it is on top of the kidney, and I know that the gland on top of the kidney
releases adrenaline and some other substance.
R: How did you know that it produces adrenaline but not remember the name of the
gland?

42
Derrick: (Long pause)…
R: Is it something that was emphasized enough in the class or was that something you
didn't study enough?
Derrick: Well, it is just repetition. I have to go through repetition and studying. I made an
association with the kidney and the organ on top and the other materials that we covered.
I know that on top of the kidney lies the adrenal gland or whatever it is… and that is
where adrenaline essentially comes from. So, it is a combination of looking at the
materials in the lab manual…the pictures… as well as the lecture notes from the course
where you learn to associate the hormones and such.
R: What about structure C?
Derrick: The pituitary gland.
R: How do you know that?
Derrick: How do I know that… (Long pause)… Studying the pictures in the lab manual.
R: Now when you say you know it from the pictures the lab manual, what do you do? Do
you look at them and cover them up? What strategy do you use?
Derrick: For me it is kind of scanning the picture in associating what is around it. In this
case it is a little piece shaped at the tip. If it had been pointing to another part, it would've
been difficult to remember, but because that stands out a little more, I am able to
remember the picture.
When analyzing the recurring themes in his understanding, the most common explanation is
visual cues (27), 20 of that were due to some type of visual recollection while 4 of that were due
to location and 3 being due to shape. Other common explanations were recall of notes (9), word
associations (3), personal experience (3) and auditory recall of the lecture (3). This student is
43
also a highly visual learner as evidenced by his explanations. There are no consistently recurring
themes to which this student attributes a lack of understanding.
Interview with Abstract-Learning style, Low-Performing Student from Experimental
Group. The fifth student chosen for interviews was Emily, a 20-year old undergraduate female
who was in the experimental group. Emily had a C average; therefore, she is considered to be a
low-performing student. Emily’s scores on the phase I LSI were higher in the Abstract
Conceptualization subsection (34) than in the Concrete Experimentation subsection (20),
indicating that her dominant mode of learning is through Abstract Conceptualization.
Interestingly, her scores on the phase II LSI exhibited a change: her scores within the Abstract
Conceptualization subsection were higher at 26 than her score of 19 on the Concrete
Experimentation subsection, implying that her learning style has become slightly more median,
but she is still considered to be an Abstract Conceptualizer.
R: Question number three says why does exogenous testosterone, in other words anabolic
steroids, cause gynecomastia?
Emily: Because the hormones are out of balance.
R: Okay, how were you able to remember that?
Emily: (Long pause)… I mean… just because of basic knowledge of steroids. The
purpose of them is to… well… like… if you are using them for… like… performance
purposes… just basic knowledge about them I guess.
R: Where did you get that basic knowledge from?
Emily: Probably from high school.
R: Okay, so previous experience?
Emily: Yeah. How like baseball players and stuff would get caught.

44
When analyzing the recurring themes in her understanding, the most common explanation is
visual cues (20), 12 of that were due to shape or while 8 of that were due to location. Another
common explanation was personal experience (8). This student is also a highly visual learner as
evidenced by her explanations. When analyzing the recurring themes to that she attributes a lack
of understanding, the most common explanations are a lack of studying (3), a lack of prior
exposure (3) and the complex nature of the concepts (3).
Interview with Abstract-Learning style, Average-Performing Student from Control Group.
The sixth student chosen for interviews was a 20-year old undergraduate female from the control
group known as Farrah. Farrah had a B average; therefore, she is considered to be an average-
performing student. Farrah’s scores on the PILSI were only slightly higher in the Abstract
Conceptualization subsection (24) than in the Concrete Experimentation subsection (21),
indicating that she is skewed towards Abstract Conceptualization. Interestingly, Farrah’s scores
on the P2LSI exhibited a significant change. Farrah’s scores within the Abstract
Conceptualization subsection were significantly higher at 43 than her score of 19 on the Concrete
Experimentation subsection, implying that her learning style has become more dependent on
Abstract Conceptualization.
R: Okay, let's go to question number two. Question number two says identify the male
reproductive structures shown on the projector. What is structure A?
Farrah: I think that is like, epididymis. I don't remember how to say it.
R: Okay you know that?
Farrah: It was on the test and I just remembered that the sequence… I don't know if you
would call it sequence… but the route, I guess, and where the sperm goes from that one
there to there.

45
R: What about structure B?
Farrah: B starts with an a-… It's like albumin something.
R: Okay how do you know that?
Farrah: I remember it from the PowerPoint. I can see the words but I don't know exactly
what it is. I know it starts within a-.
R: Okay, what about structure C?
Farrah: C…um… that's the spongy… I want to say… no… yeah… that is
the…um…gosh… I think it's like, cavernosa spongy something.
R: How do you know that?
Farrah: I remember seeing it on the slides and I remember our TA talking about that.
When analyzing the recurring themes in her understanding, the most common explanation is
visual cues (31), 14 of those were due to location while 13 were due to shape. Four responses
were also attributed to visual cues, but it is unclear as to the nature of the association. Other
common explanations were a hierarchal understanding (5), word associations (5), and rote
memorization (3). This student is also a highly visual learner as evidenced by her explanations.
When analyzing the recurring themes to that she attributes a lack of understanding, the most
common explanation is a lack of prior exposure (3).
Interview with Abstract-Learning style, High-Performing Student from Control Group.
The seventh student chosen for interviews was a 20-year old undergraduate female from the
control group known as Gwyn. Gywn had an A average; therefore, she is considered to be a
high-performing student. Gwyn’s scores on the phase I LSI were only slightly higher in the
Abstract Conceptualization subsection (29) than in the Concrete Experimentation subsection
(23), indicating that her dominant mode of learning is Abstract Conceptualization. Gwyn’s

46
scores on the phase II LSI exhibited little change. Her scores within the Abstract
Conceptualization subsection were higher at 27 than her score of 20 on the Concrete
Experimentation subsection, implying that her learning style has remained constant.
R: What about question number eight? It says identify the embryonic structures shown on
the projector. Structure A is pointing to a germ layer. What is that germ layer?
Gwyn: Okay… gosh… hold on a second… I think that is the… the… it's like… I want to
say like endo-germ or meso- germ. I remember the three germ layers… I can't remember
the order.
R: Why do you think that doesn't stand out to you?
Gwyn: The picture that I remember seeing was a little different, but I don't know
specifically why. I just remember the three layers I can't remember what order they were
in though.
R: What about structure B? This is pointing to the maternal portion of the placenta.
Gwyn: Okay… I remember this… I remember seeing the exact structure… but I can't
remember the exact name of that.
R: Why not?
Gwyn: Um…. I don't know. It didn't stick very well… I don't know.
R: Okay, structure C, while there is no picture, asks for the embryonic stage at which
neuralation occurs.
Gwyn: I have no idea.
R: Why do you think you don't know that?
Gwyn: I just can't remember to be honest.

47
When analyzing the recurring themes in her understanding, the most common explanation is
visual cues (15), 11 of that were due to recollection of a diagram while 3 of that were due to
location (1 is due to shape). Other common explanations were recollection of the powerpoint
(10), auditory recall of the lecture (8) and emphasis placed on the concept by the teaching
assistant (4). This student is a highly visual learner as evidenced by her explanations, but also
recalls a great deal of information in an auditory fashion. There are no significant recurring
themes to which she attributes a lack of understanding.
Interview Themes. Themes and their respective frequencies to which students attributed their
understanding as well as themes to which students attributed a lack of understanding were
tabulated among high-, average-, and low-performing students as presented within table 13.
Table 13. Frequencies of Themes that Students Attributed Their Understanding or a Lack of
Understanding Grouped by Achievement Level
High Performing (A average)
Average Performing (B
average)
Low Performing (C Average or
lower)
Visual Cues (47) Visual Cues (76) Visual Cues (20)
Lack of studying (11) Recall of Notes (9) Personal Experience (8)
Recall of Powerpoint (10) Hierarchical Understanding (9) Lack of studying (3)
Auditory Cues (8) Word Associations (8) Lack of Prior knowledge (3)
Absence of details (6) Lack of Prior Knowledge (8) Complex Nature of Concepts (3)
Attributing Importance (5) Personal Experience (6)
Word Associations (5) Auditory Cues (6)
Non-translation to long-term memory (4) Prior Knowledge (3)
Hierarchical Understanding (3) Rote Memorization (3)
Prior knowledge (3)
Analysis of Student Samples of Concept Maps. An analysis of a sample of student concept
maps is presented in the following section. The method of analysis is concordant with the scoring
rubric provided by Novak and Gowin (1984). This scoring model involves assigning one point
for meaningful, valid propositions and relationships, five points for each level of valid
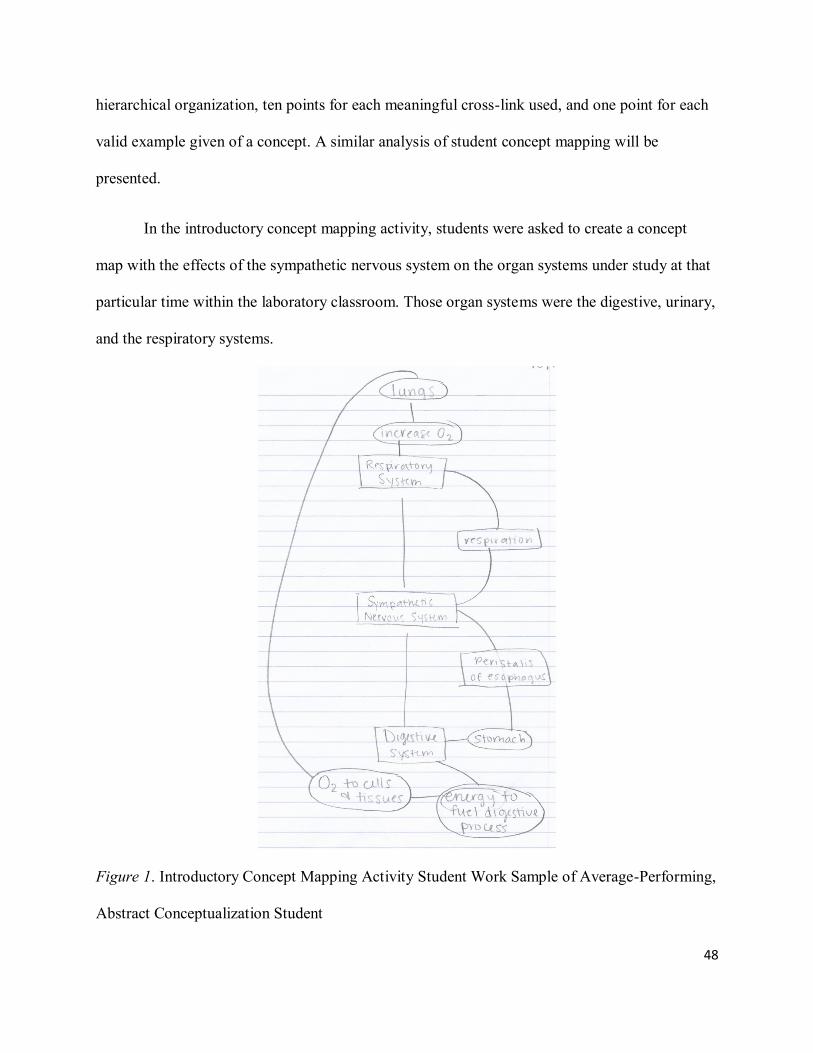
48
hierarchical organization, ten points for each meaningful cross-link used, and one point for each
valid example given of a concept. A similar analysis of student concept mapping will be
presented.
In the introductory concept mapping activity, students were asked to create a concept
map with the effects of the sympathetic nervous system on the organ systems under study at that
particular time within the laboratory classroom. Those organ systems were the digestive, urinary,
and the respiratory systems.
Figure 1. Introductory Concept Mapping Activity Student Work Sample of Average-Performing,
Abstract Conceptualization Student

49
The student who submitted this work sample had a B average in the class and is therefore
considered to be an average-performing student. This student had a learning style favoring
abstract-conceptualization. This style of concept map demonstrates an ordinal approach to the
understanding of the concepts. This student only connected the actions of the sympathetic
nervous system to the respiratory and digestive systems, implying an incomplete understanding
of the effects of the sympathetic nervous system on the various organ systems of the body. Due
to the fact there are no linking words, this student receives a 0 for propositions. The hierarchy is
somewhat difficult to understand, but the student has created a hierarchy of systems to
substructures of those systems, so this student has two levels of hierarchy and receives 10 points.
There is one valid cross-link which shows the respiratory system providing oxygen to cells to
fuel digestive processes; therefore, this student receives 10 points. This student has given two
valid examples, one of stomach, and one of the lungs for a total of 2 points. The overall score for
this student’s concept map is 22 points.

50
Figure 2. Introductory Concept Mapping Activity Student Work Sample of High-Performing,
Abstract Conceptualization Student
The student who submitted this work sample had an A average in the class and is
therefore considered to be a high-performing student favoring Abstract Conceptualization. The
student connected the actions of the sympathetic nervous system to the respiratory and digestive
systems extensively, and while she did include the urinary system in their map, she didn’t
delineate the effects of the sympathetic nervous system on the anatomical structures of the
urinary system, implying an incomplete understanding of the effects of the sympathetic nervous
system on the various organ systems of the body. This student has a valid proposition in that the
sympathetic nervous system encourages fight or flight, as well as having the stomach decrease

51
digestion; therefore, she receives two points for propositions. This student demonstrates two
levels of hierarchy with organ systems and substructures; therefore, she receives 10 points for
hierarchy. This student has made no cross-links and thus receives 0 points. She has given 10
examples of substructures and receives one point for each. The total number of points on this
concept map is 22.
Figure 3. Introductory Concept Mapping Activity Student Work Sample of High-Performing,
Median Learning style Student
The student who submitted this work sample had an A average in the class and had a
median learning style. This style of concept map demonstrates an understanding of the basic
concepts and is unable to link seemingly disconnected concepts. This student only connected the

52
actions of the sympathetic nervous system to the respiratory and digestive systems, implying an
incomplete understanding of the effects of the sympathetic nervous system on the various organ
systems of the body. She has seven correct propositions and receives 7 points. This student has
two levels of hierarchy consisting of the organ systems and their respective substructures for 10
points. She has no cross-links. This student has given 10 correct examples for a total of 10
points. This concept map receives 27 points.
The first concept mapping activity was a pre-constructed concept map that related the
functions of the Endocrine, Urinary, and Reproductive Systems with concepts related to
components of the blood. As this concept map was pre-constructed, it was only necessary for
students to insert new structures within new nodes, create cross-links between nodes that relate
concepts, and insert prepositional phrases linking subsequent nodes to one another. The analyses
of these concept maps are based upon new material that the students added to the pre-
constructed map.

53
Figure 4. First Concept Mapping Activity Student Work Sample of Low-Performing, Abstract
Conceptualization Student
This student had a C average and had a learning style favoring abstract conceptualization.
This concept map has several features that distinguish it as being cognitively unsophisticated.
The new nodes of anatomical structures that this student has chosen to write in are only
connected to a larger nodes that represent the organ system under study. New nodes have no
cross-links. The propositions used to link the nodes are relatively simple words such as
“produces”, “includes”, and “taken to” but there are 9 introduced propositions for 9 points. This
student has added no additional levels of hierarchy and thus receives 0 points. There are no
cross-links. This student has written in some personal notes and examples that relate to
surrounding nodes of concepts, however, those notes have not been linked to other topics.

54
Despite that, she still has a total of 10 correct examples and thus receives 10 points. This concept
map receives a total of 19 points.
Figure 5. First Concept Mapping Activity Student Work Sample of Average-Performing,
Abstract Conceptualization Student
This student had a B average with an Abstract Conceptualization learning style. The
concept map has several features that identify it as being a map of intermediate cognitive
sophistication. The new nodes of anatomical structures that this student has chosen to write in are
not only connected to a larger nodes that represent the organ system under study, but also to
other nodes, demonstrating a basic understanding of the interactions between these systems. Due
to the fact that the student has chosen to write in new nodes, they have introduced an additional
level of hierarchy and thus receive 5 points. This student actually uses too many cross-links;
therefore, it shows that while the basic understanding is present, a hierarchical organization of

55
the concepts is absent. There are seven valid cross-links for a total of 14 points. The propositions
that link the nodes are relatively simple words such as “produces”, but she interestingly used
notes to describe (albeit incorrectly) interactions between the kidneys and the endocrine system.
Due to the correct usage of 12 propositions, this student receives 12 points. There are five valid
examples for an additional 5 points, yielding a grand total of 36 points.
The second concept mapping activity was a pre-constructed concept map that related the
functions of the Digestive, Circulatory, and Respiratory Systems with that of concepts on
Embryonic Development. As this concept map was pre-constructed, it was only necessary for
students to insert any new structures within new nodes, create cross-links between nodes that
relate concepts, and insert prepositional phrases linking subsequent nodes to one another. The
analyses of these concept maps are based upon any new material that the students added to the
pre-constructed map.

56
Figure 6. Second Concept Mapping Activity Student Work Sample of High-Performing,
Abstract Conceptualization Student
This student had an A average with an Abstract Conceptualization learning style. This
student has only added a few new nodes and not properly defined them as nodes by enclosing
them in circles. Therefore, there are no additional levels of hierarchy. The examples added to
embryonic development reflect an ordinal understanding of the stages of embryonic
development, but there are no cross-links to other concepts. Regardless, this student receives 7
points for valid examples. A great deal of propositions were added to the existing nodes, as no
propositions were included in this concept map. This student’s propositions reflect that she is
attempting to integrate the physiological functions of various anatomical structures to one

57
another. The total number of correct propositions are 17. There are many crosslinks within the
digestive system, implying that she has a thorough understanding of the anatomy involved. There
are no crosslinks added to the respiratory or circulatory systems, implying that her knowledge of
the interactions within the systems is largely incomplete. Due to four valid cross-links within the
digestive system, this student receives 8 points, bringing the total score for this concept map to
32 points.
Figure 7. Second Concept Mapping Activity Student Work Sample of Average-Performing,
Abstract Conceptualization Student
This student had a B average and has an Abstract Conceptualization learning style. There
are several new nodes which are properly defined as nodes by being enclosed in circles. As this
student has introduced an additional level of hierarchy, he receives 5 points. The concepts added

58
to embryonic development reflect an ordinal understanding of the stages of embryonic
development, and while there are cross-links to other concepts, all of those crosslinks lack
joining propositions. There are no crosslinks added to the respiratory or circulatory systems,
implying that his knowledge of the interactions within the systems is largely incomplete. The
number of valid cross-links are six; therefore, this student receives 12 points. No propositions
have been added to the existing nodes, and there is little evidence that this student understands
the interactions between concepts. As there are no propositions, he receives no points. This
student has provided five relevant examples of stages of embryonic development, and thus
receives 5 points. The total number of points for this concept map is 22.

59
Figure 8. Second Concept Mapping Activity Student Work Sample of High-Performing, Median
Learning style Student
This student had an A average and had a learning style centered on the Abstract
Conceptualization to Concrete Experience spectrum (defined as a median learning style). Several
new nodes have been added and are properly defined as nodes by being enclosed them in circles;
therefore, due to the introduction of an additional level of hierarchy, this concept map receives 5
points. The concepts added to embryonic development reflect an ordinal understanding of the
stages of embryonic development, as well as a hierarchical understanding of the structures that
develop. This student has added only two propositions to the existing nodes and thus receives 2
points. The lack of propositions could reflect that she doesn’t understand how to integrate the

60
physiological functions of various anatomical structures to one another. There are many
crosslinks of embryonic development to other concepts, implying that she has a thorough
understanding of embryonic development. Due to the five relevant cross-links, she receives 10
points. Due to the addition of 20 relevant examples, this student receives 20 additional points for
a total of 37 points.
The final concept mapping activity was a closed-ended concept map activity where
students had their choice of creating a concept map on concepts of the Reproductive System,
Embryonic Development, or Principles of Genetics. The students were given a minimal list of
terms that were expected to be diagrammed within nodes on the concept map. There was no
predefined structure for the student to follow; therefore, the arrangement of the concept map was
dependent on the student’s understanding of the topic as well as their ability to organize their
understanding and communicate it effectively. Students could also create a composite concept
map that integrated concepts from all possible closed-ended lists.

61
Figure 9. Final Concept Mapping Activity Student Work Sample of Average-Performing,
Abstract Conceptualization Student
This student had a B average and had a learning style favoring Abstract
Conceptualization, which on the P2LSI became even more strongly in favor of Abstract
Conceptualization. She has chosen to complete a concept map on the Principles of Genetics unit.
There are only two discernible levels of hierarchy, and receives 10 points. With only four simple
propositions correctly placed, this student receives only 4 points. There are no valid cross-links.
There are 15 related examples and therefore, 15 additional points. The total score for this concept
map is 29 points.

62
Figure 10. Final Concept Mapping Activity Student Work Sample of High Performing, Median
Learning style Student
This student had an A average with a median learning style centered on the spectrum
from Abstract Conceptualization to Concrete Experience. This concept map focused on the
reproductive system. There is an abundance of nodes, crosslinks, and propositions implying a
thorough understanding of the reproductive system. There are two discernible levels of
hierarchy created by dividing the reproductive system into male and female then internal and
external parts and therefore, receives 10 points. This student has 52 valid propositions and

63
receives 52 points. There are only two valid cross-links for 4 additional points. This student has
given 62 examples for a total score of 128 points.
Figure 11. Final Concept Mapping Activity Student Work Sample of Low Performing, Abstract
Conceptualization Student
This student had a C average with a learning style strongly favoring Abstract
Conceptualization. She has chosen to complete a concept map on the Principles of Genetics unit.
All necessary nodes have been included, but there no valid cross-links between concepts. There
are no discernible levels of hierarchy present. The propositions used to link concepts are
relatively simplistic, but accurate for a total of 10 points. The student has included 10 relative
examples for a total score of 20 points on this concept map.

Discussion
Research Questions. The first research question addressed by this study is: “Does concept
mapping increase student achievement on concrete concepts in abstract learning style students?”
Due to the fact that the differences in scores on the concrete subsections of the third and second
survey was insignificant between Abstract Conceptualizers in both control and experimental
groups,it cannot be concluded that concept mapping increases student achievement on concrete
concepts in abstract learning style students. In examining the data, I was also intrigued as to
whether concept mapping would increase student achievement on concrete concepts in students
who were classified as concrete or median learners. Due to the fact that there were only three
concrete learning style students in the experimental group and one in the control group, an
analysis of these students would have such limited generalizability as to make it ineffectual. In
addition, due to the fact that there was only one student within the experimental group whose
scores on both the P1LSI and P2LSI were indicative of median thinkers, an analysis could not be
performed as to the effects of concept mapping on median thinkers.
The second research question addressed by this study is: “Does concept mapping increase
student achievement on abstract concepts in concrete learning style students?” Due to unknown
factors, there was an extremely small number of students who rely on Concrete Experience and
an analysis of those students would be ineffectual. In contemplating this issue, I reflected on
Kolb’s definition of Concrete Experience as learning concepts through experiences and feelings.
According to research by Tsai and Thomas (2011), students with a concrete learning style
attribute equal importance to all information acquired rather than prioritizing the relative
importance of the information. I believe that students who rely on Concrete Experience as a
learning style are rarely able to progress to such high level classes as Anatomy & Physiology

65
because of their inability to organize the overwhelming amount of information into a hierarchy.
Interestingly, of the three students who relied on Concrete Experience in the experimental group,
two of them had an A average and the other had a B average. The single student who relied on
Concrete Experience in the Control group had an A average. As the overall grade within the
course is mainly determined by practical exams (85% of overall grade), these students must have
attributed significance to most concrete concepts covered within the class and have been able to
organize those concepts into some type of hierarchical understanding. Since practical exams
were centered around identification of anatomical structures, it is possible that these students are
better able to distinguish between significant concrete concepts than their peers.
In examining the data, I was also curious as to whether concept mapping increased
student achievement on abstract concepts in abstract learning style students. Only students who
were classified as having an abstract learning style were used to perform this analysis. To
determine student achievement on understanding abstract concepts, student scores on the abstract
questions of the unit 3 content survey were compared to their respective scores on the abstract
questions of the unit 2 content survey to determine if their score had improved. The results of the
independent sample t-test gave a p-value of 0.452, indicating that there is no significant
difference between the experimental and control groups. Due to this result, it cannot be
concluded that concept mapping increases student achievement on abstract concepts in abstract
learning style students.
The third research question asks “does the use of a concept mapping routine change
learning style?” When comparing changes in Abstract Conceptualization between the control and
experimental group, a p-value of 0.114 was obtained for the difference in the subsection scores
on the LSIs. While this p-value is not significant, with a larger sample size, a change in learning

66
style may be seen. However, the experimental group which engaged in concept mapping had a
mean decrease in Abstract Conceptualization subsection scores of -0.213 units. The control
group which did not engage in concept mapping had a mean increase of 1.93 units. With a larger
sample size, it may be possible to see that concept mapping actually decreases a student’s
dependence on Abstract Conceptualization. When comparing changes in Concrete Experience
between the control and experimental group, a p-value of 0.897 was obtained for the difference
in the subsection scores on the LSIs. This indicates that concept mapping does not change a
student’s dependence on Concrete Experience.
As an extended analysis, I wanted to look at those students whose learning style did
change and those whose learning style did not change. Within the experimental group, there were
25 Abstract Conceptualization students, 3 Concrete Experience students, and 1 median-thinking
student who had a constant learning style on both the P1LSI and P2LSI. Within the control
group, there were 14 Abstract Conceptualization students, 1 Concrete Experience student, and 0
median-thinking students who had a constant learning style on both the P1LSI and the P2LSI.
However, there were students whose learning style did exhibit a change from the P1LSI to the
P2LSI. In order to determine if concept mapping had any effect on these students, I first
performed a t-test of unequal variances between student overall grades in the students whose
learning style did change. When comparing the control and experimental groups, a p-value of
0.91 was obtained, indicating that there is no significant difference when comparing overall
grades of students whose learning style did exhibit a change over the course of the study. This
could indicate that those students who exhibit a change in learning style do not also exhibit
increased achievement within the course.

67
It was then my intent to determine if concept mapping increased student performance on
concrete concepts in those students who did exhibit a change in learning style. In order to do so,
differences in scores on the concrete subsections between the unit 3 content survey and unit 2
content survey were calculated for each student. When comparing control and experimental
groups with a t-test of unequal variances, a p-value of 0.219 was obtained, indicating that there is
no significant difference when comparing concrete concept acquisition in students whose
learning style exhibited a change over the course of the study. It was also necessary to determine
if concept mapping increased student performance on abstract concepts in those students who
exhibited a change in learning style. In order to do so, the differences in scores on the abstract
subsections between the unit 3 content survey and the unit 2 content survey were calculated for
each student. When comparing control and experimental groups with a t-test of unequal
variances, a p-value of 0.801 was obtained, indicating that there is no significant difference when
comparing abstract concept acquisition in students whose learning style exhibited a change over
the course of the study.
In order to present the changes in learning style that occurred during the course of the
study, a quantitative variable in the form of their subsection scores on the LSIs was transformed
to a qualitative variable by labeling them as an Abstract Conceptualizer (signified by the letter
A), Concrete Experiencer (signified by the letter C), or median-thinking student (signified by the
letter M). Table 14 is a frequency table which contains the changes in learning styles in the
control and experimental groups. Due to the extremely small sample size, no viable conclusions
should be made as to the causes for the observed changes in learning style.

68
Table 14. Comparison of Learning Style Changes Observed in Control and Experimental Groups
Experimental
Frequency
Experimental
RF
Control
Frequency Control RF
A to C 3 0.167 2 0.154
A to M 4 0.222 2 0.154
C to A 3 0.167 4 0.308
C to M 2 0.111 1 0.077
M to A 2 0.111 3 0.231
M to C 4 0.222 1 0.077
Total 18 1 13 1
Discussion of Student Interviews. Due to the extremely small sample size of students who
agreed to be interviewed, a qualitative analysis of interviews has limited generalizability. In
analyzing the frequency of the themes to which students attribute their understaning or lack of
understanding, an overarching trend was observed. The vast majority of explanations that
students contributed indicated that their understanding is dependent on visual cues. Since the
laboratory portion involves examination of anatomy, it is evident that a great many students will
be able to identify structures based upon visual cues.
When grouping the themes by student achievement level, several trends were observed.
High performing students were the only students to mention that they had attributed importance
to the concept, admitted they possessed a lack of details when they could not answer a question,
and also recognized that while they had learned a concept for the practical, the transition to long-
term memory did not occur. Average performing students were the only students to mention that
they used rote memorization to acquire a concept. Low performing students were the only
students to recognize that the complex nature of the concepts interfered with their ability to
understand the information at hand. Interestingly, low- and average-performing abstract students
were the only students to mention personal experience and personal interest as an explanation for

69
their responses. This is in accordance with earlier studies by Tsai and Thomas (2011) in which
they found that abstract learners place primary importance on central concepts and only attribute
importance to secondary concepts if the students’ judgement determines those concepts to be
significant.
Discussion of Concept Maps. With a few exceptions, high-performing students often created
concept maps that received high marks and illustrated a thorough understanding of the course
content. These concept maps had an abundance of cross-links, examples, and propositions. Over
time, these concept maps became progressively more intricate. For example, the same high
performing student only scored 22 points on the introductory concept mapping activity, but then
later scored 128 points on the final concept mapping activity. Low-performaning students often
created concept maps that were essentially incomplete. Most concept maps created by low-
performing students contained few prepostions, cross-links, or any additional nodes that could
reflect a hierarchical understanding of the interconnectedness of concepts. Low-performing
students submitted concept maps whose scores were never above 20 points.

Conclusions
In this study, concept mapping was explored as a metacognitive strategy to facilitate the
acquisition of concrete concepts in abstract-learning style students as well as assist in the
acquisition of abstract concepts in concrete-learning style students. It was also a goal of this
study to determine if concept mapping had any influence in changing student learning styles over
time. An analysis of the quantitative data reveals that there were no significant differences
between the control and experimental groups on the instruments used. There was no statistically
significant difference in the changes observed in student self-reported learning style between the
control and experimental groups; therefore, it cannot be concluded that concept mapping
facilitates changes in learning style over a relatively short period of time. However, a few
students did exhibit a change in learning style over the course of the study.
While concept mapping was not found to have any effect on learning style as determined
by the instrument used in this study, concept mapping as an instructional strategy still enables
students to see the hierarchical organization of complex concepts, such as those presented in
Anatomy & Physiology. While I find concordance with the meta-study of Laight (2004) which
found that complex instructional tools are effective with students of all learning styles, due to the
evidence presented within this manuscript, it can also be concluded that no single instructional
tool is sufficient to increase student performance or acquisition of concepts. The logical
extension of that conclusion is that a variety of instructional tools should be used over a course
of a semester to facilitate student performance and acquisition of concepts.
In examining the recurring themes that students identified as facilitating their
understanding, all students interviewed from all performance levels mentioned visual cues as a

71
primary explanation for their understanding. This leads me to believe that concept mapping, as a
teaching and learning tool, is useful in facilitating visual representations of scientific concepts. In
a class such as Anatomy & Physiology, where anatomical structures are identified by visual cues,
concept mapping could prove highly useful.
Potential limitations of this study include a small sample size and problems with
compliance. The small sample size can be attributed to the maximal section class size of 24
students. As only six sections were chosen for the study, there was a maximal number of 144
students who could be involved in the study. Many students chose not to consent, and some
students who did consent were noncompliant. Compliance issues ranged from students
improperly responding to surveys (therefore making an analysis of that survey impossible) to
non-attendance of scheduled interview sessions. In addition, there were a great deal of
compliance issues and protocol violations caused by the instructor of the three control group
sections. Despite being trained and instructed in proper protocol, this teaching assistant
repeatedly violated protocols (see appendix N).
In order to effectively implement this study, there would need to be one instructor of all
course sections to minimize the variability between different course sections. Even with the same
instructor, there is variability observed in virtually all sections, so it is essentially impossible to
eliminate inter-group variability. Even if inter-group variability is minimized, there will still be
serious issues with student compliance. In order to increase student compliance, pertinent
directions would need to be underlined and highlighted, students would need reminders to attend
scheduled meetings, and incentives would need to be offered to encourage student participation.
Opportunities for further study include examining other teaching and learning strategies
as methods of inciting change in student learning style and/or increasing student performance

72
and achievement as measured by overall grade within the course. It is also an implied conclusion
of this study that visual instructional strategies facilitated the acquisition of visual concepts of
students of all performance levels and learning styles. Whether that is indeed the case is a valid
point for further study.

References
Akinsanya, C. & Williams, M. (2004). Concept mapping for meaningful learning. Nurse
Education Today 24: 41-46.
Ausabel, D. (1962). A subsumption theory of meaningful verbal learning and retention. Journal
of General Psychology 66, 213-224.
Baker, C., Pesut, D., McDaniel, A., & Fisher, M. (2007). Evaluating the impact of problem-
based learning on learning styles of master's students in nursing administration. Journal
of Professional Nursing 23(4): 214-219.
Bandura, A. (1989). Human agency in social cognitive theory. American Psychologist 44(9):
1175-1184.
Binder, J.R., Westbury, C.F., McKiernan, K.A., Possing, E.T., & Medler, D.A. (2005). Distinct
brain systems for processing concrete and abstract concepts. Journal of Cognitive
Neuroscience 17(6):905-917.
Clayton, L. (2006). Concept mapping: An effective, active teaching-learning method. Nursing
Education Perspectives 27(4): 197-203.
Daley, B.J. & Torre, D.M. (2010). Concept maps in medical education: An analytical literature
review. Medical Education 44: 440-448.
Fleming, N.D. & Mills, C. (1992). Not another inventory, rather a catalyst for reflection. To
Improve the Academy, 11, 137-155.
Gijbels, D., van de Watering, G. Dochy, F., & van den Bossche, P. (2006). New learning
environments constructivism: The students' perspective. Instructional Science, 34, 213-
226.
Gurpinar, E., Alimoglu, M.K., Mamakli, S. & Aktekin, M. (2010). Can learning style predict
student satisfaction with different instruction methods and academic achievement in
medical education. Advances in Physiology Education 34: 192-196.
Harasym, P., Tsai, T.C., & Hemmati, P. (2008). Current trends in developing medical students’
critical thinking abilities. Kaohsiung Journal of Medical Science 24:7: 341-355.
Harpaz, I., C. Balik, and Ehrenfeld, M. (2004). Concept mapping: An educational strategy for
advancing nursing education. Nursing Forum 39(2): 27.
Hartman, H.J. (2001). Metacognition in learning and instruction: Theory, research, and
practice. Netherlands: Kluwer Academic Publishers.
74
Honey, P. & Mumford, A. (1982). The manual of learning styles. Maidenhead, UK: Peter Honey
Publications.
Karns, G.L. (2006). Learning style differences in the perceived effectiveness of learning
activities. Journal of Marketing Education, 28(1), 56-63. DOI:
10.1177/0273475305284641
Kinchin, I., Hay, D., & Adams, A. (2000). How a qualitative approach to concept map analysis
can be used to aid learning by illustrating patterns of conceptual development.
Educational Research 42(1): 43-57.
Kolb, D.A. (1984). Experiential learning: Experience as the source of learning and development.
Englewood Cliffs, New Jersey: Prentice-Hall.
Laight, D. W. (2006). Attitudes to concept maps as a teaching/learning activity in undergraduate
health professional education: Influence of preferred approach to learning. Medical
Teacher 28(2): 64- 67.
Mertens, Donna. (2010). Research and evaluation in education and psychology: Integrating
diversity with quantitative, qualitative, and mixed methods. Thousand Oaks, CA: Sage
Publications.
Novak, J. & Gowin, D. (1984). Learning how to learn. Cambridge, UK: Cambridge University
Press.
Piaget, J. (1977). The Essential Piaget. New York: Basic Books.
Rakoczy, M. & Money, S. (1995). Learning styles of nursing students: A 3-year cohort
longitudinal study. Journal of Professional Nursing 11(3):170-174.
Semb, G. B. & J. A. Ellis (1994). Knowledge taught in school: What is remembered? Review of
Educational Research 64(2): 253-286.
Torrance, Harry (2007). Assessment as learning? How the use of explicit learning objectives,
assessment criteria and feedback in post-secondary education and training can come to
dominate learning. Assessment in Education: Principles, Policy & Practice 14(3): 281-
294.
Tsai, C. I. & M. Thomas. (2011). When does feeling of fluency matter? Psychological Science
20:10, 1-7.
Woody, M., S. Albrecht, T. Hines, & T. Hodgson. (1999). Directed case studies in baccalaureate
nursing anatomy and physiology. Journal of Nursing Education 38(8): 383-386.

Appendices
Appendix A – Lesson plan for Endocrine/Blood
Endocrine and Blood Lesson Plan
Week of 8/29/2011
I. Materials
Endocrine Models
Endocrine Diagrams
Blood Diagrams
Blood Typing Kit
II. SCOS/NSES Objectives
III. Central Concepts
1. Hormones
A. steroid-based hormones
B. amino acid-based hormones
C. tropic hormones
2. pituitary gland (hypophysis)
A. anterior pituitary (adenohypophysis)
B. posterior pituitary (neurohypophysis)
C. infundibulum (stalk)-connects to hypothalamus
3. pineal gland
4. thyroid gland
5. parathyroid glands
6. thymus
7. adrenal glands
8. pancreas
9. gonads
IV. Engaging Preconceptions (10 minutes)
Students will engage their preconceptions by taking a diagnostic assessment to determine
their knowledge in various aspects pertaining to the endocrine system and blood
components. The diagnostic assessment will be divided into four sections: endocrine
system anatomy and physiology, endocrine system abnormalities, blood anatomy and
physiology, and blood abnormalities. At the completion of the diagnostic assessment,
student scores in each subsection will be tabulated to yield a percentage. The subsection
with the highest score will be the subsection at that the student will begin during review
stations. The student will then move through subsequent review stations according to
their score. If students have equal scores across some or all of the subsections, then
students are encouraged to wait and see how many other students will be at that station

76
during the time that they could go to that station. If the station is crowded, students
should be encouraged to attend another station.
V. Explain (Teacher-Led Instruction) (80 minutes)
The teacher led instruction will consist of a PowerPoint presentation on the endocrine
system and blood.
VI. Explore (30 minutes)
In the exploration section of the lesson plan, students will be allowed to go to one of four
separate stations: a station on endocrine system anatomy and physiology, blood
abnormalities, blood components, and endocrine system abnormalities. Students will
rotate through each station according to their scores obtained on the diagnostic
assessment. Students will spend the least amount of time at the station in that they have
the most knowledge, and the most amount of time in the station at that they have the least
knowledge, with intermediate times spent at the intermediate station. The times are as
follows:
first station - 5 min.
second station - 6:30 min.
third station - 8:30 min.
fourth station - 10 min.
Table A1. Exploration groups and themes of study
At the station involving examination of endocrine anatomy and physiology, students in
each group should be able to identify the location of the endocrine organ, the hormones it
produces, the target organs of those hormones, and the physiological effects of those
hormones. At the station involving examination of endocrine abnormalities, students in
each group should be able to identify the causes and risk factors attributing to the
disorder, the effects the disorder has upon the body, the treatment for the disorder (if
any), and the long-term effects on the body if the disorder goes untreated. At the station
involving examination of blood anatomy and physiology, students in each group should
be able to identify the characteristics of the blood cells, the location of their production,
the cause and process of their production, and the physiological functions of the blood
Station/Group Endocrine A&P Endocrine
Abnormalities
Blood A&P Blood
Abnormalities
First Group Thyroid Thyroid
Disorders
Erythrocytes Atherosclerosis
Second Group Pancreas Acromegaly Platelets Eosinophilia
Third Group Adrenal Glands Steroid Use Agranulocytes Sickle-cell
anemia
Fourth Group Pituitary Diabetes Granulocytes Hemophilia

77
cells. At the station involving examination the blood abnormalities, students in each
group should be able to identify the causes and risk factors attributing to the disorder, the
effects the disorder has upon the body, the treatment for the disorder (if any), and the
long-term effects on the body if the disorder goes untreated.
VII. Elaborate (40 minutes)
For the elaboration section of the lesson plan, each group will be called up to present
their findings to the class in 2 min. intervals, until all groups have presented their
information.
VIII. Evaluate (10 minutes)
The evaluation section of the lesson plan consists of a 10 question quiz.
IX. Dissection (30 minutes)
Students should dissect the heart along a frontal plane, dividing the heart into two
portions, so that a view of the heart can be obtained and internal structures can be
examined. Then, have students present their dissected heart to the remainder of their
table.
X. Homework
Exercise 27-functional anatomy of the endocrine glands-pages 411 - 413, questions 1 - 11
Exercise 29A-blood-pages 437-441, questions 1-4, 6-10 (with the exception of student
test results), 11-20, 22-23
XI. Lesson Reflection
1. To identify and name the major endocrine glands and tissues of the body when provided
with an appropriate diagram.
2. To list the hormones produced by the endocrine glands and discuss the general function
of each.
3. To indicate the means by that hormones contribute to the body homeostasis by giving
appropriate examples of hormonal actions.
4. To cite mechanisms by that the endocrine glands are stimulated to release their hormones.
5. To describe the structural and functional relationship between the hypothalamus and
pituitary.
6. To describe a major pathological consequence of hyper secretion and hypo secretion of
several of the hormones considered.

78
Appendix B – IRB Approved Informed Consent Form for Study

79
Appendix C – Unit One Content Survey Scoring Rubric
1. Explain the process by that aldosterone increases blood pressure.
-Increases Mineral absorption
-Increases osmosis of water from urine
-Increased fluid retention
2. Identify the endocrine glands shown on the projector.
A. ________________Thyroid
B. ________________Adrenal
C. ________________Hypothalamus
3. Why would an individual with a parathyroid tumor suffer from osteoporosis?
-Increased PTH hormone secretion
-Increased bone breakdown
-Reduction of bone strength
4. Identify the Blood Vessels shown on the projector.
A. ________________ Common Carotid Artery
B. ________________ Abdominal Aorta
C. ________________Femoral Artery
5. Why would a heart attack caused by a blockage in the left coronary arteries be more severe
than a blockage in the right coronary arteries?
-Decreased blood supply to heart muscle
-Left side of heart supplies blood to body
- Right side of heart supplies blood to lungs
6. Identify the structures of the heart shown on the projector.
A. ________________ Pulmonary Semilunar Valve
B. ________________ Mitral (bicuspid) valve
C. ________________ Pulmonary Veins
7. Why does the thoracic duct return lymph to the subclavian veins?
- Reduced Blood Pressure in veins
- Lymph flows passively due to skeletal muscle movement
-Lymph fluid has little pressure
8. Identify the blood cell types shown on the projector (be specific).
A. ________________ Eosinophil
B. ________________ Lymphocyte
C. ________________ Thromobocytes
9. Why would a patient with kidney problems be anemic?
-Kidney produces erythropoietin
- Erythropoietin causes Erythropoesis (blood cell generation)
- No erythropoietin= no blood cells = anemia

80
10. Identify the structures shown on the projector.
A. ________________ Inguinal Lymph Nodes
B. ________________ Thymus
C. ________________ Cisterna Chylii

81
Appendix D – Unit Two Content Survey Scoring Rubric
1. Explain the process of pulmonary ventilation in terms of volume and pressure changes
occurring within the thorax.
- increase volume, decrease pressure in inhalation
- air flows from area of high pressure to area of low pressure
- decrease volume, increase pressure in exhalation
2. Identify the respiratory structures shown on the projector
A. ________________ (thyroid cartilage)
B. ________________ (cardiac notch)
C. ________________ (segmental bronchi)
3. Why does oxygen diffuse into the blood in the alveoli?
- air flows from area of high pressure to area of low pressure
- partial pressure of oxygen in the alveoli is higher than blood
- oxygen flows from alveoli into blood
4. List the three regions of the pharynx from most superior to most inferior
A. ________________ (Nasopharynx)
B. ________________ ( Oropharynx)
C. ________________ (Laryngopharynx)
5. Why would a person who has had their gallbladder removed have difficulty digesting fatty
foods?
-gallbladder stores and concentrates bile
- bile emulsifies fats
- without gallbladder, fats pass undigested through GI tract
6. Identify the structures of the digestive system shown on the projector.
A. ________________ (pancreatic duct)
B. ________________ (cystic duct)
C. ________________ (hepatopancreatic ampulla)
7. Why would a person not be able to survive without the pancreas?
-pancreas produces enzymes essential for digestion
-pancreas produces bicarbonate to neutralize chyme from stomach
- without pancreas digestion wouldn't occur and small intestine would be destroyed by acid
8. Identify the following cell types based upon their description.
A. ________________ (secrete mucus) - goblet
B. ________________ (produce HCl) - parietal
C. ________________ (form the alveolar wall) - squamous alveolar
9. Most blood pressure drugs are diuretics. How do diuretics lower the blood pressure?
-diuretics increase mineral excretion

82
- increased rate of osmosis due to hypertonic urine
- increased fluid excretion lowers blood volume
10. Identify the urinary system structures shown on the projector.
A. Renal Pyramid
B. Bowman's/Glomerular Capsule
C. Urethra

83
Appendix E – Unit Three Content Survey Scoring Rubric
1. Explain the process of negative feedback of Inhibin on the production of gonadotropins.
-Inhibin is produced by the gonads to
-Stop the production of gonadotropins
-released from the anterior pituitary
2. Identify the male reproductive structures shown on the projector.
A. ________________ (Ductus (vas) deferens)
B. ________________ (Tunica albuginea)
C. ________________(Corpus Spongiosum)
3. Why does exogenous testosterone (i.e. anabolic steroids) cause gynecomastia?
-Exogenous testosterone causes the body to produce excess estrogen
-via conversion of the excess testosterone to estrogen via aromatase enzyme, that leads to
-development of breast tissue because of heightened estrogen levels
4. Identify the female reproductive structures shown on the projector
A. ________________(Fallopian (Uterine) tube)
B. ________________(Vagina (Vaginal) Canal)
C. ________________(Great vestibular gland)
5. Explain the process by that spina bifida occurs and how it can be prevented.
-Spina bifida is caused by incomplete closure of the caudal end of the neural tube, leading to
-Malformation of the spinal column during the process of neurulation in the neurula
-Can be prevented by pre-natal vitamin supplementation (specifically folate)
6. Identify the structures of the embryonic development structures shown on the projector.
A. ________________(Amnion(tic sac))
B. ________________(Yolk sac)
C. ________________(Blastula (cavity))
7. Why and how would an amniocentesis show genetic abnormalities?
-An amniocentesis is a sampling of amniotic fluid and cells, that are
-derived from the same cells as an embryo, from that
-genetic information can be obtained and tested for abnormalities
8. Identify the embryonic structures.
A. ________________ (germ layer)- ectoderm
B. ________________ (maternal portion of the placenta) - decidua basalis
C. ________________ (embryonic stage at that neurulation occurs) – neurula
9. How does the "morning after" pill (RU-486) prevent a pregnancy?
-The morning after pill prevents a pregnancy by blocking the action of progesterone, that
-makes the stratum functionalis of the uterus unsuitable for implantation by the
-blastocyst stage and the embryo passes out of the uterus

84
10. Identify the genetics structures shown on the projector.
A. Karyotype
B. Chiasma
C. Chromosome

85
Appendix F – Informed Consent Form for Interviews

86
Appendix G – Unit One Content Interview Protocol
General Directions
1. “Thank you for coming and agreeing to participate in these interviews. The purpose of
these interviews will be to trace your thinking processes and the methods through that
you answer a question. This material will not be graded and doesn’t affect your grade in
any manner.”
2. Give student consent form for interview and audio recording. If student has any
questions, answer them appropriately. If the student declines to sign interview consent
form, then say, “well thank you for coming, but I cannot use the information garnered
from this interview without your consent, I appreciate your willingness to assist me in my
research goals”, then dismiss student. If student understands and signs consent form,
proceed to step 3.
3. Begin recording. “I will be recording these interviews so that I may understand and
record your answers and your responses to how you trace those answers. Only the audio
will be used from this recording and all identifying information will be removed. Are
there any questions about privacy?” Answer student’s questions appropriately.
4. “I will be asking you the same questions to that you responded during the group
interview sessions, but you will have an unlimited time in that to answer them. After you
have given your answer, please thoroughly explain how you arrived at that answer by
tracing your thinking process. Are there any questions before we begin?” Answer
student’s questions appropriately.
5. “Let us begin with question 1.”
1. Explain the process by that aldosterone increases blood pressure.
A. After student’s explanation, go to B.
B. “Please trace the thinking process that you go through in order to answer that
question.”
C. If student does not provide enough detail, say “Could you tell me more about how
you were able to answer that question?”
2. Identify the endocrine glands shown on the projector.
A. ________________ (ask student to identify structure A on projector)
B. ________________ (ask student to identify structure B on projector)
C. ________________ (ask student to identify structure C on projector)
i. After student’s explanation, go to ii.
ii. “Please trace the thinking process that you go through in order to answer that
question.”
iii. If student does not provide enough detail, say “Could you tell me more about
how you were able to answer that question?”
3. Why would an individual with a parathyroid tumor suffer from osteoporosis?
A. After student’s explanation, go to B.
B. “Please trace the thinking process that you go through in order to answer that
question.”

87
C. If student does not provide enough detail, say “Could you tell me more about how
you were able to answer that question?”
4. Identify the Blood Vessels shown on the projector.
A. ________________ (ask student to identify structure A on projector)
B. ________________ (ask student to identify structure B on projector)
C. ________________ (ask student to identify structure C on projector)\
i. After student’s explanation, go to ii.
ii. “Please trace the thinking process that you go through in order to answer that
question.”
iii. If student does not provide enough detail, say “Could you tell me more about
how you were able to answer that question?”
5. Why would a heart attack caused by a blockage in the left coronary arteries be more severe
than a blockage in the right coronary arteries?
A. After student’s explanation, go to B.
B. “Please trace the thinking process that you go through in order to answer that
question.”
C. If student does not provide enough detail, say “Could you tell me more about how
you were able to answer that question?”
6. Identify the structures of the heart shown on the projector.
A. ________________ (ask student to identify structure A on projector)
B. ________________ (ask student to identify structure B on projector)
C. ________________ (ask student to identify structure C on projector)
i. After student’s explanation, go to ii.
ii. “Please trace the thinking process that you go through in order to answer that
question.”
iii. If student does not provide enough detail, say “Could you tell me more about
how you were able to answer that question?”
7. Why does the thoracic duct return lymph to the subclavian veins?
A. After student’s explanation, go to B.
B. “Please trace the thinking process that you go through in order to answer that
question.”
C. If student does not provide enough detail, say “Could you tell me more about how
you were able to answer that question?”
8. Identify the blood cell types shown on the projector (be specific).
A. ________________ (ask student to identify structure A on projector)
B. ________________ (ask student to identify structure B on projector)
C. ________________ (ask student to identify structure C on projector)
i. After student’s explanation, go to ii.
ii. “Please trace the thinking process that you go through in order to answer that
question.”

88
iii. If student does not provide enough detail, say “Could you tell me more about
how you were able to answer that question?”
9. Why would a patient with kidney problems be anemic?
A. After student’s explanation, go to B.
B. “Please trace the thinking process that you go through in order to answer that
question.”
C. If student does not provide enough detail, say “Could you tell me more about how
you were able to answer that question?”
10. Identify the structures shown on the projector.
A. ________________ (ask student to identify structure A on projector)
B. ________________ (ask student to identify structure B on projector)
C. ________________ (ask student to identify structure C on projector)
i. After student’s explanation, go to ii.
ii. “Please trace the thinking process that you go through in order to answer that
question.”
iii. If student does not provide enough detail, say “Could you tell me more about
how you were able to answer that question?”

89
Appendix H – Unit Two Content Interview Protocol
General Directions
1. “Thank you for coming and agreeing to participate in these interviews. The purpose
of these interviews will be to trace your thinking processes and the methods through
that you answer a question. This material will not be graded and doesn’t affect your
grade in any manner.”
2. Give student consent form for interview and audio recording. If student has any
questions, answer them appropriately. If the student declines to sign interview
consent form, then say, “well thank you for coming, but I cannot use the information
garnered from this interview without your consent, I appreciate your willingness to
assist me in my research goals”, then dismiss student. If student understands and
signs consent form, proceed to step 3.
3. Begin recording. “I will be recording these interviews so that I may understand and
record your answers and your responses to how you trace those answers. Only the
audio will be used from this recording and all identifying information will be
removed. Are there any questions about privacy?” Answer student’s questions
appropriately.
4. “I will be asking you the same questions to that you responded during the group
interview sessions, but you will have an unlimited time in that to answer them. After
you have given your answer, please thoroughly explain how you arrived at that
answer by tracing your thinking process. Are there any questions before we begin?”
Answer student’s questions appropriately.
5. “Let us begin with question 1.”
1. Explain the process of pulmonary ventilation in terms of volume and pressure changes
occurring within the thorax?
A. After student’s explanation, go to B.
D. “Please trace the thinking process that you go through in order to answer that
question.”
E. If student does not provide enough detail, say “Could you tell me more about how
you were able to answer that question?”
2. Identify the respiratory structures shown on the projector
A. ________________ (ask student to identify structure A on projector)
B. ________________ (ask student to identify structure B on projector)
C. ________________ (ask student to identify structure C on projector)
i. After student’s explanation, go to ii.
iv. “Please trace the thinking process that you go through in order to answer that
question.”
v. If student does not provide enough detail, say “Could you tell me more about
how you were able to answer that question?”
3. Why does oxygen diffuse into the blood in the alveoli?
A. After student’s explanation, go to B.

90
D. “Please trace the thinking process that you go through in order to answer that
question.”
E. If student does not provide enough detail, say “Could you tell me more about how
you were able to answer that question?”
4. List the three regions of the pharynx from most superior to most inferior
A. ________________ (ask student to identify structure A on projector)
B. ________________ (ask student to identify structure B on projector)
C. ________________ (ask student to identify structure C on projector)\
i. After student’s explanation, go to ii.
iv. “Please trace the thinking process that you go through in order to answer that
question.”
v. If student does not provide enough detail, say “Could you tell me more about
how you were able to answer that question?”
5. Why would a person who has had their gallbladder removed have difficulty digesting fatty
foods?
A. After student’s explanation, go to B.
D. “Please trace the thinking process that you go through in order to answer that
question.”
E. If student does not provide enough detail, say “Could you tell me more about how
you were able to answer that question?”
6. Identify the structures of the digestive system shown on the projector.
A. ________________ (ask student to identify structure A on projector)
B. ________________ (ask student to identify structure B on projector)
C. ________________ (ask student to identify structure C on projector)
i. After student’s explanation, go to ii.
iv. “Please trace the thinking process that you go through in order to answer that
question.”
v. If student does not provide enough detail, say “Could you tell me more about
how you were able to answer that question?”
7. Why would a person not be able to survive without the pancreas?
A. After student’s explanation, go to B.
D. “Please trace the thinking process that you go through in order to answer that
question.”
E. If student does not provide enough detail, say “Could you tell me more about how
you were able to answer that question?”
8. Identify the following cell types based upon their description.
A. ________________ (ask student to identify structure A on projector)
B. ________________ (ask student to identify structure B on projector)
C. ________________ (ask student to identify structure C on projector)
i. After student’s explanation, go to ii.

91
iv. “Please trace the thinking process that you go through in order to answer that
question.”
v. If student does not provide enough detail, say “Could you tell me more about
how you were able to answer that question?”
9. Most blood pressure drugs are diuretics. How do diuretics lower the blood pressure?
A. After student’s explanation, go to B.
D. “Please trace the thinking process that you go through in order to answer that
question.”
E. If student does not provide enough detail, say “Could you tell me more about how
you were able to answer that question?”
10. Identify the urinary system structures shown on the projector.
A. ________________ (ask student to identify structure A on projector)
B. ________________ (ask student to identify structure B on projector)
C. ________________ (ask student to identify structure C on projector)
i. After student’s explanation, go to ii.
iv. “Please trace the thinking process that you go through in order to answer that
question.”
v. If student does not provide enough detail, say “Could you tell me more about
how you were able to answer that question?”

92
Appendix I – Unit Three Content Interview Protocol
General Directions
1. “Thank you for coming and agreeing to participate in these interviews. The purpose of
these interviews will be to trace your thinking processes and the methods through that
you answer a question. This material will not be graded and doesn’t affect your grade in
any manner.”
2. Give student consent form for interview and audio recording. If student has any
questions, answer them appropriately. If the student declines to sign interview consent
form, then say, “well thank you for coming, but I cannot use the information garnered
from this interview without your consent, I appreciate your willingness to assist me in my
research goals”, then dismiss student. If student understands and signs consent form,
proceed to step 3.
3. Begin recording. “I will be recording these interviews so that I may understand and
record your answers and your responses to how you trace those answers. Only the audio
will be used from this recording and all identifying information will be removed. Are
there any questions about privacy?” Answer student’s questions appropriately.
4. “I will be asking you the same questions to that you responded during the group
interview sessions, but you will have an unlimited time in that to answer them. After you
have given your answer, please thoroughly explain how you arrived at that answer by
tracing your thinking process. Are there any questions before we begin?” Answer
student’s questions appropriately.
5. “Let us begin with question 1.”
1. Explain the process of negative feedback of Inhibin on the production of gonadotropins.
A. After student’s explanation, go to B.
F. “Please trace the thinking process that you go through in order to answer that
question.”
G. If student does not provide enough detail, say “Could you tell me more about how
you were able to answer that question?”
2. Identify the male reproductive structures shown on the projector.
A. ________________ (ask student to identify structure A on projector)
B. ________________ (ask student to identify structure B on projector)
C. ________________ (ask student to identify structure C on projector)
i. After student’s explanation, go to ii.
vi. “Please trace the thinking process that you go through in order to answer that
question.”
vii. If student does not provide enough detail, say “Could you tell me more about
how you were able to answer that question?”
3. Why does exogenous testosterone (i.e. anabolic steroids) cause gynecomastia?
A. After student’s explanation, go to B.
F. “Please trace the thinking process that you go through in order to answer that
question.”

93
G. If student does not provide enough detail, say “Could you tell me more about how
you were able to answer that question?”
4. Identify the female reproductive structures shown on the projector
A. ________________ (ask student to identify structure A on projector)
B. ________________ (ask student to identify structure B on projector)
C. ________________ (ask student to identify structure C on projector)\
i. After student’s explanation, go to ii.
vi. “Please trace the thinking process that you go through in order to answer that
question.”
vii. If student does not provide enough detail, say “Could you tell me more about
how you were able to answer that question?”
5. Explain the process by that spina bifida occurs and how it can be prevented.
A. After student’s explanation, go to B.
F. “Please trace the thinking process that you go through in order to answer that
question.”
G. If student does not provide enough detail, say “Could you tell me more about how
you were able to answer that question?”
6. Identify the structures of the embryonic development structures shown on the projector.
A. ________________ (ask student to identify structure A on projector)
B. ________________ (ask student to identify structure B on projector)
C. ________________ (ask student to identify structure C on projector)
i. After student’s explanation, go to ii.
vi. “Please trace the thinking process that you go through in order to answer that
question.”
vii. If student does not provide enough detail, say “Could you tell me more about
how you were able to answer that question?”
viii.
7. Why and how would an amniocentesis show genetic abnormalities?
A. After student’s explanation, go to B.
F. “Please trace the thinking process that you go through in order to answer that
question.”
G. If student does not provide enough detail, say “Could you tell me more about how
you were able to answer that question?”
8. Identify the embryonic structures.
A. ________________ (ask student to identify structure A on projector)
B. ________________ (ask student to identify structure B on projector)
C. ________________ (ask student to identify structure C on projector)
i. After student’s explanation, go to ii.
vi. “Please trace the thinking process that you go through in order to answer that
question.”
vii. If student does not provide enough detail, say “Could you tell me more about
how you were able to answer that question?”

94
9. How does the "morning after" pill (RU-486) prevent a pregnancy?
A. After student’s explanation, go to B.
F. “Please trace the thinking process that you go through in order to answer that
question.”
G. If student does not provide enough detail, say “Could you tell me more about how
you were able to answer that question?”
10. Identify the genetics structures shown on the projector.
A. ________________ (ask student to identify structure A on projector)
B. ________________ (ask student to identify structure B on projector)
C. ________________ (ask student to identify structure C on projector)
i. After student’s explanation, go to ii.
vi. “Please trace the thinking process that you go through in order to answer that
question.”
vii. If student does not provide enough detail, say “Could you tell me more about
how you were able to answer that question?”

95
Appendix J – Introductory Concept Mapping Activity

96

97
Appendix K – Concept Mapping Activity One

98
Appendix L – Concept Mapping Activity Two

99
Appendix M - Final Concept Mapping Activity Powerpoint
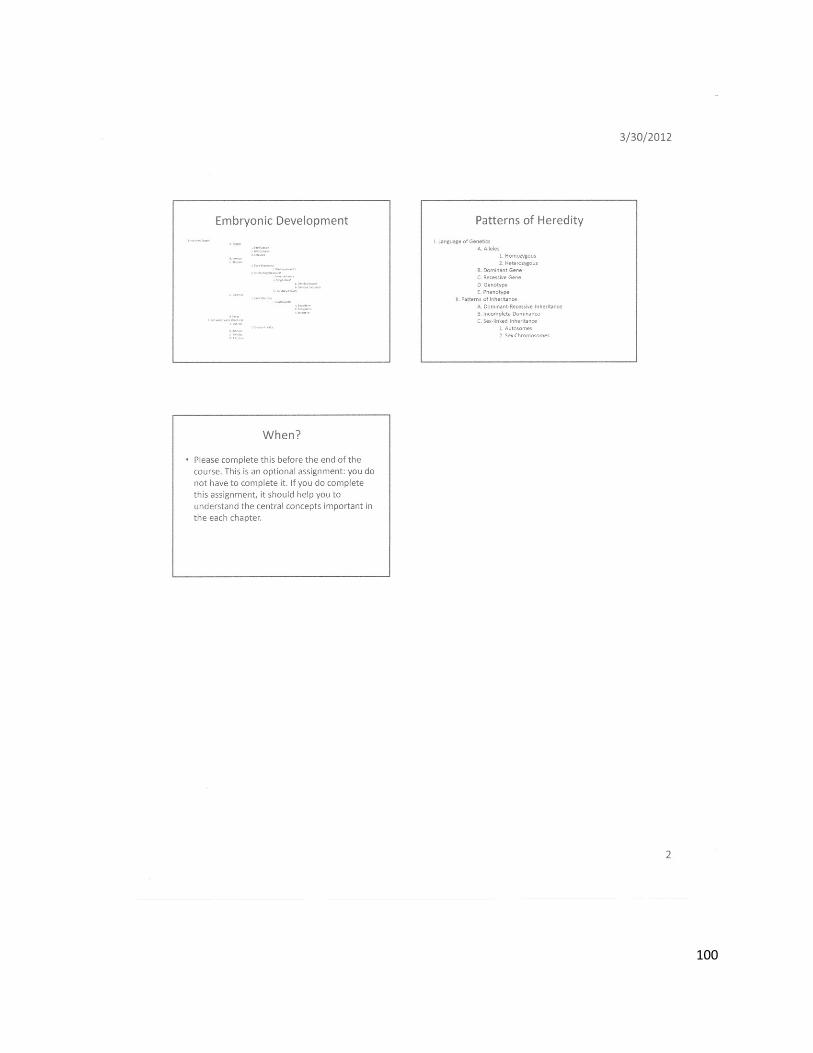
100

101
Appendix N – Protocol Violations
Protocol for Lesson Plan Validation
Anatomy of the Reproductive System
Section 006
October 17, 2011
I. Central Concepts
Were all central concepts mentioned within the lecture? Yes
If not, please note that concepts were not covered:
II. Engaging Preconceptions
Was the diagnostic assessment administered? No
Were the answers given after completion of the diagnostic assessment? No
III. Explain (Teacher-Led Instruction)
Was the lesson PowerPoint presented? Yes
What was the length of time spent on the lecture PowerPoint? 64 minutes
IV. Elaborate
Did students complete rotation through all stations? No
V. Explore
Did students present all information that they learned during the elaboration activity? No
VI. Evaluate
Was the quiz given after the elaboration activity? Yes
VII. Homework
Was the homework assignment for the week announced to the class in some form or fashion?
Yes
VIII. Protocol Violations
Was any given protocol violated in any way? If so, how? Please list all steps taken to prevent
further protocol violation.

102
Protocol was violated due the fact that neither the diagnostic assessment nor the unit two
content survey was administered to the students. The teaching assistant asked the students “do
you really want to do this or wait until next week?” The students as a whole responded “Let’s
wait until next week”. The teaching assistant completely skipped administering the diagnostic
assessment and at the completion of the lecture, a quiz was given and students were dismissed.
Upon review of the recording, the researcher contacted the teaching assistant and informed him
that he must follow protocol. To ensure that protocol was followed, the researcher attended the
class section the following week.

103
Protocol for Lesson Plan Validation
Embryonic Development
Section 006
November 7, 2011
I. Central Concepts
Were all central concepts mentioned within the lecture? Yes
If not, please note that concepts were not covered:
II. Engaging Preconceptions
Was the diagnostic assessment administered? No
Were the answers given after completion of the diagnostic assessment? No
III. Explain (Teacher-Led Instruction)
Was the lesson PowerPoint presented? Yes
What was the length of time spent on the lecture PowerPoint? 47 minutes
IV. Elaborate
Did students complete rotation through all stations? No
V. Explore
Did students present all information that they learned during the elaboration activity? No
VI. Evaluate
Was the quiz given after the elaboration activity? Yes
VII. Homework
Was the homework assignment for the week announced to the class in some form or fashion?
Yes
VIII. Protocol Violations
Was any given protocol violated in any way? If so, how? Please list all steps taken to prevent
further protocol violation.
Protocol was violated due the fact that neither the diagnostic assessment nor the unit two
content survey was administered to the students. The researcher attended to administer the unit
two content survey, however, the eight students who consented to participate felt that they were
inconveniencing the other members of the class, therefore, they declined to participate any

104
further in the study. The students agreed to allow the researcher to use their grades for
comparison. The researcher then left the classroom. Again, the teaching assistant completely
skipped administering the diagnostic assessment and at the completion of the lecture, a quiz was
given and students were dismissed. Upon review of the recording, the researcher contacted the
teaching assistant and informed him that he must follow protocol. The teaching assistant’s
response was that he didn’t feel as if he had to follow protocol as those students were no longer
participating in the study. In order to maintain fairness between all course sections, it was
explained to the teaching assistant that all students should have the same lesson.

105
Protocol for Lesson Plan Validation
Exam 3 Test Administration
Section 006
November 28, 2011
I. Central Concepts
Were all central concepts mentioned within the lecture? N/A
If not, please note that concepts were not covered:
II. Engaging Preconceptions
Was the diagnostic assessment administered? N/A
Were the answers given after completion of the diagnostic assessment? N/A
III. Explain (Teacher-Led Instruction)
Was the lesson PowerPoint presented? N/A
What was the length of time spent on the lecture PowerPoint? N/A
IV. Elaborate
Did students complete rotation through all stations? N/A
V. Explore
Did students present all information that they learned during the elaboration activity? N/A
VI. Evaluate
Was the quiz given after the elaboration activity? N/A
VII. Homework
Was the homework assignment for the week announced to the class in some form or fashion?
N/A
VIII. Protocol Violations
Was any given protocol violated in any way? If so, how? Please list all steps taken to prevent
further protocol violation.
Protocol was violated due the fact that the teaching assistant placed additional diagrams
and pictures on only his sections administrations of Exam 3. This was discovered after the fact
on November 29, 2011 when the teaching assistant was administering Exam 3 to section 005.

106
Protocol for Lesson Plan Validation
Exam 3 Test Administration
Section 005
November 29, 2011
I. Central Concepts
Were all central concepts mentioned within the lecture? N/A
If not, please note that concepts were not covered:
II. Engaging Preconceptions
Was the diagnostic assessment administered? N/A
Were the answers given after completion of the diagnostic assessment? N/A
III. Explain (Teacher-Led Instruction)
Was the lesson PowerPoint presented? N/A
What was the length of time spent on the lecture PowerPoint? N/A
IV. Elaborate
Did students complete rotation through all stations? N/A
V. Explore
Did students present all information that they learned during the elaboration activity? N/A
VI. Evaluate
Was the quiz given after the elaboration activity? N/A
VII. Homework
Was the homework assignment for the week announced to the class in some form or fashion?
N/A
VIII. Protocol Violations
Was any given protocol violated in any way? If so, how? Please list all steps taken to prevent
further protocol violation.
Protocol was violated due the fact that the teaching assistant placed additional diagrams
and pictures on only his section’s administrations of Exam 3. This was discovered on November
29, 2011 when the teaching assistant was administering Exam 3 to section 005. This was
discovered prior to the administration of the exam. The teaching assistant was told to remove the

107
images and the researcher stayed to verify that the teaching assistant didn’t place the diagrams
again. The researcher also attended the administration of that teaching assistant’s Section 003
exam on Wednesday to verify that protocol was followed.