Concentration measurement in a road tunnel as a method to assess “real-world” vehicles exhaust...
13
Atmospheric Environment 40 (2006) 1242–1254 Concentration measurement in a road tunnel as a method to assess ‘‘real-world’’ vehicles exhaust emissions G. Zanini a, , M. Berico a , F. Monforti a , L. Vitali a , S. Zambonelli a , S. Chiavarini b , T. Georgiadis c , M. Nardino c a ENEA, PROT-INN C.R. di Bologna, via Martiri di Monte Sole, 4-I-40129 Bologna, Italy b ENEA, PROT-CHIM, C.R. Casaccia, SP Anguillarese, Santa Maria di Galeria, Roma, Italy c IBIMET-CNR, National Research Council, Institute of Biometeorology, Via Gobetti 101, I 40129 Bologna, Italy Received 28 February 2005; received in revised form 12 October 2005; accepted 14 October 2005 Abstract An experiment aimed at comparing particulate matter (PM) and polycyclic aromatic hydrocarbons (PAHs) concentrations produced in a road tunnel by buses is described. The experiment took place in 2001 in Bologna when a couple of buses belonging to the public transport fleet where driven backwards and forwards in a road tunnel closed to all other vehicles. Buses run in the tunnel for 8 h a day for 4 experiment days, each day using a different fuel: biodiesel, diesel–water emulsion, diesel–water emulsion with low sulphur content and commercial diesel. Average daily concentrations of PM of different sizes and of 12 PHAs were measured and comparison between different fuels was attempted in order to assess ‘‘real-world’’ exhaust emissions of different fuels. Due to heterogeneity of experimental conditions in different days and the relatively large measurement uncertainties, the effort was only partially successful, and it was not possible to state any firm conclusion on fuels reliability even if some indications in agreement with literature were found. Nevertheless, the experiment and the data analysis method developed could be of interest as a methodological approach for future experiments aimed at evaluating ‘‘real-world’’ exhaust emissions of single vehicles. r 2005 Elsevier Ltd. All rights reserved. Keywords: Particulate matter; Bus engines; PAHs; Biodiesel blend; Water diesel emulsion; Lungs deposition; Real-world experiment 1. Introduction Although in the last few years traffic emissions have been decreasing due to the improvement of the engines, fuels and pre or post emissions treatment devices, mobile emissions remain the main pressure factor for the atmosphere and cause of poor air quality in the urban environment. As far as particulate matter (PM) is concerned, it has been stated (Ntziachristos and Samaras, 2003) that ‘‘reductions brought by technology improvements were not consistently accompanied by decreases in total particle number concentration and surface area’’. Other authors (Kittelson, 1998; Kittelson and Abdul-Khalek, 1999) also observed that, as an unexpected effect of the introduction of new low-particle mass emission diesel engines, nanopar- ticles emissions did not decrease along with mass ARTICLE IN PRESS www.elsevier.com/locate/atmosenv 1352-2310/$ - see front matter r 2005 Elsevier Ltd. All rights reserved. doi:10.1016/j.atmosenv.2005.10.034 Corresponding author. Tel.: +39 051 6098121; fax: +39 051 6098675. E-mail address: [email protected] (G. Zanini).
Transcript of Concentration measurement in a road tunnel as a method to assess “real-world” vehicles exhaust...
ARTICLE IN PRESS
1352-2310/$ - se
doi:10.1016/j.at
�Correspondfax: +39051 60
E-mail addr
Atmospheric Environment 40 (2006) 1242–1254
www.elsevier.com/locate/atmosenv
Concentration measurement in a road tunnel as a method toassess ‘‘real-world’’ vehicles exhaust emissions
G. Zaninia,�, M. Bericoa, F. Monfortia, L. Vitalia, S. Zambonellia, S. Chiavarinib,T. Georgiadisc, M. Nardinoc
aENEA, PROT-INN C.R. di Bologna, via Martiri di Monte Sole, 4-I-40129 Bologna, ItalybENEA, PROT-CHIM, C.R. Casaccia, SP Anguillarese, Santa Maria di Galeria, Roma, Italy
cIBIMET-CNR, National Research Council, Institute of Biometeorology, Via Gobetti 101, I 40129 Bologna, Italy
Received 28 February 2005; received in revised form 12 October 2005; accepted 14 October 2005
Abstract
An experiment aimed at comparing particulate matter (PM) and polycyclic aromatic hydrocarbons (PAHs)
concentrations produced in a road tunnel by buses is described. The experiment took place in 2001 in Bologna when a
couple of buses belonging to the public transport fleet where driven backwards and forwards in a road tunnel closed to all
other vehicles. Buses run in the tunnel for 8 h a day for 4 experiment days, each day using a different fuel: biodiesel,
diesel–water emulsion, diesel–water emulsion with low sulphur content and commercial diesel. Average daily
concentrations of PM of different sizes and of 12 PHAs were measured and comparison between different fuels was
attempted in order to assess ‘‘real-world’’ exhaust emissions of different fuels. Due to heterogeneity of experimental
conditions in different days and the relatively large measurement uncertainties, the effort was only partially successful, and
it was not possible to state any firm conclusion on fuels reliability even if some indications in agreement with literature
were found. Nevertheless, the experiment and the data analysis method developed could be of interest as a methodological
approach for future experiments aimed at evaluating ‘‘real-world’’ exhaust emissions of single vehicles.
r 2005 Elsevier Ltd. All rights reserved.
Keywords: Particulate matter; Bus engines; PAHs; Biodiesel blend; Water diesel emulsion; Lungs deposition; Real-world experiment
1. Introduction
Although in the last few years traffic emissionshave been decreasing due to the improvement of theengines, fuels and pre or post emissions treatmentdevices, mobile emissions remain the main pressurefactor for the atmosphere and cause of poor air
e front matter r 2005 Elsevier Ltd. All rights reserved
mosenv.2005.10.034
ing author. Tel.: +39 051 6098121;
98675.
ess: [email protected] (G. Zanini).
quality in the urban environment. As far asparticulate matter (PM) is concerned, it has beenstated (Ntziachristos and Samaras, 2003) that‘‘reductions brought by technology improvementswere not consistently accompanied by decreases intotal particle number concentration and surfacearea’’. Other authors (Kittelson, 1998; Kittelsonand Abdul-Khalek, 1999) also observed that, as anunexpected effect of the introduction of newlow-particle mass emission diesel engines, nanopar-ticles emissions did not decrease along with mass
.
ARTICLE IN PRESSG. Zanini et al. / Atmospheric Environment 40 (2006) 1242–1254 1243
emissions but they seemed to increase and that thenumber of particles formed was very sensitive to thenature of dilution process.
In studies collected for regulatory purposes,particles in engines exhaust emissions are sampledon filters or analysed by other more sophisticatedinstruments after dilution in pre-heated air andsplitting. The emissions measured during these testsusually refer to an idealized situation where thegases and PM are spilled directly from the exhaustpipe and the driving cycles are far from the real useon the road (dynamometer tests).
On the contrary, it is well known that the emi-ssions depend both on the fuel and on the vehicle sothat the latter could annihilate the boasted proper-ties of better fuels (Durbin et al., 2000) and that the‘‘standard’’ procedure surely effective for measuringgases, probably interferes deeply with the nature ofthe particulates. For this reason, in last few years anumber of measurements have been performed inroad tunnels (see Colberg et al., 2005 and thereferences therein) in order to assess the so-called‘‘real-world’’ vehicles emission factors. These stu-dies usually involve measuring pollutants concen-tration inside in-use road tunnels together withnumber, speed and category (light or heavy dutyvehicles) of vehicles passing in the tunnel. Emissionfactors are then computed on the basis of concen-tration gradients inside the tunnel and assigned todifferent vehicle categories by means of linearregression.
The experiment described in this paper differsfrom these ‘‘classical’’ road tunnel emission assess-ments as it deals with emissions from a single coupleof buses and it is intended to highlight differences inemissions due to different fuels: a couple of dieselbuses representative of the Bologna TransportationAuthority fleet were driven for about 8 h a daybackwards and forwards in a dedicated (withoutany other source) 400m long road tunnel. The buseswere fuelled on different days with standardcommercial diesel, water–diesel emulsion, water–low sulphur diesel emulsion and biodiesel blend, asfound on the Italian market, respectively and threefeatures of high interest for the PM health impactwere investigated, namely the PM size distribution,its polycyclic aromatic hydrocarbons (PAHs) con-tent and the amount of PAHs carried inside therespiratory tract by particle. Although a specificdata analysis procedure was designed and applied tothe concentration data measured in order to makecomparable measurements performed in different
environmental conditions, due to the large uncer-tainties involved in the experiment and the limitednumber of measurements, no attempt to evaluateabsolute emission factor values was made and onlypollutants excess concentrations induced by buses indifferent days were compared.
2. Materials and methods
2.1. Experiment plan
A couple of IVECO FIAT 480.12.21/115/AP/Pbuses, both registered in 1989, having a mileage ofabout 580,000 km and routinely employed in theBologna public transport network, driven in a roadtunnel, closed to all other traffic, for about 8 h,roughly from 9 a.m to 1 p.m. and from 2 p.m. to 5p.m,. for four non-consecutive days at mid-July2001. Buses ran in the tunnel only few meters fromeach other on an identical closed loop path with thesame speed cycle, including a short stop near themiddle of the tunnel and were loaded with a numberof water tanks simulating the weight of about 30passengers.
At the experiment time the tunnel was a brandnew double road tunnel not yet open to publictraffic located in the northern surrounding ofBologna and only the left tunnel was involved inthe experiment. The tunnel is 400-m long (seeFig. 1), about 16-m wide with a roughly semicircularsection and both tunnel ends were hundreds ofmeters far from any other air pollution source, theclosest heavy traffic road being located more than800m far away. Between each measurement dayand the next one there was at least a 1-day breakduring which the tunnel ventilation system wasturned on in order to eliminate any residualpollution.
Buses were powered with different kinds of diesel-based fuels in different days. On 18th July, a blendof 25% biodiesel and 75% diesel (BD in thefollowing) was used to power the buses. On 20thJuly, an emulsion of diesel and water containing88% of diesel, 10% water and around 2% ofaddictives was employed (DW in the following). On24th July, a diesel–water emulsion with a sulphurcontent (30 ppm) sensibly lower than the dieselemployed in the previous emulsion was employed(DWLS in the following). Finally, the diesel fuel (D)commonly employed by the Bologna Transporta-tion Authority in everyday bus service was em-ployed on the last experiment day (26th July).
ARTICLE IN PRESS40
0 m
108
m82
.4 m
205.
2 m
1.0 m
13 m
E
SAh:1.9 m
MKII
HVF
2.4 m
1.6 m1.0
m
SW
NE
Fig. 1. Experimental setup inside the tunnel. Particle samplers
(MKII and HVF) were placed roughly in the tunnel centre,
whereas sonic anemometer (SA) was positioned 108m from the
North-East tunnel opening.
PAH in fuels
0
100
200
300
400
500
600
700
800
BioDiesel
Con
cent
ratio
n (u
g/g
)
D-Water D-Water low S Diesel
OthersBenzo(a)anthracenePyreneFluorantheneAnthracenePhenanthrene
Fig. 2. PAH content and chemical profile of the fuels used
through the experiment.
G. Zanini et al. / Atmospheric Environment 40 (2006) 1242–12541244
The fuels were provided by producers on the basisof normal commercial relations and were represen-tative of the products available at the experimenttime. No special information was given to producersabout the use of their products before fuel stockswere delivered. Fuels samples were analyzed in theENEA chemical laboratories in Rome in order todetermine the content of 12 PAHs: phenantrene(PHE), anthracene (AN), fluoranthene (FA), pyrene(PY), benzo(a)anthracene (BaA), chrysene (CHR),benzo(b+k)fluoranthene (BF), benzo(e)pyrene (BeP),benzo(a)pyrene (BaP), indeno(1,2,3,-cd)pyrene (IP),dibenz(a,h)anthracene (DBahA) and benzo(g,h,i)perylene (BghiP).
The analysis results (Fig. 2) show that the PAHscontent in the fuels is very heterogeneous, depend-ing on commercial and seasonal variables, thoughrespecting law imposed limits in all cases. On thecontrary, the chemical profile of PAHs is verysimilar in the different fuels with phenanthrene,pyrene and anthracene together accounting for afraction from 91% to 99% of PAHs. It is worthnoticing that the different PAHs fuel content wasnot considered a bias on the experiment results, asthe main goal of the experiment was comparing
pollutant concentrations induced by ‘‘real-world’’fuels in ‘‘real-world’’ air masses.
2.2. Instrumentation
Two PM sampling sites were set up, one locatedroughly in the tunnel center (Fig. 1) and the otherone, aimed at measuring background concentra-tions, located 150m from the NNE tunnel end. Theexternal station was equipped with a samplerMarkII Andersen (MKII) and a high volumeAndersen HV PM10 sampler (HV). At the internalsite another MKII was placed together with and anAndersen HV PM10/SA235 sampler (HVF).
MKII samples the airborne particulate matter bymeans of a 8-stage impactor. The granulometricranges of the instrument are: p0.4 mm, 0.4C0.7 mm,0.7C1.1 mm, 1.1C2.1 mm, 2.1C3.3 mm, 3.3C4.7 mm,4.7C5.8 mm, 5.8C9.0 mm and X9 mm. The air fluxthrough the cascade impactors is kept constantlyequal to 28.3 l per minute (lpm) by the pump. The 8intermediate impactor stages are equipped withaluminium impact supports whereas the final stagehas a glass fiber filter (Ø 80mm).
HV processes about 1130 lpm of ambient air andcollects the airborne particulate matter with anequivalent aerodynamic diameter smaller than10 mm on a fiber glass filter (203� 254mm) whereasHVF samples the PM10 by processing about1050 lpm of ambient air and the particulate matteris divided among 5 impact stages slotted withaluminum plates (0.49C0.95 mm, 0.95C1.5 mm,1.5C3 mm, 3C7.2 mm and 7.2C10 mm) and a finalglass fiber filter (p0.49 mm).
ARTICLE IN PRESSG. Zanini et al. / Atmospheric Environment 40 (2006) 1242–1254 1245
Besides the PM samplers, a sonic anemometerwas placed inside the tunnel, 108m far from thenorthern end, 1.8m from the ground and 3.5m fromthe left wall.
2.3. PAHs analysis
All the filters collected by HVF were analyzed toevaluate their PAHs content. Filters, after spikingwith pyrene-d10 to check the recovery efficienciesthroughout PAHs analysis, were extracted in anASE 100 (Dionex) accelerated solvent extractorusing a mixture of hexane:acetone (1:1). Theextracts were reduced to small volume in aKuderna–Danish apparatus and cleaned-up byusing 2 g silica gel columns (LC-Si, Supelco) withan added layer of 1 g of anhydrous sodium sulphateon top. The PAHs were eluted from the columnswith 5ml of a solution of 40% CH2Cl2 in n-hexaneand concentrated to 1ml under a stream ofnitrogen. Samples were analyzed by gas chromato-graphy-mass spectrometry (GC/MS) in selected ionmonitoring (SIM) mode. Deuterated PAHs (phe-nanthrene-d10, chrysene-d12 and perylene-d12)were added as internal standards.
GC/MS determinations were carried out using aHP 6890 gas chromatograph coupled to a HP 5973quadrupole mass spectrometer. A HP-5MS capil-lary column (30m long, 0.25mm i.d., and 0.25 mmfilm thickness) was used with helium as carrier gasat a constant flow rate of 1.2mlmin�1. An aliquotof extract (1 ml) was injected in ‘‘pulsed splitless’’mode (25 psi at 270 1C) using a HP 7683 autosampler. The thermal program was as follows: 60 1Cfor 1min, 15 1Cmin�1 up to 300 1C, isotherm for
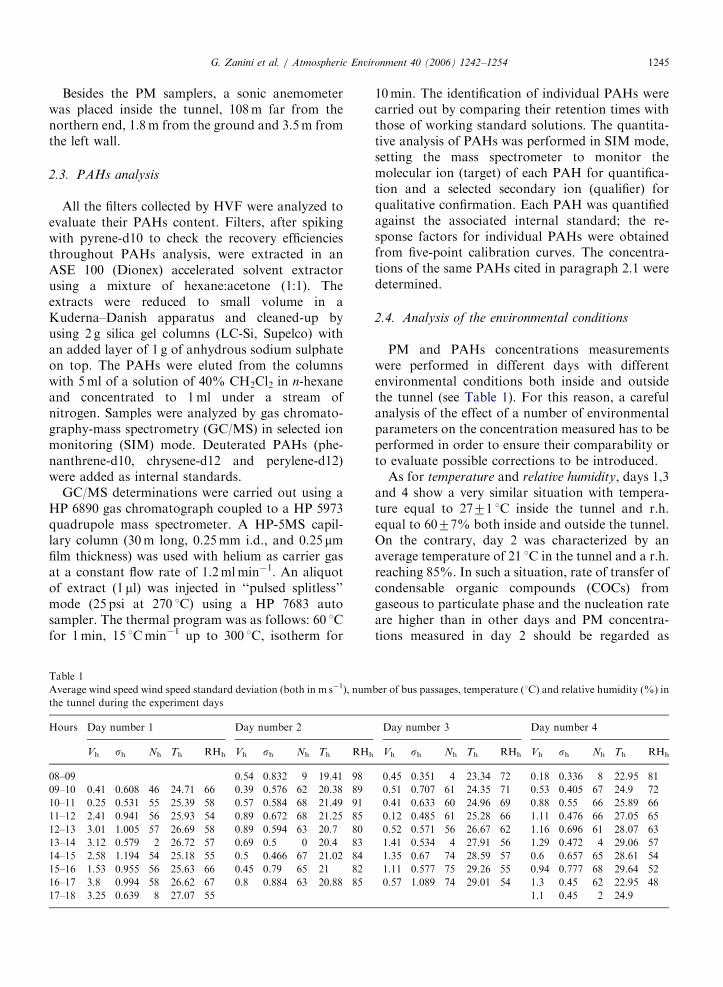
Table 1
Average wind speed wind speed standard deviation (both in m s�1), num
the tunnel during the experiment days
Hours Day number 1 Day number 2
Vh sh Nh Th RHh Vh sh Nh Th RHh
08–09 0.54 0.832 9 19.41 98
09–10 0.41 0.608 46 24.71 66 0.39 0.576 62 20.38 89
10–11 0.25 0.531 55 25.39 58 0.57 0.584 68 21.49 91
11–12 2.41 0.941 56 25.93 54 0.89 0.672 68 21.25 85
12–13 3.01 1.005 57 26.69 58 0.89 0.594 63 20.7 80
13–14 3.12 0.579 2 26.72 57 0.69 0.5 0 20.4 83
14–15 2.58 1.194 54 25.18 55 0.5 0.466 67 21.02 84
15–16 1.53 0.955 56 25.63 66 0.45 0.79 65 21 82
16–17 3.8 0.994 58 26.62 67 0.8 0.884 63 20.88 85
17–18 3.25 0.639 8 27.07 55
10min. The identification of individual PAHs werecarried out by comparing their retention times withthose of working standard solutions. The quantita-tive analysis of PAHs was performed in SIM mode,setting the mass spectrometer to monitor themolecular ion (target) of each PAH for quantifica-tion and a selected secondary ion (qualifier) forqualitative confirmation. Each PAH was quantifiedagainst the associated internal standard; the re-sponse factors for individual PAHs were obtainedfrom five-point calibration curves. The concentra-tions of the same PAHs cited in paragraph 2.1 weredetermined.
2.4. Analysis of the environmental conditions
PM and PAHs concentrations measurementswere performed in different days with differentenvironmental conditions both inside and outsidethe tunnel (see Table 1). For this reason, a carefulanalysis of the effect of a number of environmentalparameters on the concentration measured has to beperformed in order to ensure their comparability orto evaluate possible corrections to be introduced.
As for temperature and relative humidity, days 1,3and 4 show a very similar situation with tempera-ture equal to 2771 1C inside the tunnel and r.h.equal to 6077% both inside and outside the tunnel.On the contrary, day 2 was characterized by anaverage temperature of 21 1C in the tunnel and a r.h.reaching 85%. In such a situation, rate of transfer ofcondensable organic compounds (COCs) fromgaseous to particulate phase and the nucleation rateare higher than in other days and PM concentra-tions measured in day 2 should be regarded as
ber of bus passages, temperature (1C) and relative humidity (%) in
Day number 3 Day number 4
Vh sh Nh Th RHh Vh sh Nh Th RHh
0.45 0.351 4 23.34 72 0.18 0.336 8 22.95 81
0.51 0.707 61 24.35 71 0.53 0.405 67 24.9 72
0.41 0.633 60 24.96 69 0.88 0.55 66 25.89 66
0.12 0.485 61 25.28 66 1.11 0.476 66 27.05 65
0.52 0.571 56 26.67 62 1.16 0.696 61 28.07 63
1.41 0.534 4 27.91 56 1.29 0.472 4 29.06 57
1.35 0.67 74 28.59 57 0.6 0.657 65 28.61 54
1.11 0.577 75 29.26 55 0.94 0.777 68 29.64 52
0.57 1.089 74 29.01 54 1.3 0.45 62 22.95 48
1.1 0.45 2 24.9
ARTICLE IN PRESS
0
1
2
3
4
5
6
0
Wind speed (m/s)
Dilu
tio
n f
acto
r (m
-3)
1 2 3 4 5
Fig. 3. Dilution factor f(V) as a function of wind speed V inside
the tunnel using MERCURE (solid line) and an air exchange
estimate (dashed line).
G. Zanini et al. / Atmospheric Environment 40 (2006) 1242–12541246
overestimated, when compared with concentrationsmeasured in other days. As far as background and
wind resuspended concentrations are concerned, onecan suppose that the concentration C measuredinside the tunnel is
C ¼ CE þ CB þ CR, (1)
where CE is the concentration directly attributableto bus emission, CB is the background concentra-tion and CR is the resuspended particles concentra-tion.
A couple of 24-h long measurement inside andoutside the tunnel were performed on Sunday, 15thJuly with no vehicles passing in the tunnel and nodifferences were found between PAHs concentra-tions inside and outside the tunnel allowing tosuppose background concentrations being identicalinside and outside the tunnel. On the contrary, aconcentration excess of 3.070.5 mgm�3 was foundinside the tunnel for TSP, PM9 and PM3.3, probablycaused by wind (average speed 1.5m s�1) drivenparticles resuspension from the tunnel and accessroads floor. To evaluate the amount of CR in theexperiment days, following Loosmore (2003), anexponential dependence of CR from average windspeed, with exponent equal to 1.43, was supposedtogether with a wind speed threshold of 1m s�1 forresuspension to take place (Harrison et al., 2001).Applying this simple model to the data summarizedin Table 1, CR was found to be zero in allexperiment days, except in the first one, for whicha value of CR equal to 5.470.9 mgm�3 was found.
2.4.1. Wind dilution effect
Because the different anemologic situations in thedifferent experiment days (Table 1) it has beennecessary to develop a specific procedure aimed attaking into account the different dilution: theaverage daily concentration measured on the ithexperiment day (after subtracting background andresuspension) CE,i can be written as
CE;i ¼1
8
X
h
Ni;h f ðV i;hÞEi, (1)
where Vi,h and Ni,h are the hourly wind speed (inm s�1) and the number of bus transits during the hthhour of the ith experiment day, Ei is the pollutantamount emitted by a bus in a single tunnel transit(in kg) when using the ith day fuel and f(Vi,h) is adilution factor (in m�3) quantifying the pollutantdispersion inside the tunnel from the source to thesampler.
Let us now fix an experiment day as a referenceday. To clean up the measured values from thedilution variability between experiment days, oneshould evaluate the concentration C0
E,i defined asthe concentration that would have been measuredon the ith day if the wind speed pattern and thenumber of hourly bus passages had been equal tothe ones measured in the reference day. This‘‘renormalized’’ concentration is given by
C0E;i ¼
1
8
X
h
Nh;0 f ðVh;0ÞEi, (2)
where reference day hourly wind speed and hourlynumber of bus transits have been denoted with azero subscript. Dividing Eq. (2) by Eq. (1) oneobtains
C0E;i ¼
Ph
Nh;0 f ðVh;0Þ
Ph
Nh;i f ðVh;iÞCE;i ¼ FiCE;i, (3)
where the renormalizing factor Fi has been intro-duced. Fi is equal to unity for the reference day andit is larger than one in days more windy than thereference one, when the dilution in the tunnel isexpected to be stronger and CE,i smaller. For theopposite reason, i.e. smaller dilution and largesvalues of CE,I, Fi is expected to be less than one indays less windy than the reference one.
The evaluation of the dilution factor f(V) wasperformed by means two different methods. In thesimpler method (Fig. 3, dashed line) f(V) wassupposed inversely proportional to the volume ofair passed in the tunnel in an hour i.e.:
f ðV Þ ¼ A=ðS � Lþ V � L� 3600Þ, (4)
ARTICLE IN PRESSG. Zanini et al. / Atmospheric Environment 40 (2006) 1242–1254 1247
where S and L are the tunnel section and length,respectively and A is a non-dimensional constantdepending on the relative position of the source andthe receptor.
A different estimate of f(V), shown by solid line inFig. 3, was obtained by means of the Eulerian fluidsdynamics model MERCURE (Marsault and Roux,1998; Moon et al., 1997a,b). Details of the calcula-tions are reported in Zambonelli et al. (2002). Insummary, MERCURE was employed to model theconcentration expected in the middle of tunnelwhere the samplers were placed, when a linearsource at 3m from the ground and 3m from the leftwall (representing the path of the exhaust pipe ofthe buses) is present. Dispersion simulations wereperformed for different average wind speeds largerthan 0.7m s�1, whereas for smaller values of V,when the model becomes numerically unstable, aconstant dilution factor was supposed. Indeed, forvery small hourly average wind speed, the long-itudinal wind speed standard deviation overcomesthe average speed itself (see again Table 1) high-lighting a situation in which the mean wind, if any,often changes in direction and intensity and onlyturbulence is responsible for dispersion of thepollutant.
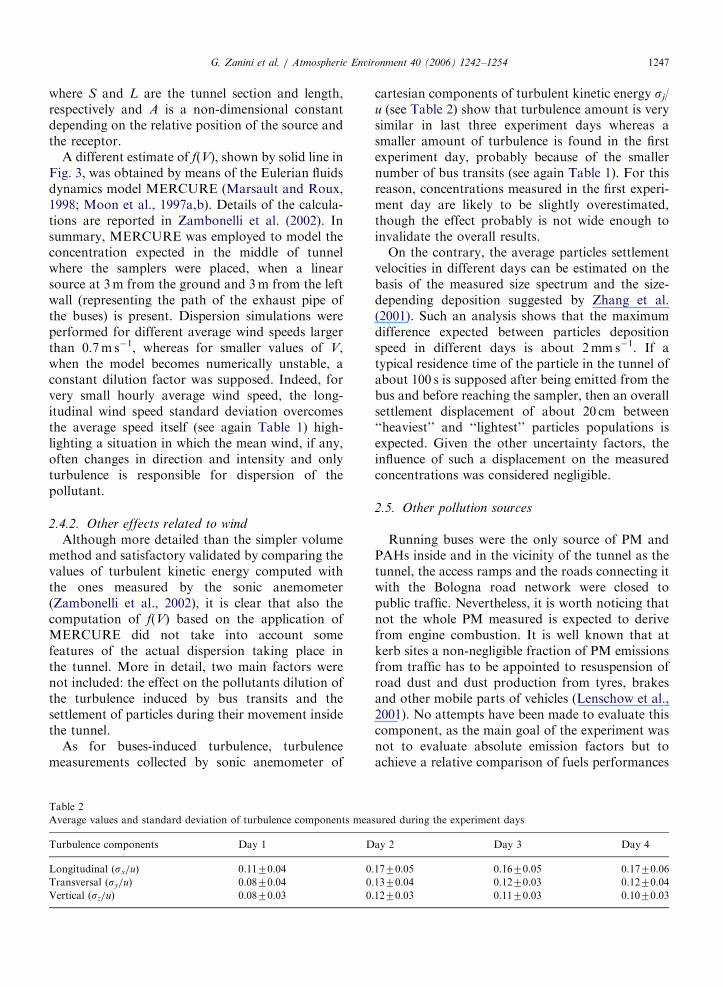
2.4.2. Other effects related to wind
Although more detailed than the simpler volumemethod and satisfactory validated by comparing thevalues of turbulent kinetic energy computed withthe ones measured by the sonic anemometer(Zambonelli et al., 2002), it is clear that also thecomputation of f(V) based on the application ofMERCURE did not take into account somefeatures of the actual dispersion taking place inthe tunnel. More in detail, two main factors werenot included: the effect on the pollutants dilution ofthe turbulence induced by bus transits and thesettlement of particles during their movement insidethe tunnel.
As for buses-induced turbulence, turbulencemeasurements collected by sonic anemometer of
Table 2
Average values and standard deviation of turbulence components mea
Turbulence components Day 1 D
Longitudinal (sx/u) 0.1170.04 0
Transversal (sy/u) 0.0870.04 0
Vertical (sz/u) 0.0870.03 0
cartesian components of turbulent kinetic energy sj/u (see Table 2) show that turbulence amount is verysimilar in last three experiment days whereas asmaller amount of turbulence is found in the firstexperiment day, probably because of the smallernumber of bus transits (see again Table 1). For thisreason, concentrations measured in the first experi-ment day are likely to be slightly overestimated,though the effect probably is not wide enough toinvalidate the overall results.
On the contrary, the average particles settlementvelocities in different days can be estimated on thebasis of the measured size spectrum and the size-depending deposition suggested by Zhang et al.(2001). Such an analysis shows that the maximumdifference expected between particles depositionspeed in different days is about 2mm s�1. If atypical residence time of the particle in the tunnel ofabout 100 s is supposed after being emitted from thebus and before reaching the sampler, then an overallsettlement displacement of about 20 cm between‘‘heaviest’’ and ‘‘lightest’’ particles populations isexpected. Given the other uncertainty factors, theinfluence of such a displacement on the measuredconcentrations was considered negligible.
2.5. Other pollution sources
Running buses were the only source of PM andPAHs inside and in the vicinity of the tunnel as thetunnel, the access ramps and the roads connecting itwith the Bologna road network were closed topublic traffic. Nevertheless, it is worth noticing thatnot the whole PM measured is expected to derivefrom engine combustion. It is well known that atkerb sites a non-negligible fraction of PM emissionsfrom traffic has to be appointed to resuspension ofroad dust and dust production from tyres, brakesand other mobile parts of vehicles (Lenschow et al.,2001). No attempts have been made to evaluate thiscomponent, as the main goal of the experiment wasnot to evaluate absolute emission factors but toachieve a relative comparison of fuels performances
sured during the experiment days
ay 2 Day 3 Day 4
.1770.05 0.1670.05 0.1770.06
.1370.04 0.1270.03 0.1270.04
.1270.03 0.1170.03 0.1070.03
ARTICLE IN PRESSG. Zanini et al. / Atmospheric Environment 40 (2006) 1242–12541248
in experimental situation as similar as possible. Thesimilarity between days was achieved by using boththe same buses and the same drivers for all days,and setting the identical running schedule for eachbus passage. In this way, PM emission contributionfrom brake and tyres is expected to be very similarin the different days.
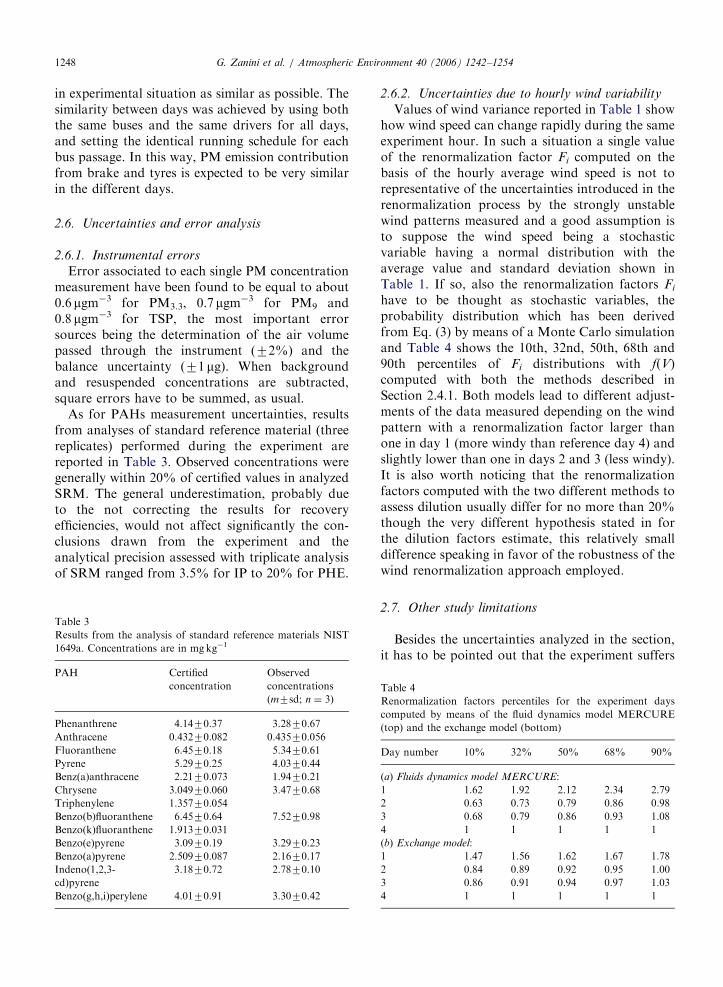
2.6. Uncertainties and error analysis
2.6.1. Instrumental errors
Error associated to each single PM concentrationmeasurement have been found to be equal to about0.6 mgm�3 for PM3.3, 0.7 mgm�3 for PM9 and0.8 mgm�3 for TSP, the most important errorsources being the determination of the air volumepassed through the instrument (72%) and thebalance uncertainty (71 mg). When backgroundand resuspended concentrations are subtracted,square errors have to be summed, as usual.
As for PAHs measurement uncertainties, resultsfrom analyses of standard reference material (threereplicates) performed during the experiment arereported in Table 3. Observed concentrations weregenerally within 20% of certified values in analyzedSRM. The general underestimation, probably dueto the not correcting the results for recoveryefficiencies, would not affect significantly the con-clusions drawn from the experiment and theanalytical precision assessed with triplicate analysisof SRM ranged from 3.5% for IP to 20% for PHE.
Table 3
Results from the analysis of standard reference materials NIST
1649a. Concentrations are in mgkg�1
PAH Certified
concentration
Observed
concentrations
(m7sd; n ¼ 3)
Phenanthrene 4.1470.37 3.2870.67
Anthracene 0.43270.082 0.43570.056
Fluoranthene 6.4570.18 5.3470.61
Pyrene 5.2970.25 4.0370.44
Benz(a)anthracene 2.2170.073 1.9470.21
Chrysene 3.04970.060 3.4770.68
Triphenylene 1.35770.054
Benzo(b)fluoranthene 6.4570.64 7.5270.98
Benzo(k)fluoranthene 1.91370.031
Benzo(e)pyrene 3.0970.19 3.2970.23
Benzo(a)pyrene 2.50970.087 2.1670.17
Indeno(1,2,3-
cd)pyrene
3.1870.72 2.7870.10
Benzo(g,h,i)perylene 4.0170.91 3.3070.42
2.6.2. Uncertainties due to hourly wind variability
Values of wind variance reported in Table 1 showhow wind speed can change rapidly during the sameexperiment hour. In such a situation a single valueof the renormalization factor Fi computed on thebasis of the hourly average wind speed is not torepresentative of the uncertainties introduced in therenormalization process by the strongly unstablewind patterns measured and a good assumption isto suppose the wind speed being a stochasticvariable having a normal distribution with theaverage value and standard deviation shown inTable 1. If so, also the renormalization factors Fi
have to be thought as stochastic variables, theprobability distribution which has been derivedfrom Eq. (3) by means of a Monte Carlo simulationand Table 4 shows the 10th, 32nd, 50th, 68th and90th percentiles of Fi distributions with f(V)computed with both the methods described inSection 2.4.1. Both models lead to different adjust-ments of the data measured depending on the windpattern with a renormalization factor larger thanone in day 1 (more windy than reference day 4) andslightly lower than one in days 2 and 3 (less windy).It is also worth noticing that the renormalizationfactors computed with the two different methods toassess dilution usually differ for no more than 20%though the very different hypothesis stated in forthe dilution factors estimate, this relatively smalldifference speaking in favor of the robustness of thewind renormalization approach employed.
2.7. Other study limitations
Besides the uncertainties analyzed in the section,it has to be pointed out that the experiment suffers
Table 4
Renormalization factors percentiles for the experiment days
computed by means of the fluid dynamics model MERCURE
(top) and the exchange model (bottom)
Day number 10% 32% 50% 68% 90%
(a) Fluids dynamics model MERCURE:
1 1.62 1.92 2.12 2.34 2.79
2 0.63 0.73 0.79 0.86 0.98
3 0.68 0.79 0.86 0.93 1.08
4 1 1 1 1 1
(b) Exchange model:
1 1.47 1.56 1.62 1.67 1.78
2 0.84 0.89 0.92 0.95 1.00
3 0.86 0.91 0.94 0.97 1.03
4 1 1 1 1 1
ARTICLE IN PRESSG. Zanini et al. / Atmospheric Environment 40 (2006) 1242–1254 1249
from an overall limitation: it consists of a singlemeasurements set with no repetitions and thislimitation did not allow assessing the influence onthe results of other effects such as for examplethe different particles residence times in thetunnel atmosphere leading to presumably differentgrowth.
For this reason, it is hard to state any firmconclusion about fuels suitability from this experi-ment only and the results presented in the followingparagraph have to be considered as an indicationfor further studies. Anyway, provided that somerefinements are introduced, the methodology em-ployed for the experiment has shown to be robustenough to lead to valuable considerations about the‘‘real-world’’ vehicles emissions.
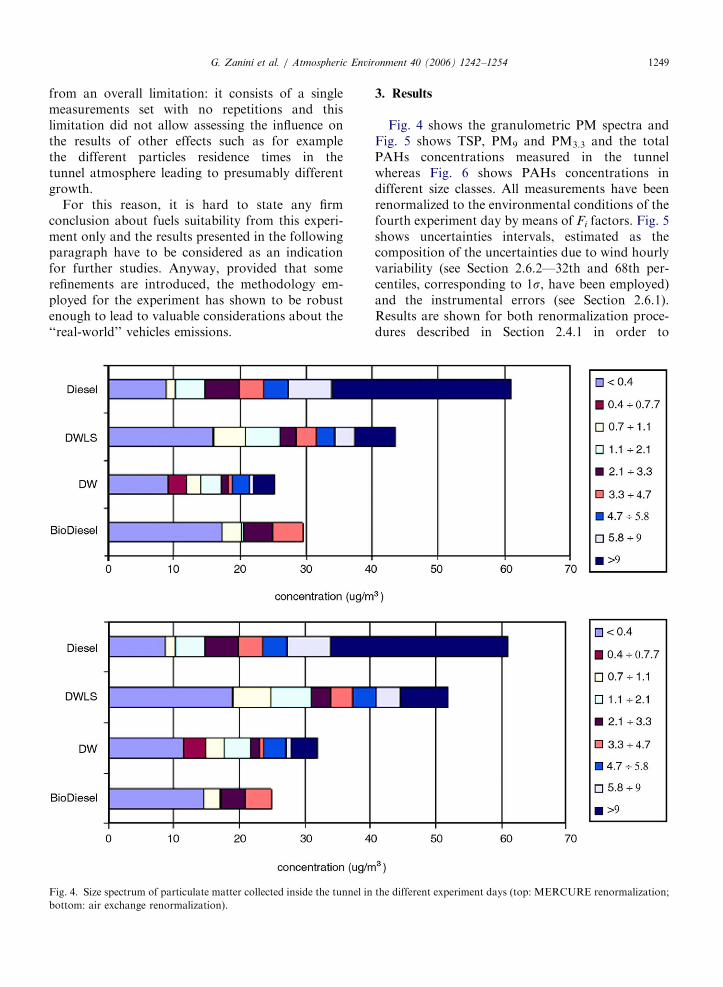
Fig. 4. Size spectrum of particulate matter collected inside the tunnel in
bottom: air exchange renormalization).
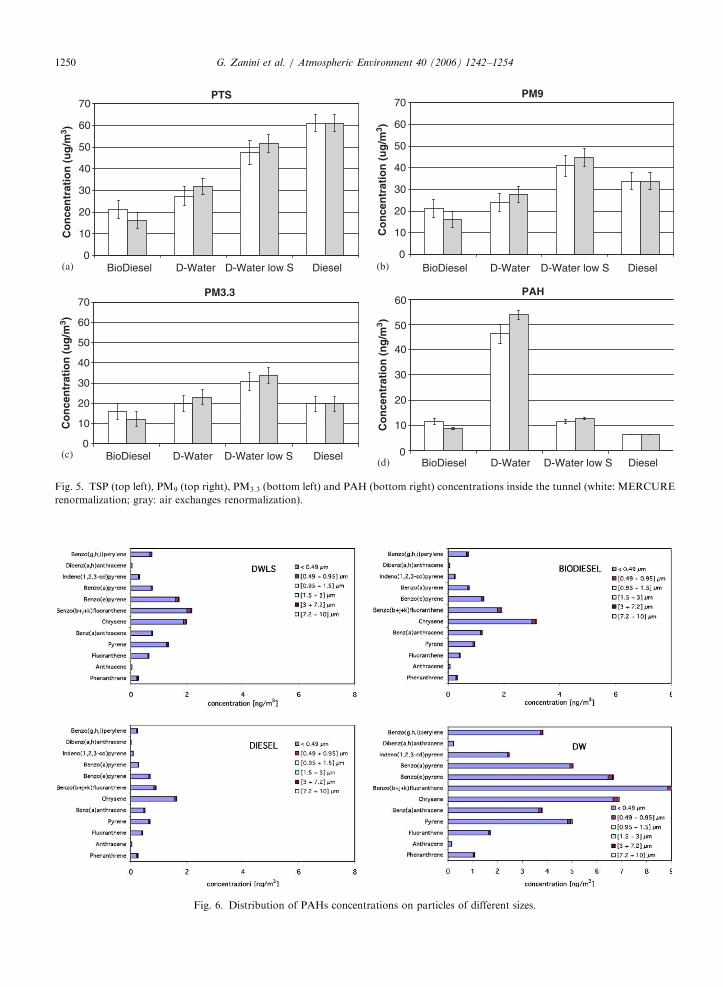
3. Results
Fig. 4 shows the granulometric PM spectra andFig. 5 shows TSP, PM9 and PM3.3 and the totalPAHs concentrations measured in the tunnelwhereas Fig. 6 shows PAHs concentrations indifferent size classes. All measurements have beenrenormalized to the environmental conditions of thefourth experiment day by means of Fi factors. Fig. 5shows uncertainties intervals, estimated as thecomposition of the uncertainties due to wind hourlyvariability (see Section 2.6.2—32th and 68th per-centiles, corresponding to 1s, have been employed)and the instrumental errors (see Section 2.6.1).Results are shown for both renormalization proce-dures described in Section 2.4.1 in order to
the different experiment days (top: MERCURE renormalization;
ARTICLE IN PRESS
PTS
0
10
20
30
40
50
60
70
BioDiesel(a) (b)
(c)(d)
D-Water D-Water low S Diesel
Co
nce
ntr
atio
n (
ug
/m3 )
PM9
0
10
20
30
40
50
60
70
BioDiesel D-Water D-Water low S Diesel
Co
nce
ntr
atio
n (
ug
/m3 )
PM3.3
0
10
20
30
40
50
60
70
BioDiesel D-Water D-Water low S Diesel
Co
nce
ntr
atio
n (
ug
/m3 )
PAH
0
10
20
30
40
50
60
BioDiesel D-Water D-Water low S Diesel
Co
nce
ntr
atio
n (
ng
/m3 )
Fig. 5. TSP (top left), PM9 (top right), PM3.3 (bottom left) and PAH (bottom right) concentrations inside the tunnel (white: MERCURE
renormalization; gray: air exchanges renormalization).
Fig. 6. Distribution of PAHs concentrations on particles of different sizes.
G. Zanini et al. / Atmospheric Environment 40 (2006) 1242–12541250
ARTICLE IN PRESSG. Zanini et al. / Atmospheric Environment 40 (2006) 1242–1254 1251
demonstrate measurement robustness for dilutioneffect.
3.1. Particulate matter concentrations
Given the overall limitation of the experimentanalyzed in the previous section, no attempts weremade to assess statistical significance of differencesin the concentrations measured and only a qualita-tive comparison of fuel performance is nowdiscussed.
Fig. 5 seems to show that TSP concentrationsmeasured for biodiesel blend and DW are lowerthan TSP concentrations induced by traditional Dand DWLS, biodiesel and DW being substantiallyas indistinguishable each other, as D and DWLSare.
This pattern becomes weaker for PM9 anddisappears completely in PM3.3 measurements,where no differences can be argued between thefuels.
It is interesting to notice that reciprocal pollutionratios between ‘‘new’’ fuels do not seem to changevery much between TSP, PM9 and PM3.3. On thecontrary, PM concentrations induced by these fuelsincrease in comparison with the standard D whenmoving through finer particles. Another interestingpoint is the apparent particulate overproductioninduced by DWLS in respect to DW, as one shouldexpect low sulphur content to be associated withlower PM concentrations. Anyway, though notexcluding a data analysis artefact, it is worthnoticing that sulphur content is not the onlydifference between fuels as they were preparedstarting from different diesel qualities and withdifferent addictives, for which no information wasgiven by producers.
3.2. PAHs concentrations
The total concentration of PAHs measured insidethe tunnel after background and wind normal-ization is shown in Fig. 5 (bottom left). In the figureonly uncertainties due to the wind dilution effecthave been shown. When the overall measurementerrors due to the measurement procedure describedin Section 2.6.1 are considered, uncertainties canreach a value of about 30%, typical of environ-mental PAHs measurements. As in the case of PM,with such a variability and without experimentrepetition it is hard to state any firm conclusion, atleast about differences in PAHs contents of D, DW
and biodiesel exhausts. On the contrary, theconsiderable amount of PAHs found in DWexhaust seems to reflect the higher PAH contentfound in the fuel. Fig. 6 shows how the PAHsconcentrations are distributed on the particles ofdifferent sizes: it is clear as the percentage of PAHscarried by smaller particles (Do0.49 m) ranges inthe 85–98% interval with very few exceptions.
3.3. Lung deposition
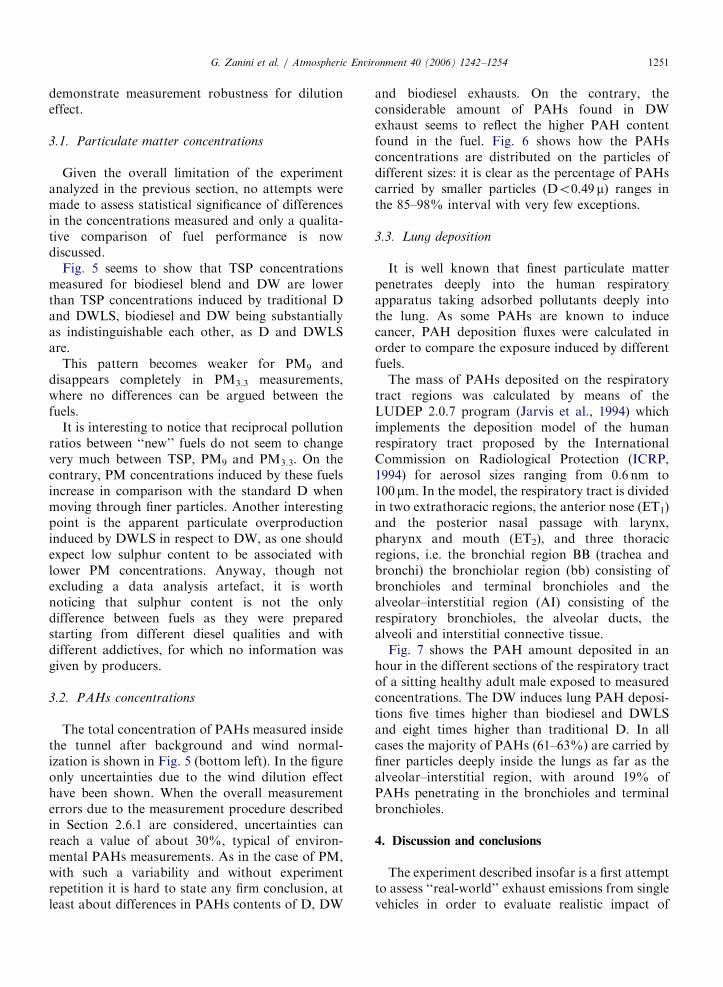
It is well known that finest particulate matterpenetrates deeply into the human respiratoryapparatus taking adsorbed pollutants deeply intothe lung. As some PAHs are known to inducecancer, PAH deposition fluxes were calculated inorder to compare the exposure induced by differentfuels.
The mass of PAHs deposited on the respiratorytract regions was calculated by means of theLUDEP 2.0.7 program (Jarvis et al., 1994) whichimplements the deposition model of the humanrespiratory tract proposed by the InternationalCommission on Radiological Protection (ICRP,1994) for aerosol sizes ranging from 0.6 nm to100 mm. In the model, the respiratory tract is dividedin two extrathoracic regions, the anterior nose (ET1)and the posterior nasal passage with larynx,pharynx and mouth (ET2), and three thoracicregions, i.e. the bronchial region BB (trachea andbronchi) the bronchiolar region (bb) consisting ofbronchioles and terminal bronchioles and thealveolar–interstitial region (AI) consisting of therespiratory bronchioles, the alveolar ducts, thealveoli and interstitial connective tissue.
Fig. 7 shows the PAH amount deposited in anhour in the different sections of the respiratory tractof a sitting healthy adult male exposed to measuredconcentrations. The DW induces lung PAH deposi-tions five times higher than biodiesel and DWLSand eight times higher than traditional D. In allcases the majority of PAHs (61–63%) are carried byfiner particles deeply inside the lungs as far as thealveolar–interstitial region, with around 19% ofPAHs penetrating in the bronchioles and terminalbronchioles.
4. Discussion and conclusions
The experiment described insofar is a first attemptto assess ‘‘real-world’’ exhaust emissions from singlevehicles in order to evaluate realistic impact of
ARTICLE IN PRESS
Fig. 7. Amount of PAH deposited in an hour in the regions of the respiratory tract of an healthy adult male exposed to PAHs
concentrations measured in the tunnel.
G. Zanini et al. / Atmospheric Environment 40 (2006) 1242–12541252
different fuels on the health of citizens living inurban areas. The method has been tested in real on-field conditions with two buses routinely employedin the public transport in the city of Bologna bymeans of a dedicated tunnel and trying to take intoaccount and evaluate the effect of confoundingenvironmental variables. Though the combined useof fluids dynamic models, instrumental errorsevaluation and confounding sources estimationhas made it possible to quantify most uncertainties,it is undoubted that this effort was only partiallysuccessful and the overall uncertainties remainlarge, not allowing a robust assessment of fuelsperformances.
More precisely, measurements repetition remainsunavoidable in order to obtain more statisticallyrobust results. Experiment repetition was notpossible due to budget limitations and was sub-stituted by an analysis as careful as possible of theenvironmental confounding variables and errorsources.
Nevertheless, it is worth noticing that alsoemission factors estimated on the basis of ‘‘classi-cal’’ road tunnel measurements are often affected bylarge environmental variability and important un-certainties, despite the high number of measure-
ments repetitions usually involved: as an example,Colberg et al. (2005) found NOx LDV emissionfactors different up to a factor of 10 in differentroad tunnels and CO emission factors with un-certainties level reaching 50%. PM emission factorsfor buses have been estimated by means of a set ofon-road experiments by Abu-Allaban et al. (2003)and values ranging from 4607160 to 780072700mg km�1 for PM10 and from 105735 to260790mgkm�1 for PM2.5 were found in threedifferent places. Finally, PM2.5 emission factorsestimated in Soderledstunnel, Stockholm (Kristens-son et al., 2004) are affected by a statisticalvariability (one standard deviation) roughly equalto the 100% of the value itself.
From this point of view, the experiment and thedata analysis methodology described have givenmethodological inputs for future experiments basedon the ‘‘real-world’’ single-vehicle emissions ap-proach and could be of interest also for currentemission factors assessments based on in-use roadtunnels.
As far as the fuel comparison is concerned, theexperiment seems to suggest that ‘‘new fuels’’ leadto an appreciable reduction of the total particlesmass concentrations but that mass, collected as
ARTICLE IN PRESSG. Zanini et al. / Atmospheric Environment 40 (2006) 1242–1254 1253
result of finer particles impact, does not decreasewith new fuels.
For DW, this kind of results qualitatively agreewith the results found by Barbusse and Plassat(2003) when they found in emulsion emissions areduction in number of large size particulate(Dp40.2 mm) while the number of fine particles(Dp around 0.03 mm) increases of a factor of 10. Noother results have been found in the open literaturein similar experimental conditions.
As for PAHs concentrations adsorbed on parti-cles, they are found to depend on the quantities ofaromatics in the diesel utilized in blend andemulsion and 90% of their total concentrationcomes with particles in the range o0.5 mm. Theseresults are in agreement with literature findings thata stronger fuel content of PAHs induce higherconcentrations in the exhaust (Westerholm and Li,1994; Concawe, 1998; Tancell et al., 1995).
Barbusse and Plassat (2003) also find that for theemulsion the distribution of PAHs does not dependon particle size for measurements at the exhaustpipe. On the contrary, Meszaros et al. (1997) havefound that summer atmospheric measurementsshow a size distribution of PAHs in the range0.25–0.5 mm.
If confirmed, such an experimental result posesproblems on the real meaning of conventionalparticulate measurements at the exhaust pipes andon the new generation fuels impact assessment. Fineand ultra-fine particles reach the interstitial alveolarregion carrying PAHs. They may react at thedeposition site or after transport to other targetsites; anyway they are associated to cardiovascularendpoints and to strong inflammatory response.
Therefore the shifting of particulate size distribu-tion towards the ultrafine region resulting fromwater diesel emulsions and biodiesel blends ifassociated with high content of aromatic in thebasic diesel could provoke worse health impact thanstandard diesel.
In evaluating the overall environmental perfor-mances of the new fuels the reduction of particulatestotal mass and the increase of the finer fractions aretwo contrasting effects that make it uneludible toreduce the aromatic content in the basic diesel.
Acknowledgments
Authors would like to thank Pasquale Spezzanoand Dario Cataldi, at ENEA research laboratoriesin Frascati for chemical analysis performed on a
number filters and for their contribution in un-certainties assessment. Comune di Bologna, ARPA-Emilia-Romagna and ATC Spa have given asubstantial logistic support to the experiment. Theexperiment was performed in the frame of ‘‘Pro-getto Benzene’’ with funding from Italian Ministryof the Environment.
References
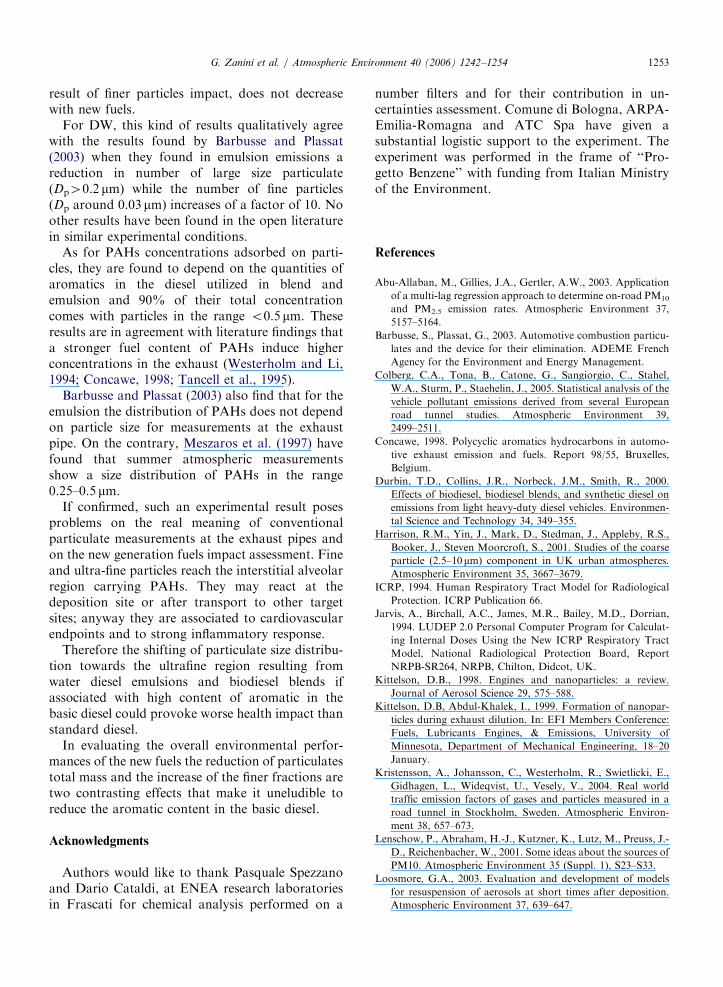
Abu-Allaban, M., Gillies, J.A., Gertler, A.W., 2003. Application
of a multi-lag regression approach to determine on-road PM10
and PM2.5 emission rates. Atmospheric Environment 37,
5157–5164.
Barbusse, S., Plassat, G., 2003. Automotive combustion particu-
lates and the device for their elimination. ADEME French
Agency for the Environment and Energy Management.
Colberg, C.A., Tona, B., Catone, G., Sangiorgio, C., Stahel,
W.A., Sturm, P., Staehelin, J., 2005. Statistical analysis of the
vehicle pollutant emissions derived from several European
road tunnel studies. Atmospheric Environment 39,
2499–2511.
Concawe, 1998. Polycyclic aromatics hydrocarbons in automo-
tive exhaust emission and fuels. Report 98/55, Bruxelles,
Belgium.
Durbin, T.D., Collins, J.R., Norbeck, J.M., Smith, R., 2000.
Effects of biodiesel, biodiesel blends, and synthetic diesel on
emissions from light heavy-duty diesel vehicles. Environmen-
tal Science and Technology 34, 349–355.
Harrison, R.M., Yin, J., Mark, D., Stedman, J., Appleby, R.S.,
Booker, J., Steven Moorcroft, S., 2001. Studies of the coarse
particle (2.5–10mm) component in UK urban atmospheres.
Atmospheric Environment 35, 3667–3679.
ICRP, 1994. Human Respiratory Tract Model for Radiological
Protection. ICRP Publication 66.
Jarvis, A., Birchall, A.C., James, M.R., Bailey, M.D., Dorrian,
1994. LUDEP 2.0 Personal Computer Program for Calculat-
ing Internal Doses Using the New ICRP Respiratory Tract
Model, National Radiological Protection Board, Report
NRPB-SR264, NRPB, Chilton, Didcot, UK.
Kittelson, D.B., 1998. Engines and nanoparticles: a review.
Journal of Aerosol Science 29, 575–588.
Kittelson, D.B, Abdul-Khalek, I., 1999. Formation of nanopar-
ticles during exhaust dilution. In: EFI Members Conference:
Fuels, Lubricants Engines, & Emissions, University of
Minnesota, Department of Mechanical Engineering, 18–20
January.
Kristensson, A., Johansson, C., Westerholm, R., Swietlicki, E.,
Gidhagen, L., Wideqvist, U., Vesely, V., 2004. Real world
traffic emission factors of gases and particles measured in a
road tunnel in Stockholm, Sweden. Atmospheric Environ-
ment 38, 657–673.
Lenschow, P., Abraham, H.-J., Kutzner, K., Lutz, M., Preuss, J.-
D., Reichenbacher, W., 2001. Some ideas about the sources of
PM10. Atmospheric Environment 35 (Suppl. 1), S23–S33.
Loosmore, G.A., 2003. Evaluation and development of models
for resuspension of aerosols at short times after deposition.
Atmospheric Environment 37, 639–647.
ARTICLE IN PRESSG. Zanini et al. / Atmospheric Environment 40 (2006) 1242–12541254
Marsault, J.P., Roux, C., 1998. Dispersion de la pollution gazeuse
rejetee aux tetes de tunnels routiers: synthese et enseignements
de mesures et modelisations comparatives (Site du souterrain
S4 de la Porte Maillot a Paris), QAVTDPGM3.MAR-JPM/IJ,
CETU (1998).
Meszaros, E., Barcza, T., Gelencser, A., Hlavay, J., Kiss, Gy.,
Krivacsy, Z., Molnar, A., Polyak, K., 1997. Size distribution
of inorganic and organic species in the atmospheric aerosol in
Hungary. Journal of Aerosol Science 28, 1163–1175.
Moon, D., Albergel, A., Jasmin, F., Thibaut, G., 1997a. The use
of the MERCURE CFD code to deal with an air pollution
problem due to building wake effects. Journal of Wind
Engineering and Industrial Aerodynamics 67–68, 781–791.
Moon, D., Albergel, A., Jasmin, F., Thibaut, G., 1997b. Exercice
de simulation numerique; Dispersion de la pollution des rejets
du tunnel S4 de la Porte Maillot. Rapport ARIA/97.010,
CETU.
Ntziachristos, L., Samaras, Z., 2003. New directions: emerging
demands for vehicle particle emission characterisation. Atmo-
spheric Environment 37, 441–442.
Tancell, P.J., Rhead, M.N., Trier, C.J., Bell, M.A., Fusssey,
D.E., 1995. The sources of benzo[a]pyrene in diesel exhaust
emissions. Science of the Total Environment 162, 179–186.
Westerholm, R., Li, H., 1994. A multivariate statistical analysis
of fuel related polycyclic aromatic hydrocarbon emissions
from heavy-duty diesel vehicles. Environmental Science and
Technology 28, 965–972.
Zambonelli, S., Monforti, F., Vitali, L., Zanini, G., 2002. Flux
simulations inside a road tunnel in support of an emission
measurement experiment. In: Seventh Congress of Wind
Engineering, Milano, Italy, 15–18 September.
Zhang, L., Gong, S., Padro, J., Barrie, L., 2001. A size-segregated
particle dry deposition scheme for an atmospheric aerosol
module. Atmospheric Environment 35, 549–560.