A computational model of the vertical anatomical organization of primary visual cortex
Upload
khangminh22Category
view
2download
0
Computer Science and Computational Thinking in Primary Schools
A thesis
submitted in partial fulfilment
of the requirements for the Degree
of
Doctor of Philosophy
in the
University of Canterbury
by
Caitlin Duncan
University of Canterbury
2019


Dedicated to my parents,
my grandpa Terry,
and me.


Abstract
As computational devices have become ingrained in modern society, a basic understanding
of these, and the Computer Science theories they operate on is now a critical component
in understanding our world. Because of this, the subjects Computer Science, programming,
and Computational Thinking are becoming a part of school curricula around the world.
However, effective integration and teaching of these topics at a pre-tertiary level faces many
challenges, as these have not traditionally been taught in school, in the majority of countries.
Additionally, many of the claims surrounding how and why these subjects, particularly
Computational Thinking, should be taught have not been extensively investigated. The
work reported on in this thesis aims to address several of these challenges, with a specific
focus on primary school curriculum.
The goals of this thesis are to 1) establish if Computer Science (CS) and Computational
Thinking (CT) can be taught effectively in a typical primary school environment; 2) inves-
tigate the impact that studying CS and programming can have on CT skills; 3) investigate
the impact that developing CT skills can have on general problem solving skills; and 4)
document additional impacts, positive or negative, that studying CS, programming, and CT
may have on primary school students.
To begin addressing these aims, discussions of four topics are first presented. The many
motivations for teaching CS and CT in primary school, and the ambitions of new curricula,
are catalogued; a comprehensive literature review on CT, and its place in education, is
presented; a history of CS and CT in the New Zealand curriculum is documented, to give
context to work conducted with New Zealand schools through this research; and, a literature
review on CS and programming teaching approaches and resources is presented.
Three studies, conducted in New Zealand primary schools during the years 2014-2017,
are then documented. This began with an exploratory pilot study with one school, then
a wide-scale teacher study that expanded on the pilot, followed by a targeted intervention
study, focussed on validating the results and conclusions of these prior studies. In total,
over 50 teachers and two thousand students participated in these. The initial pilot study
and wider teacher study also addressed the first goal of this thesis, how these topics can be
taught in primary schools, by providing ongoing evaluations of teaching resources used by
participants.
The contributions to knowledge that this thesis makes are: evidence to support the
previously un-validated theory that developing CT skills can improve students’ problem
solving skills; evidence that, while students who develop CT skills can transfer these to
other areas of learning, this requires facilitation and is unlikely to occur implicitly; a map
of connections between CS, programming, and CT, and the core skills the NZ curriculum
aims to develop in students; evidence that concepts from CS, programming, and CT can be
taught effectively at all levels of primary school; observations of disengaged students, who
struggle with the usual curriculum, being highly successful and engaged with these subjects;
an evaluation of a collection of CS Unplugged resources; and, a review of existing CS school
curricula, and a framework CS and CT curriculum that contributed to the design of the new
NZ Digital Technologies|Hangarau Matahiko curriculum.

Table of Contents
Chapter 1: Introduction 1
1.1 Research Goals . . . . . . . . . . . . . . . . . . . . . . . . . . . . . . . . . . 2
1.2 Thesis Contributions . . . . . . . . . . . . . . . . . . . . . . . . . . . . . . . 3
1.3 Thesis Structure . . . . . . . . . . . . . . . . . . . . . . . . . . . . . . . . . . 5
1.4 Terminology . . . . . . . . . . . . . . . . . . . . . . . . . . . . . . . . . . . . 6
I A New Curriculum for a Digital World 9
Chapter 2: Motivation 10
2.1 Necessary Knowledge in a Digital Society . . . . . . . . . . . . . . . . . . . . 11
2.1.1 Understanding and influencing our world . . . . . . . . . . . . . . . . 12
2.1.2 Awareness of technology’s influence . . . . . . . . . . . . . . . . . . . 13
2.1.3 Representation in the computing industry . . . . . . . . . . . . . . . 14
2.1.4 Economic considerations . . . . . . . . . . . . . . . . . . . . . . . . . 16
2.2 Primary School focus . . . . . . . . . . . . . . . . . . . . . . . . . . . . . . . 17
2.3 Motivation for this work . . . . . . . . . . . . . . . . . . . . . . . . . . . . . 20
Chapter 3: Computational Thinking, the 21st Century Skill 22
3.1 What is Computational Thinking? . . . . . . . . . . . . . . . . . . . . . . . 23
3.1.1 Challenges for finding a definition . . . . . . . . . . . . . . . . . . . . 25
3.2 Reviews of the definitions . . . . . . . . . . . . . . . . . . . . . . . . . . . . 26
3.2.1 The role of Computer Science in Computational Thinking . . . . . . 29
3.3 Problem solving and Bold Claims . . . . . . . . . . . . . . . . . . . . . . . . 32
3.4 Assessment . . . . . . . . . . . . . . . . . . . . . . . . . . . . . . . . . . . . 33
3.4.1 The Bebras Challenge . . . . . . . . . . . . . . . . . . . . . . . . . . 35
3.5 Operational definition of Computational Thinking for this research . . . . . 37
3.5.1 Barefoot Computing . . . . . . . . . . . . . . . . . . . . . . . . . . . 38

Chapter 4: Curriculum Developments 40
4.1 International Curriculum changes . . . . . . . . . . . . . . . . . . . . . . . . 40
4.2 The New Zealand National Curriculum . . . . . . . . . . . . . . . . . . . . . 42
4.2.1 The New Zealand Curriculum, and Te Marautanga o Aotearoa . . . . 43
4.2.2 The Key Competencies . . . . . . . . . . . . . . . . . . . . . . . . . . 44
4.2.3 NCEA . . . . . . . . . . . . . . . . . . . . . . . . . . . . . . . . . . . 46
4.3 History of Digital Technologies and Computational Thinking in the New
Zealand Curriculum . . . . . . . . . . . . . . . . . . . . . . . . . . . . . . . . 46
4.3.1 Pre-2011 . . . . . . . . . . . . . . . . . . . . . . . . . . . . . . . . . . 46
4.3.2 The new standards, 2011 - 2013 . . . . . . . . . . . . . . . . . . . . . 48
4.3.3 Reviewing the Digital Technologies curriculum, 2014 - 2017 . . . . . . 48
4.4 Curriculum Content for New Zealand, and this research . . . . . . . . . . . . 50
4.4.1 Synthesising a curriculum . . . . . . . . . . . . . . . . . . . . . . . . 50
4.4.2 Current and future NZ Curriculum . . . . . . . . . . . . . . . . . . . 52
Chapter 5: Teaching Computer Science and Programming in Primary School 54
5.1 Computer Science Unplugged . . . . . . . . . . . . . . . . . . . . . . . . . . 54
5.2 Programming for young students . . . . . . . . . . . . . . . . . . . . . . . . 57
5.2.1 Programming tools for young students . . . . . . . . . . . . . . . . . 59
5.2.2 Programming books and games . . . . . . . . . . . . . . . . . . . . . 63
II Trialling in New Zealand Primary Schools 67
Chapter 6: Methodology 68
6.1 Overview of studies . . . . . . . . . . . . . . . . . . . . . . . . . . . . . . . . 68
6.2 Teaching in a New Zealand primary school environment . . . . . . . . . . . . 69
6.2.1 The School Decile System . . . . . . . . . . . . . . . . . . . . . . . . 70
6.2.2 Priority Learners . . . . . . . . . . . . . . . . . . . . . . . . . . . . . 71
6.3 Resources and training used throughout the studies . . . . . . . . . . . . . . 71
6.3.1 Differences between participants training in the second study . . . . . 73
6.3.2 Computer Science Unplugged . . . . . . . . . . . . . . . . . . . . . . 74
6.3.3 Programming resources . . . . . . . . . . . . . . . . . . . . . . . . . . 77
6.3.4 Computer Science for Primary Schools (CS4PS) . . . . . . . . . . . . 79
6.3.5 Teacher Collaboration . . . . . . . . . . . . . . . . . . . . . . . . . . 80
ii

6.4 Data collection and analysis methodology . . . . . . . . . . . . . . . . . . . . 81
6.4.1 Assessment with Bebras . . . . . . . . . . . . . . . . . . . . . . . . . 82
6.4.2 Qualitative data . . . . . . . . . . . . . . . . . . . . . . . . . . . . . . 83
6.5 Limitations and threats to validity . . . . . . . . . . . . . . . . . . . . . . . 86
6.5.1 Pragmatism and mixed methods research . . . . . . . . . . . . . . . . 86
6.5.2 Interviews and interview analysis . . . . . . . . . . . . . . . . . . . . 87
6.5.3 Assessment with the Bebras challenge . . . . . . . . . . . . . . . . . . 88
6.6 Additional considerations . . . . . . . . . . . . . . . . . . . . . . . . . . . . . 88
6.6.1 Impacts of participant’s location . . . . . . . . . . . . . . . . . . . . . 88
6.6.2 Discussions on gender . . . . . . . . . . . . . . . . . . . . . . . . . . 89
6.6.3 Discussions on ethnicity . . . . . . . . . . . . . . . . . . . . . . . . . 89
Chapter 7: Pilot Study 91
7.1 Context . . . . . . . . . . . . . . . . . . . . . . . . . . . . . . . . . . . . . . 91
7.2 Aims . . . . . . . . . . . . . . . . . . . . . . . . . . . . . . . . . . . . . . . . 92
7.3 Class Structure . . . . . . . . . . . . . . . . . . . . . . . . . . . . . . . . . . 95
7.4 Class content . . . . . . . . . . . . . . . . . . . . . . . . . . . . . . . . . . . 96
7.5 Assessment Process . . . . . . . . . . . . . . . . . . . . . . . . . . . . . . . . 98
7.5.1 In-class quizzes . . . . . . . . . . . . . . . . . . . . . . . . . . . . . . 99
7.5.2 Attitude survey . . . . . . . . . . . . . . . . . . . . . . . . . . . . . . 100
7.6 Results . . . . . . . . . . . . . . . . . . . . . . . . . . . . . . . . . . . . . . . 101
7.6.1 Bebras . . . . . . . . . . . . . . . . . . . . . . . . . . . . . . . . . . . 103
7.6.2 Data representation Quiz . . . . . . . . . . . . . . . . . . . . . . . . . 104
7.6.3 Programming Quiz . . . . . . . . . . . . . . . . . . . . . . . . . . . . 105
7.6.4 Quiz comparisons . . . . . . . . . . . . . . . . . . . . . . . . . . . . . 106
7.6.5 Attitude Survey . . . . . . . . . . . . . . . . . . . . . . . . . . . . . . 107
7.6.6 Comparing Survey Responses with Assessment Results . . . . . . . . 112
7.7 Discussion . . . . . . . . . . . . . . . . . . . . . . . . . . . . . . . . . . . . . 113
7.7.1 Aims of the programme . . . . . . . . . . . . . . . . . . . . . . . . . 114
7.7.2 Gender differences . . . . . . . . . . . . . . . . . . . . . . . . . . . . 114
7.7.3 Teaching methods . . . . . . . . . . . . . . . . . . . . . . . . . . . . . 116
7.7.4 Data Representation . . . . . . . . . . . . . . . . . . . . . . . . . . . 116
7.7.5 Programming . . . . . . . . . . . . . . . . . . . . . . . . . . . . . . . 117
7.8 Conclusion . . . . . . . . . . . . . . . . . . . . . . . . . . . . . . . . . . . . . 118
iii

Chapter 8: Open Teachers Study 120
8.1 Overview . . . . . . . . . . . . . . . . . . . . . . . . . . . . . . . . . . . . . . 120
8.1.1 Research Questions . . . . . . . . . . . . . . . . . . . . . . . . . . . . 122
8.2 Method . . . . . . . . . . . . . . . . . . . . . . . . . . . . . . . . . . . . . . 122
8.2.1 Data collection . . . . . . . . . . . . . . . . . . . . . . . . . . . . . . 123
8.2.2 Interviews and qualitative analysis . . . . . . . . . . . . . . . . . . . 127
8.3 Results and Discussion . . . . . . . . . . . . . . . . . . . . . . . . . . . . . . 134
8.3.1 School information . . . . . . . . . . . . . . . . . . . . . . . . . . . . 135
8.3.2 Participants . . . . . . . . . . . . . . . . . . . . . . . . . . . . . . . . 136
8.3.3 Lessons taught . . . . . . . . . . . . . . . . . . . . . . . . . . . . . . 143
8.3.4 Computational Thinking . . . . . . . . . . . . . . . . . . . . . . . . . 148
8.3.5 The Key Competencies . . . . . . . . . . . . . . . . . . . . . . . . . . 170
8.3.6 Problem Solving . . . . . . . . . . . . . . . . . . . . . . . . . . . . . 173
8.3.7 Cross-curricular learning . . . . . . . . . . . . . . . . . . . . . . . . . 174
8.3.8 Learning transfer . . . . . . . . . . . . . . . . . . . . . . . . . . . . . 177
8.3.9 Student impacts . . . . . . . . . . . . . . . . . . . . . . . . . . . . . . 178
8.4 Conclusion . . . . . . . . . . . . . . . . . . . . . . . . . . . . . . . . . . . . . 182
Chapter 9: Intervention Study 184
9.1 Overview . . . . . . . . . . . . . . . . . . . . . . . . . . . . . . . . . . . . . . 185
9.1.1 Research questions . . . . . . . . . . . . . . . . . . . . . . . . . . . . 186
9.2 Method . . . . . . . . . . . . . . . . . . . . . . . . . . . . . . . . . . . . . . 186
9.2.1 Conducting the pre and post-tests . . . . . . . . . . . . . . . . . . . . 187
9.2.2 Additional Student Data Collection . . . . . . . . . . . . . . . . . . . 188
9.2.3 Interviews . . . . . . . . . . . . . . . . . . . . . . . . . . . . . . . . . 190
9.2.4 Data Analysis . . . . . . . . . . . . . . . . . . . . . . . . . . . . . . . 190
9.3 Schools and participant details . . . . . . . . . . . . . . . . . . . . . . . . . . 193
9.3.1 Schools and students . . . . . . . . . . . . . . . . . . . . . . . . . . . 193
9.3.2 Content covered . . . . . . . . . . . . . . . . . . . . . . . . . . . . . . 196
9.4 Results: Computational Thinking Tests . . . . . . . . . . . . . . . . . . . . . 197
9.4.1 Primary School A . . . . . . . . . . . . . . . . . . . . . . . . . . . . . 202
9.4.2 Full-primary School B, years 4-6 . . . . . . . . . . . . . . . . . . . . . 204
9.4.3 Full-primary School B, years 7-8, test order A-B . . . . . . . . . . . . 206
9.4.4 Full-primary School B, years 7-8, test order B-A . . . . . . . . . . . . 208
iv

9.4.5 Intermediate School C, test-order A-B . . . . . . . . . . . . . . . . . 210
9.4.6 Intermediate School C, test-order B-A . . . . . . . . . . . . . . . . . 212
9.4.7 Summary . . . . . . . . . . . . . . . . . . . . . . . . . . . . . . . . . 215
9.5 Results: Interviews . . . . . . . . . . . . . . . . . . . . . . . . . . . . . . . . 215
9.5.1 Teachers . . . . . . . . . . . . . . . . . . . . . . . . . . . . . . . . . . 215
9.5.2 Lessons taught . . . . . . . . . . . . . . . . . . . . . . . . . . . . . . 217
9.5.3 Computational Thinking . . . . . . . . . . . . . . . . . . . . . . . . . 222
9.5.4 Problem Solving . . . . . . . . . . . . . . . . . . . . . . . . . . . . . 229
9.5.5 Learning Transfer . . . . . . . . . . . . . . . . . . . . . . . . . . . . . 231
9.5.6 Student Impacts . . . . . . . . . . . . . . . . . . . . . . . . . . . . . 232
9.6 Discussion . . . . . . . . . . . . . . . . . . . . . . . . . . . . . . . . . . . . . 235
9.7 Conclusion . . . . . . . . . . . . . . . . . . . . . . . . . . . . . . . . . . . . . 239
Chapter 10: Conclusions 242
10.1 Research Goals . . . . . . . . . . . . . . . . . . . . . . . . . . . . . . . . . . 242
10.2 Contributions . . . . . . . . . . . . . . . . . . . . . . . . . . . . . . . . . . . 246
10.3 Limitations . . . . . . . . . . . . . . . . . . . . . . . . . . . . . . . . . . . . 247
10.4 Future work . . . . . . . . . . . . . . . . . . . . . . . . . . . . . . . . . . . . 248
Appendix A: Tables and Figures 249
A.1 Curriculum comparisons . . . . . . . . . . . . . . . . . . . . . . . . . . . . . 249
A.2 Proposed computing curricula for NZ . . . . . . . . . . . . . . . . . . . . . . 252
A.3 Pilot Study . . . . . . . . . . . . . . . . . . . . . . . . . . . . . . . . . . . . 256
A.3.1 Bebras challenge and quiz results . . . . . . . . . . . . . . . . . . . . 256
A.3.2 Attitude survey results . . . . . . . . . . . . . . . . . . . . . . . . . . 259
Appendix B: Pilot Study Quizzes 265
B.1 Data Representation Quiz . . . . . . . . . . . . . . . . . . . . . . . . . . . . 265
B.2 Scratch Programming Quiz . . . . . . . . . . . . . . . . . . . . . . . . . . . . 269
Appendix C: Ethics approval documents 272
References 277
v

Acknowledgments
Thank you to my long-suffering parents for your endless support, love, and patience. I
never would have accomplished any of this without you, and cannot express how grateful I
am for you every day.
Thank you to Professor Tim Bell for being the best supervisor and mentor I could have
asked for. I will always be grateful for your guidance, support, and the opportunities you
have given me.
Thank you Claude for always being there for me, helping me get through the bad days,
and persuading me to finally get my license.
Thank you to my co-supervisor Professor Tanja Mitrovic for your feedback, support, and
advice.
Thank you to my brother Alasdair and to my family, especially to Sharon Guy for sup-
porting me and letting me borrow Cola. Thank you to my friends Roseanna Grundy, JCEFH,
Grace Nolan, Sarang Love Leehan, Hayley van Wass, and all those I may have forgotten, for
your advice, support, listening to my rants, and generally keeping me sane.
Thank you to Gerard MacManus for your feedback, and for keeping me on task. Thank
you to Kathy Baker, Alex Forster, Tracy Henderson and the rest of the CSERG team, Yalini
Sundralingham, supporters of Computer Chicks and WiTSoc, my office and postgrad bud-
dies over the years, and the COSC department technical staff.
Ma serannas to my companions in Ferelden, Kirkwall, and Skyhold, and to the Warden,
the Champion, and the Inquisitor.
And thank you to all the incredible teachers who gave their time and energy to be a part
of this. You are an inspiration, and I could never have done this without you.
vi

Chapter I
Introduction
Over the past five years there has been a paradigm shift in school education as Com-
puter Science, programming, and Computational Thinking have entered curricula in New
Zealand, and around the world. As computers and digital devices are now ingrained in our
everyday lives, basic knowledge of Computer Science, and how these devices function is of
immense benefit. Without this understanding, a person is likely to be disadvantaged in our
society. To provide their students with this necessary knowledge, education systems around
the world are working to introduce Computer Science and Computational Thinking to their
schools. However, as these subjects have not previously been taught at school in the major-
ity of countries, there are many difficulties in creating curriculum, training and supporting
teachers to deliver it, in evaluating how these subjects can be taught, and even in identifying
what we should be teaching. This thesis aims to explore the field of Computer Science and
Computational Thinking education, and answer some of these questions.
I began my work in the field of Computer Science Education at what some would con-
sider the ideal time, right as it started to rapidly grow. The literature in this area and the
real-world context of my work has evolved constantly, influenced by political and educa-
tional developments in New Zealand, and around the world. The state of Computer Science
education in 2014, when I first entered this field, differs greatly from what we see today in
2019.
Throughout my research, I have worked on several separate projects that strongly influ-
enced, and were influenced by, my research. At times during 2015-2017, I was involved in
the direction and development of the new Digital Technologies Curriculum for New Zealand
primary schools, which was introduced to schools in 2018. This work is not fully docu-
mented here but was carried out alongside this research. These developments in the NZ and
international curricula are discussed several times through this thesis.
Since 2014 I have been a member of the University of Canterbury Computer Science
1
Education Research Group1 (CSERG), and this group has had a vital role in my work.
The Computer Science Unplugged resources and training workshops developed by our group
were used throughout my studies, and the results of these studies have likewise impacted
the CSERG’s work. This group will be referred to frequently throughout this thesis.
1.1 Research Goals
This thesis aims to overcome some of the challenges to effectively introducing Computer
Science, programming, and Computational Thinking to primary school education, and de-
termine whether the integration of these subjects has the desired positive effects on students.
The questions I attempt to address in this thesis are listed below. Each of the questions
contains several sub-questions, which needed to be answered in addressing the overall ques-
tion:
RQ1 Can Computer Science and basic programming skills be taught in a typical primary
school environment?
RQ1.1 What topics in Computer Science and programming should be trialled for teaching
in this research?
RQ1.2 What resources and training can teachers be provided with to successfully teach
these?
RQ1.3 Do students learn, and how much do they learn, through these lessons?
RQ2 Can learning Computer Science and programming develop, or improve, Computational
Thinking skills for the majority of students?
RQ2.1 How can students’ Computational Thinking skills, and changes in these, be mea-
sured?
RQ2.2 Do students exercise or employ Computational Thinking skills during Computer
Science and programming lessons, based on teacher observations?
RQ2.3 Is there evidence of students’ Computational Thinking skills improving, as a result
of the Computer Science and programming lessons, based on objective assessment
and teacher observations?
1 The CSERG: https://www.canterbury.ac.nz/engineering/schools/csse/research/cse/, andhttps://www.canterbury.ac.nz/engineering/schools/csse/computer-science-education/
2

RQ3 Can learning Computer Science and programming, and developing Computational
Thinking skills, have an impact on problem solving skills or general learning, for the
majority of students?
RQ3.1 Do students exercise or employ general problem solving skills during Computer
Science and programming lessons, based on teacher observations?
RQ3.2 Is there evidence of students’ problem solving skills improving, based on teacher
observations?
RQ3.3 Is there evidence of the Computer Science and programming lessons having im-
pacts on students’ learning in other curriculum areas, based on teacher observa-
tions?
RQ3.4 Is there evidence that developing Computational Thinking skills results in these
skills being transferred to other areas of students’ learning, based on teacher
observations?
RQ4 What other impacts can learning Computer Science and programming, and developing
Computational Thinking skills have on students?
1.2 Thesis Contributions
This thesis makes seven key contributions to the fields of Computer Science, programming,
and Computational Thinking curricula and teaching:
1. Provides evidence to support the claim that Computational Thinking can benefit the
majority students’ problem solving skills, in both computing and unrelated fields. This
claim had not been tested or validated prior to this research.
2. Provides evidence against the claim that by learning Computational Thinking skills
through Computer Science and programming students will automatically transfer this
learning to other areas. However, it does provide evidence that the majority of students
can transfer these skills if they are explicitly taught to apply Computational Thinking
skills in different contexts, or if Computer Science and programming are taught in a
cross-curricula way.
3

3. Maps the general skills (the Key Competencies, such as working together, social skills,
and resilience) that are the core principles of the New Zealand Curriculum, to Com-
puter Science, programming, and Computational Thinking.
4. Shows that concepts from Computer Science and programming can be taught in a
suitable and successful way for all primary school age groups (ages 5 - 13 years old). The
majority of prior research has focused on tertiary level education or selected students,
whereas the results here apply to typical primary school classroom environments, with
generalist teachers; and for students with a wide array of ability levels, subject interest,
and difficulties or strengths with learning, with the caveat that teachers are adequately
supported and resourced.
5. Shows that not only could these subjects be taught to students with a wide range
of abilities, these students were all (apart from students with severe developmental
disabilities) able to achieve success to some degree in these classes, and some students
who struggled with learning, or were usually seen as low achieving, were particularly
successful, often to the surprise of the teacher. Programming and topics from Computer
Science appeared to appeal strongly to groups of students who have not been successful
within the existing education system, re-engaged them with learning, provided them
with new ways to learn and demonstrate their learning which are more suitable for
them, and have facilitated the development of other skills, particularly social skills, for
these students.
6. Gives an evaluation of multiple Computer Science Unplugged activities, that was done
in conjunction with participating teachers. The Computer Science Unplugged resources
were found to be easy for teachers to use, the activities were engaging and enjoyable
for students, and teachers felt that both they and their students learnt from these. The
use of these activities led teachers to continue teaching Computer Science topics after
the conclusion of the study; developed their interest in, and knowledge of the subjects;
and enthused many to encourage and support other teachers to integrate Computer
Science and programming into their teaching.
7. Collates information on the design of Computer Science, programming, and Compu-
tational Thinking curricula, and a given a framework for a curriculum, parts of which
4

have led directly into the design of the new New Zealand Digital Technologies|Hangarau
Matahiko curriculum.
1.3 Thesis Structure
This thesis is separated into two parts. Part I, A New Curriculum for a Digital World,
covers the motivations for this work and functions as a literature review addressing research
questions 1.1, 1.2, and 2.1. Part II, Trialling in New Zealand Primary Schools, documents
three studies carried out in schools between 2014 and 2017, and addresses the remaining
research questions.
In Part I, Chapter 2 first outlines the many motivations for adding computing to primary
school curricula, and how this work is intended to support this. Chapter 3 is a literature
review on Computational Thinking, a concept that has become central to the field of Com-
puter Science education and the design and implementation of school curricula. Chapter
4 catalogues changes in international curricula, as many countries have moved to integrate
Computer Science and Computational Thinking into schools; describes the New Zealand
curriculum to give context for this research, which took place within the New Zealand cur-
riculum framework; and, gives an overview of the changes in this curriculum over time, as
Computer Science and Computational Thinking (under the subject name ‘Digital Technolo-
gies’) have been added to this. Chapter 5 is a literature review on Computer Science and
programming education and discusses the teaching resources that were used throughout the
work covered in Part II of this thesis.
In Part II, three studies, conducted with New Zealand primary school teachers and stu-
dents, are covered. Chapter 6 first gives an overview of these studies, the methodology used
in these, and the resources used for supporting teachers throughout this work. Chapter 7
covers a pilot study conducted with one teacher at an intermediate school, and the implica-
tions this had for the following work. Chapter 8 covers a wider scale study, which took place
throughout 2015 and 2016, and involved multiple teachers teaching a range of age groups
at different schools. Chapter 9 describes the final study, an intervention study that was
conducted within three different schools.
Lastly, Chapter 10 gives a summary of the thesis, the contributions it makes, its limita-
tions, and potential directions for future research.
5

1.4 Terminology
The following terms are frequently used throughout this thesis and their meanings are dis-
cussed when relevant. For clarity, summarised definitions are provided here:
Coding: Often used interchangeably with the word ‘programming’, particularly in the pop-
ular press and by organisations promoting the ‘learn to code’ movement. It can refer
to computer programming, but ‘coding’ and ‘code’ are also used in other areas of Com-
puter Science to mean different things. For the purposes of discussion in this thesis
the definition in which ‘coding’ is one part of the act of ‘programming’ will be used.
‘Coding’ can be seen as the final step in the process of programming: taking a designed
algorithm/solution to a problem, and implementing this in a form a computer can in-
terpret, i.e. writing it in a programming language. Following from this, ‘code’ can be
defined as the actual program, or multiple programs, that have been written [69].
Computational Thinking: Computational Thinking can be described, very broadly, as a
collection of mental processes and problem solving methods that are directly related
to computational concepts, and the thinking skills and practices used by Computer
Scientists. This subject is explored in Chapter 3.
Computer Science: The study of computers, computing concepts, and their interaction
with the world. It encompasses the theoretical study of computation and algorithms,
and the practical application of this in software and hardware. It covers a range of
fields, including but not limited to: computational complexity, algorithms and data
structures, artificial intelligence, computer graphics, networks, programming language
theory, human-computer interaction, computer architecture, security, and machine
learning [42, 59, 136, 182].
Computers and Digital Devices: The general definition of a Computer or Digital De-
vice is a device which processes information, represented as digits (most commonly in
binary), by performing mathematical and logical operations, according to instructions
given to it, in the form of a program. These terms are frequently used interchangeably,
and in the NZ curriculum they are taken to mean the same thing. They will be used
in this way throughout this thesis.
6
Computing: A broader field than CS. It encompasses Computer Science, as well as the links
between Computer Science and other disciplines and applications. This includes, for
example, the fields of information science and studies, information technology, software
engineering, and computer engineering [90].
Digital Literacy: Having the skills and knowledge to effectively use computers and dig-
ital devices to store, manipulate, create, and find information [17]. It is focused on
learning to use digital devices and technologies. It is distinctly different from learning
computing, but equally important. It is sometimes used as a synonym for ‘computer
literacy’, and ‘digital competence’, but opinions on whether these should be considered
the same thing are divided.
Programming: Can be broadly described as the process of taking a problem, analysing it,
creating an algorithmic solution to this, and implementing it in a form that a computer
can read and execute. The implementation of this generally involves the writing of
a program in a programming language and testing the solution. The meaning of
programming has evolved over time, and will possibly continue changing as our use
and understanding of computational devices changes over time [26, 69].
7

8

Part I
A New Curriculum for a Digital
World
9

Chapter II
Motivation
“Everyday life is increasingly regulated by complex technologies that most people
neither understand nor believe they can do much to influence.”
Albert Bandura, 2001.
In this digital age, where the influence of computing technology extends to all aspects of
society, understanding the nature of computing has become almost as crucial as learning to
read and write [10, 161]. Computing is ubiquitous. Our jobs, infrastructure, and education
systems depend on it. Its influence has entered national politics and international relations.
If someone lacks basic knowledge of computing and digital technologies, they are now placed
at a distinct disadvantage to those that do. Yet many people are currently not familiar with
these topics.
A core function of school education is preparing students to be capable and informed cit-
izens. To achieve this in the digital age, education systems around the world are changing.
The societal impact of computing technologies has motivated many countries to introduce
Computer Science (CS) to their school curricula. However, introducing CS is a massive shift
in traditional school curricula for the majority of countries. CS and related subjects, such as
programming and data science, have not commonly been taught at this level before, and the
majority of policymakers and school teachers are unfamiliar with it. This is also the case for
New Zealand, where this shift began when the subject area Digital Technologies was intro-
duced to high schools in 2011, and primary schools in 2018 [174, 175]. To successfully equip
the next generation with a sufficient understanding of computing and digital technologies,
we must ensure that any introduced curriculum achieves its educational goals.
In this chapter, I will cover why it is now considered essential for everyone to have a
basic knowledge of the nature of computing, and a degree of experience with CS and digital
technologies. The reasons for this extend from benefits on individual, national, and broader
societal levels, to minimising the negative impacts of this knowledge being restricted to a
10
small, and relatively homogeneous group of people. Based on these impacts, I then discuss
why the inclusion of this subject in school education is important, with a specific focus on
primary school. Finally, the motivation for my work, and how it contributes to the success
of this new curriculum, is summarised.
The terms “computing”, “programming” and “coding” are used frequently in this chap-
ter; for definitions of how these are used in this context, please refer to section 1.4, page
6.
2.1 Necessary Knowledge in a Digital Society
Humans no longer exist solely in a physical world, but also a digital one. To deeply un-
derstand the world we live in, an understanding of CS and the nature of computation has
become a necessity. This need was succinctly summarised by Douglas Rushkoff in 2010, in
his influential book “Program or be Programmed”. He advocated that programming skills
have now become crucial for everyone to learn [152, 153].
“When human beings acquired language, we learned not just how to listen but how
to speak. When we gained literacy, we learned not just how to read but how to write,
and as we move into an increasingly digital reality, we must learn not just how to
use programs but how to make them. In the emerging highly programmed landscape
ahead, you will either create the software or you will be the software. It’s really that
simple: Program, or be programmed. Choose the former, and you gain access to the
control panel of civilization. Choose the latter, and it could be the last real choice you
get to make.”
“We teach kids how to use software to write, but not how to write software. This
means they have access to the capabilities given to them by others, but not the power
to determine the value-creating capabilities of these technologies for themselves.”
- Douglas Rushkoff, 2010, Program or be Programmed
The title of this book has become somewhat of a catchphrase in media discussing (and
sometimes warning of) the influence of computer technology in our lives.
On the one hand, as these technologies have such a strong impact on our world, those
of us working in this field are frequently contributing to solutions for critical problems
11

facing humanity today [81]. Not only scientific research and knowledge, but also social,
economic, and environmental, partially depend on the field of computation. On the other
hand, the application of these technologies can have many negative ramifications, both
intentionally or through unintentional consequences. These range from wrongful termination
of employees [138], to enforcing racial discrimination [138], and influencing our political
decision making without our knowledge [66].
Both these positive and negative cases are strong motivators for changing our education
systems. These systems now need to include the subject of CS (which often appears as
Computational Thinking in school curricula).
2.1.1 Understanding and influencing our world
School education should ready students to be informed citizens in society. A requirement of
this is having an understanding of why the world around them functions the way it does. The
following quote from Mark Guzdial, author of “Learner-Centered Design of Computing Ed-
ucation: Research on Computing for Everyone”, summarises the contribution of computing
to this understanding:
“Computing is a part of students’ lives. We ask students to study chemistry because
they live in a world where there are chemical interactions. We ask students to study
biology because they live [in] a living world. They also live in a computational world,
and the reality of computation is probably going to impact their daily lives more than
remembering the structure of a benzene ring or the stages of mitosis.”
Mark Guzdial, 2015 [90]
I would add that this applies to physics as well; we have students study physics because
they live in a physical world, governed by physical laws. By this logic, living in a digital
world requires the same level of study is directed towards computing. In a similar vein, the
case that computation and CS should be considered the ‘fourth great domain of science’
was put forward by Denning in 2009 [64]. He argued that rather than being a part of other
sciences, or used in them, it is an entirely separate science unto itself, as it not only occurs
in systems created by humans but also in living and social systems. Because of this, it can
be called a science of both the natural and the artificial.
Basic knowledge of the sciences actively contributes to a persons ability to understand
and influence the world around them. Enabling the next generation (and preferably older
12

generations as well) to be creators and influencers of new technologies, not just users of it,
is a key motivation for teaching computing [115].
Being equipped with these skills and knowledge can assist the next generation in making
positive changes in our world. Having a more diverse group of people working in this
field, who understand the ethics of using these technologies, is critical. It could increase
the socially beneficial impacts of computing technologies, compared to those impacts which
could be seen as damaging [81].
By studying computation students can develop a more complete understanding of the
world around them. Without it, they may be missing a crucial piece of knowledge, and be
put at a disadvantage in both their careers and everyday lives.
2.1.2 Awareness of technology’s influence
Being a part of modern society now comes with the condition we accept that digital tech-
nologies are ever-present in our daily lives, have a degree of influence over us, and have a
degree of access to our personal information. Big data, Machine Learning, and Predictive
algorithms have become commonly discussed issues in the media, particularly with a focus
on their potential misuse. The technologies of data science and machine learning algorithms
have been applied to solving many pressing and complicated problems. They have applica-
tions ranging from increasing the accuracy of cancer diagnosis [192], to predicting extreme
weather events due to climate change [124]. However, there are sometimes unexpected or,
sadly, intentionally damaging consequences from their use.
The current and future issues surrounding the use of big data and machine learning al-
gorithms were explored by Cathy O’Neil in her 2016 book “Weapons Of Math Destruction:
How Big Data Increases Inequality And Threatens Democracy” [138]. O’Neil discussed the
consequences of the application of these algorithms, and how these frequently disproportion-
ately impact those already struggling in society. For example, the use of predictive policing
software, trained with racially biased data, caused police to target predominantly African-
American and Hispanic neighbourhoods [138]. The same software has been used in the
UK [137], and similarly flawed software in Australia [119]. Algorithms trained with biased
data will perpetuate biases, such as prejudice based on peoples race, gender, class, disabil-
ity, etc. Without a foundational knowledge of algorithms and software, it is challenging to
understand, and critically examine, cases such as these.
Another frequently discussed issue surrounding technology and the internet is privacy.
13

The collection of personal data to be shared, sold, or used to profile people, is commonplace.
It is done by private companies, governments, and public service institutions around the
world. This can have many positive effects on peoples lives, but this data can also be used
in ways that the people whose information has been collected, do not want it to be used.
While this is a highly publicised issue, many people are still unaware of just how much of
their personal information can be collected, and how it can be used. By learning about
software, and the digital technologies employed by these institutions, people can make more
informed decisions about how they share their information. They gain more control over
their own data, enabling them to protect it if they wish to.
An awareness of these technologies and their capabilities encourages people to interrogate
and be critical of the systems around them, and hold public and private agencies to account
for how they use, or misuse, digital technology and data. It allows more people to have a say
in the development of these systems, and in how they are ethically used. Linda McIver, the
founder and director of the Australian Data Science Education Institute1, gave the following
argument [125] for why children specifically need to be aware of how their data can be
collected and used:
“The more our kids understand about data science, the more they’ve learnt about
the ethics of it, the implications of it, and how the technology actually works, the
better equipped they will be to control its impact on their lives. If we can teach kids
to manage, analyse, and communicate data effectively, they will be able to participate
in informed conversations about the way data is used, both for and against us”
- Linda McIver, 2018, We need to arm our kids against the interests of Big Data
Understanding the underlying principles that digital technologies, data, and algorithms
are built on empowers people to become informed citizens in a digital world.
2.1.3 Representation in the computing industry
The technology industry suffers from a lack of diversity in the majority of countries where
this industry is established. Computing and software professionals tend to overly represent
the more privileged groups in our society. For example, in New Zealand, Maori, Pacifica
peoples, and women are all under-represented in computing. According to a 2017 report from
the New Zealand Digital Skills Forum, only 36% of students studying CS and IT degrees
1 Australian Data Science Education Institute https://adsei.org/
14

(undergraduate and postgraduate) identified as female, 8% as Maori, 6% as Pacifica peoples;
and women made up less than 30% of IT professionals [131]. In 2015 a report on Maori and
ICT stated that while Maori make up 12.5% of the New Zealand (NZ) workforce, they only
make up 5.8% of the ICT workforce, and were more likely to be employed in lower-skilled
ICT occupations, compared to non-Maori in the same sector [128]. To improve diversity in
the technology industry, we need a broad range of people, who represent the community, to
be pursuing careers in this field.
A wide range of factors has contributed to the low recruitment and retention rates of
women, Maori, and Pacifica peoples in CS and IT. Some of the most common reasons are a
lack of prior exposure to these subjects, misconceptions about what CS is, what Computer
Scientists and Software Engineers do, and the impact of the many stereotypes surrounding
these subjects and whom they are suited to [41, 123].
The stereotype that computing is “just for boys”, and that men are naturally more com-
petent and interested in these subjects has historically been widespread [123], despite the
evidence against this [24, 25, 156, 162]. According to a much more recent meta-analysis per-
formed by Cai, Fan, and Du (2017) there is evidence that the belief in this stereotype may
have lessened over time, but still exists [34] This stereotype is a self-reinforcing one. This
perception that men naturally have a higher aptitude for these subjects is skewed dramat-
ically by the gender differences in childhood experience with computing and programming,
which again is impacted by the stereotype that computing is an inherently ‘male’ subject
[123].
Similar to the stereotype that computing is a male subject, and still currently widespread,
there is a perception that computing is a ‘Pakeha 2 thing’, which has been around since com-
puters first began entering the home in NZ [167]. This pertains to the subject of computing,
and also the use of computers.
The term ‘digital divide’ is used in many countries. It refers to the difference in access to
computers and the internet between different demographic groups. Many of these divisions
are based on a person’s income, race, and whether they live in urban or rural areas. Those
without access are significantly disadvantaged in the modern world. In NZ, Maori and
Pacifica peoples are significantly less likely than other ethnic groups to have access to a
computer or the internet within the home [80, 128]. This further enforces the stereotype
that computing is not for these groups of people.
2 Pakeha refers to New Zealanders of European descent.
15

In NZ, digital technologies are used by virtually every person every day. The developers
of these technologies should be representative of their users. When they are not, there can
be drastic consequences, which are frequently related to disadvantaging the groups of people
who are under-represented in the technology industry [123, 138]. Increasing the number of
people from these under-represented groups entering IT professions is critical to the health
of the technology industry, in NZ and abroad. This is not merely an issue of ‘fairness’
(although this is a motivating factor), but also one of societal and economic benefit.
Increasing diversity in the IT workforce benefits both consumers and businesses. Tech-
nology businesses with a gender-balanced workforce (particularly a balance at top-level man-
agement), compared to businesses that do not, perform better financially; have teams which
have higher productivity, are more likely to meet deadlines, and more likely to stay under
budget; and demonstrate greater employee performance [13]. In the specific case of software
development, increasing diversity in a team also leads to a higher quality of produced soft-
ware [6]. The contribution of Maori led technology companies to the economy has risen in
recent years, and reached approximately $93 million in 2017. Maori businesses are also more
likely to prioritise and achieve social benefits for their communities.
As a lack of prior exposure to computing topics contributes to the digital divide, and
the likelihood of a student pursuing study in this area, it is hoped that introducing CS to
primary school education can contribute to an improvement in representation in the tech
industry, within NZ and abroad.
2.1.4 Economic considerations
Having a digitally competent population is also necessary on an international scale. It will
be one of the most significant contributors to our ability to confront pressing global issues
such as climate change, resource depletion, and inequality around the world. It is also crucial
on a national scale. In the context of NZ, the health of our economy, our national security,
and our ability to tackle national issues depend on this. Digital technologies are impacting
political decisions, and changes to our legal system. If only a minority of our population
understands the nature of these technologies, there will likely be negative implications, and
missed opportunities, for NZ.
There are economic incentives for introducing more young people to CS and program-
ming. Virtually every industry and field of employment makes use of software and benefits
from this. The software industry itself is growing and highly paid. Jobs in IT are paid
16

above the national average in NZ, regardless of the employee’s qualification level (although
the average increases with higher qualification levels) [135]. In NZ the median base salary
for IT professionals rose by 13% in six months, from August 2017 to February 2018. Four of
the top ten highest paid jobs advertised on TradeMe3 in 2017 were in IT and software de-
velopment [35]. However, NZ is facing a shortage of computing professionals to fill available
jobs.
In 2017, the NZ Digital Skills Forum carried out three large scale surveys, to investigate
the current and projected demand for digitally skilled workers. They surveyed technology
firms, government organisations, and collected profile and recruiting data from LinkedIn.
The responses to these represented over 130,000 people employed in IT jobs in NZ. The
report they produced concluded there is a strong, and increasing, demand for workers with
IT and digital skills [131]. Their findings are summarised in Figure 2.1.
These trends of increasing salaries and job opportunities, along with current and pro-
jected skill shortages, are not unique to NZ. According to the same report “Australia is
predicting an additional 81,000 ICT jobs by 2022, the United Kingdom forecasts an addi-
tional 745,000 digital workers by 2018, Europe expects to be short of 500,000 IT specialists
by 2020, and the United States of America estimates there will be over 20 million new tech-
nology jobs within two decades”, and that three out of four businesses in the UK reported
shortage of digital skills as a challenge for their company [131]. In summary, the reports
key finding was there is a great lack of local supply of skilled computing professionals, and
“Urgent action needs to be taken, to both increase the number of students studying these
subjects and attracting under-represented cohorts”. Primary school curriculum can have a
significant impact on this.
2.2 Primary School focus
The main arguments for teaching these topics specifically at a primary school level were
collated in a paper I co-authored, “A Pilot Computer Science and Programming Course for
Primary School Students”, in 2015 [67]. These are:
• Preparing students for future endeavours in computing, in both high school, and post-
school [114].
3 TradeMe is a website commonly used for advertising jobs in NZ. Salaries in medical specialities andself-employment are not taken into account in this ranking as these jobs are not advertised on TradeMe.
17

Figure 2.1: New Zealand’s Digital Skills Shortage [131]
• Giving students the confidence and capacity to be more than just users of digital
devices [115].
• Increased diversity in the computing industry, by reaching students aged 12 or younger,
particularly those from unrepresented groups, when they are still forming views of their
competence in this subject [123]
• The value of exposing students to the concepts before they reach the demands of
18

high school, the challenges of adolescence, and the risk of exposure to stereotypes of
computing, any one of which may discourage them from learning these concepts [69].
• It is well established that, for the vast majority of people, pre-adolescence is the optimal
time for learning new skills [103, 140].
• It can encourage early development of general Computational Thinking skills.
As topics in primary school curriculum are very rarely elective, including CS would allow
more students to develop a foundational understanding of computing and digital technolo-
gies. This would, of course, be of benefit to any students who continue to pursue this subject,
but it would also benefit those who do not. As previously discussed in section 2.1, comput-
ing extends to almost all fields of work. Regardless of a person’s career path, knowledge of
computing will most likely aid them in this, or at least not place them at a disadvantage.
The majority of people are currently constrained to merely using technology, rather than
modifying it or creating new technologies. When people see problems or ways they can
improve things in the world around them, they will have more tools at their disposal to do
something about this if they have gained an understanding of computing.
As discussed in section 2.1, for those who might enjoy studying computing further, pri-
mary school curriculum provides an effective way of encouraging them to pursue degrees,
training, and careers in this field. This is because exposure to these subjects in school allows
students to ‘try them out’, and find out if it is something they are interested in pursuing.
A student who does not know what CS is, or has never tried programming, is less likely to
pursue tertiary education or employment in this area than a student who does. They are
more unlikely to even pursue it at a high school level.
When it comes to exposing and interesting a more diverse range of students in this
subject, there is evidence that introducing these topics after primary school is likely to be
too late. This is because stereotypical views of the ‘type of people’ this subject is for, may
have already set in. A 2011 study of 247 American children, found that by the age of six
both girls and boys already displayed, implicitly and explicitly, a belief in the stereotype that
‘maths is for boys, and not for girls’ [52]. While there is evidence that these stereotypes
are becoming less common, they do unfortunately still exist [34]. At primary school age,
particularly before the onset of puberty and the social and self-image issues which come with
this, students are likely to be more open to learning these subjects.
19

Primary school age is also likely an ideal time for students to learn and develop Com-
putational Thinking (CT) abilities. For the majority of people this time is when their
neural-plasticity is at its highest and learning new skills, and retaining these into adulthood,
comes more easily [103, 140]. It is also a particularly interesting time for learning CT, and
about computing, as one of the core skills for these is logical thinking. In Piaget’s model of
child development, the ages identified as when logical thinking is developing were between
7-11 [142]. While these age boundaries have been found to be relatively variable between
different people [130], primary school ages are still generally the time when this develop-
ment happens. Papert noted the potential link between children’s increased ability to learn
natural languages, and their ability to learn programming languages: “Programming a com-
puter means nothing more or less than communicating to it in a language that it and the
human user can both understand. And learning languages is one of the things children do
best” [139].
2.3 Motivation for this work
CS is an entirely new subject for pre-tertiary education in the majority of countries who
have added it to their school curriculum. If the goals of teaching CS and CT are to be
achieved, there are several problems that need to be solved.
The specific topics and concepts that should be included in this curriculum need to be
identified. In choosing these, we must consider what is necessary for everyone to learn, and
what concepts students should be exposed to so that they can make an informed decision
about whether they wish to continue study in this area.
Effective ways of teaching these topics need to be identified. If teachers are not adequately
supported in implementing this curriculum, there is no hope of it succeeding [186]. If through
lack of effective pedagogy these topics are taught badly it will likely do more damage than
if they were not taught at all. Alongside good pedagogy, sufficient and effective teacher
training and support methods must be established.
Finally, if CS and CT are effectively taught, we need to assess whether they actually
have the desired positive impacts and if there are negative impacts.
In order to address these problems, I conducted four years of studies with NZ primary
schools. I worked to support NZ primary teachers in trialling CS, programming, and CT
in their classrooms and collected information on theirs, and their students’, experiences.
During this time I was also involved with the development of the NZ schools Digital Tech-
20

nologies curriculum, particularly with the newly added ‘Computational Thinking’ strand.
The findings of my work contributed to this development.
21

Chapter III
Computational Thinking, the 21st Century Skill
Coding has frequently been proclaimed to be ‘the new literacy for the 21st century’, with
programming being seen as a skill every student will need in the future. The popularity of
‘coding for all’, and ‘Learn to Code’ initiatives has spread across the globe, and sparked
millions of students’ and teachers’ interest in this area. However, recently there has been a
shift in focus from merely coding, to Computational Thinking (CT) being the crucial skill
for all to learn [87, 189].
CT has been added as a core learning area to curricula around the world, including
in NZ. Teaching CT is however not a straightforward task. Unlike long-standing school
subjects, such as Maths, History, or the Sciences, this is a new and ill-defined area, and
there is much debate around the meaning of CT. As of 2014, when I began my research,
the view that CT is a crucial skill for all students to learn had been widely adopted by the
Computing Education community [85]. It was not a focus of the pilot study I conducted,
but subsequently became a central focus of my research, my work with teachers, and my
involvement in the development of the NZ primary school Digital Technologies curriculum.
There were many developments in the area of CT throughout the years I conducted the
research covered in this thesis. Not all sections of the literature covered in this chapter were
available during each study, and a significant amount has been published since these studies
were completed [62, 63, 86, 101, 110, 144, 146, 161].
In this chapter, I will cover the history of CT; the many descriptions and definitions of
it that have been given, and the challenges of settling on one overarching definition. The
relationships between Computer Science, problem solving, and CT, and the implication of
these factors on defining CT are discussed. Assessment methods (and the lack thereof)
are then explored. Finally, CT frameworks specifically designed for use in primary school
education are discussed.
The terms “computing”, “programming” and “coding” are used frequently in this chap-
ter; for definitions of how these are used in this context, please refer to section 1.4, page
22

6.
3.1 What is Computational Thinking?
Computational Thinking can be described, very broadly, as a collection of mental processes
and problem solving methods that are directly related to computational concepts, and the
thinking skills and practices used by Computer Scientists. CT is a concept that has existed,
in varying forms and with different names since the 1940s, and has recently become popular
in the K-12 Education sphere [63, 169].
The term ‘Computational Thinking’ was first introduced in 1980, by Computer Scientist
and Educator, Seymour Papert, in his pioneering book “Mindstorms. Children, Computers,
and Powerful Ideas” [139]. At that time computers and computer-aided-instruction were
becoming common in schools. They were used mainly with ‘drilling and practice’ programs,
designed to reinforce previously learnt knowledge [129]. Mindstorms was about very different
ways computers could be used in education. It presented the groundbreaking idea that
computers could be used as a tool to facilitate new ways to learn, and think:
“In this book I discuss ways in which the computer presence could contribute
to mental processes not only instrumentally but in more essential, conceptual ways,
influencing how people think even when they are far removed from physical contact
with a computer.”
- Seymour Papert. Mindstorms (Page 4)
While Papert coined the term Computational Thinking, and Mindstorms explored the
foundational concepts of it, it was not actually identified as a specific term, or name, for
anything. It was simply mentioned once in passing when referring to computer hobbyist
clubs: “Their visions of how to integrate computational thinking into everyday life was
insufficiently developed” (page 182 [139]). The assignment of this title to the thinking,
learning, and problem solving that was deeply explored by Papert, seems to have come from
future researchers in this area. Papert’s work was highly influential on the use of computers
as a teaching tool in the classroom, but CT as a distinct concept did not truly gain traction
in education and computing research until much later.
This happened in 2006 when the idea of ‘Computational Thinking for all’ was reintro-
duced to the Computing community in Jeannette Wing’s seminal article ‘Computational
Thinking’ [189]. She identified it as a “Fundamental skill... something every human must
23

know to function in modern society”, and has since referred to it as “the new literacy of the
21st century” [191].
Wing’s article triggered a wave of interest in the topic, particularly in the education field.
Wing described CT in terms of the many different skills it encompasses, the elements of CS
that are key to it, and how computation itself can be applied to almost any field of study.
In 2008 Wing published a follow-up article, “Computational thinking and thinking about
computers”. This article gave one of the first specific definitions of CT:
“Computational thinking is taking an approach to solving problems, designing sys-
tems and understanding human behaviour that draws on concepts fundamental to
computing” [190]
Expanding on her 2006 article, she explored the ubiquity of CT and the types of problems
it can be applied to, from optimising the assignment of organ donors to recipients, to creating
new techniques for analysing historical texts. In 2010 Wing, Cuny, and Snyder published
another definition:
“Computational Thinking is the thought processes involved in formulating problems
and their solutions so that the solutions are represented in a form that can be effectively
carried out by an information-processing agent.” [191]
Wing stated that this definition was inspired by a conversation held with Alfred V. Aho,
who then proposed a similar definition in 2011. This definition conceptually agreed with
Wing, Cuny, and Snyder’s, but specified that to be carried out by an information-processing
agent a solution must be “represented as computational steps and algorithms” [1]. Both
of these definitions touch on an essential point about computation, and algorithmic solu-
tions. These are not something performed only by computers, they can be performed by
any information-processing agent, which includes humans. As CS is the study of compu-
tation, being a Computational Thinker is a key part of being a Computer Scientist, and
CT is sometimes described (in a slightly over-simplified way) as “thinking like a Computer
Scientist”.
Many other definitions have been proposed since these, and over the past five years this
area has become a particularly popular topic of research.
24

3.1.1 Challenges for finding a definition
Articulating a broad overarching definition of CT has proved difficult. This is partially
because it is generally agreed CT encompasses many varied aspects across different levels
of education, and in areas outside of education. Opinions on its importance and breadth
vary among CS educators and researchers. With new curricula being introduced across the
world, and the high public engagement created by the “Learn to Code” movement, work in
this area is additionally subject to political motivations.
The many definitions produced since 2006 vary significantly in form, from one-sentence
summaries to comprehensive explanations of each skill encompassed by CT, and their ap-
plications. The contents of these definitions also diverge in many ways [169]. Some place a
strong emphasis on the connection between CS concepts (and in some cases programming)
and CT skills, while others aim to remove the connection to CS entirely. More recent def-
initions have frequently extended CT to cover attitudes and dispositions towards problem
solving, and interpersonal skills. Many have also been crafted for specific age levels and
target audiences, such as generalist teachers, contributing to the wide variation in defini-
tions [63, 85, 158, 159].
Wing’s article gave a broad, big picture description of CT, and the many benefits she
believed it could have. As it was not intended to outline a CT framework or curriculum it
was, unsurprisingly, not particularly suitable for application in education [15, 121]. Many
of the definitions published since 2006 have been criticised for being too broad and vague,
while other more verbose and detailed ones have been dismissed as too difficult to interpret,
particularly for people without a background in Computer Science (CS). The CS education
community has not yet agreed on a definition of CT, despite the large number that have
been published, and the many similarities between these [122].
Voogt et al, [185] examined the tension of whether to define CT in terms of what are
considered its ‘core qualities’, or in terms of the more ‘peripheral qualities’, such as the
attitudes and dispositions the skill ideally encourages. They argue that incorporating more
than core concepts and skills “runs the risk of diluting the idea of CT, blurring and making it
indistinct from other 21st century skills (e.g., media information literacy)” [185]. Tedre and
Denning share this view. They claim the recent efforts to broaden CT will have a significant
negative impact on the potential educational merits of teaching this topic [169].
Both within, and outside the field of education, no one definition has been agreed upon.
This can be seen from the large amount of work that has been done since 2006 to produce
25

a universal definition of CT [14, 15, 16, 29, 60, 85, 88, 158, 159, 161]. It has been defined
and redefined by researchers from universities, industry, international computing organisa-
tions, and educational institutions around the world, and is still continuously developing.
Meanwhile, curriculum is being explored and developed without an agreed upon definition
to build on. This is causing huge variation between curriculum levels around the world. This
is discussed in Chapter 4, in relation to synthesising a curriculum for NZ.
Despite the differences in these definitions and descriptions, there are many areas of
overlap between them and there is a growing consensus on the necessary elements of a
definition [50]. There is also a high degree of consistency with the original thought and
problem solving processes described by Papert. By examining the broad range of these
definitions it is possible to get a general, and usable, view of CT even if there is no one
universally agreed upon definition.
3.2 Reviews of the definitions
There have been several attempts in recent years to collate the many CT definitions and
frameworks that have been proposed. In 2013, the most prominent definitions of CT were
aggregated by Selby and Woolard [159] in a technical report, covering descriptions of CT
published between 2006 (beginning with Wing’s 2006 article) and 2012. They examined
published documents on CT, papers referencing Wings’ publications, and CS curricula (cur-
rent and proposed at the time) from six countries. From this review, they identified common
terms and concepts and advised which terms should, and should not, be included in a defi-
nition. Their conclusions are shown in Table 3.1.
Selby and Woolard’s conclusions broadly match the definitions and descriptions of CT
published since their review. The main exception to this is that Selby and Woolard exclude
‘Logical Thinking’ and ‘problem solving’, while these are included in many of the more
recent definitions. CS content is also often incorporated into a definition, or its inclusion is
suggested when CT is taught.
In 2013 Grover and Pea [85] reviewed papers from the same period (2006-2012) and
focused on the importance, and possibilities, of introducing CT to a curriculum. They
emphasised that along with finding a suitable definition, assessment of CT is critical to its
success in any K-12 curriculum [85]. Despite this, CT assessment is an underdeveloped
area. Research on this, which goes beyond small exploratory studies, has only recently been
emerging.
26

Term Status Justification
A thought process Include Consensus found in theliterature
Abstraction Include Consensus found in theliterature
Decomposition Include Consensus found in theliterature
Logical thinking Exclude Broad term, not-welldefined
Algorithmic thinking Include Well-defined acrossmultiple disciplines
problem solving ExcludeBroad term, evidences theuse of skills; developsacquisition of skills
Evaluation Include Well-defined acrossmultiple disciplines
Generalization IncludeWell defined concept,although the term may notbe familiar
Systems design Exclude Evidences the use of skills
Automation Exclude Evidences the use of skills
Computer Science content Exclude Evidences the use of skills
Modelling and simulation Exclude Evidences the use of skills
Table 3.1: Computational Thinking Definition Terminology - table by Selby and Woolard,reproduced from [159]
27

In 2017 Shute, Sun, and Clarke conducted a research review of CT definitions across
different disciplines [161]. From this, they presented a definition of CT for K-12 educators
and a model for implementing and assessing CT in K-12. They emphasise the distinction
between programming and both CS and CT, and that there is much more to CS and CT
than programming. This is an important distinction to make, as programming is sometimes
seen as the core of both of these areas, which can lead to education focusing solely on
programming. This is problematic, as there are many additional concepts and practices
encompassed by CS and CT. Webb et al. [186] described the difference, and relationship
between programming and CT as follows:
“The distinction between computational thinking and programming is subtle; in
principle computational thinking does not require programming at all, although in
practice, representing a solution to a problem as a program provides a perfect way
to evaluate the solution, as the computer will execute the instructions to the letter,
forcing the student to refine their solution so that it is very precise.”
- Webb et al. 2016. Computer Science in K-12 school curricula of the 2lst Century:
Why, what and when?
Shute, Sun, and Clarke, also discuss the differences between CT and other thinking pro-
cesses, and what makes CT distinct from Mathematical, Engineering, Design, and Systems
thinking. However, their proposed definition seems to do the opposite of this, as it is exceed-
ingly general. They define CT as “The conceptual foundation required to solve problems
effectively and efficiently (i.e., algorithmically, with or without the assistance of computers)
with solutions that are reusable in different contexts” [161]. The qualifiers ‘effectively and
efficiently’ and ‘reusable in different contexts’ can be said to encompass CT, but these are
in no way unique to CT or algorithmic solutions. This can effectively apply to solutions
resulting from any of Mathematical, Engineering, Design, and Systems thinking, and other
fields. This definition discounts one of the core ideas that is included in the majority of
prominent CT definitions: that the algorithmic solution is one which is made up of compu-
tational steps, meaning they are specific and unambiguous enough that they can be carried
out by an information processing agent.
In 2018, Juskeviviene and Dagiene compiled a timeline of the most prominent defini-
tions and frameworks, for CT, published between 1996 and 2017 [104]. Based on these
definitions they selected eight concept groups to describe CT: Data analysis and representa-
tion, Computing Artefacts, Decomposition, Abstraction, Algorithms, Communication and
28

Collaboration, Computing and Society, and Evaluation. Computing Artefacts was a new in-
clusion, and it is generally associated with digital literacy and the use of Digital Technologies,
rather than CT or CS. They also examined the links between CT and ‘Digital Competence’,
as defined by the ‘Digital Competence (DC) Framework 2.0 (DigCom)’.1 They concluded
there was a great deal of overlap between these two areas, which is likely why they included
Computing Artefacts in the CT concepts. The concepts included in this particular model
of Digital Competence appear to include more skills focused on problem solving than those
that are often included in similar models, or interpretations. In contrast, in NZ ‘Digital
Competence’ is generally seen as using computers and creating things with them, rather
than being focused on problem solving or an understanding of how computers work.
Alan Bundy described the difference between what is generally known as digital literacy
or competence, and CT in the following way:
“Of course, we all have computers on our desks nowadays. We all use them for
email, web browsing, word processing, game playing, etc. But the computational
thinking revolution goes much deeper than that; it is changing the way we think.
Computational concepts provide a new language for describing hypotheses and the-
ories. Computers provide an extension to our cognitive faculties. If you want to
understand the 21st Century then you must first understand computation.”
- Bundy. 2007. Computational Thinking is Pervasive [33]
3.2.1 The role of Computer Science in Computational Thinking
For the purposes of this thesis Computer Science is defined as the following:
Computer Science: The study of computers, computing concepts, and their interaction
with the world. It encompasses the theoretical study of computation and algorithms,
and the practical application of this in software and hardware. It covers a range of
fields, including but not limited to: computational complexity, algorithms and data
structures, artificial intelligence, computer graphics, networks, programming language
theory, human-computer interaction, computer architecture, security, and machine
learning [136, 42, 59, 182].
1 https://ec.europa.eu/jrc/en/digcomp/digital-competence-framework
29

Despite Wing’s assertion that CT draws on concepts from CS [190], there have been
arguments that CT should be considered, and therefore defined, as entirely separate from
CS and computing [61]. The fact that the computational steps and algorithmic solutions
can be performed not only by computers, but also by humans, has been taken by some
to mean that CT need not involve programming or computers at all. This viewpoint has
become increasingly common since the current CT in K-12 movement began. Many of the
definitions published in the past ten years have focused less on computing and CS, and in
some cases these topics have been all but removed. This is largely based on the view that
CT should be seen as a form of problem solving that is widely applicable, and not unique
to computing subjects. Much of the emphasis on CT education is on incorporating it into
other subjects and aspects of life, in which case removing its connection with CS could be
seen as a logical decision.
On the other hand, it has also been argued that removing the CS elements of it would
change the core meaning of CT, and make it indistinguishable from general problem solving
skills [169, 185]. An example of this is the previously discussed definition proposed by Shute
et al. [161]. This effort to broaden CT, so that it can cover all possible areas, may have also
contributed to the difficulty of defining it clearly [63]. CT is a concept that came directly
from CS and Computer Scientists. In the 1950’s-80’s the idea that there were thinking
and problem solving skills which were unique to CS was discussed almost exclusively in the
context of it being one of the contributing factors to what made computing a subject in
and of itself, rather than merely a field of engineering or mathematics [169]. According to
Tedre and Denning, one of the first people known to have touched on this idea was Alan
Perlis, who, in 1960, presented the idea that “the value of computers is less about their use
as instruments and more about their cultivating a certain style of reasoning about problems
and designing solutions” [169]. The idea that there is a set of thinking skills that are unique
to computing has been reiterated by many highly influential figures in the field of CS, such
as Dijkstra and Knuth [169].
CT is frequently described using terms that are widely applicable and have no reference
to CS or computing, such as ‘thinking process’ and ‘problem solving method’. Removing the
computing element of CT effectively removes the attributes that distinguish it from other
already established problem solving methods. CT is also described as a process that produces
solutions that can be implemented using computers, computing tools, information processing
agents, or that in some way leverages computational concepts, to improve them [14, 43, 60,
82, 88, 100, 190]. Enabling people to take advantage of computing technology in the ‘digital
30

age’ is one of the most referenced benefits of CT education. Removing CS from a definition
of CT would therefore be detrimental, as it would make much of the effort to teach the skill
redundant [14, 43, 60, 82, 88, 100, 190].
While it is important that a definition of CT should allow it to be applied across the
broader curriculum, I argue that divorcing CT from CS will not assist with this, and agree
with the view that this would decrease the benefits of CT education. CT is a relatively
abstract notion, that can be made more tangible by the CS concepts it draws so heavily from.
The inclusion of CS principles would not automatically prevent cross-curricula integration of
CT. As will be expanded on in chapters 7 and 8 in Part II of this thesis, during my work with
many NZ primary schools it was demonstrated that CS and programming principles could
be taught in conjunction with a range of subjects, including literacy, numeracy, geometry,
algebra, design, and social studies [67]. During this work, teachers found that using CS and
programming concepts strengthened learning, and was highly engaging for students. If CS
can be integrated with other subjects, there is no reason why CT, together with CS, cannot
be.
It is also important to consider the place of programming in CT education, and as a part
of CT in general. The misconception that programming is all there is to CS and computing
is widespread, and this sometimes influences the way CT is presented and described [69].
Tedre and Denning describe how “CT initiatives that focus solely on programming tools and
techniques market a tasteless, scentless view of computing that emphasises [an] analytical
abstract world far distant from the hands-on dirty complexities of the real-world” [169].
There is much more to CS and CT than programming, so it is sometimes argued that
programming should be cut out entirely from CT. However, like CS, programming can be
used to facilitate and strengthen CT education. When solving problems through CT, the
goal is to create an algorithmic solution, made up of computational steps.
Programming provides a way for students to implement these algorithmic solutions. As
computers will obey the instructions they are given exactly as they are, programming allows
students to check if their algorithmic solutions work as they intended, and enforces the need
for these algorithmic steps to be precise and unambiguous. “Programming puts the wheels
on CT” has become a way we describe this relationship between CT and programming, in
the UC Computer Science Education Research Group.
31

3.3 Problem solving and Bold Claims
Many claims have been made about how CT skills can benefit problem solving in multiple
subject areas, and in everyday life. The problem solving approach of CT is seen by much of
the CS education community as one that students should be able to apply to multiple areas,
and can assist their general learning.
“The Computer Science for All education movement, which began around 2006,
is motivated by two premises: that computational thinking will better prepare every
child for living in an increasingly digitalized world, and that computational thinkers
will be superior problem solvers in all fields.”
- Peter J. Denning, 2017. Remaining trouble spots with computational thinking
(It should be noted that Denning is stating this rather than claiming or agreeing with
it, and in context he is critiquing this claim). Despite how widespread this opinion is, there
is very little empirical evidence that this learning transfer occurs, and that CT can benefit
people other than those who work in, or study, computing [63, 95, 169]. Many of these
claims appear in blog posts, opinion pieces, and other ‘grey literature’. Where they appear
in research publications, there is little to no evidence given to back these statements. In
2015, Mark Guzdial stated that after reviewing all available research on the benefits of CT
for generalised problem solving, there was no adequate evidence to confirm these claims [90].
Several Educational Psychologists have also expressed misgivings about these claims [89].
Much educational research on the topic of learning transfer concludes that “Transfer does
not happen easily or automatically” [3], and needs to be facilitated through appropriate
‘teach for transfer’ pedagogy. CT seems to currently be seen as an exception to this.
The claim that CT can benefit everyone is seen by many as one of the foundations the
CT education movement is based on. However, this overarching benefit is not universally
accepted. Denning challenged this assertion that CT will benefit everyone, in both their
careers and their everyday lives:
“it is reasonable to question whether computational thinking is of immediate use
for professionals who do not design computations—for example, physicians, surgeons,
psychologists, architects, artists, lawyers, ethicists, realtors, and more.”
32

“Another claim suggested in the operational definitions [of CT] is that computa-
tional thinking will help people perform everyday procedural tasks better—for exam-
ple, packing a knap-sack, caching needed items close by, or sorting a list of customers.
There is no evidence to support this claim. Being a skilled performer of actions that
could be computational does not necessarily make you a computational thinker and
vice versa.”
- Peter J. Denning, 2017. Remaining trouble spots with computational thinking
As these claims are frequently used as a key selling point when advocating for school
curriculum changes, establishing their validity is critical to the development of new CS and
CT school curricula. This is not to say that CT is not invaluable if these claims turn out to
be false, it could still be highly beneficial to students, but if these assumptions are invalid
then perpetuating them can be damaging [63, 95, 169].
“Exaggerated claims about CT serve no one—for eventually, when CT cannot de-
liver on such claims, there will be many disillusioned educators and consumers of
education, and computer science will be seen as an over-seller of CT. CT is powerful
enough without exaggerated claims.”
- Tedre and Denning. 2016. The long quest for computational thinking.
Whether or not teachers observe improvements to students’ general problem solving is
a topic I choose to focus on during my work, due to these contentions and the lack of
supporting research.
3.4 Assessment
For CS and CT curricula to succeed, educators need to be provided with methods to measure
students’ learning [150]. Without a means of assessment, it is difficult for teachers to gauge
their students’ understanding of the topics they have covered, determine if the teaching
materials used are suitable, and give students feedback on their progress. As CS is not a
subject that has traditionally been taught at this level and CT is new to curricula in general,
there are currently no widely established methods of testing these in primary school [164,
171, 193]. However, this field is rapidly growing so this may change in the near future.
Many of the assessment methods that have been used or proposed (as of writing) for
pre-tertiary education focus on close observation of students, or in-depth analysis of the
33

work they produce to evaluate their skills [84, 115, 116, 181, 187]. These methods are too
labour intensive, and require too much subject matter expertise, to be used for assessing
large numbers of students in typical school environments. Thus, they are not currently of
practical use in the majority of schools. Interviews with students can provide a measure of
their level of CT, and are a powerful method of gaining insight into students learning [78].
However, this is again a time intensive approach, and not suitable for assessing large numbers
of students.
In 2014 Curzon et al. published a framework for CT in school education [51], which
included a section on assessment with a different approach. This framework described a set
of core CT concepts (based on Selby and Woolard’s 2013 review [159]) and provided a set of
classroom techniques that could be used to teach each of these concepts. Their assessment
framework was composed of a progression of learning outcomes for each CT concept. For
example, the first learning outcomes for the topic Algorithms include “Understands what an
algorithm is and is able to express simple linear algorithms symbolically. Understands that
computers need to be given precise instructions”, and the final set that students are expected
to progress too includes being able to design recursive algorithms, and “Understanding
that some problems cannot be solved computationally”. Learning outcomes like these are
necessary for the development of assessment methods, but on their own are unlikely to
be sufficient. They would assist teachers in understanding what their students should be
learning. However, without an in-depth knowledge of the subject matter it would be difficult
for a generalist teacher to ascertain whether a student had achieved these outcomes, without
additional support.
An alternative method of assessing students is through standardised tests. This would
not provide the same level of insight into a students CT skills as the previous methods
described could. These could also be less accurate if test questions were not well designed, or
their design disadvantaged specific groups of students, for example those with lower reading
comprehension skills. However, this approach is much more scalable, as it would allow large
numbers of students to be assessed in a consistent and objective (assuming unbiased question
design) manner. It would remove the risk of an assessors level of understanding impacting
their ability to accurately, and objectively, assess students. Removing the need for teachers
to have extensive knowledge of this subject area is highly beneficial, while this topic is not
widely integrated into pre-service teacher education.
In 2015 Roman-Gonzalez proposed a set set of design guidelines for creating questions
for CT assessment, and an initial set of 28 questions which had been reviewed by a set of 20
34

experts in the field of CS education [149]. These questions were used for a CT test, targetted
at ages 12-13 years old, that was taken by 1,251 Spanish students between ages 10-16 years
old. These students also completed two standardised tests measuring cognitive abilities and
problem solving skills, and scores were compared between these three tests. The results
of this were reported on by Roman-Gonzalez, Perez-Gonzalez, and Jimenez-Fernandez in
2016, and they found positive correlations between the CT test scores and problem solving
test scores, and between the CT test and cognitive abilities results [151]. These results lend
support to the validity of the test used, if CT is considered to be linked with cognitive ability
and problem solving. As the questions used were thoroughly reviewed by a set of experts
before the test was administered, this test may be a robust method of assessing students
CT abilities. However, the set of questions is entirely focussed on the use of directional
instructions and programming concepts, for example loops and conditional statements. If
we accept the current general view of CT, then CT is considered to involve more than
programming skills and concepts. While this proposed assessment provides many questions
that can effectively evaluate a set of CT skills, its currently programming centric nature
limits its effectiveness. This limitation was acknowledged by Roman-Gonzalez, Moreno-
Leon, and Robles in 2017[150], and they recommended the use of complementary tools for
assessment, specifically Dr Scratch and tasks from the Bebras Challenge.
The previously mentioned Bebras Challenge is an extra-curricula CS challenge (also re-
ferred to as an Informatics challenge). Challenges and competitions such as this can offer
an alternative assessment method, though they also have their own drawbacks due to their
limited validation in the context of CT curriculum. The Bebras Challenge was one of the
assessment tools used in my research and so is discussed in more detail below.
3.4.1 The Bebras Challenge
The ‘Bebras International Challenge on Informatics and Computational Thinking’2 is a
popular Informatics challenge, which is run annually [57]. It began in Lithuania in 2004 and
has since spread around the world. The founder of the challenge and the organisation that
runs it, Prof. Valentina Dagiene, aimed to use the challenge to introduce school students
to the subject of Informatics (in this usage, synonymous with CS and computing). The
challenge has now been held in over 60 countries, including NZ. Since its inception, the
goals of the challenge have expanded to include promoting and developing CT skills, along
2 https://www.bebras.org
35

with promoting Informatics, CS, and computing. I choose to use the Bebras Challenge for
CT assessment in two of my studies, in the absence of validated and widely established
assessment methods.
Much work has been done on evaluating the tasks used in the Bebras Challenge, their
relevance to CT, and how they can be used in CS and CT education [12, 23, 38, 53, 54, 56,
57, 97, 98, 102, 184, 194]. For example, Dagiene and Stupuriene [57] mapped Bebras tasks to
levels on Bloom’s taxonomy to evaluate which thinking skills the tasks required. This tax-
onomy describes a hierarchy of six ways a learner can demonstrate their knowledge. These
are to: Remember, Understand, Apply, Analyse, Evaluate, and Create. Remembering is the
lowest on this hierarchy, and creating is the highest. They found that the majority of Bebras
tasks lie at the higher end of Bloom’s taxonomy (Understanding, Applying, Analysing and
Evaluating). They also concluded that the tasks encouraged learning experiences for stu-
dents, a factor that was cited as a requirement for ‘good tasks’ by Dagiene and Futschek [53].
Other criteria which were listed by Dagiene and Futschek were tasks should be independent
of any curriculum, particular software or hardware systems, and programming languages.
Dagiene and Stupuriene [57] also found that tasks can be broadly divided into five categories:
Algorithms and programming; Data, data structures, and representations; Computer archi-
tecture and processes; Communications and networking; and HCI. The first two of these are
core parts of CT, and the remaining three are all, in some way, related to it. All five of these
are core elements of CS.
The broad consensus of this research is that the Bebras contest is an effective way of
engaging students in CS/Informatics, and the tasks cover CT concepts. However, it is
important to note that this research may be biased as much of it was conducted by individuals
who are, or have previously been, involved in running the contest.
There are problems with the challenge that have also been identified. For example,
both Bellettini, et al. [23] and Vegt [184] found that the difficulty levels (easy, medium,
hard) assigned to different tasks did not accurately reflect the actual difficulty (based on
participants results) of the tasks. 37% were found to not agree with the assigned difficulty
of the tasks by Belletini, et al. and between 40% and 72% (across different age groups)
by Vegt [184]. The possible impact of reading difficulty on tasks was briefly mentioned
by Vegt, and this was a factor I found to be highly influential in my use of the Bebras
challenge. Bebras tasks can also be problematic due to the strong focus on creating stories
within the questions to try and make them interesting and relevant to learners. This can
at times distract from the CS concepts the challenge is meant to test, can be confusing for
36
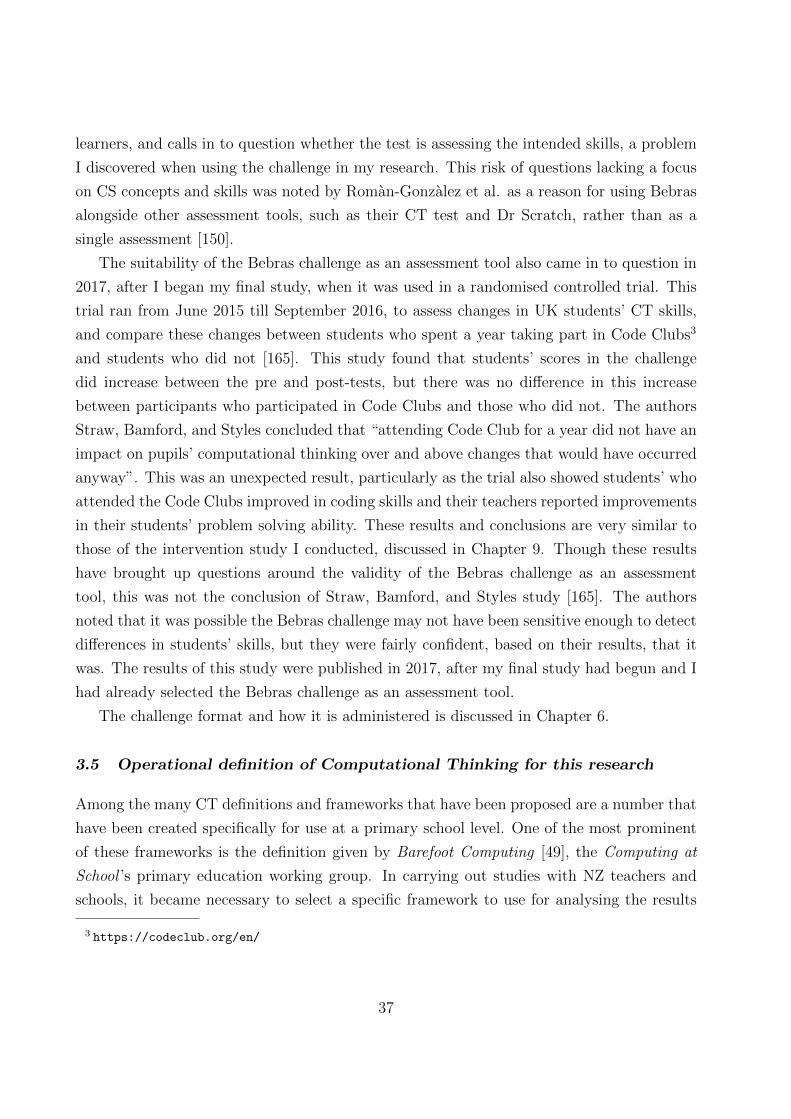
learners, and calls in to question whether the test is assessing the intended skills, a problem
I discovered when using the challenge in my research. This risk of questions lacking a focus
on CS concepts and skills was noted by Roman-Gonzalez et al. as a reason for using Bebras
alongside other assessment tools, such as their CT test and Dr Scratch, rather than as a
single assessment [150].
The suitability of the Bebras challenge as an assessment tool also came in to question in
2017, after I began my final study, when it was used in a randomised controlled trial. This
trial ran from June 2015 till September 2016, to assess changes in UK students’ CT skills,
and compare these changes between students who spent a year taking part in Code Clubs3
and students who did not [165]. This study found that students’ scores in the challenge
did increase between the pre and post-tests, but there was no difference in this increase
between participants who participated in Code Clubs and those who did not. The authors
Straw, Bamford, and Styles concluded that “attending Code Club for a year did not have an
impact on pupils’ computational thinking over and above changes that would have occurred
anyway”. This was an unexpected result, particularly as the trial also showed students’ who
attended the Code Clubs improved in coding skills and their teachers reported improvements
in their students’ problem solving ability. These results and conclusions are very similar to
those of the intervention study I conducted, discussed in Chapter 9. Though these results
have brought up questions around the validity of the Bebras challenge as an assessment
tool, this was not the conclusion of Straw, Bamford, and Styles study [165]. The authors
noted that it was possible the Bebras challenge may not have been sensitive enough to detect
differences in students’ skills, but they were fairly confident, based on their results, that it
was. The results of this study were published in 2017, after my final study had begun and I
had already selected the Bebras challenge as an assessment tool.
The challenge format and how it is administered is discussed in Chapter 6.
3.5 Operational definition of Computational Thinking for this research
Among the many CT definitions and frameworks that have been proposed are a number that
have been created specifically for use at a primary school level. One of the most prominent
of these frameworks is the definition given by Barefoot Computing [49], the Computing at
School ’s primary education working group. In carrying out studies with NZ teachers and
schools, it became necessary to select a specific framework to use for analysing the results
3 https://codeclub.org/en/
37

of the studies conducted during 2015, 2016, and 2017 (discussed in chapters 8 and 9). I
chose to use an already published framework that had been written and reviewed by a
group of subject experts, rather than designing a new one. For this, I selected the Barefoot
Computing definition, described in section 3.5.1. As this definition is one of many there are
areas where it disagrees with others. For example the inclusion of the CT ‘Approaches’ is
in line with the very broad definitions of CT, described by Voogt et al. [185] as those that
included the ‘peripheral qualities’, and does not match the definitions that try to stay more
focussed on the ‘core qualities’ and skills, that are more closely linked with CS.
The Barefoot Computing definition and framework do not fully agree with my own view
of CT, which aligns more closely with Tedre and Denning’s [169], however it was chosen over
other definitions as it is specifically targetted at primary school and is more relevant to the
NZ curriculum. In particular, there were strong links between this definition and the Key
Competencies (discussed in Chapter 4) and the contents of the draft NZ Digital Technologies
curriculum in 2015 (also discussed in Chapter 4).
3.5.1 Barefoot Computing
Computing at School (CAS) is an organisation, and community, that provides support for
K-12 computing education through online resources, and workshops throughout the UK [44].
They use their online resources and forums to provide international support. CAS was
a major contributor to the addition of Computing to the English curriculum, and their
resources were created to support teachers adopting the England national computing cur-
riculum. These resources are widely applicable to computing education elsewhere, including
in NZ. CAS outline their framework for CT in school in “Computational Thinking: a guide
for teachers” [49]. This guide uses a combination of Wing’s 2006 and 2011 definitions for
CT as a starting point for their framework. They describe CT as follows:
Computational thinking is a cognitive or thought process involving logical reasoning by
which problems are solved and artefacts, procedures and systems are better understood. It
embraces:
• the ability to think algorithmically
• the ability to think in terms of decomposition
• the ability to think in generalisations, identifying and making use of patterns
38

• the ability to think in abstractions, choosing good representations
• the ability to think in terms of evaluation.
Their materials are intended for all levels of school, but they also provide primary school
specific resources and guides on CT for teachers, through Barefoot Computing [45]. Barefoot
Computing gives an operational definition of CT. This covers the same set of CT concepts
given in the above CAS description, and also a set of approaches that a Computational
Thinker should use. These concepts and approaches are shown in figure 3.1. They provide
in-depth descriptions of the concepts and approaches through their website.4
Figure 3.1: Computational Thinking Poster from CAS
4 https://barefootcas.org.uk
39
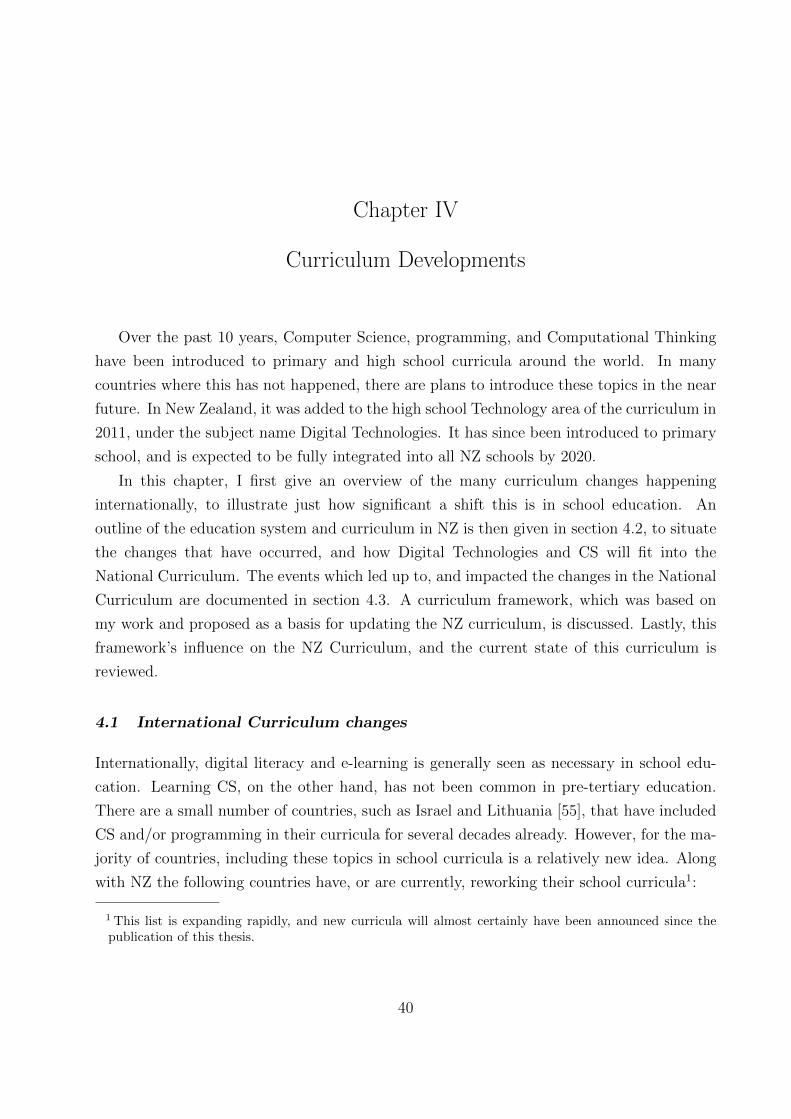
Chapter IV
Curriculum Developments
Over the past 10 years, Computer Science, programming, and Computational Thinking
have been introduced to primary and high school curricula around the world. In many
countries where this has not happened, there are plans to introduce these topics in the near
future. In New Zealand, it was added to the high school Technology area of the curriculum in
2011, under the subject name Digital Technologies. It has since been introduced to primary
school, and is expected to be fully integrated into all NZ schools by 2020.
In this chapter, I first give an overview of the many curriculum changes happening
internationally, to illustrate just how significant a shift this is in school education. An
outline of the education system and curriculum in NZ is then given in section 4.2, to situate
the changes that have occurred, and how Digital Technologies and CS will fit into the
National Curriculum. The events which led up to, and impacted the changes in the National
Curriculum are documented in section 4.3. A curriculum framework, which was based on
my work and proposed as a basis for updating the NZ curriculum, is discussed. Lastly, this
framework’s influence on the NZ Curriculum, and the current state of this curriculum is
reviewed.
4.1 International Curriculum changes
Internationally, digital literacy and e-learning is generally seen as necessary in school edu-
cation. Learning CS, on the other hand, has not been common in pre-tertiary education.
There are a small number of countries, such as Israel and Lithuania [55], that have included
CS and/or programming in their curricula for several decades already. However, for the ma-
jority of countries, including these topics in school curricula is a relatively new idea. Along
with NZ the following countries have, or are currently, reworking their school curricula1:
1 This list is expanding rapidly, and new curricula will almost certainly have been announced since thepublication of this thesis.
40

• Australia: CS, CT, and programming, were introduced to the Australian National
primary curriculum in 2014, under the subject name ‘Digital Technologies’ [76]. This
curriculum specifies what students should be learning from foundation (preschool),
through to ages 15-16. It covers the areas data representation, algorithms, general
computer use and digital literacy, digital systems, human-computer interaction, and
programming.
• Canada: CS remains an elective subject in Canadian High Schools. Since 2010, CS
has been a subject that can count towards University entry requirements, which has
encouraged more schools to offer it [96]. Several provinces have made commitments to
include and prioritise coding in their schools’ curriculum [77].
• The EU (excluding the UK): Throughout the EU, programming, CS, and CT,
are part of school curricula in Austria, Bulgaria, the Czech Republic, Denmark, Esto-
nia, Finland, France, Hungary, Ireland, Lithuania, Malta, Norway, Poland, Portugal,
Slovakia, Spain, and Sweden [9]. Several of these countries have included this in the
curriculum since the early 2000’s, while others, such as France, Spain, and Finland, did
this more recently (2014-2016). It is also being considered for integration in Cyprus
and Italy.
• India: There is currently no core curriculum for CS in schools across India, and ICT
literacy has been the core computing related focus. However, there are initiatives fo-
cused on changing this, and while only a small number of secondary schools currently
teach CS, this number is growing. One of the main challenges schools face in intro-
ducing CS, is a lack of networking infrastructure, and access to adequate computer
hardware resources [145].
• Japan: The Japanese Ministry of Education is planning to introduce Computer Sci-
ence to the primary school curriculum in 2020, with middle and high school curriculum
to follow in 2021 and 2022 respectively. CS will be taught within existing subjects,
rather than as a stand-alone subject. Before the introduction of this subject, the
Ministry intends to provide both adequate ICT resources across all schools and re-
gions. They also intend to provide professional development and lesson resources for
teachers [183, 195].
41

• South Korea: Computer education has been present in the South Korean curricu-
lum since the 70’s. Since being renamed ‘Informatics’ in 2007, it has focused on CS
concepts and principles. It had previously, however, been an elective subject, and
participation in it had been low. In 2018, a new Informatics curriculum was released,
made compulsory for middle schools, and made an elective in high schools. It covers
digital literacy, CT, and programming [94].
• The UK: CS was commonly taught in UK schools during the 1980’s, but over the next
20 years it was replaced with “Information and Communication Technology” (ICT).
This ICT curriculum was focused solely on using digital technology. In 2012, The Royal
Society released a report on the state of ICT in UK schools, which recommended large
scale changes to the subject [79]. Since this was published, England introduced new
computing standards to all school levels in 2014, followed by Scotland in 2016 [65].
However, there have been struggles with the implementation of the subject, as both
England and Scotland have been unable to fill demands for computing teachers, and
large numbers of these teachers are not confident teaching this curriculum. In Wales,
a new curriculum is due to be released in late 2018/2019, which will include CS [176].
• USA: In January 2016 the then President of the United States of America (USA),
Barack Obama, announced the “Computer Science for All” initiative, which aimed to
provide all students in the USA the chance to learn CS in school [177]. Across the
USA, many states and counties have added CS to their curriculum. CS standards
exist in Ohio, Virginia, Utah, Wisconsin, Idaho, Indiana, Massachusetts, and Texas.
Many more states have drafted standards, and pledged to introduce them in the near
future [75, 117]. As well as new curriculum standards, the Code.org “Hour of Code”
initiative has made a substantial impact in the USA. It claims that 30% of students
in the USA have a Code.org account, and have completed at least one hour of coding
through their website [40].
4.2 The New Zealand National Curriculum
The addition of Digital Technologies (DT), CS, and programming, to the New Zealand
Curriculum, began in 2011. At the time of writing (2019), this has evolved to include CT,
and extends through all levels of school. Before discussing these changes, it is useful to have
an understanding of the NZ education system. In this section, the operation and structure
42

of the National curriculum, from the beginning of primary school to the end of high school,
is explained.
4.2.1 The New Zealand Curriculum, and Te Marautanga o Aotearoa
In New Zealand there are two curricula: The New Zealand Curriculum2, and Te Marautanga
o Aotearoa3. Te Marautanga is a curriculum from a Maori perspective. These are two
separate, and different curricula, but the majority of required subjects in each are the same.
They are not translations of the same curriculum
My work took place in the context of the New Zealand Curriculum only, but for the
subjects of CS, programming, and CT, there is a large degree of overlap between each
curriculum. When referring to both of these curricula, the term National Curriculum is
used.
These documents do not dictate the exact curriculum schools must follow. Instead they
provide a framework around which schools build their own individual programmes. The
New Zealand Curriculum serves as the framework for English-medium schools, and Te Ma-
rautanga o Aotearoa as a framework for Maori-medium schools (where te reo Maori is the
language used for instruction - these schools are also called kura kaupapa). Schools must
base their programs on the principles, values, and key competencies of their chosen curricu-
lum, and through years 1-10 they must offer the subjects: English or Maori (depending on
the school medium), the arts, health and physical education, mathematics and statistics,
science, the social sciences, and technology. In years 11 to 13, students select the subjects
they will continue with, and complete assessments that count towards future qualifications.
The range of subjects available to students tends to expand in years 11 to 13, as students
begin to specialise. Aside from these requirements, schools have a large degree of flexibility
and freedom in setting their individual learning programmes, a relatively unique quality
among school curricula.
The foundation of the NZ curriculum is a vision to produce “Young people who will be
confident, connected, actively involved, lifelong learners”. The structure of the curriculum
built on this is shown in Figure 4.1. ‘Learning Areas’ reflects the main subject areas students
study. The vision of Te Marautanga o Aotearoa is similar. It “aims to develop successful
learners, who will grow as competent and confident learners, effective communicators in
2 http://nzcurriculum.tki.org.nz/The-New-Zealand-Curriculum
3 http://tmoa.tki.org.nz/Te-Marautanga-o-Aotearoa
43

the Maori world, healthy of mind, body and soul and secure in their identity, and sense of
belonging. They will have the skills and knowledge to participate in and contribute to Maori
society and the wider world”.4
4.2.2 The Key Competencies
A core part of the NZ curriculum is the five Key Competencies. Alongside subject knowledge,
students are expected to develop these competencies, and use them throughout their learning.
The NZ curriculum states: “The development of the competencies is both an end in itself (a
goal) and the means by which other ends are achieved. Successful learners make use of the
competencies in combination with all the other resources available to them. These include
personal goals, other people, community knowledge and values, cultural tools (language,
symbols, and texts), and the knowledge and skills found in different learning areas” [133].
The Key Competencies, and their official descriptions, are:
1. Thinking:
“Thinking is about using creative, critical, and metacognitive processes to make sense
of information, experiences, and ideas.”
2. Relating to others:
“Relating to others is about interacting effectively with a diverse range of people in a
variety of contexts. This competency includes the ability to listen actively, recognise
different points of view, negotiate, and share ideas.”
3. Using language, symbols, and texts:
“Using language, symbols, and texts is about working with and making meaning of
the codes in which knowledge is expressed.”
4. Managing Self:
“This competency is associated with self-motivation, a “can-do” attitude, and with
students seeing themselves as capable learners.”
4 https://parents.education.govt.nz/primary-school/learning-at-school/
new-zealand-curriculum
44

Figure 4.1: A Schematic View of the New Zealand Curriculum (New Zealand Ministry ofEducation)
45
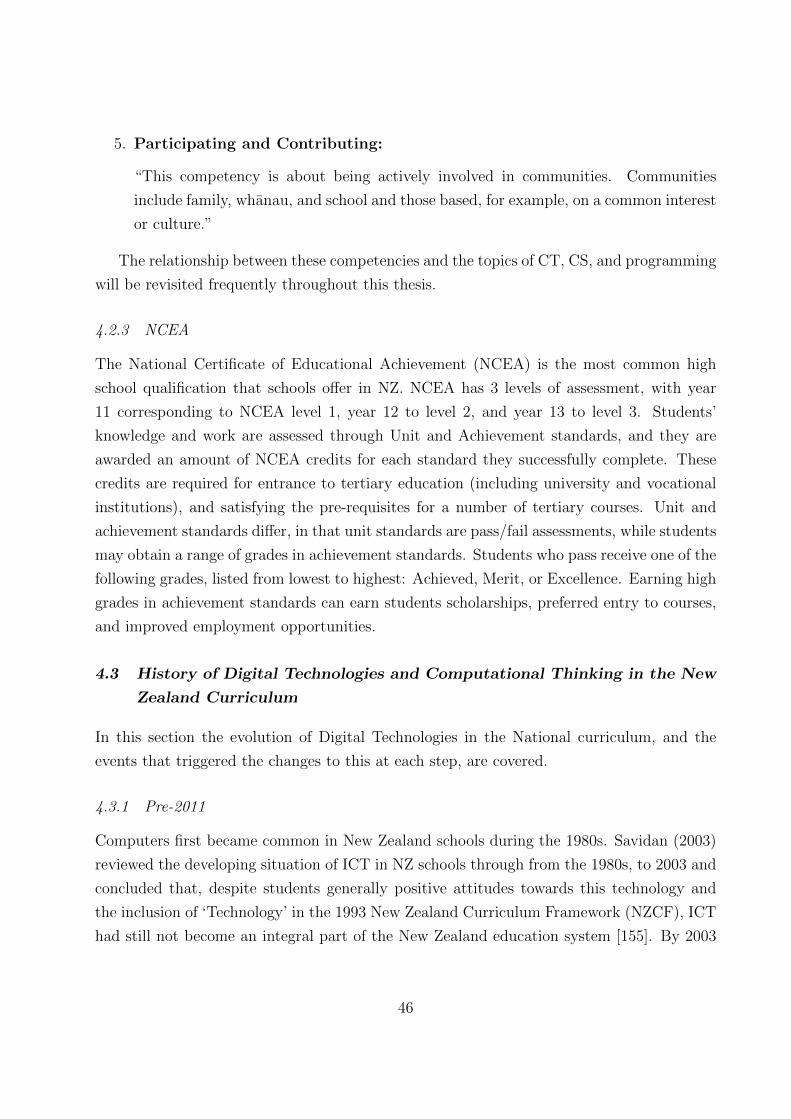
5. Participating and Contributing:
“This competency is about being actively involved in communities. Communities
include family, whanau, and school and those based, for example, on a common interest
or culture.”
The relationship between these competencies and the topics of CT, CS, and programming
will be revisited frequently throughout this thesis.
4.2.3 NCEA
The National Certificate of Educational Achievement (NCEA) is the most common high
school qualification that schools offer in NZ. NCEA has 3 levels of assessment, with year
11 corresponding to NCEA level 1, year 12 to level 2, and year 13 to level 3. Students’
knowledge and work are assessed through Unit and Achievement standards, and they are
awarded an amount of NCEA credits for each standard they successfully complete. These
credits are required for entrance to tertiary education (including university and vocational
institutions), and satisfying the pre-requisites for a number of tertiary courses. Unit and
achievement standards differ, in that unit standards are pass/fail assessments, while students
may obtain a range of grades in achievement standards. Students who pass receive one of the
following grades, listed from lowest to highest: Achieved, Merit, or Excellence. Earning high
grades in achievement standards can earn students scholarships, preferred entry to courses,
and improved employment opportunities.
4.3 History of Digital Technologies and Computational Thinking in the New
Zealand Curriculum
In this section the evolution of Digital Technologies in the National curriculum, and the
events that triggered the changes to this at each step, are covered.
4.3.1 Pre-2011
Computers first became common in New Zealand schools during the 1980s. Savidan (2003)
reviewed the developing situation of ICT in NZ schools through from the 1980s, to 2003 and
concluded that, despite students generally positive attitudes towards this technology and
the inclusion of ‘Technology’ in the 1993 New Zealand Curriculum Framework (NZCF), ICT
had still not become an integral part of the New Zealand education system [155]. By 2003
46

secondary school students in the majority of NZ schools were using ICT, in some form, for
learning. However, in the absence of guidelines for using it in curriculum, it was generally
seen as a tool that teachers had to slot into existing curriculum. Students learnt with ICT,
but generally not about ICT.
By 2008, this situation had not changed. In the vast majority of NZ schools, the subject
of computing was restricted to using computer applications and file system management.
The teaching of programming, CS concepts, and software design, was almost non-existent
and generally only appeared in schools where a particularly interested and motivated teacher
pushed the subject.
In 2008 two reports were published that denounced the state of computing in the National
Curriculum, and urged the Ministry of Education and Government to take action [18, 37, 83].
Both reports highlighted the lack of suitable achievement standards that focused on com-
puting, as a major issue for the subject. ICT unit standards were available, but these were
pass/fail assessments. Unit standards are generally viewed by students (and frequently by
teachers) as unsuitable for academically focused students. An alternative to using these unit
standards was to apply some of the generic Technology achievement standards to ICT. But
this approach had its own issues, as these standards were originally written with the intent
of being applied only to physical materials and processes. The report from the New Zealand
Computer Society (now known as IT Professionals New Zealand5) took all the existing Tech-
nology achievement standards that could be used for computing, and after in-depth critical
analysis of these 18 standards wrote “we believe that none of the standards reviewed in
this report are appropriate to assess either Computer Science or end-user computing at the
secondary school level” (Grimsey & Phillipps, 2008, p.6). The second report, commissioned
by the Ministry of Education, examined this from a broader view, discussing the negative
implications maintaining the current curriculum could have for students and the NZ ICT
industry (Carrell, Gough-Jones, & Fahy, 2008). They touched on the lack of gender diversity
in the ICT industry, the need for all students to understand the digital world they are living
in, and the ubiquity of computing in modern society and education.
The Ministry of Education responded to these reports by forming the Digital Technologies
Experts Panel (DTEP), made up of representatives from the ICT industry, tertiary institutes
and high schools. The panel was tasked with creating a plan to improve the NZ curriculum,
by addressing the concerns that had been raised [18]. In May 2009 they recommended the
5 https://itp.nz/
47

creation of a new subject area, ‘Digital Technologies’, which would cover five areas, including
programming and Computer Science.
4.3.2 The new standards, 2011 - 2013
In 2011 New Zealand became an early adopter of CS education in school curriculum, as the
NCEA level 1 (corresponds to year 11 of school) Digital Technologies Achievement standards
were first released and made available to schools. Achievement standards for levels 2 and
3 followed in 2012 and 2013 [180].6 At each level these cover core CS concepts and pro-
gramming. These standards include the additional areas: digital information management
and databases, digital media, electronics and embedded systems, digital infrastructures and
networks. These areas are not covered in this research. All information covered in this
section pertains to the versions of these standards released before 2014. The standards were
reviewed in 2014, and at the end of 2018 these standards were replaced with ones reflecting
the further changes happening in the NZ curriculum.
At level 1 and 2 there are two Achievement standards on programming and one at level
3, with each successive level requiring students to use more sophisticated programming con-
structs (e.g. functions, increasingly complex data types). There is one CS Achievement
standard at each level. A student who completes all three of these standards will have
covered the topics of algorithms, types of programming languages, human computer inter-
action, data representation, encoding, encrypting and compressing data. Like the majority
of NCEA standards, these new Achievement standards were not compulsory for schools to
offer. However, a significant number of schools have adopted these. In 2011, the first year
these standards were available, 2701 students were enrolled in the level 1 programming stan-
dards, and 1429 in the level 1 CS standard [19]. As of 2016, this had grown to 9721 students
in the levels 1 to 3 programming standards, and 3932 in levels 1 to 3 CS.7
4.3.3 Reviewing the Digital Technologies curriculum, 2014 - 2017
In 2014 the New Zealand Government released the report “A Nation of Curious Minds -
He Whenua Hihiri i te Mahara. A National Strategy Plan for Science in Society” [127,
6 These standards, and the updated versions which have since been released, can be accessedthrough the NZQA website http://www.nzqa.govt.nz/ncea/assessment/search.do?query=Digital+
Technologies&view=all&level=01.
7 http://nceatechstats.com/digital/
48

173]. This reviewed the current situation of science and technology education in NZ, with
a large part of this focused on computing. The review recommended an evaluation of the
Digital Technology curriculum, and consideration of the place of computing in the overall
curriculum. This opened the door for the development of a DT curriculum that would extend
into primary school. Throughout 2014 and 2015 a review of “The Positioning and Content of
Digital Technology within the New Zealand Curriculum/Te Marautanga o Aotearoa” took
place, with frequent working groups being held with key stakeholders in this area. These
stakeholders included representatives from the New Zealand Association of Computing and
Digital Technologies Teachers (NZACDITT, now known as Digital Technologies Teachers
Aotearoa, DTTA), the NZ Insitute of IT Professionals, the technology Industry, educators
(from both English and Maori medium), the Ministry of Education, NZ Universities, and
many associations and companies focused on Technologies education in NZ (both English
and Maori medium). Professor Tim Bell and I were members of this review team. In
October 2015 Professor Bell and I submitted a proposal to the review team for a primary
school curriculum to be created, and the subjects for it to cover at each school level. This
was based on our work researching international curricula and on my work with NZ primary
teachers [69]. Much of the content in this proposal subsequently became part of the new
Digital Technologies curriculum, launched in 2018. It also matched the majority of the
curriculum content I used throughout my work with NZ teachers.
As a result of this review Hekia Parata, the New Zealand Minister of Education at the
time, announced on July 5, 2016, that “Digital technology [was] to be formally integrated
into the New Zealand Curriculum and Te Marautanga o Aotearoa” [174]. Parata stated the
change would “ensure that we have an education system that prepares children and young
people for a future where digital fluency will be critical for success”. This meant CS, and
programming, which had previously been restricted to an optional subject in the final three
years of school, would be extended to cover all year levels. Computational Thinking would
also be incorporated, explicitly, into these subjects. Curriculum development was to take
place from this point, until the end of 2017, with a goal of having the subject integrated into
the National Curriculum in 2018.
On June 28, 2017, Nikki Kaye, the then New Zealand Minister of Education, announced
the launch of the consultation on the new digital technologies content for the New Zealand
Curriculum and Te Marautanga o Aotearoa [175]. In her announcement speech she stated
“We’re breaking new ground with a curriculum that offers unique Maori content, learning
that can be shaped according to students’ individual needs, and future-proofing so it can
49
adapt to new technology as it arises... The new curriculum content is about ensuring that
students across all year levels have access to rich learning aimed at building their digital skills
and fluency, to prepare them for this world... All young people from years one to 10 will
take part in digital technologies learning. Students choosing digital technologies pathways
for NCEA will develop the more specialised skills that industry partners say are in high
demand, through new achievement standards being developed for NCEA Levels 1, 2 and 3”.
A month later the draft curriculum8 was released for consultation.9 As previously
planned, the new curriculum content was made available for the 2018 school year, but with a
planned two year transition period. The curriculum is planned to be in full use in all schools
from the start of 2020.
4.4 Curriculum Content for New Zealand, and this research
As previously mentioned in section 4.3.3, Professor Tim Bell and I were part of the 2014 to
2015 NZ Digital Technologies curriculum review team. During 2016 and 2017, I continued
to participate in Ministry workshops, discussions, and the writing of the new curriculum.
Much of the work discussed in this section was conducted as part of Professor Bell’s and my
contribution to this review, and the work reported on in our 2015 paper “A Pilot Computer
Science and Programming Course for Primary School Students” [67]. This work has been a
strong influence on the new NZ primary school curriculum.
4.4.1 Synthesising a curriculum
When the writing of the new curriculum began, several countries had already developed
and released CT curricula at primary and post-primary school levels. In 2015 I examined a
range of these curricula, covering primary through to tertiary education, and CT curriculum
reviews, to identify common themes and synthesise a proposed NZ curriculum. These were:
• England’s computing curriculum, covering key stages 1 to 4 (from 5 to 16 year olds) [65],
• Australia’s Digital Technologies curriculum [7, 76],
• the CSTA K-12 Computer Science standards [157],
8 https://education.govt.nz/assets/Documents/Ministry/consultations/DT-consultation/
Digital-Technologies-Hangarau-Matihiko-ENG-July.pdf
9 https://www.curiousminds.nz/news/have-your-say-on-digital-tech-education/
50

• the NZ Digital Technologies NCEA Achievement Standards [134],
• the AP Computer Science Principles programme [109], and
• additional reports and publications on CT curriculum [15, 122, 170], computational
participation [105], and computational learning [46], from experts in the field.
Several of these have since been updated.
The topics and themes identified in these documents had much in common, and often
in cases where they disagreed there was a distinct difference in the meaning behind terms
used in each document (e.g. differing views on what “digital literacy” encompasses). The
comparison of the Australian, English, and CSTA curricula can be found in Appendix A,
tables A.1, A.2, and A.3. After comparing these documents we settled on the following topics
from which to create a curriculum. These are taken from our paper in the Proceedings of
the 2015 Workshop in Primary and Secondary Computing Education [67].
Algorithms: includes articulating a plan for a program; exploring standard problems such
as searching or sorting; computational complexity (performance); design techniques
(such as decomposition and abstraction).
Programming: includes implementing a plan/algorithm, debugging, and testing; selected
programming environments e.g. “Initial Learning Environments” (drag and drop),
general purpose languages, object oriented programming; parallel execution.
Data representation: includes binary representation; types of data — numbers, text,
sound, images etc.; encoding the data — compression, error correction, encryption;
data structures.
Digital devices and infrastructure: includes components, such as CPU, memory, data
storage devices; input and output devices; networks; cloud computing; troubleshooting
devices and configurations.
Digital applications: includes simulation and modelling the real-world; creating digital
content (media) such as documents, images, presentations, web pages, video; publish-
ing information; collecting and interpreting data (spreadsheets, databases); intelligent
systems.
51

Humans and computers: includes digital citizenship (cybersafety, privacy, intellectual
property including copyright and licensing, sustainability, ethics, equity, accessibility,
legal responsibilities); careers (including diversity); project management; usability;
connection to other fields; keyboard proficiency.
A curriculum framework, based on these six topics and the results of the pilot study
I conducted in 2014 (covered in Chapter 7), was proposed to the NZ Digital Technologies
review group. Two versions of this framework were presented, a conservative version and a
more ambitious version. These each covered broadly the same content, but the ambitious
version introduced content earlier in primary school, and added extra subtopics in several
areas. These two frameworks can be found in Appendix A, tables A.4 through A.7. For the
work I conducted from 2015 to 2017 I used these frameworks as a reference model for the
resources, professional development, and guidance I provided teachers with.
4.4.2 Current and future NZ Curriculum
As discussed in section 4.3.3, the changes to the National Curriculum were announced in
2018. The Technology/Hangarau learning area has been modified in the NZ curriculum and
in Te Marautanga o Aotearoa so that it is now split into five different strands10, two of which
are specific to Digital Technologies/Hangarau Matihiko11.
In the NZ curriculum these strands are:
• Computational Thinking:
Students will develop and understanding of computer science principles that underlie
all digital technologies. They’ll learn core programming concepts so that they can
become creators of digital technology, not just users.
• Designing and Developing Digital Outcomes:
Learning how to design quality, fit-for-purpose digital solutions.
10 http://nzcurriculum.tki.org.nz/The-New-Zealand-Curriculum/Technology/
Learning-area-structure
11 https://www.education.govt.nz/ministry-of-education/specific-initiatives/
digital-technologies-and-hangarau-matihiko-learning/
52

In Te Marautanga o Aotearoa they are:
• Te Whakaaro Rorohiko (Computational Thinking):
Includes using te reo Maori to express problems, formulate solutions and solve them
using algorithms, programme and data representation.
• Tangata me te Rorohiko (People and computers):
Includes designing and developing digital outcomes while considering their role and
responsibility as digital citizens.
The details of both curricula can be found through the Ministry of Educations website12.
12 http://education.govt.nz/ministry-of-education/specific-initiatives/
digital-technologies-and-hangarau-matihiko-learning/
53

Chapter V
Teaching Computer Science and Programming in Primary School
In this chapter I discuss some of the most prominent resources that are available for
teaching Computer Science and programming to primary-aged students, and the research
related to these. This includes the Computer Science Unplugged programme, its use inter-
nationally, and how it can assist students development of Computer Science knowledge. I
then discuss tools and programming environments that can be used, and those that have
been developed specifically for primary aged children.
As the Computer Science and programming concepts to be taught during this research
were identified in Chapter 4, and the training provided to teachers on how to teach these
are covered in Chapter 6, they are not discussed here.
5.1 Computer Science Unplugged
A widely used and successful strategy for introducing CS to young students is Computer
Science Unplugged (CS Unplugged).1 Computer Science Unplugged is a collection of activ-
ities and lessons that can be used to teach CS concepts without using computers, or any
other type of digital technology. The activities require no prior knowledge of CS and can be
completed using common classroom supplies, such as paper, pencils, or chalk. CS Unplugged
follows a constructivist approach to learning and promotes collaboration among students.
It was originally created and designed to be used for ‘one-off’ sessions with primary aged
children, with the goal of raising awareness and interest in CS, rather than as part of a
curriculum. However, it is now widely used internationally for both of these purposes, at
both pre-tertiary and tertiary level.
It has been discussed and recommended in CS education books [39, 93, 160], by the
1 Classic CS Unplugged: https://classic.csunplugged.org, and the updated version of CS Unplugged,released in 2016: https://csunplugged.org
54

prominent CS and programming initiative Code.org,2 and has been recommended for use in
curricula by the Association for Computing Machinery (ACM) [182].
The activities were originally developed in the 1990s by Tim Bell, Mike Fellows, and
Ian Witten. A book of these activities, “Computer Science Unplugged... off-line activities
and games for all ages” was published in 1998 [22]. In 2000, 12 of the activities were
adapted for classroom use by teachers Robyn Adams and Jane McKenzie [20], alongside the
original authors. From 2000 to 2012, the remaining activities were adapted for classroom
use and released [21].3 In 2016, the UC Computer Science Education Research Group began
redeveloping the activities, with the aim of generating a larger series of lessons, based on
each activity, for use as in primary school curriculum.
The CS Unplugged materials are available under a Creative Commons Attribution-
ShareAlike licence. This allows others to use, modify, and build on these materials (with
acknowledgement). Because of this, there are many variations of the original CS Unplugged
activities. Many different activities and lessons that follow the ‘unplugged’ approach of
teaching CS without computers have been created by a range of organisations and people.
The term ‘CS Unplugged’ is now often used to describe any activities that are intended to
teach CS or programming concepts without using computers. Unless otherwise stated, I will
be referring to only the original CS Unplugged activities (now known as ‘Classic’ CS Un-
plugged) as they are described in [21] and [22], and the updated version of these original CS
Unplugged activities, first released online in 2016 [172]. The activities and additional con-
tent provided through the new CS Unplugged website have been continually updated since
the website went live, as classic CS Unplugged activities have been adapted for curriculum
use and added to this new version.
Research on the use of CS Unplugged varies between using the original set of activities,
variations on these, new activities not in the original set, or combinations of these. The
original activities and similar variations on these are frequently found to be highly engaging,
appeal to a wide range of people and age levels, and increase students’ interest and confidence
in CS [67, 68, 69, 113, 148, 178, 179]. It has been shown to be more or equally as effective
in teaching the intended CS concepts when compared to traditional and alternative meth-
ods [113, 147, 179], and works effectively when combined with teaching programming. It has
also been used and adapted to teach students with disabilities, in an inclusive manner [47].
2 https://code.org/
3 The full history of releases can be found at https://classic.csunplugged.org/changelog/
55

There have been critiques of the classic CS Unplugged activities, which suggest that
they are not sufficient for use as part of a school curriculum. For example, Theis and
Vahrenhold [178] investigated whether these outreach activities were suitable for use as
teaching resources in primary school CS courses. They took 12 of the original activities,
as they appear in the first teachers edition [20], extracted learning outcomes from these,
and mapped these to Blooms revised taxonomy [4]. Theis and Vahrenhold identified that
the core levels on this taxonomy which CS Unplugged did not cover were ‘Evaluating’ and
‘Creating’. Both of these are included as key components of Computational Thinking in a
large number of the different CT definitions, including the Barefoot Computing framework
I used in my studies. Theis and Varenhold stated extending the activities, so they include
elements of evaluation and creation would improve their use for CT education. They also
found that the activities did not extend to ‘meta-cognitive knowledge’, but note that this
is not problematic, as children are not expected to be using this knowledge at primary
school ages [141]. In their work, the authors acknowledged that, as outreach activities, the
activities they analysed were not written explicitly to include learning outcomes, or to have
any outcomes extend across all levels of the taxonomy.
Rodriguez investigated whether CS Unplugged activities could successfully develop CT
skills in middle school (ages 11-13 approximately) students [148]. The activities used in their
work had been extended from the classic versions based on teacher and student feedback,
and a final project for students to complete was written. After these modifications, the
activities extended to higher levels of Bloom’s taxonomy and had more advanced learning
objectives which were suitable for middle school students. Based on students results in
the final project, Rodriguez concluded there was evidence that the extended CS Unplugged
activities developed students CT skills [148].
Building on this work, Rodriguez, Kennicutt, Rader, and Camp reported on the results
of administering a CS Unplugged based curriculum with 7th grade (ages 12-13) students
and assessing their CT skills with pre and post-tests [147]. This curriculum included the
activities described by Rodriguez [148], with some improvements. Their findings showed
that students were effectively learning about the Computer Science concepts intended to be
covered by these CS Unplugged activities. Their findings also lend support to the argument
that CS Unplugged can help students develop CT skills. However, as they state in their
work, these findings are not fully conclusive: “CT skills are fairly broad, so it is clearly not
possible to claim that students have mastered a particular CT component based on just one
assessment” [147].
56

The issues raised in these critiques provide insights into how the original activities could
be modified and made suitable for primary school curricula. In particular, they highlight
the need to extend the original activities so they explore topics more deeply, and to include
learning outcomes. Extensions that could be taught in a variety of contexts would help
students transfer the concepts they learn to different applications. They also emphasise the
need for activities that include evaluation and creation and generally cover a wider range of
cognitive processes. These issues were key drivers of the redevelopment of CS Unplugged,
and the release of new resources and lesson plans, available at [172]. This new version of CS
Unplugged has not yet been shown by others to succeed in addressing these needs. However,
the results of my work, discussed in Chapters 8 and 9, provide evidence that the lessons
from this new version of CS Unplugged do cover these areas.
5.2 Programming for young students
If programming is to be taught in primary schools, to diverse groups of students, it is
important that it is taught in an inclusive fashion. Historically the way programming has
been taught has often not been inclusive; it was generally more appealing and tailored to the
interests of particular groups of students [123]. Much prior work reports on small groups of
students becoming extremely interested and focused on these subjects and learning well, but
does not focus on wider groups of students, or report on their general interest and success.
Additionally, research on programming education has, until recently, very rarely focused on
typical school environments. The majority of work has focused either on adults (in tertiary
and non-tertiary environments), or self-selected groups of school age students, for example
at after-school clubs. These environments are very different from that found in a primary
school classroom.
Some of the earliest work on teaching young students programming, which did not take
place with a self-selected group of students, was conducted by Seymour Papert. In Mind-
storms [139], Papert wrote about the programming language Logo and using it to teach
geometry based programming. Beginning in the 1960s, he worked with students from a
range of age groups and ability levels, and concluded that “children of almost any age could
learn to program in Logo under good conditions with plenty of time and powerful research
computers”. The requirements of ‘good conditions’, ‘plenty of time’, and powerful comput-
ers, however, emphasises how programming education was restricted to a small minority of
children at the time. Those who had access to computers, a knowledgable programming
57

teacher, and already had a strong interest in computing to devote time to it, would have
been some of the only students to have the opportunity to learn in ‘good conditions’. Alan
Kay also reported on the success he had observed middle school students have when learn-
ing programming using the educational programming language SmallTalk in the 1970s [106].
However, as Kay wrote in 1993 when reflecting on this work, the success he had observed
was likely overstated [106].
“The successes were real, but they weren’t as general as we thought. They wouldn’t
extend into the future as strongly as we hoped. The children were chosen from the
Palo Alto schools (hardly an average background) and we tended to be much more
excited about the successes than the difficulties. In part, what we were seeing was the
‘hacker phenomenon’, that, for any given pursuit, a particular 5% of the population
will jump into it naturally, while the 80% or so who can learn it in time do not find it
at all natural.”
- Alan Kay, 1993, The Early History of SmallTalk
When the first portable computers started entering the home in the late 1970s and early
80s, the opportunity to learn programming did expand to more children, particularly as these
early computers required the user to program them at times. However, this opportunity was
yet again restricted to a small, financially privileged, group of society.
Even today, with computers accessible to students in schools, these ideal conditions are
unlikely to exist in a typical primary classroom. In NZ, primary teachers are already hugely
time constrained without having to add in another subject to the ‘crowded curriculum’. In
NZ there are initiatives working to train teachers and provide high quality teaching resources,
but the majority of primary school teachers are still not trained in delivering programming
lessons. Now that there is a demand for widespread programming education for children,
we must establish how programming can be taught in an inclusive way within a school
environment.
One of the key goals of introducing these new subjects is engaging a diverse range of
students in them, and increasing their interest in pursuing careers in this, or related, fields.
This is particularly important for primary school education, as being introduced to CS and
programming after primary school age, rather than earlier, makes it less likely that students
will gain confidence or an interest in this subject. In teaching CS and programming, it
is important to consider both how we can engage these students, but also how we avoid
potentially discouraging them from pursuing these subjects. This is another issue that
58

appears to be particularly important for girls, as early negative experiences in computing
have a particularly powerful impact on them [123]. It would, of course, be both unrealistic
and undesirable to have all students decide that computing was the career path for them,
and some students are unlikely to ever consider this a subject they want to continue with.
However, when students decide that they do not want to pursue the subject, we want this
to be for the right reasons, e.g. it’s just not a field they are interested in or enjoy. We do
not want students to be put off by, for example, influences like bad learning experiences,
stereotypes and misconceptions about the field and the ‘type of people’ who can, and can’t,
succeed in computing.
The age at which students begin learning programming has been a topic of debate in
media, curriculum development, and CS education research. This topic was explored in a
paper I co-authored in 2014 [69]. Many of the arguments against programming being taught
to young students revolve around it being an unnecessary skill for them to learn. It is seen
by some to be a skill that will not be a required skill in the future, and focussing at such an
early age on a skill that is specific only to some career paths is a waste of class time. The
argument against this is that the goal of including this in curricula is not simply to produce
programmers, but by learning it students will develop CT skills, problem solving skills, and
a deeper understanding of the digital world.
5.2.1 Programming tools for young students
One of the most important considerations in teaching introductory programming is what
tools should be used, and which tools are better suited to different age groups. Through the
studies I conducted, it was clear from the teachers feedback that tangible learning materi-
als were necessary for the youngest learners (approximately years 1-4, ages 5-9), and also
highly beneficial for older students. Similar results for very young students were found by
Kazakoff and Bers, who reported on the success kindergarten aged children (3-6 years old)
had with using robotic toys to learn about sequencing [107]. Most of the youngest students
(approximately years 1-2, ages 5-7) in my study, and all older students were able to use
visual programming languages (also referred to as block-based, and graphical programming
languages), such as Scratch. Some of the more advanced students in years 7-8 (ages 11-13)
progressed to text based languages such as Python and JavaScript, but these students were
generally those who had prior programming experience, and then worked on this indepen-
dently. As the development of abstract thinking and spatial reasoning skills most commonly
59

happens throughout ages 11-16 [142], this need for tangible learning materials and visual, as
opposed to text based, programming languages makes sense. It is worth noting that, to my
knowledge, there were no participants in my studies with vision impairments, and so this
was not a factor in the choice of programming languages students used.
Conceptualising the way a program functions without some type of tangible or visual
feedback is difficult for younger students. In 2013 Salleh et al. completed a review of papers
published 2005 and 2011 on research into programming tools for teaching, with a particular
focus on introductory programming [154]. They discussed the strong impact a programming
environment (meaning both the language and development environment used) can have on
students ability to learn, and their continued engagement with learning. They emphasised
that “In teaching and learning of programming, programming tools is one of the main topics
that discuss issues related to pedagogy, curriculum and programming languages” [154]. They
found that the tools used in tertiary education and in industry are not suitable for teaching
primary aged students, and tools that are designed specifically to facilitate learning should
be used instead. Primary aged students also require much simpler developer environments
than those used by adult programmers and learners, as more advanced environments add an
extra level of complexity to learning, and their extra capabilities are superfluous in primary
school.
Many programming and ‘coding’ resources directed at primary aged children have been
released over the past 5-10 years. These have provided a plethora of programming tools
that are suitable for primary school education. The creation of these is largely due to the
influence of not only the growing number of countries implementing curriculum, but also
from industry interest. Many companies in the computing technologies sector have become
engaged with CS and programming education, largely motivated by the current shortage of
trained professionals in this area, and their desire to attract more people to the field. These
resources include ‘Learn-to-Code’ websites, apps, and online programmes (e.g. Code.org4,
Code Club Aotearoa5, Codecademy,6 Kodable,7 and Tynker8); programming languages de-
4 https://www.code.org
5 https://codeclub.nz/
6 https://www.codecademy.com
7 https://www.kodable.com/
8 https://www.tynker.com/
60

signed specifically for beginners and young learners (e.g. Scratch9 and Blockly10); single-
board computers and microcontrollers (e.g. Raspberry Pi,11 and Arduino boards12); and
robotic toys (e.g. Bee-Bots13 and Spheros.14) Resources of these kinds were used by the
majority of participants in my studies, to varying degrees.
When the Learn-to-code movement first started to take off, a popular way to introduce
students and teachers to coding was the ‘Hour of Code’, an annual event run by Code.org
which began in 2013. Having students complete one hour of coding through tutorials on
Code.org became extremely popular, particularly in the USA. According to Code.org, 30%
of students in the USA have now participated in this initiative. Other initiatives based
on this model of short introductions to coding, were also launched. While this has greatly
raised awareness of the push to introduce coding to schools, it was extremely limited in
terms of actually developing students’ programming skills, and created issues for teachers.
After completing these types of activities, students were frequently energised and wanted to
continue learning. However, through the discussions I had with primary (participants and
non-participants in my studies) and high school teachers during my work, it was clear that
the majority of teachers were unsure what the next step in teaching was after their students
had completed the hour of code.
The focus on ‘code’ rather than programming and CS was also seen by some to be prob-
lematic. The words coding and programming are frequently used interchangeably, but this
can create confusion [69]. In the field of CS and computing, programming generally refers to
the full process of taking a problem or specifications, coming up with an algorithmic solu-
tion to this, and implementing it in a programming language. Coding has a large number of
meanings in CS that are entirely unrelated to programming, but when it is used in the con-
text of programming it is typically used to refer only to the final step, of taking the already
created algorithm, or pseudo-code, and transferring this to a programming language [69].
A large number of these introductory activities, and also longer Learn to Code online pro-
grammes, follow this model of simply translating a pre-written algorithm into code. This is
9 https://scratch.mit.edu/
10 https://developers.google.com/blockly/
11 https://www.raspberrypi.org/
12 https://www.arduino.cc/
13 https://www.bee-bot.us/
14 https://www.sphero.com/
61

Figure 5.1: A program written in the visual programming language Scratch (version 3)
not to say these types of lessons are not beneficial - they have been compared to learning
to read before learning to write; but alone they are not enough to fully teach the process of
programming and CT skills.
In order to address these limitations, since 2013 Code.org has introduced many CS ac-
tivities; a set of programming courses, called ‘Code Studio’, for different school year groups;
and a large collection of resources for educators. The majority of popular Learn-to-Code
websites and programmes have also done this. This has provided teachers with follow up
material that they can continue to engage their students with. These programmes also take
a large amount of pressure off teachers as they provide pre-prepared lessons and projects,
and allow students to work at their own pace. They were not covered in the training that
we conducted with teachers, but teachers were able to use them if they felt it would suit
their teaching programme.
Visual programming languages are frequently used to introduce students to program-
ming, and may be more effective for learning than text-based languages [48, 154]. These
were used by the vast majority of teachers I worked with. A visual programming language
is a programming language that allows the user to construct programs by choosing and
connecting programming elements (such as loops, variable decelerations, and conditional
statements) that are displayed visually, as opposed to typing commands. A short Scratch
program composed of these visual commands is shown in Figure 5.1. These commands are
frequently referred to as ‘blocks’.
There are pros and cons to using visual programming languages as teaching tools. They
can simplify the process of programming by providing a clear set of programming instructions
for students to choose from and eliminating syntax errors [126] They are also highly engaging,
and the immediate feedback they give is generally easier for children to interpret than that
62

given by a traditional programming language. Teachers with little programming experience
find these languages less intimidating than text-based programming.
On the other hand, Meerbaum-Salant, Armoni, and Ben-Ari (2011), observed that stu-
dents using Scratch frequently developed undesirable programming habits and used an
intensely bottom-up pogramming approach [126]. An analysis of programs in the online
Scratch repository found that the vast majority of projects that had been created demon-
strated little to no understanding of programming concepts by the creators, and showed
the use of these negative programming habits as well [2]. Meerbaum-Salant, Armoni, and
Ben-Ari noted that the development of these habits happened when students used Scratch
in an open-ended and exploratory way [126]. They observed that when students were explic-
itly taught concepts they did create projects which made use of these. Their work suggests
that visual programming languages are a suitable tool for teaching students programming,
but that they are specifically a tool, and explicit teaching of programming concepts is also
required.
There is little research on students ability to transition from visual programming lan-
guages to text-based ‘real’ languages. Results of this research also seem to disagree. Some
indicates that this is a difficult transition for students, and learning with visual languages
can even be detrimental when students move to some text-based languages [143]. Other
work has found students who have previously worked with visual programming languages
grasped programming concepts in text-based languages quickly and gained a more in depth
understanding, when compared to students who had not [5]. These students also displayed
more enthusiasm for programming. Despite these observed differences in students speed of
understanding however, there was little difference in these two groups’ achievement when
assessed. As I worked only with primary school aged students, and text-based languages are
generally introduced at high school instead, the transition between these was not a topic I
investigated in my work.
5.2.2 Programming books and games
Along with programming environments and online courses, programming books and physical
(i.e. not computer based) games have also been developed. These provide an alternative
way to engage students with foundational programming concepts.
There are textbooks and activity books available for teachers that give guidance and les-
son plans for teaching specific programming languages, and example projects for students to
63

complete. For example, “How to Teach Primary Programming” by Phil Bagge [8], published
by Code-IT Primary Programming, gives a study programme for teaching CS with Scratch.
It was written to support the English Computing curriculum (specifically Key Stage 2, ages
7-11), but covers topics common to many curricula, including New Zealand’s. The book
contains Scratch projects for students to complete, that are intended to cover the CS and
programming topics in the English curriculum, and gives guidance on debugging and general
approaches to teaching programming. More books on Scratch programming have also been
published by Creative Computing.15 These are free, and include guides for educators and a
workbook for students that covers both Scratch programming and the design process [27, 28].
These books have received high praise from educators who have used them. Books for self
directed learning of text based languages are also available for primary aged children, such
as Jason R. Brigg’s books on Python programming, “Snake Wrangling for Kids, Learning
to Program with Python” [30], and “Python for Kids. A Playful Introduction to Program-
ming” [31]. These are useful for keeping more advanced students, who may be looking for
additional challenges, engaged in the learning process.
Storybooks have also been written for teaching programming. “Hello Ruby”, by Linda
Liukas [120], is an illustrated children’s book in which “kids will be introduced through
storytelling to the basic concepts of coding”. The book also contains many ‘coding’ activi-
ties which, like CS Unplugged, do not require computers and are play based. It covers CT
concepts along with basic programming. Storytelling is also used to explore CS and compu-
tation in the book “Computational Fairy Tales”, by Jeremy Kubica [112], and the additional
fairy tales he publishes online [111]. These fairy tales cover a large range of computing top-
ics, including algorithms, data structures, programming, Boolean logic, and compilers [111].
These resources were not used in my studies, but several teachers discovered similar books
themselves and used these with their students.
Another alternative to learning programming through online games and apps is using
physical games, such as card games and board games. For example, the board game Robot
Turtles,16 advertised as ‘the game for little programmers’, involves constructing programs
from game cards to move your turtle from place to place on the board and collect gems. It
was inspired by Logo, and teaches simple sequencing in a similar way to using Bee-Bots,
and doing the CS Unplugged KidBots activity. Games covering more advanced programming
15 http://creativecomputing.gse.harvard.edu/guide/index.html
16 http://www.robotturtles.com/
64

concepts have also been released. These include Potato Pirates,17 in which players can create
programs with loop, conditional, and function cards. Another example is the marble-based
logic puzzle solving game Turing Tumble,18 that contains enough programming concepts to
qualify as a Turing-complete computer. The player places different components, such as cogs
and ramps, onto a board to create a system that will produce a specific pattern of coloured
marbles. Placing components on the board allows you able to simulate conditionals, Boolean
logic, loops, and memory. These games can also be combined with storytelling. Turing
Tumble includes a comic book with puzzles to complete (advertised as challenging even for
adult programmers), and an interactive Robot Turtles eBook is available. Physical games like
these can be used to provide more hands-on and less abstract ways to learn programming.
17 https://www.potatopirates.game/
18 https://www.turingtumble.com/
65

66

Part II
Trialling in New Zealand Primary
Schools
67

Chapter VI
Methodology
In this chapter, I discuss the three studies I conducted through 2014-2017, the context
these took place in, and my research approaches. I took a pragmatist approach in my
methodology, used a mixed methods approach to data collection for each of these studies
and employed a combination of descriptive quantitative, quasi-experimental quantitative,
and phenomenological qualitative research methods. The studies were conducted with NZ
primary school teachers and educators, trialling Computer Science and programming lessons
in their classrooms. I trained the participants in using Computer Science Unplugged and
block-based visual programming languages to teach basic Computer Science and program-
ming concepts.
In this chapter, I first provide an overview of the three studies I conducted through 2014-
2017, and describe the typical classroom environment in NZ, the NZ school decile system,
and priority learners. I then discuss the teaching resources and training that participants
were provided with, and how these changed throughout my research. The methodology of
my data collection and analysis is covered, and the limitations and threats to the validity of
the research are discussed. Finally, details on the ethics approval obtained for these studies,
and on discussions of gender are given.
6.1 Overview of studies
In 2014 I began my research by conducting an exploratory Pilot study, working with one
teacher at an intermediate school, with approximately 600 students. During this time I
worked closely with this teacher and supported her to integrate Computer Science and
programming lessons into her classroom programme. I collected feedback on both hers and
her students’ experiences with the lessons; information on students’ attitudes towards the
topics; the students’ self-perceived aptitude for the topics; and students’ scores in three tests.
This work was partially reported on in a paper I co-authored, in 2015 [67].
68
I then conducted a wider study with 40 teachers, throughout 2015 and 2016. During
this time I gathered feedback on the lessons they taught. This work and the preliminary
results of it were reported on in a paper I co-authored, in 2017 [68]. The majority of
the participants were full-time primary school teachers. The other participants were relief
teachers, and people who were not registered teachers but worked in the Digital Technologies
education field. This group of 40 all participated to varying degrees, and at different times
throughout the 2 years the study ran. During this study support and training were offered to
participants through workshops conducted by the UC Computer Science Education Research
Group (CSERG), and one-on-one tutoring and classroom support from myself and one of
my colleagues, Wendy1, in the CSERG. Wendy’s involvement is discussed in more detail in
Chapter 8.
In 2017 I ran a more targeted intervention study. I worked with 3 schools, and a group
of teachers from each one. These teachers taught their classes specific lessons I assigned to
them, while other classes in the school did not receive these lessons. I conducted a pre and
post test on CT with all classes at each school, and interviewed the participating teachers.
Ethics approval was obtained for each of these studies from the University of Canterbury
Educational Research Human Ethics Committee2 before commencement. Details can be
found in Appendix C.
6.2 Teaching in a New Zealand primary school environment
In NZ, a typical primary school class would: be taught by a generalist teacher, who has
trained specifically in Education and Teaching [36]; contain between 17-30 students, with the
most common size being 28 students [188]; have access to high-speed internet and computers
(through school equipment, ‘bring your own device’ (BYOD) programmes, or a combination
of the two) [99]; contain students with a large range of ability levels across different subjects;
and follow either the NZ Curriculum or Te Marautanga o Aotearoa. In NZ, schools that have
students with high-needs or special education needs will typically include these students in
general age-appropriate classes, rather than having separate classes [74]. In 2015 90% of
schools had at least one high-needs student enrolled [74]. It is therefore not unusual for a
class to include one or more high-needs students. The description ‘high-needs’ covers stu-
dents with, for example, severe behaviour problems, moderate to severe physical disabilities,
1 Name has been changed
2 http://www.canterbury.ac.nz/study/ethics/educational-research-human-ethics-committee/
69

communication difficulties, and cognitive development delays [132].
If CT and CS (which come under the title of Digital Technologies in NZ) are to be
successfully integrated into primary schools, it is crucial that they are taught in a way
that is accessible for all students and generalist teachers without prior CS experience [88].
In the past, this has often not been the case, and in many cases the teaching methods
used for computing education have been found to be biased towards different groups of
students [123], or only investigated in situations with students who were self-selected and
already enthusiastic [69, 72, 163]. As the technology industry is struggling with a lack of
diversity in its community, teaching practices need to make CS and computing accessible to
students regardless of their gender, ethnicity, socio-economic background, disabilities, and
so on.
For any subject taught in a primary school environment, there are additional consid-
erations that need to be made. Teaching materials need to be as affordable as possible,
preferably not require specialised equipment that is not commonly available within schools,
and provide clear learning objectives.
Before continuing several NZ schooling specifics need to be explained, as this work was
carried out within the NZ curriculum framework and was influenced by this.
6.2.1 The School Decile System
In the next three chapters, there are multiple references to school deciles. In NZ, the Ministry
of Education uses the school decile system to determine how much Government funding a
school receives. It is a scale from 1-10, where decile 1 schools receive the highest amount
of funding, while decile 10 schools receive the least. The Ministry of Education describes
deciles as “a measure of the socio-economic position of a school’s student community relative
to other schools throughout the country. For example, decile 1 schools are the 10% of schools
with the highest proportion of students from low socio-economic communities, whereas decile
10 schools are the 10% of schools with the lowest proportion of these students”.3 Lower decile
schools tend to have a higher proportion of students with behavioural problems, and who
live in poverty.
3 https://www.education.govt.nz/school/running-a-school/resourcing/operational-funding/
school-decile-ratings/
70

6.2.2 Priority Learners
The NZ Education system identifies a specific group of students as ‘priority learners’. Priority
learners are defined, by the Education Review Office (ERO4), as “groups of students who
have been identified as historically not experiencing success in the New Zealand schooling
system. These include many Maori and Pacific learners, those from low socio-economic
backgrounds, and students with special education needs.” [73]
It is crucial that as new subjects are introduced to schools they are taught in a way which
gives all students an equal opportunity to learn and succeed, and in NZ special attention
needs to be paid to the needs of priority learners. Because of this, throughout the studies
I conducted I aimed to gather demographic information on students’ ethnicity and special
education needs, and the decile of each school. This was not possible for every school and
class involved, due to privacy concerns, the types of information schools collected on their
students, and the challenge of collecting permission slips from students.
In circumstances when it was possible to collect data on students’ ethnicity, I investigated
whether there were any significant differences between results and observations of Maori and
Pacifica students and students of other ethnicities. This covered results in assessments, and
also qualitative information on students’ enjoyment, engagement, and attitudes in class.
Data showing which students had special education needs was not collected, but in the
interviews conducted in 2015-2017, teachers sometimes discussed students with these needs.
The decile of each school was recorded, and comparisons between schools of different deciles
were made, when appropriate.
6.3 Resources and training used throughout the studies
The CS and programming topics I focused on in these studies were the same as those outlined
in the ‘Data Representation’, ‘Algorithms’, and ‘Programming’ strands of the proposed
curriculum discussed in Chapter 4, section 4.4. These topics, and the specific concepts these
covered are shown in table 6.1. These topics dictated the choice of resources and training
methods provided during these studies.
This table shows these concepts mapped to specific levels (indicating age groups) of
the NZ curriculum. These age groups were guidelines rather than absolute divisions, and
teachers were free to teach concepts from different levels to their students’ age group.
4 http://www.ero.govt.nz/
71

Table 6.1: The concepts that were used for teaching throughout the 2014 to 2017 studies.
72

This proposed curriculum was not written until after the Pilot study (Chapter 7) was
completed, but the concepts I focused on during that study matched those in the proposed
curriculum. As the new NZ DT curriculum was published after the completion of these
studies, it was not used for any of them and not available to participants. The topics and
concepts covered in my studies however essentially match what is now included in the CT
strand of the DT curriculum.
Computational Thinking is not mentioned explicitly in these topics and was not part of
the resources and training content provided throughout the studies. These instead covered
only CS and programming; there were two reasons for this. During the time the pilot study
was conducted, CT was not yet a focus of my research. During the following two studies I
did investigate the development of CT skills, but instead of teaching it explicitly I intended
to investigate whether these skills were developed by the CS and programming lessons.
Throughout the first two studies, reported on in chapters 7 and 8, I was continually
seeking and building on feedback from participants on the training and resources provided.
I revised the training and choice of resources used throughout these studies. This feedback
also impacted the material taught at the Computer Science for Primary Schools (CS4PS)
workshops provided by the CSERG during the time the second study was conducted. These
workshops are described in section 6.3.4.
Throughout all three studies, I was available to answer teachers questions on the content
they were teaching and to provide extra training and support if they requested it. In the
first study I team-taught four lessons (each a different topic with the same class) with the
participating teacher, and one lesson each with four different teachers and their classes
during the second study, at their request. During the second study Wendy, a member of the
CSERG, worked with five other teachers and supported them through one-on-one training
and in class support.
6.3.1 Differences between participants training in the second study
During the second study, the Open Teachers study covered in Chapter 8, the amount of
training and support each participant received varied substantially. This was due to the
freedom teachers had in choosing when to join and leave the study, what resources they
would use, what selection of topics they would teach, and what types of support they wanted.
Some participants attended one or more of the CS4PS workshops, described in section 6.3.4,
which were run by the CSERG. Others did not attend any of these workshops and worked
73

independently, using the online resources provided or other resources they sought out. Some
received ongoing training and support, through one-on-one tutorials, team-teaching sessions
where I joined them for a class, and frequent email contact. Some participants worked
together with colleagues, within and outside of their schools, who were also taking part
in the studies, to support each other in their learning and teaching. One-on-one training,
email support, and team-teaching support were offered to all participants. Participants were
provided with as much support as they requested so that a lack of support would not be
a major factor in the results of these studies. This extra support was only requested by a
small number of teachers.
These differences are further discussed in Chapter 8.
6.3.2 Computer Science Unplugged
The following Computer Science Unplugged activities and materials were used for teaching
Algorithms, Data representation, and some of the Programming concepts.
• Binary numbers
Using a set of 4 or more ‘binary cards’, (usually white with dots on one side, and
entirely black on the other, but variations can be used) students learn to represent
base 10 numbers in binary, and how to count in binary. They observe patterns, such
as each card having twice as many dots as the previous, and how adding another binary
card (or bit) allows you to represent twice as many numbers. This can be extended
by using different things to represent 0 and 1, for example ‘on’ and ‘off’, up and down
arrows, koru patterns pointing in two different directions, or high and low pitched
sounds.
• Binary representation of text
By assigning the numbers 1-26 to the letters of the alphabet, students learn to represent
English text in binary. This can be extended by adding more letters or symbols to the
set of numbers (e.g. lower case and capitals, or macron letters for writing in Te Reo
Maori)
• Image representation
Students are given a set of numbers and a grid, and must use these numbers to figure
out which boxes on the grid to colour in. If the grid is correctly filled out then a
picture, which was encoded in the numbers, will be revealed.
74

• Kid-bots (programming Unplugged)
Students take turns being a ‘robot’ or a programmer. The ‘robot’ can only understand
a small set of specific instructions, and the programmer’s task is to write a program
using these instructions, to have the robot accomplish a task. The most frequent way
this is used is with the robot standing on a grid, and they are only able to understand
the instructions “turn left” (90 degree turn on the spot), “turn right”, and “move
forward” (take one step forward, in the direction you are facing).
• The Parity Magic Trick
Using a set of ‘parity cards’ to perform a ‘magic trick’. Parity cards are square cards
with a different colour on each side (e.g. black and white). The person performing the
trick seems to always know when a card has been flipped over without watching, but
they are in fact using an error detection and correction algorithm.
• The Barcode Magic Trick
After being told all but the last digit on a barcode, the person performing the trick
can ‘magically’ tell what the last digit is. The person performing the trick is actually
using an error detection algorithm, as the last digit on the barcode acts as a check
digit.
• Sorting Networks
Using a ‘Sorting network’ on the ground (this looks similar to a flow chart), students are
each given a different number and follow the arrows on the sorting network, comparing
their numbers to other students as they go along, and without intentionally doing so
they find they are in a sorted order when they arrive at the other end of the sorting
network. This activity can be done with anything that can be put into an order,
not just numbers. For example it can be done with letters or words. The activity
is intended to teach the concept of concurrency, and also introduces the idea that a
sorting algorithm can be constructed using simple comparisons between two things.
• Searching Algorithms
Students experiment with using the searching algorithms: linear search (also called
sequential search), binary search, and (as an optional extension) searching a hash
table. There are several variations on this. The two that were most commonly used in
these studies were: searching through a line of cups with ping-pong balls in them, for
75

the ball with a specific number on it; and through a battleships game, where students
search for each other’s ship based on the number on that ship.
• Sorting Algorithms
Using a set of weights and a balance scale, students use two different algorithms to sort
the weights into order from lightest to heaviest, by comparing only two at a time, and
count how many comparisons are made for different algorithms. This can be extended
by trying out more sorting algorithms.
• The Muddy City
An activity for illustrating graph problems (minimal spanning trees and networks).
Students are given a map of a city with paved paths leading between different buildings,
and have to choose the paths (by colouring them in), which together allow you to visit
every place on the map, whilst using the least number of pavers. This can lead into
discussions of optimisation, algorithms for finding the best set of paths, and variations
involving different requirements for optimising the network.
The full descriptions of these activities can be found through the CS Unplugged website5,
and the Classic CS Unplugged website6. Teachers were able to pick and choose which of
these they used (other than several activities that were required lessons in the 2017 study).
These activities will be referred to frequently throughout the remainder of this thesis.
During my research, the UC Computer Science Education Research Group began rede-
veloping and extending a subset of the original CS Unplugged activities. The aim of this
was to create a version that could serve as a full classroom programme for use in primary
schools. I was also involved with this redevelopment. The new versions were made avail-
able to participants in 2016 through a ‘sneak peek’ website, and this new version of CS
Unplugged was officially launched in February 2018. This meant that during my research
the CS Unplugged resources I was able to provide teachers with changed over time. A small
number of teachers participating in the second study and all teachers in the third study used
the updated versions of the resources.
The activities which were redeveloped and released were: Binary numbers, Binary rep-
resentation of text, Parity Magic Trick, and Sorting Networks. The Kid-bots activity was
5 https://csunplugged.org/
6 https://classic.csunplugged.org/
76

developed for the new version of CS Unplugged, and so was not available through Classic
CS Unplugged and not used by participants until 2016. The remaining activities were not
redeveloped during this research and available only through Classic CS Unplugged.
In the first study, when I worked with just one teacher, they used the CS Unplugged
book7 and online resources for her classes, and I went through each of the CS Unplugged
activities with her once before she taught them. I taught three of these activities (binary
numbers, the parity magic trick, and searching algorithms) once alongside the teacher, before
she proceeded to teach them with more classes. She was free to choose which of the activities
to teach.
In the second study, teachers were given the freedom to choose which CS Unplugged
lessons and activities they would teach. All of these participants had access to the CS
Unplugged lessons and activities, whether it was through the Classic CS Unplugged or the
new CS Unplugged website. As mentioned previously in section 6.3.1, participants in this
study received varying amounts of training in CS Unplugged, based on the amount of support
they requested and how many of the CS4PS workshops they attended.
For the final study, I conducted one-day workshops at each of the three schools I worked
with, to train the teachers on using the CS Unplugged activities. Teachers then had access
to the CS Unplugged online resources and could contact me if they had questions about the
content. During this study, I did not do any CS Unplugged team-teaching.
The specific CS Unplugged lessons and activities used by the teachers are documented
in each of the chapters on these studies.
6.3.3 Programming resources
Throughout the first two studies, reported on in Chapters 7 and 8, teachers were given full
autonomy to use whatever programming resources and languages they wanted. In the final
study, reported on in chapter 9, I instead assigned specific resources for teachers to use.
During the first study, the teacher chose to use the programming language Scratch8, and
I provided her with resources and one-on-one tutoring in programming using Scratch.
7 https://classic.csunplugged.org/books/
8 https://scratch.mit.edu
77

Programming in the second study
Training in using the visual programming languages Scratch and ScratchJr9, and the Bee-
Bot10 floor robots, was provided through the CS4PS workshops. Information on what Bee-
Bots are is given at the end of this section. Teachers were also offered one-on-one tutoring in
using these programming languages but, to my knowledge, only one teacher requested and
received this. Several participants took part in a ‘Code Club for teachers’, run by Wendy,
where they worked together on the Code Club Aotearoa11 Scratch projects and discussed
how they could incorporate these into their classroom programmes. Teachers were free to
choose the programming languages they used. Scratch and ScratchJr were the most common
languages used.
The Bee-Bots were mostly used with grids on the floor, and teachers had students pro-
gram the robots to navigate the grid in a specific way to achieve a goal. These lessons
included navigating mazes and obstacles, spelling out words with letters printed on the grid,
and performing basic maths with numbers on the grid. The Bee-Bots proved extremely
popular with both students and teachers, and a group of teachers decided to organise an
inter-school competition with these, named the “Buzz-off”. This was independent of the
work I did but involved the UC Computer Science Education Research Group. This is a
testament to how effective teachers found the Bee-Bots to be as learning tools. The Bee-Bots
were used to teach Algorithms and Programming.
Along with this training, we recommended several online resources. The main pro-
gramming resources I directed teachers towards were the projects published by Code Club
Aotearoa, and these were the most commonly used resources, particularly the Scratch ones.
I also suggested several ‘learn to code’ websites, such as Codecademy12, CodeAvengers13,
and CodeCombat14. To my knowledge, these were only used by two teachers, and only by
the more advanced students in their classes who required an extra challenge.
Several teachers used other resources they found online or were recommended by their
peers. The resources that were reported were the Hour of Code activities and Code Stu-
9 https://www.scratchjr.org/
10 https://www.bee-bot.us/
11 https://codeclub.nz/
12 https://www.codecademy.com/
13 https://www.codeavengers.com/
14 https://codecombat.com
78
dio courses available from Code.org, and the “Code It How To Teach Programming Using
Scratch” teacher’s handbook[8]. One teacher said they used several Scratch programming
tutorials written by other teachers, that they found on the Computing at School [44] forums,
but did not provide further information. Other resources I was not aware of may have also
been used. The more confident teachers frequently adapted resources to suit other topics
and projects taking place in their classroom.
The CS Unplugged activity ‘Kid-bots’ can also be considered to teach both Algorithms
and Programming, as the activity involves the same concepts as using the Bee-Bot floor
robots. The main difference is that in Kid-bots the instructions are interpreted and carried
out by a human, rather than a robot or other digital device.
Bee-Bots
Bee-Bots are educational robots that have the appearance of a bumblebee. They have a
set of buttons on their back, shown in Figure 6.1, that can be used to program them with
a set of movement instructions. They can only perform simple sequences of instructions,
and looping and conditional instructions are not available. Several similar robotic toys have
been developed, such as the Code and Go Programmable Robotic Mouse15.
Programming in the third study
In the final study I conducted, the Intervention study discussed in Chapter 9, teachers were
assigned one programming resource, in an attempt to maintain as much consistency be-
tween different classes as possible. Teachers were asked to use CodeAvengers16 (and the
KidBots CS Unplugged activity, which can be considered to teach programming concepts)
only. However, due to technical issues that arose with using CodeAvengers, partway through
the study teachers were given permission to use the Code Club Aotearoa Scratch program-
ming resources.
6.3.4 Computer Science for Primary Schools (CS4PS)
Along with direct support from myself and another member of the CSERG, many partici-
pants attended one or two of the ‘Computer Science for Primary School’ (CS4PS) workshops,
15 https://www.learningresources.com/product/learning+essentials--8482-+programmable+
robot+mouse.do
16 https://www.codeavengers.com/
79
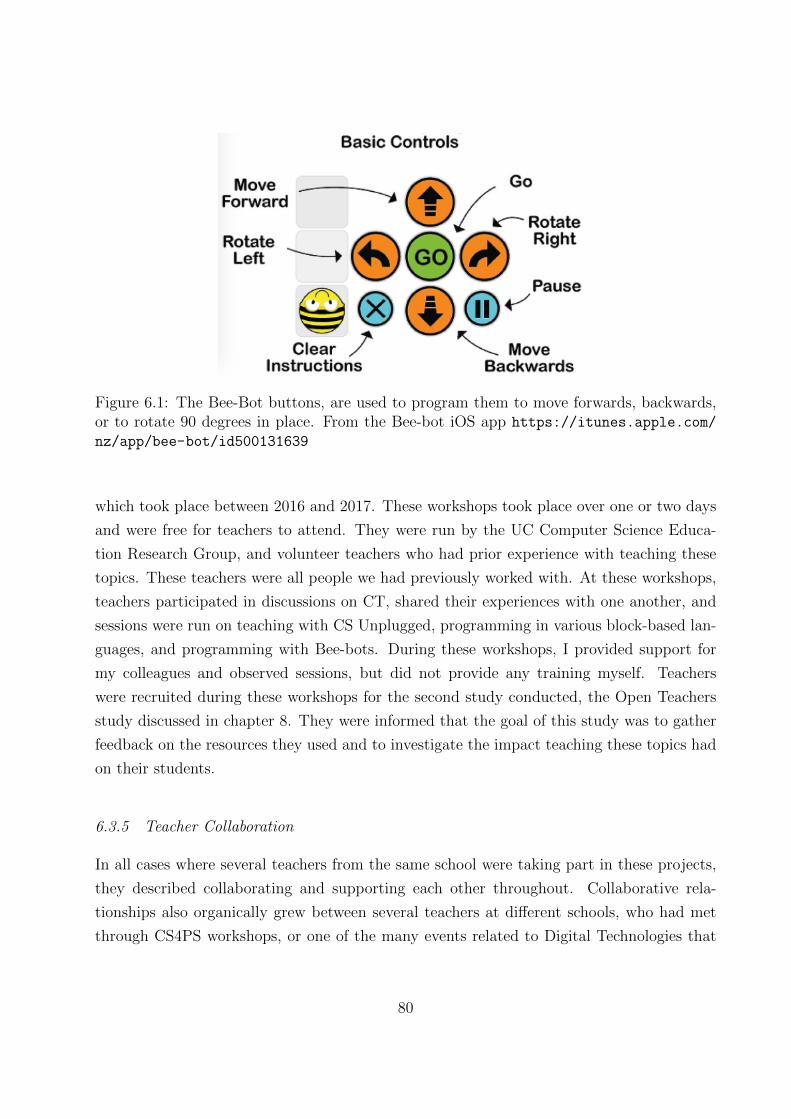
Figure 6.1: The Bee-Bot buttons, are used to program them to move forwards, backwards,or to rotate 90 degrees in place. From the Bee-bot iOS app https://itunes.apple.com/
nz/app/bee-bot/id500131639
which took place between 2016 and 2017. These workshops took place over one or two days
and were free for teachers to attend. They were run by the UC Computer Science Educa-
tion Research Group, and volunteer teachers who had prior experience with teaching these
topics. These teachers were all people we had previously worked with. At these workshops,
teachers participated in discussions on CT, shared their experiences with one another, and
sessions were run on teaching with CS Unplugged, programming in various block-based lan-
guages, and programming with Bee-bots. During these workshops, I provided support for
my colleagues and observed sessions, but did not provide any training myself. Teachers
were recruited during these workshops for the second study conducted, the Open Teachers
study discussed in chapter 8. They were informed that the goal of this study was to gather
feedback on the resources they used and to investigate the impact teaching these topics had
on their students.
6.3.5 Teacher Collaboration
In all cases where several teachers from the same school were taking part in these projects,
they described collaborating and supporting each other throughout. Collaborative rela-
tionships also organically grew between several teachers at different schools, who had met
through CS4PS workshops, or one of the many events related to Digital Technologies that
80

were run over the years by our research group and others. Some of these teachers went on
to run their own professional development workshops and events for other teachers, within
their schools and outside of them. Several of the participants in the second study attended
the ‘Code Club for teachers’ in 2015. These relationships were cited by many teachers as
crucial to their success in integrating these topics.
6.4 Data collection and analysis methodology
This research was conducted in New Zealand primary school (ages 5-13 years) classes. The
majority of these classes took place in usual class time; involved an entire class of students,
rather than a specially selected group; and were taught by a generalist primary school teacher
who had not previously taught CS and programming. In the second study I conducted
(covered in Chapter 8), there were a small number of cases that were exceptions to this,
which are each noted.
I took a pragmatist approach to this research [168, 166], focussing on the real-world
context and effect of this work. I did this because the goals of my research centred on
supporting action in CS and CT education. Any findings from this work were intended to
be of practical and relevant use. Pragmatic research is by its nature reactive. The ability to
react and adjust to shifting circumstances was crucial for my work, as curriculum in this area
was continually developing throughout my research, both in NZ and abroad. The training
and support required by educators expanded, and several of the CS education groups I have
been involved with were subcontracted by the Ministry of Education, which impacted what
parts of my work had the most practical value. I choose this research approach because I
needed flexibility in how I conducted my studies and what information I needed, and was
able, to collect.
The studies I conducted each took a mixed methods and classroom-based research ap-
proach. Mixed methods approaches are useful for research in educational settings because of
the complexities of researching within a school environment. When working with multiple
people who need to prioritise their teaching and students over participating in my research,
and the constantly evolving and dynamic environment of a classroom, there is no way to
have control of all variables involved in the research. A mixed methods approach assists in
the triangulation of results based on multiple data sources. With no established CT assess-
ment tools, it was also important that I supplemented the quantitative data from tests with
qualitative information. The types of data collected, and the data collection methods used,
81

varied between each study, and these are described in more detail within each chapter.
6.4.1 Assessment with Bebras
As previously stated in section 3.4.1 of Chapter 3, the Bebras challenge17 is an “International
Challenge on Informatics and Computational Thinking”. It was used in two of the studies
I conducted to try and measure students’ CT skills. Along with its favourable reputation
among those who had used it, and the consensus that the majority of tasks in the challenge
require CT skills to solve [98], I chose to use this challenge for the following reasons. Firstly,
the challenge does not require prior experience with CS or programming. This was useful
as it meant students would, in principle, be assessed purely on their CT skills rather than
their achievement being based on prior experience. This was particularly important for pre
and post-testing students as I was aiming to assess their development of CT skills, and not
just their knowledge of CS and programming. Secondly, it was accessible online and did not
require schools to install specific software or deal with troubleshooting software. Thirdly,
there are different sets of questions available for different age groups of students, meaning it
was potentially useable for multiple primary school year groups. As discussed in Chapter 3
however, there are several limitations to using the challenge, and there has been criticism of
its use and validity. Please refer to section 3.4.1 for more details on these limitations.
The challenge follows a specific marking schedule, where students gain points for correct
answers and lose points for incorrect ones. Points are not lost for unanswered questions.
All students start with a base score of 45 points to avoid obtaining a negative mark. Each
challenge has a minimum possible score of 0, and a maximum of 180. A score of 0 indicates
that a student attempted every question, but answered all incorrectly.
Each task is assigned a level of difficulty: easy, medium, or hard. The difficulty of
a question dictates the number of points that are gained or lost when that question is
marked. A correct answer to an easy question earns 6 points, while a wrong answer loses
2 points. Medium questions earn 9 points or lose 3, while hard questions earn 12 points
or lose 4. Levels are assigned to each question by the Bebras task developers, at their
discretion, when they develop new tasks at the annual international Bebras workshop. These
differences in scoring for each task can be beneficial as it gives a larger and potentially more
informative spectrum of possible results, and it gives recognition for solving particularly
difficult questions. However, it can also introduce problems. As discussed in Chapter 3, the
17 https://www.bebras.org/
82

assigned difficulty of a task is at times inappropriate and does not reflect the actual difficulty
level for students in practice. For example, a question marked as medium may have been
much more challenging than the task developers intended, and fewer students answered it
correctly than some of the questions marked as hard, or vice versa. In the case of the Pilot
study, covered in Chapter 7, I had access to each student’s final score, but not to their marks
for each question. This prevented me from assessing whether the assigned difficulty levels of
the tasks matched the actual difficulty, based on how many students answered each correctly
or incorrectly. It also made it impossible to tell the difference between a student who got
several questions correct and several incorrect, and a student who did not answer several
questions.
In the final study I conducted, I did have access to the answers to each task and so I was
able to examine the difficulty level of each task. As several of the assigned difficulties were
found to be substantially different from the actual difficulty level, I re-assigned levels to these
tasks and re-marked students results according to this more accurate rubric. However, to
further complicate the issue of task difficulties, the actual difficulty of a task is not always a
result of the informatics concepts or skills that need to be exercised. It can also be influenced
by the language used, and length of the question, as this is not always suitable for the target
age level. This issue arose during the third study I conducted. This issue and its implications
are discussed further in Chapter 9.
6.4.2 Qualitative data
All survey questions, questions in the feedback form, and the planned format and topics
to be covered in interviews were reviewed and approved by the University of Canterbury
Educational Research Human Ethics Committee.18 See Appendix C.
Pilot Study
During study 1, the Pilot study, I collected qualitative information by taking notes on my
meetings with the participating teacher, the observations we each made during and after the
lessons I was present for, and on any online communications we had. Our meetings were not
audio recorded or transcribed.
18 https://www.canterbury.ac.nz/study/ethics/educational-research-human-ethics-committee/
83

Interviews in the Open Teachers Study and the Intervention Study
In the subsequent studies, I conducted interviews with participating teachers. I recorded
the audio from these and transcribed them. For study two, the Open Teachers study,
these interviews were voluntary. All participants were invited to volunteer, regardless of
when they joined the study or how long they had been a part of it. The one teacher who
participated in the first study also participated in the second study and was interviewed.
In study three, these interviews were a requirement of participating in the study and all
participants consented to be interviewed. During the second study, the interviews lasted
between approximately 30 to 75 minutes, depending on how much the interviewee wished
to discuss. The interviews conducted for the third study were shorter, between 20 to40
minutes, as participants were assigned lessons to do with their classes and so did not have
any extra activities or curriculum integrations to report on. Around half of the interviews
in the second study and the majority of interviews in the third study were conducted in
person. The remaining interviews took place over the phone.
These were semi-structured interviews and so a script of specific questions was not used.
Instead an interview guide, based on the general topics for discussion, was used. This allowed
for increased flexibility in the interview process. Because of this, I was also able to explore
topics participants brought up that I had not predicted. This approach generated insightful,
and in some cases surprising, information. However, in some cases, the variation in topics
limited the potential for comparisons of particular observations between participants.
The topics discussed in the interviews were:
• The participant’s background in teaching, and how they came to be involved in this
programme.
• The general culture of their school and/or teaching environment.
• The students in their class(es). For example, whether the students were particularly
high or low achieving, motivated learners or disengaged, if there were particular be-
havioural issues within the class, etc.
• Which lessons they did and their observations about the lessons: Success, benefits,
positive and negative impacts, impact on students general learning and their problem
solving skills.
84

• The impacts being a part of the programme had on them personally, what their feelings
about the programme were, and what challenges they faced.
• What types of support and resources were most helpful to them.
Care was taken to avoid asking leading questions, for example asking “did you observe any
positive or negative impacts on students?”, rather than “what positive impacts on students
did you observe?”.
Additional data in the Open Teachers Study
Participants were asked to fill out a survey when they first joined this study, which asked
about their motivations for joining the study and teaching this material, their feelings about
the prospect of teaching this, and their previous experience with these subjects. These were
all text entry questions.
Throughout the study, participants were also asked to submit feedback on the lessons
they conducted through an online form. This form included three optional text entry ques-
tions and two required multiple-choice questions with an ‘other’ option where text could be
entered.
The qualitative information submitted through the survey and the feedback form was
analysed alongside the interview transcripts from this study.
Analysis
I used a thematic analysis approach when analysing the qualitative data collected in each
study. The analysis of the second study was completed before the third study began. The-
matic analysis is a widely used method for analysing qualitative data and is used to identify
patterns and meanings across a data set related to the research questions being investigated.
To identify these patterns and meanings a process of ‘coding’ data is used (not to be con-
fused with ‘coding’ in the context of programming). This tags sections of text with a code
(generally a key-word or potential theme). It is an iterative process in which the researcher
goes through phases of becoming familiar with the data set; coding the data; revising and
validating the codes used, which involves reviewing and (when necessary) re-coding the data;
and finally taking the codes and coded data to consolidate and describe the themes found
in the data.
85

The aim of collecting and analysing this information was to identify information related to
Computational Thinking, and to investigate if other themes or patterns related to students’
and teachers’ experiences emerged. I used a deductive approach when investigating CT skills
and themes in this data, attempting to identify data that fitted into the CT framework I
was using. As discussed in Chapter 3, section 3.5, I used the Barefoot CT definition in my
analysis of interview transcripts and participants feedback. While this definition does not
fully agree with my own view of CT, it was used for pragmatic reasons, as the approaches
it includes have close links with core parts of the NZ curriculum. These links are discussed
in Chapters 8 and 9. I then employed an inductive approach to my analysis, attempting to
identify themes or patterns in the data that were not based on a preconceived framework or
set of themes. It should be noted that in inductive analysis it is never possible to be certain
that a researcher’s preconceived theories about the data have not impacted the analysis.
6.5 Limitations and threats to validity
There were a number of limitations and threats to validity for the methodology used in these
studies that need to be noted. The main limiting factor throughout all of my studies was
that my involvement in the NZ curriculum redevelopment, and the needs of teachers (both
participants in my study and others my research group were working with) took priority over
my research. Balancing the needs of individual participants in my studies, and the wider
community of NZ primary school teachers, with the repeatability, rigour, and goals of my
research was an ongoing challenge.
More specific limitations of my work are discussed below.
6.5.1 Pragmatism and mixed methods research
Mixed methods approaches often become time consuming, and require complex research de-
signs. Pragmatic research also includes these challenges, as it is reactive and the research
being carried out must respond to changes in the real-world context. Changing circum-
stances mean findings and conclusions can become meaningless, or no longer applicable to
the current real-world situation, at different points in time. The reactive nature of prag-
matic research also greatly decreases its repeatability. The focus on generating results that
are of practical value, and in my case the reliance on participants’ personal experiences, can
impede repeatability and rigour. This is a common problem in education research and other
research involving human behaviour. Despite these disadvantages of mixed methods and
86

pragmatic research methodologies, their advantages made them well suited to my research.
6.5.2 Interviews and interview analysis
During these studies, I was closely involved with the participants and worked alongside them
continuously. This familiarity was highly beneficial in providing participants with adequate
support, and in increasing their engagement with the study so they were more willing to
provide feedback and be interviewed.
However, this also introduces several threats to the validity of these studies. The first
of these is acquiescence bias; participants may want or feel a need to please the researcher,
and so give overly positive reports of their observations and experiences, compared to the
reports they may have given if they had not been as closely involved with the researcher.
This risk could have been reduced by having a neutral third party conduct the interviews.
On the other hand, having a third party who was not familiar with research would have
likely limited the depth of information gathered in the interviews. There is also an inherent
threat to the validity of conclusions that are based on teachers’ opinions and impressions
[92]. It introduces the risk of participants giving overly positive reports of their students’
learning. Examining a teacher’s impression of their students’ learning can provide valuable
information, but can not give complete access to students’ actual knowledge.
During interviews, care was taken to avoid leading questions that could bias teachers’
answers. However, my reactions to participants answers may have introduced bias into their
subsequent answers. For example, there were several cases in the second study where I
responded to participants with statements such as “that’s really exciting” or “that’s good”
when they gave answers in a particularly enthusiastic and excited fashion, or which were
interesting to me. I had attempted to remain impartial while interviewing, but during
transcription of interviews in the second study, I observed several cases where I gave positive
reactions to the interviewees’ statements.
I was the only researcher who analysed the interviews, and so there was no secondary
thematic coder that I could compare my results with. The primary reason for this was there
were no other people available to conduct this lengthy process of analysis. It was therefore
not possible to calculate inter-rater reliability of the coding. As previously mentioned, the
use of inductive thematic analysis means the impact of a researcher’s preconceived theories
about the data may bias their analysis, and without the ability to check inter-rater reliability
the potential degree of bias in the analysis could not be examined.
87
6.5.3 Assessment with the Bebras challenge
As was discussed in Chapter 3, section 3.4.1, the reliability of the results of the Bebras
challenge as a measure of CT skills has some limitations. There is variation in the opinion
of researchers on whether the Bebras challenge is a suitable method of CT assessment, par-
ticularly because the reading difficulty of the challenge and emphasis on creating narratives
within the questions can distract from the CT concepts the challenge is aiming to assess
[150, 184]. In the third study (the intervention study) I attempted to control for the reading
difficulty of the challenge by collecting data on students’ reading ability, along with their
test results. The accuracy of the difficulties assigned to questions has been found to be
unreliable [23, 184]. I attempted to mitigate the effects of this by reassigning the difficulties
of questions in the tests I used for the third study but was unable to do this in the first
study (the pilot study) as I only had access to students’ final scores.
6.6 Additional considerations
6.6.1 Impacts of participant’s location
All participants were teaching in NZ, with the majority based in the Canterbury region.
The higher concentration of participants in Canterbury was a result of the CSERG, CS4PS
workshops, and myself being based in Christchurch, Canterbury. The potential influences
of this regional bias were not investigated. Christchurch is a fairly typical NZ urban region.
However, several participants discussed the impacts of the 2011 Christchurch earthquake19
during their interviews. These discussions focused mainly on the effect of the earthquake on
their student’s well being and behaviour problems.
The large detrimental impact of the earthquake on the mental health of young people in
Canterbury has been heavily documented. The frequency of behaviour problems in students
has been increasing since 2011, and primary school students in Christchurch have approxi-
mately double the normal rates of anxiety and PTSD symptoms for their age group [118].
The trauma of the earthquake has also had an impact on children born after it occurred,
meaning even the youngest students in these studies were potentially affected [32, 108].
The 2011 earthquake, student behavioural problems, and the impact of this study on these
problems became a common theme in the interviews.
It is also worth noting the differences in population proportions of Maori, Pacifica, and
19 https://en.wikipedia.org/wiki/2011_Christchurch_earthquake
88

European identifying people in the South and North Islands of NZ. The Canterbury region,
along with most regions in the South Island, has a relatively low percentage of people who
identify as Maori or Pacifica, and a relatively high percentage of people who identify as
European, when compared with the majority of regions in the North Island. In NZ there is
a significant difference between Maori and Pacifica student achievement rates when compared
with students of other ethnicities. There are a large range of factors contributing to this,
including structural problems within the NZ education system. The results of this research
may, therefore, be less representative of teachers and students in the North Island of NZ.
However, the demographics of the schools I worked with varied greatly so this potential for
bias may have been decreased.
6.6.2 Discussions on gender
In all following chapters, discussions and presented results that concern gender only discuss
cis-gender participants (students and teachers). This is because in each study there were,
to my knowledge and in the data collected, no gender diverse participants in the 2015-2016
open teachers study, or the 2017 intervention study. In the 2014 pilot study, 4 of the students
responded ‘other’ when asked what their gender was. As this was too small a sample size to
make any meaningful generalisations about, and none of the students’ results placed them as
outliers in the data set, no conclusions were drawn based on students responding as ‘other’
and being gender diverse.
Because of this, in discussions of students only girls and boys are referred to, and only
women and men in discussions of adults.
6.6.3 Discussions on ethnicity
In all following chapters, discussions and presented results that concern students’ ethnicities
focus on students who are Maori or Pacifica, and students who are neither Maori or Paci-
fica. In these discussions, I have grouped together students whose includes either Maori or
Pacifica, or both. This also includes students who identified as additional ethnicities, for ex-
ample a student who identified themselves as Maori and ‘New Zealand European (Pakeha)’
is included in the group Maori/Pacifica. Throughout the following chapters, this group
of students will be referred to as Maori/Pacifica. It is important to note that these two
ethnicities are not the same, and Pacifica (also referred to as Pacific Peoples and Pasifika)
is a collective name for a number of Pacific Island ethnicities, including Samoan, Tongan,
89

Niuean, and Cook Island Maori.
These ethnicities have been grouped together in discussions on ethnicity as both groups
face similar inequality issues in school education, and are both similarly unrepresented in
the computing industry and computing courses. These issues were previously discussed in
Chapter 2.
90

Chapter VII
Pilot Study
This chapter covers the Pilot study I conducted in 2014, with an intermediate school
teacher who was completely new to the topics of CS and programming. First, the circum-
stances which led to this study, and the aims the teacher and I had for introducing these
topics are described. The structure and content of the CS and programming classes are
discussed, followed by the methods of assessing the success of these classes. The results of
this programme and the implications these had for future studies are then discussed.
7.1 Context
In 2013 Angela1 was teaching technology at an intermediate school and was dissatisfied
with the classroom program being used for ICT. She observed that many students were
disengaged, bored by the content, and were not leaving the class feeling that they had
achieved something. They spent most of their lessons working through web-quests,2 which
are online enquiry oriented lessons in which students search for information on the web.
This was problematic, as these required large amounts of reading and thus shut out many
students with lower reading ages. In general, these tasks were not motivating the students.
In 2013, Angela was given the opportunity to take over the classes in the school’s com-
puter lab. This enabled her to change the content, and the way students were learning in
ICT. She spent the year focussing on teaching digital media and encouraging students to
create their own media. She felt this was successful, but wanted to take things further.
In early 2014, serendipity had it that Angela heard about our intention to work with
primary school teachers, trialling CS and programming in classes. She volunteered to work
with us. Over the next school year, I worked with Angela to implement a trial curriculum
and conduct a pilot study at her school. During this time, I trained Angela in teaching
1 Name has been changed.
2 https://en.wikipedia.org/wiki/WebQuest
91

CS using CS Unplugged activities, and programming in Scratch. At times I joined her to
team-teach classes. Throughout the year I visited Angela at her school to go through CS
and programming lesson plans, and discuss her experiences with the material. I visited her
weekly for the first school term, and approximately biweekly as the year went on and she
required less support. In each of our meetings, I took notes on her recent in-class experiences
with the content, what she was struggling with and wanted to learn, and what content I
taught her during our meeting. Throughout this project, I took on the role of teacher to
Angela and was simultaneously investigating whether the resources she was supported with
were effective for teaching and her students learning.
Angela and I attempted to assess students’ learning, and investigate the impact of these
lessons on them. We did this through quizzes, the online Bebras challenge, and an attitude
survey that students completed. The results from these, and Angela’s ongoing observations
and feedback throughout the year, provided invaluable insight into the impacts and chal-
lenges of teaching CS, CT, and programming, in an intermediate school environment. The
findings from this study informed the design of the larger-scale study conducted through
2015-2016, which is covered in Chapter 8. They also had a large impact on the official
discussions surrounding the NZ curriculum development in 2014, and the following years.
Angela remained involved in this work over 2015-2016 and was a participant in the study
covered in Chapter 8. At the end of 2016, she was interviewed about her experiences over all
three years. The contents of this chapter at times draw on information from the interview,
which relates to this pilot study.
7.2 Aims
This pilot study focused on exploration and discovery. The intent was to investigate the
general impact on students and teacher, e.g. on their attitudes to the topics, engagement in
the lessons, and the teacher’s professional opinion on the students’ learning. Angela’s goals
for the study were as important to its planning and conduct as mine.
In February 2014, I had my first meeting with Angela. She had been teaching for over
25 years, the past 18 being in intermediate schools. She was a generalist teacher, with no
previous experience or exposure to CS or programming. We discussed why she wanted to
learn about, and teach these new topics, and what she wanted to achieve that year. Her
goals for students were:
• They would be engaged in the content and enjoy the classes.
92

• Every student would be able to achieve something in these classes and leave with a
sense of personal achievement.
• They would have some control over their own work and would be encouraged to be
creative.
• They would have the opportunity to create something that they were able to share
outside of the classroom with their family, friends, and whanau.
• They would have opportunities to work together and collaborate.
• They would be encouraged to assist each other in solving problems and share their
learning with each other.
• Extension activities could be provided for those students who needed them, but the
main course content would be suitable for all students.
• At the end of the year, students would be able to get an indication of how well they
did and whether they understood what they had learnt. This would not necessarily be
through some form of assessment, but this was an option.
Angela also wanted to be able to keep up with the majority of her students throughout
the year and was concerned that she may not be able to do this. She expected that some
high achieving students would excel and move quickly through the content, and did not
mind if she could not keep up with them, but it was important to her that she kept pace
with the rest of her students. She did not want students to be held back if she was unable to
progress. She initially did not have high levels of confidence in her ability to teach CS and
programming. However, she was highly confident in her computer use skills, in incorporating
E-learning into the classroom, and was not afraid to experiment with new software. While
these skills are not directly related to CS and programming, this removed the potential extra
barrier of a lack of confidence with technology, which some late career teachers struggle with.
My aims for this study were to observe and investigate the general impacts of introducing
this material to the classroom. The specific impacts I focused on evolved slightly over the
course of the study. I progressed from investigating students specific CS knowledge and skills,
to investigating their CT skills as well. This was in response to the growing catalogue of
literature on CT, and that this was impacting opinions among CS educators and curriculum
93

influencers. Development of CT skills was increasingly being viewed as a more important
outcome for students, than simply gaining CS knowledge. Learning CS was becoming seen
as a means to learn CT, rather than CS being the core focus.
Taking into account my initial goals, and the changes in these during the study, the
questions I aimed to investigate were:
1. If a teacher without previous Computer Science or programming knowledge could be
supported and enabled to integrate Computer Science and programming into their
classroom curriculum, through the use of Computer Science Unplugged resources and
tutoring in block-based programming (supports RQ1).
2. Whether the teacher developed Computational Thinking skills, or some understanding
of these, through learning and teaching Computer Science and programming (supports
RQ1).
3. Whether students in a typical classroom could be taught Computer Science and pro-
gramming concepts, through their teacher’s use of CS Unplugged resources, and teach-
ing of block-based programming (supports RQ1.3).
4. Whether students developed Computational Thinking skills, and general problem solv-
ing skills, through this process (supports RQ2 and RQ3).
5. How students reacted to and engaged with these lessons (supports RQ2).
6. The degree to which students enjoyed the CS Unplugged and programming lessons,
how confident they were in their abilities in programming and the CS Unplugged topics,
and if they wanted to continue learning about them (supports RQ4).
7. Whether these observations and results varied for students of different genders, or
different ethnicities (supports RQ4).
These questions do not fully match the overall research questions (listed in Chapter 1,
section 1.1) I aim to address in this thesis. This is because the process and results of this
study, and developments in the NZ curriculum, influenced my subsequent research goals,
and informed the research questions I eventually chose. These also contributed to answering
several of the research questions, as noted above.
94

7.3 Class Structure
As this was an intermediate school the students ranged from ages 10-13 years (10-12 at
the start of the school year, 11-13 by the end) and were in either year 7 or year 8. The
‘computing’ classes with Angela were attended by every class in the school, which totalled
over 600 students. Each class spent one 60 minute lesson per week in the computer room.
Classes had approximately 20 lessons in total on CS and programming. These lessons were
spread out over the school year, though did not take place every week due to school events,
timetabling changes, and other ICT topics being taught.
There was also an extension class, who had lessons twice a week. This class received
approximately 30-40 lessons in total. The initial sessions with this class served as a type of
‘trial-run’ lesson for Angela and provided her with time to test out the material. I joined
the majority of these sessions at the beginning of the year to assist Angela in demonstrating
this new material, and answer students’ questions. These sessions gave Angela confidence
in teaching the following sessions alone and helped her develop a deeper understanding of
the material she was teaching. She remarked during the study that by the end of each week
she felt like she was becoming an expert in the topics she had covered. By the middle of the
school year, my teaching assistance was very rarely needed.
The classroom environment this study took place in was, what can be described as, a
typical school environment. It was a state school, with a socio-economic decile of 5.3 There
was a wide range of ability and interest levels across the student body. As a female teacher
in the 55-65 year old age group Angela also fell into the typical demographic of primary
school teachers, over 80% of whom are women4 and 40% are above the age of 50.5 A 2012
survey of 91 High School Digital Technologies teachers in New Zealand found that 60% of
these teachers were also over the age of 50.
The classroom the lessons took place in was equipped with desktop computers, with
enough for one per student. Students generally worked individually on a computer, but
frequently collaborated with the other students around them. The classroom was also set
up for non-computer work, with a whiteboard, projector, and enough space for activities
which did not take place on a computer, such as the CS Unplugged lessons.
To prepare Angela for the lessons, and to support her throughout the year, I met with
3 For an explanation of the decile system please see Chapter 6, section 6.2.1
4 https://www.educationcounts.govt.nz/publications/schooling/teacher_census
5 https://www.educationcounts.govt.nz/publications/series/2263/31417/4
95

her weekly for the first term, and then roughly biweekly for the remainder of the school year
as she began needing less support. In our meetings, we went through the CS Unplugged
resources in detail and discussed possible data representation projects and extensions for her
to use in class. I also tutored her in programming with Scratch.
7.4 Class content
We initially planned to include ‘Data Representation’, ‘Programming’, and ‘Algorithms’ (as
they are described in Chapter 4, section 4.4) in the course content. However, due to limited
classroom time, ‘Algorithms’ was not given individual lesson time. Students were exposed
to concepts from this topic, as the programming and data representation activities used
covered several algorithms, and required algorithmic thinking. However,this did mean that
some of the core concepts of the ‘Algorithms’ topic were not covered. Specifically some of
those that were highlighted in the proposed NZ curriculum: that there can be many different
algorithms which solve the same problem, and that these algorithms can be compared.
The CS Unplugged material on binary numbers, text representation, image representation,
and error detection (parity magic trick) were used to cover the topic of Data Representation.
Each of these activities, particularly binary numbers and error detection, also provided good
examples of using algorithms. As Angela became more confident in her conceptual knowledge
she began creating activities and challenges for students, based on Data Representation. She
discussed these with me before using them. In creating these she consistently displayed an
understanding of the topics, and her activities were highly successful. An example of one of
these activities was to use different symbols to represent text in binary, rather than using
the original black and white cards from CS Unplugged exercise. She had students create art
with hidden messages encoded in them, using koru6 patterns facing in different directions to
represent the two states needed to create binary numbers.
Programming was taught using the educational programming language Scratch.7 Stu-
dents used this in all their programming work. Angela and I had both previously observed
that when students were shown Scratch and told ‘just have a play and explore’, or given
similar instructions, they frequently did one of two things. Some would find this anxiety-
inducing as they did not know where to start and become paralysed with uncertainty. On
6 The Koru is a spiral shape which is an integral symbol in Maori culture, art, carving, and tattooing, andis a very well known symbol in NZ
7 scratch.mit.edu
96

the other hand, a large proportion of students had a very different reaction and created pro-
grams which Angela described as ‘Sprite-fests’. These programs tended to contain a small
number of short scripts, a small range of different block types, redundant blocks of code
which did not function at all, and contained large numbers of ‘Sprites’ (‘Sprite’ refers to a
character, or object in a Scratch program).
Students generally did not understand why the blocks they were using caused their
programs to behave the way they did and were more interested in making animations. A
common example of this type of program would be one containing ten different sprites where
one of these rapidly spun in a circle, a very exciting thing for a student to watch and have
created, but not something particularly instructive. When left to continue exploring without
guidance students commonly did not progress to using different blocks or trying new things.
Often once they had put together a block of code they were happy with they would reuse
this frequently and would not build on it further. While this did function as a creative
outlet for students, it was not building any programming or CT skills. This reflected what
Aivaloglou and Hermans (2016) would find in their future work analysing large data sets of
Scratch projects from the Scratch repository [2].
To combat this tendency an emphasis was put on teaching programming concepts with
Scratch, rather than teaching Scratch. Students were explicitly told that they were going to
be learning programming and programming with Scratch, and that while there was nothing
wrong with creating simple animations they were not going to focus on that during class
time. They were welcome to do this at any other time though and were encouraged to be
creative and experiment outside of the programming focused classes. A small number of
students had previously used Scratch, and some had used this extensively at home. Though
these students were more confident with using the Scratch interface they generally had no
more prior knowledge of programming practices than other students and were still prone to
‘Sprite-fest’ style programming.
Angela based the programming lessons on resources I wrote for her, and activities I
guided her through when teaching her. These resources and one-on-one tutorials covered
the programming concepts of inputs, outputs, sequences, variables, selection, and iteration.
As Angela came to better understand these concepts she also began searching for Scratch
teaching resources online and adapted many activities to create new lessons. It is worth
noting here that within two years of beginning to learn programming using Scratch Angela
felt she had truly grasped these programming concepts and, from my observations, this was
entirely accurate. She was confident in saying that she understood how to code.
97

The programming activities used covered a range of subject areas. Students worked on
programs that performed basic mathematics (such as multiplication and division), a number
guessing game, and drew geometric shapes. They did a project on the 2014 Winter Olympics,
incorporating literacy and geography, in which a character moved between countries, greeted
the user in the national language, and reported a fact about the country. Towards the end
of term 3, and during term 4, students were given a final project to create an interactive
quiz about a native New Zealand bird. Angela chose this as a project because it exercised
students programming and algorithmic thinking skills, and brought together several different
learning areas. Students had to: research a native NZ bird and collect facts about it, create
and draw a sprite for their chosen bird in Scratch, practice their literacy skills when writing
the quiz, and carefully consider the user of their program when they built it to ensure it was
usable. Implementing this fully required each of the programming concepts covered in class:
inputs, outputs, sequences, variables, selection, and iteration. Not all students successfully
completed this project, but all were able to implement sections of it with teacher assistance.
These projects were displayed to parents and whanau at a school open day.
7.5 Assessment Process
Five different methods were used to collect information about the effects of the study on
students and Angela. This information was collected to address the research questions listed
in section 7.2
Teacher’s professional opinion: Throughout the programme, I remained in close contact
with Angela via email and frequent meetings. During this time we discussed her
observations of the classes, students reactions to and engagement with the material,
her own experiences with the material, and her general opinions about including these
topics in her teaching program. I recorded these through note-taking and email records
between us. This information was collected to try to answer research questions 1
through 7.
Bebras challenge: Students took the 2014 Bebras challenge after they had been study-
ing the computing topics. This was done to gather information on students CT and
problem solving skills, to address research questions 4 and 7. I originally intended to
compare the results of this to results for the same year group in NZ, but I was unable
to do this, as no other students of the same age group took the challenge that year.
98

Binary numbers quiz: This was developed by Angela and me. It was designed to test
students’ basic understanding of the concepts covered by the Data Representation CS
Unplugged activities, to address research questions 3 and 7.
Scratch/programming quiz: This was developed by Angela and me. It was designed to
test students’ basic understanding of programming using Scratch, to address research
questions 3 and 7.
Survey of student attitudes: At the end of the school year, after all classes had taken
place, students were asked to complete an attitude survey. This asked if they enjoyed
the programming and data representation classes, their perceived ability in these sub-
jects, and opinions on working in programming and Computer Science in the future,
to address research questions 5, 6, and 7.
Google Forms8 was used to administer the two quizzes and attitude survey. This was
a choice made by Angela. She chose to do this as the school used Google Classroom9, she
used Google Forms and Google Classroom frequently for all topics she taught, and so her
students were familiar with using it.
Due to the logistical issues which tend to occur when dealing with large numbers of
participants in an unpredictable environment (such as a school), not all students completed
the Bebras challenge, each quiz, and the attitude survey.
As previously mentioned, Angela was also interviewed in 2016, as she had continued
teaching these topics, and had created many new lessons and projects based on her in-
creased knowledge. Although this interview was not a part of the pilot study, it will be
discussed in the results section of this chapter, as it provides many insights into Angela’s
initial experiences and the longer-term impact of this study.
7.5.1 In-class quizzes
To assess how much students had learnt from the programming and CS Unplugged lessons,
they completed two short quizzes that covered some basic programming and data represen-
tation concepts. Each of the quizzes administered was multi-choice and written by Angela.
8 https://www.google.com/forms/about/
9 https://edu.google.com/k-12-solutions/classroom/
99

She discussed the questions she had chosen with me, and I checked that the wording and
answers were technically correct.
Some examples of questions from the data representation quiz are: converting numbers
between binary and base-10, taking a set of binary numbers and converting these to letters
in order to read a message. It also included some of the more abstract concepts they had
discussed in class, such as the largest and smallest numbers you can represent, and which
whole numbers they could make, with a given number of bits. Some examples of questions
from the programming quiz are: what a variable is, the concepts of inputs and outputs to
programs and examples of these, and interpreting a short Scratch program to determine its
result. The full sets of questions and answers for these quizzes are listed in Appendix B.
7.5.2 Attitude survey
The questions in this survey were reviewed and approved by the University of Canterbury
Educational Research Human Ethics Committee.10 At the end of the year students were
asked to respond to the following statements on a 5-point Likert scale, from Strongly Disagree
to Strongly Agree:
Q1. “I enjoyed learning and using Scratch in class”
Q2. “I enjoyed learning about how data is represented with binary”
Q3. “I want to continue learning about Programming and Computer Science”
Q4. “I will consider working in Programming or Computer Science as a job”
Q5. “Before this year, I would have considered working in Programming or Computer
Science as a job”
Q6. “I am good at programming with Scratch”
Q7. “I am good at understanding and using binary numbers”
Students were also asked to enter their gender and select the ethnic groups that they be-
longed to. These questions were asked at the end of the quizzes once students had attempted
10 https://www.canterbury.ac.nz/study/ethics/educational-research-human-ethics-committee/
100

all questions, to lessen the risk of stereotype threat impacting students answers [58]. When
entering their gender the options given were ‘Female’, ‘Male’, ‘Other’, and ‘Prefer not to
answer’. When choosing which ethnicity options to include in the survey we selected the
options used by NZ Stats11 when conducting the NZ census, with the addition of ‘(Pakeha)’
to the ‘New Zealand European’ option. The options were ‘New Zealand European (Pakeha)’,
‘Maori’, ‘Samoan’, ‘Cook Island Maori’, ‘Tongan’, ‘Niuean’, ‘Chinese’, ‘Indian’, ‘Prefer not
to answer’, and an ‘Other’ option was given where students could type in other ethnic groups
they belonged to. Lastly, students provided their age.
Before analysis, entries where students had selected ‘Other’ for their ethnicity and entered
one, were reviewed and converted to the matching category from the NZ census options. For
example, the entry ‘French’ was replaced with ‘European’. All entries were successfully
matched.
Potential biases
Although students were asked to fill in their gender at the end of the survey, they were told
they would be asked about this at some point as Angela explained to them that there would
be an ‘other’ option in the gender question and why this was there. This was to discourage
students from simply choosing ‘other’ because they found it amusing, a risk with students
of this age. This meant that although students did not input their gender before they began
the survey, they were still made aware of it, which may have influenced their answers due to
stereotype threat.
7.6 Results
In total, data was collected from 599 students: 310 year 7s and 289 year 8s. However,there
was not a complete data set for each student. A complete set contained: scores for both
in-class quizzes, a score for the Bebras challenge, the students gender, the ethnic groups they
belonged to, their answers to the attitude survey, and their age. The majority of students
completed a subset of these. The year level for all students was collected. The amounts of
each type of data collected are shown in tables 7.1, 7.2, and 7.3.
In analysing the data from the Bebras challenge, the two in-class quizzes, and the attitude
survey I aimed to address the following five of the questions listed in section 7.2:
11 https://www.stats.govt.nz/
101

Data type Valid Data Missing DataGender 554 45Ethnicity 462 137Survey Response 473 126Bebras Score 226 373Binary Score 366 233Programming Score 375 224
Table 7.1: Amount of data collected for each measure
Female Male Other UnknownYear 7 140 141 1 28Year 8 131 138 3 17Total 271 279 4 45
Table 7.2: Numbers of students, by gender, in each year group
Maori/Pacifica Non Maori/Pacifica UnknownYear 7 48 169 93Year 8 52 192 45Total 100 361 138
Table 7.3: Numbers of Maori/Pacifica students per year group
102

3. Whether students in a typical classroom could be taught CS and programming con-
cepts, through their teachers use of CS Unplugged resources, and teaching of block-
based programming.
4. Whether students developed CT skills, and general problem solving skills, through this
process.
5. How students reacted to, and engaged with these lessons.
6. The degree to which students enjoyed the CS Unplugged and programming lessons,
how confident they were in their abilities in programming and the CS Unplugged topics,
and if they wanted to continue learning about them.
7. Whether these observations and results varied for students of different genders, or
different ethnicities.
7.6.1 Bebras
The data obtained from Bebras included students’ names, gender,12 and their final score.
Students marks for each individual question were not available. For a description of the
Bebras marking rubric see Chapter 6, section 6.4.1. The results of the Bebras challenge
followed a normal distribution, and are shown in Figure 7.1
When students’ scores were categorised according to their year level, gender, and whether
they identified as Maori/Pacifica, the scores were also normally distributed. These distribu-
tions are described in tables A.8, A.9, and A.10, in Appendix A.3.1.
An Independent samples T-test was performed to test for differences in students’ scores
for the groups: Female vs male students, for year 7 vs year 8 students, and for Maori/Pacifica
students vs non-Maori/Pacifica students. The results of these showed no statistically sig-
nificant differences between female and male students (p>0.05), between year 7 and year
8 students (p>0.05), or between Maori/Pacifica students and non-Maori/Pacifica students
(p>0.05).
12 The options provided by Bebras were ‘male’ and ‘female’
103

Figure 7.1: Distribution of students’ scores in the Bebras challenge.
7.6.2 Data representation Quiz
The distribution of student scores is shown in figure 7.2. Students’ scores divided by their
year level, gender, and whether they identified as Maori/Pacifica, were also normally dis-
tributed. These distributions are described in tables A.11, A.12, and A.13, in Appendix
A.3.1.
An independent samples T-test was performed to test for differences in students’ scores
for the groups: Female vs male students, for year 7 vs year 8 students, and for Maori/Pacifica
students vs non-Maori/Pacifica students. The results of these showed no statistically signif-
icant differences between female and male students (p>0.05), and between Maori/Pacifica
students and non-Maori/Pacifica students (p>0.05).
However, there was a statistically significant difference between the scores of students in
year 7 and those in year 8 (p<0.05). The effect size of this difference was 0.57, indicating the
year level had a medium effect on students’ scores. Surprisingly students in year 7 scored
higher than students in year 8. It would be expected that older students, who have spent
more time in school, would have higher scores than younger students. It is also unexpected
as this difference between year levels was not present within either of the other tests. One
104

Figure 7.2: Distribution of students’ scores in the Binary quiz.
possible explanation is the timing of school camps, as groups of students from different year
levels were away intermittently throughout the year, and more year 8 students than year
7’s may have been away and missed specific binary classes. Another is simply the timing
of lessons, as the time between doing these lessons, and doing the test, may have differed
between year groups, with year 8’s learning this content earlier in the year than year 7’s.
7.6.3 Programming Quiz
Before analysing the programming quiz results several changes were made to it. One question
was removed as it was unrelated to the lesson content (Angela taught the content it related
to separately and wanted an opportunity to assess it for report writing purposes). Questions
one and four were remarked as it was later deemed the wording in these was ambiguous
and so two of the possible answers could be considered correct. The distribution of student
scores is shown in figure 7.3
Students’ scores divided by their year level, gender, and whether they identified as
Maori/Pacifica, were also normally distributed. These distributions are described in tables
A.14, A.15, and A.16, in Appendix A.3.1.
105

Figure 7.3: Distribution of students’ scores in the Programming quiz.
An Independent samples T-test was performed to test for differences in students’ scores
for the groups: Female vs male students, for year 7 vs year 8 students, and for Maori/Pacifica
students vs non-Maori/Pacifica students. The results of these showed no statistically sig-
nificant differences between female and male students (p>0.05), between year 7 and year
8 students (p>0.05), or between Maori/Pacifica students and non-Maori/Pacifica students
(p>0.05).
7.6.4 Quiz comparisons
There were statistically significant correlations between students’ scores in each of the quizzes
and in the Bebras challenge. These correlations are shown in table 7.4. However,the corre-
lation between the Bebras scores and programming quiz scores did not hold across all sub
groups of students.
This correlation was only marginally significant for year 8 students (p=0.06), and for male
students (p=0.07). For Maori/Pacifica students the significance of a correlation between
these scores was far from the 0.05 level (p>0.5). As there was no significant difference
between Maori/Pacifica students, and non-Maori/Pacifica students’ scores in Bebras and
106

Bebras score Binary totalProg total Pearson Correlation 0.241 0.424
Sig. (2-tailed) 0.007 < 0.001N 125 329
Binary total Pearson Correlation 0.515 1 (N/A)Sig. (2-tailed) < 0.001N 131
Table 7.4: Pearson correlation between scores in each of the quizzes.
programming, this lack of correlation is unexpected. It is possibly due to the small number of
Maori/Pacifica students who completed both the Bebras and programming quizzes (N=18).
7.6.5 Attitude Survey
For analysing the results of the Attitude Survey, answers were coded with the values 1 - 5,
with 1 representing ‘Strongly disagree’ and 5 representing ‘Strongly agree’. For the sake of
brevity, in the following figures and discussions the questions will be referred to by either
their numbers only, or in the following way: Q1) Programming enjoyment, Q2) Data-rep
enjoyment, Q3) Continue learning, Q4) Consider a career, Q5) Prior career interest, Q6)
Programming confidence, Q7) Data-rep confidence. Figure 7.4 shows the answers students
gave to the survey.
Students generally had neutral to positive feelings about the programming and data
representation lessons, and their own levels of competence in these topics. Only 17.1% of
students stated they did not want to continue learning about these subjects.
While overall attitudes towards careers in programming and CS were generally negative,
the difference between students answers to Q5) and Q4) showed a change in students
attitudes towards these careers. As CS is one of many possible career paths it would be
unexpected, and undesirable, to have absolutely everyone pursue this path. The proportion
of students who were not interested in this career path is therefore not particularly surprising
or discouraging. Almost one quarter of students (24.3%) reported that they would consider
a career in this area. The number of students who disagreed, or strongly disagreed, with the
possibility of pursuing this career path decreased from 56.4% to 46.3% after learning about
these subjects.
A Spearman’s correlation test was used to determine the relationships between students
answers to each survey question. Unsurprisingly, there were significant positive correlations
107

Figure 7.4: Students’ answers to the attitude survey administered at the end of the study
between students’ answers. These ranged from weak (0.29) to strong (0.66), and are shown
in table 7.5. These correlations held for different year levels and genders, as shown in tables
A.18 and A.17, in Appendix A. These correlations held for Maori and Pacifica students,
except for one case: Q1) ‘Programming enjoyment’ and Q5) ‘Prior career interest’, this
correlation was only marginally significant (p < 0.10). These correlations are shown in table
A.19, in Appendix A.
Students who were confident in their skills with programming were more likely to enjoy
programming, and likewise for students who were confident in their understanding of binary,
and enjoyment of it. The more confident students were in one subject, the more likely they
were to be confident in the other, and enjoy each of them. Students who were more confident
and enjoyed the topics were more likely to want to continue learning CS and programming,
and more likely to consider working in it.
Differences between year groups, genders, and ethnicities
A Mann-Whitney test was used to investigate if there were significant differences between
the survey answers for different groups of students. This indicated that students’ answers
to the survey were not correlated with whether or not they were Maori/Pacifica (p>0.05
108

Questions Q2 Q3 Q4 Q5 Q6 Q7
Q1) Programming enjoyment 0.51 0.51 0.41 0.29 0.54 0.34
Q2) Data-rep enjoyment 0.48 0.45 0.39 0.41 0.55
Q3) Continue learning 0.48 0.60 0.42 0.40 0.40
Q4) Consider a career 0.45 0.60 0.66 0.42 0.38
Q5) Prior career interest 0.39 0.42 0.66 0.31 0.29
Q6) Programming confidence 0.41 0.40 0.42 0.31 0.44
Q7) Data-rep confidence 0.55 0.40 0.38 0.29 0.44
All correlations significant at the p < 0.001 level.
Table 7.5: Correlations between all students’ answers to the attitude survey questions.
for all questions). When comparing students in year 7 and year 8 the results of this test
showed no evidence of differences in questions 2, 4, 5, 6, and 7 (p>0.05). However,there was
a significant difference in students’ answers for Q1) ‘Programming enjoyment’ (p<0.05),
and Q3) ‘Continue learning’ (p<0.05). In both of these cases year 7 students were more
likely to answer positively. This indicates that they were more likely to enjoy programming
with Scratch, and more likely to want to continue learning about these topics. A possible
explanation for this is the older students may have been more likely to view Scratch as
something ‘childish’ and not suitable for their age group. While the effect of students year
level on these questions was statistically significant, they were small. The effect sizes were
0.255 for Q1), and 0.187 for Q3).
When comparing students of different genders, the results of the Mann-Whitney test
showed significant differences between female and male students’ answers to all survey ques-
tions (in all cases p<0.01). The distribution of female and male students’ responses is shown
in figure 7.5. The effect sizes of these differences ranged from 0.27 - 0.58. All but one of
these effect sizes (0.27, a small effect, for Q7)) indicate a medium effect of student’s gender
on their answers. The full table of effect sizes can be found in table A.20 in Appendix A.
Female students were more likely to answer negatively to all survey questions. This
indicates that they had lower confidence in their abilities, enjoyed the topics less, were less
likely to want to learn more, and less likely to consider working in CS and programming,
109

Figure 7.5: Students’ answers to the survey questions, divided by gender.
110

both before and after the course. This trend of girls’ and boys’ differing attitudes towards
these subjects has been well documented across a range of ages, countries, and education
systems. It appears the program of work conducted in this school was no exception to these
trends.
I further investigated these differences between genders and age groups. I compared
female to male students within year 7, and within year 8. I also compared year 7 and
8 female students to each other, and year 7 and 8 male students to each other. These
comparisons were again done using the Mann-Whitney test. The full results of these tests
can be found in tables A.21-A.24 in Appendix A. This revealed several statistically significant
differences between year groups, which differed from the results when comparing all female
and all male students, shown in A.20.
When comparing female year 7 students to female year 8 students, significant differences
were found in their answers to Q1) ‘Programming enjoyment’, and Q3) ‘Continue learning’.
Year 7 female students were more likely to answer positively to each of these questions. The
effect sizes of these differences were 0.31 and 0.3 respectively, indicating a small effect. In
contrast to this, there were no statistically significant differences between male year 7 and
year 8 students answers to any survey questions.
When comparing female year 7’s with male year 7’s, and comparing female year 8’s
with male year 8’s, there were statistically significant differences between female and male
students’ answers for questions 1, 3, 4, and 5. The effect sizes of these correlations were
calculated for each group, in order to compare the differences in the impact of gender in
the two different age groups. The full result of this can be found in Appendix A.3.2, tables
A.21 and A.22. For both age groups, gender had a small and very similar impact (0.34 and
0.37) on Q1) ‘Programming enjoyment’. For Q3) ‘Continue learning’, and Q4) ‘Consider
career’, gender had a medium effect on students’ answers in both age groups. However,in
both cases the effect size for year 8’s was larger (0.42 vs 0.59 for Q3), 0.49 vs 0.67 for Q4).
Their was also a difference of effect size for Q5) ‘Previously considered career’, between the
age groups, with Gender having a small impact on Q5) for year 7’s (0.38), and a medium
impact for year 8’s (0.65).
Opinion changes on working in CS and/or programming
Individual students’ answers to questions 4 and 5 of the survey were compared, to establish if
their opinion on working in programming or CS had changed over the course of the program.
111

Student group Negative change No change Positive changeAll 12.1% 55.9% 32.0%Year 7 10.7% 61.6% 27.2%Year 8 13.3% 50.8% 35.9%Female 11.9% 59.0% 29.1%Male 11.7% 52.7% 35.6%Maori/Pacifica 14.0% 54.0% 32.0%Other ethnicity 11.4% 56.9% 31.7%
Table 7.6: Opinion changes on working in CS and/or programming
The results of this for all students, and relevant subgroups, are shown in table 7.6. There
were no significant correlations between opinion changes and any of: gender, year group,
scores in any of the assessments, and Maori/Pacifica students (p>0.05 for all).
7.6.6 Comparing Survey Responses with Assessment Results
Students’ results in each assessment were compared to their answers to the survey, to investi-
gate the impact of their achievement in these areas on their opinions of CS and programming.
The results of this are shown in Appendix A, tables A.25 and A.26. The only questions that
had a statistically significant correlation with students’ quiz results were those on enjoyment
and confidence, but in each case these were relatively weak (ranging from 0.13- 0.19). No
significant correlation was found between the survey answers and students’ Bebras scores
(p>0.05).
Confidence and achievement
The relationships between student’s confidence in their abilities and their scores in the
assessments were also investigated with students divided by gender, and by ethnicity. The
full results of this are shown in tables A.27 and A.28 in Appendix A.
In all cases there was no significant correlation between students confidence and their
score in the Bebras challenge. For boys there was a weak-medium positive correlation be-
tween their level of confidence and their scores in the Binary and Programming quizzes.
However,for girls there was no significant correlation between their confidence and their
scores.
Similarly there was no significant correlation between achievement and confidence for
Maori/Pacifica students, but there was a correlation for non-Maori/Pacifica students. In
112

both cases this indicates that these groups generally had an inaccurate perception of their
abilities. These results are interesting as there was no correlation between gender and
scores, and no correlation between whether a student was Maori/Pacifica and with their
scores. There was also no significant correlation between whether or not a student was
Maori/Pacifica, and with their confidence.
7.7 Discussion
Before the course began, Angela had felt apprehensive and nervous about the classes but
found that after the first few weeks of lessons she had become more confident. Having one
teacher learn all the content and present it to students offered several benefits. It allowed
me to provide plenty of one-on-one professional development, react quickly to observations
Angela and I made about the material, and adapt the support I provided. It also meant that
Angela was teaching the same lesson to multiple classes each week, which quickly built her
confidence in how to deliver the content. It also allowed her to gain a deeper understanding
of the concepts she was teaching, and she stated that she gained a much better ‘big picture
idea’ of how the full course of lessons fitted together.
Throughout the year as her knowledge grew, she began having her own insights into the
topic, how it could be taught, and made connections to other subjects that my research
group and I had not previously thought of. This illustrates the significance of the skills
experienced teachers bring with them to new subject areas. There is a stereotype that
computing is an area ‘just for young people’. However, through this pilot study (and the
following studies) it was clear that the age of a teacher is not an automatic disadvantage,
and can be an advantage because of the wealth of knowledge and experience that they bring
to the subject.
Teaching this did, of course, require a huge amount of new learning for Angela. She told
me that the year had been a stressful and particularly demanding one, even though she had a
“massive amount of support” from her school, her principal, and me. This had the potential
to cause isolation from other staff, but Angela did not struggle greatly with this as she had
been teaching at the same school, and teaching a subject only she did, for many years. In
what would become a recurring theme throughout my research, she said time was the biggest
challenge she faced. It was not simply an issue of finding time to learn the content, but also
time to learn how to present it. It also presented challenges for assessment as, with over 600
students in total, individual evaluation of students was not possible without some form of
113

standardised testing.
Despite this, Angela said it had still been a positive experience for her and her students,
and she was happy that she took on the challenge. At the end of 2016, after she had been
teaching this for three years I asked her “If you could go back to the beginning before you
started this, would you still do it?”. Her answer was a definite yes, and she felt she had been
“lucky to be able to do this”.
7.7.1 Aims of the programme
At the beginning of the year, Angela and I had agreed upon the aims (listed in section 7.2)
of running this programme and were pleased to find at the end of the year that we had
achieved all of these.
Students had enjoyed, and been engaged with both the CS and programming content
throughout the year, and Angela believed that each student had been able to achieve some-
thing, no matter how small or large, in her classes. The students who had excelled with
the material had been directed to extension resources, and Angela felt she had been able
to encourage and support them, without having to take extra time away from the students
who required more help. Students had been collaborative and shared their learning with
others when they needed assistance, particularly with the programming material, and the
extension students were often involved in teaching and supporting others. Many students
had also gone home and shared their learning with their families, teaching their parents and
caregivers binary and performing the parity magic trick. Students who worked on program-
ming at home or at lunchtime would ask their friends to play the games they had created,
and try to improve each other’s games. Angela was able to use the assessment results,
and her general observations in class, to give a general indication of students achievement
throughout the year in their end-of-year reports.
7.7.2 Gender differences
High engagement and enthusiasm from students was observed from very early in the pro-
gramme, and this also came out in the attitude survey. When initially asked about whether
all students or only some groups of students displayed this interest, Angela stated she did
not observe any difference across different ethnic groups but did see some difference between
girls and boys. It was observed that in the early stages of the course several girls seemed to
take longer than the boys to display enthusiasm for, and understanding of the concepts.
114

However, as time went on Angela observed another difference between this specific group
of girls, who took longer to complete some activities, and the rest of the students. They
seemed to require more encouragement when confronted with this new content, were anxious
about starting the activities in case they did something wrong, and were less willing than
other students (particularly the boys) to take risks. They were also less persistent. Their
struggles weren’t because they found the content more difficult than other students did.
The cause instead appeared to be their fear of failure. This ‘fear of failure’, and tendency
to avoid taking risks has been documented as more common for both girls and women, in
a variety of areas, and specifically in computing [123]. It is also strongly associated with
perfectionism, and observations similar to this were made by many teachers throughout the
following studies.
An example of this behaviour is how these girls responded when given the ‘Run-length
encoding’ activity to complete. This activity involved using an algorithm to interpret a set
of numbers, which told students which particular squares on a grid they needed to colour in.
When this was done correctly the squares formed an image. While the majority of students
grasped the concept of the activity and were able to complete all of the problems on the
activity sheet, some of the girls seemed to struggle and completed only one or two of the
images. This was not a reflection on their understanding of the task though. It was observed
that they made less progress than the other students as they became hyper-focused on filling
in each square completely, so that no white paper would show through, before they moved
on to the next square. This behaviour persisted even after the teacher and I told them
multiple times that this was unnecessary, not the point of the exercise, and a waste of their
class time. From my perspective, they had less self-confidence in their performance at the
end of the class than the rest of their classmates. The significant differences between girls
and boys answers to the attitude survey, combined with the lack of difference in their test
scores, back up these observations. It was not ability levels that set the girls and boys apart,
but social and personal influences.
However, Angela’s observations about gender differences changed over the following years.
As highlighted in Chapter 2, changing these differing attitudes and experiences of the subject
between students of different genders is one of the goals of introducing these topics to primary
school. From the interview I conducted with Angela in 2016, it seems that this effect may
have been achieved. In the interview I tasked about these observations she had made, and
whether had persisted or changed. She answered that when it came to interest and aptitude
in the subject.
115

“It was probably 50/50 really. If I think of the ‘extension’ programmers, there
would be as many girls as boys... I don’t see really any difference between the boys
and the girls”.
This was a very interesting and encouraging result.
7.7.3 Teaching methods
Angela’s experiences provided insights into the ways these materials can be taught and
used, both by themselves and alongside other subjects. She felt that for the course to be
more successful the lessons needed to be reinforced more. She suggested doing multiple small
projects as students progress through the material, exercising the same skills frequently with
slightly different material e.g. using different numbers, words, or mathematical functions.
7.7.4 Data Representation
Angela found that students were “hugely engaged” by the data representation material,
and their excitement was particularly apparent when students began asking “What are we
doing next week?”, at the end of every class. She felt that the students had developed an
understanding of the binary number system, how binary digits can be used to represent
different types of information, and the more abstract concept that computers represent all
data in digital form.
She experimented with using more than ones and zeroes to represent binary numbers,
and had students decode ‘secret messages’ written using different shapes (such as clubs and
spades), Maori words, and koru patterns. This reinforced the learning and helped students
understand that the concept was not just about numbers or zeroes and ones, but it was
about using two states (or objects) to represent information.
Students were also very interested in the error detection and correction material. Initially,
Angela felt this was just because of the activity was presented as an exciting magic trick.
However, as time went on most students were able to connect this concept to parts of their
everyday lives. They understood some of the importance of this process to how digital
devices in the world around them worked.
116

7.7.5 Programming
With specific regard to Scratch, Angela wanted to incorporate more play and directed ex-
ploration into the initial lessons when students were first introduced to the language. She
felt this would help all students build some confidence in using Scratch, and become more
comfortable with the interface and program itself. This would be helpful for students to
have before they moved into the programming concepts themselves. In almost every class
there were a small number of students (typically 1-3) who had previously used Scratch out-
side of school. These students were, unsurprisingly, much more confident than others and
more enthusiastic than most. Although many of these students had used Scratch as more
of an animation tool and did not have more specific programming knowledge than others,
their familiarity with the language was beneficial. The majority of these students were boys.
This illustrates again the impact and importance of prior experience with these subjects,
and particularly with programming environments. In some cases, these students became
‘classroom helpers’ and assisted other students. This behaviour will be discussed in Chapter
8, as it came up frequently in the interviews conducted with other teachers, as well as with
Angela.
Angela found that incorporating maths and geometry with programming was highly
successful. For example, when students were working on drawing shapes in Scratch by using
the pen mode and moving a sprite around the screen, they needed to use specific angles
when drawing regular polygons. They began asking more about geometry and became
more engaged in their maths lessons on the topic. Their motivation and engagement in
programming transferred to the maths curriculum because they wanted to understand how
to do different things in Scratch. Because of this she progressively used Scratch more and
more when teaching maths in the following two years.
Towards the end of the year, Angela gave students a Scratch programming project to
complete. They were tasked with creating a quiz about a native New Zealand bird. Angela
decided on this project as creating a quiz would require students to understand and apply
a wide range of core programming skills: sequential thinking; using input and output com-
mands; variables; conditional statements; and loops. It also required students to think about
the user experience and was a cross-curricular activity. It incorporated: art and design, with
students creating their own sprites in Scratch; literacy, with students writing their questions
and answers; and inquiry learning, as students researched NZ’s endangered native birds.
While this would have been a good way to assess students learning, it was not possible to do
117

this for individuals due to the vast number of students taught, and the time it would take
to assess each project.
The amount of success students had, and the progress they made through the task, varied
greatly. Some students continued to add new features to their projects long after they had
satisfied the requirements, and others struggled to get more than a few questions working in
their quiz. However, Angela said that every single student was able to achieve and produce
something, and she felt very happy with their results. Many of these projects were then
presented by the students at a school open day, for their whanau and visitors to see.
7.8 Conclusion
Working with Angela provided a solid foundation to build my future research on. Together
we had found that despite being brand new to these topics, she was able to effectively
integrate these into her classroom in a way that was beneficial for students learning. Our
goals for the programme had been achieved, with students being highly engaged, and able
to learn the content covered. The main outcomes of this pilot study were:
• My understanding of how a teacher could be supported to integrate this material had
increased, and we found that the materials used could be successful in an intermediate
school environment.
• As expected based on prior research the CS Unplugged activities were suitable for this
age level. Students were highly engaged by, and successful with the content.
• From our assessments and Angela’s observations, it appeared there was no significant
difference between the achievement of students of different genders or ethnicities.
• Thorough measurement of students’ learning was, as expected, difficult, as a scalable
strategy for doing this had not yet been found.
• There were significant differences in girls and boys attitudes towards programming and
CS, with girls reporting lower enjoyment and interest in the area.
After the success of this programme, I wished to investigate whether this could be emu-
lated in different school environments, with a range of teachers and age groups of students.
How to support larger numbers of teachers was also a subject of interest, as implementing
118

this subject in the national primary curriculum would create a need for large scale training
and resourcing for teachers. When examining different age groups of students I wished to
investigate whether the material could be made suitable, engaging, and would be beneficial
for all ages; and if the differences between girls and boys attitudes to CS and programming
changed across year levels. These topics are explored in the next chapter, through the work
undertaken with a larger group of NZ primary teachers.
119

Chapter VIII
Open Teachers Study
After working with Angela and seeing the success she had teaching data representation,
programming, and algorithms, I investigated whether these observations held across different
environments. To do this I began working with a larger group of teachers in 2015. I intended
to conduct a one year study with this group. However, during this year the demand for
professional development (PD) in this area for primary school teachers rapidly increased.
More primary schools were recognising the need for this content and learning that it would
be added to the curriculum soon. This resulted in the UC Computer Science Education
Research Group rapidly expanding our teacher support and PD efforts. Through this, more
teachers heard about my research and asked to participate in it. Because of this, I chose to
extend this study to the end of 2016, and by the time it ended I had worked with 40 teachers
at 25 different schools, and students ranging from 3 to 13 years old. This chapter covers the
work done over these two years.
In this chapter I will cover how this study was conducted, the research questions I aimed
to answer, how I collected information from teachers throughout their time teaching CS and
programming, and how this qualitative data was analysed. The motivations and experiences
of the participating teachers, the specific lessons which were taught, and the Computer
Science concepts these covered are described. I then discuss each of the key themes which
were identified through teachers feedback and interviews: Computational Thinking, The
Key Competencies, problem solving, Cross-curricular Learning and Learning Transfer, and
Impacts on Students. I conclude by addressing my original research questions for this study
and identifying the main area of focus for my final study.
8.1 Overview
This project aimed to further gather information on the impacts of integrating Computer
Science, Programming, and Computational Thinking material into primary school class-
120

rooms, on students and teachers. Participants were trained in teaching CS and CT through
CS Unplugged, programming Unplugged, programming using block-based based languages
(e.g. Scratch and Scratch Junior), and programming floor robots (e.g. Bee-Bots). This
was done through the ‘Computer Science for Primary Schools’ (CS4PS) workshops and in
some cases one-on-one support from myself and another member of the CSERG, Wendy.1
Wendy is a primary school teacher, who participated in this study by submitting feedback
on lessons she conducted. During the time she participated, she also joined the CSERG
and became a core contributor to resource development and teacher training. Along with
conducting lessons and submitting feedback on these, she worked to support five of the other
participants in this study and served as a mentor to many of the teachers she worked with.
A variety of recruitment methods were used, primarily advertising at CS4PS workshops
and other professional development events in Canterbury. Information about the study
and invitations to participate were posted on the Facebook Group ‘NZ Teachers (primary)’.
Primary schools and teachers we had existing relationships with were also invited to join, and
several teachers contacted us directly after hearing about the study from their colleagues.
Teachers who participated were asked to provide feedback on the lessons they used in
class via an online form. As the study progressed, I decided to extend my data collection
and gather more information on the teachers involved. I asked participants to fill out a
survey about their motivations for teaching this content, participating in the programme,
their prior experience with this material, and their personal feelings about the programme.
At the end of 2016, I conducted interviews with 18 of the participants. These each ranged
from approximately 30 to 75 minutes in length
Recruitment began in mid-2015 and continued through to the end of 2016. Teachers were
able to join or withdraw from the study at any time. Because of this, the amount of time
people participated varied for each individual. Several participants continued teaching and
providing feedback throughout the entire project, but the majority participated in either
2015 or 2016, not in both years. Angela (the teacher I worked with in the 2014 Pilot study)
also participated in this study.
While carrying out this study, I was also taking part in national discussions and working
groups focused on changing the NZ Digital Technologies curriculum. Consequently, I was
aware of the planned extension of DT into the primary school curriculum and was able to
contribute to the draft versions of this. These plans and the contents of the draft curriculum
1 Name has been changed
121

went through many iterations and changes over this time. These changes, and my role in the
curriculum drafting, continually influenced the work I did with teachers during this study.
In turn, this work with teachers also influenced my contributions to the curriculum changes.
This meant the specific content I taught participants, and the resources I asked them to
trial, shifted over time. As many of the teachers involved were also aware of the planned
changes in the curriculum, this influenced their own goals and motivations for teaching this
material.
8.1.1 Research Questions
The research questions I aimed to answer in this study were:
1. Can Computer Science and Computational Thinking skills be taught in a typical pri-
mary school environment? (RQ1)
2. How suitable are the teaching resources that were chosen for use? (supports RQ 1.2
and 1.3)
3. Can learning Computer Science and programming develop, or improve, Computational
Thinking skills for the majority of students? (RQ2)
4. Can learning Computer Science and programming, and developing Computational
Thinking skills, have an impact on problem solving skills or general learning, for the
majority of students? (RQ3)
5. What other impacts can learning Computer Science and programming, and developing
Computational Thinking skills have on students? (RQ4)
Additionally I intended to further explore how teachers could be supported to integrate
these topics into their classroom programme; and use teacher feedback to assess the teaching
resources provided.
8.2 Method
Information on the resources and training used for this study can be found in Chapter 6,
section 6.3.
122

Data type Number of respondentsFeedback form 33Interviews 18Motivation survey 31All three 14
Table 8.1: Number of participants that data was collected from.
8.2.1 Data collection
In total 40 people participated in this study at some point through 2015-2016. The number
of teachers that each category of data was collected from is shown in Table 8.1.
Of the 40 participants: 10 completed only the motivation survey and then did not con-
tinue to participate, 5 completed the feedback form only, 7 completed the survey and feed-
back form only, 4 were interviewed and completed the feedback form, and 14 were inter-
viewed, completed the survey, and completed the feedback form. The methods of data
collection are further described in the following sections.
Motivation survey
From June 2016 onwards, all participants were asked to complete a survey about their
motivations for joining the study, teaching this material, and their previous experience with
these subjects. They were also asked about their personal feelings about teaching this
content, what age group they fell into, and approximately how long they had been teaching.
This survey was sent to all teachers who were participating at the time, and to those who
were recruited later in the year.
The survey contained the following questions:
1. Why are/were you interested in being part of this programme?
2. Do you have previous experience with teaching programming or Computer Science?
Select onefrom:
• Yes —Have taught one or both of these as part of my programme.
• Some —Have taught one-off lessons with one or both of these subjects.
• None —These subjects and teaching them are new to me.
3. Please enter some words that describe how you feel about being a part of this pro-
gramme and teaching Computer Science and programming (e.g. excited, anxious,
123

motivated)
4. In your own words, what you are hoping to get out of this programme?
5. What kind of ongoing support would you like, to make this programme successful for
you?
6. What is your age? Select one from:
• Under 25
• 25-34
• 35-44
• 45-54
• 55-64
• 65+
7. How long have you been teaching? Select one from:
• Less than 2 years
• 2-4 years
• 5-9 years
• 10-14 years
• 15-24 years
• 25+ years
Feedback Form
Participants were given a link to an online feedback form to fill out about each of the lessons
they conducted. It was available throughout the two year study. Participants were asked
to provide their name, the school they conducted the lessons at, and the year group of
the students they taught. This allowed feedback for each separate participant and school
to be collated, and the results for different year groups could be compared. Occasionally
the feedback entries referred to after-school clubs, extension classes, or classes of specifically
selected students, rather than a general classroom. These differences were taken into account
during analysis. Completing the form was voluntary and participants were given an incentive
to do this; each time they filled out the form 5 times they were sent a $5 coffee voucher.
Participants were asked to complete the following questions. The question text is writ-
ten in bold, text in italics refers to the ‘help’ text provided for some questions, and the
unformatted text describes the type of question, e.g. multi-choice, text entry.
124

1. What did you do/teach? Text entry. 1-2 sentences is enough, e.g. “Taught ‘if ’
and ‘if, else’ statements in Scratch; students used these to make yes/no questions”, or
“Taught binary numbers using cards with 1, 2, 4... dots”
2. How confident did you feel while teaching this topic? Select one from:
• Very unconfident
• Moderately unconfident
• Moderately confident
• Very confident
3. How challenging/engaging do you think students found it? Select one from:
• Far too easy
• A little too easy
• A good challenge level
• A little difficult/frustrating
• Far too difficult/frustrating
4. Which concept(s) was the lesson intending to cover? Multiple-choice, select
all that apply. The most common “Visual Programming Language” is Scratch
• Algorithms: What an algorithm is
• Algorithms: Following step-by-step instructions (following an algorithm)
• Algorithms: Creating step-by-step instructions (decomposing problems into steps)
• Algorithms: Test instructions and correct them (explain and/or correct steps in
an algorithm)
• Algorithms: Describe and/or demonstrate two different algorithms for the same
problem
• Algorithms: Compare two different algorithms for the same problem (which is
faster/better for a specific problem)
• Programming: Understand and give step-by-step sequenced instructions (e.g.
Turtle instructions, Beebots)
• Programming: Using a visual programming language to make a simple sequenced
program
• Programming: Using a visual programming language to make a program that
includes simple iteration (repetition)
125

• Programming: Using a visual programming language to make a program that
includes selection and iteration
• Programming: Using a visual programming language to make a program that
includes user input, output, and variables
• Programming: Using a visual programming language to make a program using
different data types
• Data representation: Using two different symbols (i.e. binary numbers) to repre-
sent information, such as integers and letters.
• Data representation: Binary representations of numeric values
• Data representation: Binary representations of text
• Data representation: Binary representations of images
• Data representation: Binary representations of sound
• Other: Please describe
5. Which concepts do you think the students understood well in the lesson?
Text entry, optional question.
6. Which concepts do you think the students struggled with in the lesson?
Text entry, optional question.
7. Please enter any other comments or observations you have. Text entry, op-
tional question. For example: How would you rate the quality of the work students
produced during the lesson? Would you do this class again? Did you have any “aha”
moments? Do you have any questions about the content the lesson was intended to
cover?
Data collection limitations
I was unable to regularly visit the majority of schools, and this, along with primary school
teachers’ generally high workload, made maintaining regular contact difficult. I had intended
on having students complete short pre and post-tests based on Bebras questions. However,
this became logistically challenging, due to the large number of participants, some of whom
were teaching multiple groups of students, and by new participants joining at different times.
After the majority of participants did not have their students complete the pre-test, or began
teaching before conducting it, I choose not to proceed with a post-test.
126

I had also intended to collect information on students’ Reading, Writing, and Maths
National Standards results at the beginning and end of the time their teacher spent as part
of this study. However, as the majority of teachers confronted administrative challenges in
obtaining this information from their schools, and the very low proportion of students who
returned permission slips for collecting this information (approximately less than 10%), this
effort was abandoned.
8.2.2 Interviews and qualitative analysis
The process of interviewing participants, and the qualitative analysis process used for the
interview transcripts and feedback form, are described in Chapter 6, section 6.4.2.
Computational Thinking Coding
I took a deductive approach in my analysis when examining CT skills. The CT skills coded
in this analysis were the concepts and approaches from the Barefoot Computing definition of
CT. The concepts were Abstraction, Algorithms and Algorithmic Thinking, Decomposition,
Evaluation, Logic, and Patterns and Generalisation. The approaches were Collaborating,
Creating, Debugging, Persevering, and Tinkering. Here I will describe each of these concepts
and approaches and the criteria used for tagging sections of text with these codes. These are
based on the descriptions and examples of each concept in the CAS Computational Thinking
Guide for Teachers [49], and the descriptions and examples of each concept and approach
on the Barefoot Computing website [11].
Abstraction
“Abstraction makes problems or systems easier to think about. Abstraction is the process of
making an artefact more understandable through reducing the unnecessary detail... The skill
in abstraction is in choosing the right detail to hide so that the problem becomes easier, with-
out losing anything that is important. A key part of it is in choosing a good representation
of a system. Different representations make different things easy to do.” [49]
The criteria used for tagging teachers’ comments as showing evidence of Abstraction were:
• Identifying which elements of a problem or situation are important and discounting
unnecessary detail.
127

• Choosing a way to represent something which simplifies it, i.e. create an abstraction
of it.
• Programming a simulation of a real-world system.
Algorithms and Algorithmic Thinking
“Algorithmic thinking is a way of getting to a solution through a clear definition of the steps.
Some problems are one-off; they are solved, solutions are applied, and the next one is tackled.
Algorithmic thinking needs to kick in when similar problems have to be solved over and over
again. They do not have to be thought through anew every time. A solution that works every
time is needed.
Learning algorithms for doing multiplication or division at school is an example. Algo-
rithmic thinking is the ability to think in terms of sequences and rules as a way of solving
problems or understanding situations. It is a core skill that pupils develop when they learn
to write their own computer programs.”[49]
The criteria used for tagging teachers’ comments as showing evidence of Algorithms were:
• Creating and writing instructions for turtle-style movement, e.g. KidBots or Beebots.
• Demonstrating and following algorithms, e.g. counting in binary, converting numbers
or text into binary, performing the parity trick, and sorting and searching algorithms.
• Planning, creating, and writing programs, e.g. using ScratchJr or Scratch. This re-
quired evidence that students were coming up with an algorithm for the program to
follow, rather than just evidence of programming by following pre-written instructions
or exploring with no particular focus or goal.
• Learning about, and then demonstrating understanding of the general concept of al-
gorithms, what they are, why they are important etc.
• Descriptions of students approaching problems by breaking them down into a set of
sequential steps and following these.
• Descriptions of students debugging systematically by checking if they have imple-
mented or carried out an algorithm correctly, or if their algorithm does what they
expect it too.
Decomposition
“Decomposition is a way of thinking about artefacts in terms of their component parts. The
parts can then be understood, solved, developed and evaluated separately. This makes complex
128

problems easier to solve, novel situations better understood and large systems easier to design.
For example, making breakfast can be broken down, or decomposed, into separate activities
such as make toast; make tea; boil egg; etc. Each of these, in turn, might also be broken down
into a set of steps. Through decomposition of the original task each part can be developed and
integrated later in the process. Consider developing a game: different people can design and
create the different levels independently, provided that key aspects are agreed in advance. A
simple arcade level might also be decomposed into several parts, such as the life-like motion of
a character, scrolling the background and setting the rules about how characters interact.”[49]
The criteria used for tagging teachers’ comments as showing evidence of Decomposition were:
• Creating and writing instructions for turtle-style movement, e.g. KidBots or Beebots.
• Planning, creating, and writing programs, e.g. using ScratchJr or Scratch.
• Any descriptions of students breaking problems, instructions, or sequences down into
smaller steps, or smaller problems.
• Descriptions of students being able to see, and understand, how problems or sequences
have been broken down into smaller parts, and why.
• Descriptions of students debugging programs or algorithms when they include students
stepping through the algorithm or program and examining each step one-by-one.
Evaluation
“Evaluation is the process of ensuring that a solution, whether an algorithm, system, or
process, is a good one: that it is fit for purpose. Various properties of solutions need to be
evaluated. Are they correct? Are they fast enough? Do they use resources economically? Are
they easy for people to use? Do they promote an appropriate experience? Trade-offs need to
be made, as there is rarely a single ideal solution for all situations. There is a specific and
often extreme focus on attention to detail in evaluation based on computational thinking...
Criteria, heuristics and user needs enable judgements to be made systematically and rigor-
ously.”[49]
The criteria used for tagging teachers’ comments as showing evidence of Evaluation were:
• Students giving, receiving, or acting on feedback when creating digital artefacts, pro-
grams, or an algorithm to solve a problem.
• Students testing and improving their work when creating programs, or an algorithm
to solve a problem.
129

• Students identifying that their program had not performed the way they expected it
too, or didn’t meet the required criteria.
• Students comparing different algorithms or solutions and identifying which was the
best for the given situation.
• Learning about, and displaying understanding of, comparing algorithms based on their
efficiency and suitability for different situations.
• Evaluating if a solution (program or algorithm) is fit for purpose, e.g. does it meet the
users needs? Could it be improved? Does it meet the design criteria?
• Making judgements in an objective and systematic way when creating algorithms and
digital artefacts.
Logic
”Logical reasoning enables pupils to make sense of things by analysing and checking facts
through thinking clearly and precisely. It allows pupils to draw on their own knowledge
and internal models to make and verify predictions and to draw conclusions. It is used
extensively by pupils when they test, debug, and correct algorithms. Logical reasoning is the
novel application of the other computational thinking concepts to solve problems...
Logical reasoning is key in allowing pupils to debug their code. They can work with peers
to evaluate each other’s code, to isolate bugs, and to suggest fixes. During this process, they
may have opportunities to employ abstraction, evaluation, and algorithmic design. The novel
use in correcting mistakes in code requires logical reasoning.”[49]
The criteria used for tagging teachers’ comments as showing evidence of Logic were:
• Creating and writing instructions for turtle-style movement, e.g. KidBots and Beebots,
as this requires predicting where the ‘bot’ will move as it carries out the instructions.
• Identifying, locating, and fixing bugs in programs and instructions, unless the descrip-
tion says students debugging method was random and not thought out.
• Descriptions of students developing or displaying logical reasoning, or logical thinking.
• Developing new knowledge from experimenting and testing things.
• Tracing the steps of an algorithm or program and predicting what it will do.
• Students saying phrases such as “If I do this then it will make this happen” and “If
this part is right then it means this part must be wrong”.
• Identifying patterns and rules in how things work, and using these to make predictions
e.g. “They were very quick to discover the patterns, predicting the next card”.
130

Patterns and Generalisation
Generalisation is associated with identifying patterns, similarities and connections, and ex-
ploiting those features. It is a way of quickly solving new problems based on previous solutions
to problems, and building on prior experience. Asking questions such as ‘Is this similar to a
problem I’ve already solved?’ and ‘How is it different?’ are important here, as is the process
of recognising patterns both in the data being used and the processes/strategies being used.
Algorithms that solve some specific problems can be adapted to solve a whole class of similar
problems. Then whenever a problem of that class is encountered, the general solution can be
applied.[49]
The criteria used for tagging teachers’ comments as showing evidence of Patterns and Gen-
eralisation were:
• Students recognising, understanding, or using patterns.
• Students applying a solution, pattern, or method they had used in one situation to a
new situation/context.
• Students recognising when a problem was similar to one they had previously solved,
and using strategies from this past problem to approach the new one.
Collaborating
“Collaborating means working with others and it frequently achieves the best results. Teach-
ers plan together and observe one another to develop good practice. Collaboration motivates
us to persevere with tasks which might otherwise seem too confusing or difficult. Computer
scientists and software engineers often draw on or improve upon others’ work and coding,
and this is facilitated greatly in open-source software.”[11]
The criteria used for tagging teachers’ comments as showing evidence of Collaborating were:
• Students working together to create a program, write an algorithm, solve a problem,
or achieve a goal.
• Pair programming.
• Students teaching each other or asking their peers for help.
• Students listening to each other, considering others ideas and feelings, and taking
turns.
• Descriptions of students social and leadership skills improving.
131

• Descriptions of teamwork and students valuing teamwork.
• Students recognising each others different strengths and working to support each other.
Creating
“Creating is about planning and making things. Some endeavours involve various media
each providing an outlet for creative expression. Software and digital media allow scope
for creativity and, by mastering software tools and digital devices, we develop confidence,
competence and independence which we can use playfully, experimentally and purposefully
in the expression of our ideas and insights.
Programming is itself a creative process. We have ideas about what we’d like to make
or solve, analyse the problem, design, write and debug the requisite code and evaluate what
we’ve created.”[11]
The criteria used for tagging teachers’ comments as showing evidence of Creating were:
• Creating digital artefacts such as programs, games, artwork, or animations.
• Creating physical artefacts involving computational knowledge or concepts, e.g. binary
art.
• Planning, designing, and creating something to meet requirements or solve a specific
problem.
• Descriptions of students displaying and developing creative thinking skills.
• Working on creative projects that also involved algorithmic thinking e.g. creating a
maze and navigating a Beebot around it, creating a set of instructions for a dance or
for telling a story.
Debugging
“Bugs are errors in algorithms and code. Debugging is the process of finding and fixing these
and it can often take much longer than writing the code in the first place. There can be
errors in logic and syntax. We can think of errors in logic as parts of a story where the
plot doesn’t make sense, and errors in coding and syntax as poor spelling, punctuation and
grammar. When debugging, it can be useful to display the contents of any variables in our
program, to help us understand what’s going on as it runs.”[11]
The criteria used for tagging teacher’s comments as showing evidence of Debugging were:
• Identifying and fixing bugs in programs.
132

• Identifying when something has gone wrong while carrying out a given algorithm, and
determining why this happened, e.g. why the output from using the sorting network
was not in sorted order.
• Identifying if a problem that has occurred was due to their thinking and the algorithm
used, or if it was due to an implementation error e.g. implementation problem in their
code, or a student did not follow the instructions given to them in the KidBots activity
correctly.
Persevering
“Persevering is being determined, resilient, tenacious – never giving up... Computer pro-
gramming is hard. This is part of its appeal – writing elegant and effective code is an in-
tellectual challenge requiring not only an understanding of the ideas of the algorithms being
coded and of the programming language you’re working in, but also a willingness to persevere
with something that’s often quite difficult and sometimes very frustrating.”[11]
The criteria used for tagging teacher’s comments as showing evidence of Persevering were:
• Teachers stating that their students demonstrated persistence, or their usual persis-
tence levels improved.
• Teachers describing students displaying patience, not giving up when they were working
on problems, or working hard even when things took a long time.
• Students displaying motivation and tenacity, taking initiative, and directing their own
learning.
• Students adopting a growth mindset. This did not include cases were teachers stated
their students already generally displayed growth mindsets before starting this mate-
rial.
Tinkering
“We often try out something new to discover what it does and how it works: this is tinkering.
It;s closely associated with logical reasoning. Pupils build up experiences of cause and effect:
‘If I move this, then this happens.’ It’s a big part of independent learning, without your
lead. For young children, it’s the vital play-based experimentation phase, full of questions
and surprises. Ideas which seem wrong can be tried, just to see what happens.
For older individuals, tinkering is more-purposeful exploration and making, often through
trial and improvement. It helps us to see our use of technology as being about developing
133

our own understanding, rather than getting a ‘right’ answer; we may be able to do things in
many ways.”[11]
The criteria used for tagging teacher’s comments as showing evidence of Tinkering were:
• Playing, e.g. creating ScratchJr programs for fun, or playing with Bee-Bots.
• Not being afraid to try things out and find out what happens.
• Students explicitly using trial and error.
• All cases where teachers described having their students play with something, rather
than giving specific tasks.
8.3 Results and Discussion
Motivation survey
In total 31 participants completed the motivation survey. The response from one partic-
ipant was discarded as they had only answered one question and did not further participate
in the study, leaving 30 useable responses. 21 of the participants who completed the survey
continued to take part in the study. Of the remaining nine participants, seven informed me
soon after completing the survey that, due to external factors, they would no longer be able
to participate in the study, or would instead be supporting a fellow teacher who was partic-
ipating. The other two participants who did not make further submissions did not officially
withdraw from the study, but their responses in the survey made it clear they were highly
anxious about taking part. Their responses to the motivation survey are further discussed
in section 8.3.2.
Feedback form
In total 137 unique feedback entries were submitted, by 33 teachers from 25 different
schools. This included one ‘virtual school’, where the class was taught online and was made
up of a small group of students from several different schools. A small number of entries
did not contain feedback on lessons. Instead, the respondent entered other information they
thought would be of interest, such as notes about misconceptions they had when preparing
for lessons. These insights were useful, but these entries were not included in the analysis of
the feedback. Some responses covered several lessons that took place over multiple days. In
these cases, they were divided into separate entries. Responses that focused on topics that
134

were not relevant to CS, programming, or CT, such as lessons about using computers, were
discarded. The useable feedback data came from 32 teachers, and amassed to 112 entries
for general classroom environments, 18 for non-typical environments or target groups of stu-
dents, and one for a workshop which was conducted with students from multiple schools.
Interviews
18 teachers were interviewed at the end of 2016. The core themes from the thematic
analysis of the interviews and feedback entries were:
• Computational Thinking skills
• problem solving
• Key Competencies
• Cross-curricular learning and learning transfer
• Individual student impacts
These themes, the lessons covered, and information on the participants and their schools,
are discussed in this section.
8.3.1 School information
This study included Public (State), State-integrated, and Private schools. The decile ratings
of the schools involved were obtained from the Ministry of Education website, where the
deciles of all NZ schools are publicly available The distribution of school deciles, and the
categories of schools are shown in Tables 8.2 and 8.3. This studied covered a range of deciles;
however, as by definition each decile represents 10% of NZ schools, decile 10 schools were
particularly over-represented in this study.
In both 2015 and 2016 approximately 83.1% of NZ schools were State schools, 13.1% were
State-integrated, and 3.4% were Private.2 With 9.5% of schools in this study being Private,
and 9.5% being State-integrated, these two types of schools were over and under-represented,
respectively.
2 https://www.educationcounts.govt.nz/statistics/schooling/number-of-schools
135

Decile Number of Schools Percentage
1 0 0%
2 0 0%
3 2 9.5%
4 1 4.8%
5 2 9.5%
6 2 9.5%
7 0 0%
8 3 14.3%
9 2 9.5%
10 9 42.9%
Table 8.2: Deciles of schools reported on in 2015 and 2016.
School Type Number of Schools Percentage Decile range
Co-Educational, State 17 81.0% 3 to 10
Co-Educational, State-integrated 2 9.5% 8 to 10
Single-sex (Female), Private 1 4.8% 10
Single-sex (Male), Private 1 4.8% 10
Table 8.3: Types of schools reported on in 2015 and 2016
8.3.2 Participants
The vast majority of participants were employed as full or part-time primary school teach-
ers. Those who were not teachers were volunteers who provided supplementary lessons and
teacher support at a primary school they were not usually employed at. As participants were
self-selected, the results of this study are potentially biased towards teachers who are more
confident with, or passionate about these subjects than most NZ primary school teachers.
There were significantly more teachers in the 45+ age groups than younger groups, and
with 15+ years of teaching experience. There were no teachers in the 65+ age group.
The distribution of ages and years of teaching experience are shown in Tables 8.4 and 8.5
respectively. The 45-54 year old age group was overrepresented in this study when compared
136

Age group Under 25 25-34 35-44 45-54 55-64
Number of teachers 1 0 6 11 3
Percentage 4.8% 0% 28.6% 52.4% 14.3%
Table 8.4: Participant age groups.
Years spent teaching 2-4 5-9 10-14 15-24 25+
Number of teachers 3 1 2 10 7
Table 8.5: Number of years each participant had been working as a school teacher
to the age distribution of all NZ teachers, 24.9% of whom are in this age group. 18.6%
of teachers in NZ are in the 25-34 age group and, as there were no teachers in this age
group in my study, teachers under the age of 34 were highly under-represented. This is
interesting considering the common stereotype that computing related topics and computer
usage are easier for, and more appealing to, the younger generation of teachers. Twenty-six
of the participants were women, and only four were men. This is relatively unsurprising
considering the large gender bias towards women in primary school education in NZ, where
over three-quarters of teachers identify as women.
While the support and training available were the same for all participants, there was a
huge variation in how much each used these, and which parts they used. Some teachers had
prior experience with these topics and so did not attend as many workshops. There were
teachers completely new to these topics and very nervous about trying them, who made use
of as much support as they could. Other teachers new to this topic did the opposite, and
after just one session of training continued with no support. Some did this as they quickly
felt comfortable and confident with the material, but some because they taught a small
number of lessons and did not continue.
Participants were asked about their confidence levels in the motivation survey, the feed-
back form they completed during the programme, and in the interviews. They were also
asked about their motivations for joining this programme in the survey and interviews. This
allowed for a comparison between teachers’ feelings before, during, and after the programme.
The most common themes in the motivation survey responses were feelings of determi-
nation and excitement, frequently alongside general anxiety and apprehension. As would be
137

Amount of experience Number of teachers Percentage
Yes —Have taught one or both ofthese as part of my program
5 23.8%
Some —Have taught one-off lessonswith one or both of these subjects
10 47.6%
None —These subjects and teachingthem are new to me
6 28.6%
Table 8.6: Number of years each participant had been working as a school teacher
expected, there was a clear difference in confidence levels between teachers with different
amounts of experience with these subjects. Teachers with no prior experience overwhelm-
ingly reported feelings of trepidation, while those with experience did not. Two of the
teachers who reported high levels of anxiety and self doubt did not go on to provide feed-
back or be interviewed. One described themselves as feeling “overwhelmed”, and indicated
the ideal type of support for them would be to have someone more experienced in these
topics help them teach the first few lessons to get them started. The other said they felt
“confused” about where to start. They wrote that model lesson plans would be the most
useful type of support. Instructions were provided for all CS Unplugged activities, however,
at the time these resources were not developed into full lesson plans. Full lesson plans were
available the following year and may have assisted this teacher to continue teaching these
subjects.
All of the 21 teachers who continued with the study reported some type of positive feeling
about being a part of the programme. 19 described themselves as ‘excited’ or ‘motivated’,
while the others were ‘curious and interested’, and glad that they were going to be a part
of the study. The majority of these teachers were relatively confident, and had some degree
of prior experience with these topics, as shown in table 8.6. three of the five teachers who
answered “yes” to prior experience had been involved in the study for at least a year before
completing the survey. The large number of teachers with some degree of prior experience
with these subjects was to be expected, as the majority of participants found out about the
study through the CS4PS workshops (described in Chapter 6, section 6.3.4).
Participants frequently cited their students as their motivation for taking part in this
programme. They saw the importance of this subject for their students’ futures and wanted
138

to do the best they could for them. They wanted their students to be engaged with the
topic, excited about it, and excited about their learning in general.
• “I want to be able to ensure I am doing the best for my students and give them skills
that are relevant to their digital world.”
• “I believe that I can help prepare our students for a world where the internet of things
is a reality. By exposing them to computational thinking at a level appropriate for
their age they will gain a better understanding of what makes their world work. They
will be better able to make an informed decision about whether this is an area they
would like to pursue in later studies.”
• “I believe that it is essential for young people to learn how to control and create
technology. Understanding how computers work and being able to program them is
the most powerful enabler I know in the 21st Century.”
• “I want to have some fun, engaging classroom activities that make my maths pro-
gramme more hands on and interactive and broaden their learning focus”
• “Student engagement and enjoyment in something new.”
Many also wished to up-skill themselves in this area, and become more comfortable with
the topic of Digital Technologies.
• “I know this is a skill I need to learn and this opportunity will give me lots of support
and motivation”
• “I am interested because, as part of my professional development I would like to be
less fearful of these technologies.”
• “To upskill on my teaching practice.”
Supporting other staff within their school was a motivating factor for several teachers.
These teachers were generally the lead teacher (officially, or unofficially in some cases) for
ICT or DT in their school, and were responsible for getting other teachers in their school on
board. Conversely, other teachers were hoping that over the course of the programme they
139

would gain the support of more staff at their school, their students’ parents and caregivers,
and teachers at other schools.
Despite these many motivating factors and general excitement teachers felt, there were
many who were ‘stressed’ about the amount of work they felt this would be for them. Over
half of the participants described these types of feelings. Two teachers highlighted the
difficulty of finding the time to fit this subject in:
• “I thought it would be great to get some PD, and hopefully a motivator to do something
in class about it...as it is not really on the priority list with the million other things
we have got going on.”
• They were hoping this program would help them “to include aspects of the programme
into existing frameworks - not an add on. I won’t fit it in otherwise.”
Time, workload, and the already very full primary school curriculum were the most
common struggles teachers described in the interviews. 16 of the 18 interviewees identified
this as one of their main challenges. However, most of these teachers said that this was a
problem for primary school teachers in general, and not unique to this subject. The high
workload for NZ primary teachers has been identified as a national concern, and a large
contributor to recent teacher strikes and teachers leaving the profession [70, 71].
Teachers’ levels of confidence reported in the feedback form were surprisingly high, con-
sidering that teaching these topics was still relatively new for the vast majority of them.
The number of times each level of confidence was reported is shown in Table 8.7. This was
potentially biased as teachers with higher confidence were, presumably, likely to teach more
classes than those with low confidence. They would, therefore, have been more likely to fill
out the feedback form multiple times. To show a less biased example the mode response for
each teacher was taken. In cases where a mode could not be taken the confidence level of
the participant’s most recent entry was used. This is shown in Table 8.8. The distribution
of this data was however similar to that shown in Table 8.7.
The interview transcripts showed that teachers tended to feel less confident and compe-
tent when it came to programming, and several teachers said it was something they were
afraid of. They were much more likely to feel comfortable with the CS Unplugged lessons.
The vast majority felt that they, at least partially, understood the concepts behind the CS
Unplugged lessons after teaching them several times. This progression of quotes, all from
140

Response Number of responses
Very unconfident 9
Moderately unconfident 15
Moderately confident 66
Very confident 45
Table 8.7: Teacher responses to the question “How confident did you feel while teaching thistopic?”
Response Number of teachers
Very unconfident 2
Moderately unconfident 3
Moderately confident 23
Very confident 5
Table 8.8: Most common response of each participant
the same interview, illustrate this teacher’s feelings, and how their confidence changed over
time:
• “I feel like I am quite computer literate, although I certainly can’t do any computer
programming whatsoever, it actually terrifies me.”
• “When I went to the very first session [on CS Unplugged] I actually thought oh my
goodness I know nothing! I thought I can’t do any of that, I don’t even know what
those things mean! It was quite terrifying. But then when I downloaded the book
and focused less on the bigger picture and more on the activities, then I felt like I was
getting more headway in my own mind, and then that led to deeper understanding of
the bigger picture.”
• “I personally don’t feel very confident on Scratch and I have older kids next year, so
I will learn how to use Scratch, but that’s probably the area I feel weakest in. The
other activities I feel very confident with those.”
• “I think my knowledge has increased.”
141

Some teachers became much more confident in their programming ability, though none
felt as though they were ahead of all of their students. This however did not concern the
teachers who commented on their students’ more advanced abilities because, as one stated,
“that’s great, because I’m only here to get them started and interested”. Others reported
that they gained no knowledge of programming during the time they taught it, or did not
engage with it at all. In these situations the teachers either did not teach any programming,
or instead gave students resources they could use independently, such as Code Club projects,
and had their students work through these by themselves and assist each other. Being
completely new to these subjects was not seen as a negative by all teachers, and some found
it to be a positive for both them and their students. One participant commented happily:
• “Honestly, I had no idea what I was doing when I first started doing it with the kids.
I just said ‘let’s play with this!’, and they’d ask ‘how do you do that?’, ‘I don’t know!
Remember I’m learning too!’ So, I would have it up on the board and I’d be trying it
at the same time as them”.
There was no stress in their voice when they said this. Instead, there was a lot of
excitement. This encouraged students to be more persistent and self-reliant in several classes.
Many teachers felt that learning alongside their students, and their students being aware
of this, was beneficial. In contrast, other teachers felt that their lack of knowledge and
confidence with the subject material meant they were doing a disservice to their students,
especially when they found they could not answer students’ questions. Despite this, even
this group of very unconfident teachers were glad they had pushed themselves to try teaching
these subjects. During the interviews, I asked each teacher if they were glad they had taken
part in this, or if they would be teaching it again in the future. The answer to one or both
of these questions was a firm yes from every interviewee.
• “Yes, absolutely. It is part of the future, well actually it’s not the future, it’s part of
what we should be doing now’.’
• “Absolutely delighted, really loved it, been really passionate about it. Its been bril-
liant.”
• “Definitely. I was definitely nervous before I started and was thinking I don’t know if
this is for me. But I’m really glad that I started and now I feel like I am able to help
other teachers get into it.”
142

All stated that they would be teaching this topic in the future, in some form. The vast
majority were planning on using the lessons again, wanted more resources to extend their
teaching in the future, and planned on attending future CS4PS workshops. One teacher
did not say definitively whether or not they were pleased they had taken part. They had
taught the material as part of an after-school club, rather than during class time. They felt
that this had been a mistake and had made the classes less successful. In every interview,
teachers expressed overwhelmingly positive feelings towards teaching these topics, despite
the challenges of time, workload, stress, and how much prior experience they had with these
subjects. This complete consensus was very surprising, and also encouraging for the future
of CS and CT curriculum.
8.3.3 Lessons taught
The feedback gathered covered many different lessons, conducted with a wide range of age
groups. The majority were about lessons that took place in usual class time with a typical
class of students. The remaining entries covered after-school clubs, outreach workshops with
students from multiple schools, a virtual classroom, and classes with specifically selected
groups of students. These groups with selected students included extension classes, lessons
with a group of ‘gifted and talented’ students, and students who were disengaged and strug-
gling with their learning. This also included one group of students who were chosen by their
usual classroom teacher to take part in a programme of lessons because they thought the
students would benefit from extension in this area but were not a usual extension class. This
programme of lessons was taught by a volunteer who worked in the field of e-learning, rather
than the students’ usual teacher. They were chosen at their teacher’s discretion, and not
based on their abilities in other subjects.
Table 8.9 shows which lessons were taught according to the feedback form, and the range
of age groups they were done with. The number of times each concept was taught in a
lesson, as reported in question four of the feedback form (options listed in section 8.2.1),
is shown in Table 8.10. As would be expected, many responses reported multiple concepts
in each lesson. Therefore, the total number of concepts is much higher than the number of
feedback responses.
The general consensus among teachers was that each of the topics covered could be taught
in a suitable way for each age group they taught, and their students’ responses to the lessons
were overwhelmingly positive. The fact that these lessons worked for different age groups
143

Activity Year levels Computational Thinking links
Programming:
Bee-bots and similar 0/1 - 8 Algorithms, Decomposition,Evaluation, Logical thinking
ScratchJr and similar levelprogramming environments
3 - 6 Algorithms, Decomposition,Evaluation, Logical thinking
Scratch and similar level pro-gramming environments
3 - 8 Algorithms, Decomposition,Evaluation, Logical thinking
CS Unplugged:
Unplugged Programming:Kidbots, mazes etc.
1 - 8 Algorithms, Decomposition,Evaluation, Logical thinking
Binary numbers: number rep-resentation
1 - 8 Algorithms, Decomposition,Patterns
Binary numbers: representa-tion of text, images, or soundetc.
2 - 8 Abstraction, Algorithms, De-composition, Patterns
Error detection and correc-tion: parity and barcodemagic
4 - 8 Abstraction, Algorithms, Pat-terns
Searching Algorithms 3 - 8 Algorithms, Decomposition,Evaluation
Networks: The muddy city 3 - 6 Abstraction, Algorithms, Evalu-ation, Logical thinking
Routing and deadlock: Theorange game
3 - 8 Algorithms, Decomposition,Evaluation, Logical thinking
Sorting networks 3 - 6 Algorithms, Evaluation
Information theory and deci-sion trees
5 - 6 Abstraction, Evaluation, Logi-cal thinking, Patterns
Sorting Algorithms 5 - 6 Algorithms, Evaluation
Table 8.9: Activities that were reported on in the feedback form responses
144

Concept taught, as reported by participants Times reportedAlgorithmsWhat an algorithm is 23Following step-by-step instructions 31Creating step-by-step instructions 36Test instructions and correct them 31Describe and/or demonstrate two different algo-rithms for the same problem
14
Compare two different algorithms for the sameproblem
13
Data representationBinary representations of numeric values 26Binary representations of text 14Using two different symbols to represent infor-mation
10
Binary representations of images 8Binary representations of sound 4ProgrammingUnderstand and give step-by-step sequenced in-structions
33
Using a visual programming language to make asimple sequenced program
30
Using a visual programming language to makea program that includes input output and vari-ables
15
Using a visual programming language to make aprogram that includes simple iteration
20
Using a visual programming language to make aprogram that includes selection and iteration
15
Table 8.10: Total number of times each concept was reported in the feedback form.
145

Response Number of responses
Far too easy 0
A little too easy 2
A good challenge level 119
A little difficult/frustrating 10
Far too difficult/frustrating 0
Table 8.11: Teacher responses to the question “How challenging/engaging do you thinkstudents found it?”
was likely influenced by teachers’ expertise. Their pedagogical skills would have helped them
to modify the content themselves, to suit the age level of their students. For example, when
interviewed one of the teachers commented that after teaching the lessons several times,
they “saw ways to take some of the lessons that were in Unplugged, and develop them again
specifically around this age, expanding them, or making them more hands-on for the kids”.
The form asked teachers to rate how challenging lessons were for their students. The
number of times each challenge level was reported in the feedback form is shown in Table 8.11.
10 lessons were identified as “A little difficult/frustrating”. However, four of the pieces of
feedback stated the difficult part of the lesson was unrelated to the CS, CT, or programming
concepts being taught, but to issues such as lack of access to resources, or children not
knowing which directions were left and right. The six remaining feedback entries, identified
as “A little difficult/frustrating” came from three separate teachers. Four of these entries
were from the same teacher, with one each coming from the other two teachers. These six
lessons covered year levels from 2-8, and so the difficulty does not appear to be related to the
age group being taught. In fact, two of these entries reported on the same lesson being taught
to different age groups (but using different, age-appropriate, programming languages). These
entries stated that both groups struggled with exactly the same CT concepts. Seven of the
total eight lessons were on programming concepts and algorithmic thinking for programming,
and one was on the ‘Image representation’ CS Unplugged activity.
The main challenges in these lessons were all very similar. Students struggled with
working methodically, and in following step by step instructions sequentially. For example,
teachers commented that students struggled with the following tasks :
• “The process of debugging - most wanted to randomly remove blocks in the hope it
146

would work.”
• “Planning, thinking through the steps in a logical and systematic approach to then be
able to then write their program.”
• “The level of accuracy was surprisingly low. They tended to rush. Those who system-
atically crossed out each number and row made fantastic progress.”
However, in each of these lessons, the students were able to eventually overcome these
difficulties. For example, in a lesson where students were having difficulty constructing their
programs the teacher found that “The struggle was short-lived. As soon as one student had
a breakthrough, then they were encouraged to show others and success spread like wildfire”.
The difficulty level of these lessons did not appear to be related to the teachers’ level of
confidence.
Each of the 18 teachers interviewed was asked if they thought these lessons had a positive
impact on their students. 17 of the teachers reported that yes, the lessons had been beneficial.
The teacher who did not report the lessons were beneficial stated that they could not make
a judgement on this, because they had taught after school, outside of the students’ normal
classes, and did not work with this group of students during the day. This meant they
were not able to observe their behaviour and work in their usual classes and classroom
environments, so were unable to observe any potential development the students may have
displayed.
They were also asked if there had been any negative impacts on students. 15 of the
teachers stated they had not observed any negative impacts. This may appear to indicate
that three of the teachers did observe negative impacts, but their answers were not as simple
as that. Interestingly, they all described the same observations, despite being in different
schools and not working with each other during this programme. They said the only negative
impact they could think of was some of their students became frustrated or upset when they
first began learning the material, as they found it challenging — when asked what negative
impacts there were their answers were:
• “Only for my really really high functioning kids,... They were just frustrated really
easily because it didn’t work the first time. It was the high functioning kids that were
like that.”
147

• “Maybe a little frustration. Like, when the binary numbers or the network wouldn’t
work out at the end they would go ‘oh this is stupid’. But to get them to go back and
say ‘let’s find out what went wrong and let’s start again and see where we went wrong’,
and solve it that way and have success at the end. So just that being frustrated[sic]. It
wasn’t a negative effect, but that reaction from the kids who think ‘I’m clever and I can
do this’ and then it didn’t work and they would say ‘oh this is stupid’ or something.
So, getting them to try and do it again... It was that persistence again and not giving
up.”
• “Other than just the short-term frustration for those kids, but that’s nothing that we
wouldn’t see in any lessons with some kids, there’s always going to be some kids with
that struggle, and basically once they can persevere and show that growth mindset
they can actually push through and once they collect they get a lot out of it.”
While a range of students in each case displayed these feelings, they were particularly
common among the higher achieving students in the classes. The teachers suspected this
was because the material put these students on a more even footing with their classmates,
as it was a new topic for all of them. They seemed frustrated that they were not able to
get the correct answers as quickly as they may have been used to doing in other classes.
One teacher said they did not think this behaviour was in any way unique to this particular
subject, and they observed it often when these students encountered something new. All
three of these teachers stated this frustration was temporary. Two remarked that this could
be interpreted as a positive impact, as it gave students an opportunity to practice diligence
and persistence.
There were no references to any negative impacts on students in the feedback form
responses, and almost all entries described one or more positive impacts.
8.3.4 Computational Thinking
All 32 teachers observed, or described, students carrying out or exercising at least one CT
skill. Unsurprisingly, there was a large difference in the number of concepts and approaches
teachers observed based on whether or not they had been interviewed, and the number of
times they submitted feedback. Two teachers submitted significantly more feedback than
others, one of whom was Wendy. Between the feedback and the interviews, all concepts and
approaches were reported 40 or more times, other than Abstraction which was reported 6
148

times, far fewer than the others. For descriptions of these concepts and approaches, and the
criteria for tagging these, please refer to section 8.2.2. The total number of times these were
each identified are shown in Table 8.12, and in Figure 8.1. The number of teachers who
observed each of the concepts and approaches is shown in Table 8.13.
CT Skill Number of observations:Feedback Interviews Total
Concepts:Abstraction 3 3 6Algorithms 123 91 214Decomposition 47 85 132Evaluation 22 43 65Logic 33 62 95Patterns and Generalisation 19 28 47Approaches:Collaborating 27 55 82Creating 27 65 92Debugging 22 61 83Persevering 2 38 40Tinkering 11 38 49
Table 8.12: The Computational Thinking Concepts and Approaches, which were identifiedin the feedback, and interview transcripts.
Each CT skill, other than Algorithms, was much less likely to be observed by teachers
who only provided feedback and were not interviewed. This is unsurprising as the interviews
provided much more detailed observations. One of the quotes that stood out the most, on
the topic of CT, was from Angela, as she reflected on the three years she had been teaching
CS and programming:
• “When you can actually see how differently students think, you know that they’re really
learning to program. They’re thinking of the algorithm. . . That’s Computational
Thinking, to be approaching the problem the way they do.”
In her interview, she talked about how both her students’, and her own thinking had
changed, and how their problem solving skills had evolved. As she had been teaching this
material for the longest and had observed groups of students over consecutive years, she
149

Figure 8.1: The Computational Thinking Concepts and Approaches, which were identifiedin the feedback, and interview transcripts.
150

CT skillGave feedbackonly, out of 14
Gave feedbackand interviewed,
All teachers, outof 32
out of 18ConceptsAbstraction 0 0% 3 17% 3 9%Algorithms 14 100% 18 100% 32 100%Decomposition 6 43% 17 94% 23 72%Evaluation 1 7% 16 89% 17 53%Logic 4 29% 17 94% 21 66%Patterns 2 14% 14 78% 16 50%ApproachesCollaboration 3 21% 14 78% 17 53%Creating 4 29% 16 89% 20 63%Debugging 3 21% 18 100% 21 66%Persevering 0 0% 15 83% 15 47%Tinkering 1 7% 16 89% 17 53%
Table 8.13: The number of teachers that each Computational Thinking Concept and Ap-proach was observed by.
was better placed than the majority of other participants to comment on how this impacted
students over the longer term.
Through the interviews and feedback, there were examples of CT skills being used indi-
vidually, but the majority of observations involved combinations of these. With the many
interconnections between the concepts and approaches, this was not surprising.
Abstraction
Abstraction was observed significantly less often than other CT skills. This is interesting,
but not particularly surprising considering the young age group of students being observed.
Despite the low number of Abstraction observations, there were three particular cases iden-
tified which gave very distinct examples of students performing Abstraction. The first two
of these both came from the same teacher.
• Maths word problems: One of the examples of Abstraction given in the CAS teachers
guide is students using Abstraction when tackling word problems in maths to identify
which information is, and is not, needed to solve the problem. While this is an example
151
of this happening in maths, rather than CS, one teacher discussed how this tied in
well with the CS and programming work their students did, and how it enforced
this problem solving method in maths. “Because they’re not so great with the word
problems ... initially, we were cutting things out so they could put them in the line,
after we had done Scratch so we could then put them in a program. So like ‘10
strawberries’, ok cut that out, ‘add’ ok cut that out, put that one over there... so it
has helped them move things across with their word problems.”
• Logic problems: In their interview, a teacher described how at the beginning of the year
they had given their students logic puzzles to work on and then gave them puzzles of the
same type at the end of the year. These puzzles required students to use information
and rules to match pairs, for example matching different characters to the activities
they did based on a set of rules and information about their likes and dislikes. At
the beginning of the year students “just couldn’t do it and they were saying ‘but it
doesn’t say that character’s name?’, [I said] ‘No but it says that [if] that character is
doing that and that has that, then that character must do that’... I had kids in tears”.
But at the end of the year, the students not only completed these, but enjoyed them,
and the teacher believed this was largely due to the CS and programming lessons.
She described how the majority of students now understood that they didn’t need to
know all the details of the situation to find the answers, they could use the abstract
information they had to do this. This was also a clear example of students developing
logical thinking skills.
• Muddy City extension: One of the classes who did the Muddy City Unplugged activity
extended this by creating new maps and adding new requirements to the challenge.
These included deciding the length of each tile and how much each tile would cost.
Students had to figure out how to find the shortest routes between different houses,
and the cheapest way to pave the whole city while minimising the distance between
destinations. This was added as a way of including maths in the activity. Students
however soon realised they could simplify this by ignoring the length and cost of each
paver, only focus on the number of pavers used, and then calculate the distance and
cost at the end of the activity. They identified and discounted the unnecessary details,
thus performing Abstraction. This was also a strong example of students performing
evaluation (along with other CT skills).
The remaining observations of Abstraction were of students coming up with different
152

representations they could use to record a set of directional (e.g. Beebot or KidBot) instruc-
tions. There were a large number of cases that could be considered to involve Abstraction
but were not covered by this criteria. These were lessons and activities related to binary
data representation, and cases of students creating programs that could be considered to be
simple simulations.
While learning and using different representations of data is an important type of ab-
straction frequently used in computing, the descriptions of data representation lessons were
not considered examples of Abstraction, as students were not choosing these representations
themselves. They did not have to consider or choose what representation was most appro-
priate for the data they were using, or why representing data in these different ways was
related to the concept of abstraction or complexity. Simply learning about and using data
representations was therefore not considered enough evidence to tag an observation with
Abstraction.
Multiple students created programs that could be argued to be simple simulations. For
example, one teacher asked their students to do Scratch projects related to their Science
Fair project and described one student “who actually designed a lab and you press different
buttons and the nails go in the coke, and sometimes one will go rusty and the other will
go... whatever [speaker trails off]”. From this information alone it was difficult to determine
whether this student created a program in which pressing one button triggered one animation
(i.e. the nail going rusty) and one button triggered another, or if they created a program
that defined some type of rule about when a nail will go rusty, which could qualify as a
simulation. However, this was not considered enough evidence of a simulation of an abstract
concept being created, partially as the other student’s projects described in this same section
were simple animations.
Algorithms and Algorithmic Thinking
Algorithms and Algorithmic Thinking (referred to from here on as just Algorithms) was
the most frequently identified CT concept within the feedback and interviews. This was
unsurprising as algorithms was one of the three core topics these lessons were intended to
teach, is central to CS and programming, and the data representation activities all involve
the use of algorithms as well.
Students were observed learning about or demonstrating this concept through program-
ming and Unplugged programming activities; learning and then carrying out different al-
153

gorithms for sorting, searching, manipulating binary numbers, error detection, and error
correction; articulating an algorithm for someone else to follow; and by walking through
algorithms and programs step-by-step when debugging and evaluating these.
Some examples of the tagged sections are:
• When describing students helping their peer with doing the parity trick —“The others
could give him a clear strategy on how to do it, it was sequential and how to follow a
process rather than just being random.”
• From feedback —“They all understood the binary search algorithm”
• From feedback, concepts students understood well —“Algorithms: how to test then
correct them”
• From feedback, concepts students understood well —“That an algorithm is a sequence
of instructions that when followed exactly always give the same result. Relating this
to programming - if, then, else, repeat”
• When describing benefits to students — “The deeper understanding of sorting, cate-
gorising, putting things like the weights into order, and the sorting network, and even
the orange game, of trying to follow those in your mind. Following a set of possible
solutions, it is so good for them.”
• When describing writing algorithms for Bee-Bots —“That was another thing that we
did last year that the kids loved. We were lent the Beebots and made big maps with
big pieces of cardboard with squares and they coded the Beebots. That was really
interesting, they had these big boards and all these different games that they had
made.”
Decomposition
Decomposition was the second most common CT concept and skill identified. It almost
always occurred in conjunction with algorithms, which makes sense as creating an algorithm
(whether or not it is then implemented in a program) requires students to break a problem or
process down into individual steps (must be more than one step). It also frequently occurred
with Debugging, as by its nature debugging will generally involve having to examine and
walk through individual steps in a program or algorithm.
Students were observed learning about, or demonstrating this concept through program-
ming and Unplugged programming activities; by teaching, or assisting others with algorithms
and programming, by breaking these down into steps and explaining these; by articulating
154

an algorithm for someone else to follow; by walking through algorithms and programs step-
by-step when creating, debugging, and evaluating these; by testing and examining individual
parts of algorithms and programs, and then building these up. Some examples of the sections
tagged as decomposition are:
• Describing students writing Beebot (i.e. turtle-style) instructions for drawing numbers
on the ground, or moving a counter from a start to an end point —“it was really good
to see the kids that could actually break that number down into steps, and those kids
that couldn’t see those smaller steps. So we then had to get them breaking it down
and simplifying it. Once they actually got a bit more confident in that then those kids
that were getting a wee bit frustrated, they then could see that it was quite an easy
task when they were breaking it down into just those smaller chunks.”
• From feedback, concepts students understood well —“Debugging - decomposing the
problem to find the problem and then develop a solution.”
• Describing two different students —“they were the one that was really decomposing
beautifully, and doing the troubleshooting”, “we’ve got this little year 4 and their
decomposition skills were remarkable.”
• When describing the positive impacts of programming —“It’s then bringing out those
sorts of concepts, like the computational thinking side of things and being able to
break those tasks down.”
There were also a significant number of cases where teachers described students struggling
to break problems down when they first encountered them, and in most (but not all) of these
situations, they described how students became better at this. For example, one teacher
described how students were asked to come up with a project to do or problem they wanted
to solve (which they struggled to do independently), but when they tried to start this “the
problem would be so big, they wouldn’t know how to even get started”. In their interview,
they discussed that with support and time the students became much better at approaching
a problem and breaking it down into smaller steps, and to think about it algorithmically.
Evaluation
Evaluation was frequently observed alongside Debugging, Creating, Algorithms, Collabora-
tion, Logic, and Decomposition. Students were observed learning about, or demonstrating
this concept through creating programs with a specific goal, such as telling a story, teaching
someone a concept, or making a game, individually or as a team; when working as a team
155

to solve a problem (such as the Muddy City) and testing each others ideas; when learning
about searching and sorting algorithms and displaying an understanding of how different
algorithms were more efficient than others; and identifying when something had gone wrong
whilst carrying out an algorithm or running a program, and working to fix or improve it.
Some examples of the sections tagged as evaluation are:
• Discussing ideas with students and observing them understanding this —“We did a lot
of talking about how it is actually about solving problems. It is about being accurate
and precise and having the right sequence. It’s about seeing where the problem is and
going back and fixing it.”
• Discussing benefits of CS Unplugged activities —“it encourages them to think in dif-
ferent ways, they definitely had to use some trial and error for things like the binary
activity. Same with that muddy city, that trial and error, give it a go, work out what
else you could try.”
• Describing students programming —“the children, they were able to work through and
say ‘that’s not working OK how do we make things go the way we want them to?’ ”
• Describing things students learnt —“We taught them how to give critical feedback.
They showed us, they verbalized, they worked on it and came back again. If we follow
the way in which technology works, which is the planning, the design and getting your
stakeholder feedback. They are learning that and getting exposed to it at an early age.
The planning part and the testing, and the re-planning and testing again.”
• Describing students projects —“We brought a design thinking element into the pro-
gram as well, so we use the design thinking framework ... for game creation. In
Hopscotch we didn’t want them just playing, creating games without a purpose. We
actually wanted them to really start looking at doing a needs analysis, and creating
prototypes, and going through that testing stage. They really loved that process...
they got that. We had an arcade for a whole session, and they were writing down the
positives and the negatives of the games. That was really cool, really enjoyed that.”
• From feedback, concepts students understood well —“We compared a linear search
and a binary search and took our time to explore these search techniques with the
same sample of data. When we got to finding a number within 1,000,000 and worked
out it could be done in 20 guesses, there was much excitement.”
• From feedback on the Muddy City activity — “Some children demonstrated how to
swap routes over so the route with the least pavers could be created. They used
expressions like minimising each route in order to save pavers and finding the most
156

efficient route.”
Logic
Students were observed learning about, or demonstrating this concept through writing and
debugging algorithms and programs; carrying out algorithms from CS Unplugged activities,
identifying when something had gone wrong and why this had happened; playing with,
and exploring block-based programming environments; and discussing, creating, and testing
algorithms and strategies for solving CS Unplugged problems.
Logic was often identified by teachers as a skill they wanted the CS and programming
lessons to develop in their students, and these teachers explicitly stated that their students
logical thinking skills had indeed improved. An example of this was given previously when
Abstraction was discussed, of students improved performance solving logic puzzles. Some
other examples of sections tagged as Logic are:
• Describing what a student said while debugging their program —“That’s the wrong
way around, I’ve done and negative when I should have done a positive, I flipped it
the wrong way.”
• Comments from multiple teachers on the benefits for students —“I think it’s the prob-
lem solving skills, when you look at the logic in it, and the ability to actually see a
pattern, or a path, an outcome and those steps to get to it”, “coding has the logic and
reasoning the mathematical concepts, the science concepts, it’s all there”, “This is an
excellent activity to challenge logical thinking”, “It teaches logic and reasoning, which
is really low, unreal low. I was surprised by some of those results with some of those
kids.”
• Feedback on students predicting results of a program —“They are developing great
spatial awareness and many can programme [sic] the beebot without having to move
it from the spot so they can visualise which way it needs to turn”
In the feedback form there were four entries from one teacher describing what students
came up with when asked what skills they had to use during their lesson, and what they
thought they did well. Students came up with multiple skills and in all cases one of these
skills was logical thinking. The same teacher who submitted this feedback also described
another lesson which was a good example of students exercising logical thinking. This lesson
was not an official CS Unplugged activity, but was an ‘unplugged’ activity on ‘inputs and
157

outputs’ that the teacher created.
They described the lesson in the feedback form as students “acting out inputs and out-
puts, so that there was a ‘machine’ in the middle of the group (made with children moving)
which applied a rule to the input then put it out to the ‘output’ person. Those watching
heard the input for each group then their eventual output and had to guess the rule which
was applied in the machine”. In their interview they gave the example “this person might
pop up and say 5, and then they [the other group] get together... and this person would
pop up and say 15, and the other group had to guess what happened inside the machine.
So someone would say it was multiplied by 3, and the team will say that’s not what we did,
the others would say OK you’ll have to do something else to show what you did. So then
they’ll say 6, and the machine pops out 16, and they’ll say oh it must be add 10.”
Patterns and Generalisation
Pattern recognition and generalisation skills were most commonly observed in binary activ-
ities, and cases of students applying one problem solving or thinking method to multiple
different problems in both programming, and other subjects. The other subject that stu-
dents and teachers most commonly connected with patterns was maths, as pattern use and
recognition is already a large part of the primary maths curriculum. In some cases binary
numbers were used to teach patterns in maths. There were also many explicit descriptions
of students noticing and understanding patterns.
Students were observed learning about, or demonstrating this concept through recognis-
ing patterns in the binary numbers activities; recognising that a pattern was being used in
the parity card trick; taking understanding gained from one type of problem or algorithm,
and applying this in a new situation (e.g. from KidBots to Scratch, from binary numbers to
base ten numbers); and recognising that they could take part of an algorithm and repeat it
in another situation (both in programming and Unplugged programming). Some examples
of the sections tagged as patterns and generalisation are:
• Describing students writing Beebot (i.e. turtle-style) instructions for drawing shapes
of numbers on the ground, or moving a counter from a start to an end point —“there
were some kids that could see things like if they could do a six they could just flip it
upside down to do at nine as well. Actually, being able to see that they can tweak
their program in small ways and it would do something else that they were aiming to
do as well.’
158

• Describing what students had learnt or improved with —“Things like patterning, se-
quence and order.”
• Describing concepts students understood well —“noticing the doubling of each binary
number and starting to get a feel for the patterns as consecutive numbers were created.”
• Describing students using Scratch —“It’s really cool that they have learnt through one
experience how they can adapt that to do other things.”
• From feedback, concepts understood well —“Doubling of binary, patterns in creating
consecutive counting numbers”, “Doubling of numbers to make the next binary num-
ber. Understanding that the maximum number that would be made with binary was
double the largest number you had minus one, eg If 16 is the number. Double 16 minus
1 gives 31. Starting to see the patterning developing with the flipping of the cards.”
• From feedback, a concept that was understood well and applied to three different
activities —“The concept of eliminating possible scenarios repeatedly by half”.
• From feedback on programming, concept understood well —“using a loop to make
sequencing easier”, “Nested loops and parameters.”
One of the observations which stood out was made by a teacher with a very young group
of students. These students were in year 1 and 2 (5-7 years old), and their teacher was excited
and surprised by the results of teaching them binary, particularly for the children in their
class who struggled with maths. They described students using patterns and generalisation
to great effect, and benefits this had for their numeracy skills:
“We used [CS Unplugged] as a follow on from our numeracy. We went into look at
the binary numbers first, I started with that, and that gave me some quite surprising
results. Some of the children that struggle with numeracy picked up the patterns in
the binary numbers really easily. So I had some of the lower ability children teaching
some of the higher ability children because the higher ability ones just couldn’t get it.
That surprised me... They picked up patterns for other things. By looking at the
way we did the binary numbers to start with, and the addition, they then started
looking at other numbers and finding the patterns that came out... It was good for
their addition and counting upwards. Helping them to count from 1-10, they had to
think more about the actual pattern of the numbers...I was surprised because it showed
them all the different patterns that addition and subtraction have if you look at them
closely.”
159

Collaborating
There was an enormous focus on collaboration and teamwork among students in the in-
terviews, and observations of collaboration occurred at least once in almost every different
CS Unplugged and programming activity. Both the CS Unplugged activities and program-
ming had either encouraged or required students to work together and collaborate. Students
worked together when coming up with strategies to approach problems, and algorithms to
solve them; designing and writing programs; working through programming resources (e.g.
Code Club) together; taking on different roles in a team and sticking to these; teaching each
other and sharing their learning; and working on their social skills through teamwork and
learning from each other. Some examples of the sections tagged as collaborating are:
• From feedback, what students understood well in various CS Unplugged activities:
– “Team work. Accepting a leader in the hoop activity [version of the Sorting
Network]. Listening to others. Not just looking after yourself and your own
position but to work towards the whole team achieving”
– “The need to work cooperatively with others”
– “I was amazed at how well the children worked together to solve the problems”
• From feedback, skills students identified as important and they had done well:
– “Helping the ‘team’ to become competent not just having one person take over”
– “communication, team work, considering others, helping each other, cooperating”
– “communication by talking and using gestures, team work, thinking of others not
just yourself (and your own position)”
• Describing students programming together
– “In a lot of those activities they have to be working with other people so it is also
really good for them to work on not only something that they love but also work
on the social skills and the leadership skills”
– “All those interpersonal dynamics all came as an opportunity to develop while
they were creating something”
Some teachers reported that their students were already very good at working together so
it was not these activities which caused this collaboration to occur, but in all of these cases
teachers said the activities supported and strengthened these skills. In other cases, teach-
ers described both specific students and entire classes who struggled greatly with working
with other people, and in some cases strongly disliked working with others. These teachers
160

reported that these activities helped change that.
Two sets of feedback on a particular class gave an insight into their collaborative skills
improving. The first set of feedback about this class stated students struggled with “Working
well together as a team. A number just wanted to have their idea actioned rather than
considering the opinions of others in the group even though they realised they did have
to work as a team to get a team result”. The teacher wrote that “children in this class
in particular would benefit from a number of similar activities to to work more coherently
together in cooperative problem solving situations”. The feedback on a subsequent session
with this class was very different. The teacher described how the students were “Working as
a team and considering each other’s ideas.... interestingly I felt they listened more to each
others ideas and considered their points of view and options better”.
Another teacher described how their students attitude towards teamwork had changed
over the year:
“I mean the working together was a big thing, because mine can’t/ they could not
work together. Then having to be taught how to work together and then having to
work together to solve a problem... and it was something they enjoyed doing, to solve
a problem. So, I really liked that. They’ve worked together in writing and create
stories together now, which they wouldn’t have done at the start of the year because
they didn’t like working together.”
One of the teachers worked with a target group of students, for one hour a week outside
their usual classroom program. This teachers interview stood out as they described a situ-
ation where students developed and demonstrated excellent collaborative skills. This group
of students had been identified by their usual classroom teachers as people who would likely
benefit from some extension in this area. They were not selected because they were high
achievers in certain subjects (although some were) and according to the teacher who worked
with them they were a mixture of different personalities and abilities, and initially were not
collaborative. However, as the students worked on projects in these classes this changed.
“[there were] the really charismatic ones where image is everything, so they came
to these a bit guarded. Then you’ve got your real quirky, ‘nerdy’ kids as well. We had
the shy girls, we had the dominant girls, I’m talking a real mix... and balance of boys
and girls, it was across the board.”
161

“... what happened over time, we’ve got a real team spirit now. Next thing they’re
starting to turn to each other to solve problems, so you’ve got the ‘cool kids’ and the
‘nerd kids’... They’re all valued in the group because at one stage or another they’ve
actually all had something to offer the group, or someone is a bit of an expert”
“I think they valued collaboration, they valued that to produce something really
good... by yourself you can reach good, together reach great, and I think that’s almost
their mantra going forward.”
This group of students subsequently started their own Code Club so they could work
together to teach other students.
Creating
Creating was the most common CT approach identified, through both students making
things inside and outside of class, and teachers describing connections between the topics
being taught and students creative thinking. Those students who worked with Scratch
and ScratchJr, and were given relatively free reign with these, consistently used them for a
creative approach. Both during and outside of school time students made animations, games,
and artwork with these programming environments, and would enthusiastically share them
with their teacher, friends, and family.
Students were observed learning about, or demonstrating this concept through design-
ing and creating original digital artefacts, most frequently through programming; creating
artwork based on CS concepts from the Unplugged activities; and using CS and program-
ming concepts and resources when creating in other areas, such as story telling and class
presentations. Some examples of the sections tagged as creating are:
• Describing students during class time:
– “We did a lesson on binary. Then the exciting next step we did was turn it
into the alphabet stuff and we made a piece of artwork of our names. We would
visually represent the letters so it made a special shape.”
– “We moved on from there too some of the activities that were around creating
codes through binary for pictures or colours or sounds etc. They created them
for their families as well and took them home for their families to decode”
– “Any time they can get on the iPads they are creating things on SratchJr”
– “They’re great when it comes to inventing things... [they are] creators, inventors”
• Describing students creating outside class time:
162

– “they’re programming outside of school, they’re spending huge time gaps creating
what they’re doing”
– “Lots of [parents] have commented and said that rather than their kids just
playing on the computer at home they’re now going home and coding something
and then playing it, so they’re a lot happier because they’re creating rather than
just playing”
– “An example of how the kids embraced it is it when we had a pet day, it’s a day
where we also have a kind of show type thing where people make things like...
craft stuff, and one kid made a Scratch Jnr thing at his house and then he en-
tered it in the show... he went away and had that on his own family iPad and was
excited to make a little Scratch Jr movie, and it was really good. A huge amount
of interest from him. It was an undersea type scene with fish... It was really cool
because he had learnt it at school, gotten really excited about it, then gone home
and organised what he needed to do in order to explore that in his own free time.”
Several interviews described how creative programming gave students a new way to
express themselves and their learning. This was beneficial for many students, but some
teachers noted that their were particular students in their classes that this had a profound
impact on. These were generally students who struggled with more traditional methods of
presenting their work, such as writing and speaking.
“It gave them a different way of learning, or a different way of expressing what
they had learnt. We have a couple of kids in here who are... they just really struggle
with writing and presenting things. Doing a poster to show their work, it is their
worst nightmare. But if you ask them to create something on Scratch to present their
findings then they do such an amazing job”
“I think one of the main things is how they can represent their learning in different
ways, more challenging ways. And the creative side of it, you’re not just regurgitating
something. As well as creative thinking it involves a lot of logical thinking, because
some of them didn’t really have a lot of that, they were quite weak on that, and the
creative side as well. I think that’s really important. That’s what the programming
offers you too, a different way of representing your creativity and your learning.”
163

“[the] children who have English as their second language did some amazing story
telling because the ScratchJr program could do the dialogue and speech bubbles for
them, or they could go away and record the sounds and then put them in. They were
making some very high end sort of stories, and these little girls who don’t say boo
in class [meaning ‘don’t say anything’] were just very quietly creating this amazing
presentation. I was just blown away”
Describing a student with severe learning difficulties: “the creativity that this kid
had was amazing but the way in which she could express it using Scratch... and then
her explaining what her story was, it was just cool... she created some amazing stuff”.
One of the teachers shared an experience from their class that they were particularly
impressed with. A student used their experience with ScratchJr to create special effects for
a play that students were writing and performing in class:
“We started a play based program last year and one of the children had made a
little hospital set up... someone went away and made a ScratchJr thing that made a
little ticking noise like a heart monitor. They went away and designed this thing that
kept ticking, I don’t know how they did it. So, they incorporated these little repetitive
elements into the ScratchJr program.
They made this little thing and said look it’s the heartbeat, and I just thought
oh my goodness, I never would have thought of that in a million years! It was really
cool. They are now integrating their knowledge of that code and integrating it into
their play. It was done seamlessly and naturally. It reinforced the play that they were
trying to engage with but also just supported it, rather than replacing it. It was their
knowledge, they had it and they used it to make their play better. I never would have
thought of it and I think that’s kind of cool for them to be able to have that freedom
to use that.
In terms of using Scratch, that could be a format for them to share learning from
other contexts and if we free them up and say that they can share their knowledge
of something they’ve learnt about another context. If they are able to share through
that mode, who knows what they will do. Because if they’ve got the knowledge it will
just be another tool in their backpack that they can go to. They can say well I can
164
use Scratch for that.”
Debugging
Debugging was often tagged along side Persevering, as having to debug was something
students were challenged by and which they frequently worked at for long periods of time,
even when they became frustrated with the process. Students were observed learning about,
or demonstrating this approach through programming (original programs and from resources
such as Code Club projects); creating algorithms; and when carrying out algorithms or
instructions they were given to follow (such as KidBots and the Sorting network). Some
examples of the sections tagged as Debugging are:
• Describing students using the Bee-Bots- “During these sessions some children were
beginning to understand that what they thought they had programmed was different
sometimes, and they were able to then sort out the problem through either working
by themselves or together”
• Describing students doing the KidBots activity —“Some of them would write their
program and give it to their partner to do, and then it wouldn’t work out so they’d
have to figure out did this person read it incorrectly or is your program incorrect”,
“The concept of debugging was also a strength for this lesson”
• Describing students becoming more persistent with debugging —“they were starting
to talk amongst themselves about what to do, ‘What haven’t we done?’, ‘Why is it
doing that?’. Initially they were just saying ‘Oh it doesn’t work’, expecting you too
fix it. After that they started to actually look at what was going on, what they were
doing, and that what they were doing was making it do this. So if I’m telling it to do
this it’s going to do that, but if I then tell it to do something else it does something
else”
• Describing students programming —“One student is a really talented programmer,
he’s the one that can debug your program and solve that”
• When doing the Sorting Network activity —“when it didn’t work, to figure out what
had happened, we would backtrack and they would find that someone should have
gone one way but they went the other way”, “You’d always see children who thought
‘oh I’ve got the biggest number’ so therefore I’ll go there, and it would kind of muck
it up so you’d just let them go and at the end they’d think ‘hmmm... these aren’t
165

exactly in order, what’s happened?’ ”
A common theme which came up in sections about Debugging (and also Persevering) was
teachers discussing how when students couldn’t figure out what was going wrong with their
program, they would ask for help and expect the teacher to do it for them, only to be shocked
when their teacher told them they couldn’t help because they didn’t know the answer either.
The teachers who described this generally did not see this as a negative, and as time went
one they found that the majority of their students began to work more independently on
solving their problems. Teachers would also debug alongside their students, or as a team
with the class, for example:
“... they’d ask ‘how do you do that?’, ‘I don’t know! Remember I’m learning too!’
So, I would have it up on the board and I’d be trying it at the same time as them.
Then they would be watching and one would put their hand up and say ‘wait you need
to put that one in there’. It was quite cool doing that, and then I just stepped away
and let them carry on. So they’re probably more efficient than me now”
When saying “I don’t know!” the teacher had a happy and excited tone of voice, and
was portraying this as a positive thing.
Persevering
While Persevering was the approach tagged least often , and the second least tagged skill
overall, it was in fact a strong theme, and the number of times it was tagged does not
truly reflect how much teachers emphasised it. They described students becoming more
determined, more likely to take charge of their own learning, and less over-reliant on them
as their teacher. The observations of persistence were particularly intriguing, as teachers
believed this was directly related to these lessons, and some of their students carried this
across into their work in other subjects. There were also teachers who stated their students
were already generally persistent before they started teaching these lessons, but they also
said that the lessons supported their existing skills.
Students were observed learning about, or demonstrating this concept through carrying
out algorithms and creating them, particularly when working with directional instructions
with Bee-Bots and Kidbots; and when creating original programs, or programming from
resources (such as Code Club projects). Some examples of the sections tagged as Persevering
are:
166

• Describing how students changed over the course of the year —“they became a lot
more autonomous, and they could choose what to do, so I didn’t have them constantly
coming up to me with a problem, which you normally have. ‘I can’t do it, I’m stuck,
what do I do now? Provide me with the answers’. [Now] a lot of them would say
‘I can’t do it’ and they would go to their buddy and they would say ‘well have you
tried doing it this way?’ It was quite nice to have them not be so... well to have them
become more self-reliant. Especially at this age. They’re a lot more self-managed and
a lot more cooperative with each other, which is a big thing.”
• Describing students programming in class —“They found that hard. But they perse-
vered and we got there”, “if a kid came up to you and said ‘ohh how do you do this?’,
if you just threw it back to them and said ‘why don’t you figure it out and come back
and teach us?’, [then] the child would”
• Describing benefits to students —“Rather than giving up on stuff, trying to work at
problems and trying to figure out the best solutions. That’s where this fits in quite
nicely because of the computative [sic] thinking, and it’s fun as well”
• One class had a Scratch programming book, and one of the students wanted to work
out his program without using it — “I watched one of them and he didn’t want to
do the angles [tutorial], he wanted to work it out himself but then it kept going the
wrong way... but he just kept trying and trying, and trying to figure out the x and the
y. But it wasn’t working so in the end he had to succumb and go check the book and
find out what was wrong. But he was really persistent.”
Several teachers discussed how some of their students were not persistent in other sub-
jects, and had a tendency to give up when they found things challenging, behaved very
differently in these classes. They worked much harder, and continued working even when
they encountered challenges. Teachers were particularly happy about this, and they felt
proud of these students. A teacher described how in their class one student in particular
was struggling with programming. They moved this student back to work with the Bee-Bots,
and when this was also highly challenging they tried giving the student the Beebot iPad app
to try instead:
167

Teacher : “Some were progressing quite quickly, and I would work with the ones
that were not because they were struggling. For those ones, we ended up leaving the
coding and used the Bee-Bots instead. Also one of them still really struggled with it
so I got the Beebot pyramid app... she did it with a counter that we put little eyes on.
She would move the counter first before she did the actual programming on the iPad,
so that she had an idea of what she was doing”
Interviewer : “Would you say that they [referring to the class] were successful or
unsuccessful?”
Teacher : “I would say they [referring to the class] were successful... and while it
frustrated Amy3, who was the one that worked with the Beebot [app], she didn’t give
up, which is unusual for her because when it’s too hard she would normally give up,
but she was determined to get it to the end... Normally she would go ‘too hard! Not
doing it!’ and she would go off in the corner and cry. But she was like... she was really
good with it.”
Tinkering
Tinkering was frequently tagged alongside Logic and Creating, as these three all went hand in
hand with exploration and play. Teachers described students being excited by their learning,
and how because of this they would repeat activities, want to find out more about them, and
would try different ways to do them. They allowed them the freedom to modify activities
and extend them, and found that students created and solved complex problems by doing
this.
Students were observed learning about, or demonstrating Tinkering through exploring
programming environments; repeating and expanding on the CS Unplugged activities; build-
ing on projects they had done at school in their own time; using trial and error approaches
to their learning and in activities; and through creating digital and physical artefacts that
illustrated their learning. Some examples of the sections tagged as Tinkering are:
• Describing students ‘playing’ with programming in class:
– “They just played a little at first and then trialled some of the things which was
really good, and some of them have actually carried it on into their [other] classes”
– “They seem to have understood it a lot faster than I expected them to... They
just play and work things out, they will come up to me and say look I worked
3 Name has been changed
168

out how to do this”
– “Any time they can get on the iPads they are creating things on ScratchJr. We
haven’t taught them how to use that, we have just shown them program. They’ve
just learnt through other children and helping each other”
– “they’ve had the Bee-Bots in their classrooms. So every morning when they come
in it’s there for them to engage with. The children in turn, because parents often
drop their children off, the children will show their parents or their grandparents”
– “I found that I could just give them a little bit of information and they would just
go ‘oh I can do that’, and be off and say ‘come look at this, come and see this!’,
and they will have done something else, they will now be making two wheels turn
or something. They just went off on those and it was good, quite cool to see.”
– “The kids just had a play and found out a lot of the stuff that they could do with
that.”
• Describing students doing Unplugged activities:
– “The other activity we did was the parity trick, they love that, that’s on my
whiteboard and the kids use it all the time. So it’s just there and I see kids doing
it with other kids all the time, any parent that comes and they do it to them,
they call it a magic trick.”
– The barcode trick: “the kids were blown away by it and keen to do it again. They
tried it with all different barcodes around the room.”
– “They loved writing their name in Binary and also went on to create a secret
message for class mates and some even went home and made a secret message for
their parents!”
• From feedback, concepts understood well by students —“Not be afraid to test their
program”, “a bit more risk taking started to happen. Not being so scared to do some-
thing and see what happens.”
Many teachers encouraged their students to play and experiment when they were learning
about programming, rather than always using specific lesson plans. They described how
their students would learn by trial and error, and through teaching and observing each
other. When learning about binary and data representation, students would frequently
write binary messages for each other, and create different ways of representing binary digits,
such as with sound and lights. The parity trick and barcode trick were frequently repeated
by students, both to show these to other people, and to test if these tricks would always work
169

or if they could ‘break’ them. Several teachers also stated that their students had become
more likely to take risks, and were less afraid to test things when they were not sure what
they would do.
8.3.5 The Key Competencies
As discussed in Chapter 4, section 4.2.2, a core component of the NZ curriculum is the set
of Key Competencies, which students are supported to develop throughout their school ed-
ucation. The five competencies are: Thinking; Relating to others; Using language, symbols,
and texts; Managing self, and; Participating and communicating. The inclusion of, and
emphasis which is put on these Key Competencies is relatively unique to the NZ curriculum,
and during my work many teachers remarked on what an important and beneficial part
of the curriculum they are. The Key Competencies were not something I had considered
investigating before these studies began. During this wider teacher study it became clear
that there was a strong connection between these and the CS and programming lessons.
Several CT skills correspond directly with the descriptions of the Key competencies in the
New Zealand Curriculum:
• Thinking: Logic, Evaluation, Debugging, and Tinkering
“Thinking is about using creative, critical (Logic, Evaluation, Debugging), and metacog-
nitive (Logic, Evaluation) processes to make sense of information, experiences, and
ideas.”
“These processes can be applied to purposes such as developing understanding, making
decisions (Evaluation), shaping actions, or constructing knowledge (Logic, Tinkering).
Intellectual curiosity is at the heart of this competency (Tinkering).”
“Students who are competent thinkers and problem solvingolvers actively seek, use,
and create knowledge (Logic, Tinkering). They reflect on their own learning, draw on
personal knowledge and intuitions, ask questions, and challenge the basis of assump-
tions and perceptions (Evaluation, Logic, Tinkering).”
• Relating to others: Collaboration
“Relating to others is about interacting effectively with a diverse range of people in a
variety of contexts. This competency includes the ability to listen actively, recognise
different points of view, negotiate, and share ideas (All Collaboration).”
170

“Students who relate well to others are open to new learning and able to take different
roles in different situations (All Collaboration).”
“By working effectively together, they can come up with new approaches, ideas, and
ways of thinking (All Collaboration).”
• Using language, symbols, and texts: Abstraction, Algorithms, Creating,
and programming
“Using language, symbols, and texts is about working with and making meaning of
the codes in which knowledge is expressed. Languages and symbols are systems for
representing information (Abstraction).”
“People use languages and symbols to produce texts of all kinds: written, oral/aural,
and visual; informative and imaginative; mathematical, scientific, and technological”.
(Many related to one or more of: Abstraction, Algorithms, Creating, and programming)
“They recognise how choices of language, symbol, or text affect people’s understanding
(Abstraction) and the ways in which they respond to communications.”
“They confidently use ICT... to access and provide information and to communi-
cate with others”. (While this competency is related to the use of ICT rather than
understanding of it, it has a connection to Creating, and ties in well with teachers’
observations of Creating)
• Managing Self: Persevering, Collaboration
“This competency is associated with self-motivation (Persevering), [and] a “can-do”
attitude (Persevering)”.
“Students who manage themselves are enterprising, resourceful, reliable, and resilient
(Persevering).”
“They know when to lead, when to follow (Collaboration), and when and how to act
independently.(Persevering)”
• Participating and Contributing: Collaboration
“This competency is about being actively involved in communities... This compe-
tency includes a capacity to contribute appropriately as a group member, to make
171

connections with others, and to create opportunities for others in the group” (All
Collaboration)
Though it is not commonly listed as a CT skill, programming is also included in this
list, as there is a clear connection between this and the Competency of “Using language,
symbols, and texts”. This same competency also had connections with the CT approach of
Creating, which is frequently demonstrated by students via programming. As explored in
section 8.3.4, creating via programming provided students with a new way to present and
communicate their knowledge, which is a key part of “Using language, symbols, and texts”.
The links between these topics and the Key Competencies were explicitly referenced by
several teachers, in both the feedback and interviews:
• “Fantastic activity, can’t wait to do more. I really see the benefit of these. They are
working on Key comps/values as well as comp sci” — Feedback entry
• “I think more than anything, this is highly dispositional. I refer to the key competencies
with them. Because you’ve got your using ‘language, symbols, and text’. You’ve got
your ‘participating and contributing’. It’s a very social activity as well, as far as
the kids relating to each other. The deeper thinking, creative thinking. The critical
thinking is a big one too. Because we talk about bringing the Key Competencies to life,
the NZ curriculum states that it’s highly important, but then that’s where teachers
become stuck sometimes, with how do you explicitly teach or encourage those key
competencies? But this has been amazing” — Interview with a teacher
• “The key competency of thinking... we think we give students a lot of opportunities
to develop that thinking, but I don’t think we do it as explicitly as the computational
thinking side of stuff does” — Interview with a teacher
One of the teachers who discussed the Key Competencies at length described that the
way these new subjects supported the Key Competencies meant they would be easier to
integrate into the curriculum. They said this could also help convince other teachers and
principles that it was worth dedicating time to these subjects. When asked what some of
the challenges they faced during this time were they responded:
172

“I guess the challenges would be knowing that I’m ultimately going to have to
justify why we’re doing this. The challenge has been making the connections in order
to justify to colleagues that this is worth them spending their time on. And I know it
is, but it’s how to frame that to them... that’s why focusing on the key competencies
has been my way of selling it to the other staff, and they’ve seen a change in the kids,
that in itself is something.”
The cohesion between the Key Competencies, and the Computational Thinking Concepts
and Approaches, made NZ schools a unique setting for integrating these new topics, CS and
programming, into an existing primary curriculum.
8.3.6 Problem Solving
Unlike the Key Competencies, problem solving was a topic I had intended to investigate from
the beginning of the study. In the interviews teachers were asked specifically whether they
had observed impacts on students problem solving skills. Of these 18 teachers, 11 said they
believed their students’ problem solving skills had indeed been improved by the programming
and CS Unplugged lessons. Two teachers said they were not certain, but they thought the
lessons probably did have some benefit for problem solving skills. The remaining five said
they could not give any answer to this question. They felt there was no way they could be
sure whether the lessons had, or had not, impacted their students problem solving skills.
They said this was because it was impossible to separate the potential impacts (specifically
on problem solving skills) of these lessons from every other subject students had worked on
in class. All teachers agreed that the lessons did not have a negative impact on problem
solving skills.
Additionally to this specific question, problem solving was referenced in several interviews
and entries in the feedback form. These were often linked to descriptions of cross curricula
learning and learning transfer, which are discussed in the following section. Discussions on
problem solving skills also frequently connected with the Key Competencies. This makes
sense, as the competency ‘Thinking’ expressly covers general problems solving skills, and
the others each refer to using the competency to do things like: confront challenges, work
towards goals, and use their knowledge to create solutions. Some examples of sections tagged
as problem solving are:
173

• “They are also asking good questions and thinking creatively in how to problem solve
the task” — From feedback
• When discussing benefits to students in interviews:
– “The problem solving! I quite liked the problem solving because you can give
them quite complicated things”
– “It’s very good for their sequential thinking and their problem solving”
– “I think it’s the problem solving skills, when you look at the logic in it, and the
ability to actually see a pattern, or a path, an outcome and those steps to get to
it... I think it is that problem solving and that reasoning”
– “I think because it’s all part of the problem solving, and they’re doing problem
solving in their maths and other areas so it all fits in quite nicely with the cur-
riculum and everything we’re doing in the classroom... again it was that problem
solving, and having success.”
• When asked in interviews if their students’ problem solving skills were impacted:
– “Yes, it encourages them to think in different ways... they definitely had to use
some trial and error for things like the binary activity. Same with that muddy
city, that trial and error, give it a go, work out what else you could try.”
– “Initially no, but after we’d done it for a few weeks they were starting to talk
amongst themselves about what to do, ‘What haven’t we done?’, ‘Why is it doing
that?’. Initially they were just saying ”Oh it doesn’t work”, expecting you too
fix it. After that they started to actually look at what was going on, what they
were doing”
– “...they’re skills that they can be using across a range of things like problem
solving, critical thinking, being creative”
8.3.7 Cross-curricular learning
There was a large amount of cross-curricula integration in this study, and a small amount
of learning transfer. Teachers integrated the CS Unplugged and programming lessons with
a wide range of other subjects. These subjects were maths (numeracy, patterns, and ge-
ometry), literacy (reading, writing, oral language), science, languages, geography, physical
education, art, and design. Teachers with a particular focus on encouraging the Maori and
174

Pacifica students they worked with described how they integrated language and cultural
context into their lessons. Some examples of this cross-subject integration are:
• “I ended up teaching geometry in Scratch... They had to learn how to do the angles,
so they had to work out the angles of the inside and outside of the shapes in order to
get Scratch to do them... It was a really good way of teaching geometry”
• “[there is ] the obvious relationship with maths and technology, but there’s also the
fractured fairy tales and the other things with literacy, there are a lot of things you
can integrate it with”
• Describing students’ Science Fair projects —“Then you’ve got another kid who actually
designed a lab and you press different buttons and the nails go in the coke, and
sometimes one will go rusty and the other will go ... whatever. Or you’ve got kids
who did mouldy food, that kind of thing. What was quite encouraging was anecdotal
evidence that they [their usual teachers] had noticed an improvement in the quality of
their work in science, because it’s the reinforcement. That’s like, wow that’s awesome,
let’s do more of that!”
• “... they would do all the directional type things. It’s so good for the oral language
skills, the instructors had to have really good oral language.”
• “When I came back I wanted to do this Te Reo Maori ... I wanted to see how
successful I could be in using programming to teach a language. So I had a project
going on where you’d show an image of something, like a well-known building, like the
Sky Tower in Auckland, and then in Maori you would ask where that was. We had
our character going all over NZ... [a lot] of our students could not have marked on the
map where Auckland was. So, we were teaching that Tamaki-makau-rau is the Maori
name for Auckland, but we were also teaching ‘where is that place?’ ”
• “I could almost say that I could go into the classroom and just use Scratch to teach
... I could just use it all day!... I feel like I’ve taught Science, Geography, you’re
teaching literacy all the time, you’re teaching numeracy, Te Reo Maori... There’s
a lot of learning going on in this room.”
175

• “We used [CS] as a follow on from our numeracy. We went into look at the Binary
numbers first... By looking at the way we did the binary numbers to start with, and
the addition, they then started looking at other numbers and finding the patterns
that came out... It was good for their addition and counting upwards. Helping them
to count from 1-10”
After her three years of teaching CS and programming, Angela described how she felt
about teaching with Scratch: “I almost think ‘what couldn’t I teach’, let alone to see all the
thinking and the shift in their thinking”. Teachers reported that the CS and programming
supported learning in these other subjects, gave students a new way to process information,
and new ways to present their learning. Not all teachers reported these same levels of
cross-curricular success, but none said there were negative impacts on either subjects. The
challenges of time constraints on class time (and preparation time for teachers), or the already
very full primary school curriculum were brought up by every teacher who was interviewed.
However, they said that integrating CS and programming with other subjects made fitting
this in to the curriculum more doable.
These topics were also frequently integrated into students ‘inquiry’ topic, in classes that
took an inquiry based approach to learning.4 One teacher discussed the links between these
subjects and their students inquiry topic, which was based on the Christchurch rebuild.
In this they investigated the ‘gap-fillers’5 in Christchurch City Central, and then created
their own gap-fillers around their school. During this inquiry work students spent several
lessons on the CS Unplugged Muddy city problem, which their teacher then linked to the
Christchurch rebuild:
From feedback form —“Great linkage with their unit on the Christchurch rebuild
regarding networks, even though their focus [for this unit] is on the Arts. [They] could
create walking networks which took you through the different gap fillers etc in CHCH.
Good opportunity for them to work in groups and to build on group skills.”
In these lessons they expanded on the idea of city planning, building cardboard build-
ings and ensuring “that there was plenty of green space left for flowers and plants. They
4 https://en.wikipedia.org/wiki/Inquiry-based_learning
5 An ‘urban regeneration social enterprise in Christchurch’, where small installations are created aroundthe city, where many buildings have been demolished post earthquake https://gapfiller.org.nz/
176

really wanted to do more with the Muddy City other than just put pavers down”. Scratch
programming was then introduced to this topic:
“We’ve got all sorts of gap fillers around the school now. We’ve got geo-cache
boxes... But what the code club did was choose 4 or 5 of the gap fillers they visited,
then researched and found a photo and some information about them, then they coded
a maze on Scratch where they could go around and find out the information about
them, and that was based on one of the code club projects.”
“It was also great that we were able to select something directly related to their
Inquiry. They have already made part of a Sound Garden for the school as a follow
up to their visit to the city.”
Along with subject specific integrations, many teachers described how skills from these
lessons were “cross curricula strategies” and transferred to other areas of students learning.
• Discussing the CS Unplugged activities —“Those are cross curricular strategies.
They are fundamental strategies and are also life strategies. They make connections
really easily across the curriculum”
• Discussing programming —“I think the main thing is that cross curricula approach...
They want to show their learning, put a display up on the board and talk about what
they’ve been doing... For me that’s the real measure of success, that they’re applying
their learning across curricula contexts and extra curricula contexts”
8.3.8 Learning transfer
As discussed in Chapter 3, one of the main claimed benefits of CT is that the skills students
acquire through learning CS, programming, and CT will benefit them in many areas of school
and general life. It is seen as something which students will transfer to other subjects, and
use it in their approach to general problem solving and learning. This is a claim that has
not been thoroughly researched, and so was a topic I investigated in this study.
Eight of the eighteen interviewed teachers believed their students had transferred some
of the skills they learnt through CS and programming, to other subject areas. Similarly to
problem solving, some teachers had no comment on this, as they felt they needed to observe
their students over a longer period of time or test their skills somehow. Others described
benefits to students general learning, but only in the context of students social development
177

or cross-curricula activities, rather than applying skills in different areas. However, those
teachers who did discuss it gave several interesting examples:
• On transfer to maths:
Teacher: “[For coding] I would say ‘go out and draw this problem out there’ and they
could act it out, and they did it in maths as well with a problem. Because they said
‘I can’t work it out, can we go draw it out there like we do with code?’ and I said yes
and off they would go. So, they were using it in maths as well.”
Interviewer: “Did they make that connection themselves?”
Teacher: “Yes... It progressed their maths a lot”
• On general transfer:
– “The kids could make easy connections to other areas and I think that shows how
valuable it is... I can definitely see benefits and how they have learnt those skills
and can transfer them.”
– “When they realised that the skill they were focusing on wasn’t computing as
such, it was the thinking side of things, it really paid off for the kids that could
do that because they did take it through into those other subjects”
– “Although [these activities were] just in one programme that can be transferred.
Generally, kids today [aren’t very good] at transferring skills... it has to be ex-
plicitly taught. Just watching today, when they were doing that thing/ how I
taught them that if they were going to step it through yourself then what would
you do... I think it is slowly transferring, which is really good”
– “It is all about sequencing, working in a team, making sure you go step by step,
all of that stuff that you need for everyday life... It’s not just coding it’s what we
should be doing with everything. So hugely beneficial.”
8.3.9 Student impacts
Across all feedback responses and interviews conducted, teachers said the vast majority of
their students were highly engaged with, and excited by programming and CS Unplugged
activities. They described students who “loved” the activities, looked forward to the classes,
and one teacher said that if they had to cancel or move a lesson on CS or programming then
they would be “accosted in the playground!”. Many said that this was something relatively
178

unique to these subjects, for example one teacher said “the reason I kept going [with the
activities] was I noticed how engaged the kids were. Even though they struggled at times to
keep focus, struggled with that self-motivation, for some reason there is something in these
activities that sparked them”.
The game-like, physical movement, and tactile nature of the CS Unplugged activities
was frequently cited as a reason for this engagement. Teachers were asked if they felt this
engagement was related only to the style of these activities, or if it was also related to the
actual CS concepts. Some said it was due to both, while others were unsure. However,
regardless of whether the concepts were related to this engagement, teachers reported that
the majority of students had gained an understanding of the underlying concepts, and only a
small number seemed to think of these as simply games. Several teachers described individual
students in their classes who did not enjoy the content, or became bored of it, but in these
cases they stated that these students were mainly disengaged as they had high learning
needs.
Along with excitement, interest, and engagement, there were a set of similar observations
of students that stood out. These were about the strong impact these lessons had on spe-
cific students, particularly on the students ‘you wouldn’t expect’. Teachers commented that
students who were normally disengaged with learning became re-engaged by these lessons,
developed leadership skills and confidence, and in many cases achieved far beyond their
teacher’s expectations. These students tended to be described in one of several ways: quiet
and less confident; ‘less able’; or disengaged with learning in general because they struggled
with usual teaching and learning methods, particularly reading and writing. There were also
several cases were teachers observed that students in their class with dyslexia were partic-
ularly successful. Teachers observed how some of these students embraced these subjects,
and were empowered by them:
• “This task brought out the best of those that normally don’t share - I saw a side to
children that I rarely see’.’
• “Sometimes those quieter ones, they surprised me really just how well they engaged
and participated in things... seeing the children achieving and those ones that aren’t
always that fabulous at something, this was their thing, and they shone.”
• “I loved hearing from those children who would normally sit back and watch. This
really engaged them.”
• “It was awesome to see some of the more learning challenged children so excited about
their success and enthusiasm”
179

• “It was particularly pleasing to see some of the ‘quieter’ children having a go and
showing they had some really effective strategies.”
• “It was interesting to note how the less able children concentrated hard on the task
and were quite methodical in their approach, whereby some of the very able children
tended to rush into it and make errors.”
• “One group in particular just whipped through both of those [Code Club projects] and
were like ‘We’re done!’ ..and they were the group that you wouldn’t expect either...
None were natural leaders in the class. Not really techy... For them the coding worked.”
• When asked about benefits to students —“It maybe tweaked some of the attitudes
to learning for the kids who were a little bit switched off. Maybe it improved the
motivation.”
• “I think it is tapping into those children for whom that is their thing... giving them a
different way of thinking. . . You could just see the way that they enjoyed that”
For those students who usually were disengaged and found learning difficult, and in some
cases had behavioural issues as a result of this, these lessons seemed to appeal to their way
of thinking in a way that the normal curriculum did not. Some teachers who observed this
commented that this may have been due to the novelty of the lessons, but regardless these
students were successful with this content. One teacher described how a student in their
class, who had previous experience with Scratch, became a leader in their classroom, and
how much they changed throughout the year:
“One of the kids got that Scratch book for Christmas, so when I had the school
version of it with me he said ‘I’ve done this and I tried it at home!’ So, he became my
expert”
“... The child that became the expert was probably really quite immature for his
age, [but] he’s now left my class this year as the leader... his mana6 just went up.”
“...that kid wasn’t really a confident kid... he became confident in quite a few
areas.”
This story was not unique to this teacher and observations of students going through a
6 Mana is a Maori word with a range of complex meanings. In this context the teacher is describing howthe classes respect for this student, his status within the class, and his self respect increased.
180

similar process were observed in several classes.
In contrast to these stories of unexpected students being so successful, many teachers
said some of the least successful students in their classes were the ‘high achievers’, or ‘gifted
and talented students’ who they thought would have thrived in this area. Many teachers
described how this group of students often became frustrated with these activities and would
give up more quickly than their peers. Others said these students approached the subjects
with a slight degree of arrogance, rushed through the learning, did not pay attention to
detail in their work, and at the end had gained less knowledge or achieved less than their
classmates. Three submissions in the feedback form were from a teacher who ran several CS
Unplugged activities with a ‘gifted and talented’ class.7 These were notable as this teacher
had done these activities with a range of different classes and students before, and this
group did not progress through as much content as other classes (of the same age group) the
teacher had worked with. The students were highly engaged, but the teacher remarked that
they tried to rush through the activities, missed steps in the process, and did not appear to
gain as deep an understanding of the underlying concepts.
One interview in particular demonstrated this stark difference between these students
when they worked through these lessons. They described their students’ approach to one of
the CS Unplugged activities:
“what was really interesting to me... I have five profoundly gifted children in
my class. They sat back and normally they do everything. [Normally] they know
everything and everything is easy, and they sat back and these other children who I
have never even seen this side of the them...
These are practical farming kids ... there was this group of five of them that
basically just did it [the whole activity]. They are the dyslexic kids, the really problem
solving kids... But it was fast and I am talking about kids - I have a boy who can
barely read, very dyslexic, and he could just see it really clearly and a lot faster than
I did when I did it myself.
That made me look at those children differently, and it was right at the start of
the year and I hadn’t seen that side of them before. It was really interesting.”
7 These classes took place at Mindplus, a programme for gifted and talented students. https://nzcge.
co.nz/mindplus
181

8.4 Conclusion
Throughout 2015 and 2016, I worked with a large number of teachers from a diverse range of
school environments. These teachers were provided with training and resources for teaching
CS Unplugged and programming, and shared their experiences of teaching this material
with me. By collecting feedback on lessons and observations of students learning, I aimed to
gather more information on how teachers can be supported to teach these topics, to evaluate
the suitability of the resources used, and to investigate students development and use of
Computational Thinking skills.
The first two of my research questions were: Can Computer Science and basic skills
be taught in a typical primary school environment?, and How suitable were the teaching
resources chosen for use?
Throughout this study teachers reported that the vast majority of their students were
able to engage with the lessons, and did seem to be developing an understanding of Com-
puter Science and programming. The reception of the resources and activities provided was
highly positive, from both teachers and students. During this study, I found that teachers
consistently, and successfully, integrated these topics into their teaching. They found that
subject content could be made suitable for the different age groups, and students of all ages
were able to engage with both the CS and programming (unplugged or ‘plugged’) content.
Teachers were generally happy with the support they received. The main suggestions for
how it could be improved were to have more focus on connecting teachers so that they could
collaborate and support each other; and to build on current resources, or create more, which
gave them a clearer idea of how their students should be progressing in this subject over
time.
The third of my research questions for this study was: Can students develop Compu-
tational Thinking skills through learning Computer Science and programming? From my
results, I concluded that yes, as a result of the CS Unplugged and programming lessons they
took part in, students developed CT skills. All five of the CT approaches, and five of the six
CT concepts were observed by the majority of teachers, in their classes. The one concept
which was not observed frequently was Abstraction, which was likely due to the age group
of these primary school students. There were however several examples of students using or
learning Abstraction, indicating that although it was not as common as the other CT skills,
Abstraction was still attainable for some students in these classes. Teachers reported that
the use and development of these skills were directly related to the CS and programming
182

lessons, and in some cases was enforced by existing curriculum
My fourth question was: Can learning Computer Science and programming, and devel-
oping Computational Thinking skills, have an impact on problem solving skills or general
learning, for the majority of students? One of the main positive impacts CT is claimed to
have for learners is that it will improve their problem solving skills in both school subjects,
and in their general life. This has been a contentious claim in the CS education community,
as there was little research to support this claim. However, the results of my work lend sup-
port to this claim, as the majority of teachers believed that learning CS, programming, and
developing CT skills had a positive effect on their students’ problem solving skills. There
were also observations of learning transfer occurring, including between subjects which had
not been explicitly integrated with the CS and programming content. This was limited to
a small number of teachers however, eight out of a total of 32. While these observations of
learning transfer were not common, they may lend further support to the claims of CT skills
positive impacts on students.
My final question was: What other impacts can learning Computer Science and program-
ming, and developing Computational Thinking skills have on students? Teachers reported
that for the majority of students there were no negative impacts of these lessons, and the
only negative impacts that had been observed was temporary frustration from some of the
typically high-achieving students in classes. The CS Unplugged activities were described
as highly engaging, beneficial for students teamwork and social skills, and fun. Program-
ming in block-based languages, with Bee-Bots, and through the KidBots activity, was also
highly engaging for students, and gave them a new way to show their creativity, present
their learning, and to challenge themselves. Along with these general positive experiences,
teachers identified individual students in their classes who became particularly engrossed
with these subjects and experienced greater success than their teachers had expected. As a
result of these positive impacts, all teachers who were interviewed stated they were planning
on continuing to teach these topics in the future.
These reports from teachers provide evidence that the CT can have benefits for problem
solving skills, and that CT skills can be developed by primary school students, through CS
and programming education. As the results of this study were based entirely on reports from
teachers however, no objective measurements of students CT and problem solving skills had
been made. Because of this, I chose to conduct an intervention study in 2017, with the aim
of quantifying students CT skills before and after they took part in CS and programming
lessons.
183

Chapter IX
Intervention Study
After three years of working with teachers and students, I had found student engagement
in Computer Science and programming lessons was consistently high. With adequate sup-
port teachers were able to successfully integrate Computer Science and programming into
their classroom programme, and into other curriculum areas. Teachers frequently observed
positive impacts on their students’ learning, problem solving skills, and persistence in prob-
lem solving. Each CT skill (concepts and approaches) had been displayed by students, and
teachers believed the CS and programming lessons had directly contributed to the devel-
opment of these skills. These observations make compelling evidence that through learning
CS and programming students can develop CT skills, and these skills can have a range of
positive effects on their learning. This evidence is strengthened by the consistency of these
observations across a range of classroom environments. However, changes in students’ CT
and problem solving skills had not been objectively measured during these studies.
This final study aimed to further investigate how programming and CS lessons impacted
students’ CT and problem solving skills, by attempting to measure the CT skills of students
before, and after they took part in these lessons. Based on my previous findings, my hypoth-
esis was that the lessons would improve students’ CT skills, would improve some students’
problem solving skills, and would not have a negative impact on students’ overall learning
or problem solving skills.
In this chapter I cover how this study was conducted, the types of data collected, and
how this was analysed. I then report the results of the Computational Thinking assessment
students completed, and the themes identified from the analysis of teacher interviews. I
discuss the possible implications of these results, and the limitations of these. Finally, with
reference to the research questions I aimed to address, I discuss my conclusions and the prior
findings that these support.
184

9.1 Overview
Over 2015 and 2016 I focused on subjective data, examining teachers’ opinions and ob-
servations. This provided valuable insight into the impact of these topics in classes from
experienced professionals in the teaching field. For this study, I chose to again interview
teachers in order to gain more information about students’ classroom experiences, and to
also quantitatively measure students’ CT skills.
I worked with three schools during this study, which I will refer to as Primary School
A, Full-primary School B, and Intermediate School C. Across these schools I worked with
students from years 4 to 8 (ages 8-13). All of the teachers I worked with taught one class of
students at their school. Primary School A was a decile 3 primary school, covering year 1
to 6. I worked with three teachers at this school, who taught year 4-6 (ages 8-11) students.
Full-primary School B was a decile 9 full-primary, and so covered all year groups from year
1 to 8. I worked with four teachers at Primary School A. Two of these teachers taught year
4-6, and two taught year 7-8 (ages 11-13). Intermediate School C was a decile 7 intermediate,
with students in years 7 and 8. I worked with six teachers at this school, four of whom taught
year 7 (ages 11-12) students, and two who taught year 8 (ages 12-13) students. These schools
were all state schools (i.e. not private) and greatly varied in ethnic make-up, and students’
socio-economic backgrounds.
I trained these teachers in using Computer Science Unplugged to teach Computer Science
and asked them to teach a set of these activities in their lessons. I also asked them to have
their students use an online programming education platform to do programming lessons.
Before they began teaching this content I had students from these teachers classes, and as
many other classes at each school as logistically possible, complete the Bebras Computational
Thinking Challenge as a pre-test of students CT skills. At the end of the school term, after all
participating teachers had completed the CS and programming lessons, I had these students
complete another Bebras Computational Thinking Challenge (with different questions) as
a post-test of their CT skills. This study was limited to Year 4-8 students, as the Bebras
challenges I was able to access were designed for years 4 and up, and were too advanced for
younger students. I then interviewed the teachers who had participated and asked about
their experiences with, and observations of the study. I also collected students’ demographic
information from their schools. The results of these tests and the interview transcripts were
used to attempt to answer the following research questions.
185

9.1.1 Research questions
The goal of this study was to verify conclusions from the previous two studies by using
an additional measurement approach, and working with a group of teachers who were not
entirely self-selected.
My research questions were, therefore, similar to those of my previous studies:
1. Can learning Computer Science and programming develop, or improve, Computational
Thinking skills for the majority of students? (RQ2)
2. Can Computer Science and programming lessons, and developing Computational Think-
ing skills have an impact on problem solving skills, for the majority of students? (RQ3.1
and 3.2)
3. Can Computer Science and programming lessons, and developing Computational Think-
ing skills have an impact on overall learning for the majority of students? (RQ3.3 and
3.4)
4. If these lessons do have an impact on students’ Computational Thinking skills or
their overall learning, do these impacts differ between students of different genders or
ethnicities? (supports RQ2 and 3)
5. What other impacts can learning Computer Science and programming, and developing
Computational Thinking skills have on students? (RQ4)
9.2 Method
At each school, I worked with multiple teachers who each taught a different class. Teachers
taught CS Unplugged and programming lessons throughout term 3 of the school year. These
schools were chosen as they volunteered to take part, and they had not previously taught
CS, programming, or CT material to their students. This applied to all classes in the school,
not just those who were taught by participating teachers.
Before the school term began I visited each of the schools and conducted a one-day
workshop with the participating teachers. During these, I covered the CS Unplugged lessons
on Binary numbers, binary representation of text and images, the Parity card and Barcode
tricks for teaching error detection and correction algorithms, unplugged programming with
186

KidBots, and the Sorting Network. Teachers were asked to teach the CS Unplugged activ-
ities on binary, error correction and detection, and unplugged programming. Binary image
representation and the Sorting Network were given as optional activities, which teachers
could use if they had time. I directed teachers to the additional data representation and
algorithms activities from the “Classic version” of CS Unplugged, as at this point in time
the new version of CS Unplugged did not include these. These additional activities were
also optional extensions.
During these workshops I also had teachers register for teacher accounts on Code Avengers1.
Code Avengers is an NZ based Education Technology company, sponsored by the NZ Min-
istry of Education, who provide an online platform for learning programming targeted at
students and teachers. I intended for teachers to use this for programming lessons, and dis-
cussed with them how I would like them to go about using it. Unfortunately however, during
the study, multiple issues arose with this system and it was not useable for the majority of
the classes. These issues are discussed in section 9.3.2. Teachers were asked to complete a
minimum of ten lessons on these topics with their classes. A lesson was approximately 45-60
minutes. Originally, at least two of the ten lessons needed to be on programming, and it
was recommended that at least three were. However, it was not possible for all classes to
complete this many lessons on programming.
At the beginning of term 3, before the CS and programming classes began, a pre-test
was conducted. Students participating in the study, and as many other classes as logistically
possible, took this test at each school. The non-participating students were in the same year
levels as the participating students and were used as a control group. At the end of term 3,
a post-test was given to all students who completed the pre-test.
9.2.1 Conducting the pre and post-tests
The Bebras challenges from 2016 and 2017 were used for the pre and post-tests. The Bebras
challenge is divided by age levels, and so year 4-6 students were given different versions of
these tests, than those given to the year 7-8 students. Bebras gives different year group
categories different names: year 4-6 are called ‘Castors’, and year 7-8 are called ‘Benjamins’.
The four different versions of the tests will be referred to as:
• ‘Castors A’ — The 2016 version of the year 4-6 challenge.
1 https://www.codeavengers.com/
187

• ‘Castors B’ — The 2017 version of the year 4-6 challenge.
• ‘Benjamins A’ — The 2016 version of the year 7-8 challenge.
• ‘Benjamins B’ — The 2017 version of the year 7-8 challenge.
During the pre-tests, students in each class were randomly assigned to either an A chal-
lenge (2016 version) or B challenge (2017 version), for their respective age group. In each
class, half the students were given an A and half were given a B test. During the post-tests
students who completed the A test as a pre-test were then given a B test, and vice versa.
To indicate the order of tests a group of students did, the groups will be referred to as
Castors A-B, Castors B-A, Benjamins A-B, and Benjamins B-A. For example, a student in
the group Benjamins A-B would have taken the 2016 version of the Benjamins challenge for
their pre-test, and then the 2017 Benjamins challenge for their post-test.
Some questions appeared in both the Castors and Benjamins tests, generally with a
different difficulty rating, e.g. a medium Castors question may then appear as an easy
Benjamins question. An example of the questions in the tests is the “Animation” question
shown in Figure 9.1. This appeared in both the Castors and Benjamins A tests and is shown
as an example question2 for ages 11-12 on the Bebras website.3
The tests were carried out successfully at each school.
9.2.2 Additional Student Data Collection
In addition to the pre and post-test results, I collected the following data on students:
• Name (in order to distinguish between students).
• Gender, as recorded by their school.
• Year level.
• Class they would be in during the study.
• Ethnicity, as recorded by their school.
• Their most recent National Standards results in Reading and Mathematics, as recorded
by the school.
2 As students were not given any information about the Bebras challenge, other than actually being giventhe tests to do, it is highly unlikely any participating students would have seen this question online beforedoing the tests.
3 https://www.bebras.org/?q=examples
188

Figure 9.1: Example Bebras question ‘Animation’ — Reproduced from the Bebras Interna-tional Challenge on Informatics and Computational Thinking website, www.bebras.org.
189

• Students’ scores in a pre-test and post-test.
• Information on their use of the Code Avengers website, including the amount of time
they spent on each task, how many tasks they completed, and their scores in these
tasks.
Students’ Reading and Mathematics National Standards were collected to see if these
had a significant impact on students’ results in the Bebras challenge. These two measures
were chosen as the Bebras challenge requires a significant amount of reading and reading
comprehension, and past research has shown a generally positive correlation between maths
skills and CS and programming ability.
9.2.3 Interviews
After the school term ended, each participating teacher was interviewed about their expe-
riences and classroom observations. These were semi-structured interviews and were con-
ducted in a similar way to the interviews described in Chapter 8. The one difference was
these interviews were less open-ended than the previous, as teachers in this study had less
freedom in choosing what they taught in class.
9.2.4 Data Analysis
Due to technical difficulties with the Code Avengers platform the data collected on students
use of the website was unable to be used in any analysis.
Bebras Computational Thinking tests
For a full description of the Bebras marking process please refer to 6.4.1 of chapter 6.
After obtaining the results from the Bebras tests I first cleaned the data by following the
steps:
1. Matched results to individual students using the names students entered on the test,
and the class lists obtained from each school. This involved removing several entries
where students had entered false names (e.g. “Cool Guy”) or nicknames which could
not be matched to full names.
2. Removed students who had not been given parental permission to participate.
190

3. Removed students who had only completed one of the tests.
4. Added the additional information of which school and class each student was from;
whether a student was a participant or a control; their gender, ethnicity, Reading level,
and Maths level; and which test group they were a part of out of Castors A-B, Castors
B-A, Benjamins A-B, and Benjamins B-A.
I also removed one of the questions from the Castor B and Benjamins B tests, as it was
deemed too ambiguous due to the way it was explained and displayed. This was based on
mine and several of the participating teachers’ judgement.
As previously described in section 6.4.1 of chapter 6, Bebras questions are rated as
easy, medium, or hard, and the level of difficulty of a question dictates how many points are
awarded, or deducted, for correct or incorrect answers to it. Each challenge is made up of five
easy, five medium, and five hard questions. As assigning difficulty ratings to these questions
has been found to be challenging and inaccurate in the past [23], I tested the accuracy of
these original ratings. I took the number of times each question was answered correctly
and ranked these. The questions were then assigned new difficulty ratings based on these
rankings, with five questions of each difficulty. As previously mentioned one question had to
be removed from both the 2017 Castors and Benjamins challenges, and so one category of
difficulty only contained four questions for these two quizzes. The assigned difficulty ratings
in the Castors A test were found to be accurate, when compared with the number of times
they were correctly answered. However, all three of the other tests contained inaccurate
difficulty ratings. The difficulty of a question needed to be changed five times for Benjamins
A, seven times for Castors B, and eight times for Benjamins B. This reassigning of the
difficulty levels is described more clearly by tables 9.2a through 9.2d.
The question “Hurlers Shake Hands” from the Benjamins B test was only answered
correctly by 4% of students, a much lower proportion than any other question across all four
tests, where the lowest success rates were 13%, 18%, and 24%. This question was therefore
removed from the data set, leaving 13 questions in the Benjamins B test.
The Bebras marking system deducts points for incorrect answers. The goal of this is to
discourage students from guessing answers. Students are all awarded a bonus 45 points, to
avoid students getting a negative score if they answered all questions incorrectly. I chose
to eliminate the bonus points and the point deductions, and give zero for incorrect answers
instead. I did this as the majority of students attempted all, or all but one, of the questions
191

(a) Assigned difficulties for the Castors(years 4-6) 2016 Challenge
(b) Assigned difficulties for the Benjamins(years 7-8) 2016 Challenge
(c) Assigned difficulties for the Castors(years 4-6) 2017 Challenge
(d) Assigned difficulties for the Benjamins(years 7-8) 2017 Challenge
Figure 9.2: Reassigned difficulties for each test, based on how many students answered eachquestion correctly.
in the tests so the possibility of losing points did not appear to impact their choice of whether
or not to answer a question. Also, based on mine and teachers’ observations it was not clear
if students understood this point deduction system.
192

After reassigning the difficulty levels, removing the problematic questions, and changing
negative marks to zero, all students’ results were recalculated. Students’ normalised learning
gain was then calculated using Equation 9.1 from [91].
gain =
post−pre100%−pre
if post ≥ pre
post−prepre
if post < pre(9.1)
The tests used to investigate students’ results and learning gain are described in section
9.4.
Interviews
As in the previous study, the interviews were transcribed and thematically analysed. The
themes identified in these were similar to those discussed in Chapter 8, and observations of
Computational Thinking were identified using the same method as in Chapter 8.
9.3 Schools and participant details
The total amount of useable data collected from each school is shown in Table 9.1. Data for
students who did not return permission forms, and who only completed one out of the pre
and post-tests, was discarded.
Two of the three teachers from Primary School A, all teachers from Full-primary School B,
and five of the six teachers from Intermediate School C were interviewed. The other teachers
from Primary School A and Intermediate School C were not available for an interview.
9.3.1 Schools and students
The proportion of female and male students within Full-primary School B (44% female, 56%
male) and Intermediate School C (53% female, 47% male) was relatively even. At Primary
School A, however, 63% of the students were female. This over-representation may have
been due to not all classes in the school being included in the study, or may simply mirror
the gender ratio within the school’s total student population.
The proportion of students at each Reading and Maths level, at each school are shown in
figure 9.3. This data was missing for a small number of students, so this data does not add
to 100% for every school. The proportion of students at the Well Below and Below levels
for Reading was much higher at Intermediate School C (28%) and Primary School A (30%)
193

Data type PrimarySchool A
Full-primarySchool B
IntermediateSchool C
62 students 129 students 125 students
3 participatingteachers
4 participatingteachers
6 participatingteachers
Year Valid 62 129 125
Missing 0 0 0
Ethnicity Valid 60 129 122
Missing 2 0 3
Gender Valid 60 129 122
Missing 2 0 3
Reading level Valid 60 126 122
Missing 2 3 3
Maths level Valid 60 122 122
Missing 2 7 3
Table 9.1: Useable student data collected from each school
194

Figure 9.3: Students Reading and Maths levels at each school.
195

Figure 9.4: Proportion of students belonging to each ethnicity, at each school.
than at Full-primary School B, for both the Full-primary School B year 4-6 group (8%) and
the year 7-8 group (16%). This was also true for Maths, where the proportion of students
in the Well Below and Below groups for Maths was much higher at Intermediate School C
(24%) and at Primary School A (particularly high at 37%) than at Full-primary School B,
for both the Full-primary School B year 4-6 group (8%) and the year 7-8 group (14%).
There were also large differences between the ethnic make-up of students at each school,
as shown in Figure 9.4. Primary School A had a much higher proportion of Maori and
Pacifica students and lower proportion of Pakeha/European students, compared to the other
schools. Full-primary School B had a much higher proportion of Asian students, compared
to Primary School A and Intermediate School C.
9.3.2 Content covered
Table 9.2 shows what topics each teacher taught. For reference, the required CS Unplugged
activities were: Binary numbers, binary representation of text, the Parity card and Barcode
tricks for teaching error detection and correction algorithms, and unplugged programming
196

with KidBots. The Sorting Network and the image representation activities (from the Clas-
sic CS Unplugged website) were optional extra lessons. All classes did the required CS
Unplugged lessons, except for one who did not do the barcodes activity. Four teachers
taught either image representation or the Sorting Network as an additional activity.
9.4 Results: Computational Thinking Tests
The distributions of students’ scores in the Castors and Benjamins tests are shown in figures
9.5a and 9.5b. The distribution of scores within each school are shown in figures 9.6a through
9.6d.
I used an independent samples t-test to establish whether the 2016/2017 tests, for each
age group, were of similar difficulty, by comparing the pre-test scores of students. The
results of this for the Castors (years 4-6) tests are shown in table 9.3, and the results for the
Benjamins (year 7-8) tests are shown in table 9.4. These showed that the Castors A and
Castors B tests were comparable, but the Benjamins A and Benjamins B tests were not.
Because of this, the order year 7-8 students took the tests in will have impacted the change
in their scores, so these two groups will be examined separately.
I used a t-test to establish whether there were significant differences between students’
pre-test scores depending on the school they attended. Because of the differences between
the Benjamins A and B tests, the year 7-8 students are examined separately based the order
of tests they took. These showed there was a significant differences between students’ pre-
test scores at Primary School A and at Full-primary School B (year 4-6), shown in table 9.5.
There was also a significant difference between students’ pre-test scores, for both Benjamins
tests, at Full-primary School B (year 7-8) and at Intermediate School C, as shown in tables
9.6 and 9.7.
Due to these significant differences between the difficulty of some tests, and the significant
difference between students’ scores at different schools, the following analysis is divided into
six sections. These are:
1. Results for Primary School A (years 4-6).
2. Results for Full-primary School B (years 4-6).
3. Results for Full-primary School B (years 7-8), test order A-B.
4. Results for Full-primary School B (years 7-8), test order B-A.
5. Results for Intermediate School C (years 7-8), test-order A-B.
197

Top
icscovered
Req
uired
activities
Sortin
gN
etwork
Image
representation
Pyth
on(C
ode
Aven
gers)Scratch
Prim
arySch
ool
AClass
A1
Yes
No
Yes
No
Yes
(studen
tsplay
ing)
Class
A2
Yes
Yes
No
No
No
Full-p
rimary
Sch
ool
B
Class
B1
(4-6)Y
esY
esN
oN
oY
es(C
ode
Clu
ban
dteach
erdirected
)C
lassB
2(4-6)
Yes
No
No
No
Yes
(Code
Clu
b)
Class
B3
(7-8)Y
esN
oN
oN
oY
es(C
ode
Clu
b)
Class
B4
(7-8)Y
esN
oY
esN
oY
es(C
ode
Clu
b)
Interm
ediate
Sch
ool
CC
lassC
1Y
esN
oN
oY
es(2-3
lessons)
No
Class
C2
Yes
No
No
Yes
(2-3lesson
s)N
oC
lassC
3Y
esN
oN
oY
es(2-3
lessons)
No
Class
C4
Yes,
excep
tbarco
des
No
No
Yes
(6-7lesson
s)N
o
Class
C5
Yes
No
No
Yes
(with
exten
sionstu
den
tson
ly)
No
Tab
le9.2:
Top
icstau
ght,
and
program
min
glesson
sdon
ein
eachparticip
ating
class
198

Test N Mean Std. Dev t Sig.
Castors 2016 53 37.8% 23.8% 0.320 0.750
Castors 2017 60 36.4% 19.2%
Table 9.3: Comparing difficulty levels of the Castors 2016/2017 (A/B) tests, based on stu-dents pre-test scores.
Test N Mean Std. Dev t Sig.
Benjamins 2016 100 54.5% 33.3% 4.952 <0.001
Benjamins 2017 103 39.6% 30.7%
Table 9.4: Comparing difficulty levels of the Benjamins 2016/2017 (A/B) tests, based onstudents pre-test scores.
School N Mean Std. Dev t Sig.
Primary School A 62 26.7% 16.6% -6.527 <0.001
Full-primary School B (year 4-6) 51 49.6% 19.9%
Table 9.5: Comparing results of the Castors tests within different schools, based on thepre-test results.
School (2016 test) N Mean Std. Dev t Sig.
Full-primary School B (year 7-8) 37 61.1% 20.7% -2.269 0.026
Intermediate School C 63 50.7% 24.3%
Table 9.6: Comparing results of the Benjamins A test within different schools, based on thepre-test results.
School (2017 test) N Mean Std. Dev t Sig.
Full-primary School B (year 7-8) 41 47.0% 21.2% -3.161 0.002
Intermediate School C 62 34.6% 16.5%
Table 9.7: Comparing results of the Benjamins B test within different schools, based on thepre-test results.
199

(a)
(b)
Figure 9.5: Distribution of scores within each age group
6. Results for Intermediate School C (years 7-8), test-order B-A.
Within each of these sections the following analysis is reported on:
1. Independent samples t-test to compare the learning gain of participants to controls.
2. Independent samples t-test to compare the pre-test scores and learning gain, of female
students to male students.
3. Independent samples t-test to compare the pre-test scores and learning gain, of Maori/Pacifica
students to non-Maori/Pacifica students.
200

(a) (b)
(c) (d)
Figure 9.6: Test scores within each school.
201
4. One-way ANOVA to compare the pre-test scores and learning gain, of students of
different ethnicities.
5. Spearman’s correlation to test for a relationship between students’ Maths Levels, and
their pre-test scores and learning gain.
6. Spearman’s correlation to test for a relationship between students’ Reading Levels,
and their pre-test scores and learning gain.
9.4.1 Primary School A
The results for Primary School A are shown in tables 9.8, 9.9, and 9.10.
• There was no significant difference in learning gain between participants and controls,
at the p>0.05 level (Table 9.8).
• There was a significant difference in pre-test scores between female students and male
students, at the p<0.05 level (Table 9.9). This was unexpected, due to the body of
research showing that gender and sex do not have a significant impact on abilities
in maths, programming, and CS. At this school there was a much larger proportion
of male students in the ‘At’ and ‘Above’ levels in both Maths (85.7%) and Reading
(85.7%) compared to the female students (48.7% and 61.5%). Maths and Reading
were both found to have a significant impact on students scores in multiple cases,
so it is likely that this impacted the difference in female and male students’ scores.
This difference in Reading and Maths Levels between female and male students was
not observed at any other school, and does not reflect the national trends for these
levels. Out of all students in NZ, between 75-80% of both female and male students
are placed at the ‘At’ or ‘Above’ levels for Reading and Maths. Therefore these results
on the influence of gender are not representative. There was no significant difference in
learning gain between female students and male students, at the p<0.05 level (Table
9.8).
• There was no significant difference in pre-test scores between Maori/Pacifica stu-
dents and non-Maori/Pacifica students, at the p<0.05 level (Table 9.9). There was
no significant difference in learning gain between Maori/Pacifica students and non-
Maori/Pacifica students, at the p<0.05 level (Table 9.8).
202

Learning Gain, Primary School A
Group N Mean Std. Dev t Sig.
Participant 49 -0.430% 30.39% 0.756 0.453
Control 13 6.82% 32.11%
Female students 39 -0.70% 27.59% -0.918 0.362
Male students 21 6.80% 34.60%
Maori/Pacifica students 26 -2.06% 32.59% 0.685 0.495
Non-Maori/Pacificastudents
36 3.37% 29.40%
Table 9.8: T-test results comparing learning gain within groups of students, at PrimarySchool A.
Pre-test scores, Primary School A
Group N Mean Std. Dev t Sig.
Female students 39 23.07% 12.47% -2.484 0.016
Male students 21 33.92% 21.42%
Maori/Pacifica students 26 27.68% 13.65% -0.379 0.706
Non-Maori/Pacificastudents
36 26.04% 18.67%
Table 9.9: T-test results comparing pre-test results within groups of students, at PrimarySchool A.
203

Reading and Maths levels, Primary School A
N Corr. Coefficient Sig.
Maths Pre-test score 60 0.340 0.008
Learning Gain 60 0.022 0.868
Reading Pre-test score 60 0.489 <0.001
Learning Gain 60 0.025 0.848
Table 9.10: Spearman’s correlation between students’ Maths and Reading levels, and theirpre-test scores and learning gain, at Primary School A.
• A one-way between subjects ANOVA was conducted to compare the effect of students’
ethnicity on pre-test scores, and another to compare the effect of ethnicity on learning
gain. There was no significant impact of ethnicity on students’ pretest scores at the
p<0.05 level [F(3,55) = 1.25, p=0.30]. There was also no significant impact of ethnicity
on learning gain at the p<0.05 level [F(3,55) = 0.46, p=0.71].
• There was a moderately positive correlation between Maths level and pre-test score,
which was statistically significant at the p<0.01 level. There was no significant corre-
lation between Maths and learning gain, at the p<0.05 level (Table 9.10).
• There was a moderately positive correlation between Reading level and pre-test score,
which was statistically significant at the p<0.01 level. There was no significant corre-
lation between Reading and learning gain, at the p<0.05 level (Table 9.10).
9.4.2 Full-primary School B, years 4-6
The results for Full-primary School B, years 4-6, are shown in tables 9.11, 9.12, and 9.13.
• There was no significant difference in learning gain between participants and controls,
at the p<0.05 level (Table 9.11).
• There was no significant difference in pre-test scores between female students and male
students, at the p<0.05 (Table 9.12). There was a significant difference in learning
gain between female students and male students, at the p<0.05 level (Table 9.11).
204

Learning Gain, Full-primary School B(4-6)
Group N Mean Std. Dev t Sig.
Participant 34 3.06% 38.70% 1.335 0.188
Control 17 18.56% 39.96%
Female students 23 21.92% 35.27% 2.348 0.023
Male students 28 -3.02% 39.66%
Table 9.11: T-test results comparing learning gain within groups of students, at Full-primarySchool B (year 4-6 students).
Pre-test scores, Full-primary School B(4-6)
Group N Mean Std. Dev t Sig.
Female students 23 48.03% 19.53% -0.500 0.619
Male students 28 50.84% 20.42%
Table 9.12: T-test results comparing pre-test results within groups of students, at Full-primary School B (year 4-6 students).
Reading and Maths levels, Full-primary School B (year 4-6 students)
N Corr. Coefficient Sig.
Maths Pre-test score 48 0.340 0.018
Learning Gain 48 0.284 0.050
Reading Pre-test score 48 0.168 0.254
Learning Gain 48 0.247 0.091
Table 9.13: Spearman’s correlation between students’ Maths and Reading levels, and theirpre-test scores and learning gain, at Full-primary School B (years 4-6 students).
205

This may have been due to their being more female students in the B-A test group
than their were in the A-B group, while the number of male students in each of these
groups was relatively even.
• There was only one Maori/Pacifica student in this group of students, so no comparisons
could be made between Maori/Pacifica and non-Maori/Pacifica students.
• A one-way between subjects ANOVA was conducted to compare the effect of students’
ethnicity on pre-test scores, and another to compare the effect of ethnicity on learn-
ing gain. There was no significant impact of ethnicity on students’ pretest scores at
the p<0.05 level [F(2,48) = 0.055, p=0.95]. There was also no significant impact of
ethnicity on learning gain at the p<0.05 level [F(2,48) = 1.476, p=0.24].
• There was a moderately positive correlation between Maths level and pre-test score,
which was statistically significant at the p<0.05 level. There was a weak positive corre-
lation between Maths and learning gain, which was marginally statistically significant
at the p<0.05 level, with p=0.050 (Table 9.13)
• There was no significant correlation between Reading and pre-test score, at the p<0.05
level. There was a no significant correlation between Reading and learning gain (Table
9.13).
9.4.3 Full-primary School B, years 7-8, test order A-B
The results for Full-primary School B, years 7-8 and test order A-B, are shown in tables
9.14, 9.15, and 9.16.
• There was no significant difference in learning gain between participants and controls,
at the p<0.05 level (Table 9.14).
• There was no significant difference in pre-test scores between female students and male
students, at the p<0.05 (Table 9.15). There was no significant difference in learning
gain between female students and male students, at the p<0.05 (Table 9.14).
• There was only one Maori/Pacifica student in this group of students, so no comparisons
could be made between Maori/Pacifica and non-Maori/Pacifica students.
206

Learning Gain, Full-primary School B (7-8, A-B)
Group N Mean Std. Dev t Sig.
Participant 22 -12.14% 24.19% 1.119 0.271
Control 15 -22.77% 33.69%
Female students 15 -19.35% 28.46% -0.506 0.616
Male students 22 -14.47% 28.98%
Table 9.14: T-test results comparing learning gain within groups of students (between testsA-B), at Full-primary School B (years 7-8 students).
Pre-test scores, Full-primary School B (7-8, A-B)
Group N Mean Std. Dev t Sig.
Female students 15 63.56% 23.07% 0.594 0.556
Male students 22 59.39% 19.33%
Table 9.15: T-test results comparing pre-test results within groups of students (test A), atFull-primary School B (years 7-8 students).
Reading and Maths levels, Full-primary School B (7-8, A-B)
N Corr. Coefficient Sig.
Maths Pre-test score 36 0.492 0.002
Learning Gain 36 -0.227 0.184
Reading Pre-test score 37 0.603 <0.001
Learning Gain 37 -2.00 0.236
Table 9.16: Spearman’s correlation between students’ Maths and Reading levels, and theirpre-test scores (test A) and learning gain (between tests A-B), at Full-primary School B(years 7-8 students).
207

• A one-way between subjects ANOVA was conducted to compare the effect of students’
ethnicity on pre-test scores, and another to compare the effect of ethnicity on learn-
ing gain. There was no significant impact of ethnicity on students’ pretest scores at
the p<0.05 level [F(3,33) = 1.010, p=0.40]. There was also no significant impact of
ethnicity on learning gain at the p<0.05 level [F(3,33) = 0.512, p=0.68].
• There was a moderately positive correlation between Maths level and pre-test score,
which was statistically significant at the p<0.01 level. There was no significant corre-
lation between Maths and learning gain, at the p<0.05 level (Table 9.16).
• There was a moderately positive correlation between Reading level and pre-test score,
which was statistically significant at the p<0.01 level. There was no significant corre-
lation between Reading and learning gain, at the p<0.05 level (Table 9.16).
9.4.4 Full-primary School B, years 7-8, test order B-A
The results for Full-primary School B, years 7-8 and test order B-A, are shown in tables
9.17, 9.18, and 9.19.
• There was no significant difference in learning gain between participants and controls,
at the p<0.05 level (Table 9.17).
• There was no significant difference in pre-test scores between female students and
male students, at the p<0.05 level (Table 9.18). There was no significant difference in
learning gain between female students and male students, at the p<0.05 level (Table
9.17).
• There was no significant difference in pre-test scores between Maori/Pacifica stu-
dents and non-Maori/Pacifica students, at the p<0.05 level (Table 9.18). There was
no significant difference in learning gain between Maori/Pacifica students and non-
Maori/Pacifica students, at the p<0.05 level (Table 9.17).
• A one-way between subjects ANOVA was conducted to compare the effect of students’
ethnicity on pre-test scores, and another to compare the effect of ethnicity on learn-
ing gain. There was no significant impact of ethnicity on students’ pretest scores at
the p<0.05 level [F(3,37) = 0.635, p=0.60]. There was also no significant impact of
ethnicity on learning gain at the p<0.05 level [F(3.37) = 1.230, p=0.31].
208

Learning Gain, Full-primary School B (7-8, B-A)
Group N Mean Std. Dev t Sig.
Participant 19 30.49% 42.34% 0.193 0.848
Control 22 28.31% 29.77%
Female students 19 33.80% 31.88% 0.743 0.462
Male students 22 25.45% 38.99%
Maori/Pacificastudents
4 1.67% 11.64% -1.668 0.103
Non-Maori/Pacificastudents
37 32.31% 36.18%
Table 9.17: T-test results comparing learning gain within groups of students (between testsB-A), at Full-primary School B (years 7-8 students).
Pre-test scores, Full-primary School B (7-8, B-A)
Group N Mean Std. Dev t Sig.
Female students 19 46.95% 18.30% -0.009 0.993
Male students 22 47.01% 23.69 %
Maori/Pacificastudents
4 42.76% 28.70% -0.417 0.679
Non-Maori/Pacificastudents
37 47.44% 20.59%
Table 9.18: T-test results comparing pre-test results within groups of students (test B), atFull-primary School B (years 7-8 students).
209

Reading and Maths levels, Full-primary School B (7-8, B-A)
N Corr. Coefficient Sig.
Maths Pre-test score 38 0.534 0.001
Learning Gain 38 0.278 0.092
Reading Pre-test score 41 0.424 0.006
Learning Gain 41 0.441 0.004
Table 9.19: Spearman’s correlation between students’ Maths and Reading levels, and theirpre-test scores (test B) and learning gain (between tests B-A), at Full-primary School B(years 7-8 students).
• There was a moderately positive correlation between Maths level and pre-test score,
which was statistically significant at the p<0.01 level. There was no significant corre-
lation between Maths and learning gain, at the p<0.05 level (Table 9.19).
• There was a moderately positive correlation between Reading level and pre-test score,
which was statistically significant at the p<0.01 level. There was a moderately positive
correlation between Reading level and learning gain, which was statistically significant
at the p<0.01 level (Table 9.19).
9.4.5 Intermediate School C, test-order A-B
The results for Intermediate School C, test order A-B, are shown in tables 9.20, 9.21, and
9.22.
• There was no significant difference in learning gain between participants and controls,
at the p<0.05 level (Table 9.20).
• There was no significant difference in pre-test scores between female students (and
male students, at the p<0.05 level (Table 9.21). There was no significant difference in
learning gain between female students and male students, at the p<0.05 level (Table
9.20).
• There was no significant difference in pre-test scores between Maori/Pacifica stu-
dents and non-Maori/Pacifica students, at the p<0.05 level Table 9.21. There was
210

Learning Gain, Intermediate School C (A-B)
Group N Mean Std. Dev t Sig.
Participant 47 -24.57% 33.32% -0.801 0.426
Control 16 -16.99% 30.71%
Female students 29 -16.95% 32.77% 1.577 0.120
Male students 33 -29.57% 30.26%
Maori/Pacificastudents
12 -33.39% 30.86% -1.275 0.207
Non-Maori/Pacificastudents
51 -20.12% 32.78%
Table 9.20: T-test results comparing learning gain within groups of students (between testsA-B), at Intermediate School C.
Pre-test scores, Intermediate School C (A-B)
Group N Mean Std. Dev t Sig.
Female students 29 48.97% 21.98% -0.368 0.714
Male students 33 51.25% 26.22%
Maori/Pacificastudents
12 44.63% 17.92% -0.959 0.341
Non-Maori/Pacificastudents
51 52.11% 25.51%
Table 9.21: T-test results comparing groups pre-test scores at Intermediate School C (testA).
211

Reading and Maths levels, Intermediate School C (A-B)
N Corr. Coefficient Sig.
Maths Pre-test score 62 0.586 <0.001
Learning Gain 62 0.083 0.520
Reading Pre-test score 63 0.532 <0.001
Learning Gain 63 0.207 0.107
Table 9.22: Spearman’s correlation between students’ Maths and Reading levels, and theirpre-test scores (test A) and learning gain (between tests A-B), at Intermediate School C.
no significant difference in learning gain between Maori/Pacifica students and non-
Maori/Pacifica students, at the p<0.05 level (Table 9.20).
• A one-way between subjects ANOVA was conducted to compare the effect of students’
ethnicity on pre-test scores, and another to compare the effect of ethnicity on learn-
ing gain. There was no significant impact of ethnicity on students’ pretest scores at
the p<0.05 level [F(4,57) = 0.223, p=0.92]. There was also no significant impact of
ethnicity on learning gain at the p<0.05 level [F(4,57) = 0.561, p=0.69].
• There was a moderately positive correlation between Maths level and pre-test score,
which was statistically significant at the p<0.01 level. There was no significant corre-
lation between Maths and learning gain, at the p<0.05 level (Table 9.22).
• There was a moderately positive correlation between Reading level and pre-test score,
which was statistically significant at the p<0.01 level. There was no significant corre-
lation between Reading and learning gain, at the p<0.05 level (Table 9.22).
9.4.6 Intermediate School C, test-order B-A
The results for Intermediate School C, test order B-A, are shown in tables 9.23, 9.24, and
9.25.
• There was no significant difference between learning gain between participants and
controls , at the p<0.05 level (Table 9.23).
212

Learning Gain, Intermediate School C (B-A)
Group N Mean Std. Dev t Sig.
Participant 47 28.38% 38.46% -0.098 0.923
Control 15 29.46% 33.39%
Female students 37 27.14% 34.08% -0.468 0.642
Male students 23 31.78% 42.01%
Maori/Pacificastudents
7 43.24% 20.77% 1.110 0.272
Non-Maori/Pacificastudents
55 26.78% 38.34%
Table 9.23: T-test results comparing learning gain within groups of students, at IntermediateSchool C (between tests B-A).
Pre-test scores, Intermediate School C (B-A)
Group N Mean Std. Dev t Sig.
Female students 37 35.49% 17.01% 0.413 0.680
Male students 23 33.64% 16.70%
Maori/Pacificastudents
7 23.68% 8.46% -1.903 0.062
Non-Maori/Pacificastudents
55 36.03% 16.81%
Table 9.24: T-test results comparing groups pre-test scores at Intermediate School C (testB).
213

Reading and Maths levels, Intermediate School C (B-A)
N Corr. Coefficient Sig.
Maths Pre-test score 60 0.402 0.001
Learning Gain 60 0.227 0.80
Reading Pre-test score 62 0.401 0.001
Learning Gain 62 0.181 0.167
Table 9.25: Spearman’s correlation between students’ Maths and Reading levels, and theirpre-test scores (test B) and learning gain (between tests B-A), at Intermediate School C.
• There was no significant difference in pre-test scores between female students and
male students, at the p<0.05 level (Table 9.24). There was no significant difference in
learning gain between female students and male students, at the p<0.05 level (Table
9.23).
• There was no significant difference in pre-test scores between Maori/Pacifica stu-
dents and non-Maori/Pacifica students, at the p<0.05 level (Table 9.24). There was
no significant difference in learning gain between Maori/Pacifica students and non-
Maori/Pacifica students, at the p<0.05 level (Table 9.23).
• A one-way between subjects ANOVA was conducted to compare the effect of students’
ethnicity on pre-test scores, and another to compare the effect of ethnicity on learn-
ing gain. There was no significant impact of ethnicity on students’ pretest scores at
the p<0.05 level [F(4,55) = 1.092, p=0.37]. There was also no significant impact of
ethnicity on learning gain at the p<0.05 level [F(4,55) = 0.712, p=0.59].
• There was a moderately positive correlation between Maths level and pre-test score,
which was statistically significant at the p<0.01 level. There was no significant corre-
lation between Maths and learning gain, at the p<0.05 level (Table 9.25).
• There was a moderately positive correlation between Reading level and pre-test score,
which was statistically significant at the p<0.01 level. There was no significant corre-
lation between Reading and learning gain, at the p<0.05 level (Table 9.25).
214

9.4.7 Summary
No cases were found where students who participated in these classes improved more than the
control group. Therefore, the null hypothesis “participating in these lessons has no significant
impact on students’ CT skills” cannot be rejected. Students’ gender and ethnicity were not
shown to have an impact on students’ results, except for one case which showed a correlation
between gender and achievement. This correlation was likely to be invalid however, due to
the variation in Reading and Maths levels between female and male students in this sample.
Read and Maths levels were frequently found to impact students’ results. These results and
the limitations on their validity are discussed in section 9.6.
9.5 Results: Interviews
9.5.1 Teachers
I worked with three teachers at Primary School A, four at Full-primary School B, and six
at Intermediate School C. Unlike my previous two studies, these teachers were not entirely
self-selected. At each school, one of the teachers had volunteered their school for the study,
but others at the school had been asked to join so that their school could participate.
In the interviews, I asked teachers how they had felt at the beginning and the end of
the study. There was a clear divide between teachers who felt anxious and stressed at the
beginning and those who did not. The teachers who had some prior experience or exposure
to CS or programming felt generally excited and motivated. Those who did not, described
themselves as “terrified”, “nervous”, and said they “didn’t feel confident at all”. Some of
these teachers commented that after the workshop on teaching CS Unplugged they felt more
excited and reassured. Several of these teachers, and also one of the more experienced and
confident teachers, felt stressed or un-enthused about trying to fit the lessons into their
timetable. However, each of these teachers said that in the end, it was worth finding time
for these:
• Before they began teaching this — “I was quite excited. I was buzzing, but I was anxious
about everything. I was anxious about all of the lessons and getting everything done
in the time frame that I had allocated.”
At the end of the study, when asked if it was worth teaching — “Absolutely. I wouldn’t
be rolling out over the whole school if I didn’t think it was.”
215

• “I was quite nervous. In my head it was just another thing that I had to try and
squeeze into my day. But we did it and it was worth doing. After the first couple of
lessons I came out feeling okay about it.”
• Before they began teaching this — “I was a bit hesitant because I was thinking ‘Oh
no, this is another thing we have to try and do, when are we going to fit this in?’ ...
there was a little bit of worry... It probably wasn’t really an area of interest for me.
I know it’s kind of the age we are coming into and a lot of our students may end up
with jobs in that area, but it still seemed to me like this was still a bit further away,
not ages away but still a bit in the distance.”
At the end of the study — “I now feel like I’m a step ahead of a lot of people... That
has been a positive. I’m still trying to get my head around it a bit more. Of course,
now I know a lot more about it now than I did before, but it still feels a bit complex,
which I guess it always is because it’s new stuff and it’s not easy... I would really like
to teach it again.”
At the end of the study, all teachers were glad that they had taken part, regardless of
their initial confidence and motivation levels. Teachers who were initially more anxious and
lacked confidence had become more comfortable with the teaching materials, but some felt
it would take more time before they were confident with the subjects. Several said one of
the positive outcomes for them was they now felt they had a “head start” for when the
new curriculum came in. Some examples of comments on these positive outcomes for the
teachers themselves are:
• “I think knowing that it’s going to become something that we have to teach, I feel
better that I’ve jumped the gun and done it earlier.”
• “it’s good to get a head start, and I like [the subject].”
• “we were all a bit nervous because.. But I’m feeling okay about it this year, now I’ve
done it once.”
Many teachers discussed their experiences of learning alongside their students, as they
were just as new to the subjects as them. As in the previous study, they saw this as a
positive part of students’ learning, and that they had fun learning with their students:
• “It was a really nice opportunity to tell the children that I was actually learning as
well. I think, hopefully, they would have respected that. There were times when things
216

didn’t go quite right so would say to them ‘Wait, hang on a minute, I just need to go
look again!’ So, it was actually teaching the children that everyone learns.”
• “I guess the beauty of when you are only a couple of steps ahead of the kids is that
you still understand how challenging a concept it is to understand.”
• “I loved learning alongside with them as well. I loved doing it with them”
• “I was literally reading from the script. We were learning together, and they thought
that was kind of cool as well because I didn’t know what I was talking about, so we
sort of got it together... I think then seeing me not knowing what I was talking about
was also beneficial for them, just to know that I am only human as well, and we don’t
all love every subject.”
While these experiences are related to this being a new subject area, rather than being
specific to CS and programming, they can offer insights into how other teachers could be
enthused to take up this subject in the future.
9.5.2 Lessons taught
For this study I asked teachers to teach the CS Unplugged activities and programming as
stand-alone lessons, and if they did any integration with other subjects to do this after they
had first taught them in isolation. I did this as I was investigating the specific link between
only CS and programming, and the development of CT skills. In my previous studies,
the majority of teachers had done a degree of integration between these topics and other
subjects, which had been highly successful. I was now aiming to find if this success could
be (at least partially) attributed to the CS and programming content, or if it was only due
to the manner in which these were taught alongside other subjects. One teacher integrated
Scratch programming with a unit they did on Growth Mindset, and after the end of the
study another began integrating Scratch into other subjects. Other than this, all teachers
who taught programming taught it as a stand-alone topic. One teacher did a small amount
of integration between the barcode activity and maths, but only in the sense that they used
the activity to motivate students who were not hugely engaged with maths, to work on their
numeracy skills. One teacher taught this as a part of their maths time but made it clear
to students that ‘coding’ (how they referred to these activities and programming) was a
separate topic to numeracy (their usual maths programme). Apart from these small links
217

with the maths curriculum, the CS Unplugged activities were taught as stand-alone topics
by all teachers.
All teachers stated that these lessons had been beneficial for their students, the CS
Unplugged activities had been particularly successful, and the resources for these had made
teaching it simple. When asked if there were any negative impacts on their students, teachers’
answers were akin to those given in the prior study. The majority of teachers said they
observed no negative impacts on the students involved, and one said the only students
there was a negative for were those who could not take part (due to not receiving parental
permission to participate). Similarly, one teacher said the only negative was that their
students wanted to share what they had learnt with their friends in other classes, but were
not able to as these students were a part of the control group:
“I know that the kids were really keen to share their learning, they actually started
writing in posts about it, which I encouraged them to do but I had to ask them not
to post them yet and they had to wait until the end of term. Which was really hard
for them and a shame, but you could see that as a positive as well because they really
wanted to share their learning.”
Two teachers cited frustration as the only potential negative impact on their students.
For one class this was frustration during the Bebras pre-test, and their teacher felt this
initially lowered students confidence. However, they went on to say “they got over that
pretty quickly, so I don’t think it negatively impacted them in any way”. The remaining
teacher’s students, on the other hand, did not recover from this frustration: “For certain
students, they got so angry! Their frustration was just at explosion level... They are the
ones who gave up... The frustration was too much for them”. The teacher also said, “ But
that’s just their personalities”.
Computer Science Unplugged
Teachers said the activities were engaging and enjoyable for all, or the vast majority, of their
students. Several teachers said there were a small number of students (generally two to five)
who were not significantly engaged with the material. The reasons given for this included
some students approaching the activities with “an element of arrogance” and viewing the
activities as too “babyish” for them, or students having very high learning needs. The
majority of teachers also described how there were groups of students in their classes who
218

were exceptionally interested in the topics, and “ it certainly pushed some kids’ buttons
more than others”.
When asked, every teacher stated that the CS Unplugged activities were beneficial for
their students and highly successful. Some examples of how teachers described the general
success of the lessons are:
• “They loved it. They got really good results... [the activities] were awesome. The
directions were really clear, and the teacher support stuff was awesome. The worksheets
that went along with it were great, because they enjoyed them and I enjoyed it.”
• “[The activities] were successful because they made them think. The kids loved it and
they all got into it. That’s why they were good. And it got them thinking as well
as them having fun. They talked a lot, especially during the KidBots activity. They
planned together how to make the activity more challenging. That was really good”
• “Everything in the unplugged went really well... I think on the whole the unplugged
lessons were super positive and I think that they took away a really different view of
what computer science is, and how computers work”
• When asked if the lessons were successful —“Definitely”, “Yes, the children definitely
enjoyed it, which was really good.”
• “I think for most kids, they were all really engaged regardless of their level. Whether
they were an above, at, or a below student, they could all do it. Especially because
most of the stuff was done in little groups, and they would go with someone who could
help them and they all helped each other.”
When asked if all their students had been able to attain some level of success in these
lessons the majority of teachers said yes, and the others said the majority of their students
had. In the cases where not all students were able to achieve to some degree, teachers said
it was because these students were not engaged. These were the same group of disengaged
students as described previously. Another teacher had a group of students who became
extremely frustrated with the material and gave up, though it was not clear if this was
in relation to the CS Unplugged material, the Python programming, or both. They also
commented that this behaviour was not unexpected for these students. One teacher also
found that during the KidBots activity one group of students struggled more than others:
“I know for KidBots a few struggled. One group, who were more of the low achievers
who struggle to work with other people sometimes, they did struggle with the group
219

stuff and trying to give instructions to each other... and not realising that if you didn’t
get it right then you had to go all the way back to the start. . . The kids who don’t
have the best social skills did struggle with a few of the lessons. But that wasn’t a big
deal because you either just put them in a different group or I hung around them and
helped them with what we were doing.”
Along with the teachers’ opinions on the general success of the lessons, I was interested
in whether they felt students had developed knowledge of actual CS concepts. Much of
the feedback received on the CS Unplugged lessons, throughout out all three studies, was
focused on the high engagement of students, and that the tactile ‘hands-on’ nature of the
activities was one of the students’ favourite things about these lessons. I asked teachers if
they thought their students had gained an understanding of the concepts the lessons were
intended to teach, rather than just enjoying them. Three teachers were not sure if students
had seen the concepts behind some of the activities, but it was not entirely clear from their
interviews whether or not their students had gained at least some CS knowledge. One of
these teachers commented that when students did the CS Unplugged activities they thought
their students probably “didn’t see it as learning. I don’t think they realised and they just
thought it was fun”. One teacher stated that their students had not gained an understanding
of the underlying concepts in the parity trick activity, and they had seen this as “ just a
magic trick”. Apart from these cases however, teachers said their students almost certainly
had learnt about the CS concepts the activities were intended to teach and had gained an
understanding of how these related to their everyday lives:
• “Yes, definitely... I was really surprised at how quickly they grasped the concepts.”
• “Absolutely... explaining how the concepts connect to a bigger picture helps them,
especially at the year eight level, where they can kind of conceptualise what the next
steps are. I think it worked well.”
• ‘Yes, definitely... I think they could see the connections between maths and what
they were doing, but also how things work. Like ‘Oh, so that’s how checkouts work,
and things come off the inventories of the shop’ so they could actually really make a
connection with how it works”
• Teacher: “It was quite neat to see when they actually started to get it, when they had
those lightbulb moments when they started understanding it, because at first it is a
little bit confusing because it is all new... I obviously talked about how computers are
run by codes and that the codes, in its simplest sense is really just off and on. I think
220

they were sort of starting to get that, and then we talked about the binary numbers
and how we can change them, and I think they were starting to cotton onto that.”
Interviewer: “Cottoning on to those deeper computer science concepts?”
Teacher: “Yes.”
• “with the binary stuff, yes definitely... They definitely got it well the kid bots as well.
Those were the two main ones where they really had to change their thinking.”
Programming
I had originally intended for all teachers to use the Code Avengers platform for program-
ming lessons. At the time when the study was planned the courses available through Code
Avengers were all targeted at High School students, but I chose to use this platform as
Junior courses were planned to be released before the study began. However, these lessons
were subsequently not released in time to be used in this study. Because of this, teachers
at Primary School A and Full-primary School B did not use Code Avengers. Several classes
at Full-primary School B attempted the first activity in the Python course but stopped
when they found the reading level was, understandably, too high for the majority of their
students. They then decided the Code Club Scratch resources would be more suitable, and
each used these for several lessons. Several of the year 7 and 8 students continued with the
Python course in their own time. The two teachers interviewed at Primary School A did
not do any programming lessons, but in one class a student was particularly interested in
Scratch programming so several students experimented with this. It was not clear from their
interview how much Scratch programming these students did in class.
All but one teacher at Intermediate School C had their students spend two or more lessons
on the Code Avengers Python programming course. The remaining teacher at Intermediate
School C had four of their extension students try these lessons out, and these students
continued with the lessons in their own time. The Python resources were not particularly
successful, which was unsurprising considering the target age group of these. Three of the
four teachers who had their whole class try the Python course commented that the majority
of their students were able to complete the first two or three activities, but stopped after
that as the reading became too challenging and they lost interest. One of these teachers
commented that, although the majority of students did not complete much of the Python
course, they felt there had been some benefit to most students as they had gained some
familiarity with debugging.
221

On the other hand, one class at Intermediate School C did continue with the Python
course, and spent around six or seven lessons on these. The teacher for this class had
experience with Computer Science and Scratch programming before the study began, and
so may have been able to assist their students more with these programming activities. This
teacher still felt these lessons were not ideal for this age group and Scratch would have
been a better option, but their students did still have success. When they were asked if they
thought their students had gained an understanding of programming from these lessons they
said:
“They got the idea... that coding actually is getting a sequence of instructions, but
at times you have to debug it to make it work. They got that concept quite clearly
and were able to do the debugging”.
The teachers at Full-primary School B who used the Scratch resources from Code Club
found these were generally successful and beneficial for students. When asked if the lessons
were successful one teacher answered “Yes. The whole lot was, the Unplugged and the
programming”, and another described the programming lessons as successful and added “I
actually think it was more powerful as we had done those previous [CS Unplugged] lessons”.
Another teacher at Full-primary School B had since begun integrating programming into
many parts of their classroom programme, as a way to engage students with their learning.
They found this was beneficial in other curriculum areas and, like in the previous study, said
it enabled students to present their learning in a new way:
“I try to involve coding into lots of different things as a gaming type, or enjoyment
part of learning. I think that if we get them to do something. . . like in ‘chapter chat’
over there [gestures to students’ reading and writing work on the wall in the classroom].
They have to visualise what’s happening in the story so I would say ‘why don’t you
make the sequence of what is happening in the story on Scratch?’ Because they can
visualise it in their head, but that articulation of it is really difficult... But if they can
show me, I can understand.”
9.5.3 Computational Thinking
As in the previous Open Teachers Study, I reviewed the interview transcripts to identify cases
where students were exercising CT skills. The same criteria (listed in Chapter 8, section
8.2.2) as in the previous study were used for tagging these observations. - tables all changed
222

Figure 9.7: The Computational Thinking Concepts and Approaches, which were identifiedin the interview transcripts.
The proportion of teachers who observed each skill in this study was lower for every
CT skill when compared with the previous study These differences are shown in table 9.27.
While the differences were relatively small for Abstraction, Algorithms, Collaboration, and
Persevering, they were large (between -30% and -64%) for every other skill. This indicates
students’ CT skills may have developed significantly less in this study. There are several
possible explanations for this, which are discussed in section 9.6.
Algorithms and Algorithmic Thinking, Decomposition, Evaluation, Logic, and
Debugging
These four skills have been grouped as each was almost always tagged alongside one or
more of the others. Students were observed learning about, or demonstrating selections of
these skills through learning and carrying out algorithms; comparing different algorithms;
223

Out of a total of 11 teachers
CT SkillTotal
observations
Number whoobserved the
skill
Proportion whoobserved the
skillConceptsAbstraction 2 1 9%Algorithms 19 10 91%Decomposition 11 7 64%Evaluation 8 5 45%Logic 11 7 64%Patterns 4 2 18%ApproachesCollaboration 11 8 73%Creating 5 4 36%Debugging 6 4 36%Persevering 13 8 73%Tinkering 9 5 45%
Table 9.26: The total number of observations of each Computational Thinking Concept andApproach, and the number of teachers that observed each of these.
identifying and fixing mistakes made when carrying out algorithms; through the KidBots
activity as they worked on breaking down a process into steps, identifying and fixing bugs,
extending the activity by creating new challenges, and comparing the efficiency of their
solutions; and through writing programs, identifying problems in these, and debugging them.
Some examples of sections which were tagged with two or more of these skills are:
• “I do feel that there was more of an understanding of how to get from one place to
another, and that you had to do things in a sequence, and if you didn’t do them in
sequence then perhaps things wouldn’t work the way you expected them to. It was
all about planning, logical thinking, logical reasoning, and justifying your choices.” —
Algorithms, Decomposition, Evaluation, Logic, and Debugging
• “They got the idea, especially with the one with the magnets, and that coding actually
is making a sequence of instructions, but at times you have to debug it to make it
work. They got that concept quite clearly and were able to do the debugging” —
Algorithms, Decomposition, and Debugging
• “I could see them thinking that they really needed to give the step-by-step specific
directions. They were like ‘come on you just go from there to there to there’, and I said,
224

Proportion of teachers observing each CT Skill
CT SkillOpen teachers study(interviewed only)
Interventionstudy
Difference
Concepts
Abstraction 17% 9% -8%Algorithms 100% 91% -9%Decomposition 94% 64% -30%Evaluation 89% 45% -44%Logic 94% 64% -30%Patterns 78% 18% -60%
Approaches
Collaboration 78% 73% -5%Creating 89% 36% -53%Debugging 100% 36% -64%Persevering 83% 73% -10%Tinkering 89% 45% -44%
Table 9.27: Differences in proportion of teachers each skill was observed by in interviews,between the Open teachers study and the Intervention study
‘no that actually doesn’t work, you need to be specific’. That specific command thing,
they actually enjoyed that.” — Algorithms, Decomposition, and Debugging
• Discussing students programming — “they realised ‘oh right I made a mistake, next
time I will need to fix that’.” — Logic, Evaluation, Debugging
• “They were able to talk about ‘look I do actually have a problem there, what is the
problem?’ Kind of talk about how to get around the problem. That was probably
more the higher achieving students because they were quite critical in their thinking.
They tried to find ways that things didn’t work.” — Evaluation, Logic, Debugging
The following discussion with a teacher on how debugging became a normal part of their
classroom programme also illustrated all five of these skills:
Teacher — “When one thing doesn’t happen what do you need to do? You need
to go back and check it. We say that in everything now, we constantly say in writing
‘go back and check your work, check your mistakes, find the bug’. I use that now in
writing. I’ll say, ‘your writing is bugged, let’s go back and find what the problem is’,
things like there isn’t a comma or a full stop. . . When I think about what they were do-
225

ing with KidBots it’s trial and error, and then you find the mistakes and you fix them.”
Interviewer — “And they were doing that?”
Teacher — “They were doing it, and they did it all through the rest of the year...
they were like ‘let’s do it again! Let’s try and fix it. Let’s try and do it as short as we
can’ or do the shortest possible sequence of steps.”
— Algorithms, Decomposition, Evaluation, Logic, and Debugging
Along with these observations, Algorithms and Logic were tagged separately several
times. The sections which were tagged with Algorithms, and none of these other four
skills, either contained explicit references to algorithmic thinking, or were observations of
students learning, carrying out, and practising specific algorithms. The sections which were
tagged with Logic, and none of these other four skills, were all explicit references to students
developing or using logical reasoning skills, with no reference to any of the other skills.
Abstraction
As in the previous study, there were very few observations of Abstraction. The observations
of Abstraction were both made by the same teacher and were made during data represen-
tation lessons. They described how students learnt about the Parity and Barcode tricks
and were then able to see that the overall idea behind these was that extra information can
be added to data and then used for error checking. They observed this pattern in both the
activities and could see that despite the differences in how the error checking was performed,
that both of these activities were about the same concept. The teacher also described how
both they and their students were then able to connect their knowledge of data representa-
tion, to how all digital technology operates on the concepts of using binary data to represent
other types of data, such as videos.
“I think it was quite cool for them to have an insight into the technology they use
without even thinking about it every day. And how clever it is, what it breaks down
too. Especially when we did binary it’s about mind blowing to think, wow I just expect
Netflix to work, and when that doesn’t or starts slowing down I’m annoyed with it.
But when it comes down to it there is a lot going on in that”
226

These observations were also examples of understanding Decomposition, and Patterns
and Generalisation.
Patterns and Generalisation
The observations of Patterns and Generalisation were all related to students recognising
and understanding patterns, but no explicit observations of generalisation were found. The
recognition and use of patterns occurred in the binary, and error detection and correction
activities. One observation was related to the Bebras test, and students general learning
about patterns and logic. This may have been referencing students applying their pattern
recognition skills across a range of different problems (i.e. generalisation), but it was not
entirely clear if this is what the teacher meant, and so this was not tagged.
Some examples of the Patterns and Generalisation observations are:
• “they picked up that there was a purpose to that extra information, and they saw the
patterns.”
• “The whole binary thing they just got really fast, like ‘oh yeah, it’s this or this, it’s
this or this’.”
Collaborating
Similarly to the previous study, there were many observations of students working together
and improving their teamwork skills; students who would not normally work well with other
students being more motivated to do this, and working on their social skills by doing this;
and students supporting each other in their learning
Some examples of the sections tagged as Collaboration are:
• Discussing students who were generally high achieving —“because they were able to
help other students understand concepts, they were building relationships with stu-
dents in the class that they hadn’t necessarily had a constructive relationship with.”
• “It was good to see students collaboratively working, it was great.”
• “I had kids working with each other who would have never worked with each other
before, they were sharing knowledge. That was beneficial.”
• “The kids bounced off each other, so the whole time they would say things like ‘look
at our KidBots grid and program!’, ‘Oh you did that, now I want to go and try that’.
There was that growth that you always hope for, with this it was obvious that they
were building off of the things each other were doing.”
227

Creating
As previously noted, Creating was observed much less frequently (compared to other CT
skills) than it was in the previous study. The drop in the amount of Creating was to be
expected, as the CS Unplugged and programming lessons taught did not require students
to create original digital or physical artefacts, and the lessons were taught in isolation and
according exactly to the lesson plans. Several teachers referenced students using Scratch in
their own time, but did not describe programs students may have created, and so these were
not tagged as Creating.
The other observations of Creating were of students modifying and extending the KidBots
activities, by adding new challenges and features to the activity:
“They figured out how to do more and try and make it more exciting. They put
these things in, I think they called them bombs, that you had to try and avoid, and
they would try to trap you in, so you would have to go all the way around them.”
Persevering
Multiple teachers referenced students increased persistence in the Bebras post-test compared
to the pre-test, and persistence when working with challenging reading requirements when
programming. These were not factors in the previous study. Some examples of the sections
tagged as Persevering are:
• “They grew in that whole problem solving aspect, and the fail fast concept, and know-
ing that things might not go right the first time but if they keep persevering they will
get there... One of our key characteristics is getting our children to be resilient so it’s a
perfect way to teach them about that and about persevering. It links really well with
our core values.”
• “When they did the Bebras test again you could actually see a bit more of their re-
silience and that they were willing to try a bit more.”
When asked to described their class in general one teacher described how many students
in their class usually did not persist when things became challenging, but in these lessons
the students behaved differently:
Teacher — “Lots of students had no patience and they would just call out that
what they were doing was too hard and then the whole class would respond to that
228

and decide it was too hard. Lots of students actually gave up on things. They didn’t
really persist.”
Interviewer — “Were they like that when they did the CS Unplugged activities?”
Teacher — “No actually. Those were different. That was much more interesting
for them.”
Tinkering
Tinkering was frequently tagged alongside Evaluation, and these examples were similar to
those in the previous study. The main observations of Tinkering were of students experi-
menting with Scratch; thinking of new ways to extend the KidBots activity; and repeating
algorithms from the lessons (such as the Barcode trick) many times in order to show other
people, and to look for situations where the algorithm did not work Some examples of the
sections tagged as Tinkering are:
• When describing the Barcode trick — “They were really mind blown by it, because
they were saying ‘What? How did you get that? That doesn’t work’. Especially one
boy who didn’t normally do a lot of work in class, he was going around asking everyone
to do it, and was trying to work out or find a way when it doesn’t work as well. He
wanted to figure out if it maybe didn’t work every time.”
• “When we were doing coding, after that they were much more likely to say ‘I’ll give
this a go’.”
• “We spent a lot of time on KidBots. They spent a lot of time making more courses to
make KidBots harder, things like needing to do concurrent movements.”
There were less examples of students employing trial and error strategies in this study,
which may be due to the lack of creating programs and then testing these.
9.5.4 Problem Solving
Teachers were each asked if they had observed any improvements or changes in students’
problem solving skills, as a result of these lessons. As expected, some teachers said they
were not certain of this as they could not say whether changes were due to these lessons,
to other subjects, or to a combination of these. Several felt they could not be sure as they
had not done any tests with their students, and one answered “no”, they had not observed
this at all. However, the majority answered that they either thought or were certain, that
229

Yes I think so I am unsure No
Did the lessons improve students’ 3 5 2 1
problem solving? 27% 45% 18% 9%
Did the lessons have an impact 2 2 5 2
on students’ general learning? 18% 18% 45% 18%
Table 9.28: Number of teachers who gave each response to the questions on problem solvingskills and general learning
the lessons had improved their students’ problem solving skills. Teachers were also asked
whether the lessons had impacted students’ learning in other areas, and again many felt they
could not be sure of the answer. The majority of teachers were unsure or said they had not
seen an impact on students general learning. Their responses to both the problem solving
and general learning questions, and the percentage of teachers this represents, are shown in
table 9.28. Teachers’ answers to the question on problem solving included:
• Yes
– “I would say yes it did... They grew in that whole problem solving aspect”
– “Yes I would say so... We do the Otago problem solving challenge and I definitely
did notice at the end of last year were doing better than that then they had been
doing prior to that, and I didn’t teach problem solving between those tests, I
taught that at the start of the year, so it wasn’t that which had helped”
– “Yes... they are learning to change their thinking.”
• I think so
– “I probably can’t say it definitely was, but I think it probably helped.”
– “We do lots of discussion on the mat... they seem to be asking questions and
looking for alternative way to do things, so I think maybe it did. I haven’t proven
that yet. I can’t be sure, but I think they were inquiring more, asking ‘does this
mean this and this?’ ”
– “I hope so, it’s so hard to know. . . I can’t see how [the lessons] wouldn’t help.
I’m sure that they would be helpful.”
230

• Unsure
– “It’s hard to tell”
• No
– “Probably not. I can’t tell you a time when I noticed.”
These observations support the conclusion of the previous study, that CS, programming,
and developing CT skills can improve the majority of students’ problem solving skills.
9.5.5 Learning Transfer
In this study, there was only one observation of learning transfer occurring for the majority
of students in a class, and this was directly facilitated by the teacher. There were no
observations of automatic learning transfer. The teachers who were unsure, but suspected
there had been benefits in other subjects, said this was mainly for maths. They also said
this was generally due to an increase in students’ confidence and engagement with maths,
through the CS and programming lessons, rather than a transfer of thinking skills. One
teacher believed some students had transferred some of the CT skills they learnt to other
subjects, but they said this was restricted to the higher-achieving students, who already had
good critical thinking skills.
The one case of the majority of students explicitly transferring their learning was in
relation to reading and writing and was clearly supported by the teacher, as they focussed
specifically on introducing CT skills (but not CS and programming) to these subjects. When
this teacher was asked if they had observed developments in their students’ general thinking
skills in other subjects, they said:
Teacher — “Yes. I think the problem solving part... when one thing doesn’t hap-
pen what do you need to do? You need to go back and check it. We say that in
everything, we constantly say in writing ‘go back and check your work, check your
mistakes, find the bug’ I use that now in writing. I’ll say, ‘your writing is bugged, let’s
go back and find what the problem is’, things like there isn’t a comma or there isn’t
a full stop. It’s the same as/when I think about what they were doing with Kid Bots
it’s trial and error, and then you find the mistakes and you fix them.”
231

Interviewer — “And they were doing that?”
Teacher — “They were doing that, and they did it all through the rest of the year.”
Several of teachers who did not observe any cases of learning transfer said that they
expected this would happen if they continued these lessons over a longer period of time,
or integrated them with other subjects (after first teaching them separately). One teacher
commented:
“Maybe if I had integrated the lessons a bit more it would have helped. They saw
it as a completely separate topic. So I don’t think it would have had that much of an
impact on their general learning.”
Comparing these results on the topic of learning transfer, to those of the previous study,
indicates that learning transfer can occur, but this is unlikely to happen automatically. It
is much more likely that for the majority of students to apply CT skills to other areas, this
needs to be facilitated by a teacher explicitly having them apply these skills in different
contexts. The differences in the amount of, and opportunities for, learning transfer between
this and the previous study, supports the observations of teachers who stated that teaching
these subjects over a longer time-period could contribute to students transferring CT skills.
9.5.6 Student Impacts
A prominent theme in the previous study, which emerged again in this, was how there
was a small group of students in each class who was impacted particularly strongly and
personally, by these lessons. One teacher described the experience of one student in their
class, which was very similar to stories I had heard from several teachers in the previous
study. The student they described had prior experience with Scratch programming, and
became the ‘class expert’ on Scratch during programming lessons. This student was not a
typical leader in the classroom, and struggled socially. They were however, highly engaged
with programming, and so the teacher appointed them (along with another student) a ‘class
helper’ during these lessons. The teacher described the development of this student as one
of the high-points of teaching these topics:
232

“As a teacher there were some absolutely fabulous moments in class where the alpha
male type student received help and support from Arnold4, because he was the resident
expert, and it was new to the other student and he sat there and took directions from
Arnold. But what was really lovely about that was Arnold was able to give direction
and socialise, when that was the discussion point... it was one of those moments as a
teacher where your heart just expands, it was one of those fabulous things.”
This teacher felt the programming lessons had been beneficial for all their other students as
well.
Teachers in this study also referenced that students who were generally disengaged in
class became some of the most engaged and motivated students in these lessons, and that
the hands-on nature of the activities appealed to students who struggled with traditional
learning methods. For example:
• “One student in particular, who has quite bad behavioural issues, really loved it and
he was really really good at it... This particular student would just sort of do the
bare minimum with other things, but he really got engaged with it and then he really
excelled at it.”
• “There was one boy I know whose behaviour can be a little bit challenging, and he
was really engaged. He really enjoyed the challenge of it. He was one of the children
that really stuck out”
• Discussing impacts on particular groups of students — “I would say the ones that
usually are quite tricky to engage, they enjoyed these lessons as well. The lessons were
hands on, like with the parity cards, those kinds of things make a big difference.”
• “Some kids just got it who you wouldn’t think would have got it.”
• “Especially one boy who didn’t normally do a lot of work in class, he was going around
asking everyone to do [the Barcode trick], and was trying to work out or find a way
when it doesn’t work as well. He wanted to figure out if it maybe didn’t work every
time... [The lessons] were very successful. Especially for those students who do struggle
with just doing reading and writing, who find it boring sometimes. It was nice for them
4 name has been changed
233

to have something different and they really got engaged. I think every single student
was engaged in the lessons.”
“I know in the past I have had kids who struggle to get their ideas onto paper so using
their hands and technology, things like that, it really does help... For some kids it’s
really difficult for them so this is something different.”
One quote about ‘unexpected’ students succeeding was quite different to these however.
When asked about students who were particularly successful they said these students were:
“...the ones who actually have good reading skills, they loved it. They understood,
and tried to understand. . . I thought it would maybe be just the students who are
good at maths, but no. The students who are good at reading did really well. It was
very interesting.”
This was very different to other teachers observations, which frequently focused on stu-
dents who struggled with curriculum areas like reading and writing, or who were disengaged
from learning in general. This teacher made several other references to reading skills in
their interview, and emphasised that the reading skills required for the Bebras tests were
too high for all but the most advanced students in their class. This observation touches on
how reading skills had such a strong impact on students’ experiences with programming and
the Bebras test.
One class in the study was a bilingual class, where Te Reo Maori and English were
spoken, and the teacher of this class felt there was a connection between students experience
working in two languages and how quickly they grasped some of the different concepts they
learned. They observed:
Interviewer — “Your class is unique in the study because they are bilingual, do
you have any observations on the interaction between this stuff and being a bilingual
class?”
Teacher — “ I think they got it really easily, but I do really believe that if they’re
learning more than one language then different part of the brain is developing and I
think this helped. They grasped it really easily.”
Interviewer — “do you have any idea why that might have been?”
Teacher — “I don’t really know. Because they’re constantly thinking in two differ-
ent languages, the whole binary thing they just got really fast, like ‘oh yeah, it’s this
234

or this, it’s this or this’. I think it uncomplicated things for them, but I would need
more data to tell. I was really surprised at how quickly they grasped the concept.”
9.6 Discussion
The results of the qualitative data collected in this study support the conclusions of the
previous study. Teachers were in agreement that these lessons were highly beneficial for
their students. Students practised and developed a range of CT skills, and several teachers
observed improvements in their students’ problem solving skills. However, based on the
interviews with teachers, the amount of student skill development in this study was lower
for all CT skills, and was significantly lower for four of the six CT concepts and three of the
five approaches, compared with the previous study. There was also significantly less evidence
of learning transfer in this study. There was only one occurrence of learning transfer, and
this transfer was explicitly facilitated by the students’ teacher. There are several possible
explanations for these lower rates of skill development and learning transfer.
In this study all teachers were restricted to a particular set of CS Unplugged activities,
very little programming took place, very little cross-curricula integration occurred, and in the
previous study many participants taught over a longer time period compared to this study.
These factors, which are discussed further later in this discussion, may have restricted both
the students’ development of CT skills and the teachers’ opportunities to observe and identify
these.
This also meant there were generally fewer lessons for teachers to discuss in their in-
terviews. Instead of describing the individual lessons there was a tendency for teachers to
list the lessons they conducted instead. This was considered not enough evidence to tag a
section with a CT skill, as there was no description of students actually doing the activ-
ities. This may have contributed to the lower amount of CT tags per teacher. For some
skills, there were likely fewer opportunities for these to be exercised (the most obvious one
being Creating). The differences between the proportion of times each skill was tagged also
could potentially be exaggerated due to the smaller sample size of this study, and that only
interview data was used in this study
Despite these differences, the results of the qualitative analysis in this study support the
conclusions that learning about CS, programming, and developing CT skills can have an
impact on the majority of students’ problem solving skills, and it is possible for learning
transfer to occur, but this is unlikely to happen without teacher facilitation. CT, CS, and
235

programming appear to be no exception to the general consensus that learning transfer
largely does not occur automatically, but through explicit teaching [3].
While these conclusions agree with those of the Open Teachers study, that students’ CT
and problem solving skills improved, the results of the Bebras assessment gave a different
result. These conclusively showed that participants’ scores on the tests did not improve
more than the controls, in any case. There are several possible explanations for these re-
sults. The first of these is that despite participating in the CS Unplugged lessons and (in
most cases) doing a small amount of programming, the participating students did not in
fact develop CT skills. It also supports the conclusion that the lower amount of CT skill
development observations was a result of students not developing these skills, rather than a
lack of opportunities for teachers to observe or report development. It is also possible that
there was some development of CT skills, but this was small and the Bebras challenge was
not a sensitive enough assessment to identify these changes, or the Bebras challenge was not
a suitable assessment tool to use.
There are several limitations to using the Bebras challenge as a CT assessment tool.
These were discussed in detail in Chapter 3, section 3.4.1. One of the limitations which may
have been particularly influential in this study was the challenging language used in the tests.
The reading level of the Bebras questions was much higher than expected for the age groups
in this study, and so students scores may have been a reflection of their reading ability, rather
than their problem solving or CT skills. Reading and Maths were found to be significantly
positively correlated with students’ scores in all tests. As students’ Reading level was also
significantly positively correlated with their Maths level, this could be interpreted as Maths
being the influence on students scores instead of, or alongside, Reading. However, when
teachers’ observations are taken into account it seems more likely that Reading was more of
an influence on scores than Maths.
Teachers of both participating and control classes at each school, universally agreed that
the reading ability the tests required was too high for all but the most advanced of their
students. Many students asked questions during the tests which were based purely on the
language used in the questions. An example of this is the first sentence of the question ‘Fair
share’, from the 2016 Castors and Benjamins test.
“Hamid has a 4 litre beaker full of a hazardous chemical.”
I discussed this question with an experienced NZ teacher, and their verdict was that
just this first sentence made the question unsuitable for year 7 and 8 students, let alone
236

the years 4, 5, and 6’s. The words ‘hazardous’, ‘chemical’, and ‘beaker’ are words many
students would not be familiar with. They are concepts students will generally encounter
for the first time when they begin High School Science. Several students were also confused
by the names used in this question, Hamid and Kazim, and asked what these meant as they
did not realise they were names.
The length of some of the questions which incorporated stories was also problematic.
Students found the stories confusing, lost track partway through long sections of text, and
could not connect these with the actual problem they were meant to be solving. While a core
part of answering Bebras questions is meant to be interpreting what the questions are asking,
the stories in these questions were the part that challenged students most. The questions
without stories or with very short ones were much easier for students to understand. One
of the recommendations given when writing Bebras questions is to incorporate a real-world
context, as a way to engage students more with the questions. While this can be effective, the
lengthy stories may have been more likely to disengage students and negatively impact their
score. When describing the students who were strongly impacted by these topics, teachers
in both this and the prior study said these were frequently the students who struggled with
reading and writing. The advanced reading level of the tests may have prevented students
like these from demonstrating their knowledge and CT skills, thus dragging down their
scores.
There are other factors as well which may have led to students learning, or displaying,
less CT. The lack of cross-curricular integration in this study may have limited students’
ability to transfer the thinking skills they used during the lessons to other contexts, such as
the Bebras questions. One teacher said this was likely a reason why there was no perceivable
impact on students’ general learning:
“Maybe if I had integrated the lessons a bit more it would have helped. They saw
it as a completely separate topic. So I don’t think it would have had that much of an
impact on their general learning.”
Another key difference between students’ experiences in this study that may have im-
pacted their skill development, was that less time was spent on programming compared to
previous studies. The majority of classes spent 2-3 lessons on programming, and some did
none. All of the classes which worked with Python made very little progress with the mate-
rial, apart from a small number of students who had prior programming experience before
the study began, or were generally high achieving at school. As discussed in Chapter 5,
237

programming is an effective method of reinforcing CT skills, particularly algorithmic think-
ing, and the lack of this likely disadvantaged students in this study compared to those in
previous studies.
Furthermore, the time period (9-10 weeks, depending on when teachers started and ended
the lessons) over which the study was conducted may not have been sufficient for students to
practice the skills enough to apply them independently. The short time period and number
of different topics teachers were asked to teach also limited their opportunities to cover
concepts multiple times. Repetition of concepts was noted by teachers in previous studies
as something their students needed, as they often forgot things quickly if they were not
repeated. One teacher in this study said that the amount of time they spent on these topics
was too short for students to consolidate their skills:
“It was too short. We would have to do it throughout the year to see the real
progress.”
In future intervention studies on CS and programming developing CT skills, these are all
important issues to address. A longer time period should be used when conducting a similar
study to this and should allow for repetition of content. If the impact of cross-curricular
integration is to be investigated time for this also needs to be allowed for, and based on the
results of the Open Teachers study I recommend giving teachers plenty of freedom (with
guidance) in how they choose to integrate CS and programming with other subjects. Using
an age-appropriate programming environment is also crucial if students are to learn about
programming.
When using the Bebras challenge as a form of CT assessment I recommend that the
language of the tasks be reviewed before the test is administered. In reviewing the questions
it is important that they are evaluated by an experienced teacher for the relevant age groups.
As the general reading level and common vocabulary for age groups of students vary between
different countries, this should be taken into account, so it would be advisable to consult a
teacher with teaching experience in the country (or region) where the students are based.
It should be ensured that the language used is age-appropriate, region-specific terminology
is relevant and commonly known, and that questions do not involve lengthy or convoluted
narratives.
238

9.7 Conclusion
The goal of this study was to verify conclusions from my previous work, by using an addi-
tional measurement approach, and by working with a group of teachers who were not entirely
self-selected. I worked with 13 teachers at three primary schools, who taught their classes CS
Unplugged lessons throughout term three of the school year. The majority of these classes
also completed a small number of programming lessons. At each school, I used the Be-
bras Challenge to conduct pre and post-tests with both participating and non-participating
classes, with the intent of measuring students’ Computational Thinking skills. The results
of these tests were used to investigate whether the participating students’ scores improved
throughout the school term. 11 of the participating teachers were interviewed about the
classes and the impacts these had on their students, at the end of the school term.
The research questions I aimed to answer were similar to those of my previous studies.
The first of these was: Can learning Computer Science and programming develop, or im-
prove, Computational Thinking skills for the majority of students? In my previous study,
I concluded that yes, CS and programming lessons can develop and improve students’ CT
skills. The thematic analysis of the interviews in this study agreed with this conclusion, but
showed less development of these skills than the previous studies did. The results of the
Bebras CT tests for each school showed no difference in CT skill development between the
participating and the control students. There are several threats to the validity of these re-
sults, as discussed in section 9.6, the most prominent of which was the unsuitable vocabulary
and level of reading comprehension in these challenges.
My second question was: Can Computer Science and programming lessons, and develop-
ing Computational Thinking skills have an impact on problem solving skills, for the majority
of students? In my previous study, I had concluded that the answer to this was yes, these
lessons and developing CT skills can improve students problem solving skills. The results
of this study agree with these findings. It should be noted that this conclusion is problem
solving skills can improve, not that they will always improve, as in both studies not all
teachers agreed on this. Those teachers that did agree stated that this was the case for the
majority of their students.
The third question for this study was: Can Computer Science and programming lessons,
and developing Computational Thinking skills have an impact on overall learning for the
majority of students? Based on the teachers’ observations, learning CS, programming, and
CT skills can have a positive impact on students’ general learning in other areas. But, this is
239

unlikely to happen in a short period of time, and without integrating CS and programming
with other subjects. This supports the conclusion of the previous study, that there can be
an impact on students’ general learning. The much larger amount of both learning transfer
and cross-curricula integration reported in the previous study also supports the conclusion
that integrating these subjects with others is a key part of facilitating learning transfer.
The fourth question was: If these lessons do have an impact on students’ Computational
Thinking skills or their overall learning, do these impacts differ between students of different
genders or ethnicities? The results of the Bebras tests showed no significant difference be-
tween students’ scores based on their gender or their ethnicity when the confounding factors
of Reading and Maths levels were taken into account. In interviews, teachers were asked
if they had observed differences between various groups of students. No teachers reported
differences between the achievement or behaviour of students in their classes, based on their
ethnicity. All teachers stated that both girls and boys were engaged in the lessons, and
they observed no differences in their achievement. However, several teachers who discussed
the particularly enthusiastic students in their classes said these were mainly (but not all)
boys, who latched on intensely to the subject. While this could be seen as an indication
that boys are more likely to engage with the topic, multiple teachers emphasised that de-
spite these particularly interested male students, their students were all equally engaged.
Some teachers, in this and the previous study, also remarked that this may have been to
do with the more overt ways the boys displayed their interest compared to the girls, rather
than a difference in their interest levels. These observations are also likely linked to the
impact of gendered socialisation and match the ‘magnetic-attraction’ phenomena, described
by Margolis and Fisher [123].
The final question I aimed to address was: What other impacts can learning Computer
Science and programming, and developing Computational Thinking skills have on students?
The conclusions I came to in this study, again, validated those of my previous work. The only
negative impact reported was the frustration some students experienced when they found
the activities challenging, and that this behaviour was not abnormal for these students in
other subjects as well. Several teachers told stories about how students they predicted
would struggle with the material were unexpectedly successful, and some of the particularly
interested and competent students developed leadership and social skills through helping
other students.
The conclusions drawn from these results strongly support the findings of the previous
studies, that:
240

• Computer Science and programming education can develop and improve the majority
of students’ Computational Thinking and problem solving skills.
• Computer Science, programming, and Computational Thinking education can have a
positive impact on the majority of students’ general learning, particularly when they
are integrated with other subjects.
• When students develop Computational Thinking skills it is possible for them to transfer
these skills to other learning areas, but this is unlikely to happen if students are not
taught explicitly to use these skills in different contexts.
241

Chapter X
Conclusions
Having a foundational knowledge of computing is now a critical part of being a capable
and informed citizen, due to the ubiquity of digital technologies in our society. To address
this need, Computer Science, programming, and Computational Thinking have been added
to school curricula around the world. As these are new subjects to school education, there are
many challenges to implementing these changes. These include evaluating what computing
topics need to be taught, how these can be successfully taught, and whether the introduction
of these topics achieves the intended educational goals. This thesis has aimed to address
these challenges, specifically in primary school curricula.
This was done by synthesising a trial curriculum, testing it in New Zealand primary
schools, continually evaluating and modifying the way it was taught, and exploring the
impacts it was having on students. In doing this, I worked with over 50 teachers and over
two thousand primary aged students. The trial curriculum was based on the motivations
for equipping students with knowledge on computing, developments in curricula around the
world, literature reviews on Computational Thinking, and on teaching Computer Science
and programming to young students. Resources to support people to teach these subjects
were collated and developed, trialled in primary schools across New Zealand, and iteratively
appraised and improved. The impacts of these lessons on students’ Computational Thinking
and learning were evaluated. Throughout the course of this work, resources for schools have
been developed, teachers have been trained in these subjects, and findings from this research
have contributed to the development of the New Zealand Digital Technologies|Hangarau
Matahiko curriculum for primary schools.
10.1 Research Goals
The core goals of this research have been to confront a range of challenges in introducing
Computer Science and Computational Thinking to a primary school curriculum, to investi-
242

gate the effects of this curriculum change on students and teachers, and to evaluate claims
on the benefits of Computational Thinking for problem solving and general learning. This
thesis has made significant progress towards achieving these goals.
The research questions I aimed to address, my answers to these, or where they are
addressed in this thesis are listed below:
RQ1 Can Computer Science and basic programming skills be taught in a typical primary
school environment?
Based on the results of the three studies, Computer Science and basic programming
skills can be taught in a typical primary school environment.
RQ1.1 What topics in Computer Science and programming should be trialled for teaching
in this research?
The topics that were used for teaching in this research, and why these were
selected, are covered in Chapter 4, section 4.4.
RQ1.2 What resources and training can teachers be provided with to successfully teach
these?
A range of resources for teaching Computer Science and programming to young
students were discussed in Chapter 5. The specific resources and training that
were provided to teachers during this research are then discussed in Chapter 6,
section 6.3.
RQ1.3 Do students learn, and how much do they learn, through these lessons?
Based on the results of the Pilot study, the Open Teachers study, and the qualita-
tive data obtained in the Intervention study, the majority of students did learn a
significant amount about the Computer Science concepts covered by the CS Un-
plugged lessons. Based on the results of the Pilot study and the Open Teachers
study, the majority of students were able to learn programming basics, such as
selection and repetition, through using block-based programming environments.
RQ2 Can learning Computer Science and programming develop, or improve, Computational
Thinking skills for the majority of students?
Based on the results of the Open Teachers study, and the qualitative data obtained
in the Intervention study, the majority of students can develop, or improve, their
Computational Thinking skills through learning Computer Science and programming.
243

However, based on the quantitative results of the Intervention study, students did not
develop, or improve, their Computational Thinking skills through learning Computer
Science and programming. Due to the limitations of the Intervention study, discussed
in Chapter 9 section 9.6, and the more conclusive results of the Open Teachers study,
I concluded that yes, the majority of students’ can develop, or improve their Compu-
tational Thinking skills through learning Computer Science and programming.
RQ2.1 How can students’ Computational Thinking skills, and changes in these, be mea-
sured?
The potential methods for assessing students’ Computational Thinking skills, and
the ones I chose to use, are discussed in Chapter 3 section 3.4.1, and Chapter 6
section 6.4.
RQ2.2 Do students exercise or employ Computational Thinking skills during Computer
Science and programming lessons, based on teacher observations?
Based on teacher observations throughout each of the three studies, the majority
of students do exercise and employ Computational Thinking skills during Com-
puter Science and programming lessons.
RQ2.3 Is there evidence of students’ Computational Thinking skills improving, as a result
of the Computer Science and programming lessons, based on objective assessment
and teacher observations?
Based on the objective assessment carried out in the Intervention study, there is no
evidence of students’ Computational Thinking skills improving. Based on teacher
observations throughout each of the three studies however, there is evidence of
the majority of students’ Computational Thinking skills improving.
RQ3 Can learning Computer Science and programming, and developing Computational Think-
ing skills, have an impact on problem solving skills or general learning, for the majority
of students?
Based on the results of the three studies, learning Computer Science and programming,
and developing Computational Thinking skills can have a positive impact on problem
solving skills and general learning for the majority of students.
RQ3.1 Do students exercise or employ general problem solving skills during Computer
Science and programming lessons, based on teacher observations?
244

Based on teacher observations throughout each of the three studies, the majority
of students do exercise and employ general problem solving skills during Computer
Science and programming lessons.
RQ3.2 Is there evidence of students’ problem solving skills improving, based on teacher
observations?
Based on teacher observations throughout each of the three studies, the majority
of students’ problem solving skills did improve.
RQ3.3 Is there evidence of the Computer Science and programming lessons having im-
pacts on students’ learning in other curriculum areas, based on teacher observa-
tions?
Based on teacher observations throughout each of the three studies, the Computer
Science and programming lessons did not have any negative impacts on students’
learning in other curriculum areas, and for the majority of students, the lessons
had positive impacts on their learning in other curriculum areas.
RQ3.4 Is there evidence that developing Computational Thinking skills results in these
skills being transferred to other areas of students’ learning, based on teacher ob-
servations?
Based on teacher observations throughout each of the three studies, the vast ma-
jority of students did not transfer their Computational Thinking skills to other
learning areas. A minority of teachers did observe their students transferring their
skills to other areas of learning, showing that this is possible, but this occurred
either as a result of cross-curricula integration or by explicitly teaching students
to apply these skills in different contexts.
RQ4 What other impacts can learning Computer Science and programming, and developing
Computational Thinking skills have on students?
Based on the results of the Pilot study, the Open Teachers study, and teachers’ obser-
vations in the Intervention study, there were many positive impacts of these lessons
on students, both academically and socially. These are detailed in the results and
discussion sections of Chapters 7, 8, and 9.
245

10.2 Contributions
This thesis has made seven primary contributions to knowledge in the domain of Computer
Science and Computational Thinking education. It has:
1. Provided evidence to support the claim that Computational Thinking can benefit the
majority of students’ problem solving skills, in both computing and unrelated fields.
This claim had not been tested or validated prior to this research.
2. Provided evidence against the claim that by learning Computational Thinking skills
through Computer Science and programming students will automatically transfer this
learning to other areas. However, there is some evidence that the majority of students
can transfer these skills if they are explicitly taught to apply Computational Thinking
skills in different contexts, or if Computer Science and programming are taught in a
cross-curricula way.
3. Mapped the general skills (the Key Competencies, such as working together, social
skills, and resilience) that are the core principles the New Zealand Curriculum is based
on, to Computer Science, programming, and Computational Thinking.
4. Shown that concepts from Computer Science and programming can be taught in a
suitable and successful way for all primary school age groups (ages 5 - 13 years old). The
majority of prior research has focused on tertiary level education or selected students,
whereas the results here apply to typical primary school classroom environments, with
generalist teachers; and for students with a wide array of ability levels, subject interest,
and difficulties or strengths with learning, with the caveat that teachers are adequately
supported and resourced.
5. Shown that not only could these subjects be taught to students with a wide range
of abilities, these students were all (apart from students with severe developmental
disabilities) able to achieve success to some degree in these classes, and some students
who struggled with learning or were seen as low achieving were particularly successful,
often to the surprise of the teacher. Programming and topics from Computer Science
appeared to appeal strongly to groups of students who have not been successful within
the existing education system, re-engaged them with learning, provided them with
246

new ways to learn and demonstrate their learning which are more suitable for them,
and have facilitated the development of other skills, particularly social skills, for these
students.
6. Given an evaluation of multiple Computer Science Unplugged activities, which was
done in conjunction with participating teachers. The Computer Science Unplugged
resources were found to be easy for teachers to use, the activities were engaging and
enjoyable for students, and teachers felt that both they and their students learnt from
these. The use of these activities led teachers to continue teaching Computer Science
topics after the conclusion of the study; developed their interest in, and knowledge of
the subjects; and enthused many to encourage and support other teachers to integrate
Computer Science and programming into their own teaching.
7. Collated information on the design of Computer Science, programming, and Compu-
tational Thinking curricula, and a given a framework for a curriculum, parts of which
have led directly into the design of the new New Zealand Digital Technologies|Hangarau
Matahiko curriculum.
10.3 Limitations
As was discussed in Chapter 6, section 6.5, throughout my work the most influential lim-
itation was that my involvement in the NZ curriculum redevelopment, and in providing
support for the implementation of this curriculum, took priority over the process of my re-
search. This, and the pragmatic research approach this required, limited the repeatability
and rigour of the studies conducted. As the curriculum changed throughout my research
there were frequent changes in the content I taught and asked teachers to teach, the training
and resources our research group was providing, and the ability of teachers to participate in
the research. These outside influences introduced a huge number of uncontrolled variables
to the studies.
There are also several threats to the validity of this research that must be acknowledged,
which were also discussed in Chapter 6, section 6.5. While the Bebras challenge has many
merits, its suitability as an assessment tool for CT is not certain. Through the interview
process and analysis, there were risks of bias being introduced. These were the potential for
acquiescence bias from participants, and subjectivity in my analysis of these interviews. As
there was no second person who examined the interview transcripts, it was also not possible
247

for my conclusions to be corroborated. Relying on teachers’ impressions and opinions of
their students’ learning also has limitations, as it is not possible for a teacher to have full
access to the extent of a student’s knowledge this way.
10.4 Future work
There is an extensive range of opportunities for future work in this area, particularly in
the field of Computational Thinking assessment. As explored in chapters 3 and 9, reliable
and objective means of measuring students skills in this area are not widely available. While
observational information is extremely useful, relying on subjective information only is limit-
ing. Having other forms of Computational Thinking assessment is necessary if it, Computer
Science, and programming, are to become established curriculum subjects. Achievement
measurements are also crucial for improving the teaching of these subjects and making
changes to curriculum content when necessary.
Future work could also build on the findings of this thesis through longitudinal studies,
to examine how students’ skills and knowledge develop over time. Several teachers involved
in this work voiced concerns about whether there was going to be a clear progression of
lessons and content at each school year level. They said that if there was not new material
for their students to learn when they moved on to their next year group, they would quickly
lose interest and would not continue learning.
Observing students over more than one year would also be an opportunity to further
investigate how this subject material impacts specific groups of students. In particular,
how this material greatly benefited students who struggled with the traditional learning
methods of reading and writing, were disengaged from learning, and who found it difficult to
communicate their learning and knowledge. The many cases of teachers describing how these
students became engaged with not just this material, but also other subjects; found they
could convey their learning more successfully through programming; and in several cases
went through a great deal of personal development, would be a compelling phenomenon to
investigate in future research.
248

Appendix I
Tables and Figures
A.1 Curriculum comparisons
Table A.1: Comparison of computing curricula for early primary school years [67]
249

Table A.2: Comparison of computing curricula for middle primary school years [67]
250

Table A.3: Comparison of computing curricula for late primary school years [67]
251

A.2 Proposed computing curricula for NZ
Table A.4: Proposed computing curricula for NZ levels 1-3, conservative version
252

Table A.5: Proposed computing curricula for NZ levels 4-5, conservative version.
253

Table A.6: Proposed computing curricula for NZ levels 1-3, ambitious version.
254

Table A.7: Proposed computing curricula for NZ levels 4-5, ambitious version.
255

A.3 Pilot Study
A.3.1 Bebras challenge and quiz results
Year level N Mean Minimum MaximumYear 7 127 40.41% 9.44% 84.44%
(σ=15.05%)Year 8 98 39.95% 4.44% 100%
(σ=19.78%)Total 225 40.21% 4.44% 100%
(σ=17.23%)
Table A.8: Bebras score percent across year 7 and 8 students
Gender N Mean Minimum MaximumFemale 115 40.00% 8.89% 100%
(σ=16.16%)Male 110 40.43% 4.44% 93.33%
(σ=18.36%)Total 225 40.21% 4.44% 100%
(σ=17.23%)
Table A.9: Bebras score percent across female and male students
Ethnicity N Mean Minimum MaximumMaori/ 27 40.21% 8.89% 77.78%Pacifica (σ=16.70%)Other 108 41.66% 4.44% 100%
(σ=17.91%)Total 135 41.37% 4.44% 100%
(σ=17.62%)
Table A.10: Bebras score percent across Maori/Pacifica, and non Maori/Pacifica students
256

Year level N Mean Minimum MaximumYear 7 239 66.25% 26.67% 93.33%
(σ=16.61% )Year 8 127 56.12% 13.33% 100%
(σ= 18.83% )Total 366 62.73% 13.33% 100%
(σ=18.05% )
Table A.11: Data representation quiz percent across year 7 and 8 students
Gender N Mean Minimum MaximumFemale 167 62.95% 26.67% 93.33%
(σ=16.58%)Male 160 63.25% 13.33% 100%
(σ= 19.64%)Total 327 63.10% 13.33% 100%
(σ=18.12%)
Table A.12: Data representation quiz percent across female and male students
Ethnicity N Mean Minimum MaximumMaori/ 60 61.89% 26.67% 100%Pacifica (σ=16.97%)Other 227 63.94% 13.33% 100%
(σ=18.03% )Total 287 63.51% 13.33% 100%
(σ=17.80%)
Table A.13: Data representation percent across Maori/Pacifica, and non Maori/Pacificastudents
Year level N Mean Minimum MaximumYear 7 238 61.68% 10% 90%
(σ=16.98% )Year 8 137 59.12% 10% 100%
(σ=18.73% )Total 375 60.75% 10% 100%
(σ=17.66% )
Table A.14: Programming quiz score across year 7 and year 8 students
257

Gender N Mean Minimum MaximumFemale 179 61.90% 20% 90%
(σ=17.18% )Male 154 61.10% 10% 100%
(σ=17.58% )Total 333 61.53% 10% 100%
(σ=17.34% )
Table A.15: Programming quiz score across female and male students
Ethnicity N Mean Minimum MaximumMaori/ 65 58.77% 30% 90%Pacifica (σ=13.52% )Other 237 62.49% 10% 100%
(σ=17.93%)Total 302 61.69% 10% 100%
(σ=17.12%)
Table A.16: Programming quiz score across Maori/Pacifica, and non Maori/Pacifica students
258

A.3.2 Attitude survey results
Q2 Q3 Q4 Q5 Q6 Q7
Q1) Programming enjoyment Girls 0.57 0.55 0.41 0.28 0.50 0.29
Boys 0.43 0.39 0.35 0.26 0.51 0.34
Q2) Data-rep enjoyment Girls 0.50 0.52 0.49 0.37 0.47
Boys 0.41 0.36 0.32 0.39 0.58
Q3) Continue learning Girls 0.50 0.56 0.37 0.37 0.40
Boys 0.41 0.56 0.38 0.36 0.37
Q4) Consider a career Girls 0.52 0.56 0.64 0.34 0.38
Boys 0.36 0.56 0.66 0.43 0.34
Q5) Prior career interest Girls 0.45 0.37 0.64 0.26 0.26
Boys 0.32 0.37 0.66 0.31 0.30
Q6) Programming confidence Girls 0.37 0.37 0.34 0.26 0.29
Boys 0.39 0.36 0.43 0.31 0.51
Q7) Data-rep confidence Girls 0.47 0.40 0.38 0.26 0.29
Boys 0.58 0.40 0.34 0.30 0.51
All correlations significant at the p < 0.001 level.
Table A.17: Correlations between all students’ answers to the attitude survey questions,split by gender.
259

Q2 Q3 Q4 Q5 Q6 Q7
Q1) Programming enjoyment Year 7 0.48 0.46 0.35 0.23 0.51 0.34
Year 8 0.55 0.53 0.48 0.37 0.55 0.33
Q2) Data-rep enjoyment Year 7 0.43 0.46 0.38 0.45 0.52
Year 8 0.53 0.45 0.40 0.37 0.57
Q3) Continue learning Year 7 0.43 0.62 0.40 0.35 0.41
Year 8 0.53 0.60 0.45 0.44 0.39
Q4) Consider a career Year 7 0.46 0.62 0.71 0.36 0.40
Year 8 0.45 0.60 0.61 0.48 0.37
Q5) Prior career interest Year 7 0.38 0.40 0.71 0.28 0.32
Year 8 0.40 0.45 0.60 0.36 0.28
Q6) Programming confidence Year 7 0.45 0.35 0.36 0.28 0.50
Year 8 0.37 0.44 0.48 0.36 0.39
Q7) Data-rep confidence Year 7 0.52 0.41 0.40 0.32 0.50
Year 8 0.57 0.39 0.37 0.28 0.39
All correlations significant at the p < 0.001 level.
Table A.18: Correlations between students’ answers to the attitude survey questions, splitby year group.
260

Q2 Q3 Q4 Q5 Q6 Q7
Q1) Programming enjoyment 0.61 0.49 0.38 0.17* 0.48 0.43
Q2) Data-rep enjoyment 0.51 0.43 0.35 0.52 0.60
Q3) Continue learning 0.51 0.61 0.37 0.36 0.41
Q4) Consider a career 0.43 0.61 0.62 0.40 0.35
Q5) Prior career interest 0.35 0.37 0.62 0.30 0.29
Q6) Programming confidence 0.52 0.36 0.40 0.30 0.44
Q7) Data-rep confidence 0.60 0.41 0.35 0.29 0.44
*p > 0.05 (p = 0.09 ), all other correlations significant at the p < 0.001 level.
Table A.19: Correlations between Maori and Pacifica students’ answers to the attitudesurvey questions.
Female vs male studentsQuestion Effect size SignificanceQ1) Programming enjoyment 0.35 p<0.001Q2) Data-rep enjoyment 0.30 p<0.001Q3) Continue learning 0.51 p<0.001Q4) Consider career 0.58 p<0.001Q5) Previously considered career 0.51 p<0.001Q6) Programming confidence 0.32 p<0.001Q7) Data-rep confidence 0.27 p<0.001
Table A.20: Differences between female and male students’ answers to the attitude survey
Year 7, female vs male studentsQuestion Effect size SignificanceQ1) Programming enjoyment 0.34 p<0.01Q2) Data-rep enjoyment 0.25 p>0.05Q3) Continue learning 0.42 p<0.01Q4) Consider career 0.49 p<0.001Q5) Previously considered career 0.38 p<0.01Q6) Programming confidence 0.41 p<0.01Q7) Data-rep confidence 0.35 p<0.01
Table A.21: Differences between Year 7 female and male students’ answers to the attitudesurvey
261

Year 8, female vs male studentsQuestion Effect size SignificanceQ1) Programming enjoyment 0.37 p<0.01Q2) Data-rep enjoyment 0.37 p<0.01Q3) Continue learning 0.59 p<0.001Q4) Consider career 0.67 p<0.001Q5) Previously considered career 0.65 p<0.001Q6) Programming confidence 0.25 p>0.05Q7) Data-rep confidence 0.20 p>0.05
Table A.22: Differences between Year 8 female and male students’ answers to the attitudesurvey
Year 7 female vs year 8 female studentsQuestion Effect size SignificanceQ1) Programming enjoyment 0.31 p<0.05Q2) Data-rep enjoyment 0.10 p>0.05Q3) Continue learning 0.30 p<0.05Q4) Consider career 0.09 p>0.05Q5) Previously considered career 0.03 p>0.05Q6) Programming confidence 0.07 p>0.05Q7) Data-rep confidence 0.06 p>0.05
Table A.23: Differences between female Year 7 students’ and female Year 8 students’ answersto the attitude survey
Year 7 male vs year 8 male studentsQuestion Effect size SignificanceQ1) Programming enjoyment 0.21 p>0.05Q2) Data-rep enjoyment 0.03 p>0.05Q3) Continue learning 0.11 p>0.05Q4) Consider career 0.22 p>0.05Q5) Previously considered career 0.22 p>0.05Q6) Programming confidence 0.21 p>0.05Q7) Data-rep confidence 0.18 p>0.05
Table A.24: Differences between male Year 7 students’ and male Year 8 students’ answersto the attitude survey
262

Binary ScoreQuestion Pearson corr. Sig.Q1) Programming enjoyment 0.139 p<0.05Q2) Data-rep enjoyment 0.104 p=0.08Q3) Continue learning 0.09 p=0.13Q4) Consider career 0.03 p=0.58Q5) Previously considered career 0.01 p=0.87Q6) Programming confidence 0.11 p=0.07Q7) Data-rep confidence 0.18 p<0.05
Table A.25: Pearson correlations between student’s score in the Data-rep quiz and theirsurvey answers
Programming ScoreQuestion Pearson corr. Sig.Q1) Programming enjoyment 0.19 p<0.05Q2) Data-rep enjoyment 0.08 p=0.16Q3) Continue learning 0.13 p<0.05Q4) Consider career 0.58 p=0.10Q5) Previously considered career -0.01 p=0.861Q6) Programming confidence 0.16 p<0.05Q7) Data-rep confidence 0.18 p<0.05
Table A.26: Pearson correlations between student’s score in the Programming quiz and theirsurvey answers
Binary total Prog totalFemale students Pearson Sig. Pearson Sig.
corr. (2-tailed) corr. (2-tailed)Binary confidence 0.028 p>0.05 0.103 p>0.05Prog confidence 0.139 p>0.05 0.090 p>0.05Male studentsBinary confidence 0.300 p<0.01 0.252 p<0.01Prog confidence 0.079 p>0.05 0.248 p<0.01
Table A.27: Pearson correlations between student’s gender and their confidence
263

Binary total Prog totalMaori/Pacifica Pearson Sig. Pearson Sig.students corr. (2-tailed) corr. (2-tailed)Binary confidence 0.01 p>0.05 0.07 p>0.05Prog confidence 0.04 p>0.05 -0.16 p>0.05Non-Maori/PacificastudentsBinary confidence 0.20 p<0.01 0.21 p<0.01Prog confidence 0.10 p>0.05 0.22 p<0.01
Table A.28: Pearson correlations between student’s ethnicity and their confidence
264

Appendix II
Pilot Study Quizzes
B.1 Data Representation Quiz
Section 1.
1. What code do computers use to store information?
a) Java b) Binary c) Python d) HTML
Answer: b) Binary
2. What are the two digits used in binary code?
a) 10, 1 b) 1, 1 c) 0, 1 d) 0, 0
Answer: c) 0, 1
3. Everything that appears on you screen is merely represented as a series of “0’s” and
“1’s” inside the computer, including number, punctuation, pictures, and colours.
a) True b) False
Answer: a) True
Section 2.
Use the image below to help you answer the next several questions. We are only using these
five cards today.
265

4. Using binary, is there more than one way to make any number?
a) Yes b) No
Answer: b) No
5. What is the biggest number you can make with these 5 cards?
a) 16 b) 30 c) 31 d) 33
Answer: c) 31
6. What is the smallest number you can make with these 5 cards?
a) 1 b) 5 c) 0 d) 31
Answer: c) 0
7. Is there any whole number you can’t make, between the biggest and the smallest
number?
a) Yes b) No
Answer: b) No
8. To make the number 19 requires the cards representing 16, 2, and 1.
a) True b) False
Answer: a) True
266

9. In binary 10101 represents which of the following numbers?
a) 17 b) 23 c) 21 d) 3
Answer: c) 21
10. If you add the numbers up from the beginning the sum will always be one less than
the next number in the sequence 1
a) True b) False
Answer: a) True
11. When you put a zero on the right hand side of a binary number, the number doubles.
a) True b) False
Answer: a) True
Section 3.
Use the table below to help you answer the next several questions.
12. Read the sequence of binary using the table above to help you work out what my
favourite cartoon character is. 11001, 01111, 00111, 01001, 00000, 00010, 00101, 00001,
10010. Note: Don’t forget 00000 represents a space between words.
a) betty boop b) daffy duck c) yogi bear d) bugs bunny
Answer: c) yogi bear
1 This wording is not very clear or technically correct. However it matched the wording the teacher hadused in class when teaching this particular concept.
267

13. Read the sequence of binary using the table above to help you. If I were an animal I
would be a? 01000, 01001, 10000, 10000, 01111, 10000, 01111, 10100, 00001, 01101,
10101, 10011
a) rhinoceros b) komodo dragon c) chinchilla d) hippopotamus
Answer: d) hippopotamus
Section 4.
Computers store drawings, photographs and other pictures using only numbers. Computer
screens are divided up into a grid of small dots called pixels (picture elements).
14. In a black and white picture, each pixel is either black or white. The first number
always relates to the number of black pixels. Use the picture above to help you answer
the question2.
a) True b) False
Answer: b) False
2 Pictures on computers are not actually represented in this same way. This is the way the concept wastaught in the CS Unplugged activities however
268

15. If the first pixel in the row is black, the line will begin with a 1.
a) True b) False
Answer: b) False
B.2 Scratch Programming Quiz
1. An input is any information provided to the program. Which of the following listed
below in the most commonly used input device?
a) Mouse b) Camera c) Keyboard d) Microphone
Answer: a) Mouse, or c) Keyboard
2. Output is any information (or effect) that a program produces: Select from below the
best answer. a) Sound is an example of an output.
b) Text is an example of an output.
c) Pictures are an example of an output.
d) All of the above are examples of outputs.
Answer: d) All of the above are examples of outputs.
3. Which of the following best defines the concept of what we mean by a Scratch block?
a) A command to one of the sprites.
b) A block on the stage.
c) A sprite on the stage.
d) When one sprite interferes with another.
Answer: a) A command to one of the sprites.
4. How is a sequence of commands created in Scratch?
a) By linking blocks together with connector lines.
b) By dragging and snapping blocks together.
c) By simply dragging and dropping blocks onto the script area.
269
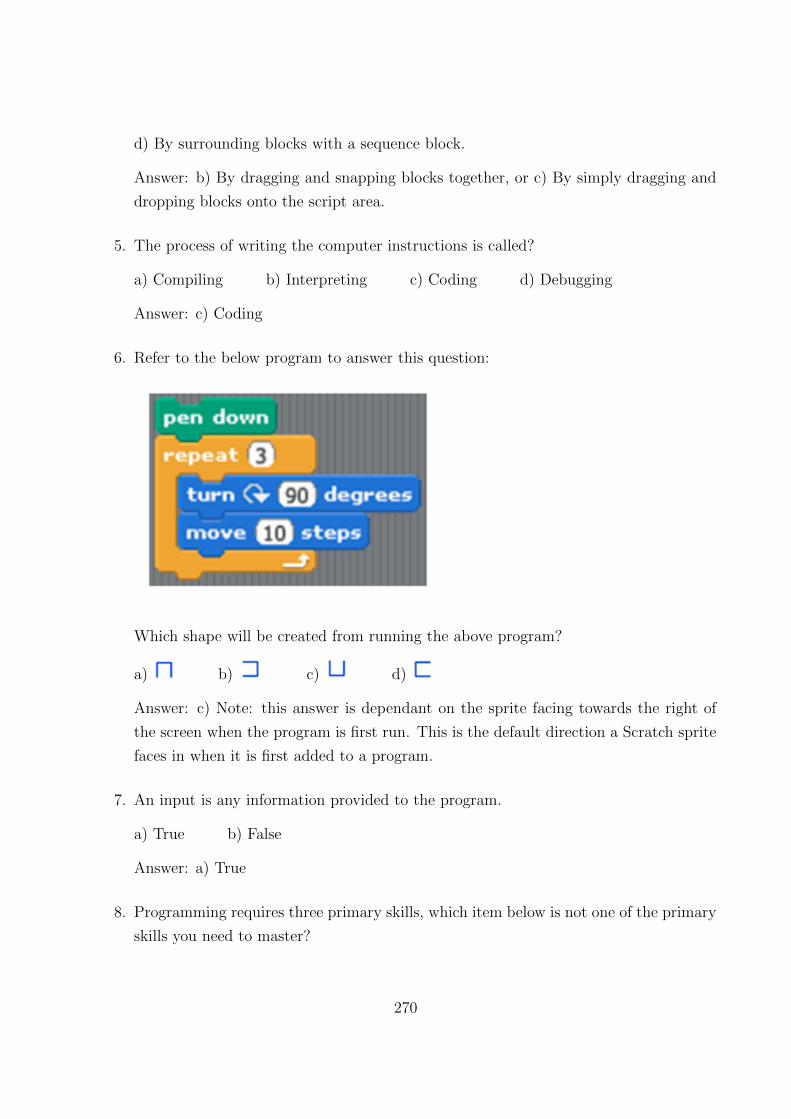
d) By surrounding blocks with a sequence block.
Answer: b) By dragging and snapping blocks together, or c) By simply dragging and
dropping blocks onto the script area.
5. The process of writing the computer instructions is called?
a) Compiling b) Interpreting c) Coding d) Debugging
Answer: c) Coding
6. Refer to the below program to answer this question:
Which shape will be created from running the above program?
a) b) c) d)
Answer: c) Note: this answer is dependant on the sprite facing towards the right of
the screen when the program is first run. This is the default direction a Scratch sprite
faces in when it is first added to a program.
7. An input is any information provided to the program.
a) True b) False
Answer: a) True
8. Programming requires three primary skills, which item below is not one of the primary
skills you need to master?
270

a) selection b) reception c) repitition d) sequence
Answer: b) reception
9. What is a variable?
a) A long-term storage of songs, photos and documents.
b) Short-term storage of numeric values.
c) A loop that runs at varying speeds.
d) A memory area that holds a single value.
Answer: d) A memory area that holds a single value.
10. When thinking about variables for your program, the rule of thumb we used is to create
one variable for each:
a) Sprite in your program.
b) Repetition block in your program.
c) For each value you need to keep track of.
d) For each player in your game.
Answer: c) For each value you need to keep track of.
271
Appendix III
Ethics approval documents
Contents:
• Approval letter for the Pilot Study.
• 2015 approval letter for the Open Teachers Study.
• 2016 approval letter for the Open Teachers Study
• Approval letter for the 2017 computational thinking skills study.
272

University of Canterbury Private Bag 4800, Christchurch 8140, New Zealand. www.canterbury.ac.nz
F E S
HUMAN ETHICS COMMITTEE Secretary, Lynda Griffioen Email: [email protected]
Ref: HEC 2014/143
19 November 2014
Caitlin Duncan
Department of Computer Science & Software Engineering
UNIVERSITY OF CANTERBURY
Dear Caitlin
The Human Ethics Committee advises that your research proposal “Student attitudes towards
computer science and programming curriculum” has been considered and approved.
Please note that this approval is subject to the incorporation of the amendments you have provided
in your emails of 12 and 15 November 2014.
Best wishes for your project.
Yours sincerely
Lindsey MacDonald
Chair
University of Canterbury Human Ethics Committee
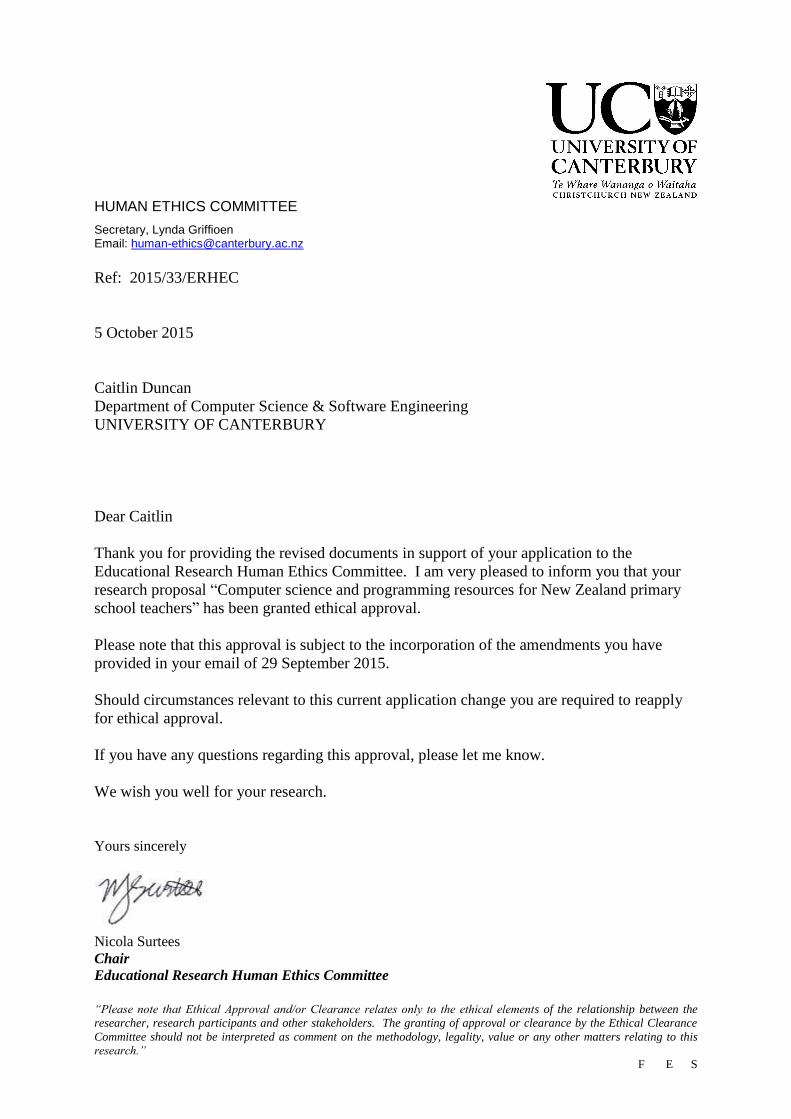
“Please note that Ethical Approval and/or Clearance relates only to the ethical elements of the relationship between the
researcher, research participants and other stakeholders. The granting of approval or clearance by the Ethical Clearance
Committee should not be interpreted as comment on the methodology, legality, value or any other matters relating to this
research.”
F E S
HUMAN ETHICS COMMITTEE
Secretary, Lynda Griffioen Email: [email protected]
Ref: 2015/33/ERHEC
5 October 2015
Caitlin Duncan
Department of Computer Science & Software Engineering
UNIVERSITY OF CANTERBURY
Dear Caitlin
Thank you for providing the revised documents in support of your application to the
Educational Research Human Ethics Committee. I am very pleased to inform you that your
research proposal “Computer science and programming resources for New Zealand primary
school teachers” has been granted ethical approval.
Please note that this approval is subject to the incorporation of the amendments you have
provided in your email of 29 September 2015.
Should circumstances relevant to this current application change you are required to reapply
for ethical approval.
If you have any questions regarding this approval, please let me know.
We wish you well for your research.
Yours sincerely
Nicola Surtees
Chair
Educational Research Human Ethics Committee

Please note that ethical approval relates only to the ethical elements of the relationship between the researcher, research
participants and other stakeholders. The granting of approval by the Educational Research Human Ethics Committee should
not be interpreted as comment on the methodology, legality, value or any other matters relating to this research. F E S
HUMAN ETHICS COMMITTEE
Secretary, Rebecca Robinson Telephone: +64 03 364 2987, Extn 45588 Email: [email protected]
Ref: 2016/13/ERHEC
1 June 2016
Caitlin Duncan
Department of Computer Science and Software Engineering
UNIVERSITY OF CANTERBURY
Dear Caitlin
Thank you for providing the revised documents in support of your application to the
Educational Research Human Ethics Committee. I am very pleased to inform you that your
research proposal “Teaching Computational Thinking Skills in New Zealand Primary
Schools.” has been granted ethical approval.
Please note that this approval is subject to the incorporation of the amendments you have
provided in your email of 27th
May 2016.
Should circumstances relevant to this current application change you are required to reapply
for ethical approval.
If you have any questions regarding this approval, please let me know.
We wish you well for your research.
Yours sincerely
Patrick Shepherd
Chair
Educational Research Human Ethics Committee
pp

Please note that ethical approval relates only to the ethical elements of the relationship between the researcher, research
participants and other stakeholders. The granting of approval by the Educational Research Human Ethics Committee should
not be interpreted as comment on the methodology, legality, value or any other matters relating to this research. F E S
HUMAN ETHICS COMMITTEE
Secretary, Rebecca Robinson Telephone: +64 03 369 4588, Extn 94588 Email: [email protected]
Ref: 2016/13/ERHEC Amendment 1
14 June 2017
Caitlin Duncan
Department of Computer Science and Software Engineering
UNIVERSITY OF CANTERBURY
Dear Caitlin
Thank you for your request for an amendment to your research proposal “Teaching
Computational Thinking Skills in New Zealand Primary Schools.” as outlined in your email
dated 7th
June 2017. I am pleased to advise that this amendment has been considered and
approved by the Educational Research Human Ethics Committee.
Please note that should circumstances relevant to this current application change you are
required to reapply for ethical approval.
If you have any questions regarding this approval, please advise.
We wish you well for your continuing research.
Yours sincerely
Patrick Shepherd
Chair
Educational Research Human Ethics Committee
pp

References
[1] Aho, A. V. Ubiquity symposium: Computation and computational thinking. Ubiquity
2011, January (January 2011).
[2] Aivaloglou, E., and Hermans, F. How kids code and how we know: An ex-
ploratory study on the scratch repository. Proceedings of the 2016 ACM Conference
on International Computing Education Research (2016), 53–61.
[3] Ambrose, S. A., Bridges, M. W., DiPietro, M., Lovett, M. C., and Nor-
man, M. K. How learning works: Seven research-based principles for smart teaching.
John Wiley & Sons, 2010.
[4] Anderson, L. W., Krathwohl, D. R., Airasian, P. W., Cruikshank, K. A.,
Mayer, R. E., Pintrich, P. R., Raths, J., and Wittrock, M. C. A taxonomy
for learning, teaching, and assessing: A revision of Bloom’s taxonomy of educational
objectives, abridged edition. White Plains, NY: Longman (2001).
[5] Armoni, M., Meerbaum-Salant, O., and Ben-Ari, M. From scratch to ”real”;
programming. Trans. Comput. Educ. 14, 4 (Feb. 2015), 25:1–25:15.
[6] Ashcraft, C., and Breitzman Sr, A. Who invents it? women’s participation
in information technology patenting, 2012 update. Tech. rep., National Center for
Women & Information Technology, 2012.
[7] Australian Curriculum Assessment and Reporting Authority (ACARA).
Australian digital technologies curriculum. www.australiancurriculum.edu.au/
technologies/digital-technologies/curriculum/f-10, 2014. [Online; accessed
1-April-2014].
[8] Bagge, P. Code It How To Teach Programming Using Scratch: Teacher’s Hand-
book (Code-IT Primary Programming), 1 ed. The University of Buckingham Press,
Buckingham, 2015.
277

[9] Balanskat, A., and Engelhardt, K. Computing our future: Computer program-
ming and coding-priorities, school curricula and initiatives across europe. Tech. rep.,
European Schoolnet, 2015.
[10] Bandura, A. Social Cognitive Theory: An Agentic Perspective. Annual Review of
Psychology 52, 1 (February 2001), 1–26.
[11] Barefoot Computing. Computational thinking concepts and ap-
proaches. https://www.barefootcomputing.org/concept-approaches/
computational-thinking-concepts-and-approaches, 2018. [Online; accessed
1-Dec-2018].
[12] Barendsen, E., Mannila, L., Demo, B., Grgurina, N., Izu, C., Mirolo,
C., Sentance, S., Settle, A., and Stupuriene, G. Concepts in k-9 computer
science education. In Proceedings of the 2015 ITiCSE on working group reports (2015),
ACM, pp. 85–116.
[13] Barker, L., Mancha, C., and Ashcraft, C. What is the Impact of Gender Di-
versity on Technology Business Performance: Research Summary. Tech. rep., NCWIT,
2014.
[14] Barr, D., Harrison, J., and Conery, L. Computational Thinking: A Digital
Age Skill for Everyone. Learning and Leading with Technology 38, 6 (2011), 20–23.
[15] Barr, V., and Stephenson, C. Bringing computational thinking to K-12: what
is involved and what is the role of the computer science education community? ACM
Inroads 2, 1 (2011), 48–54.
[16] Basawapatna, A., Koh, K. H., Repenning, A., Webb, D. C., and Marshall,
K. S. Recognizing Computational Thinking Patterns. Proceedings of the 42nd ACM
Technical Symposium on Computer Science Education - SIGCSE ’11 (2011), 245.
[17] BBC. BBC Bitesize: Digital Literacy, 2018. [Online; accessed 21-November-2018].
[18] Bell, T., Andreae, P., and Lambert, L. Computer science in New Zealand
high schools. In Proceedings of the Twelfth Australasian Conference on Computing
Education-Volume 103 (2010), Australian Computer Society, Inc., pp. 15–22.
278

[19] Bell, T., Newton, H., Andreae, P., and Robins, A. The introduction of Com-
puter Science to NZ High Schools: an analysis of student work. In The 7th Workshop in
Primary and Secondary Computing Education (WiPSCE 2012) (Hamburg, Germany,
2012), M. Knobelsdorf and R. Romeike, Eds., pp. 5–15.
[20] Bell, T., Witten, I. H., Fellows, M., Adams, R., and McKenzie, J. Com-
puter Science Unplugged. An enrichment and extension programme for primary-aged
children. Computer Science Unplugged, 2000.
[21] Bell, T., Witten, I. H., Fellows, M., Adams, R., and McKenzie, J. Com-
puter Science Unplugged. An enrichment and extension programme for primary-aged
children. Teacher’s Edition Parts I, II, and III. Computer Science Unplugged, 2012.
[22] Bell, T. C., Witten, I. H., and Fellows, M. Computer Science Unplugged:
Off-line activities and games for all ages. Citeseer, 1998.
[23] Bellettini, C., Lonati, V., Malchiodi, D., Monga, M., Morpurgo, A.,
and Torelli, M. How Challenging are Bebras Tasks? An IRT analysis based on the
performance of Italian students. Annual Conference on Innovation and Technology in
Computer Science Education, ITiCSE 2015-June (2015), 27–32.
[24] Beyer, S., Rynes, K., and Haller, S. Deterrents to women taking computer
science courses. IEEE Technology and Society Magazine 23, 1 (January 2004), 21–28.
[25] Beyer, S., Rynes, K., Perrault, J., Hay, K., and Haller, S. Gender dif-
ferences in computer science students. In Proceedings of the 34th SIGCSE technical
symposium on Computer science education - SIGCSE ’03 (New York, New York, USA,
2003), ACM Press, p. 49.
[26] Blackwell, A. F. What is programming. In 14th workshop of the Psychology of
Programming Interest Group (2002), pp. 204–218.
[27] Brennan, K., Balch, C., and Chung, M. Creative Computing. Harvard Graduate
School of Education, 2019. [Online; accessed 17 January 2019].
279

[28] Brennan, K., Balch, C., and Chung, M. Creative Computing Learner Workbook.
Harvard Graduate School of Education, 2019. [Online; accessed 17 January 2019].
[29] Brennan, K., and Resnick, M. New frameworks for studying and assessing the
development of computational thinking. Annual American Educational Research As-
sociation meeting, Vancouver, BC, Canada (2012), 1–25.
[30] Briggs, J. R. Snake wrangling for kids, learning to program with python. On-
line, 2007. [Retrieved from https://www.utrgv.edu/cstem/_files/documents/
snake-wrangling.pdf ].
[31] Briggs, J. R. Python for Kids. A Playful Introduction to Programming. No Starch
Press, 2012.
[32] Broughton, C. In-utero anxiety from Christchurch earthquakes showing up at
school — Stuff.co.nz. https://www.stuff.co.nz/national/health/90619094/
inutero-anxiety-from-christchurch-earthquakes-showing-up-at-school,
2017. [Online; accessed 3-August-2018].
[33] Bundy, A. Computational Thinking is Pervasive. Journal of Scientific and Practical
Computing 1, 2 (2007), 67–69.
[34] Cai, Z., Fan, X., and Du, J. Gender and attitudes toward technology use: A
meta-analysis. Computers & Education 105 (2017), 1–13.
[35] CareersNZ. Who earns what? CareersNZ. https://www.careers.govt.nz/
jobs-database/whats-happening-in-the-job-market/who-earns-what/, 2017.
[Online; accessed 19-June-2018].
[36] CareersNZ. https://www.careers.govt.nz/jobs-database/
education-and-social-sciences/education/primary-school-teacher/
how-to-enter-the-job, 2018. [Online; accessed 8-December-2018].
[37] Carrell, T., Gough-Jones, V., and Fahy, K. The future of Computer Science
and Digital Technologies in New Zealand secondary schools: Issues of 21st teaching
and learning, senior courses and suitable assessments. Tech. rep., Technical report,
August 2008.
280

[38] Cartelli, A., Dagiene, V., and Futschek, G. Bebras Contest and Digital Com-
petence Assessment. International Journal of Digital Literacy and Digital Competence
1, 1 (2010), 24–39.
[39] Clarke, B. Computer Science Teacher, Insight into the computing classroom. BCS,
The Chartered Institute for IT, 2017.
[40] Code.org. Code.org. https://code.org/. [Online; accessed 12-September-2018].
[41] Cohoon, J. M., and Aspray, W., Eds. Women and Information Technology:
Research on Underrepresentation, 1 ed., vol. 1. The MIT Press, 2006.
[42] Comer, D. E., Gries, D., Mulder, M. C., Tucker, A., Turner, A. J., and
Young, P. R. Computing as a discipline. Commun. ACM 32, 1 (Jan. 1989), 9–23.
[43] Computer Science for Fun. CS4FN. http://www.cs4fn.org/, 2015. [Online;
accessed 12-October-2015].
[44] Computing At School. Computing at school community. http://www.
computingatschool.org.uk/. [Online; accessed 2-March-2016].
[45] Computing At School. Barefoot computing. http://barefootcas.org.uk/, 2014.
[Online; accessed 2-March-2016].
[46] Cooper, S., Perez, L. C., and Rainey, D. K–12 computational learning. Com-
munications of the ACM 53, 11 (November 2010), 27.
[47] Cortina, T. J. Reaching a broader population of students through ”unplugged”
activities. Commun. ACM 58, 3 (Feb. 2015), 25–27.
[48] Costa, J. M., and Miranda, G. L. Relation between Alice software and pro-
gramming learning: A systematic review of the literature and meta-analysis. British
Journal of Educational Technology 48, 6 (2017), 1464–1474.
[49] Csizmadia, A., Curzon, P., Dorling, M., Humphreys, S., Ng, T., Selby,
C., and Woollard, J. Computational thinking A guide for teachers. Tech. rep.,
Computing at Schools, 2015.
281

[50] Curzon, P., Bell, T., Waite, J., and Dorling, M. Computational thinking. In
The Cambridge Handbook of Computing Education Research, S. Fincher and A. Robins,
Eds. Cambridge University Press, 2019, pp. 513–546.
[51] Curzon, P., Dorling, M., Selby, C., and Woollard, J. Developing compu-
tational thinking in the classroom: a framework. Project Report June, Computing at
School, 2014.
[52] Cvencek, D., Meltzoff, A. N., and Greenwald, A. G. Math-Gender Stereo-
types in Elementary School Children. Child Development 82, 3 (2011), 766–779.
[53] Dagiene, V., and Futschek, G. Bebras international contest on informatics
and computer literacy: Criteria for good tasks. In Informatics Education - Support-
ing Computational Thinking (Berlin, Heidelberg, 2008), M. M. Mittermeir, Roland
T.and Sys lo, Ed., vol. 5090 of Lecture Notes in Computer Science, Springer Berlin
Heidelberg, pp. 19–30.
[54] Dagiene, V., Mannila, L., Poranen, T., Rolandsson, L., and Soderhjelm,
P. Students’ Performance on Programming-related Tasks in an Informatics Contest in
Finland, Sweden and Lithuania. In Proceedings of the 2014 Conference on Innovation
Technology in Computer Science Education (New York, NY, USA, 2014), ITiCSE ’14,
ACM, pp. 153–158.
[55] Dagiene, V., and Sentance, S. It’s Computational Thinking! Bebras Tasks in the
Curriculum. In Lecture Notes in Computer Science (including subseries Lecture Notes
in Artificial Intelligence and Lecture Notes in Bioinformatics), A. Brodnik and F. Tort,
Eds., vol. 9973 LNCS of Lecture Notes in Computer Science. Springer International
Publishing, Cham, 2016, pp. 28–39.
[56] DAGIENE, V., and STUPURIENE, G. Bebras - a Sustainable Community Build-
ing Model for the Concept Based Learning of Informatics and Computational Thinking.
INFORMATICS IN EDUCATION 15, 1 (May 2016), 25–44.
[57] Dagiene, V., and Stupuriene, G. Informatics Concepts and Computational
Thinking in K-12 Education: A Lithuanian Perspective. Journal of Information Pro-
cessing 24, 4 (2016), 732–739.
282

[58] Danaher, K., and Crandall, C. S. Stereotype threat in applied settings re-
examined. Journal of Applied Social Psychology 38, 6 (2008), 1639–1655.
[59] Denning, P. J. Is computer science science? Commun. ACM 48, 4 (Apr. 2005),
27–31.
[60] Denning, P. J. Computing is a natural science. Commun. ACM 50, 7 (July 2007),
13–18.
[61] Denning, P. J. The profession of IT Beyond computational thinking. Communica-
tions of the ACM 52, 6 (June 2009), 28.
[62] Denning, P. J. Computational Thinking in Science. American Scientist (2017).
[63] Denning, P. J. Remaining trouble spots with computational thinking. Communica-
tions of the ACM 60, 6 (2017), 33–39.
[64] Denning, P. J., and Rosenbloom, P. S. Computing: The Fourth Great Domain
of Science. Communications of the ACM 52, 9 (September 2009), 27.
[65] Department for Education, England. National curriculum in england.
computing programmes of study. www.gov.uk/government/publications/
national-curriculum-in-england-computing-programmes-of-study/
national-curriculum-in-england-computing-programmes-of-study, 2014.
[Online; accessed 1-April-2014].
[66] Doward, J., Cadwalladr, C., and Gibbs, A. Watchdog to launch inquiry into
misuse of data in politics, 2017. [Online; accessed 26-April-2018].
[67] Duncan, C., and Bell, T. A Pilot Computer Science and Programming Course
for Primary School Students. In Proceedings of the 10th Workshop in Primary and
Secondary Computing Education - WiPSCE ’15 (2015), ACM, pp. 39–48.
[68] Duncan, C., Bell, T., and Atlas, J. What do the Teachers Think ? Introduc-
ing Computational Thinking in the Primary School Curriculum. Proceedings of the
Nineteenth Australasian Computing Education Conference (2017), 65–74.
283
[69] Duncan, C., Bell, T., and Tanimoto, S. Should your 8-year-old learn coding?
In Proceedings of the 9th Workshop in Primary and Secondary Computing Education
- WiPSCE ’14 (New York, New York, USA, 2014), ACM Press, pp. 60–69.
[70] Education Central. NZ teachers have biggest workloads, sur-
vey finds as NZEI strikes begin. https://educationcentral.co.nz/
nz-teachers-have-biggest-workloads-survey-finds-as-nzei-strikes-begin/,
2018. [Online; accessed 24-January-2019].
[71] EducationHQ. Teachers give reasons for leaving. https://nz.educationhq.com/
news/56544/teachers-give-reasons-for-leaving/, 2019. [Online; accessed 2-
February-2019].
[72] Ericson, B., and McKlin, T. Effective and Sustainable Computing Summer
Camps. In Proceedings of the 43rd ACM Technical Symposium on Computer Science
Education (New York, NY, USA, 2012), SIGCSE ’12, ACM, pp. 289–294.
[73] ERO. Evaluation at a Glance: Priority Learners in New Zealand Schools August 2012.
Tech. rep., The Education Review Office ERO, August 2012.
[74] ERO. Inclusive practices for students with special needs in schools.
https://www.ero.govt.nz/assets/Uploads/Inclusive-practices-for-students-with-
special-needs-in-schools.pdf, March 2015. [Online; accessed 8-December-2018].
[75] Expanding Computer Science Education Pathways. Computer sci-
ence standards and frameworks. https://ecepalliance.org/resources/
computer-science-standards-and-frameworks. [Online; accessed 12-September-
2018].
[76] Falkner, K., Vivian, R., and Falkner, N. The Australian digital technologies
curriculum: Challenge and opportunity. In Conferences in Research and Practice in
Information Technology Series (2014), vol. 148, pp. 3–12.
[77] Felix, E. Coding and computer science should be mandatory in canadian schools.
https://www.theglobeandmail.com/report-on-business/rob-commentary/
284

coding-and-computer-science-should-be-mandatory-in-canadian-schools/
article31456908/, 2016. [Online; accessed 13-March-2019].
[78] Friend, M., and Cutler, R. Efficient Egg Drop Contests : How Middle School
Girls Think About Algorithmic Efficiency. Icer’13 (2013), 99–106.
[79] Furber, S., Ed. Shut down or restart? The way forward for computing in UK schools.
The Royal Society, London, 2012.
[80] Gibson, J. The Digital Divide in New Zealand: The Position of Maori and Pacific
Peoples. Journal of Maori and Pacific Development (2002), 90–96.
[81] Goldweber, M., Barr, J., and Patitsas, E. Computer science education for
social good. In Proceeding of the 44th ACM technical symposium on Computer science
education - SIGCSE ’13 (New York, New York, USA, 2013), ACM Press, p. 15.
[82] Google. Google for education: Exploring computational thinking. https://www.
google.co.nz/edu/resources/programs/exploring-computational-thinking/
index.html#!ct-overview. [Online; accessed 26-February-2016].
[83] Grimsey, G., and Phillipps, M. Evaluation of Technology Achievement Standards
for use in New Zealand Secondary School Computing Education. Tech. Rep. April,
New Zealand Computer Society (NZCS), Wellington, 2008.
[84] Grover, S., Cooper, S., and Pea, R. Assessing computational learning in K-12.
Proceedings of the 2014 conference on Innovation & technology in computer science
education - ITiCSE ’14 (2014), 57–62.
[85] Grover, S., and Pea, R. Computational Thinking in K-12: A Review of the State
of the Field. Educational Researcher 42, 1 (2013), 38–43.
[86] Grover, S., and Pea, R. Computational thinking: A competency whose time has
come. Computer Science Education: Perspectives on teaching and learning in school.
London: Bloomsbury Academic (2018), 19–37.
285

[87] Grover, Shuchi. The 5th ‘C’ of 21st Century Skills? Try Com-
putational Thinking (Not Coding). https://www.edsurge.com/news/
2018-02-25-the-5th-c-of-21st-century-skills-try-computational-thinking\
-not-coding/, 2018. [Online; accessed 3-December-2018].
[88] Guzdial, M. Education Paving the way for computational thinking. Communications
of the ACM 51, 8 (2008), 25.
[89] Guzdial, M. Computing Education Blog Growing CS Ed through Schools of Ed , and
CT is Unlikely : Report from Oldenburg, 2015. [Online; accessed 13-October-2017].
[90] Guzdial, M. Learner-Centered Design of Computing Education: Research on Com-
puting for Everyone. Synthesis Lectures on Human-Centered Informatics 8, 6 (Novem-
ber 2015), 1–165.
[91] Hake, R. R. Interactive-engagement versus traditional methods: A six-thousand-
student survey of mechanics test data for introductory physics courses. American
Journal of Physics 66, 1 (1998), 64–74.
[92] Harlen, W. Trusting teachers’ judgement: research evidence of the reliability and
validity of teachers’ assessment used for summative purposes. Research Papers in
Education 20, 3 (2005), 245–270.
[93] Hazzan, O., Lapidot, T., and Ragonis, N. Guide to Teaching Computer Science.
Springer London, London, 2011.
[94] Heintz, F., Mannila, L., and Farnqvist, T. A review of models for introduc-
ing computational thinking, computer science and computing in K-12 education. In
2016 IEEE Frontiers in Education Conference (FIE) (October 2016), vol. 2016-Novem,
IEEE, pp. 1–9.
[95] Hemmendinger, D. A plea for modesty. ACM Inroads 1, 2 (2010), 4.
[96] Hoover, J. Report on how alberta got cs as a recognized subject. http://cacsaic.
cpsc.ucalgary.ca/HowAlbertaGotCS, 2011. [Online; accessed 9-May-2018].
286

[97] Hubwieser, P., and Muhling, A. Playing PISA with Bebras. In Proceedings of
the 9th Workshop in Primary and Secondary Computing Education (New York, NY,
USA, 2014), WiPSCE ’14, ACM, pp. 128–129.
[98] Hubwieser, P., and Muhling, A. Investigating the psychometric structure of Be-
bras contest: Towards measuring computational thinking skills. In Proceedings - 2015
International Conference on Learning and Teaching in Computing and Engineering,
LaTiCE 2015 (2015), pp. 62–69.
[99] InternetNZ. State of the Internet 2017. The State of the Internet in New Zealand.
Tech. rep., InternetNZ, 2017.
[100] ISTE and CSTA. Operational Definition of Computational Thinking. Tech. rep.,
ISTE, CSTA, CSTA Computational Thinking Task Force, 2011.
[101] Iversen, O. S., Smith, R. C., and Dindler, C. From computational thinking
to computational empowerment: A 21st century pd agenda. In Proceedings of the
15th Participatory Design Conference: Full Papers - Volume 1 (New York, NY, USA,
2018), PDC ’18, ACM, pp. 7:1–7:11.
[102] Izu, C., Mirolo, C., Settle, A., Mannila, L., and Stupuriene, G. Explor-
ing Bebras Tasks Content and Performance: A Multinational Study. Informatics in
Education 16, 1 (2017), 39–59.
[103] Janacsek, K., Fiser, J., and Nemeth, D. The best time to acquire new skills:
age-related differences in implicit sequence learning across the human lifespan. Devel-
opmental science 15, 4 (July 2012), 496–505.
[104] Juskeviciene, A., and Dagiene, V. Computational Thinking Relationship with
Digital Competence. Informatics in Education 17, 2 (2018), 265–284.
[105] Kafai, Y. B., and Burke, Q. Computer programming goes back to school. Edu-
cation Week (2014), 61–65.
[106] Kay, A. C. The Early History of Smalltalk. In The Second ACM SIGPLAN Confer-
ence on History of Programming Languages (New York, NY, USA, 1993), HOPL-II,
ACM, pp. 69–95.
287

[107] Kazakoff, E., and Bers, M. Programming in a robotics context in the kinder-
garten classroom: The impact on sequencing skills. Journal of Educational Multimedia
and Hypermedia 21, 4 (2012), 371–391.
[108] Keogh, B. Canterbury earthquakes: Kids born after disaster inheriting trauma from
parents through DNA, schools dealing with more behaviour issues - NZ Herald, 2018.
[Online; accessed 6-June-2018].
[109] Kick, R., and Trees, F. P. AP CS Principles: Engaging, Challenging, and Re-
warding. ACM Inroads 6, 1 (February 2015), 42–45.
[110] Kite, V., Park, S., and Wiebe, E. Recognizing and questioning the ct education
paradigm. In Proceedings of the 50th ACM Technical Symposium on Computer Science
Education (New York, NY, USA, 2019), SIGCSE ’19, ACM, pp. 1286–1286.
[111] Kubica, J. Computational fairy tales blog. http://computationaltales.
blogspot.com/. [Online; accessed 16-January-2019].
[112] Kubica, J. Computational Fairy Tales. CreateSpace Independent Publishing Plat-
form, 2012.
[113] Lambert, L., and Guiffre, H. Computer science outreach in an elementary school.
Journal of Computing Sciences in Colleges 24, 3 (January 2009), 118–124.
[114] Lee, I. Computer Science: Critical K-8 Learning. In Special Issue Computer Science
K-8: Building a Strong Foundation (2012), P. Phillips, Ed., Computer Science Teachers
Association, pp. 10–11.
[115] Lee, I., Martin, F., and Apone, K. Integrating Computational Thinking Across
the K–8 Curriculum. ACM Inroads 5, 4 (December 2014), 64–71.
[116] Lee, I., Martin, F., Denner, J., Coulter, B., Allan, W., Erickson, J.,
Malyn-Smith, J., and Werner, L. Computational thinking for youth in practice.
ACM Inroads 2, 1 (2011), 32.
288

[117] Lestch, C. These states embraced computer science education in 2017. https://
edscoop.com/these-states-embraced-computer-science-education-in-2017.
[Online; accessed 12-September-2018].
[118] Liberty, K., Tarren-Sweeney, M., Macfarlane, S., Basu, A., and Reid, J.
Behavior problems and post-traumatic stress symptoms in children beginning school:
A comparison of pre- and post-earthquake groups. PLoS Currents 8, Disasters (Jan-
uary 2016).
[119] Lieu, J. Australian police use a secret algorithm and blacklist to tar-
get children suspected of future offending. https://mashable.com/2017/10/26/
children-predictive-policing-australia/. [Online; accessed 3-September-2018].
[120] Liukas, L. Hello Ruby: Adventures in Coding. R. R. Donnelley and Sons Company,
2015.
[121] Lu, J. J., and Fletcher, G. H. Thinking about computational thinking. In ACM
SIGCSE Bulletin (New York, NY, USA, March 2009), vol. 41 of SIGCSE ’09, ACM,
p. 260.
[122] Mannila, L., Dagiene, V., Demo, B., Grgurina, N., Mirolo, C., Rolands-
son, L., and Settle, A. Computational Thinking in K-9 Education. In Proceedings
of the Working Group Reports of the 2014 on Innovation & Technology in Computer
Science Education Conference - ITiCSE-WGR ’14 (2014), pp. 1–29.
[123] Margolis, J., and Fisher, A. Unlocking the clubhouse: Women in computing.
MIT press, 2003.
[124] Marr, B. The Amazing Ways We Can Use AI To Tackle Climate
Change. https://www.forbes.com/sites/bernardmarr/2018/02/21/
the-amazing-ways-we-can-use-ai-to-tackle-climate-change/#32e3aa254a35,
2018. [Online; accessed 28-November-2018].
[125] McIver, L. We need to arm our kids against the in-
terests of Big Data. https://amp.theage.com.au/education/
289

we-need-to-arm-our-kids-against-the-interests-of-big-data-20180430-p4zcej.
html, 2018. [Online; accessed 20-November-2018].
[126] Meerbaum-Salant, O., Armoni, M., and Ben-Ari, M. Habits of programming
in scratch. In Proceedings of the 16th annual joint conference on Innovation and
technology in computer science education (New York, NY, USA, 2011), ITiCSE ’11,
ACM, pp. 168–172.
[127] Ministry of Business Innovation and Employment. A Nation of Curious
Minds: A National Strategic Plan for Science in Society. Tech. rep., Ministry of
Business, Innovation & Employment, New Zealand, 2014.
[128] Ministry of Business Innovation and Employment. Maori me te Ao Hanga-
rau 2015. The Maori ICT Report. Tech. rep., Ministry of Business Innovation and
Employment, 2015.
[129] Molnar, A. Computers in education: A brief history. THE Journal: Technological
Horizons in Education.—06.01 (1997).
[130] Morra, S., Gobbo, C., Marini, Z., and Sheese, R. Cognitive development:
neo-Piagetian perspectives. Psychology Press, 2007.
[131] New Zealand Digital Skills Forum. Digital Skills For a Digital Nation An
Analysis of the Digital Skills Landscape of New Zealand. Tech. rep., New Zealand
Digital Skills Forum, 2017.
[132] New Zealand Ministry of Education. Definitions of very high and high needs for
ors. https://education.govt.nz/school/student-support/special-education/
ors/criteria-for-ors/definitions-of-very-high-and-high-needs-for-ors/.
[Online; accessed 8-December-2018].
[133] New Zealand Ministry of Education. The new zealand curriculum online. http:
//nzcurriculum.tki.org.nz/The-New-Zealand-Curriculum. [Online; accessed 4-
March-2017].
290

[134] New Zealand Qualifications Authority. NZQA Digital Technologies Stan-
dards. https://www.nzqa.govt.nz/ncea/assessment/search.do?query=Digital+
Technologies&view=all, 2014. [Online; accessed 1-April-2015].
[135] New Zealand Technology Industry Association. Digital Nation : New
Zealand From a tech sector to digital nation. Tech. Rep. April, New Zealand Technol-
ogy Industry Association, (NZTech), 2016.
[136] Newell, A., Perlis, A. J., and Simon, H. A. Computer science. Science 157,
3795 (1967), 1373–1374.
[137] O’Malley, N. To predict and to serve: the future of law enforcement. [Online;
accessed 3-September-2018].
[138] O’Neil, C. Weapons of Math Destruction: How Big Data Increases Inequality and
Threatens Democracy. Penguin Books, 2017.
[139] Papert, S. Mindstorms: children, computers, and powerful ideas. Basic Books, Inc.,
New York, NY, USA, January 1980.
[140] Pascual-Leone, A., Freitas, C., Oberman, L., Horvath, J. C., Halko,
M., Eldaief, M., Bashir, S., Vernet, M., Shafi, M., Westover, B.,
Vahabzadeh-Hagh, A. M., and Rotenberg, A. Characterizing brain cortical
plasticity and network dynamics across the age-span in health and disease with TMS-
EEG and TMS-fMRI. Brain topography 24, 3-4 (October 2011), 302–315.
[141] Piaget, J. The psychology of intelligence. Littlefield, Adams, 1960.
[142] Piaget, J., and Inhelder, B. The psychology of the child. Basic Books, 1969.
[143] Powers, K., Ecott, S., and Hirshfield, L. M. Through the looking glass:
Teaching cs0 with alice. SIGCSE Bull. 39, 1 (Mar. 2007), 213–217.
[144] Proctor, C., Bigman, M., and Blikstein, P. Defining and designing computer
science education in a k12 public school district. In Proceedings of the 50th ACM
Technical Symposium on Computer Science Education (New York, NY, USA, 2019),
SIGCSE ’19, ACM, pp. 314–320.
291

[145] Raman, R., Venkatasubramanian, S., Achuthan, K., and Nedungadi, P.
Computer science (cs) education in indian schools. ACM Transactions on Computing
Education 15 (05 2015), 1–36.
[146] Rich, K. M., Binkowski, T. A., Strickland, C., and Franklin, D. Decom-
position: A k-8 computational thinking learning trajectory. In Proceedings of the 2018
ACM Conference on International Computing Education Research (New York, NY,
USA, 2018), ICER ’18, ACM, pp. 124–132.
[147] Rodriguez, B., Kennicutt, S., Rader, C., and Camp, T. Assessing Computa-
tional Thinking in CS Unplugged Activities. In Proceedings of the 2017 ACM SIGCSE
Technical Symposium on Computer Science Education (New York, NY, USA, 2017),
SIGCSE ’17, ACM, pp. 501–506.
[148] Rodriguez, B. R. Assessing Computational Thinking in Computer Science Un-
plugged Activities. Colorado School of Mines in partial fulfilment of the requirements
for the degree of Master of Science (Computer Science)., 2015.
[149] Roman-gonzalez, M. COMPUTATIONAL THINKING TEST : DESIGN GUIDE-
LINES AND CONTENT VALIDATION COMPUTATIONAL THINKING TEST :
DESIGN GUIDELINES AND CONTENT VALIDATION. In Proceedings of ED-
ULEARN15 Conference (Barcelona, Spain, 2016), pp. 2436–2444.
[150] Roman-Gonzalez, M., Moreno-Leon, J., and Robles, G. Complementary
tools for computational thinking assessment. In Proceedings of International Confer-
ence on Computational Thinking Education (CTE 2017), S. C Kong, J Sheldon, and
K. Y Li (Eds.). The Education University of Hong Kong (2017), pp. 154–159.
[151] Roman-Gonzalez, M., Perez-Gonzalez, J. C., and Jimenez-Fernandez, C.
Which cognitive abilities underlie computational thinking? Criterion validity of the
Computational Thinking Test. Computers in Human Behavior 72 (2017), 678–691.
[152] Rushkoff, D. Program or be programmed. https://www.youtube.com/watch?v=
kgicuytCkoY. [Online, YouTube; accessed 1-July-2018].
292

[153] Rushkoff, D. Program or Be Programmed: Ten Commands for a Digital Age. OR
Books, 2010.
[154] Salleh, S. M., Shukur, Z., and Judi, H. M. Analysis of Research in Programming
Teaching Tools: An Initial Review. Procedia - Social and Behavioral Sciences 103
(2013), 127–135.
[155] Savidan, V. ICT and the New Zealand secondary school curriculum. ACE Papers
12 (2003), 123–144.
[156] Schulte, C., and Knobelsdorf, M. Attitudes towards computer science-
computing experiences as a starting point and barrier to computer science. In Pro-
ceedings of the third international workshop on Computing education research - ICER
’07 (New York, New York, USA, 2007), ACM Press, p. 27.
[157] Seehorn, D., Carey, S., Fuschetto, B., Lee, I., Moix, D., O ’grady-
Cunniff, D., Owens, B. B., Stephenson, C., and Verno, A. K–12 Com-
puter Science Standards The CSTA Standards Task Force. Tech. rep., Computer
Science Teachers Association (CSTA) and the Association for Computing Machinery,
Inc (ACM), 2011.
[158] Selby, C. Computational Thinking: The Developing Definition. ITiCSE Conference
2013 (2013), 5–8.
[159] Selby, C., and Woollard, J. Computational thinking: The developing definition.
Tech. rep., University of Southampton, 2013.
[160] Sentance, S., Barendsen, E., and Schulte, C. Computer science education:
Perspectives on teaching and learning in school. Bloomsbury Academic (2018).
[161] Shute, V. J., Sun, C., and Asbell-Clarke, J. Demystifying computational
thinking. Educational Research Review 22 (2017), 142–158.
[162] Singh, K., Allen, K. R., Scheckler, R., and Darlington, L. Women in
Computer-Related Majors: A Critical Synthesis of Research and Theory From 1994
to 2005. Review of Educational Research 77, 4 (2007), 500–533.
293

[163] Smith, N., Sutcliffe, C., and Sandvik, L. Code club. In Proceedings of the 45th
ACM technical symposium on Computer science education - SIGCSE ’14 (New York,
New York, USA, March 2014), ACM Press, pp. 517–522.
[164] Snow, E., Rutstein, D., Bienkowski, M., and Xu, Y. Principled Assessment
of Student Learning in High School Computer Science. Proceedings of the 2017 ACM
Conference on International Computing Education Research - ICER ’17 (2017), 209–
216.
[165] Straw, S., Bamford, S., and Styles, B. Randomised Controlled Trial and
Process Evaluation of Code Clubs. Tech. rep., Slough: NFER, 2017.
[166] Szyjka, S. Understanding research paradigms: Trends in science education research.
Problems of Education in the 21st Century 43 (2012).
[167] Taiuru, Karaitiana. Digital whakapapa, where is it – Digital authorship and
founders? https://www.taiuru.maori.nz/digital-whakapapa-does-it-exist/,
2016. [Online; accessed 26-September-2018].
[168] Tan, C. Philosophical perspectives on education. In Critical Perspectives on Ed-
ucation: An Introduction, C. Tan, B. Wong, J. Chua, and T. Kang, Eds. Pearson
education, 01 2006, pp. 21–40.
[169] Tedre, M., and Denning, P. J. The long quest for computational thinking. In
Proceedings of the 16th Koli Calling International Conference on Computing Education
Research - Koli Calling ’16 (New York, New York, USA, 2016), ACM Press, pp. 120–
129.
[170] Tenenberg, J., and McCartney, R. Computing Education in (K-12) Schools
from a Cross-National Perspective. Trans. Comput. Educ. 14, 2 (June 2014), 6:1–6:3.
[171] Tew, A. E., and Guzdial, M. Developing a validated assessment of fundamental
cs1 concepts. In Proceedings of the 41st ACM Technical Symposium on Computer
Science Education (New York, NY, USA, 2010), SIGCSE ’10, ACM, pp. 97–101.
294

[172] The Computer Science Education Research Group, at the University
of Canterbury, New Zealand. CS Unplugged. Computer Science without a
computer. https://csunplugged.org/. [Online; accessed 8-January-2019.
[173] The office of the Minister of Education, New Zealand. Kiwi cu-
riosity at heart of science engagement. https://www.beehive.govt.nz/release/
kiwi-curiosity-heart-science-engagement, 2014. [Online; accessed 30-July-
2014].
[174] The office of the Minister of Education, New Zealand. NZ Cur-
riculum to include digital technology. https://www.beehive.govt.nz/release/
nz-curriculum-include-digital-technology, 2016. [Online; accessed 5-July-
2016].
[175] The office of the Minister of Education, New Zealand. Digital cur-
riculum changes connect young people to the future. https://www.beehive.govt.
nz/release/digital-curriculum-changes-connect-young-people-future, 2017.
[Online; accessed 28-June-2017].
[176] The Royal Society. After the reboot: computing education in UK schools. Tech.
rep., The Royal Society, 2017.
[177] The White House, Office of the Press Secretary. Fact
sheet: Preside obama announces computer science for all initiative.
https://obamawhitehouse.archives.gov/the-press-office/2016/01/30/
fact-sheet-president-obama-announces-computer-science-all-initiative-0.
[Online; accessed 12-September-2018].
[178] Thies, R., and Vahrenhold, J. Reflections on Outreach Programs in CS Classes:
Learning Objectives for ”Unplugged” Activities. In SIGCSE ’12: Proceedings of the
43rd ACM technical symposium on Computer Science Education (2012), pp. 487–492.
[179] Thies, R., and Vahrenhold, J. On plugging “unplugged” into CS classes. Proceed-
ing of the 44th ACM technical symposium on Computer science education - SIGCSE
’13 (2013), 365–370.
295

[180] Thompson, D., and Bell, T. Adoption of new Computer Science high school
standards by New Zealand teachers. In The 8th Workshop in Primary and Secondary
Computing Education (WiPSCE 2013) (Aarhus, Denmark, 2013), M. Knobelsdorf,
R. Romeike, and M. E. Caspersen, Eds., ACM.
[181] Tissenbaum, M., Sheldon, J., Sherman, M. A., Abelson, H., Weintrop, D.,
Jona, K., Horn, M., Wilensky, U., Basu, S., and Rutstein, D. The State of
the Field in Computational Thinking Assessment. In 13th International Conference
of the Learning Sciences (ICLS) 2018 (2018), pp. 1493–1494.
[182] Tucker, A., Deek, F., Jones, J., McCowan, D., Stephenson, C., and
Verno, A. A Model Curriculum for K-12 Computer Science: Final Report of the
ACM K-12 Task Force Curriculum Committee. Tech. rep., Association for Computing
Machinery (ACM), New York, 2003.
[183] Ukai, Y. What’s been proposed on computer science education in
primary school in japan for 2020. https://medium.com/@ukkaripon/
whats-been-proposed-on-computer-science-education-in-primary-school-in-\
japan-for-2020-d1543cd5e461, 2016. [Online; accessed 17-November-2018].
[184] Vegt, W. V. D. How Hard Will this Task Be ? Developments in Analyzing and
Predicting Question Difficulty in the Bebras Challenge. Olympiads in Informatics 12,
2018 (2018), 119–132.
[185] Voogt, J., Fisser, P., Good, J., Mishra, P., and Yadav, A. Computational
thinking in compulsory education: Towards an agenda for research and practice. Ed-
ucation and Information Technologies 20, 4 (June 2015), 715–728.
[186] Webb, M. E., Davis, N., Bell, T., Katz, Y. J., Reynolds, N., Chambers,
D. P., Sys lo, M. M., and Sys\lo, M. M. Computer Science in K-12 school
curricula of the 2lst Century: Why, what and when? Education and Information
Technologies (2016).
[187] Werner, L., Denner, J., Campe, S., and Kawamoto, D. C. The fairy perfor-
mance assessment. In Proceedings of the 43rd ACM technical symposium on Computer
296

Science Education - SIGCSE ’12 (New York, New York, USA, feb 2012), ACM Press,
p. 215.
[188] Willetts, R. Class size, average class size, and pupil-teacher ratio; truth,
lies and government statistics. https://www.ppta.org.nz/news-and-media/
class-size-average-class-size-and-pupil-teacher-ratio-truth-lies-and\
-government-statistics/, 2017. [Online; accessed 8-December-2018].
[189] Wing, J. M. Computational thinking. Commun. ACM 49, 3 (March 2006), 33–35.
[190] Wing, J. M. Computational thinking and thinking about computing. Philosophical
Transactions of the Royal Society A: Mathematical, Physical and Engineering Sciences
366, 1881 (October 2008), 3717–3725.
[191] Wing, J. M. Computational Thinking: What and Why? https://www.cs.cmu.
edu/~CompThink/resources/TheLinkWing.pdf, 2010.
[192] Wong, D., and Yip, S. Machine learning classifies cancer. https://www.nature.
com/articles/d41586-018-02881-7, 2018. [Online; accessed 28-November-2018].
[193] Yadav, A., Burkhart, D., Moix, D., Snow, E., Bandaru, P., and Clay-
born, L. Sowing the seeds: A landscape study on assessment in secondary computer
science education. Comp. Sci. Teachers Assn., NY, NY (2015).
[194] Yagunova, E., Podznyakov, S., Ryzhova, N., Razumovskaia, E., and Ko-
rovkin, N. Tasks classification and age differences in task perception. case study
of international on-line competition “beaver”. In The Proceedings of International
Conference on Informatics in Schools: Situation, Evolution and Perspectives—ISSEP
(2015), pp. 33–43.
[195] Yuta. K-12 Computer Science Education in Japan. http://tonegawa.hatenablog.
com/entry/2016/10/16/003213, 2016. [Online; accessed 17-November-2018].
297
Copyright © 2022 FDOKUMEN