Computer-controlled system for ISEs automatic calibration
11
Sensors and Actuators B 105 (2005) 521–531 Computer-controlled system for ISEs automatic calibration Sorin Aurel Dorneanu a,b,∗ , Vasile Coman a , Ionel C˘ at˘ alin Popescu a , Pierre Fabry b a Department of Physical Chemistry, “Babe¸ s-Bolyai” University, RO-400028 Cluj-Napoca, Romania b Laboratoire d’Electrochimie et de Physicochimie des Mat´ eriaux et des Interfaces, INPG-ENSEEG, BP 75, 38402 Saint Martin d’H` eres Cedex, France Received 26 April 2004; received in revised form 5 July 2004; accepted 22 July 2004 Available online 22 September 2004 Abstract The present work examines the problems encountered during the design, construction and testing of a fully computer-controlled system for automatic calibration of ion-selective electrodes (ISEs), based on two data acquisition boards, a home-made fast multifunction potentiostat, two peristaltic pumps and an injection valve. With few minor modifications, the experimental setup allows the using of batch and flow techniques for automatic calibration of ISEs, operated in potentiometric or amperometric mode. For flow measurements, a wall-jet cell (WJC) was designed, built and characterized. Using [Fe(CN) 6 ] 3− /[Fe(CN) 6 ] 4− as standard redox couple, the WJC amperometric response was examined in order to establish the dispersion factor as well as the hydrodynamic regime as a function of the flow rate and cell geometry. Finally, a Na + -selective electrode, based on a commercial NASICON (CERAMATEC TM ), was used to evaluate the electroanalytical performances of the experimental setup for potentiometric and amperometric calibration of ISEs using batch, steady-state flow and flow injection measurements. © 2004 Elsevier B.V. All rights reserved. Keywords: Automatic ISEs calibration; Computer-controlled system; Flow injection analysis; Wall-jet electrode; NASICON 1. Introduction Since the introduction of ion-selective electrodes (ISEs), the great majority of the studies focused on the evaluation of their analytical parameters were performed using batch measurements and scarcely flow conditions. Nevertheless, it is worthy to note that, in order to improve the precision and reproducibility of the measurements, in many modern applications (e.g. HPLC, capillary electrophoresis, stripping or hyphenated methods [1]) controlled flow techniques are widely used. For this reason, a large diversity of flow tech- niques, such as flow injection analysis (FIA), segmented flow analysis (SFA), sequential injection analysis (SIA), multi- commutation flow analysis (MCFA) or multi-syringe flow analysis (MSFA), was developed [2,3]. ∗ Corresponding author. Tel.: +40 264 59 38 33 (Romania); fax: +40 264 59 08 18 (Romania). E-mail address: [email protected] (S.A. Dorneanu). In spite of the advantages offered by flow measurements, their “Achilles’ heel” remains, undoubtedly, the step of stan- dard solutions preparation. Because a representative calibra- tion curve requires a large number of experimental points, the preparation of standard solutions is usually a time-consuming operation and, additionally, it can affect seriously the pre- cision and reproducibility of the measurements. For these reasons, various computer-controlled systems were proposed for automatic preparation of standard solutions, such as: (i) robots able to manipulate, weight and mix different solutions and solid reactants [4–7]; (ii) systems for SIA incorporat- ing automated burettes [8], piston pumps [9], syringe pumps [10,11], peristaltic pumps [12–15] or calibrated diaphragm micro-pumps [16]. A different approach to prepare standard solutions for ISEs calibration consists in mixing two or more solutions, pumped with different flow rates [17,18]. Using this principle and a fully rotary valve, it was possible to prepare until eight different standard solutions, delivered with a fixed flow rate [3,19–21]. 0925-4005/$ – see front matter © 2004 Elsevier B.V. All rights reserved. doi:10.1016/j.snb.2004.07.014
Transcript of Computer-controlled system for ISEs automatic calibration

Sensors and Actuators B 105 (2005) 521–531
Computer-controlled system for ISEs automatic calibration
Sorin Aurel Dorneanua,b,∗, Vasile Comana, Ionel Catalin Popescua, Pierre Fabryb
a Department of Physical Chemistry, “Babe¸s-Bolyai” University, RO-400028 Cluj-Napoca, Romaniab Laboratoire d’Electrochimie et de Physicochimie des Mat´eriaux et des Interfaces, INPG-ENSEEG,
BP 75, 38402 Saint Martin d’H`eres Cedex, France
Received 26 April 2004; received in revised form 5 July 2004; accepted 22 July 2004Available online 22 September 2004
Abstract
The present work examines the problems encountered during the design, construction and testing of a fully computer-controlled system forautomatic calibration of ion-selective electrodes (ISEs), based on two data acquisition boards, a home-made fast multifunction potentiostat, twoperistaltic pumps and an injection valve. With few minor modifications, the experimental setup allows the using of batch and flow techniquesfor automatic calibration of ISEs, operated in potentiometric or amperometric mode. For flow measurements, a wall-jet cell (WJC) wasd aminedi . Finally, aN of thee surements.©
K
1
tomiaaownaca
f
ents,an-libra-, the
mingpre-heseposeds: (i)ionst-sm
ISEspeddghtrate
0d
esigned, built and characterized. Using [Fe(CN)6]3−/[Fe(CN)6]4− as standard redox couple, the WJC amperometric response was exn order to establish the dispersion factor as well as the hydrodynamic regime as a function of the flow rate and cell geometrya+-selective electrode, based on a commercial NASICON (CERAMATECTM), was used to evaluate the electroanalytical performancesxperimental setup for potentiometric and amperometric calibration of ISEs using batch, steady-state flow and flow injection mea2004 Elsevier B.V. All rights reserved.
eywords:Automatic ISEs calibration; Computer-controlled system; Flow injection analysis; Wall-jet electrode; NASICON
. Introduction
Since the introduction of ion-selective electrodes (ISEs),he great majority of the studies focused on the evaluationf their analytical parameters were performed using batcheasurements and scarcely flow conditions. Nevertheless,
t is worthy to note that, in order to improve the precisionnd reproducibility of the measurements, in many modernpplications (e.g. HPLC, capillary electrophoresis, strippingr hyphenated methods[1]) controlled flow techniques areidely used. For this reason, a large diversity of flow tech-iques, such as flow injection analysis (FIA), segmented flownalysis (SFA), sequential injection analysis (SIA), multi-ommutation flow analysis (MCFA) or multi-syringe flownalysis (MSFA), was developed[2,3].
∗ Corresponding author. Tel.: +40 264 59 38 33 (Romania);ax: +40 264 59 08 18 (Romania).
E-mail address:[email protected] (S.A. Dorneanu).
In spite of the advantages offered by flow measuremtheir “Achilles’ heel” remains, undoubtedly, the step of stdard solutions preparation. Because a representative cation curve requires a large number of experimental pointspreparation of standard solutions is usually a time-consuoperation and, additionally, it can affect seriously thecision and reproducibility of the measurements. For treasons, various computer-controlled systems were profor automatic preparation of standard solutions, such arobots able to manipulate, weight and mix different solutand solid reactants[4–7]; (ii) systems for SIA incorporaing automated burettes[8], piston pumps[9], syringe pump[10,11], peristaltic pumps[12–15] or calibrated diaphragmicro-pumps[16].
A different approach to prepare standard solutions forcalibration consists in mixing two or more solutions, pumwith different flow rates[17,18]. Using this principle ana fully rotary valve, it was possible to prepare until eidifferent standard solutions, delivered with a fixed flow[3,19–21].
925-4005/$ – see front matter © 2004 Elsevier B.V. All rights reserved.oi:10.1016/j.snb.2004.07.014

522 S.A. Dorneanu et al. / Sensors and Actuators B 105 (2005) 521–531
The electrochemical preparation of metal-ion standard so-lutions by anodic dissolution was also proposed, but the ap-plicability of this method is limited to a relative small numberof chemical species, e.g. transitional metal ion[22].
ISEs calibration based on transient measurements per-formed in flow conditions can fail because of the responsetime and, especially, the overshoot phenomenon[23–31].Moreover, it was observed that when the geometry of a flowthrough electrochemical detector and/or the flow rate are sub-ject of changes, the ISEs analytical parameters could be dras-tically affected due to corresponding variations of the disper-sion coefficient and/or the concentration profile at the elec-trode surface[31].
Among the flow through electrochemical detectors, thewall-jet cell (WJC) and the thin layer cell (TLC) are the mostused configurations for ISEs applications[1]. After Yamadaand Matsuda had introduced in 1973 the WJ electrode term[32], several hybrids systems between WJ and TL cells, char-acterized by a very small distance (less than 1 mm) betweeninlet nozzle and electrode surface, were reported[33–36].Moreover, in the framework of the general miniaturizationtendency, microelectrodes were developed and used in flowconditions[37–40]. Consequently, the identification of thehydrodynamic regime existing in the flow through detectorbecomes a required step in order to assure the experimentalr
ng ofa ali-b efulc vedt on-c ownc cisiono allya p in-j per-a (FI)m n oft am-m t tor cou-p e(
y oft as a-t d inp
2
2
.A illi-
RO®4 and Milli-Q®,ρ > 18.3 M� cm). In order to investigatethe hydrodynamic regime in the WJC and to evaluate thedispersion coefficient of the flow injection system, a 0.5 MKCl solution was used as supporting electrolyte. For Na+-SEcalibration, the supporting electrolyte was a standard 0.1 MBaCl2 solution.
2.2. Electrode preparation
For the WJC calibration, two disc electrodes of Au (φ
1 mm; Goodfellow®, UK) and spectral graphite (SG,φ3 mm; RW0-RW001, SGL Carbon GmbH®, Germany),mounted with epoxy resin (ARALDITE® Standard, Bostik,France) in polymethyl methacrylate (PMM) electrode bod-ies, were used. Several identical NASICON-based Na+-SEwere custom-made by stacking a NASICON pellet (φ 3 mmand 1 mm width) with epoxy resin in an electrode body madefrom PMM. The NASICON was a commercial material(CERAMATEC®, USA) having the composition correspond-ing to the stoichiometry Na3Zr2Si2PO12 and the conductivitysimilar to membranes synthesized in our laboratory[31].The inner reference electrode of the Na+-SE was an Ag wire(φ 0.5 mm, Goodfellow®, UK) electrochemically coveredwith AgCl and immersed in 0.1 or 1 M NaCl solution. Beforeuse, all Na+-SEs were wet polished on fine emery paper( ,F
2
-pi itionb gi tiona ith1 ert-e put( na-lb ignals,w ges[
emi-c tio-s canb -m micali itiond
on-t ippedw flowa alticp ag-
eproducibility.This work presents the design, construction and testi
fully computer-controlled system for ISEs automatic cration in different experimental conditions. First, a caralibration of a variable flow rate peristaltic pump prohat, by addition of known volumes from a standard centrated solution in a mixing chamber, solutions of knoncentrations can be successfully prepared. The pref this method was evaluated volumetrically, gravimetricnd via pH measurements. The same peristaltic pum
ects the calibration solutions in a home-made WJC, oted both in steady-state flow (SSF) and flow injectionodes. Additionally, for a rapid and precise identificatio
he flow regime inside the WJC, the hydrodynamic voltetry with linear scan of the flow rate was carried ou
ecord the voltammetric response of a standard redoxle ([Fe(CN)6]3−/[Fe(CN)6]4−) at a conventional electrodgraphite or Au).
In order to evaluate the precision and reproducibilithe computer-controlled system, a NASICON-based N+-elective electrode (Na+-SE) [41] was used for a comparive examination of the electrode calibration, performeotentiometric and amperometric mode.
. Experimental
.1. Chemicals
All reagents were of analytical grade (Merck®, Germany)ll solutions were prepared using ultra pure water (M
grit 400, 600, 800 and 1200 from MECAPREX®, PRESIrance).
.3. Experimental setup
The experimental setup (Fig. 1) includes an IBM comatible PC equipped with two National Instruments® (USA)
nterface cards. The first one is a complex data acquisoard (PCI 6024 E®) with 16 simple (or 8 differential) analo
nputs (AI), including: a programmable gain instrumentamplifier; one fast analog to digital converter (ADC), w2 bits resolution; two 12 bits fast digital to analog convrs (DAC); eight programmable ports for digital input/outDIO). Setting the first board in differential mode, the aog signals supplied by the second board (PC-AO-2DC®) cane used to compensate the baseline of two measured sithout requiring supplementary differential amplifier sta
42].The experimental setup also includes an electroch
al interface (EI), consisting in a low noise fast potentat/galvanostat (P/G-stat) with four electrodes, whiche used as a high impedance (1012�) voltmeter for potentioetric measurements, too. This home-made electroche
nterface assures a high compatibility with the acquisata system, allowing a full computer control.
For automatic ISEs calibration and hydrodynamic crolled measurements, the experimental setup was equith a home-made control unit designed to drive thend concentration control elements (FCCE): two peristumps; a double three-way valve; an injection valve; a m
S.A. Dorneanu et al. / Sensors and Actuators B 105 (2005) 521–531 523
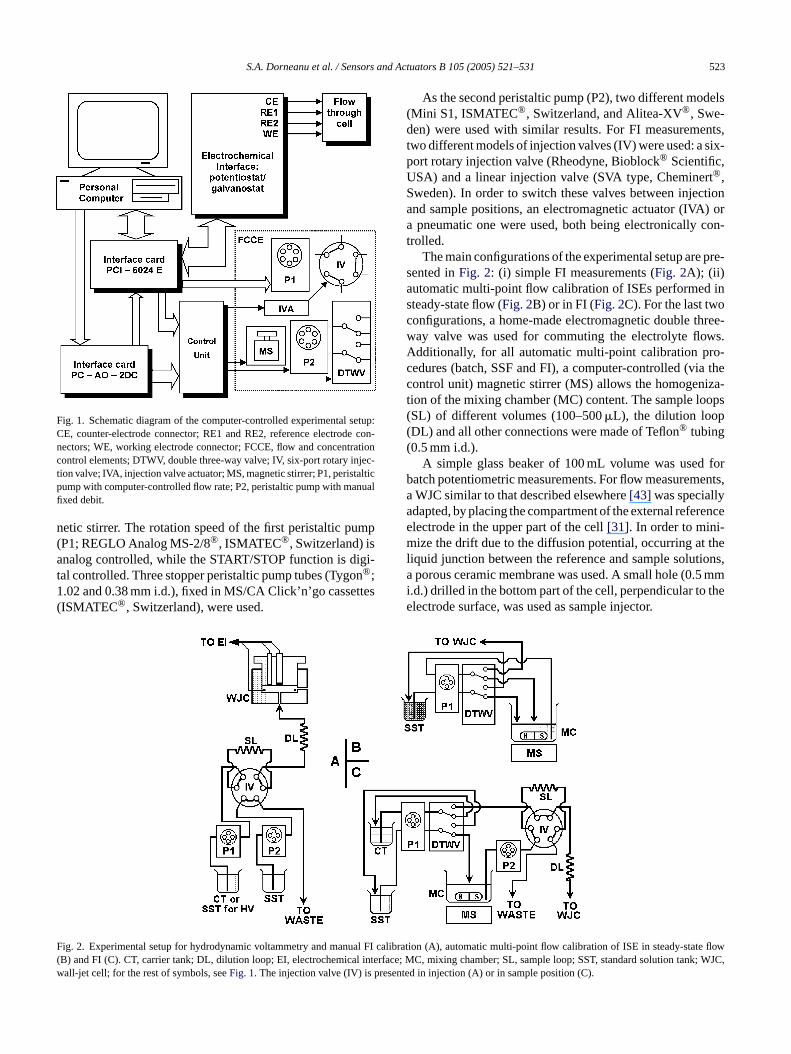
Fig. 1. Schematic diagram of the computer-controlled experimental setup:CE, counter-electrode connector; RE1 and RE2, reference electrode con-nectors; WE, working electrode connector; FCCE, flow and concentrationcontrol elements; DTWV, double three-way valve; IV, six-port rotary injec-tion valve; IVA, injection valve actuator; MS, magnetic stirrer; P1, peristalticpump with computer-controlled flow rate; P2, peristaltic pump with manualfixed debit.
netic stirrer. The rotation speed of the first peristaltic pump(P1; REGLO Analog MS-2/8®, ISMATEC®, Switzerland) isanalog controlled, while the START/STOP function is digi-tal controlled. Three stopper peristaltic pump tubes (Tygon®;1.02 and 0.38 mm i.d.), fixed in MS/CA Click’n’go cassettes(ISMATEC®, Switzerland), were used.
F al FI ca tat( interfa nk;w presen
As the second peristaltic pump (P2), two different models(Mini S1, ISMATEC®, Switzerland, and Alitea-XV®, Swe-den) were used with similar results. For FI measurements,two different models of injection valves (IV) were used: a six-port rotary injection valve (Rheodyne, Bioblock® Scientific,USA) and a linear injection valve (SVA type, Cheminert®,Sweden). In order to switch these valves between injectionand sample positions, an electromagnetic actuator (IVA) ora pneumatic one were used, both being electronically con-trolled.
The main configurations of the experimental setup are pre-sented inFig. 2: (i) simple FI measurements (Fig. 2A); (ii)automatic multi-point flow calibration of ISEs performed insteady-state flow (Fig. 2B) or in FI (Fig. 2C). For the last twoconfigurations, a home-made electromagnetic double three-way valve was used for commuting the electrolyte flows.Additionally, for all automatic multi-point calibration pro-cedures (batch, SSF and FI), a computer-controlled (via thecontrol unit) magnetic stirrer (MS) allows the homogeniza-tion of the mixing chamber (MC) content. The sample loops(SL) of different volumes (100–500�L), the dilution loop(DL) and all other connections were made of Teflon® tubing(0.5 mm i.d.).
A simple glass beaker of 100 mL volume was used forbatch potentiometric measurements. For flow measurements,aa renceem thel ions,a 5 mmi thee
ig. 2. Experimental setup for hydrodynamic voltammetry and manuB) and FI (C). CT, carrier tank; DL, dilution loop; EI, electrochemicalall-jet cell; for the rest of symbols, seeFig. 1. The injection valve (IV) is
libration (A), automatic multi-point flow calibration of ISE in steady-se flowce; MC, mixing chamber; SL, sample loop; SST, standard solution taWJC,ted in injection (A) or in sample position (C).
WJC similar to that described elsewhere[43] was speciallydapted, by placing the compartment of the external refelectrode in the upper part of the cell[31]. In order to mini-ize the drift due to the diffusion potential, occurring at
iquid junction between the reference and sample solutporous ceramic membrane was used. A small hole (0.
.d.) drilled in the bottom part of the cell, perpendicular tolectrode surface, was used as sample injector.

524 S.A. Dorneanu et al. / Sensors and Actuators B 105 (2005) 521–531
A digital pH-meter (model PHM 210, MeterLabRadiometer-Tacussel®, France) equipped with a combinedpH electrode (model XC100, Radiometer-Tacussel®, France)was used to monitor (via EI) the pH value in the mixing cham-ber.
2.4. Software
The setup control and the experimental data acquisitionwere carried out automatically using specific virtual instru-ments (VIs) elaborated using LabView® software (NationalInstruments®, USA). Additional software was developed inorder to perform supplementary tasks as: the setup purge, theperistaltic pumps calibration, the FI peak detection, the sta-tistical analysis, and the non-linear experimental data fittingusing the Levenberg–Marquardt algorithm.
The operator has to introduce from the keyboard the valuescorresponding to the volume and concentration of the initialstandard solution, the concentration of added standard so-lution and the calibration constants for the peristaltic pumptubes, as well as other specific parameters (e.g. precondi-tioning and measurement time for SSF, the sampling time,the number of desired repeated injections for FI, etc.). Atthe end of each experiment, the data representing the con-centrations of the prepared standard solutions and the corre-s rmat,c h asM
3
3p
s ages:( op,a speec andt s int h thed
tan-d ime
TL ates ev
P
retrea
I 2.8 ± 3S 0.925±R 0.9999
of the flexible tubing. In order to evaluate the influence ofthis factor on the precision of standard solutions prepara-tion, several tests were performed. First of all, the depen-dence between the rotation speed (ω) of the pump head andthe applied control voltage (EC, from 1 up to 10 V) waschecked and the following linear correlation was found:ω
[rpm] = (0.46 ± 0.09) + (16.45± 0.02)EC [V], with thecorrelation coefficient (R) equal to 1 for five experimentalpoints (N).
Second, in order to evaluate the effect of the tube age on theflow rate, two different Tygon® tubes (1.02 and 0.38 mm i.d.)were tested as received and after 3 h of continuous runningwith distillate water. In both cases, comparing the parame-ters of the linear regressions between the measured and pro-grammed flow rates of delivered samples (Table 1), a slope de-crease of about 3% was observed after the application of thispre-treatment proposed by the pump manufacturer (running-in period at least 1–3 h, before starting the desired application[44]). Nevertheless, after 2 days of continuous using (about6 h by day) the flow rates remained relatively stable, showinga decrease less that 1%.
Third, in order to simplify the pump calibration proce-dure, a polynomial regression was used to fit the correlationbetween the flow rate and the applied control voltage for allused tubings:
V
w edf ingt ex-p ent,fv ndards
ilityo dards imen-t n-d et , thew -s earr0 u-r
ponding ISE responses are saved in a specific file foompatible with specific software for data treatment, sucSExcel®, Origin®, SigmaPlot®, etc.
. Results and discussion
.1. Setup calibration for standard solutionsreparation
The choice of a REGLO Analog MS-2/8® as variablepeed peristaltic pump was based on two major advanti) the driving DC motor is included in a closed control lossuring a constant and pressure independent analogontrol; (ii) the combination of the analog speed controlhe digital START/STOP control allows very fast changehe pumping rate, the maximum delay necessary to reacesired speed being around 50 ms.
The main drawback of using a peristaltic pump for sard solutions preparation consists in the limited lifet
able 1inear dependencies between the measured and programmed flow r
arameter Tube I (0.38 mm i.d.)
New P
ntercept (�L min−1) 3.6± 6.2a 1lope 0.952± 0.007ab 0.99980a Standard deviation.b ForN = 10 points.
d
aluated for the REGLO Analog (ISMATEC®) peristaltic pump
Tube II (1.02 mm i.d.)
ted New Pretreateda 66± 26a 74± 17a
0.004a 0.925± 0.004a 0.906± 0.003a
2 0.99992 0.99996
f = (0.0025+ 0.1047EC − 0.0017E2C + 0.0001E3
C)KV (1)
hereKV is a correction factor, experimentally determinor a given tubing at the maximum flow rate correspondo EC = 10 V. In this manner, each recalibration of theerimental setup requires only one additional measurem
or the evaluation ofKV value. The software uses theKValue to calculate the concentration of the prepared staolutions.
The final test concerning the accuracy and reproducibf the experimental setup during the preparation of stanolutions consisted in a comparison between the experal (Vexp) and programmed (Vprog) volumes of added staard solutions (from 22�L to 17 mL). In order to minimiz
he errors occurring in the evaluation of small volumeseight of delivered samples was measured (±0.1 mg preciion) and then divided by the solution density. The linegression equation: [Vexp = (−0.004± 0.001) + (1.0040±.0001)Vprog, with R= 1 andN = 10], proves the high accacy of the experimental setup.

S.A. Dorneanu et al. / Sensors and Actuators B 105 (2005) 521–531 525
Fig. 3. Steady-state limiting current corresponding to [Fe(CN)6]3+ reduc-tion on SG disc electrode, recorded at different flow rates with (a) and without(b) pulsation-dumping element. In insert,Ia andIb represent the amplitudesof limiting current pulsations, andIM,a andIM,b stands for the mean valuesof the limiting current. Experimental conditions: injected solution, 0.01 MK3[Fe(CN)6] + 0.5 M KCl; d = 0.25 mm; applied potential,−0.20 V vs.Ag/AgCl, KCl 0.5 M; flow rate: (1) 1.03 mL min−1; (2) 1.88 mL min−1; (3)4.44 mL min−1; (4) 6.57 mL min−1; (5) 8.7 mL min−1.
3.2. Characterization of hydrodynamic regime in WJC
Recently, it was shown that the potentiometric behavior ofISEs based on solid ionic conductors (NASICON) could beinfluenced by the flow profile at the electrode surface duringthe potential measurements[31].
In order to identify the hydrodynamic regime in theWJC, the limiting current corresponding to the reductionof a 0.01 M K3[Fe(CN)6] solution at a spectral graphite(SG) electrode was recorded with high acquisition rate(200 samples s−1). The explored flow rates ranged between1 and 9 mL min−1 for different distances (d) between the in-let nozzle and electrode surface (from 0.25 to 5 mm). Allmeasurements were performed in presence and in absenceof a pulsation-dumping element (a silicon tubing of 100 cmlength, with 4 mm i.d. and 6 mm o.d.). As can be seen in theinset ofFig. 3, the presence of the dumping element inducesa decrease of the current pulsation amplitude (Ia andIb) and,especially at high flow rates, a decrease of the average valuesof the limiting currents (IM,a andIM,b), too. For the investi-gated range ofd values, two general conclusions can be for-mulated: (i) the relative amplitude of the pulsations decreaseswhen the flow rate increases; and (ii) the pulsation-dumpingelement reduces significantly (8–20 times) the relative pul-sation amplitude but, simultaneously, it induces an importantd find-i pingea n oft
Fig. 4. Hydrodynamic voltammograms recorded on SG (φ 3 mm) or Au(φ 1 mm) disc electrodes for different flow rates (A) and the correspond-ing log–log dependence between the limiting current and the flow ratefor both electrodes (B). Experimental condition: injected solution, 0.01 MK3[Fe(CN)6] + 0.5 M KCl; d = 2 mm; potential scan rate = 5 mV s−1, flowrate: 150, 300, 600, 900, 1200 and 1500�L min−1 for SG electrode and150, 375, 750, 937, 1125, 1313 and 1500�L min−1 for Au electrode. Thelimiting current was evaluated at−0.20 V vs. Ag/AgCl, KCl 0.5 M.
The hydrodynamic regime in WJC was characterized us-ing two different experimental procedures. The first one wascarried out in a classical manner[45], recording several hy-drodynamic voltammograms for 0.01 M K3[Fe(CN)6] reduc-tion at SG or Au electrodes. The results obtained for differentflow rates (from 0.15 to 1.5 mL min−1) and for a fixed inletnozzle to electrode surface distance (2 mm) are presented inFig. 4A. A scan rate of 5 mV s−1 was used in order to assurea quasi-stationary regime, proved by absence of hysteresisbetween the direct and reverse potential scans (results notshown). The values of the limiting current were read for apolarization potential of−0.200 V versus the Ag/AgCl, KCl
ecrease (until 20%) of the current average value. Thesengs could be explained assimilating the pulsation-dumlement to a low-pass filter with a given time constant[41]nd should be carefully considered during the evaluatio
he FI dispersion coefficient.

526 S.A. Dorneanu et al. / Sensors and Actuators B 105 (2005) 521–531
0.5 M. The identification of the flow profile was based onthe generalized Levich equation[46], relating the limitingcurrent (IL, A) to the flow parameters:
IL = nFCD2/3KVy
f (2)
wheren is the number of transferred electrons,F is the Fara-day constant (A s equiv−1),C is the concentration of the elec-trochemical active species (mol L−1),D is the diffusion coef-ficient (cm2 s−1),K is a constant depending on the electrolyteviscosity and cell geometry andVf is the solution flow rate(cm3 s−1).
The value of the flow rate exponent (y) provides impor-tant information about the flow regime and was determinedfrom the slope of the linear correlation log(IL) versus log(Vf )(Fig. 4B). For both investigated electrodes, the values ob-tained for “y” (0.76 for SG, and 0.72 for Au) point out to awall-jet flow regime, characterized byy = 0.75.
The second experimental procedure exploits the hydrody-namic voltammetry with linear scan of the flow rate (setuppresented inFig. 2A). Thus, maintaining the applied elec-trode potential at a fixed value (+0.8 V versus Ag/AgCl, KCl1 M), the limiting current was recorded for different val-ues of the flow rate, obtained via a linear scan of the volt-age controlling the rotation speed of the peristaltic pump.A −1 dw , cer-t d re-v amicvV do-m e ap-p lledr
-d( thel -fi trodes micr ntald avingc es,a icr
b200
-b l-u onc tes(= e
Fig. 5. The dependence between the logarithm of the limiting current andthe logarithm of the flow rate obtained by hydrodynamic voltammetry withlinear scan of the flow rate at differentd and flow rate values: (A) from 0.15to 1.5 mL min−1; (B) from 1 to 10 mL min−1. Experimental conditions: SG(φ 3 mm) electrode; injected solution, 0.01 M K4[Fe(CN)6] + 0.5 M KCl;applied potential, +0.8 V vs. Ag/AgCl, KCl 1 M. In (A): I, the diffusion-controlled domain; II, the convection-controlled domain.
hydrodynamic regime corresponds to a laminar flow, parallelto the electrode surface, similar with that existing in the caseof a rotating disk electrode. Due to the surface uniform acces-sibility, characteristic for this hydrodynamic regime, and toan adequate samples throughput, this combination (d= 2 mmandVf = 5 mL min−1) was retained for all further measure-ments performed for ISEs flow calibration.
It is worth to mention that the dispersion coefficient of theexperimental system is strongly influenced bydandVf values[31]. Additionally, taking into account that ISEs responsetime is dramatically affected by the solution concentration,their calibration in transient flow conditions may be affectedby significant errors. Therefore, in order to avoid this kind
scan rate of 0.1% s from the maximal rotation speeas used in order to assure a quasi-stationary regime
ified by absence of hysteresis between the direct anerse voltage scans (results not shown). The hydrodynoltammograms, recorded for several combinations ofd andf values selected at the extremities of the investigatedains (results not shown), confirmed that, in all cases, thlied potential is well placed in the mass transport-controegion.
Two typical examples of log(IL) versus log(Vf ) depenencies, obtained for the SG electrode at differentd valuesFig. 5A and B), show that significant deviations frominearity occur for the highest values ofd. This fact conrms that the distance between the inlet nozzle and elecurface is a critical parameter to control the hydrodynaegime. A simple comparison of the log–log experimeependencies with reference lines (see the insets), hharacteristic slopes for particular hydrodynamic regimllows a rapid identification of the WJC hydrodynamegime.
For the same flow rate domain (seeFig. 4B andFig. 5A),oth methods give similar results. As an example, ford =mm, the first method gave a “y” value of 0.76± 0.04 (R=.9995;N = 7), while the second method gave a “y” value of.753± 0.001 (R= 0.9885;N = 9218).
In the range of low flow rates (Fig. 5A, domain I), cominations between large values ofd (>2 mm) and small vaes ofVf (<0.25 mL min−1) are characterized by a diffusiontrolled limiting current. In the range of high flow raFig. 5B), a quasi-constant slope (∼0.5) was attained ford2 mm andVf around 5 mL min−1. In these conditions, th
S.A. Dorneanu et al. / Sensors and Actuators B 105 (2005) 521–531 527
of errors is necessary to validate FI ISEs calibration usingsupplementary SSF measurements.
3.3. ISEs automatic calibration
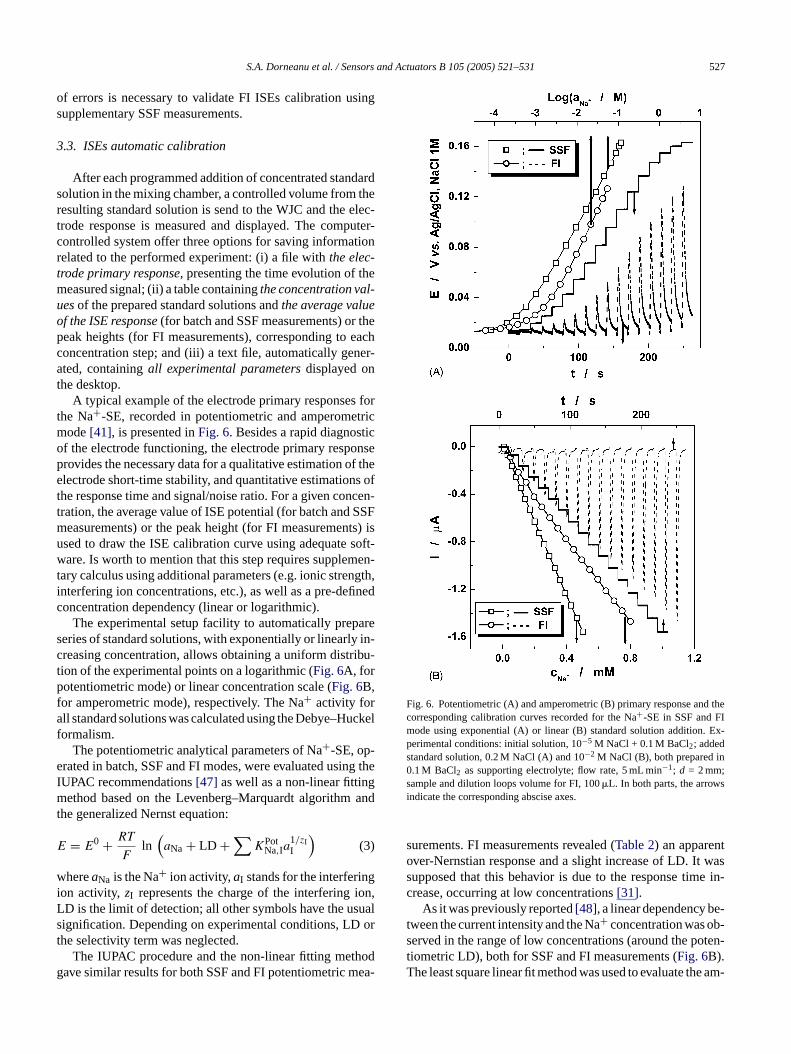
After each programmed addition of concentrated standardsolution in the mixing chamber, a controlled volume from theresulting standard solution is send to the WJC and the elec-trode response is measured and displayed. The computer-controlled system offer three options for saving informationrelated to the performed experiment: (i) a file withthe elec-trode primary response, presenting the time evolution of themeasured signal; (ii) a table containingthe concentration val-uesof the prepared standard solutions andthe average valueof the ISE response(for batch and SSF measurements) or thepeak heights (for FI measurements), corresponding to eachconcentration step; and (iii) a text file, automatically gener-ated, containingall experimental parametersdisplayed onthe desktop.
A typical example of the electrode primary responses forthe Na+-SE, recorded in potentiometric and amperometricmode[41], is presented inFig. 6. Besides a rapid diagnosticof the electrode functioning, the electrode primary responseprovides the necessary data for a qualitative estimation of theelectrode short-time stability, and quantitative estimations oft ncen-t SSFm ts) isu soft-w en-t ngth,i finedc
ares y in-c ibu-tpfa uckelf
e g theI gm andt
E
w gi ion,L uals ort
hodg ea-
Fig. 6. Potentiometric (A) and amperometric (B) primary response and thecorresponding calibration curves recorded for the Na+-SE in SSF and FImode using exponential (A) or linear (B) standard solution addition. Ex-perimental conditions: initial solution, 10−5 M NaCl + 0.1 M BaCl2; addedstandard solution, 0.2 M NaCl (A) and 10−2 M NaCl (B), both prepared in0.1 M BaCl2 as supporting electrolyte; flow rate, 5 mL min−1; d = 2 mm;sample and dilution loops volume for FI, 100�L. In both parts, the arrowsindicate the corresponding abscise axes.
surements. FI measurements revealed (Table 2) an apparentover-Nernstian response and a slight increase of LD. It wassupposed that this behavior is due to the response time in-crease, occurring at low concentrations[31].
As it was previously reported[48], a linear dependency be-tween the current intensity and the Na+ concentration was ob-served in the range of low concentrations (around the poten-tiometric LD), both for SSF and FI measurements (Fig. 6B).The least square linear fit method was used to evaluate the am-
he response time and signal/noise ratio. For a given coration, the average value of ISE potential (for batch andeasurements) or the peak height (for FI measuremensed to draw the ISE calibration curve using adequateare. Is worth to mention that this step requires supplem
ary calculus using additional parameters (e.g. ionic strenterfering ion concentrations, etc.), as well as a pre-deoncentration dependency (linear or logarithmic).
The experimental setup facility to automatically preperies of standard solutions, with exponentially or linearlreasing concentration, allows obtaining a uniform distrion of the experimental points on a logarithmic (Fig. 6A, forotentiometric mode) or linear concentration scale (Fig. 6B,
or amperometric mode), respectively. The Na+ activity forll standard solutions was calculated using the Debye–H
ormalism.The potentiometric analytical parameters of Na+-SE, op-
rated in batch, SSF and FI modes, were evaluated usinUPAC recommendations[47] as well as a non-linear fittinethod based on the Levenberg–Marquardt algorithm
he generalized Nernst equation:
= E0 + RT
Fln
(aNa + LD +
∑KPot
Na,Ia1/zII
)(3)
hereaNa is the Na+ ion activity,aI stands for the interferinon activity, zI represents the charge of the interferingD is the limit of detection; all other symbols have the usignification. Depending on experimental conditions, LDhe selectivity term was neglected.
The IUPAC procedure and the non-linear fitting metave similar results for both SSF and FI potentiometric m

528 S.A. Dorneanu et al. / Sensors and Actuators B 105 (2005) 521–531
Table 2Analytical and statistical parameters corresponding to Na+-SE automaticcalibration using potentiometric and amperometric measurements in SSF orFI mode
Calibration mode Sensitivitya LD (M) R N
Potentiometric (exponential addition)SSF 59.8± 0.6b mV/�pNa 3.8× 10⁻⁴c 0.99962 10FI 62.2± 0.9b mV/�pNa 7.7× 10⁻⁴c 0.99699 10
Amperometric (linear addition)SSF −3.16± 0.02b mA/M 3.0 × 10⁻⁵d −0.99983 17FI −1.82± 0.02b mA/M 5.0 × 10⁻⁵d −0.99895 17
For experimental conditions, seeFig. 6.a The analytical parameters were calculated using linear regression.b Standard deviation.c The analytical parameters were calculated using the asymptotes inter-
section method.d The analytical parameters were calculated using signal/noise ratio = 3:1.
perometric sensitivity. The amperometric LD was calculatedfor a signal to noise ratio of 3:1. Contrarily to the potentio-metric behavior, when the Na+-SE is exploited in ampero-metric mode, the sensitivity and LD are practically the samein SSF and in FI measurements (seeTable 2). The apparentdifferences are due to the inherent FI sample dispersion.
3.4. Precision and reproducibility of the experimentalsetup
A simple and reliable way to estimate the accuracy of theexperimental setup for standard solutions preparation con-sisted in the using of a conventional pH electrode, insertedin the mixing chamber, for pH monitoring during multipleadditions of 0.1 M HCl solution. For all three protocols usedfor ISEs calibration (batch, SSF or FI), the experimentallyrecorded pH values were compared with the calculated ones.As can be seen fromFig. 7A andTable 3, for all investigatedprotocols excellent correlations between the measured andcalculated pH values were obtained.
A rapid method to evaluate both the precision and the re-producibility of the experimental setup for standard solutionspreparation, within an extended domain of concentrations,uses combinations between the concentrations of the initialand added standard solutions. Thus, in order to emphasizet ea-s initiala x-
TR ted andm
M
BSF
F
Fig. 7. The dependence between the measured and calculated pH in themixing chamber during exponential standard additions of 0.1 M HCl corre-sponding to batch, SSF or FI measurements (A) and the calibration curves fora Na+-SE recorded in batch for different concentrations of initial and addedNaCl standard solutions (B). Experimental condition: (A) initial solution,5 mM NaCl (pH 5.2); added solution, 0.1 M HCl + 5 mM NaCl; (B) initialstandard solution, 10−5 M NaCl (tests 1 and 2) and 10−3 M NaCl (tests 3and 4); added standard solution, 10−3 M NaCl (tests 1 and 2) and 1 M NaCl(tests 3 and 4). In order to increase the figure visibility, batch and FI curves(A) were deliberately shifted with±0.5 pH units as indicated by arrows.All solutions (A and B) were prepared using 0.1 M BaCl2 as supportingelectrolyte.
perimental points within the electrode-working domain, theclose values of the slopes corresponding to the linear ranges(Table 4), as well as the strong correlation between the twoseries of measurements (see the last three columns ofTable 4)proved the excellent reproducibility of the standard solutionspreparation.
The potentiometric response repeatability of the Na+-SEwas checked in FI at five levels of concentration, by perform-ing 10 repetitive injections of NaCl solutions, with different
he reproducibility of the calibration setup two series of murements were performed using the same pairs of thend added solutions (Fig. 7B). The superposition of the e
able 3egression parameters for the linear dependency between the calculaeasured pH for exponential standard additions of 0.1 M HCl solution
ode Intercept Slope R N
atch 0.063± 0.008a 0.990± 0.003a 0.99995 14SF 0.072± 0.008a 1.021± 0.003a 0.99996 14IA −0.138± 0.011a 1.051± 0.004a 0.99991 14
or experimental conditions, seeFig. 7A.a Standard deviation.

S.A. Dorneanu et al. / Sensors and Actuators B 105 (2005) 521–531 529
Table 4Analytical and statistical parameters corresponding to Na+-SE batch automatic calibration using exponential addition for different concentrations of initial andadded NaCl standard solutions (seeFig. 7B)
Test S(mV)a LD (×10−4 M)a E0 (mV)a χ2a Slopeb Rb Nb
1 + 3 61.5± 0.3c 1.6± 0.05c 89.8± 0.6c 1.18× 10⁻⁶ 1.017± 0.004c 0.99973 342 + 4 60.8± 0.4c 1.3± 0.05c 88.8± 0.7c 1.76× 10⁻⁶
a Parameters were evaluated by non-linear (Levenberg–Marquardt algorithm) regression.b Parameters were evaluated by linear regression.c Standard deviation.
concentrations between 10−4 and 1 M (Fig. 8A). As expected,a statistical analysis of the obtained results (Table 5) revealedthat the relative standard deviation (R.S.D., %) decreases sig-nificantly with the sample concentration increase. The poten-tiometric LD for FI measurements (7.7× 10⁻⁴ M) is higherthan that observed in batch or SSF measurements (3.8×
FrcBiv
Table 5Average values of the peak potential and the relative standard deviationcorresponding to Na+-SE potentiometric response, recorded for 10 repetitiveinjections of a NaCl solution, with different concentrations (seeFig. 8A)
cNaCl (M) Epeak (mV) R.S.D. (%) N
10−4 0.9 16.8 910−3 10.9 2.84 910−2 74.1 0.22 1010−1 137.8 0.13 101 207.1 0.19 10
10−4 M), due to the slow Na+-SE response at low Na+ con-centrations. Nevertheless, for samples having concentrationabout 10 times higher than the LD value, the FI techniquewith NASICON-based Na+-SE represents a very convenientprocedure for precise and reproducible potentiometric mea-surements.
The negative peaks (Fig. 8A) are due to the “overshoot”phenomenon, generated by the strong adsorption of Ba2+ions (from the supporting electrolyte) at the electrode sur-face [31]. The amplitude of this undesirable phenomenondecreases with the Na+ concentration increase.
In order to perform amperometric measurements, the ap-plied potential was poised at the value corresponding to theNa+-SE equilibrium potential, measured when the support-ing electrolyte flows through the WJC[41]. In this way, astable and close to zero current base line was constantlymaintained (seeFig. 8B). However, in the low concentra-tions range, a significant current drift and the overshoot phe-nomenon were noticed. Consequently, for 10 repetitive in-
ig. 8. Potentiometric (A) and amperometric (B) Na+-SE responsesecorded for 10 repetitive injections of a NaCl solution, with different con-entrations. Experimental conditions: flow carrier, 10−5 M NaCl + 0.1 MaCl2; sample solution, 10−4, 10−3, 10−2, 10−1 and 1 M NaCl, all prepared
n 0.1 M BaCl2 as supporting electrolyte; flow rate, 5 mL min−1; d = 2 mm;olume of sample loop, 140�L; volume of dilution loop, 100�L.
jections of NaCl solutions, with two different concentrations(10−4 and 10−3 M), relatively high R.S.D. values were ob-tained (Table 6).
The comparison between two successive series of repeti-tive amperometric measurements proves the excellent repro-ducibility of the computer-controlled system. It is worth tom mea-s meryp 10-r per-i pre-s dc pro-d
ention that, before the second series of amperometricurements, the electrode surface was polished with eaper (1200 grit). The two complete series, consisting inecorded peaks, were compared point by point for all exmental points (6200). The correlation parameters areented in the last two columns ofTable 6. The slopes anorrelation coefficients values confirm the excellent reucibility of the experimental setup.

530 S.A. Dorneanu et al. / Sensors and Actuators B 105 (2005) 521–531
Table 6Statistical parameters concerning the repeatability and reproducibility of the Na+-SE amperometric response, recorded for two series of 10 repetitive injectionsof a NaCl solution, with different concentrations (seeFig. 8B)
Test cNaCl (M) |Ipeak| (�A) R.S.D. (%) N Slopea Ra
1A 10−4 0.037± 0.001b 2.22 9 0.997± 0.002b 0.99311B 10−4 0.029± 0.001b 2.87 92A 10−3 0.638± 0.004b 0.66 10 1.0001± 0.0005b 0.99922B 10−3 0.632± 0.003b 0.51 103A 10−2 13.14± 0.685b 5.22 10 0.9289± 0.001b 0.99553B 10−2 12.73± 0.442b 3.47 104A 10−1 53.63± 0.79b 1.48 10 0.9444± 0.0002b 0.99974B 10−1 51.48± 0.49b 0.96 105A 1 100.7± 0.27b 0.27 10 0.9961± 0.0002b 0.99985B 1 100.6± 0.18b 0.18 10
a N = 6200 points, corresponding to the integral recorded curves.b Standard deviation.
4. Conclusions
The WJC adapted to our system allowed optimizing theexperimental parameters: the flow rate and the distance be-tween the injector and the electrode surface. The presenceof a pulsation-dumping element induces a great decrease ofthe current pulsations observed in the amperometric mode,improving considerably the measurements accuracy.
The hydrodynamic voltammetry with linear scan of theflow rate was successfully used for a fast and accurate de-piction of the flow profile in the WJC. Using this cell, it waspossible to obtain a hydrodynamic regime corresponding to alaminar parallel flow, allowing a uniform accessible electrodesurface.
Several tests, using a commercial pH glass electrode or ahome-made NASICON-based Na+-SE, proved the ability ofour system, equipped with a variable speed peristaltic pump,to prepare large series of standard solutions with an excellentprecision and reproducibility. The full electronic control offlow control elements and the high data acquisition speedallow obtaining reproducible results for repetitive as well asfor long time measurements.
Finally, it is worth to note that, due the facility to preparestandard solutions with linear and exponential increase ofconcentration, this setup can be successfully used for auto-m datet ignedu res-oi
A
lab-o Thefi irsa c-k
References
[1] M. Trojanowicz, M. Szewczynska, M. Wcislo, Electroanalytical flowmeasurements—recent advances, Electroanalysis 15 (2003) 347–365.
[2] V. Cerda, J.M. Estela, R. Forteza, A. Cladera, E. Becerra, P. Al-timira, P. Sitjar, Flow techniques in water analysis, Talanta 4 (1999)695–705.
[3] P. Koscielniak, Univariate calibration techniques in flow injectionanalysis, Anal. Chim. Acta 438 (2001) 323–333.
[4] B.W. Renoe, K.R. O’keefe, H.V. Malmstadt, Automated computer-controlled solution handling system utilizing weights of solution,Anal. Chem. 48 (1976) 661–666.
[5] G.D. Owens, R.J. Eckstein, Robotic sample preparation station, Anal.Chem. 54 (1982) 2347–2351.
[6] J.L. Chadwick, Laboratory robotics: an automated tool for prepar-ing ion chromatography calibration standards, Lab. Rob. Autom. 9(1997) 21–29.
[7] D.G. Cork, T. Sugawara, J.S. Lindsey, L.A. Corkan, H. Du, Fur-ther development of a versatile microscale automated workstationfor parallel adaptive experimentation, Lab. Rob. Autom. 11 (1999)217–223.
[8] A. Cladera, C. Tomas, E. Gomez, J.M. Estela, V. Cerda, A newinstrumental implementation of sequential injection analysis, Anal.Chim. Acta 302 (1995) 297–308.
[9] L. Alerm, J. Bartroli, Development of a sequential microtitrationsystem, Anal. Chem. 68 (1996) 1394–1400.
[10] R. Schindler, M. Watkins, R. Vonach, B. Lendl, R. Kellner, R. Sara,Automated multivariate calibration in sequential injection-Fouriertransform infrared spectroscopy for sugar analysis, Anal. Chem. 70(1998) 226–231.
[ -etric
[ ndction
[ A.N.o-min720.
[ tedatilecopy,
[ temtom-
atic calibration of the amperometric biosensors. To valihis feature, a new computer-controlled system was dessing a more accurate data acquisition card with 16 bitslution (NI 6014, National Instruments®, USA). The work is
n progress with very promising results.
cknowledgements
This work includes a part of Dorneanu’s Ph.D. thesis, erated in the frame of French–Romanian collaboration.nancial supports from French Ministry of Foreign Affand from CNCSIS (Grant AT 38/41/2003) are gratefully anowledged.
11] A. Tan, Z. Xinying, C. Li, X. Cailin, H. Jialin, A reliable syringepump-based flow analyzer for photometric analysis and photomtitration, Lab. Rob. Autom. 12 (2000) 108–113.
12] J.Y. Neira, N. Reyes, J.A. Nobrega, Development of hardware asoftware for on-line sample preparation using sequential-injeanalysis, Lab. Rob. Autom. 12 (2000) 246–252.
13] R.N. Fernandes, M.G.F. Sales, B.F. Reis, E.A.G. Zagatto,Araujo, M.C.B.S.M. Montenegro, Multi-task flow system for ptentiometric analysis: its application to the determination of VitaB6 in pharmaceuticals, J. Pharm. Biomed. Anal. 25 (2001) 713–
14] F. Vogt, M. Karlowatz, M. Jakusch, B. Mizaikoff, The automasample preparation system MixMaster for investigation of volorganic compounds with mid-infrared evanescent wave spectrosAnalyst 128 (2003) 397–403.
15] A.L.D. Comitre, B.F. Reis, Automatic multicommutated flow sysfor ethanol determination in alcoholic beverages by spectrophoetry, Lab. Rob. Autom. 12 (2000) 31–36.

S.A. Dorneanu et al. / Sensors and Actuators B 105 (2005) 521–531 531
[16] E. Richards, C. Bessant, S. Saini, A liquid handling system for theautomated acquisition of data for training, validating and testingcalibration models, Sens. Actuators B 88 (2003) 149–154.
[17] B.D. Frary, Multipoint calibration from one standard solution andautomatic dilution of overrange samples for flame atomic absorptionspectrometry, Analyst 123 (1998) 233–237.
[18] J.A.G. Neto, S.J.B. Borba, S.I. Goncalves, C.A. Jose, Use of FIAsystems for on-line dilution in multielement determination by ICP-MS, Lab. Rob. Autom. 11 (1999) 240–247.
[19] P. Koscielniak, J. Janiszewska, Design of the fully rotary valve forcalibration purposes in flow analysis, Lab. Rob. Autom. 9 (1997)47–54.
[20] P. Koscielniak, M. Herman, J. Janiszewska, Flow calibration systemwith the use of fully rotary directive valve, Lab. Rob. Autom. 11(1999) 111–119.
[21] P. Koscielniak, M. Herman, Flow system for calibration and inter-ference examination in two-component analysis, Lab. Rob. Autom.12 (2000) 228–235.
[22] A.D. Dakashev, V.T. Dimitrova, Continuous flow system and methodfor electrochemical preparation of metal-ion standard solutions, Lab.Rob. Autom. 10 (1998) 39–43.
[23] M. Gratzl, E. Lindner, E. Pungor, Theoretical interpretation oftransient signals obtained with precipitate-based ion-selective elec-trodes in the presence of interfering ions, Anal. Chem. 57 (1985)1506–1511.
[24] A. Lewenstam, A. Hulanicki, T. Sokalski, Response mechanism ofsolid-state ion-selective electrodes in the presence of interfering ions,Anal. Chem. 59 (1987) 1539–1544.
[25] E. Lindner, K. Toth, E. Pungor, Dynamic Characteristic of Ion-Selective Electrodes, CRC Press, Boca Raton USA, 1988, pp.
[ om-d ion-hem.
[ lec-92)
[ for–178.
[ All-lm ofide)
[ ofn in
[ usedsient
[ miccial
[33] J.M. Elbicki, D.M. Morgan, S.G. Weber, Theoretical and practi-cal limitations on the optimization of amperometric detectors, Anal.Chem. 56 (1984) 978–985.
[34] J. Wang, L. Chen, On-detector injector for flow injection ampero-metric measurements. The wall-jet/thin-layer cell, Anal. Chem. 63(1991) 1499–1501.
[35] M. Bart, P.J.H.J. Van Os, B. Kamp, A. Bult, W.P. Van Bennekom,Development of a confined wall-jet flow-through cell for simulta-neous electrochemical and surface plasmon resonance applications,Sens. Actuators B 84 (2002) 129–135.
[36] B.A. Logue, J.C. Westall, Kinetics of reduction of nitrobenzene andcarbon tetrachloride at an iron-oxide coated gold electrode, Environ.Sci. Technol. 37 (2003) 2356–2362.
[37] V. Mori, M. Bertotti, Amperometric detection with microelectrodesin flow injection analysis: theoretical aspects and application inthe determination of nitrite in saliva, Talanta 47 (1998) 651–658.
[38] V. Mori, M. Bertotti, Studies on the reaction between nitrite andiodide by using microelectrodes in stationary and convective systems,Electroanalysis 11 (1999) 234–237.
[39] J.A. Alden, S. Hakoura, R.G. Compton, A comparison of the timescales accessible and kinetic discrimination obtainable using steady-state voltammetry at common hydrodynamic and microelectrode ge-ometries, Anal. Chem. 71 (1999) 806–810.
[40] L.T. Dimitrakopoulos, T. Dimitrakopoulos, Evaluation of a four sen-sor array used in a wall-jet configured flow cell for flow injectionpotentiometry, Electroanalysis 13 (2001) 161–163.
[41] S.A. Dorneanu, Realisation et caracterisation de capteursa ionsalcalins utilises en FIA dans une cellule WJa base de NA-SICON, Ph.D. Thesis, University J. Fourier Grenoble, France
ober
[ red
[ -all-jet
[ A,
[ rogent II.xy-
2000)
[ ticalpp.
[ elec-
[ mod-d-m-
81–107.26] T.R. Berube, R.P. Buck, E. Lindner, M. Gratzl, E. Pungor, C
parison of proposed response mechanisms of precipitate-baseselective electrodes in the presence of interfering ions, Anal. C61 (1989) 453–458.
27] R.J. Forster, D. Diamond, Nonlinear calibration of ion-selective etrode arrays for flow injection analysis, Anal. Chem. 64 (191721–1728.
28] M. Attari, P. Fabry, H. Mallie, G. Quezel, A new double-jet cellfast ion-sensitive electrodes, Sens. Actuators B 15 (1993) 173
29] T. Momma, S. Komaba, M. Yamamoto, T. Osaka, S. Yamauchi,solid-state potassium-selective electrode using double-layer fipolypyrrole/polyanion composite and plasticized poly(vinyl chlorcontaining valinomycin, Sens. Actuators B 25 (1995) 724–728.
30] T.K. vel Krawczyk, M. Trojanowicz, N. El-Murr, Enhancementselectivity of electrochemical detectors by kinetic discriminatioflow-injection systems, Lab. Rob. Autom. 12 (2000) 205–215.
31] S.A. Dorneanu, I.C. Popescu, P. Fabry, NASICON membraneas Na+-selective potentiometric sensor in steady state and tranhydrodynamic conditions, Sens. Actuators B 91 (2003) 67–75.
32] J. Yamada, H. Matsuda, Limiting diffusion currents in hydrodynavoltammetry. III. Wall jet electrodes, J. Electroanal. Chem. InterfaElectrochem. 44 (1973) 189–198.
and University Babes-Bolyai, Cluj Napoca, Romania, 26 Oct2001.
42] M.R. Romero, J.M. Marioli, A computer-controlled battery-powemicropotentiostat, Lab. Rob. Autom. 12 (2000) 53–58.
43] I.C. Stefan, I.C. Popescu, P. Fabry, Na+-selective NASICON electrode used as potentiometric and amperometric sensor in a wFI system, Lab. Rob. Autom. 10 (1998) 339–345.
44] ISMATEC, REGLO Analog Operating Manual, ISMATEC S.Glattbrugg, Switzerland, 2002, p. 17.
45] P. Ilea, S. Dorneanu, I.C. Popescu, Electrosynthesis of hydperoxide by partial reduction of oxygen in alkaline media. ParWall-jet ring disk electrode for electroreduction of dissolved ogen on graphite and glassy carbon, J. Appl. Electrochem. 30 (187–192.
46] H. Gunasingham, B. Fleet, in: A.J. Bard (Ed.), ElectroanalyChemistry, vol. 16, Marcel Dekker, New York, USA, 1989,96–180.
47] I.U.P.A.C., Recommendation for nomenclature of ion-selectivetrodes, Pure Appl. Chem. 48 (1976) 127–132.
48] S.A. Dorneanu, I.C. Popescu, P. Fabry, Amperometric behavioreling of a NASICON based Na+ ion selective electrode, in: Proceeings of the 53rd ISE Meeting, Dusseldorf, Germany, 15–20 Septeber 2002.