COMPUTER-ASSISTED PSEUDO-COLORING METHOD OF LUNG X-RAYS
15
The 10 Annual International Conference on Computer Science and Education in Computer Science, July 04-07 2014, Albena, Bulgaria COMPUTER-ASSISTED PSEUDO-COLORING METHOD OF LUNG X-RAYS Dessislava Valentinova GEORGIEVA, Vesselin Evgueniev GUEORGUIEV Abstract: The purpose of computer-assisted methods is to subserve the diagnosing process through the presentation of information in the images more accessible and more informative form. For this purpose, methods have been developed that take into account the peculiarities of the human visual system to perceive more easily information in color. The article described a new method for the pseudo coloring of chest X- ray images in order to more easily diagnose seals in the lung. Keywords: X-ray imaging, pseudo coloring, computer-assisted method. ACM Classification Keywords: medical imaging, computer-assisted methods, X-ray post-processing, pseudo-coloring
Transcript of COMPUTER-ASSISTED PSEUDO-COLORING METHOD OF LUNG X-RAYS

The 10 Annual International Conference on Computer Science and Education in Computer Science,
July 04-07 2014, Albena, Bulgaria
COMPUTER-ASSISTED PSEUDO-COLORING
METHOD OF LUNG X-RAYS
Dessislava Valentinova GEORGIEVA, Vesselin Evgueniev GUEORGUIEV
Abstract: The purpose of computer-assisted methods is to subserve the
diagnosing process through the presentation of information in the
images more accessible and more informative form. For this purpose,
methods have been developed that take into account the peculiarities of
the human visual system to perceive more easily information in color.
The article described a new method for the pseudo coloring of chest X-
ray images in order to more easily diagnose seals in the lung.
Keywords: X-ray imaging, pseudo coloring, computer-assisted method.
ACM Classification Keywords: medical imaging, computer-assisted methods,
X-ray post-processing, pseudo-coloring

2 D. Georgieva, V. Gueorguiev
Computer-Assisted Pseudo-Coloring Method of Lung X-Rays
Introduction
The use of up-to-date technologies is of crucial importance for
telemedicine. Video as a kind of data and information exchange and/or
communication has an important role in videoconference and
telepresence [Ghaye, 2007].
Interpretation errors of medical images date back to the early days of
Radiology. Medical problem after an interpretation error was first
reported by Garland in 1959. Regardless of changes made, errors
continue to be a major problem as they tend to be very frequent,
especially in early diagnosis of diseases using lung X-rays (around 20-
50% misdiagnosis), and mammography (up to 75% misdiagnosis).
Studies have shown that interpretation errors of images of confirmed
diagnoses reached ~30%. At the same time, when images of
healthy/sick patients are read by a physician, the percentage of
misdiagnoses increased by another 4% [Berlin, 2007], [Garland, 1959].
Errors in reading X-rays are not only the result of a physician’s
qualification but also of their ability to see structures and details in the
image.
In essence, the process of ‘observing’ is very complex and includes
anatomical, physiological, neuropsychological and psycho-emotional
components. In such a complex process, possible errors are not a
surprise, although not all of the images are equally complex. For
example, it is assumed by intuition that bringing an image closer to the
eye results in easier detection of characteristic elements and easier
evaluation of the image. This is not true for images with low contrast,
such as most X-ray images. Visualization and examination of digital
images on the display differs because classical X-ray examination
process cannot be replicated in fullness due to the peculiarities of
imaging systems and the characteristics of human vision. This
determines the continued search for more efficient ways and more
CSECS 2014, July 04-07 2014, Albena, Bulgaria 3
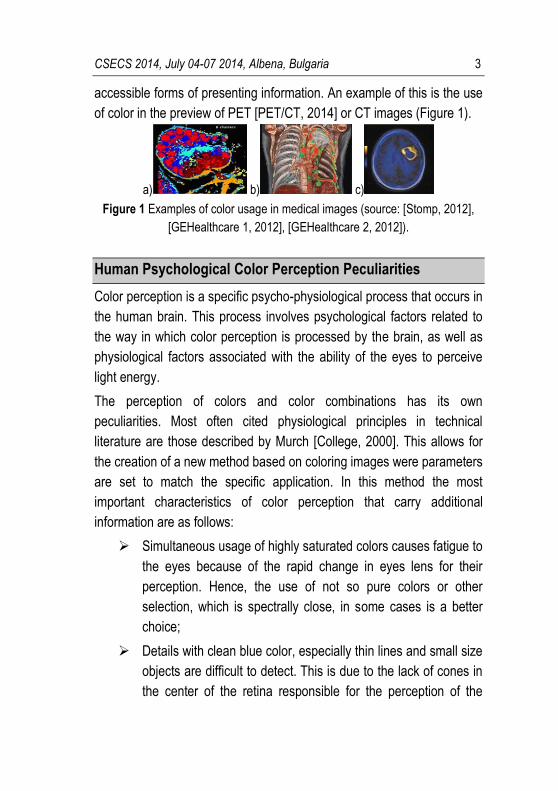
accessible forms of presenting information. An example of this is the use
of color in the preview of PET [PET/CT, 2014] or CT images (Figure 1).
a) b) c)
Figure 1 Examples of color usage in medical images (source: [Stomp, 2012],
[GEHealthcare 1, 2012], [GEHealthcare 2, 2012]).
Human Psychological Color Perception Peculiarities
Color perception is a specific psycho-physiological process that occurs in
the human brain. This process involves psychological factors related to
the way in which color perception is processed by the brain, as well as
physiological factors associated with the ability of the eyes to perceive
light energy.
The perception of colors and color combinations has its own
peculiarities. Most often cited physiological principles in technical
literature are those described by Murch [College, 2000]. This allows for
the creation of a new method based on coloring images were parameters
are set to match the specific application. In this method the most
important characteristics of color perception that carry additional
information are as follows:
Simultaneous usage of highly saturated colors causes fatigue to
the eyes because of the rapid change in eyes lens for their
perception. Hence, the use of not so pure colors or other
selection, which is spectrally close, in some cases is a better
choice;
Details with clean blue color, especially thin lines and small size
objects are difficult to detect. This is due to the lack of cones in
the center of the retina responsible for the perception of the

4 D. Georgieva, V. Gueorguiev
Computer-Assisted Pseudo-Coloring Method of Lung X-Rays
blue color. In contrast, the blue color is better to use for the
background, particularly in computer displays where it leads to
a blurring of the raster lines in its perception;
The use of similar colors that differ only by the amount of blue
creates a sense of fuzzy edges, as the blue color does not
contribute to the perception of brightness;
The perceptible color change is different in different parts of the
spectrum;
It is difficult for human eye to focus and perceive information
when a change of color is used only in the adjacent areas;
Red and green in the periphery of large screens are not
perceived correctly so they should be avoided there;
Human vision perceives better a combination of contrasting
colors;
Visualization of contiguous areas with pure blue and pure red
color on the display leads to their perception as separate layers
with different depths;
When viewing on display adjacent areas with pure blue and
pure red colors they are perceived as being on separate layers
with different depths.
It has been found that the degree of light is a characteristic, which is
particularly suitable when forming a color scale because it provides for
an arrangement that is based on natural impression. Color scales with
variable intensity are also used, but they are not as effective as others.
Nuances of color are not perceived in the same way as the natural order
of the arrangement formed by brightness. Some color schemes, such as
those representing changes due to gradual heating of objects, rely more
on a symbolic meaning rather than perception. Bipolar color models

CSECS 2014, July 04-07 2014, Albena, Bulgaria 5
where two colors vary in intensity and saturation are best suited for color
scales with a central zero point.
The most commonly used structured multi-tone color scale - Rainbow
has the disadvantage that its central colors - yellow and green, are
perceived as too bright by many researchers. Thus the arrangement
according to brightness is in conflict with the arrangement of colors. At
the same time, spectral-based systems such as Rainbow present an
arrangement of colors according to their physical perception; they do not
form a consistent arrangement according to our perceptions, so in most
cases experts disagree about their use for coding quantitative data
[Breslow, 2010].
Studies in the development of the presented method show that as far as
medical purposes are concerned, colors that look different in slight
variations in the background should be avoided because they may be
perceived as different by the observer and the information they carry
may be lost. In addition, different shades of the same color should be
avoided for denoting objects or areas with different characteristics. This
is especially true for the blue color where different shades are very
difficult to distinguish visually and cannot be defined as areas with
different characteristics.
Method of Computer-Assisted Lung X-Ray Diagnosis Through
the Use of Colors
The proposed method of post-processing X-ray images consists in
pseudo-coloring, i.e. using specially defined color scheme upon
grayscale images [GEHealthcare 3, 2012]. The most popular method of
pseudo-coloring is that of using Look-up tables [Lehmann, 1997]. This
kind of tables is set in computer tomography and position-emission
tomography aimed at improving the contrast of tissues under
6 D. Georgieva, V. Gueorguiev
Computer-Assisted Pseudo-Coloring Method of Lung X-Rays
observation. Unfortunately, the direct application of this method when
pseudo-coloring X-rayed lungs proved to be non-applicable.
Experiments were carried out to evaluate the existing types of coloring.
This allowed doing different analyses on the possibility of replacing the
gray tones in color, which would allow distinguishing the different
conditions of the lungs’ diseases.
Besides assessing lung diagnosis, the conducted analysis shows that
direct gradient model application is not suitable for treating X-ray images
because of considerable loss of medical artefacts. This fact led to the
conducting of a series of experiments for lung pseudo-coloring.
a) b) c) d)
e) f) g) h)
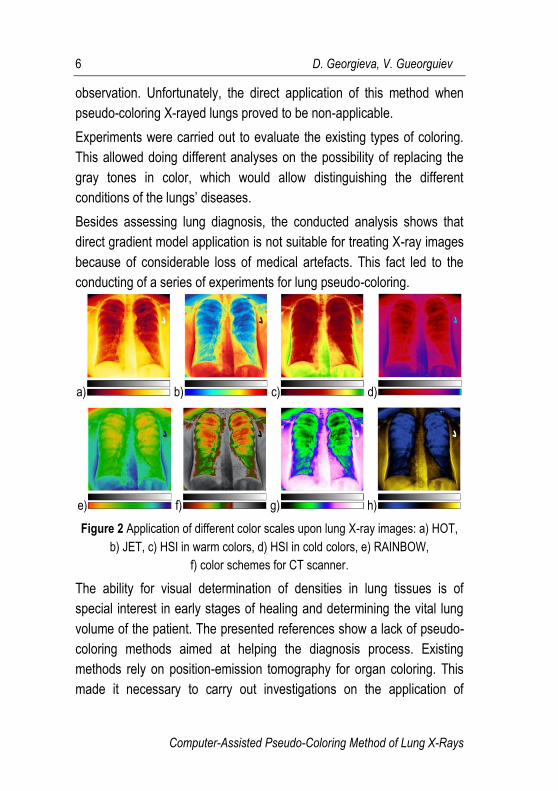
Figure 2 Application of different color scales upon lung X-ray images: a) HOT,
b) JET, c) HSI in warm colors, d) HSI in cold colors, e) RAINBOW,
f) color schemes for CT scanner.
The ability for visual determination of densities in lung tissues is of
special interest in early stages of healing and determining the vital lung
volume of the patient. The presented references show a lack of pseudo-
coloring methods aimed at helping the diagnosis process. Existing
methods rely on position-emission tomography for organ coloring. This
made it necessary to carry out investigations on the application of

CSECS 2014, July 04-07 2014, Albena, Bulgaria 7
methods used in lung treatments. The fastest initial assessment method
was the use of coloring by tables of conformity (Figure 2).
The analysis of different color scales applications used for medical
purposes showed that the obtained X-ray images display very saturated
colors. This contributes to eye fatigue and hampers the diagnosing
process. Such is the case of applying red color upon very large zones,
as in JET and HIS in warm and color colors. At the same time, in many
zones color does not carry information; it even hampers the image
analysis. Such critical zones are those around bones, the heart, under
the diaphragm, especially when the HIS scale in cold colors is applied. In
some cases the visualization of the grid structure of the bronchus is
being lost - as is the case with HSI in warm and cold colors or it is
significantly reduced as is the case with RAINBOW (Figure 2 g)
When assessing two-shade scales like HOT and HSI in cold colors, HOT
proves much better in displaying lung volume as well as visualizing
bronchus grid, which shows that the greater the contrast between the
bronchus and the surrounding lung tissue, the better the results.
When assessing multi-color scales such as the one used in computer
tomography (Figure 2 e, g) it is established that an ambiguity appears in
the visualization with different colors (Figure 2 e).
In general, the assessment of existing scales in lung X-ray studies shows
that they cannot be applied directly and that a new way of presenting
information of lung X-ray images is to be sought.
Lung X-Rays Pseudo-Coloring Method
The following peculiarities of the conducted experiments on the basis of
analysis of results have been determined:
The direct application of a color scale used for other
applications is not suitable because lung visualization has its
own specific features;
8 D. Georgieva, V. Gueorguiev
Computer-Assisted Pseudo-Coloring Method of Lung X-Rays
Medically reliable X-ray images cannot be achieved only by
means of direct application of the gradient change of colors.
In the proposed method, color is used for informational purposes rather
than as a qualitative characteristic of X-rays. The aim of the method is to
facilitate diagnosis by color separation of tissues of the chest with
different X-ray densities. This combines visualization capacities of two
color scales - greyscale for the visualization of X-rays and color scale for
the visualization of lung tissues.
The core of the method is to clearly visualize lung capacity as well as
tissue densities. It was defined that red color is the most appropriate for
rendering lung zones with the smallest density - they are equivalent to
dark gray or black zones of ordinary grayscale X-rays. These zones are
indicative of a lung’s vital volume and are immediate characteristics of its
functional abilities.
It is crucial to visualize clearly tissue zones with higher densities
especially those with cancer origin. The particularity of such zones is
their reticulated structure that has to be visualized in order to be
diagnosed correctly. This aim determines the importance of the process
functions that have to preserve the X-ray character.
Investigations showed that tissue structures of interest are to be
distinguished from the surrounding environment not only by color, but by
brightness, too.
In addition, the color applied should not be adjacent to the main one (red
color), neither could it be blue because that will create a sense of
stratification (exfoliation). This was the reason why green was chosen
with a gradation of saturation and brightness - it renders correctly tissues
with different densities.
The remaining X-ray elements of the lungs that are not directly
concerned with the assessment of lung capacity are visualized by

CSECS 2014, July 04-07 2014, Albena, Bulgaria 9
grayscale as in most X-ray images. This allows them to remain visual
and be taken account of in the diagnosis process.
a) b) c)
d) e) f)
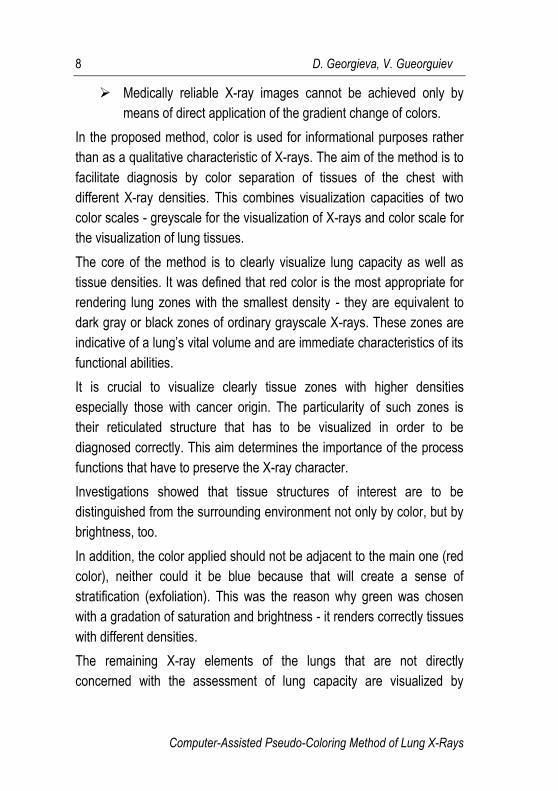
Figure 3 Intermediate results of function application upon the X-ray image.
On the basis of the investigations conducted a series of filters for image
processing was determined. The specific point here is that each filter is
applied upon the result of the application of the previous one. The new
method works in the following stages:
The image is transformed into grayscale;
The image is transformed into a negative and its contrast is
increased by extending its histogram;
The process filters are applied upon that negative image aiming
at the 'exfoliation' of the image depending on its X-ray density
and integrating the chosen colors;
A function is applied aiming at restoration of the part of the
image that is not of immediate interest - bones surrounding
tissue environment;
Correction of brightness and contrast of the final image.

10 D. Georgieva, V. Gueorguiev
Computer-Assisted Pseudo-Coloring Method of Lung X-Rays
The peculiarity of X-ray images is their diverse level of quality (most of
them are underexposed). Therefore each of them is unique in
characteristic (Figure 3 a). Better results are obtained when a method
improving X-ray quality and contrast is applied although this is not
obligatory. The critical point is the convergence of prime X-ray images
into grayscale, thus avoiding undesired coloring during post-treatment
when colors are superimposed. This particularity predefines the
importance of the chosen method of transforming the image from colorful
into greyscale one. Depending on the chosen method, pixels are given
different gray values, which influence the next processing step in
accordance with pixel values.
The second stage of the method consists of transforming the image into
a negative. This includes correcting contrast through different methods -
changing global brightness and contrast, changing on the basis of
gamma-correction, etc. (Figure 3 b). A list of filters follows:
Filter on the basis of applying red color to pixel values while
preserving their brightness value (Figure 3 c);
Gradient filter that enhances the difference in pixel brightness
while maintaining minimum pixel value. This filter visualizes
bronchi's grid structure. The degree of a parameter is chosen to
have 45% of influence (Figure 3 d);
Filter based on gradient change - assigning an additional green
color over the grid structure of the bronchus with middle X-ray
density and extra red upon tissue zones with minimal X-ray
density (air in lungs and tissues exhibits minimal density value).
The aims of this filter are two - to help visualize lungs’ vital
volume (red colored) and to highlight thickened zones
(Figure 3 e).
The third stage of the method brings back pixel values of the input image
to a degree depending on their brightness. What characterizes this stage
CSECS 2014, July 04-07 2014, Albena, Bulgaria 11
is that black color pixels are fully restored to their original values while
lighter-colored pixels are restored according to the degree of their
brightness. This is how visualization of bones and surrounding tissue is
achieved (Figure 3 f).
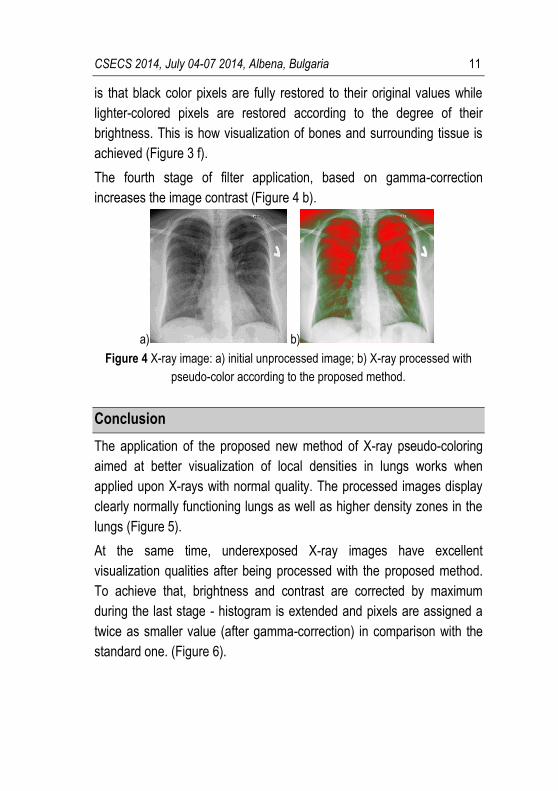
The fourth stage of filter application, based on gamma-correction
increases the image contrast (Figure 4 b).
а) b)
Figure 4 X-ray image: a) initial unprocessed image; b) X-ray processed with
pseudo-color according to the proposed method.
Conclusion
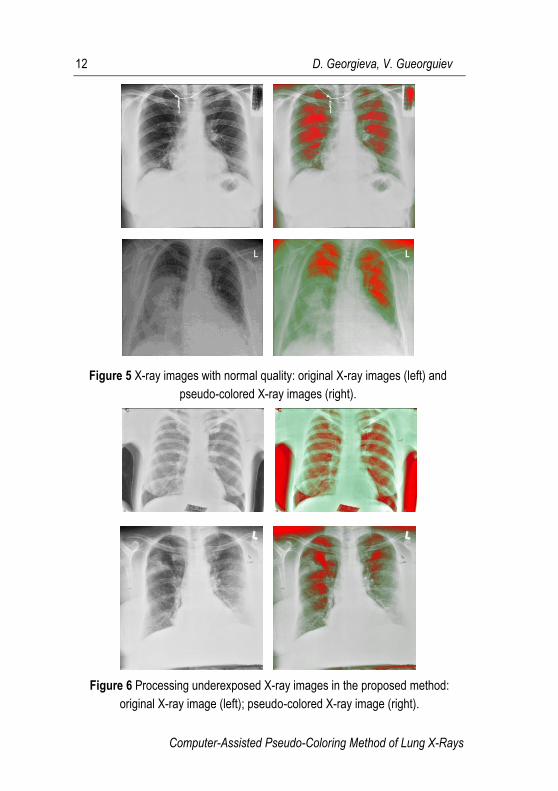
The application of the proposed new method of X-ray pseudo-coloring
aimed at better visualization of local densities in lungs works when
applied upon X-rays with normal quality. The processed images display
clearly normally functioning lungs as well as higher density zones in the
lungs (Figure 5).
At the same time, underexposed X-ray images have excellent
visualization qualities after being processed with the proposed method.
To achieve that, brightness and contrast are corrected by maximum
during the last stage - histogram is extended and pixels are assigned a
twice as smaller value (after gamma-correction) in comparison with the
standard one. (Figure 6).
12 D. Georgieva, V. Gueorguiev
Computer-Assisted Pseudo-Coloring Method of Lung X-Rays
Figure 5 X-ray images with normal quality: original X-ray images (left) and
pseudo-colored X-ray images (right).
Figure 6 Processing underexposed X-ray images in the proposed method:
original X-ray image (left); pseudo-colored X-ray image (right).
CSECS 2014, July 04-07 2014, Albena, Bulgaria 13
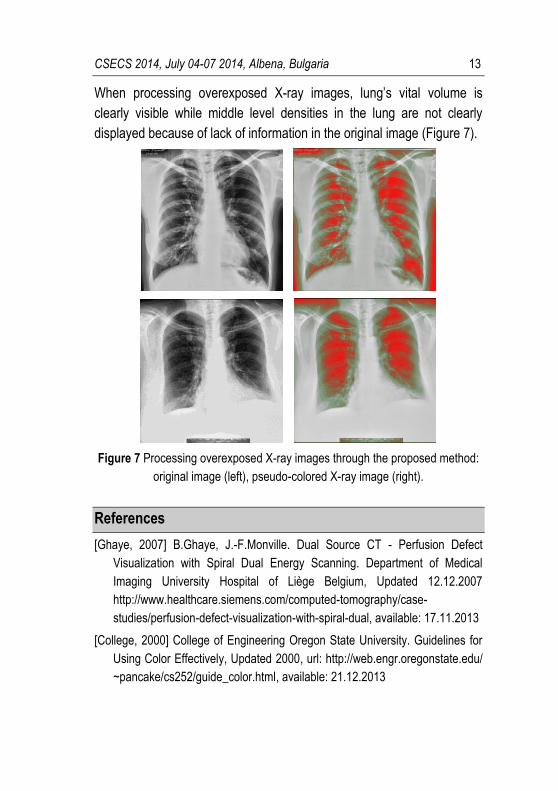
When processing overexposed X-ray images, lung’s vital volume is
clearly visible while middle level densities in the lung are not clearly
displayed because of lack of information in the original image (Figure 7).
Figure 7 Processing overexposed X-ray images through the proposed method:
original image (left), pseudo-colored X-ray image (right).
References
[Ghaye, 2007] B.Ghaye, J.-F.Monville. Dual Source CT - Perfusion Defect
Visualization with Spiral Dual Energy Scanning. Department of Medical
Imaging University Hospital of Liège Belgium, Updated 12.12.2007
http://www.healthcare.siemens.com/computed-tomography/case-
studies/perfusion-defect-visualization-with-spiral-dual, available: 17.11.2013
[College, 2000] College of Engineering Oregon State University. Guidelines for
Using Color Effectively, Updated 2000, url: http://web.engr.oregonstate.edu/
~pancake/cs252/guide_color.html, available: 21.12.2013
14 D. Georgieva, V. Gueorguiev
Computer-Assisted Pseudo-Coloring Method of Lung X-Rays
[Berlin, 2007] L.Berlin. Accuracy of Diagnostic Procedures: Has It Improved
Over the Past Five Decades?. In: American Journal of Roentgenology, vol.
188, no. 5, pp. 1173-1178, 2007
[Breslow, 2010] L.Breslow, J.Trafton, J.McCurry, R.Ratwani. An Algorithm for
Generating Color Scales for Both Categorical and Ordinal Coding. In:
COLOR research and application, vol. 35, no. 1, 2010
[Garland, 1959] L.Garland. Studies on the accuracy of diagnostic procedures.
In: American Journal of Roentgenology, vol. 82, pp. 25-38, 1959
[Lehmann, 1997] T.Lehmann, A.Kaserb, R.Repgesa. A simple parametric
equation for pseudocoloring grey scale images keeping their original
brightness progression. In: Image and Vision Computing, vol. 15, pp. 251-
257, 1997
[Stomp, 2012] W.Stomp. Siemens Biograph mCT PET-CT System Receives
FDA Clearance, Updated 16.02.2012. Url: http://www.medgadget.com/2012/
02/siemens-biograph-mct-pet-ct-system-receives-fda-clearance.html,
available: 21.11.2013
[GEHealthcare 1, 2012] GEHealthcare. CT Perfusion 4D Neuro. Updated 2012.
Url: http://www3.gehealthcare.com/en/Products/Categories/Advanced_
Visualization/Applications/CT_Perfusion_4D_Neuro, available: 21.11.2013
[GEHealthcare 2, 2012] GE Healthcare: Integrated Registration. Updated 2012.
Url: http://www3.gehealthcare.com/en/Products/Categories/Advanced_
Visualization/Applications/Integrated_Registration , available: 21.11.2013
[GEHealthcare 3, 2012] GEHealthcare. Spectral Imaging in clinical practice,
Updated 2012. Url: http://www3.gehealthcare.com/~/media/Downloads/us/
Product/Product-Categories/Advanced-Visualization/GSI-Viewer/GEHC-
Case-Study-GSI_Spectral_Imaging_in_Clinical_Practice.pdf, available:
21.11.2013
[PET/CT, 2014] PET/CT. Updated 2014 Url: http://www.citrus
diagnosticcenter.com/petct.htm, available: 21.11.2013
CSECS 2014, July 04-07 2014, Albena, Bulgaria 15
Authors' Information
Desislava GEORGIEVA, PhD, assistant-professor, New Bulgarian University Sofia, Bulgaria, [email protected].
Major Fields of Scientific Research: 3D computer graphics,
medical imaging, 3D computer animation.
Vesselin GUEORGUIEV, PhD, assistant-professor, Technical University Sofia, Bulgaria, [email protected].
Major Fields of Scientific Research: embedded systems, real-
time systems, validation and verification of software applications,
medical imaging, 3D computer graphics, 3D computer animation.