Computer-aided error analysis of L2 spoken English: A data mining approach
8
Proceedings of the Conference on Language and Technology 2014 (pp. 127-134) Computer-aided Error Analysis of L2 Spoken English: A Data Mining Approach Yuichiro Kobayashi Japan Society for the Promotion of Science [email protected] Abstract Understanding learners’ errors is significant for language teachers, researchers, and learners. Computer learner corpora enable us to carry out computer-aided error analysis, and as compared to traditional error analysis, it has an advantage in the storing and processing of enormous amounts of information about various aspects of learner language. The present study aims to explore the error patterns across proficiency levels in second language spoken English with data mining techniques. It also attempts to identify error types that can be used to discriminate between English learners at different proficiency levels. Spoken data for the present study were sourced from the NICT JLE Corpus, a computerized learner corpus annotated with 46 different error tags. The results of the present study indicate that there is a substantial difference in the frequencies of five types of errors, namely (a) article errors, (b) lexical verb errors, (c) normal lexical preposition errors, (d) noun number errors, and (e) tense errors, between lower- and upper- level learners. The findings will be useful for L2 learner profiling research and for the development of automated speech scoring systems. 1. Introduction Understanding learners’ errors is significant for language teachers, researchers, and learners [1]. Error analysis (EA) was a major topic in the field of second language acquisition in the 1960s and early 1970s, and it consists of the following five steps [2]: (a) Collection of a sample of learner language (b) Identification of errors (c) Description of errors (d) Explanation of errors (e) Evaluation of errors However, several limitations of the approach were pointed out in the 1970s. Major limitations can be summarized as follows [3]: (a) Limitation 1: EA is based on heterogeneous learner data. (b) Limitation 2: EA categories are fuzzy. (c) Limitation 3: EA cannot cater for phenomena such as avoidance. (d) Limitation 4: EA is restricted to what the learner cannot do. (e) Limitation 5: EA gives a static picture of L2 learning. Nonetheless, the emergence of computer learner corpora in the early 1990s enabled us to carry out computer-aided error analysis (CEA). It was developed to overcome most of the drawbacks of traditional EA, and it has an advantage in the storing and processing of enormous amounts of information about various aspects of learner language [4]. 2. Purposes The present study aims to explore the error patterns across proficiency levels in second language (L2) spoken English with data mining techniques. It also attempts to identify error types that can be used to discriminate between English learners at different proficiency levels. 3. Materials 3.1. Spoken data Spoken data for the present study were sourced from the NICT JLE (National Institute of Information and Communications Technology Japanese Learner English) Corpus, a corpus of more than 1,200 Japanese English as a foreign language (EFL) learners’ oral interview transcripts [5]. It comprises 325 hours of interviews conducted with 1,281 test takers. The 15- minute oral proficiency test is called the Standard Speaking Test (SST) and its evaluation criteria
Transcript of Computer-aided error analysis of L2 spoken English: A data mining approach
Proceedings of the Conference on Language and Technology 2014 (pp. 127-134)
Computer-aided Error Analysis of L2 Spoken English: A Data Mining Approach
Yuichiro Kobayashi Japan Society for the Promotion of Science
Abstract
Understanding learners’ errors is significant for
language teachers, researchers, and learners. Computer learner corpora enable us to carry out computer-aided error analysis, and as compared to traditional error analysis, it has an advantage in the storing and processing of enormous amounts of information about various aspects of learner language. The present study aims to explore the error patterns across proficiency levels in second language spoken English with data mining techniques. It also attempts to identify error types that can be used to discriminate between English learners at different proficiency levels. Spoken data for the present study were sourced from the NICT JLE Corpus, a computerized learner corpus annotated with 46 different error tags. The results of the present study indicate that there is a substantial difference in the frequencies of five types of errors, namely (a) article errors, (b) lexical verb errors, (c) normal lexical preposition errors, (d) noun number errors, and (e) tense errors, between lower- and upper-level learners. The findings will be useful for L2 learner profiling research and for the development of automated speech scoring systems. 1. Introduction
Understanding learners’ errors is significant for language teachers, researchers, and learners [1]. Error analysis (EA) was a major topic in the field of second language acquisition in the 1960s and early 1970s, and it consists of the following five steps [2]:
(a) Collection of a sample of learner language (b) Identification of errors (c) Description of errors (d) Explanation of errors (e) Evaluation of errors
However, several limitations of the approach were pointed out in the 1970s. Major limitations can be summarized as follows [3]:
(a) Limitation 1: EA is based on heterogeneous learner data. (b) Limitation 2: EA categories are fuzzy. (c) Limitation 3: EA cannot cater for phenomena such as avoidance. (d) Limitation 4: EA is restricted to what the learner cannot do. (e) Limitation 5: EA gives a static picture of L2 learning.
Nonetheless, the emergence of computer learner corpora in the early 1990s enabled us to carry out computer-aided error analysis (CEA). It was developed to overcome most of the drawbacks of traditional EA, and it has an advantage in the storing and processing of enormous amounts of information about various aspects of learner language [4]. 2. Purposes
The present study aims to explore the error patterns across proficiency levels in second language (L2) spoken English with data mining techniques. It also attempts to identify error types that can be used to discriminate between English learners at different proficiency levels. 3. Materials 3.1. Spoken data
Spoken data for the present study were sourced from the NICT JLE (National Institute of Information and Communications Technology Japanese Learner English) Corpus, a corpus of more than 1,200 Japanese English as a foreign language (EFL) learners’ oral interview transcripts [5]. It comprises 325 hours of interviews conducted with 1,281 test takers. The 15-minute oral proficiency test is called the Standard Speaking Test (SST) and its evaluation criteria
Proceedings of the Conference on Language and Technology 2014 (pp. 127-134)
conform to the American Council on the Teaching of Foreign Language Oral Proficiency Interview (ACTFL OPI). The present study used the error-tagged subset of this corpus, including oral performance data from 209 test takers whose proficiency levels were assessed, varyingly, as level 3 (novice high), level 4 (intermediate low), level 5 (intermediate low-plus), level 6 (intermediate mid), level 7 (intermediate mid-plus), level 8 (intermediate high), and level 9 (advanced). Since the numbers of test takers in levels 1 and 2 were low, they were not employed for the present study. Table 1 summarizes the number of test takers and total words from each level. Table 1: Corpus size of each level
Test takers Total words Level 3 35 15,387 Level 4 50 35,370 Level 5 37 32,228 Level 6 36 36,604 Level 7 23 25,410 Level 8 16 19,714 Level 9 12 17,489 Total 209 182,202
3.2. Error tags
Limiting the number of error types targeted in an EA can yield limited results. Therefore, we need to analyze various types of errors, and to compare their frequencies with each other [6]. The error tagset for the NICT JLE Corpus was designed to deal with as many morphological, lexical, and grammatical errors as possible, and includes 46 different error tags [7] (see Appendix). The tags are based on XML syntax, as can be seen in Figure 1. Yes. Uh. Usually, <at odr="1" crr="the"></at> museum <v_agr odr="2" crr="opens">open</v_agr> on <n_num odr="3" crr="Saturdays">Saturday</n_num> and <n_num odr="4" crr="Sundays">Sunday</n_num>. Figure 1: A sample of error-tagged spoken data 4. Procedure
In the present study, the frequencies of each error tag inserted in the spoken data were automatically calculated and employed for the data mining of learners’ error patterns. First, the distribution of frequencies of all types of errors was visualized in order to overview the errors found in the data. Then, using heatmap analysis with hierarchical clustering, the
learner groups at each proficiency level and error types were classified. Following these classifications, co-occurrence patterns of errors of lower- and upper-level learners were compared using association rule mining. Finally, error types that can be used to discriminate between learners at different proficiency levels were identified with a decision tree model. 5. Results and discussion 5.1. Frequency distribution of errors
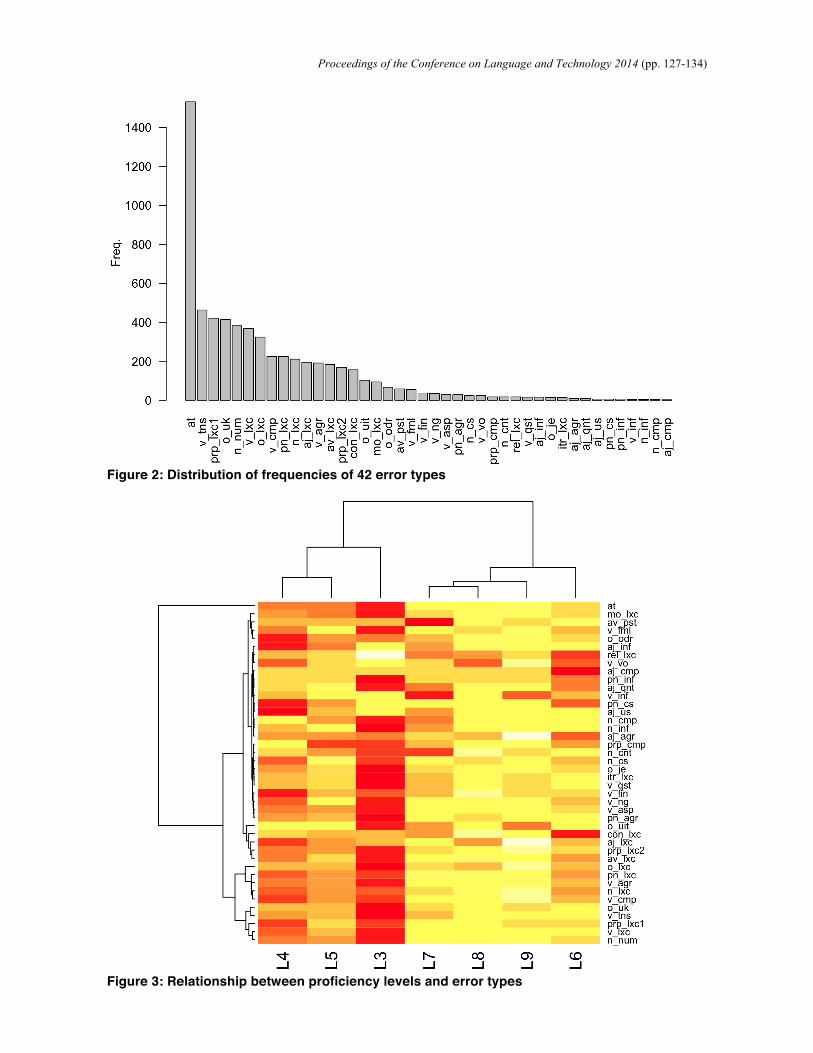
The present study began by examining which types of errors are frequently observed in the oral performance of Japanese EFL learners. Figure 2 presents the frequencies of all error types found in the corpus. As can be seen in this figure, the most common errors are article errors (at), followed by tense errors (v_tns), normal lexical preposition errors (prp_lxc1), unknown types of errors (o_uk), noun number errors (n_num), and lexical verb errors (v_lxc). 5.2. The relationship of proficiency levels and error types
The next step was to investigate the complex interrelationships among seven proficiency levels, those among 42 error types, and association patterns between proficiency levels and error types. In Figure 3, they are visualized as a heatmap with hierarchical clustering based on the complete linkage method on Euclidean distances. It consists of the result of the clustering of proficiency levels, the result of error types, and the heatmap generated from the frequency matrix of error types. In the heatmap, errors in cells dark in color represent more frequent errors at that proficiency level and errors in cells pale in color represent less frequent errors, as compared to at other levels. The diagram shows that most error types are the most frequent at level 3 and that their frequencies decrease as learners’ proficiency levels rise. Results of hierarchical clustering also show tree-like categorizations where small clusters of highly similar items are included within much larger clusters of less similar items. As is clear from the result of the clustering of proficiency levels, there is a substantial difference in the frequencies of errors between lower-level (levels 3, 4, and 5) and upper-level (levels 6, 7, 8, and 9) learners.
Proceedings of the Conference on Language and Technology 2014 (pp. 127-134)
Figure 2: Distribution of frequencies of 42 error types
Figure 3: Relationship between proficiency levels and error types
Proceedings of the Conference on Language and Technology 2014 (pp. 127-134)
5.3. The co-occurrence of errors
It is crucial to consider the difference in frequencies of error types between lower- and upper-level learners in more detail. As Figure 3 indicates, complex patterns of frequencies of errors underlie the differences of proficiency levels. Therefore, the co-occurrence patterns of errors deserve careful attention. Tables 2 and 3 show the top 10 co-occurrence patterns of errors made by lower- and upper-level learners respectively. The Apriori algorithm for association rule mining [8] was used for extracting co-occurrence patterns, and these patterns were ranked in descending order of their support scores. Since a support score is based on the co-occurring frequency of the left-hand-side and right-hand-side items, a pattern including high frequency items tends to be placed in a higher rank. Table 2: Co-occurrence patterns of errors occurred at lower-levels with support scores (top 10)
left-hand-side right-hand-side support 1 {v_lxc} => {at} 0.767 2 {at} => {v_lxc} 0.767 3 {v_tns} => {at} 0.767 4 {at} => {v_tns} 0.767 5 {n_num} => {at} 0.752 6 {at} => {n_num} 0.752 7 {prp_lxc1} => {at} 0.729 8 {n_num} => {v_lxc} 0.705 9 {v_lxc} => {n_num} 0.705
10 {v_lxc} => {v_tns} 0.705 Table 3: Co-occurrence patterns of errors occurred at upper-levels with support scores (top 10)
left-hand-side right-hand-side support 1 {prp_lxc1} => {at} 0.793 2 {at} => {prp_lxc1} 0.793 3 {v_tns} => {at} 0.747 4 {at} => {v_tns} 0.747 5 {o_lxc} => {at} 0.736 6 {at} => {o_lxc} 0.736 7 {n_num} => {at} 0.724 8 {v_tns} => {prp_lxc1} 0.713 9 {prp_lxc1} => {v_tns} 0.713
10 {n_num} => {prp_lxc1} 0.701
The top 10 co-occurrence patterns ranked in Table 2 and those in Table 3 are similar, but, interestingly enough, collocation errors (o_lxc) can be found in the latter.
Tables 4 and 5 present the top 10 co-occurrence patterns extracted from lower- and upper-level learners
respectively and sorted in descending order of their lift scores. Using lift scores instead of support scores can mitigate the effect of high frequency items on the ranking of patterns. Table 4: Co-occurrence patterns of errors occurred at lower-levels with lift scores (top 10)
left-hand-side right-hand-side lift 1 {pn_agr} => {v_cmp} 1.342 2 {v_asp} => {v_cmp} 1.275 3 {v_qst} => {prp_lxc1} 1.240 4 {av_pst} => {v_cmp} 1.222 5 {o_je} => {n_num} 1.205 6 {pn_agr} => {prp_lxc1} 1.175 7 {pn_agr} => {n_num} 1.142 8 {v_ng} => {n_num} 1.142 9 {v_ng} => {v_tns} 1.121
10 {v_fml} => {v_lxc} 1.119 Table 5: Co-occurrence patterns of errors occurred at upper-levels with lift scores (top 10)
left-hand-side right-hand-side lift 1 {v_ng} => {n_lxc} 1.719 2 {v_ng} => {v_cmp} 1.614 3 {o_uit} => {o_uk} 1.343 4 {v_ng} => {o_uk} 1.318 5 {o_uit} => {o_lxc} 1.226 6 {o_uit} => {v_lxc} 1.208 7 {v_fin} => {v_lxc} 1.184 8 {v_fin} => {n_num} 1.171 7 {v_vo} => {v_lxc} 1.168
10 {v_ng} => {o_lxc} 1.163
As Table 4 shows, lower-level learners make many verb-related errors (e.g., v_lxc, v_cmp) as well as noun number errors (n_num), pronoun number/sex disagreement errors (pn_agr), and normal lexical preposition errors (prp_lxc1). Furthermore, they produce Japanese English (o_je) in their oral performance. On the other hand, as compared to lower-level learners, upper-level learners make fewer simple grammatical errors, but produce some unknown error types (o_uk) and unintelligible utterances (o_uit).
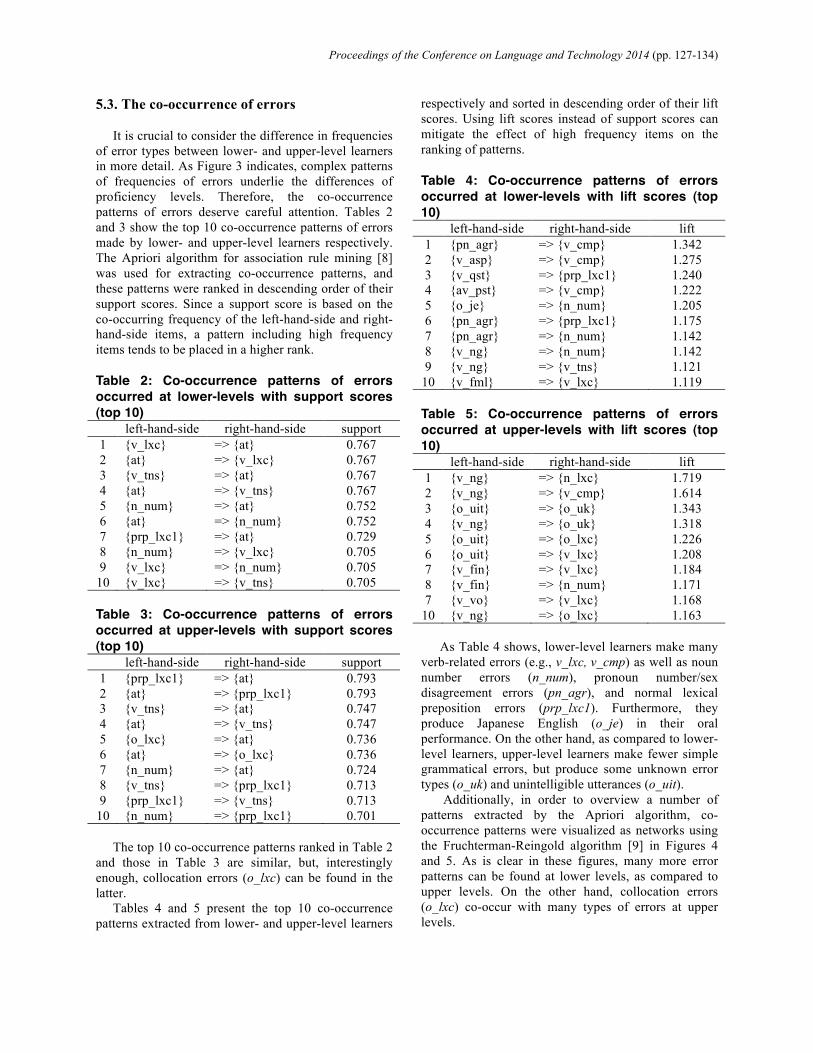
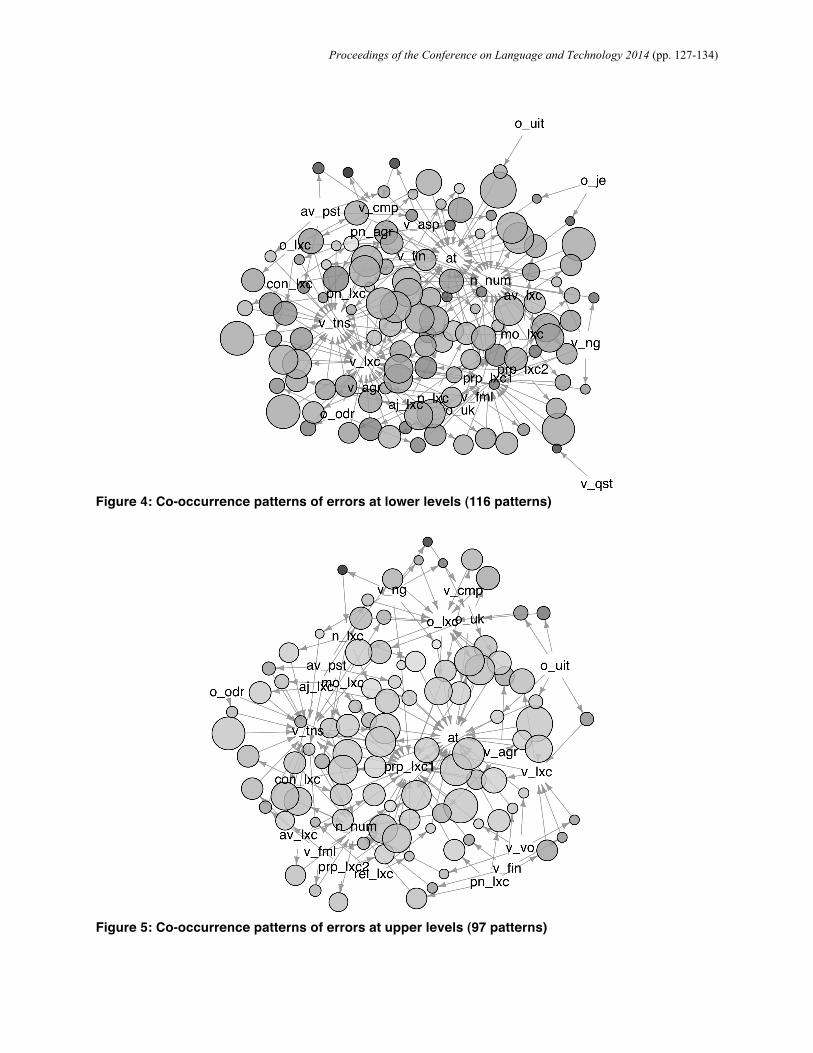
Additionally, in order to overview a number of patterns extracted by the Apriori algorithm, co-occurrence patterns were visualized as networks using the Fruchterman-Reingold algorithm [9] in Figures 4 and 5. As is clear in these figures, many more error patterns can be found at lower levels, as compared to upper levels. On the other hand, collocation errors (o_lxc) co-occur with many types of errors at upper levels.
Proceedings of the Conference on Language and Technology 2014 (pp. 127-134)
Figure 4: Co-occurrence patterns of errors at lower levels (116 patterns)
Figure 5: Co-occurrence patterns of errors at upper levels (97 patterns)
Proceedings of the Conference on Language and Technology 2014 (pp. 127-134)
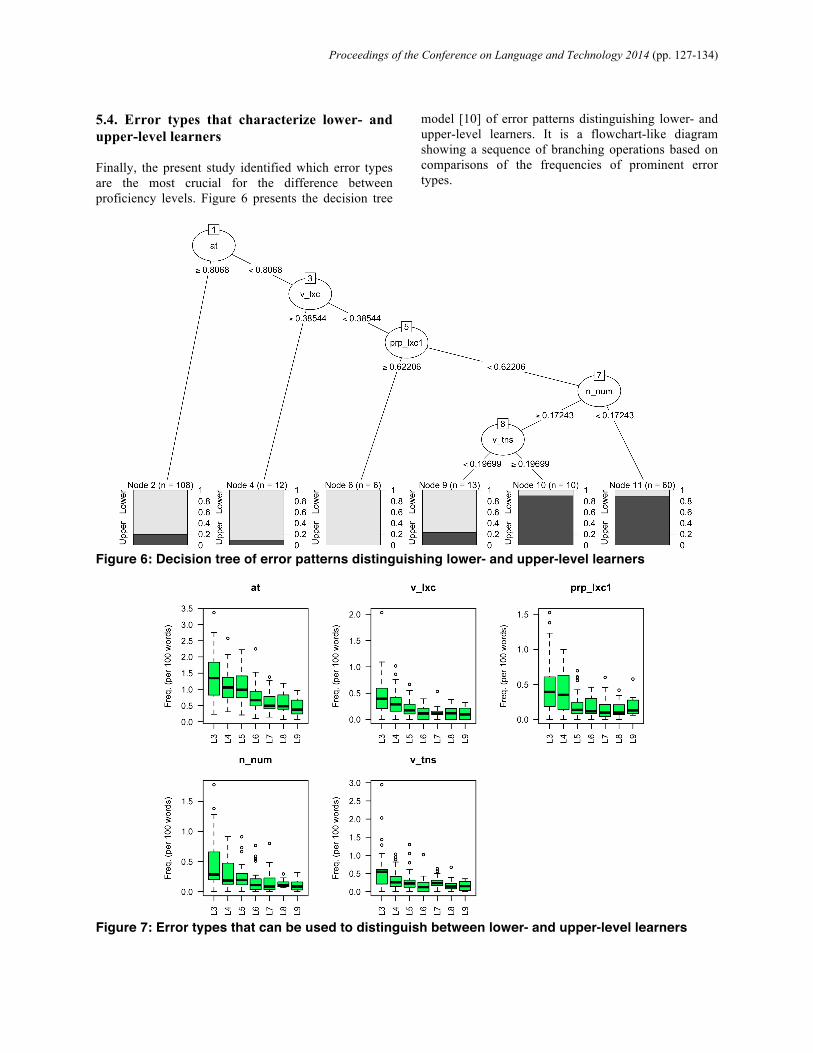
5.4. Error types that characterize lower- and upper-level learners Finally, the present study identified which error types are the most crucial for the difference between proficiency levels. Figure 6 presents the decision tree
model [10] of error patterns distinguishing lower- and upper-level learners. It is a flowchart-like diagram showing a sequence of branching operations based on comparisons of the frequencies of prominent error types.
Figure 6: Decision tree of error patterns distinguishing lower- and upper-level learners
Figure 7: Error types that can be used to distinguish between lower- and upper-level learners
Proceedings of the Conference on Language and Technology 2014 (pp. 127-134)
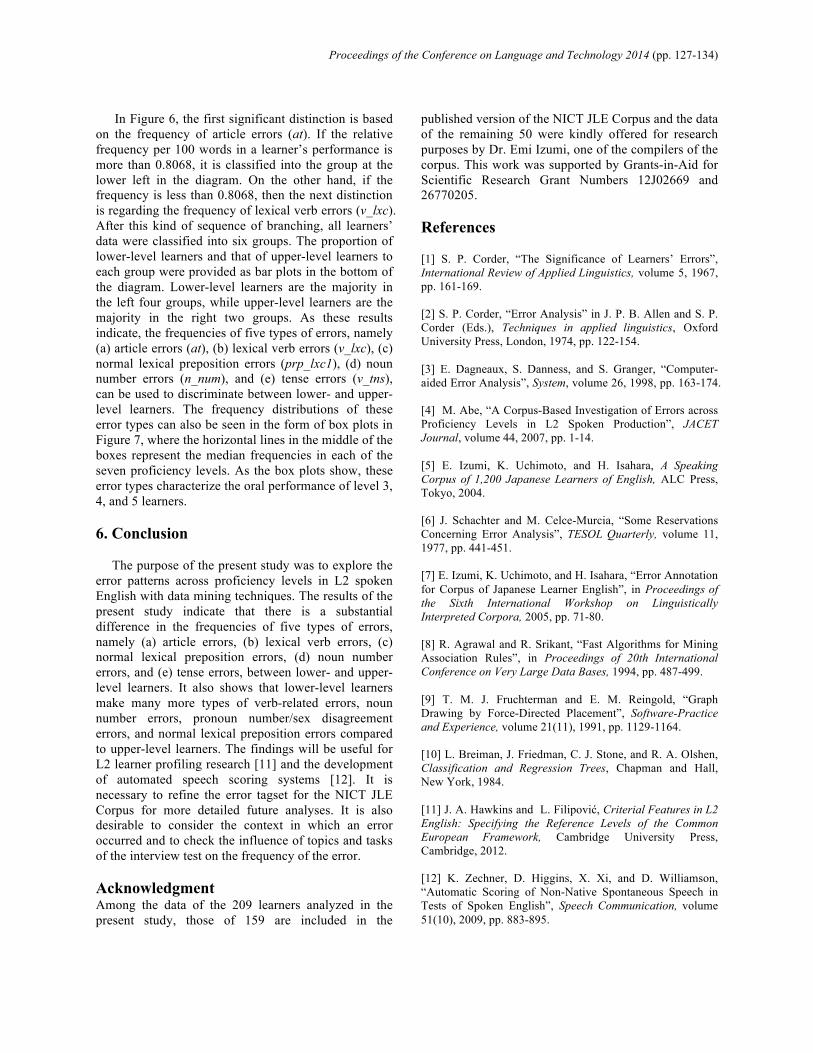
In Figure 6, the first significant distinction is based
on the frequency of article errors (at). If the relative frequency per 100 words in a learner’s performance is more than 0.8068, it is classified into the group at the lower left in the diagram. On the other hand, if the frequency is less than 0.8068, then the next distinction is regarding the frequency of lexical verb errors (v_lxc). After this kind of sequence of branching, all learners’ data were classified into six groups. The proportion of lower-level learners and that of upper-level learners to each group were provided as bar plots in the bottom of the diagram. Lower-level learners are the majority in the left four groups, while upper-level learners are the majority in the right two groups. As these results indicate, the frequencies of five types of errors, namely (a) article errors (at), (b) lexical verb errors (v_lxc), (c) normal lexical preposition errors (prp_lxc1), (d) noun number errors (n_num), and (e) tense errors (v_tns), can be used to discriminate between lower- and upper-level learners. The frequency distributions of these error types can also be seen in the form of box plots in Figure 7, where the horizontal lines in the middle of the boxes represent the median frequencies in each of the seven proficiency levels. As the box plots show, these error types characterize the oral performance of level 3, 4, and 5 learners. 6. Conclusion
The purpose of the present study was to explore the error patterns across proficiency levels in L2 spoken English with data mining techniques. The results of the present study indicate that there is a substantial difference in the frequencies of five types of errors, namely (a) article errors, (b) lexical verb errors, (c) normal lexical preposition errors, (d) noun number errors, and (e) tense errors, between lower- and upper-level learners. It also shows that lower-level learners make many more types of verb-related errors, noun number errors, pronoun number/sex disagreement errors, and normal lexical preposition errors compared to upper-level learners. The findings will be useful for L2 learner profiling research [11] and the development of automated speech scoring systems [12]. It is necessary to refine the error tagset for the NICT JLE Corpus for more detailed future analyses. It is also desirable to consider the context in which an error occurred and to check the influence of topics and tasks of the interview test on the frequency of the error. Acknowledgment Among the data of the 209 learners analyzed in the present study, those of 159 are included in the
published version of the NICT JLE Corpus and the data of the remaining 50 were kindly offered for research purposes by Dr. Emi Izumi, one of the compilers of the corpus. This work was supported by Grants-in-Aid for Scientific Research Grant Numbers 12J02669 and 26770205. References [1] S. P. Corder, “The Significance of Learners’ Errors”, International Review of Applied Linguistics, volume 5, 1967, pp. 161-169. [2] S. P. Corder, “Error Analysis” in J. P. B. Allen and S. P. Corder (Eds.), Techniques in applied linguistics, Oxford University Press, London, 1974, pp. 122-154. [3] E. Dagneaux, S. Danness, and S. Granger, “Computer-aided Error Analysis”, System, volume 26, 1998, pp. 163-174. [4] M. Abe, “A Corpus-Based Investigation of Errors across Proficiency Levels in L2 Spoken Production”, JACET Journal, volume 44, 2007, pp. 1-14. [5] E. Izumi, K. Uchimoto, and H. Isahara, A Speaking Corpus of 1,200 Japanese Learners of English, ALC Press, Tokyo, 2004. [6] J. Schachter and M. Celce-Murcia, “Some Reservations Concerning Error Analysis”, TESOL Quarterly, volume 11, 1977, pp. 441-451. [7] E. Izumi, K. Uchimoto, and H. Isahara, “Error Annotation for Corpus of Japanese Learner English”, in Proceedings of the Sixth International Workshop on Linguistically Interpreted Corpora, 2005, pp. 71-80. [8] R. Agrawal and R. Srikant, “Fast Algorithms for Mining Association Rules”, in Proceedings of 20th International Conference on Very Large Data Bases, 1994, pp. 487-499. [9] T. M. J. Fruchterman and E. M. Reingold, “Graph Drawing by Force-Directed Placement”, Software-Practice and Experience, volume 21(11), 1991, pp. 1129-1164. [10] L. Breiman, J. Friedman, C. J. Stone, and R. A. Olshen, Classification and Regression Trees, Chapman and Hall, New York, 1984. [11] J. A. Hawkins and L. Filipović, Criterial Features in L2 English: Specifying the Reference Levels of the Common European Framework, Cambridge University Press, Cambridge, 2012. [12] K. Zechner, D. Higgins, X. Xi, and D. Williamson, “Automatic Scoring of Non-Native Spontaneous Speech in Tests of Spoken English”, Speech Communication, volume 51(10), 2009, pp. 883-895.
Proceedings of the Conference on Language and Technology 2014 (pp. 127-134)
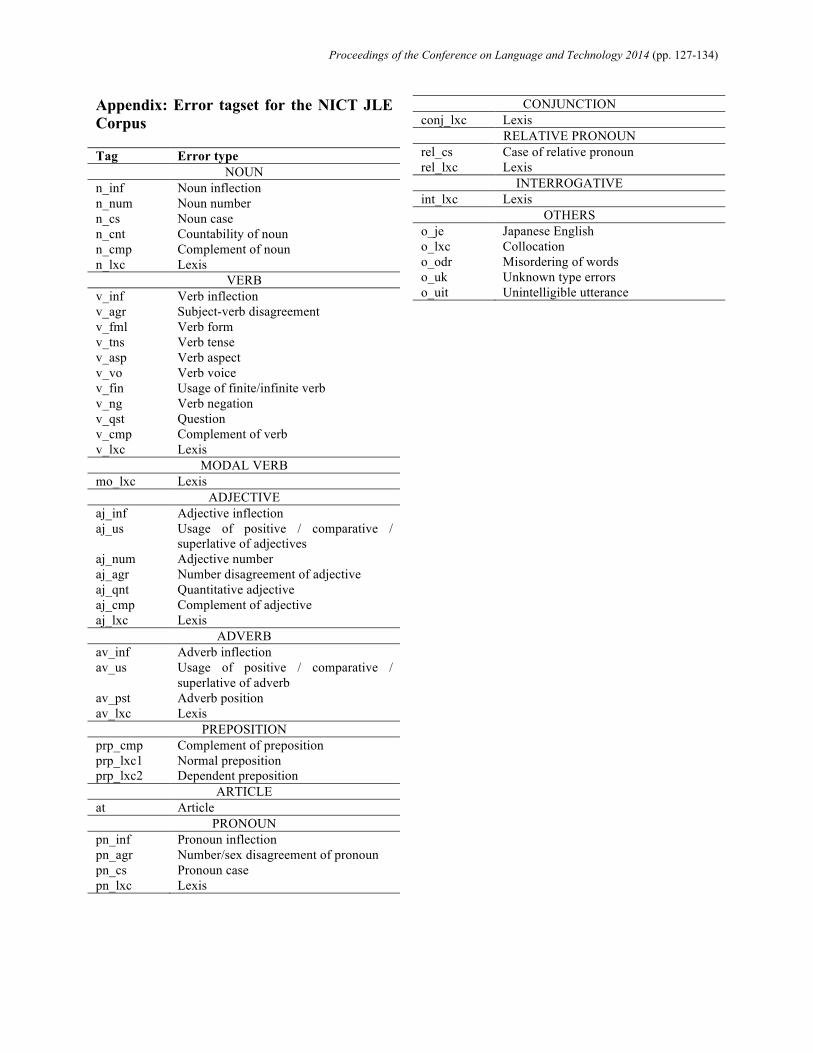
Appendix: Error tagset for the NICT JLE Corpus Tag Error type
NOUN n_inf Noun inflection n_num Noun number n_cs Noun case n_cnt Countability of noun n_cmp Complement of noun n_lxc Lexis
VERB v_inf Verb inflection v_agr Subject-verb disagreement v_fml Verb form v_tns Verb tense v_asp Verb aspect v_vo Verb voice v_fin Usage of finite/infinite verb v_ng Verb negation v_qst Question v_cmp Complement of verb v_lxc Lexis
MODAL VERB mo_lxc Lexis
ADJECTIVE aj_inf Adjective inflection aj_us Usage of positive / comparative /
superlative of adjectives aj_num Adjective number aj_agr Number disagreement of adjective aj_qnt Quantitative adjective aj_cmp Complement of adjective aj_lxc Lexis
ADVERB av_inf Adverb inflection av_us Usage of positive / comparative /
superlative of adverb av_pst Adverb position av_lxc Lexis
PREPOSITION prp_cmp Complement of preposition prp_lxc1 Normal preposition prp_lxc2 Dependent preposition
ARTICLE at Article
PRONOUN pn_inf Pronoun inflection pn_agr Number/sex disagreement of pronoun pn_cs Pronoun case pn_lxc Lexis
CONJUNCTION conj_lxc Lexis
RELATIVE PRONOUN rel_cs Case of relative pronoun rel_lxc Lexis
INTERROGATIVE int_lxc Lexis
OTHERS o_je Japanese English o_lxc Collocation o_odr Misordering of words o_uk Unknown type errors o_uit Unintelligible utterance