COMPUTER-AIDED DIAGNOSIS OF THE PAROXYSMAL ATRIAL FIBRILLATION: A FUZZY-EVOLUTIONARY APPROACH
19
COMPUTER-AIDED DIAGNOSIS OF THE PAROXYSMAL ATRIAL FIBRILLATION: A FUZZY-EVOLUTIONARY APPROACH Francisco de Toro 1 , Javier Aroba 2 , and Eduardo Ros 3 1 Department of Signal Theory, Telematics and Communications, CITIC, University of Granada, Granada, Spain 2 Department of Information Technologies, E.T.S.I., University of Huelva, Palos de la Frontera, Spain 3 Department of Computer Architecture and Technology, CITIC, University of Granada, Granada, Spain & This paper presents an integrated fuzzy-evolutionary methodology to address computer-aided diagnosis in medical applications by using features extracted from biosignal processing. In the pro- posed methodology, a deterministic crowding genetic optimizer designed to provide high-diversity solutions is used for weighted feature selection, and the diagnostic decision is made by a binary k-nearest neighbor classifier. Weight vector solutions resulting from the optimization stage are pro- cessed by a fuzzy rules generator to retrieve a fuzzy model giving friendly information to the medical specialist about the role of the different features in the diagnosis. This allows the design of efficient diagnosis protocols. The overall diagnostic methodology is applied to Paroxysmal Atrial Fibrillation detection based on analysis of nonfibrillation ECGs, obtaining a fuzzy model consistent with previous work in this field. INTRODUCTION We can define computer-aided diagnosis (CAD) as the diagnosis a physician makes using output from a computerized analysis of medical data. Multiple features are used to classify an observation as normal or abnormal. A radiologist, for example, may note the size, shape, and margin sharpness of a potential lesion in a mammogram and somehow use the This work has been supported by the Spanish Ministry of Science and Science and Technology under grants TIN2007-67843-C06-03 and TIN2010-20057-C03-02, and the EU DRIVSCO. Address correspondence to Francisco de Toro, Department of Signal Theory, Telematics and Communications, University of Granada, C=Periodista Daniel Saucedo Aranda, s=n, 18071, Granada, Spain. E-mail: [email protected] Applied Artificial Intelligence, 25:590–608, 2011 Copyright # 2011 Taylor & Francis Group, LLC ISSN: 0883-9514 print=1087-6545 online DOI: 10.1080/08839514.2011.595281
-
Upload
independent -
Category
Documents
-
view
0 -
download
0
Transcript of COMPUTER-AIDED DIAGNOSIS OF THE PAROXYSMAL ATRIAL FIBRILLATION: A FUZZY-EVOLUTIONARY APPROACH
COMPUTER-AIDED DIAGNOSIS OF THE PAROXYSMAL ATRIALFIBRILLATION: A FUZZY-EVOLUTIONARY APPROACH
Francisco de Toro1, Javier Aroba2, and Eduardo Ros31Department of Signal Theory, Telematics and Communications, CITIC,University of Granada, Granada, Spain2Department of Information Technologies, E.T.S.I., University of Huelva,Palos de la Frontera, Spain3Department of Computer Architecture and Technology, CITIC,University of Granada, Granada, Spain
& This paper presents an integrated fuzzy-evolutionary methodology to address computer-aideddiagnosis in medical applications by using features extracted from biosignal processing. In the pro-posed methodology, a deterministic crowding genetic optimizer designed to provide high-diversitysolutions is used for weighted feature selection, and the diagnostic decision is made by a binaryk-nearest neighbor classifier. Weight vector solutions resulting from the optimization stage are pro-cessed by a fuzzy rules generator to retrieve a fuzzy model giving friendly information to the medicalspecialist about the role of the different features in the diagnosis. This allows the design of efficientdiagnosis protocols. The overall diagnostic methodology is applied to Paroxysmal Atrial Fibrillationdetection based on analysis of nonfibrillation ECGs, obtaining a fuzzy model consistent withprevious work in this field.
INTRODUCTION
We can define computer-aided diagnosis (CAD) as the diagnosis aphysician makes using output from a computerized analysis of medicaldata. Multiple features are used to classify an observation as normal orabnormal. A radiologist, for example, may note the size, shape, and marginsharpness of a potential lesion in a mammogram and somehow use the
This work has been supported by the Spanish Ministry of Science and Science and Technologyunder grants TIN2007-67843-C06-03 and TIN2010-20057-C03-02, and the EU DRIVSCO.
Address correspondence to Francisco de Toro, Department of Signal Theory, Telematics andCommunications, University of Granada, C=Periodista Daniel Saucedo Aranda, s=n, 18071, Granada,Spain. E-mail: [email protected]
Applied Artificial Intelligence, 25:590–608, 2011Copyright # 2011 Taylor & Francis Group, LLCISSN: 0883-9514 print=1087-6545 onlineDOI: 10.1080/08839514.2011.595281

combined information of the different features to determine whether acancer is present.
The goal in training a diagnostic classifier is to employ a limited datasetincluding normal (without disease) and abnormal (with disease) cases todetermine the classifier parameter values so that it correctly classifies otherdatasets of unknown diagnosis. The training of a classifier can be viewed asan optimization problem, where the quantity to be maximized is the per-formance of the classification on an independent dataset. Binary classifiers(Devroye, Gyorfi, and Lugosi 1996) separate two classes of observations andassign new observations to one of the two classes: the normal—no diseasepresent—and abnormal—indicative of disease—class. As mentioned, cer-tain characteristics of the observations, called features, are used in makingthe classification decision. The process of choosing and combining the fea-tures used in a diagnostic classifier takes place in the so-called feature selec-tion stage (Cantu-Paz 2002). Evolutionary Algorithms (EA) (Eiben andSmith 2003) and, above all, one of its most-applied paradigms—Geneticalgorithms (Eiben and Smith 2003; Goldberg 1989), have been appliedsuccessfully for feature selection (Handels et al. 1999) and also for deter-mining the classifier parameters values in medical diagnostic applications:for example, weights of an artificial neural network (Fogel, Wasson III, andBroughton 1995) or thresholds in rule-based detection schemes (Anastasio,Kupinski, and Nishikawa 1998).
The ability to find multiple solutions in a single iteration gives EAs aprivileged position to address multimodal optimization problems (Li et al.2002). There are two good, practical reasons, which could prompt thelocation of multiple optima in such types of problems. First, by encouragingthe location of multiple optima, the chances of situating the global optimumare increased. Second, identifying a diverse set of high-quality solutions(global and local optima) will provide an insight into the nature of thesearch space, suggesting alternative solutions to the decision maker and=or enabling the modeling of the search space. This second possibility hasbeen poorly exploited so far, as stated in Li et al. (2002) and de Toroet al. (2006).
In this paper, we propose a computer-aided methodology for medicaldiagnosis based on a binary k-nearest neighbor classifier, which uses prede-fined extracted weighted features from a biosignal for making the diagnos-tic decision. A genetic algorithm is used for weighted feature selection. ADeterministic Crowding (Mahfoud 1992; Mahfoud 1995) technique isembodied in the design of the genetic algorithm in order to improve thechances of obtaining diversified solutions from this natural multimodaloptimization problem, encouraging the extraction of knowledge fromthe design space (Li et al. 2002). Here, a solution to the problem is a setof weighted features that provides good performance classification (so
Computer-Aided Diagnosis of the Paroxysmal Atrial Fibrillation 591

high-quality local optima can also be considered for this purpose). Then,solutions from the optimization stage are processed by a fuzzy clusteringalgorithm (Aroba 2003). This algorithm generates a model based on fuzzyrules providing qualitative knowledge about the performance of the classi-fier as a function of the degree of the participation of each of the featuresin the classification process. This model can be of use in two ways: (1) toextract some conclusions about which combinations of features lead togood performance classification; (2) to predict which performance classi-fication can be obtained by using a given subset of features available at a spe-cific medical center. The proposed methodology is applied to ParoxysmalAtrial Fibrillation (PAF) detection, the heart arrhythmia that more fre-quently causes cerebrovascular accidents (Petersen and Godfredsen 1986).The paper is organized as follows: the section titled Automatic PAF Diagnosissummarizes our previous work concerning the automatic diagnosis of thePAF by using nonfibrillating ECGs. Section Fuzzy–Evolutionary Method-ology for PAF Diagnosis describes the diagnostic methodology proposedin this paper. In Web-Based Implementation, we suggest a three-profile col-laborative, web-based implementation of our methodology. In the sectiontitled Results, the proposed methodology is applied to a PAF diagnosticapplication and the obtained fuzzy model is discussed. We finalize this workwith a summary of the conclusions drawn from our investigation.
MATERIALS AND METHODS
Following, we review some of our previous works in the field ofParoxysmal Atrial Fibrillation Computer-Aided Diagnosis.
Automatic PAF Diagnosis
In Ros et al. (2004 and 2004b), the diagnosis of the PAF by using ak-nearest neighbor (KNN) algorithm to make the classification decision(patient is healthy or ill) was first addressed by some of those authors.The features used for the classifier were selected from an initial group offeatures extracted from ECGs noncontaining explicit fibrillation episodesso that a preventive diagnosis is addressed. A detailed explanation of theextracted features is given in Ros et al. (2004b). In Ros et al. (2004), thefeature selection process is performed by using a forward stepwise searchalgorithm (FSS). One method of FSS begins by selecting the single bestperforming feature as a seed. The algorithm then steps through eachsubsequent feature, adding it to the subset if it improves the classificationaccuracy, and discarding it otherwise. Each feature has only one opport-unity to survive, which limits the possible combinations. In addition to this,
592 F. de Toro et al.
from the optimization process performed by the FSS algorithm, only onesolution is obtained, so the medical specialist is restricted to using onlyone subset of features to make the classification decision; furthermore,the FSS performs a one-track process that easily discards a feature entirelyafter a single consideration of its usefulness.
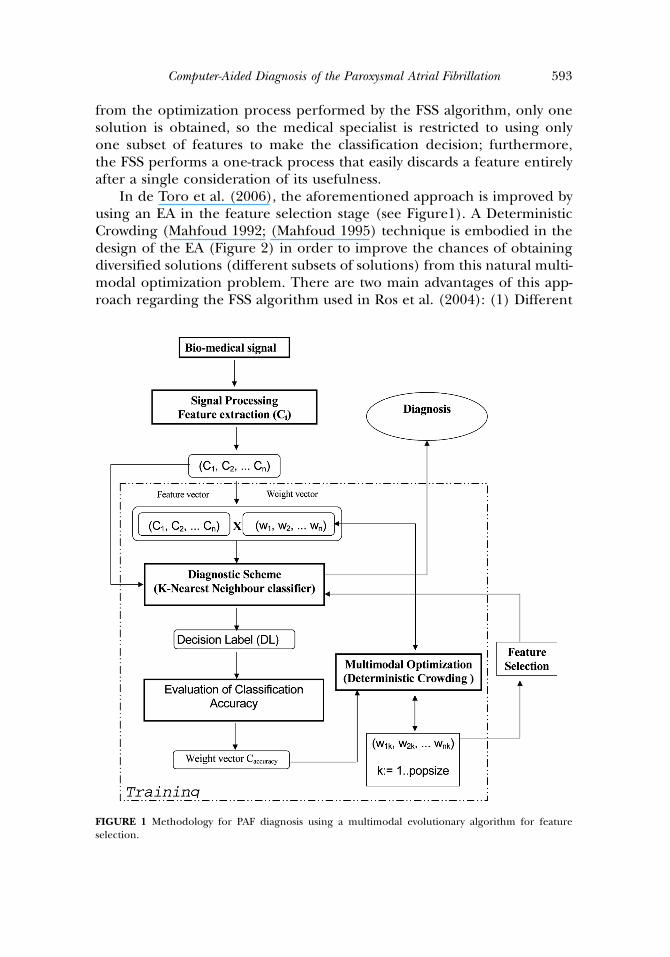
In de Toro et al. (2006), the aforementioned approach is improved byusing an EA in the feature selection stage (see Figure1). A DeterministicCrowding (Mahfoud 1992; (Mahfoud 1995) technique is embodied in thedesign of the EA (Figure 2) in order to improve the chances of obtainingdiversified solutions (different subsets of solutions) from this natural multi-modal optimization problem. There are two main advantages of this app-roach regarding the FSS algorithm used in Ros et al. (2004): (1) Different
FIGURE 1 Methodology for PAF diagnosis using a multimodal evolutionary algorithm for featureselection.
Computer-Aided Diagnosis of the Paroxysmal Atrial Fibrillation 593

search paths are explored concurrently, and a feature is not discarded aftera single consideration of its usefulness. That way, the chances of beingtrapped in local optima are lowered; (2) after the optimization process, dif-ferent subsets of features that provided a good performance classificationare obtained, so the specialist can use those features that are available ata specific medical center or can use those that are more robust to the inter-fering action of other heart diseases. This methodology (Figure 1) (de Toroet al. 2006) involves a first stage of the general parameter definition (Roset al. 2004b), followed by the extraction of a set of characteristics (featuresvector), which are used by the diagnostic scheme (KNN classifier) to obtainthe Decision Label (normal=abnormal case). The characteristics are relatedto the physical properties of the biomedical signal. Thus, the diagnosticdecision is a label obtained as a function of certain input items or charac-teristics Ci. The diagnostic scheme is applied to the input items, after whichthe diagnosis (DL) is obtained for each subject. This diagnostic method-ology is modular so that different researchers are able to easily add (orremove) new features to the vector. After this analysis, the basic feature vectorcontaining all defined characteristics is multiplied by a weight vector for fea-ture selection. Different weight vectors (solutions) are evaluated during theoptimization process. Due to the fact that EAs work with a population ofcandidate solutions, different choices of weight vectors can be evaluated
FIGURE 2 Evolutionary Algorithm based on deterministic crowding used for training the classifier.
594 F. de Toro et al.
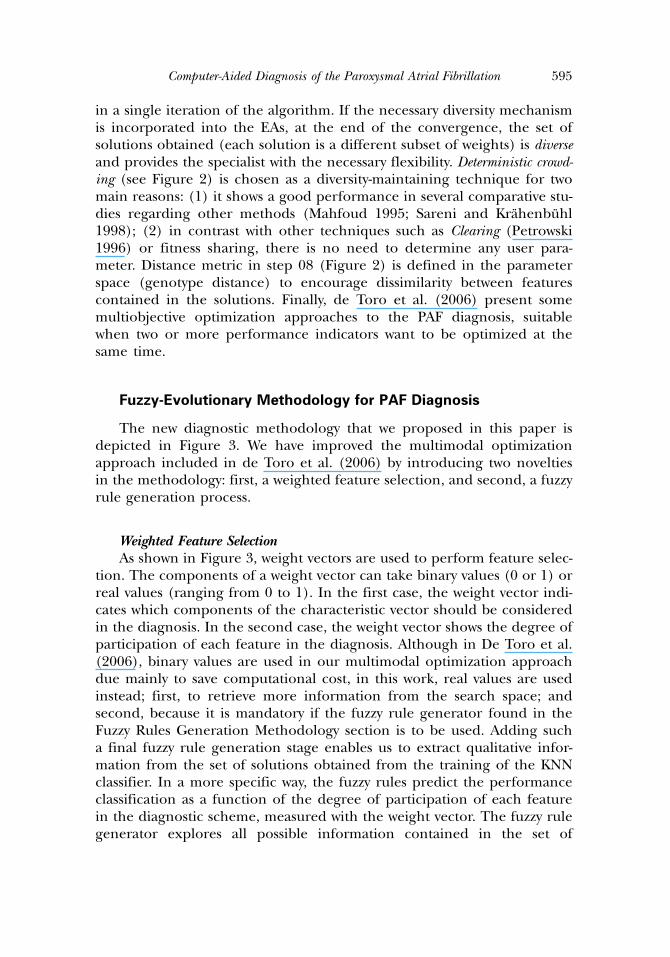
in a single iteration of the algorithm. If the necessary diversity mechanismis incorporated into the EAs, at the end of the convergence, the set ofsolutions obtained (each solution is a different subset of weights) is diverseand provides the specialist with the necessary flexibility. Deterministic crowd-ing (see Figure 2) is chosen as a diversity-maintaining technique for twomain reasons: (1) it shows a good performance in several comparative stu-dies regarding other methods (Mahfoud 1995; Sareni and Krahenbuhl1998); (2) in contrast with other techniques such as Clearing (Petrowski1996) or fitness sharing, there is no need to determine any user para-meter. Distance metric in step 08 (Figure 2) is defined in the parameterspace (genotype distance) to encourage dissimilarity between featurescontained in the solutions. Finally, de Toro et al. (2006) present somemultiobjective optimization approaches to the PAF diagnosis, suitablewhen two or more performance indicators want to be optimized at thesame time.
Fuzzy-Evolutionary Methodology for PAF Diagnosis
The new diagnostic methodology that we proposed in this paper isdepicted in Figure 3. We have improved the multimodal optimizationapproach included in de Toro et al. (2006) by introducing two noveltiesin the methodology: first, a weighted feature selection, and second, a fuzzyrule generation process.
Weighted Feature SelectionAs shown in Figure 3, weight vectors are used to perform feature selec-
tion. The components of a weight vector can take binary values (0 or 1) orreal values (ranging from 0 to 1). In the first case, the weight vector indi-cates which components of the characteristic vector should be consideredin the diagnosis. In the second case, the weight vector shows the degree ofparticipation of each feature in the diagnosis. Although in De Toro et al.(2006), binary values are used in our multimodal optimization approachdue mainly to save computational cost, in this work, real values are usedinstead; first, to retrieve more information from the search space; andsecond, because it is mandatory if the fuzzy rule generator found in theFuzzy Rules Generation Methodology section is to be used. Adding sucha final fuzzy rule generation stage enables us to extract qualitative infor-mation from the set of solutions obtained from the training of the KNNclassifier. In a more specific way, the fuzzy rules predict the performanceclassification as a function of the degree of participation of each featurein the diagnostic scheme, measured with the weight vector. The fuzzy rulegenerator explores all possible information contained in the set of
Computer-Aided Diagnosis of the Paroxysmal Atrial Fibrillation 595

solutions obtained from the training of the classifier. This information canbe used to determine which features are more suitable in order to get agood performance classification. These rules could also be used to predictthe performance classification that can be obtained by using the featuresavailable at a specific medical center. Finally, the information found byPreFuRGe (Aroba 2003) can be used to accelerate the optimization ofthe classifier by providing a good guess for the initial population of theEA (see Figure 3). In what follows we review the fuzzy rules generationprocess used in this methodology.
Fuzzy Rules Generation MethodologyFuzzy logic is not new; it was born in 1965, and its creator was Professor
Lofti Zadeh at the University of California, Berkeley (Zadeh 1965). Sincethen, a great number of works have been carried out, from a theoretical
FIGURE 3 Methodology for the Paroxysmal Atrial Fibrillation Diagnosis by using an integrated Fuzzy–evolutionary approach.
596 F. de Toro et al.
point of view, as practical applications. Fuzzy logic works very closely toreasoning rules in the approximate and intuitive form of thinking ofhuman beings. The main characteristic of the fuzzy logic is that it allowsus to define values without specifying a precise value, which is not possiblewith the classic logic on which the computer sciences’ development hasbeen based up to now. In classic logic, membership to a class or set isbinary; that is, belonged to or not belonged to; therefore only two precisevalues (0 and 1, yes or no) are required. Therefore, the fuzzy sets are a truegeneralization of conventional sets. The use of fuzzy sets defined by mem-bership functions in logical expressions is called ‘‘fuzzy logic.’’
On other hand, clustering (Raymond, Ng, and Han 1994) involves thetask of dividing data points into homogeneous classes or clusters so thatitems in the same class are as similar as possible and items in differentclasses are as dissimilar as possible. Clustering can also be thought of as aform of data compression, where a large number of samples are convertedinto a small number of representative prototypes or clusters. Depending onthe data and the application, different types of similarity measures may beused to identify classes, where the similarity measure controls how the clus-ters are formed. Some examples of values that can be used as similaritymeasures include distance, connectivity, and intensity (Raymond, Ng, andHan 1994; Zhang and Couloigner 2005). In nonfuzzy or hard clustering,data is divided into crisp clusters, where each data point belongs to exactlyone cluster. In fuzzy clustering, the data points can belong to more thanone cluster, and associated with each of the points are membership gradesthat indicate the degree to which the data points belong to the differentclusters (Keller and Klawonn 2000; Sato, Sato, and Jain 1997).
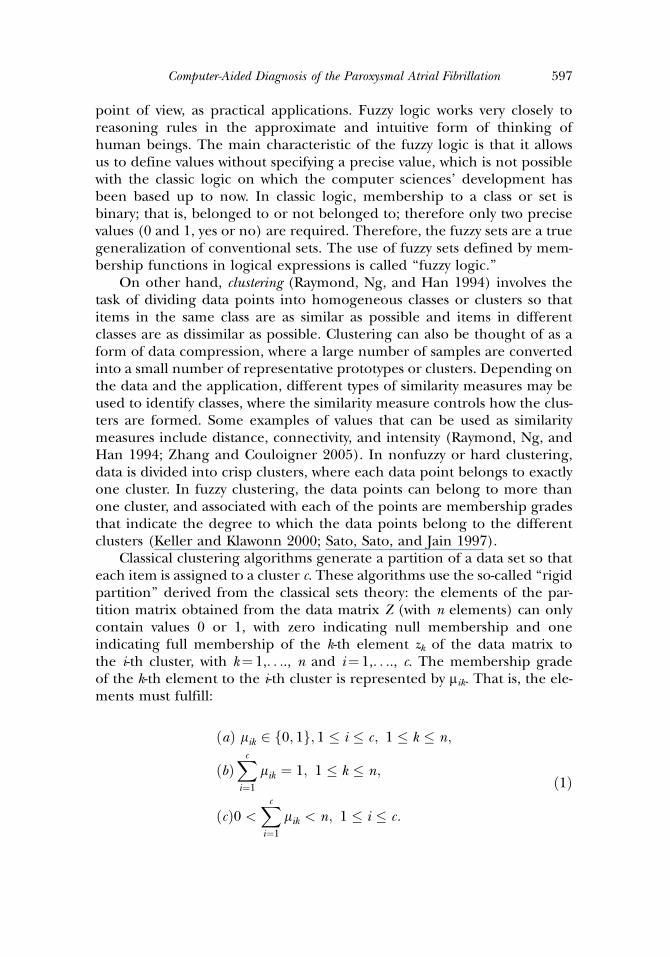
Classical clustering algorithms generate a partition of a data set so thateach item is assigned to a cluster c. These algorithms use the so-called ‘‘rigidpartition’’ derived from the classical sets theory: the elements of the par-tition matrix obtained from the data matrix Z (with n elements) can onlycontain values 0 or 1, with zero indicating null membership and oneindicating full membership of the k-th element zk of the data matrix tothe i-th cluster, with k¼ 1,. . .., n and i¼ 1,. . .., c. The membership gradeof the k-th element to the i-th cluster is represented by mik. That is, the ele-ments must fulfill:
ðaÞ lik 2 f0; 1g; 1 � i � c; 1 � k � n;
ðbÞXc
i¼1
lik ¼ 1; 1 � k � n;
ðcÞ0 <Xc
i¼1
lik < n; 1 � i � c:
ð1Þ
Computer-Aided Diagnosis of the Paroxysmal Atrial Fibrillation 597
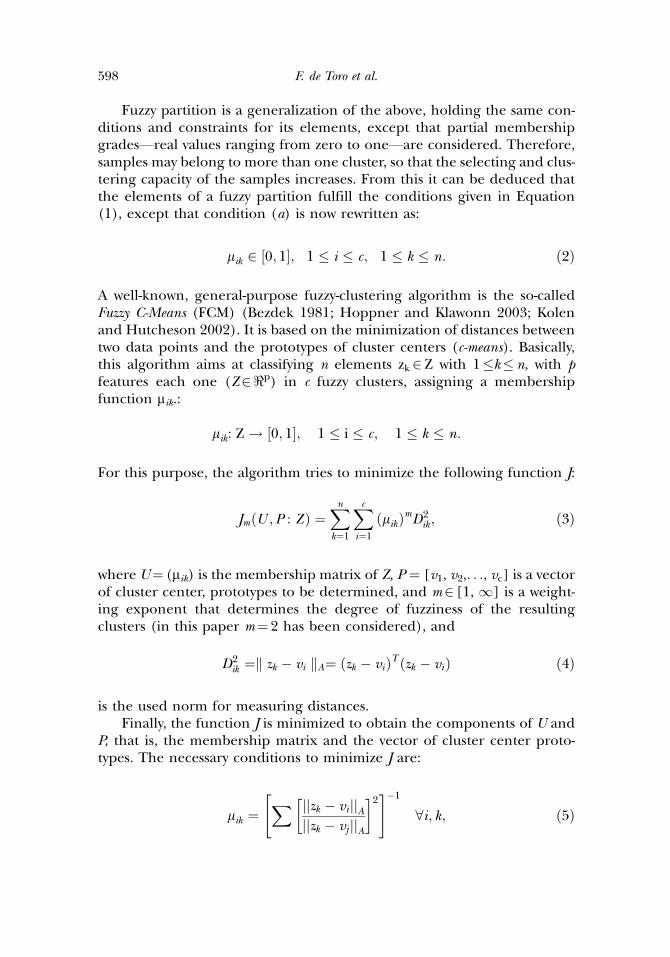
Fuzzy partition is a generalization of the above, holding the same con-ditions and constraints for its elements, except that partial membershipgrades—real values ranging from zero to one—are considered. Therefore,samples may belong to more than one cluster, so that the selecting and clus-tering capacity of the samples increases. From this it can be deduced thatthe elements of a fuzzy partition fulfill the conditions given in Equation(1), except that condition (a) is now rewritten as:
lik 2 0; 1½ �; 1 � i � c; 1 � k � n: ð2Þ
A well-known, general-purpose fuzzy-clustering algorithm is the so-calledFuzzy C-Means (FCM) (Bezdek 1981; Hoppner and Klawonn 2003; Kolenand Hutcheson 2002). It is based on the minimization of distances betweentwo data points and the prototypes of cluster centers (c-means). Basically,this algorithm aims at classifying n elements zk2Z with 1�k�n, with pfeatures each one (Z2<p) in c fuzzy clusters, assigning a membershipfunction mik.:
lik: Z ! ½0; 1�; 1 � i � c; 1 � k � n:
For this purpose, the algorithm tries to minimize the following function J:
JmðU ;P : Z Þ ¼Xnk¼1
Xc
i¼1
ðlikÞmD2ik ; ð3Þ
where U¼ (mik) is the membership matrix of Z, P ¼ [v1, v2,. . ., vc] is a vectorof cluster center, prototypes to be determined, and m2 [1, 1] is a weight-ing exponent that determines the degree of fuzziness of the resultingclusters (in this paper m¼ 2 has been considered), and
D2ik ¼k zk � vi kA¼ ðzk � viÞT ðzk � viÞ ð4Þ
is the used norm for measuring distances.Finally, the function J is minimized to obtain the components of U and
P, that is, the membership matrix and the vector of cluster center proto-types. The necessary conditions to minimize J are:
lik ¼X jjzk � vi jjA
jjzk � vj jjA
� �2" #�1
8i; k; ð5Þ
598 F. de Toro et al.

vi ¼Pn
k¼1 ðlikÞ2zkPn
k¼1 ðlikÞ2 8i: ð6Þ
Therefore, the objective of this phase is to classify the data matrix Z into cfuzzy clusters. To do so, a fuzzy-clustering algorithm based on the proce-dures described in (Sugeno and Yasukawa 1993) and (Aroba 2003) isapplied to ultimately build a fuzzy model based on IF-THEN fuzzyrules Ri:
Ri : IF xi 2 Ai THEN y 2 Bi ð7Þ
Where X¼[x1, x2,. . ., xn] 2 <n are input variables, A¼[A1, A2,. . ., An] are nfuzzy sets, y 2 < is an output variable, and B¼[B1, B2,. . ., Bm] are m fuzzysets.
It is important to note that the graphic output provided by PreFuRGe(Aroba 2003) enables an easy interpretation of the fuzzy rules in a naturallanguage. As an example, Figure 4 shows two rules generated by PreFuRGe.In the rule of Figure 4(a), the fuzzy set assigned to each parameter is repre-sented by a polyhedron. The parameter values are represented on the x axisof each fuzzy set, and the value of membership to a cluster on the y axis.This fuzzy rule would be interpreted as follows:
In the fuzzy rule of Figure 4(b), a multiple projection is represented inthe input parameter A1. In this case, we observe how the parameter A1 cantake different types of values for a certain kind of output. This fuzzy rule
FIGURE 4 Examples of fuzzy rules generated by PreFuRGe.
Computer-Aided Diagnosis of the Paroxysmal Atrial Fibrillation 599

can be interpreted as follows:
Web-Based Implementation
The immense possibilities that the Internet provides for remote accessinformation and global connectivity have led to an increasing effort toapply the so-called new technologies in the field of health care as wellas in other areas. In this context, telemedicine is defined in (Bauerand Ringel 1999) as ‘‘the combined use of telecommunications and com-puter technologies to improve the efficiency and effectiveness of health-care services by liberating caregivers from traditional constraints ofplace and time and by empowering consumers to make informed choicesin a competitive marketplace.’’ Finally, new technologies enable the easysharing of resources and databases for medical investigation purposes.All these reasons justify the increasing effort to explore the benefits thatthe Internet can bring to both the medical specialist and health careresearchers.
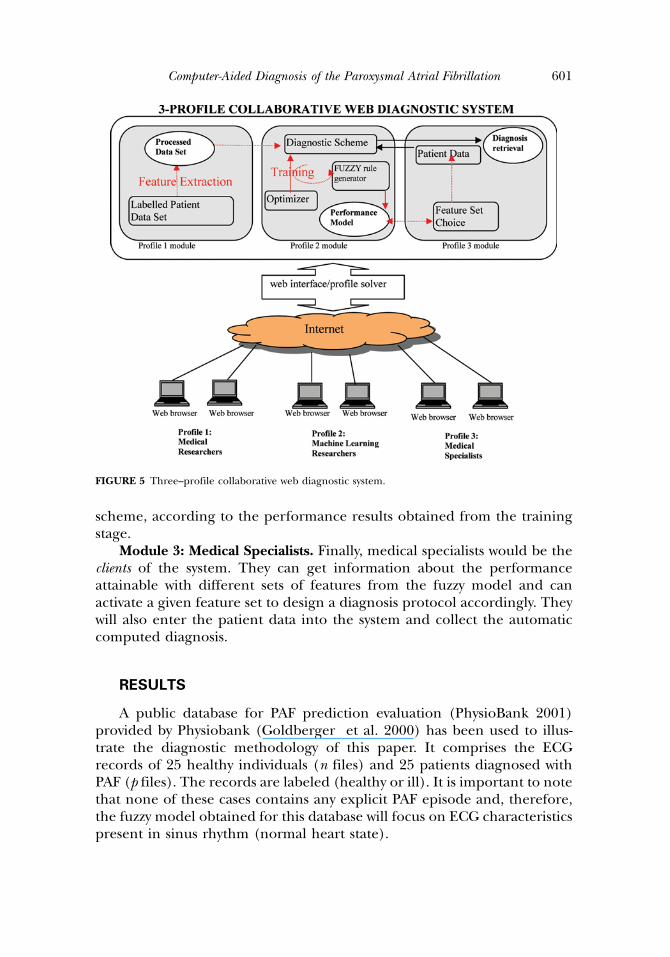
In this sense, we believe that a web-based implementation of the meth-odology presented in section Fuzzy–Evolutionary Methodology for PAFDiagnosis, remotely accessible through the Internet, is very beneficial. Finalusers, such as medical specialists, can extract the features from the patientbiosignal data and can send the extracted features online toward the webdiagnostic applications, which would deliver the computed diagnosis withina relatively short response time. Furthermore, this centralized approach forthe implementation of the discussed methodology of this paper enables aneasy collaboration among different elements involved in the diagnostic pro-cess. In this sense, in Figure 5, we propose a three-profile collaborativeweb-diagnostic application based on the methodology presented in thispaper. The different users would log on to the web application providingan identification that would grant access to one of these three modules:
Module 1: Medical Researchers. This user profile would consist ofmedical researchers in charge of providing the labeled patient data(ECG) for optimizing the diagnostic scheme in the training stage. Theywould also be responsible for proposing—because of their expert knowl-edge—the features that should be extracted from the data and used inthe diagnostic scheme.
Module 2: Machine Learning Researchers. This user profile wouldcomprise those personnel in charge of improving and maintaining thefuzzy rules generator and choosing the optimizer and the diagnostic
600 F. de Toro et al.
scheme, according to the performance results obtained from the trainingstage.
Module 3: Medical Specialists. Finally, medical specialists would be theclients of the system. They can get information about the performanceattainable with different sets of features from the fuzzy model and canactivate a given feature set to design a diagnosis protocol accordingly. Theywill also enter the patient data into the system and collect the automaticcomputed diagnosis.
RESULTS
A public database for PAF prediction evaluation (PhysioBank 2001)provided by Physiobank (Goldberger et al. 2000) has been used to illus-trate the diagnostic methodology of this paper. It comprises the ECGrecords of 25 healthy individuals (n files) and 25 patients diagnosed withPAF (p files). The records are labeled (healthy or ill). It is important to notethat none of these cases contains any explicit PAF episode and, therefore,the fuzzy model obtained for this database will focus on ECG characteristicspresent in sinus rhythm (normal heart state).
FIGURE 5 Three–profile collaborative web diagnostic system.
Computer-Aided Diagnosis of the Paroxysmal Atrial Fibrillation 601

Performance Indicators
For biomedical diagnostic applications, the final diagnosis is that eithera patient is ill (suffering a certain pathology) or healthy (free from thisparticular pathology1). This means that the classification result can beone of the following cases:
1. The algorithm classifies the subject as ill and the subject is in fact ill(True Positive).
2. The algorithm classifies the subject as healthy and the subject is in facthealthy (True Negative).
3. The algorithm classifies the subject as ill but the subject is healthy (FalsePositive).
4. The algorithm classifies the subject as healthy but the subject is ill (FalseNegative).
In these cases, we have taken into account the following performanceindicators: Classification Accuracy, Sensitivity, and Specificity (De Toroet al. 2006).
Due to the small size of the test database (25 PAF patients and 25 non-PAFsubjects), the evaluation of the Classification Accuracy (and Sensitivity) is cal-culated in 50 cycles by the leaving one out method (Hand 1981), in otherwords, in each cycle one vector is selected from the database as the testelement. This vector is classified according to the scheme described above,with the other 49 labeled vectors serving as classification references. In eachcycle the classification results are updated in four counters: True-Positive,True-Negative, False-Positive and False-Negative. Finally the ClassificationAccuracy, Sensitivity, and Specificity are calculated as in De Toro et al. (2006).
Features
Although 48 different features are used in our previous work, in this work,only the14 features shown in Table 1 are considered. These features are thosethat were found to be more relevant according to our previous work (De Toroet al. 2006), avoiding unnecessary redundancy in the input feature set.
Genetic Operators
The crossover operator used in the deterministic crowding procedureis a single-point real-coded operator (Eiben and Smith 2003). Two differ-ent types of mutation have been considered: uniform mutation (Equation(8)) and Gaussian mutation (Equation(9)). Then, the mutated weightcomponents are obtained from a uniform distribution function and a
602 F. de Toro et al.

normal distribution function, respectively. Each type of mutation is usedwith a probability of 0.5. The mutation rate probability (see Figure 2) hasbeen set to 0.05.
w0
j ¼ U ð0; 1Þ ð8Þl ¼ wj
r ¼ffiffiffiffiffiffiffiffiffiffiffiffiffiffiffiffiffiffiffiffiffiffiffiffiffiffiffiffiffiffiffiffiffiffiffiffimin ðð1 � wjÞ;wjÞ
qw
0
j ¼ N ðl; rÞ
ð9Þ
The Fuzzy Model
For the training of the classifier, the deterministic crowding algorithm(Figure 2) has been run during 1014 weight vector fitness evaluations. Afterthis optimization period, more than 200 different subsets of features pro-viding a Classification Accuracy (Equation 6) above 80% were obtained.
The obtained solutions were entered to PreFuRGe according to the method-ology shown in Figure 3, and six different fuzzy rules were discovered (Figure 6).
For a better visualization of the results, the rules are split in Figure 6 intotwo subgraphics involving features F1 to F7 and F8 to F14, respectively. Eachrule contains 14 input variables (values of the components of the weightvector) and the 3 aforementioned performance indicators: ClassificationAccuracy (label S1), Sensitivity (label S2), and Specificity (label S3). Froma medical point of view, the more interesting rule seems to be that labeledRule #1 (see Figures 6a and 6b), which retrieves information concerning
TABLE 1 We Extract Different Features of Each Heart Beat Along the ECG Registers and WeCalculate the Mean, Maximum, Minimum, and Standard Deviation Values Out of the Whole Register
Featurenumber Feature label
Feature description (The atrial activity in mainly focussed on theP wave. When the P wave seems to fibrillate is called F wave)
F1 (QR)max Maximum of the QR distanceF2 (QR)min Minimum of the QR distanceF3 (RR)SD Standard Deviation of the RR distanceF4 (PR)SD Standard Deviation of the PR distanceF5 (P_amp)min Minimum of the amplitude of the P waveF6 (P_wide)min Minimum of the width of the P waveF7 (P_ini)mean Mean of the distance between the initiation and the maximum of
the P waveF8 (P_int)mean Mean of the integral of the P waveF9 (P_int)min Min of the integral of the P waveF10 (P_int)SD Standard Deviation of the integral of the P waveF11 (FR)mean Mean of the FR distanceF12 (FR)max Maximum of the FR distanceF13 (F_amp)mean Mean of the amplitude of the F wavesF14 (F_amp)max Maximum of the amplitude of the F waves
Computer-Aided Diagnosis of the Paroxysmal Atrial Fibrillation 603

FIGURE 6 (a) Fuzzy rules with antecedents F1..F7 and consequents S1, S2, S3. (b) Fuzzy rules with ante-cedents F8..F14 and consequents S1, S2, S3.
604 F. de Toro et al.
features that lead to a ‘high classification accuracy’ together with ‘highsensitivity’ (and ‘medium-high specificity’). It is clear that features leadingto high sensitivity are of interest, so they are related to the ability to detectill patients among all the subjects. From the observation of Rule #1, wecan conclude that the absence of F1 and F2 features, together with thepresence of F8 and F12 features, leads to high classification accuracyand high sensitivity simultaneously; we are not able to derive further con-clusions from the rest of the features considered. Conclusions concerningF1 and F2 can be explained by the time-based nature of these features, sothey can add noise to the diagnostic decision. Furthermore, because thesubjects’ database contained subjects with other cardiac pathologies, thesefeatures turned out to be misleading. In Rule #3—involving medium-highclassification accuracy—and to some point also in Rule #5, we obtainedthe same qualitative information about features F1 and F2, so we do notrecommend their utilization for PAF diagnosis.
On other hand, F8 being the mean of the integral of the P wave and F12 themaximum of the FR distance, we can summarize the following medical conclu-sions about the PAF detection: (1) The main Atrial activity indicators relayon the P and F waves, (2) the integral of the P wave is a good indicator and(3) the number of fibrillating P waves (usually called F wave) encodes sig-nificant information for the diagnosis of this pathology. These results,especially regarding F8, are consistent with some of our previous workand that of other authors (De Toro et al. 2006), encouraging the use ofP wave for PAF detection (even in the absence of explicit atrial fibrillationepisodes, as is the case in the used database).
Finally, we can observe that no rule has been retrieved involving highclassification accuracy together with high specificity. This fact can beexplained by the nature of the used database, which contains a wide rangeof different non-PAF diseases—treated here as ‘‘non-PAF subjects’’—makingthe global detection of all of them difficult due to their diversity (thereforeleading to low specificity rates).
CONCLUSIONS
In many situations, the medical diagnosis of health disorders (e.g.,heart disease) can be addressed through the extraction of characteristicparameters from biosignals such as ECGs. In many cases, this kind ofnoninvasive diagnosis is more appropriate than other solutions that involvesurgery. The extracted features are used in an algorithm for classification toproduce a computer-aided diagnosis. Computer-aided diagnosis can beused with other diagnostic strategies, for example, as a second reading orsecond opinion in making diagnostic decisions (Giger 1999).
Computer-Aided Diagnosis of the Paroxysmal Atrial Fibrillation 605

This work presents a methodology to address computer-aided diagnosisin medical applications. The diagnosis is carried out by a binary k-nearestneighbor classifier by using certain features from a biosignal. A determinis-tic crowding genetic algorithm is used for weighted feature selection dur-ing the optimization process of the classifier. Weight vectors, giving thedegree of importance of the different features retrieved during the optimi-zation process, are entered in to a fuzzy clustering algorithm in order toobtain an IF-THEN rules fuzzy model that will predict the performanceof the diagnostic classifier with regard to the weighted features, givingfriendly information to be interpreted by the medical specialists.
This is of great interest because it provides useful cues to designefficient diagnosis protocols. The IF-THEN fuzzy rules can be easily usedto select key features for medical diagnosis protocols to be applied directlyby medical specialists. Furthermore, we can use one of the systems withhigh classification rates directly in order to automatically provide diagnos-tics to newly presented subject features and to compare them with thoseobtained by medical specialists applying a wide variety of methods. Thishelps to ‘‘calibrate’’ and ‘‘validate’’ different diagnosis protocols using anautomatic scheme. The characterization of the diagnosis performancedepending on the feature set is represented using IF-THEN rules (whichare easy to interpret by the specialists when designing and testing differentdiagnostic protocols). This enables specialists to design diagnosis protocolsbased on different subsets of features. This is of great interest, since somecharacteristics could be unreliable due to the interference of other medicaldisorders that the patient or the database of patients may have.
Finally, a three-profile collaborative web implementation of the medicaldiagnostic methodology presented in this paper has been suggested. Theoverall methodology has been illustrated in a Paroxysmal Atrial Fibrillationdiagnosis application and the obtained fuzzy model is consistent with ourprevious work reporting pointing P wave-based features as good criteriafor PAF detection.
NOTE
1. ‘‘Healthy’’ individuals may be affected with some other diseases different from PAF.
REFERENCES
Anastasio, M. A., M. A. Kupinski, and R. M. Nishikawa. 1998. Optimization and FROC analysis ofrule-based detection schemes using a multiobjective approach. IEEE Transactions on Medical Imaging17 (6): 1089–1093.
Aroba, J. 2003. Avances en la toma de decisiones en proyectos de desarrollo de software, PhD Thesis,University of Sevilla, Spain.
606 F. de Toro et al.
Bauer, J., and M. Ringel. 1999. Telemedicine and the reinvention of healthcare: The seventh revolution inmedicine. New York: McGraw-Hill.
Bezdek, J. C. 1981. Pattern recognition with fuzzy objective function algorithm. New York: Plenum Press.Cantu-Paz, E. 2002. Feature subset selection by estimation of distribution algorithms. In: Genetic and
Evolutionary Computation Conference, ed. W. Langdon et al.: 303–310.De Toro, F., E. Ros, S. Mota, and J. Ortega. 2006. Evolutionary algorithms for multiobjective and
multimodal optimization of diagnostic schemes. IEEE Transactions on Biomedical Engineering 53(2): 178–189.
Devroye, L., L. Gyorfi, and G. Lugosi. 1996. A probabilistic theory of pattern recognition. New York:Springer-Verlag.
Eiben, A. E., and J. E. Smith. 2003. Introduction to evolutionary computing. Natural Computing Series.Springer.
Fogel, D. B., E. C. Wasson III, and E. M. Boughton. 1995. Evolving neural network for detecting breastcancer. Cancer Letters 96:49–53.
Giger, M. L. 1999. Computer–aided diagnosis. In AAPM=RSNA Categorical Course in Diagnostic RadiologyPhysics: Physical Aspects of Breast Imaging—Current and Future Considerations, ed. A. Haus and M. Yaffe,249–272.
Goldberg, D. E. 1989. Genetic algorithms in search, optimization and machine learning. New York: AddisonWesley.
Goldberger, A., L. Amaral, L. Glass, J. M. Hausdorff, P. C. Ivanov, R. G. Mark, J. E. Mietus, G. B.Moody, C. K. Peng, and H. E. Stanley. 2000. PhysioBank, PhysioToolkit, and Physionet:Components of a new research resource for complex physiologic signals. Circulation 101(23): 215–220.
Hand, D. 1981. Discrimination and classification. New York: Wiley & Sons.Handels, H., Th. Rob, J. Kreusch, H. Wolff, and S. Poppl. 1999. Feature selection for optimized skin
tumor recognition using genetic algorithms. Artificial Intelligence in Medicine 16:283–297.Hoppner, F., and F. Klawonn. 2003. A contribution to convergence theory of fuzzy c-means and deriva-
tives. IEEE Transactions on Fuzzy Systems 11 (5): 682–694.Keller, A., and F. Klawonn. 2000. Fuzzy clustering with weighting of data variables. International Journal of
Uncertainty, Fuzziness and Knowledge–Based Systems 8 (6): 735–746.Kolen, J., and T. Hutcheson. 2002. Reducing the time complexity of the fuzzy c–means algorithm. IEEE
Transactions on Fuzzy Systems 10 (2): 263–267.Li, J. P., M. E. Balazs, G. T. Parks, and P. J. Clarkson. 2002. A species conserving genetic algorithm for
multimodal function optimisation. Evolutionary Computation 10 (3): 207–234.Mahfoud, S. W. 1992. Crowding and preselection revisited. In: Parallel Problem Solving from Nature, 2, ed.
R. Manner and B. Manderick, 27–36. Amsterdam: Elsevier Science Publishers.Mahfoud, S. W. 1995. A comparison of parallel and sequential niching methods. In: Proceedings of
the Sixth International Conference on Genetic Algorithms, 136–143. San Mateo, CA: MorganKauffman.
Petersen, P., and J. Godtfredsen. 1986. Embolic complications in Paroxysmal Atrial Fibrillation. Stroke17:622–626.
Petrowski, P. 1996. A clearing procedure as a niching method for genetic algorithms. In Proceedings. ofIEEE International Conference on Evolutionary Computation, 798–803. Nagoya, Japan.
PhysioBank. Computers in Cardiology. IEEE press. http://physionet.cps.unizar.es/physiobank/database/afpdb/ (Last accessed: Apr. 2011).
Raymond T., R. Ng, and J. Han. 1994. Efficient and effective clustering methods for spatial data mining.In: Proceedings of the 20th International Conference on Very Large Data Bases 1:144–155. Chile.
Ros, E., S. Mota, F. De Toro, A. F. Dıaz, and F. J. Fernandez. 2004. Paroxysmal Atrial Fibrillation: Auto-matic diagnosis algorithm based on nonfibrillating ECGs. Methods of Information in Medicine 43 (1):94–98.
Ros, E., S. Mota, F. J. Fernandez, F. De Toro, and J. L. Bernier. 2004b. ECG Characterization ofParoxysmal Atrial Fibrillation: Parameter extraction and automatic diagnosis algorithm. Computersin Biology and Medicine 34 (8): 679–696.
Sareni, B., and L. Krahenbuhl. 1998. Fitness sharing and niching methods revisited. IEEE Transactions onEvolutionary Computation 2 (3): 97–106.
Computer-Aided Diagnosis of the Paroxysmal Atrial Fibrillation 607

Sato, M., Y. Sato, and L. Jain. 1997. Fuzzy clustering models and applications. Heidelberg, Germany:Springer-Verlag.
Sugeno, M., and M. Yasukawa. 1993. A fuzzy Logic-based approach to qualitative modeling. IEEE Transac-tions on Fuzzy Systems 1:7–31.
Zadeh, L. A. 1965. Fuzzy sets. Information and Control 8:338–353.Zhang, Q., and I. Couloigner. 2005. A new and efficient k–medoid algorithm for spatial clustering. In:
Proceedings of the International Conference on Computational Science and Its Applications 3582:181–189.Singapore, May.
608 F. de Toro et al.