comprehensive study of the urban transport development ...
248
COMPREHENSIVE STUDY OF THE URBAN TRANSPORT DEVELOPMENT PROGRAM IN GREATER YANGON (YUTRA UPDATE) FINAL REPORT MAIN TEXT MARCH 2019 JAPAN INTERNATIONAL COOPERATION AGENCY (JICA) ALMEC CORPORATION NIPPON KOEI CO., LTD. ORIENTAL CONSULTANTS GLOBAL CO, LTD. REPUBLIC OF THE UNION OF MYANMAR MINISTRY OF TRANSPORT AND COMMUNICATIONS (MOTC) YANGON REGION GOVERNMENT (YRG) JR 019-029 1R
-
Upload
khangminh22 -
Category
Documents
-
view
3 -
download
0
Transcript of comprehensive study of the urban transport development ...

COMPREHENSIVE STUDY OF THE URBAN TRANSPORT DEVELOPMENT PROGRAMIN GREATER YANGON (YUTRA UPDATE)
FINAL REPORTMAIN TEXT
MARCH 2019
JAPAN INTERNATIONAL COOPERATION AGENCY (JICA)
ALMEC CORPORATIONNIPPON KOEI CO., LTD.
ORIENTAL CONSULTANTS GLOBAL CO, LTD.
REPUBLIC OF THE UNION OF MYANMARMINISTRY OF TRANSPORT AND COMMUNICATIONS (MOTC)YANGON REGION GOVERNMENT (YRG)
J R019-029
1 R

COMPREHENSIVE STUDY OF THE URBAN TRANSPORT DEVELOPMENT PROGRAMIN GREATER YANGON (YUTRA UPDATE)
FINAL REPORTMAIN TEXT
MARCH 2019
JAPAN INTERNATIONAL COOPERATION AGENCY (JICA)
ALMEC CORPORATIONNIPPON KOEI CO., LTD.
ORIENTAL CONSULTANTS GLOBAL CO, LTD.
REPUBLIC OF THE UNION OF MYANMARMINISTRY OF TRANSPORT AND COMMUNICATIONS (MOTC)YANGON REGION GOVERNMENT (YRG)

i
Table of Contents
1.1 Study Framework .......................................................................................................... 1-1
1.2 Study Implementation .................................................................................................... 1-3
2.1 Strategic Location and Role of Yangon ......................................................................... 2-1
2.2 Urban Transport System in Yangon .............................................................................. 2-4
2.3 Characteristics of Current Urban Transport Demand .................................................. 2-17
3.1 Approach and Methodology .......................................................................................... 3-1
3.2 Traffic Demand Forecast for 2035 ............................................................................... 3-14
4.1 Impact of Future Growth on Urban Transport in Yangon ............................................... 4-1
4.2 Transport Sector Goal and Basic Strategies ................................................................. 4-3
5.1 Review of YUTRA Network ........................................................................................... 5-1
5.2 Transport Network Analysis .......................................................................................... 5-3
5.3 Proposed Transport Network for Yangon .................................................................... 5-12
6.1 Regional Transport Characteristics ............................................................................... 6-1
6.2 Urban Logistics ............................................................................................................. 6-5
7.1 Urban Roads Development ........................................................................................... 7-1
7.2 Removal of Bottlenecks ................................................................................................. 7-6
7.3 Development of Missing Links in Built-up Urban Area ................................................. 7-10
7.4 Development of Missing Links in New Urban Area...................................................... 7-12
7.5 Urban Expressway Development ................................................................................ 7-13
7.6 Development of Outer Ring Road .............................................................................. 7-20
8.1 Public Transport System in Yangon .............................................................................. 8-1
8.2 Reform of Bus System in Yangon ................................................................................. 8-2

ii
8.3 Current Operating Characteristics of YBS ..................................................................... 8-8
8.4 YBS Improvement Directions ...................................................................................... 8-19
8.5 Bus Pilot Project .......................................................................................................... 8-32
9.1 Main Issues ................................................................................................................... 9-1
9.2 Proposed Solutions and Measures................................................................................ 9-4
9.3 Proposed Actions ........................................................................................................ 9-15
10.1 Current Situation ......................................................................................................... 10-1
10.2 Direction of Urban Railway Development .................................................................... 10-5
10.3 Proposed Urban Rail Network ................................................................................... 10-10
10.4 Proposed Action Plan ................................................................................................ 10-14
11.1 Current Situation ......................................................................................................... 11-1
11.2 Development of New IWT Routes ............................................................................... 11-7
12.1 Understanding of TOD ................................................................................................ 12-1
12.2 Opportunities and Approach to TOD in Yangon ........................................................ 12-12
13.1 Proposed Transport Projects ....................................................................................... 13-1
13.2 Funding Opportunities ................................................................................................. 13-6
13.3 Preliminary Evaluation of Projects ............................................................................. 13-10
13.4 Findings on the Projects and Importance of Implementing Organization .................. 13-18
14.1 Conclusion .................................................................................................................. 14-1
14.2 Recommendations ...................................................................................................... 14-4

iii
List of Tables and Figures
Table 1.2.1 Meetings Held during the Study ............................................................................... 1-3
Table 2.1.1 Yangon in Myanmar, 2014 ......................................................................................... 2-1
Table 2.2.1 Vehicle Ownership in Yangon Region ...................................................................... 2-4
Table 2.2.2 Vehicle Ownership among International Corporations by City ............................. 2-4
Table 2.2.3 Population Growth in Greater Yangon by Urban Cluster ..................................... 2-10
Table 2.2.4 Profile of Roads ........................................................................................................ 2-11
Table 2.2.5 International Comparison of Shares of Road Area to Urban Area ...................... 2-11
Table 2.2.6 Understanding of Traffic Congestion ..................................................................... 2-12
Table 2.2.7 Vehicle Registration in Yangon Region ................................................................. 2-13
Table 2.2.8 Number of Taxi in Yangon Region .......................................................................... 2-14
Table 2.2.9 Fare System of Taxi in Yangon (Kyat) .................................................................... 2-14
Table 2.2.10 Total Number of Annual Flights and Passengers ................................................. 2-16
Table 2.2.11 Cargo and Container Throughput in Yangon Port, 2005–2015 ............................ 2-16
Table 2.3.1 Urban Transport Demand by Mode Including Walking in 2013 ........................... 2-18
Table 2.3.2 Average Travel Length and Travel Time in 2013 ................................................... 2-20
Table 2.3.3 Traffic Growth across the Hlaing River Screen Line ............................................ 2-21
Table 2.3.4 Traffic Growth across the Bago River Screen Line .............................................. 2-21
Table 2.3.5 Flyovers in Yangon City........................................................................................... 2-22
Table 2.3.6 Traffic Growth on the Airport Road Cordon Line .................................................. 2-22
Table 2.3.7 Road Traffic Growth on the Cordon Line, 2013–2016 ........................................... 2-23
Table 3.1.1 Current and Forecast Population ............................................................................. 3-4
Table 3.1.2 GRDP Growth Rates, 2016–2035 ............................................................................... 3-4
Table 3.1.3 Key Traffic Growth Variables in 2016 and 2035 ...................................................... 3-5
Table 3.1.4 Day-time Population in 2035 ..................................................................................... 3-5
Table 3.1.5 Night-time Population in 2035 ................................................................................... 3-6
Table 3.1.6 Day-Night Population Ratio in 2035 .......................................................................... 3-6
Table 3.1.7 Traffic Zones in the Study Area and Comparison with YUTRA ........................... 3-10
Table 3.1.8 Characteristics of Road and Rail Network in the Study Area .............................. 3-11
Table 3.1.9 Road Network Capacities and Maximum Speeds by Location and Road Type . 3-12
Table 3.1.10 Assignment Model Parameters for Roads, 2016 ................................................... 3-12
Table 3.1.11 Assignment Model Parameters for Railway, 2016 ................................................ 3-12
Table 3.2.1 2016 and 2035 OD Person Trips by Mode .............................................................. 3-14
Table 3.2.2 2016 and 2035 OD Trips in PCU Trips .................................................................... 3-16
Table 4.1.1 Assumed Socio-economic Framework for Greater Yangon by 2035 .................... 4-1
Table 4.1.2 Estimated Transport Demand in Yangon by 2035 .................................................. 4-2
Table 4.1.3 Estimated Intracity and Intercity Traffic Demand by 2035 ..................................... 4-2
Table 5.2.1 Network Performance under Various Scenarios ..................................................... 5-4

iv
Table 5.2.2 Railway Performance Indicators under the Do Maximum Scenario ..................... 5-6
Table 5.2.3 Urban Expressway Performance Indicators under the Do Maximum Scenario .. 5-8
Table 5.2.4 Estimated Goods Vehicle Demand Generated by Port and Truck Terminals ...... 5-9
Table 5.2.5 Estimated Demand Generated by the Yangon International Airport in 2016 (000/day) ..... 5-9
Table 5.3.1 Performance Indicators for Main Corridors in 2016 ............................................. 5-14
Table 5.3.2 Performance Indicators for Main Corridors in 2035 ............................................. 5-14
Table 6.1.1 Profile of National Transport Corridors, 2012 ......................................................... 6-3
Table 6.2.1 Classification of Goods ............................................................................................. 6-5
Table 6.2.2 Freight Flow Volume in Yangon ................................................................................ 6-7
Table 7.1.1 Vehicle Ownership in Yangon Region ...................................................................... 7-1
Table 7.1.2 International Comparison of Vehicle Ownership .................................................... 7-1
Table 7.1.3 Proposed Urban Roads .............................................................................................. 7-4
Table 7.2.1 Identified Bottlenecks by Corridor ........................................................................... 7-6
Table 7.5.1 Basic Design Plan for the YUEX ............................................................................. 7-16
Table 7.5.2 Comparison of Toll Systems ................................................................................... 7-19
Table 8.1.1 Estimated Travel Demand in 2016 and 2035 ............................................................ 8-1
Table 8.2.1 Reorganized Bus Operators ...................................................................................... 8-5
Table 8.3.1 Current Bus Routes .................................................................................................. 8-10
Table 8.3.2 Bus Supply by Route ............................................................................................... 8-15
Table 8.3.3 Characteristics of Bus Operation on YUPT Routes .............................................. 8-15
Table 8.3.4 Traffic Density (Pax-km) on Selected YUPT Bus Routes ..................................... 8-16
Table 8.3.5 Average Travel Time and Speed of Buses on YUPT Routes ............................... 8-16
Table 8.3.6 Assumptions for Estimating Bus Operating Costs .............................................. 8-17
Table 8.3.7 Assumptions for Estimating Bus Operating Costs .............................................. 8-18
Table 8.4.1 Current and Proposed Actions for the Yangon Bus Service ............................... 8-19
Table 8.4.2 Manpower for a 500-Bus Fleets .............................................................................. 8-26
Table 8.4.3 Key Performance Indicators for Bus Transit ......................................................... 8-29
Table 8.5.1 Outline of the Bus Pilot Project .............................................................................. 8-32
Table 9.1.1 Comparison of Travel Speeds on Selected Roads, 2013 and 2017 ....................... 9-3
Table 9.2.1 Proposed Traffic Management Measures for Problem Areas on Pyay Road ....... 9-4
Table 9.2.2 Impact of Optimizing Traffic Signal Phasing ......................................................... 9-12
Table 9.2.3 Socio-economic Characteristics of CBD Residents ............................................. 9-12
Table 9.2.4 CBD-related Travel Demand (000 Trips/day) ......................................................... 9-14
Table 10.1.1 Existing Railway Lines in Yangon .......................................................................... 10-1
Table 10.2.1 Types of UMRT ......................................................................................................... 10-7
Table 10.3.1 Profile of Proposed Urban Rail Lines in Yangon ................................................ 10-12
Table 10.4.1 Proposed Action Plan for Yangon Urban Rail Network Development .............. 10-14
Table 11.1.1 Current Inland Water Transport Services .............................................................. 11-2
Table 11.2.1 Profile of Industrial Zones in Yangon ................................................................ 11-10

v
Table 11.2.2 Comparison of Estimated Passenger Travel Times by Mode............................ 11-11
Table 11.2.3 Comparison of Estimated Cargo Travel Times by Mode ................................... 11-11
Table 11.2.4 Comparison of Fares by Mode .............................................................................. 11-13
Table 11.2.5 Assumed Ship Specifications ............................................................................... 11-14
Table 11.2.6 Proposed Stepwise Operation ............................................................................ 11-15
Table 12.2.1 TOD by Station Type in Yangon .......................................................................... 12-13
Table 12.2.2 Summary of Existing Conditions of YCR Stations ............................................ 12-13
Table 12.2.3 YCR Stations with High Potential for TOD ......................................................... 12-15
Table 12.2.4 Example of Site-Specific Zoning Code, Cost, and Revenue (tentative) .......... 12-18
Table 12.2.5 Current and Forecast of Passengers at Da Nyin Gone Station ....................... 12-19
Table 12.2.6 Tentative List of Proposed TOD at Da Nyin Gone Station Area ...................... 12-22
Table 12.2.7 TOD Roadmap for Establishment of Urban Railway Corridor in Yangon ....... 12-25
Table 12.2.8 Major Members of TOD Committee .................................................................... 12-27
Table 12.2.9 Project Components of TOD in Yangon ............................................................... 12-28
Table 13.1.1 Preliminary List and Costs of Proposed Transport Sector Projects .................. 13-2
Table 13.1.2 Estimated Project Costs by Subsector .................................................................. 13-4
Table 13.1.3 Estimated Government Share in Project Costs by Subsector ............................ 13-4
Table 13.1.4 Estimated Budget Envelope for Yangon Region and Greater Yangon by Scenario ....... 13-5
Table 13.2.1 Estimated Budget Envelope by Fuel Tax for Greater Yangon ........................... 13-7
Table 13.2.2 Estimated Budget Envelope by Parking Fees for Greater Yangon ................... 13-8
Table 13.3.1 Categories of Economic Benefits ....................................................................... 13-10
Table 13.3.2 VOC by Vehicle Type (Economic Price) ............................................................. 13-11
Table 13.3.3 Value of Time by Travel Mode ............................................................................. 13-11
Table 13.3.4 Economic Evaluation Results of Key Projects .................................................. 13-12
Table 13.3.5 Relevant Environmental and Social Indicators for the Projects ..................... 13-13
Table 13.3.6 Preliminary Results of Environmental Impact Evaluation ............................... 13-14
Table 13.4.1 Implementation Organization by Project Category ........................................... 13-18
Table 14.1.1 Estimated Cost to Government ............................................................................. 14-2
Table 14.2.1 Alternative Steps for Urban Rail Development ................................................... 14-5
Figure 1.1.1 Study Area ................................................................................................................. 1-2
Figure 2.1.1 Yangon Region in Myanmar and the Greater Mekong Subregion ....................... 2-2
Figure 2.1.2 Transport Network in Yangon Region .................................................................... 2-3
Figure 2.2.1 Transport Network in Greater Yangon, 2016 ......................................................... 2-5
Figure 2.2.2 Land Use in Greater Yangon, 2012 ......................................................................... 2-7
Figure 2.2.3 Distribution of Population by Township ................................................................. 2-8
Figure 2.2.4 Population Density by Township ............................................................................ 2-8
Figure 2.2.5 Workplace Employment by Township .................................................................... 2-8
Figure 2.2.6 Higher-education Enrolment by Township ............................................................ 2-8

vi
Figure 2.2.7 Urban Clusters in Greater Yangon .......................................................................... 2-9
Figure 2.2.8 Congestion-prone Locations in Yangon City ....................................................... 2-12
Figure 2.2.9 Number of Traffic Accidents in Yangon Region by Cause ................................. 2-12
Figure 2.2.10 Destinations of Domestic Freight from Yangon Airport ..................................... 2-16
Figure 2.3.1 Location of the Supplemental Traffic Surveys .................................................... 2-17
Figure 2.3.2 Urban Transport Demand by Mode in 2013.......................................................... 2-18
Figure 2.3.3 Trip Rates in 2013 by Urban Cluster ..................................................................... 2-19
Figure 2.3.4 Trip Distribution in 2016 ......................................................................................... 2-19
Figure 2.3.5 Urban Transport Demand by Hour in 2013........................................................... 2-20
Figure 2.3.6 Flyovers in Yangon City ......................................................................................... 2-22
Figure 3.1.1 Flowchart for Updating Demand Analysis ............................................................. 3-1
Figure 3.1.2 Traffic Zones in the Study Area ............................................................................... 3-2
Figure 3.1.3 Updating the Base-year (2016) and Forecasting the 2035 Socio-economic
Framework ................................................................................................................. 3-3
Figure 3.1.4 Proposed Land Use in SUDP (2035) and Locations of Urban Clusters .............. 3-3
Figure 3.1.5 Updating the Base-year (2016) and Forecasting the 2035 Transport Network... 3-7
Figure 3.1.6 Updating the Base-year (2016) and Forecasting the 2035 Trip Matrices (Walk,
Bicycle, and Motorcycle) .......................................................................................... 3-8
Figure 3.1.7 Validating the Base-year (2016) Model ................................................................... 3-9
Figure 3.1.8 Forecast-year Demand Modelling ......................................................................... 3-10
Figure 3.1.9 Speed–Flow Relationship (Highway Assignment) .............................................. 3-13
Figure 3.2.1 Mode Shares in the Base and Forecast Years ..................................................... 3-15
Figure 3.2.2 Mode Shares in the Base and Forecast Years in PCU Trips .............................. 3-16
Figure 3.2.3 Trip Patterns in the Base and Forecast Years ..................................................... 3-17
Figure 4.1.1 Car Ownership Patterns by Household Income .................................................... 4-2
Figure 4.2.1 Indicative Target for Modal Share ........................................................................... 4-3
Figure 5.1.1 Future Roads/Expressways Network Proposed in YUTRA Study (2013) ............ 5-2
Figure 5.1.2 Future Rail Network Proposed in YUTRA Study (2013) ........................................ 5-2
Figure 5.1.3 Regional Spatial Development Concept Proposed in Updated SUDP (2016) ..... 5-2
Figure 5.1.4 Urban Spatial Structure Proposed in Updated SUDP ........................................... 5-2
Figure 5.2.1 Traffic Situation in 2035 under Do Nothing Scenario ........................................... 5-3
Figure 5.2.2 Traffic Situation in 2016 ........................................................................................... 5-3
Figure 5.2.3 Traffic Situation in 2035 under the Do Maximum Scenario .................................. 5-5
Figure 5.2.4 Railway Traffic Demand in 2035 under the Do Maximum Scenario ..................... 5-7
Figure 5.2.5 Expressway Traffic Demand in 2035 under the Do Maximum Scenario ............. 5-8
Figure 5.2.6 Development Direction of Alternative Socio-economic Framework ................. 5-10
Figure 5.2.7 Proposed Land Use of Dala & Kyee Myin Daing Area in A development master
plan for the Yangon-Hanthawaddy-Bago corridor and Yangon's southwest ... 5-11
Figure 5.3.1 Proposed Urban Transport Network for Yangon ................................................. 5-13
Figure 5.3.2 Traffic Situation on the North–South Cross-section ........................................... 5-15

vii
Figure 6.1.1 Key National Transport Corridors, 2030 ................................................................. 6-2
Figure 6.1.2 Transport Demand on Selected Corridors by Mode ............................................. 6-4
Figure 6.2.1 Location of the New Dry Port in Ywarthargyi ........................................................ 6-8
Figure 7.1.1 Urban Roads in Yangon by Number of Lanes ....................................................... 7-2
Figure 7.1.2 Proposed Road Network Improvements ................................................................ 7-5
Figure 7.2.1 Identified Bottlenecks on Pyay Road and Proposed Measures ........................... 7-7
Figure 7.2.2 Proposed Concept of Making Pyay Road a Semi Access-controlled North–South
Arterial Road ............................................................................................................. 7-7
Figure 7.2.3 Identified Bottlenecks on Major Corridors (1) ....................................................... 7-8
Figure 7.2.4 Identified Bottlenecks on Major Corridors (2) ....................................................... 7-9
Figure 7.3.1 Large Urban Areas without Proper Secondary/Distributor Roads .................... 7-10
Figure 7.3.2 Development Concept for Existing Roads ........................................................... 7-11
Figure 7.3.3 Development Concept for Missing Links ............................................................. 7-11
Figure 7.4.1 Landuse Plan of Dala & Kyee Myin Daing Area Proposed by KOICA ............... 7-12
Figure 7.4.2 Location of New Town Projects Proposed in SUDP ........................................... 7-12
Figure 7.5.1 Impact of Urban Expressways ............................................................................... 7-13
Figure 7.5.2 Proposed Urban Expressway Network ................................................................. 7-15
Figure 7.5.3 Urban Expressway Concept for Wai Za Yan Tar Road Section ......................... 7-16
Figure 7.5.4 Organizational Structure for the Urban Expressway Company ......................... 7-18
Figure 7.5.5 Toll Collection Plan for the YUEX ......................................................................... 7-18
Figure 7.5.6 Popularization of Japanese Vehicles and ITS ..................................................... 7-19
Figure 7.6.1 Phasing Development Plan of ORR ...................................................................... 7-20
Figure 7.6.2 Proposed Urban Spatial Structures ...................................................................... 7-21
Figure 7.6.3 Phasing Development Plan of ORR ...................................................................... 7-21
Figure 8.1.1 PT Modal Share in Yangon in 2013 ......................................................................... 8-1
Figure 8.2.1 Yangon Bus Network Before Restructuring .......................................................... 8-2
Figure 8.2.2 Organizational Chart of Yangon Bus Service as of January 2017 ....................... 8-4
Figure 8.2.3 Bus Users’ Opinion about Yangon Bus Service 3 Months After Launch ........... 8-6
Figure 8.2.4 Bus Users’ Opinion about the Most Important Aspect for Bus Improvement .. 8-7
Figure 8.2.5 Comparison between Previous Bus Service and YBS .......................................... 8-7
Figure 8.3.1 Comparison of Bus Route Coverage between YBS and Previous Bus Service. 8-9
Figure 8.3.2 Coverage of YBS Routes........................................................................................ 8-11
Figure 8.3.3 Comparison of Bus Service Coverage between YBS and Previous Bus Service ......... 8-12
Figure 8.3.4 Ridership Pattern on YUPT Bus Route No.6 ........................................................ 8-13
Figure 8.3.5 Ridership Pattern on Selected YUPT Bus Routes ............................................... 8-14
Figure 8.3.6 Estimated Bus Operating Cost ( Kyat/km) at 15 km/h of Operating Speed ...... 8-18
Figure 8.4.1 Logical Clustering of Routes ................................................................................. 8-21
Figure 8.4.2 Typical Organizational Structure of a Bus Enterprise ........................................ 8-25
Figure 8.4.3 Management Reports and Departmental Interactions ........................................ 8-27

viii
Figure 8.4.4 Operational Relationships in a Bus Company ..................................................... 8-28
Figure 8.5.1 Bus Operating Characteristics on Route No. 6 (Example) ................................. 8-33
Figure 8.5.2 Data Collection through ICT Devices .................................................................... 8-35
Figure 8.5.3 Role Sharing among Bus Operators, Bus Users, and YRTA in
Bus Operation and Information Management System ........................................ 8-35
Figure 8.5.4 Preliminary Improvement Plan for Tha Khin Mya Park Terminal Area .............. 8-36
Figure 9.1.1 Popular Locations and Causes of Traffic Congestion .......................................... 9-2
Figure 9.1.2 Identification of Traffic Bottlenecks using Probe Data ......................................... 9-2
Figure 9.1.3 Selected Roads for Travel Speed Survey ............................................................... 9-3
Figure 9.2.1 Traffic Bottlenecks and Proposed Management Measures for Pyay Road ........ 9-5
Figure 9.2.2 Traffic Bottlenecks and Proposed Management Measures for Kabar Aye Pagoda Road 9-6
Figure 9.2.3 Traffic Bottlenecks and Proposed Management Measures for Kannar Road–
Bayint Naung Road ................................................................................................... 9-7
Figure 9.2.4 Traffic Bottlenecks and Proposed Management Measures for Yangon–Pathein Road ... 9-8
Figure 9.2.5 Traffic Bottlenecks and Proposed Management Measures for Wai Zayan Tar Road ...... 9-9
Figure 9.2.6 Traffic Bottlenecks and Proposed Management Measures for Upper Pazuntaung
Road–Thanthumar Road–No. 2 Main Road .......................................................... 9-10
Figure 9.2.7 Estimated Volume–Capacity Ratio of Major Intersections in Yangon .............. 9-11
Figure 9.2.8 Example of Micro Traffic Simulation Conducted in YUTRA Study .................... 9-12
Figure 9.2.9 Yangon Central Business District ......................................................................... 9-12
Figure 9.2.10 Identified Bottlenecks on CBD Corridors ............................................................. 9-13
Figure 9.3.1 Introduction of ICT and AI for Urban Transport/ Traffic Management .............. 9-16
Figure 10.1.1 Railway Network in Yangon, 2016 ......................................................................... 10-2
Figure 10.2.1 Distribution of Public Transport Demand and Location of Circular Railway Line, 2016 10-5
Figure 10.2.2 Hourly Distribution of Traffic Demand in Yangon, 2013 ..................................... 10-5
Figure 10.2.3 Broad Classification of Mass Transit ................................................................... 10-6
Figure 10.2.4 Examples of Urban Rails in Selected Asian Cities .............................................. 10-6
Figure 10.2.5 Types of Railway Planning and Development Organizations ............................ 10-8
Figure 10.2.6 Components of Railway ICT .................................................................................. 10-9
Figure 10.3.1 Assumed Coverage of Urban Railway Network in the City Center (with UMRT
Line 3)..................................................................................................................... 10-11
Figure 10.3.2 Proposed Urban Rail Network Plan for Yangon City ........................................ 10-13
Figure 11.1.1 Regular Inland Water Transport Routes ............................................................... 11-1
Figure 11.1.2 Present Condition of Jetties and Ships Operating in Existing Routes ............. 11-3
Figure 11.1.3 Number of Passengers by IWT Route .................................................................. 11-4
Figure 11.1.4 Cargo Volumes by IWT Route ............................................................................... 11-4
Figure 11.1.5 Water Taxi Routes and Image of Water Taxi (Chao Phraya River, Bangkok) ... 11-6
Figure 11.1.6 New Jetty at Pun Hlaing Golf Estate ..................................................................... 11-6
Figure 11.2.1 Proposed New IWT Routes .................................................................................... 11-7
Figure 11.2.2 Present Condition of Pun Hlaing River ................................................................ 11-8

ix
Figure 11.2.3 Location of Industrial Zones in Yangon ........................................................... 11-10
Figure 11.2.4 Water Depth around Yangon Port ..................................................................... 11-12
Figure 11.2.5 Water Transport in Tokyo .................................................................................. 11-14
Figure 11.2.6 Expected Implementation Route and Terminal by Term ................................ 11-15
Figure 12.1.1 Basic Principle and Effects of TOD ..................................................................... 12-1
Figure 12.1.2 TOD as a Catalyst to Integrate Transport and Urban Development ................ 12-2
Figure 12.1.3 TOD Opportunities at Spatial Level .................................................................... 12-4
Figure 12.1.4 Main Components of TOD .................................................................................... 12-5
Figure 12.1.5 Role and Function of Intermodal Facilities ........................................................ 12-7
Figure 12.1.6 Basic Layout of the Station Plaza ....................................................................... 12-8
Figure 12.1.7 Station Plazas in Japan ........................................................................................ 12-9
Figure 12.1.8 Example of Car Parking ..................................................................................... 12-10
Figure 12.1.9 Examples of Bicycle Parking ............................................................................. 12-10
Figure 12.1.10 Examples of Pedestrian Deck ........................................................................... 12-11
Figure 12.2.1 Potential Areas for Integrated Development .................................................... 12-16
Figure 12.2.2 Proposed New Town Area along YCR .............................................................. 12-17
Figure 12.2.3 Example of Land Use Plan for Zone 1 and Zone 3-1 (tentative) ..................... 12-18
Figure 12.2.4 Example of Section of Zone 3-2 (tentative) ...................................................... 12-19
Figure 12.2.5 Current Construction Status (Dec. 2016; left) and Site Plan (right) for
Danyingone Fruits, Vegetables, and Flowers Wholesale Market ................... 12-20
Figure 12.2.6 TOD Concept Plan at Da Nyin Gone Station Area ........................................... 12-21
Figure 12.2.7 Example of Land Use Plan for TOD at Da Nyin Gone Station Area ............... 12-21
Figure 12.2.8 Optimal Approach for Land Value Capture ...................................................... 12-23
Figure 12.2.9 Land Readjustment Scheme .............................................................................. 12-23
Figure 12.2.10 Collective Land Re-plotting for Development of Station and Intermodal Facilities .. 12-24
Figure 12.2.11 Urban Redevelopment Scheme ......................................................................... 12-24
Figure 12.2.12 Concept of Transfer of Development Rights ................................................... 12-24
Figure 12.2.13 Roadmap for Development-based Value Capture ........................................... 12-25
Figure 13.2.1 Project Costs vs. Budget Envelope .................................................................... 13-6
Figure 13.2.2 Petrol Prices and Taxes in OECD Countries (2014) and Yangon (2017) ......... 13-7
Figure 13.2.3 Public Transport Fare for a 10-km One-way Trip in Selected Asian Cities, 2007 ........ 13-9
Figure 13.3.1 VOC by Vehicle Type (Economic Price) ............................................................. 13-11
Figure 14.1.1 Project Costs vs. Budget Envelope ...................................................................... 14-3
Figure 14.2.1 Roadmap for Bottleneck Removal ........................................................................ 14-5
Figure 14.2.2 Roadmap for Bus Modernization .......................................................................... 14-6
Figure 14.2.3 Roadmap for Traffic Management and Safety Improvement .............................. 14-6
Figure 14.2.4 Roadmap for the Construction of Missing Links ................................................ 14-7
Figure 14.2.5 Roadmap for Urban Rail Network Development .................................................. 14-7
Figure 14.2.6 Roadmap for Urban Expressway Development ................................................... 14-7

x
Figure 14.2.7 Roadmap for Inland Waterway Transport Development ..................................... 14-8
Figure 14.2.8 Roadmap for Transit Oriented Development ....................................................... 14-8
Figure 14.2.9 Roadmap for YRTA Strengthening ....................................................................... 14-9
LIST OF ABBREVIATIONS

xi

xii
CONVERSION RATE (AT OCTOBER 2016)
1 MMK = 0.0815200 JPY, 1 JPY = 12.2669 MMK
1 USD = 100.606 JPY, 1 JPY = 0.00993977 USD
1 USD = 1234.12 MMK, 1 MMK = 0.000810292 USD

Comprehensive Study of the Urban Transport Development Program in Greater Yangon (YUTRA Update) Final Report | Chapter 1: Introduction
1-1
1 INTRODUCTION
1.1 Study Framework
1) Background
1.1 Yangon, the former capital of Myanmar with a population of 5.2 million (as of the 2014
census), is the country’s largest commercial hub. In the city, traffic and transport situation has
quickly worsened, especially after the new administration took office, due to accelerated economic
growth and motorization. The increase in traffic volume mainly accounted for by private cars and
buses, has also resulted in air pollution and increasing severity of traffic accidents. By 2035, the
population of Yangon is expected to reach 7.7 million, with the population concentrating in the urban
area. The urban area is also expected to expand into the surrounding areas, transforming Yangon
into a megacity with a population of 10 million in the future. Along with economic and population
growth and the resulting increase in traffic demand and incomes, private vehicle ownership rate is
expected to grow. The pressure for urban and transport development will only become bigger.
1.2 In 2013–2014, a study entitled “Comprehensive Study on Urban Transport Development
Program in Greater Yangon” (YUTRA) was conducted with the technical assistance of the Japan
International Cooperation Agency (JICA) to formulate an urban transport development plan for the
Yangon metropolitan area focusing on road and urban rail intersections, traffic management and
safety, public transportation, and transport sector institutions, among others. A comprehensive
transport network and development plan was formulated based on the conduct of comprehensive
traffic surveys which produced an important database. The YUTRA study was also conducted in
coordination with a parallel JICA-assisted study entitled “Yangon Sustainable Urban Development
Planning” (SUDP) which intended to formulate a comprehensive urban development plan for
Yangon. Due to a rapidly changing urban transport situation, however, a need arose for a review
and an update of YUTRA under the new administration’s policy on urban transport development.
1.3 In response, JICA concluded an agreement with the Myanmar government in March 2016 to
implement a study which would update and review YUTRA I study findings and recommendations,
conduct a pre-feasibility study for the UMRT Line 1(north-south line) and UMRT Line 2 (east–west
line), come up with policies and an action plan to ease traffic congestion in Yangon, prevent or
minimize traffic accidents, and establish an organization to formulate these policies.
2) Objectives
1.4 This study has the following specific objectives:
(a) Review and update YUTRA study which has the target year of 2035;
(b) Update the roadmap on urban transport in Yangon;
(c) Implement a pilot project related to bus transport modernization and draw lessons from this
pilot project; and
(d) Formulate a proposal for the Yangon Urban Railway Construction Programme and conduct a
pre-feasibility study for selected lines.
1.5 Along with gathering the required data to review YUTRA, efforts have been made to draft a
proposal and an action plan for developing the urban transport network and for strengthening the
urban transport management system in Yangon.
1-1

Comprehensive Study of the Urban Transport Development Program (YUTRA Update) Final Report | Chapter 1: Introduction
1-2
3) Approach
1.6 Updating the transport master plan for Yangon, including the development goals, basic
strategies, overall transport network plan, list of projects/actions, and proposed roadmap, took
account of the following points:
(i) Compliance with the overall urban and regional framework and structure by updating the
Strategic Urban Development Plan (referred to as SUDP-II);
(ii) Incorporation of urban and regional transport policies and development directions of the new
administration;
(iii) Review of the YUTRA (2014) plan and projects based on the results of supplemental traffic
surveys carried out in this current study and on the updated database;
(iv) Consultation and coordination with Yangon Region Transport Authority (YRTA) to generate a
shared understanding of the study and to build their capacity.
4) Study Area
1.7 The study area is the same as that of YUTRA, i.e., the metropolitan area of Yangon. It covers
Yangon City, which is being administered by the Yangon City Development Committee (YCDC), and
the urbanizing areas of Yangon Region, as shown in Figure 1.1.1. The study area is also called
Greater Yangon and has an area of 1,500 km2.
Source: Study Team
Figure 1.1.1 Study Area
1-2

Comprehensive Study of the Urban Transport Development Program in Greater Yangon (YUTRA Update) Final Report | Chapter 1: Introduction
1-3
1.2 Study Implementation
1.7 During the course of this study, the following meetings were held with relevant stakeholders in
Myanmar along with the relevant Japanese agencies: Myanmar Union Government (UG), Ministry of
Construction (MOC), Ministry of Transport and Communications (MOTC), Yangon Region
Government (YRG), YRTA, Yangon City Development Committee (YCDC), JICA, and Japan’s
Ministry of Land, Infrastructure, Transport and Tourism (MLIT).
Table 1.2.1 Meetings Held during the Study
Meeting Date Venue Participant 1)
Meeting with YRTA
Kick-off Meeting 3 August 2016 Yangon YRTA, JICA, MLIT
Periodic Meeting (1) 16 August 2016 Yangon YRTA, JICA
Periodic Meeting (2) 7 September 2016 Tokyo, Japan YRTA, YCDC JICA, MLIT
Periodic Meeting (3) 30 September 2016 Yangon YRTA, YCDC, JICA
Interim Report Meeting 10 October 2016 Yangon YRTA, YCDC JICA, MLIT
Periodic Meeting (4) 5 November 2016 Yangon YRTA, YCDC, JICA
Periodic Meeting (5) 5 December 2016 Yangon YRTA, YCDC, JICA
Periodic Meeting (6) – Investment and Funding Opportunity of MPs
23 January 2017 Yangon YRTA, YCDC, JICA
Periodic Meeting (7) – Review of YBS and Proposed Pilot Project
23 January 2017 Yangon YRTA, JICA
Summary of the Study for International Donors 20 February 2017 Yangon YRTA, JICA and foreign donors
Progress Report Meeting (& Announcement of Pilot Project)
10 April 2017 Yangon YRTA, YCDC, JICA
Interim Report on Urban Railway Pre-FS 9 July 2017 Yangon YRTA, YCDC, JICA
Discussion on Grade Separation Project of Yangon Circular Railway
17 August 2017 Yangon YRTA, JICA
Discussion on Taxi Policy 25 October 2017 Yangon YRTA, JICA
Discussion on Traffic Improvement at Level Crossing
1 November 2017 Yangon YRTA, YCDC, JICA
Discussion Paper on Pilot Project of Traffic Management
30 November 2017 Yangon YRTA, YCDC, JICA
Progress Report on Bottleneck Removal Program
10 February 2018 Yangon YRTA, YCDC, JICA
Meeting with Myanmar Union Gov’t
Kick-off Meeting MOC 4 August 2016 Nay Pyi Taw MOC, JICA, MLIT
MOTC 4 August 2016 Nay Pyi Taw MOTC, YCDC JICA, MLIT
Interim Report Meeting MOC 11 October 2016 Nay Pyi Taw MOC, JICA,
MOTC 12 October 2016 Nay Pyi Taw MOTC, JICA
Summary Report Meeting
MOC 19 December 2016 Nay Pyi Taw MOC, JICA,
MOTC 19 December 2016 Nay Pyi Taw MOTC, JICA
Interim Report on Urban Railway Pre-FS
MOTC 15 April 2017 Nay Pyi Taw MOTC, JICA
Other Meetings
Kickoff Meeting of the Director Level Working Group by MLIT
6 September 2016 Tokyo, Japan YRTA, YCDC, MLIT, JICA
Working Group Meeting by MLIT (1) 10 October 2016 Yangon YRTA, YCDC, MLIT, JICA
Working Group Meeting by MLIT (2) 12 December 2016 Yangon YRTA, YCDC, MLIT, JICA
Summary of the Study for Japanese Companies 18 January 2017 Yangon JICA, Japanese companies
Summary of the Study for Japanese Agency 24 June, 2017 Tokyo, Japan JICA, MLIT
Report on Urban Railway Pre-FS
8 September 2017 Tokyo, Japan JICA, MLIT
Source: JICA Study Team 1) Major stakeholder organizations.
1-3

Comprehensive Study of the Urban Transport Development Program in Greater Yangon (YUTRA Update) Final Report | Chapter 2: Overview of the Urban and Regional Transport System
2-1
2 OVERVIEW OF THE URBAN AND REGIONAL TRANSPORT
SYSTEM
2.1 Strategic Location and Role of Yangon
1) Significance of Yangon
2.1 Yangon City is the most important hub for socio-economic activities in Myanmar and the
gateway to the rest of the world. It is the capital of Yangon Region and had a population of 5.2
million in 2014 compared with Yangon Region’s 7.4 million population (14% of the country). In the
same year, Yangon accounted for MMK12,359 billion of the GRDP (19% of the country) (see Table
2.1.1).
Table 2.1.1 Yangon in Myanmar, 2014
Item Myanmar Yangon Region Yangon
Population
(000) 51,486 7,361 5,191
% 100 14 10
Area km2 669,794 9,804 971
% 100 1.5 0.14
Population Density (1,000/km2) 77 751 5,346
GRDP MMK billion 65,262 12,359 n.a
% 100 19 n.a
Per-capita GRDP (MMK000) 1,268 1,679 n.a
Source: Worked out by Study Team, based on Various sources.
2) Yangon in the Greater Mekong Subregion
2.2 Yangon is connected to the countries of the Greater Mekong Subregion (GMS) and the
members of the Bay of Bengal Initiative for Multi-Sectoral Technical and Economic Cooperation
(BIMSTEC) through the Asian Highway network, as shown in Figure 2.1.1. Yangon Region is
located on the Western Corridor which connects to the East-West Corridor passing though Thailand,
Laos, and Vietnam. The Asian Highway network, however, is underdeveloped at present and
Yangon is yet to be integrated with its neighboring countries.
2-1

Comprehensive Study of the Urban Transport Development Program in Greater Yangon (YUTRA Update) Final Report | Chapter 2: Overview of the Urban and Regional Transport System
2-2
Greater Mekong Subregion and Economic Corridors National Spatial Development Framework
East–West Economic Corridor
Source: Worked out by Study Team, based on Various sources.
Figure 2.1.1 Yangon Region in Myanmar and the Greater Mekong Subregion
2-2

Comprehensive Study of the Urban Transport Development Program in Greater Yangon (YUTRA Update) Final Report | Chapter 2: Overview of the Urban and Regional Transport System
2-3
3) Yangon in the National Transport Network
2.3 Yangon City, which is being administered by the Yangon City Development Committee
(YCDC) has been growing rapidly. Its urban areas have expanded quickly as the population has
increased, forming Greater Yangon1.
2.4 Yangon Region is covered with a network of roads, waterways, rails, and provided with
gateway ports and airports (see Figure 2.1.2). However, the current status of the transport
infrastructure in the region is not satisfactory, requiring large investments to meet current and future
needs. In 2014, more than 50% of the highways connecting to Yangon City were found to be in poor
condition2. Although the road network around Yangon City accommodates a large share of national
traffic, investments in maintenance, improvement, and new construction of roads are limited.
Source: Study Team
Figure 2.1.2 Transport Network in Yangon Region
1 Greater Yangon is the study area of YUTRA study of 2013 and this study (YUTRA II). 2 ADB Myanmar Transport Sector Policy Note: Urban Transport, 2016
2-3

Comprehensive Study of the Urban Transport Development Program in Greater Yangon (YUTRA Update) Final Report | Chapter 2: Overview of the Urban and Regional Transport System
2-4
2.2 Urban Transport System in Yangon
1) Overview
2.5 The urban transport system in Yangon City is composed of a network of roads, rails,
waterways, ports, and airports (see Figure 2.2.2). Although the main urban areas are covered by
major roads, railways, and waterways, they are not connected to each other nor provided with an
adequate set of secondary network and feeder services.
2.6 During the last several years, the urban transport situation in Yangon has quickly worsened
due to the constantly increasing urban population, increase in car ownership, slow progress in
infrastructure development, and lack of traffic management to maximize the use of available
transport capacities. The major transport problems identified include: (i) increasing traffic congestion;
(ii) worsening traffic safety and undisciplined driving manner; (iii) low quality of public transport (bus,
railway, taxi); (iv) worsening traffic pollution (air, noise); (v) illegal parking; (vi) widespread use of
used/old vehicles; and (vii) worsening walkability. The problems are so much interrelated and
present in many parts of the urban areas, making it difficult for the city to find and implement drastic
solutions in a short time. The effectiveness of piecemeal measures is also limited.
2.7 Considering the national role of Yangon Region, urban transport issues should not be isolated
from international/ regional transport because Yangon is the gateway for both passengers and
cargos. As the country’s economy grows and global integration makes progress, international traffic
will increase and concentrate in gateways points, such as airports and border gates. The impact of
international/ regional traffic will become increasingly significant. In view of this, two significant
issues are currently being discussed in the Government. One is the development of a new airport in
Hanthawaddy in Bago Region, and two is the relocation of port/ logistics facilities from the Yangon
CBD.
2.8 Further development of roads and bridges, strengthening of existing railways, improvement
and modernization of bus services, development of urban water transport is also ongoing.
Table 2.2.1 Vehicle Ownership in Yangon Region Table 2.2.2 Vehicle Ownership among
International Corporations by City
Classification No. of Units (000) Growth
Rate (2016/2012) 2012 2014 2016
Private Car 160 270 330 2.1
Truck Light 16 49 124 7.5 Heavy 11 17 17 1.6
Bus 11 13 16 1.4 MC 56 143 253 4.5 Others 13 22 34 2.5
Total 269 514 773 2.9
Source: Statistical Yearbook in Myanmar, Road Transport Administration Department
Capital City No./ 000 Population
Car M/C
Yangon 45 34 Hanoi 80 350 Bangkok 400 120 Manila 100 20 Kuala Lumpur 480 110 Taipei 220 150 Seoul 280 20 Singapore 230 15 Tokyo 120 10
Source: Worked out by Study Team, based on Various sources.
2-4

Comprehensive Study of the Urban Transport Development Program in Greater Yangon (YUTRA Update) Final Report | Chapter 2: Overview of the Urban and Regional Transport System
2-5
Source: Study Team
Figure 2.2.1 International Comparison of Car Ownership and Per Capita GRDP
Source: Study Team
Figure 2.2.2 Transport Network in Greater Yangon, 2016
2-5

Comprehensive Study of the Urban Transport Development Program in Greater Yangon (YUTRA Update) Final Report | Chapter 2: Overview of the Urban and Regional Transport System
2-6
2) Implications for Land Use and Urban Issues
2.9 Transport demand is derived from various socio-economic activities in urban areas. As
transport and land use affect each other, traffic problems and issues should also be looked at in the
context of urban development.
2.10 Urban areas in Yangon, i.e., the central business district (CBD) and the city center, are
characterized by very high density and mixed uses, while areas along major roads have medium
density and mixed uses. Between these areas and in suburban areas, there is low density. While
population increase in central areas is slowing down, it is accelerating in outer areas in a sprawling
manner. Yangon is rather monocentric in its urban spatial structure, though various scales of
developments are taking place sporadically along major roads. Employment is significantly
distributed in the CBD and city center, while higher-education enrolment is concentrated in a number
of locations (see Figures 2.2.2– 2.2.6) The major urban needs facing Yangon include the following:
(i) Improvement of living conditions and environment provided with adequate utilities and
protected against natural disasters such as flood;
(ii) Expansion of investment opportunities to make the city more competitive and create
employment; and
(iii) Presentation of widely distributed heritage sites and rich natural resources (greeneries and
water bodies) in urban areas which many cities have been losing in the urbanization process.
2.11 As transport is a key driver in influencing urban land use, it is necessary to look at various
transport and traffic issues in relation to urban development and environmental management.
2-6

Comprehensive Study of the Urban Transport Development Program in Greater Yangon (YUTRA Update) Final Report | Chapter 2: Overview of the Urban and Regional Transport System
2-7
Source: Study Team
Figure 2.2.3 Land Use in Greater Yangon, 2012
2-7

Comprehensive Study of the Urban Transport Development Program in Greater Yangon (YUTRA Update) Final Report | Chapter 2: Overview of the Urban and Regional Transport System
2-8
Figure 2.2.4 Distribution of Population by
Township Figure 2.2.5 Population Density by Township
Figure 2.2.6 Workplace Employment
by Township
Figure 2.2.7 Higher-education Enrolment by
Township
Source: Worked out by the Study Team based on the results of the HIS conducted in 2013.
2-8

Comprehensive Study of the Urban Transport Development Program in Greater Yangon (YUTRA Update) Final Report | Chapter 2: Overview of the Urban and Regional Transport System
2-9
2.12 The CBD, city center, and three clusters of inner urban areas (IU–01, IU–02, IU–03) have high
population densities of 200 persons/ha or more (CBD has 341 persons/ha). Because of the high
density, the population has not increased between 2011 and 2016, but has actually been decreasing,
especially in the CBD and adjoining clusters.
2.13 Large populations are also distributed in some suburban clusters (SU–01, SU–02, SU–03,
and SU–04) and outer area clusters (OA–01 and OA–02), though population density is relatively low.
These clusters are located along major transport corridors, and their populations are expected to
grow further as transport services improve.
2.14 As transport services affect the growth and distribution of population, spatial and land-use
management must be coordinated and integrated with transport development.
CBD Latha, Lanmadaw, Panbetan, Kyauktada, Botataung, Pazundaung
Central Cluster Alone, (a part of ) Kyeemyindaing, Dagon, Mingalar Taung Nyunt, Seikkan
Inner Cluster IU-01 Inner North West: San Chaung, Kamayut, Hlaing IU-02 Inner North: Bahan, Tarmwe, Yankin, Thingankyun, South Okkalapa IU-03 Inner East: Dawpon, Tharkayta IU-04 Inner South West: (a part of) Kyeemyindaing, Seikgyikanaungto, (a part of) Twantay IU-05 Inner South: (a part of) Dala IU-06 Inner East: Thanlyin
Outer Cluster SU-01 Outer North West: (a part of) Mayangone, Insein SU-02 Outer North: (a part of) Mayangone, (a part of) Mingalardon, North Okkalapa SU-03 Outer North East: North Dagon, South Dagon, (a part of) East Dagon, (a part of) Dagon Seikkan SU-04 Outer West: Hlaingtaryar SU-05 Outer South West: (a part of) Twantay SU-06 Outer South: (a part of) Dala, (a part of) Twantay SU-07 Outer East: (a part of) Thanlyin SU-08 Outer South East (Thilawa) : Kyauktan, (a part of) Tanlyin
Far Outer Cluster OA-01 Far Outer North West: Shwepyitar, (a part of) Hmawbi OA-02 Far Outer North: (a part of) Mingalardon, Hlegu, (a part of) Hmawbi OA-03 Far Outer North East: (a part of) East Dagon, (a part of) Dagon Seikkan OA-04 Far Outer West: Htantabin OA-05 Far Outer South East: (a part of) Kyauktan OA-06 Far Outer East: (a part of) Thanlyin
Source: Study Team
Figure 2.2.8 Urban Clusters in Greater Yangon
2-9

Comprehensive Study of the Urban Transport Development Program in Greater Yangon (YUTRA Update) Final Report | Chapter 2: Overview of the Urban and Regional Transport System
2-10
Table 2.2.3 Population Growth in Greater Yangon by Urban Cluster
Cluster Population AGR
(%/yr)
Population Density (no/ha) 2011 2016
CBD 252,392 222,256 -2.5 341 Central 318,592 321,115 0.2 234
Inner Cluster
IU-01 Inner North West 344,103 346,743 0.2 200 IU-02 Inner North 840,726 695,789 -3.7 205 IU-03 Inner East 340,568 302,554 -2.3 208 IU-04 Inner South West 89,376 86,786 -0.6 25 IU-05 Inner South 111,954 112,592 0.1 38 IU-06 Inner South East 93,526 169,023 12.6 47
Subtotal 1,820,253 1,713,487 -1.2 103
Outer Cluster
SU-01 Outer North West 442,504 442,393 -0.0 135 SU-02 Outer North 542,494 587,115 1.6 85 SU-03 Outer North East 798,760 950,639 3.5 74 SU-04 Outer West 488,768 803,127 10.4 112 SU-05 Outer South West 11,297 9,894 -2.6 2 SU-06 Outer South 17,768 16,976 -0.9 2 SU-08 Outer South East (Thilawa) 13,974 16,466 3.3 4 SU-07 Outer East 68,560 123,904 12.6 12
Subtotal 2,384,125 2,950,514 4.4 50
Far Outer Cluster
OA-01 Far Outer North West 331,698 494,637 8.3 44 OA-02 Far Outer North 191,473 301,391 9.5 18 OA-03 Far Outer North East 61,199 73,710 3.8 6 OA-04 Far Outer West 32,506 44,981 6.7 6 OA-05 Far Outer South East 45,212 38,804 -3.0 9 OA-06 Far Outer East 15,160 27,398 12.6 3
Subtotal 677,248 980,920 7.7 16 Greater Yangon Total 5,452,610 6,188,292 2.6 44
Source: Study Team
2.15 In 2013, a household interview survey was conducted among a total of 10,068 households.
Household heads were interviewed based on a comprehensive questionnaire consisting of 95
questions dealing with the household’s socio-economic profile, such as the ages of the household
head and its members, gender, occupations, incomes, ownership of vehicles and household goods,
housing and housing conditions, availability of urban utilities (such as power, water, drainage, and
garbage collection), access to various urban services, and public transport, among others. At the
same time, people’s assessment of the existing urban environment and public services, as well as
their future needs and visions for the city were also asked. An analysis of the survey data is in
Technical Report No. 4 entitled “Profile and Voices of Yangon People in 2013.”
3) Urban Roads and Streets
2.16 Yangon lacks road infrastructure in terms of length, space, density, and quality as
characterized in the following:
(a) Small Network Size: While the total road length is fairly long at 9,945 km, they are mostly
one-lane roads. Those with more than 6 lanes or having 4 or 2 lanes are 126 km, 429 km,
and 9,255 km in length, respectively. The share of the overall road area to the total urban
area is only 4.5%, which is much lower than other large cities in the world (Table 2.2.5). On
the other hand, roads in the old CBD are well provided both in terms of density and network
(i.e., at a high 22%, although most of the space is blocked by parked vehicles and vendors).
2-10

Comprehensive Study of the Urban Transport Development Program in Greater Yangon (YUTRA Update) Final Report | Chapter 2: Overview of the Urban and Regional Transport System
2-11
Table 2.2.4 Profile of Roads
in Greater Yangon
Table 2.2.5 International Comparison
of Shares of Road Area to Urban Area
No. of Lanes
Length (km)
Average ROW (m)
Road Area (km2)
≥ 6 lanes 126 32 4.0
≥ 4 lanes 429 24 10.3
≥ 2 lanes 2,906 8 23.2
< 2 lanes 6,349 4 25.4
Total 9,912 - 63.0
Source: Study Team from YCDC data
City / Urban Area Share (%)
Tokyo (Japan) 18.4
Seoul (Korea) 13.2
Singapore 10.0
Hong Kong 6.3
Taipei City (Taiwan) 7.7
Bangkok (Thailand) 7.1
Jakarta (Indonesia) 7.3 Source: Worked out by Study Team, based on Various sources.
(b) Inadequate Network Connectivity: The urban area is covered with a limited number of
major roads (i.e., four north–south roads) which lack east–west connectivity. Secondary roads,
which articulate the primary road network, are also lacking.
(c) Poor Road Standards: Many roads are narrow, winding, and not properly maintained. Road
surfaces are not smooth for cars and are also unsafe for pedestrians. Many sections tend to
get flooded during the rainy season due to poor drainage.
(d) Lack of Traffic Management: Congestion takes place in many intersections, roundabouts,
and road sections, especially around shopping centers and schools due to unregulated
roadside parking and loading/unloading practices. Pedestrians are also not provided with
adequate safety facilities and a comfortable walking environment.
2.17 After the YUTRA study of 2013, the Bayint Naung Bridge was completed in 2014 and the new
Thaketa Bridge is currently under construction using grant aid from JICA. The project on the
construction of the Bago River Bridge is also underway using Japanese ODA Loan. The construction
of Dala Bridge connecting Dala area with Pyay Road is expected to commence. Other donors are
involved in road and bridge projects in the study area. In addition to roads and bridges, the number
of flyovers has increased: From three (3) during the time of the YUTRA study in 2013, five more
were finished by end-September 2016. Two (2) flyovers that were planned by the previous
government were cancelled by the new administration in March 2016.
4) Traffic Congestion
2.18 Why has traffic congestion become the most critical concern of many cities, including those in
developed countries? It is because the economic, social, and environmental costs of traffic
congestion are significant. It affects many sectors of society not only transport but also socio-
economy, environment, and urban land use. Traffic congestion reduces the mobility of people and
accessibility to services, resulting in increased travel costs and discomfort. Traffic congestion also
tends to increase air pollution and gasoline consumption. Traffic congestion negatively affects a
city’s competitiveness, livability, and environmental sustainability, as well as degrades its image.
Traffic congestion hits the low-income groups more negatively.
2-11

Comprehensive Study of the Urban Transport Development Program in Greater Yangon (YUTRA Update) Final Report | Chapter 2: Overview of the Urban and Regional Transport System
2-12
Source: YUTRA Study (2013)
Source: Myanmar Statistical Yearbook 2015
Figure 2.2.9 Congestion-prone
Locations in Yangon City
Figure 2.2.10 Number of Traffic Accidents in Yangon Region
by Cause
Table 2.2.6 Understanding of Traffic Congestion
Area of Negative Impact Main Issue/ Cause Location
Mobility of people Smooth flow of goods Accessibility to services Safety and comfort Transport cost (time, vehicle) Energy cost Environmental cost (air, noise) Image of the city
Road network: bottlenecks and missing links Parking: facilities/ space, management (fee) Public transport services: coverage, accessibility, quality,
driving manner, boarding/ alighting practice, bus stops (location and facility), etc.
Roadside vendors, schools, commercial activities Jay walking Sidewalks/ pedestrian facilities and walkability People’s awareness
Main corridors Secondary roads CBD Area: clusters, urban block Point: specific area (e.g.
school, shopping center, industrial park, etc.)
Source: Study Team
2.19 Solving traffic congestion in large urban areas requires long-term and constant attention of the
government and road users. There are four key areas that must be attended to in mitigating the
negative impacts of traffic congestion.
(a) Lack of Infrastructure Development: Without adding transport capacities, demand cannot
be met. Development infrastructure ranges from proper maintenance; minor improvement;
rehabilitation; removal of bottlenecks/missing links; construction of new roads including
bridges, elevated expressways, and exclusive transit lines (BRT, MRT), among others.
Priorities must be given to basic, low-cost house-keeping measures.
(b) Inadequate Provision and Use of Road Space: Inefficient use of available road space is
one of the most obvious reasons for traffic congestion in Yangon.
(c) Sharp Increase in Private Vehicles and Lack of Competitive Public Transport Services:
Of the total current demand of 11 million trips/day, about 40% and 20% are shouldered by
0.0
0.5
1.0
1.5
2.0
2.5
3.0
3.5
2010 2011 2012 2013 2014
Num
ber o
f Tra
ffic
Acc
iden
ts b
y C
ause
s
(000) OthersViolation by PedestriansViolation by Vehicle PassengersRoad defectMotor vehicles defectDriver's carelessness
2-12

Comprehensive Study of the Urban Transport Development Program in Greater Yangon (YUTRA Update) Final Report | Chapter 2: Overview of the Urban and Regional Transport System
2-13
buses and other modes of public transport (truck bus, taxi, rail, waterway), respectively. Bus
ridership has gradually decreased, as passengers shifted to private cars and taxis. Although
the number of buses has increased, the units are mostly old. The sharp increase in private
vehicle numbers tends to worsen traffic congestion, affecting bus operation more negatively.
(d) Need for Expansion and improvement of Bus Services: In terms of passenger-km, bus
meets 73% of total passenger demand although bus occupies only 21% of road space. Bus is
so space-efficient that its services have to be expanded. At the same time, private vehicle
traffic must be controlled to give priority to bus operation in view of the limited road space.
Table 2.2.7 Vehicle Registration in Yangon Region
Mode No. of Units (000)
2016/2012 2012 2014 2016
Passenger Car2) 160,290 269,829 329,793 2.1
Truck Light 16,426 48,948 123,700 7.5
Heavy 10,916 16,917 17,257 1.6
Bus 11,393 13,036 15,524 1.4
M/C 56,379 142,830 253,440 4.5
Others 13,306 22,375 33,523 2.5
Total 268,710 513,935 773,237 2.9
1) From the website of the Department of Road Transport Administration, as of June 2016. 2) Taxis are included. Source: Department of Road Transport Administration
5) Bus Transport
2.20 Public transport in Yangon heavily relies on buses, which share about 40% of the total
motorized trips and carry about 2 million passengers a day. Considering the importance of bus
services and in response to the needs of the people, the Government has committed to reform the
system drastically. The reform program was initiated in January 2017 by restructuring bus routes
from 3333 to 70, which was later increased to 91 in August 2017. More than 100 companies and
operators were amalgamated into 8 groups. New buses are being introduced to replace old ones.
ICT in the form of GPS, and CCTV is being introduced gradually. Improvement of bus stops and
terminals are also about to commence. Although the reform program still has many areas that need
further improvement, it has been favorably accepted by bus users. Since February 2018, JICA TA
Project names “The Project for Improving Public Bus Service in Yangon” has been launched.
3 As of August 2016.
2-13

Comprehensive Study of the Urban Transport Development Program in Greater Yangon (YUTRA Update) Final Report | Chapter 2: Overview of the Urban and Regional Transport System
2-14
6) Railways
2.21 The current Myanmar Railway lines in the study area are operated poorly and have low
transport capacity due to deteriorated infrastructure and a lack of maintenance although there is
some demand from people who want to use the railway more. The maximum speed is approximately
25–30 km/h even on comparatively well-maintained sections (Yangon–Mandalay Main Line and
Yangon–Pyay Main Line) in the study area. Branch lines are in poor condition and the speed is quite
slow at about 5–10 km/h. The Yangon Circular Line is currently being upgraded. Toward railway
modernization, Japan government supports both sides of hardware and software.
2.22 The daily peak hours are from 07:00–09:00 in the morning (peak ratio of 11%) and 17:00–
18:00 in the evening (peak ratio of 17%). Four trains/hour (15 minutes interval) are operated in the
peak hour. About 42% and 36% of railway passengers use the railway to go home and to go to work,
respectively. The main means of access to the stations is by walking (72% of all railway users) due
to poor feeder services. Continuous urban railway development, including the enhancement of
feeder services, is required.
2.23 There are 25 at-grade crossings along the circular rail. Some level crossings with roads cause
traffic congestion (e.g., Parami Road, Main Road No. 4, Bayint Naung Road, etc). However, an
analysis conducted in one of the studies for the upgrading of the circular rail indicated that rail level
crossings would not become traffic bottlenecks when railway signal and nearby road traffic signals
were synchronized4.
7) Taxi
2.24 The total number of registered taxis increases by over 3 times from 2011 to 2017. Since
government changed the vehicle import policy in 2013, the number of taxis increased rapidly.
Currently, the total number of taxi in Yangon reached over 70,000. YRTA is planning to half the
number of taxis5.
Table 2.2.8 Number of Taxi in Yangon Region
2011 2012 2013 2014 2015 2016 2017
24,288 31,931 46,460 55,000 60,522 68,731 over 70,000 Source: Worked out by Study Team, based on Various sources.
2.25 The fare of taxi is based on the negotiation. According to the drivers, taxi fares will vary
depending on the congestion. The fare rate is assumed to be commodity charge which shorter trips
have higher fare rate.
Table 2.2.9 Fare System of Taxi in Yangon (Kyat)
2 km 3 km 4 km 5 km 6-8 km 9-12 km 13-15 km
1,500 2,000 2500 3000 3500 4500 5500
Source: Interview with Taxi Drivers
2.26 Currently, mobile application based taxi services are being expanded in Yangon: Hello Cab
and Oway Ride are the local service providers introduced in 2016. The foreign based services, Grab
(Singapore based) and Uber (US based) expanded into Myanmar since 2017.
4 Working Paper: Signal System for Level crossing, Basic Design Study on The Yangon Circular Railway Line Upgrading Project (Signalling, Rolling Stock) (YCR-RS/BD), 2016 5 https://www.mmbiztoday.com/articles/yrta-halve-number-yangon-taxis-fight-against-traffic
2-14

Comprehensive Study of the Urban Transport Development Program in Greater Yangon (YUTRA Update) Final Report | Chapter 2: Overview of the Urban and Regional Transport System
2-15
8) Inland Water Transport
2.27 There are seven main inland waterway routes in the study area, namely Yangon River, Bago
River, Hlaing River, Panhlaing River, Twante Canal, Pazundaung Creek, and Khanaungto Creek.
Three routes are regularly operated by IW transport (IWT), i.e., Pansodan–Dala (Ferry service of 1
km, ferry, 0.8 million a month), Wadan–Dala (2 km, Ro-Ro, 8.5 thousands a month) and Land Thit–
Kha Naung Toh (6 km, ferry, 65 thousands a month).
2.28 The new water transport service called Yangon Water Bus launched the first phase which
operates between Insein and Bothtaung area. As of March 2018, The second phase (Botahtaung to
North Dagon) and third phases (Botahtaung to Thanlyin) are planned to be operated in July 2018.
2.29 Problems and Issues on Inland Water Transport are as follows:
(i) Condition of Passenger and Cargo Vessels: More than five thousands vessels have plied
inland waterways, however about half of them are more than 40-year age. Ship conditions are
generally inferior, and shortage of power, inadequate safety equipment and improper hull form
are main issues. In consideration of these situations, Japan has supported to rehabilitate the
ship docks to maintain vessels, or plans to provide vessels. As mentioned in previous phase,
three ferry boats, which have an accommodating capacity of 1,000 is schedule to be procured
by Japanese gratis fund, and will launch at the end of 2014.
(ii) Condition of Navigation Channel: Entrance into and Leave from Ports at night-time is not
performed due to inadequate navigational facilities such as leading lights and navigation
buoys. In order to maintain safety navigation and ship calling schedule, improvement and
installation of navigation aids are required as well as maintenance dredging.
(iii) Condition of Passenger Jetty: Jetty is decrepit due to inadequate maintenance, and
mooring facilities and equipment are damaged, for example, it is often observed that mooring
rope is worn-out. Regular maintenance is fundamental to keep public facilities good condition.
Establishment and introduction of maintenance system are required, and budget for
implementation should be reserved.
9) Air Transport/Gateway Airports
2.30 The existing Yangon Airport is located in the north of the city, approximately 17 km from the
city center. The airport has one runway (3,413 m) and separate terminals for international and
domestic flights. The airport has direct flights to 16 international and 15 domestic destinations (see
Table 2.2.10). The total number of daily flights is 105 for international and 129 for domestic trips.
The number of annual incoming and outgoing international and domestic passengers is 3.83 million
and 1.99 million, respectively. Peak hour time is 9:00–10:00 and 16:00–17:00.
2.31 At present, the most popular access mode to the airport is private cars, followed by taxis. The
access time to the airport from the CBD, for example, varies between 30 and 120 minutes at present.
This large fluctuation is due to traffic congestion in the CBD and on major arterial roads.
2.32 Development of new international airport is planned and Hanthawady in Bago Region, which
is 65 km away from the CBD of Yangon City is one of the candidates. The location of new
international airport will change the pattern of access to air transport dramatically when it becomes
operational.
2-15

Comprehensive Study of the Urban Transport Development Program in Greater Yangon (YUTRA Update) Final Report | Chapter 2: Overview of the Urban and Regional Transport System
2-16
Table 2.2.10 Total Number of Flights and Passengers
Destination No. of Trips1)
Inter-national
Short-haul International (BKK, DMK, SIN, KUL, PEN, HAN, SGN, CNX)
79
Mid-haul International (HKG, KMG, CAN, TPE) 20
Long-haul International (NRT, DOH, DXB, ICN) 6
Subtotal 105
Domestic 129
Total 234
1)Operating record as of May 25th, 2018 Source: Study Team
Source: Study Team
Figure 2.2.11 Origin/ Destinations of
Domestic Freight to/ from Yangon Airport
10) Gateway Port
2.33 Yangon Port consists of Yangon Main Port and Thilawa Port. is located along the Yangon
River, maintaining 8.5 m of draft during the dry season and 9.0 m during the rainy season, Yangon
Main Port accommodate 15,000 DWT vessels and Yangon Port in Thilawa Area accommodate
2,000 DWT vessels. Port facilities occupy long stretches of waterfront areas, including the CBD, and
disconnect the urban areas from the riverbank in many locations.
2.34 The Yangon Port system is composed of Yangon Main Port and Yangon Port in Thilawa Area.
The former is located 32 km from the mouth of the Yangon River and extends to about 9 km on the
left bank of the river including most of the waterfront area of the CBD. Yangon Port in Thilawa Area
is located about 16 km downstream and also built on the left bank of the river.
2.35 Major cargoes at Yangon Port are handled in container terminals, while general cargo is
handled in the general cargo terminal and coastal/inland waterway transport terminals. There are
jetties and pontoons utilized for domestic/inland waterway transport. The wharves owned by the
Myanmar Port Authority (MPA) under Ministry of Transportation and Communication, and private
companies handle general cargoes and containers.
2.36 In 2011, the cargo handling volumes at Yangon Main Port and Yangon Port in Thilawa Area
were 18.7 million tons and 3.1 million tons, respectively. Of these numbers, about 70% consisted of
imported goods. Meanwhile, container cargo handling volume was 335,000 TEUs.
Table 2.2.11 Cargo and Container Throughput in Yangon Port, 2005–2015
Year Container Cargo (000 TEU) General Cargo (000 ton)
Yangon Inner Harbor Thilawa Area Port Yangon Port (Total) Yangon Port (Total) In Ex Total In Ex Total In Ex Total In Ex Total
2005 86.1 85.8 171.9 17.0 18.8 35.8 103.1 104.6 207.7 n.a n.a n.a 2006 99.9 97.3 197.3 23.9 23.6 47.5 123.9 120.9 244.8 1,621 749 2,370 2007 111.3 111.2 226.5 19.5 23.3 42.8 130.8 134.5 265.3 1,727 885 2,612 2008 133.7 130.3 264.0 16.7 21.0 37.6 150.4 151.3 301.6 1,485 3,004 4,489 2009 152.1 151.3 303.4 9.3 14.0 23.3 161.4 165.3 326.7 2,595 1,333 3,927 2010 175.3 171.3 346.6 4.8 5.4 10.2 180.1 176.8 356.9 5,554 1,958 7,511 2011 207.5 200.5 408.0 1.4 1.0 2.5 209.0 201.5 410.5 3,132 1,877 5,009 2012 238.8 239.1 478.0 7.1 9.8 16.9 255.0 248.9 494.9 6,289 3,871 10,161 2013 310.8 306.3 617.2 5.6 7.8 13.4 316.4 314.1 630.6 7,202 5,048 12,250 2014 377.3 367.9 745.2 9.8 8.6 18.5 387.1 376.5 763.6 9,671 2,437 12,108 2015 n.a n.a n.a n.a n.a n.a n.a n.a n.a 11,526 775 12,301
Source: Myanmar Port Authority
2-16

Comprehensive Study of the Urban Transport Development Program in Greater Yangon (YUTRA Update) Final Report | Chapter 2: Overview of the Urban and Regional Transport System
2-17
2.3 Characteristics of Current Urban Transport Demand
1) Update of Urban Transport Demand Data
2.37 In the study, various supplemental traffic and transport surveys were conducted to update the
OD tables prepared in YUTRA I and, at the same time, to analyze the current traffic situation and
bus operation. Supplemental surveys conducted comprise the following:
(i) Screen line survey in 15 locations;
(ii) Cordon line survey in 5 locations;
(iii) Intersection traffic survey in 8 locations;
(iv) Travel speed survey on 6 roads;
(v) Bottleneck survey on seven corridors;
(vi) Interview survey on public transport access among 1,000 respondents;
(vii) Willingness-to-pay survey among 1,000 respondents;
(viii) Bus passenger boarding/alighting survey on all 80 YBS routes;
(ix) YBS bus passenger interview survey among 2,400 respondents; and
(x) Bus departure / arrival survey for Tha Khin Mya Park and Sule.
2.38 Details and main outputs of the survey are included in Technical Report No.1.
Source: Study Team
Figure 2.3.1 Location of the Supplemental Traffic Surveys
2) Demand Characteristics
2.39 Total Demand and Mode Share: In the YUTRA study conducted in 2013, a comprehensive
household interview survey was conducted. Results showed that in the study area, about 11.3
million trips were made on a normal weekday in 2013, as shown in Table 2.3.1. Of those 11.3 million
2-17
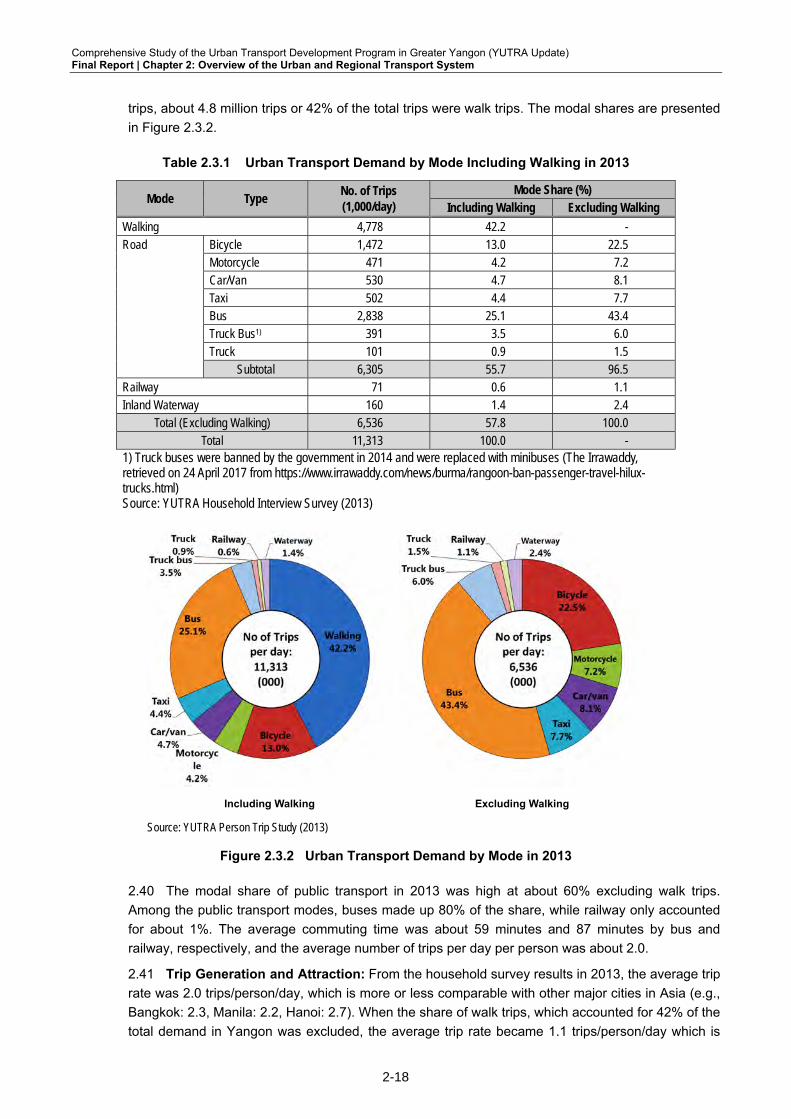
Comprehensive Study of the Urban Transport Development Program in Greater Yangon (YUTRA Update) Final Report | Chapter 2: Overview of the Urban and Regional Transport System
2-18
trips, about 4.8 million trips or 42% of the total trips were walk trips. The modal shares are presented
in Figure 2.3.2.
Table 2.3.1 Urban Transport Demand by Mode Including Walking in 2013
Mode Type No. of Trips (1,000/day)
Mode Share (%) Including Walking Excluding Walking
Walking 4,778 42.2 - Road Bicycle 1,472 13.0 22.5
Motorcycle 471 4.2 7.2 Car/Van 530 4.7 8.1 Taxi 502 4.4 7.7 Bus 2,838 25.1 43.4 Truck Bus1) 391 3.5 6.0 Truck 101 0.9 1.5
Subtotal 6,305 55.7 96.5 Railway 71 0.6 1.1 Inland Waterway 160 1.4 2.4
Total (Excluding Walking) 6,536 57.8 100.0 Total 11,313 100.0 -
1) Truck buses were banned by the government in 2014 and were replaced with minibuses (The Irrawaddy, retrieved on 24 April 2017 from https://www.irrawaddy.com/news/burma/rangoon-ban-passenger-travel-hilux-trucks.html) Source: YUTRA Household Interview Survey (2013)
Including Walking Excluding Walking
Source: YUTRA Person Trip Study (2013)
Figure 2.3.2 Urban Transport Demand by Mode in 2013
2.40 The modal share of public transport in 2013 was high at about 60% excluding walk trips.
Among the public transport modes, buses made up 80% of the share, while railway only accounted
for about 1%. The average commuting time was about 59 minutes and 87 minutes by bus and
railway, respectively, and the average number of trips per day per person was about 2.0.
2.41 Trip Generation and Attraction: From the household survey results in 2013, the average trip
rate was 2.0 trips/person/day, which is more or less comparable with other major cities in Asia (e.g.,
Bangkok: 2.3, Manila: 2.2, Hanoi: 2.7). When the share of walk trips, which accounted for 42% of the
total demand in Yangon was excluded, the average trip rate became 1.1 trips/person/day which is
2-18

Comprehensive Study of the Urban Transport Development Program in Greater Yangon (YUTRA Update) Final Report | Chapter 2: Overview of the Urban and Regional Transport System
2-19
quite low compared to those of Manila and Hanoi, at 1.8 and 2.0, respectively. Trip rates in Yangon
varied significantly by type of urban area. In the inner urban areas, trip rates were much higher than
those in outer areas (see Figure 2.3.3).
Source: YUTRA Person Trip Study (2013)
Figure 2.3.3 Trip Rates in 2013 by Urban Cluster
2.42 Distribution of Demand: The distribution of public and private demand was quite different.
Private transport demand was rather concentrated in the central part of urban areas, while public
transport demand was spread more widely over urban areas.
Bus Trip Distribution Private Trip Distribution
Source: Study Team.
Figure 2.3.4 Trip Distribution in 2016
2-19

Comprehensive Study of the Urban Transport Development Program in Greater Yangon (YUTRA Update) Final Report | Chapter 2: Overview of the Urban and Regional Transport System
2-20
2.43 Trip Lengths: The average trip length in 2013 varied by mode. Bus users traveled the longest
at 8.4 km, followed by truck bus users6 (7.3 km), taxi users (6.9 km), and car/van users (5.7 km).
Railway users traveled over 10.6 km, while IWT users cruised for 3.2 km. The average travel time
for public transport users was about one hour, which can be compared to about 40 minutes for
car/taxi users (see Table 2. 3. 3).
Table 2.3.2 Average Travel Length and Travel Time in 2013
Mode Average Travel
Length (km) Average Travel
Time (min) Walking 0.5 14.1 Road Private Bicycle 1.6 17.1
Motorcycle 3.8 17.2 Car/Van 5.7 39.5 Taxi 6.9 42.6 Truck 7.4 52.5
Public Bus 8.4 61.2 Truck Bus 7.3 52.9
Subtotal 8.3 60.2 Railway 10.6 69.0 Waterway 3.2 61.1
Total (Excluding Walking) 5.9 44.4 Total 3.5 32.2
Source: YUTRA Person Trip Study (2013)
2.44 Hourly Distribution of Demand: In 2013 the peak hour time was from 7:00 to 9:00.
Approximately 23% of the daily demand was concentrated during this two-hour period. “To work”
and “to school” trips shared the substantial part of the demand (see Figure 2.3.5).
Source: YUTRA Person Trip Study (2013)
Figure 2.3.5 Urban Transport Demand by Hour in 2013
3) Road Traffic Demand
2.45 To capture the changes in traffic demand inside the study area since 2013 and to provide data
for the calibration and verification of the traffic demand, a screen line survey was conducted
comprising manual classified-traffic counts and vehicle occupancy surveys.
2.46 A summary of the results of the screen line surveys in YUTRA in 2013 and in this study is as
follows:
6 Truck buses were banned by the government in 2014 and replaced with minibuses
2-20

Comprehensive Study of the Urban Transport Development Program in Greater Yangon (YUTRA Update) Final Report | Chapter 2: Overview of the Urban and Regional Transport System
2-21
(a) Changes in Road Traffic crossing Hlaing River: Due to extensive developments of
industrial estates and factories on the west side of Hlaing River, traffic across the entire
screen line increased by 1.77 times between 2013 and 2016 with an annual average growth
rate of 21.0% (numerical growth of 55,928 PCUs). In terms of vehicles, there were 128,470
PCUs in 2016 compared to 72,542 PCUs in 2013. This is shown in the following table.
Table 2.3.3 Traffic Growth across the Hlaing River Screen Line
Vehicle Type Volume (PCU) Growth Rate
2013 2016 2016/2013
Car 11,306 24,358 2.15
Taxi 14,148 35,462 2.51
Small Bus 2,651 4,861 1.83
Large Bus 3,889 4,123 1.06
Light Goods Vehicle (LGV) 27,970 30,415 1.09
Heavy Goods Vehicle (HGV) 12,578 29,251 2.33
Total 72,542 128,470 1.77 Source: Screen Line Survey
(b) Changes in Road Traffic Demand crossing Bago River: Between 2013 and 2016, PCU
traffic crossing Bago River increased by 1.68 times but in terms of numerical growth, traffic
only increased by 16,379 PCUs compared to the increase in the number of vehicles crossing
Hlaing River. This was because as of 2016, there were still relatively few developments on
the eastern side of Bago River.
Table 2.3.4 Traffic Growth across the Bago River Screen Line
Vehicle Type Volume (PCU) Growth Rate
2013 2016 2016/2013
Car 5,118 10,530 2.06
Taxi 5,059 8,471 1.67
Small Bus 1,179 3,890 3.30
Large Bus 2,734 2,814 1.03
Light Goods Vehicle (LGV) 6,919 8,543 1.23
Heavy Goods Vehicle (HGV) 3,061 6,201 2.03
Total 24,070 40,449 1.68 Source: Screen Line Survey
4) Traffic in Major Intersections
2.47 One of the biggest bottlenecks in Yangon City’s road network is the design and operation of
the intersections, many of which were already congested during the YUTRA study in 2013. A
number of flyovers were being constructed then even without sufficient analysis of the affected
intersections. The construction of a couple of the planned flyovers was eventually suspended
because the issue of whether or not they could really contribute to network efficiency had not been
resolved. The concern then was that traffic queues might just transfer to the at-grade intersection
next/ nearest to the flyovers. The locations of constructed flyovers are shown in Table 2. 3. 6 and
Figure 2. 3. 6.
2.48 Based on the results of the survey conducted to assess the effectiveness of Kokkaing Flyover
and 8 Mile Flyover, it was concluded that flyovers could increase the overall traffic capacity of
intersections and help reduce congestion on the corridor. This implies that flyovers are effective in
2-21

Comprehensive Study of the Urban Transport Development Program in Greater Yangon (YUTRA Update) Final Report | Chapter 2: Overview of the Urban and Regional Transport System
2-22
some locations, especially where there are major traffic flows, and that flyovers must be provided
along the major corridors.
Table 2.3.5 Flyovers in Yangon City
Flyover Opening Date
1 Hledan Flyover April 2013
2 Bayintnaung Flyover December 2013
3 Shwe Gon Daing Flyover March 2014
4 Myaynigone Flyover March 2015
5 Kokkaing Flyover February 2016
6 8 Mile Flyover March 2016
7 Insein Flyover March 2016
8 Tarmwe Flyover July 2017
Source: Study Team
Source: Study Team
Figure 2.3.6 Flyovers in Yangon City
5) Changes in Road Traffic in the Airport
2.49 The following tables show the growth in road traffic in the airport. Vehicles crossing the airport
cordon line, i.e., vehicles entering or exiting the airport, increased by 1.80 times with an annual
average growth rate of 21.7%.
(i) At Airport Road (West), the western entry point to Yangon International Airport, taxis showed
the highest annual average growth rate, which was 21.7%. This is probably due to the growth
in air traffic since 2013 and the increased demand to travel to/from the city by travelers.
(ii) At Airport Road (East), cars and large buses showed the largest annual average growth rates
in vehicle traffic. This entry point is primarily used by airport workers and the growth in trips by
these vehicle types suggests that an increase in employment at the airport occurred along
with the growth in air traffic to Yangon.
Table 2.3.6 Traffic Growth on the Airport Road Cordon Line
Vehicle Type Volume (PCU) Growth Rate
2013 2016 2016/2013
Car 9,775 19,004 1.94
Taxi 10,791 20,451 1.90
Small Bus 336 571 1.70
Large Bus 147 163 1.11
Light Goods Vehicle (LGV) 5,522 7,898 1.43
Heavy Goods Vehicle (HGV) 1,106 1,749 1.58
Total 27,677 49,836 1.80 Source: Cordon Line Survey
2-22

Comprehensive Study of the Urban Transport Development Program in Greater Yangon (YUTRA Update) Final Report | Chapter 2: Overview of the Urban and Regional Transport System
2-23
6) Volume of External Road Traffic
2.50 In order to gauge the changes in intercity traffic demand between the study area and outer
areas since 2013, a cordon line survey was conducted which involved a 24-hour manual classified
count for vehicles and a 24-hour roadside origin-destination (OD) interview survey. OD survey
results were used to make 2016 OD trip tables.
2.51 Between 2013 and 2016, the total traffic demand on the cordon line increased by 1.2 times.
Table 2.3.7 Road Traffic Growth on the Cordon Line, 2013–2016
Location Vehicle Type Volume (PCU) Growth Rate
2013 2016 2016/2013
Entire Cordon Car 7,558 19,996 2.65
Taxi 2,683 14,427 5.38
Small Bus 1,240 6,177 4.98
Large Bus 5,757 7,053 1.23
Light Goods Vehicle (LGV) 14,284 26,030 1.82
Heavy Goods Vehicle (HGV) 11,496 19,296 1.68
Total 43,019 92,979 2.16 Source: 2016 Cordon Line Survey, YUTRA II.
2-23

Comprehensive Study of the Urban Transport Development Program in Greater Yangon (YUTRA Update) Final Report | Chapter 3: Traffic Demand Forecast
3-1
3 TRAFFIC DEMAND FORECAST
3.1 Approach and Methodology
1) Overview of Approach
3.1 The traffic demand analysis approach has been kept simple, as the original YUTRA traffic
model was already comprehensive. The approach was based on the use of a transport database
which was updated based on the following:
(i) Results of the recent (2014) census to update the socio-economic database;
(ii) Updates on urban development information from recent studies conducted for Greater Yangon including the Strategic Urban Development Plan for Greater Yangon (SUDP) and others;
(iii) Results of supplemental traffic surveys conducted in this study; and
(iv) Update information about ongoing and planned transport projects.
3.2 Regarding the demand forecast methodology, five major tasks were carried out:
(i) Updating of the socio-economic framework for 2016 and forecast years;
(ii) Preparation and updating of the transport model networks for 2016;
(iii) Development of the initial 2016 OD trip table by mode using the YUTRA 2013 & 2018 synthesized trip tables;
(iv) Analysis of recent traffic survey data and validation of models for the network and trip tables by mode to calibrate the 2016 situation; and
(v) Forecasting of demand and assessment of network to develop and evaluate the master plan.
3.3 The overall approach to update and forecast the demand is shown in Figure 3.1.1. The traffic
zone system which was applied in the analysis was the same one used in the 2013 YUTRA.
Source: Study Team
Figure 3.1.1 Flowchart for Updating Demand Analysis
3-1

Comprehensive Study of the Urban Transport Development Program in Greater Yangon (YUTRA Update) Final Report | Chapter 3: Traffic Demand Forecast
3-2
Source: Study Team
Figure 3.1.2 Traffic Zones in the Study Area
3-2

Comprehensive Study of the Urban Transport Development Program in Greater Yangon (YUTRA Update) Final Report | Chapter 3: Traffic Demand Forecast
3-3
2) Update of Socio-economic Framework
3.4 The development of the future socio-economic framework comprised of two parts, as shown
in Figure 3.1.3. The first part is developing the socio-economic baseline (2016) which was done by
updating the 2013 YUTRA data using the 2014 census results, then projecting the results to 2016
using 1999 and other historical census data. The second part was forecasting the target-year
socioeconomic framework based on the updated SUDP, reviewing ongoing and committed projects,
and identifying urban development constraints.
Source: Study Team Figure 3.1.3 Updating the Base-year (2016) and Forecasting the 2035 Socio-economic Framework
CBD Latha, Lanmadaw, Panbetan, Kyauktada, Botataung, Pazundaung
Central Cluster Alone, part of Kyeemyindaing, Dagon, Mingalar Taung Nyunt, Seikkan
Inner Cluster IU-01 Inner North West: San Chaung, Kamayut, Hlaing IU-02 Inner North: Bahan, Tarmwe, Yankin, Thingankyun, South Okkalapa IU-03 Inner East: Dawpon, Tharkayta IU-04 Inner South West: part of Kyeemyindaing, Seikgyikanaungto, part of Twantay IU-05 Inner South: part of Dala IU-06 Inner East: Thanlyin
Outer Cluster SU-01 Outer North West: part of Mayangone, Insein SU-02 Outer North: part of Mayangone, part of Mingalardon, North Okkalapa SU-03 Outer North East: North Dagon, South Dagon, parts of East Dagon and Dagon Seikkan SU-04 Outer West: Hlaingtaryar SU-05 Outer South West: part of Twantay SU-06 Outer South: parts of Dala and Twantay SU-07 Outer East: part of Thanlyin SU-08 Outer South East (Thilawa): Kyauktan, part of Tanlyin
Far Outer Cluster OA-01 Far Outer North West: Shwepyitar, part of Hmawbi OA-02 Far Outer North: part of Mingaladon, Hlegu, part of Hmawbi OA-03 Far Outer North East: parts of East Dagon and Dagon Seikkan OA-04 Far Outer West: Htantabin OA-05 Far Outer South East: part of Kyauktan OA-06 Far Outer East: part of Thanlyin
Source: Study Team
Figure 3.1.4 Proposed Land Use in SUDP (2035) and Locations of Urban Clusters
3-3

Comprehensive Study of the Urban Transport Development Program in Greater Yangon (YUTRA Update) Final Report | Chapter 3: Traffic Demand Forecast
3-4
3.5 The key drivers of traffic demand on an existing or a proposed network are socio-economic
factors such as: population, employment, vehicle ownership, GDP growth, changes in travel patterns,
and the shift to/from other competing/ complementary modes. In addition, specific developments,
such as a new port, special economic zones (SEZs), or the relocation of other similar special traffic
generators, could impact traffic demand.
3.6 The socio-economic framework developed by the SUDP study was based on the likely future
land use, distribution of population, employment, and development of new sub-centers and SEZs in
Greater Yangon. The future land use is depicted in Figure 3.1.4, while the corresponding population
distribution is summarized in Table 3.1.1. The population is expected to grow substantially over the
next two decades to about 9.5 million inhabitants. The areas expected to post the highest growth
would be the outer and new suburbs. Populations in the CBD and the city center are likely to decline
as these areas are already fairly saturated.
Table 3.1.1 Current and Forecast Population
No. Area Description 2016
Population (‘000)
2035 Population
(‘000)
Growth (2035/2016)
Average Annual Growth
Ratio (%)
1 CBD 222 196 0.9 -0.7 2 Central Cluster 321 342 1.1 0.3 3 Inner Urban Cluster 1,713 1,990 1.2 0.8 4 Outer Cluster 2,951 4,708 1.6 2.5 5 Far Outer Cluster 981 2,258 2.3 4.5
Total of Greater Yangon 6,188 9,495 1.5 2.3 Source: JICA SUDP study forecast.
3.7 The economic growth in Greater Yangon was forecast in the YUTRA study, and it shows a
healthy growth. The economy will grow by more than 4.7 times from the 2016 level by 2035 (see
Table 3.1. 2). Such economic growth would increase the GRDP/capita to over USD7,500 per annum.
It has been proven that there is a direct correlation between increase in incomes and growth in car
ownership in growing economies. Models derived from the 2013 Household Interview Survey (HIS)
data predict that car ownership would increase from around 10–15 cars per one thousand population
to about 35 cars.
Table 3.1.2 GRDP Growth Rates, 2016–2035
Year Average Annual Growth Ratio (%)
Factor (Base=2016)
2016 - 1.00 2020 9.10 1.42 2025 8.40 2.12 2030 8.30 3.16 2035 8.30 4.71
Source: YUTRA Forecast
3-4

Comprehensive Study of the Urban Transport Development Program in Greater Yangon (YUTRA Update) Final Report | Chapter 3: Traffic Demand Forecast
3-5
3.8 Other changes in the socio-economic characteristics of the study area population which would
impact the growth in travel demand are summarized in Table 3.1.3.
Table 3.1.3 Key Traffic Growth Variables in 2016 and 2035
Description 2016 2035 % AAGR
Population in Full-time Employment (‘000) 2,595 5,796 4.3
Population in Full-time Student (‘000) 1,566 2,498 2.5
Employment Participation Rate (Emp./Pop.) 0.42 0.61 2.0
Vehicle Ownership (% of Households.) 15 35 4.6
Note: Estimated by the JICA Study Team
3.9 The increase in population, GRDP, and the effect of other socio-economic indicators would
lead to a growth in trip numbers as more available vehicles naturally lead to more trips per capita.
3.10 These factors were used in the travel demand ‘Trip End’ model to estimate the future number
of trips by both private and public modes. Similarly, there would be an increase in goods vehicle trips.
The trip ends estimated were distributed using the ‘Furness’ process to present the total demand in
OD matrices by mode.
Table 3.1.4 Day-time Population in 2035
Area Day-time Populatio
n (000)
No. of Employees in Workplaces No. of Students in School Primar
y Secondary
Tertiary Total
Primary
Secondary
Highschool
Higher Total
CBD 511 0 38 398 436 10 10 18 25 63 Central 523 0 30 358 388 17 19 22 35 92
Inner Cluster
IU-01 Inner North West 447 0 32 295 328 17 19 23 25 85 IU-02 Inner North 804 0 57 486 542 34 38 54 47 173 IU-03 Inner East 325 0 36 180 216 14 16 19 9 59 IU-04 Inner South West 226 2 6 118 126 12 13 16 24 65 IU-05 Inner South 283 1 15 131 146 12 12 25 33 82 IU-06 Inner South East 153 0 5 43 48 12 13 10 10 45
Total 2,238 4 151 1,253 1,407 100 111 149 148 508
Outer Cluster
SU-01 Outer North West 481 3 94 197 295 24 27 23 41 116 SU-02 Outer North 774 8 115 306 429 41 46 55 87 228 SU-03 Outer North East 1,440 0 81 671 752 77 86 105 195 463 SU-04 Outer West 772 0 167 268 435 54 60 54 71 239 SU-05 Outer South West 103 7 13 47 67 6 6 6 4 22 SU-06 Outer South 88 0 5 47 52 4 5 6 3 19 SU-08 Outer South East (Thilawa) 253 1 79 51 132 10 11 19 48 89 SU-07 Outer East 409 7 94 135 236 18 20 32 68 138
Total 4,322 27 648 1,724 2,399 234 261 301 518 1,314
Far Outer Cluster
OA-01 Far Outer North West 746 28 233 146 407 44 49 45 34 172 OA-02 Far Outer North 560 34 157 175 366 34 38 30 26 127 OA-03 Far Outer North East 447 31 77 133 240 20 22 17 108 167 OA-04 Far Outer West 121 21 25 30 76 7 8 6 5 27 OA-05 Far Outer South East 60 4 14 25 43 3 4 4 3 13 OA-06 Far Outer East 60 11 11 12 35 4 5 3 2 15
Total 1,995 129 517 520 1,166 112 125 106 177 521 Greater Yangon Total 9,589 159 1,384 4,253 5,796 474 526 595 902 2,498
Source: the Study Team
3-5

Comprehensive Study of the Urban Transport Development Program in Greater Yangon (YUTRA Update) Final Report | Chapter 3: Traffic Demand Forecast
3-6
Table 3.1.5 Night-time Population in 2035
Area Night-time Population
(000)
No. of Employees in Workplaces No. of Students in Schools Prima
ry Secondary
Tertiary Total
Primary
Secondary
Highschool
Higher Total
CBD 196 0 13 114 126 10 10 12 25 57 Central 342 0 20 179 199 17 19 22 43 101
Inner Cluster
IU-01 Inner North West 347 0 27 197 224 17 19 23 29 89 IU-02 Inner North 678 0 47 347 394 34 37 45 78 195 IU-03 Inner East 290 0 30 138 169 15 16 19 21 71 IU-04 Inner South West 209 2 12 107 122 10 11 11 20 53 IU-05 Inner South 234 2 10 109 121 12 12 12 22 58 IU-06 Inner South East 232 0 12 108 120 12 13 13 15 52
Inner Cluster Total 1,990 5 138 1,006 1,149 100 109 124 185 518
Outer Cluster
SU-01 Outer North West 492 3 86 197 286 25 27 33 52 136 SU-02 Outer North 824 10 96 374 479 41 45 55 87 228 SU-03 Outer North East 1,546 0 90 809 899 77 85 97 162 422 SU-04 Outer West 1,077 0 209 487 696 54 59 68 102 283 SU-05 Outer South West 114 4 22 47 74 6 6 7 7 26 SU-06 Outer South 90 1 4 47 52 5 5 6 6 21 SU-08 Outer South East (Thilawa) 205 2 66 51 119 10 11 13 19 54 SU-07 Outer East 359 5 104 123 232 18 20 20 34 92
Total 4,708 25 677 2,136 2,837 235 259 299 469 1,262
Far Outer Cluster
OA-01 Far Outer North West 890 41 233 243 518 45 49 56 56 206 OA-02 Far Outer North 677 44 175 219 437 34 37 38 64 173 OA-03 Far Outer North East 395 13 77 166 255 20 22 25 33 100 OA-04 Far Outer West 144 14 42 37 93 7 8 8 9 32 OA-05 Far Outer South East 67 2 14 31 47 3 4 4 4 15 OA-06 Far Outer East 86 17 14 25 55 4 5 5 5 19
Total 2,258 131 554 720 1,405 113 124 135 172 544 Greater Yangon Total 9,495 161 1,402 4,155 5,717 475 521 593 894 2,482
Source: the Study Team
Table 3.1.6 Day-Night Population Ratio in 2035
Area Population No. of Employees in Workplaces No. of Students in Schools
Primary
Secondary
Tertiary Total
Primary
Secondary
Highschool
Higher Total
CBD 2.6 n/a 3.0 3.5 3.5 1.0 1.0 1.5 1.0 1.1 Central 1.5 n/a 1.5 2.0 2.0 1.0 1.0 1.0 0.8 0.9
Inner Cluster
IU-01 Inner North West 1.3 n/a 1.2 1.5 1.5 1.0 1.0 1.0 0.9 1.0 IU-02 Inner North 1.2 n/a 1.2 1.4 1.4 1.0 1.0 1.2 0.6 0.9 IU-03 Inner East 1.1 n/a 1.2 1.3 1.3 1.0 1.0 1.0 0.4 0.8 IU-04 Inner South West 1.1 1.0 0.5 1.1 1.0 1.1 1.1 1.5 1.2 1.2 IU-05 Inner South 1.2 0.5 1.5 1.2 1.2 1.0 1.0 2.0 1.5 1.4 IU-06 Inner South East 0.7 n/a 0.4 0.4 0.4 1.0 1.0 0.8 0.7 0.9
Total 1.1 0.8 1.1 1.2 1.2 1.0 1.0 1.2 0.8 1.0
Outer Cluster
SU-01 Outer North West 1.0 1.2 1.1 1.0 1.0 1.0 1.0 0.7 0.8 0.9 SU-02 Outer North 0.9 0.8 1.2 0.8 0.9 1.0 1.0 1.0 1.0 1.0 SU-03 Outer North East 0.9 n/a 0.9 0.8 0.8 1.0 1.0 1.1 1.2 1.1 SU-04 Outer West 0.7 n/a 0.8 0.6 0.6 1.0 1.0 0.8 0.7 0.8 SU-05 Outer South West 0.9 1.6 0.6 1.0 0.9 1.0 1.0 0.8 0.6 0.8 SU-06 Outer South 1.0 0.0 1.2 1.0 1.0 1.0 1.0 1.0 0.6 0.9 SU-08 Outer South East (Thilawa) 1.2 0.6 1.2 1.0 1.1 1.0 1.0 1.5 2.5 1.7 SU-07 Outer East 1.1 1.5 0.9 1.1 1.0 1.0 1.0 1.6 2.0 1.5
Total 0.9 1.1 1.0 0.8 0.8 1.0 1.0 1.0 1.1 1.0
Far Outer Cluster
OA-01 Far Outer North West 0.8 0.7 1.0 0.6 0.8 1.0 1.0 0.8 0.6 0.8 OA-02 Far Outer North 0.8 0.8 0.9 0.8 0.8 1.0 1.0 0.8 0.4 0.7 OA-03 Far Outer North East 1.1 2.4 1.0 0.8 0.9 1.0 1.0 0.7 3.3 1.7 OA-04 Far Outer West 0.8 1.5 0.6 0.8 0.8 1.0 1.0 0.8 0.6 0.8 OA-05 Far Outer South East 0.9 1.6 1.0 0.8 0.9 1.0 1.0 1.0 0.6 0.9 OA-06 Far Outer East 0.7 0.7 0.8 0.5 0.6 1.0 1.0 0.7 0.4 0.8
Total 0.9 1.0 0.9 0.7 0.8 1.0 1.0 0.8 1.0 1.0 Greater Yangon Total 1.0 1.0 1.0 1.0 1.0 1.0 1.0 1.0 1.0 1.0
Source: the Study Team
3-6

Comprehensive Study of the Urban Transport Development Program in Greater Yangon (YUTRA Update) Final Report | Chapter 3: Traffic Demand Forecast
3-7
3) Update of the Transport Network
3.11 The transport network for 2016 was developed by updating the 2013 YUTRA’s highway
network. The updates consisted of the following:
(i) Flyovers developed since 2013;
(ii) A new toll bridge across the Hlaing River;
(iii) Updated road network including all bridges and paved road crossings on the Yangon Circular
Railway (YCR); and
(iv) Adjustments of road capacities and speeds where road widening has taken place.
3.12 In the case of the rail network, no modifications were made to the 2013 network because
there had been no upgrading of any line to date.
3.13 The forecast 2035 transport network was based on the validated 2016 network, appropriate
scenarios currently under consideration, and committed road and rail projects. The process is
depicted in Figure 3.1.5.
Source: Study Team
Figure 3.1.5 Updating the Base-year (2016) and Forecasting the 2035 Transport Network
3-7

Comprehensive Study of the Urban Transport Development Program in Greater Yangon (YUTRA Update) Final Report | Chapter 3: Traffic Demand Forecast
3-8
4) Development of the Initial 2016 OD Trip Matrices
3.14 The initial 2016 OD tables were estimated by interpolating the YUTRA’s 2013 and 2018
synthesized trip tables for the four main modes of travel: (i) car, (ii) taxi, (iii) bus and rail, and (iv)
goods vehicles.
3.15 OD trip tables for 2016 for motorcycles (which are banned in most of the Yangon area) and
the remaining non-motorized modes (walk and bicycle) were estimated using changes in the socio-
economic framework between 2013 and 2016. This process is shown in Figure 3.1.6.
Source: Study Team
Figure 3.1.6 Updating the Base-year (2016) and Forecasting the 2035 Trip Matrices (Walk, Bicycle,
and Motorcycle)
5) Methodology for Validating Base-year (2016) Model
3.16 The validation of the base-year model was carried out by comparing the assigned traffic
volume against the observed traffic data. The initial OD trip tables for each mode were assigned to
the updated network using the traffic assignment model. The results, i.e., the assigned traffic
volumes, were then compared with the observed traffic counts across the study area’s screen and
cordon lines.
3.17 The OD trip tables for each mode were then adjusted for area-to-area movements across the
screen or cordon line accordingly and traffic was assigned to the network. The OD table adjustment
and traffic assignment were repeated until the assigned traffic volumes were within +/- 10% of the
observed counts, at which stage the model was then considered valid. The final iteration of the OD
trip matrices was deemed as the validated 2016 travel demand. This process is illustrated in Figure
3.1.7.
3-8

Comprehensive Study of the Urban Transport Development Program in Greater Yangon (YUTRA Update) Final Report | Chapter 3: Traffic Demand Forecast
3-9
Source: Study Team
Figure 3.1.7 Validating the Base-year (2016) Model
6) Methodology for Estimating Forecast-year Model
3.18 The forecast-year demand was estimated using the YUTRA’s 2035 synthesized OD tables
and the ratio of the target-year to base-year socio-economic indicators. Using the Furness
procedure, the base-year OD trip matrices were then used to yield the forecast-year OD trip tables.
3.19 The future network was developed to include target-year transport projects and development
program(s). The future-year OD matrices were assigned to the network scenario. The assigned
volumes were then analyzed in terms of network capacity, project viability, and project prioritization.
3.20 The above-mentioned analysis involves estimating the economic viability of a project or that of
the whole network. The economic impacts are estimated in terms of time savings and savings in
vehicle operating costs. In addition, network operational performance could be assessed by
analyzing the link or area-based network speed and volume-capacity ratio (V/C Ratio). These
indicators provide information on network capacity deficiencies and levels of service. This process is
illustrated in Figure 3.1.8.
3-9

Comprehensive Study of the Urban Transport Development Program in Greater Yangon (YUTRA Update) Final Report | Chapter 3: Traffic Demand Forecast
3-10
Source: Study Team
Figure 3.1.8 Forecast-year Demand Modelling
7) Travel Demand Characteristics
(1) Traffic Analysis Zones in the Study Area
3.21 The study area comprised of the entire area under the jurisdiction of the Yangon City
Development Committee (YCDC) and parts of the adjoining townships which compose Greater
Yangon. This area is referred to as the inner study area. For demand modelling, this area was
divided into 154 traffic analysis zones. Meanwhile, special traffic generators, such as the Yangon
International Airport, Yangon Port, two Yangon bus terminals, and the existing freight terminal, were
represented by six zones.
3.22 The areas beyond the inner study area were represented by 25 zones, and three additional
dummy zones were included to represent the future airport, port, and freight terminal. Table 3.1.7
summarizes the zones.
Table 3.1.7 Traffic Zones in the Study Area and Comparison with YUTRA
Area No. of
Townships Number of Traffic Zones
Updated YUTRA
YCDC Area 32 122 122 Special Generators in YCDC Area - 6 6 Adjoining Townships (or parts of 7 32 32
Subtotal 39 160 160 Outer Areas (Rest of Myanmar) - 25 25 Proposed Truck Terminal - 1 1 Proposed Port @ Thilawa - 1 1 Proposed Airport @ Hanthawaddy - 1 -
Total 39 188 187 Source: Study Team
3-10

Comprehensive Study of the Urban Transport Development Program in Greater Yangon (YUTRA Update) Final Report | Chapter 3: Traffic Demand Forecast
3-11
(2) Characteristics of the Base-year Transport Network
3.23 The base-year (2016) transport network was developed from the YUTRA study area network
and included the recently built eight (8) flyovers in Yangon City. In addition, all roads, bridges, and
paved level crossings which cross the YCR were included in the network. The key characteristics of
the two networks are shown in Table 3.1.8.
3.24 The level of detail of the network was based on the area, i.e., in the inner areas the network
includes all primary roads and most connecting secondary roads. In cases where the zone size is
small (e.g., CBD and old inner areas), local roads were also included in the highway network but are
treated as secondary roads.
3.25 Outside the CBD and within the study area, all major intercity national roads are included in
the network. Secondary roads of strategic importance (i.e., those that link key conurbations to
primary/national roads) and those which could become primary roads once the surrounding areas
are developed, are likewise included.
3.26 The rail network included the four main railway lines in Myanmar. The main intercity lines like
Yangon–Mandalay and Pyay lines were included up to the last station which lies inside the Greater
Yangon boundary. The three spur lines to universities are included as part of the main lines.
3.27 The main ferry service between Yangon and Dala area was also included in the network.
Table 3.1.8 Characteristics of Road and Rail Network in the Study Area
Description CBD Area
(km) Rest of
YCDC (km) Rest of Greater
Yangon (km) Total (km)
Primary Roads 22 329 104 455 Secondary / Local Roads 16 351 84 451
Total Road Length 38 680 188 906 Railway Network within Greater Yangon
Line/ System Length (km) No. of Stations
Yangon Circular Railway (YCR) 46.1 38 Pyay Line 22.4 7 Yangon Mandalay Line 42.4 8 Thilawa Line 31.7 6
Total Study Area Railway Network 142.6 59 Source: Study Team
3.28 Table 3.1.9 summarizes the road network capacities and associated maximum (free flow)
speeds. The road capacities were adopted from the YUTRA model and adjusted where appropriate.
The quoted road capacity is daily, which is 10 times the hourly capacity for each road type. Future
road capacities and free-flow speed will be based on the same table. Capacities and free flow
speeds of planned expressways are also shown in the table.
3-11

Comprehensive Study of the Urban Transport Development Program in Greater Yangon (YUTRA Update) Final Report | Chapter 3: Traffic Demand Forecast
3-12
Table 3.1.9 Road Network Capacities and Maximum Speeds by Location and Road Type
Location Road Type
No. of Lanes
Daily Capacity (PCU)
Max. Speed (km/h)
Road Length (km)
1. CBD
Secondary 1 2,200 40 2.2 2 7,600 40 13.8
Primary
1 4,500 45 0.4 2 10,000 45 13.9 3 15,000 45 5.0 4 20,000 45 11.9
2. Townships 7-13,15-21,24,25
Secondary 1 5,800 45 33.4 2 13,600 45 70.7
Primary
1 7,200 50 8.0 2 16,800 50 91.6 3 25,200 50 54.4 4 25,200 50 1.8
3. Townships 22,23,26-39
Secondary 1 8,300 50 245.3 2 17,600 50 82.8
Primary 1 9,900 60 90.0 2 21,000 60 136.7 3 31,500 60 19.4
4. Bridge Bridge 1 13,800 45 6.9 2 30,000 60 5.1 3 45,000 60 7.3
5. Flyovers Flyovers 2 30,000 60 5.4
6. Urban/Intercity (Ramps) Access 1 15,000 60 -
7. Urban/Intercity Expressway 2 40,000 100 - 3 60,000 100 - 4 80,000 100 -
Total 905.9 Source: Study Team
(3) Traffic Assignment Model Parameters
3.29 All passenger OD trip tables were converted to vehicle trips by applying average weekday
vehicle occupancy factors. These occupancy factors were derived from recent traffic surveys. These
values are given below in Table 3.1.10. Vehicle trip matrices were then converted to a common unit
for traffic assignment model. The assignment model assigns traffic in a common unit, i.e., equivalent
PCU, or more commonly known as the PCU factor. The railway assignment parameters are detailed
in Table 3.1.11.
Table 3.1.10 Assignment Model Parameters for Roads, 2016
Parameter Bicycle MC Car Taxi Bus1) Truck1)
Average 24-hour Occupancy (Person) 1.14 1.76 2.5 2.5 40.0* n/a PCU Factor 0.20 0.25 1.0 1.0 1.89* 1.64* Fare (MMK/km) n/a n/a n/a 260 18.5 n/a Value of Time (MMK/min/person) 11.6 11.0 26.9 21.0 13.5 n/a Source: Study Team 1) For bus and goods vehicles, weighted average occupancy and PCU factor for the study area are reported.
Table 3.1.11 Assignment Model Parameters for Railway, 2016
Parameter YCR Pyay Mandalay Thilawa
Average Hourly Headway of Each Line (min) 30 30 30 30 Average Speed (km/h) 16 20 25 16 Source: Study Team
3-12

Comprehensive Study of the Urban Transport Development Program in Greater Yangon (YUTRA Update) Final Report | Chapter 3: Traffic Demand Forecast
3-13
(4) Traffic Assignment Process
3.30 The combined road and rail network traffic model was used to assign the OD table. The
assignment process used is based on a well-known ‘multi-user class equilibrium’ method, where the
traffic from each OD pair is assigned iteratively to the network until no cheaper or quicker route
could be found.
3.31 The shortest-path building was based on the generalized cost of travel for private mode, and
public transport fares and wait & walk times were represented for the public modes according to the
service on each line. The equilibrium method re-calculates the new travel time based on the road
capacity and assigned traffic volume after each assignment iteration. As travel speed slows down
with the addition of more traffic after each successive iteration, the assignment process calculates
new routes and adds more traffic to the network.
3.32 The curve illustrates how speed decreases with an increase in traffic volume (see Figure
3.1.7). Two curves are shown as an example. In the assignment model, each road link is defined
from the coded free-flow speed and its associated road capacity. In the assignment process, speed
is computed for each road link after each iteration, depending on the total assigned traffic volume.
Source: Consultants’ application of BPR formulation to Yangon traffic model highway network assignment
Figure 3.1.9 Speed–Flow Relationship (Highway Assignment)
3-13

Comprehensive Study of the Urban Transport Development Program in Greater Yangon (YUTRA Update) Final Report | Chapter 3: Traffic Demand Forecast
3-14
3.2 Traffic Demand Forecast for 2035
1) Demand by Mode
3.33 The 2016 validated travel demand OD trip matrices were prepared during the traffic model
validation. These OD tables reflect the current / recent situation when compared with the 2016 traffic
counts. The forecasts for 2035 were estimated using the 2016 OD tables and 2035 trip ends derived
using the socio-economic framework. All modes of travel, including walk, trips by bicycle and
motorcycle, are forecast independently from other modes, i.e., car, taxi, bus and goods vehicles
(GV). Of interest to this study were the trips by motorized modes excluding walk, bicycle, and
motorcycle.
3.34 Trips by bicycle are usually short and localized. The share of bicycle trips is declining as the
motorized modes become more popular and dominant. In 2016 bicycle trips accounted for less than
10% of the total trips and are likely to decline to about 6% of the travel demand by 2035. Trips by
motorcycle, which are banned in major urbanized parts of the YCDC are a small proportion of total
travel demand (less than 3%) and are expected to decline further to under 3% of the total trips by
2035. Therefore, a further analysis of bicycle and motorcycle trips is not provided anymore.
3.35 The growth in travel demand by dominant travel modes from 2016 to 2035 is compared in
Table 3.2.1. It is demonstrably clear that car trips would increase at much higher rates than those of
taxis, and mostly at the expense of public transport. However, public transport trips are likely to more
than double by 2035. This shows that the need for travel would more than double (2.4 times) from
2016 to 2035, and the rate of increase is estimated to be over 4.6% per annum, which is almost
double the growth in population.
Table 3.2.1 2016 and 2035 OD Person Trips by Mode
No. Travel Mode
Validated 2016 OD Person
Trips (‘000)
2016 Mode Share (%)
Forecast 2035 OD
Person Trips (‘000)
2035 Mode Share (%)
Person Trip Growth
(2035 / 2016)
AAGR in Person Trips (%)
Total 4+
Wheel Total 4+
Wheel 1 Walk 4,624 37.5 - 5,375 24.2 - 1.16 0.8 2 Bicycle 1,091 8.8 - 1,268 5.7 - 1.16 0.8 3 Motorcycle 357 2.9 - 550 2.5 - 1.54 2.3
4 Car 1,118 9.1 17.8 4,186 18.8 27.8 3.75 7.2 5 Taxi 1,019 8.3 16.3 2,280 10.2 15.1 2.24 4.3 6 Public 4,132 33.5 65.9 8,591 38.6 57.1 2.08 3.7
4-6 4+ Wheel Modes 6,269 51 100 15,057 51 100 2.40 4.7 1-6 Total 12,339 100 - 22,250 100 - 1.80 3.2
Sources: Study Team
3.36 Changes in the share of all modes between the base year of 2016 and the forecast year of
2035 are illustrated in Figure 3.2.1. The share of walk, bicycle, and motorcycle trips would decline,
with walk trips having the biggest decline. In Asia, as societies get richer, the tendency to walk
declines. It is considered to be the mode of poor population, who tend to reside near workplaces for
lack of resources to travel, even by bus. Car share would almost double, with a small increase in taxi
trips.
3.37 Public transport is expected to increase, somewhat at the expense of walk trips. The expected
increase in public transport share is also greater than the growth in population. This should be
considered a blessing when compared with other Southeast Asian cities like Hanoi or HCMC where
3-14

Comprehensive Study of the Urban Transport Development Program in Greater Yangon (YUTRA Update) Final Report | Chapter 3: Traffic Demand Forecast
3-15
motorcycles have swamped the cities and the share of public transport is very limited, despite
massive investments in public transport.
2016 2035
Sources: Study Team
Figure 3.2.1 Mode Shares in the Base and Forecast Years
3.38 Trips by goods vehicles (GVs) are modelled as a separate category due to their nature, i.e.,
collection and delivery of goods, and the physical distribution of goods in the city. For a like-with-like
comparison and for modelling road traffic, trips by all modes and by different sizes of goods vehicles
were converted to PCU, where a ‘standard’ 4-wheel car is equivalent to 1.0 unit.
3.39 Table 3.2.2 below illustrates the 2016 and 2035 traffic in PCU trips for the four main modes (&
Motorcycle) of road traffic in Yangon. Vehicle occupancies were observed during the recent traffic
surveys and the PCU factors were sourced from the YUTRA study and compared with the factors
used in similar cities in the southeast Asia region. Trips by all types/ sizes of goods vehicles were
then added to form a single OD trip matrix in PCU.
3.40 The growth in car traffic in PCU terms is the highest, followed by the growth in GV trips. The
significance of the growth in car trips is that the impact on road traffic would be more than 2.5 times
that of the bus PCU. The taxi trip growth would be similar to that of the growth in bus passenger trips,
reflecting the need for a strong and steady public transport at an average growth rate of about 4%
per annum, in line with the growth in population and the impact of increased economic activities.
3.41 This is also due to the relative increase in the average trip rates (total trips / total population)
by each mode of travel. This increase in trip rate is reflective of the increase in average incomes and
the higher rate of vehicle availability. The distribution of population and economic activities over a
wider area would lead to longer trips and hence an increase in road traffic.
3.42 The growth in GV trips over and above the rate of the GRDP growth was estimated based on
an elasticity of 1.2, indicating that the increase in economic activities leads to more movement of
goods in and around the city and in special traffic generators, such as ports, and the development of
several SEZs in Greater Yangon.
3.43 Traffic shares of motorized road modes in PCU terms are illustrated in Figure 3.2.2. It shows a
marked increase in the share of car trips. GV trips would also increase as the proposed land use
assumes that the port and other logistics activities would increase with the increase in
3-15

Comprehensive Study of the Urban Transport Development Program in Greater Yangon (YUTRA Update) Final Report | Chapter 3: Traffic Demand Forecast
3-16
industrialization. Taxi trips would decline, so would the share of bus trips in PCU terms, as the car
becomes the dominant mode with 41% of the PCU trips on the road.
Table 3.2.2 2016 and 2035 OD Trips in PCU Trips
Travel Mode
2016 Observed
Vehicle Occupancy
Person/ Vehicle
Average PCU
Factor
2016 Validated
OD Trips (PCU)
2016 Mode Share
(%)
2035 Forecast
OD Trips (PCU)
2035 Mode Share
(%)
Growth in PCU Trips (2035/ 2016)
AAGR in PCU Trips (%)
Motorcycle 1.76 0.25 50,646 4 78,118 2 2.3 Car 2.50 1.00 447,036 32 1,674,577 41 3.75 7.2 Taxi 2.50 1.00 407,521 29 912,124 22 2.24 4.3 Bus 40.0 1.89 195,219 14 405,924 10 2.08 3.9 Goods Vehicle n/a 1.64 286,447 21 1,029,712 25 3.60 7.0
All Modes – – 1,386,869 100 4,100,455 100 2.94 5.9 Note: Forecast by the JICA Study Team.
2016 2035
Source: Study Team
Figure 3.2.2 Mode Shares in the Base and Forecast Years in PCU Trips
2) Trip Patterns
3.44 Main findings on the trip pattern are explained based on Figure 3.2.3, as follows:
(i) The 2016 distribution of public and private trips is quite different from each other. While
private transport trips were rather concentrated in the central urban areas, public transport
trips were widely spread over the urban areas. This is also verified from the supplemental
survey which shows that the average travel distance of bus passengers was much longer
than that of private car users. Meanwhile, freight traffic was concentrated in major traffic-
generating centers mostly within the study area.
(ii) The future will be different from 2016 for all types of traffic demand. The common expectation
is that the demand will increase significantly and will spread throughout much of the study
3-16

Comprehensive Study of the Urban Transport Development Program in Greater Yangon (YUTRA Update) Final Report | Chapter 3: Traffic Demand Forecast
3-17
area. The increase will also be felt in the outer area, and this has implications for urban
transport in Yangon; appropriate planning will thus be needed to address this concern.
Mode 2016 2035
Private (Including Taxi)
Public
Freight
Source: Study Team
Figure 3.2.3 Trip Patterns in the Base and Forecast Years
3-17

Comprehensive Study of the Urban Transport Development Program in Greater Yangon (YUTRA Update) Final Report | Chapter 4: Approach to Sustainable Transport Development in Yangon
4-1
4 APPROACH TO SUSTAINABLE TRANSPORT DEVELOPMENT IN
YANGON
4.1 Impact of Future Growth on Urban Transport in Yangon
1) Socio-economic Growth
4.1 Yangon has been growing and is expected to grow further, bringing about significant impact
on urban transport. Population will grow at 2.3%/year, resulting in a population of 9.5 million by 2035.
Per capita GRDP will grow at 6.2%/year and 35% of households will own cars by 2035. There will be
more employed people and more students who will enroll in higher education. Due to the socio-
economic growth, trip rates will increase and total traffic demand will grow substantially. Because
urban areas will expand, the average trip lengths of passengers will add to traffic demand.
Table 4.1.1 Assumed Socio-economic Framework for Greater Yangon by 2035
Indicator 2016 2035
Average Growth Rate
16-35 (%/y)
2035/2016
Population (000) 6,188 9,495 2.3 1.5
GRDP (Million USD) 14,148 60,990 8.6 4.3
Per capita GRDP (USD) 2,286 6,423 6.2 2.8
Employment Total 2,339 5,717
4.7 2.4 % (1/2/3) 1) 4/ 21/ 75 3/ 25/ 72
School Enrollment
Total 1,531 2,482 2.6 1.6
(P/S/H/U) 2) 98/ 44/ 67/18 100/ 100/ 90/ 45
Vehicle Ownership (% to HH) 15 35 4.6 2.3
Trip Rate (%) Including Walking 2.0 2.3 0.7 1.2
Excluding Walking 1.1 1.4 1.3 1.3
Average Trip Length excluding Walking (km)
10.1 11.3 0.6 1.1
Source: Worked out by the Study Team based on various sources. 1) Economic sector: 1 = primary, 2 = secondary, 3 = tertiary. 2) Education level: P = primary school (6-10 years old), 2 = secondary (11-14), H = high school (15-17), U = university/ Higher (18-30).
4.2 Moreover, it is expected that the overall socio-economic growth of the country will bring about
increasingly more significant impacts on the role of Yangon City as the country’s growth hub and
international gateway. As a result, the growth of intercity traffic demand to / from Yangon will
accelerate.
4-1

Comprehensive Study of the Urban Transport Development Program in Greater Yangon (YUTRA Update) Final Report | Chapter 4: Approach to Sustainable Transport Development in Yangon
4-2
2) Rapid Increase in Traffic Demand
4.3 Compounded by Yangon’s socio-economic development, the future transport demand in the
city will increase from 12.4 million in 2016 to 22.1 million trips a day (including walk) by 2035.
Motorized trips (excluding walk and bicycle) will also increase from 6.7 million to 15.4 million.
Table 4.1.2 Estimated Transport Demand in Yangon by 2035
Mode 2016 2035 2035/
2016
Annual Growth Rate
(%/y) No. (000) % No. (000) %
Motorized Motorcycle 357 2.9 547 2.5 1.5 2.3 Car 1,136 9.1 4,137 18.7 3.6 7.0 Taxi 1,125 9.0 2,509 11.3 2.2 4.3 Bus 4,116 33.1 8,234 37.2 2.0 3.7
Subtotal 6,734 54.1 15,427 69.7 2.3 4.5 Non-motorized
Walk 4,624 37.1 5,431 24.5 1.2 0.9 Bicycle 1,091 8.8 1,281 5.8 1.2 0.9
Subtotal 5,715 45.9 6,712 30.3 1.2 0.9 Total 12,448 100.0 22,139 100.0 1.8 3.1
Source: Study Team
Table 4.1.3 Estimated Intracity and Intercity Traffic Demand by 2035
Item 2016 2035 2035/2016
Person Trip (000/day)
Within Yangon City 10,522 16,560 1.6
Intercity 1,925 5,579 2.9
PCU (000/day)
Within Yangon City 1,387 3,141 2.3
Intercity 279 1,016 3.6
Freight PCU (000/day)
Within Yangon City 235 686 2.9
Intercity 111 408 3.7
Source: Study Team
Note: Worked out by the Study Team based on the YUTRA Study’s person trip survey done in 2013.
Figure 4.1.1 Car Ownership Patterns by Household Income
4-2

Comprehensive Study of the Urban Transport Development Program in Greater Yangon (YUTRA Update) Final Report | Chapter 4: Approach to Sustainable Transport Development in Yangon
4-3
4.2 Transport Sector Goal and Basic Strategies
1) Vision
4.4 The transport sector, being an integral part of the overall urban development, aims to achieve
the following goal:
Overall Goal of Yangon Transport
Sustainable transport development for the Yangon Region to enable it to function as a
competitive international and national growth hub and provide needed mobility and accessibility
for the people.
4.5 The goal is established through discussion in a series of the meetings held with relevant
stakeholders, and based on the development vision of Yangon, “Attractive International Port and
Logistics HUB - A City of Blue, Green, and Gold-”.
4.6 In this context, the intention is to rid Yangon Region from traffic congestion, traffic accidents,
pollution, poorly accessible areas, and other barriers to ensure the smooth movement of people and
goods. The urban transport network will also be comprehensible to both domestic and international
visitors and accessible especially to the physically challenged.
2) Target Modal Share
4.7 At present, Yangon Region’s urban transport is supported by extensive bus services which,
however, have been threatened by rapid motorization. But for the expected size of the future
Yangon City, it will be difficult to sustain a public-transport-based city. In order to maintain the
current high share of public transport demand, it is necessary to introduce a high-quality, mass
transit system such as urban rail, BRT, improved bus system, and other transit services, as
conceptually illustrated in Figure 4.2.1.
Source: Study Team
Figure 4.2.1 Indicative Target for Modal Share
4-3

Comprehensive Study of the Urban Transport Development Program in Greater Yangon (YUTRA Update) Final Report | Chapter 4: Approach to Sustainable Transport Development in Yangon
4-4
4.8 Sustainable transport for Yangon City should have the following five characteristics:
(a) Connected: Transport must be connected at international, national, regional, and city levels.
(b) Competitive: Transport must be competitive, that is, it has high quality and high performance,
must be comfortable and efficient, and offer various amenities.
(c) Inclusive: Transport must be inclusive, that is, people-oriented and accessible to vulnerable
groups such as the elderly, people with disabilities, etc.
(d) Ecological: Transport must be ecological, that is, it is energy-efficient, less polluting, and
disaster-resilient.
(e) Coordinated: Transport must be coordinated well among the vertical and horizontal
government institutions and between public and private sectors.
4.9 With the above-mentioned goal and principles, Yangon’s transport sector intends to minimize
(i) traffic congestion, (ii) traffic accidents, (iii) pollution, (iv) poorly accessible areas, and (v) barriers
to smooth movement of people and goods.
3) Basic Strategies
4.10 The basic strategies to achieve the above goal are summarized as follows:
(i) Development of high-quality public transport system comprising competitive urban rail,
modern bus, and other public transport modes in integration with efficient land use and urban
development. Because the development of urban rails requires lengthy time and large
investments, a step-wise rail development, early improvement of bus services, and
development of a BRT system must be considered;
(ii) Strengthening of the hierarchical urban road network comprising urban expressways, primary
roads, secondary roads, and local roads, which are properly maintained. Priority must be
given to road maintenance, minor improvements, and removal of bottlenecks/missing links.
The development of elevated urban expressways on self-financing or PPP basis can also be
considered;
(iii) Strengthening of traffic management to maximize available transport capacities through such
measures as improved traffic control along major roads and intersections/roundabouts,
provision of traffic safety facilities, improved enforcement of traffic rules, education of road
users including drivers, and improved vehicle inspection, among others;
(iv) Improvement of walking conditions; and
(v) Introduction of alternative methods to address right-of-way (ROW) acquisition and
resettlement issues more effectively, such as land readjustment which has been practiced
widely in Japan.1
4.11 Key considerations in transport planning and development include the following:
(a) Comprehensive Approach: As many projects/actions in large urban areas are interrelated,
sectoral approach and piecemeal solutions are not sustainable. Transport and urban
development must be integrated. Transport modes need efficient intermodal connectivity, and
infrastructure without proper management by IT and human resource may not function
adequately.
1 It was reported that about a third of urban areas in Japanese cities were developed based on the land readjustment scheme.
4-4

Comprehensive Study of the Urban Transport Development Program in Greater Yangon (YUTRA Update) Final Report | Chapter 4: Approach to Sustainable Transport Development in Yangon
4-5
(b) Continuity among Short-, Medium-, and Long-term Actions: Short-term solutions must be
continued over the midterm and the long term, while long-term solutions must be started
during the short-term period. Integrated, coordinated, and phased actions are important for
the effective use of limited resources.
(c) Emphasis on Urban Transport Issues in National Transport Policy: As the efficiency of
Yangon’s urban transport affects the country’s economy and image, central government
resources must be tapped adequately. This includes projects which strengthen the
connectivity between Yangon and other regions, as well as access transport to international
gateway ports and airports.
4.12 In addition to the aforementioned considerations, it must be emphasized that integration is
key to formulating and implementing transport policy, plan, and projects, as briefly explained below.
(a) Spatial Integration: As Myanmar and Yangon are becoming globalized, spatial integration at
international, national, regional, urban, township, and even ward/ community levels become
more and more important to ensure seamless movement of people and goods. This is
especially true for Yangon which must function as the most important socio-economic hub
and gateway.
(b) Sectoral Integration: Transport, land use, and environment are highly interactive and must
be planned and implemented in an integral manner.
(c) Modal Integration: Various public and private transport modes (such as air, water, rail, road)
and services for goods and passengers must be properly integrated as well as efficiently and
effectively provided.
(d) Hierarchical Integration: The transport network must be designed in a hierarchical manner,
i.e., primary, secondary and tertiary, to enhance network orientation and cost effectiveness.
(e) Institutional Integration: As transport development involves various agencies and
organizations at national and local levels, including the private sector and communities,
coordination among these stakeholders is important and adequate institutions must be
provided.
4-5

Comprehensive Study of the Urban Transport Development Program in Greater Yangon (YUTRA Update) Final Report | Chapter 5: Future Transport Network for Yangon
5-1
5 FUTURE TRANSPORT NETWORK FOR YANGON
5.1 Review of YUTRA Network
1) Viewpoints of Review
5.1 At the onset of this task, the future transport network proposed in YUTRA was reviewed from
the following viewpoints:
(a) Change in Future Land Use and Spatial Structure: The land use and spatial structure
updated in the SUDP study was incorporated.
(b) Rapid Growth of Demand since YUTRA: During the last 3–4 years, especially after the
change in administration, road traffic has increased so rapidly that the future demand forecast
made in YUTRA was revised based on the review and update of relevant policy and socio-
economic framework.
(c) Impact of New Airport, Relocation of Ports and South-Western Area of CBD: Although
this plan is not concrete plan but under consideration by the government of Myanmar, the
possible impacts of developing a new airport in Hantharwaddy, the relocation of the existing
port function to Thilawa area and urban development plan in South-Western Area of CBD
were assessed because the traffic both will generate will significantly affect urban traffic.
5.2 The urban transport network proposed in YUTRA is composed of among others: (i) urban
roads including primary and secondary roads; (ii) inner and outer ring roads; (iii) BRT (7 routes); (iv)
urban rails including the circular rail, suburban lines, new north–south line, new east–west line, and
others (see Figure 5.1.1 for roads and expressways and Figure 5.1.2 for urban rail).
5.3 The YUTRA network was analyzed based on the updated traffic demand to identify demand–
supply gaps and assess network and corridor performance. Performance indicators include volume–
capacity ratio, average travel speed, ridership and traffic density of urban rails, overall transport
costs including vehicle operating cost and passenger’s time cost.
2) Assumed Spatial Framework for Traffic Analysis
5.4 Transport development must be planned in coordination with the policy on spatial
development. This was discussed in the SUDP and is established both at city and regional levels, as
shown in Figure 5. 1. 3 and Figure 5.1.4, respectively. Main characteristics are briefly as follows:
(a) National Level: At the national level, Yangon is assigned as the gateway of the north–south
national corridor (Myitkyna–Mandalay–Yangon). At the regional level, the corridor splits into
two in Bago, as shown in Figure 5.1.3. One corridor connects Hantharwaddy Airport, Dagon
Seikkan, and Thilawa where new industries and ports are expected to concentrate. Along the
corridor, universities are also located and expected to contribute to high-tech and R&D
activities. Another corridor connects Bago with Kyee Myin Daing and the southern areas of
Yangon Region where a new airport and a new deep-water sea port are being considered.
(b) City Level: At the city level, as shown in Figure 5.1.4, urban areas will expand along the
existing transport corridors, especially the north and northeast. Transport development is also
intended to guide new urban development in the west, (Kyee Myin Daing), south (Dala), and
southeast (Thilawa). Most of the future urban areas will be more or less within or along the
outer ring road (ORR). In order to distribute the urban function concentrated in the existing
CBD and adjoining areas, three new towns in East Dagon, Kyee Myin Daing, and Dala, and
five subcenters in Thilawa, Dagon Myothit, Dagon Seikkan, Yankin, and Mindama are
proposed. As mass transit, especially urban rail, is expected to promote future urban areas,
the extensive application of TOD is also considered.
5-1

Comprehensive Study of the Urban Transport Development Program in Greater Yangon (YUTRA Update) Final Report | Chapter 5: Future Transport Network for Yangon
5-2
Source: YUTRA Study Team (2013)
Figure 5.1.1 Future Roads/Expressways
Network Proposed in YUTRA Study (2013)
Source: YUTRA Study Team (2013)
Figure 5.1.2 Future Rail Network Proposed
in YUTRA Study (2013)
Source: Updated SUDP Study Team
Figure 5.1.3 Regional Spatial Development Concept
Proposed in Updated SUDP (2016) Source: Updated SUDP Study Team
Figure 5.1.4 Urban Spatial Structure Proposed in
Updated SUDP
5-2

Comprehensive Study of the Urban Transport Development Program in Greater Yangon (YUTRA Update) Final Report | Chapter 5: Future Transport Network for Yangon
5-3
5.2 Transport Network Analysis
1) Assessment of YUTRA Network
5.5 On the basis of the updated demand, the YUTRA network was assessed. Except for some
sections where goods vehicles concentrate, and these are at ports and logistics areas, the
assessment shows that the network is considered generally adequate. Therefore, the network
proposed in the YUTRA is taken as the basis for further analysis in the study.
2) Do Nothing Scenario
5.6 This scenario aims to analyze the traffic situation in the future by assuming that no
investments have been done. As shown in Figure 5.2.1, the entire transport network will be choked
and bottlenecks will spread over the entire urban area. This greatly contrasts with the existing
situation shown in Figure 5.2.2 where traffic congestion is already observed in many sections in the
city. Under the Do Nothing Scenario, it is estimated that the total transport cost (sum of vehicle
operating cost and time cost of passengers) will reach MMK 66.6 billion a day, which is a 6 times
increase from 20161. The result indicates that Yangon needs to expand and strengthen its transport
system substantially to meet a very large demand.
Source: Study Team
1) Width of Line is 1 dot per 5,000 pcu/day
Figure 5.2.1 Traffic Situation in 2035 under Do
Nothing Scenario
Source: Study Team
1) Width of Line is 1 dot per 5,000 pcu/day
Figure 5.2.2 Traffic Situation in 2016
1 Vehicle Operating Cost and Unit Travel Time Cost are 2016 price
5-3

Comprehensive Study of the Urban Transport Development Program in Greater Yangon (YUTRA Update) Final Report | Chapter 5: Future Transport Network for Yangon
5-4
3) Do Maximum Scenarios
5.7 There are two Do Maximum scenarios, i.e., the one prepared in YUTRA Study and the other
prepared in this study in response to the urban spatial structure updated in the SUDP study and new
policy directions. The main differences between the two scenarios are the following:
(i) Expansion of the urban expressway to the outer ring road in the direction of Kyee Myin Daing
/ Twanty, Dala and the addition of an east–west link in the city center;
(ii) Reduction of 7 BRT routes to 2 due to lack of urban road space; and
5.8 This scenario aims to analyze the adequacy of the future transport network as of 2035. The
results are shown in Table 5.2.1 and Figure 5.2.3. The main findings are as follows:
(i) The updated network shows overall improvement in traffic performance compared to the
YUTRA plan, as shown in Table 5.2.1;
(ii) In 2035, overall traffic will improve and become better than the situation in 2016. Average VC
ratio will also decrease from 0.56 to 0.45, while average travel speed will increase from 10.6
km/h to 15.1 km/h;
(iii) One of the most significant factors that will contribute to the improvement is the urban railway
network which is expected to transport 4.4 million passengers a day in 2035;
(iv) Another important factor is the expressway network which will share about 15% of total road
traffic demand. Without elevated expressways in urban areas, congestion on at-grade roads
will worsen; and
(v) Average transport cost per person trip will decrease from MMK 1,733 in 2016 to MMK 1,539
in 2035, mainly because of reduced traffic congestion and improved connectivity between
origins and destinations.
Table 5.2.1 Network Performance under Various Scenarios
Item 2016
2035
Do Nothing Do Maximum
(YUTRA) Do Maximum (This Study)
Travel Demand
Person Trip (000) 6,268 15,058 15,058 15,058
Person-km (000) 63,703 175,828 180,309 178,374
Person-hours (000) 5,565 40,702 14,141 11,802
Road Traffic Demand PCU-km (000) 13,708 42,034 40,017 35,233
PCU-hours (000) 1,185 8,295 3,543 2,418
Network Performance
Ave. V/C Rate 0.55 1.67 0.62 0.45
Ave. Travel Speed (km/h) 11.4 4.3 12.8 15.1
Transport Cost (MMK billion) 1) 10.9 68.1 29.9 23.2
Transport Cost/Pax Trip (Kyat) 1,733 4,524 1,987 1,539
Railway Performance 2) No. of Pax (000) 77 499 4,637 4,450
Pax-km (000) 1,846 5,934 37,796 37,584
1) Only Vehicle Operating Cost and Travel Time Cost. The value is modified as 2016 price.
2) Excluding BRT
Source: Study Team
5.9 The aforementioned analysis indicates that Yangon has a good chance at realizing a much
improved urban transport provided the proposed projects are timely implemented.
5-4

Comprehensive Study of the Urban Transport Development Program in Greater Yangon (YUTRA Update) Final Report | Chapter 5: Future Transport Network for Yangon
5-5
YUTRA (2013)
This Study
Source: Study Team
1) Width of Line is 1 dot per 5,000 pcu/day
Figure 5.2.3 Traffic Situation in 2035 under the Do Maximum Scenario
5-5

Comprehensive Study of the Urban Transport Development Program in Greater Yangon (YUTRA Update) Final Report | Chapter 5: Future Transport Network for Yangon
5-6
4) Performance of Urban Rail
5.10 While the role of urban rail will be significant, the network is analyzed by line as shown in
Table 5.2.2 and Figure 5.2.4. The main findings are as follows:
(i) With a total length of 192 km of urban rail lines and 34 km of BRT lines, a total of 4.3 million
passengers will be transported every day;
(ii) All mass transit lines, i.e., urban rail and BRT, show high performance. The circular rail will
carry 1.3 million passengers/day; three suburban commuter lines, 1.1 million/day; three
UMRT lines, 1.5 million/day; and two BRT lines, 0.5 million/day;
(iii) Group of high-density lines (passenger-km/route-km) include the circular line, UMRT Line 1
and 2 and Mandalay line, followed by the second group comprising Pyay Line and Thilawa
Line; and
(iv) BRT lines also show good performance, though they are located on corridors parallel to the
circular rail. While the BRT and the circular rail compete in some sections, they are
complementary in others. They also meet different demands considering that their average
trip lengths differ: 5.0 km for the BRT and 10.0 km for the circular rail.
Table 5.2.2 Railway Performance Indicators under the Do Maximum Scenario
Line Description Line
Length (km)
Ridership (000)
Pax*km ('000)
PPHPD (Maximum Pax/Ave. H)
Ave. Travel Distance
(km)
Traffic Density (000)
Pax/km Pax-km /km
Circle YCR West (YNG-DNG) 20.1 744 6,290 32,000 8.5 37.1 313
Line YCR East (DNG-YNG) 26.0 516 6,294 21,000 12.2 19.8 242
Subtotal 46.1 1,260 12,584 32,000 10.0 27.3 273
MR Suburban
Pyay Line 22.4 158 1,714 21,000 10.8 7.0 76
Mandalay Line 42.4 775 11,479 21,000 14.8 18.3 271
Lines Thilawa Line 31.7 148 1,230 9,000 8.3 4.7 39
Subtotal 96.5 1,081 14,423 21,000 13.3 11.2 149
UMRT UMRT Line 1 (N/S) 26.5 749 5,330 27,000 7.1 28.2 201
Lines UMRT Line 2 (E/W) 23.3 741 6,558 34,000 8.9 31.8 281
Subtotal 49.8 1,489 11,888 34,000 8.0 29.9 239
BRT BRT Line-1 (IRR West) 17.4 299 1,424 9,000 4.8 17.2 82
Lines 1 BRT Line-2 (IRR East) 17.5 182 968 6,200 5.3 10.4 55
& 2 Subtotal 34.9 481 2,392 9,000 5.0 13.8 69
Total 227.4 4,311 41,287 - 9.6 19.0
Source: Study Team 1) Peak hour ratio: UMRT = 15%, BRT = 10 %
5-6

Comprehensive Study of the Urban Transport Development Program in Greater Yangon (YUTRA Update) Final Report | Chapter 5: Future Transport Network for Yangon
5-7
Source: Study Team
Figure 5.2.4 Railway Traffic Demand in 2035 under the Do Maximum Scenario
5) Performance of Urban Expressways
5.11 An extensive network of expressways with a total length of 288 km has been proposed and
analyzed as shown in Table 5.2.3 and Figure 5.2.5. The main findings of the analysis are as follows:
(i) The performance of expressways is very different by route. The first group with VC ratios of
0.7 and above are the elevated expressways on the west and east sections of the inner ring
road, the access to the Yangon–Mandalay Expressway, Yangon–Thilawa, and East–West
smart tunnel (south route). The second group with VC ratios of 0.4–0.6 are Yangon–Pyay.
Yangon–Pathein, Kyee Myin Daing Bridge, and east–west smart tunnel (north route);
(ii) Although the VC ratio of Yangon–Bago–Hantharwaddy section is 0.3, it will become higher
when the new airport is in full operation; and
(iii) The performance of the ORR varies by section, because its total length is very long. Its
overall performance is low. The analysis indicates that the ORR must be developed in stages
with adequate design standard.
5-7

Comprehensive Study of the Urban Transport Development Program in Greater Yangon (YUTRA Update) Final Report | Chapter 5: Future Transport Network for Yangon
5-8
Table 5.2.3 Urban Expressway Performance Indicators under the Do Maximum Scenario
Section Length
(km) PCU-km (000) V/C PCU-km/km
Cross-section
Traffic (max.)
(000 pcu/day)
ORR East Section 65.1 592 0.11 9,091 16.0
South-West Section 31.3 266 0.11 8,498 11.9
North-West Section 35.0 343 0.12 9,794 12.0
Radial Yangon–Bago–Hanthawaddy 18.7 505 0.34 26,963 22.8
Yangon–Pyay 10.2 493 0.61 48,567 34.4
Yangon–Thilawa 14.9 879 0.74 58,828 37.6
Yangon–Hlegu 8.8 154 0.22 17,558 11.2
Yangon–Pathein 8.4 355 0.53 42,358 44.3
Dala Bridge 8.6 73 0.11 8,421 6.0
KMD Bridge 9.7 89 0.11 9,176 5.2
IRR I-RR (Western Axis: Insein–CBD–Dala) 18.8 1,297 0.86 68,888 54.9
I-RR (Eastern Axis: Mindamar–CBD) 17.6 1,164 0.83 66,000 42.0
Others Access to Yangon–Mandalay Expressway 21.9 1,428 0.82 65,241 48.2
Pazundaung Bypass 6.6 202 0.38 30,646 16.7
East–West Tunnel (North) 6.0 239 0.50 39,874 32.9
East–West Tunnel (South) 6.7 423 0.79 63,372 35.9
Source: Study Team
Source: Study Team
Figure 5.2.5 Expressway Traffic Demand in 2035 under the Do Maximum Scenario
5-8
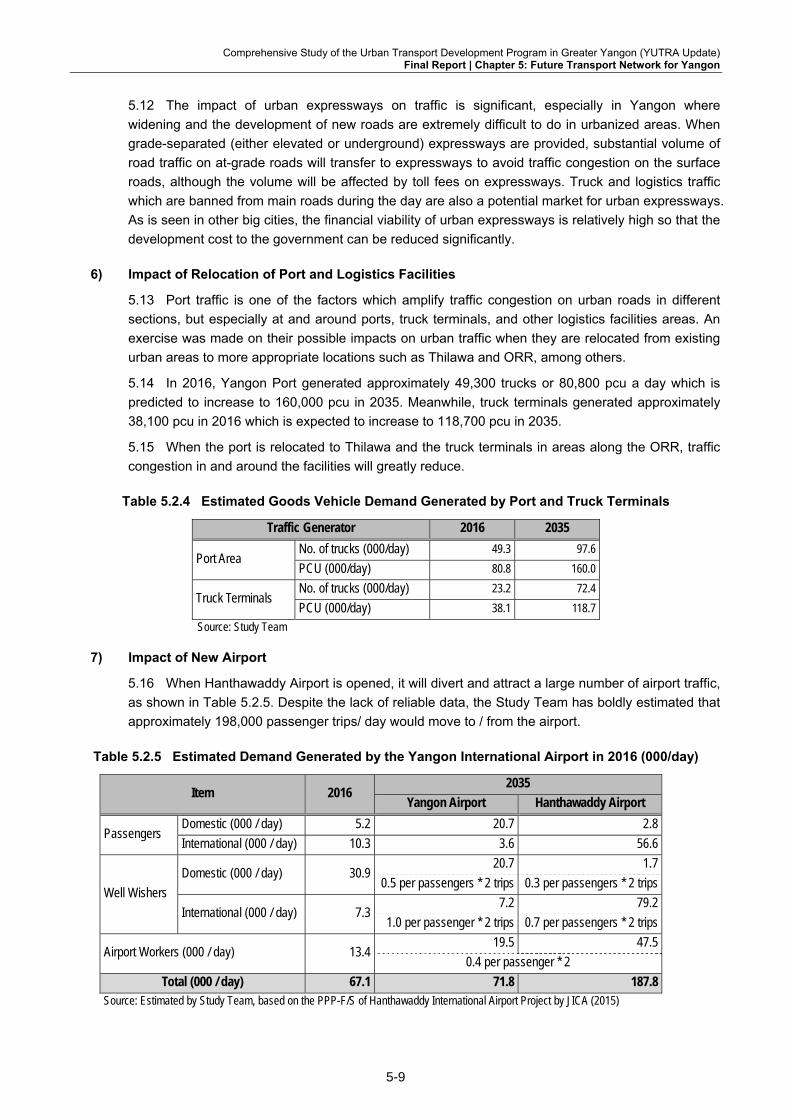
Comprehensive Study of the Urban Transport Development Program in Greater Yangon (YUTRA Update) Final Report | Chapter 5: Future Transport Network for Yangon
5-9
5.12 The impact of urban expressways on traffic is significant, especially in Yangon where
widening and the development of new roads are extremely difficult to do in urbanized areas. When
grade-separated (either elevated or underground) expressways are provided, substantial volume of
road traffic on at-grade roads will transfer to expressways to avoid traffic congestion on the surface
roads, although the volume will be affected by toll fees on expressways. Truck and logistics traffic
which are banned from main roads during the day are also a potential market for urban expressways.
As is seen in other big cities, the financial viability of urban expressways is relatively high so that the
development cost to the government can be reduced significantly.
6) Impact of Relocation of Port and Logistics Facilities
5.13 Port traffic is one of the factors which amplify traffic congestion on urban roads in different
sections, but especially at and around ports, truck terminals, and other logistics facilities areas. An
exercise was made on their possible impacts on urban traffic when they are relocated from existing
urban areas to more appropriate locations such as Thilawa and ORR, among others.
5.14 In 2016, Yangon Port generated approximately 49,300 trucks or 80,800 pcu a day which is
predicted to increase to 160,000 pcu in 2035. Meanwhile, truck terminals generated approximately
38,100 pcu in 2016 which is expected to increase to 118,700 pcu in 2035.
5.15 When the port is relocated to Thilawa and the truck terminals in areas along the ORR, traffic
congestion in and around the facilities will greatly reduce.
Table 5.2.4 Estimated Goods Vehicle Demand Generated by Port and Truck Terminals
Traffic Generator 2016 2035
Port Area No. of trucks (000/day) 49.3 97.6
PCU (000/day) 80.8 160.0
Truck Terminals No. of trucks (000/day) 23.2 72.4
PCU (000/day) 38.1 118.7
Source: Study Team
7) Impact of New Airport
5.16 When Hanthawaddy Airport is opened, it will divert and attract a large number of airport traffic,
as shown in Table 5.2.5. Despite the lack of reliable data, the Study Team has boldly estimated that
approximately 198,000 passenger trips/ day would move to / from the airport.
Table 5.2.5 Estimated Demand Generated by the Yangon International Airport in 2016 (000/day)
Item 2016 2035
Yangon Airport Hanthawaddy Airport
Passengers Domestic (000 / day) 5.2 20.7 2.8
International (000 / day) 10.3 3.6 56.6
Well Wishers
Domestic (000 / day) 30.9 20.7 1.7
0.5 per passengers * 2 trips 0.3 per passengers * 2 trips
International (000 / day) 7.3 7.2 79.2
1.0 per passenger * 2 trips 0.7 per passengers * 2 trips
Airport Workers (000 / day) 13.4 19.5 47.5
0.4 per passenger * 2
Total (000 / day) 67.1 71.8 187.8 Source: Estimated by Study Team, based on the PPP-F/S of Hanthawaddy International Airport Project by JICA (2015)
5-9

Comprehensive Study of the Urban Transport Development Program in Greater Yangon (YUTRA Update) Final Report | Chapter 5: Future Transport Network for Yangon
5-10
8) Impact of Urban Development Plan in the South-Western Area of CBD
5.17 Development of southern area across the River is planed which is expected to bring about
significant impact both on transportation and spatial structure of Yangon when they are completed
the area is composed of Dala and Kyee Myin Daing shown in as IU-04, IU-05, SU-05 and SU-06 in
Figure 5.3.3. The area is populated approximately 647,000 persons with a population density of 31
persons/ha over the wide area of 20,000 ha. Advantage of the area is proximity to CBD. Most of the
area is located within 15 Km radius from CBD. Disadvantage is poorly provided access and widely
distributed flood prone area. At present direct access is only provided by ferry or the long detour by
road.
Source: the Study Team
Figure 5.2.6 Development Direction of Alternative Socio-economic Framework
5-10

Comprehensive Study of the Urban Transport Development Program in Greater Yangon (YUTRA Update) Final Report | Chapter 5: Future Transport Network for Yangon
5-11
5.18 YRG has intention to accelerate the area. In “A Development Master Plan for the Yangon-
Hanthawaddy-Bago Corridor and Yangon's Southwest” by KOICA (2016-2017), the large-scale
development in Dala Area and Kyee Myin Daing Area is proposed. The projected population is 1.7
million in 2035 (excluding existing settlement) with 94 (no/ha) of gross population density. When new
developments are taking place the access will be provided with following modes:
(i) Construction of Dala Bridge which is on-going
(ii) Extension of Line 1 to Dala
(iii) Extension of expressway at Kyee Myint Daing to the west
(iv) Consideration of Line 3 in the south connecting KMD, CBD and Thilawa
(v) And network of primary and secondary roads in integration with this above primary network.
Phase Target
Year
Area
(ha)
Population
(000) Landuse
1 -2020 3,685 450
Commercial, Residential,
Mixed Use, Business,
Pagoda, Culture
2 -2025 3,809 450
Commercial, Residential,
Mixed Use, Business,
Public, Industrial,
Distribution
3 2030 4,172 300
Commercial, Residential,
Mixed Use, Business, R&D,
Culture, University,
Distribution
4 2035 6,333 500 Residential, Mixed-Use,
Industrial, Distribution
5 2040 1,540 0 Sport-Park, Distribution
Source: A development master plan for the Yangon-Hanthawaddy-Bago corridor and Yangon's southwest
Figure 5.2.7 Proposed Land Use of Dala & Kyee Myin Daing Area in A development master plan for
the Yangon-Hanthawaddy-Bago corridor and Yangon's southwest
5-11

Comprehensive Study of the Urban Transport Development Program in Greater Yangon (YUTRA Update) Final Report | Chapter 5: Future Transport Network for Yangon
5-12
5.3 Proposed Transport Network for Yangon
1) Proposed Network
5.19 In order to meet the expected large traffic demand in Yangon as a result of promoting the
desired growth and expansion of urban areas, the future transport network is formulated with the
following considerations (see Figure 5.3.1):
(a) Road Network: Improvement and development of hierarchical urban roads consisting of
primary and secondary roads both in existing and emerging urban areas including new towns.
(b) Expressway Network: The development of a network of elevated or access-controlled toll
expressways in integration with urban roads is a must to resolve traffic congestion on at-
grade roads.
(c) Public Transport Network: The development of a high-quality, high-capacity public transport
system is the most important challenge for Yangon, not only to improve the traffic situation but
also to promote compact and desirable urban areas and land use. With the circular rail
forming the backbone, it must be integrated with suburban commuter lines and new urban
lines. BRT development under elevated urban expressways is also worth considering.
5.20 The overall urban transport network proposed in the YUTRA Study has been deemed
appropriate to meet the future transport demand in Yangon. The main findings of the review which
was based on the updated database and planning policy of the new administration include the
following:
(a) Development of At-grade Roads: Further expansion and development of at-grade roads is
the most fundamental undertaking of the government. In addition to the upgrading of existing
roads, the development of missing links in existing urban areas and new roads in emerging
suburban areas must be promoted in integration with land use development.
(b) Expansion of Expressways: The expansion of the urban expressway network is proposed
because of substantial increases in the future transport demand compared to YUTRA’s
estimates, the anticipated difficulties in developing at-grade roads, and in response to the
redefined spatial structure in the SUDP. The proposed expressway network will cover the
future urban area which will cover areas within and along the outer ring roads. For this, new
expressway routes connecting Dala, Kyee Minh Daing, Thilawa, and East Dagon, as well as
an additional east-west link in the city center, are proposed. Urban expressways will be
elevated or underground in the city center and at-grade in suburban areas.
(c) Development of BRT Routes: The seven BRT routes proposed in YUTRA should be
reduced to two to spare road space for vehicular traffic, except inner ring road sections where
elevated expressways are to be constructed and is at-grade sections of the roads are wide
enough to accommodate two-lane dual carriageways even after BRT development.
(d) Development of Urban Rails: A high-quality mass transit network supplemented with BRT,
bus, and other public transport modes is proposed for Yangon. The proposed urban rail
network will also promote diversion from private cars through park & ride schemes, especially
in suburban areas. The urban rail network will be composed of the Yangon Circular Rail,
suburban commuter rails, and new metro lines. In view of the concentration of high demand in
the city center and expected developments in the south, west, and east areas, an additional
east–west line can be proposed to connect the city center with Kyee Minh Daing / Dala and
Thilawa.
5-12

Comprehensive Study of the Urban Transport Development Program in Greater Yangon (YUTRA Update) Final Report | Chapter 5: Future Transport Network for Yangon
5-13
Roads and Expressways Urban Rails
* Alignment of Outer Ring Road is still in discussion by relevant agencies.
Source: Study Team
Figure 5.3.1 Proposed Urban Transport Network for Yangon
2) Assessment of Proposed Urban Transport Network
5.21 Selected main corridors of the proposed network was assessed, and the results are shown in
Table 5.3.1 and Table 5.3.2 for 2016 and 2035 situations, respectively. The main findings are as
follows:
(i) While overall traffic demand on 10 selected corridors will increased, The average volume–
capacity ratio and average travel speed improve.
(ii) While traffic situation will improve, it will not be so in CBD, implying that demand management
measures should be introduced in the area; and
(iii) It is still necessary to strengthen traffic management for more effective and safe use of limited
capacities.
5-13

Comprehensive Study of the Urban Transport Development Program in Greater Yangon (YUTRA Update) Final Report | Chapter 5: Future Transport Network for Yangon
5-14
Table 5.3.1 Performance Indicators for Main Corridors in 2016
Corridor Length (km)
PCU-km Ave. V/C
Ratio
Average Speed (km/h)
Pax-km % Public (Pax)
Transport Cost per PCU-km (MMK)
Kannar (Waterfront) Road 21.9 459 0.82 8.7 1,472 67.9 1,085.0
Pyay Road–Insein Road 19.2 657 0.85 11.7 2,610 62.5 943.7
Inya Road–Pyay Road 12.2 420 0.88 12.4 1,550 45.5 804.8
Kabar Aye Pagoda Roazd 19.6 776 0.94 10.5 2,455 47.5 929.1
Wizar–Yan–Tar 7.2 220 0.70 27.5 841 58.3 500.0
No.2 Main Road 15.7 528 0.81 11.5 2,391 60.3 912.9
East–West (Northern Corridor) 22.1 853 0.93 12.5 2,237 48.3 866.4
Ahlon Road–Shwe Gone Daing Road 11.1 380 0.91 9.5 1,429 52.6 1,028.9
Thanlin–Thilawa Link 14.7 341 0.86 10.7 1,320 58.5 947.2
All CBD Roads 37.8 362 0.92 4.8 1,234 64.3 1,770.7
All Corridors 182.0 4,996 0.87 10.3 17,539 56.1 973.4
Source: Study Team
Table 5.3.2 Performance Indicators for Main Corridors in 2035
Corridor Length(km)
PCU-km Ave.V/C Ratio
Average Speed (km/h)
Pax-km %Public (Pax)
Transport Cost per PCU-km (MMK)
Kannar (Waterfront) Road 21.9 866 0.83 9.4 1,715 43.8 879.9
Pyay Road–Insein Road 19.2 756 0.80 13.0 2,524 46.4 760.6
Inya Road–Pyay Road 12.2 464 0.86 15.0 1,413 36.9 648.7
Kabar Aye Pagoda Road 19.6 971 0.82 15.9 3,258 51.7 674.6
Wizar–Yan–Tar 7.2 245 0.62 27.2 852 44.6 408.2
No.2 Main Road 15.7 585 0.75 13.9 2,719 56.7 717.9
East–West (Northern Corridor) 22.1 741 0.60 22.5 3,108 52.6 506.1
Ahlon Road–Shwe Gone Daing Road 11.1 300 0.63 15.0 1,418 63.8 743.3
Thanlin–Thilawa Link 14.7 535 0.91 9.9 2,099 44.3 942.1
All CBD Roads 37.8 711 1.24 5.1 1,988 56.1 1,607.6
All Corridors 182.0 6,174 0.80 11.4 21,094 50.4 819.2
Source: Study Team
5-14

Comprehensive Study of the Urban Transport Development Program in Greater Yangon (YUTRA Update) Final Report | Chapter 5: Future Transport Network for Yangon
5-15
5.22 Figure 5.3.2 shows the traffic situation along the east–west cross-section of the city between
the inner ring roads. The main findings are as follows:
(i) For the most important north–south traffic movement, the role of public transport by rail is
significant, especially the Circular Rail and UMRT Line 1. The BRT on Kyee Myindaing
Kannar Road also plays a critical role;
(ii) Elevated expressways to be constructed on inner ring roads will contribute remarkably to the
reduction of at-grade road traffic; and
(iii) The impact of freight traffic on western corridors, including Kyee Myindaing Kannar Road, IRR
expressway, and Baho Road, will be substantial.
Passenger
PCU
Source: Study Team
Figure 5.3.2 Traffic Situation on the North–South Cross-section
5-15

Comprehensive Study of the Urban Transport Development Program in Greater Yangon (YUTRA Update) Final Report | Chapter 6: Regional Transport and Urban Logistics
6-1
6 REGIONAL TRANSPORT AND URBAN LOGISTICS
6.1 Regional Transport Characteristics
1) National Spatial Development Structure and Transport Corridors
6.1 Myanmar’s national spatial structure is built with different types of activity centers and
corridors. The former includes regional/state capital cities such as Yangon, Mandalay, and Bago.
Industrial zones and special economic zones (SEZs), agro-industrial centers are also included.
The latter refers to strategic transportation networks, including ASEAN/transnational land, water,
and air transport corridors. Connecting the aforementioned strategic activity hubs are 10
development corridors comprising the national network. These development corridors are listed
below and shown in Figure 6.1.1.
(i) Central North–South Corridor (approximately 1,200 km);
(ii) East–West Corridor (approximately 600 km);
(iii) Northern Corridor (approximately 550 km);
(iv) Mandalay–Tamu Corridor (approximately 610 km);
(v) Second East–West Corridor (approximately 1,120 km);
(vi) Main River Corridor (part of the Western North–South Corridor);
(vii) East–West Bridging Corridor (approximately 710 km);
(viii) Delta Area Network (approximately 340 km);
(ix) Southern Area Development Corridor (approximately 690 km);
(x) Western North–South Corridor (approximately 690 km); and
(xi) Eastern North–South Corridor (approximately 760 km).
6.2 Four corridors, namely, Central North–South Corridor, East–West Corridor, Western North–
South Corridor, and Delta Area Network, are located in Greater Yangon, the common and only
international gateway. In this regard, interregional traffic in this area should be properly managed
so as not to affect urban traffic negatively.
6.3 In 2012, Myanmar’s population was 61 million and the country had a GDP of MMK47 trillion.
Among the 10 development corridors, larger populations and associated economic activities can
be seen along Central North–South Corridor (41% of the total population and 50% of GRDP),
followed by the Western North–South Corridor (33% of total population and 42% of GRDP), East–
West Corridor (28% of total population and 35% of GRDP), and Delta Area Network (21% of total
population and 27% of GRDP). This indicates that connectivity improvement between Yangon’s
transport systems and the Central North–South Corridor should be given first priority, followed by
the Western North–South Corridor, and the East–West Corridor. It should be noted that the
Thilawa SEZ is now designated as the terminus of the East-–West Corridor by the Myanmar
government.
2) Regional Transport Demand Characteristics
6.4 Each of the four important corridors has its own unique characteristics in terms of modal
share of freight and passenger transport, which are mainly determined by two major factors,
namely, natural conditions and history of transport infrastructure development in the modern era.
6.5 The dominant modes of transport along the Central North–South Corridor are land transport
including roads and rail. There is no water transport along the corridor, while it includes national
highways (NH No. 1, 2, and 3), and expressways, and railways (double track). The share of road
6-1

Comprehensive Study of the Urban Transport Development Program in Greater Yangon (YUTRA Update) Final Report | Chapter 6: Regional Transport and Urban Logistics
6-2
transport (truck) is dominant in freight transport, reaching about 91% in terms of ton-km in 2013,
which is expected to increase slightly to 93% in 2030. With regard to passenger transport along
Source: Study on National Transport Development Plan (2014) JICA
Figure 6.1.1 Key National Transport Corridors, 2030
6-2

Comprehensive Study of the Urban Transport Development Program in Greater Yangon (YUTRA Update) Final Report | Chapter 6: Regional Transport and Urban Logistics
6-3
Table 6.1.1 Profile of National Transport Corridors, 2012
Development Corridor Section Code Population (000)
Share to National (%)
GDP (MMK billion)
Share to National (%)
1. Central North–South Corridor
Yangon–Nay Pyi Taw A1 11,714
41
13,170
50 Nay Pyi Taw–Mandalay A2 6,323 4,457
Mandalay–Myitkyna A3 7,035 5,648
2. GMS East–West Corridor Yangon–Hpa-An–Myawaddy B1 14,052
28 14,543
35 Mawlamyine–Dawei B2 2,753 2,039
3. GMS Northern Corridor Mandalay–Muse C1 6,042 10 4,503 10 4. Mandalay–Tamu Corridor Mandalay–Tamu D1 8,722 14 6,992 15 5. New East–West Corridor Tachilek–Meiktila–Kyaukpyu E1 10,636 17 6,938 15
6. East–West Bridging Corridor Hpasawing–Pyay G1 2,664
12 1,727
11 Loikaw–Magway G2 4,767 3,214
7. Delta Area Corridor Yangon–Pathein H1 8,992
21 10,076
27 Pathein–Hinthada H2 3,766 2,651
8. Southern Area Development Corridor
Thanbyuzayat–Hpayarthonesu J1 2,537
8
1,482
8 Dawei–Thai Border J2 811 781
Dawei–Kawthaung J3 1,756 1,679
9. Western North–South Corridor
Yangon–Pyay–Magway K1 12,810 33
14,388 42
Magway–Mandalay K2 7,096 5,468
10. Eastern North–South Corridor
Bilin–Loikaw L1 3,896 12
2,550 9
Loikaw–Nawnghko L2 3,247 1,900 Source: MYT Plan (2014)
the Central North–South Corridor, the share of bus transport is dominant in terms of passenger-
km, reaching about 66%, followed by rail transport at 17%. The share of rail transport in
passenger transport demand is expected to increase to 32% in 2030 due to the ongoing
improvement of the Yangon–Mandalay railway. This demand forecast shows the importance of
the connectivity improvement between industrial centers, such as the Thilawa SEZ and the Hlaing
industrial area in Greater Yangon, and the national land transport system for freight movement
and the improvement of the Yangon central station and intercity bus passenger terminals for
passenger movement.
6.6 In terms of modal share, the East–West Corridor shows similar characteristics with those of
the Central North–South Corridor, but the expected modal share of rail passengers along the
former corridor in 2030 is higher than that of the latter corridor because of rail improvement
between Yangon and Bago as part of the Yangon–Mandalay railway improvement.
6.7 The Western North–South Corridor has unique characteristics in comparison with other
corridors, that is, the modal share of water transport is high due to the traditionally developed
inland water transport system along the Ayeyarwaddy River. The share of freight transport by
water transport means along this corridor is expected to increase from 9% in 2013 to more than
70% in 2030, which is desirable as this is an environment-friendly transport. With regard to
passenger transport along the corridor, rail transport is expected to play a more vital role with the
improvement of the Yangon–Pyay railway line.
6.8 In the delta area, the Delta Area Corridor, the dominant freight mode is road transport,
reaching about 56%. However, this is expected to decrease to about 41% in 2030 as a result of
improvements in the water transport systems in the delta area. The share of rail passenger
transport is expected to increase as a result of improvements in the Yangon–Pathein railway line,
while bus transport will still be the dominant mode in the delta area in 2030.
6-3

Comprehensive Study of the Urban Transport Development Program in Greater Yangon (YUTRA Update) Final Report | Chapter 6: Regional Transport and Urban Logistics
6-4
Passengers Cargo
Central North–South Corridor (Yangon–Nay Phi Taw–Mandalay–Mythakyna) Passengers Cargo
East–West Corridor (Dawei–Mawkmyine–Yangon ) Passengers Cargo
Western North–South Corridor (Yangon–Pyay–Magway–Mandalay) Passengers Cargo
Delta Area Corridor (Yangon–Pathein–Hinthada) Source: MYT Plan (2014)
Figure 6.1.2 Transport Demand on Selected Corridors by Mode
6-4
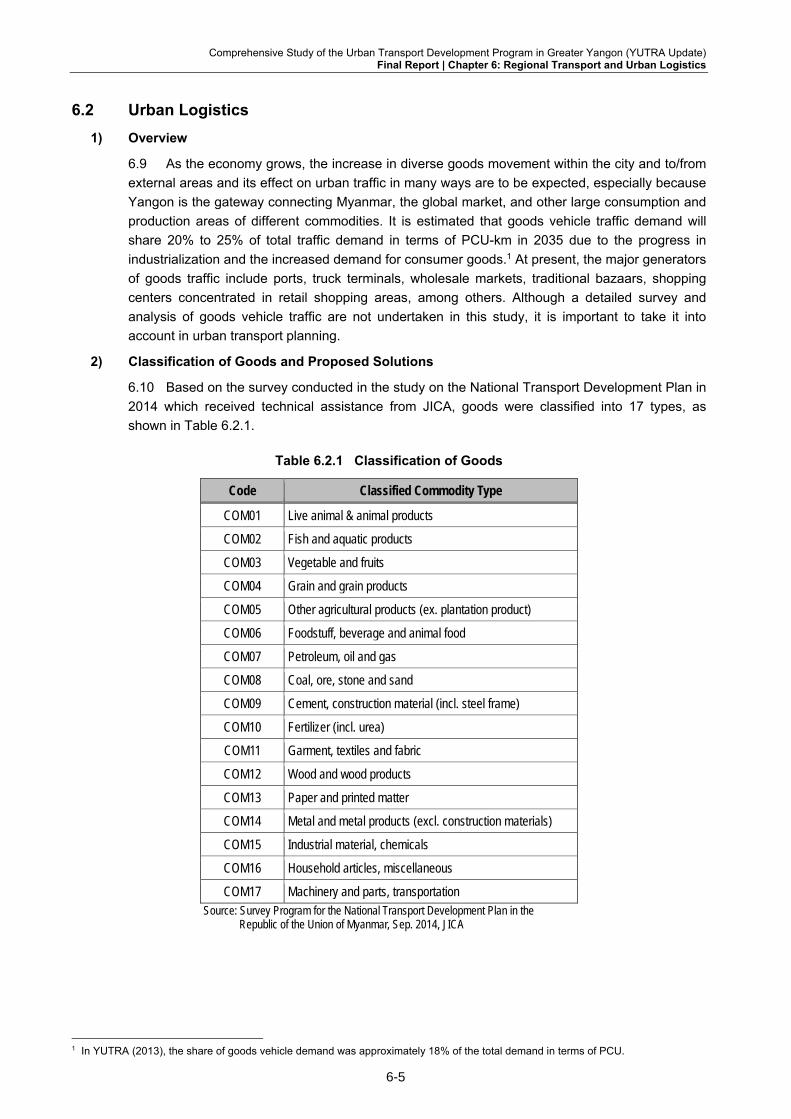
Comprehensive Study of the Urban Transport Development Program in Greater Yangon (YUTRA Update) Final Report | Chapter 6: Regional Transport and Urban Logistics
6-5
6.2 Urban Logistics
1) Overview
6.9 As the economy grows, the increase in diverse goods movement within the city and to/from
external areas and its effect on urban traffic in many ways are to be expected, especially because
Yangon is the gateway connecting Myanmar, the global market, and other large consumption and
production areas of different commodities. It is estimated that goods vehicle traffic demand will
share 20% to 25% of total traffic demand in terms of PCU-km in 2035 due to the progress in
industrialization and the increased demand for consumer goods.1 At present, the major generators
of goods traffic include ports, truck terminals, wholesale markets, traditional bazaars, shopping
centers concentrated in retail shopping areas, among others. Although a detailed survey and
analysis of goods vehicle traffic are not undertaken in this study, it is important to take it into
account in urban transport planning.
2) Classification of Goods and Proposed Solutions
6.10 Based on the survey conducted in the study on the National Transport Development Plan in
2014 which received technical assistance from JICA, goods were classified into 17 types, as
shown in Table 6.2.1.
Table 6.2.1 Classification of Goods
Code Classified Commodity Type
COM01 Live animal & animal products
COM02 Fish and aquatic products
COM03 Vegetable and fruits
COM04 Grain and grain products
COM05 Other agricultural products (ex. plantation product)
COM06 Foodstuff, beverage and animal food
COM07 Petroleum, oil and gas
COM08 Coal, ore, stone and sand
COM09 Cement, construction material (incl. steel frame)
COM10 Fertilizer (incl. urea)
COM11 Garment, textiles and fabric
COM12 Wood and wood products
COM13 Paper and printed matter
COM14 Metal and metal products (excl. construction materials)
COM15 Industrial material, chemicals
COM16 Household articles, miscellaneous
COM17 Machinery and parts, transportation Source: Survey Program for the National Transport Development Plan in the
Republic of the Union of Myanmar, Sep. 2014, JICA
1 In YUTRA (2013), the share of goods vehicle demand was approximately 18% of the total demand in terms of PCU.
6-5

Comprehensive Study of the Urban Transport Development Program in Greater Yangon (YUTRA Update) Final Report | Chapter 6: Regional Transport and Urban Logistics
6-6
6.11 They were further classified into three cargo categories based on their characteristics. Each
category is described below in
(1) Category 1: Consumption Goods (Raw Materials)
6.12 In the past, Yangon City had depended on river transport for the procurement of most
commodities and goods, e.g., daily consumer goods, coal, timber, etc. Due to the development of
land infrastructure, especially roads, trucking might play a key role in inner-city logistics in Yangon
from now on. However, the expanding truck haulage has created some problems inside the city,
e.g., traffic congestion, waste gas, and so on. Furthermore, an excessive reliance on truck
haulage for inner-city logistics poses risks when a disaster strikes.
6.13 The characteristics of relevant logistics facilities are briefly as follows:
(i) Some public wholesale markets, e.g., Thiri Mingalar Market (vegetable and fruits, Hlaing
T/S), Sin Min Market (chicken and duck, Hlaing T/S), San Pya Market (fish, Kyee Myin
Daing T/S), etc., are allowed to use large trucks on the inner ring road;
(ii) Thiri Mingalar Market (Hlaing T/S) near Shwe Padauk Market (fish, Hlaing T/S) mainly
turned over vegetable and fruits was removed from Kyee Myin Daing T/S three years ago
as a countermeasure to traffic congestion;
(iii) The surrounding areas of the Bayint Naung Truck Terminal in Hlaing T/S is a major
distribution center of rice and paddy; and
(iv) The sanitary conditions of these public wholesale markets, which also include a ‘wet’
section, are not good.
6.14 The upper-middle class in Yangon is expected to expand from now on according to a rapid
economic growth in Myanmar, especially in Yangon. Corresponding to the needs of the upper-
middle class, the existing public wholesale markets should be upgraded. An efficient allocation of
the wholesale markets along the ring road and an upgrade of their facilities and sanitary
environment are needed. Furthermore, the location/relocation of food processing industries as
value-added industries near wholesale markets should be promoted. Now, one local private
company, the Dagon Group Inc., is developing a modern wholesale market through consultations
with the YCDC.
(2) Category 2: Consumption Goods (Manufactured Materials)
6.15 As manufactured consumer goods are expected to increase in a large scale in the east and
the west of Yangon where population growth and density are high. There exists one public market
in each township selling such goods as fresh fish, vegetables, milled rice, dressed meat, flowers,
and fabrics. Most daily consumer goods are sold in Yangon City through markets.
6.16 With the expected burgeoning of the upper-middle class in Yangon, existing traditional
markets should be upgraded and a modern distribution system needs to be developed in the city.
6.17 A few local modern retailers, such as City Mart and Star Mart, are opening modern retail
markets in high-density areas. The commodity handling portion in modern retail markets has
remained low and the distribution system should be upgraded. There is a need to shift to modern
retail markets and efficient distribution systems, for instance, a modern storage and distribution
system combined with a barge and a truck haulage. A modern and mechanized logistics system
with an ICT system will be able to improve efficiency.
(3) Category 3: Energy, Intermediate, and Industrial Goods
6.18 Industrial goods, such as coal, petroleum, cement, timber, fertilizer, meal, machinery,
chemicals, and industrial materials, are transported to the west of Yangon City and the CBD
through inland water and coastal shipping. Because this type of traffic will increasingly affect
6-6

Comprehensive Study of the Urban Transport Development Program in Greater Yangon (YUTRA Update) Final Report | Chapter 6: Regional Transport and Urban Logistics
6-7
urban traffic in and around the CBD negatively, there is a plan to relocate the port function to
Thilawa and others. The shift of industrial goods to Thilawa Port will contribute to a decrease in
logistics costs for manufacturers in Thilawa SEZ and other industrial parks located in the city.
6.19 A proposed approach includes the integration and partial relocation of the existing port
facilities, such as Pansoedan, Thuwanna, river jetty, and many private ports in central Yangon, to
Thilawa Port. Cargo transport, especially container transport, is important to exchange goods.
Space for container storage, cargo warehouse, and other logistics functions are also needed in
the dry port.
Table 6.2.2 Freight Flow Volume in Yangon Unit: ton/day
Year Inside Yangon Outside Yangon Total
2013 107,769 91,529 199,298
2030 491,562 474,155 965,717
2030/2013 4.6 5.2 4.8
Source: Survey Program for the National Transport Development Plan in the Republic of the Republic of the Union of Myanmar, Sep. 2014, JICA
3) Development Direction
6.20 On the basis of the aforementioned study, the following actions are preliminarily proposed:
(i) Upgrading public wholesale markets for Category 1 commodities, including:
Relocating and developing wholesale markets along the ring road;
Upgrading facilities and sanitary conditions; and
Attracting good processing industries near wholesale markets.
(ii) Upgrading traditional markets for Category 2 commodities, including:
Upgrading traditional markets, and
Upgrading distribution systems.
(iii) Shifting port function to Thilawa and other ports
Shifting the handling of increasing volumes of industrial cargos from highly populated
areas to Thilawa Port and the hinterland, and
Integrating port facilities in highly populated areas and relocating some functions of
existing port facilities to Thilawa Port.
6.21 Myanmar Railways is considering the construction and operation of a dry port as an
important work in freight transport. For the construction of the dry port along the Asia Highway and
Trans Asia Railways in Asia and Pacific, Myanmar signed “the intergovernmental Agreement on
Dry Port” on on 7 November 2013. Myanmar proposed eight potential locations of dry ports. They
are Yangon, Mandalay, Tamu, Muse, Mawlamyine, Bago, Monywa, and Pyay.
6.22 In Yangon, Myanmar Railway is considering a dry port in Ywarthargyi in East Dagon
Township. The nearest seaports are the Asia World Port Terminal, Myanmar Industrial Port, and
Botahtaung Port, all of which are located along the Yangon River, and Myanmar International
Terminal Thilawa near the mouth of the sea. The Ywarthargyi dry port can easily be linked to the
Yangon–Bago–Pyinmana–Meilkhita–Mandalay Road network. Furthermore, it is also situated on
the Yangon–Mandalay Railway line (main railway corridor), and the dry port itself has a railway
line connected to Yangon–Bago, extending to Hanthawaddy International Airport, which will be the
6-7

Comprehensive Study of the Urban Transport Development Program in Greater Yangon (YUTRA Update) Final Report | Chapter 6: Regional Transport and Urban Logistics
6-8
biggest airport in the country. These are some of Yangon’s inland waterway ports along the
Yangon River which can easily be linked to the dry port as well.
Source: Study Team
Figure 6.2.1 Location of the New Dry Port in Ywarthargyi
6.23 The needed major activities in the dry port are listed below.
(i) Container handling and storage;
(ii) Container stripping and stuffing;
(iii) Break bulk cargo handling and storage;
(iv) Customs inspection and clearance;
(v) Light container repairs;
(vi) Freight forwarding and cargo consolidation service;
(vii) Banking, insurance, financing services; and
(viii) Use of pallet system for cargo transport.
6-8

Comprehensive Study of the Urban Transport Development Program in Greater Yangon (YUTRA Update) Final Report | Chapter 7: Urban Roads
7-1
7 URBAN ROADS
7.1 Urban Roads Development
1) Importance of Urban Roads
7.1 Roads are the most fundamental infrastructure in urban areas. They provide space not simply
for the movement of vehicles and pedestrians but also places for various socio-economic activities,
offering venue for various events and recreational activities. Roads connect main socio-economic
centers to each other and to living quarters as well.
7.2 Roads also serve as an important open space as fire belt and evacuation route. The design of
road space also enhances amenity and landscape. Roads can accommodate other urban utilities
such as those for water supply, drainage, electricity, and telecommunications.
2) Sharp Increase in Road Traffic Demand
7.3 In the past years road traffic has increased rapidly due to the increase in road vehicles, as
shown in Table 7.1.1. Between 2012 and 2016, the total number of vehicles in Yangon Region shot
up from 269,000 to 773,000, or a 2.9 times growth. Even between 2014 and 2016, it increased by
1.5 times. It is an accepted fact across the world that vehicle ownership increases as an economy
develops and household incomes rise. As with other cities, it is expected that vehicle ownership in
Yangon will further increase and the impact on roads will become increasingly larger.
Table 7.1.1 Vehicle Ownership in Yangon Region
Type No. of Units (000) Rate
14/16 2012 2014 2016 Private Car 160 270 330 2.1
Truck Light 16 49 124 7.5
Heavy 11 17 17 1.6 Bus 11 13 16 1.4 Motorcycle 56 143 253 4.5 Others 13 22 34 2.5
Total 269 514 773 1.5 Source: Department of Road Transport Administration
Table 7.1.2 International Comparison of
Vehicle Ownership
City No. of Vehicles / 000 Pop
Yangon (2016) 45 Bangkok (2012) 400 Kuala Lumpur (2013) 480 Manila (2013) 100 Hanoi (2013) 80 Seoul (2013) 280 Taipei (2015) 220 Singapore (2014) 230
Source: Study Team
3) Major Planning Issues
7.4 Existing urban roads in Yangon Region are not provided in the same manner as the roads in
the aforementioned destinations are built, that is, connected to each other, efficient, and effective.
The major issues of the current urban road network and facilities in Yangon are as follows:
Absolute lack of road infrastructure
Insufficient traffic capacity for most of the primary and secondary urban roads network against traffic demand.
Substandard road and bridge facilities for industrial and residential developments, including access to Thilawa SEZ, and Dala and Twantay new towns, among others.
Many missing links are found in large urban blocks in the city centre area which reduces articulation of road network, decrease accessibility in the urban blocks and increase traffic concentration on main roads.
7-1

Comprehensive Study of the Urban Transport Development Program in Greater Yangon (YUTRA Update) Final Report | Chapter 7: Urban Roads
7-2
Source: Study Team.
Figure 7.1.1 Urban Roads in Yangon by Number of Lanes
7-2

Comprehensive Study of the Urban Transport Development Program in Greater Yangon (YUTRA Update) Final Report | Chapter 7: Urban Roads
7-3
Insufficient and improper maintenance of roads including pavement, drainage, road markings,
and furniture.
Inadequate traffic management
Excessive concentration of vehiculars to/from and within the CBD;
Reduction of traffic capacity due to roadside parking and street vendors turning 4-lane roads into 2-lane roads and 6-lane roads into 4-lane roads in many locations;
Insufficient traffic capacity of intersections, including roundabouts, and sole or independent traffic signal control without reflecting appropriate time required for directional flows especially during morning and evening peak hours; and
Though eight flyovers were constructed, they are not working systematically, causing new bottlenecks at neighboring intersections.
Lack of pedestrian facilities, wherein sidewalks are not pedestrian-friendly, road crossings
cause traffic accidents while negatively affecting traffic flow;
Inadequate control of large cargo vehicles, such as cargo trucks and container trailers, which
run on Kannnar Road - Bayint Naing Road, Than Thu Mar Road, and a part of CBD during the
morning and evening peak hours, causing traffic congestion, conflicts, and accidents; and
Other factors which are not properly attended to such as:
Lack of local traffic circulation management at and around large markets/shopping centers, schools, etc.;
Inadequate U-turns;
Inappropriate access control to/from buildings and local streets;
Inadequate traffic control at at-grade railway crossings; and
Inadequate arrangement for boarding/alighting of passengers at bus stops and terminals.
4) Urban Road Development Directions
7.5 Although traffic volume has increased significantly in the last three years and this high rate is
expected to continue for a while, the construction of new major arterial roads or widening of existing
major arterial and secondary roads in the city center to increase traffic flow capacity proves to be
very difficult because of constraints in land acquisition and resettlement. Because the provision of
new road facilities like the elevated inner ring road (IRR) and mass rapid transit (MRT) will likewise
require considerable time under such restrictions, the direction of urban road development is
proposed as follows:
Maximum utilization of the existing road network and facilities including removal of bottlenecks,
expansion of traffic management measures, expanded reliabilities and maintenance;
Development of missing links including widening of roads in existing urban areas in integration
with improvements of the roadside environment; and
Development of new roads in urban areas even though it is not easy to do so. Yangon must
continuously face this challenge in order to establish an adequate transport infrastructure as
well as an effective land use. There are alternative approaches in developing new roads in
urban areas, to wit:
When developing roads in urban areas, introduce alternative approaches which will not require acquisition of lands but readjustment of lands, and
In greenfield projects, plan roads first to secure space and shoulder the cost of subsequent urban development which will follow the planned alignments. In this case, a road plan must be part of the statutory urban plan to force developers to comply.
7-3

Comprehensive Study of the Urban Transport Development Program in Greater Yangon (YUTRA Update) Final Report | Chapter 7: Urban Roads
7-4
Table 7.1.3 Proposed Urban Roads
Category Project / Action Timeframe
1. Asset Management
a. Preparation of a comprehensive inventory of primary/secondary roads and intersections In 1–2 years
b. Utilization of existing flyovers: Pyay Road from 8-mile junction to Bogyoke Aung San Street1, Pyay Road between U Htaung Road intersection and Hledan intersection, U Htaung Bo Road–Kan Yeik Tha Street between Baho Road and Set Yone Road
Short-term
c. Preparation of a bus stop database Short-term 2. Rehabilit
ation and Minor Improvements
a. Improvement of intersections including additional flyovers / underpasses Short-term b. Rehabilitation of main roads (i.e., Hlaw Ga Road, Anawratha Road, Hlaing River Road, Main
Road No.6. In 1–2 years
c. Roundabouts in the city center: Pyay Road–Hanthawaddy Road intersection, U Wisara Road–U Htaung Bo Road intersection, Kabar Aye Pagoda Road–U Htaung Bo Road intersection.
Short-term
d. All roads Short-term 3. Construc
tion of New Roads and Missing Links
a. 1. New truck route3, 2. Wataya Bridge South Approach, 3. Min Ye Kyaw Swar Road–Yarzaa Dirit Road3, 4. KyeeMyin Daing Bridge & ORR connection, 5. Dala Bridge & ORR connection, 6. Bago River Bridge -2 and Thanlyin Connection.
Short-term
b. Main Road No.2, New Cargo Truck Route, Main Road No.4, Yadanar Road, Thilawa Access Road, Extension of Thilawa Access Road4 to Thilawa Port, Kyauktan Road, Dagon Bridge–Thilawa SEZ Road.
Short-term
c. New Thaketa Bridge5, New Bago Bridge6, Dala Bridge7, Wataya Bridge, Kyi Myin Dine Bridge, Bago River Bridge 2 for Bago or Monkey Point
Short- to Medium-term
d. East and west ring routes as new cargo truck routes Short-term 4. Upgradi
ng of Pedestrian Facilities
a. For all sidewalks provided along primary and secondary urban roads Short- to Medium-term
b. Primary and secondary urban roads in the city center on which daily pedestrian crossing exceeds 500.
Short- to Medium-term
c. Standard 2.0-m wide sidewalk on which daily pedestrian traffic is less than 500 and 3.5 m sidewalk if more than 500.
Short- to Medium-term
d. Primary and secondary urban roads in the city center on which daily pedestrian traffic exceeds 500.
Short- to Medium-term
Source: Study Team 1 Flyover or underpass construction at the Parami Road–Hanthawaddy Road intersection. 2 A flyover or underpass is required at the Pyay Road–Hanthawaddy Road intersection. 3 Includes new bridge construction. 4 Thilawa Access Road is an ongoing project under a JICA loan. 5 Under construction using JICA grant. 6 Under DD using JICA finance. 7 Under DD using KOICA finance.
7-4

Comprehensive Study of the Urban Transport Development Program in Greater Yangon (YUTRA Update) Final Report | Chapter 7: Urban Roads
7-5
Source: Study Team.
Figure 7.1.2 Proposed Road Network Improvements
7-5

Comprehensive Study of the Urban Transport Development Program in Greater Yangon (YUTRA Update) Final Report | Chapter 7: Urban Roads
7-6
7.2 Removal of Bottlenecks
1) Overview
7.6 Because the development of an adequate road network for the entire urban area requires
extensive measures, attending first to road traffic problems by corridor and area is proposed to
increase traffic capacity and ensure smooth movement along major roads. In relation to this, a total
of seven major corridors were surveyed to assess their current situation and problems. The survey
was conducted in cooperation with the YRTA and the YCDC in January 2017.
Pyay Road,
Kabar Aye Pagoda Road,
Kanner Road–Bayint Naung Road–Lower Mingaladon Road,
Yangon–Pathein Road
Upper Pazuntaung Road,
Wai Za Yan Tar Road, and
Thanthumar Road–No. 2 Main Road.
7.7 The survey was conducted by teams of YCDC officials using a survey form to determine the
following: (i) congestion at and around traffic-generating sources such as shopping centers and
schools; (ii) structures of intersections; (iii) signal phasing; (iv) roundabouts; (v) congestion caused
by boarding/alighting passengers at and around bus stops; (vi) congestion caused by waiting taxis
or boarding/alighting taxi passengers; (vii) roadside parking; (viii) jaywalking; (ix) poor pavement
conditions; (x) congestion on sidewalks due to vendors and parked vehicles; (xi) inadequate use of
space under flyovers; (xii) unclear lane markings; and (xiii) poor road facilities.
2) Identified Bottlenecks
7.8 Identified bottlenecks are summarized in Table 7.2.1 and illustrated in figures shown on the
next pages. The most major cause of bottleneck is the roadside parking due to the lack of parking
space, long signal phase, disordered loading by bus/taxi were also observed at various places.
Details and main outputs of the survey are included in Technical Report No.3. In addition to the
findings on the survey, flood prone area could be serious bottleneck.
Table 7.2.1 Identified Bottlenecks by Corridor
Bottleneck
No. of Bottlenecks by Corridor (Unit: Number of Location)
Pyay
Roa
d
Kab
ar A
ye
Pago
da R
oad
Kyi
Myi
nt D
aing
K
anna
r, B
ayin
t na
ung,
Low
er
Min
gala
r Don
Roa
d
Yang
on–P
athe
in
Roa
d
Wai
Za
Yan
Tar
Roa
d U
pper
Pa
zunt
aung
R
oad–
Th
anth
umar
R
oad–
No
2 M
ain
4 C
orrid
ors
in
CB
D
Survey Section Length (km) 11.9 12.7 23.6 5.5 8.1 16.5 20.2 Congestion at Traffic Generator 8 0 3 0 1 1 4
Congestion at Intersection
By structure of intersection 3 2 0 1 0 0 4 By signal phase 10 10 8 9 9 0 3 By roundabout 1 4 0 0 0 0 0
Roadside Parking 16 12 47 7 21 17 51 Loading by Bus/ Taxi
Congestion by bus 13 0 0 0 0 0 1 Congestion by taxi 8 2 0 0 0 0 0
Walking Condition
Poor crossing conditions 6 2 3 1 0 1 2 Jaywalking 3 4 0 0 0 0 0 Poor pavement conditions 27 19 1 0 0 3 26 Congestion at sidewalk 23 17 53 4 28 22 36
Others Unused space under flyover 3 5 0 0 0 0 0 Unclear lane markings 3 0 2 0 0 0 2 Poor road facility 7 4 0 3 2 0 2
Total 131 81 117 25 61 44 131 Source: Study Team.
7-6

Comprehensive Study of the Urban Transport Development Program in Greater Yangon (YUTRA Update) Final Report | Chapter 7: Urban Roads
7-7
7.9 A possible solution for Pyay Road, which is one of the most significant corridors connecting
Yangon Airport and the CBD, is to construct flyovers at intersections with Oakkala and Parami roads,
and underpasses1 at the intersection with Inya Road and at Hanthawaddy roundabout. With these,
the corridor will avoid major bottlenecks at intersections, reducing travel time to approximately 30
minutes.
Source: Study Team. 1) ROW: Right of Way, CW: Carriageway, SW: Sidewalk, EL: Extra Land
Figure 7.2.1 Identified Bottlenecks on Pyay Road and
Proposed Measures
Source: Study Team.
Figure 7.2.2 Proposed Concept of Making
Pyay Road a Semi Access-controlled North–
South Arterial Road
1 With provision of drainage pump station
7-7

Comprehensive Study of the Urban Transport Development Program in Greater Yangon (YUTRA Update) Final Report | Chapter 7: Urban Roads
7-8
Kabar Aye Pagoda Road Kyee Myint Daing Kannar Road
Bayint Naung Road Lower Mingalardon Road
Source: Study Team. 1) ROW: Right of Way, CW: Carriageway, SW: Sidewalk, EL: Extra Land
Figure 7.2.3 Identified Bottlenecks on Major Corridors (1)
7-8

Comprehensive Study of the Urban Transport Development Program in Greater Yangon (YUTRA Update) Final Report | Chapter 7: Urban Roads
7-9
Wizar Yan Tar Road Thanthumar Road–No. 2 Main Road
Yangon–Pathein Road Upper Pazuntaung Road
Source: Study Team. 1) ROW: Right of Way, CW: Carriageway, SW: Sidewalk, EL: Extra Land
Figure 7.2.4 Identified Bottlenecks on Major Corridors (2)
7-9

Comprehensive Study of the Urban Transport Development Program in Greater Yangon (YUTRA Update) Final Report | Chapter 7: Urban Roads
7-10
7.3 Development of Missing Links in Built-up Urban Area
1) Issues
7.10 While Yangon lacks road infrastructure substantially, there are also missing links which can
help connect the roads by widening or constructing relatively short road sections. However, these
missing links are mostly located in built-up urban areas. It is considered difficult in terms of land
adjustment, buildings of affected parties, financial constraints, and institutional arrangements,
among others. Notwithstanding these current constraints, Yangon must continuously attend to the
challenge to promote sustainable urban development.
7.11 Missing links in Yangon represent the following two types:
Substandard or Missing Sections of Road Network: As shown in Figure 7.3.1, in many
locations roads are not connected to each other with appropriate standards. Missing links
include both substandard road sections and new links.
Large Urban Blocks without Secondary and Distributor Roads: Urban blocks surrounded
by major roads are so large and are not provided with adequate secondary and distributor
roads. As shown in Figure 7.3.1, many urban blocks are not provided with an appropriate road
network, creating the following negative effects:
People have to walk long distances to access bus routes which is a factor in the shift to cars and taxis, and
Cars and other vehicles tend to enter major roads, amplifying traffic congestion.
ID Area (ha)
Estimated Population
Density (no./ha)
1 178 21,191 119 2 296 13,611 46 3 131 30,536 233 4 293 45,964 157 5 108 8,021 74 6 130 8,372 64 7 146 5,249 36 8 140 15,335 109 9 182 6,471 36
10 56 5,674 101 11 186 32,064 173 12 59 16,827 285 13 59 10,938 184 14 92 18,303 198 15 63 12,077 190 16 41 8,609 211 17 47 9,048 193 18 38 8,946 233 19 64 9,438 148 20 114 36,232 317 21 90 37,042 412 22 171 30,629 179 23 201 83,110 413
Source: Study Team
Figure 7.3.1 Large Urban Areas without Proper Secondary/Distributor Roads
7-10

Comprehensive Study of the Urban Transport Development Program in Greater Yangon (YUTRA Update) Final Report | Chapter 7: Urban Roads
7-11
2) Objectives
7.12 The objectives of constructing the missing links are:
To mitigate traffic concentration on primary roads;
To strengthen overall network capacity; and
To improve accessibility to localities.
Source: Study Team
Figure 7.3.2 Development Concept for Existing Roads
Source: Study Team
Figure 7.3.3 Development Concept for Missing Links
3) Proposed Approach
7.13 The considered approach for constructing missing links is two-fold, i.e.:
To designate right of way (ROW) in the official urban plan, and
To introduce alternative methods, such as land readjustment, with the agreement of land
owners along subject roads.
7-11

Comprehensive Study of the Urban Transport Development Program in Greater Yangon (YUTRA Update) Final Report | Chapter 7: Urban Roads
7-12
7.4 Development of Missing Links in New Urban Area
1) Issues
7.14 As well as the road development in built-up urban areas, road development in new urban area
also should be carefully discussed to promote sustainable development. In order to distribute the
urban function concentrated in the existing CBD and adjoining areas, three new towns in East
Dagon, Kyee Myin Daing, and Dala are proposed to be developed in Suburbs.
7.15 To ensure the mobility and accessibility in the proposed new town, the road network with high
road density should be developed. The comprehensive road systems with hierarchy. For new town
projects by private developer, the construction of roads, drainage, sewage ditch, parks and other
infrastructures shall be borne by the developer
Source: NYDC Figure 7.4.1 New Yangon City Development
Phase 1 and Phase 2
Source: Study Team Figure 7.4.2 Location of New Town
Projects Proposed in SUDP
2) Objectives
7.16 The objectives of constructing the road development in new urban areas are:
To ensure the mobility and accessibility in the proposed new town
To strengthen overall network capacity; and
To encourage investment for urban development
3) Proposed Approach
7.17 The considered approach for constructing missing links is two-fold, i.e.:
To designate right of way (ROW) in the official urban plan, and
To introduce alternative methods, such as land readjustment, with the agreement of land
owners along subject roads.
7-12

Comprehensive Study of the Urban Transport Development Program in Greater Yangon (YUTRA Update) Final Report | Chapter 7: Urban Roads
7-13
7.5 Urban Expressway Development
1) Role of Urban Expressways
7.18 Mega cities need both high-quality transit network and urban expressway network. In the
Transport Network, The urban expressway network consists of an Inner Ring Road (IRR), Outer
Ring Road (ORR) and Radial roads for both arterial roads and expressway.
7.19 Road area to the total urban area in Yangon is only 4.5%, which is much lower than other
large cities in the world. And there is significant difficulty to construct new road in built-up urban
areas in terms of land adjustment, buildings of affected parties, financial constraints, and institutional
arrangements. To minimize the land acquisition and resettlement in built-up area, the “elevated
viaduct” structure on the existing arterial roads was proposed to extend the road capacity.
7.20 Especially, an IRR should be ideally located to improve road traffic, in particular:
To absorb CBD traffic effectively;
To divert long-distance passengers and goods traffic to/from port; and
To establish efficient connectivity to Dala and the southern region via the Dala Bridge.
7.21 The IRR is proposed as an elevated toll road and as part of an integrated urban expressway
network. It will comprise of the Dala Bridge and connections to Yangon–Mandalay extension, other
link roads, and the outer ring road (ORR).
With Urban Expressways Without Urban Expressways
Source: Study Team
Figure 7.5.1 Impact of Urban Expressways
7-13

Comprehensive Study of the Urban Transport Development Program in Greater Yangon (YUTRA Update) Final Report | Chapter 7: Urban Roads
7-14
2) Proposed Urban Expressway Network
7.22 In view of the limited opportunities to increase traffic capacities of at-grade urban roads, a
network of expressways with controlled access is proposed. The basic objectives of expressway
development in Yangon are as follows:
To divert long-distance, intercity, and through traffic from urban roads which are mainly of
large vehicles such as trucks and buses;
To divert north–south traffic on Bayint Naung Road–Kanner Road–Wai Za Yan Tar Road,
including port traffic, to elevated expressways;
To divert CBD traffic to/from hinterland urban areas; and
To integrate emerging urban areas in Dala, Kyee Myin Daing, and Thilawa, among others.
7.23 The expressway network has a total length of 190 km and is composed of the following
sections:
Yangon–Bago–Hanthawaddy New Airport (36.2 km);
Yangon–Pyay (21.5 km);
Yangon–Thilawa (18.8 km);
Yangon–Hlegu (18.0 km);
Yangon–Pathein (15.2 km);
IRR Western Half: Insein–CBD–Dala (19.1 km);
IRR Eastern Half: Mindak–CBD (20.2 km);
Access to Yangon–Mandalay Expressway (21.3 km);
Pazundaung Bypass (6.4 km);
Northern East–West Smart Tunnel (6.3 km); and
Southern East–West Smart Tunnel (6.9 km).
7.24 The International Finance Corporation (IFC), a member of the World Bank Group, promotes
private sector investment on the urban expressway network. The PPP-F/S is on going as of July
2018.
7-14

Comprehensive Study of the Urban Transport Development Program in Greater Yangon (YUTRA Update) Final Report | Chapter 7: Urban Roads
7-15
Source: Study Team
Figure 7.5.2 Proposed Urban Expressway Network
7-15

Comprehensive Study of the Urban Transport Development Program in Greater Yangon (YUTRA Update) Final Report | Chapter 7: Urban Roads
7-16
3) Basic Design Concept
(1) Elevated / Underground Section
7.25 As the design standards in Myanmar specify the width of lane to be 3.75 m, the same applies
to the inner city of Yangon. Meanwhile, in the United States and other countries recently, road
widths in urban areas tend to be narrower. Therefore, it is appropriate to apply this model of urban
road standards in the city of Yangon. On the basis of this, the optimization of road width (i.e., 3.6 m
→3.0 m) can be applied to the construction of viaducts and waiting lanes for left-turning vehicles, etc.
Consequently, the plan proposes the construction of viaducts which can secure the same number of
lanes as existing roads have and minimize widening of roads, i.e., land acquisition. The basic
concept of developing the urban expressway proposed in YUTRA-YUEX is summarized below.
7.26 Besides, expressways should have a minimum number of ramps to balance performance and
cost for target vehicles, mainly those traveling long distances. Additionally, in order to minimize the
space for ramps, straight ramps are recommended in general. On routes where the construction of
expressways impedes viaduct structures, e.g., the planned expressway from east to west, the
construction of tunnels can be an alternative.
Existing Road Existing Road + Inner Ring Expressway 1)
Source: Data collection survey for the Yangon Urban Expressway (YUEX) Project. 1) 2.5m width of the road shoulders on the expressway is provided along the alignment for emergency parking and road operation and maintenance services. The road shoulder could be omitted by the provision of the parking bay (lay-bay space) with certain intervals (i.e. 200 m)
Figure 7.5.3 Urban Expressway Concept for Wai Za Yan Tar Road Section
7.27 The table below shows the proposed standards for the geometric structures of the YUEX at
pre-FS level and those stipulated by the Ministry of Construction of Myanmar.
Table 7.5.1 Basic Design Plan for the YUEX
Item Section Standard in Myanmar Proposed
Design Speed Expressway 80 km/h 80 km/h (mainline) 60 km/h (junction) 40 km/h (interchanges)
Arterial Road 55–72 km/h 55–72 km/h
Width of Carriageway Expressway 3.6 m 3.5 m Arterial Road n/a 3.0 m (urban area)
Number of Lanes Expressway n/a Determined by traffic analysis Arterial Road Minimum 4 lanes Minimum 4 lanes
Minimum Curve Radius Expressway Not clearly specified. The design standard of PWD is now under revision.
350 m Arterial Road Varies
Width of Shoulders Expressway 2,5 m (outer) / 0.5 m (inner) Arterial Road 0.5 m Vertical Clearance 16.5 feet 5.0 m
Source: Data Collection Survey for the Yangon Urban Expressway (YUEX) Project.
7-16
Comprehensive Study of the Urban Transport Development Program in Greater Yangon (YUTRA Update) Final Report | Chapter 7: Urban Roads
7-17
(2) Tunnel Section
7.28 In case of narrow widths and problematic alignments of existing roads especially when in
comes to locations of the base of viaducts, tunnel structures should be considered as an option at
the feasibility study stage to minimize the effect on the ground and the longitudinal flow of traffic.
7.29 For an examination of the tunnel structure, this section provides an overview of advanced
examples such as the SMART Project (Stormwater Management and Road Tunnel Project)
implemented in Kuala Lumpur2. Prior to the construction of this tunnel, there were frequent floods as
a result of urbanization which also hindered the expansion of the river. At the same time, there was
road congestion with the increase in traffic volume. Through the SMART Project, whose primary
objective was to control flooding in the city, the construction and operation of the underground tunnel
for both of flood control also mitigated congestion This tunnel has a three-layer structure: Under
ordinary usage, the upper two layers serve as motorway (only for regular-sized vehicles). The lowest
level functions as water conveyor.
7.30 This structure that such a plan for storm-water retention tank in the upstream and a stilling
pool in the downstream should be examined at the stage of adopting expressway tunnels with a
flood-preventive function. The attenuation ponds to reduce the flood water level at the corridor
preventing spillover should be carefully selected.
2 http://smarttunnel.com.my/
7-17

Comprehensive Study of the Urban Transport Development Program in Greater Yangon (YUTRA Update) Final Report | Chapter 7: Urban Roads
7-18
4) Operation and Management
(1) Organizational Structure
7.31 For the development of the expressway network, the following describes items to be expected
and considered:
7.32 In view of efficient management and measures implemented by administrative agencies and
user-friendliness, integrated operation within ORR of urban expressway considering interoperability
is indispensable regardless of embodiment of the construction, e.g., classification of PPP. In order to
realize this, an organizational structure for the urban expressway company should be established
under the YRTA. Supervising relevant organizations will enable coordination with other projects
regarding routes, construction, maintenance, and management.
Source: Study Team
Figure 7.5.4 Organizational Structure for the Urban Expressway Company
(2) Toll System
7.33 The following shows a proposal on the toll system, wherein a flat rate is applied to YUEX.
Source: Data collection survey for the Yangon Urban Expressway (YUEX) Project.
Figure 7.5.5 Toll Collection Plan for the YUEX
YRTA / HeadQuarter of Urban
Expressway
Road Construction
RoadMaintenance
Facilities Maintenance Toll Collection Traffic Control &
Patrolling
7-18

Comprehensive Study of the Urban Transport Development Program in Greater Yangon (YUTRA Update) Final Report | Chapter 7: Urban Roads
7-19
7.34 The table below compares the features of toll systems. Evaluation of each system varies
according to usage, management system, introduction of ITS, etc.
Table 7.5.2 Comparison of Toll Systems
Toll System Advantage Disadvantage
1. Flat Rate Simple toll management Toll collecting facility installed only at
entrance (required stop once)
Sense of unfairness disproportioned to the driving distance
Vulnerability for expansion of road network and flexible toll management
2. Distance-based Rate Sense of fairness proportioned to the driving distance
Expansibility for expansion of road network and flexible toll management
Complicated toll management Toll collecting facility installed at entrance
and exit (required stop twice)
Source: Study Team
(3) Intelligent Transport Systems
7.35 In Myanmar, there are many second-hand Japanese cars, not yet worn out, which have
retained their on-board units (OBUs) for electronic toll collection (ETC) or vehicle information
communication system (VICS). This means that these vehicles are prepared for the introduction of
ITS in Yangon, and when the infrastructure part is ready, it may be easier to introduce ITS of the
same standard/ degree as those used in Japan. However, there are some difficulties to practically
utilize due to the issues such as cryptography implemented to the Japanese ETC unit.
7.36 Furthermore, exclusive lanes for such vehicles for toll collection on expressways could be
considered.
Source: Study Team
Figure 7.5.6 Popularization of Japanese Vehicles and ITS
7.37 One of the current global trends is the use of autonomous cars, which will be first introduced
in access-controlled expressways. In view of such advanced technology and in preparation for the
introduction of ITS, efficient operation of expressways through the adoption of existing ITS
technologies should be considered in this study.
7-19

Comprehensive Study of the Urban Transport Development Program in Greater Yangon (YUTRA Update) Final Report | Chapter 7: Urban Roads
7-20
7.6 Development of Outer Ring Road 3
1) Role of Outer Ring Road
7.38 Yangon is expanding outward and various developments are proposed in the suburban area.
In particular, the urbanization of Thilawa area is remarkable. And Outer Ring Road (ORR) is
positioned as both of interurban corridor and urban corridor.
As Interurban Corridor: Thilawa area having Thilawa Port and Thilawa SEZ located in the
Greater Yangon is the south end of North-South Corridor as well as the west end of East-
West Economic Corridor in Asian Economic Corridors. Both corridors are the two of most
important corridors for Myanmar economy, and thus early implementation between Y-M
Expressway and Dala area is necessary.
As Urban Corridor: Traffic demand of southern part between Thilawa and Dala areas on
YORR is expected to be increased depending on the development of Dala area.
2) Implementation Phase
7.39 To develop as interurban corridor and urban corridor, the Eastern Section which runs from the
existing Yangon-Mandalay expressway through the Thilawa SEZ along the No.7 Road to Dala
crossing the Yangon River is positioned as the priority project and “The Project Formulation Study
for Construction of the Yangon Outer Ring Road (Eastern Section) in the Republic of the Union of
Myanmar, March 2017” was conducted by MLIT in 2016-2017. Demand of southern part between
Thilawa and Dala areas on YORR depends on the development of Dala area. and the project cost is
huge compared with the length of this section. Therefore, Eastern Section was divided into two
phases; Section from Y-M Expressway to Thilawa area will be constructed by 2024 in Phase 1, while
Section 2 from Thilawa to Dala area will be constructed by 2035 in Phase 2.
Source: Study Team,
Figure 7.6.1 Phasing Development Plan of ORR
3 The Project Formulation Study for Construction of the Yangon Outer Ring Road (Eastern Section) in the Republic of the Union of Myanmar, March 2017
7-20

Comprehensive Study of the Urban Transport Development Program in Greater Yangon (YUTRA Update) Final Report | Chapter 7: Urban Roads
7-21
3) Proposed Cross Section of ORR
7.40 In YUTRA Study, landuse and spatial development plan in SUDP proposed to allocate urban
centres along Outer Ring Road. However, the spatial development plan was modified in updated
SUDP study and Only East Dagon Newtown and Thilawa SEZ are proposed along the Eastern
Section of ORR (See Figure 7.6.2).
Source: SUDP Study
Source: Updated SUDP Study Team
SUDP (2013) Updated SUDP (2016) Figure 7.6.2 Proposed Urban Spatial Structures
7.41 In the point of view, the Eastern Section of ORR is recommended to ensure traffic function
and disordered development along ORR should be controlled. In Pre-F/S on the Eastern Section of
ORR, the cross section is proposed to be expressway with service road as shown in Figure 7.6.3.
The constriction of other sections will be far future. And large scale development projects are
proposed in Dala, Kyee Myin Daing. It may be possible to construct arterial roads with future space
for the expressway as proposed in YUTRA Study.
1) At the initial stage, construction of 4 lanes of expressway is proposed to minimize the initial construction cost. Source: The Project Formulation Study for Construction of the Yangon Outer Ring Road (Eastern Section) in the Republic of the Union of Myanmar, March 2017
Figure 7.6.3 Phasing Development Plan of ORR
7-21

Comprehensive Study of the Urban Transport Development Program in Greater Yangon (YUTRA Update) Final Report | Chapter 8: Public (Bus) Transport
8-1
8 PUBLIC (BUS) TRANSPORT
8.1 Public Transport System in Yangon
1) Overview
8.1 Based on results of the comprehensive traffic survey conducted in 2013 in YUTRA Study, it
was estimated that the total number of public transport passenger was 3.9 million a day, of which large
bus shared 47%, followed by truck bus (10%) and small bus (9%). Public bus shared a total of 60%
or 2.6 million passengers of the total demand (see Figure 8.1.1). Private bus, such as school bus and
company bus, shared 15%, while railway and water ferry shared 2% and 4%, respectively. Taxi shared
13%, although the share has increased since 2013 as motorization has made rapid progress.
8.2 The most significant change since 2013 is the active
intervention of the Yangon Region Government in strengthening the
public transport system which comprises bus, circular rail, and water
transport. The most notable improvement is the drastic reform of the
bus industry and the bus system into Yangon Bus Service (YBS),
which commenced in January 2017 and covers the introduction of
new buses, improvement of bus facilities, reorganization of bus
operators, restructuring of bus routes, and introduction of ICT. The
circular rail, which is expected to complete its upgrading by 2023, is
estimated to carry 200 thousand to 300 thousand passengers. The
expansion of water transport is ongoing with private sector
participation. Studies are also underway to further strengthen the
circular rail through grade separation, upgrading of suburban
commuter lines, and development of metro lines. The Government is
committed to maintaining public transport share at a high level and
quality.
2) Future Outlook
8.3 While future demand is estimated to increase substantially, there is a concern that private car
use will increase at a much faster rate than other transport modes, as have been commonly
experienced in other big cities in Asia during the process of urbanization associated with economic
growth. As is summarized in Table 8.1.1, the demand for motorized travel will increase from 53.7% of
all trips in 2016 to 70.1% by 2035.
Table 8.1.1 Estimated Travel Demand in 2016 and 2035
Trip Mode 2016 2035
Growth (35/16) No.
(000/day) Share (%) No.
(000/day) Share
Subtotal Total Subtotal Total Non-motorized Trip
Walk 4,624 80.9 37.5 5,375 80.9 24.2 1.16 Bicycle 1,091 19.1 8.8 1,268 19.1 5.7 1.16
Subtotal 5,715 100 46.3 6,643 100 29.9 1.16 Motorized Trip
Motorcycle 357 5.4 2.9 550 3.5 2.5 1.54 Car 1,118 16.9 9.1 4,186 26.8 18.8 3.75 Taxi 1,019 15.4 8.3 2,280 14.6 10.2 2.24 Public (Bus & Rail) 4,132 62.4 33.5 8,591 55.0 38.6 2.08
Subtotal 6,625 100 53.7 15,608 100 70.1 2.36 Total 12,340 − 100 22,251 − 100 2.40
Source: Study Team
Source: YUTRA Person Trip Survey (2013)
Figure 8.1.1 Modal Share of Public Modes in Yangon in
2013
8-1

Comprehensive Study of the Urban Transport Development Program in Greater Yangon (YUTRA Update) Final Report | Chapter 8: Bus Public Transport
8-2
8.2 Reform of Bus System in Yangon
1) Previous Bus Service
8.4 The public bus network covers almost all of Yangon, but the quality of service and safety is low.
The following figure shows the public bus network at the end of 2016.
Source: Study Team
Figure 8.2.1 Yangon Bus Network Before Restructuring
8.5 The Yangon Region Government took a small step in improving the bus transport system by
launching three BRT Lite routes in partnership with the private sector in February 2016. And this
represented a significant break from the past. This was followed by the establishment of the Yangon
Regional Transport Authority (YRTA) in July 2016, a new management authority to regulate public
transport. By the beginning of 2017, the Yangon Region Government completely restructured the
public bus network and management and launched the Yangon Bus Service (YBS). This marked the
beginning of significant changes in the public bus system of Yangon.
8.6 While previously the regional government had avoided putting money into bus transport, it has
now allocated a large portion of its limited budget to improving public transport. This is nothing short
of a capital subsidy. It is a slippery slope that could worsen the fiscal position of the Yangon Region
Government, unless this subsidy is calibrated with major reforms of the bus transport industry along
a sustainable path. Otherwise, the investment will not reap dividends, but increasing losses.
8.7 The main challenge was how to eradicate the following negative image of buses on roads:
(i) The general perception is that bus drivers lack discipline largely due to their penchant for
competing against each other, whether belonging to the same company or not. This street
competition for passengers is a result of the fragmented structure of the industry which
compensates drivers through payment of commissions. Although the recent changeover to the
8-2

Comprehensive Study of the Urban Transport Development Program in Greater Yangon (YUTRA Update) Final Report | Chapter 8: Public (Bus) Transport
8-3
YBS and a salary-based system are supposed to fix this problem, it remains to be seen whether
bus drivers’ discipline will dramatically improve in the short term;
(ii) The traffic impact of bus operations is another issue. They tend to race to the next bus stop to
overtake other buses and dwell at stops for a very long time to pick up as many passengers as
possible, although the attitude has been improving lately; and
(iii) Nearly all of the vehicles in service were very old but new buses are being fielded to replace
them.
8.8 From lessons on bus reform in other cities, the key factors for success in converting the
preceding negatives into positives are the following:
(i) Strong political leadership at the local or city level to start and sustain the reform process;
(ii) A strong local institution—a role expected from the recently operational YRTA—that will be
responsible for route planning, performance monitoring, support infrastructure;
(iii) Passenger feedback as part of the quality control mechanism;
(iv) Rapid deployment of modern technologies for bus management (e.g., GPS-based vehicle
tracking, a unified smart card fare collection system, and central control center); and
(v) Need for calibrated subsidies up front, considering that fares are set too low against the high
cost of procuring modern bus assets.
2) Restructuring of the Buses and Launch of Yangon Bus Service
8.9 As mentioned in the previous section, in July 2016, the Yangon Region Government formed
the Yangon Region Transport Authority (YRTA) to replace the existing bus regulator, Ma Hta Tha
(formally known as the Central Supervisory Committee for Motor Vehicles)1. The Ma Hta Tha had
controlled the city’s buses for more than 50 years and had built up a bad reputation for inefficient
management as well as being subject to allegations of corruption in almost every aspect of its
operation.
8.10 A month later in August 2016, the Yangon Region Chief Minister U Phyo Min Thein unveiled
plans to introduce a new public bus system by January 2017.2 On 17 January 2017, the Yangon
Region Government launched the new public bus network called the Yangon Bus Service (YBS)3, and
the following major actions were taken4:
(vi) Dissolution of the Ma Hta Tha (Central Supervisory Committee for Motor Vehicles) as the bus
regulator and operationally replaced by the YRTA;
(vii) Rationalization of more than 300 bus routes in Yangon to about 80 (as of January 2017);
(viii) Replacement of commission-based payments for bus drivers and conductors (which
encouraged overcrowding on buses and unsafe driving) with monthly salary payments;
(ix) Establishment of eight companies under the management of the YRTA to replace the existing
system where many companies and individuals owned bus vehicles and bus lines. (Previously,
vehicles were owned by individuals with some owners operating as few as two or three buses).
1 Soe, H. (2017). Breaking Yangon's gridlock. Frontier Myanmar. Retrieved 18 April 2017, from http://frontiermyanmar.net/en/breaking-yangons-gridlock
2 Soe, H. (2017). Yangon transport authority flags delay to bus network reforms. Frontier Myanmar. Retrieved 18 April 2017, from http://frontiermyanmar.net/en/yangon-transport-authority-flags-delay-to-bus-network-reforms
3 Soe, H. (2017). Testing times on the buses. Frontier Myanmar. Retrieved 18 April 2017, from http://frontiermyanmar.net/en/testing-times-on-the-buses
4 Myint, S. (2017). Yangon’s new bus service is a bold challenge to vested interests. Frontier Myanmar. Retrieved 18 April 2017, from http://frontiermyanmar.net/en/yangons-new-bus-service-is-a-bold-challenge-to-vested-interests
8-3

Comprehensive Study of the Urban Transport Development Program in Greater Yangon (YUTRA Update) Final Report | Chapter 8: Bus Public Transport
8-4
The eight companies are: Omni Focus Co., Ltd., Bandoola Transportation Co., Ltd., Yangon
Public Bus Co., Ltd., Yangon Urban Public Transportation Co., Ltd., Power Eleven Co., Ltd.,
Sanwaila and San Raung Ni Co., Ltd., City Liner Bus Public Co., Ltd., and Golden South District
Co., Ltd. The company structure of these companies are as follows:
One (1) public-private partnership company, namely, Yangon Bus Public Co., Ltd.,
Two (3) existing private bus operators (from the previous system), namely, Yangon Urban
Public Transportation Co., Ltd., Omni Focus Co., Ltd., Bandoola Transportation Co., Ltd.;
and
Four (4) associations of small-scale bus vehicle owners, namely, Power Eleven Co., Ltd.,
Sanwaila and San Raung Ni Co., Ltd., City Liner Bus Public Co., Ltd. And Golden
Southern District Co., Ltd.
(x) Fares changed from MMK50 to MMK100 to flat fares of MMK100 for the three CBD loop routes
and MMK200 for all other routes (as of January 2017);
(xi) Retirement of old bus vehicles (those built before 1996); and
(xii) Eventual change in payment of fares from cash to smartcards within months of the launch of
the Yangon Bus Service (January 2017) to reduce problems of corruption among bus
conductors.
8.11 The organizational chart for the Yangon Bus Service is shown in Figure 8.2.2
Source: Study Team, Soe, H. (2017). Testing times on the buses. Frontier Myanmar. Retrieved 18 April 2017, from http://frontiermyanmar.net/en/testing-times-on-the-buses
Figure 8.2.2 Organizational Chart of Yangon Bus Service as of January 2017
8-4

Comprehensive Study of the Urban Transport Development Program in Greater Yangon (YUTRA Update) Final Report | Chapter 8: Public (Bus) Transport
8-5
8.12 However, the rollout of the new Yangon Bus Service has been anything but smooth. The major
problem has been the lack of buses. In the old system, there were about 6,000 vehicles (including
standard buses, minibuses, and Dyna/Hilux buses); but in the new system, only 4,000 vehicles (as of
9 February 2017) became available because many were taken out of service permanently due to old
age and poor condition. Also, some owners who were involved in the old system were unhappy with
the reforms and refused to cooperate. Around 1,000 bus vehicles became available in July as the
YRTA utilizes a USD44 million funding allocation from the Yangon Region Government 5.
Table 8.2.1 Reorganized Bus Operators (As of February 2017)
Group Operators Remarks Current Status (As of October 2018) 1 YUPT Previously known as "Ma Hta Tha, Myo Twin"
2 YBPC Previously known as "BRT-Lite" Shwe Myo Daw Stop its operation Myaut Pine Thar Stop its operation
3 Bandoola Previously known as "Parami"
4 Omni Focus Trans Link
5
Power Eleven Previously know as "45" Ever Green Consolidated as “Lucky Family,
Shwepytahr Thar, Ever Green” Lucky Family Shwe Pyi Tha Tharr
6
SRT Renamed as “YBS 31” San-wai-la Northern District Previously known as "Ma Hta Tha" Khit Thit Bayint Naung Previously known as "Ma Hta Tha, Western District" Shwe Inwa Renamed as “Shwe Lan Khin”
7
Future Stop its operation City Liner
8
Shwe Southern District Previously known as "Ma Hta Tha" Khone Baung Yangon Htet Myat Thu Renamed as “Golden Southern”
5https://www.mmtimes.com/national-news/yangon/26970-new-bus-fleet-to-improve-service.html http://www.mizzima.com/news-domestic/ybs-inks-deal-yutong-purchase-1000-city-buses
8-5

Comprehensive Study of the Urban Transport Development Program in Greater Yangon (YUTRA Update) Final Report | Chapter 8: Bus Public Transport
8-6
Table 8.2.2 Bus Operators in YBS (As of October 2018)
Company No. of
Routes
Number of
Owned
buses
Average
Number of
buses Daily
Operated
Operating
Rate 1)
001 Bandula 5 244 213 87%
002 YUPT 19 1230 975 79%
003 Yangon Bus Public Co.,Ltd 8 546 464 85%
004 Yangon Nothern Taikkyithar 1 84 57 68%
005 Omini Focus General Service Public Co.,Ltd 8 464 307 66%
006 Power Eleven Public Co.,Ltd 3 225 158 70%
007 Ever Green Lucky Family (65) 2 198 123 62%
008 Shwe Lan Khin 1 70 61 87%
009 Sanwaila 1 50 34 68%
010 Holiest Vim 4 174 114 66%
011 GYCT Co.,Ltd 10 696 344 49%
012 Khit Thit Bayint Naung 11 606 425 70%
013 Golden Southern 10 749 423 56%
014 Kong Baung 2 170 129 76%
015 Trans Link Co.,Ltd 2 60 54 90%
016 City Liner Co.,Ltd 1 16 8 50%
017 Rapid City 8 323 168 52%
018 People Partner 5 265 241 91%
019 YBS (22) 1 101 71 70%
020 YBS (31) 1 41 19 46%
021 YBS (33) 1 55 42 76%
022 YBS (45) 1 25 23 92%
023 YBS (63) 1 28 25 89%
024 YBS (73) 1 11 5 45%
025 YBS (76) 1 46 32 70%
026 YBS (79) 1 85 39 46%
027 YBS (80) 1 19 15 79%
Total 101* 6,581 4,569 69%
1)Average number of buses daily operating / number of owned buses
Source: YRTA
3) Initial Assessment of Yangon Bus Service
8.13 After the Yangon Bus Services (YBS) was launched, the Study Team conducted a bus
passenger interview survey to gauge bus users’ opinion with regard to the new bus service. By April
2017 or three months after the launch of the YBS, 2,400 bus passengers had been interviewed. Survey
results are shown in Figure 8.2.3.
8.14 Results show that the overall satisfaction with the bus service increased after the YBS replaced
the previous bus service. However, the users’ opinion survey also shows that there are some aspects
of the bus service that barely improved, to wit:
(i) Comfort in transferring to buses/other modes (number of transfers);
(ii) Convenience in transferring to other modes;
(iii) Waiting time; and
(iv) Accessibility of bus stops.
8-6

Comprehensive Study of the Urban Transport Development Program in Greater Yangon (YUTRA Update) Final Report | Chapter 8: Public (Bus) Transport
8-7
Source: Study Team Note: Respondents totalled 2,400 bus users.
Figure 8.2.3 Bus Users’ Opinion about Yangon Bus Service 3 Months After Launch
8.15 Bus users were also asked about the most important aspect they would like to see with regard
to bus service improvement. Results are shown in Figure 8.2.4. The top three priority measures from
bus users are as follows:
(i) Behavior/Attitude of conductor/driver (17.8%);
(ii) Driving manner of drivers (15.5%); and
(iii) On-board comfort (13.4%).
8.16 From the results of this survey question, it is clear that for bus users better bus operation and
management are required to provide better bus services. In addition, a “Yangon Bus Report”
application provided to bus users where individual bus users could report problems with regard to bus
services. One month after the YBS was launched (as of 12 February 2017), 764 problems were
reported with the most problems coming from the G1 bus group (254 problems), followed by the G7
bus group (137 problems).
8-7

Comprehensive Study of the Urban Transport Development Program in Greater Yangon (YUTRA Update) Final Report | Chapter 8: Bus Public Transport
8-8
Source: Bus Passenger Interview Survey 1) Respondents totalled 6,996 opinions from 2,400 bus users.
Figure 8.2.4 Bus Users’ Opinion about the Most Important Aspect for Bus Improvement 1)
Source: Bus Passenger Interview Survey
Figure 8.2.5 Comparison between Previous Bus Service and YBS
8-8

Comprehensive Study of the Urban Transport Development Program in Greater Yangon (YUTRA Update) Final Report | Chapter 8: Public (Bus) Transport
8-9
8.3 Current Operating Characteristics of YBS
1) Supplemental Survey
8.17 In order to analyze the current bus operation and services supplemental surveys were
conducted in March and April with the assistance of the YRTA. The scope of the survey is briefly as
follows:
(a) Objectives
To preliminary analyse current bus operating characteristics and user satisfaction/ needs,
and
To collect bus operation and passenger ridership data necessary for the Bus
Management Information System (YBS-MIS).
(b) Coverage and Survey Methods
All YBS routes;
On-board survey: for total of 81 routes; and
Bus passenger interview survey at selected bus terminals / stops: 2,400 bus passengers
at 12 bus stops.
(c) Survey Items Covered in the On-board Survey
Bus type and number of seats;
Bus arrival / departure time at each bus stop;
Number of boarding / alighting passengers at each bus stop;
Assessment of level of service (LOS) (on-board congestion, on-board comfort, driving
manner); and
Happenings during the survey.
(d) Survey Items Covered in the Bus Passenger Interview Survey
Socio-economic profile;
Trip Information;
Use of bus; and
Assessment of YBS in comparison to the previous bus service.
8.18 Survey results were processed into a database for analysis of various features of the YBS
operating characteristics. Details are explained in Technical Report No. 1.
8-9

Comprehensive Study of the Urban Transport Development Program in Greater Yangon (YUTRA Update) Final Report | Chapter 8: Bus Public Transport
8-10
2) Coverage of Bus Service and Route Connectivity
8.19 More than 300 bus routes were restructured to 81 routes, as shown in Table 8.3.1, Figure 8.3.1,
and Figure 8.3.2. The findings on the coverage of bus service and route connectivity are as follows:
(i) The coverage of the bus network has expanded although the number of transfers has increased
in some areas. For instance, in the Northwest / Northeast clusters, bus network coverage is
extensive. On the other hand, in new urban areas, such as Hlaingthaya, Kyee Myin Daing, Dala
and Thanlyin, the coverage is limited;
(ii) However, as it is not economical to connect all areas with big buses, adequate feeder services
need to be provided. Measures to improve connectivity must include facilities, services, and
fare integration; and
(iii) In order to supplement city bus services, companies have increasingly provided bus / truck bus
services for their workers.
Previous Bus Route Coverage
(Before YBS)
YBS Route Coverage
(As of January 2017)
YBS Route Coverage
(As of January 2019)
Source: Study Team
Figure 8.3.1 Comparison of Bus Route Coverage between YBS and Previous Bus Service
8-10

Comprehensive Study of the Urban Transport Development Program in Greater Yangon (YUTRA Update) Final Report | Chapter 8: Public (Bus) Transport
8-11
Table 8.3.1 Current Bus Routes (As of October 2018)
Company YBS No
O-D
Trip Length
Mile (round
trip)
Number of Buses
City Bus
Mini Bus
other Total
YUPT
2 Aungmingalar Highway Bus Terminal Yuzana Garden City 32.0 25 - - 25 3 Yuzana Garden City 50 Street 28.0 50 - - 50 4 Yuzuna Garden City Sule 22.0 98 - - 98
7_1 South Dagon 71/72 Sule 30.0 55 - - 55 7_2 Cargyi Gate Sule 24.0 105 - - 105 7_3 South Dagon(Kyi Su) Sule 30.0 86 - - 86 8_1 Inwa Housing Shwedagon Pagoda 26.0 25 - - 25 8_2 168 ward St. Paul 32.0 - 17 - 17 10_1 National Village Dagon University
34.0 30 - - 30
10_2 National Village Dagon University - 32 - 32 11 Aungmingalar Highway Bus Terminal Shwedagon Pagoda 35.2 - 40 - 40
15_1 Dagon University-Bayint Naung-Danyingone 30.9 30 - - 30 15_2 Dagon University-Pyay Rd-Danyingone 30.0 20 - - 20 17 Shwepaukkan Dagon Ayeyar Terminal 34.0 - 44 - 44
24_1 Kyansitthar Rd-Kyaung Rd-Botahtaung Pagoda 26.0 30 - - 30 24_2 Dagon University Botahtaung Pagoda 26.0 20 - - 20 26 Dagon University Botahtaung Pagoda 32.0 35 - - 35 28 Dagon University Sule 28.0 30 - - 30 29 Dagon University Sule 28.7 84 - - 84
36_1 Shwepaukkan Sule 28.9 40 - - 40 36_2 Htaukkyant Sule 42.0 60 - - 60 36_3 Aungmingalar Highway Bus Terminal Sule 26.0 20 - - 20 40 Shwe Pyithar/Aungmingalar Highway Bus Terminal-Thakhinmya Park 40.0 67 - - 67 58 Thakhinmya Park Linsataung 12.0 45 - - 45
59_1 South Dagon(Thein Kyaung) Hnin Si Kone St 30.0
30 - - 30 59_2 South Dagon(Thein Kyaung) Hnin Si Kone St - 24 - 24 65 Hlawgar (Lain Kone) Botahtaung Pagoda 44.0 60 - - 60 84 green 49 old gate 7/8 Junction 30.0 - 28 - 28
Subotal 1,045 185 0 1,230
Bandula
12 50 kwae Sule 26.0 43 - - 43 14 Parami(Bayli) Thakhinmya Park 36.3 43 - - 43 25 Dagon University Maharbandula Road 30.0 47 - - 47 30 Dagon University Thakhinmya Park 33.8 72 - - 72 38 South Okkalar (Bayli) Thirimingalar Market 16.8 39 - - 39
Subotal 244 0 0 244
Khit Thit Bayint Naung
15 Dagon University YTU 36.0 - 34 - 34 18 Khayaypin Avenue Tamwe Bali 30.0 - 36 - 36 21 WYU Mawtin 25.0 152 - - 152 35 Htaukyant Mawtin 29.3 92 - - 92 52 Tan Tapin Mee Gwat Zay 38.0 - 21 - 21 53 Ahlaeywar(Tour Gate)-Naung Tone Rd-Ahlaeywar(Tour Gate) 22.0 - 56 - 56 54 86 old gate-Kyansitthar Rd-86 old gate 20.0 - 18 - 18 61 WYTU Sule 28.0 106 - - 106 68 Shwepyithar WYTU 40.0 - 33 - 33 69 Shwepyithar Dagon Ayeyar Terminal 36.4 - 28 - 28 75 Thauwana Pagoda Natsin St 18.0 - 30 - 30
Subotal 350 256 0 606
Golden Southern
5 Yoe Ma Avenue Botahtaung Pagoda 32.0 19 - - 19 33 Kyaut Tan Workers' Hospital 44.0 - 41 - 41
34_1 Khayan Thein Phyu 92.0
26 - - 26 34_2 - 1 - 1 34_3 42 1 - 43 47 Hlaing Thar yar Twantay 42.0 - - 87 87
48_1 Dala Twantay 36.0
- - 252 252 48_2 - - 17 17 49 Hlaing Thar yar Konegangone 70.0 - - 39 39
50_1 Dala Konegangone 64.0
- - 85 85 50_2 - - 46 46
8-11

Comprehensive Study of the Urban Transport Development Program in Greater Yangon (YUTRA Update) Final Report | Chapter 8: Bus Public Transport
8-12
Company YBS No
O-D
Trip Length
Mile (round
trip)
Number of Buses
City Bus
Mini Bus
other Total
51_1 Kayan Bago 76.0
- 2 - 2 51_2 Kayan Bago - - 13 13 70 TTU Maharbandula Bridge 32.0 41 - - 41 95 Kyaut Tan Workers' Hospital 44.0 37 - - 37
Subotal 165 45 539 749
Omini Focus General Service Public Co.,Ltd
20 Dagon Ayeyar Bus Terminal Thein Phyu 40.4 70 - - 70 27 Mental Hospital Thein Phyu 37.5 63 - - 63 56 Thakhinmya Park-Botahtaung Pagoda-Thakhin Mya Park 12.0 30 - - 30 83 Dagon Ayeyar Bus Terminal Shweli Road(65) Ward 42.0 50 - - 50 85 Tuchaung Ayeyar Wun 39.0 51 - - 51
Airport Yangon International Airport Yangon International Airport 22.8 50 - - 50 98 Dagon Ayeyar Bus Terminal Thakhinmya Park 23.0 55 - - 55 99 Dagon Ayeyar Bus Terminal Shweli Road 28.0 95 - - 95
Subotal 464 0 0 464
Holiest Vim
1_1 Hlegu Market Zawana 66.0
16 - - 16 1_2 - 6 - 6
6 Ayeyar Wun Dagon Ayeyar Bus Terminal 44.0 94 - - 94 46 Dar Pain Zawana 44.0 - 5 - 5 92 Htauk Kyant Zawana 42.0 - 53 - 53
Subotal - 110 64 0 174
Kong Baung 31 TTU Pansoedan 30.0 105 - - 105 64 Wai Bar Gi Maharbandula Rd (Pansoedan) 30.0 65 - - 65
Subotal 170 0 0 170
Power Eleven Public Co.,Ltd
21 WYTU Mawtin 41.0 50 - - 50 39 Shwepyithar(LaneKone) Mawtin 26.0 52 - - 52
41_1 Hmawbi (TU) Thakhinmya Park 66.0
44 - - 44 41_2 - 79 - 79
Subotal 146 79 0 225
Yangon Bus Public Co.,Ltd
43 Wireless Botahtaung Pagoda 34.0 30 - - 30 62 Dagon University-Kyimyindaing-Panpingyi St 34.0 45 - - 45
37_1 Htauk kyant Sule 48.0 90 - - 90 37_2 Hmawbi Sule 74.0 46 - - 46 37_3 Hlegu Sule 62.0 45 - - 45 37_4 Oakkan 6 Htet Office 14.0 30 - - 30 72 Tharkayta Sule 44.0 35 - - 35 87 Dagon University Sule 48.0 60 - - 60 88 Dagon University Pyitawthar 34.0 50 - - 50 89 Ayeyar Wun Panpigyi St 30.0 70 - - 70 96 Hlawgar (Tar Sone) Tharkayta 46.0 45 - - 45
Subotal 546 0 0 546
Yangon Nothern Taikkyithar
90_1 Oakkan Thakhinmya Park 132.0 66 - - 66 90_2 Tikegyi BOC Kwae 90.0 - 18 - 18
Subotal 66 18 0 84
Shwe Lan Khin 40 Shwepyithar Thakhinmya Park 40.0 70 - - 70
Subotal 70 0 0 70
GYCT Co.,Ltd
1 Hlegu Market Zawana 66.0 11 13 - 24 6 106 Dagon Ayeyar Bus Terminal 44.0 198 - - 198 9 87 ward Kyat Tine 30.0 - 49 - 49
16_1 Aungmingalar Highway Bus Terminal Dagon Ayeyar Bus Terminal 35.6
- 14 - 14 16_2 128 - - 128 19 Shwepaukkan (Sinpone) Thakhinmya Park 50.0 57 - - 57 23 WYTU Thakhinmya Park 30.0 74 - - 74 39 UCSY Mawtin 48.0 34 - - 34 57 Thakhinmya Park-Botahtaung Pagoda-Thakhin Mya Park 12.0 35 - - 35
60_1 South Dagon-BayintNaung Road-Thirimingalar Market 34.0
- 36 - 36 60_2 22 - - 22 100 South Dagon Linsataung 28.0 25 - - 25
Subotal 584 112 0 696 Trans Link Co.,Ltd 80 Yadanar Rose Housing Women Central Hospital 25.0 35 - - 35
8-12

Comprehensive Study of the Urban Transport Development Program in Greater Yangon (YUTRA Update) Final Report | Chapter 8: Public (Bus) Transport
8-13
Company YBS No
O-D
Trip Length
Mile (round
trip)
Number of Buses
City Bus
Mini Bus
other Total
81 East Dagon Pansoedan 34.0 25 - - 25 Subotal - 60 0 0 60
City Liner Co.,Ltd 86 Bandula Bridge Thayattaw 24.0 - 16 - 16
Subotal 0 16 0 16
Sanwaila 23_1 WYTU Thakhinmya Park 30.0 42 - - 42 23_2 Twantay Dala 18.0 8 - - 8
Subotal - 50 0 0 50
Ever Green Lucky Family (65)
42_1 Hlawgar (Lain Kone) Tharkyta (Yadanar) 56.0
23 - - 23 42_2 - 72 - 72 65 Hlawgar (Lain Kone) Botahtaung Pagoda 44.0 103 - - 103
Subotal 126 72 0 198
Rapid City
44 Hlegu Market Mindama Housing 54.0 - 22 - 22 66 Mental Hospital UCSY 24.0 59 - - 59 67 Shwelin Pan-Pathein Rd-Shwelin Pan 27.6 - 11 - 11 71 Thatyat Pinchaung Sanpya Market 32.0 - 58 - 58 74 Shwepyithar 81 old gate Dagon Ayeyar Bus Terminal 19.0 - 28 - 28 77 Shwepyithar(Kannar) Sanpya 40.0 - 49 - 49 79 WYU Linsataung 43.0 37 - - 37 91 Taikgyi No.(3) Junction 60.0 - 59 - 59
Subotal 96 227 0 323
People Partner
78 Shwepyithar(LaneKone) Yangon Central Station 30.0 50 - - 50 93 WYU Yangon Central Station 30.0 50 - - 50 94 UCSY Yangon Central Station 40.0 50 - - 50 32 MMU Htaukkyant 68.0 50 - - 50 97 Ywarthargyi Htaukkyant 32.0 65 - - 65
Subotal 265 0 0 265
Individual Owners
22_1 WYU Thakhinmya Park 44.0
81 - - 81 22_2 - 20 - 20 31 East University Botahtaung Market 22.0 41 - - 41 33 Kyaut Tan Workers' Hospital 50.0 - 55 - 55 45 Hlegu Market Minkone Market 38.0 25 - - 25 63 Kyauk Kone Linsataung 14.0 - 28 - 28 73 Shwepyithar Htaukkyant 40.0 - 11 - 11 76 East University Sat Mu (1) 36.0 - 46 - 46 79 East University Linsataung 43.0 85 - - 85 80 Tharkayta Upper Pansoedan Rd(Kyauk Kwae) 28.0 - 19 - 19
Subotal . 232 179 0 411 Total - 4,789 1,253 539 6,581
Source: YRTA
8-13

Comprehensive Study of the Urban Transport Development Program in Greater Yangon (YUTRA Update) Final Report | Chapter 8: Bus Public Transport
8-14
CBD & Central Area Northwest Outer Cluster
Northeast Outer Cluster West Outer Cluster
Southwest / West Outer Cluster Southeast Cluster
Source: Study Team
Figure 8.3.2 Coverage of YBS Routes
8-14

Comprehensive Study of the Urban Transport Development Program in Greater Yangon (YUTRA Update) Final Report | Chapter 8: Public (Bus) Transport
8-15
Assessment of Bus Connectivity by Area
Source: Bus Passenger Interview Survey
Figure 8.3.3 Comparison of Bus Service Coverage between YBS and Previous Bus Service
8.20 Results of a questionnaire survey conducted among bus passengers on bus connectivity in the
areas of their residences show that their assessment vary by area. As shown in Figure 8.3.2, the
percentage of dissatisfaction (very bad and bad) is high in the southwest urban cluster, followed by
the west and south, but it is low in the inner urban, peri-urban, and suburban clusters.
3) Performance Indicators for Bus Operation
8.21 To study bus operation, one must first collect accurate data on bus operation and ridership.
And to analyze bus performance on the new YBS routes, a survey was designed and conducted along
the bus routes of YUPT, which is one of the largest new bus groups in Yangon. The survey collected
bus operation data, as well as number of boarding and alighting bus passengers at each bus stop
every morning, afternoon, and evening by assigning two surveyors on board. The specific data
collected from the survey is shown in Table 8.3.1.
Table 8.3.1 Bus Data Collected from On-board Survey
Data Collected from the Survey Key Performance Indicator Obtained from Analysis
1. Bus Operating Conditions • Departure time at each bus stop • Arrival time at each bus stop • Fuel consumption for each trip
2. Bus Passenger Ridership • No. of passengers boarding at each bus stop • No. of passengers alighting at each bus stop
1. Bus capacities 2. Travel speed and time between bus stops 3. Travel speed and time for each bus trip 4. Time spent on boarding/alighting at each bus stop 5. Load factor for sections between bus stops 6. Average load factor for each route 7. Bus passengers at each bus stop 8. Average travel distance of bus passengers
Source: Study Team
8-15

Comprehensive Study of the Urban Transport Development Program in Greater Yangon (YUTRA Update) Final Report | Chapter 8: Bus Public Transport
8-16
8.22 Figure 8.3.3 shows an example of the analysis on ridership pattern of bus passengers on bus
route no. 6. The figure indicates the number of bus passengers boarding/alighting at each bus stop
and the number of bus passengers on board along the route. When the number of on-board
passengers exceed set capacities, the bus is considered overcrowded. When the data is collected
from all bus trips every day, they can be used in bus allocation and scheduling, as well as route
planning.
Time Ridership Pattern Direction 1 Direction 2
Morning
Daytime
Evening
Source: On-board Survey
Figure 8.3.4 Ridership Pattern on YUPT Bus Route No.6
8-16

Comprehensive Study of the Urban Transport Development Program in Greater Yangon (YUTRA Update) Final Report | Chapter 8: Public (Bus) Transport
8-17
Route No. 25 Route No.30
Route No. 25
Time Ridership Pattern
Direction 1 Direction 2
Morning
Daytime
Evening
Route No.30
Time Ridership Pattern
Direction 1 Direction 2
Morning
Daytime
Evening
Source: On-board Survey
Figure 8.3.5 Ridership Pattern on Selected YUPT Bus Routes
8-17

Comprehensive Study of the Urban Transport Development Program in Greater Yangon (YUTRA Update) Final Report | Chapter 8: Bus Public Transport
8-18
4) Preliminary Cost Analysis
8.23 The operating costs for different types of buses have been preliminary estimated for selected
representative buses available in the market (see Table 8.3.6).
Table 8.3.2 Assumptions for Estimating Bus Operating Costs
Item Vehicle Type
Mini Bus (old)
Mini Bus (Old)
Standard Bus (Old)
Standard Bus (New)
Standard Bus (Advanced)
Typical Model in Yangon
Model Hino BM Hyundai County
2008 Hyundai Aero City
(2002–2004) Hyundai Aero City
(2005–2007) Hyundai 2015
Image
Cost (Market Price)
Vehicle 12,500,000 21,500,000 18,000,000 39,000,000 140,000,000 Tire 60,000 60,000 90,000 90,000 90,000 Maintenance 20,000 20,000 20,000 40,000 100,000 Vehicle's Registration Fee 150,000 150,000 200,000 200,000 200,000
Gasoline Permit 900,000 900,000 3,500,000 3,500,000 3,500,000 Insurance 8,300 16,700 16,700 225,000 250,000
Crew (Monthly)
Driver 200,000 300,000 350,000 439,000 330,000 Conductor 100,000 150,000 180,000 228,000 -
Others Vehicle Life (year) 8 10 8 10 12 Salvage Value 0% 10% 0% 15% 20%
Estimated Bus Operating Cost (MMK/km)
25 km/h 217 259 371 551 882
10 km/h 367 405 652 1,013 1,469
1): Estimated by Study Team based on interviews with bus operators.
8-18

Comprehensive Study of the Urban Transport Development Program in Greater Yangon (YUTRA Update) Final Report | Chapter 8: Public (Bus) Transport
8-19
Table 8.3.3 Assumptions for Estimating Bus Operating Costs
Vehicle Type New Buses Old Buses
Model Ankai (2017)
Yutone (2017)
Hyudai (2007)
Yutone (2007)
City Bus1995-
1999
Hyudai (2000-2007)
Mini Bus (2004-2007)
Number of Holding 250 225 135 105 102 347 303 Market Price (Kyat) 82,442,630 82,442,630 21,000,000 20,087,000 12,000,000 21,000,000 20,000,000
Fuel
Main Fuel Type (Gasoline/ Diesel/ Others)
CNG CNG CNG Diesel CNG CNG Diesel
Fuel Consumption Rate (L/ km) 0.50 0.50 0.56 0.63 0.44 0.56 0.218 Fuel Price (Kyat/ L) 273 273 273 690 273 273 690
Oil
Oil Consumption Rate (L/ 1,000km) 3.70 3.70 3.40 2.25 3.90 3.4 2.06
Oil Price (Kyat/ L) 3,100 3,100 3,000 3,100 3,100 3000 3100 Unit Engine Oil Cost (Kyat/1000
km) 11,470 11,470 10,200 6,975 12,090 10,200 6,386
Tire
No. of Tires 12 12 6 6 6 6 6 New Tire Price (Kyat / Unit) 240,000 240,000 240,000 240,000 240,000 240,000 135,000
New Tire life (km) 50,000 50,000 50,000 50,000 50,000 50,000 50,000 Unit Tire Cost (Kyat/ km) 58 58 29 29 29 29 16
Maintenance Maintenance Cost (Kyat/ Month) 10,000 10,000 260,000 260,000 40000 260,000 40000
Inspection Cost (Kyat/ Month) 150000 50000 Repair Cost 1,550,000 1,550,000 1,750,000 1,750,000 1,750,000 1,750,000 550000
Crew and Others
Drivers Wage (kyat/month) 600,000 Car Insurance (Kyat/ Year) 1,121,490 1,121,490 350,000 360,000 150,000 350,000 150000
SIM Card/Server Communication Expense (Kyat/ Month/Bus) 20,000 20,000 20,000 20,000 20,000 20,000 20000
Unit Other Cost (Kyat/ Month) 1,141,490 1,141,490 370,000 380,000 170,000 370,000 170,000
Operating Information
Vehicle Life (year) 10 10 5 5 2 5 5 Salvage Value (%) 20.0 20.0 20.0 10.0 10.0 10.0 10.0
Average Operating km 200 Estimated
Operating Cost (Kyat/km)
25 km/h 521 509 451 780 335 420 365
15 km/h 612 594 538 988 397 498 441
Source: Estimated by Study Team based on interviews with YUPT
Source: Estimated by Study Team based on interviews with YUPT
Figure 8.3.6 Estimated Bus Operating Cost ( Kyat/km) at 15 km/h of Operating Speed
8-19

Comprehensive Study of the Urban Transport Development Program in Greater Yangon (YUTRA Update) Final Report | Chapter 8: Bus Public Transport
8-20
6) Operating Issues of YBS
(1) Insufficient Reorganization
8.24 One of the expected impacts by reorganization of bus operators is transition from commission
base (according to the fare revenue), into trip-based commission system or fixed salary system. The
main characteristic of each system is as follows:
(a) Sales-based type: the drivers tend to wait for passengers at bus stops causing traffic
congestion
(b) Trip-based type: the drivers may over-speed and overtake just to make more trips
(c) Fixed salary system: is desirable for safe driving. Provision of incentives (ex. For safety driving
/ operation manor) need to be studied
8.25 As of October 2018, many bus operators have shifted into fixed-salary system or trip-based
system though some companies still apply conventional sales-based system. On the other hand,
buses operating under the companies can be classified into individual-own and company-own. Drivers
operating individually owned vehicles contract with the individual owner, not the company. The salary
system is up to the each contract and most of them apply sales-based system.
(2) Vehicle Management Scheme
8.26 Operation Rate (average number of buses daily operating / number of owned buses shown in
Table 8.2.1 ) is one of indicators to measure the service level of bus operators. The overall average
operation rate of YBS was 69 % as of October 2018 and some operators show less than 50 %. Lower
operation rate causes financial loss, overloading and left-off passengers. The most critical factor for
low operation rate is the frequency of mechanical problems.
8.27 In the most of bus operators, drivers or maintenance staffs conduct pre-departure inspection.
But they don’t prepare any manual and regular inspection record. Some bus operators own their
workshop facilities but many operators conduct repair and maintenance work on the roadside.
(3) Intra / Inter - modal Connectivity
8.28 As shown in Figure 8.2.3, modal transfer (comfort in transferring to buses/other modes and
number of transfers) is one of big issues of YBS. Since rationalizing more than 300 bus routes, the
number of passengers need transfer has been increased in average. Not only the marginal fare, there
are some transfer impedances such as walking distance for transfer, psychological factor due to the
lack of information. Bus terminal and intermodal facilities should be carefully developed to enhance
smooth transfer.
(4) Driver’s Working Hours and CNG
8.29 Working condition of YBS drivers is pointed out to be oppressive. The binding hour is longer
and handling hour (periods which the drivers grasp the handle, including bus operation and dead-
mileage) is higher than each Japanese Standard, which is 65 hours per week and 68.75 %,
respectively.
8.30 The cause of the longer binding hours is CNG station. For the fuel for buses, CNG is dominant
due to the cheaper price (half of the diesel fuel). However, the number of CNG stations is insufficient
compared with the operating bus vehicles and severe traffic congestions can be seen around the CNG
stations. Some drivers must wait for 3 hours to 6 hours to fill the CNG. The status of CNG station
facilities is also oppressive.
8-20

Comprehensive Study of the Urban Transport Development Program in Greater Yangon (YUTRA Update) Final Report | Chapter 8: Public (Bus) Transport
8-21
(5) Training on Drivers:
8.31 Driving skill and manner of YBS drivers are highly related to the customer’s satisfaction. As
mentioned YBS drivers are working under oppressive condition and it is difficult for them to care about
the safety, comfortable operation and service. Driver’s Training Centre was established by MOTC and
YRTA. The training centre issues type “E” driver’s licence, which is required to drive passenger buses.
However, there is no penalty for bus drivers who don’t have type-“E” driver’s license. Individual
operators and some minor bus operators assign bus drivers without sufficient training and education.
(6) Operation Management System
8.32 Current operation system of YBS applies Dispatching Operation (Departure time of each bus
is specified by the Dispatcher). Bus operators assign the staffs at origin, destination and major bus
stops and arrival / departure time of each bus trip are recorded. This system was applied in the tram
and buses of mega cities in pre-war Japan. But after World War II, it was changed into diagram
operation (which is applied in the train), to achieve the efficient fuel consumption and efficient service
providing.
8.33 To achieve high frequency of service in morning peak hour and ensure sufficient headway at
evening peak hour, the interval at origin and destination should be efficiently adjusted. In Yangon,
introduction of diagram operation is highly necessary.
(7) Financial Condition
8.34 It is reported that financial status of YBS operators are not good. Two Yangon public companies,
the Yangon Bus Public Company (YBPC) and Yangon Urban Public Transportation Public Company
(YUPT), have recorded losses totaling MMK 4 billion in the past three years. The companies had
purchased a total of 1,000 new buses, 500 each, to operate under YBS. So far though, YBPC and
YUPT have yet to break even on the capital expenditure taken for the new YBS buses. To achieve
financial benefit, YBS operators has claimed the approval from YRTA to increase the bus fare (MMK
200 per trip, fixed fare) or introduce distance-based fare system.
8.35 After the restructuring into YBS, Bus operators have payed MMK 4,000 per day per operating
bus fleet to YRTA as the management fee. However, development of necessary infrastructure for bus
operators has not been implemented yet and bus operators are dissatisfied.
8-21

Comprehensive Study of the Urban Transport Development Program in Greater Yangon (YUTRA Update) Final Report | Chapter 8: Bus Public Transport
8-22
8.4 YBS Improvement Directions
1) Further Actions to Improve Yangon Bus Service
8.36 The Yangon Bus Service has recently been launched, and there are still many issues and
problems which need to be addressed before Yangon can have a safe and reliable public bus system
that meets the travel needs of bus users.
8.37 The Study Team has identified additional actions that can be undertaken by the YRTA to further
improve the services of public buses in Yangon. These actions build on current ones which the YRTA
has undertaken. The following table summarizes all of the further actions that are required. In the next
section, the Study Team gives a proposal on how bus companies can be further improved and
modernized institutionally.
Table 8.4.1 Current and Proposed Actions for the Yangon Bus Service
Area Current Action by the YRTA Proposed Action
1 Bus Operators Reorganization
Consolidation of the many bus vehicle owners into 8 companies/groups.
Only 2 of the 8 companies have a modern organizational structure (Yangon Bus Public Co., Ltd. and Bandoola Transportation Co., Ltd.) in which the company owns all of the bus vehicles.
For the other 6 companies (5 association companies) and the Omni Focus Co., Ltd., bus ownership is still split between the actual company and individual owners.
2 Bus Fleet Removal of old buses. Acquisition of new buses (in March
2017).
Required fleet size is still large. Need for a system for the sustainable renewal of
vehicles. Establishment of a maintenance system.
3 Bus Operation Improvement
Consolidation to 80 bus routes. Introduction of loop routes in the
CBD and restriction of buses that run through the CBD.
Continuous monitoring of the supply and demand gap. Need for further regulated bus operations. Consideration for area/feeder services.
4 Bus Facilities Improvement
Ongoing tender for bus stop improvements.
Need for technical design guideline for bus stop and access facilities.
Improvement of bus depots and turn-around facilities.
5 Bus Corridor Traffic Management
Traffic control from the traffic control center for bus corridors/intersections.
Micro traffic management at bus stops and specific areas.
Consideration for bus priority measures.
6 Business Management Improvement
Change in payroll system for driver/conductor to a salary-based system (not fully practiced).
Strengthening of operation/management of buses including cost/revenue control.
Strengthening of capacities of bus personnel.
7 Bus User Services Bus route information “Yangon Bus Report“
Expansion of the dialogue with bus users.
8 YRTA Bus Sector Management
Centralization of bus sector management under YRTA.
Institutionalization of role-sharing between YRTA and bus companies/operators.
Technical support for bus companies/operators Bus fare and subsidy policy Preparation of bus operation rules and regulation and its
enforcement
Source: Study Team
8-22

Comprehensive Study of the Urban Transport Development Program in Greater Yangon (YUTRA Update) Final Report | Chapter 8: Public (Bus) Transport
8-23
2) Stages for Modernization
8.38 In the reorganization of the bus network into the Yangon Bus Service in January 2017, eight
companies were established. However, only one of these companies, the Yangon Bus Public Co. Ltd.,
was structured as a public-private partnership. Two of the companies are private bus companies which
operated in the previous system and the remaining five are more like loose associations of small bus
owners. The situation with regard to the structure and organization of the bus operating companies is
still fluid. In this section, the Study Team explains how the bus operating companies could be
modernized in general.
8.39 The bus modernization program can be seen to take place in several stages. The first stage is
to group the 80 or more bus routes into five to eight clusters or transport corridors so that the routes
within each group are synergistic with each other. More importantly, each cluster should have a similar
market size (i.e., the potential demand should approximately be the same). In their assigned markets,
the bus company should be granted a monopoly or exclusivity because they will have sufficient
competition from other modes, primarily from increasing car ownership.
8.40 Establishment of the consortiums is the second stage. They must be registered as public
limited-liability companies. Identifying the lead investor(s) who will initiate the incorporation of these
seven companies is part of this step. The YRTA can designate or ask for proposals from existing bus
operators for their willingness and readiness to take the lead. The first choice should be the biggest
operator already operating in each of the eight corridors. Priority can also be given to the company
willing and able to put in the largest equity, and thus require the least equity contribution from the
government.
8.41 The third stage is for the lead investor to amalgamate other operators in his corridor of
responsibility. This can be done by way of asset-for-stock swaps; in exchange for shareholdings in
the new company, operators transfer their old buses into the company and forms part of its bus fleet.
Valuation and acceptability of bus vehicles will pose a challenge. If no deal is agreed upon, the new
company can either (i) order the old company to cease from operating in the route or (ii) enter into a
leasing agreement so that the old operator can continue to render service under the supervision of
the new company until such time that new vehicles are deployed by the latter to replace the former.
(1) Guidelines for the 1st Stage
8.42 As part of the launch of the Yangon Bus Service, bus routes were restructured and reduced
from around 300 to around 80. However, because the new bus network was launched all at once
literally overnight, the responsibilities for the bus routes and which company operates them are still
not optimal. In fact, the Study Team has observed that the number of operated bus routes changes
each month. The YRTA should consider how to allocate bus routes and clusters to each of the eight
operating companies in an efficient and logical manner. Therefore, the following are general guidelines
on how the bus routes in Yangon could be allocated to bus operating companies in a logical way.
8.43 Starting with the current set of around 80 bus routes, the YRTA can group them into five (5)
service areas as shown in Figure 8.4.1. Tentatively, these route clusters can be named (and colored)
as follows:
(i) Hlaing Tharya Cluster (red) covers the western zone of the city;
(ii) Insein Cluster (blue) covers the northern zone of the city;
(iii) Mandalay Cluster (green) covers the northeastern zone;
(iv) East Dagon Cluster (violet) covers the eastern zone; and
(v) Thanlyin Cluster (gray) covers the southern districts of the city.
8-23

Comprehensive Study of the Urban Transport Development Program in Greater Yangon (YUTRA Update) Final Report | Chapter 8: Bus Public Transport
8-24
Source: Study Team
Figure 8.4.1 Logical Clustering of Routes
8.44 The five service corridors as proposed should also be flexible. For example, the Hlaing Tharya
Cluster can be merged with the East Dagon Cluster to form an east–west crosstown corridor. Another
bus company could be assigned an inner town service area which roughly corresponds to the current
CBD Loop. This CBD Loop has three routes (Routes 56, 57, and 58) at the moment and could actually
be expanded to cover more than 5 km2 in area, and obviate the need for the other five cluster routes
to go inside the CBD. In the long term, the Yangon Circular Railway can perform the role for the larger
circumferential bus corridor.
8.45 Once the 80 or so bus routes get clustered into five groups, the newly formed bus companies
can be assigned their set of routes based on their dominant areas of operation. As this happens, the
current set of routes needs to be modified primarily to reduce overlaps and shorten route distances.
The average length of the current bus routes is 30 km while the longest is at 67 km. It is difficult for a
bus operator to maintain headways for longer routes.
8.46 The current proposed grouping has five classifications (northern, southern, eastern, feeder, and
CBD Loop). Many of the existing routes overlap and encroach on one other’s territory thus
8-24

Comprehensive Study of the Urban Transport Development Program in Greater Yangon (YUTRA Update) Final Report | Chapter 8: Public (Bus) Transport
8-25
exacerbating competition on the street and causing road accidents. For example, the Northern District
bus lines extend all the way to the south, while the Eastern District bus lines are all over the city from
north to south.
8.47 A major change (from the old to the new clusters) is the inclusion of feeder routes in the area
of responsibility of the bus company. These feeder routes should be served with minibuses, rather
than standard or big buses.
8.48 A separate meeting with each group can be undertaken to identify the lead company among
them. Alternatively, the YRTA can issue the guidelines for re-grouping and give the bus operators a
time to select the groups they wish to join and agree as to who will be their leader. The lead company
will be tasked to consolidate or merge the other operators into one public company, as well as be
responsible for supervising the operations of existing paratransit in their area.
8.49 As can be seen in the preceding figure, there will be some zones of overlap among the eight
bus companies, which is actually fine as these overlaps create opportunities for interline transfers,
some degree of competition, and wider coverage.
(2) Guidelines for the 2nd Stage
8.50 During the launch of the Yangon Bus Service, eight bus operating companies were established
and the aim from the regional government was for the these companies to be established as public-
private partnerships. However, only the Yangon Bus Public Co. Ltd. can be considered a true public-
private partnership. The following are general guidelines from the Study Team on how the remaining
seven companies could be restructured to become true, modern public-private partnerships.
8.51 Legal Framework: The Myanmar Companies Act (formerly the Burma Companies Act) was
enacted in 1914 and has served as the legal foundation for incorporated businesses in Myanmar. A
revision of this law is now in process. Administered by the Directorate of Investment and Company
Administration (DICA), the Myanmar Companies Act provides the legal framework for things such as:
(i) Incorporation and registration of companies;
(ii) Company management;
(iii) Financial reporting and audit requirements;
(iv) Share allocation and raising of capital;
(v) Appointment of a board of directors;
(vi) General meetings and other procedures; and
(vii) Liquidating the company
8.52 On the other hand, foreign investments are governed by the Foreign Investment Law of 2012.
It is up for revision, with the draft now being deliberated at the Union Parliament (Pyidaungsu Hluttaw).
It will be administered by a new body to be called the Myanmar Investment Commission. DICA is
proposed to serve as the Secretariat of the Commission.
8.53 To overcome the lack of capital, it would be advisable to allow the entry of foreign investments
in a public limited-liability bus company. A safe assumption is that such foreign direct investment would
have to be under a joint-venture arrangement with a government agency, if the Yangon Bus Public
Co. Ltd. is any precedent.
8.54 Incentives to Encourage Formation of the Bus Companies: Understandably, there will be
reluctance from domestic investors to put money into the bus companies. It is simply not profitable,
due primarily to low fares imposed by the government. To overcome this reluctance, the following
incentives are proposed:
8-25

Comprehensive Study of the Urban Transport Development Program in Greater Yangon (YUTRA Update) Final Report | Chapter 8: Bus Public Transport
8-26
(i) Monopoly in their corridor of responsibility (i.e., no other operator will be allowed to provide bus
services in the company’s set of routes/area of operation except in some roads where segments
of their routes converge);
(ii) Tax-free importation (i.e., zero import tariff) of bus vehicles conforming to the new standards
imposed by the YRTA;
(iii) Right to establish a gas fuelling station for its own use and for third parties;
(iv) Delegation of powers of the former Bus Supervisory Committee and Bus Line Committee to the
new company in so far as existing operators that are to be consolidated into the new company
are concerned including paratransit operators in their exclusive zone;
(v) Validity of 10 years or more for license or franchise to operate;
(vi) Exemption from paying corporate income taxes for a period of five years from start of earning
revenues using the new buses;
(vii) Freedom to modify and restructure its set of routes, including the corresponding level of service
in terms of frequency and schedule, subject only to compliance with minimum service
obligations;
(viii) Freedom to offer various types of services, such as premium or air-conditioned, regular or non-
air-conditioned, express, shuttle, feeder, and trunk routes;
(ix) Government subsidy commensurate to the interest cost of loans—whether foreign or
domestic—incurred in the procurement of new buses (equivalent to interest-free loan), or equity
infusion into the company of up to 40% of total, as in the case of the Yangon Bus Public Co.
Ltd., and/or land grant for use as bus depot;
(x) The 1,000 new buses to be procured in 2017 can be allocated to all of the bus companies either
as equity contribution of the government in the shareholdings (which is simple and transparent)
or on a long-term lease (which is more complicated);
(xi) Foreign exchange cover to be absorbed by the government to shield the company from
devaluations on their foreign loans, if any;
(xii) Freedom to engage in other business-related activities, such as advertising inside or outside
buses; and
(xiii) Equal treatment of all the bus companies such that any preferential treatment given to one
automatically applies to the other companies to ensure a level playing field.
8.55 Possible Role of Foreign Investments in the Bus Companies: Due to the scarcity of
domestic capital, the above incentives may not be sufficient to entice Myanmar citizens to invest in
the new bus companies. Foreign investments may be an additional source, aside from government
equity and/or incentives. Foreign direct investments can be attracted in the following manner:
(a) One Brand, One Company: Invite one bus manufacturer from each country (such as China,
Japan, South Korea, Sweden, Germany) to supply on a sole source basis the vehicle
requirements of one company and provide technical assistance to that company. This will also
address the skills shortage and need for capacity building in bus operations and maintenance.
Thus, each bus company will have a technology partner who can also provide financing by way
of equity and export credit (10-year repayment period to be more attractive to foreign suppliers
who want to enter the Myanmar truck/bus market).
(b) Foreign Exchange Cover: The loan or credit, if not on total investments, can be shielded from
fluctuations in foreign exchange. This will require approval from the Ministry of Finance.
8-26

Comprehensive Study of the Urban Transport Development Program in Greater Yangon (YUTRA Update) Final Report | Chapter 8: Public (Bus) Transport
8-27
(c) 100% Foreign Ownership of the Bus Company: In relation to the one-brand, one-company
scheme, the bus supplier/manufacturer can set up shop in Myanmar to import the buses and
offer the units to bus company on a lease-to-own basis, as well as set up shop to provide
maintenance and manufacture/fabrication of bus bodies. This will have the added benefit of
encouraging greater local content in the manufacture of buses in Myanmar.
3) Internal Workings of the Bus Company
(1) Model Organization
8.56 Among the eight bus companies that were established when the Yangon Bus Service was
launched, the Study Team observed that only two have a modern organizational structure: the public-
private partnership Yangon Bus Public Co. Ltd. and the privately owned Bandoola Transportation Co.,
Ltd. Therefore, for the other six companies, modernization of operations is still necessary. In the
following section, the Study Team proposes how these six companies can be modernized in general.
8.57 A model bus company with adequate capital is usually organized to cover four main
departments or functions by itself:
(a) Operations: Its business objective is to maximize revenues (passengers per bus unit) via the
productive use of bus assets (revenue-km run per bus per day). The department (comprising
about 60% of total company workforce) will have the following divisions:
Scheduling, Dispatching and Inspection – proper scheduling of buses and drivers, as well
as field inspectors;
Operations Training – recruitment and continuous training, skills upgrading of drivers;
and
Field Operation – supervises the drivers and conductors.
(b) Shop and Maintenance: Its business objective is to minimize non-operational buses and
increase bus availability at the least cost to the company. This department (comprising about
25% of the total company workforce) will have the following divisions:
Preventive Maintenance – to handle such tasks as oil change, greasing, adjustment of
brakes/clutch;
Electrical-Mechanical General Repair;
Major Repairs and Body Works – such as overhauling, fuel pump calibration, painting
and metal fabrication;
Works Planning and Control – to handle the scheduling of maintenance activities; and
Maintenance Supply and Storage – to handle the procurement and inventory of spare
parts.
(c) Administration and Finance: A support department with the following four divisions:
(i) Administration – to handle human resources, property and security of assets, as well as general
services;
Legal – to handle claims arising from accidents, customer complaints, and regulatory
compliance reporting to government, and other legal requirements;
Finance – to handle comptrollership, accounting, funds management, payroll, ticket
distribution and control, revenue verification, and internal audit; and
Planning, Marketing and Public Relations – its business objective is to perform bus route
8-27

Comprehensive Study of the Urban Transport Development Program in Greater Yangon (YUTRA Update) Final Report | Chapter 8: Bus Public Transport
8-28
and service planning, monitor bus supply and demand in every route, formulates public
information and marketing programs, and maximize non-fare revenue generation.
Source: Study Team
Figure 8.4.2 Typical Organizational Structure of a Bus Enterprise
8.58 In recent times, companies outsourced (i.e., contracted to another entity) some of the above
functions rather than gear up to deliver them internally. The most popular outsourced service is e-
ticketing wherein the prepaid tickets, software, and the devices needed to make them work are
provided by a third party.
8.59 A variant of the above organization is to outsource the entire repairs and maintenance, except
for routine or preventive maintenance works. This scheme will be appropriate under the following
conditions:
(i) A bus leasing program is established, whereby the bus supplier (which is 100% foreign-owned)
sets up shop to sell or lease the units to a bus company;
(ii) The procuring bus company has no capability to perform the required maintenance because of
the absence or lack of trained mechanics and technicians; and/or
(iii) The vehicle supplier intends to gain a foothold in the Myanmar automotive market and sell his
products and support services to other bus companies and third parties.
(2) Size of the Bus Company
8.60 The initial estimate for the whole Yangon Region is for a fleet size of 2,500 standard buses.
This excludes minibuses and paratransit modes that can be seen though officially not recognized in
Yangon. A gradual replacement can be planned over a period of five years beginning with the oldest
units and non-compliant to the new technical standards. Assuming an initial fleet of 500 buses, the
indicative number of employees is shown on Table 8.4.2.
Table 8.4.2 Manpower for a 500-Bus Fleets
Department Job Class/Type Headcount
Operations Drivers 750
Conductors 750
Accountants Cashiers Buyers Clerks
Operations Department
Maintenance Department
Finance & Administration
Board of Directors
Drivers Conductors Controllers Schedulers
Mechanics Painters Welders Electricians Other technicians
General Manager
8-28

Comprehensive Study of the Urban Transport Development Program in Greater Yangon (YUTRA Update) Final Report | Chapter 8: Public (Bus) Transport
8-29
Controllers/Schedulers 100
Maintenance Preventive Maintenance 250
Electro-Mechanical 25
Major Repairs & Body Works 100
Works Planning & Control 50
Materials Inventory 25
Finance and Administration 150
Planning, etc. 70
Total 2,270
Manpower to Vehicle Ratio 4.54
Source: Study Team
8.61 The above numbers are not to be taken as mandatory. Each company may choose to
emphasize one function over the other, in which case one department would tend to be larger than
the norm. The growth rate of the fleet may also differ, such that one company may grow to 500 buses
sooner than the others, while another company may take longer. Because the vehicles are new at
year 1 and would still enjoy the warranty from manufacturers, the maintenance organization can start
small in size with the manning of the major repairs division deferred to later years. Extensive ICT use
can also reduce the headcount across various departments especially on indirect personnel. The
global ratio (< 5.0 employees to vehicle ratio) should be maintained to reduce overhead cost.
8.62 In terms of capitalization, a company with a fleet of 500 new buses, each costing approximately
USD120,000, should have a balance sheet of at least USD70 million to include depot and other cost
items. At a 70:30 debt-to-equity ratio, that implies USD21 million (MMK29.4 billion at 1,400/$) equity.
If the government participates at up to 49% of the equity, the private sector would have to contribute
the balance of about MMK15 billion. There is a large amount of risk which investors may not take
without some reform in the fare policy.
4) Management Systems for New Bus Companies
(1) Starting Point
8.63 A brief assessment of the existing bus operators revealed weaknesses in their management
systems. It is therefore difficult to build on these current practices. It is less cumbersome to start with
new systems and organizations in each of the bus companies.
8.64 Three bus companies6 (Yangon Bus Public Co. Ltd., SRT 1, and Omni Focus) have started to
update their systems. The BRT Lite routes operated by the Yangon Bus Public Co., Ltd. and the bus
route operated by SRT 1 are equipped with smart card payment systems (incompatible with each
other) and GPS and CCTV; however, their information systems are still rudimentary. Vehicle
maintenance is currently limited to routine and preventive maintenance procedures supported by
mechanics from suppliers. The Bandoola Transportation Co., Ltd. has a more organized operations
and maintenance departments; it also operates tourist buses, taxis, and city buses.
(2) Operational or Interdepartmental Relationships
6 This was the situation before the bus network restructuring and the launch of the Yangon Bus Service in January 2017. SRT 1 was a Ministry of Transport and Communications backed bus operating company that only operated one bus route for the purposes of showing what a modernized bus route in Yangon could look like. However, before the launch of the Yangon Bus Service, the financial situation of the SRT 1 deteriorated and the company stopped operations before the Yangon Bus Service was launched.
8-29

Comprehensive Study of the Urban Transport Development Program in Greater Yangon (YUTRA Update) Final Report | Chapter 8: Bus Public Transport
8-30
8.65 The grouping of employees into departments is meant for efficiency. However, it sometimes
leads to a silo mentality that downplays the importance of interdepartmental relationships, as
illustrated in Figure 8.4.3 and Figure 8.4.4.
Source: Study Team
Figure 8.4.3 Management Reports and Departmental Interactions
8.66 Based on the market situation (load profile along the route and during the day) on every route,
the Operations Department assigns a specific number of buses. For this number of buses, a “Basic
Schedule of Dispatches” and its faithful implementation highly depends on the availability of buses
that Maintenance could provide. The dispatching of extra trips, when warranted, is also dependent on
operational buses that Maintenance can release. The Basic Schedule of Dispatches is simply a time
schedule of trip departures from a station or terminal for each particular bus.
8.67 Permanent crews (driver + conductor) are assigned per bus, and in general, they are
permanently assigned specific trip schedules daily. A head dispatcher is responsible for the generation
of trip schedules, as well as the designation or approval of rest days. In cases where a crew fails to
report for his scheduled trip, the head dispatcher most often takes charge of assigning a relief crew
who is normally on standby at the depot waiting for such opportunities. A similar procedure is followed
when a regular member of the crew unexpectedly takes a leave of absence. Rest days are
programmed on a fixed day basis, but sometimes are not followed because a crew still in transit or no
relief is available. It is a good labor practice, if not a legal requirement, to give each employee one rest
day per week. And if that employee is required to render service on his rest day, he is entitled to a
premium pay akin to working on a holiday.
8.68 Statistics are derived from a conductor’s trip and collection reports, which should include
kilometers run per bus per route, revenue per bus per route. Flash reports of revenue collections and
kilometers run are prepared daily, and statistics vary as the number of bus runs fluctuates daily.
8.69 The preventive maintenance checkup of a bus follows the manufacturer’s recommendation,
usually every 5,000 km for oil change and checkup of components as per the manufacturer’s checklist.
The Maintenance Department advises Operations when a particular bus is due for checkup or oil
change, depending on its cumulative kilometers run. Sometimes, Maintenance just embargo the
vehicle when it is due for maintenance. Like rest days for crews, compliance with the bus service
schedule is dependent on the availability of reserve buses. Tension between Maintenance and
Operation could occasionally erupt when more buses are needed on the route but available units are
short. In such a case, a policy ought to be adopted on when one prevails over the other.
8.70 There are now available computerized bus management systems that integrate the systems of
FINANCIAL REPORTS
OPERATIONS
REPAIRS & MAINTENANCE
SCHEDULES
REVENUES
COSTS
OPERATIONS REPORTS
8-30

Comprehensive Study of the Urban Transport Development Program in Greater Yangon (YUTRA Update) Final Report | Chapter 8: Public (Bus) Transport
8-31
bus and crew assignments vis-à-vis the schedule of both preventive maintenance and route
dispatches. The materials planning, procurement, and control system is also integrated into such a
system, together with accounting and finance.
Source: Study Team
Figure 8.4.4 Operational Relationships in a Bus Company
Maintenance & R
epairs
Service Schedule
Route Supervision
Bus Breakdown
Bus & Crew
Dispatches
Information about the m
arket
BOARD OF DIRECTORS
GENERAL
MANAGEMENT
MAINTENANCE ENGINEERING
OPERATION, DEPOT & TRAFFIC
SUPERVISION
EXECUTIVE COMMITTEE
Bus Route Requirement
Bus Availability
Bus Breakdown
BUSES CREWS
PASSENGERS
FINANCE & ADMINISTRATION
PLANNING
BUS DEPOT
8-31

Comprehensive Study of the Urban Transport Development Program in Greater Yangon (YUTRA Update) Final Report | Chapter 8: Bus Public Transport
8-32
(3) Key Performance Indicators
8.71 Key performance indicators (KPIs) refer to a set of performance measures to assess internal
management, support decision making within the organization, and provide comparative information
for the YRTA, and to identify best practices. It enables a bus company to benchmark its performance
against that of other operators in Yangon, as well as in other cities in the world.
8.72 Benchmarking is defined as a systematic process of continuously measuring, comparing, and
understanding an organization’s performance and change:
(i) In the performance of a diversity of key business processes;
(ii) Against comparable peers anywhere else in the world; and
(iii) To gain information which will help participating organizations to improve their performance.
8.73 Table 8.4.3 provides a comprehensive list of KPIs in six areas that an international group
(International Bus Benchmarking Group) has adopted. The last column shows the initial set of KPIs
that the six Yangon bus companies ought to adopt and for the YRTA to impose as minimum KPIs.
Table 8.4.3 Key Performance Indicators for Bus Transit
Success Dimension Performance Measure KPI for YBS
G Growth & Learning
G1 Passenger boardings G2 Vehicle kilometers G3 Staff training (categories)
C Customer
C1 Passenger-km/revenue capacity km C2 Actual/Scheduled revenue-km & hour C3 Dynamic customer information C4 Low floor buses (see Note a) C5 % Buses on time C6 Regularity (Excess waiting time) C7 Customer satisfaction
P Internal Processes
P1 % of Fleet used in peak (see Note b) P2 Revenue/total vehicle-kilometer P3 Total vehicle hours per labor hour P4 Staff absenteeism rate P5 Mean distance between failures (see Note c) P6 Lost vehicle kilometer
S Safety & Security
S1 Number of vehicle accidents per vehicle-km S2 Number of staff accidents/million staff hours S3 Number of passenger accidents/boarding S4 Number of 3rd party accidents S5 Incidences of on-board crime
F Financial
F1 Total cost per total vehicle-kilometer F2 Total operating cost per total vehicle-km F3 Service operation cost/total vehicle-km F4 Maintenance cost/total vehicle-km F5 Administration cost/total vehicle-km F6 Service operating cost/revenue vehicle-km F7 Total fare revenue/total operating cost F8 Total operating cost/passenger boarding F9 Fare revenue/passenger boarding
E Environmental
E1 Diesel/CNG fuel consumption/100 veh-km E2 Diesel/CNG fuel consumption/passenger-km E3 Fuel consumption/total vehicle ton-km E4 % of fleet meeting Euro 4 standards E5 CO2 emissions per vehicle-km & pax-km
Source: International Bus Benchmarking Group
8-32

Comprehensive Study of the Urban Transport Development Program in Greater Yangon (YUTRA Update) Final Report | Chapter 8: Public (Bus) Transport
8-33
(4) Commercially Available Software
8.74 The new bus companies will be better off in the long run if they start their operations with more
intensive use of available software in the market. In that way, newly hired employees will be trained
to work with these systems in place rather than undergo subsequent re-training and change in their
working habits. Usually, these ready-made software address one or all of the following aspects: fleet
management, electronic fare payment, and traveler information.
8.75 Without endorsing any one product or company, or being exhaustive, some of the top-rated
transit management systems are the following:
(a) Optibus on Schedule empowers schedulers to prepare vehicles and drivers schedule using a
proprietary Interactive Schedule Optimization (ISO) methodology that can evaluate all the
possible scenarios in real time. The scheduler changes preferences and parameters, compares
multiple scenarios, and investigates the impact of what-if scenarios. This unique process leads
to the most optimal schedule that meets the operator’s business objectives;
(b) Pantonium is a web-based application software designed to optimize routes in real time so a
company can reduce the number of vehicles needed per trip and make each trip as efficient
and profitable as possible;
(c) Telenav is a GPS-based tracking service that locates vehicles and receive informative reports
regarding driving habits and fuel consumption;
(d) Route Coordinator is a routing and scheduling software that is designed for small and medium-
sized transportation organizations; including GPS tracking with AccuTrack, and generate data
inputs to maintenance;
(e) Locomate offers vehicle tracking, scheduling, route management, dispatch, bus terminal, depot
management, inventory and maintenance systems;
(f) Fleet Maintenance Pro is maintenance tracking software for quick and easy tracking and
organizing preventive and repair maintenance of the bus fleet, with automated and color-coded
alerts when a certain vehicle or piece of equipment is due for service. Any unexpected
maintenance performed on a vehicle will be also be recorded and saved; and
(g) SureFleet is a fleet maintenance software designed to track and report on preventive fleet
maintenance, repair costs, fuel purchases and more; customized maintenance alerts and
tracking by days, miles, engine hours, and fuel. It also provides the ability to customize trip
inspections, manage fleets and sub-fleets, manage driver qualifications, track fuel, create work
orders, receive email alerts, and run reports
(5) Investing in Capacity Development
8.76 Without a commensurate investment in human capital, the investment in new buses and new
systems will be for naught. Trained human resources are critical to the long-term sustainability of the
bus transport system in Yangon.
8.77 It is therefore strongly recommended that the YRTA tap as much external assistance as
possible in implementing the proposed reforms in the public sector as well as reforms in the bus
operators side.
8.78 Such a technical assistance package should have the following objectives:
(i) To assist the YRTA implement Phase 1 of the Bus Modernization Project, particularly the
formation of the bus companies and the acquisition of 2,500 new buses;
8-33

Comprehensive Study of the Urban Transport Development Program in Greater Yangon (YUTRA Update) Final Report | Chapter 8: Bus Public Transport
8-34
(ii) To assist in the development of institutional capabilities within the YRTA for planning, monitoring,
and regulation of the bus transport sector; and
(iii) To assist in the establishment and development of professionally managed bus companies,
capable of efficient fleet operation of buses after amalgamation of existing transport operators
into five to eight bus companies.
8.79 The technical assistance will include assistance for the following main tasks that constitute the
major components of the planned Bus Modernization Project:
(a) Advisory and institutional development mainly to the public sector (YRTA):
Route planning, design, and implementation
Consolidation of operators into five public bus companies
Revision of the system of franchising and licensing of bus operators
Design of new policies on fares and subsidies
(b) Technical and managerial assistance mainly to the bus companies (5–8 entities)
Assist each of the bus companies in organizing an expanded fleet and delivery of
adequate services on its routes, and
Assist them in evolving into autonomous fleet operators, including provision of training
and advice in operation, maintenance, and financial aspects of transit management.
8-34

Comprehensive Study of the Urban Transport Development Program in Greater Yangon (YUTRA Update) Final Report | Chapter 8: Public (Bus) Transport
8-35
8.5 Bus Pilot Project
1) Objective and Scope of Pilot Project
8.80 While the YBS has been undergoing reform and improvement since the beginning of 2017, this
study intends to facilitate its further improvement by conducting the following actions on a pilot basis
(see Table 8.5.1):
(i) Comprehensive YBS transport survey;
(ii) Bus operation and management information concept formulation;
(iii) Micro traffic management planning; and
(iv) Trainings and workshops.
Table 8.5.1 Outline of the Bus Pilot Project
Action Objective Scope
1. Comprehensive YBS Transport Survey
To preliminary analyze current bus operation characteristics and satisfaction/ needs of bus users
To collect bus operation and passenger ridership data necessary for Bus Management Information System
All 81 bus routes On-board survey on operation/ ridership
data Bus passenger interview survey at
selected bus stops
2. Bus Operation and Management Information Concept Planning
To prepare concept plan for bus operation and management information system though ICT
Data collection through ICT (IC-card, GPS, Wi-fi ) from selected routes
3. Micro Traffic Management Planning
To prepare traffic circulation and management plans for smooth bus operation and boarding / alighting
Preparation of plans for selected bus terminals
4. Training and Workshops To share the outputs of 1,2,3 above with bus operators
Toe learn experiences of foreign bus operators
To conduct workshops and training for bus operators using guidelines and teaching materials.
Source: Study Team
8.81 The collected data from the Comprehensive YBS Transport Survey can be further analyzed
and shown in visual signage to better understand bus operational characteristics, as shown in Figure
8.5.1.
8.82 While the survey was completed in April / May and data has been analyzed, other useful data
and information were collected based on which bus operation and management information system
could be worked out. The data collected is included in Technical Report No. 2. Main data collected in
the survey include the following:
(a) On-board Survey: Survey items are: (i) bus type and number of the seats; (ii) bus arrival /
departure time at each bus stop; (iii) number of boarding / alighting passengers at each bus
stop; (iv) assessment of LOS (e.g., on-board congestion, on-board comfort, and driving
manner); and (v) happenings during the survey such as traffic accidents, illegal activities.
(b) Bus Passenger Interview Survey: Survey items are: socio-economic profile; (ii) trip
information (OD, purpose, access); (iii) frequency of bus use; (iv) comparison between YBS
and the previous bus service.
8-35

Comprehensive Study of the Urban Transport Development Program in Greater Yangon (YUTRA Update) Final Report | Chapter 8: Bus Public Transport
8-36
Source: Study Team
Figure 8.5.1 Bus Operating Characteristics on Route No. 6 (Example)
8-36

Comprehensive Study of the Urban Transport Development Program in Greater Yangon (YUTRA Update) Final Report | Chapter 8: Public (Bus) Transport
8-37
2) Formulation of Bus Operation and Management Information System
8.83 Because it is important that the YBS is operated and managed based on updated and objective
data, key performance indicators must include among others the following:
(a) Operating Performance Indicators: Passenger volume, fleet utilization, distance travelled by
buses, breakdown in services, fuel consumption, staff ratios (no. of staff/ bus), accident rate,
dead mileage (km run without revenue), and cost of bus operation.
(b) Quality of Service Indicators: Waiting time, walking distance to bus stops, transfer between
routes and services, journey times, and travel expenditure.
8.84 These data were first collected manually through an on-board survey for all routes. During the
pilot project, the same data were collected through ICT, as shown in Figure 8.5.2.
8.85 Bus Route 37 and 7 were selected and ICT devices were installed to collect relevant data. For
Bus Route 37, GPS, CCTV, IC card, tablet and wi-fi were provided, while for Bus Route 7, tablet and
wi-fi are provided. Once it was found that necessary data could be collected through the appropriate
set of ICT devices, the data were stored as big-data under the YRTA to be controlled and analyzed
based on appropriate applications for the benefit of bus stakeholders including bus operators/
companies, bus users, and the YRTA itself.
3) Micro Traffic Management Planning
8.86 This pilot project component intended: (i) to facilitate smooth operation of bus boarding/
alighting in selected problem areas, (ii) to ensure the safety of pedestrians in critical areas, and (iii) to
promote improved overall circulation of road traffic at critical bus stops. Two areas were selected for
preliminary study, i.e., Tha Khin Mya Park and Sule Pagoda area.
8.87 Site survey and preliminary planning work had been conducted. Figure 8.5.4 shows a tentative
output for Tha Kyin Mya Park Terminal.
4) Workshop/ Training
8.88 In the pilot project, a series of workshops were conducted to (i) generate an understanding of
the importance and benefits of role-sharing among bus operators, bus users, and the YRTA to
promote improved YBS services, and (ii) conduct practical training in and knowledge sharing on
database operation and management.
8.89 Workshop topics included the concept of YBS-MIS and training of bus personnel in safety. A
total 2 workshops were organized for YRTA members and staffs from bus operators, and many
stakeholders attended. Figure 8.5.5 shows the results of workshops.
8-37

Comprehensive Study of the Urban Transport Development Program in Greater Yangon (YUTRA Update) Final Report | Chapter 8: Bus Public Transport
8-38
Source: Study Team
Figure 8.5.2 Data Collection through ICT Devices
Source: Study Team
Figure 8.5.3 Role Sharing among Bus Operators, Bus Users, and YRTA in
Bus Operation and Information Management System
8-38

Comprehensive Study of the Urban Transport Development Program in Greater Yangon (YUTRA Update) Final Report | Chapter 8: Public (Bus) Transport
8-39
Current Situation
Proposed Option Source: Study Team
Figure 8.5.4 Preliminary Improvement Plan for Tha Khin Mya Park Terminal Area
8-39

Comprehensive Study of the Urban Transport Development Program in Greater Yangon (YUTRA Update) Final Report | Chapter 8: Bus Public Transport
8-40
1st WORKSHOP on “Pilot Project on Bus Transport Modernization”
Venue: Meeting Room of IBIS Hotel, 369 Laydaungkan Road, Yangon, Myanmar
Date & Time: 20 June 2017 (Tue) 9:00-11:30 Participants: Total 38 participants
Members and Staffs of YRTA, JICA Study Team and Members of Bus Operators
Programs on Workshop: 1. Questionnaire for Bus Company: - Overall Existing operation system - Bus Maintenance and Bus Depot - Difficulties & future requirements
2. Delivering 1st presentation - Comprehensive YBS survey - Bus operation management information - Micro Traffic Management Planning - Training and Workshops
3. Delivering2nd presentation - On-Board survey - Bus user Interview - YBS Route Performance
4. Bus Map - Delivering to YBS bus map to attendees
2nd WORKSHOP on “Pilot Project on Bus Transport Modernization”
Venue: Meeting Room of IBIS Hotel, 369 Laydaungkan Road, Yangon, Myanmar
Date & Time: 24 August 2017 (Thu) 13:30-16:30 Participants: Total 72 participants
Members and Staffs of YRTA, JICA Study Team and Members of Bus Operators
Programs on Workshop: 1. Introduction of Yokohama City Bus Operation: - Outline of Yokohama City Bus - Bus Route Planning - Bus Operation Management - Human Resource Development
2. Introduction of Bus Driver manual - Introduction - Bus Driver Manual
3. Outline of Bus Management Information System - Concept & Overview of Pilot Project - Free Wifi Service for Bus Users - Bus Operation & Driving Management by Tablet PC - Crowd Level Estimation by Video Analysis - Travel Speed Calculation by Probe Processing
4. Micro Traffic Management - Preliminary Analysis on Tha Khin Mya Park - Preliminary Analysis on Sule Pagoda
Contents: Source: Study Team
Figure 8.5.5 Results of Workshop on Bus Pilot Project
8-40

Comprehensive Study of the Urban Transport Development Program in Greater Yangon (YUTRA Update) Final Report | Chapter 9: Traffic Management and Safety
9-1
9 TRAFFIC MANAGEMENT AND SAFETY
9.1 Main Issues
1) Traffic Congestion
9.1 Mobility of the people and their accessibility to services have been worsening day by day due
to traffic congestion, the causes of which vary and are complex because they are interrelated. Traffic
congestion does not only affect traffic safety and environment (air quality, noise pollution, living
conditions, and landscape), but socio-economic activities as well. The main causes of traffic
congestion include the following:
(i) Lack of traffic control at bottlenecks, such as schools and shopping centers, and presence of
roadside vendors;
(ii) Increasing number of private cars and improper maintenance of old vehicles;
(iii) Excessive, disorderly, and illegal roadside parking;
(iv) Poor pavement conditions and lack of traffic control measures;
(v) Bad driving manner;
(vi) Uncoordinated traffic signal cycle time and flow control at intersections both for vehicles and
pedestrians;
(vii) Picking up/ Dropping off of passengers by buses and taxis on-street affect the traffic flow;
(viii) Poor walking conditions and jaywalking;
(ix) Lack of large-truck traffic management;
(x) Lack of enforcement capacity; and
(xi) Others including slow response to traffic accidents, construction work, and related traffic
control, etc.
9.2 Because the causes of traffic congestion are many and interrelated, this makes it difficult to
plan for effective measures and to implement them effectively. For planning purposes, measures
can be grouped into four categories, as follows:
(i) Provision of adequate infrastructure and facilities for both vehicles and pedestrians;
(ii) Control and management of road vehicles and vehicular traffic;
(iii) Education and awareness enhancement of road users, i.e., drivers, passengers, and
pedestrians; and
(iv) Establishment of proper enforcement mechanism and capacity.
9-1

Comprehensive Study of the Urban Transport Development Program in Greater Yangon (YUTRA Update) Final Report | Chapter 9: Traffic Management and Safety
9-2
Congestion at Intersection Roadside Parking
Jaywalking due to lack of proper facilities for pedestrians Congestion under the flyover
Congestion at peak hours Damaged sidewalk
Source: Study Team.
Figure 9.1.1 Popular Locations and Causes of Traffic Congestion
Source: Travel speed analysis using road probe data, MLIT Project
Figure 9.1.2 Identification of Traffic Bottlenecks using Probe Data
9-2

Comprehensive Study of the Urban Transport Development Program in Greater Yangon (YUTRA Update) Final Report | Chapter 9: Traffic Management and Safety
9-3
2) Level of Services of Road Traffic
9.4 A popular indicator to assess road congestion is travel time on roads. Surveying travel speed
using free flow method (a car travels more or less according to the overall flow of traffic) was done to
compare the current situation with that during YUTRA time. For this, five road sections were
selected, as shown in Figure 9.1.3. Preliminary findings are shown in Table 9.1.1 and briefly
described below.
(i) Although in general, the traffic situation has worsened along the selected corridors, travel
conditions improved along Pyay Road where a flyover was constructed. The improvements
are also attributed to the signalization of major intersections;
(ii) Travel speed varied considerably not only by time and direction, but also by day. Nevertheless,
it was found that road traffic situation is tolerable in spite of the significant increase in the
number of road vehicles during the last several years; and
(iii) It was found that there were ample opportunities for traffic management could contribute to
the improvement of road traffic in Yangon
Figure 9.1.3 Selected Roads for Travel Speed Survey
Table 9.1.1 Comparison of Travel Speeds on Selected Roads, 2013 and 2017
Selected Road Length
(km) Time
Period Direction
Ave. Travel Speed (km) 2013 2017
1. Pyay Road (Lan Thit to Bogyoke Aung San Road) 15
Morning To CBD 15.3 15.4 Daytime To CBD 21.4 35.4 Evening From CBD 17.5 22.9
2. Kabara Aye Pagoda Road (Thu Dhamar to Bogyoke Aung San)
13 Morning To CBD 28.6 18.5 Daytime From CBD 19.8 16.1 Evening From CBD 15.7 11.6
3. Bayint Naung–Kyee Myin Daing Kannar (Hlaing River Road to Aung Yadanar Road)
14 Morning To CBD 22.5 28.8 Daytime From CBD 15.5 19.8 Evening From CBD 8.6 16.6
4. No. 2 Main Road (Anawarahta Road to Bogyoke Aung San) 13
Morning To CBD 25.8 24.1 Daytime From CBD 26.3 21.0 Evening From CBD 20.9 n/a
5. Parami Road (Bayint Naung to Thanthumar) 8
Morning East to West 20.9 11.9 Daytime East to West 19.5 18.1 Evening West to East 14.1 12.3
Sources: YUTRA Travel Speed Survey (2013), and Study Team
9-3

Comprehensive Study of the Urban Transport Development Program in Greater Yangon (YUTRA Update) Final Report | Chapter 9: Traffic Management and Safety
9-4
9.2 Proposed Solutions and Measures
1) Elimination of Bottlenecks on Main Corridors
(1) Pyay Road
9.5 Pyay Road is one of the most important north–south traffic corridors connecting Yangon
Airport and the CBD via the city centre. The road is relatively wide and can accommodate six lanes
or more with central median and sidewalk. The road has a total of 14 intersections including flyovers
at intersections with 8 Mile Road, Inya Road, and Minigone Road, and one non-signalized
intersection with Min Ye Kyaw Swar.
9.6 Traffic management problems are typically seen in the following locations:
(i) In front of Taw Win Centre;
(ii) In front of People’s Park;
(iii) In front of Myenigone/Maharmying bus stop;
(iv) In front of Grand Garden Insurance;
(v) In front of the University of Yangon;
(vi) In front of the International Business Center;
(vii) South of AD Intersection; and
(viii) In front of the 7 Mile bus stop.
9.7 The possible measures to improve the situation include: (i) repair of traffic markings on
pedestrian crossings, (ii) installation of push button pedestrian signal, (iii) installation of traffic signals
for vehicles, (iv) designation of no-parking areas and provision of traffic markings and signs, and (v)
provision of signs for pedestrian crossings.
9.8 For selected locations, the proposed measures are listed in Table 9.2.1. Those for four
locations, i.e., Taw Win Centre, People’s Park, Myenigone/Maharmying bus stop, and the
International Business Centre are shown in Figure 9.2.1.
Table 9.2.1 Proposed Traffic Management Measures for Problem Areas on Pyay Road
Problem Area
Proposed Traffic Management Measure
Installation of Pedestrian Crossing
Installation of Push-button
Signal for Pedestrians
No-parking Marking /
Signboard
Bus Priority Lane Marking
and Signboard
Guidance on Bus Stop Location
Enforcement of Traffic
Regulations
Others (Signal Management,
etc.)
1. Taw Win Centre 〇 〇 〇 △ - 〇 - 2. People’s Park △ 〇 〇 〇 △ 〇 - 3. Myenigone/
Maharmying Bus Stop
〇 〇 〇 △ △ 〇 -
4. Grand Guardian Insurance
〇 〇 〇 △ △ 〇 -
5. University of Yangon
〇 〇 〇 △ △ 〇 -
6. International Business Center
〇 〇 - - - △ 〇
7. AD Intersection South
- - - - - - 〇
8. 7 mile Inter-section Bus Stop
〇 〇 〇 △ △ 〇 -
Source: Study Team 1) 〇: Key Measure △: Secondary Measure
9-4

Comprehensive Study of the Urban Transport Development Program in Greater Yangon (YUTRA Update) Final Report | Chapter 9: Traffic Management and Safety
9-5
Taw Win Centre
People’s Park
Myenigone/ Maharmying Bus Stop
International Business Centre
Source: Study Team
Figure 9.2.1 Traffic Bottlenecks and Proposed Management Measures for Pyay Road
9-5

Comprehensive Study of the Urban Transport Development Program in Greater Yangon (YUTRA Update) Final Report | Chapter 9: Traffic Management and Safety
9-6
(2) Kabar Aye Pagoda Road
9.9 Kabar Aye Pagoda Road is also one of the most important north–south traffic corridors. The
road is relatively wide and can accommodate six lanes or more with sidewalk. The road has a total
of 16 intersections including flyovers at 8 Mile, Kokkaing, and Shwe Gone Daing roads. The main
bottlenecks on and proposed solutions for the corridor are shown below.
Corridor Main Problem Area Proposed Solution
1. Short-term Solutions (i) Adjust signal phasing (ii) Control traffic at commercial areas (iii) Control disorderly bus loading/unloading, especially at
commercial facilities (iv) Control roadside parking Improve traffic signs and lane markings Train traffic enforcers Micro-manage traffic at flyover intersections
2. Mid-term Solutions
(i) Construct underpasses / flyovers (ii) Strengthen traffic management
Source: Study Team.
Figure 9.2.2 Traffic Bottlenecks and Proposed Management Measures for Kabar Aye Pagoda Road
9-6

Comprehensive Study of the Urban Transport Development Program in Greater Yangon (YUTRA Update) Final Report | Chapter 9: Traffic Management and Safety
9-7
(3) Kannar Road–Bayint Naung Road
9.10 Kannar Road–Bayint Naung Road is a north–south traffic corridor along the waterfront area.
The road is relatively wide and can accommodate six lanes or more with sidewalk. Port facilities are
located along this road and a lot of freight vehicles can be seen on the corridor. On this corridor, the
inner ring road (IRR) is proposed to be developed. Enough road width is prepared and there is a
certain amount of room for further expansion. Roadside parking by freight vehicles can be seen on
many sections, thereby affecting traffic flow.
Corridor Main Problem Area Proposed Solution
1. Short-term Solutions Adjust signal phasing Control traffic especially freight vehicles Control traffic at disorderly bus
loading/unloading points Control roadside parking Improve traffic signs and lane markings Train traffic enforcers Micro-manage traffic at flyover
intersections
2. Mid-term Solutions Strengthen traffic management Readjust road space with development of
IRR Relocate port functions
Source: Study Team
Figure 9.2.3 Traffic Bottlenecks and Proposed Management Measures for Kannar Road–Bayint Naung
Road
9-7

Comprehensive Study of the Urban Transport Development Program in Greater Yangon (YUTRA Update) Final Report | Chapter 9: Traffic Management and Safety
9-8
(4) Yangon–Pathein Road
9.11 Yangon–Pathein Road is an east–west traffic corridor connecting the inner urban area and
Hlaingtharyar. The road is wide and can accommodate six lanes or more with sidewalk. In Yangon,
the number of east–west corridors is limited; hence traffic tend to concentrate on the existing
corridors and intersections with north–south corridors can be bottlenecks (see Figure 9.2.4).
Corridor Main Problem Area Proposed Solution
1. Short-term Solutions Adjust signal phasing Control traffic at commercial areas Control traffic at disorderly bus boarding/alighting points Control roadside parking Improve traffic signs and lane markings Train traffic enforcers
2. Mid-term Solutions Make Pyay Road a semi-access-controlled road Readjust road space with development of IRR Strengthen traffic management
Source: Study Team
Figure 9.2.4 Traffic Bottlenecks and Proposed Management Measures for Yangon–Pathein Road
9-8

Comprehensive Study of the Urban Transport Development Program in Greater Yangon (YUTRA Update) Final Report | Chapter 9: Traffic Management and Safety
9-9
(5) Wai Zayan Tar Road
9.12 This is the north–south traffic corridor in the eastern part. The road is relatively wide and can
accommodate six lanes or more with sidewalk. On this corridor, the inner ring road (IRR) is
proposed to be developed. Enough road width is prepared and there is some room for further
expansion. Additionally, bus operation on this corridor is restricted. Roadside parking by private
vehicles can be seen at many points, thereby affecting traffic flow. Some intersections become
bottlenecks.
Corridor Main Problem Area Proposed Solution
1. Short-term Solutions Adjust signal phasing Control traffic at schools/commercial areas Control traffic at disorderly bus boarding/alighting
points Control roadside parking Improve traffic signs and lane markings Train traffic enforcers Micro-manage traffic at flyover intersections
2. Mid-term Solutions Make Pyay Road as a semi-access- controlled road Construct underpasses/flyover Strengthen traffic management
Source: Study Team.
Figure 9.2.5 Traffic Bottlenecks and Proposed Management Measures for Wai Zayan Tar Road
9-9

Comprehensive Study of the Urban Transport Development Program in Greater Yangon (YUTRA Update) Final Report | Chapter 9: Traffic Management and Safety
9-10
(6) Upper Pazuntaung Road–Thanthumar Road–No. 2 Main Road
9.13 This corridor connects Yangon with Bago Region and is used for intercity traffic. Road width is
prepared and there is some room for further expansion. Roadside parking by private vehicles and
freight vehicles can be seen at many points, thereby affecting traffic flow. The main bottlenecks and
proposed solutions are shown below.
Corridor Main Problem Area Proposed Solution
1. Short-term Solutions Adjust signal phasing Control traffic at schools/commercial areas Control traffic at disorderly bus boarding/alighting
points Control roadside parking Improve traffic signs and lane markings Train traffic enforcers Micro-manage traffic at flyover intersections
2. Mid-term Solutions Construct underpasses/flyovers Provide off-street parking Strengthen traffic management
Source: Study Team.
Figure 9.2.6 Traffic Bottlenecks and Proposed Management Measures for Upper Pazuntaung Road–
Thanthumar Road–No. 2 Main Road
9-10

Comprehensive Study of the Urban Transport Development Program in Greater Yangon (YUTRA Update) Final Report | Chapter 9: Traffic Management and Safety
9-11
2) Intersection Improvement
9.14 In many cities, intersections often cause the most critical traffic congestion on the road
network. It is also the case in Yangon: Traffic volumes at intersections are lower than the theoretical
capacities, even as intersections are seriously congested, as shown in Figure 9.2.7.
Source: YUTRA Study (2013). 1) V/C: Volume Capacity Ratio 2) Since YUTRA Study, 5 flyovers had been constructed.
Figure 9.2.7 Estimated Volume–Capacity Ratio of Major Intersections in Yangon
9.15 Underutilized road capacities are also seen in many road links due to lack of traffic control and
management as identified in previous section. Improving intersections include the following:
(a) Optimization of Traffic Signal Phasing: An example made in YUTRA based on micro traffic
simulation model for an intersection clearly shows the positive impact of optimizing traffic
signal phasing (see Figure 9.2.8). It is expected that the newly established Traffic Control
Centre will improve traffic flow at critical intersections both for vehicles and pedestrians.
(b) Channelization: On the basis of traffic volume and directional flow road design, lane
arrangement must be optimized to facilitate vehicle traffic flow for each direction.
(c) Provision of Safety Facilities: As it is at intersections where different types of vehicle traffic
and pedestrian traffic merge, thereby creating various conflicts, proper safety facilities and
measures must be provided.
9-11

Comprehensive Study of the Urban Transport Development Program in Greater Yangon (YUTRA Update) Final Report | Chapter 9: Traffic Management and Safety
9-12
Table 9.2.2 Impact of Optimizing Traffic Signal
Phasing
Indicator With With-out
Improvement
A-B A/B
Ave. Delay (second) 316 164 -152 0.51
No. of Stops 4.5 2.5 -2.0 0.56
Ave. Travel Speed (km/h) 17.4 26.3 +8.9 1.51
Source: YUTRA Study (2013).
Figure 9.2.8 Example of Micro Traffic Simulation Conducted in
YUTRA Study
3) CBD Traffic Improvement
(1) Socio-economic Profile
9.16 The CBD is the traditional and most vibrant area in Yangon City with more than 650 ha of land
area facing Yangon River. At present, 220,000 persons reside here.
Figure 9.2.9 Yangon Central Business District
Table 9.2.3 Socio-economic Characteristics of CBD Residents
Indicator
CBD
Total Western Section
(Lamadaw / Latha)
Central Section (Pabedan,
Kyauktada)
Eastern Section (Pazundaung,
Botataung) Net Land Area (ha) 187.5 134.0 330.4 651.9 Population No. 72,304 60,330 89,623 222,256 Density (no./ha) 385.7 450.3 271.2 341.0 AGR (%/y) -0.1 -2.4 -0.1 -0.8 Household No. (000) 18,739 15,157 22,102 55,998 Profile No. of HH Members 3.9 4.0 4.1 4.0
Ave. HH Income (000 MMK/m) 373 339 337 350 Ave. Living Area (m2) 20.2 18.8 20.9 20.1
Ownership of Vehicle (no./000 people) 170 95 79 114 Source: Household Interview Survey Conducted in 2013
(2) Transport Conditions
9.17 The CBD has a good network of roads which are articulated in complete grid form and in
hierarchy, comprising wide primary roads and densely provided secondary roads. Road to area ratio
is about 22%, which is the highest in the city and comparable to those in developed cities.
Notwithstanding the high availability of roads and its accessibility to river and rail transport, including
the circular rail, traffic congestion here is the most serious in the city due not only to high travel
demand but also to poor conditions and management of existing transport facilities and space.
9-12

Comprehensive Study of the Urban Transport Development Program in Greater Yangon (YUTRA Update) Final Report | Chapter 9: Traffic Management and Safety
9-13
Roadsides are occupied by parked vehicles and vendors, while proper traffic management
measures and enforcement are lacking, as shown in Figure 9.2.10.
9.18 The CBD’s riverfront is mostly occupied by port and logistics facilities with a little exception
provided for ferry and other purposes. Constraints in using the riverfront reduce opportunities to
expand water transport services. Although the circular rail is located within walking distance, proper
access is not provided and railway services are insufficient nor attractive.
Source: Study Team.
Figure 9.2.10 Identified Bottlenecks on CBD Corridors
(3) CBD Traffic Demand Characteristics
9.19 The CBD is both a significant traffic-generating and attracting area. On the basis of the
updated OD table, CBD-related traffic demand was analyzed, as shown in Table 9.2.3. The main
findings are as follows:
(i) In 2016, a total of 1 million person trips a day was generated in the CBD, of which 0.7 million
moved within the CBD;
(ii) There were approximately 705 thousand person trips within the CBD, of which 574 thousand
trips were by walking, 48 thousand by public transport, and 38 thousand by car/taxi;
(iii) There were approximately 346 thousand person trips moving between the CBD and outer
areas, of which 182 thousand trips used public transport and 155 thousand trips by car/ taxi;
(iv) The future intra-CBD travel demand will decrease, but the demand between the CBD and
outer areas will increase substantially from 346 thousand trips in 2016 to 625 thousand in
2035. It is also expected that the demand for car/ taxi will increase significantly; and
(v) The analysis suggests that the CBD will require improved access both by public and private
modes of transport.
9.20 In 2013, approximately 25,000 vehicles were owned by households in CBD. It is roughly
estimated that the total number of private cars owned by CBD residents is 15,000 units. Estimated
vehicle ownership is 114 per 1,000 people, more than twice of value of Greater Yangon. Based on
the assumption that only 20% of them have their own parking places, almost 12,000 cars park on
9-13

Comprehensive Study of the Urban Transport Development Program in Greater Yangon (YUTRA Update) Final Report | Chapter 9: Traffic Management and Safety
9-14
roads or public space. Besides the residents, those who commute to the CBD and visit it for
business also require parking space for their vehicles, the number of which is roughly estimated to
be 80 to 100 thousand a day. Residents need permanent parking space, while visitors need facilities
for specific time depending on their purposes. This large demand for parking is based on the fact
that streets and public space are occupied by vehicles which cause serious traffic congestion.
Table 9.2.4 CBD-related Travel Demand (000 Passenger Trips/day)
Mode 2016 2035
Within CBD
To/From CBD
Total Within CBD
To/From CBD
Total No. % No. %
Walk 574 13 587 55.9 477 20 497 39.8 Bicycle 45 4 49 4.7 40 9 49 3.9 MC 0 0 0 0 0 0 0 0 Car 21 71 92 8.7 15 160 175 14 Taxi 17 75 92 8.8 19 143 162 13 Public 48 182 230 21.9 71 293 364 29.2
Total 705 346 1,050 100 622 625 1,247 100 GV(PCU) 2 27 29 - 2 66 68 - Source: Study Team
(4) Proposed Solutions
9.21 As traffic problems facing the CBD are complex, it is difficult to work out immediate solutions.
However, the following initial measures can be suggested:
(i) Designation of parking and non-parking space clearly on roads and public space;
(ii) Pricing on designated parking space both for residents, shops, and visitors;
(iii) Designation of areas for street vendors and pricing on the space;
(iv) Provision of public parking facilities/ space in fringe areas of the CBD which are connected to
the CBD circular transport services; and
(v) Conduct of comprehensive survey on parking and traffic flow in the CBD to formulate parking
and circulation plans.
4) Traffic Safety
9.22 Traffic safety has worsened as motorization has progressed not only in Yangon and Myanmar
but also in other developing cities. According to WHO, in Southeast Asia, approximately 316,000
people die on the roads or 865 fatalities each day. About 20 to 50 times that number are injured or
become disabled and require long-term care, costing as much as 3% of the GDP.
9.23 Although it is often explained and shown as statistics that human error is the main cause of
traffic accidents, it could have been avoided by using better road safety technology such as barriers,
rumble strips, signage, among others. Considering that the causes of traffic accidents are complex,
a good set of data must be collected by authorities.
9.24 To attend to traffic safety issues, the following areas must be taken into account:
(i) Development of an updated accident database and scientific analysis method.
(ii) Provision of infrastructure tailored to the needs of vulnerable road users, especially
pedestrians;
(iii) Introduction of vehicles with higher safety standards;
(iv) Awareness enhancement on traffic safety among all road users;
(v) Increase in responsiveness to post-crash emergencies; and
(vi) Firm policy commitment and improved enforcement.
9-14

Comprehensive Study of the Urban Transport Development Program in Greater Yangon (YUTRA Update) Final Report | Chapter 9: Traffic Management and Safety
9-15
9.3 Proposed Actions
9.25 There is a wide range of measures and actions that can be introduced to Yangon to improve
the traffic situation for both vehicles and pedestrians. They are briefly as follows:
(a) Road Vehicle Management
(i) Improvement of the vehicle registration system
(ii) Development of a vehicle inspection system
(b) Traffic Enforcement
(i) Establishment of an institutional framework
(ii) Capacity building among traffic enforcers
(c) Traffic Engineering
(i) Management of the Traffic Control Centre
(ii) Expansion of traffic signals for vehicles and pedestrians
(iii) Improvement of pedestrian facilities/ walking environment
(iv) Provision of signage and land markings
(d) Traffic Safety Education
(i) Preparation of traffic rules/regulations
(ii) Traffic safety education for school children
(iii) Traffic safety campaign for the public and communities
(e) Parking Management
(i) Establishment and enforcement of parking regulations
(ii) Development of public parking facilities
(f) Traffic Control
(i) Regulation of loading/unloading for bus, taxi, etc.
(ii) Expansion of traffic flow control and other measures
(g) Bus Terminal Traffic Circulation: This is conducted as a component of the pilot project in
the study.
(h) Traffic Demand Management: There are various ways to manage traffic demand, as follows:
(i) Staggered Time for Work and School Trips: Shifting office and school hours is
effective in lowering the concentration of work and school trips during the morning peak
hours.
(ii) Control of Vehicle Ownership and Use: This intends to discourage ownership and
use of cars through: (i) high taxes on vehicle purchases, (ii) high registration fees, and
(iii) high fuel tax.
(iii) Road Pricing/ Area Licensing Scheme: This is an advanced congestion charging
system practiced in many cities in the world. When urban rail and public transport are
provided, this measure can be applied in the CBD of Yangon.
(iv) Shared Use of Vehicles: This encourages the use of cars/ taxis by multiple users.
(i) Introduction of ITS & ICT: There is a wide range of ITS and ICT for traffic management
which can be updated every day and is applicable to Yangon where telecommunications have
improved significantly.
9-15

Comprehensive Study of the Urban Transport Development Program in Greater Yangon (YUTRA Update) Final Report | Chapter 9: Traffic Management and Safety
9-16
Source: Study Team.
Figure 9.3.1 Introduction of ICT and AI for Urban Transport/ Traffic Management
9-16

Comprehensive Study of the Urban Transport Development Program in Greater Yangon (YUTRA Update) Final Report | Chapter 10: Urban Railway
10-1
10 URBAN RAILWAY
10.1 Current Situation
1) Railway Network
10.1 At present, urban railway services are provided by Myanma Railway which has a total
network length of 149 km and 59 stations using a conventional system. There are eight (8) lines, of
which a branch line is exclusive for freight service for Yangon Port (see Table 10.1.1). The
characteristics of the main lines are briefly as follows:
(a) Circular Line: This line is operated in two sections: the western section from Yangon Central
to Da Nyin Gone via Insein (20.3 km and 21 stations) and the eastern section which runs from
Yangon Central to Da Nyin Gone via the western side of the Circular Line, which has 25.8 km
and 17 stations.
(b) Pyay Line: This stretches from north of Da Nyin Gone to Hmawbi, a 26.5-km section with six
stations and a 3.0-km spur which serves the Computer University of Yangon.
(c) Yangon–Mandalay Line Section in Yangon Area: This is part of the north–south main line
section from Yangon to Mandalay. The section from Yangon Central to Dabein is a 36.0-km
section with seven stations and a 6.4-km spur which serves the Dagon University in northeast
Yangon.
(d) Thilawa Line: This is a 26.7-km branch line to the industrial area in southeast Yangon and
has five stations and a 5.0-km spur which serves the East University of Yangon.
10.2 At present, existing railway lines excluding intercity services are carrying approximately
80,000 passengers a day.
Table 10.1.1 Existing Railway Lines in Yangon
Type Line Name Urban Rail Service
Section Length
(km) No. of
Stations Track
Main Line
Circular Rail Entire section 46.0 38 Double Yangon–Mandalay Central Station–Dabein 36.1 6 Double
Yangon–Pyay Danyingone–Hmawbi 19.4 4 Double 7.6 km (Yangon–Hlawga) Single 11.8 km (Hlawga–Hmawbi)
Branch Line
Thilawa Toe Gaung Gale–Okhposu–Thilawa 26.2 5 Single Eastern University Okhposu–Eastern University 5.4 1 Single Dagon University Toe Kyaung Ka Lay–Dagon University 8.0 1 Single Computer University Hlawga–Computer University 2.9 1 Single
Yangon Port (Freight) Pazundaung–Botahtaung–Kyee Myin Daing 9.9 2 Single
Total Passenger 144.0 56
Freight 9.9 2
Source: Study Team
10-1

Comprehensive Study of the Urban Transport Development Program in Greater Yangon (YUTRA Update) Final Report | Chapter 10: Urban Railway
10-2
Source: Study Team
Figure 10.1.1 Railway Network in Yangon, 2016
10-2

Comprehensive Study of the Urban Transport Development Program in Greater Yangon (YUTRA Update) Final Report | Chapter 10: Urban Railway
10-3
2) Ongoing Railway Improvement Project
10.3 At present, improvement projects to increase transport capacities and safety in the short
term are ongoing and include the following:
(a) Yangon Circular Rail Line Upgrading Project: This project intends to improve the signal
system, introduce a new diesel/electric multiple unit (DEMU), improve the platforms, and
rehabilitate the track and civil structure. The project is expected to be completed by 2021 and
increase transport capacities to 300,000 passengers or more a day.
(b) Yangon–Mandalay Line Improvement Project (Phase 1): This project intends to improve
the track, civil structure, and signaling system in the suburban section of Yangon. The project
is expected to be completed by 2021.
(c) Yangon Central Station Operation Control Centre Project: This project intend to improve
the interlocking system at the Yangon Central Station yard and is expected for completion in
20171.
3) Existing Problems and Issues
10.4 With regard to the existing rail service in the Greater Yangon area, the main issues are
summarized as follows:
(i) Decreasing Levels of Service (Speed, Punctuality, Riding Comfort, Cleanness, and
Safety): The operation of the YCR Line commenced in January 1959. After about half a
century since then, the deteriorated state of the facilities, equipment and rolling stock with
limited partial rehabilitation cause reduced travel speeds: have fallen to almost half (15 km/h)
of that when it started, train delays, derailments, accidents and other operational problems.
(ii) Low Ridership against Increasing Demand: The population in the city has grown. The
existing rail system in Yangon carries about 75,000 passengers per day, while an improved
YCR Line (with EMU) is expected to carry about 700,000 passengers or more per day upon
its completion.
(iii) Deteriorated Infrastructure, Equipment, System, and Rolling Stock: In almost all
aspects the existing rail and related facilities need improvement, including roadbed, rail track,
signalling and train control system, telecommunication, level crossings, and rolling stock.
(iv) Insufficient Maintenance of Track and Other Facilities: The deformation of the track due
to heavy rainfall in the rainy season is one of the main causes of derailments. Because of the
limited technical capacity of workers and machines, the level of maintenance work has
remained at low level. Improvement of track condition together with the introduction of
mechanical maintenance methods with modern machines is required to achieve a decent
maintenance work level.
(v) Aged Rolling Stock: The MR’s existing rolling stock need to attract the Yangon residents by
improving its performance, comfort level, and design which does not favor vulnerable groups.
The interior of the rolling stock is not properly designed nor furnished for commuters, and its
ride comfort is far below the desired level of a transit system in an international gateway.
(vi) Bottleneck Section: Priority in the current train operation is given to the long-distance
Yangon–Mandalay Line. The operation of the YCR Line is sometimes disrupted to give way
to the former at a cross-over rail segment between Pa Zun Taung Station and Yangon
Central Station. This crossing operation needs to be improved by installing a signal system
on the YCR Line.
1 The name of project is “Project for Installation of Operation Control Center System and Safety Equipment”
10-3

Comprehensive Study of the Urban Transport Development Program in Greater Yangon (YUTRA Update) Final Report | Chapter 10: Urban Railway
10-4
(a) Increasing Road Traffic crossing Manually Operated Level Crossings: All of the existing
level crossings along the YCR Line (27 in total) are manually operated by MR staff. The
closing time of level crossings tends to be longer because of the manual operation and selfish
behavior of car drivers. Sometimes trains need to stop at level crossings because cars do not
give way. Replacement of existing manually operated level crossing system with an
automated system is needed to improve the level of safety.
(b) Deteriorated Station Buildings: Almost all of the existing station facilities are heavily
deteriorated and in need of rehabilitation. There are no decent facilities, such as toilets,
platform ceiling, benches, and passenger information boards, which have resulted in low
levels of service.
(c) Poor Accessibility to Rail Stations: There are no feeder bus services to/from the existing
rail stations; in other words, there is no integration between rail and bus service in Yangon. In
addition to this, roads to/from rail stations are not well developed nor maintained. Hence, it is
quite difficult for vulnerable groups to use the existing rail service. A universal design must be
incorporated in the modernization of MR’s system.
(d) Traffic Congestion: Parallel roads to the YCR Line are major arterial roads in the city,
namely Pyay road, Insein Road, Baho Road, and Waizayandar Road. Traffic congestion and
travel time on these roads have been increasing. Improving the YCR Line will contribute to
the improvement of traffic along these major arterial roads.
4) Additional Grounds for Developing a Modern Transit System
(a) Short Distances between Stops on YCR West: Some of the stations here are less than one
kilometer apart. This is not an ideal distance for a high-speed commuter rail system because
it limits the maximum speed that could otherwise be achieved between station to reduce
journey times and make rail more competitive and attractive to passengers currently using
other modes.
(b) Long Distances between Stops on YCR East: There are a number of stations here which
are more than 1.5 km apart. This limits the catchment area of the stations and makes them
less attractive to passengers because they have to use another mode to reach their final
destinations.
(c) Few Stations on Pyay, Mandalay, and Thilawa Lines: The station density is too low even
for a suburban rail system. Ideally, suburban rail stations should be 2.0 to 2.5 km apart. On all
these three lines, a number of new stations could be introduced either close to existing
developments or certainly through TOD to enhance patronage and make the lines more
viable.
(d) Too Many Level Crossings: At-grade level crossings require trains to obey yet another
unnecessary signal along the way. The high number of level crossings located one after the
other, like on YCR East section, limits the number of trains that could be operated.
10-4

Comprehensive Study of the Urban Transport Development Program in Greater Yangon (YUTRA Update) Final Report | Chapter 10: Urban Railway
10-5
10.2 Direction of Urban Railway Development
1) Important Role of Urban Railway
10.5 The results of the demand forecast clearly indicates that Yangon needs a good urban rail
system together with urban roads and expressways, public transport system, and adequate traffic
management that work as a network. In order to promote and establish a public-transport-based
urban area, Yangon requires a competitive (i.e., high-quality, high-capacity level of service) and
affordable public transport system wherein urban rail functions as the backbone that integrates other
public transport modes including bus, BRT, taxi, and ferry. Certainly, as wide urban areas cannot be
served by railway alone, connectivity to feeder services is critical. BRT and bus must serve other
major corridors not covered by urban rail.
10.6 The development of urban rail in Yangon must not only be looked into from the transport
perspective but also from the urban development aspect. Urban rail can be a key driver and catalyst
to promote integrated urban development and achieve the desired spatial structure. The
development of a high-quality urban rail can also generate tremendous opportunities for TOD when
properly designed and can capture the value from those developments, thereby improving people’s
mobility, infrastructure accessibility, and public convenience.
10.7 In Yangon, as shown in Figure 10.2.1, public transport demand is distributed along the
existing Circular Rail and rail corridors. When rail is provided with high-capacity trains, peak hour
traffic in the morning and afternoon shown in Figure 10.2.2 can be absorbed effectively by rail which
would help reduce road traffic during peak hours.
Source: Study Team
Figure 10.2.1 Distribution of Public Transport Demand and Location of Circular Railway Line,
2016
Source: Study Team
Figure 10.2.2 Hourly Distribution of Traffic Demand in Yangon, 2013
10-5

Comprehensive Study of the Urban Transport Development Program in Greater Yangon (YUTRA Update) Final Report | Chapter 10: Urban Railway
10-6
2) Key Considerations in Urban Railway Development
10.8 As urban rail requires large investment and lengthy time for implementation, the following
points must be duly considered:
(a) Match between System and Location: The system must suit the characteristics of
locations/routes and depend on the demand.
(b) Integration of Different Lines: Urban rail lines must be integrated properly to ensure smooth
travel of passengers.
(c) Consideration of Proper Structure: In consideration of other urban traffic on roads and the
availability of space for constructing urban rail facilities, a proper rail structure (at-grade,
elevated, or underground) must be selected.
(d) Phased Development: As the investment cost is always high, it is important to consider
development by stages.
(e) Funding and TOD: Urban rail development must be integrated with urban development to
promote the desired land use based on a TOD concept for value capture (TOD is described in
Chapter 12).
Source: Study Team
Figure 10.2.3 Broad Classification of Mass Transit
Source: Study Team
Figure 10.2.4 Examples of Urban Rails in Selected Asian Cities
10-6

Comprehensive Study of the Urban Transport Development Program in Greater Yangon (YUTRA Update) Final Report | Chapter 10: Urban Railway
10-7
Table 10.2.1 Types of UMRT
Item Metro/Heavy Rail
(Elevated) Metro/Heavy Rail (Underground)
Monorail (Straddled Type)
AGT
Image
Capacity(Passengers / cars with seats + 6 pax / m 2)
220 220 122 115
PPHPD (Capacity per car * 6 cars * 30 trips/hr/direction )
40,000 40,000 22,000 21,000
Moving Gear Steel wheel Steel wheel Rubber tire Rubber tire
Maximum Speed (km/h) (Average)
100 (40)
100 (40)
80 (36)
601) (36)
Max. Track Gradient (%) 3.5 3.5 6 6
Min. Curve Radius (m) 300 (200) 300 (200) 70 50
Rough Construction & Procurement Cost (USD mil./km)
50–100 140–200 45–100 45–60
Required Space Larger Many land acquisition
and resettlement may be required.
Large depot land is required if at-grade.
Smaller Some land acquisition
and resettlement may be required.at station area
Large depot area is required if at-grade
Medium Some land acquisition
and resettlement may be required, especially at station area.
Moderate depot area is necessary.
Smaller Some land acquisition
and resettlement may be required, especially at station area.
Moderate depot area is necessary.
Environmental Impact
Noise Level 90 dBA (normal speed) 85 dBA (reduced speed)
Low because built underground
70 dBA (normal speed) 65 dBA (reduced speed)
65 dBA (normal speed) 60 dBA (reduced speed)
Landscape Become worse becuse overhead structure is large
Good because no overhead structure
Become not so bad because overhead structure is slim
Become worse a little because overhead structure is medium-sized
Emergency Exit Track can be used as escape route.
Special countermeasure is required in case of fire
Special countermeasure is required in case of fire
Track can be used as escape route
Car Maintenance Common Common Replacement of rubber tire is necessary
Replacement of rubber tire is necessary
Past Experiences Many Many Moderate Moderate
Manufacturers Many Many Limited Limited
Source: Study Team 1) A new type of automated people mover runs at120 km/h.
10-7

Comprehensive Study of the Urban Transport Development Program in Greater Yangon (YUTRA Update) Final Report | Chapter 10: Urban Railway
10-8
3) Institutions
10.9 In order to develop urban railway, it is necessary to establish not only the infrastructure but
also the soft part such as railway policy, laws, etc. Typical examples in the other countries are
shown in the figure below. The Myanmar government must select its own policy and laws prior to
developing its urban railway.
Source: Study Team
Figure 10.2.5 Types of Railway Planning and Development Organizations
10-8

Comprehensive Study of the Urban Transport Development Program in Greater Yangon (YUTRA Update) Final Report | Chapter 10: Urban Railway
10-9
10.10 Organizations that will be responsible for the development and operation of urban railway is
also an important matter to think about. Listed below are some alternatives based on the
experiences of other countries.
(a) For New Lines
(i) Develop and operate by the local government;
(ii) Develop and operate by a company owned by the local government;
(iii) Develop by 1 and operate by 2;
(iv) Give concession to a private company
Build-Operation-Transfer;
Build-Lease-Transfer: Operate by 1 or 2; or
Develop by 1 and give concession for operation to a private company.
(b) For Lines of Myanma Railways (Urban transport only)
(i) Develop and operate by Myanmar Rail;
(ii) Develop by Myanmar Rail and operate by local government;
(iii) Develop by Myanmar Rail and operate by a company owned by the local government;
(iv) Develop by the local government, transfer to Myanmar Rail, and operate by 1, 2, or 3.
4) Introduction of Railway ICT
10.11 In addition to improving railway infrastructure, it is essential to enhance passenger
convenience and user-friendliness such as easy fare deposit system, real-time provision of train
operation information, etc. In order to establish transparent tracking of revenue and expenditure, it is
recommended that an automatic accounting system be introduced.
10.12 Railway ICT includes an automatic fare collection (AFC) system using smart cards controlled
by a centralized automatic accounting system, signboards providing real-time traffic information, and
seamless information provision to smartphones
Source: Study Team
Figure 10.2.6 Components of Railway ICT
10-9

Comprehensive Study of the Urban Transport Development Program in Greater Yangon (YUTRA Update) Final Report | Chapter 10: Urban Railway
10-10
10.3 Proposed Urban Rail Network
10.13 The proposed urban rail network intends to promote a public-transport-based spatial
structure and urban development as defined in the updated SUDP. The CBD and planned
subcentres and new towns will be connected to each other with a high-quality mass transit network,
and emerging urban developments will be guided by the network. The overall characteristics of the
network are briefly explained here.
(1) Circular Rail
10.14 The circular rail will form the main urban transit backbone covering existing urban areas
where demand concentrates. When the circular rail is strengthened, it is expected that urban
development along the route will be promoted significantly. The circular rail must function as the
most important foundation both for public transport and urban development.
10.15 The ongoing upgrading of the circular rail is expected to complete in 2021 and serve 200
thousand to 300 thousand passengers in the short term. It will be further strengthened by elevating
the rail in at-grade sections where it currently crosses with major roads. The elevation of the circular
rail must be implemented in integration with urban development based on the TOD concept at and
around the stations to facilitate access to/from feeder services and to promote commercial
development to capture added value.
10.16 Grade separation must be implemented without stopping railway operation and by section.
The priority sections are Kyee Myin Daing–Insein and Malwago–Yegu which are located in busy
urban areas and cross with a number of at-grade roads.
(2) Suburban Commuter Lines
10.17 When the circular rail is upgraded, existing MR lines must likewise be improved to provide
commuter services that connect the urban center and suburban areas in the north and northeast,
where public transport demand is high. Suburban commuter lines are as follows:
(a) Yangon–Mandalay Line: An improvement project (phase 1) is ongoing. The section
between Yangon and Ywa Tar Gyi stations must be improved so that the line can provide
urban services. The improvement should include modernizing the safety system, developing
station areas, and procuring new rolling stock.
(b) Yangon–Pyay Line: At present, there is no upgrading work. Facilities are deteriorated and
old-fashioned. The section between Hlawga and Hmawabi stations has a single track.
Necessary improvement work for Danyingone and Hmawbi include the rehabilitation and
modernization of track, civil structure, stations, and safety system. For the Danyingone and
Hlawga section, which has double tracks, it must be provided with automatic color light
signal. Procurement of additional rolling stock is also needed for the entire line.
(c) Thilawa Line: The single-track line is deteriorated and requires thorough upgrading
including double tracking of the Thanlyin bridge crossing Bago River.
(d) Branch Lines: There are three short-distance, single-track branch lines, namely the Eastern
University Line, Dagon University Line, and Computer University Line. These lines are also
deteriorated and do not function adequately. It is proposed that intermediate capacity modes,
such as monorail and AGT, be introduced when the main lines are properly upgraded.
10-10

Comprehensive Study of the Urban Transport Development Program in Greater Yangon (YUTRA Update) Final Report | Chapter 10: Urban Railway
10-11
(3) New UMRT Lines
10.18 Yangon which is expected to grow into a mega city needs new urban rail lines. In order to
meet the future demand and promote the envisioned urban development, three new lines which will
be integrated with the circular rail and form part of the mass-transit network are proposed to be
developed.
(i) UMRT Line 1, North–South Line: This line will serve the urban areas in Yangon,
connecting the CBD with Dala in the south and with Dagon, Bahan, Yankin, and Mayangon
along Kab Aye Pagoda Road. A pre-feasibility study (pre-FS) conducted on the line revealed
that it is economically feasible and will provide high-quality public transport services along
one of the most congested roads in the city.
(ii) UMRT Line 2, East–West Line: The urban areas in Yangon are not provided with good
east–west connections—the circular rail functions as the north–south public transport axis.
Line 2 has two objectives: In the short term, it can carry current and future large traffic
demand by connecting high-demand areas to the upgraded circular rail. For the medium to
long term, Line 2 will encourage the development of subcentres along its route and will
integrate the main urban rail lines, i.e., the circular line, UMRT Line 1, Yangon–Mandalay
Line, and Thilawa Line. Line 2 is expected to establish a new transit backbone, encourage
TOD, and decrease the excessive concentration of socio-economic activities in the CBD.
(iii) Possibility of Proposed UMRT Line 3, East–West (South) Line: Although this line was
studied in YUTRA, it was not included in the final proposed network. Because the SUDP
showed an updated spatial structure featuring new sub-centers and towns in Dala, Kyee
Myin Daing, and Twantay, all of which would generate large demand, this scenario was
tested in the study. It revealed that the development of an urban rail connecting these
emerging areas via the city center will be necessary. It was also found that when this line is
constructed underground, most parts of the city center will be served by urban rail within
walking distances (see Figure 10.3.1).
Source: Study Team Figure 10.3.1 Assumed Coverage of Urban Railway Network in the City Center (with UMRT Line 3)
10-11

Comprehensive Study of the Urban Transport Development Program in Greater Yangon (YUTRA Update) Final Report | Chapter 10: Urban Railway
10-12
(4) Port Access Line
10.19 The current rail line connecting to the existing port will cease when the port is relocated from
the CBD to Thilawa and other areas.
(5) Hanthawaddy Airport Line
10.20 This line will connect Yangon to the planned Hanthawaddy international airport near Bago
City. The distance between Yangon and the new airport is approximately 70 km. A preliminary study
on the route and system is ongoing. Although the objective is to provide speedy access to the new
airport, the integrated urban development along the line must also be considered because it is
difficult to justify the huge investment if the line will only serve the new airport.
(6) Suburban Freight Line
10.21 This line intends to provide freight transport service in outer areas of the city because
suburban commuter lines need to provide frequent passenger services, leaving no room for freight
operation. Moreover, safety issues arise from frequent passenger and freight transport.
Table 10.3.1 Profile of Proposed Urban Rail Lines in Yangon
Line/ Section Length (km) Structure
No. of Stations System Estimated Cost
(USD mil.) At-grade Elevated Under-
ground
Circular Rail 46.0 Grade-separated 17 21 MRT 350 (upgrading) 2,375
Suburban Commuter Lines
Yangon–Mandalay 36.1 At-grade 6 MRT 450
Yangon–Pyay 19.4 At-grade 7 MRT 625
Thilawa 26.2 At-grade 5 MRT 1,025
Branch Lines
East University 5.4 Elevated 5 Monorail/AGT 100
Dagon University 8.0 Elevated 8 Monorail/AGT 100
Computer University 2.9 Elevated 3 Monorail/AGT 100
UMRT Line 1: North–South 20.5 Elevated /
Underground 3 6 12 MRT 4,270
Line 2: East–West 21.9 Elevated / Underground 1 22
(14) 0
(8) MRT 1,870
Source: Study Team
10-12

Comprehensive Study of the Urban Transport Development Program in Greater Yangon (YUTRA Update) Final Report | Chapter 10: Urban Railway
10-13
Source: Study Team
Figure 10.3.2 Proposed Urban Rail Network Plan for Yangon City
10-13

Comprehensive Study of the Urban Transport Development Program in Greater Yangon (YUTRA Update) Final Report | Chapter 10: Urban Railway
10-14
10.4 Proposed Action Plan
Table 10.4.1 Proposed Action Plan for Yangon Urban Rail Network Development
Line Proposed Action Planning Horizon Preliminary
Cost (USD mil.)
Short-term (2020)
Mid-term (2021–2025)
Long-term 2026–2030 2030<
Circular Line
1. Upgrading
Ongoing: Entire Line
System, rolling stock 2021 280 Civil, track 2019 70
Planned Station 2020 3
2. Grade Separation
1 Road Over Bridge 2020 5 Section 1: Kyee Myin Daing–- Insein
Civil, track, station 2025 260 System 2025 180 Rolling stock 2025 90
Section 2: Insein–Danyingone
Civil, track, station 2025 280 System 2025 180 Rolling stock 2025 90
Section 3: Civil, track, station 2030 250 Danyingone– System 2030 170 Mingaladon Rolling stock 2030 80 Section 4: Mingaladon– Malwagone
Civil, track, station 2030 140 System 2030 90 Rolling stock 2030 50
Section 5: Malwagone Yangon Central
Civil, track, station 2033 260 System 2033 170 Rolling stock 2033 80
Suburban Lines
Yangon– Mandalay
Section: In Greater Yangon
System 2032 180 Rolling stock 2034 270
Yangon–Pyay Line
Section: In Greater Yangon
Civil, track, station 2028 100 System 2028 375 Rolling stock 2030 150
Thilawa Section 1 Civil, track, station 2023 160 Line System 2023 340 Rolling stock 2023 150 Section 2 New Bago Bridge 2025 375
UMRT
UMRT 1 Section 1 (Dala–YGN)
Civil, track, station 2030 750 North–South System 2030 130 Line Rolling stock 2030 60
Section 2 (YGN–Airport North)
Civil, track, station 2035 2,440 System 2035 600 Rolling stock 2035 290 UMRT 2 Section 1:
Hlaing Thayar–Oak Kyin
Civil, track, station 2026 430 East–West System 2026 290 Line Rolling stock 2026 140
Section 2: Oak Kyin–Toe Kyaung G
Civil, track, station 2031 500 System 2031 340
Rolling stock 2031 170
Other Lines
CBD Circular LRT Civil, track, station 2030 90 System 2030 90 Rolling stock 2030 70
Outer Circular Rail Line
Section 1 Civil, track, station 2025 190 System 2025 270 Section 2 Civil, track, station 2028 150 System 2028 240
Hanthawaddy Airport Access
Civil, track, station 2035 790 System 2035 1,310 Rolling stock 2035 530
Source: Study Team
10-14

Comprehensive Study of the Urban Transport Development Program in Greater Yangon (YUTRA Update) Final Report | Chapter 11: Inland Waterway Transport
11-1
11 INLAND WATERWAY TRANSPORT
11.1 Current Situation
1) Overview
11.1 Traffic congestion has been worsening in Yangon due to the increase in the number of cars,
buses, trucks, and etc. which is associated with rapid economic growth. In addition to cargo
transport, passenger transport is considered as one of the reasons for the worsening traffic
congestion. Therefore, it is necessary to take countermeasures from the aspect of logistics for
passenger and cargo. In particular, it is expected that cargo which passes around Yangon City will
increase due to industrial activities at Thilawa SEZ and other industrial zones.
2) Existing Routes and Operation
11.2 There are three major water transport routes in Yangon. These are the routes connecting
Yangon and the opposite side of the river, as shown in Figure 11.1.1. Table 11.1.1 shows the three
existing routes and Figure 11.1.2 shows the present condition of the jetties and ships that operated
in these routes. Besides the three, there is a service transporting passengers for short distances at
Yangon Port using small boats.
Source: Study Team
Figure 11.1.1 Regular Inland Water Transport Routes
11-1

Comprehensive Study of the Urban Transport Development Program in Greater Yangon (YUTRA Update) Final Report | Chapter 11: Inland Waterway Transport
11-2
Table 11.1.1 Current Inland Water Transport Services
From Pansodan to Dala
Ship Type Ferry Route Distance (km) 1 Schedule 46 services/day (one-way trip)
From Pansodan first service 5:30 and last service 21:30 From Dala first service 5:00 and last service 21:00
Number of Passengers1)
Number of passengers : 9,792,173 Average per 1 month : 816,014 Average per 1 service : 295
Cargo Volume2) (ton) Cargo volume : 41,307 Average per 1 month : 3,442 Average per 1 service : 1.25
Fare3) (MMK) Passenger : 100 Cargo4): measured rate system 1–50 viss : 50 51–100 viss : 100 More than 400 viss : 500 Bulk/Fouling cargo : twice of normal fare
From Wadan to Dala
Ship Type RO-RO Route Distance (km) 2 Schedule 10 services/day (one-way trip)
From Wardan first service 7:00 and last service 18:30 From Dala first service 6:30 and last service 18:00
Number of Passengers1)
Number of passenger : 102,226 Average per 1 month : 8,519 Average per 1 service : 14.2
Cargo Volume2) (ton) Cargo volume : 183,532 Average per 1 month : 15,294 Average per 1 service : 25.5
Fare3) (MMK) Passenger : 100 Cargo4): measured rate system Less than 2 tons : 2,000 3 tons : 3,000 General cargo : 1.6 kyat/viss
From Lan Thit to Kha Naung Toh
Ship Type Ferry Route Distance (km) 6 Schedule 8 services/day (one-way trip)
From Lan Thit first service 5:30 and last service 17:30 From Kha Naung first service 6:00 and last service 18:20
Number of Passengers1)
Number of passenger : 782,778 Average per 1 month : 65,232 Average per 1 service : 135
Cargo Volume2) (ton) Cargo volume : 1,838 Average per 1 month : 153 Average per 1 service : 0.3
Fare3) (MMK) Passenger : 200 Cargo4): measured rate system 100 viss : 100 Bulk cargo : 1.5 times of normal fare Fouling cargo : 1.25 times of normal fare
Source: IWT 1) The number of passengers show the total for both directions. The period for tallying is April 2015 to March 2016. 2) The cargo volume shows the total for both directions. The period for tallying is April 2015 to March 2016. 3) MMK100 = JPY8.4 (as of 17 August 2016) 4) 1 viss = 1.6 kg.
11-2

Comprehensive Study of the Urban Transport Development Program in Greater Yangon (YUTRA Update) Final Report | Chapter 11: Inland Waterway Transport
11-3
Dala Jetty Ferry operating Pansodan–Dala Route
Pansodan Jetty Wadan Jetty
Lan Thit Jetty Kha Naung Toh_New Jetty
Ferry operating Lan Thit–Kha Naung Toh Route Kha Naung Toh Old Jetty
Source: Study Team 1) The pontoon in Kha Naung Toh is currently being utilized because the existing fixed-type jetty had deteriorated.
Figure 11.1.2 Present Condition of Jetties and Ships Operating in Existing Routes
11-3

Comprehensive Study of the Urban Transport Development Program in Greater Yangon (YUTRA Update) Final Report | Chapter 11: Inland Waterway Transport
11-4
11.3 Figure 11.1.3 and Figure 11.1.4 show the number of passengers and cargo volumes in
recent years handled by IWT. Regarding the number of passengers, around 90% comprise
passengers from Pansodan to Dala. The total has been in the range of 0.8 million to 1.0 million,
which shows a stable demand. Regarding cargo volume, around 80% was accounted for by cargo
from Wadan to Dala and carried by RoRo ships. For other routes serviced by ferry, cargo volume is
not so high because passengers bring few cargo. Around 20,000 tons of cargo had been transported
every month, except during the months with heavy rainfall (July and August).
Source: IWT
Figure 11.1.3 Number of Passengers by IWT Route
Source: IWT
Figure 11.1.4 Cargo Volumes by IWT Route
817
927 906 921 918 888 917 866 893 881
841 901
‐
200
400
600
800
1,000
(thousand)
Pansodan‐Dala Wadan‐Dala Lan Thit‐Kha Naung Toh
20
23 21
14
9
18 19 20 21 21 20
22
‐
5
10
15
20
25(thousand tons)
Pansodan‐Dala Wadan‐Dala Lan Thit‐Kha Naung Toh
11-4

Comprehensive Study of the Urban Transport Development Program in Greater Yangon (YUTRA Update) Final Report | Chapter 11: Inland Waterway Transport
11-5
3) Ongoing Projects
(a) Introduction of Yangon Water Bus (Yangon Water Bus)
11.4 The Yangon Regional Transport Authority (YRTA) is planning to operate passenger transport
by high-speed water taxis on the Hlaing River and Nga Moe Yeik Creek for more convenient
transport and to reduce traffic congestion in Yangon City. Two local joint venture companies
submitted tender application forms to YRTA for the operation, and Tint Tint Myanmar won the tender.
11.5 In October 2017, the first phase of Yangon Water Bus was started to operate between Insein
and Bothtaung area (as shown in Figure 11.1.5). As of June 2018, The second phase (Botahtaung
to North Dagon) and third phases (Botahtaung to Thanlyin) are planned to be operated within 2018.
11.6 The operation of first phase was planned to target about 20,000 commuters and run every
20 minutes from 6 am to 6:30 pm. Recently, the company has amended the schedule several times
and reduced the frequency of service to meet a commuter demand.
11.7 The feasibility study for water taxi route survey was implemented beginning June 2016.
Besides the YRTA, external experts, the Department of Marine Administration, Myanma Port
Authority (MPA), Directorate of Water Resource and Improvement of River System, and experts
from Japan, France, and England made a survey of the Hlaing River, Nga Moe Yeik Creek, and
Pazundaung Creek. As a result of the survey, seven small ports will be set up along the Hlaing River
for the Hlaingthaya–Pansodan route, and 11 small ports along Nga Moe Yeik Creek for a North
Dagon–Nyaung Tan route.
(b) New Jetty Construction by Private Company
(i) Pun Hlaing Golf Estate: The jetty (pontoon type) was constructed by the MPA in 2015, with
the management and maintenance being controlled by a private company. Only one vessel
owned by that company is being operated from Pun Hlaing Golf Estate to Thilawa Area for
tourists. Passenger capacity is 60 and rental fee is MMK200,000 per hour. Currently, an
office building is under construction at Pun Hlaing Golf Estate; it is expected to finish in 2017.
When finished, a ferry will service the staff of that company from Star City to Pun Hlaing Golf
Estate. The company’s current building, which is located near Bogyoke Market downtown
will be demolished and all offices will be moved to the new building.
(ii) Star City Area: At Star City, a jetty which is the same type as that being used at Pun Hlaing
Golf Estate will be constructed by a private company. This jetty will extend far out to the sea
because of the shallow water near the coast. The construction permit has been acquired
already from the MPA. A contractor will conduct dredging work before the installation of the
jetty. As of January 2017, the project is behind schedule. The initial schedule is shown below
and it is under the bid evaluation at present.
Bidding (design build): October 2016
Bid evaluation: November 2016
Award and construction start: Late November 2016
11.8 The plan is to operate the service for public transport (mainly for commuters); however, the
detailed operation plan was not disclosed during the bidding period.
11-5

Comprehensive Study of the Urban Transport Development Program in Greater Yangon (YUTRA Update) Final Report | Chapter 11: Inland Waterway Transport
11-6
Source: YRTA
Figure 11.1.5 Water Taxi Routes and Image of Water Taxi
Source: Study Team
Figure 11.1.6 New Jetty at Pun Hlaing Golf Estate
11-6

Comprehensive Study of the Urban Transport Development Program in Greater Yangon (YUTRA Update) Final Report | Chapter 11: Inland Waterway Transport
11-7
11.2 Development of New IWT Routes
1) Proposed Routes
11.9 It can be said that the development of inland water transport is effective in order to relieve
road congestion. Five routes with potentially high passenger and cargo demand are proposed, as
shown in Figure 11.2.1 in consideration of the future development of Yangon City and the industrial
zones.
11.10 As mentioned above, the Yangon Region Transport Authority (YRTA) under the Yangon
Regional Government is working to develop new inland water transport routes. According to them,
the Pansodan–Hlaingthaya and Nyaung Dan–Thuwana–Dagon passenger routes have high priority
due to an estimated high demand among Yangon citizens.
Source: Study Team 1) Prepared by the Study Team based on Google Earth.
Figure 11.2.1 Proposed New IWT Routes
11-7

Comprehensive Study of the Urban Transport Development Program in Greater Yangon (YUTRA Update) Final Report | Chapter 11: Inland Waterway Transport
11-8
11.11 The outline of each route and the reason for their selection are summarized below.
(a) Pansodan–Hlaingthaya
11.12 This route has a length of 21 km and will serve passengers. The reasons for selecting this
route are as follows:
(i) There are seven development plans for industry zones in Hlaingtharya (refer to Figure
11.2.3) and it is expected that the population of workers will increase in these areas including
during the construction period. Therefore, traffic congestion becoming worse in case of
utilizing land transport is a concern; and
(ii) In case land transport will be used between Yangon to Hlaingtharya, the route will pass
Bayint Naung Bridge which has high traffic volume; many trucks transporting cargo use this
bridge because it connects Yangon to Pathein. For this reason, it would be effective to divert
road traffic to water transport.
11.13 It should be noted that the water depth of Pun Hlaing River is currently not sufficient for safe
operations. After the dredging work conducted by DWIR three years ago, the river has become
shallow again due to sand sedimentation.
Source: Study Team
Figure 11.2.2 Present Condition of Pun Hlaing River
(b) Pansodan–Star City–Thanlyin
11.14 This route has a length of 15 km and will serve passengers. The reasons for selecting this
route are as follows:
(i) Significant increase in working population is expected along with the development of Thilawa
SEZ; hence, traffic congestion from Yangon to Thilawa Area will become even more severe.
Even now, traffic around Thanlyin Bridge is remarkable; and.
(ii) It is logical to diversify the traffic volume around Thanlyin Bridge which is the main traffic
bottleneck at present. A new jetty for this route will be constructed in the near future and
passenger service will be operated by a private company.
(c) Nyaung Dan–Thuwana–Dagon
11.15 This route is about 27 km long and will serve passengers. The reasons for selecting this
route are as follows:
(i) Dagon and Thuwana are the main residential areas in Yangon, with a very high population
density. It is estimated that there is a large demand from passengers living in areas along or
near the riverside such as South Oakkalapa, North Oakkalapa, South Dagon, and North
Dagon.
11-8

Comprehensive Study of the Urban Transport Development Program in Greater Yangon (YUTRA Update) Final Report | Chapter 11: Inland Waterway Transport
11-9
(ii) There are many wards between Thuwana and Pansodan, the major ones being 5th Ward,
6th Ward, Taung Lone Pyan Ward, Sat San Ward, Ku Toet Seik Ward, and Pathein Nyunt
Ward. The Thuwana National Stadium is also located here. Therefore, there is heavy traffic
in this area.
(d) Thilawa–Hlaingtharya
11.16 This route has a length of about 41 km and will serve both passengers and cargo. The
reasons for selecting this route are as follows:
(i) There is a large demand for cargo transport by barge between Thilawa Port, which is an
international port, and developing areas such as Hlaingtharya; and
(ii) The current land route between Yangon to Hlaingtharya passes Bayint Naung Bridge. Many
trucks transporting the cargo between Yangon to Pathein pass this bridge, resulting in
severe traffic congestion.
11.17 The optimal route including the via-terminal in Yangon Main Port will be decided in
consideration of cargo volume and transport time.
(e) Thilawa–Shwe Pyi Thar
11.18 This route is about 48 km and will serve cargo only. The reasons for selecting this route are
as follows:
(i) There are four development plans for industrial zones in Shwe Pyi Thar (refer to Figure
11.2.3) and industrial development is expected in the future. Accordingly, it is expected that
there would be a large demand for cargo transport by barge between Thilawa Port and Shwe
Pyi Thar. In addition, the Insein Market and Thiri Mingalar Market, both crowd drawers, are
located along the route between Yangon and Shwe Pyi Thar. It will thus be effective to offer
water modes to ease road congestion;
(ii) The plan for container cargo being transported between the MITT terminal and Shwe Pyi
Thar by barge is being pushed forward already. The operation was expected to start in
December 2016. The selection of the operator is progressing. It is estimated that barge size
could be about 40 TEUs. Like the Thilawa–Hlaingtharya route, it is necessary to decide on
the optimal route and the terminal at Yangon Port giving due consideration to cargo volume
and transport time; and
(iii) Water transport offers more advantages when transporting large quantities at long distances.
Therefore, this route is considered particularly effective because it is one of the longest
routes in Greater Yangon.
11-9

Comprehensive Study of the Urban Transport Development Program in Greater Yangon (YUTRA Update) Final Report | Chapter 11: Inland Waterway Transport
11-10
Table 11.2.1 Profile of Industrial Zones Related to Inland Waterway Transport
Name Area Aggregate Administrator Shwe Pyi Thar (1) 336 acres, 385 lots Shwe Pyi Thar (1) Industrial Zone Management Committee Shwe Pyi Thar (2/3/4) SPT2=204.512 acres
SPT3=394.504 acres SPT4=388.312 acres
Shwe Pyi Thar (2/3/4) Industrial Zone Management Committee
Hlaingtharya (1/2/3/4/6/7) Total area=1401.44 acres, Industrial area=1087.98 acres
Hlaingtharya Industrial Zone Management Committee
Hlaingtharya (5) 222.933 acres Hlaingtharya 5 Industrial Zone Management Committee Source: Myanmar Industry Directory 2015-2016
Source: Myanmar Industry Directory 2015-2016 Figure 11.2.3 Location of Industrial Zones in Yangon
2) Issues on Water Transport Development in Yangon
11.19 The following matters are considered technical issues aimed at promoting the use of water
transportation. Especially, Monkey Point where three rivers cross is dangerous area. In 1986, the
capsizal accident of Tine Lone Kyaw happened by the influence of the strong wind during the
monsoon. It is necessary to decide the detailed route and location of via-terminal by fully considering
of the natural condition of each river such as the water depth, current, wind and etc.
(a) Securing of Punctuality
11.20 In case existing ships are used, there is a possibility that operating schedules would not be
followed The strong current of the Yangon River, especially during the rainy season, and the current
fleet’s lack of propulsion power will not allow ships to reach their destinations upstream on time.
Related to Inland Waterway Transport
11-10

Comprehensive Study of the Urban Transport Development Program in Greater Yangon (YUTRA Update) Final Report | Chapter 11: Inland Waterway Transport
11-11
There are also some areas where ships cannot operate at night; they need light to pass under low-
clearance bridges.
11.21 Table 11.2.2 and Table 11.2.3 show the estimated travel times for passenger and cargo by
mode, respectively. For estimating travel times via water transport, current speeds of existing
deteriorated ships were adopted, while future travel times were estimated using high-performance
ships. Based on the results, ships with high performance (such as speed boats for passenger
transport and tugs with marine engines for cargo transport) should be introduced to shorten
operating time.
Table 11.2.2 Comparison of Estimated Passenger Travel Times by Mode
Unit: Hour
Source: Study Team 1) Where there is no railway service, time was added for using bus or walking to reach the destination. Regarding water transport, time was estimated on assumed speeds plus seven minutes each to embark and disembark. During actual operation, speed limits will be followed.
Table 11.2.3 Comparison of Estimated Cargo Travel Times by Mode
Unit: Hour
Source: Study Team 1) Regarding water transport, time is estimated on assumed speeds. During actual operation, speed limits will be followed.
Downstream - Upstream Downstream - Upstream
Pansodan -Hlaingtharya
1.5 - 2.0 1.5 1.0 - 2.5 0.8 - 1.5
Pansodan -Thanlyin
1.0 - 1.5 1.00 0.8 - 1.5 0.5 - 1.0
Nyaung Tan -Dagon
1.0 - 1.5 1.50 1.2 - 3.0 1.0 - 2.0
1.0 - 1.5
1.0 - 1.5
1.25 - 1.75
Water Transport(Future)Bus Taxi Railway
Water Transport(Present)
Downstream - Upstream Downstream - Upstream
Thilawa - Hlaingthaya 2.5 - 3.0 3.1 - 6.8 2.2 - 4.5
Thilawa - Shwepyitha 2.5 - 3.0 3.7 - 8.1 2.5 - 5.4
Water Transport(Present)Truck
Water Transport(Future)
11-11

Comprehensive Study of the Urban Transport Development Program in Greater Yangon (YUTRA Update) Final Report | Chapter 11: Inland Waterway Transport
11-12
(b) Securing of Safety
11.22 Serious accidents with casualties had occurred in Myanmar such as the sinking accidents in
Sagain Region and Rakhine State. Ageing vessels and overloading of passengers or cargo are
thought as the main causes, among others as listed below.
(i) Water Depth: There is a risk of ships getting stranded during the dry season because the
water depth is not sufficient in some areas (Figure 11.2.4). In particular, the area between
Pansodan and Star City, the water level is 4 m or less during low tide. There are also even
shallower parts where the water depth is about 2 m.
Source: International Chart Series, Yangon River and Approaches 833 Edition Number: 3 Edition Date: 1st August 2013
Figure 11.2.4 Water Depth around Yangon Port
(ii) Wake Size: There is a tendency for a large ship or speed-ship to create a wake as it travels
along the river. It is necessary to secure the safety especially of small ships that are easily
influenced by the wake because the risk of capsizing is so high.
(iii) Clearance between Ship and Bridge: It is essential to ensure clearance between the ship
and a bridge for safe operation because there are many bridges in Yangon. For example,
from Nyaung Tan to Dagon, there are five bridges and enough clearance should be secured
especially during high tide.
(c) Establishment of a Management and Implementation System
(i) Clarification of Management Body and Establishment of Implementation System: The
Yangon Urban Transport Authority (YUTA), which is under the Yangon Regional
Government, has played the role of manager of inland water transport. It is working to
develop inland water transport such as selecting new routes. It is necessary though to clarify
the management body for IWT and establish an implementation system.
(ii) Development of Human Resources: It is an important to secure and train human
resources, such as captains, for safe operation especially while the problem of lack of
channel maintenance exists.
11-12

Comprehensive Study of the Urban Transport Development Program in Greater Yangon (YUTRA Update) Final Report | Chapter 11: Inland Waterway Transport
11-13
(d) Consideration of Suitable Usage Fare
11.23 Table 11.2.4 shows the estimated fares for passengers on various modes. To provide a
competitive fare for water transport, it is necessary to set it at the same level as that for existing
transport modes such as bus. Regarding the cost of cargo transport, it is difficult to set it because
the unit price changes depending on time period. Thus, cargo cost was omitted.
Table 11.2.4 Comparison of Fares by Mode
Unit: Kyat
Source: Study Team Note: The fare for water transport was estimated by averaging the unit price of existing services in Yangon (Pansodan–Dala, Wadan–Dala and Lan Thit–Kha Naung Toh). The unit rate is MMK20 /km.
3) Proposed Measures
(a) Passenger/Tourist Service
(i) Currently, the introduction of water taxis for commuters to reduce road congestion is under
consideration by the YRTA. Full operation will be implemented based on the results of the
trial operation by the Water Taxi Project.
(ii) It is thought that the number of IWT passengers decreases alongside the development of
roads, railways (subways), and so on. However, water transport is expected to shift to
servicing tourists once Yangon’s riverfront is developed, as was seen in Bangkok and Paris.
Ships and facilities will be utilized for tourists according to demand and usage situation.
(iii) Therefore, a stepwise development can be proposed.
(b) Cargo
(i) Because inland water transport is advantageous for heavy cargo and mass transport and
creates less environmental impact, it is quite effective and efficient to use inland water cargo
transport between Thilawa and Hlaingtharya or Shwe Pyi Thar. The barge used for
transporting container cargo was built during a pilot project1 (2016, JICA) and also IWT is
planning to start container cargo transport service in the near future.
(ii) Current cargo demand is not so much because the handling volume for container and bulk in
Yangon Port is very small relative to the population; however, the demand for cargo is
expected to increase significantly. The container volumes Yangon Port is expected to handle
by 2025 is estimated at about 4 million TEUs, according to “The Preparatory Survey for the
Project for Expansion of Yangon Port in Thilawa Area” (2014, JICA).
(iii) In the short term, the trial operation will start utilizing the barge built by the pilot project,
which is the plan of the IWT. Based on the results of the trial operation, full operation will
commence. 1 Verification Survey with the Private Sector for Disseminating Japanese Technologies for a Container Barge for Shallow Water on
Ayeyarwaddy River, 2016, JICA
Pansodan - Hlaingtharya 300 - 500 100 - 300
Pansodan - Thanlyin 300 - 500 100 - 300
Nyaung Tan - Dagon 300 - 500 200 - 500
Bus Taxi RailwayWater Transport
(Expected)
400
250
550
5000 - 10000
6000 - 8000
5000 - 8000
11-13

Comprehensive Study of the Urban Transport Development Program in Greater Yangon (YUTRA Update) Final Report | Chapter 11: Inland Waterway Transport
11-14
(c) Introduction of High-performance Ships
11.24 In order to ensure punctuality, a speed of about 12 to 15 knots is required for passenger
boats. Ships which will not be affected by a wake should be introduced. In addition, ships should be
selected in consideration of the shallow depths and low-clearance bridges to ensure safety. The
assumed specifications of ships are shown in the table below.
Table 11.2.5 Assumed Ship Specifications
Item Passenger/Tourism Cargo
Speed 12–15 knots/hour 10 knots/hour
Limitation of passenger or cargo 100 passengers 50 TEUs Source: Study Team
Source: Study Team
Figure 11.2.5 Water Transport in Tokyo
(d) Stepwise Operation
11.25 The stepwise operation is proposed in consideration of the usage demand in future. The ship
and facility for the tourism will be effectively utilize the ship and facility for the passenger according
to usage situation. Table 11.2.6 shows the outline of the stepwise operation and Figure 11.2.5
shows the expected implementation route and terminal of each term.
11-14

Comprehensive Study of the Urban Transport Development Program in Greater Yangon (YUTRA Update) Final Report | Chapter 11: Inland Waterway Transport
11-15
Table 11.2.6 Proposed Stepwise Operation
Passenger/Tourism Cargo
Short-Term (up to 2019)
P-1:Implement trial and start of operation as the public transport
The trial operation and regular operation will be implemented in the two routes with the high priority by Water Taxi project, which is considered by YRTA currently (The trial operation is planned to start in April, 2017).
C-1: Implement trial and start of operation of container cargo transportation
The trial transportation and regular operation of the container cargo will be implemented utilizing the barge built by the pilot project (2016, JICA) and the tug boat owned by IWT.
Mid-Term (2020-2025)
P-2: Implement of the full-fledged operation as the public transport
The full-fledged operation as the public transport (commuter usage) will be started by increasing the routes and terminals.
C-2: Implement of the full-fledged operation of container cargo transportation
The full-fledged operation of container cargo transportation will be implemented by the development of port’s facilities and equipment, the ship building in Myanmar, the increasing the size of vessel and so on.
T-1: Implement trial for the tourism usage The trial operation regarding the tourism usage of inland water transportation will be implemented in consideration of the decrease in commuting users due to the development of land transportation.
Long-Term (2026-2035)
P-3: Implement of the sustainable operation as the public transport
New route will be developed and the sustainable management system will be established in consideration of the commuter usage’s demand.
T-2: Implement of the full-fledged operation for the tourism usage
The regular operation for the tourism usage will be started along with the decreasing the number of commuter usage due to the development of the railway and road.
Source: Study Team
Source: Worked out by Study Team based on Google Earth
Figure 11.2.6 Expected Implementation Route and Terminal by Term
11-15

Comprehensive Study of the Urban Transport Development Program in Greater Yangon (YUTRA Update) Final Report | Chapter 11: Inland Waterway Transport
11-16
4) Proposed Actions
11.26 It is proposed for inland water transport development in Yangon must look into both its
function and planning direction. The possible functions of water transport include:
(i) Interurban freight transport;
(ii) Transport for daily activities;
(iii) Tourist transport; and
(iv) Interurban small freight transport.
11.27 Planning directions must consider:
(i) Improvement of existing urban water transport facilities and services;
(ii) Development of new opportunities for local water transport services;
(iii) Examples in foreign countries (Bangkok, Japan, etc.), pier to pier (in Paris), small-scale
freight transport between commercial facilities along the Seine River; and
(iv) Redevelopment of waterfront including relocation of existing port facilities (TOD of water
transport).
11-16
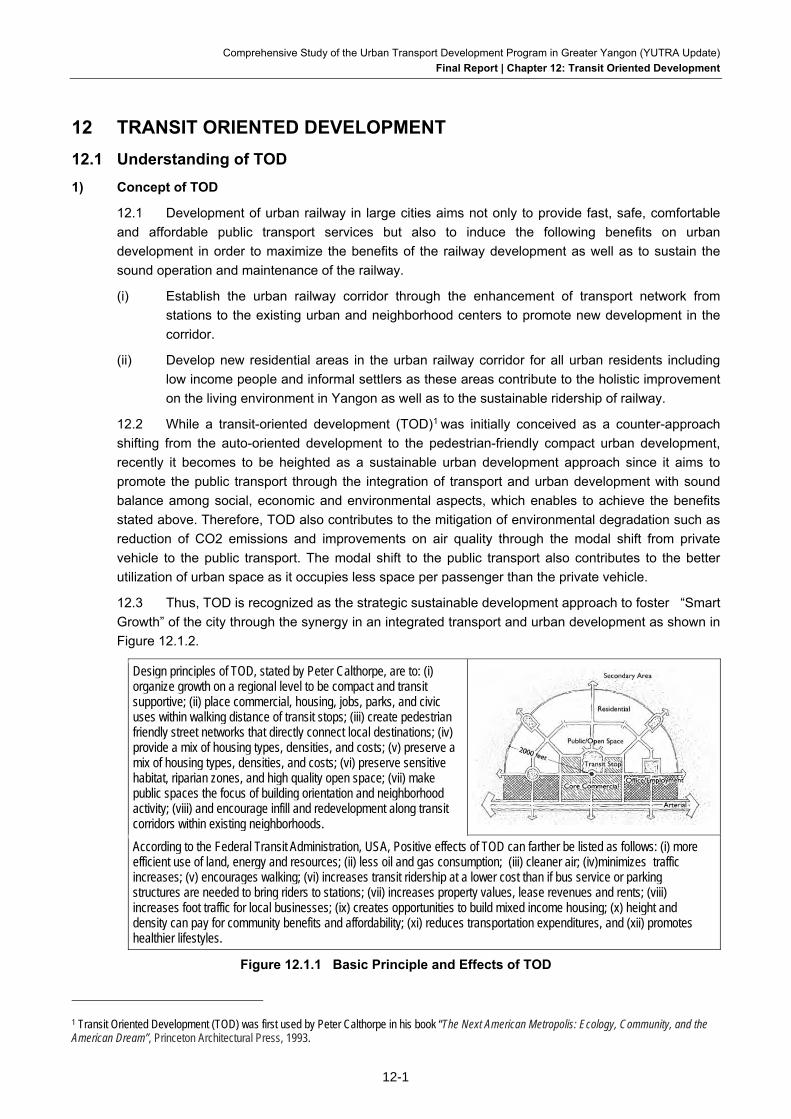
Comprehensive Study of the Urban Transport Development Program in Greater Yangon (YUTRA Update)
Final Report | Chapter 12: Transit Oriented Development
12-1
12 TRANSIT ORIENTED DEVELOPMENT
12.1 Understanding of TOD
1) Concept of TOD
12.1 Development of urban railway in large cities aims not only to provide fast, safe, comfortable
and affordable public transport services but also to induce the following benefits on urban
development in order to maximize the benefits of the railway development as well as to sustain the
sound operation and maintenance of the railway.
(i) Establish the urban railway corridor through the enhancement of transport network from
stations to the existing urban and neighborhood centers to promote new development in the
corridor.
(ii) Develop new residential areas in the urban railway corridor for all urban residents including
low income people and informal settlers as these areas contribute to the holistic improvement
on the living environment in Yangon as well as to the sustainable ridership of railway.
12.2 While a transit-oriented development (TOD)1 was initially conceived as a counter-approach
shifting from the auto-oriented development to the pedestrian-friendly compact urban development,
recently it becomes to be heighted as a sustainable urban development approach since it aims to
promote the public transport through the integration of transport and urban development with sound
balance among social, economic and environmental aspects, which enables to achieve the benefits
stated above. Therefore, TOD also contributes to the mitigation of environmental degradation such as
reduction of CO2 emissions and improvements on air quality through the modal shift from private
vehicle to the public transport. The modal shift to the public transport also contributes to the better
utilization of urban space as it occupies less space per passenger than the private vehicle.
12.3 Thus, TOD is recognized as the strategic sustainable development approach to foster “Smart
Growth” of the city through the synergy in an integrated transport and urban development as shown in
Figure 12.1.2.
Design principles of TOD, stated by Peter Calthorpe, are to: (i) organize growth on a regional level to be compact and transit supportive; (ii) place commercial, housing, jobs, parks, and civic uses within walking distance of transit stops; (iii) create pedestrian friendly street networks that directly connect local destinations; (iv) provide a mix of housing types, densities, and costs; (v) preserve a mix of housing types, densities, and costs; (vi) preserve sensitive habitat, riparian zones, and high quality open space; (vii) make public spaces the focus of building orientation and neighborhood activity; (viii) and encourage infill and redevelopment along transit corridors within existing neighborhoods.
According to the Federal Transit Administration, USA, Positive effects of TOD can farther be listed as follows: (i) more efficient use of land, energy and resources; (ii) less oil and gas consumption; (iii) cleaner air; (iv)minimizes traffic increases; (v) encourages walking; (vi) increases transit ridership at a lower cost than if bus service or parking structures are needed to bring riders to stations; (vii) increases property values, lease revenues and rents; (viii) increases foot traffic for local businesses; (ix) creates opportunities to build mixed income housing; (x) height and density can pay for community benefits and affordability; (xi) reduces transportation expenditures, and (xii) promotes healthier lifestyles.
Figure 12.1.1 Basic Principle and Effects of TOD
1 Transit Oriented Development (TOD) was first used by Peter Calthorpe in his book “The Next American Metropolis: Ecology, Community, and the American Dream”, Princeton Architectural Press, 1993.
12-1

Comprehensive Study of the Urban Transport Development Program in Greater Yangon (YUTRA Update)
Final Report | Chapter 12: Transit Oriented Development
12-2
Source: Study Team
Figure 12.1.2 TOD as a Catalyst to Integrate Transport and Urban Development
2) Key Roles of TOD
(a) Smart Urban Growth
12.4 Concept of “Smart Growth” started to be developed in the United States aiming for the
sustainable urban development and management in terms of environmental, economic and social
aspects. Major organizations such as Smart Growth America and Smart Growth Network introduce the
following 10 principles for a smart urban growth approach.
(i) Mix land uses
(ii) Take advantage of compact design
(iii) Create a range of housing opportunities and choices
(iv) Create walkable neighborhoods
(v) Foster distinctive, attractive communities with a strong sense of place
(vi) Preserve open space, farmland, natural beauty, and critical environmental areas
(vii) Direct development towards existing communities
(viii) Provide a variety of transportation choices
(ix) Make development decisions predictable, fair, and effective
(x) Encourage community and stakeholder collaboration in development decisions
12.5 All these principles are also necessary for the implementation of TOD. Therefore, in other
words, implementation of TOD promotes the smart growth of the city.
12-2

Comprehensive Study of the Urban Transport Development Program in Greater Yangon (YUTRA Update)
Final Report | Chapter 12: Transit Oriented Development
12-3
12.6 Historically in Yangon, the central urban area has been developed in an efficient and
compact manner with high population density. The population density is still quite high in Yangon CBD
areas (341 person/ha; average of 6 townships in CBD, 234 person/ha; average of 6 townships
adjacent to CBD).
12.7 However, rapid economic growth and motorization accelerates the urban sprawl through the
development in the suburban areas. As a result, population growth in suburban areas becomes
significant (e.g.135 persons/ha in Insein and Mayangone Township) enough to inhibit the population
growth in the central urban area over the last decade.
12.8 Since many developed counties failed to control the sustainable size and density of CBD by
allowing the rapid urban sprawl, Yangon should consider the revitalization of CBD as well as the
control of new urban development and redevelopment in order to avoid the precedent mistakes.
12.9 Since urban railway can connect CBD and suburban areas in an effective and sustainable
manner as shown in Figure 12.1.3, induce of the investment in the urban railway corridor through TOD
based on the principles of smart growth previously introduced becomes essential for the sustainable
city.
(b) Reorganization/ Revitalization of CBD
12.10 TOD can contribute to restructuring and improvement of CBD since it enables to reduce traffic
congestions due to the modal shift from private cars to the public transport and results in the efficient
utilization of urban spaces as previously described. TOD also contributes to the improvement of
environmental conditions such as air quality and noise. Such improvement on the living/working
environment becomes a major factor to attract business in CBD together with the convenient public
transport and pedestrian access to be established by TOD. In Yangon, CBD plays the significant roles
both in business and tourism. Therefore, holistic improvements of public transport through TOD is
essential to stimulate multiplier effects by the development of both business and tourism sectors
towards the attractive and sustainable CBD.
(c) Enhancement of Urban Development/Redevelopment of Station Areas
12.11 Establishment of urban railway corridor in a strategic manner for the solution of the potential
urban development issues shown in Figure 12.1.3 can provide ample opportunities for competitive
urban development/ redevelopment at and around urban railway stations. Since each station has
different locational characters, issues as well as the interests of communities, investors and other
concerned parties, planning and consultation for TOD should be carefully implemented among various
stakeholders based on the smart growth principles previously introduced.
(d) Enhancement of Transport Network in Urban Railway Corridor
12.12 Establishment of safe, convenient and comfort public transport network form the station is
fundamental both for the formulation of urban railway corridor as well as for the inducement of the
relevant development necessary for the revitalization of CBD and urban development/ redevelopment
to the corridor. Various elements including management should be incorporated for the establishment
of public transport network towards successful TOD.
12-3

Comprehensive Study of the Urban Transport Development Program in Greater Yangon (YUTRA Update)
Final Report | Chapter 12: Transit Oriented Development
12-4
At Station Area Scale At City Scale Source: Study Team
Figure 12.1.3 TOD Opportunities at Spatial Level
3) Key Interventions for Successful TOD
12.13 TOD aims to increase the ridership of urban railways in accordance with the increase in the
satisfaction of passengers. In order to increase the level of satisfaction, seamless public transport
transfer needs to be provided. Seamless public transport network in the urban railway corridor should
be established based on the consideration for the synergy with the relevant urban development/
redevelopment to maximize the benefits of both transport and urban development/ redevelopment to
induce the multiplier effects in terms of social, economic and environmental aspects. It should be
emphasized that an overall goal of TOD is to establish the comprehensive public transport network in
the urban railway corridor that includes compact urban areas with high mobility and accessibility as
well as optimal land use ensuring the environmental conservation and mitigation of environmental
degradation.
12.14 Main components of interventions required to implement TOD are as follows:
(i) Access Roads Development: Stations must be developed with good access roads for
pedestrians and vehicles including bicycle, motorbike, car, taxi, bus, etc. to reach and depart
to and from the stations.
(ii) Station Plaza: Stations must be developed with space at the front of stations for easy access
to and egress from the stations by walk, bicycle, motorbike, car, taxi, bus and so on. In order
to meet this requirement, adequate size of parking space and loading/unloading space
facilities must be secured. Based on the consideration for the local characteristics and needs
of the community, station plaza may also have to serve as a symbolic space for community
and other activities.
(iii) Pedestrian Access: Walking is the most important transport mode for the access to the
urban railway stations. Although the demand for pedestrian access varies by station, it
normally exceeds the half of the transport mode. Therefore, the conditions of pedestrian
Potential Issues to be solved by the development of urban railway corridor and inducement of relevant development to it
12-4

Comprehensive Study of the Urban Transport Development Program in Greater Yangon (YUTRA Update)
Final Report | Chapter 12: Transit Oriented Development
12-5
access must be improved in the most effective manner especially within walking distance from
a station (less than 500-800 meter or 10 minutes’ walk). Measures include smooth walkways
(at-grade, elevated, underground) without physical barrier and intrusion by the vehicles, as
well as with shade, trees and street furniture. Proper consideration and design for people with
disablity, children and elderly people are also necessary.
(iv) Traffic Management/ Traffc Demand Management (TDM): Vrious types of traffic mode
concentrate in the station area, especially during peak hours. In order to regulate traffic flow at
and around the stations, proper traffic management must be provided including, among others,
traffic signals both for vehicles and pedestrians, safety facilities. In addition to the current ban
on motorcycle, drastic TDM will be necessary to maximize the utilization of public transport
network including urban railways as well as to ensure the public health and safety.
(v) Feeder Services: Feeder service to the urban railway stations is fundamental to expand the
catchment areas of the urban railway. In addition to the transfer to the existing bus service at
the stations, transfer to the other types of public transport such as regional bus and water taxi
services also should be considered where it is feasible.
(vi) Integrated Urban Development: Integrated urban developments in the urban railway corridor
is essential not only for the increase in ridership but also for the smart urban growth through
various types of urban development/ redevelopment with high quality living and working
environment.
(vii) TOD Management: In order to comprehensively handle the above TOD components,
management aspect is critical. Proper organization and inter-agency coordination mechanism
including private sector and civil society must be established. Certain regulations and
institutional arrangements are also necessary for the establishment of financial scheme that
secures the budget both for planning and implementation including monitoring and evalutation.
Source: Study Team
Figure 12.1.4 Main Components of TOD
12-5

Comprehensive Study of the Urban Transport Development Program in Greater Yangon (YUTRA Update)
Final Report | Chapter 12: Transit Oriented Development
12-6
4) Intermodal Facilities
(a) Role and Functions of Intermodal Facilities
12.15 Intermodal facility is a key facility to make the main components of TOD shown in Figure
12.1.4 work in an efficient and effective manner for both urban railway users and non-users .
Seamless transfer among various public transport modes is necessary for the entire door to door
travel in order to implement the modal shift from the private vehicle to the public transport. Intermodal
facility is able to provide safe and convenient seamless transfer at the station when it is appropriately
designed for the necessary functions.
12.16 While the scale and elements of intermodal facility vary depends on the expected roles of
each station, major activities at the intermodal facility applying for all stations including the aspects
need to be considered for the appropriate design are summarized as follows;
(i) Transfer: For the establishment of sustainable urban public transport system in Yangon,
securement of safe and convenient transfer between the urban railway and other transport
modes such as bus, taxi, car, motorcycle, bicycle, etc. is necessary as previously explained.
In order to implement the seamless transfer, transfer point such as bus stop/ bus berth, drop-
off/ pick up area should be designed close to the station. In addition, pedestrian access
including pedestrian walkway and bridge, which connects all transfer points should be
provided.
(ii) Parking: Although access to the station by the private vehicle is not desirable for the stations
in the urban center, adequate parking space should be allocated for the people with certain
difficulties in the access to the station by public transport. It also helps to reduce illegal
roadside parking as well as traffic congestion and accidents associated with it. In the
suburban areas, convenient parking facilities near the station promote the commute by Park
and Ride (P&R)2 and will contribute to the increase of railway passengers and decrease the
environmental degredation accordingly.
(iii) Circulation: In the station area, both railway users and non-users generate pedestrian
circulation for various purpuses such as shopping, waiting and meeting. Thus, clear signage
and sufficient width of walkway need to be constructed to control pedestrian flow in a safe and
efficinet manner. Also, provision of urban amenities such as seating with shade, green open
spaces as well as commercial faciliteis such as kiosk, café and surpermarket are necessary
as they attract more users in the station area and result in the promotion of public transport at
the intermodal facility including urban railway.
12.17 For planning and design of facilities, following aspects need to be considered as the
fundamental design principles:
(i) Universal design: Universal design aims for the securement of health, safety and welfare for
all and therefore, it is often referred as inclusive design whereas barrier-free design focuses
on mobility/ accessibility and mainly targets elderly and people with disability. Since
intermodal facility is expected to provide safe and convenient services for all users, universal
design approach should be adopted including measures for multi-languages signage as a part
of improvement on the mobility and accessibility.
2 Park and ride (P&R) facilities are car parks with connections to public transport that allow commuters and other people headed to city centres to leave their vehicles and transfer to a bus, rail system (rapid transit, light rail, or commuter rail), or carpool for the remainder of the journey. The vehicle is stored in the car park during the day and retrieved when the owner returns. Park-and-rides are generally located in the suburbs of metropolitan areas or on the outer edges of large cities.
12-6

Comprehensive Study of the Urban Transport Development Program in Greater Yangon (YUTRA Update)
Final Report | Chapter 12: Transit Oriented Development
12-7
(ii) Seamless door-to-door transfer: Since seamless door-to-door transfer is essential for the
promotion of public transport including urban railway as previously described, convenient,
comfortable, safe, reliable, and affordable feeder service network should be established in the
urban railway corridor and reflected on the design of intermodal facility.
(iii) Walkable public space: Pedestrian friendly environment in the public space increases the
value and numbers of visitors for the adjacent facilities and result in the increase in the
revenue of them including the urban railway station. Since creation of walkable negihborhoods
is listed as one of the smart growth principles previously introduced, it should be highly
considered for the implementation of TOD.
12.18 Due to its comprehensive functions, Intermodal facilities includes both transport facilities such
as station plazas, bus stops, pedestrian bridges, access roads, car parking and motor cycle parking,
and other amenity service facilities such as open space, green space and retail shops. Among these,
the station plaza is a key facility since it is located at the center of traffic circulation and public open
space. Therefore, it plays multiple functions with the components of (i) carriage way (one-way), (ii) bus
berth and bus pool, (iii) taxi berths and taxi pool, (iv) berth for private vehicles, (v) pedestrian bridge,
(vi) pedestrians’ circulation space, and (vii) open space.
Source: Study Team Figure 12.1.5 Role and Function of Intermodal Facilities
12-7

Comprehensive Study of the Urban Transport Development Program in Greater Yangon (YUTRA Update)
Final Report | Chapter 12: Transit Oriented Development
12-8
(b) Station Plaza
12.19 A station plaza has two major spatial functions; (i) transport function and (ii) social and
environmental function. In terms of transport function, securement of safe, convenient and comfort
access to the various public transport including urban railway adjacent to the station plaza is essential.
As for social and environmental function, provision of the safe, convenient and comfort spaces for
various activities such as walking, waiting and meeting is required. Since station plaza is the key
component of intermodal facility, fundamental design principles (universal design, seamless door-to-
door transfer, walkable public space) should be applied to design of both functions.
12.20 In the planning of the station plaza, roles of each station should be clarified to identify the
necessary elements as well as the required scale of the elements. For example, the capacities of bus
berth and taxi pool are estimated based on the future railway demand and modal share. While the
station plazas at the suburban stations include relatively small pick-up/drop off area, bus stop and taxi
stand to fulfill the transport function, the ones at urban central stations require the certain size of bus
berth and stop, taxi pool and stand, pick-up/drop off to meet the transport demand. In addition, such
station plazas at major stations often require the symbolic civic space with monument, illumination,
water features etc. as a landmark to fulfil the social and environmental function.
12.21 Station plazas should be developed and managed based on the agreement between the
railway operator and the road administrator according to their jurisdiction because the station plaza
includes road facility as well as other relevant facilities. In Japan, railway companies need to reach the
agreement with the concerned governmental agencies upon their responsible areas in construction,
operation and maintenance both in terms of financial and physical aspects for the establishment of the
station plaza. In order to physically clarify the responsible areas, station plaza is recommended to be
officially designated as a transport facility with legal basis that also ensures necessary land
acquisition/ expropriation and ROW.
Source: Final Report of “Special Assistance for Project Implementation (SAPI) for Ho Chi Minh City Urban Railway Project (Ben Thanh – Suoi Tien Section (Line 1) )”, 2014, JICA
Figure 12.1.6 Basic Layout of the Station Plaza
Parking
Railway Station
Bus terminal
Commercial and business facility
Hotel
Public service facility
Access Road
Taxi Pool
Bus stop
Taxi stand (boarding)
Taxi stand (alighting)
Drop off/Pick up area
Pedestrians’ circulation space
Green space
Pedestrian bridge
Station Plaza
12-8

Comprehensive Study of the Urban Transport Development Program in Greater Yangon (YUTRA Update)
Final Report | Chapter 12: Transit Oriented Development
12-9
Station Plaza of Totsuka Station (bus rotary, taxi pool, pedestrian deck)
Station Plaza of Futako Tamagawa Station (bus rotary, taxl pool, pedestrian plaza with rooftop)
Source: Study Team
Figure 12.1.7 Station Plazas in Japan
(c) Bus and Taxi Facilities
12.22 Bus and taxi facilities are usually located in front of the station for smooth transfer of
passengers. In order to improve the transfer environment, introduction of the relevant technologies
such as bus location system (information of bus location and arrival time) is recommended in addition
to the conventional approach such as installation of roofs, shelters and benches. If there are several
bus stops in the station plaza, these bus stops (bays) should be located in parallel based on the
consideration for the pedestrian circulation. As needed, additional facilities such as pedestrian
crossing and bridges should be provided to secure the pedestrian safety.
12.23 In the central areas in the city where land availability is limited, urban railway terminal stations
are often developed with integrated bus terminals and commercial facilities through multiple stories.
For example, Nishitetsu Company, a railway and bus operator in Japan, developed a station building
with a department store. Such integrated station facility can financially support the railway operation as
it collects fee from the tenants. Also, increase in passenger can be expected due to the customers of
the commercial facility.
(d) Car Parking
12.24 Parking spaces should be planned and developed in consistency with urban planning
including land use plan as well as transportation plan to meet the demand in the long run. As
previously mentioned, access to the central area of the city by the private car is not desirable from the
perspective of promotion of public transport, various needs should be acknowledged and required
number of stalls need to be developed to avoid the illegal on-street parking. Especially for the
integrated station facility with commercial facility previously introduced, car parking facility should be
shared with commercial facility as the construction/ maintenance cost can be shared with the private
sector. At the stations in the suburban areas, P&R facilities should be developed for the convenient
and ecological commute to the city center.
12.25 In Japan, car parking and P&R facility are mostly developed by the public sector. Parking
development, operation and maintenance are stipulated by various relevant laws. Road Law defines
parking as a part of road facility and Parking Law stipulates the requirement for the parking area, on-
street parking etc. Road Transportation Law controls parking meters of on-street parking and City
Planning Law designates a parking development area and a parking in the area as a city planning
facility required to ensure smooth traffic circulation in the commercial area .
12.26 In Yangon, car parking spaces are limited, especially in CBD. Car parking should be planned
and developed efficiently and effectively including the consideration for the multi-storied and
12-9

Comprehensive Study of the Urban Transport Development Program in Greater Yangon (YUTRA Update)
Final Report | Chapter 12: Transit Oriented Development
12-10
underground parking facilities in addition to the surface car parking. In order to promote the
involvement of private sector in the development of car parking, close coordination as well as the
formulation of necessary legal framework are necessary.
Multi-story parking building, Hashimoto Station, Tokyo Semi-underground parking for bicycle, motorcycle and car
Source: Study Team based on various sources
Figure 12.1.8 Example of Car Parking
(e) Motorcycle and bicycle parking
12.27 Since motorcycle is prohibited in the central areas in Yangon, provision of the motorcycle
parking in the intermodal facility at the suburban station areas plays a similar role to P&R facility for
cars promoting convenient and ecological commute to the city center. Bicycle parking is indispensable
for all urban railway stations to implement the smooth transfer in a convenient and ecological manner.
12.28 Due to the smaller size of the parking stall comparing to the car, utilization of various spaces
such as sidewalk, under the viaduct, underground space should be considered to maximize the
utilization of limited urban spaces. Any types of parking needs to be located at the convenient place
preferably within 200m from the station. Parking should be designed in order not to interfere with the
pedestrian circulation based on the design principles including universal design previously introduced.
12.29 Existing bicycle and motorcycle parking are mostly developed by the local government, both
pay and free parking. Similar to the car parking, certain coordination and establishment of the relevant
legal framework is necessary for the involvement of private sector in the development and
maintenance of bicycle and motorcycle parking in Yangon.
Pay bicycle parking on-siewalk, Nishisinjuku, Tokyo New York Parking under viaduct of UMRT, Odakyu Line, Tokyo
Source: Study Team from various sources
Figure 12.1.9 Examples of Bicycle Parking
12-10

Comprehensive Study of the Urban Transport Development Program in Greater Yangon (YUTRA Update)
Final Report | Chapter 12: Transit Oriented Development
12-11
(f) Pedestrian Facilities and Walking Environment
(i) Pedestrian-friendly Walking Environment: While various activities such as waiting, walking,
bicycling etc. may occur in the intermodal facility, safety of pedestrians should be secured
based on the design principles including universal design as previously described. “Complete
streets” is a design approach to implement universal access for all users in a comprehensive
manner based on the consideration for transport as well as social and environmental aspects.
Such measures should be adopted for the development of intermodal facilities in Yangon.
(ii) Pedestrian Bridge/ Deck: While pedestrian bridge aims to ensure safe and comfortable
pedestrian access over the busy arterial streets, the pedestrian deck is mostly constructed
over the station plaza of big terminal stations in order to connect elevated stations and
adjacent buildings with larger space than pedestrian bridge. As shown in Figure 12.1.10, a
ring-shaped pedestrian deck over the major intersection enables pedestrians to access all
directions in a safe and efficient manner. For the implementation of this important element of
intermodal facility for the pedestrian safety and convenience, role sharing between public and
private sector for construction and management should be clarified. In Japan, it used to be
determined by the project basis due to the lack of specific rules until the guideline is prepared
by the government.
Station plaza at Mizonokuchi Station, Kawasaki City Pedestrian deck connecting commercial facility with Kawasaki Station,
Kawasaki City
Pedestrian crossing at the intersection, Shin Yokohama Station, Yokohama City
“Pearl Ring” pedestrian crossing at the intersection creating openspace, Shanghai City
Source: Study Team
Figure 12.1.10 Examples of Pedestrian Deck
12-11

Comprehensive Study of the Urban Transport Development Program in Greater Yangon (YUTRA Update)
Final Report | Chapter 12: Transit Oriented Development
12-12
12.2 Opportunities and Approach to TOD in Yangon
1) TOD Potential in Yangon
12.30 Yangon aims at developing mass-transit based sustainable city wherein the city become
competitive, livable and environment friendly. Development of extensive urban rail network comprising
both existing and new lines will provide an ample opportunity to integrate public transport and urban
development. TOD potential and opportunities for investment both by public and private sector are
enormous at and around the rail stations as well as along the rail lines due to the consolidated
government land with high potential for urban development/redevelopment as shown in Figure 12.2.1.
12.31 Yangon Circular Railway (YCR) is the only existing urban railway in the central area of
Yangon and its upgrading project is about to start through the assistance of Japanese government.
Therefore, identification of TOD opportunity along YCR based on the consideration for the future
transport network including new urban railway (Urban Mass Rapid Transit: UMRT) is necessary in
order to maximize the benefits of the upgrading project.
12.32 TOD can also be adopted for other transport modes such as airport, port and expressways, as
long as certain possibility for the integration of transport and urban development exists and the key
roles of TOD previously introduced in the previous section are incorporated. All types of TOD in
Yangon can be referred to the precedent TOD projects in Japan as well as in the neighboring
countries.
2) Opportunity for Urban Railway based TOD in Yangon
12.33 Urban railway based TOD is expected to bring about the most significant impacts on both
transport and urban development in Yangon. Mobility and accessibility will be enhanced and efficient
and effective landuse will be promoted and opportunities for value capture to fund public infrastructure
will be created.
12.34 As previously described, assessment on the characteristics and roles of each station is the
first step to identify the potential of TOD. Table 12.2.2 summarizes the evaluation of the accessibility,
land availability and potential for TOD. It also categorizes the station type since elements to be
included in the intermodal facility at the station vary according to the station type.
12.35 In general, locational character of urban railway falls into two major categories; urban or
suburban/ neighborhood. In each category, certain stations are expected to play a central rolls based
on their urban or neighborhood context. Such stations of urban or neighborhood center are the
stations with high potential for TOD; i.e. required for both transport and integrated urban development.
While passengers of urban center type station include office workers, tourists, local residents and
business owners etc., passengers of neighborhood center type station are mostly local residents.
Therefore, the facilities expected to be developed in the station area vary as shown in Table 12.2.1.
12.36 For the successful TOD, establishment of urban clusters based on the stations with high TOD
potential listed in Table 12.2.3 is desirable. In order to establish the urban cluster, utilization of the
government lands is necessary as they occupy the majority of areas in Yangon as shown in Figure
12.2.1. Such utilization allows to improve the efficiency of landuse, accessibility and mobility through
TOD to maximize the benefits of upgrading YCR. For the establishment of the urban cluster, future
transport network including UMRT also should be considered to induce the multiplier effects in the
long run.
12-12

Comprehensive Study of the Urban Transport Development Program in Greater Yangon (YUTRA Update)
Final Report | Chapter 12: Transit Oriented Development
12-13
Table 12.2.1 TOD by Station Type in Yangon
Urban Center (e.g. Yangon Central Station)
Neighborhood Center (e.g. Insein, Da Nyin Gone Station.)
Other Station (Urban or Neighborhood)
Transport Development
Station Plaza with Transfer Facility / Feeder Services
Drop-off/Pick-up Area Pedestrian Deck/Sidewalk Car Parking
Station Plaza with Transfer Facility / Feeder Services
Drop-off/Pick-up Area Pedestrian Deck/Sidewalk Park and Ride Facility (mainly
motorcycle and bicycle)
Transfer Facility / Feeder Service Drop-off/Pick-up Area Pedestrian Deck/Sidewalk
Urban Development
Regional serving retail facility (department store etc.)
Office Hotel, Service apartment High-end condominium
Community serving retail facility (supermarket etc.)
Office Mixed income housing School (nursing, vocational,
language etc.) Branch office of local
municipality (township)
Mixed income housing Local retail facility
Source: Study Team
Table 12.2.2 Summary of Existing Conditions of YCR Stations
ID Station Name Station Type
Vehicular Access
Station Plaza
Pedestrian Access
Taxi Bay1
YBS2 (No. of Lines) Land
Availability for TOD
Potential for TOD
1 Yangon Central UC A 〇 A 〇 12,36,28,29, 56 A A
2 Payar Lan U D ― C ― 11,8 C C
3 Lanmadaw U D ― C ― ― C C
4 Pyay Lan U D ― C 〇 39,21.27.35 C C
5 Shan Lan U D ― D 〇 59 C C
6 Ahlone Lan U D ― D 〇 59,22 C C
7 Panhlaing U D ― D ― 30,4,59 C C
8 Kyee Myint Daing U A ― B 〇 75.30,11,22, 41 A A
9 Hanthawaddy N B ― C ― 11,41 C C
10 Hledan N A ― B ― 30,11,22,41 C C
11 Ka Ma Yut N A ― B ― 11 C C
12 Thirimyaing N C ― B ― 11 C C
13 Oak Kyin N C ― B ― 22 C C
14 Thamine NC A/B ― B ― 11 B A
15 Thamine Myothit N C ― B 〇 22,11 C C
16 Kyaoe Gone N C ― B ― 11.22 C C
17 Insein NC C 〇 B ― 39,68, A A
18 Ywar Ma N E ― D ― 39 C C
19 Phawkan N E ― D ― ― C C
20 Aung San N E ― D ― ― C C
21 Da Nyin Gone NC C ― D ― 17.40, 21, 72, 74 A A
22 Golf Kwin N E ― D ― 17 A A
23 Kyite Ka Lae N E ― D ― 41,37,41 A A
24 Mingalardone Zay N E ― D ― ― A B
25 Mingalardone N E ― B ― 42 C C
12-13

Comprehensive Study of the Urban Transport Development Program in Greater Yangon (YUTRA Update)
Final Report | Chapter 12: Transit Oriented Development
12-14
ID Station Name Station Type
Vehicular Access
Station Plaza
Pedestrian Access
Taxi Bay1 YBS2 (No. of Lines)
Land Availability
for TOD
Potential for TOD
26 Wai Bar Gi N E ― B ― ― A A
27 Okkalapa N E ― B ― ― C C
28 Pa Ywat Sate Gone NC E ― B ― ― C C
29 Kyauk Yay Twin N E ― B ― 16,42,18,15,29,19,10 A B
30 Ta Ta Lay N E ― B ― 64,10 C C
31 Yaegu N E ― D ― ― A A
32 Parami N E ― B ― 30,6 C C
33 Kanbe N C ― A ― 38,12,29 C C
34 Baukhtaw N E ― B ― ― C C
35 Tarmwe N E ― D ― 3,7 C C
36 Myittar Nyunt N E ― B ― ― C C
37 Ma Hlwa Gone U E ― D ― ― A A
38 Pa Zun Taung U D ― D ― ― A A
1, 2: Located within 200m from the station
Classifications Station Type UC (Urban Center) Located in Central Yangon with proximity to CBD and function of urban hub U (Urban) Located in Central Yangon NC (Neighborhood Center) Located outskirts of Central Yangon with feeder services and function of transport/community hub (daily boarding
passenger >3,000 with feeder services) N (Neighborhood) Located in outskirts of Central Yangon Vehicular Access A Multiple major (and minor) access roads with direct access from both sides of the station B Multiple major (and minor) access roads above station (station under ROB) at both sides of the station C Single major direct access road at one side of the station D Single major access road above station (station under ROB) at one side of the station E Single minor access road at one side of the station Pedestrian Access A Multiple pedestrian access roads with designated sidewalk B Multiple pedestrian access roads without designated sidewalk C Single pedestrian access road with designated sidewalk D Single pedestrian access road without designated sidewalk Land Availability A Vacant land and/or area fenced off by MR (>2ha) exist in the vicinity of the station B Available land can be created by necessary urban redevelopment (e.g. improvement on the existing wet market) C No or limited land is available in the vicinity of the station TOD Potential A High potential with necessity to be implemented in short to long term B Moderate potential with possibility for the necessity of implementation in accordance with TOD at the categorized A stations C Low potential
Source: Basic Design Study on the Yangon Circular Railway Line Upgrading Project (Civil Work), Study Team
12-14

Comprehensive Study of the Urban Transport Development Program in Greater Yangon (YUTRA Update)
Final Report | Chapter 12: Transit Oriented Development
12-15
Table 12.2.3 YCR Stations with High Potential for TOD
Station Name Approx.
Available Land(ha)
Implementation Term
TOD Opportunity Needs for Improvements
on Accessibility
Yangon Central 26 Short Establishment of a gateway for CBD Consolidated government land (approx..
26ha)
Enhancement on connection with CBD
(e.g. Shuttle bus service, additional sidewalk signage etc.)
Kyee Myint Daing 10 Long
Conservation of historic station building Redevelopment of fenced off area by MR
(total: approx. 5ha) Redevelopment of informal settlement
adjacent to the station
Construction of secured sidewalk Replacement of footbridge Control on on-street parking Construction of station plaza including
sufficient space for transfer to YBS and taxi
Thamine 11 Mid
Redevelopment of existing wet market Junction point of N-S/E-W connection
(potential gateway from/to Hlaingtaryar Township)
Construction of secured sidewalk Replacement of footbridge Control on on-street parking Construction of station plaza including
sufficient space for transfer to YBS and taxi
Relocation of existing wet market
Insein 90 Mid-Long
Establishment of new sub-center Redevelopment of fenced off area by MR
(approx. 26 ha), Insein Jail (approx..36ha) and adjacent vacant land
Junction of N-S and E-W axis (potential gateway from/to Hlaingtaryar Township)
Reconstruction of station plaza including relocation of YBS stations
Construction of secured sidewalk Replacement of footbridge Utilization of underused space of
stadium for additional YBS station (along Baho road)
Da Nyin Gone 40 Short
Redevelopment of existing wet market On-going PPP development on west side of
the station Consolidated government land (approx.. 40
ha; excluding the area for PPP development)
Construction of secured sidewalk and pedestrian bridge
Construction of station plaza including sufficient space for transfer to YBS and taxi
Relocation of existing wet market
Golf Kwin 233
Short-Mid Consolidated government land mostly
vacant for New Town Development
Construction of secured sidewalk and pedestrian bridge
Construction of station plaza Kyite Ka Lae Short-Mid
Short
Wai Bar Gi 10 Long Proximity to regional bus station and airport Vacant land adjacent to the station
Establishment of feeder service route connecting to regional bus station and airport (e.g. shuttle bus service)
Construction of secured sidewalk and pedestrian bridge
Construction of station plaza
Yaegu 91 Long
Consolidated government land (approx. 75 ha)
New junction of N-S and E-W axis (potential gateway to/from South Okkalapa and Thingangyun Township)
Construction of secured sidewalk and pedestrian bridge
Construction of station plaza
Ma Hlwa Gone
136 Long
Consolidated government land (approx. 75 ha) and fenced off area by MR (approx. 61 ha)
Integration with water transport and water front development
Construction of secured sidewalk and pedestrian bridge
Construction of station plaza Enhancement on connection with
waterfront area and water transport (e.g. Shuttle bus service, sidewalk
signage etc.)
Pa Zun Taung
Source: Study Team
12-15

Comprehensive Study of the Urban Transport Development Program in Greater Yangon (YUTRA Update)
Final Report | Chapter 12: Transit Oriented Development
12-16
Source: Study Team
Figure 12.2.1 Potential Areas for Integrated Development
3) Selected Areas for Preliminary TOD Concept Planning
(a) New Town Development on the north of YCR
12.37 From the perspective of optimal value capture by the public sector through integrated
development, it is critical to commence the integrated development along urban railway by utilizing the
government land as shown in Figure 12.2.1 from the early stage prior to the escalation of land value.
Such strategic integrated development provides the solution not only for the resettlement but also
other social issues such as insufficient numbers of low income housing for the numbers of informal
settlers. Also, optimal value capture at the early stage of the urban railway development allows to
expand the areas of integrated development to induce private investment and ensure the sustainable
management of the city.
12.38 As Figure 12.2.1 illustrates, New Town Development has been proposed along north section
of YCR. The proposed area is located in Insein and Mingaradon Township and mostly vacant or
relatively small farmland. According to the township office, proposed site is owned by the government
such as army and Ministry of Industry as shown in Figure 12.2.2.
12-16

Comprehensive Study of the Urban Transport Development Program in Greater Yangon (YUTRA Update)
Final Report | Chapter 12: Transit Oriented Development
12-17
Source: Study Team
Figure 12.2.2 Proposed New Town Area along YCR
12.39 Due to the size of the area (Approximately 233 hectare), phased planning needs to be
considered. As Figure 12.2.2 illustrates, first phase should be focused on the areas around the
stations and adjacent to YCR (Zone 1, 2 and 3).
12.40 Since YCDC has not formulate the draft of zoning in this area, designation of zoning code as
well as formulation of landuse plan will be necessary to control the density of the development and
secure the sufficient open space and public facilities. Cost sharing with private sector for the
construction of necessary public infrastructure as well as consideration for social and environmental
aspects should be stipulated in zoning code and design guideline.
12.41 New town development in the government owned land includes tremendous opportunity to
integrate low-income housing. Mix of various types of residence would expand the opportunity to solve
not only the resettlement issue due to the establishment of the urban corridor along YCR but also
informal settlement becoming a significant issue in Yangon. For example, approximately 8,500 low-
income housing units (assuming 50 square meters per unit) can be accommodated in Zone 3-1 and
Zone 3-2 in accordance with the zoning code shown in Table 12.2.4.
12.42 If the units in other zones are sold at market price, these low-income housing can be sold at
affordable price (10 million Kyat; about 7,300 USD) and still certain revenue (approximate 1,273
million USD) is expected3 from Phase 1 to proceed TOD in Phase 2 (Zone 4) and other areas.
3 Under the condition that all government land is available without any land acquisition cost or cost for resettlement
500 1000m 0
Proposed New Town Area
Gov. Land
ROW (claimed by MR)
Kyite Ka Lae Station
Golf Kwin Station
ZONE 4-3
Da Nyin Gone Station
ZONE 1
ZONE 2
ZONE 3-1
ZONE 3-2
ZONE 4-1
ZONE 4-2
12-17

Comprehensive Study of the Urban Transport Development Program in Greater Yangon (YUTRA Update)
Final Report | Chapter 12: Transit Oriented Development
12-18
Table 12.2.4 Example of Site-Specific Zoning Code, Cost, and Revenue (tentative)
Phase Zone Area Land Use BCR FAR Max.
Building Height
Preliminarily
Construction
Cost
(Million USD)
Sales
Revenue
(Million USD)
Phase1
Zone 1 72ha
Residential (middle-income)
Commercial, Office
Park (Min. 6 ha in total)
Station Plaza (Min. 1ha)
School (Primary and Middle School; Min. 5ha)
Road
0.5 5.0 45m 1756 2960
Zone 2 27ha
Residential (middle-income)
Commercial, Office
Park (Min. 3 ha in total)
School (Primary and Middle School; Min. 3ha)
Road
0.5 5.0 45m 580 805
Zone 3 44ha Residential (low-income)
Commercial, Office (SOHO etc.) 0.4 2.0 20m 292 136
Phase2 Zone 4 90ha
Residential (high-income)
Commercial, Office
Park (Min. 6 ha in total)
School (Primary and Middle School; Min. 5ha)
Road
0.5 5.0 45m TBD TBD
Source: Study Team
Source: Study Team
Figure 12.2.3 Example of Land Use Plan for Zone 1 and Zone 3-1 (tentative)
School Pedestrian Deck Park Major Access Road Open Space/Minor Access Road TOD Area
Commercial-based Mixed Use (Type1:15F) Commercial-based Mixed Use (Type2:10F) Residential-based Mixed Use (Type10F) Residential-based Mixed Use (Type2: 5F Low income housing) Station Plaza
Da Nyin Gone Sta.
Golf Kwin Sta.
500m Radius
Zone 3-1
12-18

Comprehensive Study of the Urban Transport Development Program in Greater Yangon (YUTRA Update)
Final Report | Chapter 12: Transit Oriented Development
12-19
Source: Study Team
Figure 12.2.4 Example of Section of Zone 3-2 (tentative)
(b) Da Nyin Gone Station
12.43 Since land availability is the essential factor to implement TOD, strategic and practical
approach for TOD is to acquire the lands that are currently open or underused around the station and
consolidate them to increase the value of the property. Since suburban area generally has many
available lands in relatively low price, consolidation of lands for TOD includes significant potential for
the value capture.
12.44 Da Nyin Gone Station explicitly highlights this fact from both positive and negative aspects. As
Table 12.3.5 shows, currently the station has the second largest number of passengers next to
Yangon Central Station and it is expected to be more than 6 times in 2035.
Table 12.2.5 Current and Forecast of Passengers at Da Nyin Gone Station
2014 2025 2035 2035/14
5500 14900 33400 6.1
Source: Study Team
12.45 Due to the significant potential growth in the neighborhood and current land availability, the
property owned by YCDC located west side of the station has been developed by the partnership with
Dagon International Ltd. through Public-Private Partnership (PPP) as shown in Figure 12.2.6. Since
this project includes the relocation of the existing wet market and construction of the new market,
market department at YCDC is in charge. Due to the limited coordination with urban planning
department, unfortunately this project has not been planned from the point of view of TOD. As Figure
12.2.6 shows, station plaza is not included and the commercial facility and motel are proposed at the
farthest location from the station.
12.46 Currently five YBS bus routes include Da Nyin Gone Station. Considering the current number
of YBS buses as well as passengers in 2035, approximately at least 1 hectare of station plaza will be
required 4 for smooth transfer to the feeder services (bus, taxi etc.), the catchment area of the
passenger during the peak hours, as well as the rest and social interaction.
12.47 In this type of PPP, the public side should control the private sector to maximize the benefits
by the project based on the consideration for the social, economic and environmental aspects. For
example, there surely is the possibility to construct the station plaza and pedestrian deck by the public
fund if the large scale commercial facilities are allowed to be located in front of the station with the
direct access to/ from the station. Inclusion of the development of the necessary transport facility by
private fund in return for the provision of the development rights in the premier location is the popular
PPP strategy adopted in various countries.
4 According to the Japanese standard equation for station plaza area estimation (1953 Method).
10m20m 20m 20m 20m
60m 60m 30m
Roadway Roadway
Railway
Commercial/Office
Residential
10m
12-19

Comprehensive Study of the Urban Transport Development Program in Greater Yangon (YUTRA Update)
Final Report | Chapter 12: Transit Oriented Development
12-20
Figure 12.2.5 Current Construction Status (Dec. 2016; left) and Site Plan (right) for Danyingone Fruits,
Vegetables, and Flowers Wholesale Market
12.48 Currently a part of construction for this PPP project has been suspended since Chief Minister
pointed out the lack of consideration for YCR and directed to cancel the construction of several
buildings located along YCR. Therefore, it is desirable to revise the plan based on the consideration
for the TOD including east side of the station as well as New Town Development previously described.
12.49 Similar to the proposed New Town Area, zoning code should be prepared by project basis as
YCDC has not drafted the zoning code for this area yet. Through the promotion of mixed use
development by mid-rise buildings (10-15 stories), efficient land use will be implemented with relatively
low building coverage ratio (BCR) and floor area ratio (FAR). According to the example of land use
plan shown in Figure 12.2.8, approximate 9,000 household can accommodate including 1,400 low-
income housings under FAR 5.0 and BCR 0.5.
12.50 Consolidation of the property based on the coordination among various owners of the
government properties allows inclusion of not only low-income housing but also public infrastructures
such parks and pedestrian decks by private fund through PPP. Consolidation of government
properties allows to implement the large-scale integrated development by PPP, which enables to
require the development of necessary social infrastructure in return for the provision of the
development rights. Table 12.2.6 summarizes the preliminary estimate of construction cost and the
maximum revenue based on the example of land use plan shown in Figure 12.2.8.
Ex. Wet Market
Shop House
Office
Truck loading/ unloading
Wholesale
Market
Packing & Storage
Motel Commercial
Complex
Danyingone Station
Source: Dagon International Ltd. (with edit by Study Team)
12-20

Comprehensive Study of the Urban Transport Development Program in Greater Yangon (YUTRA Update)
Final Report | Chapter 12: Transit Oriented Development
12-21
Source: Study Team
Figure 12.2.6 TOD Concept Plan at Da Nyin Gone Station Area
Source: Study Team
Figure 12.2.7 Example of Land Use Plan for TOD at Da Nyin Gone Station Area
Da Nyin Gone Fruit, Vegetable & Flowers Wholesale Market (to be constructed by PPP)
Relocated Commercial Facility & Motel
500m Radius
Commercial-based Mixed Use
Residential-based Mixed Use
(Type1)
Residential-based Mixed Use
(Type2: Low income housing)
Station Plaza
Pedestrian Deck
Park
Major Access Road
Open Space/Minor Access Road
Proposed New Town Development Area
12-21

Comprehensive Study of the Urban Transport Development Program in Greater Yangon (YUTRA Update)
Final Report | Chapter 12: Transit Oriented Development
12-22
Table 12.2.6 Tentative List of Proposed TOD at Da Nyin Gone Station Area
TOD Project Area (ha)
Commercial-based Mixed Use (15F) 4.0 ha
Residential-based Mixed Use (Type 1, 10F) 7.5 ha
Residential-based Mixed Use (Type 2: Low Income Housing, 5F)) 2.5 ha
Station Plaza 0.5 ha
Park 2.2 ha
Urban Plaza 1.1 ha
Open Space 2.9 ha
Major Access Road 6.4 ha
Minor Access Road 2.9 ha
Total TOD Area 30 ha
BCR (Building Coverage Ratio) 0.47
FAR (Floor Area Ratio) 4.92
Construction Cost (Preliminary, Tentative) 593 million USD
Maximum Sales Revenue (Preliminary, Tentative) 778 million USD Source: Study Team
4) Value Capture by TOD
12.51 Timely and appropriate value capture by the relevant governmental agencies is critical for the
implementation of TOD. While private developers are good at capturing the value to maximize their
capital gain (profit generated by the increase in their property value), many governmental agencies fail
to generate the capital gain from the governmental properties as well as to tax the capital gain by the
private developers.
12.52 Potential value capture by the governmental agencies are divided into 2 types; 1. Tax-based
value capture and 2. Development-based value capture. In Yangon, valuations for property tax and
transaction tax are different. While valuation of property tax is extremely low5, valuation of transaction
tax is relatively close to the market value. However, it induces many real estate firms to sell and buy
their properties internally without official registration and causes difficulty for the government to collect
the transaction tax.
12.53 Optimization of land transaction, land price and landuse are the necessary approach to
capture the value by TOD through both taxation and urban development. While certain legal
framework and standard need to be established together with the relevant capacity enhancement to
capture the value through taxation as shown in Figure 12.2.9, development based value capture can
be implemented by the designation of TOD Planning Area and application of specific zoning code and
development permit for the TOD Planning Area. Since it will take some time to establish the legal
framework, it is more feasible to proceed the development based value capture and reflect its lesson
learnt on the establishment of the legal framework for the implementation of tax-based value capture.
5 According to the report by Renaissance Institute Myanmar (published in September 2017), average of property tax payment in Yangon is 203 MMK, which is less than the average cost of a cup of tea (350 MMK, about 0.26 USD).
12-22

Comprehensive Study of the Urban Transport Development Program in Greater Yangon (YUTRA Update)
Final Report | Chapter 12: Transit Oriented Development
12-23
Source: Land value and urban planning, Gakugei Publisher, 1983 (edited by Study Team)
Figure 12.2.8 Optimal Approach for Land Value Capture
(a) Land Readjustment
12.54 In order to increase the value of the property through optimization of land use, consolidation of
land with sufficient infrastructure such as roads and open spaces/ parks is fundamental.
12.55 Land Readjustment (LR) is an integrated urban development measure including land re-
plotting and infrastructure construction as shown in Figure 12.2.10. Cost of infrastructure development
will be covered by the sales of reserved rand secured by land replotting. LR is a well-known urban
development measure in Japan and the same or similar system is adapted in more than ten countries
such as Thailand, India, Indonesia, Germany, Turkey and Nepal. While land owners in the LR site can
maintain their property rights after the project, size of the property will be reduced due to the land
contribution for the improvement on the plotting and infrastructure. Therefore, LR should be
implemented based on the participation of the land owners and their consensus building.
12.56 Although the size of the property will be reduced, total value of the property will be increased
due to the raise in the unit price of the property.
Source: Study Team
Figure 12.2.9 Land Readjustment Scheme
Optimization of Land Price
Valuation System by Legal Std.
Development Permit by Urban Planning Law
Control on Speculative Transaction by Law
Tax on Real Estate Transaction etc.
Property Tax etc.
Tax on Urban Development etc.
Optimization of Land Transaction
Tax on Increment Value etc.
Optimization of Land Value Capture
Optimization of Land Use
Transfer of Development Rights
Land Readjustment
Infrastructure Dev. by Public Fund
Urban Redevelopment
Sales or lease of Gov. owned Land
Approach Scheme Captured Value
Tax-based Value Capture
Dev.-based Value Capture
12-23

Comprehensive Study of the Urban Transport Development Program in Greater Yangon (YUTRA Update)
Final Report | Chapter 12: Transit Oriented Development
12-24
(i) Land acquisition in advance around the station area (ii) Collective replotting (iii) Development of station and intermodal facilities
Source: Study Team
Figure 12.2.10 Collective Land Re-plotting for Development of Station and Intermodal Facilities
(b) Urban Redevelopment
12.57 Urban Redevelopment (UR) is one of the development based value capture measures based
on the land use right conversion system. This measure is used to consolidate the multiple lands with
the individual owners to single property to construct new large-scale buildings with multi-family
housing where existing owners can resettle as shown in Figure 12.2.12. Original land use right holders
secure their land use right during the project implementation period, and their land use rights will be
distributed to sectional ownerships of the new building. There is also a self-finance system to secure
reserved floor for sale to cover the construction cost.
Source: Study Team
Figure 12.2.11 Urban Redevelopment Scheme
(c) Transfer of Development Rights
12.58 Transfer of Development Rights (TDR) is an incentive scheme that allows landowners to sell
development rights of their land to a private developer or other interested party who can use these
rights to increase the density of their development. Utilization of TDR allows to recover public transport
infrastructure development cost by selling the development rights to the developer of the areas
adjacent to the public transport. It also promotes TOD through the enhancement on efficiency and
effectiveness of land use as shown in Figure 12.2.12.
Source: Study Team
Figure 12.2.12 Concept of Transfer of Development Rights
Road
BCR and building height regulated by Zoning Code
TDR to build high-rise building
Property of Right Holders
Road Property of Right Holders
Station
12-24

Comprehensive Study of the Urban Transport Development Program in Greater Yangon (YUTRA Update)
Final Report | Chapter 12: Transit Oriented Development
12-25
(d) Roadmap for Development-based Value Capture
12.59 Commencement of the integrated development along urban railway corridor from the early
stage prior to the escalation of land value by utilizing the government land is critical in order to capture
the value by the transport development,. Since the utilization of the government land is the simplest
way to implement TOD in the most financially economical manner comparing the other schemes, it is
important to start with the area mostly owned by the government.
12.60 Due to the least land acquisition cost, TOD in government property has better chance to
generate revenue. The revenue can be utilized to proceed the TOD as shown in Figure 12.2.13.
Therefore, TOD along YCR should start with the north as the land is mostly underused and owned by
the government.
Source: World Bank, Financing Transit-Oriented-Development with Land Values, edited by JICA Study Team
Figure 12.2.13 Roadmap for Development-based Value Capture
Table 12.2.7 TOD Roadmap for Establishment of Urban Railway Corridor in Yangon
Development Area (ha)
Key Methods/Scheme
Short Term
New Town Development on North of YCR (Phase1: Zone 1-3)
143 Utilization of Gov. Land
Da Nyin Gone Station Area 40 Utilization of Gov. Land, Land Readjustment, Urban Redevelopment
Yangon Central Station Area 26 Utilization of Gov. Land, Land Readjustment, Urban Redevelopment, Air Right Transfer
Mid-term
New Town Development on North of YCR (Phase2: Zone 4)
90 Utilization of Gov. Land
Insein Station Area (Phase 1) 76 Utilization of Gov. Land, Land Readjustment, Urban Redevelopment Yaegu Station Area 91 Utilization of Gov. Land, Land Readjustment, Urban Redevelopment
Thamine Station Area 11 Utilization of Gov. Land, Land Readjustment, Urban Redevelopment Redevelopment of Food Market
Phathein Station Area and New Town Development (UMRT 2)
20 Utilization of Gov. Land, Land Readjustment, Urban Redevelopment
Long-term
Kyeemyingdaing Station Area 10 Utilization of Gov. Land, Land Readjustment, Urban Redevelopment Conservation of Historic Architecture (Station Building)
Wai Bai Gi Station Area 10 Utilization of Gov. Land, Land Readjustment, Urban Redevelopment
Ma Hlwa Gone-Pa Zun Taung 196 Utilization of Gov. Land, Land Readjustment, Urban Redevelopment, Air Right Transfer
Insein Station Area (Phase 2)
70 Utilization of Gov. Land (Redevelopment of Insein Jail)
Station Area for other UMRT TBD
Source: Study Team
12-25

Comprehensive Study of the Urban Transport Development Program in Greater Yangon (YUTRA Update)
Final Report | Chapter 12: Transit Oriented Development
12-26
12.61 Value can be captured not only from the increment of the land value but also from the
contribution by developers for the necessary public infrastructure as shown in Figure 12.2.14. There
are several mechanism by which developers contribute directly to the provision of the necessary public
infrastructure, including:
(i) Development Impact Fee: A one-time fee assessed on new development to offset the cost of
infrastructure needs generated by a development
(ii) Negotiated Development Contributions: Direct provision of or payment for improvements
on the public infrastructure by a developer in conjunction with a development
(iii) Density Bonus Program: A zoning tool that allows developers to build a higher density or
height in exchange for provision of specific community benefits
12.62 Since public facilities require operation and maintenance, PPP scheme also should be
considered. Build-Operate-Transfer (BOT) agreements allow the private sector to finance, design,
build and operate investments on government land for a fixed term and commonly adopted under the
previous government. While tendering process was previously overseen by the Myanmar Investment
Commission (MIC) and President’s Office, the process under the current government remains unclear
and new BOT deals appear to have not signed as of late 2016.
12.63 Myanmar still lacks a privatisation law to regulate tenders of government land and buildings,
and many aspects of the BOT tender process are not in line with international standards. Therefore,
developers and investors have previously called for reforms to the tendering process since in many
cases little or no guidance is offered regarding the type of development required, or the zoning
regulations for the site.6
12.64 Considering the current conditions of PPP, formulation and enforcement of the detailed zoning
code and design guideline by each project basis to fill the gap of legal and institutional framework is
critical to implement the TOD roadmap in Yangon shown in Table 12.2.7.
6 Frontier Myanmar, Q4 2016 Yangon Real Estate Review, Myanmar Real Estate & Construction Monitor
12-26

Comprehensive Study of the Urban Transport Development Program in Greater Yangon (YUTRA Update)
Final Report | Chapter 12: Transit Oriented Development
12-27
5) Institutional Arrangement for TOD Implementation
12.65 In order to commence TOD at the site owned by the government, certain coordination is
required as the government properties are usually owned by various agencies. Therefore, it is
desirable to establish a TOD Committee not only to consolidate the government land but also to
designate the TOD Planning Area and formulate the necessary zoning and development code as well
as design guideline for TOD implementation in Yangon.
12.66 TOD Committee members should include the property owner(s), stakeholders of urban
development in terms of planning, construction and finance from both public and private sector as
shown in Table 12.2.8. TOD Committee is supposed to lead the discussion with the owners of freehold
land to reach the agreement for the temporal or permanent resettlement.
12.67 Since many relevant department of YCDC are involved in TOD Committee, YCDC is expected
to play a central role as an intermediary body to link government agencies and local communities. In
particular, strong initiative of YCDC will be required to consolidate the government land owned by the
various agencies as well as to formulate the site-specific land use plan and zoning code for the
implementation of TOD.
12.68 TOD Committee also should establish an operation and management system for each TOD.
Necessary organizations are supposed to be formed such as Area Management Committee based on
the participatory planning process with all relevant stakeholders from both private and public sectors.
Table 12.2.8 Major Members of TOD Committee
Ministry/ Agency Department/ Commission /Institution Current Role
Ministry and/or agency that owns the site(s) in TOD Planning Area Manage the tender of BOT
Ministry of Construction (MOC)
Department of Urban and Housing Development (DUHD)
Support local governments for implementing urban regional policies and plans.
Planning and implementation of low income housing
Department of Building Administration Construction of public project (in response to the request
with the budget from other department)
Construction and Housing Development Bank (CHDB)
Provide mortgage-type of loans and finance for the developers of low-cost and affordable housing.
Ministry of Planning and Finance
Myanmar Investment Commission (MIC)
Manage and enforce the laws relevant to investment including PPP
Evaluate economic and business proposals that require government involvement
Ministry of Development Affairs (Mayor of YCDC)
City Planning and Land Administration Department Formulate urban planning and regulatory codes for YCDC
area.
Engineering Department (Building) Formulate building code and issue construction permit in
YCDC area.
Engineering Department (Roads & Bridges) Planning and construction of roads and bridges in YCDC
area
Engineering department (Water & Sanitation) Planning and construction of water and sanitation in YCDC
area
Market Department Planning and construction market in YCDC area
Myanmar Railways Operate railways in Myanmar
Myanmar Construction Entrepreneurs Association (MCEA; private association) Planning and construction of new towns, low income
housing, industrial zones etc. through the collaboration with the government.
Owner(s) of freehold land (if any) in TOD Planning Area N/A
Source: Study Team
12-27

Comprehensive Study of the Urban Transport Development Program in Greater Yangon (YUTRA Update)
Final Report | Chapter 12: Transit Oriented Development
12-28
6) Proposed Actions
12.69 As previously described, both formulation of TOD plan including necessary land use plan,
zoning code, and design guideline as well as institutional arrangement to implement the prepared plan
are necessary to implement TOD in Yangon. Establishment of TOD Committee is the first step for the
implementation and opportunities for the private investment should be studied by the initiative of TOD
Committee. Based on the results of the study, pilot TOD can be commenced within 2 to 3 years.
Potential candidates of the pilot TOD are 1. New town development on north of YCR and 2. Da Nyin
Gone station area development shown in Table 12.2.7 as the short term projects.
12.70 As Table 12.2.9 shows, TOD project components include both planning and establishment of
institutional and legal framework. For the successful implementation of TOD, both aspects need to be
conducted simultaneously. Relevant capacity development and enhancement should also be
conducted on-the-job (OJT) training basis through the planning and establishment of institutional and
legal framework.
Table 12.2.9 Project Components of TOD in Yangon
Major Components Project Components
TOD along Urban Railway
Integrated urban/suburban development at/around the stations Access improvement especially within a walking distance from the stations Development of intermodal facilities at the stations (introduction of transfer facility,
integration with regional bus terminal etc.) New town development Integrated water transport and water front development Utilization of the underground space at subway stations Utilization of the space under viaduct
Implementation Framework Establishment of TOD Committee Establishment of operation and management system for TOD Establishment of financial schemes for TOD
Legal Framework
Formulation of relevant laws and regulations for BOT, land adjustment, urban redevelopment, air-right transfer, appropriate valuation system, development permit and control on speculative real estate transaction
Clarification on collective land ownership for BOT projects built on government land (Amendment on Condominium Law)
Source: Study Team
12-28

Comprehensive Study of the Urban Transport Development Program in Greater Yangon (YUTRA Update) Final Report | Chapter 13: Proposed Actions and Roadmap
13-1
13 PROPOSED TRANSPORT SECTOR PROJECTS
13.1 Proposed Transport Projects
1) List of Identified Projects
13.1 In order to implement the transport development strategies discussed in previous chapters
and realize the desired future transport network, the Study Team and counterpart agencies have
identified a total of 101 projects and actions under 10 subsectors and 34 categories (see Table
13.1.1). The subsectors are briefly described below, while project profiles are shown in Technical
Report Vol. 6 Project Profiles.
(a) Roads: The roads subsector is composed of 24 projects on minor improvement/maintenance,
rehabilitation, bottleneck removal, completion of missing road links, and construction of
flyovers/underpasses, secondary roads, primary roads, new bridges, and outer ring roads.
(b) Expressways: The expressways subsector is composed of 11 projects on intercity and urban
expressways.
(c) Public Transport: The public transport subsector is composed of 8 projects on bus transport
modernization and BRT development.
(d) Traffic Management and Safety: The traffic management and safety subsector is composed
of 16 projects on road vehicle management, traffic enforcement, traffic engineering, traffic
safety education, parking management, traffic control, and traffic demand management.
(e) Urban and Suburban Railway: The urban/ suburban rail subsector is composed of 12
projects on circular rail, suburban commuter rail, and new lines.
(f) Inland Water Transport: The inland water transport subsector is composed of 7 projects on
upgrading of existing services and the development of new routes.
(g) Logistics: The logistics subsector is composed of 4 projects on the upgrading of existing
facilities, relocation, and new development.
(h) Information and Communications Technology: The ICT subsector is composed of 7
projects on the expansion of ICT for the YRTA and the expansion of ICT for public transport
operators.
(i) Transit-oriented Development: The TOD subsector is composed of 4 projects on TOD on
circular rail and TOD on other lines.
(j) Institutions: The institutions subsector is composed of 8 projects on strengthening of the
YRTA, capacity building in public transport operation, ROW acquisition and resettlement, and
TOD promotion.
13-1

Comprehensive Study of the Urban Transport Development Program in Greater Yangon (YUTRA Update) Final Report | Chapter 13: Proposed Actions and Roadmap
13-2
Table 13.1.1 Preliminary List and Costs of Proposed Transport Sector Projects
Sector Category Code Project Name Cost
(million USD)
Cost to Government
(%)
Term 1), 2)
S (17-20)
M (21-25)
L (26-35)
Roads
Minor Improvement/ Maintenance R-01 Urban roads and bridges maintenance program 496 100 1 1
Rehabilitation R-02 Rehabilitation program for priority roads and bridges (Hlaw Ga Rd, Hlaing River Rd, Main Rd No.5, No.6, etc.) 243 100 1
Improvement of Intersection R-03 Program on road improvement of bottleneck intersection 32 100 1 Road Development in New Urban Area R-04 Road Development in New Urban Area 2,120 20 1 1
Bottlenecks Removal R-05 Program on Removal of Bottlenecks for Major Corridors 107 100 1
Missing Link Development R-06 1 Program to construct secondary roads in existing urban
areas 79 100 1 1 1
2 Program on road widening in urban blocks (5 packages) 356 100 1
Pedestrian Safety Facility R-07 Pedestrian bridges, pedestrian crossing signals, wide sidewalk, relocation of electric poles, etc. 238 100 1 1
Primary Roads Development R-08
1 Construction of new truck route
197 100
1 2 Wataya Br South Approach 1 3 Min Ye Kyaw Swar Rd/Yarzaa Dirit Rd 1 4 Kyi Myin Dine Br & ORR connection 1 5 Dala Br & ORR connection 1 6 Bago River Br -2 and Thanlyin Connection 1
New Bridges R-09
1 New Thaketa Bridge
1,085 100
1 2 New Bago Bridge 1 1 3 Dala Bridge 1 1 4 Wataya Bridge 1 5 Kyi Myin Dine Bridge 1 6 Bago River Bridge 2 for Bago or Monkey Point 1
Outer Ring Road R-10
1 East Section (Phase 1) 728 90 1 2 East Section (Phase 2) 1,948 90 1 1 3 South-West Section 590 90 1 1 4 North-West Section 870 90 1 1
Subtotal 9,089 80
Expressway
Intercity Expressway R-11
1 Yangon – Bago – Hanthawaddy New Airport 930 30 1 2 Yangon - Pyay 1,160 30 1 1 3 Yangon - Thilawa 1,310 45 1 1 4 Yangon – Hlegu 511 30 1 1 5 Yangon - Pathein 511 30 1
Urban Expressway R-12
1 North-South Backbone (Western Axis: Insein-CBD-Dala) 1,261 30 1 2 North-South Backbone (Eastern Axis: Mindamar-CBD) 1,333 30 1 3 Access to Yangon-Mandalay Expressway 536 45 1 4 Pazundaung Bypass 422 30 1 5 East-West Smart Tunnel (North) 819 50 1 6 East-West Smart Tunnel (South) 897 50 1
Subtotal 9,690 40
Public Transport
Bus Transport Modernization P-01
1 Bus Industry Reform/Capacity Building 3 100
1 2 Bus Route Restructuring 1 3 Bus Fleet Renewal/Maintenance 240 50 1 1 4 Bus Terminals/Facilities Improvement 20 80 1 1 5 Bus Corridor Traffic Management 20 100 1 6 Bus Transport Sector Management (YRTA) 3 100 1
BRT Development P-02 1 BRT under North - South Backbone Western ( Kannur Rd -
Bayint Naung Rd) 110 50 1 1
2 BRT under North - South Backbone Eastern (Waizayandar Rd) 110 50 1 1
Subtotal 506 54
Traffic Management and Safety
Road Vehicle Management M-01
1 Improvement of Vehicle Registration System 10 80
1 2 Development of Vehicle Inspection System 1
Traffic Enforcement M-02
1 Establishment of Institutional Framework 5 100
1 2 Capacity Building of Traffic Enforcers 1
Traffic Engineering M-03
1 Management of Traffic Control Centre
50 100
1 2 Expansion of Traffic Signals for Vehicles and Pedestrians 1 3 Improvement of Pedestrian Facilities/ Walking Environment 1 4 Provision of Signage and Lane Marking 1
Traffic Safety Education M-04
1 Preparation of Traffic Rules/Regulations 10 100
1 2 Traffic Safety Education for School Children 1 3 Traffic Safety Campaign for the Public and Communities 1
Parking Management M-05
1 Establishment of Parking Regulations and Enforcement 100 80
1 2 Development of Public Parking Facilities 1 1
Traffic Demand Management M-06
1 Introduction of Staggered Working/School Time 50 50
1 2 Expansion of Pricing (higher parking fee, fuel, vehicle tax) 1 3 Area Licensing Scheme Control (CBD) 1
Subtotal 225 80
Urban/Suburban
Rail
Circular Rail L-01
1 Upgrading of Existing Line and Services 350 80 1 2 Urgent Service Improvement 3 80 1 3 Elevation and Electrification of Circular Rail 1,100 90 1 1 4 Improvement/Development of Access Transport 100 100 1
Suburban Commuter Rail L-02
1 Yangon-Mandalay Line 1,350 80 1 1 2 Yangon-Pyay Line 780 80 1 1 3 Thilawa Branch Line 1,730 80 1 4 Outer Circular Rail Line 1,020 90 1
13-2

Comprehensive Study of the Urban Transport Development Program in Greater Yangon (YUTRA Update) Final Report | Chapter 13: Proposed Actions and Roadmap
13-3
5 Relocation of Depot / Workshop to Suburban Area and Regeneration of MR Land 540 50 1 1
New Lines L-03 1 Development of UMRT Line 1 (North-South) 3,630 90 1 1 2 Development of UMRT Line 2 (East - West) 2,250 90 1 1 3 Yangon New Airport Access 1,350 100 1
Subtotal 14,203 90
Inland Water
Transport
Upgrading of Existing Services
W-01
1 Fleet Procurement 10 0 1 2 Facilities Improvement 30 60 1
Development of New Routes W-02
1 Facilities Development 10 60 1 2 Fleet Procurement (Passenger) 18 0 1 3 Fleet Procurement (Freight) 10 0 1 4 Fleet Procurement (Tourism) 10 0 1
Improvement of Management System W-03 Strengthening Organization 3 100 1 1
Subtotal 91 30
Logistics
Upgrading of Existing Facilities F-01
1 Upgrading of Public Wholesale Markets 140 10
1 2 Upgrading of Traditional Markets 1
Relocation and New Development F-02
1 Relocation of Existing Port Function to Thilawa Port 511 60 1 1
2 Relocation of ICD and Development of New Truck Terminal along ORR 127 50 1
Subtotal 778 50
ICT
Expansion of ICT for YRTA C-01
1 Collection and Information of Traffic Data through ICT
5 100
1
2 Development of Bus Operation/Management Information system 1
3 Development of Public Transport User Information System 1
Expansion of ICT for Public Transport Operators C-02
1 Introduction of Compatible ICT System among Public Transport Operators
50 50
1
2a Provision of ICT Equipment for Public Transport Vehicles 1 2b Provision of wifi & Digital Signage at Terminals 1 3 Development of Public Transport User Information System 1
Subtotal 55 50
TOD TOD on Circular Rail T-01
1 Integrated Urban Development at/around the Stations
n.k 0
2 Development of Integrated New Town for Resettlement and those who need Affordable Housing
3 Effective Use of the Space under the Viaduct TOD on Other Lines T-02 Integrated Development with New Lines (UMRT) Subtotal - -
Institutions
Strengthening of YRTA I-01 1 Establishment of Legal and Policy Framework
15 100 1 1
2 Strengthening of Organization and Staffing 1 1 3 Capacity Building including Study Tour 1 1
Capacity Building of Public Transport Operation I-02
1 Development of Training Manuals/Guideline 3 100
1 1 2 Conduct of Training 1 1 3 Conduct of Workshops 1 1
ROW Acquisition and Resettlement and TOD Promotion
I-03 1 Introduction of “Land Readjustment and Urban Renewal
System” 1 100 1
2 Development of PPP Guideline on TOD 1 Subtotal 19 100
Source: Study Team 1) n.k: Not known
13-3

Comprehensive Study of the Urban Transport Development Program in Greater Yangon (YUTRA Update) Final Report | Chapter 13: Proposed Actions and Roadmap
13-4
2) Estimated Cost of the Projects
13.2 Based on the preliminarily estimated costs of the projects and on the assumption of a
possible participation of the private sector, the cost to the government was calculated. Although the
share of the private sector varies by type of transport project and funding scheme, it was estimated
that roughly 67% of the total cost would be shouldered by the government or about USD23.7 billion
out of the total project cost of USD 34.6 billion.
Table 13.1.2 Estimated Project Costs by Subsector
Sector Total Project (USD mill)
Cost to Government % to Total USD mill
Roads Maintenance/Minor Improvement/ Rehabilitation/ Bottlenecks Removal/ Missing Links Development
1,551 100 1,551
Flyovers/Underpass/Secondary Roads/ Primary Roads/New Bridges/Outer Ring Road
7,538 72 5,428
Expressway Intercity Expressway 4,422 34 1,523 Urban Expressway 5,268 38 2,004
Public Transportation
Bus Transport Modernization 286 57 162 BRT Development 220 50 110
Traffic Management 225 100 225 Rail Circular Rail 1,553 88 1372
Suburban Commuter Rail 5,420 79 4,276 New Urban Lines 7,230 92 6,642
Inland Waterway Transport 91 30 27 Logistics 778 49 384 ICT 55 55 30 TOD n.k n.k n.k Institutions 19 100 19
Total 34,656 67 23,707 Source: Study Team 1) n.k.=not known
13.3 The cost to the government is further classified into short, medium, and long term.
Table 13.1.3 Estimated Government Share in Project Costs by Subsector
Sector Cost to Government (USD mill) Total Project Cost
to Government (USD mill)
Short Term (2017–2020)
Middle Term (2021–2025)
Long Term (2026–2035)
Roads 1,328 3,879 1,772 6,979 Expressway 0 2,124 1,403 3,527 Public Transportation 149 123 0 272 Traffic Management 178 0 0 178 Rail 382 5,512 6,396 12,290 Inland Waterway Transport 26 2 0 27 Logistics 14 217 153 384 ICT 30 0 0 30 TOD n.k n.k n.k n.k Institutions 10 9 0 19 Total 2,117 11,865 9,725 23,707
Source: Study Team
13-4

Comprehensive Study of the Urban Transport Development Program in Greater Yangon (YUTRA Update) Final Report | Chapter 13: Proposed Actions and Roadmap
13-5
3) Estimated Budget Envelope
13.4 In order to determine the government’s capacity to fund the listed transport projects, the
budget envelope was estimated for both Yangon Region and Greater Yangon (study area) based on
the following assumptions:
(i) GRDP of Yangon Region
2016: USD17.6 billion
2035: USD75.9 billion
Assumed Growth Rate: 8% / year for 2016–2035
(ii) Share of Greater Yangon to Yangon Region
80% in terms of population
(iii) Allocation for the transport sector
Scenario 1: 6% of GRDP
Scenario 2: 3% of GRDP
13.5 The estimated budgets for Greater Yangon are USD41 billion for Scenario 1 and USD21
billion for Scenario 2.
Table 13.1.4 Estimated Budget Envelope for Yangon Region and Greater Yangon by Scenario
Item Yangon Region Greater Yangon 1)
(Study Area)
GRDP 2016 17,607 14,148 2035 2) 75,988 60,983 2017–2035 850,688 683,534
Allocation to Transport Sector (USD million)
Scenario 1: 6% of GRDP
2017–2020 (Short Term) 5,393 4,334 2021–2025 (Medium Term) 10,387 8,346 2026–2035 (Long Term) 35,261 28,332
Total 51,041 41,012
Scenario 2: 3% of GRDP
2017–2020 (Short Term) 2,697 2,167 2021–2025 (Medium Term) 5,194 4,173 2026–2035 (Long Term) 17,630 14,166
Total 25,521 20,506 Source: Study Team 1) The share of Greater Yangon was assumed to be 80% that of Yangon Region based on population. 2) Assumed average growth rates are 10% in 2016–2025 and 6.2% in 2026–2035 at 2016 prices.
13-5

Comprehensive Study of the Urban Transport Development Program in Greater Yangon (YUTRA Update) Final Report | Chapter 13: Proposed Actions and Roadmap
13-6
13.2 Funding Opportunities
1) Against Budget Envelope
13.6 The project costs were compared with the estimated budget envelope, and the results are as
follows:
(i) For the period between 2017 and 2035, the estimated budget envelope under Scenario 1 (6%
of GRDP) is more or less equal to the project cost. This implies that Greater Yangon can
afford to fund the Master Plan;
(ii) On the other hand, in the short to midterm, the budget envelope will be unable to fund the
transport projects.
(iii) Therefore, it is critical to mobilize external funding for the short to the medium term.
Source: Study Team Figure 13.2.1 Project Costs vs. Budget Envelope
2) Financing Sources
13.7 Even though the aforementioned estimations are indicative values only, it is necessary to look
into other public funding sources. Following the user pay principle, the investment capital to develop
transport infrastructure should be borne by service users. For example, the idea that railway users
should bear the investment cost of urban railway had been suggested by some analysts. However, it
is also widely understood that such a financing scheme has not worked or has never been adopted in
other countries and cities. Accordingly, different approaches may need to be considered, such as
those based on the external economy (benefits) generated by such urban rail projects. Urban rail
projects are expected to reduce traffic congestion, improve the environment (air quality, noise
reduction, etc.), and increase the value (productivity) of land along railway lines. These benefits can
be captured by increasing taxes and fares, and the collected money can be pooled into funds of
development of transport infrastructure. The financing sources applied in other cities are as follows.
Among them, fuel tax, parking fee and fare setting policy are featured.
(i) Public Transport Fare & Tolls
(ii) Parking Fee
13-6

Comprehensive Study of the Urban Transport Development Program in Greater Yangon (YUTRA Update) Final Report | Chapter 13: Proposed Actions and Roadmap
13-7
(iii) Vehicle’s Acquisition and Registration Fee
(iv) Fuel Tax
(v) Road Pricing / Area Licensing Scheme
(vi) Value Capture from TOD
(vii) Central Government Transfer
(1) Fuel Taxes
13.8 Increase in fuel taxes for private vehicle users is to shoulder congestion costs. As shown in
Figure 13.2.2, the taxation of motor fuel displays a great variability across countries. Asian countries
have lower fuel tax rates and Myanmar charges only commercial tax which is 5 % of the price.
Raising fuel tax may serve not only the purpose of revenue generation but also internalizing external
costs of road transport users.
Source: Worked out by Study Team based on StatsChat(https://www.statschat.org.nz/)
Figure 13.2.2 Petrol Prices and Taxes in OECD Countries (2014) and Yangon (2017)
13.9 The preliminary estimated budget envelope is shown in Table 13.2.1. If the fuel tax is
imposed as the same amount of the fuel price, the estimated revenue since 2016 to 2035 is 13.5
billion USD.
Table 13.2.1 Estimated Budget Envelope by Fuel Tax for Greater Yangon
2016 2035
Estimated Traffic Demand (000 vehicle - km/ Day) 1) 11,625 30,338 Fuel Consumption (000 litter/day) 1) 2,862 5,771 Fuel Price excluding Tax (Kyat / Litter) 619
Tax Revenue by Scenario
(million Kyat/day)
Conventional Rate (5 % by VAT): 31 Kyat /Litter 89 179 Scenario 1: 50 % of Fuel Price: 310 Kyat /Litter 887 1,789 Scenario 2: 100 % of Fuel Price: 620 Kyat /Litter 1,774 3,578
Revenue Envelope 2016-2035
(billion USD)
Conventional Rate (5 % by VAT): 31 Kyat /Litter 676 Scenario 1: 50 % of Fuel Price: 310 Kyat /Litter 6,755 Scenario 2: 100 % of Fuel Price: 620 Kyat /Litter 13,510
Source: Study Team 1) Traffic demand and fuel consumption by M/C, Car, Tai, and Truck are counted.
13-7

Comprehensive Study of the Urban Transport Development Program in Greater Yangon (YUTRA Update) Final Report | Chapter 13: Proposed Actions and Roadmap
13-8
(2) Parking Fees
13.10 Increase in parking fees for road vehicle users is to shoulder the cost of public spaces and
facilities. The preliminary estimated budget envelope is shown in Table 13.2.2. Under the assumed
number of users of parking facilities and fare setting, the estimated revenue since 2016 to 2035 is
11.6 billion USD, more than 30 % of transport project cost.
Table 13.2.2 Estimated Budget Envelope by Parking Fees for Greater Yangon
Trip Purpose No. of Trips by Private Car Assumed % of Car
Users Priced Parking Facilities
Fare Assumption 2016 (000) 2035 (000)
At Residence 450 1,685 25% 5,000 per day
at Destinations
To Work 126 470 30% 1,000 per hr * 8 hrs
Business 141 529 30% 1,000 per hr * 2 hrs
Private 173 649 30% 1,000 per hr * 2 hrs
Fare Revenue per day (million Kyat)
1,053 3,942 Envelope
(2016-2035) 14,300 billion Kyat ≒ 11.6 billion USD
Source: Study Team
(3) Fare/ Toll Setting Policy
13.11 Profitability is a key issue for urban rail and some transport projects. In Asia’s developing
cities, public transport fares are very cheap and cause a loss, increasing subsidy and inability to
maintain preferred service quality will be inevitable. In some Asian cities demonstrate that operational
profitability can be achieved without losing its service quality. Similarly, well-structured fare system for
urban public transport options may guarantee higher operating ratio without losing the ridership. The
fare elasticity is the key strategy for the rational price for travel.
13.12 It is difficult to change public transport fares once these are decided. “Fare setting beyond
populism” is the key to the profitability of transport development projects. Based on the results of a
willingness-to-pay survey conducted in the study, the people are willing to pay high fares for good
transport services.1 To illustrate this, the taxis in Yangon can serve as an example. Taxi fares in the
city are more than 10 times those of bus, but the number of registered taxis and patronage of the
mode has increased significantly. This phenomenon suggests that high fares for urban rail and other
transport services can still ensure high ridership and contribute to profitability.
13.13 For fares on urban railway, it should be balanced with fares on conventional modes to ensure
competition under different levels of service and operating costs. Figure 13.2.2 shows the public
transport fares in Asian mega cities with per capita GRDP. In Metro Manila, the fares on the
LRT/MRT are cheaper than those for air-conditioned bus, and rail transport is considered as the
mode for low-income groups. On the other hand, urban railway in Bangkok has high fares and
attracts high-income passengers.
1 Other survey results are shown in Technical Report Vol. 1 – Traffic Survey.
13-8

Comprehensive Study of the Urban Transport Development Program in Greater Yangon (YUTRA Update) Final Report | Chapter 13: Proposed Actions and Roadmap
13-9
Source: Worked out by Study Team based on STREAM study(Fare) and various sources (GRDP) 1) Bus fare is for air-conditioned bus; LRT in Metro Manila and BRT in Jakarta are considered as MRTs.
Figure 13.2.3 Public Transport Fare for a 10-km One-way Trip in Selected Asian Cities, 2007
3) PPP Scheme
13.14 The term public-private partnership (PPP) has been broadly applied to any innovative
involvement of the private sector in the design, construction, operation, maintenance, or financing of
transport infrastructure. The PPP framework is considered an effective instrument not only to fill up
the funding and financing gaps but also to make use of private sector’s creativity to increase
efficiency of project management and service operation.
13.15 However, the implementation of some PPP projects in other Asian countries has been
problematic and private sectors hesitate to engage. If the Governments can make initiatives to better
frame PPP contracts, avoid unnecessary transaction costs and provide some degree of capital
subsidy to make them commercially viable, private sectors can be attracted by significant PPP
investment. As mentioned above, the fare setting to ensure the profitability is a key issue.
13.16 And another most important factor of PPP in urban rail is land development right to be
granted to the private sector for generation of ancillary revenue. The experiences of other East Asian
Cities show that the performance of PPP urban railway project is sensitive to successful land value
capture to finance the development.
13.17 But if the public sector and the regulatory framework of PPP are unstable for public sectors,
overcoming private sector hesitation of significant investment for PPP will be difficult. The public
sector should enter into selective partnerships with the private sector where risk sharing is clearly
defined and allocated.
13-9

Comprehensive Study of the Urban Transport Development Program in Greater Yangon (YUTRA Update) Final Report | Chapter 13: Proposed Actions and Roadmap
13-10
13.3 Preliminary Evaluation of Projects
1) Economic Evaluation of Selected Projects
(1) Methodology and Assumption
13.18 In general, the economic benefits of transport projects consist of: (i) consumer surplus,
namely benefits for rail users, and (ii) producer surplus (increase in net profit of supplier).
(i) Consumer surplus can be classified into two, namely travel time cost (TTC) savings and
vehicular operating cost (VOC) savings. TTC saving is derived from direct and indirect
benefits.
(ii) Producer surplus may also be an outcome of a project. The two major transport service
providers are the MR (train operator) and bus operators. The shift of passengers from bus to
rail will result in a benefit to the latter, and dis-benefit to the former (bus operator). Because of
the low marginal cost of railway operation compared to bus, the benefit to the rail producer
will be higher. However, for simplicity, the two values can be assumed as equal, resulting in a
producer surplus that is zero.
13.19 Non-quantifiable benefits include environmental, social, and economic benefits, as shown in
Table 13.3.1.
Table 13.3.1 Categories of Economic Benefits
Type of Benefit Counted Not Counted
1. Consumer Surplus: TTC X
2. Consumer Surplus: VOC X
3. Producer Surplus: Incremental Passenger Revenue X
4. Enhanced Traffic Safety X
5. Reduced Air Pollution and Noise X
6. Increased Land Value X
7. Job Opportunities X Source: Study Team
13.20 The Study Team adopted the following assumptions and standardizations for the sake of
simplification and convenience of comparison:
(i) Annual Working Days: 324 days/year.
(ii) Opportunity Cost of Capital: 12%.
(iii) Project Evaluation Period: 40 years, which is equivalent to the maturity period of Japanese
ODA loans.
(iv) Project Life Period: For simplicity, the project life is deemed to be equivalent to the project
evaluation period; and therefore, no residual or terminal value was considered in the analysis.
(2) VOC and TTC
13.21 As savings in VOC and TTC were selected as the economic benefits of a project, their unit
costs were required to estimate the benefits. Unit costs were based on the estimation results in
YUTRA Study (2013) which were updated using 2016 prices, as shown in Table 13.3.2.
13.22 The unit VOC by vehicle type was estimated based on an analysis of actual performance data
collected from different transport operators and automobile dealers. The following data were used in
estimating VOC:
(i) Fuel and lubricant cost;
13-10

Comprehensive Study of the Urban Transport Development Program in Greater Yangon (YUTRA Update) Final Report | Chapter 13: Proposed Actions and Roadmap
13-11
(ii) Tire cost;
(iii) Repair cost;
(iv) Depreciation cost;
(v) Capital opportunity cost; and
(vi) Crew cost.
Table 13.3.2 VOC by Vehicle Type (Economic Price)
Speed (km/h)
M/C Car/Taxi HOV/Van MiniBus Standard
Bus Small Truck
Big Truck
5 71.2 549.5 778.2 813.6 913.1 1,032.6 1,415.5 10 42.1 316.7 459.5 537.5 593.8 751.1 977.7 20 26.9 193.7 285.9 373.8 408.9 554.5 698.3 30 21.5 149.5 217.2 302.8 331.7 451.4 563.1 40 18.6 126.4 176.9 260.9 288.4 384.4 480.1 50 17.4 112.9 159.1 237.3 264.4 343.5 435.6 60 16.8 106.7 152.9 225.5 251.1 320.7 411.2 70 16.7 104.7 152.6 223.9 248.5 316.2 408.1 80 17.4 106.1 158.2 232.2 257.1 329.7 429.0 90 18.8 110.6 166.9 249.3 275.9 359.7 469.5
Source: Study Team
Source: Study Team
Figure 13.3.1 VOC by Vehicle Type (Economic Price)
13.23 TTC is an important parameter in determining the modal split of passenger traffic and to
provide the basis for economic evaluation of a proposed project. The value of passengers’ travel time
cost was estimated by mode of transport, and the value was assumed to increase at the same growth
rate as per-capita GRDP. Unit costs were based on the estimation results in YUTRA Study (2013)
which were updated using 2016 prices, as shown in Table 13.3.3.
Table 13.3.3 Value of Time by Travel Mode
(Unit: MMK/h) Mode 2016 2025 2035
M/C 656 1,140 2,070
Car 1,615 2,802 5,100
Taxi 1,261 2,190 3,984
Bus 811 1,410 2,562
Source: Study Team
13-11

Comprehensive Study of the Urban Transport Development Program in Greater Yangon (YUTRA Update) Final Report | Chapter 13: Proposed Actions and Roadmap
13-12
(3) Evaluation Results
13.24 Results of the economic analysis for selected priority projects are summarized in the following
sections. To compare the economic viability of each project, B/C and EIRR were computed based on
the assumptions mentioned in the foregoing sections. Evaluation results reveal that most of the
projects are economically feasible, as the threshold of EIRR is 12%.
(i) Road & Expressway Project: Roads are fundamental infrastructures in urban areas. They
provide space not only for the movement of vehicles and pedestrians but also as places for
various socio-economic activities. In this chapter, only the economic benefits were consulted.
While results of the evaluation show that all key projects have higher EIRRs than the
threshold, the huge development projects showed lower EIRRs and benefit-cost (BC) ratios
because they require higher investments, and cost reduction is the key issue. On the other
hand, minor projects showed higher economic benefits. For these projects, the difficulties in
terms of land adjustment, buildings of affected parties, and institutional arrangements should
be carefully discussed.
(ii) UMRT Project: Urban rail can be a key driver and catalyst to promote integrated urban
development and achieve the desired spatial structure. The development of a high-quality
urban rail can also generate tremendous opportunities for TOD when properly designed and
can capture the value from those developments. Even the economic benefit from transport
cost were consulted, all of selected projects showed high EIRR. Among them, the
development of the YCR showed the higher EIRR. The YCR operates in existing urban areas
with very high transport demand and it will serve as the main urban transit backbone.
(iii) BRT Project: The BRT is proposed to be developed along Kanar Road–Bayint Naung Road
(under the urban expressway) and Waizayandar Road (under the IRR urban expressway).
Because the investment cost is quite low compared with urban railway development, the
project showed quite a high EIRR. Based on the network analysis done in this study, the BRT
will play a critical role in areas where the service level of the public transport is limited.
Table 13.3.4 Economic Evaluation Results of Key Projects
Category Key Projects EIRR (%)
B/C
Road& Expressway
Inner Ring Road (Eastern axis and Western axis) 17.4 2.0
Outer Ring Road
East Section 17.9 2.3
South-West Section 14.5 2.1
North Section 12.3 1.5
Bottleneck Removal Programs 38.3 7.1
Missing Link Development 24.7 2.7
Urban Railway Development Project
Yangon Circular Railway Development (Upgrade & Grade Separation) 36.1 1.7
Suburban Railway Lines 17.6 1.8
UMRT Line 1 14.3 1.2
UMRT Line 2 17.8 1.6
BRT BRT Line 1 & Line 2 22.2 1.5
Source: Study Team
13-12

Comprehensive Study of the Urban Transport Development Program in Greater Yangon (YUTRA Update) Final Report | Chapter 13: Proposed Actions and Roadmap
13-13
2) Social & Environmental Evaluation of Projects
(1) Methodology and Assumption
13.25 This section describes the results of the environmental and social evaluation done on the
proposed projects. In the master-planning stage, this process aims to forecast the adverse impacts of
the projects on their immediate environment and local communities so that mitigation measures and
monitoring plans can be prepared at the feasibility study stage.
13.26 In terms of coverage, environmental considerations include common temporary construction
effects that were assumed for qualitative evaluation. These include the following:
(i) Air pollution
(ii) Noise and vibration
(iii) Soil and groundwater
(iv) Fish, wildlife and vegetation
(v) Wetlands and floodplains
(vi) Greenhouse effect
(vii) Energy consumption
13.27 On the other hand, social considerations studied the following:
(i) Involuntary resettlement
(ii) Livelihood
(iii) Cultural sites
(iv) Landscape and visual impact
(v) Social equity in terms of traffic cost
(vi) Health and safety
(vii) Recreation areas
(viii) Institutional environment
13.28 Assessing the environmental and social impacts of the projects was conducted using easily
available information, which included existing data (e.g., official government statistics, existing
project/study findings) and rapid site surveys. Table 13.3.5 elaborates some of the selected criteria in
coming up with preliminary findings on the projects’ impacts.
Table 13.3.5 Relevant Environmental and Social Indicators for the Projects
Category Criteria Indicator A B C D E Weight
(%) Score 1 3 5 8 10
Environmental Impact
Air Pollution Pollutant emission of CO, SO2, NOx, PM
Significant Increase
Some Increase
Almost no change
Some reduction
Significant reduction
15
Noise and Vibration
Persons affected by noise and Vibration
CBD / more than 200
Suburban / more than
200 50–200 Less than 50 No influence 10
Greenhouse Effect
Emission of CO2 Significant Increase
Some Increase
Almost no change
Some reduction
Significant reduction
15
Energy Consumption
Oil, Petrol and Gas usage Significant Increase
Some Increase
Almost no change
Some reduction
Significant reduction
10
Social Impact
Social Equity Charge of traffic cost (public & private mode users)
Significant Increase
Some Increase
Almost no change
Some reduction
Significant reduction
10
Involuntary Resettlement
Persons to be relocated CBD / more
than 200
Suburban / more than
200 50–200 Less than 50 No influence 40
Source: Study Team
13-13

Comprehensive Study of the Urban Transport Development Program in Greater Yangon (YUTRA Update) Final Report | Chapter 13: Proposed Actions and Roadmap
13-14
(2) Evaluation Results
13.29 The preliminary results of the environmental evaluation are summarized in Table 13.3.6. The
main findings are as follows:
(i) Projects with high social / environmental impact are those in the road, expressway, logistics,
and TOD subsectors;
(ii) Road and expressway projects will generate environmental impacts. There is a risk of
promoting motorization because of road expansion, as is often pointed out by road
development skeptics. Practically, traffic demand in a project area will increase and residents
living along the roads will be affected. Some projects which will involve resettlement will require
careful discussion with various stakeholders.
(iii) Logistics and TOD projects will also bring about social impacts, i.e., involuntary resettlement. In
other Asian countries, this has been the most critical bottleneck in infrastructure projects. To
avoid conflict among stakeholders and project delay, an institutional framework for the urban
planning sector should be prepared in the early stages of project development.
Table 13.3.6 Preliminary Results of Environmental Impact Evaluation
Sector Category
Remark Project Environmental Social
Scor
e
Cla
ss
Environmental Social Code Project Name
Air
pollu
tion
Noi
se a
nd
vibr
atio
n
Emis
sion
of
CO
2
Ener
gy
Con
sum
ptio
n
Traf
fic c
ost
Res
ettle
men
t
Roads
Minor Improvement/ Maintenance
Some environmental impact can result from increasing traffic.
Traffic cost can be reduced due to mitigation of congestion. Resettlement is not necessary.
R-01 Urban roads and bridges maintenance program B B B B D E 6.3 D
Rehabilitation R-02
Rehabilitation program for priority roads and bridges (Hlaw Ga Rd, Hlaing River Rd, Main Rd No.5, No.6, etc.)
B B B B D E 6.3 D
Bottlenecks Removal
Mitigated congestion improved environmental impact.
Reduce traffic cost. No resettlement. R-03 Program on road improvement
of bottlenecks D D D D D E 8.8 E
Road Development in New Urban Area
Some environmental impact can result from increasing traffic.
Traffic cost can be reduced due to mitigation of congestion. Some resettlement will be necessary for new road construction.
R-04 Road Development in New Urban Area B B B B D B 3.5 B
Bottlenecks Removal
Mitigated congestion improved environmental impact.
Reduce traffic cost. No resettlement. R-05 Program on Removal of
Bottlenecks for Major Corridors D D D D D E 8.8 E
Missing Link Development
Increase traffic will have some impact on air quality; traffic noise will be increase in urban area.
Improved accessibility improved traffic cost. Land acquisition for road development.
R-06
1 Program to construct secondary roads in existing urban areas B A D D D B 4.6 B
2 Program on road widening in urban blocks (5 packages) B A D D D B 4.6 B
Pedestrian Safety Facility
Pedestrian facility has no environmental impact. No social impact. R-07
Pedestrian bridges, pedestrian crossing signals, wide sidewalk, relocation of electric poles, etc.
C E C C C E 7.5 D
Primary Roads Development
Improved accessibility can have positive environmental impact but traffic noise can be increased.
Improved accessibility will reduce traffic cost. Some resettlement will be necessary for ROW.
R-08
1 Construction of new truck route D B D D D B 5.5 C 2 Wataya Br South Approach D B D D D B 5.5 C
3 Min Ye Kyaw Swar Rd/Yarzaa Dirit Rd D B D D D B 5.5 C
4 Kyi Myin Dine Br & ORR connection D B D D D B 5.5 C
5 Dala Br & ORR connection D B D D D B 5.5 C
6 Bago River Br -2 and Thanlyin Connection D B D D D B 5.5 C
New Bridges
Improved accessibility can have positive environmental impact but traffic noise can be increased.
Improved accessibility will reduce traffic cost. Some resettlement will be necessary for ROW.
R-09
1 New Thaketa Bridge D B D D D B 5.5 C 2 New Bago Bridge D B D D D B 5.5 C 3 Dala Bridge D B D D D A 4.7 B 4 Wataya Bridge D B D D D B 5.5 C 5 Kyi Myin Dine Bridge D B D D D B 5.5 C
6 Bago River Bridge 2 for Bago or Monkey Point D B D D D B 5.5 C
Outer Ring Road
Improved accessibility can have positive environmental impact but traffic noise can be increased.
Improved accessibility will reduce traffic cost. .Less resettlement.
R-10
1 East Section (Phase 1) D B D D D D 7.5 D 2 East Section (Phase 2) D B D D D D 7.5 D 3 South-West Section D B D D D D 7.5 D
4 North-West Section D B D D D D 7.5 D
Expressway Intercity Expressway Some environmental
impact.
Improved traffic flow can reduce traffic cost. Less resettlement.
R-11
1 Yangon – Bago – Hanthawaddy New Airport B B B B D D 5.5 C
2 Yangon - Pyay B B B B D D 5.5 C
13-14
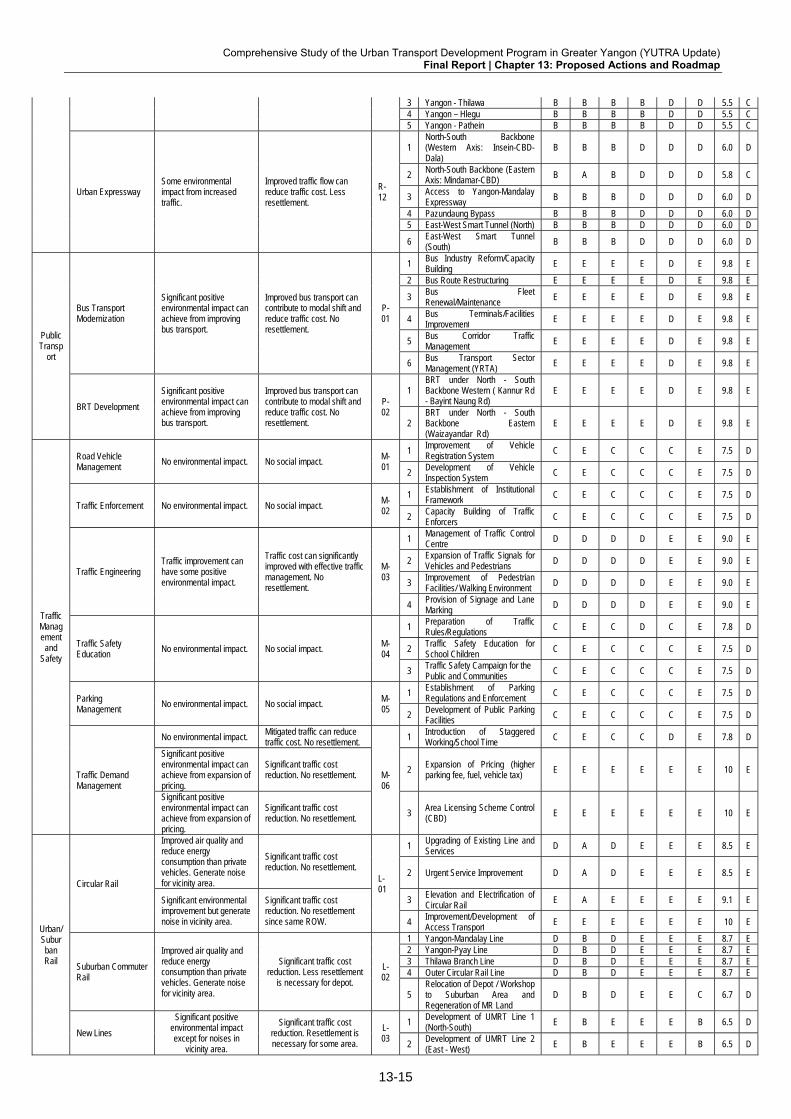
Comprehensive Study of the Urban Transport Development Program in Greater Yangon (YUTRA Update) Final Report | Chapter 13: Proposed Actions and Roadmap
13-15
3 Yangon - Thilawa B B B B D D 5.5 C 4 Yangon – Hlegu B B B B D D 5.5 C 5 Yangon - Pathein B B B B D D 5.5 C
Urban Expressway Some environmental impact from increased traffic.
Improved traffic flow can reduce traffic cost. Less resettlement.
R-12
1 North-South Backbone (Western Axis: Insein-CBD-Dala)
B B B D D D 6.0 D
2 North-South Backbone (Eastern Axis: Mindamar-CBD) B A B D D D 5.8 C
3 Access to Yangon-Mandalay Expressway B B B D D D 6.0 D
4 Pazundaung Bypass B B B D D D 6.0 D 5 East-West Smart Tunnel (North) B B B D D D 6.0 D
6 East-West Smart Tunnel (South) B B B D D D 6.0 D
Public Transp
ort
Bus Transport Modernization
Significant positive environmental impact can achieve from improving bus transport.
Improved bus transport can contribute to modal shift and reduce traffic cost. No resettlement.
P-01
1 Bus Industry Reform/Capacity Building E E E E D E 9.8 E
2 Bus Route Restructuring E E E E D E 9.8 E
3 Bus Fleet Renewal/Maintenance E E E E D E 9.8 E
4 Bus Terminals/Facilities Improvement E E E E D E 9.8 E
5 Bus Corridor Traffic Management E E E E D E 9.8 E
6 Bus Transport Sector Management (YRTA) E E E E D E 9.8 E
BRT Development
Significant positive environmental impact can achieve from improving bus transport.
Improved bus transport can contribute to modal shift and reduce traffic cost. No resettlement.
P-02
1 BRT under North - South Backbone Western ( Kannur Rd - Bayint Naung Rd)
E E E E D E 9.8 E
2 BRT under North - South Backbone Eastern (Waizayandar Rd)
E E E E D E 9.8 E
Traffic Management and
Safety
Road Vehicle Management No environmental impact. No social impact. M-
01
1 Improvement of Vehicle Registration System C E C C C E 7.5 D
2 Development of Vehicle Inspection System C E C C C E 7.5 D
Traffic Enforcement No environmental impact. No social impact. M-02
1 Establishment of Institutional Framework C E C C C E 7.5 D
2 Capacity Building of Traffic Enforcers C E C C C E 7.5 D
Traffic Engineering Traffic improvement can have some positive environmental impact.
Traffic cost can significantly improved with effective traffic management. No resettlement.
M-03
1 Management of Traffic Control Centre D D D D E E 9.0 E
2 Expansion of Traffic Signals for Vehicles and Pedestrians D D D D E E 9.0 E
3 Improvement of Pedestrian Facilities/ Walking Environment D D D D E E 9.0 E
4 Provision of Signage and Lane Marking D D D D E E 9.0 E
Traffic Safety Education No environmental impact. No social impact. M-
04
1 Preparation of Traffic Rules/Regulations C E C D C E 7.8 D
2 Traffic Safety Education for School Children C E C C C E 7.5 D
3 Traffic Safety Campaign for the Public and Communities C E C C C E 7.5 D
Parking Management No environmental impact. No social impact. M-
05
1 Establishment of Parking Regulations and Enforcement C E C C C E 7.5 D
2 Development of Public Parking Facilities C E C C C E 7.5 D
Traffic Demand Management
No environmental impact. Mitigated traffic can reduce traffic cost. No resettlement.
M-06
1 Introduction of Staggered Working/School Time C E C C D E 7.8 D
Significant positive environmental impact can achieve from expansion of pricing.
Significant traffic cost reduction. No resettlement. 2 Expansion of Pricing (higher
parking fee, fuel, vehicle tax) E E E E E E 10 E
Significant positive environmental impact can achieve from expansion of pricing.
Significant traffic cost reduction. No resettlement. 3 Area Licensing Scheme Control
(CBD) E E E E E E 10 E
Urban/Suburban Rail
Circular Rail
Improved air quality and reduce energy consumption than private vehicles. Generate noise for vicinity area.
Significant traffic cost reduction. No resettlement.
L-01
1 Upgrading of Existing Line and Services D A D E E E 8.5 E
2 Urgent Service Improvement D A D E E E 8.5 E
Significant environmental improvement but generate noise in vicinity area.
Significant traffic cost reduction. No resettlement since same ROW.
3 Elevation and Electrification of Circular Rail E A E E E E 9.1 E
4 Improvement/Development of Access Transport E E E E E E 10 E
Suburban Commuter Rail
Improved air quality and reduce energy consumption than private vehicles. Generate noise for vicinity area.
Significant traffic cost reduction. Less resettlement
is necessary for depot.
L-02
1 Yangon-Mandalay Line D B D E E E 8.7 E 2 Yangon-Pyay Line D B D E E E 8.7 E 3 Thilawa Branch Line D B D E E E 8.7 E 4 Outer Circular Rail Line D B D E E E 8.7 E
5 Relocation of Depot / Workshop to Suburban Area and Regeneration of MR Land
D B D E E C 6.7 D
New Lines
Significant positive environmental impact except for noises in
vicinity area.
Significant traffic cost reduction. Resettlement is necessary for some area.
L-03
1 Development of UMRT Line 1 (North-South) E B E E E B 6.5 D
2 Development of UMRT Line 2 (East - West) E B E E E B 6.5 D
13-15

Comprehensive Study of the Urban Transport Development Program in Greater Yangon (YUTRA Update) Final Report | Chapter 13: Proposed Actions and Roadmap
13-16
Some environmental impact. Some resettlement for ROW. 3 Yangon New Airport Access B B B B B B 3.0 B
Inland Water Transp
ort
Upgrading of Existing Services
Improved water transport will contribute to modal shift and have some positive impact on environment.
Reduced traffic cost and no resettlement.
W-01
1 Fleet Procurement D E D D E E 9.2 E
2 Facilities Improvement D E D D E E 9.2 E
Development of New Routes
Improved water transport will contribute to modal
shift and have some positive impact on
environment.
Reduced traffic cost and no resettlement.
W-02
1 Facilities Development D E D D E E 9.2 E 2 Fleet Procurement (Passenger) D E D D E E 9.2 E 3 Fleet Procurement (Freight) D E D D E E 9.2 E 4 Fleet Procurement (Tourism) D E D D E E 9.2 E
Improvement of Management System
W-03 Strengthening Organization C E C C D E 7.8 D
Logistics
Upgrading of Existing Facilities No environmental impact. Resettlement will be
necessary. F-01
1 Upgrading of Public Wholesale Markets C E C C C B 4.7 B
2 Upgrading of Traditional Markets C E C C C B 4.7 B
Relocation and New Development
Increased route length will have some impact on environmental impact.
Less resettlement and increase traffic cost.
F-02
1 Relocation of Existing Port Function to Thilawa Port B E B B B B 3.7 B
2 Relocation of ICD and Development of New Truck Terminal along ORR
B E B B B B 3.7 B
ICT
Expansion of ICT for YRTA
ICT can contribute to mitigation of traffic congestion and can significantly improve
environmental impact.
Reduce traffic cost and no resettlement.
C-01
1 Collection and Information of Traffic Data through ICT C E D D D E 8.6 E
2 Development of Bus Operation/Management Information system
D E D D D E 9.0 E
3 Development of Public Transport User Information System
E E E D D E 9.6 E
Expansion of ICT for Public Transport Operators
ICT can contribute to mitigation of traffic congestion and can significantly improve
environmental impact.
Reduce traffic cost and no resettlement.
C-02
1 Introduction of Compatible ICT System among Public Transport Operators
D E D D D E 9.0 E
2a
Provision of ICT Equipment for Public Transport Vehicles D E D C D E 8.7 E
2b
Provision of wifi & Digital Signage at Terminals D E D C D E 8.7 E
3 Development of Public Transport User Information System
D E D D D E 9.0 E
TOD
TOD on Circular Rail TOD contribute to modal shift and have positive impact on environment.
Traffic cost can reduce significantly and resettlement
is necessary.
T-01
1 Integrated Urban Development at/around the Stations D A D D E A 4.7 B
2
Development of Integrated New Town for Resettlement and those who need Affordable Housing
D B D D E A 4.9 B
3 Effective Use of the Space under the Viaduct D E D D E A 5.6 C
TOD on Other Lines TOD contribute to modal shift and have positive impact on environment.
Traffic cost can reduce significantly and resettlement
is necessary. T-02 Development of Underground
Space at Metro Stations D E D D E B 6.4 D
Institutions
Strengthening of YRTA
Improved public transport will contribute to modal shift and result positive environmental impacts.
Significant traffic cost reduction. No resettlement. I-01
1 Establishment of Legal and Policy Framework D E D D E E 9.2 E
2 Strengthening of Organization and Staffing D E D D E E 9.2 E
3 Capacity Building including Study Tour D E D D E E 9.2 E
Capacity Building of Public Transport Operation
Improved public transport will contribute to modal shift and result positive environmental impacts.
Significant traffic cost reduction. No resettlement. I-02
1 Development of Training Manuals/Guideline D E D D E E 9.2 E
2 Conduct of Training D E D D E E 9.2 E 3 Conduct of Workshops D E D D E E 9.2 E
ROW Acquisition and Resettlement and TOD Promotion
No environmental impact. Resettlement or land
acquisition will be necessary for land readjustment.
I-03 1
Introduction of “Land Readjustment and Urban Renewal System”
E E E E E E 10 E
2 Development of PPP Guideline on TOD E E E E E E 10 E
Source: Study Team 1) A=Less than 3, B=3 to 5, C=5 to 6, D=6 to 8, E=More than 8. A low score (i.e., A and B) means the project has high positive or negative impact, while a high score (i.e., D and E) means low impact.
13-16

Comprehensive Study of the Urban Transport Development Program in Greater Yangon (YUTRA Update) Final Report | Chapter 13: Proposed Actions and Roadmap
13-17
13.30 For particular project categories, specific environmental / social impacts should be considered
and discussed. Some examples are as follows:
(a) Surface Settlement (for Roads and Urban/Suburban Rail): This applies particularly to the
construction of roads and railway with underground structures, because underground work may
cause a deformation of the sills and rocks around excavation areas. Such deformation may in
turn trigger sudden collapses, subsidence, and sinking which can damage both the work under
construction and nearby structures, particularly when the work is under developed areas.
Therefore, the following three elements should be carefully taken into consideration before
construction start:
Excavation techniques;
Dimension and geometry of the excavation; and
Type of excavated materials.
(b) Interaction with Surface Water and Groundwater (for Roads, Urban/Suburban Rail
Projects with Underground Structure and Bridge): This applies particularly to the
construction of roads and railway with underground structures and bridges, because excavating
tunnels induce draining, leading to a more or less drawdown of the groundwater table. The
impacts will be undesirable, such as drying up of springs and/or wells and changes in
groundwater, in the flow and quality of thermal waters, and in the hydrogeological balance in the
water basin. These phenomena can persist even after the tunnel has been constructed,
especially if the final alignment is not completely waterproof.
(c) Urban Generation (for Urban/Suburban Rail and Public Transport): Public transport projects
can enhance urban generation in the catchment areas of the modes. Sustainable public
transport can provide better access to housing areas and other urban services, more
transportation options, and lower transportation costs, thereby mitigating the environment
impacts.
13-17

Comprehensive Study of the Urban Transport Development Program in Greater Yangon (YUTRA Update) Final Report | Chapter 13: Proposed Actions and Roadmap
13-18
13.4 Findings on the Projects and Importance of Implementing Organization
1) Findings on the Proposed Projects
(i) Funding: In this study, more than a hundred projects in various sectors are proposed and the
total project cost was estimated to be USD33 billion. Based on the preliminary assessment by
the Study Team, Greater Yangon can afford to fund the Master Plan, but the mobilization of
external funding for the short to the medium term would be necessary.
(ii) Economic Evaluation: The selected projects showed high EIRRs in terms of construction and
O&M costs and benefit of VOC & TTC savings. However, their implementation is fraught with a
lot of uncertainties. Discussions regarding land adjustment, buildings to be affected, and
complex institutional arrangements should start at the early stages of development.
(iii) Impacts: The social and environmental evaluation of the proposed projects shows that of the
many social and environmental impacts, resettlement is the most critical. To avoid conflict
among stakeholders and project delays, the institutional framework for the urban planning
sector should be prepared at the early stages of development.
2) Importance of Institutional Coordination
13.31 As the key considerations in a comprehensive approach to transport planning and
development among the sectors have been pointed out, Table 13.4.1 shows the assumed
implementation bodies of the proposed projects by category. Transport development projects/ actions
involve various agencies and organizations at national and local levels, including the private sector
and communities. Especially for road development, the YCDC, MOC, YRG, and private developers
have to work together. Coordination among implementation bodies is necessary for smooth
implementation of the projects.
Table 13.4.1 Implementation Organization by Project Category
Sector Category Implementing Agency Sector Category Implementing Agency
Roads
Minor Improvement/ Maintenance MOC, YCDC, YRG Urban/Suburban Rail
Circular Rail MOTC/MR/YRTA Rehabilitation MOC, YCDC, YRG Suburban Commuter Rail MOTC/MR/YRTA Bottlenecks Removal YCDC New Lines not decided yet Road Development in New Urban Area YCDC, Developer Inland
Water Transport
Upgrading of Existing Services YRTA, Private Company Missing Link Development YCDC/ MOC Development of New Routes YRTA, Private Company Pedestrian Safety Facility YCDC Improvement of Management System YRTA, Private Company Primary Roads Development MOC Logistics
Upgrading of Existing Facilities YCDC
New Bridges MOC Relocation and New Development MOT Outer Ring Road MOC
ICT
Expansion of ICT for YRTA YRTA
Expressway
Intercity Expressway MOC Expansion of ICT for Public Transport Operators
YRTA
Urban Expressway MOC / YCDC TOD
TOD on Circular Rail n.k Public Transport
Bus Transport Modernization YRTA TOD on Other Lines n.k BRT Development YRTA
Institutions
Strengthening of YRTA YRTA Traffic Management and Safety
Road Vehicle Management Road Transport Administration, MOC
Capacity Building of Public Transport Operation
YRTA
Traffic Enforcement Road Transport Administration, MOC
ROW Acquisition and Resettlement and TOD Promotion
MOC, MOTC, MR, YCDC , etc.
Traffic Engineering YRTA/YCDC Source: Classified by Study Team
Traffic Safety Education Traffic Police / MOTC/ YRTA
Parking Management YRTA/YCDC Traffic Demand Management YRTA
Source: Study Team
13-18

Comprehensive Study of the Urban Transport Development Program in Greater Yangon (YUTRA Update) Final Report | Chapter 13: Proposed Actions and Roadmap
13-19
3) Proposed Directions of Policy / Institutional Framework
13.32 To achieve the development goals with limited resources, it is more important to implement
integrated, coordinated, and phased actions. And the role of the YRTA is essential to integrate and
coordinate the actions of all implementation bodies for a smooth traffic environment in Yangon
Region.
13.33 In many urban areas elsewhere, transport authorities are seen as organizations that act for
public interest with the primary responsibility for a well-functioning and integrated transport system
within their respective jurisdictions. As such, they take the responsibility for the planning, organizing,
and financing public transport services.
13.34 As many projects/actions in large, urban areas are interrelated, a sectoral approach or
piecemeal solutions are not sustainable. Integration and coordination between transport and urban
development is important and requires the YRTA to act as an effective instrument for planning,
managing, and regulating the region’s multimodal transport systems.
13.35 As well as implementing infrastructure development projects, preparing an overall policy/
institutional framework is necessary, and the YRTA must function as the lead here, supported by
other stakeholders. To enhance the implementation of the proposed projects under such an
institutional framework, they should be packaged as short-term, strategic programs that the
government has to lead (see Chapter 14).
13-19

Comprehensive Study of the Urban Transport Development Program in Greater Yangon (YUTRA Update) Final Report | Chapter 14: Conclusion and Recommendations
14-1
14 CONCLUSION AND RECOMMENDATIONS
14.1 Conclusion
14.1 Yangon has been growing rapidly and will continue to grow further long into the future. Urban
populations will increase both due to natural growth and migration from other places in the country
for employment, higher education, new business ventures, and other opportunities. People’s income
will increase and lifestyles will continue to change as the economy grows and the market
strengthens its international linkages. By 2035, it was estimated that Yangon would have already
grown to become a city with a population of more than 7 million. It is even expected to grow further
thereafter, transforming it into a significant city-region or a mega city with a population of 10 million.
14.2 At the same time, urban transport in Yangon has rapidly worsened. Congestion takes place
on many sections along major roads and in many areas of the city center throughout the day, but
especially during morning and afternoon peak hours, although measures to improve bus services
and signalize major intersections have somewhat eased the situation.
14.3 It was estimated that in 2016 the total transport cost, comprising vehicle operating cost and
passenger time cost, of both private and public transport amounted to MMK24.3 billion (USD19.7
million) each day. It was also estimated that if no significant transport infrastructure is developed,
this figure would increase to MMK170.2 billion (USD137.9 million) by 2035, by which time the entire
network would be in a gridlock.
14.4 In order to meet the large transport demand while promoting the planned spatial structure,
investments in transport infrastructure and services must expand and accelerate. However, it should
be noted that urban transport is an integrated system, comprising various types of infrastructure
(such as roads, rail, and waterway transport), passenger and goods services, and their management.
While the transport network in the proposed urban transport master plan only shows road and rail
infrastructure, operating and managing available infrastructure are equally important. Hence, the
main components of the proposed master plan are as follows:
(i) Urban Roads: Comprising (i) maintenance/ minor improvement, (ii) rehabilitation, (iii) removal
of bottlenecks, (iv) removal of missing links, (v) flyover and underpass construction, (vi)
development of secondary road packages, (vii) improvement of walking environment, (viii)
development of primary roads, (ix) construction of bridges, and (x) development of an outer
ring road.
(ii) Expressways: Covering both suburban expressways (partially elevated toll road) and urban
expressways (elevated toll road) as an integrated network.
(iii) Public Transport: Comprising (i) bus transport modernization, including bus industry reform,
bus operator capacity building, bus route rationalization, bus fleet renewal / maintenance, bus
terminals / facilities improvement, bus corridor traffic management, bus transport sector
management by the YRTA; and (ii) BRT development.
(iv) Traffic Management and Safety: Comprising (i) road vehicle management (registration,
inspection); (ii) traffic enforcement, (iii) traffic engineering including management of a traffic
control center and improvement of intersections; (iv) traffic safety including accident database,
enforcement, education, and post-accident measures; (v) parking management, (vi) control of
vehicle traffic, boarding / alighting of bus passengers, and illegal parking; (vi) traffic demand
management, including staggered working/ school time and road / area pricing.
(v) Urban / Suburban Rails: Comprising (i) upgrading and grade separation of circular rail; (ii)
improvement of suburban commuter lines, including the Yangon–Mandalay Line, Yangon–
Pyay Line, Thilawa branch, and other branch lines to universities; (iii) development of new
14-1

Comprehensive Study of the Urban Transport Development Program in Greater Yangon (YUTRA Update) Final Report | Chapter 14: Conclusion and Recommendations
14-2
lines, i.e., Line 1 (north–south metro line), Line 2 (east–west metro line), and Line 3 (east–
west metro line).
(vi) Inland Water Transport: Comprising (i) upgrading of existing facilities / services and (ii)
development of new routes.
(vii) Logistics Facilities: Comprising (i) upgrading of existing facilities, such as wholesale and
traditional markets; (ii) transfer of existing port’s function to Thilawa; and (iii) relocation of ICD;
and development of new truck terminal along the outer ring road.
(viii) Information and Communication Technology (ICT): Comprising (i) expansion of ICT for
urban transport management, (ii) expansion of ICT for public transport operators and users.
(ix) TOD: Comprising (i) development of intermodal / access facilities and TOD at/ around stations
of the circular rail and other rail lines, (ii) integration of the circular rail with the development of
new towns to serve families to be resettled and provide affordable housing; (iii) development
of publicly owned lands integrated with urban rail, (iv) establishment of an institutional
framework for TOD based on private sector participation.
(x) Institutions: Comprising (i) strengthening of the YRTA, including the establishment of legal
and policy frameworks on urban transport, strengthening of the organization and staffing, and
capacity building to include study tours; (ii) development of PPP guidelines on urban transport
development and TOD; and (iii) capacity development for urban transport operators.
14.5 The total investment cost of the proposed urban transport master plan up to 2035 was roughly
estimated to be nearly USD 34.66 billion, of which USD 23.7 billion is the cost to government based
on the assumption that 30% of the cost could be mobilized from private sector investments and
various user charges such as bus fares, expressway toll, and others. The funding requirement by
the government was further estimated by term as shown in Table 14.1.1
Table 14.1.1 Estimated Cost to Government
Item
Cost to Government
Total Cost Short Term
(–2020)
Medium Term
(2021–2025)
Long Term
(2026–2035) Subtotal
USD million 2,117 11,865 9,725 23,707 34,656
% 8.9 50.0 41.0 100 -
Source: Study Team
14.6 The budget envelope or capacity to mobilize funds by both the public and the private sector
was estimated for the study area based on the following assumptions:
(i) The GRDP of Yangon Region for 2016–2035 was estimated by assuming an 8% growth
annually;
(ii) The share of the study area in the GRDP mentioned above is approximately 80% based on
population; and
(iii) Two scenarios on the allocation of the GRDP to the transport sector were assumed, i.e., 6%
and 3%.
14.7 The estimated budget envelope available for the study area for the period 2016–2035 is
approximately USD41 billion and USD21 billion for the high and low scenarios, respectively.
14.8 Project costs were then compared with the estimated budget envelope which indicate the
following:
(i) For the total period between 2017 and 2035, the estimated budget envelope under Scenario 1
(6% of GRDP) is more or less equal to the project cost. This implies that Greater Yangon can
afford to fund the Master Plan;
14-2

Comprehensive Study of the Urban Transport Development Program in Greater Yangon (YUTRA Update) Final Report | Chapter 14: Conclusion and Recommendations
14-3
(ii) On the other hand, for the short to the medium term, the budget envelope will be insufficient;
and
(iii) It is critical to mobilize external funding for the short to the medium term.
Source: Study Team
Figure 14.1.1 Project Costs vs. Budget Envelope
14.9 The preliminary economic evaluation of the proposed transport master plan was conducted by
comparing the total plan cost estimated in economic cost and direct benefits including savings in
vehicle operating costs and passenger time costs. The estimated EIRR is quite high due to the
increasing cost of congestion.
14.10 When the proposed master plan is implemented the impacts on social and natural
environment are also expected to be significant. These are briefly as follows:
(i) Average transport cost per person trip will decrease to MMK1,517 as compared with
MMK4,421 under the Do Nothing Case in 2035; and
(ii) Air quality will also improve and contribute to a reduction in GHG emissions.
14-3

Comprehensive Study of the Urban Transport Development Program in Greater Yangon (YUTRA Update) Final Report | Chapter 14: Conclusion and Recommendations
14-4
14.2 Recommendations
1) Overall
14.11 While the proposed master plan up to 2035 would help improve the transport situation in the
future Yangon, implementing the plan would be critical. If improvements will not be done in a timely
manner to address the increasing demand every year, long-term solutions would not be accepted by
society. Therefore, in light of the master plan’s envisioned scenario for 2035, the proposed projects
are further packaged as short-term strategic programs that the government has to lead.
14.12 Recommendations for effective implementation include the following:
(a) Packaging of Proposed Individual Projects into Programs to avoid Haphazard
Development: In this study, nine (9) strategic programs are recommended as follows:
(i) Removal of bottlenecks on major corridors and the CBD;
(ii) Bus modernization;
(iii) Traffic management and safety improvement;
(iv) Construction of missing links;
(v) Development of the urban rail network;
(vi) Development of the urban expressway network;
(vii) Development of inland waterway transport;
(viii) Transit-oriented development; and
(ix) Strengthening of the YRTA.
(b) Implementation of Short-term Actions to Promote Long-term Projects: Large
infrastructure projects, especially urban rails, require equally large investments and lengthy
implementation periods. It is thus recommended that an alternative to the conventional
implementation sequence of “FS-DD-ROW acquisition-Construction” be introduced and
integrated urban planning, as well as development of institutions and processes, as
conceptually explained in Table 14.2.1.
(c) Closer Integration with Urban Development Strategies: As the impact of transport on
socio-economic activities, land use, environment and public funding is so large, the
transport plan needs to be integrated into urban development strategies, such as the
provision of affordable housing, relocation of poor families from high hazard risk areas, and
development of new towns and subcenters. High-density commercial complex
development must undergo a detailed assessment of the traffic impact they will create to
avoid or minimize such negative impact on local circulation. Households and commercial
facilities must also have adequate parking spaces.
(d) Development of Transport as an Integrated Network and System: Urban transport in
Yangon is composed of various modes to which high-standard new modes, such as urban
rail, elevated expressways and modern bus, will be added. These modes must function as
an integrated and coordinated system to ensure seamless and safe movement of people at
affordable costs. For this, it is necessary to strengthen the function and capacity of the
YRTA as the sole administrative body in charge of planning and management of the urban
transport system in Yangon.
14-4

Comprehensive Study of the Urban Transport Development Program in Greater Yangon (YUTRA Update) Final Report | Chapter 14: Conclusion and Recommendations
14-5
Table 14.2.1 Alternative Steps for Urban Rail Development
Step Action Purpose
1 Conduct of FS on the Entire Network or Priority Route
To verify feasibility of the project To determine ROW necessary for rail structure, stations, intermodal facilities To identify potential areas for TOD
2 Integration with Urban Plan To designate rail routes and ROW in statutory urban plan To formulate detailed land use/ urban plan for the influence area of urban
rails for enforcement/ control/ guidance of land use/ urban development
3 Land Acquisition / Resettlement
To commence acquisition of rail ROW To introduce land adjustment for wider area of improvement including railway
ROW and TOD-potential area To incorporate resettlement as a concept of TOD
4 Initial Development
To introduce quality bus service or BRT along planned rail routes while land acquisition is carried out
To encourage commercial development in/ around the stations without encroaching on necessary space for intermodal facilities
5 Conduct of D/D for the Routes with Acquired ROW
DD must include TOD plan to involve potential private investments for value capture.
6 Construction When the rail is opened, initial TOD is also completed or on-going.
2) Programmatic Approach to Strategic Projects
(1) Removal of Bottlenecks on Major Corridors and in CBD
14.13 This program intends to provide smooth and safe traffic on major traffic corridors and in the
CBD. The projects included in this program are maintenance/minor improvement/rehabilitation of
roads and removal of specific bottlenecks, and related traffic management and improvement
measures.
Current Study Immediate Action
(Within 1 year) Short-term Action
(2–3 years) Mid to Long -term Action (4–5 years)
Figure 14.2.1 Roadmap for Bottleneck Removal
(2) Bus Modernization
14.14 This program comprises the following projects: (i) bus route redesign, (ii) bus industry re-
structuring, (iii) bus fleet renewal and expansion, (iv) bus support infrastructure, (v) bus corridor
traffic management, and (vi) bus sector management and regulation by YRTA. The estimated cost of
this program is USD350 million, of which about USD52 million is the government’s share in the
equity of five public bus companies, spread over 5 years.
Preliminary Data Collection
and Study
Planning & Design Expansion to Other Corridors and CBD Pilot Project
Semi-access-controlled Corridor For Pyay Rd. & Kabar Aye Pagoda Rd.
14-5

Comprehensive Study of the Urban Transport Development Program in Greater Yangon (YUTRA Update) Final Report | Chapter 14: Conclusion and Recommendations
14-6
Current Study Immediate Action
(within 1 year) Short-term Action
(2–3 years) Medium-term Action
(4–6 years)
Figure 14.2.2 Roadmap for Bus Modernization
(3) Traffic Management and Safety Improvement
14.15 This program includes such components as (i) road vehicle management, (ii) traffic
enforcement, (iii) traffic engineering, (iv) traffic safety education, (v) parking management, (vi) traffic
control, and (vii) traffic demand management. The estimated cost of the program is approximately
USD245 million (cost to Government is USD198 million).
Current Study Immediate Action
(Within 1 year) Short-term Action
(2–3 years) Mid to Long-term Action (4–5 years)
Figure 14.2.3 Roadmap for Traffic Management and Safety Improvement
(4) Construction of Missing Links
14.16 This program intends to strengthen overall road network and accessibility in large urban
blocks by widening or constructing secondary roads through new approaches widely practiced in
Japan. This program comprises (i) road widening and new construction in large-scale urban blocks
(5 packages), and (ii) ROW acquisition and resettlement through the introduction of land
readjustment. The estimated cost is approximately USD500 million (cost to Government is USD250
million).
Policy / Institutional Framework in conjunction with YRTA Evolution
Preliminary Problem
Identification
Training of Traffic Enforcers
Parking Regulation and
Basic TM Measures
Public Campaign and Education Review and
Tentative Solutions
Establishment of Proper Organization
and Staffing
Expansion of TM Measures in coordination with Traffic
Control Centre
Expansion of Public Campaign and Safety Education
Expansion of Pilot exercise to all bus
companies
Pilot ICT-based Bus Service
Improvements
Construction of Bus Support Infrastructure (Bus Stops and Depots)
Intensification in the use of ICT by public bus companies
Bus service delivery by routes Capacity Development of bus company
management Bus Operations Management
Bus Maintenance System
Bus Sector & Route Study
Route Redesign & Re-Allocation
Formation of Public 5 Bus Companies
Government Support to Bus Consolidation
Continuous Adjustments in Routes; Development of Transport Hubs
14-6

Comprehensive Study of the Urban Transport Development Program in Greater Yangon (YUTRA Update) Final Report | Chapter 14: Conclusion and Recommendations
14-7
Current Study Immediate Action
(Within 1 year) Short-term Action
(2–3 years) Mid- to Long-term Action (4–5 years)
Figure 14.2.4 Roadmap for the Construction of Missing Links
(5) Development of the Urban Rail Network
14.17 This program intends to provide the people with congestion-free, high-quality public transport
services in integration with feeder services and TOD. The roadmap of the program is shown below.
Current Study Immediate Action Short-term Action
(2–3 years) Mid- to Long-term Action (4–5 years)
Figure 14.2.5 Roadmap for Urban Rail Network Development
(6) Development of the Urban Expressway Network
14.18 This program intends to provide high-level, high-capacity channels for private and public
transport including (i) urban expressways including north–south backbone (western axis: Insein–
CBD–Dala), north–south backbone (eastern axis: Mindama–CBD), access to Yangon–Mandalay
Expressway, and Pazundaung bypass, east–west smart tunnel (north and south sections), and (ii)
BRT development including Kanar Road–Bayint Naung Road (under an urban expressway), and
Waizayandar Road (under an urban expressway).
Current Study Immediate Action Short-term Action
(2–3 years) Mid- to Long-term Action (4–5 years)
Figure 14.2.6 Roadmap for Urban Expressway Development
Upgrading of Circular Rail (D/D, Construction)
FS on Elevated Circular Rail
FS on Priority Lines
Establishment of Institutional Framework for Urban Rail Management
Scale-up to Cover Entire Urban Areas
Case Study and Pilot Project in Existing Built-up Urban Blocks
Preparation of Institutional Framework in Urban Planning/ Management System
Review and Preliminary
Study
Existing JICA Studies
UMRT Line 1 &2 YCR
Development Policy and Modalities
Review & Pre-liminary Study
Pre-FS on Priority Lines
Implementation
Existing Studies: JICA,
KOICA
Bidding for PPP
Preliminary Study
Pre-FS on other Routes as Express-way Network
F/S on N-S Axis (Insein-CBD-Dala)
Implementation Establishment of Institutional Framework
Integration with Bus Operation
14-7

Comprehensive Study of the Urban Transport Development Program in Greater Yangon (YUTRA Update) Final Report | Chapter 14: Conclusion and Recommendations
14-8
(7) Development of Inland Waterway Transport
14.19 This program intends to meet urban transport needs along waterfront areas and comprises (i)
upgrading of existing services including fleet procurement and facilities improvement and (ii)
development of new routes including fleet procurement and facilities improvement.
Current Study Immediate Action Short-term Action
(2–3 years) Mid- to Long-term Action (4–5 years)
Figure 14.2.7 Roadmap for Inland Waterway Transport Development
(8) Transit-oriented Development
14.20 This program intends to promote transit-based compact urban area, local economic
development and value capture, including (i) TOD for the Yangon Circular Rail including integrated
urban development in/around the stations, improvement of access to/from the stations, especially in
areas within walking distance to stations, development of integrated new towns for resettlement and
those who need affordable housing, effective use of space under viaducts and integrated
development of publicly owned lands, and (ii) TOD on other lines including integrated development
with suburban centers and development of underground space at metro stations.
Current Study Immediate Action Short-term Action (2–3 years)
Mid- to Long-term Action (4–5 years)
Figure 14.2.8 Roadmap for Transit Oriented Development
(9) Strengthening of the YRTA
14.21 This program seeks to transform the newly organized YRTA into an effective instrument for
planning, managing, and regulating the region’s multimodal transport system. This package includes
(i) mobilization of YRTA and formulation of legal and policy framework; (ii) staffing and capacity
building via study tours, attendance in specialized training courses, and hands-on exercises; and (iii)
expansion of functions to include construction of bus support infrastructure, and coordination of
other transport modes (railways, IWT); and TOD planning and promotion. The estimated cost of the
program is approximately USD19 million, most of which will be expenses on personnel
compensation and external training.
Preliminary Study
Conduct of Investment Opportunities Study
Establishment of Institutional Framework to Control/ manage TOD Project
Implementation
Conduct of Pilot Projects
Preliminary Study
Improvement of Existing Facilities/
Fleet
Study and Development of New Routes (Passenger, Freight, Tourism)
Implementation
14-8

Comprehensive Study of the Urban Transport Development Program in Greater Yangon (YUTRA Update) Final Report | Chapter 14: Conclusion and Recommendations
14-9
Current Study Immediate Action
(within 1 year) Short-term Action
(2–3 years) Medium-term Action
(4–6 years)
Figure 14.2.9 Roadmap for YRTA Strengthening
Establishment of YRTA by Law
Formulation of Fare Policy
Funding Mechanism for YRTA’s sustainability
Performance of Expanded
Scope of YRTA
Flexing of coordinating role of YRTA over other
i Organization of YRTA in 2 core
functions (bus & traffic)
Capacity building of staff in various competences (bus regulation, traffic
engineering, etc.)
14-9