Comprehensive Kinetic Analysis of Influenza Hemagglutinin-Mediated Membrane Fusion: Role of Sialate...
15
Comprehensive Kinetic Analysis of Influenza Hemagglutinin-Mediated Membrane Fusion: Role of Sialate Binding Aditya Mittal and Joe Bentz Department of Bioscience and Biotechnology, Drexel University, Philadelphia, Pennsylvania 19104 USA ABSTRACT The data of Danieli et al. (J. Cell Biol. 133:559 –569, 1996) and Blumenthal et al. (J. Cell Biol. 135:63–71, 1996) for fusion between hemagglutinin (HA)-expressing cells and fluorescently labeled erythrocytes has been analyzed using a recently published comprehensive mass action kinetic model for HA-mediated fusion. This model includes the measurable steps in the fusion process, i.e., first pore formation, lipid mixing, and content mixing of aqueous fluorescent markers. It contains two core parameters of the fusion site architecture. The first is the minimum number of aggregated HAs needed to sustain subsequent fusion intermediates. The second is the minimal number of those HAs within the fusogenic aggregate that must undergo a slow “essential” conformational change needed to initiate bilayer destabilization. Because the kinetic model has several parameters, each data set was exhaustively fitted to obtain all best fits. Although each of the data sets required particular parameter ranges for best fits, a consensus subset of these parameter ranges could fit all of the data. Thus, this comprehensive model subsumes the available mass action kinetic data for the fusion of HA-expressing cells with erythro- cytes, despite the differences in assays and experimental design, which necessitated transforming fluorescence dequenching intensities to equivalent cumulative waiting time distributions. We find that HAs bound to sialates on glycophorin can participate in fusion as members of the fusogenic aggregate, but they cannot undergo the essential conformational change that initiates bilayer destabilization, thus solving a long-standing debate. Also, the similarity in rate constants for lipid mixing and content mixing found here for HA-mediated fusion and by Lee and Lentz (Proc. Natl. Acad. Sci. U.S.A. 95:9274 –9279, 1998) for PEG-induced fusion of phosphatidylcholine liposomes supports the idea that subsequent to stable fusion pore formation, the evolution of fusion intermediates is determined more by the lipids than by the proteins. INTRODUCTION The molecular mechanism by which the envelope glycop- rotein hemagglutinin (HA) of influenza virus induces mem- brane fusion has been intensely studied since it was the first fusion protein whose structure was solved (Wilson et al., 1981; Bullough et al., 1994) and its structure is related to other membrane fusion proteins (Skehel and Wiley, 1998). Furthermore, it is the only membrane fusion system for which there are quantitative data that can be used to deduce how many fusion proteins are required at the fusion site (Ellens et al., 1990; Melikyan et al., 1995; Danieli et al., 1996; Blumenthal et al., 1996; Bentz, 2000a). Thus, the architecture of its fusion site is being elucidated (Bentz et al., 1990; Bentz, 1993). HA-mediated fusion subsumes at least four distinct inter- mediates, subsequent to close apposition of the membranes and the low pH-induced exposure of the HA2 N-terminus, which are defined by the assays that monitor their formation (Bentz, 1992, 2000a,b; Zimmerberg et al., 1994; Blumen- thal et al., 1996; Hernandez et al., 1996; Chernomordik et al., 1997, 1998; Melikyan et al., 2000; Markosyan et al., 2000, 2001; Bentz and Mittal, 2000). Briefly, these inter- mediates are: 1. Aggregates of HA that form rapidly subsequent to acid- ification (Bentz, 2000a); 2. The first fusion pore that is defined by the first conduc- tivity spike (2–5 nS) across the membranes; 3. The lipid channel, which is defined by the onset of lipid dye transfer to the target membrane, which might be due to hemifusion of the outer monolayers only; 4. The fusion site, which is defined by the onset of aqueous contents mixing (e.g., fluorophors) and the stable joining of the two membranes, a step required for nucleocapsid release for the virion. Each of these steps will undoubtedly be subdivided in the future, as is being done now with pore evolution (Marko- syan et al., 2001), and can be added to this kinetic model. However, the central problem will remain the same: how do we correlate these “communal” intermediates of the fusion process with the well-known “individual” conformations of HA fragments? (White and Wilson, 1987; Stegmann et al., 1990; Bullough et al., 1994; Chen et al., 1995; Yu et al., 1994; Hernandez et al., 1996; Carr et al., 1997; Bo ¨ttcher et al., 1999). We believe that a rigorous kinetic analysis em- bracing the entire refolding landscape of HA will be essen- tial. Bentz (2000a) began the development of a comprehen- sive mass action model for HA-mediated fusion based upon the fusion intermediates listed above and used it to analyze the data of Melikyan et al. (1995) for first fusion pore formation between HA-expressing cells and ganglioside- containing planar bilayers. It was found that at least eight HAs must aggregate to form the fusogenic aggregate that Received for publication 28 February 2001 and in final form 4 June 2001. Address reprint requests to Dr. Joseph Bentz, Dept. of Bioscience/Biotech- nology, Drexel University, 3141 Chestnut St., Philadelphia, PA 19104- 2875. Tel.: 215-895-1513; Fax: 215-895-1273; E-mail: [email protected]. © 2001 by the Biophysical Society 0006-3495/01/09/1521/15 $2.00 1521 Biophysical Journal Volume 81 September 2001 1521–1535
-
Upload
independent -
Category
Documents
-
view
0 -
download
0
Transcript of Comprehensive Kinetic Analysis of Influenza Hemagglutinin-Mediated Membrane Fusion: Role of Sialate...

Comprehensive Kinetic Analysis of Influenza Hemagglutinin-MediatedMembrane Fusion: Role of Sialate Binding
Aditya Mittal and Joe BentzDepartment of Bioscience and Biotechnology, Drexel University, Philadelphia, Pennsylvania 19104 USA
ABSTRACT The data of Danieli et al. (J. Cell Biol. 133:559–569, 1996) and Blumenthal et al. (J. Cell Biol. 135:63–71, 1996)for fusion between hemagglutinin (HA)-expressing cells and fluorescently labeled erythrocytes has been analyzed using arecently published comprehensive mass action kinetic model for HA-mediated fusion. This model includes the measurablesteps in the fusion process, i.e., first pore formation, lipid mixing, and content mixing of aqueous fluorescent markers. Itcontains two core parameters of the fusion site architecture. The first is the minimum number of aggregated HAs needed tosustain subsequent fusion intermediates. The second is the minimal number of those HAs within the fusogenic aggregate thatmust undergo a slow “essential” conformational change needed to initiate bilayer destabilization. Because the kinetic modelhas several parameters, each data set was exhaustively fitted to obtain all best fits. Although each of the data sets requiredparticular parameter ranges for best fits, a consensus subset of these parameter ranges could fit all of the data. Thus, thiscomprehensive model subsumes the available mass action kinetic data for the fusion of HA-expressing cells with erythro-cytes, despite the differences in assays and experimental design, which necessitated transforming fluorescence dequenchingintensities to equivalent cumulative waiting time distributions. We find that HAs bound to sialates on glycophorin canparticipate in fusion as members of the fusogenic aggregate, but they cannot undergo the essential conformational changethat initiates bilayer destabilization, thus solving a long-standing debate. Also, the similarity in rate constants for lipid mixingand content mixing found here for HA-mediated fusion and by Lee and Lentz (Proc. Natl. Acad. Sci. U.S.A. 95:9274–9279,1998) for PEG-induced fusion of phosphatidylcholine liposomes supports the idea that subsequent to stable fusion poreformation, the evolution of fusion intermediates is determined more by the lipids than by the proteins.
INTRODUCTION
The molecular mechanism by which the envelope glycop-rotein hemagglutinin (HA) of influenza virus induces mem-brane fusion has been intensely studied since it was the firstfusion protein whose structure was solved (Wilson et al.,1981; Bullough et al., 1994) and its structure is related toother membrane fusion proteins (Skehel and Wiley, 1998).Furthermore, it is the only membrane fusion system forwhich there are quantitative data that can be used to deducehow many fusion proteins are required at the fusion site(Ellens et al., 1990; Melikyan et al., 1995; Danieli et al.,1996; Blumenthal et al., 1996; Bentz, 2000a). Thus, thearchitecture of its fusion site is being elucidated (Bentz etal., 1990; Bentz, 1993).
HA-mediated fusion subsumes at least four distinct inter-mediates, subsequent to close apposition of the membranesand the low pH-induced exposure of the HA2 N-terminus,which are defined by the assays that monitor their formation(Bentz, 1992, 2000a,b; Zimmerberg et al., 1994; Blumen-thal et al., 1996; Hernandez et al., 1996; Chernomordik etal., 1997, 1998; Melikyan et al., 2000; Markosyan et al.,2000, 2001; Bentz and Mittal, 2000). Briefly, these inter-mediates are:
1. Aggregates of HA that form rapidly subsequent to acid-ification (Bentz, 2000a);
2. The first fusion pore that is defined by the first conduc-tivity spike (2–5 nS) across the membranes;
3. The lipid channel, which is defined by the onset of lipiddye transfer to the target membrane, which might be dueto hemifusion of the outer monolayers only;
4. The fusion site, which is defined by the onset of aqueouscontents mixing (e.g., fluorophors) and the stable joiningof the two membranes, a step required for nucleocapsidrelease for the virion.
Each of these steps will undoubtedly be subdivided in thefuture, as is being done now with pore evolution (Marko-syan et al., 2001), and can be added to this kinetic model.However, the central problem will remain the same: how dowe correlate these “communal” intermediates of the fusionprocess with the well-known “individual” conformations ofHA fragments? (White and Wilson, 1987; Stegmann et al.,1990; Bullough et al., 1994; Chen et al., 1995; Yu et al.,1994; Hernandez et al., 1996; Carr et al., 1997; Bo¨ttcher etal., 1999). We believe that a rigorous kinetic analysis em-bracing the entire refolding landscape of HA will be essen-tial.
Bentz (2000a) began the development of a comprehen-sive mass action model for HA-mediated fusion based uponthe fusion intermediates listed above and used it to analyzethe data of Melikyan et al. (1995) for first fusion poreformation between HA-expressing cells and ganglioside-containing planar bilayers. It was found that at least eightHAs must aggregate to form the fusogenic aggregate that
Received for publication 28 February 2001 and in final form 4 June 2001.
Address reprint requests to Dr. Joseph Bentz, Dept. of Bioscience/Biotech-nology, Drexel University, 3141 Chestnut St., Philadelphia, PA 19104-2875. Tel.: 215-895-1513; Fax: 215-895-1273; E-mail: [email protected].
© 2001 by the Biophysical Society
0006-3495/01/09/1521/15 $2.00
1521Biophysical Journal Volume 81 September 2001 1521–1535
can sustain first fusion pore formation. Thus the minimalaggregate size isv 5 8. Remarkably, only two or three ofthese HAs needed to undergo the slow “essential” confor-mational change required for first fusion pore formation.Thus, the minimal fusion unit isq 5 2 or 3. This division oflabor between those HAs that form the fusogenic aggregateand the subset of those HAs that form the minimal fusionunit is the core of this comprehensive fusion model. Bothjobs are allowed by the model and the number of HAsrequired for each job is fitted from the data.
A comprehensive model must be able to bring all appro-priate data into a coherent set of parameter estimates.Danieli et al. (1996) and Blumenthal et al. (1996) monitoredthe lipid mixing between HA expressing cells and fluores-cently labeled RBC. They used different conditions, differ-ent assays, and different equations to arrive at differentestimates for the number of HAs forming the “cooperativeunit” or the fusion site. Blumenthal et al. (1996) correctlycriticized the equation used in Danieli et al. (1996) ashaving no theoretical basis. In fact, both analyses wererestrictive, in that a particular step of the process wasassumed to be rate-limiting in advance and the fitting equa-tions were designed for just that step. If no single step israte-limiting, which our analysis suggests, then the param-eters of overly simplified equations will be forced to ac-commodate the extra information in the data, blurring theirphysical meaning.
The comprehensive model applied here to their datamakes no unproven assumptions about rate-limiting steps.We have assumed only that the data sets of Melikyan et al.(1995), Danieli et al. (1996), and Blumenthal et al. (1996)are representative of the different assays used to study thefusion of HA-expressing cells with target membranes.Hence, our focus is to determine whether this kinetic modelcan fit all the data and, if so, what can we learn about howthe experimental design affects the fusion monitored.
Table 1 shows a synopsis of the different experimentalsetups used for the three studies. One major difference isthat Melikyan et al. (1995) and Blumenthal et al. (1996)
report waiting times for fusion intermediates to form be-tween a single HA-expressing cell and a particular RBC,while Danieli et al. (1996) report the population averageddequenching of fluorophor from labeled RBC into HA-expressing cells in suspension. We have derived a simpleformula in Appendix B, which can translate the intensitydata of Danieli et al. (1996) into its simplest waiting timeform, thus all three data sets can be brought to the samebasis for analysis.
MATERIALS AND METHODS
All data were recalibrated from original data kindly sent to us by Drs.Robert Blumenthal, Tsafi Danieli, and Judy White, as described below.Danieli et al. (1996) used stably transfected clones of the Japan strain ofinfluenza virus (A/Japan/305/57) in 3T3 fibroblasts, denoted GP4f, HAb2,and GP4/6. Freshly drawn RBCs were labeled with octadecylrhodamine,R18, and bound to HA-expressing cells for 20 min at 25°C before washing.Fusion was triggered by lowering the pH of the above solution to 5.0 in athermostatted cuvette at 28° to 29°C. Fluorescence dequenching of R18from RBCs’ membrane into the HA-expressing cell membrane was mea-sured using a fluorometer equipped with a magnetic stirrer (LS-5B; Perkin-Elmer, San Jose, CA). We note that data from HAb2 cells treated withsodium butyrate were not used for this analysis.
Blumenthal et al. (1996) used only the GP4f cell line for their experi-ments. Human RBC ghosts double-labeled with DiI (C18-3) for lipidmixing, and calcein for content mixing, were monitored for fusion with theGP4f cells by multi-wavelength fluorescence video microscopy. A suddensmall drop in RBC DiI fluorescence was often observed, well before thebeginning of DiI redistribution, and was considered as an indicator mem-brane depolarization and, by inference, of the first fusion pore formation.Onset of DiI redistribution was taken as the waiting time of lipid mixingand onset of calcein redistribution was taken as the waiting time of aqueouscontents mixing, which were determined by eye in Blumenthal et al.(1996). Using this system, a distribution of waiting times (for RBC ghosts)was obtained for the formation of the first fusion pore, the lipid channel,and the aqueous contents mixing. Not all cells showed all three outcomes,i.e., of the 76 cells that showed lipid dye spread, only 34 showed all threeoutcomes. For the 26 cells showing no clear drop in DiI fluorescence, itmay have been too small to rise above the noise in the signal. For the 12cells showing no calcein redistribution, it may be that lipid mixing was dueto hemifusion (Chernomordik et al., 1998) or leakage of contents was toogreat (Shangguan et al., 1996). Because our model can treat each outcomeindependently, we used all of the data for fitting each step.
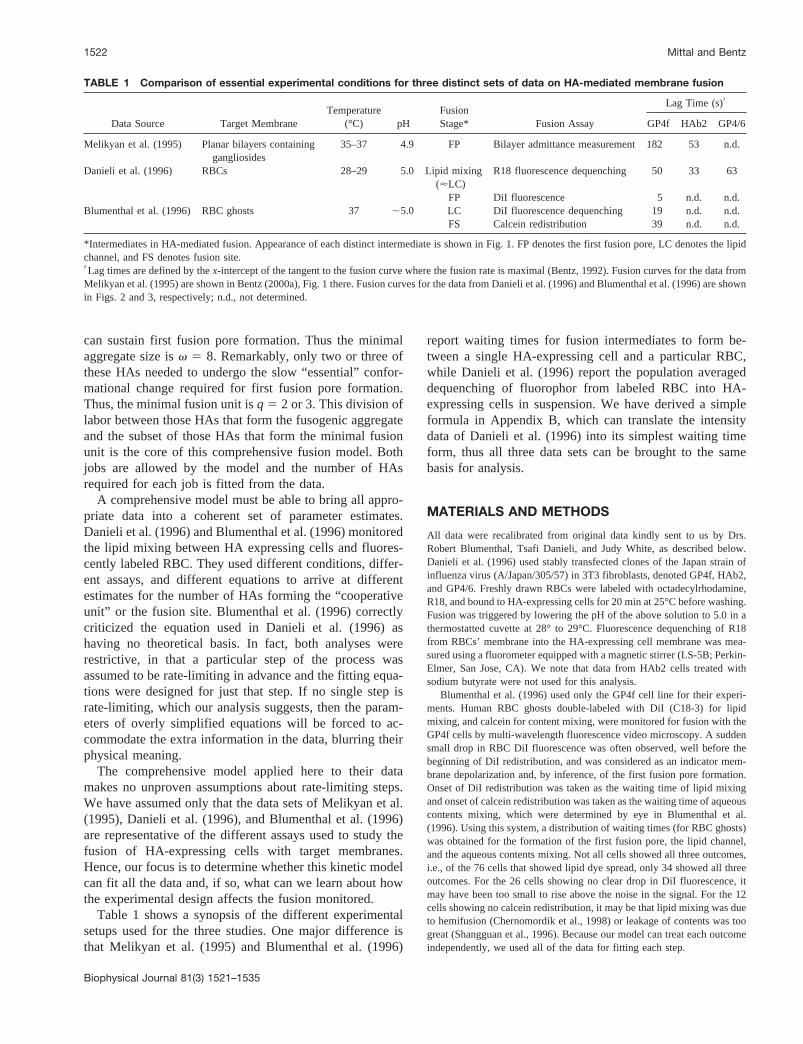
TABLE 1 Comparison of essential experimental conditions for three distinct sets of data on HA-mediated membrane fusion
Data Source Target MembraneTemperature
(°C) pHFusionStage* Fusion Assay
Lag Time (s)†
GP4f HAb2 GP4/6
Melikyan et al. (1995) Planar bilayers containinggangliosides
35–37 4.9 FP Bilayer admittance measurement 182 53 n.d.
Danieli et al. (1996) RBCs 28–29 5.0 Lipid mixing('LC)
R18 fluorescence dequenching 50 33 63
FP DiI fluorescence 5 n.d. n.d.Blumenthal et al. (1996) RBC ghosts 37 ;5.0 LC DiI fluorescence dequenching 19 n.d. n.d.
FS Calcein redistribution 39 n.d. n.d.
*Intermediates in HA-mediated fusion. Appearance of each distinct intermediate is shown in Fig. 1. FP denotes the first fusion pore, LC denotes the lipidchannel, and FS denotes fusion site.†Lag times are defined by thex-intercept of the tangent to the fusion curve where the fusion rate is maximal (Bentz, 1992). Fusion curves for the data fromMelikyan et al. (1995) are shown in Bentz (2000a), Fig. 1 there. Fusion curves for the data from Danieli et al. (1996) and Blumenthal et al. (1996) are shownin Figs. 2 and 3, respectively; n.d., not determined.
1522 Mittal and Bentz
Biophysical Journal 81(3) 1521–1535

The kinetic model and multiparameter fitting ofthe fluorescence data
Fig. 1 shows the comprehensive kinetic model used for influenza hemag-glutinin aggregation and fusion developed in Bentz (2000a) to analyze thefirst fusion pore kinetics found by Melikyan et al. (1995) between HA-expressing cells and ganglioside-containing planar bilayers. The modelcontains only those steps known to be essential for fusion. Followingprotonation, the HA aggregate forms rapidly, denoted here as HAv,0, for anaggregate ofv HAs wherein none has yet undergone the essential confor-mational change. Although aggregation of HA is rapid, as shown in Bentz(2000a), that need not be the case for other fusion proteins;v is thesmallest aggregate size capable of achieving fusion, which was fitted asv $ 8 in Bentz (2000a) for the data of Melikyan et al. (1995).
Although this reaction is theoretically reversible, we believe that theessential conformational change for HA is the formation of the extendedcoiled coil (Bullough et al., 1994; Carr et al., 1997; Shangguan et al., 1998;Skehel and Wiley, 1998), which appears to be irreversible under theconditions for fusion. Thuskrf 5 0 for our fits.
We have expanded the model slightly by havingvf denote the numberof the HAs within the fusogenic aggregate that can undergo an essentialconformational change, independently and identically, with a rate constantof kf. Thus, the overall rate constant for the first reaction would bevfkf.These conformational changes continue for each HA untilq of them haveoccurred. Clearly,q # vf # v. We will discuss below why this general-ization is needed. Each of these parameters must be fitted by the data.
At this point, the fusogenic aggregate can transform to the first fusionpore, FP, which is observed as the first conductivity across the apposedmembranes (Melikyan et al., 1995) or the sudden small drop in DiIfluorescence (Blumenthal et al., 1996). The minimal fusion unit,q, equalsthe number of conformationally changed HAs (i.e., their transduced freeenergy) needed to create and/or stabilize the first high-energy intermediatefor fusion. The first fusion pore then evolves to the lipid channel, LC,demarked by the mixing of lipids, and then to the fusion site, FS, demarkedby content mixing, if there is not too much leakage (Shangguan et al., 1996;Gunter-Ausborn et al., 2000).
Data calibration: single cell waiting times versuspopulation fluorescence dequenching
In the kinetic model, {FP(t)} represents the average number of first fusionpores in the area of contact at timet. A Poisson distribution is used toobtain the probability at timet that a given cell has or has had one or morefusion pores (Bentz, 1992, 2000a):
NFP~t! 5 1 2 exp$2@$FP~t!% 1 $LC~t!% 1 $FS~t!%#% (1)
The sum {FP(t)} 1 {LC( t)} 1 {FS(t)} arises becauseNFP(t) is defined asthe cumulant and an FS used to be an LC, which used to be an FP. Byanalogy, the waiting times for the first lipid mixing and contents mixing, asobserved by Blumenthal et al. (1996), are given by:
NLC~t! 5 1 2 exp$2@$LC~t!% 1 $FS~t!%#%
NFS~t! 5 1 2 exp$2@$FS~t!%#%(2)
However, Danieli et al. (1996) measured fluorescence dequenching oflabeled RBC bound to HA-expressing cells in a cuvette, i.e., a populationaverage. They presented their lipid mixing assay results in terms offluorescence dequenching, using a standard normalization,
I~t! 5F~t! 2 F~0!
F~det! 2 F~0!(3)
whereF(t) and I(t) represent the absolute and relative fluorescence inten-sities respectively at timet or time 0, andF(det) is the fluorescence due todetergent lysis at the end of the experiment. This is a population measure-ment that presents two problems for fitting data. The first is usingF(det)to approximate the fluorescence of complete lipid mixing. This is acommon approach, but not one suitable for a rigorous kinetic analysisbecause it does not give the fraction of fused particles. The second problemis that the data cannot be compared directly with waiting times.
We have solved the first problem by recalibrating their intensity curvesby replacingF(det) in Eq. 3 withF(`), which is the maximum possibleprobe redistribution due lipid mixing only, i.e., not due to detergent lysis.F(`) is the plateau value of lipid mixing fluorescence and was obtained bybest-fitting the fluorescence dequenching curves to an approximate equa-tion derived in Bentz (2000a) for first fusion pore formation:
F~t! 5 F~0! 1 1 2 exp$2A~1 2 exp$2kt%!B% (4)
For fitting lipid mixing here, the values ofk and B have no rigoroussignificance, so we simply use it as a convenient equation for fittingA,since for the best fit,F(`), is defined by
F~`! 5 F~0! 1 1 2 exp$2A% (5)
These fits were very good and agreed with visual estimates for the HAb2and GP4f data, where plateaus were actually reached, while the GP4/6curves required extrapolation.
The second problem, that of relating the population average dequench-ing with the fraction of fused cells, is partially solved in Appendix B,where it is shown that when the flow of probe to the target cell is fastcompared with the time required for the next lipid channel to form, theappropriate relation is (Eq. B7):
I~t! 5 NLC~t!~2 2 NLC~t!! (6a)
or equivalently,
NLC~t! 5 1 2 ~1 2 I~t!!1/2 (6b)
WhereNLC(t) is defined in Eq. 2 relative to the kinetic model, Fig. 1.
FIGURE 1 The comprehensive kinetic model for influenza hemaggluti-nin-mediated membrane fusion. Following protonation, the HA aggregateof size v forms rapidly, denoted as HAv,0. v is the minimal size for afusogenic aggregate and a lower bound of eight was found by kineticanalysis in Bentz (2000a), i.e.,v $ 8. vf denotes the number of the HAswithin the fusogenic aggregate that can undergo the essential conforma-tional change independently and identically with a rate constant ofkf. Thus,the overall rate constant for the first reaction would bevfkf. These con-formational changes continue for each HA untilq of them have occurred,HAv,q. q is called the minimal fusion unit, as it equals the minimumnumber of HAs that have undergone the essential conformational changeneeded to stabilize the first high-energy intermediate for fusion. At thispoint, the fusogenic aggregate can transform to the first fusion pore, whichis observed as the first conductivity across the apposed membranes. Thefirst fusion pore, FP, evolves to the lipid channel, LC, demarked by mixingof lipids, which evolves to the fusion site, FS, demarked by aqueouscontents mixing.
Sialate Binding in Influenza HA-Mediated Fusion 1523
Biophysical Journal 81(3) 1521–1535

Screening for “best fits”
Numerical integrations for the mass action kinetic model were done as inBentz (2000a) using MATLAB (The Math Works) subroutine ODE23s.Curve-fitting was done using the fitting routine “fmins” of MATLAB. Forthe model in Fig. 1 we have found that theoretical data, generated from themodel, are uniquely fitted by our algorithm. Thus, multiple fits here are dueto experimental noise.
For any given data set the goodness-of-fit achieved by a particular setof kinetic parameters was quantitated by the root mean square error (rmse)between the data points and the numerically integrated theoretical curve. Aminimum rmse value for each data set was obtained and “best fits” weredefined as all sets of parameters that were visually indistinguishable fromthat of the minimal rmse fit. All data-fitting was exhaustive, i.e., the widestpossible ranges of initial estimates for the parameters in the kinetic modelwere tested to assure that all best fits were found. This was confirmed byour finding that all best fits lay within a convex space in parameter space,as described below.
For Danieli et al. (1996) the lipid mixing data for the HAb2 cell lineshowed much more scatter than those for the GP4f and GP4/6 cell lines,making a simultaneous fitting of all three data sets too expensive compu-tationally. Accordingly, we devised a three-step process to best-fit the data.First, the data for the for GP4f and GP4/6 cell lines were jointly fitted anda best-fit cutoff value of rmse5 2.853 1022 was chosen, with an absoluteminimum rmse of 2.763 1022, to collect the best-fit kinetic constants (kf,kp, kl) and the number of fusogenic aggregates in the area of contactNv(GP4f),Nv (GP4/6)). Second, for each of these chosen parameter sets,data for the HAb2 cell line were fitted solely for the number of fusogenicaggregates in the area of contact, denoted byNv(HAb2). The combinedbest-fit cutoff rmse value was calculated to be#5.20 3 1022, with anabsolute minimum rmse5 4.76 3 1022. The third step was to excludethose fits for whichNv(GP4/6), 2, i.e., two or more fusogenic aggregateswere required within the area of contact, which we consider a weakassumption.Nv(GP4/6) has the lowest surface density of the three celllines, and hence the smallest number of available fusogenic aggregates.
The data from Blumenthal et al. (1996) were fitted in the same sequenceas the appearance of fusion intermediates. First, for the distribution of firstfusion pore waiting times, best fits forkf, kp, andNv(GP4f) were exhaus-tively generated. For each of these parameter sets, best fits forkl weredeveloped from the lipid mixing waiting times by providing a whole rangeof initial values for the rate constant for lipid channel formation in themodel. This was followed by applying the same procedure to fit the rateconstant for fusion site formation (aqueous fluorophor content mixing).Combined best-fit rmse values for all three fusion intermediates (FP, LC,and FS) were taken as#2.50 3 1022 for all data points, where theminimum rmse was 2.473 1022.
Cell constants
For all calculations the cell surface densities of HA on the GP4f cell linewere taken as {GP4f}5 1600 HA/mm2, {HAb2} 5 1.63 {GP4f} for theHAb2 cell line, and {GP4/6}5 {GP4f}/1.6 for the GP4/6 cell line (Ellenset al., 1990; Danieli et al., 1996). The total area of GP4f and GP4/6 celllines was taken as 1800mm2 and 2500mm2 for the HAb2 cell line (Ellenset al., 1990). The area of contact between a single RBC and an HA-expressing cell was taken as 38mm2 as measured by Danieli et al. (1996).We assumed 19 sialates per glycophorin (Pisano et al., 1993) and 2000–10,000 glycophorins permm2 on an RBC (Leikina et al., 2000; Marchesiet al., 1972).
RESULTS
It is important to observe that the overall kinetics from thesethree studies are rather different, as shown in Table 1 by the
lag times, i.e., thex-intercept from the tangent at the max-imal rate (Bentz, 1992). The lag times for the GP4f cells isthe most complete set. For lipid mixing in Danieli et al.(1996) the lag time was;50 s, while in Blumenthal et al.(1996) it was;19 s. Much of this difference is due to thehigher temperature, 37°C, Blumenthal et al. (1996) used ascompared to 28–29°C used by Danieli et al. (1996). How-ever, at the same temperature and a lower pH, Melikyan etal. (1995) show a lag time for first fusion pore formationthat is;35 times longer than that found in Blumenthal et al.(1996) for DiI depolarization.
Quantitative differences are due to experimental differ-ences and to biological variation between these studies. Wedo not expect the comparison of rigorous fittings to com-pletely agree. However, the job of a good comprehensivekinetic model is to show which parameters have similarvalues for the three studies, suggesting robust steps lesssensitive to the experimental differences and which param-eters have clearly different values, indicative of steps thatdepend strongly on details of the experiment.
The open symbols in Fig. 2 show the fluorescence de-quenching due to lipid mixing curves from Danieli et al.(1996) for the three cell lines, recalibrated using Eqs. 3–5.The solid lines show a best fit to these data using Eq. 6, andall sets of kinetic parameters yielding a best fit gave visuallyindistinguishable curves. Over 2000 widely separated initialconditions were provided for fitting these data.
The symbols in Fig. 3 represent the waiting times for thefraction of GP4f cells that has shown membrane depolar-ization/first fusion pore formation (3), lipid mixing (h),and content mixing (1) from the data of Blumenthal et al.(1996). The solid lines show the best fit to these data, i.e.,all sets of kinetic parameters yielding a best fit gave visuallyindistinguishable curves. Over 1000 widely separated initialconditions were provided for fitting these data.
Table 2 summarizes the fitted parameter ranges for bothof these data sets. Also included are the ranges previouslyreported in Bentz (2000a) for the data of Melikyan et al.(1995) on first fusion pore formation with a gangliosidecontaining planar bilayer target, as measured by admittancechanges. The most important result is that the data ofMelikyan et al. (1995) and Danieli et al. (1996) require aminimal fusion unit ofq 5 2 or 3 to best fit the data. Noother values ofq, from 0 to 8, could fit all the data as well(i.e., no best-fit was found). By itself, the data of Blumen-thal et al. (1996) allowedq 5 1, 2, or 3 for best fits of thedata for the GP4f cell line. However, the estimate forq 5 1is not reliable because data from Melikyan et al. (1995) orDanieli et al. (1996) for a single cell line could be best-fittedby other q values. Having data for more than one HAsurface density significantly restricts the consensus param-eter values. A major point of our analysis is that assumingall these data sets are reasonable implies that the consensusbest fits are most reliable. The consensus value for theminimal fusion unit isq 5 2 or 3.
1524 Mittal and Bentz
Biophysical Journal 81(3) 1521–1535

The estimated range for the average rate constant for thefirst fusion pore formationkp is in the range of 1024–1025
s21 if the minimal fusion unitq 5 2. However, forq 5 3,kp is estimated either in the range of 1025 s21 or $0.5 s21,two widely disparate ranges. Bentz (2000a) noted that thisshowed the need for the analysis of other data to determinewhich range is correct. All three data sets analyzed hereagree only on a single range forkp, i.e., 1024–1025 s21.This would also mean that the value of minimal fusion unitq 5 2. Although such precision may appear unneeded, anindependent analysis given below also suggests thatq 5 2.
For fitting the data of Danieli et al. (1996) alone, esti-mates for kp and kl were interchangeable because theycontrol first-order processes in series with only the secondstep being measured, i.e., lipid mixing. The consensus fromthe three studies is shown in the table. The estimated rangefor the average rate constant for the lipid channel formation,kl, is in the range of 1023–1022 s21. The lower bound forthe range ofk1 found for the data of Blumenthal et al. (1996)alone is probably too low, due to having only one cell linetested. There is quite good agreement among the studies,which suggests a robust estimate for the kinetics of this step.From the data of Blumenthal et al. (1996), the value for thefusion rate constant was also estimated from Fig. 3 to bekS 5 3 3 1022 s21. Lee and Lentz (1998) found similarvalues for the lipid mixing and content mixing between purelipid vesicles (SUV) induced to fuse by PEG, which will bediscussed below.
The rate constant for the essential HA conformationalchange,kf, has absorbed most of the obvious kinetic differ-ence among the three studies, discussed above and shown inTable 1 by the lag times. This step is the most sensitive tothe experimental differences among the three studies. In theDiscussion we will consider why this might be the case.
Confidence in the range of parameter values for best-fitsets requires that all possible best-fits are actually found. Asin Bentz (2000a), we have found here that all best-fits arecontained within a convex space of the universe of possibleparameter values, as shown in the final column of Table 2.For the data of Melikyan et al. (1995), Bentz (2000a) foundthat all of the best-fit parameter sets could be fitted to theequation kpkf
qNv(GP4f) 5 1029.160.5 for q 5 2 andkpkf
qNv(GP4f) 5 1029.560.1 for q 5 3, as shown. In “pa-rameter space,” this relation defines a convex volume. Thismeans we have the relevant ranges for all of the parameters.However, combinations of parameters that satisfy this rela-tionship will yield good, but not always best, fits. Parts ofthis parameter space are inaccessible because they wouldrequire the number of HAv-mers, denoted byNv, to exceedthe available number of HAs in the area of apposition forthe GP4f cell line. Similar relations hold for the best fits tothe data of Danieli et al. (1996), when the value in the tableequalsklkpkf
qNv(GP4f), and for the data of Blumenthal et al.(1996), when the value in the table equalsksklkpkf
qNv(GP4f).The parameter space values shown are mean values6
FIGURE 2 Lipid channel, LC, formation measured by Danieli et al. (1996) using R18-labeled RBCs fusing with HA-expressing cells. Open symbolsshow lipid mixing for three cell lines: GP4/6 (‚), GP4f (h), and HAb2 (E). HAb2 cells express 1.6 times more HA/mm2 than GP4f cells, and GP4f cellsexpress 1.6 times more HA/mm2 than GP4/6 cells (Danieli et al., 1996). Fusion is quantified as relative fluorescence due to lipid mixing (see Eq. 1). Solidlines show a typical best fit (see Results) obtained from multiparameter fitting of the data to the kinetic model. Other best fits can be obtained within theparameter ranges shown in Table 2.
Sialate Binding in Influenza HA-Mediated Fusion 1525
Biophysical Journal 81(3) 1521–1535

FIGURE 3 Fusion intermediates measured by Blumenthal et al. (1996) for double-labeled RBC ghosts fusing with GP4f cells. Symbols are the waitingtime data after acidification, showing the cumulant fraction of cells that have achieved their first conductivity channel FP (3), their first indication for lipidchannel formation LC (h), and their first indication for content mixing FS (1) as functions of time. Solid lines show a typical best fit obtained frommultiparameter fitting of the data to the kinetic model (Eqs. 2–4). Other best fits can be obtained within the parameter ranges shown in Table 2.
TABLE 2 Comparison of the fitted parameter ranges for the data discussed in Table 1, using the mass action kinetic model forHA-mediated membrane fusion shown in Fig. 1
q* Fusion Intermediate†Protein
kf (s21)‡Fusion Pore
kp (s21)‡Lipid Channel
k1 (s21)‡
Nv~HAb2!§
Nv~GP4f!
Nv~GP4f)§
Nv~GP4/6)Parameter
Space¶
2 FP\ Melikyan et al. (1995) (0.3–2)3 1024 (0.3–7)3 1024 n.d. 416 2 n.d. 1029.160.5
LC Danieli et al. (1996) (2–2.6)3 1022 (4.5–8)3 1024 (3–5)3 1022 2.926 0.01 2.766 0.01 1026.7160.01
LC Blumenthal et al. (1996) (2–2.5)3 1021 (0.03–1)3 1024 (2.5–2.6)3 1022 n.d. n.d. 1026.0860.002
3 FP\ Melikyan et al. (1995) (0.4–2)3 1024 $0.5 n.d. 396 3 n.d. 1029.560.1
LC Danieli et al. (1996) (1.5–2.2)3 1022 $0.5 (0.5–1.1)3 1023 2.956 0.003 2.756 0.002 1027.160.3
LC Blumenthal et al. (1996) (3–3.1)3 1021 (0.2–6)3 1025 (2.5–2.6)3 1022 n.d. n.d. 1026.4160.002
*q denotes the minimal fusion unit. Onlyq 5 2 or 3 could best fit the data.v, the minimal aggregate size, was fixed at 8 from Bentz (2000a). For the dataof Melikyan et al. (1995), where the target membrane was a ganglioside-containing planar bilayer, Bentz (2000a) assumed that all of the HAs in thefusogenic aggregate could undergo the essential conformational change, i.e.,vf 5 v. Here, for the data of Danieli et al. (1996) and Blumenthal et al. (1996),where the target membrane is a glycophorin on the RBC, we find that within the fusogenic aggregate, only those HAs not bound to sialates can undergothe essential conformational change, complementing the results of Leikina et al. (2000). Thus, the fitted value ofkf shown in Table 2 assumes thatvf 52 or 3 for these data, i.e.,Ks $ 1022 (molecules/mm2)21, see Figs. 5 and 6. The initial fitting of the data withvf 5 v 5 8 gave fits forkf that were;5.5times smaller forq 5 2 and;4.0 times smaller forq 5 3. With these corrections all other parameters were insensitive to the value ofvf.†Fusion intermediates are defined in Fig. 1. FP denotes the first fusion pore, LC denotes the lipid channel, and FS denotes fusion site.‡Best-fit ranges for the rate constants for the essential conformational change of HA,kf, the first fusion pore formation,kp, and the lipid channel formation,kl. Results are shown for.25 best fits obtained in each case. Beyond the ranges shown either poor fits were obtained, or morev-mer aggregates of HAwere required in the area of apposition than were available for these cells, or the number of fusogenic aggregates in the area of apposition was,2.§Average of ratio of the number ofv-mers in the area of apposition for the pairs of cell lines shown, for all best fits from the numerical integrations (6SDfor .25 fits in each case).¶Bentz (2000a) found that all of the best-fit parameter sets for the data of Melikyan et al. (1995) could be fitted to the equationkpkf
qNv(GP4f)5 1029.160.5
for q 5 2 andkpkfqNv(GP4f)5 1029.560.1 for q 5 3, as shown. Similar relations hold for the best fits to the data of Danieli et al. (1996), when the value
in the table equalsklkpkfqNv(GP4f), and for the data of Blumenthal et al. (1996), when the value in the table equalsksklkpkf
qNv(GP4f). The parameter spacevalues shown are mean values6 SD for .25 best fits obtained in each case.\Previously reported in Bentz (2000a).
1526 Mittal and Bentz
Biophysical Journal 81(3) 1521–1535

standard deviation for more than 25 best fits obtained ineach case.
Bound HA can be a part of a fusogenicaggregate
Among the best fits, the particular values forNv(GP4f),Nv(GP4/6), andNv(HAb2), the number of fusogenic aggre-gates on the GP4f, GP4/6, and HAb2 cells, ranged widely.However, their ratios were remarkably constant. In Bentz(2000a), it was found that this ratio for the data of Melikyanet al. (1995) wasNv(HAb2)/Nv(GP4f)5 41 6 2 for q 5 2over hundreds of fits. Because the surface density (of HA)difference between HAb2 and GP4f cell lines was 1.6(Ellens et al., 1990; Danieli et al., 1996), this ratio of 40 ledto the conclusion that there were 8 or more HAs in thefusogenic aggregate Bentz (2000a,b).
The ratio of fusogenic aggregates for the lipid mixingdata from Danieli et al. (1996) is more than 10-fold less andeven more precise, i.e., 2.926 0.01 forq 5 2. Essentiallythe same ratio of fusogenic aggregates is found for the GP4fand GP4/6 cell lines, i.e.,Nv(GP4f)/Nv(GP4/6)5 2.76 60.01, for q 5 2. These two cell lines also have an HAsurface density ratio of 1.6 (Danieli et al., 1996). Thestandard deviation over all best fits (n . 25) is remarkablysmall. The reason for this reduction in the ratio of fusogenicaggregates is not because the cells are in suspension. A ratioof fusogenic aggregates of;3 has also been observed foradherent HAb2 and GP4f cells fusing with R18-labeledRBCs observed by video microscopy (G. Melikyan, A.Mittal, and J. Bentz, unpublished observations).
This reduction in the ratio of fusogenic aggregates can becompletely explained by HA binding to glycophorin on the
RBC. This will cause the HAs to accumulate well abovetheir average surface density within the area of contactbetween the RBC and the HA-expressing cell. This accu-mulation causes the absolute number of HAs within the areaof contact to increase for both cell lines. However, the ratioof the total HA surface densities, between the GP4f andHAb2 cell lines, in the area of contact will decrease from1.6 (no binding) to near 1 (all glycophorin sites bound andfree HAs at the cell surface average). If the HAs bound tosialate can participate in the fusogenic aggregate in someway, then the ratio of fusogenic aggregates in the area ofcontact would diminish from 40, where there is insignificantbinding as explained below, to a smaller number.
Fig. 4 illustrates a portion of the HA-expressing cell withHAc denoting HAs outside of the area of apposition, atroughly the “measured” surface density (Ellens et al., 1990;Danieli et al., 1996). The bound RBC (not to scale) is shownwith the glycophorin-HA connections accumulating HAswithin the area of contact. We model the binding of HA tothe glycophorin via its sialates in the simplest way:
HAF 1 RºKs
HAB
The larger the binding constantKs, the more similar the HAsurface density facing the RBC for all HA-expressing celllines, because the glycophorin (receptor) surface density isthe same. The value of the binding constantKs will dependupon the sialate binding constant to the HA1 headgroup, thenumber of sialates per glycophorin, and any steric effectsreducing the accessibility of the sialate to the binding siterelative to the free sialate.
Calculating this binding effect is simple and is given inAppendix A. For our calculation, we assume that all of the
FIGURE 4 Accumulation of HAs in the area of apposition due to receptor binding. The portion of the HA expressing cell is shown with HAc denotingHAs outside the area of apposition, at roughly the measured surface density for GP4f cells. The bound RBC (not to scale) is shown with glycophorin-HAconnections accumulating HAs within the area of contact. The surface density of unbound HAs within the area of contact is denoted by HAF, while HAB
denotes HA bound to glycophorin, which is denoted by R. The larger the binding constantKs, the more similar is HA surface density facing the RBC forall HA-expressing cell lines.
Sialate Binding in Influenza HA-Mediated Fusion 1527
Biophysical Journal 81(3) 1521–1535

HAs on the cell surface are at equilibrium with the bindingreaction to glycophorin in the area of contact. Leikina et al.(2000) made the assumption that no HAs could diffuse intothe area of contact, which yields that essentially all of theHAs in the area of contact would be bound to sialates. If thisassumption were correct, there would be no basis for fusiondifferences between the different cell lines. Given the mo-bility of HA (Ellens et al., 1990) and the accessibility ofHAs within the area of contact to large proteolytic andglycolytic enzymes (Melikyan et al., 2000; Leikina et al.,2000), our assumption of free diffusion of HA into the areaof contact is more reasonable. For all of our calculations, thesurface density of free HAs within the area of contact, i.e.,not bound to sialates, for the GP4f and HAb2 cell lines wasalways.85% and 94%, respectively, of the original surfacedensity before binding. Thus, there are many free HAs. Thefraction of HA bound within the area of contact was as highas 89% and 80%, respectively, due to accumulation of HAs.
What matters here is not the absolute values of HA, butthe ratio between the two cell lines. Fig. 5 shows the graphof the calculated ratio of HA surface densities for HAb2 andGP4f cell lines in the area of RBC contact as a function ofthe binding constantKs. The separate ratios of free HA,bound HA, and total HA5 bound1 free are shown. Thiscalculation does depend upon the surface density of glyco-phorin, which has been estimated from 2000 to 10,000/mm2
(Marchesi et al., 1972; Leikina et al., 2000). We did thecalculation for 2000, 5000, and 10,000 glycophorins/mm2.Lines show the average of the calculated values for these
three glycophorin surface densities and the bars show thestandard deviation around this average. Although absoluteamounts of bound HA depend on glycophorin surface den-sity, the ratios between the two cell lines are rather insen-sitive. Thus, the true glycophorin surface density is notimportant for our analysis.
When the binding constant is near zero, the ratio of totalHA is 1.6 in the area of contact, because all HA are free.When the binding constantKs $ 1022 (molecules/mm2)21,the ratio of total HA within the area of contact, between theHA2b/GP4f cell lines, is reduced to;1.2. The bindingconstant of soluble sialate to soluble HA1 is well known,'1/(2.8 mM) (Sauter et al., 1989). However, the bindingconstant of membrane-bound HA to membrane-bound gly-cophorin,Ks, has not been measured. Leikina et al. (2000)have estimated this value atKs ' 1022 (molecules/mm2)21,using a straightforward thermodynamic transformation andassuming that the sialate-HA binding is otherwise un-changed. Because their calculation did not include the factthat there are;19 sialates per glycophorin (Pisano et al.,1993), their value is up to a 19-fold underestimate, i.e.,Ks . 1022 (molecules/mm2)21.
Remarkably, the nucleation model for HA aggregation tofusogenic aggregates developed in Bentz (2000a) predictsthat a reduction in ratio of fusogenic aggregates from 40 to3 would require a reduction in the ratio of total HA in thearea of contact from 1.6 to 1.2, for these two cell lines, asshown by Fig. 8 in Appendix A. These calculations suggestthat the ratio of fusogenic aggregates we found here for thedata of Danieli et al. (1996) is explained completely by thepredicted accumulation of bound HAs within the area ofcontact, provided that the HAs bound to sialates can partic-ipate in fusion.
The minimal fusion unit requires free HA in thefusogenic aggregate
A fusogenicv-mer aggregate of HAs can be composed ofnF free HAs and (v 2 nF) bound HAs. Given that the ratioof fusogenic aggregates for HAb2 and GP4f cell lines fusingwith RBCs from Danieli et al. (1996) is;3, the solution tothe nucleation equation (Eq. A6) is constrained for the valueof nF. Fig. 6shows that the number of free HAs,nF, requiredin the fusogenic aggregate depend mostly on the value ofthe binding constant, using Eq. A9. Dots show averagevalues for the three glycophorin densities used (2000, 5000,and 10,000/mm2) and error bars are for standard deviationsfor the different densities, as used in Fig. 5. It is clear onceagain that the actual value of glycophorin surface density isnot crucial for these ratios. This constrained solution re-quires that the number of free HAs in the fusogenic aggre-gate,nF ' 2, when the binding constantKs . 1022 (mol-ecules/mm2)21. This is the same number as the consensusminimal fusion unit,q 5 2. Thus, it seems clear that theminimal fusion unit, i.e., those HAs that undergo the essen-
FIGURE 5 Dependence of ratio of surface densities on the receptor-HAbinding constant in the area of apposition for the HA-expressing cells.Calculations were done using receptor surface densities of 2000, 5000, and10,000/mm2 based on existing data for glycophorins on RBCs (Marchesi etal., 1972; Leikina et al., 2000). Dots show the average ratios obtained fromthe calculations for these three surface densities and error bars are standarddeviations. The separate ratios of free HA, bound HA, and total HA in thearea of apposition are shown.
1528 Mittal and Bentz
Biophysical Journal 81(3) 1521–1535

tial conformational change, must be composed of free HAs,while the remaining HAs in the fusogenic aggregate can beeither free or bound.
For the data of Melikyan et al. (1995), where the targetmembrane was ganglioside-containing planar bilayer, Bentz(2000a) assumed that all of the HAs in the fusogenic ag-gregate could undergo the essential conformational change,i.e., vf 5 v. Here, for the data of Danieli et al. (1996) andBlumenthal et al. (1996), for the target membrane glycoph-orin on the RBC, we find that only those HAs not bound tosialates can undergo the essential conformational change,complementing the results of Leikina et al. (2000). Hence,the fits needed to havevf 5 2 or 3. Operationally, we fittedthe data twice, first withvf 5 v 5 8, to discover that theratio ofNv(HAb2)/Nv(GP4f) had been reduced to;3, com-pared with value of;40 for the data of Melikyan et al.(1995). The second fitting used wasvf 5 nf 5 2, whichgives the estimated parameter ranges reported in Table 2.Because the overall rate constant in the kinetic equations isvfkf, the values ofkf for the fits withvf 5 v 5 8 were;5.5times smaller forq 5 2 and;4.0 times smaller forq 5 3.Other parameters were insignificantly affected. Thus, the35-fold difference in lag times for fusion pore formationbetween Melikyan et al. (1995) and Blumenthal et al. (1996)translates to a 100-fold difference in the estimate for the rateconstantkf. Because the major difference between the two
studies was the target membrane, we will consider belowhow this might affectkf.
Membrane fusion site architecture cannot bepredicted by lag times
Although our primary point is that an unrestricted compre-hensive kinetic model for HA-mediated fusion shown inFig. 1 can simultaneously fit these disparate data, we havealso studied the predictive power of the equations used inthe original studies. Blumenthal et al. (1996) fitted thecumulant waiting time between fusion pore formation andcontent mixing, i.e., the transition FP3 FS using thenotation of Fig. 1, to an equation for ann-mer aggregate ofHAs executing independent and identical conformationalchanges with a rate constantk. The value ofn andk werefitted. They only used one cell line, GP4f, and there is noobvious way to simultaneously fit data from other cell lineswith their equation. They reported that the compound pro-cess of FP3 FS requiredn 5 6, which we confirmed usingtheir Eq. 3. We also fitted their FP3 LC data to their Eq.3 and found thatn 5 2.8, while fitting the LC3 FS datarequiredn 5 1.7. The model is not additive for some reason.
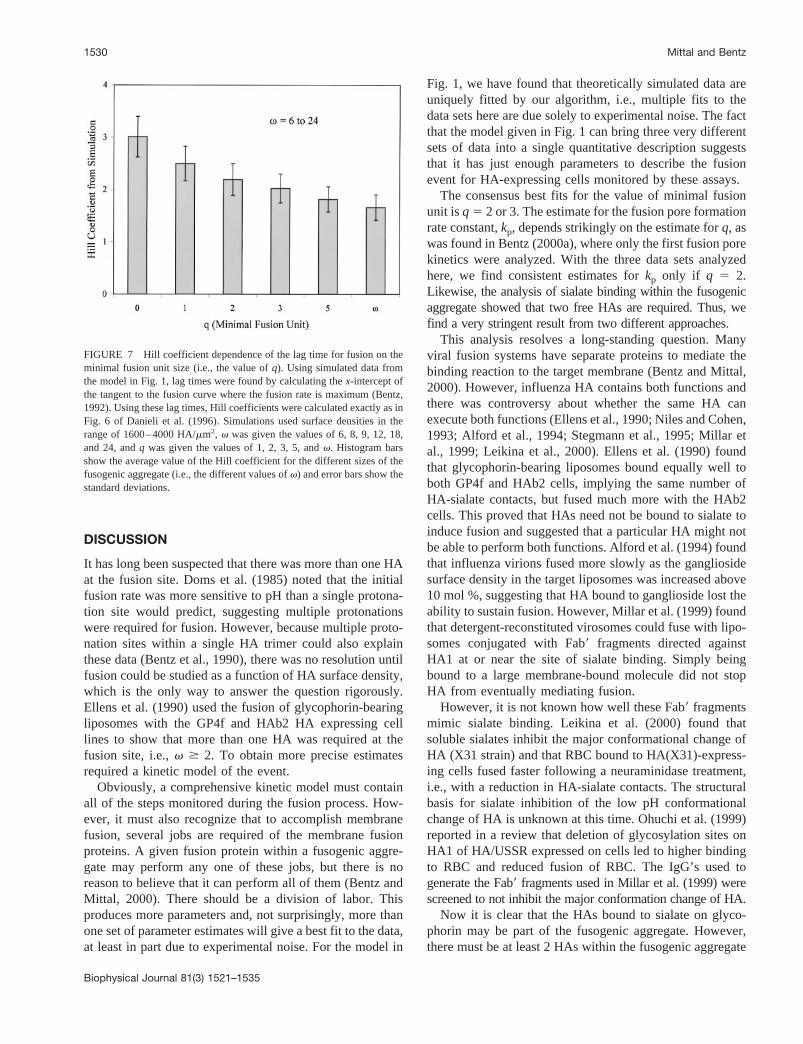
Danieli et al. (1996) used a version of a Hill plot of lagtimes to try to extract the “cooperative unit” of fusion, ashave Stegmann et al. (1990) and Gu¨nter-Ausborn et al.(2000). We investigated the validity of the Hill plot analysisby simulating data for lipid mixing using our kinetic modeland subjecting this simulated data to the Hill plot analysisused in Danieli et al. (1996). We used HA surface densitiesover the range of 1600 to 4000 HA/mm2, v was given thevalues of 6, 8, 9, 12, 18, and 24, andq was given the valuesof 1, 2, 3, 5, andv. Thus, a wide range of possibilities weretested. The kinetic constants werekf 5 1024 s21, kp 5 1024
s21, and kl 5 1022 s21. Using other values within theranges shown for the data in Table 2 would only change thetime scales of the simulations and would not alter theconclusions we reach. Fig. 7 shows results of this analysisas the values of Hill coefficients (calculated as in Fig. 6 ofDanieli et al., 1996) plotted against the various values ofqused to simulate the data. The height of the bars shows theaverage value of the Hill coefficient for all the differentvalues ofv used, 6 to 24, and error bars show the standarddeviations. It is clear thatv, the minimal aggregate size,makes little difference to the value of the Hill coefficient. AHill coefficient, by any simple definition of cooperativity,should reflect either the value ofq or (v 2 q) in our kineticmodel. It correlates with neither in any predictive sense, asfound before with a simpler kinetic model (Bentz, 1992).For all the values ofq andv used, the Hill coefficient wasin the range of 1.25–3.51. The value of the Hill coefficientobtained by Danieli et al. (1996) was 2.83, i.e., within thisrange and implying thatq 5 0. These Hill plots have novalidity for a kinetic process and no predictive power for thekinetic model used here.
FIGURE 6 Number of free HA in the fusogenic aggregate as a functionof the binding constant. A fusogenicv-mer aggregate can be composed ofnF free and (v 2 nF) bound HA. Given that the ratio of fusogenicaggregates is;3, the solution to nucleation reaction (Eqs. A6–A9) isconstrained for values ofnF. This constrained solution requires that thenumber of free HAs in the fusogenic aggregate,nF ' 2, when the bindingconstantKs . 1022 (molecules/mm2)21. Calculations were done usingreceptor surface densities of 2000, 5000, and 10,000/mm2, as in Fig. 5.Dots on the curve show the averages obtained from these calculations forthe three surface densities and error bars are standard deviations for thethree different receptor surface densities, as in Fig. 5.
Sialate Binding in Influenza HA-Mediated Fusion 1529
Biophysical Journal 81(3) 1521–1535
DISCUSSION
It has long been suspected that there was more than one HAat the fusion site. Doms et al. (1985) noted that the initialfusion rate was more sensitive to pH than a single protona-tion site would predict, suggesting multiple protonationswere required for fusion. However, because multiple proto-nation sites within a single HA trimer could also explainthese data (Bentz et al., 1990), there was no resolution untilfusion could be studied as a function of HA surface density,which is the only way to answer the question rigorously.Ellens et al. (1990) used the fusion of glycophorin-bearingliposomes with the GP4f and HAb2 HA expressing celllines to show that more than one HA was required at thefusion site, i.e.,v $ 2. To obtain more precise estimatesrequired a kinetic model of the event.
Obviously, a comprehensive kinetic model must containall of the steps monitored during the fusion process. How-ever, it must also recognize that to accomplish membranefusion, several jobs are required of the membrane fusionproteins. A given fusion protein within a fusogenic aggre-gate may perform any one of these jobs, but there is noreason to believe that it can perform all of them (Bentz andMittal, 2000). There should be a division of labor. Thisproduces more parameters and, not surprisingly, more thanone set of parameter estimates will give a best fit to the data,at least in part due to experimental noise. For the model in
Fig. 1, we have found that theoretically simulated data areuniquely fitted by our algorithm, i.e., multiple fits to thedata sets here are due solely to experimental noise. The factthat the model given in Fig. 1 can bring three very differentsets of data into a single quantitative description suggeststhat it has just enough parameters to describe the fusionevent for HA-expressing cells monitored by these assays.
The consensus best fits for the value of minimal fusionunit isq 5 2 or 3. The estimate for the fusion pore formationrate constant,kp, depends strikingly on the estimate forq, aswas found in Bentz (2000a), where only the first fusion porekinetics were analyzed. With the three data sets analyzedhere, we find consistent estimates forkp only if q 5 2.Likewise, the analysis of sialate binding within the fusogenicaggregate showed that two free HAs are required. Thus, wefind a very stringent result from two different approaches.
This analysis resolves a long-standing question. Manyviral fusion systems have separate proteins to mediate thebinding reaction to the target membrane (Bentz and Mittal,2000). However, influenza HA contains both functions andthere was controversy about whether the same HA canexecute both functions (Ellens et al., 1990; Niles and Cohen,1993; Alford et al., 1994; Stegmann et al., 1995; Millar etal., 1999; Leikina et al., 2000). Ellens et al. (1990) foundthat glycophorin-bearing liposomes bound equally well toboth GP4f and HAb2 cells, implying the same number ofHA-sialate contacts, but fused much more with the HAb2cells. This proved that HAs need not be bound to sialate toinduce fusion and suggested that a particular HA might notbe able to perform both functions. Alford et al. (1994) foundthat influenza virions fused more slowly as the gangliosidesurface density in the target liposomes was increased above10 mol %, suggesting that HA bound to ganglioside lost theability to sustain fusion. However, Millar et al. (1999) foundthat detergent-reconstituted virosomes could fuse with lipo-somes conjugated with Fab9 fragments directed againstHA1 at or near the site of sialate binding. Simply beingbound to a large membrane-bound molecule did not stopHA from eventually mediating fusion.
However, it is not known how well these Fab9 fragmentsmimic sialate binding. Leikina et al. (2000) found thatsoluble sialates inhibit the major conformational change ofHA (X31 strain) and that RBC bound to HA(X31)-express-ing cells fused faster following a neuraminidase treatment,i.e., with a reduction in HA-sialate contacts. The structuralbasis for sialate inhibition of the low pH conformationalchange of HA is unknown at this time. Ohuchi et al. (1999)reported in a review that deletion of glycosylation sites onHA1 of HA/USSR expressed on cells led to higher bindingto RBC and reduced fusion of RBC. The IgG’s used togenerate the Fab9 fragments used in Millar et al. (1999) werescreened to not inhibit the major conformation change of HA.
Now it is clear that the HAs bound to sialate on glyco-phorin may be part of the fusogenic aggregate. However,there must be at least 2 HAs within the fusogenic aggregate
FIGURE 7 Hill coefficient dependence of the lag time for fusion on theminimal fusion unit size (i.e., the value ofq). Using simulated data fromthe model in Fig. 1, lag times were found by calculating thex-intercept ofthe tangent to the fusion curve where the fusion rate is maximum (Bentz,1992). Using these lag times, Hill coefficients were calculated exactly as inFig. 6 of Danieli et al. (1996). Simulations used surface densities in therange of 1600–4000 HA/mm2, v was given the values of 6, 8, 9, 12, 18,and 24, andq was given the values of 1, 2, 3, 5, andv. Histogram barsshow the average value of the Hill coefficient for the different sizes of thefusogenic aggregate (i.e., the different values ofv) and error bars show thestandard deviations.
1530 Mittal and Bentz
Biophysical Journal 81(3) 1521–1535
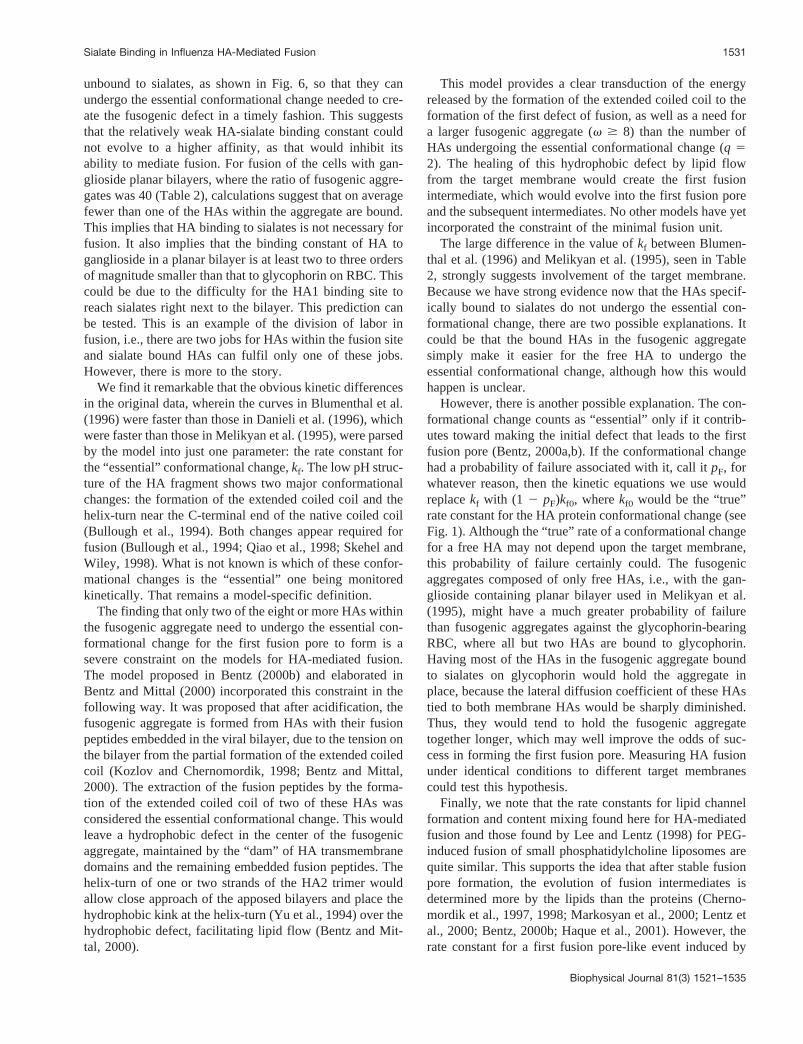
unbound to sialates, as shown in Fig. 6, so that they canundergo the essential conformational change needed to cre-ate the fusogenic defect in a timely fashion. This suggeststhat the relatively weak HA-sialate binding constant couldnot evolve to a higher affinity, as that would inhibit itsability to mediate fusion. For fusion of the cells with gan-glioside planar bilayers, where the ratio of fusogenic aggre-gates was 40 (Table 2), calculations suggest that on averagefewer than one of the HAs within the aggregate are bound.This implies that HA binding to sialates is not necessary forfusion. It also implies that the binding constant of HA toganglioside in a planar bilayer is at least two to three ordersof magnitude smaller than that to glycophorin on RBC. Thiscould be due to the difficulty for the HA1 binding site toreach sialates right next to the bilayer. This prediction canbe tested. This is an example of the division of labor infusion, i.e., there are two jobs for HAs within the fusion siteand sialate bound HAs can fulfil only one of these jobs.However, there is more to the story.
We find it remarkable that the obvious kinetic differencesin the original data, wherein the curves in Blumenthal et al.(1996) were faster than those in Danieli et al. (1996), whichwere faster than those in Melikyan et al. (1995), were parsedby the model into just one parameter: the rate constant forthe “essential” conformational change,kf. The low pH struc-ture of the HA fragment shows two major conformationalchanges: the formation of the extended coiled coil and thehelix-turn near the C-terminal end of the native coiled coil(Bullough et al., 1994). Both changes appear required forfusion (Bullough et al., 1994; Qiao et al., 1998; Skehel andWiley, 1998). What is not known is which of these confor-mational changes is the “essential” one being monitoredkinetically. That remains a model-specific definition.
The finding that only two of the eight or more HAs withinthe fusogenic aggregate need to undergo the essential con-formational change for the first fusion pore to form is asevere constraint on the models for HA-mediated fusion.The model proposed in Bentz (2000b) and elaborated inBentz and Mittal (2000) incorporated this constraint in thefollowing way. It was proposed that after acidification, thefusogenic aggregate is formed from HAs with their fusionpeptides embedded in the viral bilayer, due to the tension onthe bilayer from the partial formation of the extended coiledcoil (Kozlov and Chernomordik, 1998; Bentz and Mittal,2000). The extraction of the fusion peptides by the forma-tion of the extended coiled coil of two of these HAs wasconsidered the essential conformational change. This wouldleave a hydrophobic defect in the center of the fusogenicaggregate, maintained by the “dam” of HA transmembranedomains and the remaining embedded fusion peptides. Thehelix-turn of one or two strands of the HA2 trimer wouldallow close approach of the apposed bilayers and place thehydrophobic kink at the helix-turn (Yu et al., 1994) over thehydrophobic defect, facilitating lipid flow (Bentz and Mit-tal, 2000).
This model provides a clear transduction of the energyreleased by the formation of the extended coiled coil to theformation of the first defect of fusion, as well as a need fora larger fusogenic aggregate (v $ 8) than the number ofHAs undergoing the essential conformational change (q 52). The healing of this hydrophobic defect by lipid flowfrom the target membrane would create the first fusionintermediate, which would evolve into the first fusion poreand the subsequent intermediates. No other models have yetincorporated the constraint of the minimal fusion unit.
The large difference in the value ofkf between Blumen-thal et al. (1996) and Melikyan et al. (1995), seen in Table2, strongly suggests involvement of the target membrane.Because we have strong evidence now that the HAs specif-ically bound to sialates do not undergo the essential con-formational change, there are two possible explanations. Itcould be that the bound HAs in the fusogenic aggregatesimply make it easier for the free HA to undergo theessential conformational change, although how this wouldhappen is unclear.
However, there is another possible explanation. The con-formational change counts as “essential” only if it contrib-utes toward making the initial defect that leads to the firstfusion pore (Bentz, 2000a,b). If the conformational changehad a probability of failure associated with it, call itpF, forwhatever reason, then the kinetic equations we use wouldreplacekf with (1 2 pF)kf0, wherekf0 would be the “true”rate constant for the HA protein conformational change (seeFig. 1). Although the “true” rate of a conformational changefor a free HA may not depend upon the target membrane,this probability of failure certainly could. The fusogenicaggregates composed of only free HAs, i.e., with the gan-glioside containing planar bilayer used in Melikyan et al.(1995), might have a much greater probability of failurethan fusogenic aggregates against the glycophorin-bearingRBC, where all but two HAs are bound to glycophorin.Having most of the HAs in the fusogenic aggregate boundto sialates on glycophorin would hold the aggregate inplace, because the lateral diffusion coefficient of these HAstied to both membrane HAs would be sharply diminished.Thus, they would tend to hold the fusogenic aggregatetogether longer, which may well improve the odds of suc-cess in forming the first fusion pore. Measuring HA fusionunder identical conditions to different target membranescould test this hypothesis.
Finally, we note that the rate constants for lipid channelformation and content mixing found here for HA-mediatedfusion and those found by Lee and Lentz (1998) for PEG-induced fusion of small phosphatidylcholine liposomes arequite similar. This supports the idea that after stable fusionpore formation, the evolution of fusion intermediates isdetermined more by the lipids than the proteins (Cherno-mordik et al., 1997, 1998; Markosyan et al., 2000; Lentz etal., 2000; Bentz, 2000b; Haque et al., 2001). However, therate constant for a first fusion pore-like event induced by
Sialate Binding in Influenza HA-Mediated Fusion 1531
Biophysical Journal 81(3) 1521–1535
PEG is several orders of magnitude faster than what wemeasure here for HA-induced fusion, again showing thatHA is intimately involved in its formation (Melikyan et al.,1997, 1999, 2000; Chernomordik et al., 1998, 1999; Mar-kosyan et al., 2000, 2001; Bentz, 2000b).
The transfer of control from protein constraints to lipidconstraints is likely to be gradual. The path between the firstfusion pore and lipid mixing is clearly complex (Markosyanet al., 2001). Furthermore, a sequence of first-order pro-cesses, such as a sequence of intermediates from first fusionpore to lipid mixing, can be well-fitted as a single first-orderprocess, as done here, without any one step being rate-limiting (Bentz, 1992). Comparison of the sequence as afunction of HA surface density will be essential to under-standing it (Bentz, 2000a).
APPENDIX A
Accumulation of HAs in the area of contact dueto sialate binding to HA1
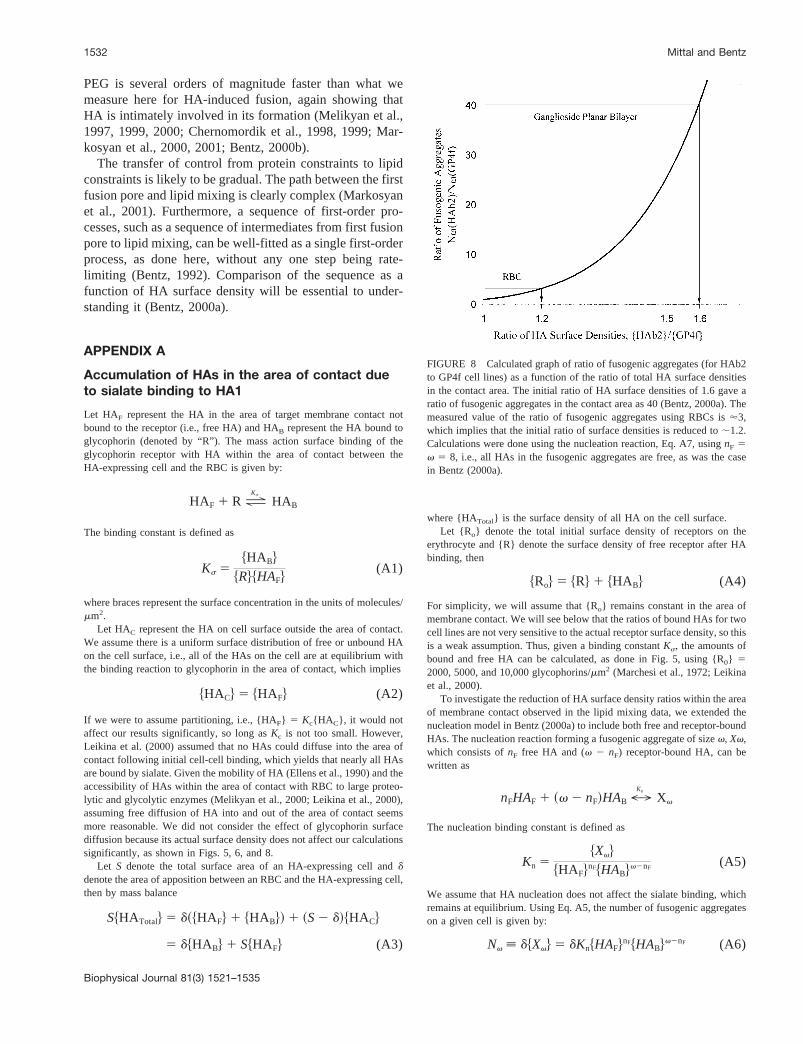
Let HAF represent the HA in the area of target membrane contact notbound to the receptor (i.e., free HA) and HAB represent the HA bound toglycophorin (denoted by “R”). The mass action surface binding of theglycophorin receptor with HA within the area of contact between theHA-expressing cell and the RBC is given by:
HAF 1 RºKs
HAB
The binding constant is defined as
Ks 5$HAB%
$R%$HAF%(A1)
where braces represent the surface concentration in the units of molecules/mm2.
Let HAC represent the HA on cell surface outside the area of contact.We assume there is a uniform surface distribution of free or unbound HAon the cell surface, i.e., all of the HAs on the cell are at equilibrium withthe binding reaction to glycophorin in the area of contact, which implies
$HAC% 5 $HAF% (A2)
If we were to assume partitioning, i.e., {HAF} 5 Kc{HA C}, it would notaffect our results significantly, so long asKc is not too small. However,Leikina et al. (2000) assumed that no HAs could diffuse into the area ofcontact following initial cell-cell binding, which yields that nearly all HAsare bound by sialate. Given the mobility of HA (Ellens et al., 1990) and theaccessibility of HAs within the area of contact with RBC to large proteo-lytic and glycolytic enzymes (Melikyan et al., 2000; Leikina et al., 2000),assuming free diffusion of HA into and out of the area of contact seemsmore reasonable. We did not consider the effect of glycophorin surfacediffusion because its actual surface density does not affect our calculationssignificantly, as shown in Figs. 5, 6, and 8.
Let S denote the total surface area of an HA-expressing cell andddenote the area of apposition between an RBC and the HA-expressing cell,then by mass balance
S$HATotal% 5 d~$HAF% 1 $HAB%! 1 ~S2 d!$HAC%
5 d$HAB% 1 S$HAF% (A3)
where {HATotal} is the surface density of all HA on the cell surface.Let {Ro} denote the total initial surface density of receptors on the
erythrocyte and {R} denote the surface density of free receptor after HAbinding, then
$Ro% 5 $R% 1 $HAB% (A4)
For simplicity, we will assume that {Ro} remains constant in the area ofmembrane contact. We will see below that the ratios of bound HAs for twocell lines are not very sensitive to the actual receptor surface density, so thisis a weak assumption. Thus, given a binding constantKs, the amounts ofbound and free HA can be calculated, as done in Fig. 5, using {R0} 52000, 5000, and 10,000 glycophorins/mm2 (Marchesi et al., 1972; Leikinaet al., 2000).
To investigate the reduction of HA surface density ratios within the areaof membrane contact observed in the lipid mixing data, we extended thenucleation model in Bentz (2000a) to include both free and receptor-boundHAs. The nucleation reaction forming a fusogenic aggregate of sizev, Xv,which consists ofnF free HA and (v 2 nF) receptor-bound HA, can bewritten as
nFHAF 1 ~v 2 nF!HAB7Kn
Xv
The nucleation binding constant is defined as
Kn 5$Xv%
$HAF%nF$HAB%v2nF
(A5)
We assume that HA nucleation does not affect the sialate binding, whichremains at equilibrium. Using Eq. A5, the number of fusogenic aggregateson a given cell is given by:
Nv ; d$Xv% 5 dKn$HAF%nF$HAB%v2nF (A6)
FIGURE 8 Calculated graph of ratio of fusogenic aggregates (for HAb2to GP4f cell lines) as a function of the ratio of total HA surface densitiesin the contact area. The initial ratio of HA surface densities of 1.6 gave aratio of fusogenic aggregates in the contact area as 40 (Bentz, 2000a). Themeasured value of the ratio of fusogenic aggregates using RBCs is'3,which implies that the initial ratio of surface densities is reduced to;1.2.Calculations were done using the nucleation reaction, Eq. A7, usingnF 5v 5 8, i.e., all HAs in the fusogenic aggregates are free, as was the casein Bentz (2000a).
1532 Mittal and Bentz
Biophysical Journal 81(3) 1521–1535

Thus the ratio of fusogenic aggregates on two cell lines is given by:
Nv~HAb2)
Nv~GP4f)5 SHAF~HAb2!
HAF~GP4f!DvS1 1 Ks$HAF~GP4f!%
1 1 Ks$HAF~HAb2!%Dv2nF
(A7)which actually does not depend on the nucleation constantKn.
Equation A7 can be solved fornF for a fixed ratio of fusogenicaggregates (Table 2) as a function ofKs and total receptor concentrationRo, as done in Fig. 6. The heavy curve shown in Fig. 8 is the ratio offusogenic aggregates for other ratios of HA surface densities in the area ofcontact. The measured value for ratio of fusogenic aggregates for the RBC is;3, which implies that the initial ratio of surface densities is reduced to;1.2.
APPENDIX B
Predicting fluorescence dequenching from lipidmixing kinetics
We start from the treatment of Chen and Blumenthal (1989). The formationof the lipid channel, LC, demarks the beginning of lipid flow between thehost and target membrane. We will consider the fusion of a fluorescentlylabeled RBC, with surface areaAE, to an HA-expressing cell with surfacearea AC, where there arem $ 1 RBC bound per cell on average. Theequilibrium of this flow will depend upon the relative areas of the fusing cells.Here, we will assume that each RBC fuses independently and that the areaof the cell patch available for probe dilution for that RBC isAP 5 AC/m,which is the eventual plateau value. This ignores some complications at theend of the dilution process, which require small corrections to the predictedfluorescence intensities at the cost of much more complex equations.
Fluorescence from a single RBC
For one RBC, the surface fraction of the fused product coming from thisRBC is:
s 5AE
AE 1 AP(B1)
The average number of fluorescent probes on the RBC is denotedNE(0)before the lipid channel opens andNE(t) thereafter. It is essential to realizethat each RBC will have different opening times, which we will treatexplicitly below. Here we consider just the case of a given RBC.
Although lipid fluorophor labeling of RBC is heterogeneous, we willsimply use the average value of fluorophors per RBC throughout. Also, toavoid a cluttered nomenclature,NE(0) etc. will denote these averageswithout explicit brackets. The number of probes transferred to the patch ofcell available to this RBC will depend upon time and is denotedNP(t) 5NE(0) 2 NE(t). At equilibrium, NE(`) 5 sNE(0) andNP(`) 5 NE(0)(1 2s). Chen and Blumenthal (1989) show formal equations for explicitlytreating distributions, but if the labeling distributions are Gaussian-like,then the use of averages here should make little difference in the outcome.Thus, assuming average amounts of label per erythrocyte, the fluorescenceintensity due to the probes from this RBC initially, finally and at timet are,respectively:
F~0! 5 NE~0!QFNE~0!
AEG
F~`! 5 NE~`!QFNE~`!
AEG 1 NP~`!QFNP~`!
APG
5 NE~0!QFsNE~0!
AEG
F~t! 5 NE~t!QFNE~t!
AEG 1 NP~t!QFNP~t!
APG (B2)
5 NE~t!QFNE~t!
AEG 1 ~NE~0!
2 NE~t!!QFs~NE~0! 2 NE~t!!
~1 2 s!AEG
whereQ[N/A] is the relative fluorescence of probes that are quenched byForster energy transfer when there areN acceptors per areaA (Wolber andHudson, 1979; Du¨zgunes and Bentz, 1988). Thus, the relative fluorescencedue to lipid mixing, normalized to the equilibrium or plateau value, i.e., notdetergent lysis, is:
I~t! 5F~t! 2 F~0!
F~`! 2 F~0!
5
h~t!Q@h~t!a0# 1 ~1 2 h~t!!QF~1 2 h~t!!
~1 2 s!sa0G 2 Q@a0#
Q@sa0# 2 Q@a0#
(B3)
whereh(t) 5 NE(t)/NE(0) anda0 5 NE(0)/AE.At low concentrations of acceptor, whereQ[N/A] ' 1 2 constant*N/A
(Hoekstra et al., 1984), Eq. B3 simplifies to:
I~t! 5~1 2 h~t!!~1 1 h~t! 2 2s!
~1 2 s!2 (B4)
Interestingly, when dequenching is not linear, Eqs. B3 and B4 predict verysimilar values, within 10% relative error, due to the normalization. Thusthe linear form is reasonable for us, given the scatter in the data.
Transforming the waiting time distribution tofluorescence dequenching
Now, Eq. B3 or B4 refer only to the dequenching of a particular RBC/cellfusion when the opening time is known. The real problem is that each ofthe RBC will have its lipid channel form at a different time and theensemble fluorescence intensity would depend upon this distribution ofopening times. This is whyI(t) does not equal the fraction of fused cells.
When LC(t) denotes the average number of lipid channels in the area ofapposition between the RBC and the cell (Fig. 1), then we can use thePoisson distribution to obtain the fraction of RBC with one or more lipidchannels,NLC(t) (Bentz, 1992, 2000a):
NLC~t! 5 1 2 exp$2LC(t)} (B5)
This gives us the waiting time function used to fit the data of Blumenthalet al. (1996). To predict the cuvette fluorescence intensity from the waitingtime distribution, we need to know how much of the probe has flowedthrough the channel since its formation, because that could be fast or slow,depending upon the probe.
If the time required for the probe to redistribute is fast compared withthe time required for the next lipid channel to form, then the fraction ofprobe remaining on the RBC that have lipid channels will besNLC(t). Thefraction of probe remaining on RBC that have not formed a lipid channelis obviously 12 NLC(t). Thus, in this case, the average fraction of probeon the RBC would be:
^h~t!& 5 ~1 2 NLC~t!! 1 sNLC~t! (B6)
Sialate Binding in Influenza HA-Mediated Fusion 1533
Biophysical Journal 81(3) 1521–1535

and the expected fluorescence from Eq. B4 would be,
I~t! 5 NLC~t!~2 2 NLC~t!! (B7)
using Eq. B6. This gives the simplest transformation between the measuredfluorescence intensity and the number of RBC that have a lipid channel. Ifthe lipid transfer is slow, then the fitting ofI(t) using Eq. B7 wouldunderestimate the value fork1 relative to a direct fitting ofNLC(t) (Mittalet al., 2001).
We thank Robert Blumenthal, Tsafi Danieli, and Judy White for kindlyproviding the original data used here. We also thank Drexel University forthe allocation of computer time.
REFERENCES
Alford, D., H. Ellens, and J. Bentz. 1994. Fusion of influenza virus withsialic acid-bearing target membranes.Biochemistry.33:1977–1987.
Bentz, J. 1992. Intermediates and kinetics of membrane fusion.Biophys. J.63:448–459.
Bentz, J. 1993. Viral Fusion Mechanisms. CRC Press, Boca Raton, FL.
Bentz, J. 2000a. Minimal aggregate size and minimal fusion unit for thefirst fusion pore of influenza hemagglutinin-mediated membrane fusion.Biophys. J.78:227–245.
Bentz, J. 2000b. Membrane fusion mediated by coiled coils: a hypothesis.Biophys. J.78:886–900.
Bentz, J., H. Ellens, and D. Alford. 1990. An architecture for the fusion siteof influenza hemagglutinin.FEBS Lett.276:1–5.
Bentz, J., and A. Mittal. 2000. Deployment of membrane fusion proteindomains during fusion.Cell Biol Int. 24:819–838.
Blumenthal, R., D. P. Sarkar, S. Durell, D. E. Howard, and S. J. Morris.1996. Dilation of the influenza hemagglutinin fusion pore revealed bythe kinetics of individual fusion events.J. Cell Biol. 135:63–71.
Bottcher, C., K. Ludwig, A. Herrmann, M. van Heel, and K. Stark. 1999.Structure of the influenza haemagglutinin at neutral and at fusogenic pHby electron cryo-microscopy.FEBS. Lett.463:255–259.
Bullough, P. A., F. M. Hughson, J. J. Skehel, and D. C. Wiley. 1994.Structure of influenza haemagglutinin at the pH of membrane fusion.Nature.371:37–43.
Carr, C. M., C. Chaudhry, and P. S. Kim. 1997. Influenza hemagglutinin isspring-loaded by a metastable native configuration.Proc. Natl. Acad.Sci. USA.94:14306–14313.
Chen, Y. D., and R. Blumenthal. 1989. On the use of self-quenchingfluorophores in the study of membrane fusion kinetics. The effect ofslow probe redistribution.Biophys. Chem.34:283–292.
Chen, J., S. Wharton, W. Weissenhorn, L. Calder, F. Hughson, J. J. Skehel,and D. C. Wiley. 1995. A soluble domain of the membrane-anchoringchain of influenza virus hemagglutinin (HA2) folds inEscherichia coliinto the low pH induced conformation.Proc. Natl. Acad. Sci. USA.92:12205–12209.
Chernomordik, L. V., V. A. Frolov, E. Leikina, P. Bronk, and J. Zimmer-berg. 1998. The pathway of membrane fusion catalyzed by influenzahemagglutinin: restriction of lipids, hemifusion, and lipid fusion poreformation.J. Cell. Biol.140:1369–1382.
Chernomordik, L. V., E. Leikina, V. Frolov, P. Bronk, and J. Zimmerberg.1997. An early stage of membrane fusion mediated by the low pHconformation of influenza hemagglutinin depends upon membrane lip-ids. J. Cell. Biol.136:81–93.
Danieli, T., S. L. Pelletier, Y. I. Henis, and J. M. White. 1996. Membranefusion mediated by the influenza virus hemagglutinin requires the con-certed action of at least three hemagglutinin trimers.J. Cell Biol.133:559–569.
Doms, R. W., A. Helenius, and J. White. 1985. Membrane fusion activityof the influenza virus hemagglutinin. The low pH-induced conforma-tional change.J. Biol. Chem.260:2973–2981.
Duzgunes, N., and J. Bentz. 1988. Fluorescence assays for membranefusion. In Spectroscopic Membrane Probes, Vol. I, L. M. Lowe, editor.CRC Press Inc., Boca Raton, FL. 117–159.
Ellens, H., J. Bentz, D. Mason, F. Zhang, and J. M. White. 1990. Fusion ofinfluenza hemagglutinin-expressing fibroblasts with glycophorin-bearing liposomes: role of hemagglutinin surface density.Biochemistry.29:9697–9707.
Gunter-Ausborn, S., P. Schoen, I. Bartholdus, J. Wilschut, and T. Steg-mann. 2000. Role of hemagglutinin surface density in the initial stagesof influenza virus fusion: lack of evidence for cooperativity.J. Virol.74:2714–2720.
Haque, M. E., T. J. McIntosh, and B. R. Lentz. 2001. Influence of lipidcomposition on physical properties and peg-mediated fusion of curvedand uncurved modelmembrane vesicles: “nature’s own” fusogenic lipidbilayer.Biochemistry.40:4340–4348.
Hernandez, L. D., L. R. Hoffman, T. G. Wolfsberg, and J. M. White. 1996.Virus-cell and cell-cell fusion.Annu. Rev. Cell Dev. Biol.12:627–661.
Hoekstra, D., T. de Boer, K. Klappe, and J. Wilschut. 1984. Fluorescencemethod for measuring the kinetics of fusion between biological mem-branes.Biochemistry.23:5675–5681.
Kozlov, M. M., and L. V. Chernomordik. 1998. A mechanism of protein-mediated fusion: coupling between refolding of the influenza hemag-glutinin and lipid rearrangements.Biophys. J.75:1384–1396.
Lee, J-K., and B. R. Lentz. 1998. Secretory and viral fusion may sharemechanistic events with fusion between curved lipid bilayers.Proc.Natl. Acad. Sci. U.S.A.95:9274–9279.
Leikina, E., I. Markovic, L. V. Chernomordik, and M. M. Kozlov. 2000.Delay of influenza hemagglutinin refolding into a fusion-competentconformation by receptor binding: a hypothesis.Biophys. J. 79:1415–1427.
Lentz, B. R., V. Malinin, M. E. Haque, and K. Evans. 2000. Proteinmachines and lipid assemblies: current views of cell membrane fusion.Curr. Opin. Struct. Biol.10:607–615.
Marchesi, V. T., T. W. Tillack, R. L. Jackson, J. P. Segrest, and R. E. Scott.1972. Chemical characterization and surface orientation of the majorglycoprotein of the human erythrocyte membrane.Proc. Natl. Acad. Sci.U.S.A.69:1445–1449.
Markosyan, R. M., F. S. Cohen, and G. B. Melikyan. 2000. The lipid-anchored ectodomain of influenza virus hemagglutinin (GPI-HA) iscapable of inducing nonenlarging fusion pores.Mol. Biol. Cell. 11:1143–1152.
Markosyan, R. M., G. B. Melikyan, and F. S. Cohen. 2001. Evolution ofintermediates of influenza virus hemagglutinin-mediated fusion revealedby kinetic measurements of pore formation.Biophys. J.80:812–821.
Melikyan, G. B., H. Jin, R. A. Lamb, and F. S. Cohen. 1997. The role ofthe cytoplasmic tail region of influenza virus hemagglutinin in formationand growth of fusion pores.Virology. 235:118–128.
Melikyan, G. B., S. Lin, M. G. Roth, and F. S. Cohen. 1999. Amino acidsequence requirements of the transmembrane and cytoplasmic domainsof influenza virus hemagglutinin for viable membrane fusion.Mol. Biol.Cell. 10:1821–1836.
Melikyan, G. B., R. M. Markosyan, M. G. Roth, and F. S. Cohen. 2000. Apoint mutation in the transmembrane domain of the hemagglutinin ofinfluenza virus stabilizes a hemifusion intermediate that can transit tofusion.Mol. Biol. Cell. 11:3765–3775.
Melikyan, G. B., W. Niles, and F. S. Cohen. 1995. The fusion kinetics ofinfluenza hemagglutinin expressing cells to planar bilayer membranes isaffected by HA surface density and host cell surface.J. Gen. Physiol.106:783–802.
Millar, B. M., L. J. Calder, J. J. Skehel, and D. C. Wiley. 1999. Membranefusion by surrogate receptor-bound influenza haemagglutinin.Virology.257:415–423.
Mittal, A., E. Leikina, J. Bentz, and L. V. Chernomordik. 2001. Kinetics ofRBC fusion with influenza hemagglutinin-expressing cells as a functionof technique.Biophys. J.80(Part 2):417a. (Abstr.).
Niles, W. D., and F. S. Cohen. 1993. Single event recording shows thatdocking onto receptor alters the kinetics of membrane fusion mediatedby influenza hemagglutinin.Biophys. J.65:171–176.
1534 Mittal and Bentz
Biophysical Journal 81(3) 1521–1535

Ohuchi, M., R. Ohuchi, and A. Matsumoto. 1999. Control of biologicalactivities of influenza virus hemagglutinin by its carbohydrate moiety.Microbiol. Immunol.43:1071–1076.
Pisano, A., J. W. Redmond, K. L. Williams, and A. A. Gooley. 1993.Glycosylation sites identified by solid-phase Edman degradation: O-linked glycosylation motifs on human glycophorin A.Glycobiology.3:429–435.
Qiao, H., S. Pelletier, L. Hoffman, J. Hacker, R. Armstrong, and J. M.White. 1998. Specific single or double proline substitutions in the“spring-loaded” coiled coil region of the influenza hemagglutinin impairor abolish membrane fusion activity.J. Cell Biol. 141:1335–1347.
Sauter, N. K., M. D. Bednarski, B. A. Wurzburg, J. E. Hanson, G. M.Whitesides, J. J. Skehel, and D. C. Wiley. 1989. Hemagglutinins fromtwo influenza virus variants bind to sialic acid derivatives with milli-molar dissociation constants: a 500-MHz proton nuclear magnetic res-onance study.Biochemistry.28:8388–8396.
Shangguan, T., D. Alford, and J. Bentz. 1996. Influenza virus-liposomeslipid mixing is leaky and largely insensitive to the material properties ofthe target membrane.Biochemistry.35:4956–4965.
Shangguan, T., D. Siegel, J. Lear, P. Axelsen, D. Alford, and J. Bentz.1998. Morphological changes and fusogenic activity of influenza virushemagglutinin.Biophys. J.74:54–62.
Skehel, J. J., and D. C. Wiley. 1998. Coiled coils in both intracellularvesicle and viral membrane fusion.Cell. 95:871–874.
Stegmann, T., I. Bartoldus, and J. Zumbrunn. 1995. Influenza hemagglu-tinin-mediated membrane fusion: influence of receptor binding on thelag phase preceding fusion.Biochemistry.34:1825–1832.
Stegmann, T., J. M. White, and A. Helenius. 1990. Intermediates ininfluenza induced membrane fusion.EMBO J.13:4231–4241.
White, J., and I. A. Wilson. 1987. Anti-peptide antibodies detect steps in aprotein conformational change: low-pH activation of the influenza virushemagglutinin.J. Cell Biol. 105:2887–2896.
Wilson, I. A., J. J. Skehel, and D. C. Wiley. 1981. Structure of thehaemagglutinin membrane glycoprotein of influenza virus at 3 Å reso-lution. Nature.289:366–373.
Wolber, P. K., and B. S. Hudson. 1979. An analytic solution to the Forsterenergy transfer problem in two dimensions.Biophys. J.28:197–210.
Yu, Y. G., D. S. King, and Y-K. Shin. 1994. Insertion of a coiled-coilpeptide from influenza virus hemagglutinin into membranes.Science.266:274–276.
Zimmerberg, J., R. Blumenthal, D. P. Sarkar, M. Curran, and S. J. Morris.1994. Restricted movement of lipid and aqueous dyes through poresformed by influenza hemagglutinin during cell fusion.J. Cell Biol.127:1885–1894.
Sialate Binding in Influenza HA-Mediated Fusion 1535
Biophysical Journal 81(3) 1521–1535