
Weekly / Semanal Influenza Report EW 23
36
PAHO/OPS | INFLUENZA REGIONAL UPDATE EW 23, 2021 /ACTUALIZACIÓN REGIONAL DE INFLUENZA SE 23 DE 2021 1 2021 Weekly / Semanal Influenza Report EW 23/ Reporte de Influenza SE 23 Regional Update: Influenza & Other Respiratory Viruses / Actualización Regional: Influenza y Otros virus respiratorios Data as of June 18, 2021/ Datos hasta el 18 de junio de 2021 Prepared by PHE/IHM/Influenza Team/ Realizado por PHE/IHM/Equipo de Influenza June 22, 2021 22 de junio de 2021
-
Upload
khangminh22 -
Category
Documents
-
view
8 -
download
0
Transcript of Weekly / Semanal Influenza Report EW 23

PAHO/OPS | INFLUENZA REGIONAL UPDATE EW 23, 2021 /ACTUALIZACIÓN REGIONAL DE INFLUENZA SE 23 DE 2021 1
2021 Weekly / Semanal
Influenza Report EW 23/
Reporte de Influenza SE 23
Regional Update: Influenza & Other Respiratory Viruses / Actualización Regional: Influenza y Otros virus respiratorios
Data as of June 18, 2021/
Datos hasta el 18 de junio de 2021
Prepared by PHE/IHM/Influenza Team/ Realizado por PHE/IHM/Equipo de Influenza
June 22, 2021 22 de junio de 2021

PAHO/OPS | INFLUENZA REGIONAL UPDATE EW 23, 2021 /ACTUALIZACIÓN REGIONAL DE INFLUENZA SE 23 DE 2021 2
FluNet
Map Production /Producción del mapa: PAHO/WHO. OPS/OMS. Data Source / Fuente de datos: Ministries of Health and National Influenza Centers of Member States Reports to the informatics global platforms FluNet and / FluID Informe de los Ministerios de Salud y los Centros Nacionales de Influenza de los Estados Miembros a las plataformas informáticas globales de FluNet y FluID
FluID

PAHO/OPS | INFLUENZA REGIONAL UPDATE EW 23, 2021 /ACTUALIZACIÓN REGIONAL DE INFLUENZA SE 23 DE 2021 3
WEEKLY REPORT DATA SOURCES
The information presented in this update is based on data provided by Ministries of Health and National Influenza Centers of Member States to the global informatics platforms
http://www.who.int/influenza/gisrs_laboratory/flunet/en/ and http://www.who.int/influenza/surveillance_monitoring/fluid/en/;
and reports/weekly bulletins that Ministries of Health published on its website or shared with PAHO/WHO.
La información presentada en esta actualización se obtiene a partir de los datos notificados por los Ministerios de Salud y los Centros Nacionales de Influenza de los Estados Miembros a las plataformas informáticas
globales de la OPS/OMS: FluNet y FluID; y de los informes/boletines semanales que los Ministerios de Salud publican en sus páginas web o comparten con OPS/OMS.
Note: Compared to the same period of the previous years, the current influenza surveillance data should be interpreted in light of the ongoing COVID-19 pandemic, which may have influence, to differing extents, health seeking behaviors, staffing/routines in sentinel sites, and testing capacities in Member States. The various social and physical distancing measures implemented by Member States to reduce SARS-CoV2 virus transmission may also have played a role in reducing substantially or even complete influenza virus transmission. Nota: en comparación con el mismo período de los años anteriores, los datos actuales de vigilancia de la influenza deben interpretarse a la luz de la pandemia de COVID-19 en curso, que puede tener influencia en diferentes grados, comportamientos de búsqueda de salud, personal / rutinas en sitios centinela, y capacidades de prueba en los Estados miembros. Las diversas medidas de distanciamiento social y físico implementadas por los Estados Miembros para reducir la transmisión del virus SARS-CoV2 también pueden haber desempeñado un papel en la reducción sustancial o incluso completa, en la transmisión del virus de la influenza.
PAHO INFLUENZA LINKS
PAHO interactive data / Datos interactivos de la OPS:
PAHO FluNet: http://ais.paho.org/phip/viz/ed_flu.asp
PAHO FluID: http://ais.paho.org/phip/viz/flumart2015.asp
Influenza regional reports / Informes regionales de influenza
In English: https://www.paho.org/hq/influenzareport
En español: www.paho.org/reportesinfluenza
Severe acute respiratory infections network - SARInet Red de las infecciones respiratorias agudas graves - SARInet:
http://www.sarinet.org
Go to Index/ Ir al Índice

PAHO/OPS | INFLUENZA REGIONAL UPDATE EW 23, 2021 /ACTUALIZACIÓN REGIONAL DE INFLUENZA SE 23 DE 2021 4
REPORT INDEX
ÍNDICE DE LA ACTUALIZACIÓN
Section Content Page
1 Weekly Summary / Resumen Semanal 5
2 Influenza Global Update 396/ Actualización de influenza a nivel mundial 396 7
3 Overall Influenza and RSV circulation / Circulación general de los virus
influenza y VRS 9
4 Overall ORV circulation and antigenic characterization of influenza viruses,
2017-20 / Circulación general de OVR y caracterización antigénica de los virus influenza, 2017-20
10
5 Weekly and Cumulative numbers / Números semanales y acumulados 11
6 Epidemiological and Virologic updates by country / Actualización
epidemiológica y virológica por país 12
7 Acronyms / Acrónimos 36
Rep
ort
Ind
ex /
Índ
ice
del
info
rme

PAHO/OPS | INFLUENZA REGIONAL UPDATE EW 23, 2021 /ACTUALIZACIÓN REGIONAL DE INFLUENZA SE 23 DE 2021 5
WEEKLY SUMMARY (ENGLISH) North America: Influenza activity remained low. SARS-CoV-2 activity continues elevated but decreasing in Canada and in the United States. RSV activity continue to increase in the United States. In Mexico, SARS-CoV-2 activity continued elevated and detections increased slightly this week. Caribbean: Influenza activity remained low. In Belize, SARS-CoV-2 detections continue to increase, and activity remained moderated. In Haiti, SARS-CoV-2 activity continued elevated and increasing.
Central America: Influenza activity remained low. In Costa Rica, SARS-CoV-2 activity continued elevated and in Guatemala, SARI activity decrease to moderate levels and associated to SARS-CoV-2 activity. In Nicaragua, SARS-CoV-2 activity continues to increase and remained at moderate levels.
Andean: Influenza activity remained low. In Bolivia, Ecuador and Colombia, SARS-CoV-2 activity continue elevated.
Brazil and Southern Cone: Influenza activity remained low, and SARS-CoV-2 activity continues elevated overall.
Global: Despite continued or even increased testing for influenza in some countries, influenza activity remained at lower levels than expected for this time of the year. In the temperate zone of the southern hemisphere, influenza activity remained at inter-seasonal level. In the temperate zone of the northern hemisphere, influenza activity remained at baseline levels, though detections of influenza B/Victoria lineage slightly increased, especially in China. In tropical Africa, few influenza detections were reported in some countries in Western and Eastern Africa. In Southern Asia, few influenza detections were reported from Bangladesh, India, Nepal, and Pakistan. In South East Asia, no influenza detections were reported. Worldwide, influenza B detections accounted for most of the very low numbers of detections reported.
Rep
ort
Su
mm
arie
s –
Res
um
en d
el in
form
e

PAHO/OPS | INFLUENZA REGIONAL UPDATE EW 23, 2021 /ACTUALIZACIÓN REGIONAL DE INFLUENZA SE 23 DE 2021 6
RESUMEN SEMANAL (ESPAÑOL)
América del Norte: la actividad de la influenza se mantuvo baja. La actividad del SARS-CoV-2 sigue siendo elevada, pero está disminuyendo en Canadá y en los Estados Unidos. La actividad del VRS sigue aumentando en los Estados Unidos. En México, la actividad del SARS-CoV-2 continúa elevada y las detecciones aumentaron levemente esta semana.
Caribe: la actividad de la influenza se mantuvo baja. En Belice, las detecciones de SARS-CoV-2 continúan aumentando y la actividad se mantuvo moderada. En Haití, la actividad del SARS-CoV-2 continuó elevada y en aumento.
América Central: la actividad de la influenza se mantuvo baja. En Costa Rica, la actividad de SARS-CoV-2 continuó elevada y en Guatemala, la actividad de la IRAG disminuyó a niveles moderados y se asoció con la actividad de SARS-CoV-2. En Nicaragua, la actividad del SARS-CoV-2 continúa aumentando y se mantuvo en niveles moderados.
Andina: la actividad de la influenza se mantuvo baja. En Bolivia, Ecuador y Colombia, la actividad del SARS-CoV-2 continuó elevada.
Brasil y Cono Sur: la actividad de la influenza se mantuvo baja y la actividad del SARS-CoV-2 continuó elevada en general.
Global: a pesar de las pruebas continuas de influenza continuas o incluso un aumento de etas en algunos países, la actividad de la influenza se mantuvo en niveles más bajos de lo esperado para esta época del año. En la zona templada del hemisferio sur, la actividad de la influenza se mantuvo en un nivel interestacional. En la zona templada del hemisferio norte, la actividad de la influenza se mantuvo en los niveles basales, aunque las detecciones de influenza B linaje Victoria aumentaron ligeramente, especialmente en China. En África tropical, se notificaron pocas detecciones de influenza en algunos países de África occidental y oriental. En el sur de Asia, se informaron pocas detecciones de influenza en Bangladesh, India, Nepal y Pakistán. En el sudeste asiático, no se notificaron detecciones de influenza. En todo el mundo, las detecciones de influenza B representaron la mayor parte del número muy bajo de detecciones notificadas.
Rep
ort
Su
mm
arie
s –
Res
um
en d
el in
form
e

PAHO/OPS | INFLUENZA REGIONAL UPDATE EW 23, 2021 /ACTUALIZACIÓN REGIONAL DE INFLUENZA SE 23 DE 2021 7
In the temperate zones of the southern hemisphere, influenza activity remained at the interseasonal level. In Oceania, influenza-like illness (ILI) and other influenza activity indicators remained very low, despite continued testing. In South Africa, continued detections of influenza B/Victoria lineage viruses were reported in this period, although activity remains at interseasonal levels. In Western Africa, detections of influenza A(H1N1)pdm09 continued to be reported in Côte d’Ivoire and Ghana. In Eastern Africa, influenza B/Victoria lineage virus was detected in Mozambique and influenza B virus detections (lineage not determined). In Southern Asia, reports of detections of influenza A(H3N2) viruses from India and Nepal, influenza A(H1N1) viruses from India, influenza B viruses from Pakistan, and influenza B/Victoria lineage viruses from Bangladesh and India were received during this period. In southeast Asia, no influenza detections were reported. In the temperate zones of the northern hemisphere, influenza activity remained below baseline overall. In Europe, influenza activity remained at interseasonal levels, with sporadic detections of influenza A and B viruses reported in some countries. In Central Asia and In Northern Africa, no influenza detections were reported across reporting countries. In Western Asia, influenza and ILI activity remained low overall. Oman and Saudi Arabia each reported detecting one influenza B virus and the United Arab Emirates reported the detection of one influenza A(H3N2) virus. In East Asia, influenza activity remained low. Increased detections of influenza B/Victoria lineage virus were reported from northern and southern China, although these detections remained low
compared to previous years. / En las zonas templadas del hemisferio sur, la actividad de la influenza se mantuvo en el nivel interestacional. En Oceanía, la enfermedad tipo influenza (ETI) y otros indicadores de actividad de la influenza se mantuvieron muy bajos, a pesar de las pruebas continuas. En Sudáfrica, se notificaron detecciones continuas del virus influenza B linaje Victoria en este período, aunque la actividad se mantiene en niveles interestacionales. En África occidental, continuaron las notificaciones de detecciones de influenza A(H1N1)pdm09 en Costa de Marfil y Ghana. En África oriental, se detectó virus influenza B linaje Victoria en Mozambique y hubo detecciones de los virus influenza B (linaje no determinado). En el sur de Asia, se recibieron informes de detecciones de virus influenza A(H3N2) de India y Nepal, virus influenza A(H1N1) de India, virus influenza B de Pakistán y virus influenza B linaje Victoria de Bangladesh e India. En el sureste de Asia, no se notificaron detecciones de influenza. En las zonas templadas del hemisferio norte, en general, la actividad de la influenza se mantuvo por debajo de la línea de base. En Europa, la actividad de la influenza se mantuvo en los niveles interestacionales con detecciones esporádicas de virus influenza A y B notificadas en algunos países. En Asia central y en el norte de África, no se notificaron detecciones de influenza en los países informantes. En Asia occidental, la actividad de la influenza y de la ETI se mantuvo baja en general. Omán y Arabia Saudita informaron haber detectado cada uno un virus de influenza B y los Emiratos Árabes Unidos informaron la detección de un virus de influenza A(H3N2). En el este de Asia, la actividad de la influenza se mantuvo baja. En el norte y el sur de China se informó un aumento de las detecciones del virus influenza B linaje Victoria, aunque estas detecciones se mantuvieron bajas en comparación con años anteriores.
National Influenza Centres (NICs) and other national influenza laboratories from 78 countries, areas or territories reported data to FluNet for the time period from 24 May 2021 to 6 June 2021. The WHO GISRS laboratories tested more than 228 6461 specimens during that time period. A total of 965 specimens were positive for influenza viruses, of which 69 (7.2%) were typed as influenza A and 896 (92.8%) as influenza B. Of the sub-typed influenza A viruses, 24 (55.8%) were influenza A(H1N1)pdm09 and 19 (44.2%) were influenza A(H3N2). Of the characterized B viruses, 2 (0.2%) belong to the B/Yamagata lineage and 830 (99.8%) to the B/Victoria lineage. / Los Centros Nacionales de Influenza (NIC) y otros laboratorios nacionales de influenza de 78 países, áreas o territorios reportaron sus datos a FluNet para el período comprendido entre el 24 de mayo y el 6 de junio de 2021. Los laboratorios GISRS de la OMS analizaron más de 228 6461 muestras durante ese período. Un total de 965 muestras fueron positivas para los virus influenza, de las cuales 69 (7,2%) se tipificaron como influenza A y 896 (92,8%) como influenza B. De los virus influenza A, a los cuales se les identificó el subtipo, 24 (55,8%) fueron influenza A(H1N1)pdm09 y 19 (44,2%) fueron influenza A(H3N2). De los virus B caracterizados, 2 (0,2%) pertenecían a B linaje Yamagata y 830 (99,8%) a B linaje Victoria.
1 It includes data only from countries reporting on positive and negative influenza specimens. Incluye datos únicamente de países que notifican muestras positivas y negativas para influenza.
Glo
bal
Lev
el /
Niv
el M
un
dia
l
Influenza Global Update 396 / Actualización de influenza a nivel mundial 396 21 June 2021 / 21 de junio de 2021
Based on data up to June 6, 2021 / basado en datos hasta el 6 de junio de 2021

PAHO/OPS | INFLUENZA REGIONAL UPDATE EW 23, 2021 /ACTUALIZACIÓN REGIONAL DE INFLUENZA SE 23 DE 2021 8
G
lob
al L
evel
/
Niv
el M
un
dia
l

PAHO/OPS | INFLUENZA REGIONAL UPDATE EW 23, 2021 /ACTUALIZACIÓN REGIONAL DE INFLUENZA SE 23 DE 2021 9
Influenza circulation by subregion, 2014-21 Circulación virus influenza por subregión, 2014-21
Respiratory syncytial virus (RSV) circulation by Subregion, 2014-21
Circulación virus respiratorio sincitial (VRS) por subregión, 2014-21
*To view more lab data, view here. / Para ver más datos de laboratorio, vea aquí.
Rep
ort
Su
mm
arie
s –
Res
um
en d
el in
form
e

PAHO/OPS | INFLUENZA REGIONAL UPDATE EW 23, 2021 /ACTUALIZACIÓN REGIONAL DE INFLUENZA SE 23 DE 2021 10
Other respiratory viruses (ORV) circulation by subregion, 2017-21
Circulación de otros virus respiratorios (OVR) por subregión, 2017-21
Genetic Characterization of Influenza Virus by Subregion, 2020
Caracterización Genética de los Virus Influenza por Subregión, 2020
Month of data collected
*These data are from the WHO –Collaborating Center at the U.S. CDC. *Estos datos son recolectados desde el CC de la OMS en los CDC de EE. UU.
*To view more lab data, view here. / Para ver más datos de laboratorio, vea aquí.
Rep
ort
Su
mm
arie
s –
Res
um
en d
el R
epo
rte

PAHO/OPS | INFLUENZA REGIONAL UPDATE EW 23, 2021 /ACTUALIZACIÓN REGIONAL DE INFLUENZA SE 23 DE 2021 11
Weekly and cumulative numbers of influenza and other respiratory viruses, by country and EW, 20212,3
Números semanales y acumulados de influenza y otros virus respiratorios, por país y SE, 20214,5
2
The detection of respiratory viruses other than influenza depends on the diagnostic capacity of each country and monitoring system. The absence of report of other respiratory viruses does not indicate the absence of their circulation.
3 Data reported by the Ministries of Health of the countries, from sentinel and intensified surveillance for acute respiratory disease. 4
La detección de otros virus respiratorios diferentes a influenza depende de la capacidad diagnóstica de cada país y del sistema de vigilancia establecido. El que no se reporten otros virus respiratorios, no significa, ni indica la ausencia de circulación viral.
5 Datos reportados por los Ministerios de Salud de los países, provenientes de la vigilancia centinela e intensificada de enfermedad respiratoria aguda.
Rep
ort
Su
mm
arie
s –
Res
um
en d
el in
form
e

PAHO/OPS | INFLUENZA REGIONAL UPDATE EW 23, 2021 /ACTUALIZACIÓN REGIONAL DE INFLUENZA SE 23 DE 2021 12
No
rth
Am
eric
a-
Am
éric
a d
el N
ort
e
• In EW 23, 2021, few influenza detections (one sample) were reported with the circulation of influenza A(H3N2). In addition, few samples tested positive for the respiratory syncytial virus (RSV) (Graphs 1 and 2). Rhinovirus and parainfluenza virus co-circulated among other respiratory viruses. During EW 23, SARS-CoV-2 percent positivity decreased to 1.9%. Ontario and Quebec provinces continued recording the highest number of COVID-19 cases (Graph 3). At the national level, 54.7% occurred among those aged less than 40 years (Graph 4). Females accounted for 50.3% of cases. / En la SE 23 de 2021, se reportaron pocas detecciones de influenza (una muestra) con la circulación de influenza A(H3N2). Además, pocas muestras dieron positivo para el virus respiratorio sincitial (VRS) (Gráficos 1 y 2). El rinovirus y el virus de la parainfluenza circularon concurrentemente entre otros virus respiratorios. Durante la SE 23, el porcentaje de positividad para SARS-CoV-2 disminuyó a 1,9%. Las provincias de Ontario y Quebec continuaron registrando el mayor número de casos de COVID-19 (Gráfico 3). A nivel nacional, el 54,7% ocurrió en menores de 40 años (Gráfico 4). Las mujeres representaron el 50,3% de los casos.
Graph 1. Canada: Influenza virus distribution, EW 23, 2015 –21
Distribución de virus de influenza, SE 23, 2015 –21
Graph 2. Canada: Influenza, RSV, and SARS-CoV-2 distribution
EW 23, 2015-21 Distribución de los virus influenza, VRS y SARS-CoV-2,
SE 23, 2015-21
Graph 3. Canada: Number of COVID-19 total cases in Canada as of June 21, 2021
Número total de casos de COVID-19 en Canadá, al 21 de junio de 2021
Source: Coronavirus disease (COVID-19): Outbreak update. https://www.canada.ca/en/public-health
Graph 4. Canada: Age by sex distribution of COVID-19 cases, as of June 18, 2021
Distribución de los casos de COVID-19 por edad y sexo, al 18 de junio de 2021
Source: Epidemiological summary of COVID-19 cases in Canada.https://www.canada.ca/en/public-health
*To view more epi data, view here. / Para ver más datos epi, vea aquí.
North America / América del Norte
Canada / Canadá
EPIDEMIOLOGIC AND VIROLOGIC UPDATE OF INFLUENZA & OTHER
RESPIRATORY VIRUSES BY COUNTRY
ACTUALIZACIÓN EPIDEMIOLÓGICA Y VIROLÓGICA DE INFLUENZA Y OTROS
VIRUS RESPIRATORIOS POR PÁIS

PAHO/OPS | INFLUENZA REGIONAL UPDATE EW 23, 2021 /ACTUALIZACIÓN REGIONAL DE INFLUENZA SE 23 DE 2021 13
No
rth
Am
eric
a-
Am
éric
a d
el
No
rte
• Up to EW 23, 2021, the public health laboratory network (Graph 1) reported circulation of influenza A and B virus detections with influenza B (lineage not determined) more frequently detected. Influenza percent positive remained below the epidemic threshold while respiratory syncytial virus activity continued increasing (Graph 2). During 2021, overall, the percentage of outpatient visits for influenza-like illness (ILI) (1.2%) remained similar compared to the previously reported and remained below the national baseline (2.6%) and below the average of 2009-20 seasons (Graph 3). As of EW 23, 7.6% of the deaths that occurred during the week ending June 12, 2021 (week 23), were due to pneumonia, influenza, and/or COVID-19 (PIC)- above the epidemic threshold of 6.0% for EW 23 (Graph 4). As of June 18, 2021, the decreasing trend in laboratory-confirmed COVID-19-associated hospitalizations continued (Graph 5). / Hasta la SE 23 de 2021, la red de laboratorios de salud pública (Gráfico 1) notificó circulación de detecciones de virus influenza A y B con influenza B (linaje no determinado) detectada con mayor frecuencia. El porcentaje positivo de influenza se mantuvo por debajo del umbral epidémico, mientras que la actividad del virus respiratorio sincitial continuó aumentando (Gráfico 2). Durante 2021, en general, el porcentaje de visitas ambulatorias por enfermedad tipo influenza (ETI) (1,2%) se mantuvo similar en comparación con lo informado anteriormente y se mantuvo por debajo de la línea de base nacional (2,6%) y por debajo del promedio de las temporadas 2009-20 (Gráfico 3). A la SE 23, el 7,6% de las muertes ocurridas durante la semana que terminó el 12 de junio de 2021 (semana 23), se debieron a neumonía, influenza o COVID-19 (PIC), por encima del umbral epidémico de 6,0% para la SE 23 (Gráfico 4). Al 18 de junio de 2021, continuó la tendencia decreciente en las hospitalizaciones asociadas a COVID-19 confirmadas por laboratorio (Gráfico 5).
Graph 1. USA: Influenza virus distribution, EW 23, 2021
2020-2021 season Distribución de virus de influenza, SE 23 de 2021
Temporada 2020-2021
Content source: CDC- FluView Report
Graph 2. USA: Influenza and RSV distribution
EW 23, 2015-21 Distribución de los virus influenza y VRS,
SE 23, 2015-21
Graph 3. USA: Percentage of visits for ILI, EW 23, 2009-21
Porcentaje de visitas por ETI, SE 23, 2009-21
Content source: CDC- FluView Report
Graph 4. USA: Pneumonia, influenza, and COVID-19 mortality data
as of June 17, 2021 Mortalidad por neumonía, influenza y COVID-19,
datos al 17 de junio de 2021
Content source: CDC- FluView Report
Graph 5. USA: New hospital admissions of patients with confirmed COVID-19, August 1, 2020 - June 19, 2021
Nuevos ingresos hospitalarios de pacientes con COVID-19 confirmado, 1 de agosto de 2020 al 19 de junio de 2021
Content source: CDC - COVID Data Tracker Weekly Review
*To view more epi data, view here. / Para ver más datos epi, vea aquí.
United States / Estados Unidos

PAHO/OPS | INFLUENZA REGIONAL UPDATE EW 23, 2021 /ACTUALIZACIÓN REGIONAL DE INFLUENZA SE 23 DE 2021 14
No
rth
Am
eric
a-
Am
éric
a d
el
No
rte
• In EW 23, 2021, no influenza detections were reported, influenza and RSV activity remained below the seasonal threshold (Graphs 1, 2 and 3). Few metapneumovirus and human coronavirus detections were recorded. As of EW 23, SARS-CoV-2 percent positivity (19.4%) increased compared to the previously recorded; SARS-CoV-2 activtiy remained at moderate levels (Graph 2). The number of SARI cases has decreased and remained at baseline levels compared to prior weeks (Graph 4). / En la SE 23 de 2021 no se notificaron detecciones de influenza, la actividad de influenza y del VRS se mantuvo por debajo del umbral estacional (Gráficos 1, 2 y 3). Se registraron pocas detecciones de metapneumovirus y coronavirus humano. A la SE 23, el porcentaje de positividad para SARS-CoV-2 (19,4%) aumentó en comparación con lo registrado anteriormente; la actividad del SARS-CoV-2 se mantuvo en niveles moderados (Gráfico 2). El número de casos de IRAG ha disminuido y se ha mantenido en los niveles basales en comparación con las semanas anteriores (Gráfico 4).
Graph 1. Mexico: Influenza virus distribution, EW 23, 2015-21 Distribución deL virus influenza, SE 23, 2015-21
Graph 2. Mexico: Influenza, RSV, and SARS-CoV-2 distribution EW 23, 2015-21
Distribución de los virus influenza, VRS y SARS-CoV-2, SE 23, 2015-21
Graph 3. Mexico: Percent positivity for influenza, EW 23, 2021
(compared to 2010-20) Porcentaje de positividad de influenza, SE 23 de 2021
(comparado con 2010-20)
Graph 4. Mexico: Number of SARI cases, EW 1 - 23, 2021
Numero de casos de IRAG, SE 1- 23 de 2021
*To view more epi data, view here. / Para ver más datos epi, vea aquí.
Mexico / México

PAHO/OPS | INFLUENZA REGIONAL UPDATE EW 23, 2021 /ACTUALIZACIÓN REGIONAL DE INFLUENZA SE 23 DE 2021 15
Car
ibb
ean
-
El C
arib
e
• Since EW 30, 2020, at the national level, no influenza detections have been recorded (Graph 1); during EW 23, few detections of rhinovirus were reported with parainfluenza and human coronavirus co-circulating. SARS-CoV-2 percent positive decreased lightly and was at 1.8% (Graph 2); detections decreased compared to previously recorded (Graph 3). In EW 23, 72/4100 samples analyzed for SARS-CoV-2 tested positive. / Desde la SE 30 de 2020, a nivel nacional, no se registran detecciones de influenza (Gráfico 1); durante la SE 23, se reportaron pocas detecciones de rinovirus con la circulación concurrente de parainfluenza y coronavirus humano. El porcentaje de positividad para SARS-CoV-2 disminuyó levemente y fue de 1,8% (Gráfico 2); las detecciones disminuyeron en comparación con las registradas anteriormente (Gráfico 3). En la SE 23, 72/4100 muestras analizadas para SARS-CoV-2 dieron positivo.
Graph 1. Belize. Influenza virus distribution EW 23, 2016-21
Distribución de virus influenza SE 23, 2016-21
Graph 2. Belize: Influenza, RSV, and SARS-CoV-2 distribution,
EW 23, 2016-21 Distribución de virus influenza, VRS y SARS-CoV-2, SE 23, 2016-21
Graph 3. Belize: RSV, SARS-CoV-2, and other respiratory viruses distribution, EW 23, 2016-21 Distribución de VRS, SARS-CoV-2 y otros virus respiratorios,
SE 23, 2016-21
*To view more epi data, view here. / Para ver más datos epi, vea aquí.
Caribbean / Caribe
Belize / Belice

PAHO/OPS | INFLUENZA REGIONAL UPDATE EW 23, 2021 /ACTUALIZACIÓN REGIONAL DE INFLUENZA SE 23 DE 2021 16
Car
ibb
ean
-
El C
arib
e
• In EW 22, the number of SARI cases continued to decrease and was at baseline levels (Graph 1). / En la SE 22, el número de casos de IRAG continuó disminuyendo y se ubicó en niveles basales (Gráfico 1).
*To view more epi data, view here. / Para ver más datos epi, vea aquí.
Graph 1. Dominican Republic: Number of SARI cases, EW 22, 2021
(compared to 2018-20) Número de casos de IRAG, SE 22 de 2021
(comparado con 2018-20)
Dominican Republic / República Dominicana

PAHO/OPS | INFLUENZA REGIONAL UPDATE EW 23, 2021 /ACTUALIZACIÓN REGIONAL DE INFLUENZA SE 23 DE 2021 17
• Guadeloupe: In EW 23, 139 new COVID-19 cases have been confirmed (compared to 185 in EW 22). The number of ARI estimated cases reamined low compared to previous weeks (Graph 1). Saint-Martin: As of EW 23, 2021, 86 (compared to 116 previously) COVID-19 new cases were confirmed. During the last three weeks, the number of ARI consultations increased compared to the number recorded in previous weeks (Graph 2). Saint-Barthelemy: During EW 23, eiaght new COVID cases were confirmed, an increase compared to those reported last week. The number of ARI consultations remained low compared to previous months (Graph 3). Martinique: The number of new COVID-19 cases (69) decreased slightly compared to 80 previously reported positive. During EW 23, the number of ARI teleconsultations decreased from 40 to 6 teleconsultations (Graph 4). Guiana: As of June 20, 2021, 26 450 cases of COVID-19 were confirmed with 853 new cases confirned during EW 23. Overall, the consultation rate for acute respiratory infections increase to 187 per 100 000 population compared to the previously reported (Graph 5). / Guadalupe: en la SE 23 se han confirmado 139 nuevos casos de COVID-19 (con respect a 185 en la SE 22). El número de casos estimados de IRA siguió siendo bajo en comparación con las semanas anteriores (Gráfico 1). San Martín: a la SE 23 de 2021, se confirmaron 86 (en comparación con 116 anteriormente) casos nuevos de COVID-19. Durante las últimas tres semanas, el número de consultas por IRA aumentó en comparación con el número registrado en semanas anteriores (Gráfico 2). San Bartolomé: durante la SE 23 se confirmaron ocho nuevos casos de COVID, un incremento respecto a los reportados la semana pasada. El número de consultas de IRA se mantuvo bajo en comparación con meses anteriores (Gráfico 3). Martinica: el número de nuevos casos de COVID-19 (69) disminuyó ligeramente en comparación con los 80 positivos reportados anteriormente. Durante la SE 23, el número de teleconsultas por IRA disminuyó de 40 a 6 teleconsultas (Gráfico 4). Guayana: al 20 de junio de 2021, se confirmaron 26 450 casos de COVID-19 con 853 nuevos casos confirmados durante la SE 23. En general, la tasa de consultas por infecciones respiratorias agudas aumentó a 187 por 100 000 habitantes en comparación con lo reportado anteriormente (Gráfico 5).
Graph 1. Guadeloupe: Estimated number of clinically suggestive cases of acute respiratory infections, EWs 13, 2020 – 23, 2021*
Número estimado de casos clínicamente sugestivos de infecciones respiratorias agudas, SE 13 de 2020 a 23 de 2021
Graph 2. Saint-Martin: Estimated number of clinically suggestive cases of acute respiratory infections, EWs 13, 2020 – 23, 2021*
Número estimado de casos clínicamente sugestivos de infecciones respiratorias agudas, SE 13 de 2020 a 23 de 2021
Graph 3. Saint-Barthelemy: Estimated number of clinically suggestive cases of acute respiratory infections, EWs 13, 2020 - 23, 2021*
Número estimado de casos clínicamente sugestivos de infecciones respiratorias agudas, SE 13 de 2020 a 23 de 2021
Graph 4. Martinique: Estimated number of clinically suggestive cases of acute respiratory infections, EWs 13, 2020 - 23, 2021*
Número estimado de casos clínicamente sugestivos de infecciones respiratorias agudas, SE 13 de 2020 a 23 de 2021
Graph 5. French Guiana: Number and extrapolated rate of consultations for acute respiratory infections per 100 000 population seen by general practitioners
Número y tasa extrapolada de consultas por infecciones respiratorias agudas por cada 100 000 habitantes atendidas por médicos generales
* Point épidémio régional. Spécial COVID-19. GLP – MAF - BLM, MTQ, GUF/ Punto epidémico regional. Especial. COVID-19. Disponible aquí: GLP – MAF - BLM, MTQ, GUF ** To view more epi data, view here. / Para ver más datos epi, vea aquí.
French Territories / Territorios Franceses
Car
ibb
ean
-
El C
arib
e

PAHO/OPS | INFLUENZA REGIONAL UPDATE EW 23, 2021 /ACTUALIZACIÓN REGIONAL DE INFLUENZA SE 23 DE 2021 18
• As of EW 23, no influenza detections were recorded with percent positivity at baseline levels (Graph 1). No respiratory syncytial virus (RSV) detections were reported. In EW 23, 28.2% (374/1325) of samples tested positive for SARS-CoV-2, increasing compared to the percentage recorded previously (Graph 2). Influenza activity remained below epidemic levels for this time of year (Graph 3), and SARS-CoV-2 detections decreased slightly to previously registered (Graph 4). After EW 20, the number of SARI hospitalizations has remained below epidemic levels compared to earlier seasons for the same time (Graph 5). / A la SE 23, no se registraron detecciones de influenza con el porcentaje de positividad en los niveles basales (Gráfico 1). No se informaron detecciones de virus respiratorio sincitial (VRS). En la SE 23, el 28,2% (374/1325) de las muestras resultaron positivas para SARS-CoV-2, un aumento con respecto al porcentaje registrado anteriormente (Gráfico 2). La actividad de la influenza se mantuvo por debajo de los niveles epidémicos para esta época del año (Gráfico 3), y las detecciones de SARS-CoV-2 disminuyeron levemente a las registradas anteriormente (Gráfico 4). Después de la SE 20, el número de hospitalizaciones por IRAG se ha mantenido por debajo de los niveles epidémicos en comparación con temporadas anteriores en el mismo periodo (Gráfico 5).
*To view more epi data, view here. / Para ver más datos epi, vea aquí.
Graph 1. Haiti: Influenza virus distribution EW 23, 2015-21 Distribución de virus influenza SE 23, 2015-21
Graph 2. Haiti: Influenza, RSV, and SARS-CoV-2 distribution, EW 23, 2015-21
Distribución de los virus influenza, VRS y SARS-CoV-2, SE 23, 2015-21
Graph 3. Haiti: Percent positivity for influenza, EW 23, 2021
(compared to 2015-20) Porcentaje de positividad de influenza, SE 23 de 2021
(comparado con 2015-20)
Graph 4. Haiti: RSV, SARS-CoV-2, and other respiratory viruses
distribution, EW 23, 2019-21 Distribución del VRS, SARS-CoV-2 y otros virus, SE 23, 2019-21
Graph 4. Haiti: Number of SARI cases, EW 23, 2021
(compared to 2017-20) Número de casos de IRAG, SE 23 de 2021
(comparado con 2017-20)
Haiti / Haití
Car
ibb
ean
-
El C
arib
e

PAHO/OPS | INFLUENZA REGIONAL UPDATE EW 23, 2021 /ACTUALIZACIÓN REGIONAL DE INFLUENZA SE 23 DE 2021 19
Car
ibb
ean
-
El C
arib
e
• No influenza, RSV, or other respiratory viruses (ORV) detections have been recorded this year (Graph 1). SARS-CoV-2 percent positivity decreased (0.7%) compared to the percentage recorded the previous week (Graph 2). The percent positivity for influenza remained below the average seen in last seasons (Graph 3). SARI hospitalizations per 100 have risen in recent weeks but remained at baseline levels (Graph 4). After EW 13, the number of pneumonia cases has remained below the epidemic threshold (Graphs 5), while the number of ARI cases continued to hover below the seasonal threshold (Graph 6). / Este año no se han registrado detecciones de influenza, VRS u otros virus respiratorios (ORV) (Gráfico 1). El porcentaje de positividad para SARS-CoV-2 disminuyó (0,7%) en comparación con el porcentaje registrado la semana anterior (Gráfico 2). El porcentaje de positividad para influenza se mantuvo por debajo del promedio observado en las últimas temporadas (Gráfico 3). Las hospitalizaciones por IRAG por 100 han aumentado en las últimas semanas, pero se han mantenido en los niveles basales (Gráfico 4). Después de la SE 13, el número de casos de neumonía se ha mantenido por debajo del umbral epidémico (Gráficos 5), mientras que el número de casos de IRA continuó por debajo del umbral estacional (Gráfico 6).
Graph 1. Jamaica : Influenza virus distribution EW 23, 2015-21
Distribución de virus influenza SE 23, 2015-21
Graph 2. Jamaica: Influenza, RSV, and SARS-CoV-2 distribution, EW 23, 2015-21
Distribución de los virus influenza, VRS y SARS-CoV-2, SE 23, 2015-21
Graph 3. Jamaica: Percent positivity for influenza, EW 23, 2021
(compared to 2010-20) Porcentaje de positividad de influenza, SE 23 de 2021
(comparado con 2010-20)
Graph 4. Jamaica: SARI hospitalizations/100 hospitalizations,
EW 23, 2021 (compared to 2011-20) Hospitalizaciones de IRAG/100 hospitalizaciones, SE 23 de 2021
(comparado con 2011-20)
Graph 5. Jamaica: Number of pneumonia cases, EW 23, 2014-21
Número de casos de neumonía, SE 23, 2014-21
Graph 6. Jamaica: Number of ARI cases, EW 23, 2021
(compared to 2011-20) Número de casos de IRA, SE 23 de 2021
(comparado con 2011-20)
*To view more epi data, view here. / Para ver más datos epi, vea aquí
Jamaica

PAHO/OPS | INFLUENZA REGIONAL UPDATE EW 23, 2021 /ACTUALIZACIÓN REGIONAL DE INFLUENZA SE 23 DE 2021 20
Car
ibb
ean
-
El C
arib
e
• Throughout the year, the number of influenza-positive cases (rapid test) has remained below the average number of cases observed in the last seasons (Graph 1). Children less than five years continued to be the age group with the highest number of influenza-confirmed cases (Graph 2). As of EW 23, Jayuya and Sabana Grande municipalities reported the highest influenza incidence rate per-100 000 population (Graph 3). The number of COVID-19 cases continued a downward trend at low activity levels. / A lo largo del año, el número de casos positivos para influenza (prueba rápida) se ha mantenido por debajo del promedio de casos observados en las últimas temporadas (Gráfico 1). Los niños menores de cinco años continuaron siendo el grupo de edad con mayor número de casos confirmados de influenza (Gráfico 2). A la SE 23, los municipios de Jayuya y Sabana Grande reportaron la mayor tasa de incidencia de influenza por 100 000 habitantes (Gráfico 3). El número de casos de COVID-19 continuó una tendencia a la baja con niveles de actividad bajos.
Graph 1. Puerto Rico: Influenza-positive cases EW 23, 2020-21
Casos positivos para influenza SE 23, 2020-21*
Graph 2. Puerto Rico: Number of cases positive for influenza by age group, EW 23, 2021
Número de casos positivos para influenza por grupo de edad, SE 23 de 2021*
Graph 3. Puerto Rico: Influenza incidence rate per 100,000 population by municipality of residence, EW 23, 2021
Tasa de incidencia de influenza por 100.000 habitantes por municipio de residencia, SE 23 de 2021**
Graph 4. Puerto Rico: COVID-19 confirmed cases, as of June 18, 2021 Casos confirmados de COVID-19, al 18 de junio de 2021*
* Departamento de Salud. Sistema de Vigilancia de Puerto Rico. Salud Puerto Rico
*To view more epi data, view here. / Para ver más datos epi, vea aquí.
Puerto Rico

PAHO/OPS | INFLUENZA REGIONAL UPDATE EW 23, 2021 /ACTUALIZACIÓN REGIONAL DE INFLUENZA SE 23 DE 2021 21
• No influenza or respiratory syncytial virus detections have been reported in recent months (Graph 1). In EW 23,
SARS-CoV-2 percent positivity (1.7%) and detections decreased compared to the previously reported (Graphs 2 and 3). Throughout 2021, ILI cases among children <5 years have fluctuated and remained below the average observed in previous seasons. After several weeks above the alert threshold, the number of ILI cases reported decreased among persons aged five years and older. It was at the average observed in previous seasons for the same period (Graphs 4 and 5). During EW 23, the number of ILI cases among persons ≥ five years (27) double the number reported last year (13). Choiseul and Soufriere recorded the highest number of cases. In EW 23, SARI cases / 100 hospitalizations remained below the epidemic threshold (Graph 6). / No se han reportado detecciones de influenza o virus respiratorio sincitial en los últimos meses (Gráfico 1). En la SE 23, el porcentaje de positividad para SARS-CoV-2 (1,7%) y las detecciones disminuyeron en comparación con lo notificado anteriormente (Gráficos 2 y 3). A lo largo de 2021, los casos de ETI en niños menores de 5 años han fluctuado y se han mantenido por debajo del promedio observado en temporadas anteriores. Después de varias semanas por encima del umbral de alerta, el número de casos de ETI notificados disminuyó entre las personas de cinco años o más. Se ubicó en el promedio observado en temporadas anteriores para el mismo período (Gráficos 4 y 5). Durante la SE 23, el número de casos de ETI (27) en personas de cinco años o mayores duplicó el número informado el año pasado (13). Choiseul y Soufriere registraron el mayor número de casos. En la SE 23, los casos de IRAG / 100 hospitalizaciones se mantuvieron por debajo del umbral epidémico (Gráfico 6).
Graph 1. Saint Lucia: Influenza virus distribution, EW 23, 2015-21
Distribución de virus influenza, SE 23, 2015-21
Graph 2. Saint Lucia: Influenza, RSV, and SARS-CoV-2 virus distribution, EW 23, 2015-21
Distribución de los virus influenza, VRS y SARS-CoV-2, SE 23, 2015-21
Graph 3. Saint Lucia: RSV, SARS-CoV-2, and other respiratory viruses distribution, EW 23, 2015-21
Distribución del VRS, SARS-CoV-2 y otros virus respiratorios, SE 23, 2015-21
Graph 4. Saint Lucia: ILI case distribution among the < 5 years of age, EW 23, 2021 (compared to 2016-20)
Distribución de ETI entre los <5 años, SE 23, 2021 (comparado con 2016-20)
Graph 5. Saint Lucia: ILI case distribution among the ≥ 5 years of age, EW 23, 2021 (compared to 2016-20)
Número de casos de ETI en los ≥ 5 años, SE 23, 2021 (comparado con 2016-20)
Graph 6. Saint Lucia: SARI hospitalizations/100 hospitalizations, EW 23, 2021 (compared to 2016-20)
Número de casos de IRAG, SE 23 de 2021 (comparado con 2016-20)
*To view more epi data, view here. / Para ver más datos epi, vea aquí.
Saint Lucia / Santa Lucía
Car
ibb
ean
-
El C
arib
e

PAHO/OPS | INFLUENZA REGIONAL UPDATE EW 23, 2021 /ACTUALIZACIÓN REGIONAL DE INFLUENZA SE 23 DE 2021 22
• As of EW 23, no influenza and respiratory syncytial virus detections have been recorded. Rhinovirus and human coronavirus co-circulated. SARS-CoV-2 percent positive fell to 51.3% from 55.6% the previous week and remained risen (Graphs 1, 2, and 3), while SARS-CoV-2 detections decreased from the number previously reported (Graph 4). From January through May, the number of severe acute respiratory infection (SARI) were at moderate activity levels to decline below the seasonal threshold in recent weeks (Graph 5). / A la SE 23, no se han registrado detecciones de influenza ni de virus respiratorio sincitial. El rinovirus y el coronavirus humano circularon concurrentemente. El porcentaje de positividad para SARS-CoV-2 cayó a 51,3% desde el 55,6% de la semana anterior y se mantuvo elevado (Gráficos 1, 2 y 3), mientras que las detecciones de SARS-CoV-2 disminuyeron respecto al número informado previamente (Gráfico 4). De enero a mayo, el número de infecciones respiratorias agudas graves (IRAG) se mantuvo en niveles de actividad moderados para descender por debajo del umbral estacional en las últimas semanas (Gráfico 5).
Graph 1. Costa Rica: Influenza virus distribution,
EW 23, 2015-21 Distribución de virus influenza por SE 23, 2015-21
Graph 2. Costa Rica: Influenza, RSV, and SARS-CoV-2 distribution,
EW 23, 2015-21 Distribución de los virus influenza, VRS y SARS-CoV-2, SE 23, 2015-21
Graph 3. Costa Rica: Percent positivity for influenza, EW 23, 2021
(compared to 2011-20) Porcentaje de positividad de influenza, SE 23 de 2021
(comparado con 2011-20)
Graph 4. Costa Rica: RSV, SARS-CoV-2, and other respiratory viruses
distribution, EW 23, 2015-21 Distribución del VRS, SARS-CoV-2 y otros virus respiratorios, SE 23,
2015-21
Graph 5. Costa Rica: Number of SARI cases, EW 23, 2021
(compared to 2013-20) Número de casos de IRAG, SE 23 de 2021
(comparado con 2013-20)
*To view more epi data, view here. / Para ver más datos epi, vea aquí.
Central America / América Central
Costa Rica
Cen
tral
Am
eric
a-
Am
éric
a C
entr
al

PAHO/OPS | INFLUENZA REGIONAL UPDATE EW 23, 2021 /ACTUALIZACIÓN REGIONAL DE INFLUENZA SE 23 DE 2021 23
• By 2021, no influenza detections have been recorded, and influenza activity remained below the seasonal threshold (Graphs 1 and 3). In EW 23, no respiratory syncytial virus (RSV) detections were reported. Percent positivity for SARS-CoV-2 (7.1%) and detections were similar to the numbers recorded in the previous week (Graphs 2 and 4). / Para el 2021, no se han registrado detecciones de influenza y la actividad de la influenza se mantuvo por debajo del umbral estacional (Gráficos 1 y 3). En la SE 23 no se informaron detecciones de virus respiratorio sincitial (VRS). El porcentaje de positividad para SARS-CoV-2 (7,1%) y las detecciones fueron similares a las cifras registradas en la semana anterior (Gráficos 2 y 4).
*To view more epi data, view here. / Para ver más datos epi, vea aquí.
Graph 1. El Salvador: Influenza virus distribution, EW 23, 2015-21
Distribución de virus influenza, SE 23, 2015-21
Graph 2. El Salvador: Influenza, RSV, and SARS-CoV-2 distribution,
EW 23, 2015-21 Distribución de los virus influenza, VRS y SARS-CoV-2, SE 23, 2015-21
Graph 3. El Salvador: Percent positivity for influenza,
EW 23, 2021 (compared to 2010-20) Porcentaje de positividad de influenza, SE 23 de 2021
(comparación 2010-20)
Graph 4. El Salvador: RSV, SARS-CoV-2, and other respiratory viruses
distribution, EW 23, 2015-21 Distribución del VRS, SARS-CoV-2 y otros virus respiratorios,
SE 23, 2015-21
El Salvador
Cen
tral
Am
eric
a-
Am
éric
a C
entr
al

PAHO/OPS | INFLUENZA REGIONAL UPDATE EW 23, 2021 /ACTUALIZACIÓN REGIONAL DE INFLUENZA SE 23 DE 2021 24
• During EW 23, no influenza detections were reported, with percent positivity remaining below epidemic levels. No respiratory syncytial virus (RSV) detections were reported at sentinel sites. Percent positivity for SARS-CoV-2 (17.7%) and detections increased compared to the last week (Graphs 1, 2, 3, and 4). In recent weeks a steep increase of SARI cases number was observed and reached high activity levels, although decrease to moderate activity levels during EW 23 (Graph 5). ILI activity has decreased during the last few weeks remaining at baseline activity levels for this time of year compared to previous seasons (Graph 6). / Durante la SE 23, no se notificaron detecciones de influenza y el porcentaje de positividad se mantuvo por debajo de los niveles epidémicos. No se informaron detecciones de virus respiratorio sincitial (VRS) en los sitios centinela. El porcentaje de positividad para SARS-CoV-2 (17,7%) y las detecciones aumentaron en comparación con la última semana (Gráficos 1, 2, 3 y 4). En las últimas semanas se observó un aumento pronunciado en el número de casos de IRAG y alcanzó niveles de actividad altos, aunque disminuyeron a niveles de actividad moderados durante la SE 23 (Gráfico 5). La actividad de la ETI ha disminuido durante las últimas semanas manteniéndose en los niveles de actividad de referencia para esta época del año en comparación con temporadas anteriores (Gráfico 6).
Graph 1. Guatemala: Influenza virus distribution, EW 23, 2015-21
Distribución de influenza, SE 23, 2015-21
Graph 2. Guatemala: Influenza, RSV, and SARS-CoV-2 distribution,
EW 23, 2015-21 Distribución de los virus influenza, VRS y SARS-CoV-2, SE 23, 2015-21
Graph 3. Guatemala: Percentage positivity for influenza,
EW 23, 2021 (compared to 2010-20) Porcentaje de positividad de influenza, SE 23 de 2021
(comparado con 2010-20)
Graph 4. Guatemala: RSV, SARS-CoV-2, and other respiratory viruses
distribution, EW 23, 2015-21 Distribución del VRS, SARS-CoV-2 y otros virus respiratorios,
SE 23, 2015-21
Graph 5. Guatemala: SARI hospitalizations/100 hospitalizations,
EW 23, 2021 (compared to 2011-20) Hospitalizaciones de IRAG/100 hospitalizaciones, SE 23 de 2021
(comparado con 2011-20)
Graph 6. Guatemala: ILI cases from sentinel surveillance,
EW 23, 2021 (compared to 2010-20) Casos de ETI, vigilancia centinela,
SE 23 de 2021 (comparado con 2010-20)
*To view more epi data, view here. / Para ver más datos epi, vea aquí.
Guatemala
Cen
tral
Am
eric
a-
Am
éric
a C
entr
al

PAHO/OPS | INFLUENZA REGIONAL UPDATE EW 23, 2021 /ACTUALIZACIÓN REGIONAL DE INFLUENZA SE 23 DE 2021 25
• As of EW 23, no influenza or respiratory syncytial virus (RSV) detections were reported. Influenza and RSV activity remained at baseline levels (Graphs 1, 2, and 3). In EW 23, at the national level, a total of 448 samples were analyzed for SARS-CoV-2, 17.0% tested positive, increasing from the percentage recorded the last week. During recent weeks the number of SARI cases steadily decreased and was below the average levels of past seasons at baseline levels (Graph 5). ILI activity has decreased during the last few weeks remaining at baseline activity levels for this time of year compared to previous seasons (Graph 6). / Hasta la SE 23, no se notificaron detecciones de influenza o virus respiratorio sincitial (VRS). La actividad de la influenza y el VRS se mantuvo en los niveles de referencia (Gráficos 1, 2 y 3). En la SE 23, a nivel nacional, se analizaron un total de 448 muestras para SARS-CoV-2, 17,0% resultaron positivas, aumentando respecto al porcentaje registrado la última semana. Durante las últimas semanas, el número de casos de IRAG disminuyó de manera constante y estuvo por debajo de los niveles promedio de temporadas anteriores en los niveles de referencia (Gráfico 5). La actividad de la ETI ha disminuido durante las últimas semanas permaneciendo en los niveles de referencia para esta época del año en comparación con temporadas anteriores (Gráfico 6).
Graph 1. Honduras: Influenza virus distribution, EW 23, 2015-21
Distribución virus de la influenza, SE 23, 2015-21
Graph 2. Honduras: Influenza, RSV, and SARS-CoV-2 distribution, EW 23, 2015-21
Distribución de los virus influenza, VRS y SARS-CoV-2, SE 23, 2015-21
Graph 3. Honduras: Percent positivity for influenza, EW 23, 2021
(compared to 2010-20) Porcentaje de positividad de influenza SE 23 de 2021
(comparado con 2010-20)
Graph 4. Honduras: RSV, SARS-CoV-2, and other respiratory virus
distribution, EW 23, 2015-21 Distribución del VRS, SARS-CoV-2 y otros virus respiratorios,
SE 23, 2015-21
Graph 5. Honduras: SARI cases, from sentinel surveillance,
EW 23, 2021 (compared to 2010-20) Casos de IRAG de la vigilancia centinela, SE 23 de 2021
(comparado con 2010-20)
Graph 6. Honduras: ILI cases, from sentinel surveillance,
EW 23, 2021 (compared to 2010-20) Casos de ETI de la vigilancia centinela,
SE 23 de 2021 (comparado con 2010-20)
*To view more epi data, view here. / Para ver más datos epi, vea aquí.
Honduras
Cen
tral
Am
eric
a-
Am
éric
a C
entr
al

PAHO/OPS | INFLUENZA REGIONAL UPDATE EW 23, 2021 /ACTUALIZACIÓN REGIONAL DE INFLUENZA SE 23 DE 2021 26
• In EW 23, no influenza detections have been reported with influenza B (lineage not determined) circulating in the previous week; percent positivity remained below the average epidemic curve. Few respiratory syncytial virus (RSV) detections (one sample) were recorded with low activity levels (Graphs 1, 2, and 3). SARS-CoV-2 detections and percent positivity increased compared to recent weeks (Graph 4). In EW 23, 8.2% (181/2200) of the analyzed samples tested positive for SARS-CoV-2, increasing compared to the previously recorded percentage. / En la SE 23, no se notificaron detecciones de influenza con la circulación de influenza B (linaje no determinado) en la semana anterior; el porcentaje de positividad se mantuvo por debajo de la curva epidémica promedio. Se registraron pocas detecciones de virus respiratorio sincitial (VRS) (una muestra) con niveles de actividad bajos (Gráficos 1, 2 y 3). Las detecciones de SARS-CoV-2 y el porcentaje de positividad aumentaron en comparación con las últimas semanas (Gráfico 4). En la SE 23, el 8,2% (181/2200) de las muestras analizadas resultaron positivas para SARS-CoV-2, un aumento en comparación con el porcentaje registrado anteriormente.
*To view more epi data, view here. / Para ver más datos epi, vea aquí.
Graph 1. Nicaragua: Influenza virus distribution, EW 23, 2015-21 Distribución de influenza, SE 23, 2015-21
Graph 2. Nicaragua: Influenza, RSV, and SARS-CoV-2 distribution, EW 23, 2015-21
Distribución de los virus influenza, VRS y SARS-CoV-2, SE 23, 2015-21
Graph 3. Nicaragua: Percent positivity for influenza, from sentinel
surveillance; EW 23, 2021 (compared to 2010-20) Porcentaje de positividad de influenza de la vigilancia centinela; SE
23 de 2021 (comparado con 2010-20)
Graph 4. Nicaragua: RSV and other respiratory virus distribution,
EW 23, 2015-21 Distribución del VRS y otros virus respiratorios, SE 23, 2015-21
Nicaragua
Cen
tral
Am
eric
a-
Am
éric
a C
entr
al

PAHO/OPS | INFLUENZA REGIONAL UPDATE EW 23, 2021 /ACTUALIZACIÓN REGIONAL DE INFLUENZA SE 23 DE 2021 27
• During EW 23, no influenza detections were reported at the national level, and percent positive remained at baseline levels (Graph 1). Few RSV detections were recorded with high activity levels compared to previous seasons, while SARS-CoV-2 activity and percent positivity decreased compared to previously registered with 19.5% of samples positive (18 688/95 706) (Graphs 2, 3, and 4). During the past three weeks, SARI cases increased to moderate activity levels compared to the average observed in previous seasons (Graph 5). / Durante la SE 23, no se informaron detecciones de influenza a nivel nacional y el porcentaje de positividad se mantuvo en los niveles de línea de base (Gráfico 1). Se registraron pocas detecciones de VRS con altos niveles de actividad en comparación con temporadas anteriores, mientras que la actividad de SARS-CoV-2 y el porcentaje de positividad disminuyeron en comparación con los registrados anteriormente con un 19,5% de muestras positivas (18 688/95 706) (Gráficos 2, 3 y 4 ). Durante las últimas tres semanas, los casos de IRAG aumentaron a niveles de actividad moderados en comparación con el promedio observado en temporadas anteriores (Gráfico 5).
Graph 1. Bolivia: Influenza virus distribution, EW 23, 2015-21 Distribución de influenza, SE 23, 2015-21
Graph 2. Bolivia: Influenza, RSV, and SARS-CoV-2 distribution, EW 23, 2015-21
Distribución de los virus influenza, VRS y SARS-CoV-2, SE 23, 2015-21
Graph 3. Bolivia: Percent positivity for influenza,
EW 23, 2021 (compared to 2010-20) Porcentaje de positividad de influenza, SE 23 de 2021
(comparado con 2010-20)
Graph 4. Bolivia: RSV, SARS-CoV-2, and other respiratory viruses
distribution, EW 23, 2015-21 Distribución del VRS, SARS-CoV-2 y otros virus respiratorios,
SE 23, 2015-21
Graph 5. Bolivia: Number of SARI cases / 100 inpatients,
EW 23, 2021 (compared to 2015-20) Número de casos de IRAG / 100 hospitalizaciones,
SE 23 de 2021 (comparado con 2015-20)
*To view more epi data, view here. / Para ver más datos epi, vea aquí.
South America / América del Sur – Andean countries / Países andinos
Bolivia
Sou
th A
mer
ica/
Am
éric
a d
el
Sur-
An
dea
n C
ou
ntr
ies/
Paí
ses
An
din
os
PAHO/OPS | INFLUENZA REGIONAL UPDATE EW 23, 2021 /ACTUALIZACIÓN REGIONAL DE INFLUENZA SE 23 DE 2021 28
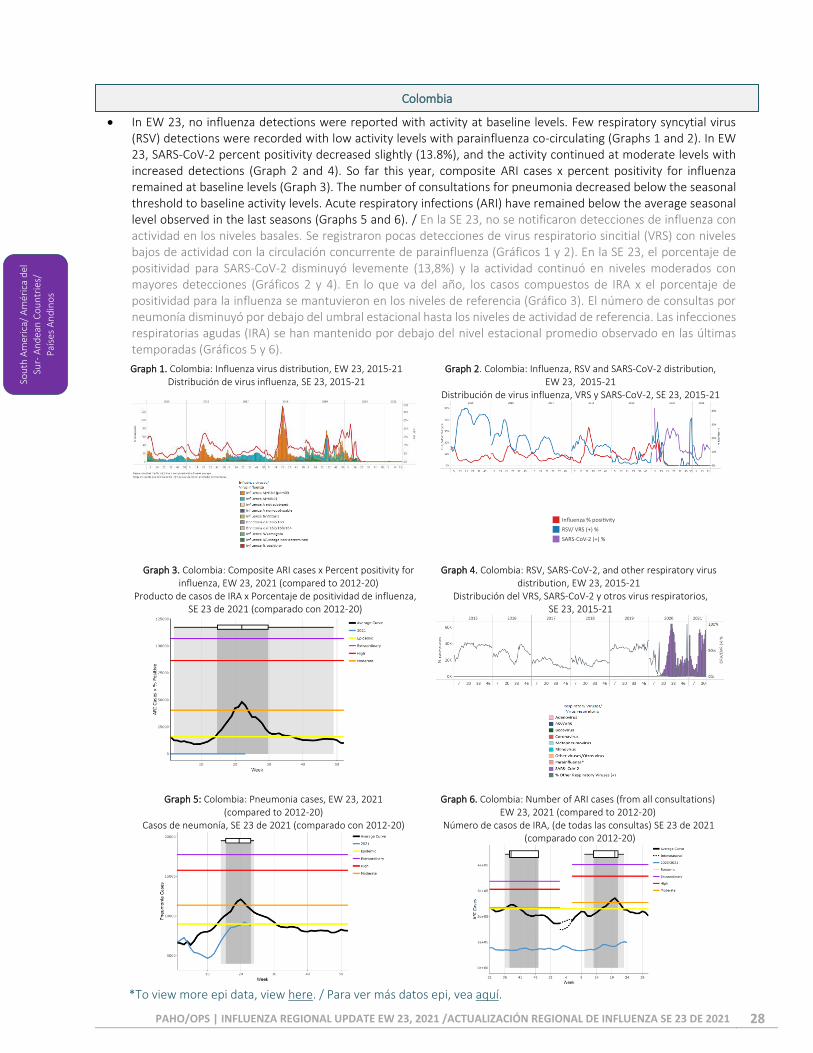
• In EW 23, no influenza detections were reported with activity at baseline levels. Few respiratory syncytial virus (RSV) detections were recorded with low activity levels with parainfluenza co-circulating (Graphs 1 and 2). In EW 23, SARS-CoV-2 percent positivity decreased slightly (13.8%), and the activity continued at moderate levels with increased detections (Graph 2 and 4). So far this year, composite ARI cases x percent positivity for influenza remained at baseline levels (Graph 3). The number of consultations for pneumonia decreased below the seasonal threshold to baseline activity levels. Acute respiratory infections (ARI) have remained below the average seasonal level observed in the last seasons (Graphs 5 and 6). / En la SE 23, no se notificaron detecciones de influenza con actividad en los niveles basales. Se registraron pocas detecciones de virus respiratorio sincitial (VRS) con niveles bajos de actividad con la circulación concurrente de parainfluenza (Gráficos 1 y 2). En la SE 23, el porcentaje de positividad para SARS-CoV-2 disminuyó levemente (13,8%) y la actividad continuó en niveles moderados con mayores detecciones (Gráficos 2 y 4). En lo que va del año, los casos compuestos de IRA x el porcentaje de positividad para la influenza se mantuvieron en los niveles de referencia (Gráfico 3). El número de consultas por neumonía disminuyó por debajo del umbral estacional hasta los niveles de actividad de referencia. Las infecciones respiratorias agudas (IRA) se han mantenido por debajo del nivel estacional promedio observado en las últimas temporadas (Gráficos 5 y 6).
Graph 1. Colombia: Influenza virus distribution, EW 23, 2015-21 Distribución de virus influenza, SE 23, 2015-21
Graph 2. Colombia: Influenza, RSV and SARS-CoV-2 distribution, EW 23, 2015-21
Distribución de virus influenza, VRS y SARS-CoV-2, SE 23, 2015-21
Graph 3. Colombia: Composite ARI cases x Percent positivity for
influenza, EW 23, 2021 (compared to 2012-20) Producto de casos de IRA x Porcentaje de positividad de influenza,
SE 23 de 2021 (comparado con 2012-20)
Graph 4. Colombia: RSV, SARS-CoV-2, and other respiratory virus
distribution, EW 23, 2015-21 Distribución del VRS, SARS-CoV-2 y otros virus respiratorios,
SE 23, 2015-21
Graph 5: Colombia: Pneumonia cases, EW 23, 2021
(compared to 2012-20) Casos de neumonía, SE 23 de 2021 (comparado con 2012-20)
Graph 6. Colombia: Number of ARI cases (from all consultations)
EW 23, 2021 (compared to 2012-20) Número de casos de IRA, (de todas las consultas) SE 23 de 2021
(comparado con 2012-20)
*To view more epi data, view here. / Para ver más datos epi, vea aquí.
Colombia
Sou
th A
mer
ica/
Am
éric
a d
el
Sur-
An
dea
n C
ou
ntr
ies/
Paí
ses
An
din
os

PAHO/OPS | INFLUENZA REGIONAL UPDATE EW 23, 2021 /ACTUALIZACIÓN REGIONAL DE INFLUENZA SE 23 DE 2021 29
• As of EW 23, no influenza or respiratory syncytial virus (RSV) detections were reported, with RSV at high activity level (Graph 1,2). In EW 23, SARS-CoV-2 percent positive decreased, and activity remained elevated (29.0%). (Graphs 2 and 4). During the last month, the number of SARI cases / 100 inpatients has decreased from extraordinary activity levels in EW 15 to low activity levels during EW 23. Pneumonia activity continued at baseline activity levels (Graphs 5 and 6). / A la SE 23 no se notificaron detecciones de influenza ni de virus respiratorio sincitial (VRS), con el VRS en nivel de actividad alto (Gráfico 1,2). En la SE 22, el porcentaje de positivos para SARS-CoV-2 disminuyó y el porcentaje de positividad se mantuvo elevada (29,0%). (Gráficos 2 y 4). Durante el último mes, el número de casos de IRAG / 100 pacientes hospitalizados ha disminuido de niveles de actividad extraordinaria en la SE 15 a niveles bajos de actividad en la SE 23. La actividad de neumonía continuó en los niveles de actividad basal (Gráficos 5 y 6).
Graph 1. Ecuador: Influenza virus distribution from SARI
sentinel cases, EW 23, 2015-21 Distribución de virus influenza de casos de IRAG centinela
SE 23, 2015-21
Graph 2. Ecuador: Influenza, RSV, and SARS-CoV-2 distribution
EW 23, 2015-21 Distribución de los virus influenza, VRS y SARS-CoV-2,
SE 23, 2015-21
Graph 3. Ecuador: Percent positivity for influenza, EW 23, 2021
(compared to 2011-20) Porcentaje de positividad de influenza, SE 23 de 2021
(comparado con 2011-20)
Graph 4. Ecuador: RSV, SARS-CoV-2, and other respiratory viruses
distribution, (non-sentinel sites) EW 23, 2015-21 Distribución del VRS, SARS-CoV-2 y otros virus respiratorios,
(sitios no centinela) SE 23, 2015-21
Graph 5. Ecuador: Number of SARI cases / 100 inpatients,
EW 23, 2021 (compared to 2015-20) Número de casos de IRAG / 100 hospitalizaciones,
SE 23 de 2021 (comparado con 2015-20)
Graph 6. Ecuador: Pneumonia cases, EW 23, 2021
(compared to 2013-20) Casos de neumonía, SE 23 de 2021
(comparado con 2013-20)
*To view more epi data, view here. / Para ver más datos epi, vea aquí.
Ecuador
Sou
th A
mer
ica/
Am
éric
a d
el
Sur-
An
dea
n C
ou
ntr
ies/
Paí
ses
An
din
os

PAHO/OPS | INFLUENZA REGIONAL UPDATE EW 23, 2021 /ACTUALIZACIÓN REGIONAL DE INFLUENZA SE 23 DE 2021 30
• In Peru, during EW 23, no influenza detections were reported (Graph 1). Influenza percent positivity remained at
baseline activity levels (Graph3). As of EW 23, respiratory syncytial virus detections have been reported with low activity levels. SARS-CoV-2 detections and percent positivity (7.8%) were at moderate levels but with a decreasing trend (Graphs 2 and 4). / En Perú, durante la SE 23, no se informaron detecciones de influenza (Gráfico 1). El porcentaje de positividad para la influenza se mantuvo en los niveles de actividad basales (Gráfico 3). A la SE 23 se han reportado detecciones de virus respiratorio sincitial con niveles de actividad bajos. Las detecciones de SARS-CoV-2 y el porcentaje de positividad (7,8%) estuvieron en niveles moderados, pero con una tendencia decreciente (Gráficos 2 y 4).
Graph 1. Peru: Influenza virus distribution, EW 23, 2015-21
Distribución de virus influenza, SE 23, 2015-21
Graph 2. Peru: Influenza, RSV, and SARS-CoV-2 distribution,
EW 23, 2015-21 Distribución de virus influenza, VRS y SARS-CoV-2,
SE 23, 2015-21
Graph 3. Peru: Percent positivity for influenza, EW 23, 2021 (compared to 2010-20)
Porcentaje de positividad de influenza, SE 23 de 2021 (comparado con 2010-20)
Graph 4. Peru: RSV, SARS-CoV-2, and other respiratory viruses distribution, EW 23, 2015-21
Distribución del VRS, SARS-CoV-2 y otros virus respiratorios, SE 23, 2015-21
*To view more epi data, view here. / Para ver más datos epi, vea aquí.
Peru
Sou
th A
mer
ica/
Am
éric
a d
el
Sur-
An
dea
n C
ou
ntr
ies/
Paí
ses
An
din
os

PAHO/OPS | INFLUENZA REGIONAL UPDATE EW 23, 2021 /ACTUALIZACIÓN REGIONAL DE INFLUENZA SE 23 DE 2021 31
no Sur y Brasil
• As of EW 23, influenza activity remained at baseline levels with no detections recorded since EW 19 (Graphs 1 and 3). In recent weeks respiratory syncytial virus activity has increased and remained elevated. SARS-CoV-2 percent positivity decreased with activity continuing high (34.6%) (Graphs 2 and 4). The number of ILI cases remained at baseline activity levels (Graph 5), with the number of SARI patients decreasing and the activity below the seasonal threshold (Graph 6). / A la SE 23, la actividad de la influenza se mantuvo en los niveles basales sin que se registraran detecciones desde la SE 19 (Gráficos 1 y 3). En las últimas semanas, la actividad del virus respiratorio sincitial ha aumentado y se mantiene elevada. El porcentaje de positividad de SARS-CoV-2 disminuyó y su actividad continúa alta (34,6%) (Gráficos 2 y 4). El número de casos de ETI se mantuvo en los niveles de actividad basales (Gráfico 5), disminuyendo el número de pacientes con IRAG y su actividad por debajo del umbral estacional (Gráfico 6).
Graph 1. Argentina: Influenza virus distribution, EW 23, 2015-21
Distribución de virus influenza, SE 23, 2015-21
Graph 2. Argentina: Influenza, RSV, and SARS-CoV2 distribution
EW 23, 2015-21 Distribución de virus influenza, VRS y SARS-CoV-2,
SE 23, 2015-21
Graph 3. Argentina: Percent positivity for influenza, EW 23, 2021 (compared to 2010-20)
Porcentaje de positividad de influenza, SE 23 de 2021 (comparado con 2010-20)
Graph 4. Argentina: RSV, SARS-CoV-2, and other respiratory virus distribution, EW 23, 2014-21
Distribución del VRS, SARS-CoV-2 y otros virus respiratorios, SE 23, 2014-21
Graph 4. Argentina: Number of ILI cases, EW 23, 2021 (compared to 2012-20)
Número de casos de ETI, SE 23 de 2021 (comparado con 2012-20)
Graph 4. Argentina: Number of SARI cases, EW 23, 2021 (compared to 2012-20)
Número de casos de IRAG, SE 23 de 2021 (comparado con 2012-20)
*To view more epi data, view here. / Para ver más datos epi, vea aquí.
South America / América del Sur – South Cone and Brazil / Cono sur y Brasil
Argentina
Sou
th A
mer
ica/
Am
éric
a d
el
Sur-
So
uth
Co
ne
and
Bra
zil/
C
on
o S
ur
y B
rasi
l

PAHO/OPS | INFLUENZA REGIONAL UPDATE EW 23, 2021 /ACTUALIZACIÓN REGIONAL DE INFLUENZA SE 23 DE 2021 32
• As of EW 23, no influenza detections have been reported, and percent positivity remained below epidemic levels of activity compared to previous seasons for the same period (Graphs 1, 2, and 3). In EW 23, few respiratory syncytial virus (RSV) detections were reported with co-circulation of rhinovirus and human coronavirus. SARS-CoV-2 detections decreased, and percent positivity remained similar to the percentage recorded the last week (39.1%) at high activity levels (Graphs 2 and 4). / A la SE 23, no se han reportado detecciones de influenza y el porcentaje de positividad se mantuvo por debajo de los niveles de actividad epidémica en comparación con temporadas anteriores para el mismo período (Gráficos 1, 2 y 3). En la SE 23, se informaron pocas detecciones de virus respiratorio sincitial (VRS) con circulación concurrente de rinovirus y coronavirus humano. Las detecciones de SARS-CoV-2 disminuyeron y el porcentaje de positividad se mantuvo similar al porcentaje registrado la última semana (39,1%) en niveles de actividad altos (Gráficos 2 y 4).
Graph 1. Brazil: All NICs. Influenza virus distribution, EW 23, 2015-21
Distribución de virus influenza, SE 23, 2015-21
Graph 2. Brazil: All NICs. Influenza, RSV, and SARS-CoV-2, distribution, EW 23, 2015-21
Distribución de los virus influenza, VRS y SARS-CoV-2, SE 23, 2015-21
Graph 3. Brazil: Percent positivity for influenza, EW 23, 2021
(compared to 2011-20) Porcentaje de positividad de influenza, SE 23 de 2021
(comparado con 2011-20)
Graph 4. Brazil: All NICs. RSV, SARS-CoV-2, and other respiratory
virus distribution, EW 23, 2015-21 Distribución del VRS, SARS-CoV-2 y otros virus respiratorios,
SE 23, 2015-21
*To view more epi data, view here. / Para ver más datos epi, vea aquí
Brazil
Sou
th A
mer
ica/
Am
éric
a d
el
Sur-
So
uth
Co
ne
and
Bra
zil/
Co
no
Su
r y
Bra
sil

PAHO/OPS | INFLUENZA REGIONAL UPDATE EW 23, 2021 /ACTUALIZACIÓN REGIONAL DE INFLUENZA SE 23 DE 2021 33
• In EW 23, no influenza detections were reported with influenza A virus (not subtyped) circulating in previous months; activity remained below the average epidemic curve (Graphs 1 and 3). During EW 23, few respiratory syncytial virus (RSV) detections were reported with rhinovirus and adenovirus co-circulating. SARS-CoV-2 activity remained similar to the previously observed remaining at high levels (90.0%), as 35 samples tested positive from the 39 tested (Graphs 2 and 4). By 2021, the number of ILI visits have remained below the average level of previous seasons (Graph 5); and the number of SARI cases /100 hospitalizations continued decreasing and was at the epidemic curve at low activity levels (Graph 6). / En la SE 23, no se informaron detecciones de influenza con la circulación de los virus influenza A (subtipo sin determinar) en meses anteriores; la actividad se mantuvo por debajo de la curva epidémica promedio (Gráficos 1 y 3). Durante la SE 23, se notificaron pocas detecciones de virus respiratorio sincitial (VRS) con la circulación concurrente de rinovirus y adenovirus. La actividad del SARS-CoV-2 se mantuvo similar a la observada anteriormente permaneciendo en niveles altos (90,0%), ya que 35 muestras dieron positivo de las 39 analizadas (Gráficos 2 y 4). En el 2021, el número de visitas de ETI se ha mantenido por debajo del nivel promedio de temporadas anteriores (Gráfico 5); y el número de casos de IRAG / 100 hospitalizaciones continuó disminuyendo y se ubicó en la curva epidémica con niveles de actividad bajos (Gráfico 6).
Chile: Influenza virus distribution, EW 23, 2015-21 Distribución de virus de influenza, SE 23, 2015-21
Graph 2. Chile: Influenza, RSV, and SARS-CoV-2, distribution, (sentinel surveillance) EW 23, 2015-21
Distribución de los virus influenza, VRS y SARS-CoV-2, (vigilancia centinela) SE 23, 2015-21
Graph 3. Chile: Percent positivity for influenza, EW 23, 2021
(compared to 2010-20) Porcentaje de positividad de influenza, SE 23 de 2021
(comparado con 2010-20)
Graph 4. Chile: RSV, SARS-CoV-2, and other respiratory viruses
distribution, (sentinel surveillance) EW 23, 2015-21 Distribución del VRS, SARS-CoV-2 y otros virus respiratorios
(vigilancia centinela) SE 23, 2015-21
Graph 5. Chile: Number of ILI cases EW 23, 2021
(compared to 2015-21) Número de consultas por ETI, SE 23 de 2021
(comparado con 2015-21)
Graph 6. Chile: SARI cases/100 hospitalizations (sentinel surveillance),
EW 23, 2021 (compared to 2015-20) Casos de IRAG/100 hospitalizaciones (vigilancia centinela),
SE 23 de 2021 (comparado con 2015-20)
*To view more epi data, view here. / Para ver más datos epi, vea aquí.
Chile
Sou
th A
mer
ica/
Am
éric
a d
el
Sur-
So
uth
Co
ne
and
Bra
zil/
Co
no
Su
r y
Bra
sil

PAHO/OPS | INFLUENZA REGIONAL UPDATE EW 23, 2021 /ACTUALIZACIÓN REGIONAL DE INFLUENZA SE 23 DE 2021 34
• As of EW 23, no influenza detections were reported at the national level, remaining below the seasonal threshold for this time of year. In recent weeks respiratory syncytial virus activity has increased and remained at high levels. (Graphs 1, 2, and 3). In EW 23, at the national level, SARS-CoV-2 percent positivity decreased from 28.0% to 23.0% and remained at elevated activity levels (Graphs 2 and 4). A la SE 23, no se informaron detecciones de influenza a nivel nacional, permaneciendo por debajo del umbral estacional para esta época del año. En las últimas semanas, la actividad del virus sincitial respiratorio ha aumentado y se mantiene en niveles elevados. (Gráficos 1, 2 y 3). En la SE 23, a nivel nacional, el porcentaje de positividad para SARS-CoV-2 disminuyó de 28,0% a 23,0% y se mantuvo en niveles elevados de actividad (Gráficos 2 y 4).
Graph 1. Paraguay: Influenza virus distribution EW 23, 2015-21
Distribución de virus de influenza, SE 23, 2015-21
Graph 2. Paraguay: Influenza, RSV, and SARS-CoV-2 distribution,
EW 23, 2015-21 Distribución de los virus influenza, VRS y SARS-CoV-2,
SE 23, 2015-21
Graph 3. Paraguay: Percent positivity for influenza, EW 23, 2021 (in comparision to 2010-21)
Porcentaje de positividad de influenza, SE 23 de 2021 (comparado con 2010-21)
Graph 4. Paraguay: RSV, SARS-CoV-2, and other respiratory viruses distribution, EW 23, 2015-21
Distribución del VRS, SARS-CoV-2 y otros virus respiratorios, SE 23, 2015-21
*To view more epi data, view here. / Para ver más datos epi, vea aquí.
Paraguay
Sou
th A
mer
ica/
Am
éric
a d
el
Sur-
So
uth
Co
ne
and
Bra
zil/
C
on
o S
ur
y B
rasi
l

PAHO/OPS | INFLUENZA REGIONAL UPDATE EW 23, 2021 /ACTUALIZACIÓN REGIONAL DE INFLUENZA SE 23 DE 2021 35
• As of EW 23, no influenza virus detections have been recorded; the positivity percentage remained at baseline levels for this time of year (Graphs 1 and 3). During EW 23, no respiratory syncytial virus (RSV) detections were reported. At the national level, SARS-CoV-2 detections, and percent positivity (17.3%) decreased compared to levels reported in the previous week (Graph 2). With sentinel surveillance, the number of SARI cases/100 hospitalizations remained similar to the number recorded previously and continued at the epidemic threshold (Graph 4). / A la SE 23, no se registraron detecciones de virus de influenza; el porcentaje de positividad permaneció en los niveles de referencia para esta época del año (Gráficos 1 y 3). En la SE 23, no se informaron detecciones de virus respiratorio sincitial (VRS). A nivel nacional, las detecciones de SARS-CoV-2 y el porcentaje de positividad (17,3%) disminuyó en comparación con los niveles informados en la semana anterior (Gráfico 2). En la vigilancia centinela, el número de casos de IRAG / 100 hospitalizaciones se mantuvo similar al registrado anteriormente y continuó en el umbral epidémico (Gráfico 4).
Graph 1. Uruguay: Influenza virus distribution EW 23, 2015-21
Distribución de virus de influenza, SE 23, 2015-21
Graph 2. Uruguay: Influenza and RSV distribution, EW 23, 2015-21
Distribución de los virus influenza y VRS, SE 23, 2015-21
Graph 3. Uruguay: Percent positivity for influenza, EW 23, 2021
(compared to 2010-20) Porcentaje de positividad de influenza, SE 23 de 2021
(comparado con 2010-20)
Graph 4. Uruguay: SARI cases/100 hospitalizations (sentinel
surveillance), EW 23, 2021 (compared to 2017-20) Casos de IRAG/100 hospitalizaciones (vigilancia centinela),
SE 23 de 2021 (comparado con 2017-20)
*To view more epi data, view here. / Para ver más datos epi, vea aquí.
Uruguay
Sou
th A
mer
ica/
Am
éric
a d
el
Sur-
So
uth
Co
ne
and
Bra
zil/
Co
no
Su
r y
Bra
sil

PAHO/OPS | INFLUENZA REGIONAL UPDATE EW 23, 2021 /ACTUALIZACIÓN REGIONAL DE INFLUENZA SE 23 DE 2021 36
ACRONYMS
ARI Acute respiratory infection
CARPHA Caribbean Public Health Agency
CENETROP Centro de Enfermedades Tropicales (Santa Cruz, Bolivia)
EW Epidemiological week
ILI Influenza-like illness
INS Instituto Nacional de Salud
ORV Other respiratory viruses
SARI Severe acute respiratory infection
ICU Intensive care unit
RSV Respiratory syncytial virus
_________________________________________
ACRÓNIMOS
CARPHA Agencia de Salud Pública del Caribe
CENETROP Centro de Enfermedades Tropicales (Santa Cruz, Bolivia)
ETI Enfermedad tipo influenza
INLASA Instituto Nacional de Laboratorios de Salud (La Paz, Bolivia)
INS Instituto Nacional de Salud
IRA Infección respiratoria aguda
IRAG Infección respiratoria aguda grave
OVR Otros virus respiratorios
SE Semana epidemiológica
SEDES Servicio Departamental de Salud (Bolivia)
UCI Unidad de cuidados intensivos
VRS Virus respiratorio sincitial
Acr
on
yms
/
Acr
ón
imo
s