Kinetics of hardness evolution during annealing of gamma-irradiated polycarbonate
Upload
pascaunesaCategory
view
0download
0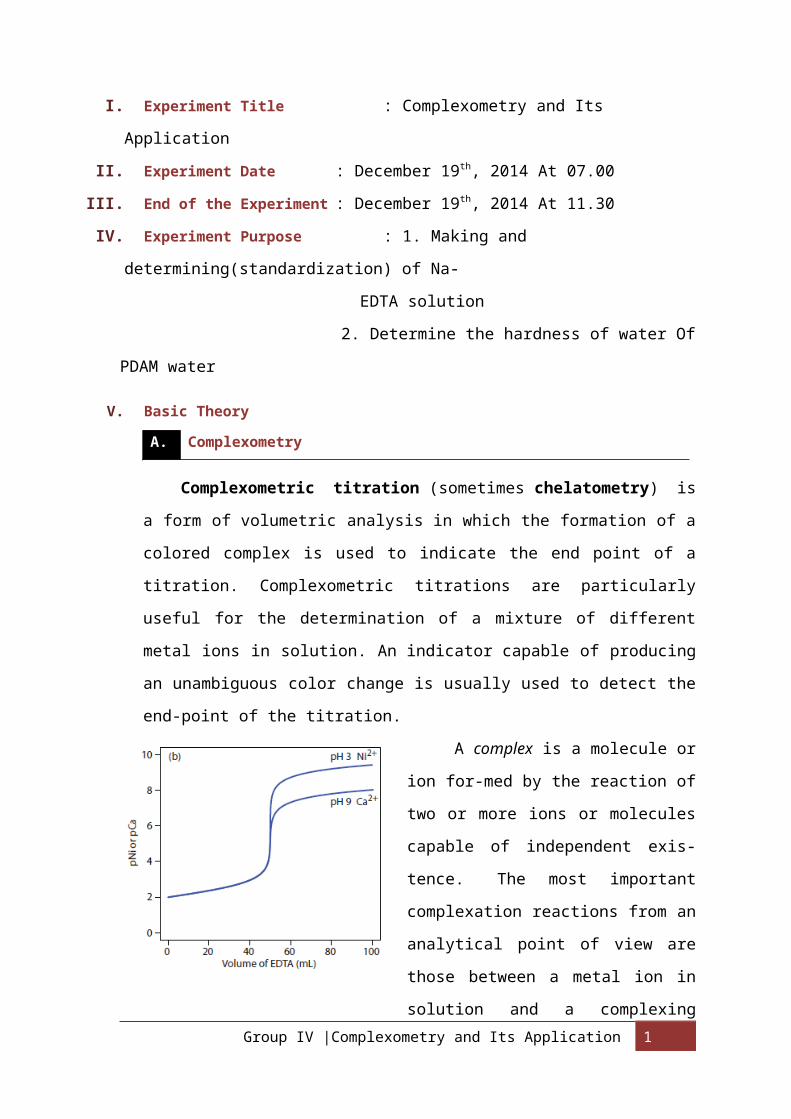
I. Experiment Title : Complexometry and Its
Application
II. Experiment Date : December 19th, 2014 At 07.00
III. End of the Experiment : December 19th, 2014 At 11.30
IV. Experiment Purpose : 1. Making and
determining(standardization) of Na-
EDTA solution
2. Determine the hardness of water Of
PDAM water
V. Basic Theory
A. Complexometry
Complexometric titration (sometimes chelatometry) is
a form of volumetric analysis in which the formation of a
colored complex is used to indicate the end point of a
titration. Complexometric titrations are particularly
useful for the determination of a mixture of different
metal ions in solution. An indicator capable of producing
an unambiguous color change is usually used to detect the
end-point of the titration.
A complex is a molecule or
ion for-med by the reaction of
two or more ions or molecules
capable of independent exis-
tence. The most important
complexation reactions from an
analytical point of view are
those between a metal ion in
solution and a complexingGroup IV |Complexometry and Its Application 1

agent. A metal atom can usu-
ally form a bond with one or
more donor atoms which have at
least one unshared pair
of electrons. The number of donor atoms which bond with
a given atom depends on the number of electron pairs that
the metal ion can accept, in other words, the
coordination number of the metal ion. Complexing agents,
or ligands, which can provide more than one pair of
electrons (multidentate ligands), are also called chelating
agents.
Complexometric titrations are particularly useful for
determination of a mixture of different metal ions in
solution. An indicator with a marked color change is
usually used to detect the end-point of the titration.
In a complexometric titration, a solution containing
the free metal ion of interest is titrated with a
solution of chelating agent until all of the metal ions
are completely complexed. The endpoint is usually
measured with an indicator ligand that forms a colored
complex with the free metal ion.
Chelating Agent: EDTA
The most important chelating agent in analytical
chemistry is ethelyenedia-minetetraacetic acid
(EDTA). The tetrabasic form of this acid forms
complexes with virtually all metal ions. EDTA is a
hexadentate ligand; each of the acid oxy-gens and each
of the amine nitrogens can donate one electron pair.
Group IV |Complexometry and Its Application 2

The metal ion is usually held in a one-to-one complex
with EDTA. The complexes have four or five membered
rings, contributing significantly to their stability.
Unfortunately, EDTA cannot be easily used as a primary
standard. It is available in pure form, but must be
dried at 80°C for several days to obtain the precise
composition of the dihydrate. In any case,
standardization of EDTA titrant against a solution of
the metal ion to be determined helps to eliminate any
errors in endpoint selection.
It is important to realize that the electron pairs
of the carboxylic acid groups of EDTA are only
available to the metal ion when the acid is
dissociated. This means that the effectiveness of the
complexing agent is strongly affected by pH. At low pH
EDTA will be in the acid form and will not be an
effective complexing agent. Additionally, many metal
ions form complexes with hydroxide ions. Hydroxide
ions compete with the chelating agent for coordination
sites in the me-tal ion. Therefore, the effectiveness
of the complexing agent will also be reduced at high
Group IV |Complexometry and Its Application 3
pKa-2 =
0.0
pKa-1 =
1.5
pKa1 =
2.0

pH. For a given chelating agent and metal ion, there
will be an optimum pH for the titration which will
depend on the pKa values for the chelating agent and
the formation constants for the metal-hydroxide
complexes.
Complex Titration with EDTA
EDTA, ethylenediaminetetraacetic acid, has four
carboxyl groups and two amine groups that can act as
electron pair donors, or Lewis bases. The ability of
EDTA to potentially donate its six lone pairs of
electrons for the formation of co-ordinate covalent
bonds to metal cations makes EDTA a hexadentate
ligand. However, in practice EDTA is usually only
partially ionized, and thus forms fe-wer than six
coordinate covalent bonds with metal cations.
Disodium EDTA is commonly used to standardize
aqueous solutions of transition metal cations.
Disodium EDTA (often written as Na2H2Y) only forms four
coordinate covalent bonds to metal cations at pH
values ≤ 12. In this pH range, the amine groups remain
protonated and thus unable to donate electrons to the
formation of coordinate covalent bonds. Note that the
shorthand form Na4-xHxY can be used to represent any
species of EDTA, with x designating the number of
acidic protons bonded to the EDTA molecule.
Group IV |Complexometry and Its Application 4
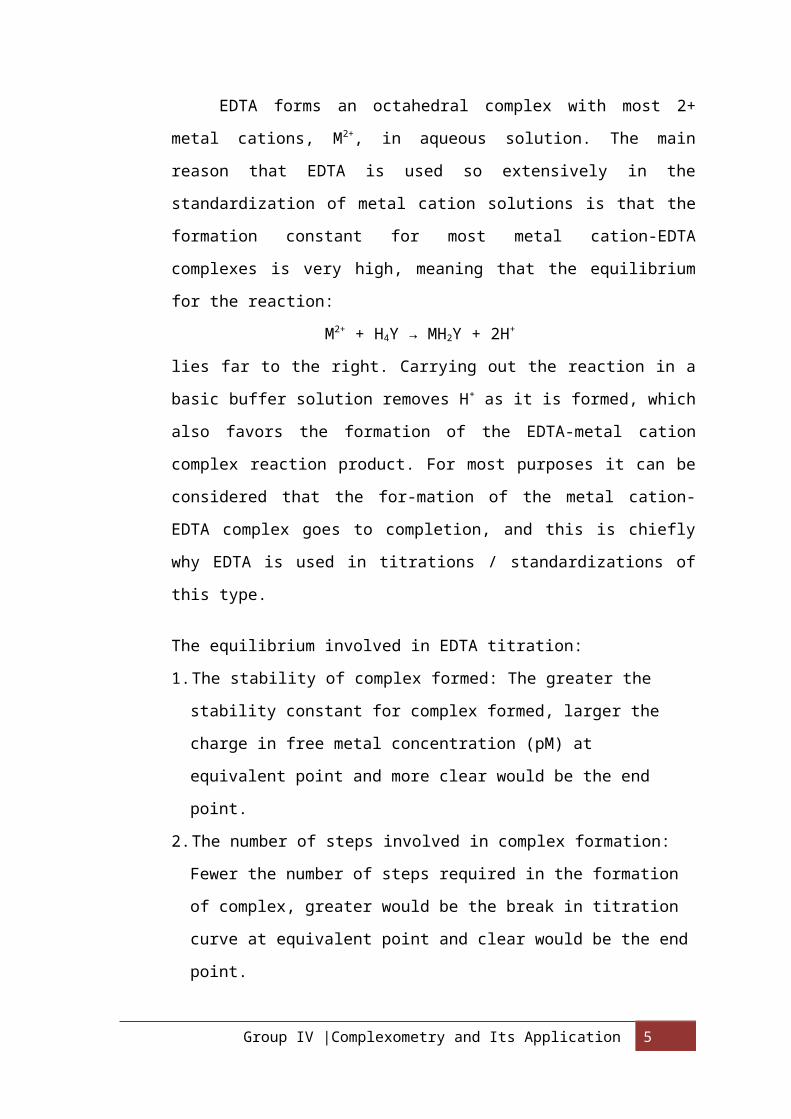
EDTA forms an octahedral complex with most 2+
metal cations, M2+, in aqueous solution. The main
reason that EDTA is used so extensively in the
standardization of metal cation solutions is that the
formation constant for most metal cation-EDTA
complexes is very high, meaning that the equilibrium
for the reaction:
M2+ + H4Y → MH2Y + 2H+
lies far to the right. Carrying out the reaction in a
basic buffer solution removes H+ as it is formed, which
also favors the formation of the EDTA-metal cation
complex reaction product. For most purposes it can be
considered that the for-mation of the metal cation-
EDTA complex goes to completion, and this is chiefly
why EDTA is used in titrations / standardizations of
this type.
The equilibrium involved in EDTA titration:
1.The stability of complex formed: The greater the
stability constant for complex formed, larger the
charge in free metal concentration (pM) at
equivalent point and more clear would be the end
point.
2.The number of steps involved in complex formation:
Fewer the number of steps required in the formation
of complex, greater would be the break in titration
curve at equivalent point and clear would be the end
point.
Group IV |Complexometry and Its Application 5

3.Effect of pH: During a complexometric titration, the
pH must be constant by use of a buffer solution.
Control of pH is important since the H+ ion plays an
important role in chelation. Most ligands are basic
and bind to H+ ions throughout a wide range of pH.
Some of these H+ ions are frequently displaced from
the ligands (chelating agents) by the metal during
chelate formation.
Indicators
To carry out metal cation titrations using EDTA,
it is almost always neces-sary to use a complexometric
indicator to determine when the end point has been
reached. Common indicators are organic dyes such as
Fast Sulphon Black, Erio-chrome Black T, Eriochrome
Red B, Patton Reeder, or Murexide. Color change shows
that the indicator has been displaced (usually by
EDTA) from the metal cations in solution when the end
point has been reached. Thus, the free indicator
(rather than the metal complex) serves as the endpoint
indicator.
EBT indicators
The structure of Eriochrome Black T are shown
below
Group IV |Complexometry and Its Application 6
OH
N
NO2
-
O3SN
OH
Chelate metal formed with Eriochrome Black T
molecule with the disappe-arance of hydrogen ions
from phenolate –OH and formation bonding bet-ween
metal ion and oxygen atoms and also azo-group.
This indicator forming red wine stable complex 1:1
with some cations, such as Mg2+, Ca2+, Zn2+, and Ni2+.
Most of the EDTA titration occur in buffer pH 8-
10, a range where the dominant form of EBT is HIn2-
blue colored.
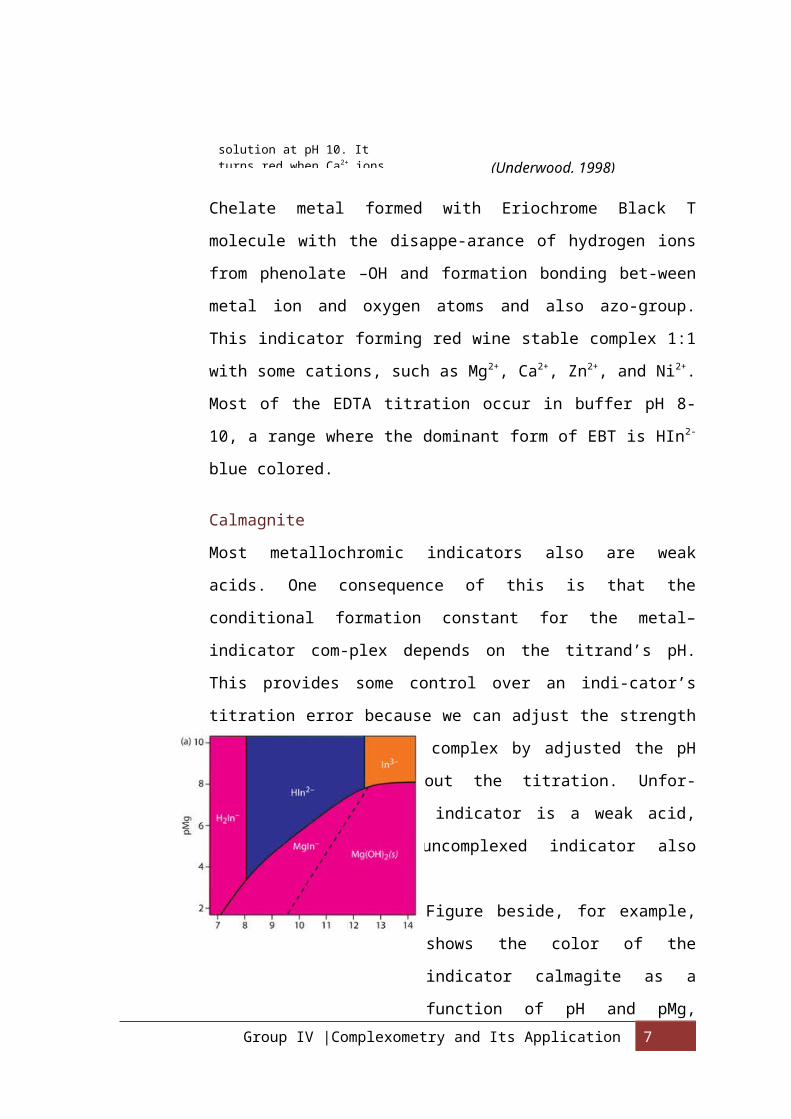
Calmagnite
Most metallochromic indicators also are weak
acids. One consequence of this is that the
conditional formation constant for the metal–
indicator com-plex depends on the titrand’s pH.
This provides some control over an indi-cator’s
titration error because we can adjust the strength
of a metal–indica-tor complex by adjusted the pH
at which we carry out the titration. Unfor-
tunately, because the indicator is a weak acid,
the color of the uncomplexed indicator also
changes with pH.
Figure beside, for example,
shows the color of the
indicator calmagite as a
function of pH and pMg,Group IV |Complexometry and Its Application 7
(Underwood, 1998)solution at pH 10. It turns red when Ca2+ ions

where H2In–, HIn2–, and
In3– are different forms of
the uncomplexed indicator,
and MgIn– is the Mg2+–
calmagite complex. Because
the color of calmagite’s
metal–indicator com-
plex is red, its use as a metallochromic indicator
has a practical pH range of approximately 8.5–11
where the uncomplexed indicator, HIn2–, has a blue
color.
Some other indicator known can be used for some
cations:
Application of EDTA Titration
EDTA titration mostly succeeds in every cations.
There are some procedure which used in this kind of
analytic gravimetric:
Group IV |Complexometry and Its Application 8

Direct Titration
It is the simplest and the most convenient method
used in chelometry. In this method, the standard
chelon solution is added to the metal ion solution
until the end point is detected. This method is
analogous to simple acid-base titrations. E.g.-
calcium gluconate injection, calcium lactate
tablets and compound sodium lactate injection for
the assay of calcium chloride (CaCl2.6H2O).
Limitations -slow complexation reaction -
Interference due to presence of other ions
Back Titration
In this method, excess of a standard EDTA solution
is added to the metal solution, which is to be
analyzed, and the excess is back titrated with a
standard solution of a second metal ion. E.g. -
Determination of Mn. This metal cannot be directly
titrated with EDTA because of precipitation of
Mn(OH)2. An excess of known volume of EDTA is
added to an acidic solution of Mn salt and then
ammonia buffer is used to adjust the pH to 10 and
the excess EDTA remaining after chelation, is back
titrated with a standard Zn solution kept in
burette using Eriochrome blackT as indicator. This
method is analogous to back titration method in
acidimetry. e.g.- ZnO
Replacement Titration
Group IV |Complexometry and Its Application 9
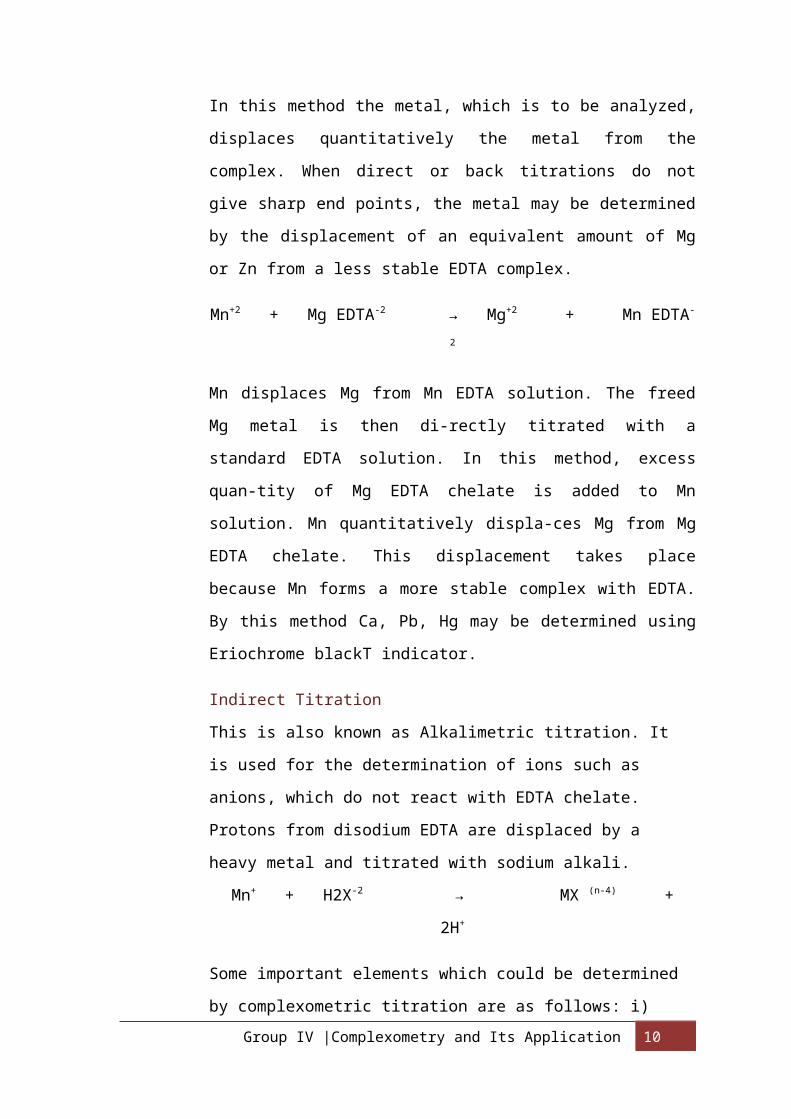
In this method the metal, which is to be analyzed,
displaces quantitatively the metal from the
complex. When direct or back titrations do not
give sharp end points, the metal may be determined
by the displacement of an equivalent amount of Mg
or Zn from a less stable EDTA complex.
Mn+2 + Mg EDTA-2 → Mg+2 + Mn EDTA-
2
Mn displaces Mg from Mn EDTA solution. The freed
Mg metal is then di-rectly titrated with a
standard EDTA solution. In this method, excess
quan-tity of Mg EDTA chelate is added to Mn
solution. Mn quantitatively displa-ces Mg from Mg
EDTA chelate. This displacement takes place
because Mn forms a more stable complex with EDTA.
By this method Ca, Pb, Hg may be determined using
Eriochrome blackT indicator.
Indirect Titration
This is also known as Alkalimetric titration. It
is used for the determination of ions such as
anions, which do not react with EDTA chelate.
Protons from disodium EDTA are displaced by a
heavy metal and titrated with sodium alkali.
Mn+ + H2X-2 → MX (n-4) +
2H+
Some important elements which could be determined
by complexometric titration are as follows: i) Group IV |Complexometry and Its Application 10

Direct Titration : Analysis of Cu, Mn, Ca, Ba, Br,
Zn, Cd, Hg, Al, Thallium, Sn, Pb, Bi, Vanadium,
Cr, Mo, Gallium, Fe, Co, Ni, and Pd.
B. Application of Complexometry: Determination the hardness
of water
Complexometric titration is an efficient method for
determining the level of hardness of water. Caused by
accumulation of mineral ions, pH of water is increased.
The Kf during the titration of hard water is reduced
because of the reduced amount of EDTA added.
Softening of hard water is done by altering the pH of
the water reducing the concentration of the metal ions
present.Could be performed in two phases: Basic pH for
ions with high Kf e.g. Ca2+ and Mg2+
Hard water is water that has high mineral content (in
contrast with "soft water"). Hard water is formed when
water percolates through deposits of calcium and magne-
sium-containing minerals such as limestone, chalk and
dolomite. Group IV |Complexometry and Its Application 11
Figure: End point for the titration of hardness with EDTA using EBT as anindicator; the indicator is: (a) red WINEprior to the end point due to thepresence of the Ca2+–indicator complex; (b) grey-blue at the titration’s end

Hard drinking water is generally not harmful to one's
health, but can pose seri-ous problems in industrial
settings, where water hardness is monitored to avoid
costly breakdowns in boilers, cooling towers, and other
equipment that handles water. In do-mestic settings, hard
water is often indicated by a lack of suds formation when
soap is agitated in water, and by the formation of lime
scale in kettles and water heaters. Wherever water
hardness is a concern, water softening is commonly used
to reduce hard water's adverse effects.
Minerals that cause hard water have a wide impact on
households. Hard water interferes with almost every
cleaning task from laundering and dishwashing to bathing
and personal grooming. Clothes laundered in hard water
may look dingy and feel harsh and scratchy. Dishes and
glasses washed in hard water may become spotted as they
dry. Hard water may cause a film on glass shower doors,
shower walls, and bath-tubs. Hair washed in hard water
may feel sticky and look dull.
Calcium
Calcium occurs in water naturally. Seawater
contains approximately 400 ppm calcium. One of the
main reasons for the abundance of calcium in water is
its natural occurrence in the earth's crust. Calcium
is also a constituent of coral. Rivers generally
contain 1-2 ppm calcium, but in lime areas rivers may
contains calcium concentrations as high as 100 ppm.
Examples of calcium concentrations in water organisms:
Group IV |Complexometry and Its Application 12
seaweed luctuca 800-6500 ppm (moist mass), oysters
appro-ximately 1500 ppm (dry mass).
In a watery solution calcium is mainly present as
Ca2+ (aq), but it may also occur as CaOH+ (aq) or
Ca(OH)2 (aq), or as CaSO4 in seawater. Calcium is an
important determinant of water harness, and it also
functions as a pH stabilizer, because of its buffering
qualities. Calcium also gives water a better taste.
Ca (s) + 2H2O (g) -> Ca(OH)2 (aq) + H2 (g)
This reaction forms calcium hydroxide that
dissolves in water as a soda, and hydrogen gas.
Calcium is a dietary mineral that is present in
the human body in amounts of about 1.2 kg. No other
element is more abundant in the body. Calcium phos-
phate is a supporting substance, and it causes bone
and tooth growth, together with vitamin D. Calcium is
also present in muscle tissue and in the blood. It is
required for cell membrane development and cell
division, and it is partially res-ponsible for muscle
contractions and blood clotting. Calcium regulates
membrane activity, it assists nerve impulse transfer
and hormone release, stabilizes the pH of the body,
and is an essential part of conception. In order to
stimulate these body functions a daily intake of about
1000 mg of calcium is recommended for adults. This may
be achieved by consuming dairy, grains and green
vegetables.
Group IV |Complexometry and Its Application 13

Calcium carbonate works as a stomach acid remedy
and may be applied to resolve digestive failure.
Calcium lactate may aid the body during periods of
calcium deficiency, and calcium chloride is a
diuretic. Hard water may assist in strengthening bones
and teeth because of its high calcium concentration.
It may also decrease the risk of heart conditions.
Drinking water hardness must be above 8.4 odH. Calcium
carbonate has a positive effect on lead water pipes,
because it forms a protective lead(II)carbonate
coating. This prevents lead from dissolving in
drinking water, and thereby prevents it from entering
the human body.
Calcium and magnesium ions present as sulfates,
chlorides, carbonates, and bicarbonates cause water to
be hard. Water chemists measure water impurities in
parts per million (ppm), but water hardness is often
expressed in grains of hardness per gallon of water
(gpg). The two systems can be converted
mathematically. Table 1 gives common classifications
for hard water with values listed in both parts per
million and grains per gallon. One grain of hardness
is the amount of calcium and magnesium equal in weight
to a kernel of wheat.
Table 1. Hard Water Classifications.
Group IV |Complexometry and Its Application 14
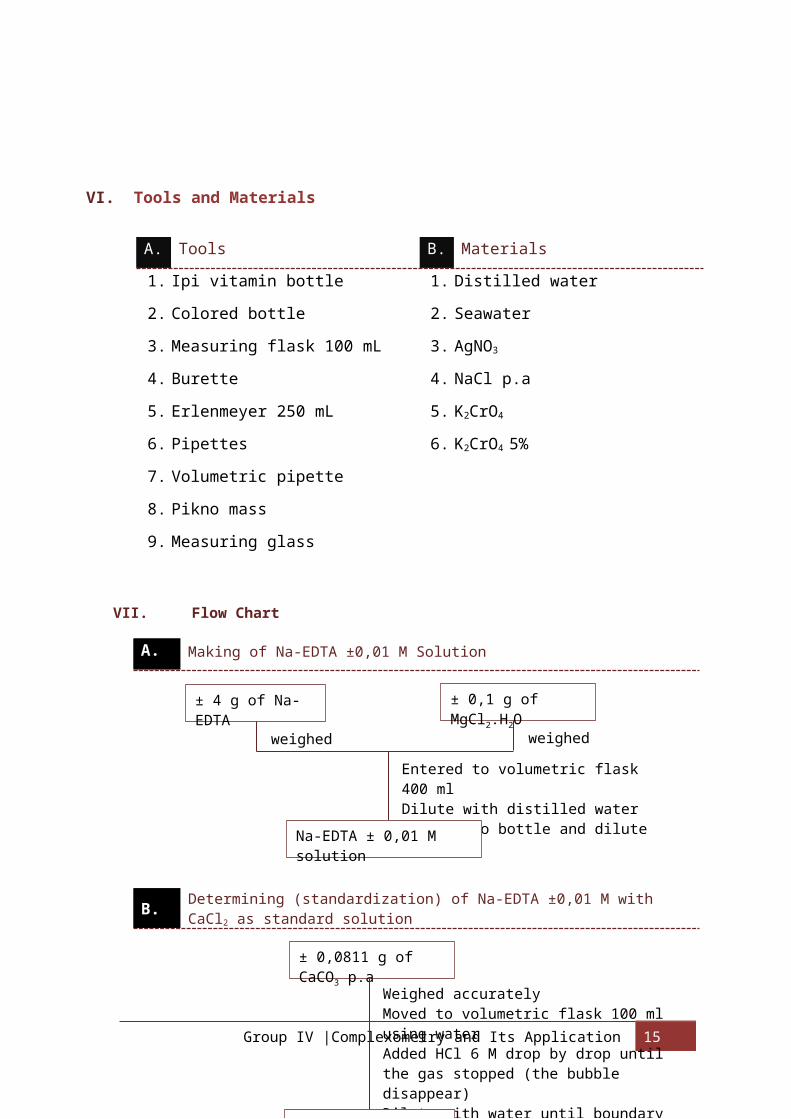
VI. Tools and Materials
A. Tools B. Materials1. Ipi vitamin bottle
2. Colored bottle
3. Measuring flask 100 mL
4. Burette
5. Erlenmeyer 250 mL
6. Pipettes
7. Volumetric pipette
8. Pikno mass
9. Measuring glass
1. Distilled water
2. Seawater
3. AgNO3
4. NaCl p.a
5. K2CrO4
6. K2CrO4 5%
VII. Flow Chart
A. Making of Na-EDTA ±0,01 M Solution
B. Determining (standardization) of Na-EDTA ±0,01 M with CaCl2 as standard solution
Group IV |Complexometry and Its Application 15
± 4 g of Na-EDTA
± 0,1 g of MgCl2.H2O
weighed weighed
Entered to volumetric flask 400 mlDilute with distilled waterMoved into bottle and dilute until 1 L
Na-EDTA ± 0,01 M solution
± 0,0811 g of CaCO3 p.a
Weighed accurately Moved to volumetric flask 100 ml using waterAdded HCl 6 M drop by drop until the gas stopped (the bubble disappear)Dilute with water until boundary lineShaked well
CaCl2 ± 0,01 M solution

C. Application of Complexometry: Hardness water of PDAM water
Group IV |Complexometry and Its Application 16
Weighed accurately Moved to volumetric flask 100 ml using waterAdded HCl 6 M drop by drop until the gas stopped (the bubble disappear)Dilute with water until boundary lineShaked well
CaCl2 ± 0,01 M solution
Na-EDTA ± 0,01 M solution
25 ml of CaCl2 ±0,01 M solutionEntered to volumetric
flask 300 mlAdded 5 ml of buffer solution (pH:10)Added 3 drops of EBT indicator
Entered to burette
Titrated
Color changes from red wine to
blueRead and write down the volume of Na-EDTACalculate the concentration of Na-EDTARepeated 3 timesAverage concentration of
Na-EDTA
Na-EDTA ± 0,01 M solution
10 ml of water sample
(PDAM)Entered to volumetric flask 300 mlAdded 5 ml of buffer solution (pH:10)Added 3 drops of EBT indicator
Entered to burette
Titrated
Color changes from red wine to
blueRead and write down the volume of Na-EDTACalculate the Hardness water of sampleRepeated 3 timesTotal hardness water of CaCO3
salt/liter
Group IV |Complexometry and Its Application 17
Total hardness water of CaCO3 salt/liter
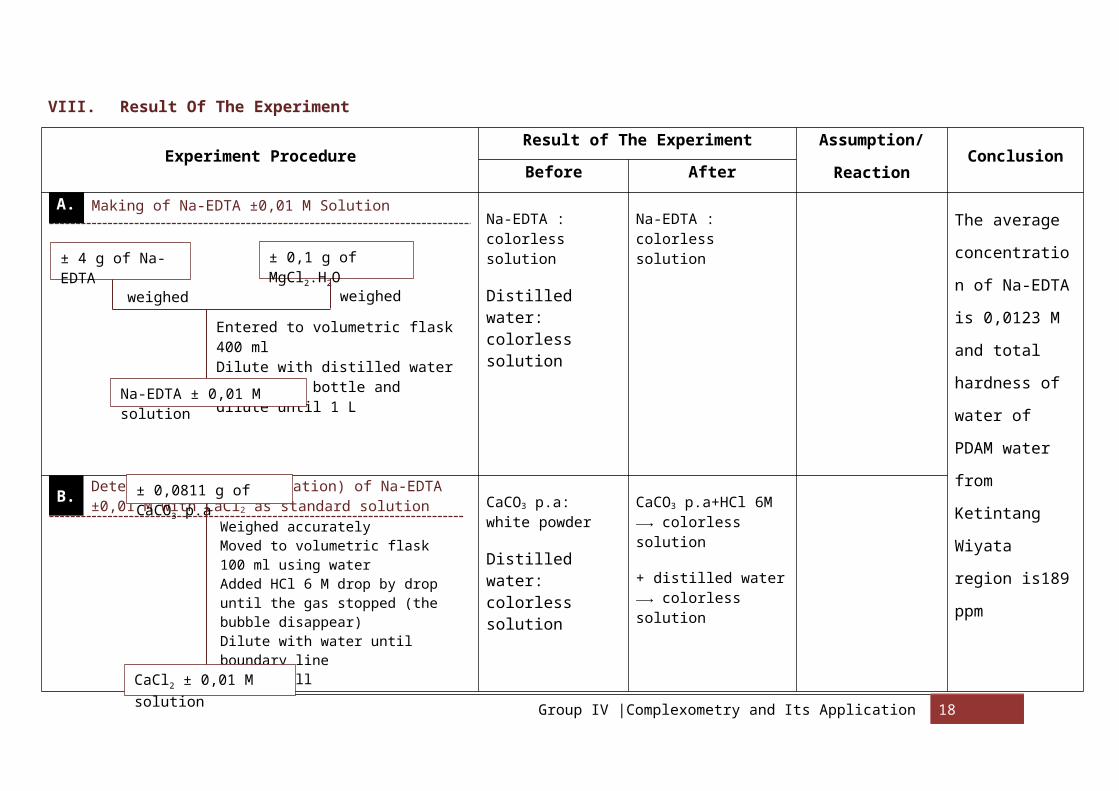
VIII. Result Of The Experiment
Experiment ProcedureResult of The Experiment Assumption/
ReactionConclusion
Before AfterA. Making of Na-EDTA ±0,01 M Solution
Na-EDTA : colorless solution
Distilled water: colorless solution
Na-EDTA : colorless solution
The average
concentratio
n of Na-EDTA
is 0,0123 M
and total
hardness of
water of
PDAM water
from
Ketintang
Wiyata
region is189
ppm
B. Determining (standardization) of Na-EDTA ±0,01 M with CaCl2 as standard solution CaCO3 p.a:
white powder
Distilled water: colorless solution
CaCO3 p.a+HCl 6M ⟶ colorless solution
+ distilled water⟶ colorless solution
Group IV |Complexometry and Its Application 18
± 4 g of Na-EDTA
± 0,1 g of MgCl2.H2O
weighed weighed
Entered to volumetric flask 400 mlDilute with distilled waterMoved into bottle and dilute until 1 L
Na-EDTA ± 0,01 M solution
± 0,0811 g of CaCO3 p.a
Weighed accurately Moved to volumetric flask 100 ml using waterAdded HCl 6 M drop by drop until the gas stopped (the bubble disappear)Dilute with water until boundary lineShaked wellCaCl2 ± 0,01 M
solution

Distilled water: colorless solution
Na-EDTA : colorless solution
Buffere solution: colorless solution
EBT: red wine solution
CaCl2: colorless solution
CaCl2+ buffer solution ⟶ colorless solution
+3 drops of EBT ⟶ red wine solution
+ Na-EDTA⟶ bluesolution
V Na-EDTAV1= 16,3 mlV2= 16,5 mlV3= 16,4 ml
Ca2++Y4- ⟶ CaY2--
Group IV |Complexometry and Its Application 19

C.Applicaton of Complexometry: Hardness water of PDAM water
Na-EDTA : colorless solution
Buffere solution: colorless solution
EBT: red wine solution
Sample:
Sample + buffer solution ⟶ colorless solution
+3 drops of EBT ⟶ red wine solution
+ Na-EDTA⟶ bluesolution
V Na-EDTA
Ca2++Y4- ⟶ CaY2--
Group IV |Complexometry and Its Application 20
Na-EDTA ± 0,01 M solution
10 ml of water sample
(PDAM)Entered to volumetric flask 300 mlAdded 5 ml of buffer solution (pH:10)Added 3 drops of EBT indicator
Entered to burette
Titrated
Color changes from red wine to
blueRead and write down the volume of Na-EDTACalculate the Hardness water of sampleRepeated 3 times
Total hardness water of CaCO3 salt/liter
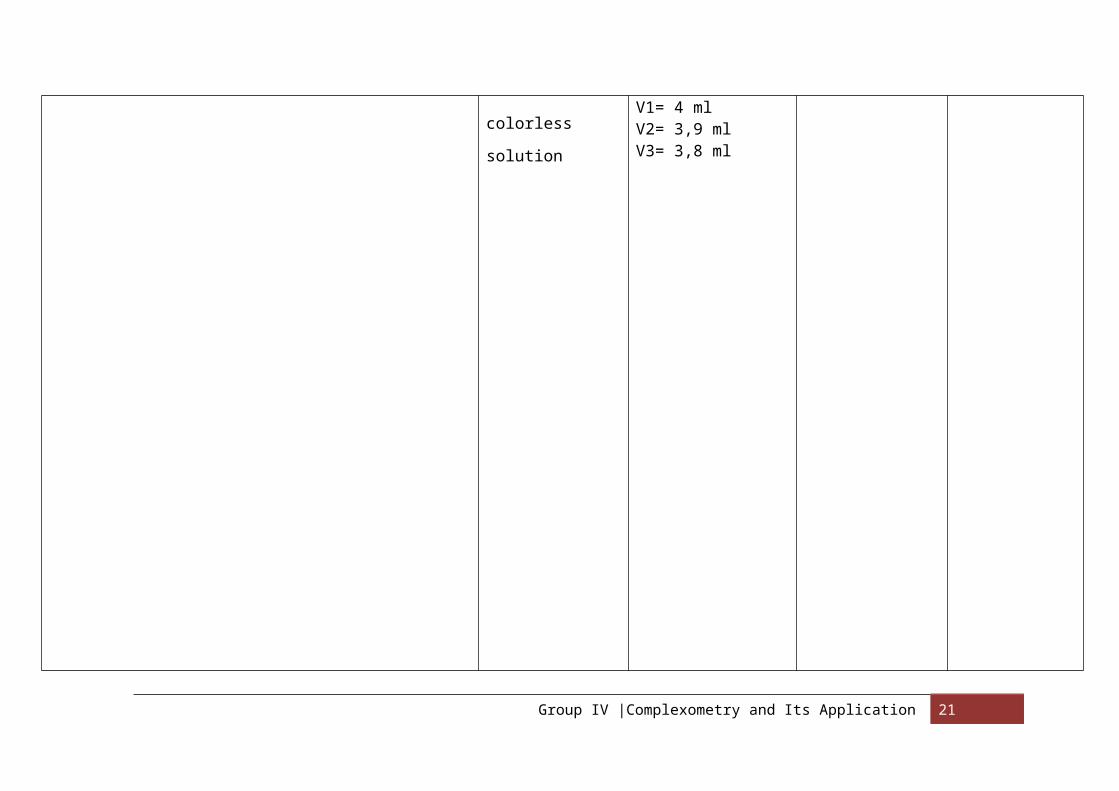
colorless
solution
V1= 4 mlV2= 3,9 mlV3= 3,8 ml
Group IV |Complexometry and Its Application 21

Group IV |Complexometry and Its Application 22
10 drops of KMNO4
Solution B
+ H2O until
10 drops of H2C2O4
Solution A
+ H2O until

IX. Analysis and Explanation:
Complexometric is a form of volumetric analysis in which
the formation of a co-lored complex is used to indicate the
end point of a titration. Complexometric titrations are
particularly useful for the determination of a mixture of
different metal ions in solution.
An indicator capable of producing an unambiguous color
change is usually used to detect the end-point of the
titration. In this experiment we will detect Ca2+ in
formation of Complex with Na-EDTA. This experiment we use
CaCl2 as a standard solution, because it not primary
standard so we must make standard solution from this matter.
A. Determining (standardization) of Na-EDTA ±0,01 M with CaCl2 as standard solution
We use CaCO3 pure analyte to make standard solution
CaCl2. Weight accurately 0.0811 gram of CaCO3 p.a (white
powder). Moved to volumetric flask 100 ml using water but
not until boundary line, after that add HCl 6M (colourless
solution) drop to drop until the gases is stop.
CaCO3(s) + 2HCl(aq) →CaCl2(aq) + H2O(l) + CO2(g)
Before added HCl the solution is turbid but after added
HCl the solution becomes colorless.The function of adding
HCl is to making loosen carbon dioxide, because from this
reaction carbon dioxide which can be seen in the bubble
form, calcium chloride, and water will be formed. If the
bubble has completely gone, it means the CaCl2 has been
formed and it can be used to standardization as the analyte.
Group IV |Complexometry and Its Application 23

This Titration used 25 ml of CaCl2 solution entered to
Erlenmeyer. Added 5 ml of buffer solution pH=10, the
solution still colorless. The function of the buffer
solution pH= 10 addition because in pH 8-10 is a range where
dominant form of EBT is in form blue HIn2- and this titration
of CaCl2 and Na-EDTA is in a basic condition during
titration. Buffer solution will defend the pH because this
titration needs the constant pH to make titration process
stable. After that, added 3 drops of EBT indicators. The
solution changes color from colorless to red wine. It is
suitable with the theory because EBT has red wine in color
(shown in picture below). The reason why using this
indicator is because this indicator forming red wine stable
complex 1:1 with some cations such as: Mg2+, Ca2+,
Zn2+, and Ni2+. Since this
titration using CaCO3 as the
analyte which contain ion of
Ca2+. So, EBT is suitable to be
used in this experiment
The reaction is:
Ca2+ + In3- ⇄ CaIn-
Metal ion indicator
indicator-metal (colorless) (blue)
complex(wine-red)
Group IV |Complexometry and Its Application 24
Based on the theory: EBT is blue in a buffered solution at pH 10. It turns red when Ca2+ ions
Based on the expe-riment: the addition of EBT changes the solu-tion to red wine solu-tion
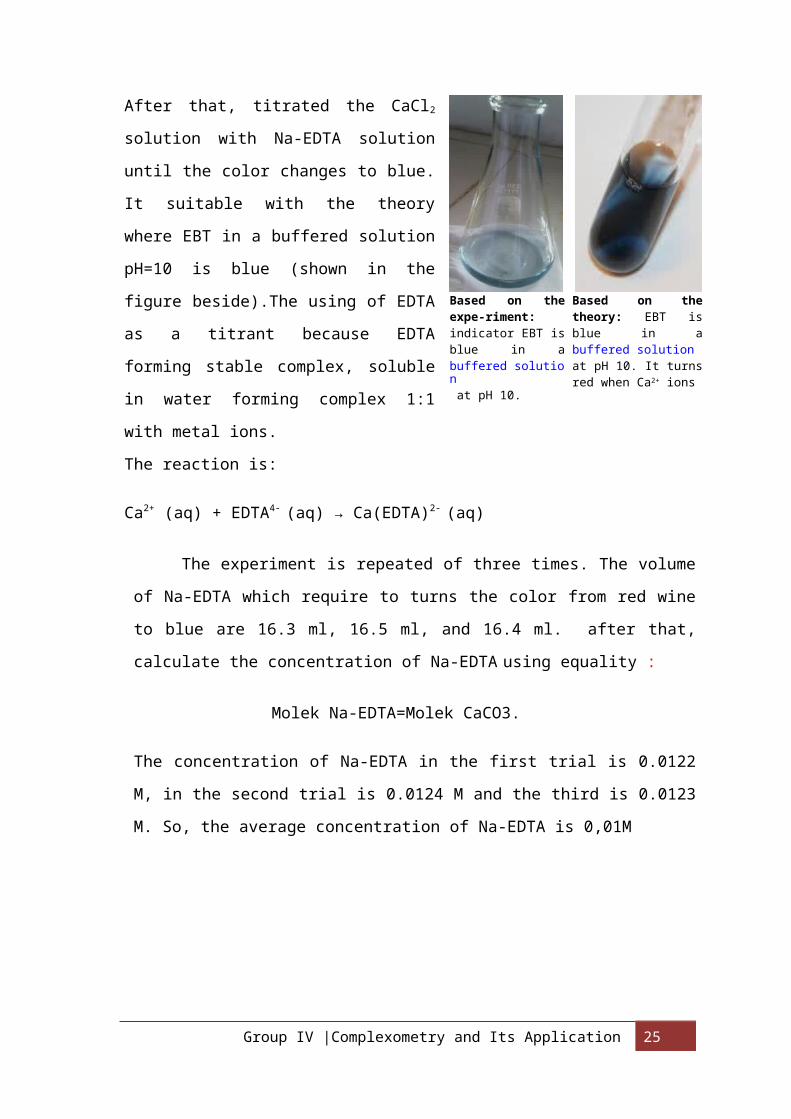
After that, titrated the CaCl2
solution with Na-EDTA solution
until the color changes to blue.
It suitable with the theory
where EBT in a buffered solution
pH=10 is blue (shown in the
figure beside).The using of EDTA
as a titrant because EDTA
forming stable complex, soluble
in water forming complex 1:1
with metal ions.
The reaction is:
Ca2+ (aq) + EDTA4- (aq) → Ca(EDTA)2- (aq)
The experiment is repeated of three times. The volume
of Na-EDTA which require to turns the color from red wine
to blue are 16.3 ml, 16.5 ml, and 16.4 ml. after that,
calculate the concentration of Na-EDTA using equality :
Molek Na-EDTA=Molek CaCO3.
The concentration of Na-EDTA in the first trial is 0.0122
M, in the second trial is 0.0124 M and the third is 0.0123
M. So, the average concentration of Na-EDTA is 0,01M
Group IV |Complexometry and Its Application 25
Based on the theory: EBT is blue in a buffered solution at pH 10. It turns red when Ca2+ ions
Based on the expe-riment: indicator EBT is blue in a buffered solution at pH 10.

B. Application of Complexometry: Hardness water of PDAM water
This application is determine the hardness of water.
Here we are using sample of PDAM water which we took from
Ketintang Wiyata region. The PDAM water is used as the
analyte and EDTA as a titer. First, enter 10 ml of sample
to Erlenmeyer. Next, adding 2 ml of buffer solution pH=10.
The function of the buffer solution pH= 10 addition
because in pH 8-10 is a range where dominant form of EBT
is in form blue HIn2- and this titration of CaCl2 and Na-
EDTA is in a basic condition during titration. Buffer
solution will defend the pH because this titration needs
the constant pH to make titration process stable. After
that add 3 drops of EBT. The solution changes color from
colorless to red wine. It is suitable with the theory
because EBT has red wine in color (shown in picture
below).
The reason why using this
indicator is because this
indicator forming red wine
stable complex 1:1 with some
cations such as: Mg2+, Ca2+, Zn2+,
and Ni2+. Since this titration
has purpose to determine the
level of Ca2+ in the sample, so
EBT is suitable to be used in
this experiment
The reaction is:
Ca2+ + In3- ⇄ CaIn- Group IV |Complexometry and Its Application 26
Based on the theory: EBT is blue in a buffered solution at pH 10. It turns red when Ca2+ ions
Based on the expe-riment: the addition of EBT changes the solu-tion to red wine solu-tion
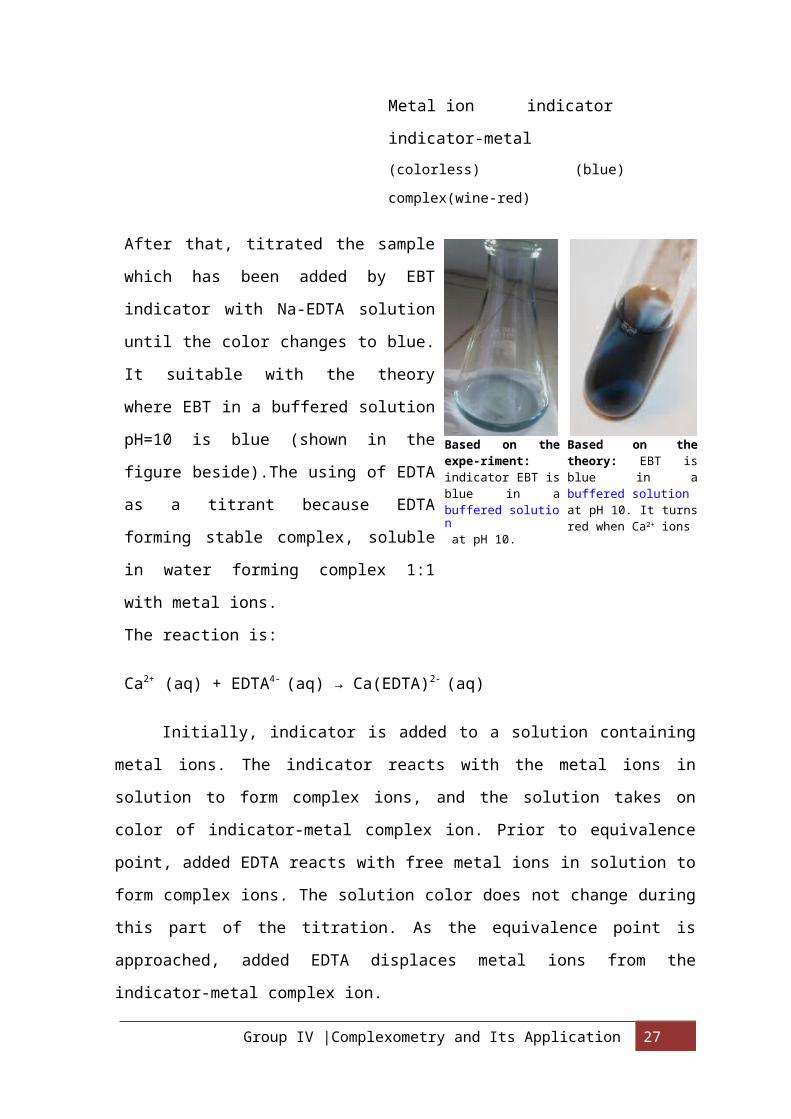
Metal ion indicator
indicator-metal (colorless) (blue)
complex(wine-red)
After that, titrated the sample
which has been added by EBT
indicator with Na-EDTA solution
until the color changes to blue.
It suitable with the theory
where EBT in a buffered solution
pH=10 is blue (shown in the
figure beside).The using of EDTA
as a titrant because EDTA
forming stable complex, soluble
in water forming complex 1:1
with metal ions.
The reaction is:
Ca2+ (aq) + EDTA4- (aq) → Ca(EDTA)2- (aq)
Initially, indicator is added to a solution containing
metal ions. The indicator reacts with the metal ions in
solution to form complex ions, and the solution takes on
color of indicator-metal complex ion. Prior to equivalence
point, added EDTA reacts with free metal ions in solution to
form complex ions. The solution color does not change during
this part of the titration. As the equivalence point is
approached, added EDTA displaces metal ions from the
indicator-metal complex ion.
Group IV |Complexometry and Its Application 27
Based on the theory: EBT is blue in a buffered solution at pH 10. It turns red when Ca2+ ions
Based on the expe-riment: indicator EBT is blue in a buffered solution at pH 10.

The experiment is repeated of three times. The volume
of Na-EDTA which require to turns the color from red wine
to blue are 4 ml, 3,9 ml, and 3,8 ml. After that,
calculate the concentration of sample using equation:
Molek of sample = Molek Na-EDTA
From the standardization experiment, we know that the
concentration of Na-EDTA is 0,0123 M. From data above, the
concentration of sample in the first trial is 0.0049 M, in
the second trial is 0.0047 M and the third is 0.0046 M.
So, the average concentration of sample is 0,0047 M
The next step is determining the hardness of water for
each concentration from the calculation we done before.
But, first we have to calculate the mass of Ca2+ in the
sample using equation:
Msample=massofCa
ArCa× 1000100
×dilutionfactor
In the first trial with concentration of sample is 0,0049
M we get mass of Ca2+ in the sample is 0,00196 g. After
that calculate the level of Ca2+ in the sample using
equation:
Level of Ca2+ in water sample ¿ MassofCavsample
And we get the level of Ca2+ is 196 ppm. For the second
trial, the mass of Ca2+ in the sample is 0,00188 g and the
level of Ca2+ in the sample is 188 ppm. Meanwhile, for the
Group IV |Complexometry and Its Application 28

third trial the mass of Ca2+ in the sample is 0,00184 g and
the level of Ca2+ in the sample is 184 ppm. So the average
level Ca2+ in the sample is 189 ppm.
XI.Conclusion
From the experiment, we can conclude that :
1. The concentration of Na-EDTA standard solution is 0,0123
m
2. The level of Ca2+ in seawater is 189 ppm
X. Question and Answer( standardization)
1. NaC10H16N2O8 and C20H12N3O7SNa
2. Calcium concentrations are measured in units of ppm as
calcium, ppm as CaCO3, moles per liter, or any other
convenient concentration unit. Table 1 indicates some of
the concentration units.
TABLE 1: Concentration Unit Conversion Factors
3. We'll take a mixture of ammonia and ammonium chloride
solutions as typical. Ammonia is a weak base, and the
position of this equilibrium will be well to the left:
Group IV |Complexometry and Its Application 29
Adding ammonium chloride to this adds lots of extra
ammonium ions. According to Le Chatelier's Principle,
that will tip the position of the equilibrium even
further to the left.
The solution will therefore contain these important
things:
lots of unreacted ammonia;
lots of ammonium ions from the ammonium chloride;
Enough hydroxide ions to make the solution alkaline.
Other things (like water and chloride ions) which are
present aren't important to the argument.
Adding an acid to this buffer solution
There are two processes which can remove the hydrogen
ions that you are adding.
Removal by reacting with ammonia
The most likely basic substance which a hydrogen ion is
going to collide wih is an ammonia molecule. They will
react to form ammonium ions.
Most, but not all, of the hydrogen ions will be removed.
The ammonium ion is weakly acidic, and so some of the
hydrogen ions will be released again.
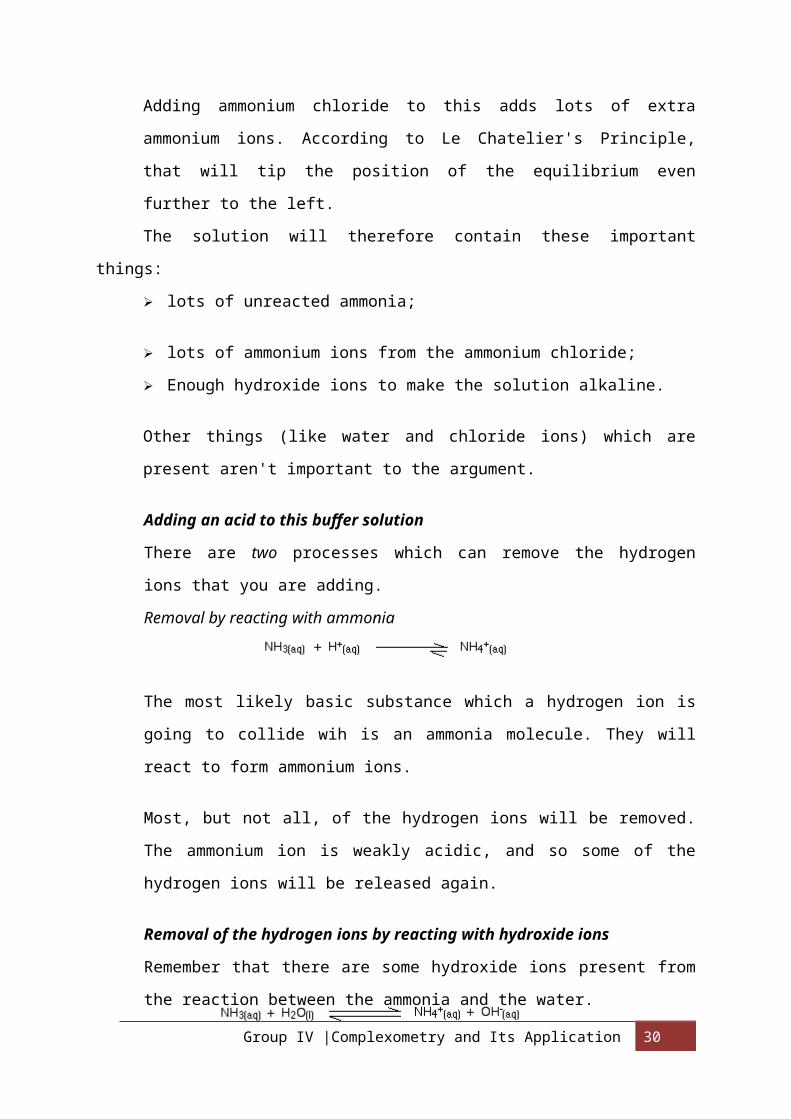
Removal of the hydrogen ions by reacting with hydroxide ions
Remember that there are some hydroxide ions present from
the reaction between the ammonia and the water.
Group IV |Complexometry and Its Application 30
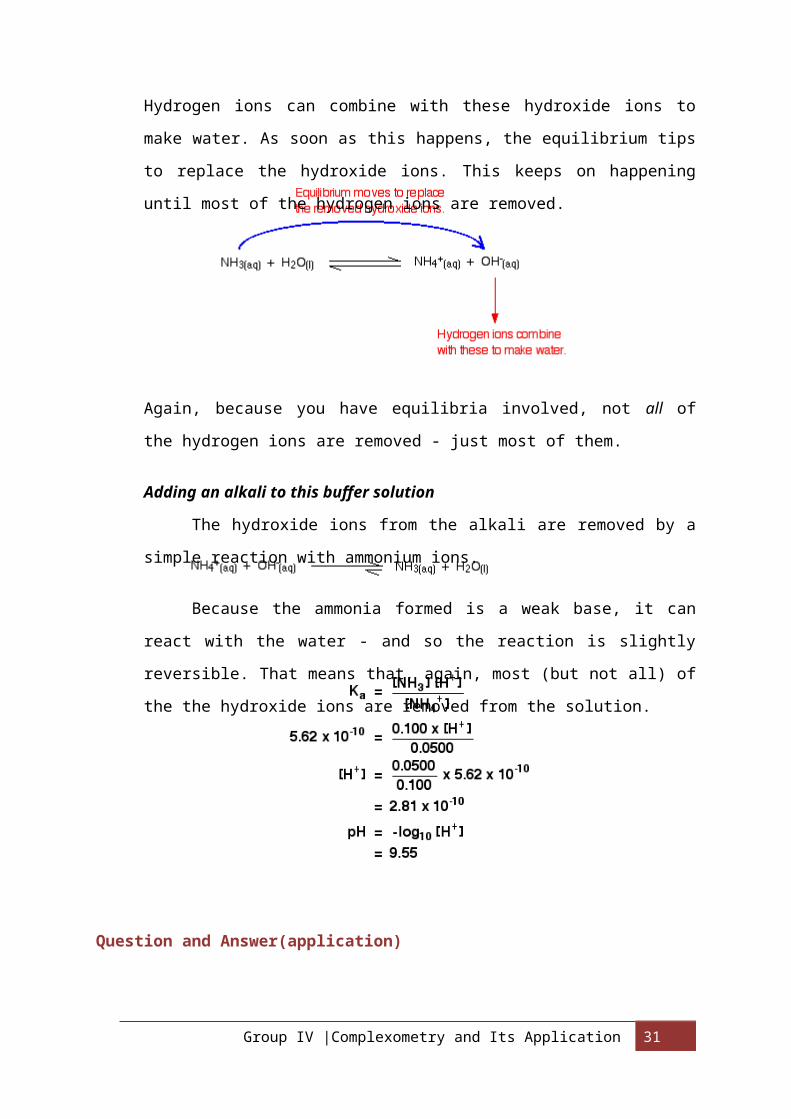
Hydrogen ions can combine with these hydroxide ions to
make water. As soon as this happens, the equilibrium tips
to replace the hydroxide ions. This keeps on happening
until most of the hydrogen ions are removed.
Again, because you have equilibria involved, not all of
the hydrogen ions are removed - just most of them.
Adding an alkali to this buffer solution
The hydroxide ions from the alkali are removed by a
simple reaction with ammonium ions.
Because the ammonia formed is a weak base, it can
react with the water - and so the reaction is slightly
reversible. That means that, again, most (but not all) of
the the hydroxide ions are removed from the solution.
Question and Answer(application)
Group IV |Complexometry and Its Application 31
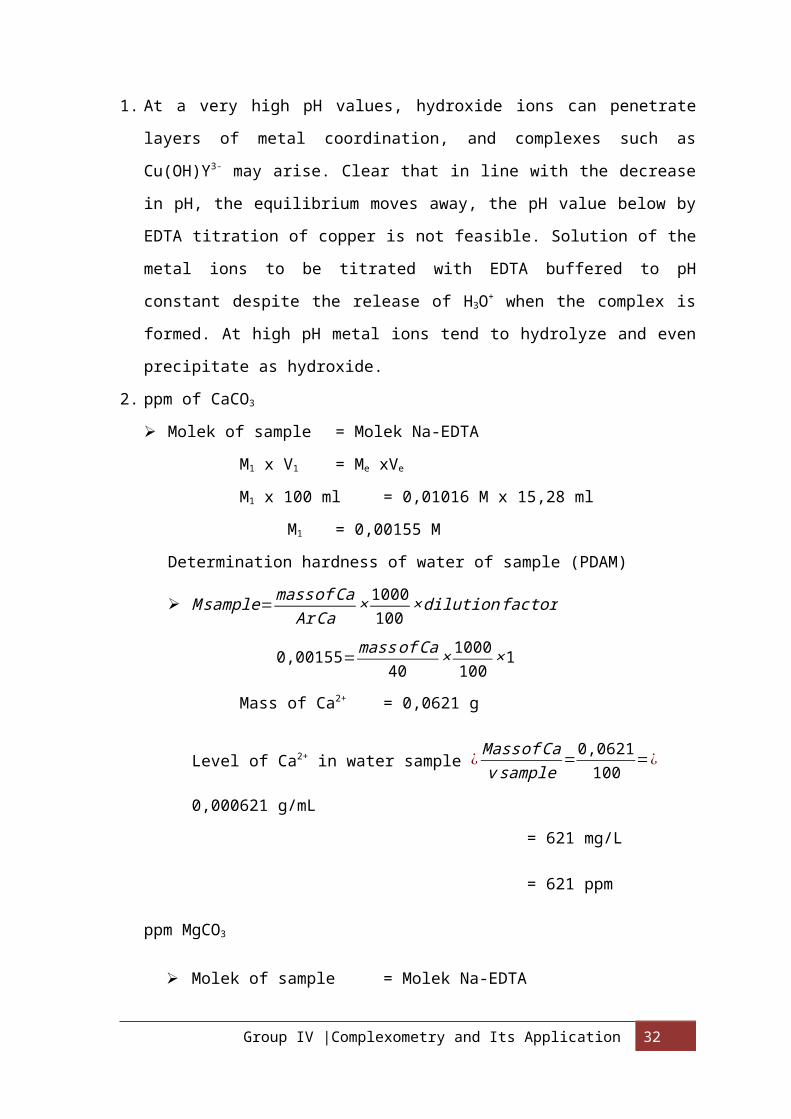
1. At a very high pH values, hydroxide ions can penetrate
layers of metal coordination, and complexes such as
Cu(OH)Y3- may arise. Clear that in line with the decrease
in pH, the equilibrium moves away, the pH value below by
EDTA titration of copper is not feasible. Solution of the
metal ions to be titrated with EDTA buffered to pH
constant despite the release of H3O+ when the complex is
formed. At high pH metal ions tend to hydrolyze and even
precipitate as hydroxide.
2. ppm of CaCO3
Molek of sample = Molek Na-EDTA
M1 x V1 = Me xVe
M1 x 100 ml = 0,01016 M x 15,28 ml
M1 = 0,00155 M
Determination hardness of water of sample (PDAM)
Msample=massofCa
ArCa× 1000100
×dilutionfactor
0,00155=massofCa40
× 1000100
×1
Mass of Ca2+ = 0,0621 g
Level of Ca2+ in water sample ¿ MassofCavsample=0,0621100
=¿
0,000621 g/mL
= 621 mg/L
= 621 ppm
ppm MgCO3
Molek of sample = Molek Na-EDTA
Group IV |Complexometry and Its Application 32
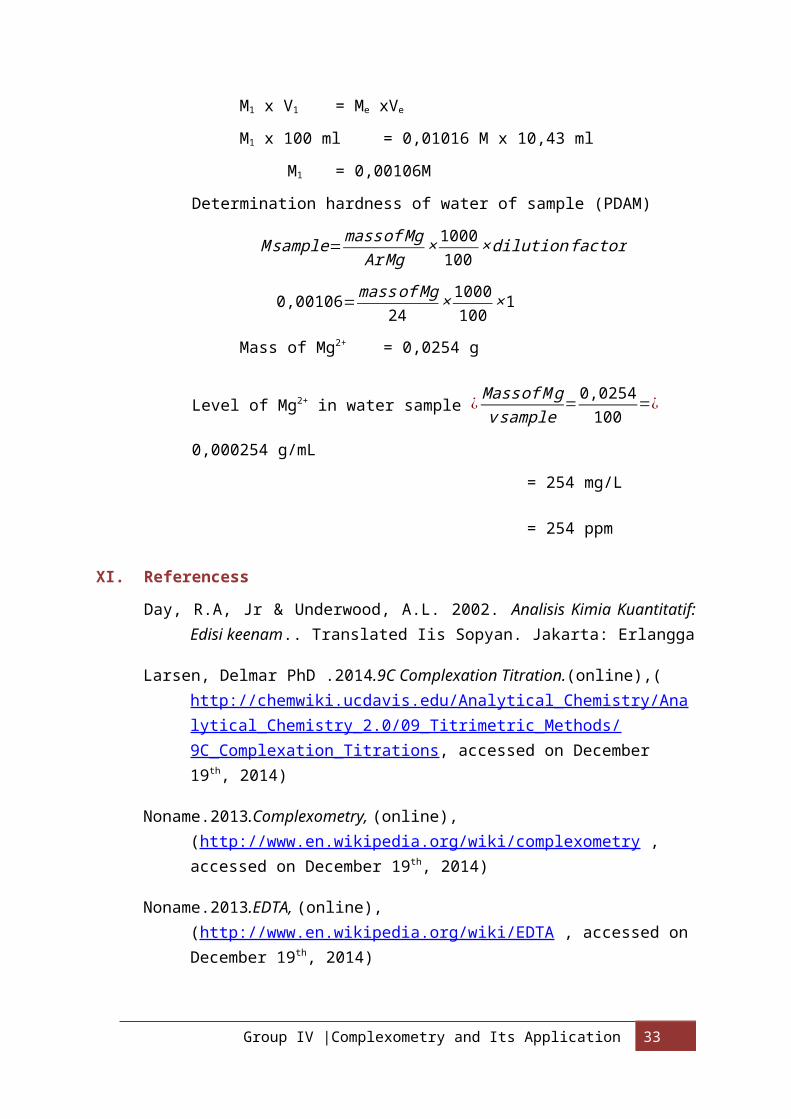
M1 x V1 = Me xVe
M1 x 100 ml = 0,01016 M x 10,43 ml
M1 = 0,00106M
Determination hardness of water of sample (PDAM)
Msample=massofMg
ArMg× 1000100
×dilutionfactor
0,00106=massofMg24
× 1000100
×1
Mass of Mg2+ = 0,0254 g
Level of Mg2+ in water sample ¿ MassofMgvsample=0,0254
100=¿
0,000254 g/mL
= 254 mg/L
= 254 ppm
XI. Referencess
Day, R.A, Jr & Underwood, A.L. 2002. Analisis Kimia Kuantitatif:Edisi keenam.. Translated Iis Sopyan. Jakarta: Erlangga
Larsen, Delmar PhD .2014.9C Complexation Titration.(online),(http://chemwiki.ucdavis.edu/Analytical_Chemistry/Analytical_Chemistry_2.0/09_Titrimetric_Methods/9C_Complexation_Titrations, accessed on December 19th, 2014)
Noname.2013.Complexometry, (online),(http://www.en.wikipedia.org/wiki/complexometry , accessed on December 19th, 2014)
Noname.2013.EDTA, (online),(http://www.en.wikipedia.org/wiki/EDTA , accessed onDecember 19th, 2014)
Group IV |Complexometry and Its Application 33
Svehla, G.(1985). Vogel: Buku Teks Analisis Oraganik Kualitatif Makrodan Semimikro.(first edition). Translated Setiono, Land Handayana, P.A Jakarta: Kaliman Media Pusaka.
Tim Kimia Dasar. 2014. Panduan Praktikum Kimia Analitik I Dasar-Dasar Kimia Analitik. Surabaya: Jurusan Kimia FMIPA Unesa
Attachment 1
A. Determining (standardization) of Na-EDTA ±0,01 M with CaCl2 as standard solution
Group IV |Complexometry and Its Application 34

Group IV |Complexometry and Its Application 35
HCl 6 MColorless solution
Entered CaCO3
(white powder)into volumetric
Dilute withdistilled wateruntil boundary
Addition of HCl 6MProducing bubble
CaCO3 + distilledwater
White precipitate
Took 25 ml of CaCl2
and moved toErlenmeyer

B. Application of Complexometry: Hardness water of PDAM water
Group IV |Complexometry and Its Application 36
Addition of buffersolution pH=10
Colorless solution
Addition of EBTIndicator
Red wine solution
Titration processwith Na-EDTA
After reaching the endpoint V1= 16,3 ml V2=16,4 ml V3=16,5 ml
Blue Solution

Group IV |Complexometry and Its Application 37
Addition of buffersolution pH=10
Colorless solution
10 ml of Sample(PDAM)
Colorless solution
Addition of EBTIndicator
Red wine solution
10 ml sample + buffer solution pH=10+ EBTindicator
Red wine solution
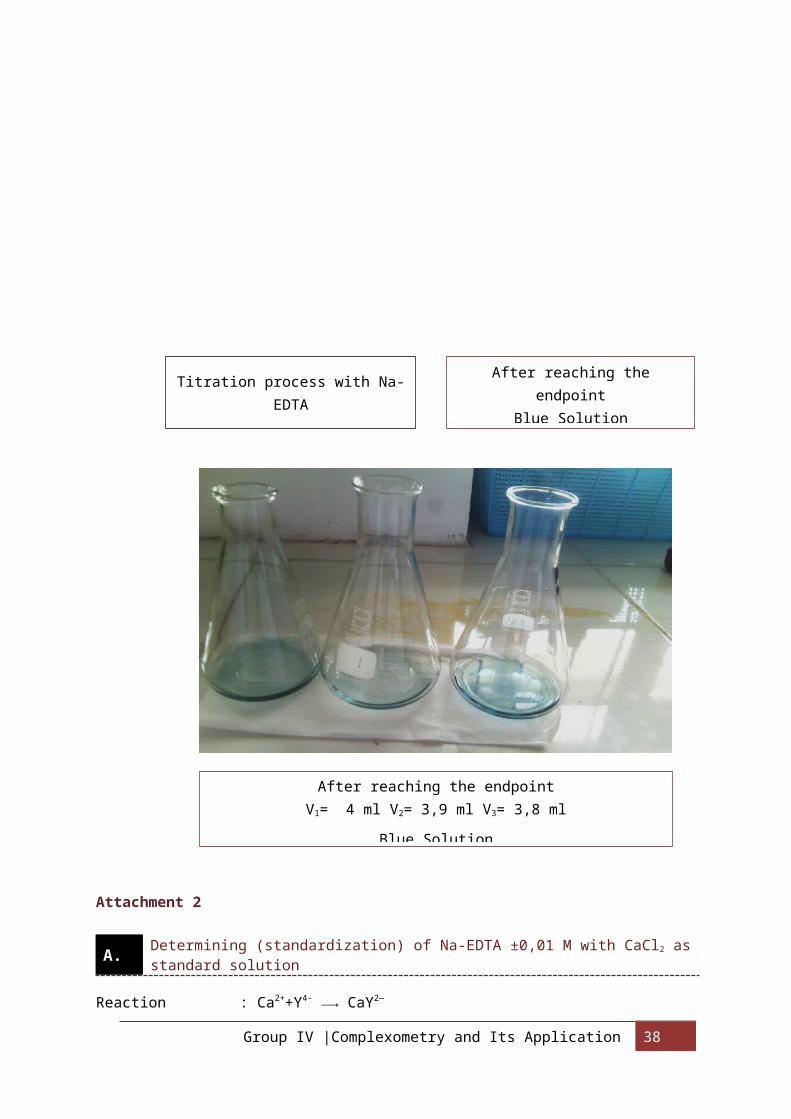
Attachment 2
A. Determining (standardization) of Na-EDTA ±0,01 M with CaCl2 asstandard solution
Reaction : Ca2++Y4- ⟶ CaY2—
Group IV |Complexometry and Its Application 38
Titration process with Na-EDTA
After reaching the endpoint V1= 4 ml V2= 3,9 ml V3= 3,8 ml
Blue Solution
After reaching theendpoint
Blue Solution
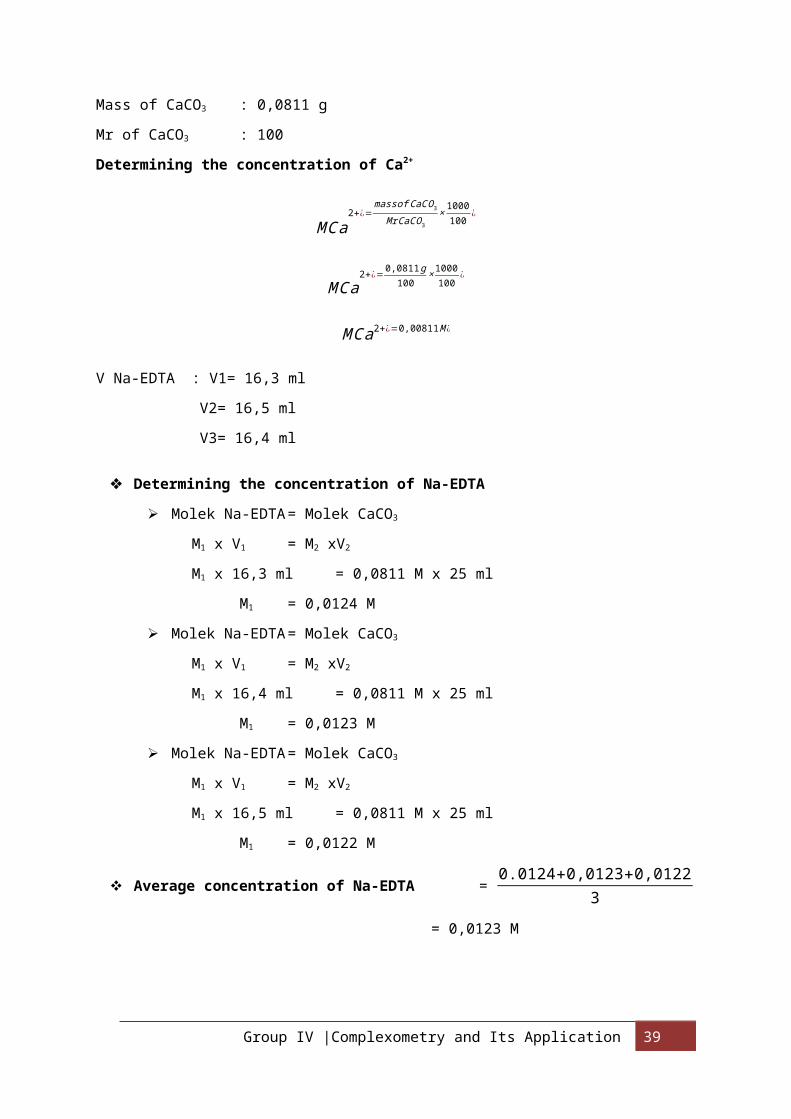
Mass of CaCO3 : 0,0811 g
Mr of CaCO3 : 100
Determining the concentration of Ca2+
MCa2+¿=
massofCaCO3
MrCaCO3× 1000100
¿
MCa2+¿=
0,0811g100
×1000100
¿
MCa2+¿=0,00811M ¿
V Na-EDTA : V1= 16,3 ml
V2= 16,5 ml
V3= 16,4 ml
Determining the concentration of Na-EDTA
Molek Na-EDTA= Molek CaCO3
M1 x V1 = M2 xV2
M1 x 16,3 ml = 0,0811 M x 25 ml
M1 = 0,0124 M
Molek Na-EDTA= Molek CaCO3
M1 x V1 = M2 xV2
M1 x 16,4 ml = 0,0811 M x 25 ml
M1 = 0,0123 M
Molek Na-EDTA= Molek CaCO3
M1 x V1 = M2 xV2
M1 x 16,5 ml = 0,0811 M x 25 ml
M1 = 0,0122 M
Average concentration of Na-EDTA = 0.0124+0,0123+0,01223
= 0,0123 M
Group IV |Complexometry and Its Application 39

B. Application of Complexometry: Hardness water of PDAM water
Reaction : Ca2++Y4- ⟶ CaY2—
M Na-EDTA : 0,0123 M
V Na-EDTA : V1= 4 ml
V2= 3,9 ml
V3= 3,8 ml
Determination the concentration of sample (PDAM)
Molek of sample = Molek Na-EDTA
M1 x V1 = Me xVe
M1 x 10 ml = 0,0123 M x 4 ml
M1 = 0,0049 M
Molek of sample = Molek Na-EDTA
M2 x V2 = Me xVe
M2 x 10 ml = 0,0123 M x 3,9 ml
M1 = 0,0047 M
Molek of sample = Molek Na-EDTA
M3 x V3 = Me xVe
M3 x 10 ml = 0,0123 M x 3,8 ml
M3 = 0,0046 M
Average concentration of sample = 0.0049+0,0047+0,00463
= 0,0047 M
Determination hardness of water of sample (PDAM)
Msample=massofCa
ArCa× 1000100
×dilutionfactor
0,0049=massofCa40
×1000100
×1
Mass of Ca2+ = 0,00196 g
Group IV |Complexometry and Its Application 40
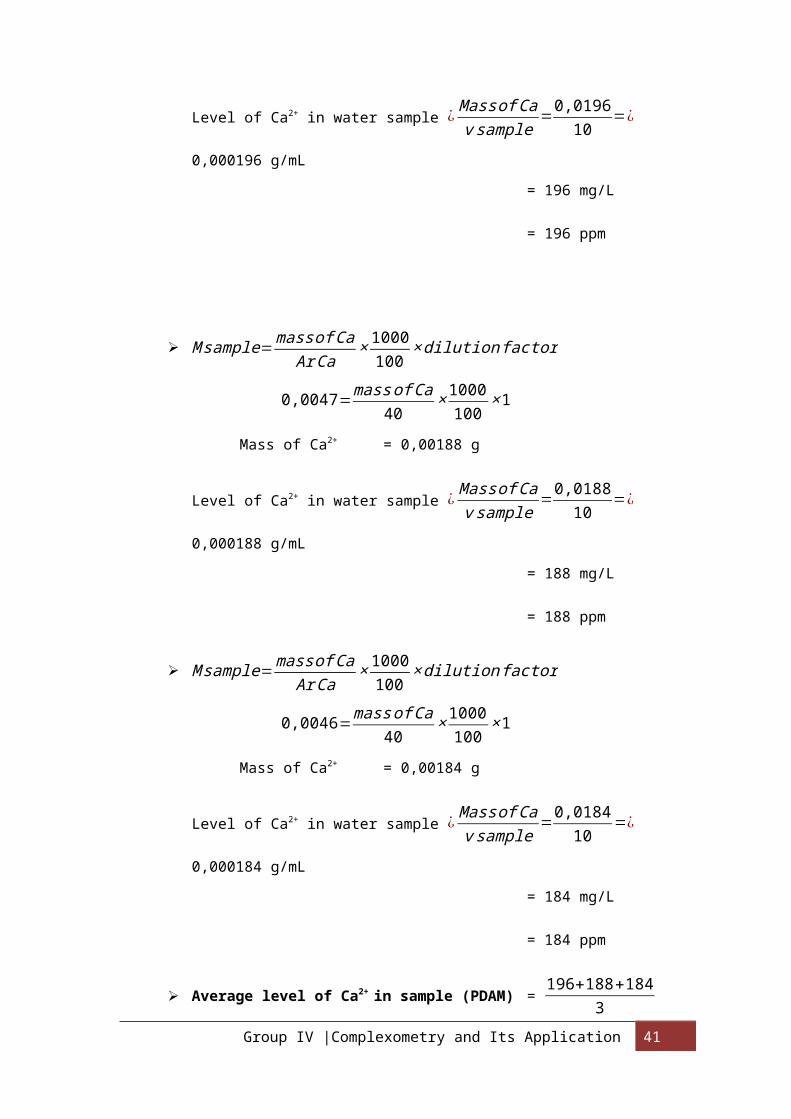
Level of Ca2+ in water sample ¿ MassofCavsample=0,0196
10=¿
0,000196 g/mL
= 196 mg/L
= 196 ppm
Msample=massofCa
ArCa× 1000100
×dilutionfactor
0,0047=massofCa40
×1000100
×1
Mass of Ca2+ = 0,00188 g
Level of Ca2+ in water sample ¿ MassofCavsample=0,018810
=¿
0,000188 g/mL
= 188 mg/L
= 188 ppm
Msample=massofCaArCa
× 1000100
×dilutionfactor
0,0046=massofCa
40×1000100
×1
Mass of Ca2+ = 0,00184 g
Level of Ca2+ in water sample ¿ MassofCavsample=0,0184
10=¿
0,000184 g/mL
= 184 mg/L
= 184 ppm
Average level of Ca2+ in sample (PDAM) = 196+188+1843
Group IV |Complexometry and Its Application 41
=189 ppm
Group IV |Complexometry and Its Application 42
Copyright © 2022 FDOKUMEN