Complex migration and the development of genetic structure in subdivided populations: an example...
10
Complex migration and the development of genetic structure in subdivided populations: an example from Caribbean coral reef ecosystems Johnathan T. Kool, Claire B. Paris, Serge Andre ´foue ¨t and Robert K. Cowen J. T. Kool ([email protected]), ARC Centre of Excellence for Coral Reef Studies, James Cook Univ., Townsville, Queensland, Australia, 4811. C. B. Paris, Div. of Applied Marine Physics, Rosenstiel School of Marine and Atmospheric Science, Univ. of Miami, 4600 Rickenbacker Causeway, Miami, FL 33149-1098, USA. S. Andre´foue ¨t, Inst. de Recherche pour le De´veloppement (I.R.D.), UR 128 CoRe´Us(Communaute´s Re´cifales etUsages), Centre IRD Noume´a, 101 Promenade RogerLaroque, Anse Vata, BP A5 98848 Noumea, New Caledonia. R. K. Cowen, Div. of Marine, Biology and Fisheries, Rosenstiel School of Marine and Atmospheric Science, Univ. of Miami, 4600 Rickenbacker Causeway, Miami, FL 33149-1098, USA. A matrix-based projection model is used in conjunction with the results of a coupled bio-physical dispersal model to examine the spread of alleles through subdivided populations over time, and the associated development of genetic structural patterns. Applying this approach, it becomes possible to quantitatively evaluate the contribution of spatially explicit migration towards patterns of genetic structure observed in the field. To provide a concrete example, the model was used to examine genetic dispersal between coral reef patches of the Caribbean. Using generic life-history parameters, the model shows the formation of a strong genetic break between eastern and western patches, as well as the development of a gradient along the length of the Bahamian archipelago, corresponding with evidence previously collected for coral and fish species. The data also suggest that Jamaica and the Cayman Islands are important stepping stones between the reefs of the northern Caribbean (Hispaniola and the Bahamas) and the Mesoamerican Barrier Reef. The model provides an effective means of evaluating regional-scale genetic connectivity through time and identifying natural clusters of genetic exchange. Spatially explicit population genetic structure is an area of growing interest for both scientists and managers (Planes and Fauvelot 2002, Roberts et al. 2003, Vekemans and Hardy 2004, Hedgecock et al. 2007). The interest can be attributed in part to increasing recognition of the impor- tance of spatial aspects of conservation management, such as connectivity between subpopulations (Bunn et al. 2000, Crooks and Sanjayan 2006, Cowen et al. 2007), and also due to new techniques that make it feasible to process large amounts of genetic data derived from multiple genetic markers (Kristensen et al. 2001, Richardson et al. 2007). In addition to evaluating the form of genetic patterns however, it is also important to consider the processes that create and maintain them as well. Reconciling the factors responsible for generating genetic structure with real-world genetic patterns will lead to a better understanding of not only what the important processes are, but also the expected con- sequences if they were to change. Evaluating the manner in which genes diffuse through interconnected populations can be challenging due to the effort required to cover potentially large spatial extents over time with a meaningful degree of resolution. A major factor contributing to this problem is the degree of spatial heterogeneity associated with migration, particularly at regional scales. Simple stepping stone and diffusion models have frequently been invoked in theoretical studies of genetic dispersal (Kimura and Weiss 1964, Nagylaki 1978, Holmes et al. 1994), and while these are important for understanding fundamental principles, they are not suitable for handling most real-world systems, which violate basic assumptions of these models; in particular, that the dispersal process is uniform across all populations. In marine environments, the ocean currents that disperse marine larvae (and consequently their genes as well) are highly complex and nonlinear (Neumann 1969), and this is equally true of air currents dispersing windborne pollen and seeds in terrestrial environments. Recently, models have been developed that are capable of addressing the problem of biological dispersal in complex flow fields. This is achieved using simulations that couple physical data, such as wind or ocean currents, with mechanistic behavior to determine patterns of migration between populations (Armsworth 2002, Nathan et al. 2002, Paris et al. 2005, 2007, Kuparinen 2006). This generates information regarding the manner in which organisms transition from one population to another, but genes have Ecography 000: 000000, 2010 doi: 10.1111/j.1600-0587.2009.06012.x # 2010 The Authors. Journal compilation # 2010 Ecography Subject Editor: Thorsten Wiegand. Accepted 8 September 2009 Early View (EV): 1-EV
Transcript of Complex migration and the development of genetic structure in subdivided populations: an example...

Complex migration and the development of genetic structure insubdivided populations: an example from Caribbean coral reefecosystems
Johnathan T. Kool, Claire B. Paris, Serge Andrefouet and Robert K. Cowen
J. T. Kool ([email protected]), ARC Centre of Excellence for Coral Reef Studies, James Cook Univ., Townsville, Queensland,Australia, 4811. � C. B. Paris, Div. of Applied Marine Physics, Rosenstiel School of Marine and Atmospheric Science, Univ. of Miami, 4600Rickenbacker Causeway, Miami, FL 33149-1098, USA. � S. Andrefouet, Inst. de Recherche pour le Developpement (I.R.D.), UR 128� CoReUs (Communautes Recifales et Usages), Centre IRD � Noumea, 101 Promenade Roger Laroque, Anse Vata, BP A5 � 98848 Noumea,New Caledonia. � R. K. Cowen, Div. of Marine, Biology and Fisheries, Rosenstiel School of Marine and Atmospheric Science, Univ. of Miami,4600 Rickenbacker Causeway, Miami, FL 33149-1098, USA.
A matrix-based projection model is used in conjunction with the results of a coupled bio-physical dispersal model toexamine the spread of alleles through subdivided populations over time, and the associated development of geneticstructural patterns. Applying this approach, it becomes possible to quantitatively evaluate the contribution of spatiallyexplicit migration towards patterns of genetic structure observed in the field. To provide a concrete example, the modelwas used to examine genetic dispersal between coral reef patches of the Caribbean. Using generic life-history parameters,the model shows the formation of a strong genetic break between eastern and western patches, as well as the developmentof a gradient along the length of the Bahamian archipelago, corresponding with evidence previously collected for coraland fish species. The data also suggest that Jamaica and the Cayman Islands are important stepping stones between thereefs of the northern Caribbean (Hispaniola and the Bahamas) and the Mesoamerican Barrier Reef. The model providesan effective means of evaluating regional-scale genetic connectivity through time and identifying natural clusters ofgenetic exchange.
Spatially explicit population genetic structure is an area ofgrowing interest for both scientists and managers (Planesand Fauvelot 2002, Roberts et al. 2003, Vekemans andHardy 2004, Hedgecock et al. 2007). The interest can beattributed in part to increasing recognition of the impor-tance of spatial aspects of conservation management, such asconnectivity between subpopulations (Bunn et al. 2000,Crooks and Sanjayan 2006, Cowen et al. 2007), and alsodue to new techniques that make it feasible to process largeamounts of genetic data derived from multiple geneticmarkers (Kristensen et al. 2001, Richardson et al. 2007). Inaddition to evaluating the form of genetic patterns however,it is also important to consider the processes that create andmaintain them as well. Reconciling the factors responsiblefor generating genetic structure with real-world geneticpatterns will lead to a better understanding of not only whatthe important processes are, but also the expected con-sequences if they were to change.
Evaluating the manner in which genes diffuse throughinterconnected populations can be challenging due to theeffort required to cover potentially large spatial extents overtime with a meaningful degree of resolution. A major factorcontributing to this problem is the degree of spatial
heterogeneity associated with migration, particularly atregional scales. Simple stepping stone and diffusion modelshave frequently been invoked in theoretical studies ofgenetic dispersal (Kimura and Weiss 1964, Nagylaki1978, Holmes et al. 1994), and while these are importantfor understanding fundamental principles, they are notsuitable for handling most real-world systems, which violatebasic assumptions of these models; in particular, thatthe dispersal process is uniform across all populations. Inmarine environments, the ocean currents that dispersemarine larvae (and consequently their genes as well) arehighly complex and nonlinear (Neumann 1969), and this isequally true of air currents dispersing windborne pollen andseeds in terrestrial environments.
Recently, models have been developed that are capableof addressing the problem of biological dispersal in complexflow fields. This is achieved using simulations that couplephysical data, such as wind or ocean currents, withmechanistic behavior to determine patterns of migrationbetween populations (Armsworth 2002, Nathan et al. 2002,Paris et al. 2005, 2007, Kuparinen 2006). This generatesinformation regarding the manner in which organismstransition from one population to another, but genes have
Ecography 000: 000�000, 2010
doi: 10.1111/j.1600-0587.2009.06012.x
# 2010 The Authors. Journal compilation # 2010 Ecography
Subject Editor: Thorsten Wiegand. Accepted 8 September 2009
Early View (EV): 1-EV

the additional property of persisting through time, allowingthem to integrate into multiple populations. It is possible touse matrix methods (Bodmer and Cavalli-Sforza 1968,Caswell 2001, Fu et al. 2006) to project connectivitymatrices (defined as the probability of transitioning fromone population to another � Taylor et al. 1993, Cowenet al. 2007) developed from the simulations forward intime. Using this approach, the expected development ofgenetic structure can be evaluated, even for systems withcomplex patterns of migration and individual behavior.
Coral reefs provide an ideal environment for developingand testing this approach. Three-dimensional ocean currentdata that are consistent over large extents and have sufficientresolution for resolving biological dispersal at regional scalesare available. Coral reef communities are discrete habitats,and can be identified with a high degree of resolutionover large spatial extents using remotely sensed imagery(Andrefouet et al. 2006). High-quality habitat data areessential for ensuring that release and settlement locations,and consequently the dispersal patterns, are accurate. Manycorals and the organisms associated with them have a sessileadult stage and a pelagic larval stage, minimizing thepotential for confounding effects from active behavioralmigration as adults. Furthermore at large scales, coral reefscan form closed systems, with no significant immigration oremigration from other areas. For example, the only majorcoral reef communities in the Atlantic outside of theCaribbean are situated on the east coast of Brazil and onthe west coast of Africa (Spalding et al. 2001), extensivedistances for pelagic larvae to travel given the high mortalityrates typically expected of them (Houde 1997, Paris-Limouzy 2001). Coral reefs also have considerable commer-cial importance as ecotourism destinations, and are the targetof many marine protected area efforts (ISRS 2004). More-over, several regional studies have been carried out in order toexamine the genetic patterns of coral reef organisms withinthe Caribbean. Although different species are expected tohave their own characteristic structure, a consistent findingfor Caribbean coral reef organisms is the presence of adistinct genetic break between eastern and western popula-tions. This has been observed for populations of Acroporapalmata (Baums et al. 2005, 2006), Acropora cervicornis(Vollmer and Palumbi 2007) and Montastrea annularis(Foster et al. pers. comm.). Structure is evident within theBahamas as well, Taylor and Hellberg (2003, 2006) haveproposed additional breaks along the length of the Bahamasfor members of the genus Elacatinus (Gobiidae), and anexamination of the gorgonian Pseudoptergorgia elisabethae byGutierrez-Rodriguez and Lasker (2004) identified differ-ences among populations located at Exuma Sound, inoutlying areas, and near San Salvador Island. Purcell et al.(2006) analyzed microsatellite data for Haemulon flavolinea-tum throughout the Caribbean and found weak (thoughsignificant) structure. The authors proposed that the lowsignal strength might be caused by overlapping populations.
Here, we use matrix analysis in conjunction with abio-oceanographic larval dispersal model to evaluate theexpected development of genetic structure in subdividedcoral reef populations. Matrices derived from a bio-oceanographic larval dispersal model were used to projectthe expected development of genetic structure in Caribbeancoral reef ecosystems. The resulting patterns conform to
field-based observations of genetic structure, suggesting thatfor some species, contemporary migration patterns play asignificant role in generating some of the genetic structureevident in Caribbean coral reef populations.
Methods
A GIS data layer of coral reefs and associated habitatsdeveloped as part of the Millennium Coral Reef MappingProject was used to identify patch environments that wouldbe used in the study. The patch environments selected wererestricted to Caribbean environments that would betypically considered as coral reef (i.e. patch reef, forereefsand reef flats, not seagrass dominated lagoons, terraces orother unconsolidated benthos). The remaining patches werebuffered to a distance of 5 km to account for the ability forlarvae to engage in directed settlement behavior, and theresulting coverage was then split into discrete polygon unitsusing a tolerance level of 10 km (Fig. 1) following Pariset al. (2005, 2007) and Cowen et al. (2006). Tolerance (theminimum allowable distance between any two verticesalong the boundary edge of a polygon) was used to providea balance between preserving perimeter length and polygonarea for all polygons within the region. 10 km was chosen asthe tolerance distance in order to be greater than theresolution of the ocean circulation model, but also smallenough to capture local retention scales in the modeledregion (Cowen et al. 2006). At the time at which thepolygon layer was developed, MCRMP data was notavailable for Venezuela. Coral reef location informationdeveloped by the United Nations Environment Pro-gramme’s World Conservation Monitoring Centre(Spalding et al. 2001) was used for this area instead.
Transition matrices describing the probability of migra-tion between populations under different life-histories wereconstructed using a Java-based translation of the FOR-TRAN-based connectivity modeling system (BOLTS)developed by Paris et al. (2007). The system operates bycarrying out individual-based Lagrangian particle tracking.Particles undergo advection and diffusion based on oceancurrent data, and engage in settlement and retentionbehavior that can be parameterized at the individual level.Current velocity information was obtained from the HybridOcean Coordinate Model (Chassignet et al. 2007), usingdaily archived output for the time interval 2 January, 2003through 25 December, 2005. One thousand individualswere released from each local population (i.e. polygon) at28 d intervals. Individuals were eligible for retention/settling in the patch polygons following a period of 5 d(S1) or 15 d (S2) corresponding with simulations made byCowen et al. (2006), and were monitored for up to 30 d.Five days corresponds with observations of larval retentionfor damselfishes, and 15 d provides a more conservativeestimate of retention for comparison. A mortality rate (z) of0.2 d�1 was applied to each transiting individual based ona mode of estimated daily mortality rates (Houde 1989,Paris-Limouzy 2001). Additional detail regarding thebiophysical dispersal is available in Supplementary materialAppendix 4. The results were combined into a singletransition matrix M describing proportion of individualsarriving in a destination population (rows) from a given
2-EV

source population (columns), taking into account those thatwere lost in transit. Note that this assumes that the speciesreproduce continuously in an unbiased manner throughoutthe year. If a species of interest only reproduces within agiven time window (e.g. spring or fall), this would beaccomplished by combining only those matrices that fallwithin the specified period, and weighting their contribu-tion if necessary.
To project expected genetic structure forward in time, amodified version of the matrix-based approach developedby Bodmer and Cavalli-Sforza (1968) was used; the term‘‘expected value’’ is used here in the formal sense of being aweighted sum or integral of the set of possible values of arandom variable. The transition matrix M can be applied toa state matrix Q t containing information on the number (orfrequency) of alleles of each type in each population at timet, to yield the expected state of the population at time t�1,and Dt encompasses a discrete reproductive cycle. Throughrecursive substitution, it can be shown that Q t�MtQ0
(Bodmer and Cavalli-Sforza 1968). This equation assumesthat all elements of Q undergo transition however, which isnot the case when there is a sedentary adult phase, and aseparate mobile juvenile phase. Instead, only offspring aretransported, which then merge back into the adult popula-tions. To account for this, the transition formula becomes
Q t�1�KMBQ t �Q t (1 � top bar indicates row
normalization; Supplementary material Appendix 1)
where K is a diagonal matrix of carrying capacity values foreach population, and B is a diagonal matrix of birth rates foreach population. The interpretation of the equation is thatthe expected state of the system (Q ) at t�1 is the result ofmigrating progeny (MBQ t) added to the original parentgeneration (�Q t), converted to probabilities via rownormalization, and multiplied by carrying capacity (K)(Fig. 2). The scaling of MBQ t�Q t to probabilities and
multiplication by K produces expected values for the matrixthe same way expected values of the multinomial distributionare determined by multiplying np, where n is the number ofobjects sampled, and p is a vector of their probability of beingsampled. The ordering of the multiplicative terms issignificant. From right to left, they represent the order inwhich the processes occur: birth first (B), then migration(M), followed by scaling to carrying capacity (bar and K).Using iterative substitution, it can be shown that
Q t �KAKt�1
AQ 0 where A� MB�I (2 � seeSupplementary material Appendix 2 for proof )
where I is an identity matrix having the same dimensions asM and B.
If Q 0 equals K, which is the case if individuals areuniquely labeled according to their population of origin,then Q 0 is an identity matrix, and the equation simplifies
to /Q t �K AKt
. If allele frequencies are being assessed, Q t
may be divided by the carrying capacity K in which case
the equation further reduces to /Q t � AKt
. The projectionstherefore represent the expected probability that alleles willtransition from a source population to a destinationpopulation. To provide a representative time scale, a genericbirth rate of 500 per individual was used based on values forStegastes partitus (�1000 successful hatches per female perspawning event � Cole and Sadovy 1995; the probability ofan individual within a population being male or female wasassumed to be equal). Carrying capacity was calculatedbased on reef area available within a given polygon. It ispossible to use relative carrying capacity (e.g. populationa supports twice as many individuals as population b)instead of absolute carrying capacity (numbers of indivi-duals) due to the row-normalization of the equations. Themost commonly used genetic markers in population geneticstudies are assumed to be neutral, therefore the potential
Figure 1. Map of derived polygon boundaries for the Caribbean divided into subregions. FLK � Florida Keys; LBB � Little BahamaBank; GBW � Grand Bahama West; GBE � Grand Bahama East; MBH � Mid-Bahamas; CBN � Cuba North; CBS � Cuba South; HPNHispaniola; PR � Puerto Rico and the Virgin Islands; LAN � Lesser Antilles; SAE � South America East; SAW � South America West;PAN � Panama; CCB � Central Caribbean, including the Nicaraguan Rise; JAM � Jamaica, the Cayman Islands and Swan Island; MBR �Roatan and the Mesoamerican Barrier Reef. Shading from light to dark indicates the ordering of the polygons within each region.
3-EV

effects of selection were not considered. The role ofmutation was also not addressed, however the effects couldbe incorporated by multiplying the MBQ term by anadditional matrix (e.g. MBQV) describing the probabilityof switching from one allele form to another (Fu et al.
2006). Similarity matrices were derived as ar
k�1
ffiffiffiffiffiffiffiffiffiffi
xikyikp
(Nei
1987), where x and y are the allele frequency vectors of twodifferent populations. The similarity values were convertedinto distances by subtracting from 1, and then clusteredusing an average (UPGMA) linkage function (Legendre andLegendre 1998).
Results
Transition matrices showing the exponentiation of AKwere generated using the input parameters provided.Individuals tended to settle near to their population oforigin, although there were exceptions for the reefs of CaySal (positioned just prior to LBB on the axes), north andcentral Cuba (CBN), the northern portion of Hispaniola(HPN), the chain of reefs along the Nicaraguan Rise south
of Cuba, as well as the Cayman Islands and Swan Island(CCB-JAM) (Fig. 3A). Decreasing the time to competencyof the larvae resulted in a greater proportion of individualssettling back to or near their natal habitat (there was onaverage a 54% increase in the probability of settlement topolygons less than or equal to 50 km radial distance fromthe source). The decrease in the values of the off-diagonalelements (distance-recruiting) and the corresponding in-crease in values near the diagonal (near- or self-recruiting)demonstrate increased retention, although the general formof the matrix remained the same (Fig. 3B).
By projecting expected genetic connectivity forwardthrough time, links between disparate populations becomeevident, represented as blocks in the resulting matrices (Fig.3C, D) � for example in the Bahamas region (LBB-CBS), orthe Mesoamerican Barrier Reef (MBR-end). Over time,populations become increasingly genetically connected withone another, and small-scale differences in allele frequencieserode, evidenced by an increase in the degree of horizontalbanding in the transition matrix (Fig. 3D). Even thoughmany of the probabilities of the projected matrices wereextremely low, relative differences between populations dopersist, providing the basis for the development of genetic
Figure 2. Conceptual diagram showing the model process for a single time step. Step 1 begins with the initial state of the system. In step2, new individuals or alleles are produced according to the set of given birth rates. In step 3, the individuals or alleles migrate according totransition probability values. The percentages do not necessarily sum to 1 because individuals may be lost in transition. Finally, in step 4,the populations are reduced back to the carrying capacity of the population. Note that the equations handle expected values (averagevalues over an infinite number of trials), and therefore they use real-valued numbers rather than generating the discrete outcome depictedhere.
4-EV
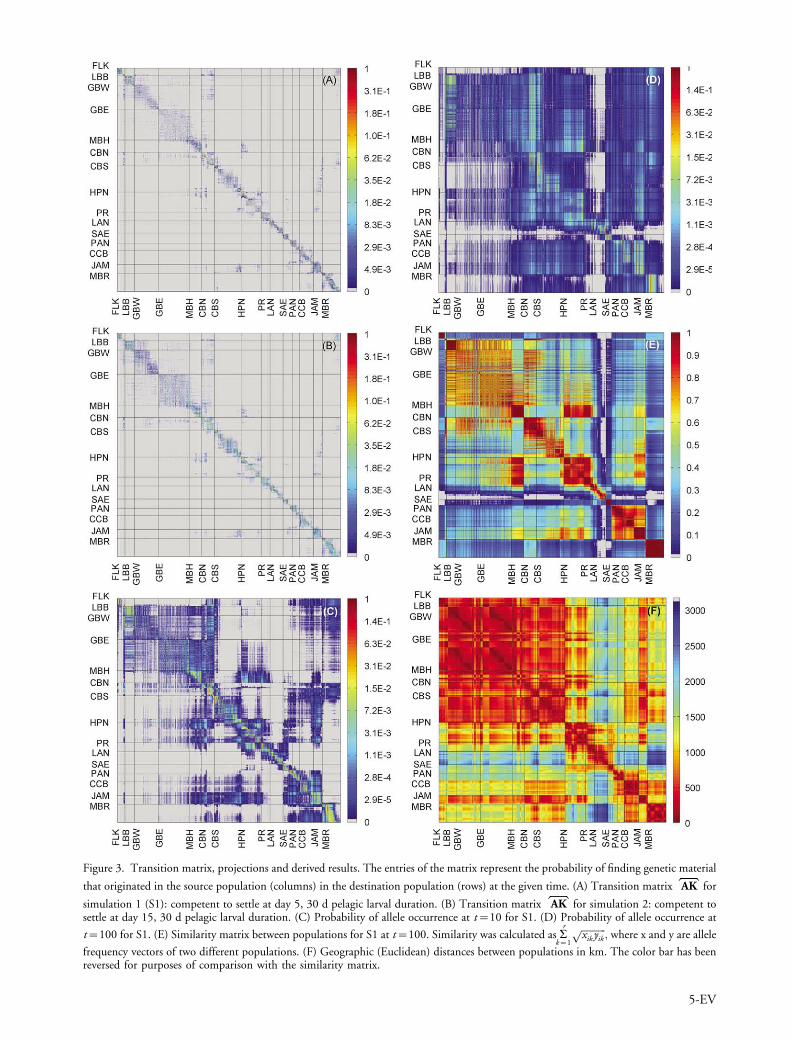
Figure 3. Transition matrix, projections and derived results. The entries of the matrix represent the probability of finding genetic material
that originated in the source population (columns) in the destination population (rows) at the given time. (A) Transition matrix AK for
simulation 1 (S1): competent to settle at day 5, 30 d pelagic larval duration. (B) Transition matrix AK for simulation 2: competent tosettle at day 15, 30 d pelagic larval duration. (C) Probability of allele occurrence at t�10 for S1. (D) Probability of allele occurrence at
t�100 for S1. (E) Similarity matrix between populations for S1 at t�100. Similarity was calculated as ar
k�1
ffiffiffiffiffiffiffiffiffiffi
xik yikp
; where x and y are allele
frequency vectors of two different populations. (F) Geographic (Euclidean) distances between populations in km. The color bar has beenreversed for purposes of comparison with the similarity matrix.
5-EV

structure shown by the formation of blocks in the similaritymatrix (Fig. 3E). The most obvious and persistent feature inthe matrices is a break that begins near Puerto Rico and theVirgin Islands (PR) and extends to the Gulf of Venezuela,separating the islands of the Lesser Antilles from theWestern Caribbean. The similarity matrix also shows thatnested structure is also expected to develop within theBahamas and in portions of the Western Caribbean such asCuba and the Greater Antilles. A relationship betweensouthern Cuba, Jamaica and the reefs of the NicaraguanRise is anticipated, as is a link between the MesoamericanBarrier Reef and the Florida Keys, evidenced by bands ofstronger color in the genetic similarity matrix (Fig. 3E).For purposes of comparison, the matrix of geographic(Euclidean, or straight-line) distances between populationsis also shown (Fig. 3F). Geographic distance, geneticsimilarity and degree of connectivity can also be comparedusing correlograms (Fig. 4), revealing a significant trend ofisolation by distance (pBB0.01 for genetic similarity vsdistance based on linear regression) as might be expectedgiven the relationship between mortality and transporttime, however details regarding spatial relationships andlocal trends are lost in this summary form, and a largeproportion of the variance is unexplained by pure distanceeffects alone (r2�0.38). Clustering the values from thesimilarity matrix and plotting the results on a map (Fig. 5)reveals natural geographic groupings that arise from theexchange of alleles between populations. Additional simula-tion results and analysis are available in Supplementarymaterial Appendix 3 and 5.
Discussion
The matrices show the development of expected geneticconnectivity patterns in the Caribbean through time, using
Figure 4. Correlograms of geographic (euclidean) distance versusconnectivity, measured as the mean probability of migrating to adestination in a given distance class (grey squares, left axis); andmean genetic similarity within a given distance class (white circles,right axis).
Figure 5. Cluster patterns derived from Nei’s similarity values for S1 at t�100. Average linkage (UPGMA) was used to generate a set of10 clusters. The stepsize criterion (Milligan and Cooper 1985) was used to identify natural numbers of clusters in the data set.
6-EV

generic life-history parameters. Although populations maynot be connected in an obvious manner demographically,they may be linked genetically. In particular, the projectionsshow the formation of regional clusters, including the LesserAntilles, the Bahamas and northern Cuba, and among thereefs of Panama and the Nicaraguan Rise. The results aredependent on the input parameters used, however there isconsistency between runs using different input parameters(e.g. Fig. 3B). Individuals persistently recruit back to ornear their population of origin, and the structure of thematrix retains a similar overall form, driven by the spatialarrangement of the populations and ocean circulation,indicating that for Caribbean coral reef ecosystems theoverall characteristics of the projections are robust. Theprojections demonstrate that a genetic break is expectedfrom Puerto Rico down to the Gulf of Venezuela, which isconsistent with observations from field studies (Taylor andHellberg 2003, Baums et al. 2005) and previous indepen-dent simulations (Baums et al. 2006, Cowen et al. 2006).Note that although the break appears in the projectedmatrices at Puerto Rico and the Mona Passage, the distancematrix groups Puerto Rico more closely with Hispaniolaand the Western Caribbean. The Mona Passage is an areawith highly variable current structure (Metcalf et al. 1977),and the work by Baums et al. (2005) identified mixingin this area as well (with the exception of the period inwhich elkhorn corals reproduce, when a strong break formsbetween Hispaniola and Mona Island - Baums et al. 2006).The variability in current structure, forced by the wet anddry seasons in the Caribbean, results in an indistinctlydefined break in the north. More simulations using speci-fic life-history information as well as longer-term andhigher resolution oceanographic data in this area will berequired to resolve the precise nature of the genetic break.There also appears to be support for the existence of aweaker break in the central Bahamas consistent withobservations made by Taylor and Hellberg (2003, 2006).The projections suggest that part of the weakness of thisbreak stems from the fact that there appears to be extensivemixing in this area, and allele frequencies change along thelength of the Bahamas, although the sharpest transitiondoes occur at the boundary between the northern Bahamas(GBW, GBE) and the southern Bahamas (MBH). For atleast some species, it appears that oceanographic currentsplay a major role in shaping the genetic structure ofCaribbean coral reef communities. Comparing the geneticsimilarity matrix and the matrix of geographic distancesreveals a significant negative relationship, and this isreflected in the correlograms as well. The trend does notappear to be a straight line however, and is relatively weak,evidenced by the relatively low r2 value of the relationship.This is expected, given that mortality is exponential, and isinteracting with non-linear flow distances. The comparisonalso shows that the reefs of the Florida Keys are not asstrongly related to other reefs in the region as might beexpected based on distance. This can be explained by theaction of the Florida Current acting as a barrier to larvaltransport. Similarly, linkages between South Americanand Panamanian reefs with the reefs of Hispaniola andPuerto Rico are weaker than expected based on geogra-phic distance, presumably due to the westward motion ofthe Caribbean Current (Gordon 1967, Roemich 1981,
Gyory et al. 2009) acting as a barrier to north-southdispersal. The separation of the eastern and westernportions of the Caribbean results from the combined actionof the Colombia-Panama Gyre in the south (Mooers andMaul 1998, Andrade and Barton 2000) preventing thesouthwestern transport of larvae from eastern reefs, and theaforementioned variability in the north near the MonaPassage and Puerto Rico. Greater than expected connectiv-ity based on geographic distance between Hispaniola,Puerto Rico and the northern islands of the Lesser Antillesis also evident, driven primarily by the northwest movementof the Antilles Current (Lee et al. 1996, Rowe et al. 2009).The Antilles Current is known to have a variable signal andis subject to short-term fluctuations (Rowe et al. 2009),which may also contribute to the indistinct nature of thenorthern portion of the east-west break.
The high degree of spread of genetic material acrosspopulations after only a few generations might seemquestionable, however it is important to understand that
the powered matrix values of AK indicate the probabilitythat any form of genetic material from a given sourcepopulation reaches the corresponding destination. Theprobability with which a new mutant would arise in apopulation would be 1/2N (assuming a diploid popula-tion), where N is the number of individuals in thepopulation (which in this case equals the correspondingdiagonal element of K). This results in a decreasedprobability of transition, and consequently the amount oftime required for a similar allele to spread to otherpopulations. The model also does not take into accountmortality due to intra-population demographic processes. Itis likely that juveniles would experience greater mortalitythan established adults, which would further increase thetime required for novel genes to spread, although adultswould be subject to age-related mortality. Assigning Q0
to be equal to K might also seem unusual, since popula-tions are more likely to begin in a mixed state rather thanin a unique condition. However, if all populations arecompletely identical in terms of their composition, newmaterial must be injected into the system for structuraldifferences to appear (e.g. via mutation). Assuming that theprobability of the mutation being generated is uniformacross time and space, then the probability of arising inany particular population will be equal, and if the newmaterial is only generated in a single population at a time,then the result is equivalent to using an identity matrix(i.e. row-normalized K).
Given the significant degree of structure expected to bepresent in the system from the simulations, why are strongbreaks between populations not more evident in observa-tions of natural populations (Shulman and Bermingham1995, Purcell et al. 2006)? One potential answer to this liesin the relationship between the number of individualssampled and the probability of sampling the available alleleforms. The matrix probabilities are the allele frequenciesthat would be expected from sampling the populations witha high (theoretically infinite) degree of accuracy. Sampling alimited number of individuals increases perceived distancesbetween populations, and decreases the amount of visiblestructure (Fig. 6). Structure may be present, but relativedifferences between populations might not be discernablegiven the available sampling power. Typically, this problem
7-EV

is addressed by sampling more individuals or loci, and thematrix projections can be used to help identify the samplesizes required to bring genetic structure into focus. It mustbe noted that the ‘‘markers’’ used by the matrix are idealizedin the sense that each different form arises independently ina different population, and all populations have a uniquemarker associated with them. In reality, some populationsmay not produce a unique mutation, or there may behomoplasy, reducing the amount of observable structurein the system. It is also likely that additional processesare also contributing variability to natural populations, suchas density-dependent effects, trophodynamics or disease,which could dampen structure even further.
The matrix model provides a powerful and concisemeans of evaluating the expected genetic structure ofsubdivided populations through time. Although the formof the equation is similar to other approaches (Bodmer andCavalli-Sforza 1968, Fu et al. 2006) there are also somecritical differences. Classic models assume that all elements
of the Q matrix undergo transition, whereas here, migrantsmerge into previously existing populations. There is animportant consequence of this. Although the trajectory ofthe population is ultimately determined by the combinedeffects of migration, birth and carrying capacity, themagnitude of the difference between MB and I affects therate at which convergence occurs. Therefore, if the timescale over which genetic structure develops is of importance,demographic factors (i.e. levels of birth and mortalityrelative to population size) must be taken into account.
Previous work with respect to linking oceanographicmodels with genetic dispersal has also been carried out byGalindo et al. (2006), however their model has somedrawbacks. First, the dispersal probabilities were derived onthe basis of releases at random locations situated along rhumblines, however many of these locations were not situated inappropriate habitat for coral reef organisms. The results alsoindicate that individuals arriving in certain locations tend tocome from similar sources, but are unable to specify whatthose sources are because random release points were used.In addition it uses FST as its chief measure of geneticdifferentiation, which has been shown to be unsuitable forthat purpose by Jost (2008) and other theoretical populationgeneticists (Epperson 2003, Hedrick 2005).
An analytical solution for projecting expected geneticstructure offers some advantages versus simulation-basedapproaches. The results are more accurate and computa-tionally efficient, and can be easily executed using a standardmatrix package (e.g. Matlab or Scilab). Although simula-tion-based frameworks can be robust and easy to concep-tualize, the aforementioned importance of demographicswith regard to time scale means that in order to capture thefull dynamics of the populations using simulation it wouldbe necessary to simulate actual numbers of individualspresent in the system. For regional-scale studies of marinesystems, this could require simulating billions or trillions ofindividuals through time repeatedly, which would bechallenging, even given significant increases in computingpower. An analytical solution simplifies the calculations inthe same way that the binomial function simplifies repeatedsampling of a binary event. The equations are limited by thefact that the various matrices (M, B and K) are assumed toremain constant through time. Although this is unlikely tobe true in real-world systems, if it can be assumed that eventsare independent of one another, have finite variance, and aregenerated through an identical process, then the central limittheorem will apply, meaning that the values will beapproximately normally distributed about the mean of theset. Otherwise, evaluating the trajectory of a system in whichconnectivity changes over time in a complex, autocorrelatedmanner would require stepwise projection or simulation(Peng and Kimmel 2005, Kool 2009).
It is essential to bear in mind that the results areprojections, not predictions. The model is not designed tofit any particular set of observations. Instead, the modelprovides an expected set of patterns, and these expectedresults may be compared with observed results to testwhether the assumptions regarding the system are correct.Here, the assumption is that migration is a primary forceshaping genetic structure of populations associated withCaribbean coral reef ecosystems, and the comparisons withexisting studies provide some support for this. While other
Figure 6. (A) Similarity matrices resulting from randomlysampling S1 at t�100 using 1000 individuals per population(B) using 100 individuals per population.
8-EV

factors also have the potential to influence populationgenetic structure (e.g. age structure, variation in reproduc-tion, biased patterns of mutation and/or demographicbottlenecks), the use of matrix methods in conjunctionwith the output of bio-oceanographic larval dispersalmodels provides an effective means of evaluating theexpected development of genetic structure over time dueto migration. Furthermore, the projection equations are notdependent on scale. As long as connectivity matrices can begenerated from a dispersal model then the formulas can beused. With ongoing efforts to evaluate regional-scale geneticstructure of marine populations, the ability to cross-validateexpectations from physical models with field-basedobservations will be a valuable tool for studying howgenetic diversity is created and maintained in subdividedpopulations.
Conclusions
Matrix analysis was coupled with a bio-oceanographic larvaldispersal model to evaluate the expected development ofgenetic structure in coral reef ecosystems. Applying thisapproach to Caribbean coral reef ecosystems, significantand persistent differences between populations were evi-dent, including a clear genetic break between eastern andwestern portions of the Caribbean in concordance withprevious simulations and field studies. Other potentiallyimportant relationships include linkages among the reefs ofthe Nicaraguan Rise, and a strong connection between theMesoamerican Barrier Reef and the Florida Keys. Cluster-ing the values from the similarity matrix and plotting theresults on a map reveals natural geographic groupings thatare anticipated to develop as a result of exchange of allelesbetween populations. This approach provides a concretemeans of evaluating the relationship between genetic theoryand field-based evidence in regional-scale environments,and provides a powerful way of studying and visualizing thedevelopment of genetic structure in large-scale ecosystemsthrough time.
Acknowledgements � The authors would like to thank ChristineKranenburg (Inst. of Marine Remote Sensing, Univ. of SouthFlorida) for her assistance in providing the Millennium Coral ReefMapping products. Douglas L. Crawford, Geoff Sutcliffe, JohnW. McManus and Paul H. Barber reviewed and commented on anearlier version of the manuscript. Subramanian Ramakrishnan wasinstrumental in helping to develop the matrix equations, andAshwanth Srinivasan’s expertise was critical in developing theconnectivity modeling system and software. Computer time wasprovided by the Univ. of Miami’s High Performance ComputingCenter. Funding was provided through the Maytag Chair inIchthyology at the Univ. of Miami’s Rosenstiel School of Marineand Atmospheric Science, the ARC Centre of Excellence for CoralReef Studies, the Australian Inst. of Marine Science, and for theMillennium Coral Reef Mapping products by NASA.
References
Andrade, C. A. and Barton, E. D. 2000. Eddy developmentand motion in the Caribbean Sea. � J. Geophys. Res. 105:26191�26201.
Andrefouet, S. et al. 2006. Global assessment of modern coral reefextent and diversity for regional science and managementapplications: a view from space. � In: Suzuki, Y. et al. (eds),10th ICRS. Japanese Coral Reef Society, pp. 1732�1745.
Armsworth, P. R. 2002. Recruitment limitation, populationregulation, and larval connectivity in reef fish metapopula-tions. � Ecology 83: 1092�1104.
Baums, I. B. et al. 2005. Regionally isolated populations of animperiled Caribbean coral, Acropora palmata. � Mol. Ecol. 14:1377�1390.
Baums, I. B. et al. 2006. A bio-oceanographic filter to larvaldispersal in a reef-building coral. � Limnol. Oceanogr. 51:1969�1981.
Berloff, P. S. and McWilliams, J. C. 2002. Material transport inoceanic gyres. Part II: hierarchy of stochastic models. � J. Phys.Oceanogr. 32: 797�830.
Bodmer, W. F. and Cavalli-Sforza, L. L. 1968. A matrix migrationmodel for the study of random genetic drift. � Genetics 59:565�592.
Bunn, A. G. et al. 2000. Landscape connectivity: a conser-vation application of graph theory. � J. Environ. Manage. 59:265�278.
Caswell, H. 2001. Matrix population models: construction,analysis, and interpretation. � Sinauer.
Chassignet, E. P. et al. 2007. The HYCOM (HYbrid Coordi-nate Ocean Model) data assimilative system. � J. Mar. Syst. 65:60�83.
Codling, E. A. et al. 2004. Random walk models for themovement and recruitment of reef fish larvae. � Mar. Ecol.Prog. Ser. 279: 215�224.
Cole, K. S. and Sadovy, Y. 1995. Evaluating the use of spawningsuccess to estimate reproductive success in a Caribbean reeffish. � J. Fish Biol. 47: 181�191.
Cowen, R. K. et al. 2006. Scaling of connectivity in marinepopulations. � Science 311: 522�527.
Cowen, R. K. et al. 2007. Population connectivity in marinesystems: an overview. � Oceanography 20: 14�21.
Crooks, K. R. and Sanjayan, M. 2006. Connectivity conservation.� Cambridge Univ. Press.
Epperson, B. K. 2003. Geographical genetics. � Princeton Univ.Press.
Fu, R. et al. 2006. Exact moment calculations for genetic modelswith migration, mutation, and drift. � Theor. Popul. Biol. 63:231�243.
Galindo, H. M. et al. 2006. Seascape genetics: a coupledoceanographic-genetic model predicts population structure ofCaribbean corals. � Curr. Biol. 16: 1622�1626.
Gordon, A. L. 1967. Circulation of the Caribbean Sea. � J.Geophys. Res. 72: 6207�6223.
Graham, E. M. et al. 2008. Survival dynamics of scleractiniancoral larvae and implications for dispersal. � Coral Reefs 27:529�539.
Griffa, A. 1996. Applications of stochastic particle models tooceanographic problems. � In: Adler, R. J. et al. (eds),Stochastic modelling in physical oceanography. Birkhauser,pp. 113�140.
Gutierrez-Rodriguez, C. and Lasker, H. R. 2004. Microsatellitevariation reveals high levels of genetic variability and popula-tion structure in the gorgonian coral Pseudoptero-gorgia elisabethae across the Bahamas. � Mol. Ecol. 13:2211�2221.
Gyory, J. et al. 2009. The Caribbean Current. � /<http://oceancurrents.rsmas.miami.edu/caribbean/caribbean.html/>.
Hedgecock, D. et al. 2007. Genetic approaches to measuringconnectivity. � Oceanography 20: 70�79.
Hedrick, P. W. 2005. A standardized genetic differentiationmeasure. � Evolution 59: 1633�1638.
9-EV

Holmes, E. E. et al. 1994. Partial differential equations in ecology:spatial interactions and population dynamics. � Ecology 75:17�29.
Houde, E. 1989. Comparative growth, mortality, and energetics ofmarine fish larvae: temperature and implied latitudinal effects.� Fish. Bull. 87: 471�495.
Houde, E. D. 1997. Patterns and trends in larval-stage growth andmortality of teleost fish. � J. Fish Biol. 51: 52�83.
ISRS 2004. Marine protected areas (MPAs) in management ofcoral reefs. Briefing paper 1. � International Society for ReefStudies.
Jost, L. 2008. Gst and its relatives do not measure differentiation.� Mol. Ecol. 17: 4015�4026.
Kimura, M. and Weiss, G. H. 1964. The stepping stone model ofpopulation structure and the decrease of genetic correlationwith distance. � Genetics 49: 561�576.
Kool, J. T. 2009. An object-oriented, individual-based approachfor simulating the dynamics of genes in subdivided popula-tions. � Ecol. Inform., doi: 10.1016/j.ecoinf.2009.06.002.
Kristensen, V. N. et al. 2001. High-throughput methods fordetection of genetic variation. � Biotechniques 30: 318�322.
Kuparinen, A. 2006. Mechanistic models for wind dispersal.� Trends Plant Sci. 11: 296�301.
Lee, T. N. et al. 1996. Moored observations of western boundarycurrent variability and thermohaline circulation 26.58N in thesubtropical North Atlantic. � J. Phys. Oceanogr. 26: 962�983.
Legendre, P. and Legendre, L. 1998. Numerical ecology.� Elsevier.
Lumpkin, R. et al. 2002. Lagrangian Eddy scales in the northernAtlantic Ocean. � J. Phys. Oceanogr. 32: 2425�2440.
Metcalf, W. G. et al. 1977. Mona Passage drift bottle study.� Bull. Mar. Sci. 27: 586�591.
Milligan, G. W. and Cooper, M. C. 1985. An examination ofprocedures for determining the number of clusters in a dataset. � Psychometrika 50: 159�179.
Mooers, C. N. K. and Maul, G. A. 1998. Intra-Americas seacirculation. � In: Brink, K. H. and Robinson, A. R. (eds), Thesea. Wiley, pp. 183�208.
Nagylaki, T. 1978. A diffusion model for geographically struc-tured populations. � J. Math. Biol. 6: 375�382.
Nathan, R. et al. 2002. Mechanisms of long-distance dispersal ofseeds by wind. � Nature 418: 409�413.
Nei, M. 1987. Molecular evolutionary genetics. � Columbia Univ.Press.
Neumann, G. 1969. Ocean currents. � Elsevier.Okubo, A. 1980. Diffusion and ecological problems: mathema-
tical models. � Springer.Paris, C. B. et al. 2005. Larval transport pathways from Cuban
snapper (Lutjanidae) spawning aggregations based on biophy-sical modeling. � Mar. Ecol. Prog. Ser. 296: 93�106.
Paris, C. B. et al. 2007. Surfing, spinning, or diving from reef toreef: effects on population connectivity. � Mar. Ecol. Prog.Ser. 347: 285�300.
Paris-Limouzy, C. B. 2001. Transport dynamics and survival ofthe pelagic larval stages of a coral reef fish, the bicolordamselfish, Stegastes partitus (Poey). � Ph.D. thesis, MarineSciences Research Center, State Univ. of New York at StonyBrook.
Peng, B. and Kimmel, M. 2005. simuPOP: a forward-timepopulation genetics simulation environment. � Bioinformatics21: 3686�3687.
Planes, S. and Fauvelot, C. 2002. Isolation by distance andvicariance drive genetic structure of a coral reef fish in thePacific Ocean. � Evolution 56: 378�399.
Purcell, J. F. H. et al. 2006. Weak genetic structure indicatesstrong dispersal limits: a tale of two coral reef fish. � Proc. R.Soc. B 273: 1483�1490.
Richardson, D. E. et al. 2007. High-throughput species identifica-tion: from DNA isolation to bioinformatics. � Mol. Ecol. Not.7: 199�207.
Roberts, C. M. et al. 2003. Ecological criteria for evalua-ting candidate sites for marine reserves. � Ecol. Appl. 13:S199�S214.
Roemich, D. 1981. Circulation in the Caribbean Sea: a well-resolved inverse problem. � J. Geophys. Res. 86: 7993�8005.
Rowe, E. et al. 2009. The Antilles Current. � /<http://oceancurrents.rsmas.miami.edu/atlantic/antilles.html/>.
Shulman, M. J. and Bermingham, E. 1995. Early-life histories,ocean currents, and the population-genetics of Caribbean reeffishes. � Evolution 49: 897�910.
Spalding, M. D. et al. 2001. World atlas of coral reefs. � Univ. ofCalifornia Press.
Taylor, M. S. and Hellberg, M. E. 2003. Genetic evidence forlocal retention of pelagic larvae in a Caribbean reef fish.� Science 299: 107�109.
Taylor, M. S. and Hellberg, M. E. 2006. Comparative phylogeo-graphy in a genus of coral reef fishes: biogeographicand genetic concordance in the Caribbean. � Mol. Ecol. 15:695�707.
Taylor, P. D. et al. 1993. Connectivity is a vital element oflandscape structure. � Oikos 68: 571�573.
Urban, D. and Keitt, T. 2001. Landscape connectivity: a graph-theoretic perspective. � Ecology 82: 1205�1218.
Vekemans, X. and Hardy, O. J. 2004. New insights from fine-scalespatial genetic structure analyses in plant populations. � Mol.Ecol. 13: 921�935.
Veneziani, M. et al. 2004. Oceanic turbulence and stochasticmodels from subsurface Lagrangian data for the northwestAtlantic Ocean. � J. Phys. Oceanogr. 34: 1884�1906.
Vollmer, S. V. and Palumbi, S. R. 2007. Restricted gene flow inthe Caribbean staghorn coral Acropora cervicornis: implicationsfor the recovery of endangered reefs. � J. Hered. 98: 40�50.
Download the Supplementary material as file E6012 from /
<www.oikos.ekol.lu.se/appendix/>.
10-EV