Complex cells decrease errors for the Müller-Lyer illusion in a model of the visual ventral stream
9
ORIGINAL RESEARCH ARTICLE published: 24 September 2014 doi: 10.3389/fncom.2014.00112 Complex cells decrease errors for the Müller-Lyer illusion in a model of the visual ventral stream Astrid Zeman 1,2,3 *, Oliver Obst 2 and Kevin R. Brooks 3,4 1 Department of Cognitive Science, ARC Centre of Excellence in Cognition and its Disorders (CCD), Macquarie University, Sydney, NSW, Australia 2 Digital Productivity and Services Flagship (DPAS), Commonwealth Scientific and Industrial Research Organisation, Marsfield, NSW, Australia 3 Perception in Action Research Centre, Macquarie University, Sydney, NSW, Australia 4 Department of Psychology, Macquarie University, Sydney, NSW, Australia Edited by: Mazyar Fallah, York University, Canada Reviewed by: Ján Antolík, Centre National de la Recherche Scientifique, France Victor De Lafuente, Universidad Nacional Autónoma de México, Mexico *Correspondence: Astrid Zeman, Macquarie University, Level 3 Australian Hearing Hub, 16 University Avenue, Sydney, NSW 2109, Australia e-mail: [email protected] To improve robustness in object recognition, many artificial visual systems imitate the way in which the human visual cortex encodes object information as a hierarchical set of features. These systems are usually evaluated in terms of their ability to accurately categorize well-defined, unambiguous objects and scenes. In the real world, however, not all objects and scenes are presented clearly, with well-defined labels and interpretations. Visual illusions demonstrate a disparity between perception and objective reality, allowing psychophysicists to methodically manipulate stimuli and study our interpretation of the environment. One prominent effect, the Müller-Lyer illusion, is demonstrated when the perceived length of a line is contracted (or expanded) by the addition of arrowheads (or arrow-tails) to its ends. HMAX, a benchmark object recognition system, consistently produces a bias when classifying Müller-Lyer images. HMAX is a hierarchical, artificial neural network that imitates the “simple” and “complex” cell layers found in the visual ventral stream. In this study, we perform two experiments to explore the Müller-Lyer illusion in HMAX, asking: (1) How do simple vs. complex cell operations within HMAX affect illusory bias and precision? (2) How does varying the position of the figures in the input image affect classification using HMAX? In our first experiment, we assessed classification after traversing each layer of HMAX and found that in general, kernel operations performed by simple cells increase bias and uncertainty while max-pooling operations executed by complex cells decrease bias and uncertainty. In our second experiment, we increased variation in the positions of figures in the input images that reduced bias and uncertainty in HMAX. Our findings suggest that the Müller-Lyer illusion is exacerbated by the vulnerability of simple cell operations to positional fluctuations, but ameliorated by the robustness of complex cell responses to such variance. Keywords: Müller-Lyer, illusion, HMAX, hierarchical, computational, model, visual, cortex 1. INTRODUCTION Much of what is known today about our visual perception has been discovered through visual illusions. Visual illusions allow us to study the difference between objective reality and our inter- pretation of the visual information that we receive. Recently it has been shown that computational vision models that imitate neural mechanisms found in the ventral visual stream can exhibit human-like illusory biases (Zeman et al., 2013) . To the extent that the models are accurate reflections of human physiology, these results can be used to further elucidate some of the neural mechanisms behind particular illusions. In this paper, we focus on the Müller-Lyer Illusion (MLI), which is a geometrical size illusion where a line with arrow- heads appears contracted and a line with arrow-tails appears elongated (Müller-Lyer, 1889) (see Figure 1). The strength of the illusion can be affected by the fin angle (Dewar, 1967), shaft length (Fellows, 1967; Brigell and Uhlarik, 1979), inspection time (Coren and Porac, 1984; Predebon, 1997), observer age (Restle and Decker, 1977), the distance between the fins and the shaft (Fellows, 1967) and many other factors. The illusion classically appears in a four-wing form but can also manifest with other shapes, such as circles or squares, replacing the fins at the shaft ends. Even with the shafts completely removed, the MLI is still evident. Here, we employ an underused method to explore the Müller- Lyer illusion and its potential causes using an Artificial Neural Network (ANN). To date, few studies have used ANNs to explore visual illusions (Ogawa et al., 1999; Bertulis and Bulatov, 2001; Corney and Lotto, 2007). In some cases, these artificial neural networks were not built to emulate their biological counterparts, but rather to demonstrate statistical correlations in the input. One such example is the model used by Corney and Lotto (2007), con- sisting of only one hidden layer with four homogenous neurons, which few would consider to be even a crude representation of visual cortex. The work presented by Ogawa et al. (1999) used a network with three hidden layers of “orientational neurons,” Frontiers in Computational Neuroscience www.frontiersin.org September 2014 | Volume 8 | Article 112 | 1 COMPUTATIONAL NEUROSCIENCE
Transcript of Complex cells decrease errors for the Müller-Lyer illusion in a model of the visual ventral stream
ORIGINAL RESEARCH ARTICLEpublished: 24 September 2014doi: 10.3389/fncom.2014.00112
Complex cells decrease errors for the Müller-Lyer illusion ina model of the visual ventral streamAstrid Zeman1,2,3*, Oliver Obst2 and Kevin R. Brooks3,4
1 Department of Cognitive Science, ARC Centre of Excellence in Cognition and its Disorders (CCD), Macquarie University, Sydney, NSW, Australia2 Digital Productivity and Services Flagship (DPAS), Commonwealth Scientific and Industrial Research Organisation, Marsfield, NSW, Australia3 Perception in Action Research Centre, Macquarie University, Sydney, NSW, Australia4 Department of Psychology, Macquarie University, Sydney, NSW, Australia
Edited by:
Mazyar Fallah, York University,Canada
Reviewed by:
Ján Antolík, Centre National de laRecherche Scientifique, FranceVictor De Lafuente, UniversidadNacional Autónoma de México,Mexico
*Correspondence:
Astrid Zeman, Macquarie University,Level 3 Australian Hearing Hub, 16University Avenue, Sydney,NSW 2109, Australiae-mail: [email protected]
To improve robustness in object recognition, many artificial visual systems imitate theway in which the human visual cortex encodes object information as a hierarchical setof features. These systems are usually evaluated in terms of their ability to accuratelycategorize well-defined, unambiguous objects and scenes. In the real world, however, notall objects and scenes are presented clearly, with well-defined labels and interpretations.Visual illusions demonstrate a disparity between perception and objective reality, allowingpsychophysicists to methodically manipulate stimuli and study our interpretation of theenvironment. One prominent effect, the Müller-Lyer illusion, is demonstrated when theperceived length of a line is contracted (or expanded) by the addition of arrowheads(or arrow-tails) to its ends. HMAX, a benchmark object recognition system, consistentlyproduces a bias when classifying Müller-Lyer images. HMAX is a hierarchical, artificialneural network that imitates the “simple” and “complex” cell layers found in the visualventral stream. In this study, we perform two experiments to explore the Müller-Lyerillusion in HMAX, asking: (1) How do simple vs. complex cell operations within HMAXaffect illusory bias and precision? (2) How does varying the position of the figures inthe input image affect classification using HMAX? In our first experiment, we assessedclassification after traversing each layer of HMAX and found that in general, kerneloperations performed by simple cells increase bias and uncertainty while max-poolingoperations executed by complex cells decrease bias and uncertainty. In our secondexperiment, we increased variation in the positions of figures in the input images thatreduced bias and uncertainty in HMAX. Our findings suggest that the Müller-Lyer illusionis exacerbated by the vulnerability of simple cell operations to positional fluctuations, butameliorated by the robustness of complex cell responses to such variance.
Keywords: Müller-Lyer, illusion, HMAX, hierarchical, computational, model, visual, cortex
1. INTRODUCTIONMuch of what is known today about our visual perception hasbeen discovered through visual illusions. Visual illusions allow usto study the difference between objective reality and our inter-pretation of the visual information that we receive. Recently ithas been shown that computational vision models that imitateneural mechanisms found in the ventral visual stream can exhibithuman-like illusory biases (Zeman et al., 2013) . To the extentthat the models are accurate reflections of human physiology,these results can be used to further elucidate some of the neuralmechanisms behind particular illusions.
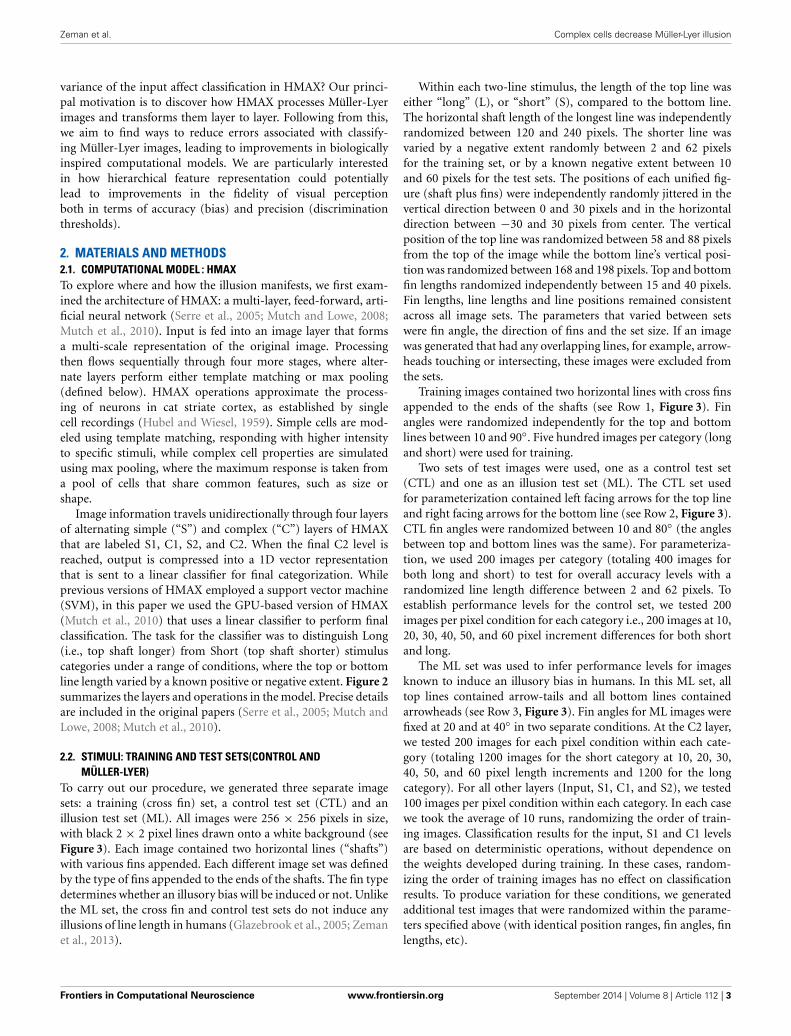
In this paper, we focus on the Müller-Lyer Illusion (MLI),which is a geometrical size illusion where a line with arrow-heads appears contracted and a line with arrow-tails appearselongated (Müller-Lyer, 1889) (see Figure 1). The strength of theillusion can be affected by the fin angle (Dewar, 1967), shaftlength (Fellows, 1967; Brigell and Uhlarik, 1979), inspection time(Coren and Porac, 1984; Predebon, 1997), observer age (Restle
and Decker, 1977), the distance between the fins and the shaft(Fellows, 1967) and many other factors. The illusion classicallyappears in a four-wing form but can also manifest with othershapes, such as circles or squares, replacing the fins at the shaftends. Even with the shafts completely removed, the MLI is stillevident.
Here, we employ an underused method to explore the Müller-Lyer illusion and its potential causes using an Artificial NeuralNetwork (ANN). To date, few studies have used ANNs to explorevisual illusions (Ogawa et al., 1999; Bertulis and Bulatov, 2001;Corney and Lotto, 2007). In some cases, these artificial neuralnetworks were not built to emulate their biological counterparts,but rather to demonstrate statistical correlations in the input. Onesuch example is the model used by Corney and Lotto (2007), con-sisting of only one hidden layer with four homogenous neurons,which few would consider to be even a crude representation ofvisual cortex. The work presented by Ogawa et al. (1999) useda network with three hidden layers of “orientational neurons,”
Frontiers in Computational Neuroscience www.frontiersin.org September 2014 | Volume 8 | Article 112 | 1
COMPUTATIONAL NEUROSCIENCE
Zeman et al. Complex cells decrease Müller-Lyer illusion
FIGURE 1 | The ML illusion in classical four-wing form. Horizontal linesare the same length in all cases. The ML effect is stronger for more acuteangles (Left) and weaker for more obtuse angles (Right).
“rotational neurons” and “line unifying neurons.” This networkcould roughly correspond to one layer of simple cells that provideorientation filters and one layer of complex cells that combinetheir output. However, this study presented no quantitative dataand lacked a detailed description of the model, such as the sizeor connectivity of their network. Bertulis and Bulatov (2001)created a computer model to replicate the spatial filtering prop-erties of simple cells and the combination of these units’ outputsby complex cells in visual cortical area V1. Although they com-pared human and model data for the Müller-Lyer Illusion, theirmodel centered only on the filtering properties of early visual neu-rons. These models do not adequately represent the multi-layeredsystem that would best describe the relevant neural structures.Neuroimaging studies have shown areas V1, V2, V4, and ITare recruited when viewing the MLI (Weidner and Fink, 2007;Weidner et al., 2010) and hence the inclusion of operations fromsuch visual ventral stream subdivisions is desirable. Therefore,studying the MLI in a computational model known to mimicthese areas would provide a more biologically representativeresult.
In a previous report, we studied the MLI in a benchmarkmodel of the ventral visual stream that imitates these cortical areas(Zeman et al., 2013). Following from our hypothesis that the MLIcould occur in a model that imitates the structure and function ofvisual ventral areas, we demonstrated its manifestation in a bio-logically plausible artificial neural network. Although the modelslisted above are capable of reproducing the MLI, we believe ourwork provides a significant advance, being one of the first stud-ies to model a visual illusion in a simulated replica of the ventralvisual stream. In addition, our study contrasts with those aboveby employing techniques to train the model on multiple imagesbefore running a classification task and comparing the task ofinterest to a control. This allows us to separate the inner workingsof the model from the input in the form of training images.
The model we recruit, HMAX (Serre et al., 2005), is a feed-forward, multi-layer, artificial neural network with layers corre-sponding to simple and complex cells found in visual cortex. Likevisual cortex, the layers of HMAX alternate between simple andcomplex cells, creating a hierarchy of representations that cor-respond to increasing levels of abstraction as you traverse eachlayer. The simple and complex cells in the model are designed tomatch their physiological counterparts, as established by singlecell recordings in visual cortex (Hubel and Wiesel, 1959). Here,we briefly describe single and complex cell functions and pro-vide further detail on these later in Section 2.1. In short, simplecells extract low-level features, such as edges, an example of which
would be Gabor filters that are often used to model V1 operations.The outputs of simple cells are pooled together by complex cellsthat extract combined or high-level features, such as lines of oneparticular orientation that cover a variety of positions within avisual field. Within HMAX, the max pooling function is used toimitate complex cell operations, giving the model its trademarkname. In general, low-level features extracted by simple cells areshared across a variety of input images. High-level features are lesscommon across image categories. The high-level features outputby complex cells are more stable, invariant and robust to slightchanges in the input.
HMAX has been extensively studied in its ability to match andpredict physiological and psychological data (Serre and Poggio,2010). Like many object recognition models, HMAX has beenfrequently tested using well-defined, unambiguous objects andscenes but has not been thoroughly assessed in its ability tohandle visual illusions. Our previous demonstration of the MLIwithin HMAX showed not only a general illusory bias, but alsoa greater effect with more acute fin angles, corresponding tothe pattern of errors shown by humans. Our replication of theMLI in this model allowed us to rule out some of the neces-sary causes for the illusion. There are a number of theories thatattempt to explain the MLI (Gregory, 1963; Segall et al., 1966;Ginsburg, 1978; Coren and Porac, 1984; Müller-Lyer, 1896a,b;Bertulis and Bulatov, 2001; Howe and Purves, 2005; Brown andFriston, 2012) and here we discuss two. One common hypothesisis the “carpentered-world” theory—that images in our environ-ment influence our perception of the MLI (Gregory, 1963; Segallet al., 1966). To interpret and maneuver within our visual envi-ronment, we apply a size-constancy scaling rule that allows us toinfer the actual size of objects from the image that falls on ourretina. While arrowhead images usually correspond to the near,exterior corners of cuboids, arrow-tail configurations are associ-ated with more distant features, such as the right-angled cornersof a room. If the expected distance of the features is used toscale our perception of size, when a line with arrowheads is com-pared to a line with arrow-tails that is physically equal in length,the more proximal arrowhead line is perceived as being smaller.Another common theory is based upon visual filtering mecha-nisms (Ginsburg, 1978). By applying a low spatial frequency filterto a Müller-Lyer image, the overall object (shaft plus fins) willappear elongated or contracted. Therefore, it could simply bea reliance on low spatial frequency information that causes theMLI. In our previous study, we were able to replicate the MLI inHMAX, allowing us to establish that exposure to 3-dimensional“carpentered world” scenes (Gregory, 1963) is not necessary toexplain the MLI, as the model had no representation of distanceand hence involved no size constancy scaling for depth. We alsodemonstrated that the illusion was not a result of reliance uponlow spatial frequency filters, as information from a broad rangeof spatial frequency filters was used for classification.
In the current study, we set out to investigate the condi-tions under which the Müller-Lyer illusion manifests in HMAXand what factors influence the magnitude and precision of theeffect. In particular, we address the following questions: (1) Howdo simple vs. complex cell operations within HMAX affect illu-sory bias and precision? (2) How would increasing the positional
Frontiers in Computational Neuroscience www.frontiersin.org September 2014 | Volume 8 | Article 112 | 2
Zeman et al. Complex cells decrease Müller-Lyer illusion
variance of the input affect classification in HMAX? Our princi-pal motivation is to discover how HMAX processes Müller-Lyerimages and transforms them layer to layer. Following from this,we aim to find ways to reduce errors associated with classify-ing Müller-Lyer images, leading to improvements in biologicallyinspired computational models. We are particularly interestedin how hierarchical feature representation could potentiallylead to improvements in the fidelity of visual perceptionboth in terms of accuracy (bias) and precision (discriminationthresholds).
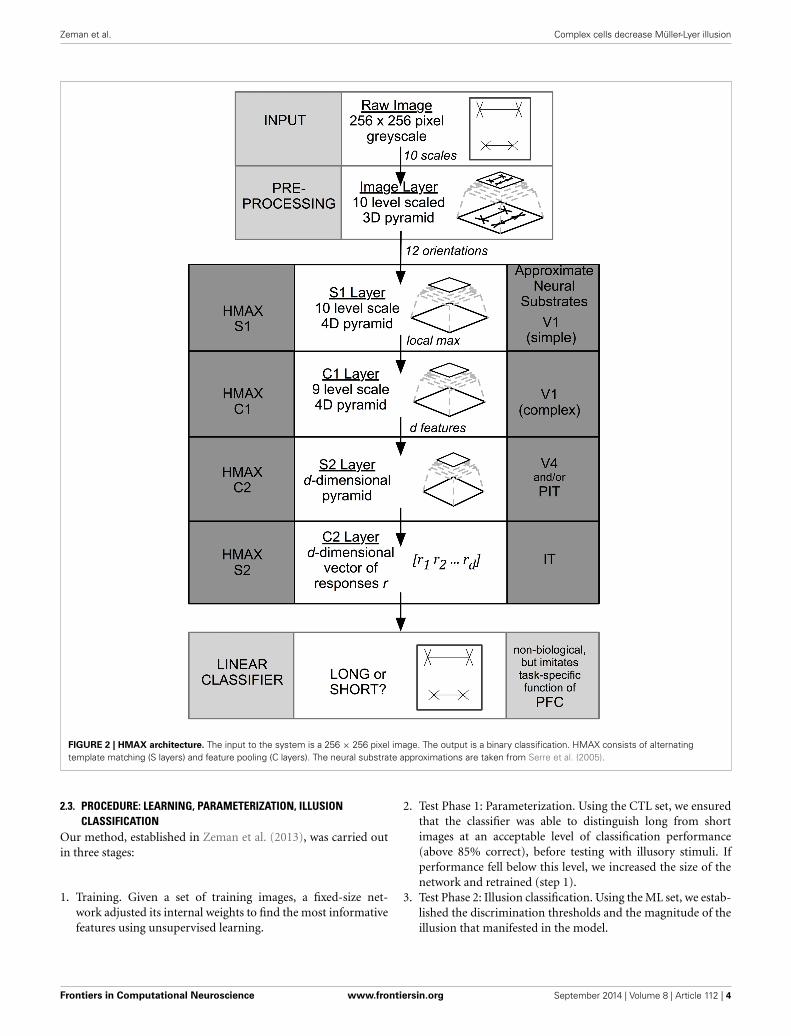
2. MATERIALS AND METHODS2.1. COMPUTATIONAL MODEL : HMAXTo explore where and how the illusion manifests, we first exam-ined the architecture of HMAX: a multi-layer, feed-forward, arti-ficial neural network (Serre et al., 2005; Mutch and Lowe, 2008;Mutch et al., 2010). Input is fed into an image layer that formsa multi-scale representation of the original image. Processingthen flows sequentially through four more stages, where alter-nate layers perform either template matching or max pooling(defined below). HMAX operations approximate the process-ing of neurons in cat striate cortex, as established by singlecell recordings (Hubel and Wiesel, 1959). Simple cells are mod-eled using template matching, responding with higher intensityto specific stimuli, while complex cell properties are simulatedusing max pooling, where the maximum response is taken froma pool of cells that share common features, such as size orshape.
Image information travels unidirectionally through four layersof alternating simple (“S”) and complex (“C”) layers of HMAXthat are labeled S1, C1, S2, and C2. When the final C2 level isreached, output is compressed into a 1D vector representationthat is sent to a linear classifier for final categorization. Whileprevious versions of HMAX employed a support vector machine(SVM), in this paper we used the GPU-based version of HMAX(Mutch et al., 2010) that uses a linear classifier to perform finalclassification. The task for the classifier was to distinguish Long(i.e., top shaft longer) from Short (top shaft shorter) stimuluscategories under a range of conditions, where the top or bottomline length varied by a known positive or negative extent. Figure 2summarizes the layers and operations in the model. Precise detailsare included in the original papers (Serre et al., 2005; Mutch andLowe, 2008; Mutch et al., 2010).
2.2. STIMULI: TRAINING AND TEST SETS(CONTROL ANDMÜLLER-LYER)
To carry out our procedure, we generated three separate imagesets: a training (cross fin) set, a control test set (CTL) and anillusion test set (ML). All images were 256 × 256 pixels in size,with black 2 × 2 pixel lines drawn onto a white background (seeFigure 3). Each image contained two horizontal lines (“shafts”)with various fins appended. Each different image set was definedby the type of fins appended to the ends of the shafts. The fin typedetermines whether an illusory bias will be induced or not. Unlikethe ML set, the cross fin and control test sets do not induce anyillusions of line length in humans (Glazebrook et al., 2005; Zemanet al., 2013).
Within each two-line stimulus, the length of the top line waseither “long” (L), or “short” (S), compared to the bottom line.The horizontal shaft length of the longest line was independentlyrandomized between 120 and 240 pixels. The shorter line wasvaried by a negative extent randomly between 2 and 62 pixelsfor the training set, or by a known negative extent between 10and 60 pixels for the test sets. The positions of each unified fig-ure (shaft plus fins) were independently randomly jittered in thevertical direction between 0 and 30 pixels and in the horizontaldirection between −30 and 30 pixels from center. The verticalposition of the top line was randomized between 58 and 88 pixelsfrom the top of the image while the bottom line’s vertical posi-tion was randomized between 168 and 198 pixels. Top and bottomfin lengths randomized independently between 15 and 40 pixels.Fin lengths, line lengths and line positions remained consistentacross all image sets. The parameters that varied between setswere fin angle, the direction of fins and the set size. If an imagewas generated that had any overlapping lines, for example, arrow-heads touching or intersecting, these images were excluded fromthe sets.
Training images contained two horizontal lines with cross finsappended to the ends of the shafts (see Row 1, Figure 3). Finangles were randomized independently for the top and bottomlines between 10 and 90◦. Five hundred images per category (longand short) were used for training.
Two sets of test images were used, one as a control test set(CTL) and one as an illusion test set (ML). The CTL set usedfor parameterization contained left facing arrows for the top lineand right facing arrows for the bottom line (see Row 2, Figure 3).CTL fin angles were randomized between 10 and 80◦ (the anglesbetween top and bottom lines was the same). For parameteriza-tion, we used 200 images per category (totaling 400 images forboth long and short) to test for overall accuracy levels with arandomized line length difference between 2 and 62 pixels. Toestablish performance levels for the control set, we tested 200images per pixel condition for each category i.e., 200 images at 10,20, 30, 40, 50, and 60 pixel increment differences for both shortand long.
The ML set was used to infer performance levels for imagesknown to induce an illusory bias in humans. In this ML set, alltop lines contained arrow-tails and all bottom lines containedarrowheads (see Row 3, Figure 3). Fin angles for ML images werefixed at 20 and at 40◦ in two separate conditions. At the C2 layer,we tested 200 images for each pixel condition within each cate-gory (totaling 1200 images for the short category at 10, 20, 30,40, 50, and 60 pixel length increments and 1200 for the longcategory). For all other layers (Input, S1, C1, and S2), we tested100 images per pixel condition within each category. In each casewe took the average of 10 runs, randomizing the order of train-ing images. Classification results for the input, S1 and C1 levelsare based on deterministic operations, without dependence onthe weights developed during training. In these cases, random-izing the order of training images has no effect on classificationresults. To produce variation for these conditions, we generatedadditional test images that were randomized within the parame-ters specified above (with identical position ranges, fin angles, finlengths, etc).
Frontiers in Computational Neuroscience www.frontiersin.org September 2014 | Volume 8 | Article 112 | 3
Zeman et al. Complex cells decrease Müller-Lyer illusion
FIGURE 2 | HMAX architecture. The input to the system is a 256 × 256 pixel image. The output is a binary classification. HMAX consists of alternatingtemplate matching (S layers) and feature pooling (C layers). The neural substrate approximations are taken from Serre et al. (2005).
2.3. PROCEDURE: LEARNING, PARAMETERIZATION, ILLUSIONCLASSIFICATION
Our method, established in Zeman et al. (2013), was carried outin three stages:
1. Training. Given a set of training images, a fixed-size net-work adjusted its internal weights to find the most informativefeatures using unsupervised learning.
2. Test Phase 1: Parameterization. Using the CTL set, we ensuredthat the classifier was able to distinguish long from shortimages at an acceptable level of classification performance(above 85% correct), before testing with illusory stimuli. Ifperformance fell below this level, we increased the size of thenetwork and retrained (step 1).
3. Test Phase 2: Illusion classification. Using the ML set, we estab-lished the discrimination thresholds and the magnitude of theillusion that manifested in the model.
Frontiers in Computational Neuroscience www.frontiersin.org September 2014 | Volume 8 | Article 112 | 4

Zeman et al. Complex cells decrease Müller-Lyer illusion
FIGURE 3 | Representative sample of images categorized as LONG or
SHORT. The Cross fin set (Top row) was used for training. The ControlCTL set (Middle row) and Illusory ML set were both used for testing.
Images are grouped into those that were jittered both horizontally andvertically (Left group) and those that were jittered only vertically (Rightgroup).
3. RESULTS3.1. EXPERIMENT I: CLASSIFICATION OF ML IMAGES AFTER EACH
LEVEL OF HMAXThe aim of this experiment was to assess how simple and complexcell operations contribute toward bringing about the MLI. Tothis end, we examined the inner workings of HMAX, looking atclassification performance for illusory images at each level of thearchitecture. We used a linear classifier to perform classificationafter each subsequent layer of HMAX, (which included process-ing of all previous layers required to reach that stage). Therefore,we ran classification on the Input only, on S1 (after informationarrived from Input), on C1 (after information traversed throughInput and S1 layers) and so on.
We first tested classification performance on our controlimages, which exceeded 85% when the size of the S2 layer was1000 nodes. Using this network configuration, we tested classifi-cation on 20 and 40◦ ML images at the C2 level. We then testedclassification at each layer of HMAX using the same illusory set.
When plotted in terms of the percentage of stimuli classifiedas “long” as a function of the difference in line length (top–bottom) for each separate data set (i.e., control images, illusoryimages with 20◦ fins and with 40◦ fins), we observed a sigmoidalpsychometric function, characteristic of human performance in
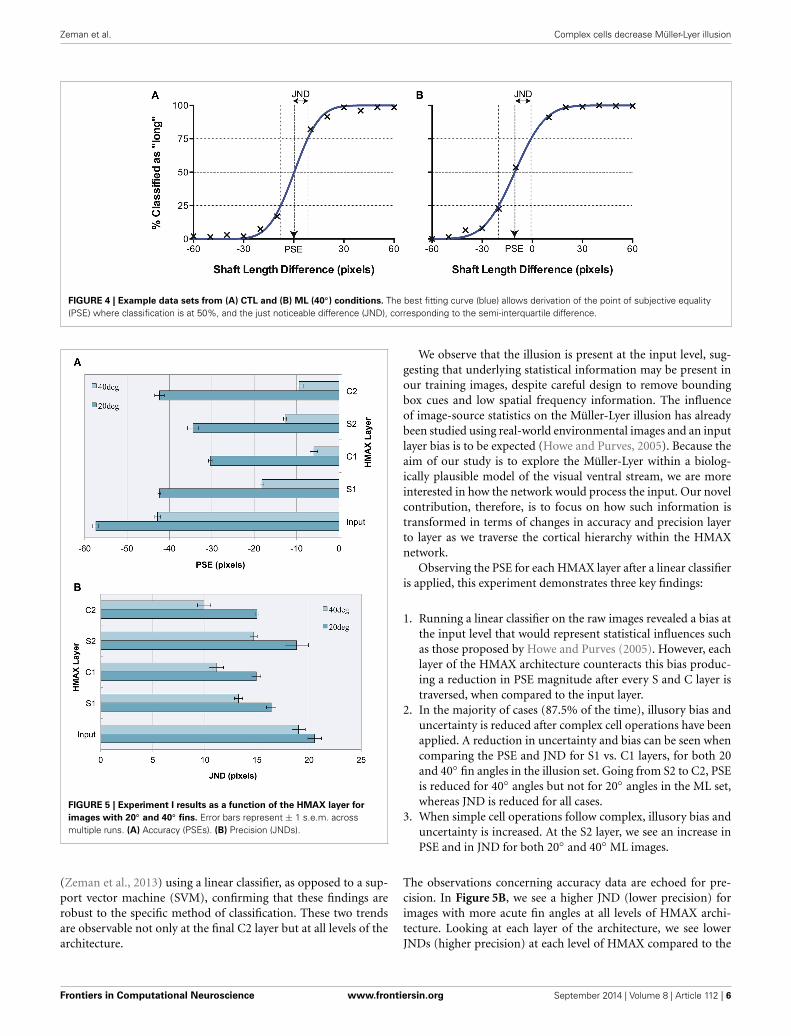
equivalent psychophysical tasks. The data were characterized bya cumulative Gaussian, with the parameters of the best-fittingfunction determined using a least-squares procedure. Figure 4illustrates an example data set. When Gaussian curves did notfit significantly better than a horizontal line at 50% (chanceresponding) in an extra sum of squares F-test, the results were dis-carded (2 runs out of a total of 52). This allowed us to determinethe Point of Subjective Equality (PSE) the line length differencefor which stimuli were equally likely to be classified as long orshort (50%), represented by the mean of the cumulative Gaussian.Here, PSEs are taken as a measure of accuracy, representing themagnitude of the Müller-Lyer Illusion manifested in the model.We also established the Just Noticeable Difference (JND) for eachdata set. The JND represents perceptual precision—the level ofcertainty of judgments for a stimulus type, and is indicated by thesemi-interquartile difference of the Gaussian curve (the standarddeviation multiplied by 0.6745). A higher JND represents greateruncertainty, and hence lower precision.
As can be seen in our results (see Figure 5A), the model pro-duces a pattern of PSEs for illusory images consistent with humanbias. We see a larger bias for more acute angles (20◦) vs. less acuteangles (40◦), a pattern that is also consistent with human per-ception. This constitutes a replication of our previous findings
Frontiers in Computational Neuroscience www.frontiersin.org September 2014 | Volume 8 | Article 112 | 5
Zeman et al. Complex cells decrease Müller-Lyer illusion
FIGURE 4 | Example data sets from (A) CTL and (B) ML (40◦) conditions. The best fitting curve (blue) allows derivation of the point of subjective equality(PSE) where classification is at 50%, and the just noticeable difference (JND), corresponding to the semi-interquartile difference.
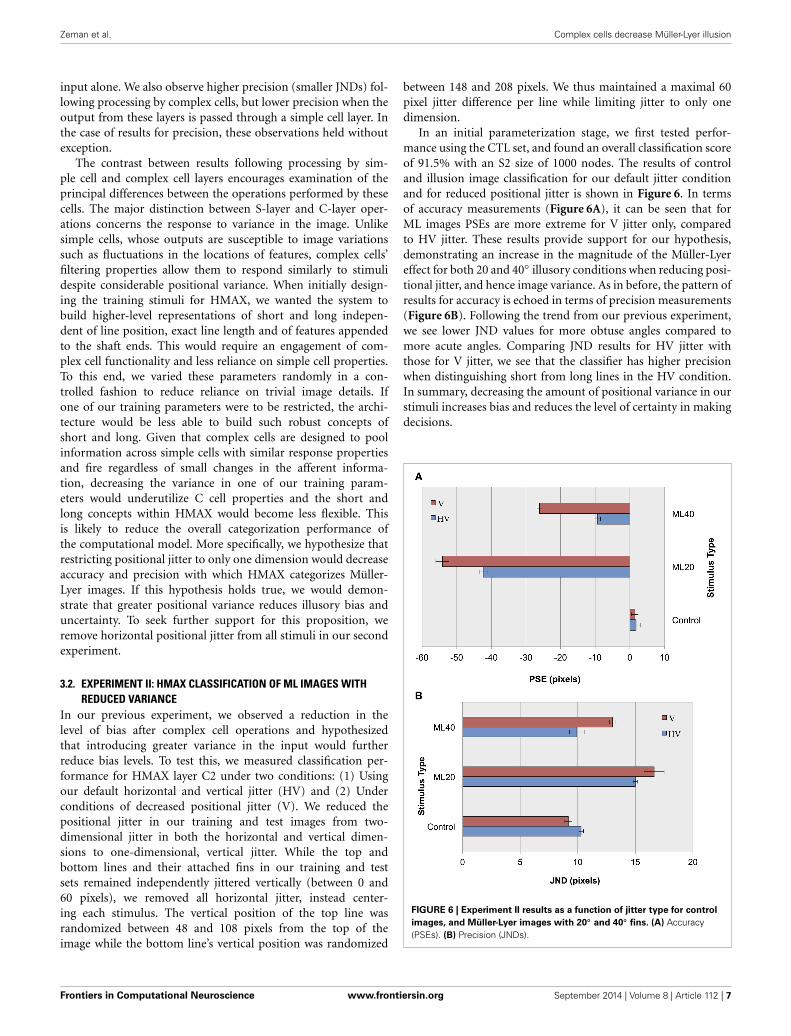
FIGURE 5 | Experiment I results as a function of the HMAX layer for
images with 20◦ and 40◦ fins. Error bars represent ± 1 s.e.m. acrossmultiple runs. (A) Accuracy (PSEs). (B) Precision (JNDs).
(Zeman et al., 2013) using a linear classifier, as opposed to a sup-port vector machine (SVM), confirming that these findings arerobust to the specific method of classification. These two trendsare observable not only at the final C2 layer but at all levels of thearchitecture.
We observe that the illusion is present at the input level, sug-gesting that underlying statistical information may be present inour training images, despite careful design to remove boundingbox cues and low spatial frequency information. The influenceof image-source statistics on the Müller-Lyer illusion has alreadybeen studied using real-world environmental images and an inputlayer bias is to be expected (Howe and Purves, 2005). Because theaim of our study is to explore the Müller-Lyer within a biolog-ically plausible model of the visual ventral stream, we are moreinterested in how the network would process the input. Our novelcontribution, therefore, is to focus on how such information istransformed in terms of changes in accuracy and precision layerto layer as we traverse the cortical hierarchy within the HMAXnetwork.
Observing the PSE for each HMAX layer after a linear classifieris applied, this experiment demonstrates three key findings:
1. Running a linear classifier on the raw images revealed a bias atthe input level that would represent statistical influences suchas those proposed by Howe and Purves (2005). However, eachlayer of the HMAX architecture counteracts this bias produc-ing a reduction in PSE magnitude after every S and C layer istraversed, when compared to the input layer.
2. In the majority of cases (87.5% of the time), illusory bias anduncertainty is reduced after complex cell operations have beenapplied. A reduction in uncertainty and bias can be seen whencomparing the PSE and JND for S1 vs. C1 layers, for both 20and 40◦ fin angles in the illusion set. Going from S2 to C2, PSEis reduced for 40◦ angles but not for 20◦ angles in the ML set,whereas JND is reduced for all cases.
3. When simple cell operations follow complex, illusory bias anduncertainty is increased. At the S2 layer, we see an increase inPSE and in JND for both 20◦ and 40◦ ML images.
The observations concerning accuracy data are echoed for pre-cision. In Figure 5B, we see a higher JND (lower precision) forimages with more acute fin angles at all levels of HMAX archi-tecture. Looking at each layer of the architecture, we see lowerJNDs (higher precision) at each level of HMAX compared to the
Frontiers in Computational Neuroscience www.frontiersin.org September 2014 | Volume 8 | Article 112 | 6
Zeman et al. Complex cells decrease Müller-Lyer illusion
input alone. We also observe higher precision (smaller JNDs) fol-lowing processing by complex cells, but lower precision when theoutput from these layers is passed through a simple cell layer. Inthe case of results for precision, these observations held withoutexception.
The contrast between results following processing by sim-ple cell and complex cell layers encourages examination of theprincipal differences between the operations performed by thesecells. The major distinction between S-layer and C-layer oper-ations concerns the response to variance in the image. Unlikesimple cells, whose outputs are susceptible to image variationssuch as fluctuations in the locations of features, complex cells’filtering properties allow them to respond similarly to stimulidespite considerable positional variance. When initially design-ing the training stimuli for HMAX, we wanted the system tobuild higher-level representations of short and long indepen-dent of line position, exact line length and of features appendedto the shaft ends. This would require an engagement of com-plex cell functionality and less reliance on simple cell properties.To this end, we varied these parameters randomly in a con-trolled fashion to reduce reliance on trivial image details. Ifone of our training parameters were to be restricted, the archi-tecture would be less able to build such robust concepts ofshort and long. Given that complex cells are designed to poolinformation across simple cells with similar response propertiesand fire regardless of small changes in the afferent informa-tion, decreasing the variance in one of our training param-eters would underutilize C cell properties and the short andlong concepts within HMAX would become less flexible. Thisis likely to reduce the overall categorization performance ofthe computational model. More specifically, we hypothesize thatrestricting positional jitter to only one dimension would decreaseaccuracy and precision with which HMAX categorizes Müller-Lyer images. If this hypothesis holds true, we would demon-strate that greater positional variance reduces illusory bias anduncertainty. To seek further support for this proposition, weremove horizontal positional jitter from all stimuli in our secondexperiment.
3.2. EXPERIMENT II: HMAX CLASSIFICATION OF ML IMAGES WITHREDUCED VARIANCE
In our previous experiment, we observed a reduction in thelevel of bias after complex cell operations and hypothesizedthat introducing greater variance in the input would furtherreduce bias levels. To test this, we measured classification per-formance for HMAX layer C2 under two conditions: (1) Usingour default horizontal and vertical jitter (HV) and (2) Underconditions of decreased positional jitter (V). We reduced thepositional jitter in our training and test images from two-dimensional jitter in both the horizontal and vertical dimen-sions to one-dimensional, vertical jitter. While the top andbottom lines and their attached fins in our training and testsets remained independently jittered vertically (between 0 and60 pixels), we removed all horizontal jitter, instead center-ing each stimulus. The vertical position of the top line wasrandomized between 48 and 108 pixels from the top of theimage while the bottom line’s vertical position was randomized
between 148 and 208 pixels. We thus maintained a maximal 60pixel jitter difference per line while limiting jitter to only onedimension.
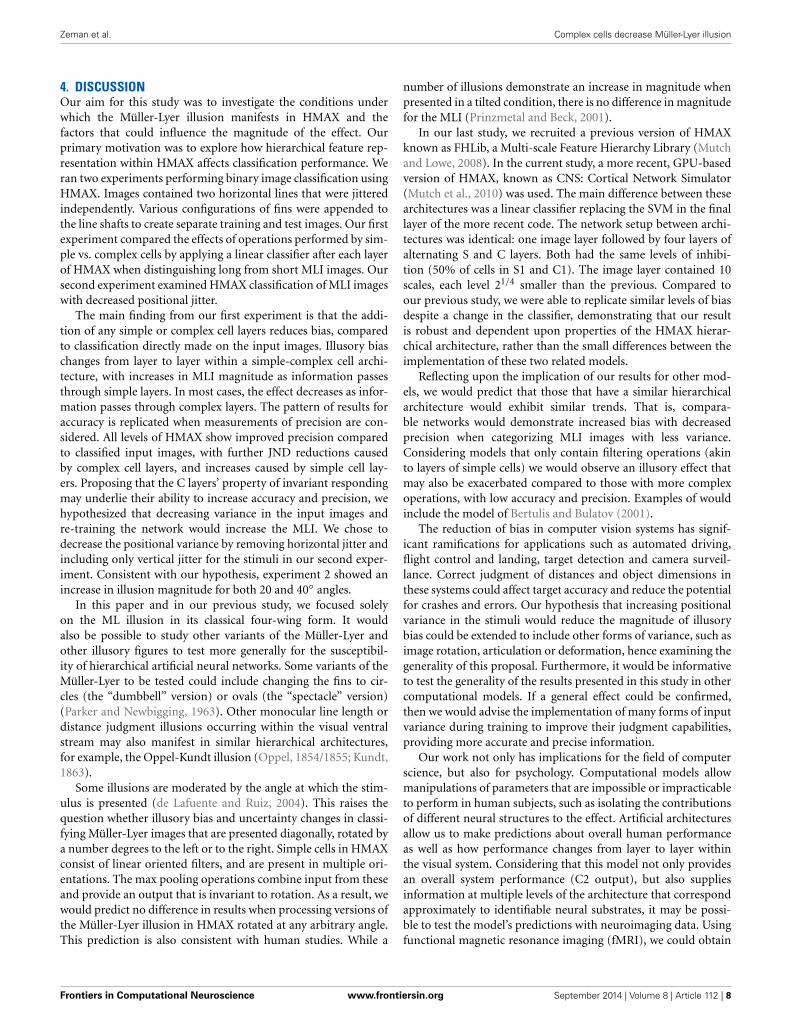
In an initial parameterization stage, we first tested perfor-mance using the CTL set, and found an overall classification scoreof 91.5% with an S2 size of 1000 nodes. The results of controland illusion image classification for our default jitter conditionand for reduced positional jitter is shown in Figure 6. In termsof accuracy measurements (Figure 6A), it can be seen that forML images PSEs are more extreme for V jitter only, comparedto HV jitter. These results provide support for our hypothesis,demonstrating an increase in the magnitude of the Müller-Lyereffect for both 20 and 40◦ illusory conditions when reducing posi-tional jitter, and hence image variance. As in before, the pattern ofresults for accuracy is echoed in terms of precision measurements(Figure 6B). Following the trend from our previous experiment,we see lower JND values for more obtuse angles compared tomore acute angles. Comparing JND results for HV jitter withthose for V jitter, we see that the classifier has higher precisionwhen distinguishing short from long lines in the HV condition.In summary, decreasing the amount of positional variance in ourstimuli increases bias and reduces the level of certainty in makingdecisions.
FIGURE 6 | Experiment II results as a function of jitter type for control
images, and Müller-Lyer images with 20◦ and 40◦ fins. (A) Accuracy(PSEs). (B) Precision (JNDs).
Frontiers in Computational Neuroscience www.frontiersin.org September 2014 | Volume 8 | Article 112 | 7
Zeman et al. Complex cells decrease Müller-Lyer illusion
4. DISCUSSIONOur aim for this study was to investigate the conditions underwhich the Müller-Lyer illusion manifests in HMAX and thefactors that could influence the magnitude of the effect. Ourprimary motivation was to explore how hierarchical feature rep-resentation within HMAX affects classification performance. Weran two experiments performing binary image classification usingHMAX. Images contained two horizontal lines that were jitteredindependently. Various configurations of fins were appended tothe line shafts to create separate training and test images. Our firstexperiment compared the effects of operations performed by sim-ple vs. complex cells by applying a linear classifier after each layerof HMAX when distinguishing long from short MLI images. Oursecond experiment examined HMAX classification of MLI imageswith decreased positional jitter.
The main finding from our first experiment is that the addi-tion of any simple or complex cell layers reduces bias, comparedto classification directly made on the input images. Illusory biaschanges from layer to layer within a simple-complex cell archi-tecture, with increases in MLI magnitude as information passesthrough simple layers. In most cases, the effect decreases as infor-mation passes through complex layers. The pattern of results foraccuracy is replicated when measurements of precision are con-sidered. All levels of HMAX show improved precision comparedto classified input images, with further JND reductions causedby complex cell layers, and increases caused by simple cell lay-ers. Proposing that the C layers’ property of invariant respondingmay underlie their ability to increase accuracy and precision, wehypothesized that decreasing variance in the input images andre-training the network would increase the MLI. We chose todecrease the positional variance by removing horizontal jitter andincluding only vertical jitter for the stimuli in our second exper-iment. Consistent with our hypothesis, experiment 2 showed anincrease in illusion magnitude for both 20 and 40◦ angles.
In this paper and in our previous study, we focused solelyon the ML illusion in its classical four-wing form. It wouldalso be possible to study other variants of the Müller-Lyer andother illusory figures to test more generally for the susceptibil-ity of hierarchical artificial neural networks. Some variants of theMüller-Lyer to be tested could include changing the fins to cir-cles (the “dumbbell” version) or ovals (the “spectacle” version)(Parker and Newbigging, 1963). Other monocular line length ordistance judgment illusions occurring within the visual ventralstream may also manifest in similar hierarchical architectures,for example, the Oppel-Kundt illusion (Oppel, 1854/1855; Kundt,1863).
Some illusions are moderated by the angle at which the stim-ulus is presented (de Lafuente and Ruiz, 2004). This raises thequestion whether illusory bias and uncertainty changes in classi-fying Müller-Lyer images that are presented diagonally, rotated bya number degrees to the left or to the right. Simple cells in HMAXconsist of linear oriented filters, and are present in multiple ori-entations. The max pooling operations combine input from theseand provide an output that is invariant to rotation. As a result, wewould predict no difference in results when processing versions ofthe Müller-Lyer illusion in HMAX rotated at any arbitrary angle.This prediction is also consistent with human studies. While a
number of illusions demonstrate an increase in magnitude whenpresented in a tilted condition, there is no difference in magnitudefor the MLI (Prinzmetal and Beck, 2001).
In our last study, we recruited a previous version of HMAXknown as FHLib, a Multi-scale Feature Hierarchy Library (Mutchand Lowe, 2008). In the current study, a more recent, GPU-basedversion of HMAX, known as CNS: Cortical Network Simulator(Mutch et al., 2010) was used. The main difference between thesearchitectures was a linear classifier replacing the SVM in the finallayer of the more recent code. The network setup between archi-tectures was identical: one image layer followed by four layers ofalternating S and C layers. Both had the same levels of inhibi-tion (50% of cells in S1 and C1). The image layer contained 10scales, each level 21/4 smaller than the previous. Compared toour previous study, we were able to replicate similar levels of biasdespite a change in the classifier, demonstrating that our resultis robust and dependent upon properties of the HMAX hierar-chical architecture, rather than the small differences between theimplementation of these two related models.
Reflecting upon the implication of our results for other mod-els, we would predict that those that have a similar hierarchicalarchitecture would exhibit similar trends. That is, compara-ble networks would demonstrate increased bias with decreasedprecision when categorizing MLI images with less variance.Considering models that only contain filtering operations (akinto layers of simple cells) we would observe an illusory effect thatmay also be exacerbated compared to those with more complexoperations, with low accuracy and precision. Examples of wouldinclude the model of Bertulis and Bulatov (2001).
The reduction of bias in computer vision systems has signif-icant ramifications for applications such as automated driving,flight control and landing, target detection and camera surveil-lance. Correct judgment of distances and object dimensions inthese systems could affect target accuracy and reduce the potentialfor crashes and errors. Our hypothesis that increasing positionalvariance in the stimuli would reduce the magnitude of illusorybias could be extended to include other forms of variance, such asimage rotation, articulation or deformation, hence examining thegenerality of this proposal. Furthermore, it would be informativeto test the generality of the results presented in this study in othercomputational models. If a general effect could be confirmed,then we would advise the implementation of many forms of inputvariance during training to improve their judgment capabilities,providing more accurate and precise information.
Our work not only has implications for the field of computerscience, but also for psychology. Computational models allowmanipulations of parameters that are impossible or impracticableto perform in human subjects, such as isolating the contributionsof different neural structures to the effect. Artificial architecturesallow us to make predictions about overall human performanceas well as how performance changes from layer to layer withinthe visual system. Considering that this model not only providesan overall system performance (C2 output), but also suppliesinformation at multiple levels of the architecture that correspondapproximately to identifiable neural substrates, it may be possi-ble to test the model’s predictions with neuroimaging data. Usingfunctional magnetic resonance imaging (fMRI), we could obtain
Frontiers in Computational Neuroscience www.frontiersin.org September 2014 | Volume 8 | Article 112 | 8
Zeman et al. Complex cells decrease Müller-Lyer illusion
blood-oxygen-level dependent (BOLD) signals at different levelsof the visual cortices of observers viewing the MLI compared toa control condition (using a similar method to that described byWeidner and Fink, 2007). Then by applying a classifier to thesesignals, we could map this information to changes in model biasand quantify how well the model matches human brain data. Thisforms a possible direction for future research.
FUNDINGAstrid Zeman is supported by a CSIRO Top-Up Scholarshipand the Australian Postgraduate Award (APA) provided bythe Australian Federal Government. Astrid Zeman is alsosupported by the Australian Research Council Centre ofExcellence for Cognition and its Disorders (CE110001021)http://www.ccd.edu.au.
ACKNOWLEDGMENTSWe thank Dr. Kiley Seymour and Dr. Jason Friedman fromthe Cognitive Science Department at Macquarie University(Dr. Friedman now at Tel Aviv University, Israel) for helpfuldiscussions. We thank Jim Mutch for making HMAX publiclyavailable via GNU General Public License. We would like to thankAssistant Professor Sennay Ghebreab from the Intelligent SystemsLab at the University of Amsterdam for valuable input and sug-gestions. Lastly, we thank the reviewers for their helpful feedback,particularly with suggestions that we have incorporated into ourdiscussion.
REFERENCESBertulis, A., and Bulatov, A. (2001). Distortions of length perception in human
vision. Biomedicine 1, 3–26.Brigell, M., and Uhlarik, J. (1979). The relational determination of length illusions
and length aftereffects. Perception 8, 187–197. doi: 10.1068/p080187Brown, H., and Friston, K. J. (2012). Free-energy and illusions: the cornsweet effect.
Front. Psychol. 3:43. doi: 10.3389/fpsyg.2012.00043Coren, S., and Porac, C. (1984). Structural and cognitive components in the
Müller-Lyer illusion assessed via cyclopean presentation. Percept. Psychophys.35, 313–318. doi: 10.3758/BF03206334
Corney, D., and Lotto, R. B. (2007). What are lightness illusions and why do we seethem? PLoS Comput. Biol. 3:e180. doi: 10.1371/journal.pcbi.0030180
de Lafuente, V., and Ruiz, O. (2004). The orientation dependence of theHermann grid illusion. Exp. Brain Res. 154, 255–260. doi: 10.1007/s00221-003-1700-5
Dewar, R. (1967). Stimulus determinants of the practice decrement of the Müller-Lyer illusion. Can. J. Psychol. 21, 504–520. doi: 10.1037/h0083002
Fellows, B. J. (1967). Reversal of the Müller-Lyer illusion with changes in the lengthof the inter-fins line. Q. J. Exp. Psychol. 19, 208–214. doi: 10.1080/14640746708400094
Ginsburg, A. (1978). Visual Information Processing Based on Spatial FiltersConstrained by Biological Data. Ph.D. thesis, Aerospace Medical ResearchLaboratory, Aerospace Medical Division, Air Force Systems Command,Cambridge.
Glazebrook, C. M., Dhillon, V. P., Keetch, K. M., Lyons, J., Amazeen, E., Weeks,D. J., et al. (2005). Perception–action and the Müller-Lyer illusion: ampli-tude or endpoint bias? Exp. Brain Res. 160, 71–78. doi: 10.1007/s00221-004-1986-y
Gregory, R. L. (1963). Distortion of visual space as inappropriate constancy scaling.Nature 199, 678–680. doi: 10.1038/199678a0
Howe, C. Q., and Purves, D. (2005). The Müller-Lyer illusion explained bythe statistics of image–source relationships. Proc. Natl. Acad. Sci. U.S.A. 102,1234–1239. doi: 10.1073/pnas.0409314102
Hubel, D. H., and Wiesel, T. N. (1959). Receptive fields of single neurones in thecat’s striate cortex. J. Physiol. 148, 574–591.
Kundt, A. (1863). Untersuchungen über Augenmaß und optische Täuschungen.Poggen-dorffs Annalen der Physik und Chemie 120, 118–158. doi:10.1002/andp.18631960909
Müller-Lyer, F. C. (1889). Optische Urteilstäuschungen. Archiv für Anatomie undPhysiologie 2, 263–270.
Müller-Lyer, F. C. (1896a). Über Kontrast und Konfluxion. (Zweiter Artikel).Zeitschrift für Psychologie und Physiologie der Sinnesorgane 10, 421–431.
Müller-Lyer, F. C. (1896b). Zur Lehre von den optischen Tauschungen überKontrast und Konfluxion. Zeitschrift für Psychologie und Physiologie derSinnesorgane 9, 1–16.
Mutch, J., Knoblich, U., and Poggio, T. (2010). Cns: A gpu-Based Frameworkfor Simulating Cortically-Organized Networks. Cambridge, MA: TechnicalReport MIT-CSAIL-TR-2010-013 / CBCL-286, Massachusetts Institute ofTechnology.
Mutch, J., and Lowe, D. G. (2008). Object class recognition and localization usingsparse features with limited receptive fields. Int. J. Comp. Vis. 80, 45–57. doi:10.1007/s11263-007-0118-0
Ogawa, T., Minohara, T., Kanaka, I., and Kosugi, Y. (1999). “A neural networkmodel for realizing geometric illusions based on acute-angled expansion,” in6th International Conference on Neural Information Processing (ICONIP ’99)Proceedings, Vol. 2 (Perth, WA: IEEE), 550–555.
Oppel, J. (1854/1855). Über geometrischoptische Täuschungen (Zweite Nachlese).Jahres-Bericht des Physikalischen Vereins zu Frankfurt am Main 37–47.
Parker, N. I., and Newbigging, P. L. (1963). Magnitude and decrement of theMuller-Lyer illusion as a function of pre-training. Can. J. Psychol 17, 134–140.doi: 10.1037/h0083262
Predebon, J. (1997). Decrement of the Brentano Müller-Lyer illusion as a functionof inspection time. Perception 27, 183–192. doi: 10.1068/p270183
Prinzmetal, W., and Beck, D. M. (2001). The tilt-constancy theory of visualillusions. J. Exp. Psychol. Hum. Percept. Perform. 27, 206–217. doi: 10.1037/0096-1523.27.1.206
Restle, F., and Decker, J. (1977). Size of the Mueller-Lyer illusion as a func-tion of its dimensions: theory and data. Percept. Psychophys. 21, 489–503. doi:10.3758/BF03198729
Segall, M. H., Campbell, D. T., and Herskovits, M. J. (1966). The Influence of Cultureon Visual Perception. New York, NY: The Bobbs-Merrill Company, Inc.
Serre, T., and Poggio, T. (2010). A neuromorphic approach to computer vision.Commun. ACM 53, 54–61. doi: 10.1145/1831407.1831425
Serre, T., Wolf, L., and Poggio, T. (2005). “Object recognition with featuresinspired by visual cortex,” in Proceedings of 2005 IEEE Computer SocietyConference on Computer Vision and Pattern Recognition (CVPR 2005) (SanDiego, CA: IEEE Computer Society Press), 886–893. doi: 10.1109/CVPR.2005.254
Weidner, R., Boers, F., Mathiak, K., Dammers, J., and Fink, G. R. (2010). The tem-poral dynamics of the Müller-Lyer illusion. Cereb. Cortex 20, 1586–1595. doi:10.1093/cercor/bhp217
Weidner, R., and Fink, G. R. (2007). The neural mechanisms underlying the Müller-Lyer illusion and its interaction with visuospatial judgments. Cereb. Cortex 17,878–884. doi: 10.1093/cercor/bhk042
Zeman, A., Obst, O., Brooks, K. R., and Rich, A. N. (2013). The Müller-Lyerillusion in a computational model of biological object recognition. PLoS ONE8:e56126. doi: 10.1371/journal.pone.0056126
Conflict of Interest Statement: The authors declare that the research was con-ducted in the absence of any commercial or financial relationships that could beconstrued as a potential conflict of interest.
Received: 15 May 2014; accepted: 29 August 2014; published online: 24 September2014.Citation: Zeman A, Obst O and Brooks KR (2014) Complex cells decrease errors for theMüller-Lyer illusion in a model of the visual ventral stream. Front. Comput. Neurosci.8:112. doi: 10.3389/fncom.2014.00112This article was submitted to the journal Frontiers in Computational Neuroscience.Copyright © 2014 Zeman, Obst and Brooks. This is an open-access article distributedunder the terms of the Creative Commons Attribution License (CC BY). The use, dis-tribution or reproduction in other forums is permitted, provided the original author(s)or licensor are credited and that the original publication in this journal is cited, inaccordance with accepted academic practice. No use, distribution or reproduction ispermitted which does not comply with these terms.
Frontiers in Computational Neuroscience www.frontiersin.org September 2014 | Volume 8 | Article 112 | 9