Complementarity in Training Practices Methodological Notes and Empirical Evidence for a Local...
21
Complementarity in Training Practices Methodological notes and empirical evidence for a local economic system in Emilia Romagna Giovanni Guidetti, Susanna Mancinelli, Massimiliano Mazzanti Abstract The paper develops a conceptual framework aimed at analysing the profitability to finance general training, grounding on the notion of complementarity among productive factors. First, we show that a simple application of theoretical analysis based on the lattice theory and the notion of supermodularity can provide a suitable framework to study complementarity relationships characterizing productive factors. Secondly, we discuss empirical evidence on complementarity between general and specific training with respect to firm productivity, exploiting a detailed and specifically constructed survey based dataset. Complementarity between training forms is thus tested in a discrete framework. We show that complementarity holds for most specifications, though the outcome might be dependant on other firm-related features and strategies. The multivariate analysis also shows, on the same model framework, that R&D and training expenditures are emerging as main explanatory drivers for productivity. Our results on training complementarity and productivity drivers indicates that complementarity related to training forms matters, but also that the mere training adoption is probably not sufficient: the level of training provided is positively correlated with firm productivity. JEL: D20; C60; J24. Keywords: General and specific training, human capital, super modularity, complementarity, firm productivity
-
Upload
independent -
Category
Documents
-
view
3 -
download
0
Transcript of Complementarity in Training Practices Methodological Notes and Empirical Evidence for a Local...

Complementarity in Training Practices Methodological notes and empirical evidence for a local economic system in Emilia Romagna
Giovanni Guidetti, Susanna Mancinelli, Massimiliano Mazzanti
Abstract
The paper develops a conceptual framework aimed at analysing the profitability to finance general training, grounding on the notion of complementarity among productive factors. First, we show that a simple application of theoretical analysis based on the lattice theory and the notion of supermodularity can provide a suitable framework to study complementarity relationships characterizing productive factors. Secondly, we discuss empirical evidence on complementarity between general and specific training with respect to firm productivity, exploiting a detailed and specifically constructed survey based dataset. Complementarity between training forms is thus tested in a discrete framework. We show that complementarity holds for most specifications, though the outcome might be dependant on other firm-related features and strategies. The multivariate analysis also shows, on the same model framework, that R&D and training expenditures are emerging as main explanatory drivers for productivity. Our results on training complementarity and productivity drivers indicates that complementarity related to training forms matters, but also that the mere training adoption is probably not sufficient: the level of training provided is positively correlated with firm productivity.
JEL: D20; C60; J24.
Keywords: General and specific training, human capital, super modularity, complementarity, firm productivity
1
0. Introduction
In his seminal contribution, Becker (1964) drew the crucial distinction between specific and general training
and analysed its consequences. Assuming perfect competition in both the labour and the product market,
perfect information and perfect mobility of productive factors, Becker showed that no employer is available
to fund training of employees for the acquisition of skills/ knowledge that affect positively employees’
productivity in the firm financing training, as well as in other comparable firms; namely no employer funds
general training. On the contrary, employer’s financing is available for specific training, namely the
acquisition of knowledge/skills that affect positively employees’ productivity solely in the firm providing the
financial means supporting this training programme. In the case of specific training the burden of financing
is sustained not only by the employer, but also by the employees benefiting from training support, who share
with the employer direct training expenses and opportunity costs.
Departing from Becker’s analysis, recent economic literature has shown that, if one abandons Becker’s
assumptions concerning perfect competition and information, the rationale for employers’ funding of
employees’ general training can emerge. In their extensive and thorough survey, Acemoglu and Pischke
(1999) analyse this strategy of research. This paper adopts a marginally different strategy, as it investigates
some features of production in firms. The basic idea is that the existence of complementary relationships
among productive inputs can justify the employer’s financing of general training. Especially, the paper
emphasises the complementarity relationship, which can be established between specific and general
training.
If the assumption of complementarity among general and specific training is reasonable, we do not need
many other technical hypothesis, since from that assumption relevant results directly follow. Quoting
Milgrom and Roberts, ''Once the reasonableness of the complementarity hypothesis is verified one hardly
needs to write down a fully specified mathematical model. […] certain kinds of conclusions follow directly
from the complementarity structure , without further technical assumptions'' (Milgrom, Roberts, 1995, p.
200). In their model, relying on complementary assumptions, the profit function is supermodular in 12
variables, and by this property they show that whatever change in one of the 12 variables will induce a
systematic response in all the other 11 variables. What the theory does is just to establish ''the
complementarity assumptions that are sufficient to imply the stated conclusions'' (Milgrom, Roberts, 1995, p.
199).
Hence, what we still need is to empirically verify how realistic is the assumption of complementarity among
general and specific training.
Our aim is twofold. First, we introduce a methodological framework useful to empirically test
complementarity among the two forms of training, keeping in mind that data about firms training practices,
whether specific or general, are available and usually are discrete variables. Secondly, we consequently
present empirical evidence on training forms complementarity with respect to firm productivity, exploiting
detailed and specific survey based data. Complementarity between general and specific training adoption is
tested in a discrete framework. As a side outcome, we also investigate what the main drivers of average firm
2
productivity are on the basis of the same empirical model we use for assessing complementarity in training
of firms. The value added of the paper relies on the integration of the two level of analysis.
The paper is organized as follows. The first section of the paper introduces the analysis of complementarity
among productive factors recently developed, and analyses the consequences of complementarity in the
process of skill development in firms. Particularly, this section stresses the relevance of general training in
the development of specific assets and provides a preliminary discussion about problems to deal with in
empirical analysis when classifying and measuring training practices. In section two, a methodological
framework is presented, wherein the complementarity among general and specific training is analysed
through the supermodularity of firms productivity function. Section three presents the survey based dataset,
the analysis on complementarity between training forms and concludes with an assessment of productivity
drivers. The last section concludes the paper by summarising results and offering insights for further
research.
1. Complementarities in production
1.1 Complementarity and skills
Milgrom and Roberts (1990, 1995) have developed a formal model that refines Edgeworth’s approach to
complementarity among productive factors. In their contributions they never define a specific unit of
analysis. They refer to either characteristic features of production (Milgrom and Roberts, 1995) or to
“elements of the firm’s strategy” (Milgrom and Roberts, 1990, p. 513) or in a broader sense to “groups of
activities” (Milgrom and Roberts, 1990, p. 514).
Complementarity among inputs entails that the return of a single skill does not only depend on the skill itself,
but also on other skills and inputs. For this reason it is useful to introduce the distinction between skills
acquired and skills used. The former refer to the content of education, training and, in general, to the
knowledge content transmitted to the employee. Skills acquired account for the stock of knowledge and
previous working experience of an employee, definable regardless of the specific productive context in
which she operates. Acquisition of skills occurs through both formal (formal education, training) and
informal procedures of transmission. On the other hand, skills used refer to those skills actually used by
employees in their working activities and define the set of tasks to perform. Skills used cannot be specified
outside a well-defined productive context and their development can occur through some kind of formal and
informal training.
Skills acquired and used result from a complex process of learning in which the specification of
complementary relationships between both types of skills and the other inputs play a pivotal role. From an
endowment of skills acquired, one can develop a set of skills used through the establishment of
complementary relationships among this bundle of skills and the other productive inputs. These relationships
convert skills acquired into skills used. However, these learning mechanisms also work in the opposite
direction. In other words, after a series of skills acquired has developed into skills used, the process of

3
conversion can continue in reverse and proceed towards the acquisition of new skills and the consequent
growth and sedimentation of the endowment of skills acquired.
This relationship between skills used and skills acquired implies that the effect on skills of specific and
general training is different. As far as general training is concerned, it affects directly the endowment of
skills acquired. As to skills used the story is different. Actually, the effect of general training on skills used
depends on the complementary relationship with the other inputs. As mentioned in the previous paragraph,
these relationships among inputs set, through the aforementioned process of conversion, the return of skills
acquired. If general training favours the setting up of new complementary relationships with other productive
inputs or improves the working of these relationships, this implies that the range of skills used has widened,
resulting into a higher level of employees’ productivity. Accordingly, if general training affects
complementary relationships, positive effects can be observed on the productivity of other inputs, as well;
i.e.: provision of general training may affect positively not only the productivity of the trained employed, but
also the productivity of other employees.
As far as specific training is concerned, it affects the structure of the complementary relationships and,
hence, the establishment and the working of links among inputs. For the same reasons as for general training,
the observed effects may be positive on diverse inputs, as well as the employee trained.
1.2. Skills and asset specificity
The distinction between general and specific training has to be analysed in comparison with the notion of
asset specificity. In Becker’s analytical framework, general training does not develop any specific asset and
therefore the newly developed skills can be used in any workplace. Asset specificity stems from specific
training only, giving rise to the opportunity for the employer to exploit an economic rent.
In the framework of analysis developed in this paper, things are different. Indeed, even though general
training improves employees’ productivity in any firm, training, favouring the establishment of new
complementarity relationships, can also widen the range of skills used. The degree of asset specificity of the
skills used increases, making the trainees’ productivity firm specific. As a matter of fact, even though
training can be general, its return, measured by increases in employee’s and other factors’ productivity,
depends on the complementarity relationships developed within the firm and, as such, is always firm
specific. As a consequence of that, the development of specific assets through training does not depend on
the nature of training, but on the cobweb of complementary relationships among inputs implemented in the
organisation of production. Therefore, general training can develop specific assets.
Training is not provided, if it does not promote asset specificity. The key turning-point issue is not the degree
of specificity of training, but the framework of the complementarity relationships among productive inputs,
stemming from the process of conversion of skills acquired into skills used. In a sense, general training, in
the Becker’s meaning of promotion of general assets, cannot be easily accommodated in this framework of
analysis. It can be conceived as a very special case in which training is irrelevant with respect to production
and does not affect productivity of inputs, at all. This can occur either because the content of training has no
4
connections with inputs and production1, or if, as a consequence of training, the firm does not promote the
establishment and the strengthening of complementarity relationships among inputs 2.
This analysis of training, learning and skill development raises two crucial consequences. Firstly, general
training affects productivity in the firm where the employee is currently employed (internal productivity) and
productivity as perceived by employers in the external labour market (external productivity) in a different
way. Divergence between internal and external productivity favours the setting up of internal labour markets,
as they insulate the employers financing training from the underbidding of other employers. Secondly, the
focus of the analysis shifts from the distinction between general and specific training to the analysis of
complementary relationships among inputs. If general training can develop specific assets, this occurs
through the interaction of this kind of training with other inputs. General training practices fit with other
inputs and their interactions favour the process of skill development described in the previous paragraphs.
Especially, as far as training practices are concerned, that means that general training has always to be
analysed jointly with other training practices in order to understand its impact on the firm’s productivity. It is
useful to emphasize that the effect of general training is not limited to individual productivity but spreads,
due to the complementarity relationship among productive inputs.
Of course, that does not mean that employers are always available to finance general training. However, the
distinction between skills acquired and used provides the rationale to understand the potential arising of a
positive level of employer’s rent, even when general training is provided and no special assumption about the
level of wages is made as in Acemoglu and Pischke’s (1999) analysis.
It is important to highlight that the establishment of complementarity relationships is an inherently dynamic
process, whose duration depends on the complexity of the architecture of complementarity. Of course, the
longer the process, the more unpredictable and costly the process is and, hence, the more problematic its
evaluation and the sharing of costs between the employees and the employer.
1.3 General and specific training: some definitions
In the real world, it is not simple to separate specific training from general one, because a non-arbitrary
procedure of measurement of the degree of specificity/generality of training cannot be defined. It seems that
the two polar cases, “pure” general and specific training, cannot be easily observed and defined. Of course,
there are different degrees of generality/specificity, so that one can say that a dominant nature can be pointed
out. In informal training practices such as apprenticeship or task rotation, the specific component prevails.
On the other hand, in formal practices such as off-the-job training the general component can exceed the
specific one. However, the dichotomies formal/informal and on-the-job/off-the-job do not overlap that
between general and specific.
As an example, we can consider a firm operating in the advertising sector. This firm can choose to organize
(or not to organize) a course in word processing. This choice involves general training, since it can be
conceived out of a productive context. Specific training is more complex. From the one hand, it may be 1 A bridge course for an electronic engineer. 2 A course of word processing in a firm that has no computer.

5
intended in a widest meaning of sector specific, rather than firm specific, (Acemoglu, Pischke, 1999). On the
other hand, specificity of training arises when complementarity relationships are set up by the interaction of
general skills with other inputs such as other skills, organisational practices (HPWO). In the first case
specificity refers to the sector, whereas in the second case, it is based on firm’s characteristics. For instance,
the choice to train (or not to train) the aforementioned employees in the use of a sophisticated graphic
program can be considered as an example of this sector-based specificity. In the second case, the degree of
specificity does not depend on the content of the training program, as much as on the match between the
newly acquired skills and other productive inputs. We discuss in paragraph 3.2, how we have tried to solve
these problems in empirical analysis.
2. Testing complementarity between general ad specific training
In the analysis set out in the previous section complementarity among general and specific training inside a
firm seems to be a reasonable hypothesis, that is doing more of general training can raise the return to doing
more of specific training.
Since both general and specific training are generally discrete choice variables of the firm, we study
complementarity between these two forms of training, through the properties of supermodular functions.
Following Topkis (1995, 1998), Milgrom, Shannon (1994), Milgrom, Roberts (1990, 1995), we say that a set
of variables nRXx ⊆∈ is complementary if a real-valued function )(xF on a sublattice nRX ⊆ is
supermodular in its arguments3.
Going into details, we define a sublattice ),( ≥X as a set ,X with a partial order ,≥ such that for any
Xxx ∈′′′, the set X also contains a smallest element under the order that is larger than both x′ and x ′′ and
a largest element under the order that is smaller than both x′ and .x ′′ Let xx ′′∨′ denote the smallest
element that is larger than both x′ and x ′′ , and let xx ′′∧′ denote the largest element that is smaller than
both x′ and .x ′′ In the n-dimensional Euclidean space, nR , xx ′′∨′ and xx ′′∧′ , are:
{ } { }( )nn xxxxxx ′′′′′′=′′∨′ ,max,...,,max 11 , and { } { }( )nn xxxxxx ′′′′′′=′′∧′ ,min,...,,min 11
A real-valued function F on a sublattice X is supermodular in its arguments, if and only if:
)()()()( xFxFxxFxxF ′′+′≥′′∧′+′′∨′ ., Xxx ∈′′′∀ )1(
Or, written in a different way:
)()()()( xxFxFxFxxF ′′∧′−′′≥′−′′∨′ ,, Xxx ∈′′′∀ )2(
that is, the change in F from x′ (or x ′′ ) to the maximum )( xx ′′∨′ is bigger than the change in F from the
minimum xx ′′∧′ to x ′′ (or x′ ): having more of one variable increases the returns to having more of the
other4.
3“The implications of supermodularity do not depend on the usual kinds of specialized assumptions […]. For example, we do not need any divisibility or concavity assumptions, so increasing returns are easily encompassed” (Milgrom and Roberts, 1995, p. 184) 4From equations (1) and (2) it is evident that complementarity is symmetric: having more of x’ increases the returns to having more of x’’, as well as having more of x’’ increases the returns to having more of x’.

6
In our case, if general and specific training are complementary, firm’s objective function must be super
modular in these two variables.
In the specific, we consider firm’s average productivity function )( jAP as the objective function and we
focus on just two of the many decisions that can affect firm’s productivity function: general and specific
training:
)3( ),,( jsgjj ttAPAP θ= .j∀
The problem of firm j is to choose a set of policies for specific and general training, 2),( RTtt sg ⊆∈ , which
maximizes its average productivity function. jθ represents firm’s exogenous parameters. Actually, a firm
operates in an environment which is characterized by exogenous parameters (such as product market) and
one can be interested in how different values of the parameter θ may imply different instances of the firm’s
decision problem, and hence different firm’s optimal choices and average productivity.
Complementarity between general and specific training may be analysed testing whether ),,( jsgj ttAP θ is
supermodular in gt and in st .
The maximization problem is the same for all the firms, but, since each firm is characterized by specific
exogenous parameters ),( jθ the AP function may result supermodular in gt and st for some firms, but not
for others.
Our aim is to derive a set of inequalities (as those explicated in equations )1( and ))2( , that can be used in
empirical tests, to verify whether these inequalities are accepted by the data and, hence, whether
complementarities among general and specific training is empirically confirmed, or in which specific
circumstances (firm-specific exogenous parameters) complementarity holds.
Since in our case the objective function of each firm is the average productivity function, firm j’s AP
function on the sublattice T is supermodular in gt and st ( gt and st are complements) if and only if, for
any :, Ttt sg ∈
)4( ),,(),(),(),( jsjjgjjsgjjsgj tAPtAPttAPttAP θθθθ +≥∧+∨
or:
)5( ),,(),(),(),( jsgjjgjjsjjsgj ttAPtAPtAPttAP θθθθ ∧−≥−∨
that is doing more of gt increases the returns to doing more of st .
We can consider each of the two choices about general and specific training as binary decision variables. So,
going back to example made in paragraph 3.1, if a firm chooses to organize neither the course in word
processing, nor the training in the graphic program, we have ;0,0 == sg tt in this case the element of the set
T is { }.00=∧ sg tt If a firm chooses to organize both the course in word processing and the training in the
graphic program, we have 1,1 == sg tt , and the element of the set T is { }11=∨ sg tt . Including also the
mixed cases, we have four elements in { } { } { } { }{ }11,10,01,00=T .
7
From equations )4( and )5( we can assert that gt and st are complements and hence that the function
jAP is supermodular, if and only if:
)6( ),,01(),10(),00(),11( jjjjjjjj APAPAPAP θθθθ +≥+
or:
)7( ),,00(),10(),01(),11( jjjjjjjj APAPAPAP θθθθ −≥−
that is, increasing one of the two forms of training (for instance gt ) increases the average productivity in a
wider way if also the other form of training increases. Actually, the increases in AP due to an increase of gt
from { }00 to { }10 are less (or at least equal) to the increases in AP due to increases of both gt and st from
{ }01 to { }11 .
Summing up, complementarity among the two decision variables ( gt and st ) exists if the jAP function is
shown to be supermodular in these two variables and this happens when either inequality )6( or inequality
)7( is satisfied5.
3. Empirical evidence
3.1 The data
The applied analysis is based on a dataset stemming from a comprehensive study concerning a Province of
the Emilia Romagna Region, in Northern Italy. We decided to conduct our analysis at firm level rather than
industry level in order to possess detailed micro information on firm strategy and behaviour. We are aware
that the choice between firm/industry focus is associated to a trade off: pros and cons are to be carefully
valuated case by case.6 We support the perspective that micro-data at firm level are necessary for the kind of
theoretical and applied analyses we deal with. Surveys are therefore the only way to pursue such research
direction. We exploit information, deriving from two consequential surveys on the same sample of firms,
carried out in 2003 and 2005, with the aim of collecting detailed and extensive data at firm level, usually
quite rare, regarding training, innovation and other high performance practices.
Surveys have been conducted on industrial and market-service firms with at least 20 employees and
establishments in the Province, thus excluding agriculture and public administration. We initially identified
436 firms, which were disaggregated by sectors (metalwork, market services and other industries: textile-
wearing articles, food products, chemical products, engineering and energy) and size (20-49, 50-99 and more
than 99 employees, corresponding to small, medium and “large size” firms). Building on those 436 firms (the
universe), a random sample of 250 firms was selected (57% of the universe).
5 Since complementarity is symmetric, when the binary decision variables are two, the relevant inequality is one: either (6), or (7), or any other inequality deriving from one of them. For instance, in the empirical analysis below will be tested the inequality 0),01(),10(),00(),11( ≥−−+ jjjjjjjj APAPAPAP θθθθ . 6See Dearden et al. (2005, p.10-11) for an assessment of pros and cons.
8
A first wave of data was collected during 2003 by direct interviews to managers of human resources at the
central offices of the firm7. We ended up with 243 filled questionnaires. Data concerning specific and general
training activities derive from this survey, which specifically elicited information on issues like training,
labour demand, workers skills, over the period 2000-2002. A second consequential survey was carried out in
may 2005, administering by telephone a shorter but focused questionnaire, which elicited information on
performance trends (productivity, profit, turnover, employment) over two periods (2000-2002 and 2003-
2004), high-performance practices, training efforts (coverage, expenses), R&D and technological innovation,
ICT dynamics. Most of those data are elicited over 2000-2004, either as trends (i.e. adoption of some
typology of innovations over the period) or as annual mean values (i.e. R&D and training expenses). We
addressed the same 243 firms, which joined the first survey: after dropping firms which closed down and
other which refused to be interview, we ended up with 147 firms. This is the number of firms forming our
integrated final dataset. The sample is highly representative of the population.
Merging the two surveys, we may in fact integrate different types of information on training, performances
and innovation practices. This was the main reason of the consequential effort. Moreover, from a statistical
perspective, we may use lagged information (associated to the 2003 survey) to “explain” performances over
the period 2003-2004. Although this does not allow the construction of a proper panel setting8, we mitigate
the usual problem of assessing the causal direction between training and performance in cross section
environments (reverse causality9).
3.2 General and specific training: data sources and definitions in empirical analysis
It is worth discussing few details about the definition and the measurement of general and specific training.
In fact, official sources do not exist and the need to rely on firm surveys is unavoidable. The first survey
conducted in 2002 was directly administered to firms and it devoted to investigating workforce features
(skills, tenure, competencies), firm training investments and labour demand characteristics. We derive the
variables regarding general and specific training from two specific questions devoted to elicit the degree of
generality of training provided. The first question concerns the adoption of two informal forms of training,
i.e.: apprenticeships and task rotation. The second question concerns the nature of formal training provided
by the firm. Formal training has been classified into two different categories: specific formal training and
general formal training. The degree of specificity depends on trainees; the more training is focused to
specific occupational groups, the higher the degree of specificity. Besides, one assumes that
specificity/generality is positively/negatively affected by the nature of the training provider; an external
7Interviewees were firm managers and human resources managers. Surveys were directly conducted at firm establishments by specialised interviewers, who administered detailed structured questionnaires of around 30 pages. 8 We note that proper panel settings at firm level which concern dynamics like innovations, training and high performance practices are rare since very difficult to construct even from ad hoc surveys, given the “slow-evolving” and “trend-related” nature of most of those firm-related variables. Even national official surveys tend to have difficulties in eliciting proper panel datasets (see for example Zwick, 2002, for Germany). 9 “Although a positive correlation is generally found, it is very difficult to interpret because the training measures are only measured at a single point in time and could be picking up many unobservable firm specific factors correlated with both training and productivity” (Dearden et al., 2005, p.3)
9
provider is presumed to provide more general training than an internal trainer such as a senior employee or
personnel in charge of the development of the employees’ skills. Accordingly, training activities devoted to
specific occupational groups or managed internally by the firm have been classified as specific, whereas
training activities devoted to all the employees or managed by an external organization have been classified
as general training.
The construction of a synthetic indicator of the nature and the amount of training practised in the firm would
not be easily to conceive, either because the proper data could not be easily available or because it would
require the introduction of arbitrary assumptions for the specification of the nature of training. A reliable and
unbiased measurement of training might as well require data on single employees, which can be hardly
available or, when measured, can contain a high margin of error. In fact, a measurement of training practices
should take account of both the percentage of employees involved in training practices and the time devoted
to these practices. Hence, it would make sense to consider the provision of training as a dummy variable,
without intending to measure its intensity. Even though this procedure can appear exceedingly clear-cut, it is
one of the first attempts in the economic literature to provide a cardinal measure of the nature of training.
Conclusively, training has been classified as specific when it included one or more of the following
activities: apprenticeship, job rotation and/or specific off-the-job training. On the other hand, training has
been classified as general when general off-the-job training activities, i.e.: training provided by an external
institution or to all the employees, were arranged (see 3.3.1 for relative shares of general/specific training
adoption following our classification).
3.3. Empirical analysis
The empirical analysis has the primary aim of testing the complementarity nexus between specific and
general training forms, in order to assess whether the productivity function is super modular in these two
arguments. We exploit information, as said, deriving from two consequential surveys on the same sample of
firms. We use original data10 on specific and general training efforts, re-elaborated as explained above (par.
3.2).
Then, we also want to assess the significance of high performance practices, technological innovations and
other drivers of productivity, thus extending the core analysis revolving around complementarity tests11.
10 A trade off exists between the collection of specific and original data in case study surveys and the often rough measure of training collected in large longitudinal official surveys. Dearden et al (2005) provide an example. They exploit official survey data on training to measure the impact on productivity levels. Though the analysis is robust and brilliant, we note that (i) their measure of training rely on a question which asked workers whether they had received “any education or training over the past 4 weeks”; this is a quite rough measure. Then, (ii) they set up a dataset based at industry level, in order to use long time series of training and productivity. They observe that the only publicly available firm-level panel data in the UK is a sample of 119 firms with basic training information. This confirms the absolute need, if we aim at studying firm behaviour in details, to exploit information deriving from direct survey conducted on the field, where we may set up the questionnaire frame along our research needs. 11 We note that a simple regression analysis cannot ascertain the complementarity between the dependant variable and the drivers (i.e. Training and Innovation), as presented by some authors (Baldwin and Johnson, 1995). Complementarity is assessed focusing on the nexus characterising various drivers with respect to a defined performance index (innovation, productivity, profit). See Galia and Legros (2004a,b) and Mohnen and Roller (2005) for a detailed presentation of various complementarity tests at empirical level.

10
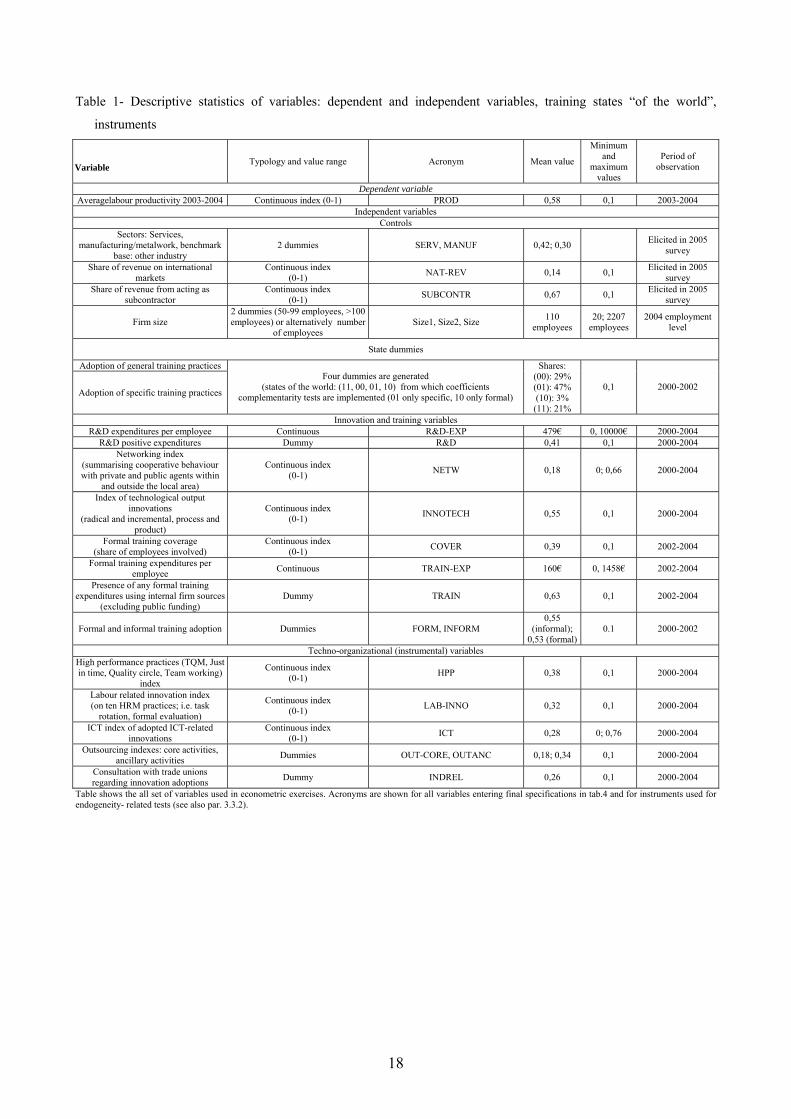
The reader may refer to tab.1 for a synthetic description of all variables used in the paper: dependant
variable, training states of the world (see also above), controls and independent variables exploited in thee
econometric exercise.
We use labour productivity indicators for 2003-2004 as dependant variable in all regressions, in order to
mitigate typical endogeneity problems encountered in cross section studies. Actually, the two surveys were
motivated both by the need to integrate different information regarding the same firms and, not less
important, to originate a temporal lag between dependant (productivity) and independent variables (from the
two surveys).
3.3.1 Testing complementarity between general and specific training
We specify regressions entering the four dummies associated to the potential states of the world: 00 (no
training provided at all), 10 (only general training provided), 01 (only specific training provided), 11 (two
forms jointly provided), where one, as said, means presence and zero the absence of the training productivity
input in a specific firm. Descriptively speaking, 29% of firms do not provide any training, 47% only specific
forms, as here defined; 3% provide only general training and finally 21% provide both forms. Thus,
“complementary” states represent half of firms.
From a statistical perspective, each state of the world, in terms of general/specific training, is included in the
productivity regression as a sort of dummy. Such dummies are like constants; the model is thus a “without
constant” specification, instrumental to estimate the set of parameters for carrying out the test. We need to
include all state dummies in order to recover the full estimates of coefficients and variance / covariances.
Going directly to the definition, we may recall from the theoretical section that complementarity hold if and
only if [b1+b2-b3-b4≥0] . Empirically speaking, b1 and b2 are the estimated parameter linked to
“complementarities states” (i.e. (00), (11)), while b3 and b4 are associated to other states ((10), (01)). The
reasoning revolving around couples of input drivers (bivariate analysis) leads to a statistical framework
where the complementarity’s hypothesis is the one expressed above. A one sided t test is thus applicable and
sufficient for the present investigation in order to assess the degree of complementarity12. The null
hypothesis is the complementarity state under a non strict inequality (≥0)13; we thus test complementarity in
12 We note that one-tailed tests make it easier to reject the null hypothesis when the alternative is true. A large sample, two-sided, 0.05 level t test needs a t statistic higher than 1.96 (in absolute values) to reject the null hypothesis of no difference in means. A one-sided test rejects the hypothesis for values of t higher/lower than (+,-) 1.645. Therefore, a one-sided test is more likely to reject the null hypothesis when the difference is in the expected direction. As far as complementarity tests are concerned, in the present case it is worth noting that the choice of the null is relevant not for the final interpretation of the test statistic arising from the estimated coefficient, which is obviously the same under different null hypothesis. Nevertheless, we may set the null as (b1+b2-b3-b4 ≥0): in this case the rejection of the null is the result (we remind that it is not correct, though common, to affirm that the null has been “accepted”) in favour of (non strict) complementarity. If the value of the test is, say, higher than 1.645 we may observe that strict complementarity holds. The null would be, in this “second” case, (b1+b2-b3-b4 ≤0): rejection implies strict complementarity. 13 More specifically, in this case we have three possible outcomes: if the null is not rejected the hypothesis of complementarity holds in the ≥0 form, which is consistent with the theory. A value higher than 1.645 on the positive sign will lead to a strict complementarity assessment (b1+b2-b3-b4 >0), while a negative value lower than the defined threshold (e.g. 1,645, or a 5% tail, within the one tail framework) will lead to a rejection of the null.

11
a non strict framework. Only if a negative value is observed below the defined threshold (e.g. 5%, 1%) we
may conclude and reject the null at the specified significance level.
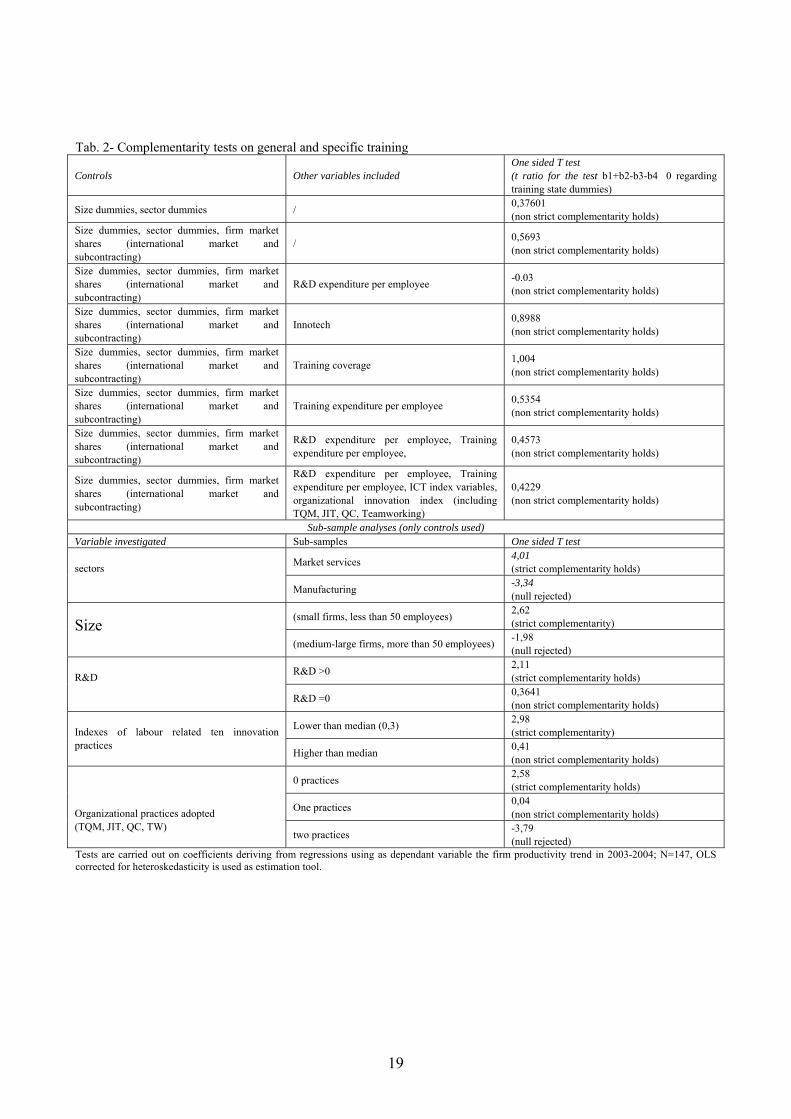
We here sum up main results (see tab.2). First, considering regressions including the four states and control
variables only (base specification), we note that complementarity holds across various specifications; the
outcome is not sensitive to the number and type of controls introduced (the t ratio of the one sided test range
across different specifications with controls only between 0,37 and 0,56).
Secondly, adding other covariates to the base regression, this result is robustly confirmed14. The inclusion of
other explanatory variables (high performance practise, R&D, organisational innovation index, technological
innovation actors, ICT factors) does not lead to a rejection of the null in any case. It is worth noting that,
when we include the dummy variable “adoption of technological innovation”, the t test raises to barely 0,90.
Complementarity holds since the null hypothesis [b1+b2-b3-b4�0] is not rejected by data across
specifications15. The assessment of the hypothesis for different specifications is aimed at verifying the
dependence of the result on relevant potentially omitted factors. In fact, the test statistics varies in association
with the inclusion of other covariates, though in our case this variation does not lead to a rejection of the
null.
Finally, we attempted to disaggregate the sample of firms by size and other critical variables in order to
assess whether sub-sample analyses lead to different results. We find some different results, some counter
intuitive.
When splitting the sample by size, we observe that complementarity holds, even in a stricter sense, for
smaller firms (t=2,62), while the null is rejected for medium-large firms (t=-1,98).
Splitting by sectors, we find strict complementarity for market services (t=4,01) and a rejection of the
complementarity hypothesis for metalwork/manufacturing firms (t=-3.34). Turning attention to innovation
dynamics, the analysis by R&D confirms the hypothesis for both samples: but firms with positive R&D
would pass a strict complementarity test (t=2,11). As a final attempt, various splitting of the sample by the
number of organisational practices show that, for firms adopting more than two high performance practices
(just in time, team working, TQM, quality circle) the null is rejected (t=-3,79). Using the number of
organisational practices linked to human resource management (i.e. job rotation, worker evaluation, etc..),
various splits of the dataset tend to confirm the null, though the t ratio of the test is higher for firms
associated to fewer practices.
The econometric analysis on sub-sample may be nevertheless less robust, since relies on fewer observations.
Differently from the addition of covariates, the sub sample analysis leads to a more significant variation in
test statistics for the complementarity hypothesis. Some results might appear as counterintuitive.
14 For example, Dearden et al (2005), in their analysis of firm level data, note that the training coefficients may be affected (reduced) by the addition of other variables, even sector dummies. Thus, robustness of results in base specifications must be always validated by the addition of potentially covariates, even in a model which is instrumental to the complementary test. 15 This paper focuses on a bivariate analysis circumscribed to general and specific training, taking other firm innovative strategies and firm features as given (the θj exogenous parameter described in the theoretical section). See Galia and Legris (2004a) for an analysis on complementarity using four organisational drivers, including a (rough) proxy of training.
12
Summing up, data shows that complementarity holds, though non strictly, in the overall sample, while strict
complementarity but also substitutability cases emerge when the sample of firms is split by primary
innovative and firm structural variables. Thus, further research is encouraged along this line.
3.3.2 The drivers of productivity
Extending the reasoning to the analysis of explanatory variables other than general and specific training, we
analyse the significance of other potential productivity drivers, taken from the realms of techno-
organizational practices, other training efforts, firm innovative strategies, etc...16. We investigate their effects
maintaining a model specification with the four state dummies at the place of a usual constant term, in order
to implement the econometric exercise on the frame used for testing complementarity. Since we have shown
that complementarity, in its non strict sense, holds independently of other explanatory variables included, the
econometric exercise analyse drivers holding fixed the (latent) outcome regarding complementarity between
general and specific training. Obviously, results are not affected by this specification choice regarding the
constant term.
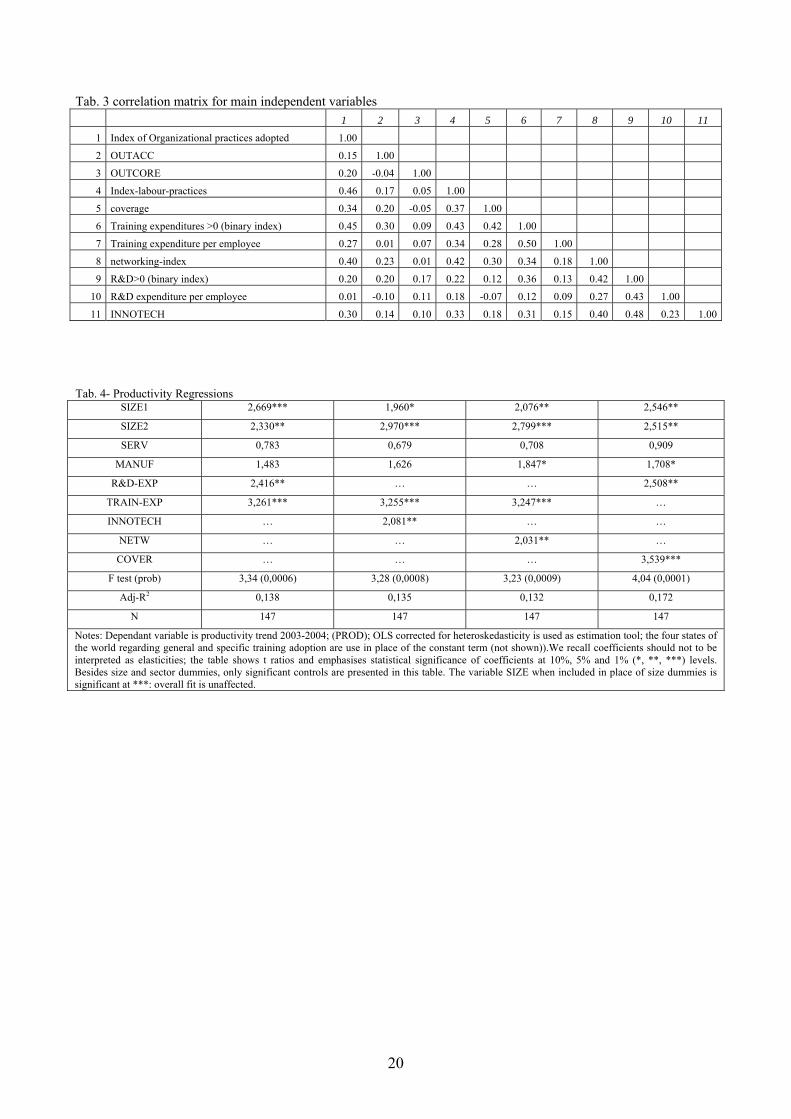
The picture we observe is the following17. As far as structural factors used as main controls are concerned, a
clear size effect emerges. Size is a crucial and confirmed explanatory factor. Then, productivity is also
correlated to metalwork manufacturing firms, although statistically less significant across specifications, and
not to market service firms, also confirming an expected result (though the sign of the correlation is
positive).
Focusing on main productivity drivers, expenditures per employee in R&D and in formal training by firms
emerge both significant factors, impacting on productivity with the expected positive sign. This is in line
with other evidence on Sweden and France: R&D and training exert significant effects on productivity which
may be partially country specific; nevertheless, no evidence is found in favour of positive interactions
between these two forms of capital (Ballot et al., 2001)18. Instead, when using dummies as proxies of the
mere presence of R&D and formal training, the correlation with productivity is not statistically significant.
The interpretation is that, for our firms, the intensity of R&D and training expenses matter more than the
mere existence of such investments. Further, the training coverage variable, when included separately, is
associated to a positive significant coefficient. This shows that intensity, in terms of expenses and coverage
efforts by firms, matters more than presence of training, captured by dummy variables. This is true for both
dummies capturing the adoption of formal and informal training activities (elicited in the 2003 survey) and
for the dummy linked to positive expenses in formal training (2005 survey). 16 Tab. 3 presents the correlation matrix for main relevant independent variables potentially impacting on productivity. It shows that innovative dynamics are generally correlated to each other, and that R&D, networking and technological innovation are particularly correlated, as expected. Explanatory factors which are highly correlated are consequently included separately in regressions. 17 Since we posses an extended vector of potential drivers, we test their significance incrementally adding set of drivers (realm of technology, realm of ICT, realm of organisational innovation) to the base specification, instead of adopting a “general from particular” selection procedure.
18 Other correlated evidence is provided by Cassidy et al (2005), who find that the relationship between R&D / training and productivity is significant for national firms but not for multinational (located in Ireland, the case study), which may tend to undertake most investments in home countries.
13
This result is not extensively comparable to other studies, given the high heterogeneity in the literature
concerning the proxies authors use, both for training and other dependant and independent variables,
descending from the survey based data of most studies. Nevertheless, our outcomes are very similar to those
obtained by Zwick (2002) who analyses a recent dataset (1997-2000), focusing on the effect of various
training indexes (in 1997) on productivity levels in 1998 and 1999. He finds that training intensity (training
coverage) has a positive and significant effect on productivity. Formal internal and external training exerts
also a positive but overall lower in significance effect. Then, training on the job presents a negative effect,
and other training-organisational practices (seminars, talks, quality circles) do not arise as significant direct
drivers. The picture is mixed in evidence but points to stronger effects concerning intensity of training.
We are aware that endogeneity may affect data when using R&D and formal training per employee, elicited
as annual trend values over 2002-2004, as covariates for explaining productivity. We thus estimate
regressions for R&D and training expenses in order to recover predicted values/residuals and consequently
carry out regression based tests for endogeneity19.
We use our index related to organisational innovations, high-performance practices and workforce features
(i.e. tenure, stock of short term employees, skill level) as instruments for training, in addition to basic
structural controls, while we exploit the networking index, the ICT composite20 index and the high-
performance practice index as instruments for R&D. It is worth noting that the former (first stage)
regression, specifying training expenses as dependant variable, shows that size, international market turnover
share, workforce skill level and the two indexes of high performance practices and organisational
innovations are all firm specific elements which are positively and significantly correlated with training. This
is a result not central in our paper but that adds evidence on the drivers of training, in terms of expenditures
per employee21.
The regression for R&D instead shows in addition the potential role of networking as driver of R&D
intensity in firms (this is scope for further applied research). On those grounds, endogeneity is tested by a t
test on the coefficient of such obtained fitted values in the second stage heteroskedastic robust regression: for
training, the t test shows that the null hypothesis of exogeneity is not rejected by data (we observe a very low
t ratio for the predicted value coefficient). As far as R&D is concerned, the same outcome emerges22.
To conclude the analysis on drivers, we add further possible omitted explanatory factors of productivity,
following the aforementioned incremental procedure.
19 See Wooldridge (2002). He notes that the first stage regression producing the fitted values must contain both all instruments for x and all exogenous variables then included in the second stage regression, along with x and its predicted values or eventually first stage residuals. 20 The choice over the set of instruments is driven by the low correlation between ICT, organisational innovation, high-performance practices and workforce characteristics with respect to productivity. Most of those elements are instead related to training and R&D. In our case, thus, ICT and organisational innovations seem not to directly affect firm performances, but indirectly, through a correlation with other drivers. 21 This result is usually confirmed in the empirical literature focusing on training. See the good survey in Zwick (2002) and the results found by Guidetti and Mazzanti (2005, 2006), who study training drivers at firm level in local production systems.
22 Exogeneity is not rejected using both predicted and residuals in the second stage regression. Then, it is confirmed for both productivity and overall performance 2003-2004 levels (including also profitability, turnover, and investments).
14
We observe that other significant factors impacting on productivity trends are (i) the dummy capturing
whether firms have adopted technological innovations over 2000-2005 and (ii) the index of networking
activities in the realm of innovation activities23. Given the correlation with R&D, in those cases we omit the
R&D covariate. Also, and interestingly, (iii) the dummies associated to the outsourcing of accessory and core
activities show respectively a positive and a negative, plausible, sign of the coefficients.
In a multi-variate setting, instead, ICT dynamics, high performance practices, like TQM, QC, JIT, and
organisational innovations do not directly exert significant impact on 2003-2004 productivity trend24. A
similar result, associated to mixed evidence concerning the direct relationship between ICT and productivity,
while a strong evidence in support of positive correlation between ICT and training, R&D, organizational
innovation and workers involvement practices, is presented by Matteucci et al. (2005) for data on Germany,
Italy and UK. We stress that R&D and training expenditures are determinant for providing a good fit to the
overall regression, emerging as main explanatory drivers. Those seem to be the most crucial variables,
adding robustness to the productivity regression. Their high statistical significance is not undermined by the
inclusion of the other relevant drivers, which on the other hand (marginally) increases the explanatory power
of regressions (see tab.4 for a summary of main regression outcomes).
4. Concluding remarks
From a methodological perspective, this paper has brought attention on two interrelated topics concerning
the economics of training in firms. First, it introduces the notion of complementarity in the analysis of
training practices managed in firms. In this framework of analysis training is not analysed per se, but it is
studied as a component of a complex system such as a firm. This paper emphasises complementarity
between general and specific training, but these are only two of the many elements interacting and matching
in the firm. Training practices do not occur in vacuum but have to fit into a complex nexus of inputs,
intended in the broad meaning. The application of the notion of complementarity provides the rationale for
employer’s funding of general training.
Secondly, this work constitutes one more step towards the analysis of complementarity between general and
specific training inside a firm, in the sense of providing a methodological support to the empirical analysis.
Complementarity between the two forms of training has been analysed through the super modularity of the
productivity function. Adopting the principles of the lattice theory, the relevant inequalities which insure the
super modularity of the productivity function and, hence, the complementarity among the variable choices
concerning general and specific training, have been derived.
23 Networking is defined with respect to cooperation activities regarding other firms (clients, suppliers, competitors) and institutions (university). The index varies between 0 and 1 and captures the intensity of networking activities by firms. 24 As far as high performance practices are concerned, we could test whether the introduction of TQM, QC, JIT, and team working before 2000 had an impact on 2003-2004 productivity, allowing (at least) four years lag causal response between the driver stimulus and the effect on performances. Using dummy variables for adoption before 2000, for each practice, we then do not observe any statistical significance. Firms adopting such practice before 2000 were on average very few, with a 16% maximum for TQM.

15
As far as the empirical evidence is concerned, we exploit a specific two-waves survey based dataset
providing detailed information on training dynamics, firm performances and other innovative strategies, and
find that complementarity holds between general and specific training. We explicitly addressed general and
specific training constructing empirical proxies which represent a value added of the paper, given the
literature seldom present data availability specifically on the two forms. More specifically, data shows that
complementarity holds, though non strictly, in the overall sample, while strict complementarity but also
substitutability cases emerge when the sample of firms is split by primary innovative and firm structural
variables. Thus, further research is encouraged along this line.
Nevertheless, a direct effect of such variables (adoption of general and specific training) on productivity is
not clearly emerging from our data. This may be related to the lower, mainly not significant, impact that we
observe for training and other drivers, when proxied by dummies (adoption/presence of general/specific
training, of formal/informal training). Thus, it seems that it is not the presence/adoption of training practices
to have impact on productivity performance, but the intensity of training (and also R&D), both in terms of
expenses per employee and coverage.
Our results on training complementarity and training intensity provide and indication for firm strategies and
policy action. Complementarity in investments matters, but the mere adoption is probably not sufficient: the
level of training provided is positively correlated with firm productivity. As far as complementarity of
general and specific training is concerned, further research is needed towards the analysis on the extent to
which this complementarity is influenced by firm related features such as size, sector, and other tecno-
organisational strategies.
16
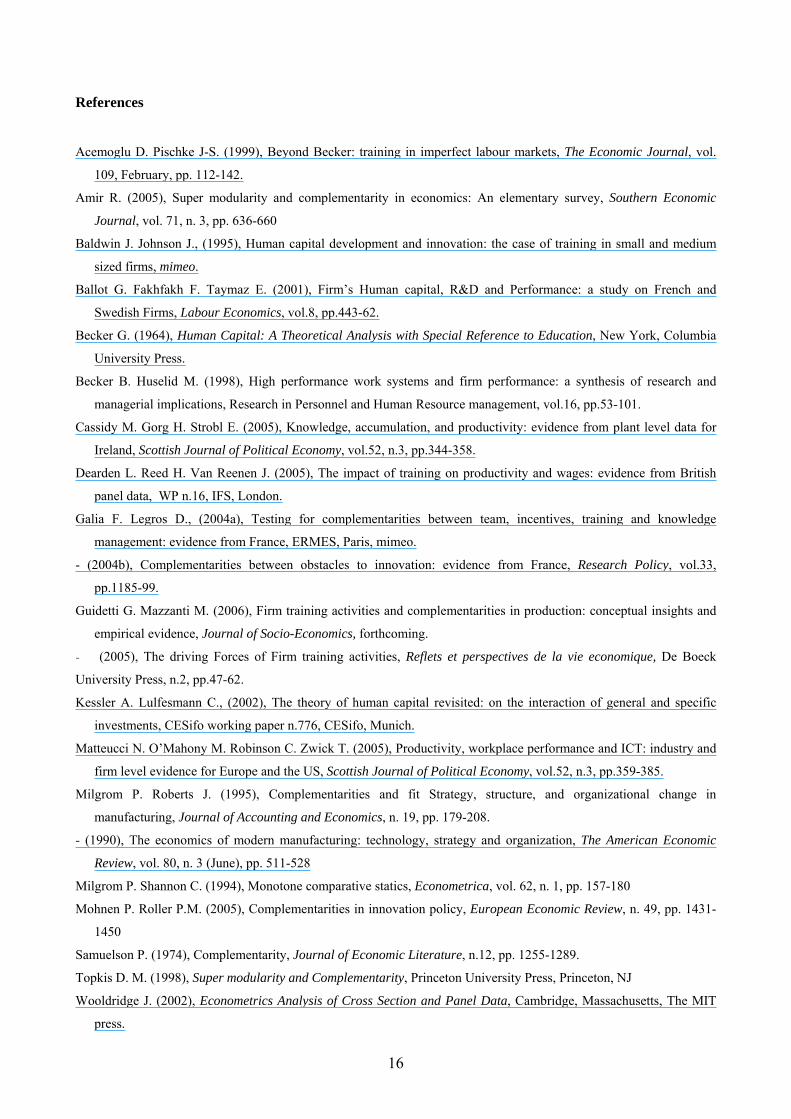
References
Acemoglu D. Pischke J-S. (1999), Beyond Becker: training in imperfect labour markets, The Economic Journal, vol.
109, February, pp. 112-142.
Amir R. (2005), Super modularity and complementarity in economics: An elementary survey, Southern Economic
Journal, vol. 71, n. 3, pp. 636-660
Baldwin J. Johnson J., (1995), Human capital development and innovation: the case of training in small and medium
sized firms, mimeo.
Ballot G. Fakhfakh F. Taymaz E. (2001), Firm’s Human capital, R&D and Performance: a study on French and
Swedish Firms, Labour Economics, vol.8, pp.443-62.
Becker G. (1964), Human Capital: A Theoretical Analysis with Special Reference to Education, New York, Columbia
University Press.
Becker B. Huselid M. (1998), High performance work systems and firm performance: a synthesis of research and
managerial implications, Research in Personnel and Human Resource management, vol.16, pp.53-101.
Cassidy M. Gorg H. Strobl E. (2005), Knowledge, accumulation, and productivity: evidence from plant level data for
Ireland, Scottish Journal of Political Economy, vol.52, n.3, pp.344-358.
Dearden L. Reed H. Van Reenen J. (2005), The impact of training on productivity and wages: evidence from British
panel data, WP n.16, IFS, London.
Galia F. Legros D., (2004a), Testing for complementarities between team, incentives, training and knowledge
management: evidence from France, ERMES, Paris, mimeo.
- (2004b), Complementarities between obstacles to innovation: evidence from France, Research Policy, vol.33,
pp.1185-99.
Guidetti G. Mazzanti M. (2006), Firm training activities and complementarities in production: conceptual insights and
empirical evidence, Journal of Socio-Economics, forthcoming.
- (2005), The driving Forces of Firm training activities, Reflets et perspectives de la vie economique, De Boeck
University Press, n.2, pp.47-62.
Kessler A. Lulfesmann C., (2002), The theory of human capital revisited: on the interaction of general and specific
investments, CESifo working paper n.776, CESifo, Munich.
Matteucci N. O’Mahony M. Robinson C. Zwick T. (2005), Productivity, workplace performance and ICT: industry and
firm level evidence for Europe and the US, Scottish Journal of Political Economy, vol.52, n.3, pp.359-385.
Milgrom P. Roberts J. (1995), Complementarities and fit Strategy, structure, and organizational change in
manufacturing, Journal of Accounting and Economics, n. 19, pp. 179-208.
- (1990), The economics of modern manufacturing: technology, strategy and organization, The American Economic
Review, vol. 80, n. 3 (June), pp. 511-528
Milgrom P. Shannon C. (1994), Monotone comparative statics, Econometrica, vol. 62, n. 1, pp. 157-180
Mohnen P. Roller P.M. (2005), Complementarities in innovation policy, European Economic Review, n. 49, pp. 1431-
1450
Samuelson P. (1974), Complementarity, Journal of Economic Literature, n.12, pp. 1255-1289.
Topkis D. M. (1998), Super modularity and Complementarity, Princeton University Press, Princeton, NJ
Wooldridge J. (2002), Econometrics Analysis of Cross Section and Panel Data, Cambridge, Massachusetts, The MIT
press.

17
- (1999), Introductory econometrics: a modern approach, Thomson learning.
Zwick T. (2002), Continuous training and firm productivity in Germany, Discussion paper n. 50, ZEW, Mannheim.
18
Table 1- Descriptive statistics of variables: dependent and independent variables, training states “of the world”,
instruments
Variable Typology and value range Acronym Mean value
Minimum and
maximum values
Period of observation
Dependent variable Averagelabour productivity 2003-2004 Continuous index (0-1) PROD 0,58 0,1 2003-2004
Independent variables Controls
Sectors: Services, manufacturing/metalwork, benchmark
base: other industry 2 dummies SERV, MANUF 0,42; 0,30 Elicited in 2005
survey
Share of revenue on international markets
Continuous index (0-1) NAT-REV 0,14 0,1 Elicited in 2005
survey Share of revenue from acting as
subcontractor Continuous index
(0-1) SUBCONTR 0,67 0,1 Elicited in 2005 survey
Firm size 2 dummies (50-99 employees, >100 employees) or alternatively number
of employees Size1, Size2, Size 110
employees 20; 2207
employees 2004 employment
level
State dummies
Adoption of general training practices
Adoption of specific training practices
Four dummies are generated (states of the world: (11, 00, 01, 10) from which coefficients
complementarity tests are implemented (01 only specific, 10 only formal)
Shares: (00): 29% (01): 47% (10): 3% (11): 21%
0,1 2000-2002
Innovation and training variables R&D expenditures per employee Continuous R&D-EXP 479€ 0, 10000€ 2000-2004
R&D positive expenditures Dummy R&D 0,41 0,1 2000-2004 Networking index
(summarising cooperative behaviour with private and public agents within
and outside the local area)
Continuous index (0-1) NETW 0,18 0; 0,66 2000-2004
Index of technological output innovations
(radical and incremental, process and product)
Continuous index (0-1) INNOTECH 0,55 0,1 2000-2004
Formal training coverage (share of employees involved)
Continuous index (0-1) COVER 0,39 0,1 2002-2004
Formal training expenditures per employee Continuous TRAIN-EXP 160€ 0, 1458€ 2002-2004
Presence of any formal training expenditures using internal firm sources
(excluding public funding) Dummy TRAIN 0,63 0,1 2002-2004
Formal and informal training adoption Dummies FORM, INFORM 0,55
(informal); 0,53 (formal)
0.1 2000-2002
Techno-organizational (instrumental) variables High performance practices (TQM, Just in time, Quality circle, Team working)
index
Continuous index (0-1) HPP 0,38 0,1 2000-2004
Labour related innovation index (on ten HRM practices; i.e. task
rotation, formal evaluation)
Continuous index (0-1) LAB-INNO 0,32 0,1 2000-2004
ICT index of adopted ICT-related innovations
Continuous index (0-1) ICT 0,28 0; 0,76 2000-2004
Outsourcing indexes: core activities, ancillary activities Dummies OUT-CORE, OUTANC 0,18; 0,34 0,1 2000-2004
Consultation with trade unions regarding innovation adoptions Dummy INDREL 0,26 0,1 2000-2004
Table shows the all set of variables used in econometric exercises. Acronyms are shown for all variables entering final specifications in tab.4 and for instruments used for endogeneity- related tests (see also par. 3.3.2).
19
Tab. 2- Complementarity tests on general and specific training
Controls Other variables included One sided T test (t ratio for the test b1+b2-b3-b4�0 regarding training state dummies)
Size dummies, sector dummies / 0,37601 (non strict complementarity holds)
Size dummies, sector dummies, firm market shares (international market and subcontracting)
/ 0,5693 (non strict complementarity holds)
Size dummies, sector dummies, firm market shares (international market and subcontracting)
R&D expenditure per employee -0.03 (non strict complementarity holds)
Size dummies, sector dummies, firm market shares (international market and subcontracting)
Innotech 0,8988 (non strict complementarity holds)
Size dummies, sector dummies, firm market shares (international market and subcontracting)
Training coverage 1,004 (non strict complementarity holds)
Size dummies, sector dummies, firm market shares (international market and subcontracting)
Training expenditure per employee 0,5354 (non strict complementarity holds)
Size dummies, sector dummies, firm market shares (international market and subcontracting)
R&D expenditure per employee, Training expenditure per employee,
0,4573 (non strict complementarity holds)
Size dummies, sector dummies, firm market shares (international market and subcontracting)
R&D expenditure per employee, Training expenditure per employee, ICT index variables, organizational innovation index (including TQM, JIT, QC, Teamworking)
0,4229 (non strict complementarity holds)
Sub-sample analyses (only controls used) Variable investigated Sub-samples One sided T test
Market services 4,01 (strict complementarity holds) sectors
Manufacturing -3,34 (null rejected)
(small firms, less than 50 employees) 2,62 (strict complementarity) Size
(medium-large firms, more than 50 employees) -1,98 (null rejected)
R&D >0 2,11 (strict complementarity holds) R&D
R&D =0 0,3641 (non strict complementarity holds)
Lower than median (0,3) 2,98 (strict complementarity) Indexes of labour related ten innovation
practices Higher than median 0,41
(non strict complementarity holds)
0 practices 2,58 (strict complementarity holds)
One practices 0,04 (non strict complementarity holds)
Organizational practices adopted (TQM, JIT, QC, TW)
two practices -3,79 (null rejected)
Tests are carried out on coefficients deriving from regressions using as dependant variable the firm productivity trend in 2003-2004; N=147, OLS corrected for heteroskedasticity is used as estimation tool.
20
Tab. 3 correlation matrix for main independent variables 1 2 3 4 5 6 7 8 9 10 11
1 Index of Organizational practices adopted 1.00
2 OUTACC 0.15 1.00
3 OUTCORE 0.20 -0.04 1.00
4 Index-labour-practices 0.46 0.17 0.05 1.00
5 coverage 0.34 0.20 -0.05 0.37 1.00
6 Training expenditures >0 (binary index) 0.45 0.30 0.09 0.43 0.42 1.00
7 Training expenditure per employee 0.27 0.01 0.07 0.34 0.28 0.50 1.00
8 networking-index 0.40 0.23 0.01 0.42 0.30 0.34 0.18 1.00
9 R&D>0 (binary index) 0.20 0.20 0.17 0.22 0.12 0.36 0.13 0.42 1.00
10 R&D expenditure per employee 0.01 -0.10 0.11 0.18 -0.07 0.12 0.09 0.27 0.43 1.00
11 INNOTECH 0.30 0.14 0.10 0.33 0.18 0.31 0.15 0.40 0.48 0.23 1.00
Tab. 4- Productivity Regressions
SIZE1 2,669*** 1,960* 2,076** 2,546**
SIZE2 2,330** 2,970*** 2,799*** 2,515**
SERV 0,783 0,679 0,708 0,909
MANUF 1,483 1,626 1,847* 1,708*
R&D-EXP 2,416** … … 2,508**
TRAIN-EXP 3,261*** 3,255*** 3,247*** …
INNOTECH … 2,081** … …
NETW … … 2,031** …
COVER … … … 3,539***
F test (prob) 3,34 (0,0006) 3,28 (0,0008) 3,23 (0,0009) 4,04 (0,0001)
Adj-R2 0,138 0,135 0,132 0,172
N 147 147 147 147
Notes: Dependant variable is productivity trend 2003-2004; (PROD); OLS corrected for heteroskedasticity is used as estimation tool; the four states of the world regarding general and specific training adoption are use in place of the constant term (not shown)).We recall coefficients should not to be interpreted as elasticities; the table shows t ratios and emphasises statistical significance of coefficients at 10%, 5% and 1% (*, **, ***) levels. Besides size and sector dummies, only significant controls are presented in this table. The variable SIZE when included in place of size dummies is significant at ***: overall fit is unaffected.