Compendium Abstract CCAP 2017 - Indian Ecological Society
747
-
Upload
khangminh22 -
Category
Documents
-
view
1 -
download
0
Transcript of Compendium Abstract CCAP 2017 - Indian Ecological Society

9 789386 256737


It is I
LLEGAL t
o cop
y, pri
nt or
save
any c
onten
t of th
is PDF,
in pa
rt or in
full,
on an
y retr
ieval
syste
m,
withou
t the E
XPRESS WRITTEN PERMISSIO
N of th
e cop
yrigh
t-hold
er

It is I
LLEGAL t
o cop
y, pri
nt or
save
any c
onten
t of th
is PDF,
in pa
rt or in
full,
on an
y retr
ieval
syste
m,
withou
t the E
XPRESS WRITTEN PERMISSIO
N of th
e cop
yrigh
t-hold
er

It is I
LLEGAL t
o cop
y, pri
nt or
save
any c
onten
t of th
is PDF,
in pa
rt or in
full,
on an
y retr
ieval
syste
m,
withou
t the E
XPRESS WRITTEN PERMISSIO
N of th
e cop
yrigh
t-hold
er

Guidance Dr. Ajoy Kumar Singh Vice-Chancellor, BAU, Sabour
Editors Ashok K. Dhawan S. Sheraz Mahdi Mainak Ghosh Swaraj Kumar Dutta S.K. Chauhan Arnab Roy Chowdhury
Correct Citation Dhawan, A.K., Mahdi, S.S., Ghosh, M., Dutta, S.K., Chauhan, S.K. and Chowdhury, A.R. 2017. Climate Change and Agricultural Production: Adapting Crops to Climate Variability and Uncertainty. Proceedings of the National Conference, organized by Bihar Agricultural University, Sabour, Bhagalpur, Bihar in Collaboration with Indian Ecological Society, Ludhiana, Punjab, 6–8 April, 2017. © All Rights Reserved Bihar Agricultural University Sabour–813210, Bhagalpur, (Bihar) and Indian Ecological Society, Ludhiana, Punjab
ISBN: 978-93-86256-73-7 Published by EXCEL INDIA PUBLISHERS
91 A, Ground Floor Pratik Market, Munirka, New Delhi–110067 Tel: +91-11-2671 1755/ 2755/ 3755/ 5755 Fax: +91-11-2671 6755 E-mail: [email protected] Web: www.groupexcelindia.com
DISCLAIMER Papers contained in this “Proceedings” have been compiled as received from Authors. The authors are solely responsible for the contents of the papers complied in this volume. The publishers or editors shall not be responsible for any error, omission and plagiarism.” Printed by Excel Printing Universe, New Delhi–110067 E-mail: [email protected] Printed: March, 2017
It is I
LLEGAL t
o cop
y, pri
nt or
save
any c
onten
t of th
is PDF,
in pa
rt or in
full,
on an
y retr
ieval
syste
m,
withou
t the E
XPRESS WRITTEN PERMISSIO
N of th
e cop
yrigh
t-hold
er

Foreword
Maintaining crop production to feed a growing population during a period of climate change is the greatest challenge we face as a species. The increased crop yields during the last century and especially the Green Revolution, were brought about through breeding for increased harvest index and disease resistance, as well as by using more irrigation water and agrochemicals. Improved cultivars were adopted readily during this period of relative climate stability. While genetic gains continue, albeit at reduced rates, productivity is in decline in many regions. Given the multiple challenges of climate change, reduced water supplies, and declining soil fertility in many regions, new approaches to produce climate resilient crops are desperately needed. The natural resource foundation is coming under increasing pressure from both increasing population and higher levels of per capita economic activity. In next fifteen years, the world’s population is expected to grow by 3.7 billion. This will often entail an accelerated use of natural resources, both as inputs to the economy, and as recipients of waste. However, the relationship between economic growth and environmental stress is not a linear one, as growth also generates resources to better manage natural resources. The biggest threat to global food security is from our narrow dependence on food items. It is a well recognized fact that 60% of our calories come from just three species of cereals i.e. paddy, maize and wheat. 90% calories in human diet come from just fifteen species of plants (250 plant species are used for food all over the world). In India, 120 species of plants have been recognized important at national level and less than 150 species of plants are cultivated today. World over about 30,000–40,000 species of plants can be used as source of food but only 7000 plant species are used at local level all over the world. The history reveals that narrow sphere of dependence has been disastrous for human beings.
India has made commendable progress in agriculture besides providing food security in last fifty years and it has also transformed the standard of living of large section of the urban and rural population. However, the increase in agricultural productivity has come at the expense of deterioration in the natural resource base on which farming systems depend and this trend needs to be reversed by encouraging farmers to adopt sustainable methods of farming that will have long-term benefits in environmental conservation and sustaining livelihoods security.
The concentration of carbon dioxide and other greenhouse gases in the atmosphere has considerably increased over the last century having a positive correlation with average global surface temperature. It is possible to manage the carbon dioxide in the environment through targeted land use and management activities. The management of carbon dioxide in the biosphere through afforestation and reforestation is a cost effective opportunity. However, the quantification of the carbon pools in different land use systems is essential so that the carbon stored is quantified, monitored, and traded. Hence, to make future agriculture remunerative, lesser risky and sustainable; the dynamic characteristics of atmospheric stressors have to be understood so that researches on its impacts on agriculture is take up in a holistic way to formulate adaptation and mitigation options.
I congratulate the Dr. S. Syed Sheraz Mahdi, organizing secretary, Dr. A.K. Dhawan, President, IES, Ludiana and other members of publishing team for bringing out this proceedings in time.
Dr. Ajoy Kumar Singh
Vice Chancellor, BAU, Sabour
It is I
LLEGAL t
o cop
y, pri
nt or
save
any c
onten
t of th
is PDF,
in pa
rt or in
full,
on an
y retr
ieval
syste
m,
withou
t the E
XPRESS WRITTEN PERMISSIO
N of th
e cop
yrigh
t-hold
er

Preface
Climate change is perhaps the most serious environmental threat to the fight against hunger, malnutrition, disease and poverty, mainly through its impact on agricultural productivity. Agriculture is a climate-sensitive sector and is also a sector that provides livelihood for more than 60% of Indians. Warming due to climate change is now reality as evident from the significant increase in the CO2 concentration (406.42 ppm as on March 6, 2017) which has caused most of the warming and has contributed the most to climate change. Yet again, year 2016 set a global heat record for the third year in a row. A record El Nino lasting from 2015 into 2016 played a role in further pushing the planet's temperature higher.
The rising temperatures will adversely affect the world's food production and India would be the hardest hit. There are reports of shifting in the sowing time and length of growing seasons geographically, which would alter planting and harvesting dates of crops and varieties currently used in a particular area. It is estimated that crop production loss in India by 2100 AD could be 10–40% despite the beneficial effects of higher CO2 on crop growth. The impact of climate change on water availability will be particularly severe for India. About 54 percent of India's groundwater wells are decreasing, with 16 percent of them decreasing by more than one meter per year. Dynamic of pests and diseases will be significantly altered leads to the emergence of new patterns of pests and diseases which will affect crops yield.
No doubt, Indian farmers have evolved many coping mechanisms over the years, but these have been fallen short of an effective response strategy in dealing with recurrent and intense forms of extreme climatic events on the one hand and gradual changes in climate like rise in surface temperatures, changes in rainfall patterns, increases in evapo-transpiration rates and degrading soil moisture conditions on the other. Region wise climate change adaptation and mitigation options have been identified as important strategies to safeguard food production.
To address these issues, the proposed conference on "Climate Change and Agricultural Production (CCAP)" organized by Bihar Agricultural University, Sabour in collaboration with Indian Ecological Society, Ludhiana on 6-8 April, 2017 at Sabour, aims to focus on totality of the problem of climatic variability and change-its description, implications and explore approaches to maintain and increase crop productivity into the future. Based on the deliberations, future research strategies and recommendations will be developed to address the emerging matrix of the agricultural problems in holistic manner. It is hoped that their pro-active participation will play innovative and decisive role in shaping the future research aiming to look on climate change issues for farmers’ welfare and environmental security. The following themes have been covered in the conference:
1. Climatic Uncertainties, impact and Adaptation in Agriculture
2. Weather Based Information, Crop Simulation Modeling and Remote Sensing Applications in Climate Change
3. Natural Resource Management, Information & Communication Management Concerning Climate Smart Agriculture
4. Crop Weather Pest Dynamics and Innovative Agronomic and Breeding Practices
5. Climate Change and Livestock, Fisheries and Poultry
In addition, 2 special sessions namely, “Abiotic Stress Tolerant Rice for Adaptation to a Climate Change” with IRRI (International Rice Research Institute), and “Sustainable Intensification and Climate Smart agriculture for Smallholders” with CIMMYT (International Maize and Wheat Improvement Center) were also organized during the conference.
We express our sincere thanks to all contributors from ICAR Intuitions, State Agriculture Universities, KVKs, NGOs, for making their useful contributions and timely submission of papers. In addition, we pay our due regard to the research contributions received from our international partners of the conference viz. CIMMYT, IRRI, BISA. We also appreciate the scientist from Bangladesh Rice Research Institute and Bangladesh Agricultural Research Institute, Gazipur for submitting and presenting their work in this conference. The
It is I
LLEGAL t
o cop
y, pri
nt or
save
any c
onten
t of th
is PDF,
in pa
rt or in
full,
on an
y retr
ieval
syste
m,
withou
t the E
XPRESS WRITTEN PERMISSIO
N of th
e cop
yrigh
t-hold
er

abstracts submitted in the conference could be a good surrogate marker of climate change research in India and abroad. It can also serve as a source for identifying strengths and opportunities in different laboratories for exploring collaborative research.
Based up on above themes, the abstract analysis revealed that a record 695 extended abstracts were received in addition to 28 invited talks. Out of the 695 abstracts, only 455 abstracts were accepted to varying reasons for oral and poster presentations. This issues contains a wealth of information on all aspects of Climate Change, agriculture and allied sciences and would prove indispensable for not only students, teachers and researchers in agriculture but also for administrators, planners and field level extension functionaries.
We are grateful to Vice Chancellor, BAU, Sabour for providing necessary support, guidance and encouragement to organize this conference. Special thanks to Dr. R.K. Sohane, Chairman, Local Organizing Committee for being very supportive throughout the conference preparations. Entire administrative setup of the university helped in a great manner to organize this event successfully. We are also thankful to our sponsors, SERB-DST, ICAR, New Delhi for providing funds for successful organization of the conference.
At last but not least, I wish to put on record the help and cooperation directly or indirectly extended by our well wishers involved at different levels of organization of CCAP-2017.
The great enthusiasm shown by honourable delegates from all around the nation and abroad is praiseworthy.
Place: Sabour, Bhagalpur (Bihar) Date: March 22, 2017
Editors A.K. Dhawan
S. Sheraz Mahdi Mainak Ghosh
Swaraj Dutta S.K. Chauhan
Arnab Roy Chowdhury
It is I
LLEGAL t
o cop
y, pri
nt or
save
any c
onten
t of th
is PDF,
in pa
rt or in
full,
on an
y retr
ieval
syste
m,
withou
t the E
XPRESS WRITTEN PERMISSIO
N of th
e cop
yrigh
t-hold
er

Special Acknowledgement
The necessary financial support provided for organizing the National Conference on Climate Change and Agricultural Production (CCAP) by the Indian Council of Agricultural Research (ICAR), Science and Engineering Research Board, Department of Science Technology, (SERB-DST), New Delhi, International Rice Research Institute (IRRI), Philippines and International Maize and Wheat Improvement Center (CIMMYT), Mexico is duly acknowledged.
It is I
LLEGAL t
o cop
y, pri
nt or
save
any c
onten
t of th
is PDF,
in pa
rt or in
full,
on an
y retr
ieval
syste
m,
withou
t the E
XPRESS WRITTEN PERMISSIO
N of th
e cop
yrigh
t-hold
er

National Conference on Climate Change and Agricultural Production: Adapting Crops to Climate Variability and Uncertainty, 6th–8th April, 2017
[ix]
Contents
Foreword v Preface vi Special Acknowledgement viii
LEAD PAPERS
1. Exposed to Global Warming―Challenges, Opportunities and Future Directions A.K. Singh, S. Sheraz Mahdi and R.K. Sohane 3
2. Climate Change and Agriculture in India Rattan Lal 3
3. Climate Change and Rainfed Agriculture B. Venketeswarlu 5
4. Impact of Climate Change on Temperate Fruit Production in North Western Himalayan Region of India–Challenges, Opportunities and Way Forward Nazeer Ahmed, F.A. Lone and K. Hussain 6
5. Climate Resilient Agriculture: Global and National Initiatives Ch. Srinivasa Rao 7
6. Adaptation and Intervention in Crops for Managing Atmospheric Stresses N.P. Singh, S.K. Bal, N.S. More, Yogeshwar Singh and A. Gudge 8
7. Simulating the Impact of Climate Change and its Variability on Agriculture Naveen Kalra 8
8. Weather based Information on Risk Management in Agriculture K.K. Singh, A.K. Baxla, Priyanka Singh and P.K. Singh 9
9. Are GCM and Crop Simulation Models Capable to Provide Useful Information for Decision Making? Lalu Das 12
10. Impact of El-Nino and La-Nina on Indian Climate and Crop Production Vyas Pandey, A.K. Misra and S.B. Yadav 13
11. Looking at Climate Change and its Socio-economic and Ecological Implications through BGC (Bio-Geo-Chemical Cycle)-Lens: An ADAM (Accretion of Data and Modulation) and EVE (Environmentally Viable Engineering Estimates) Analysis J.S. Pandey 14
12. Mapping Agriculture Dynamics and Associated Flood Impacts in Bihar using Satellite Data C. Jeganathan and Praveen Kumar 15
13. Climate Adaptive Technologies ior Sustainable Rice Production in Sub-Tropical India Dillip Kumar Swain 15
14. Climate Change: Impact on Land Degradation, Emerging Issues and Strategies S.S. Walia, Vikrant Dhawan and A.K. Dhawan 16
15. Climate Change Impact on Agriculture and Forest Land of Bangladesh Md. Farid Hossain 18
It is I
LLEGAL t
o cop
y, pri
nt or
save
any c
onten
t of th
is PDF,
in pa
rt or in
full,
on an
y retr
ieval
syste
m,
withou
t the E
XPRESS WRITTEN PERMISSIO
N of th
e cop
yrigh
t-hold
er

National Conference on Climate Change and Agricultural Production: Adapting Crops to Climate Variability and Uncertainty, 6th–8th April, 2017
[x]
16. Global Climate Change and Inland Open Water Fisheries in India: Impact and Adaptations B.K. Das, U.K. Sarkar and K. Roy 19
17. Climate Change Impacts on Insect Dynamics and Management Interventions Subhash Chander 19
18. Potential Impacts of Recent Invasive Whiteflies and its Natural Enemies in Indian Agriculture K. Selvaraj, T. Venkatesan, Ankita Gupta, S.K. Jalali and R. Sundararaj 20
19. Emergence of Bemisia tabaci as New World Pest of Crops and Challenges in Management Shantanu Jha and Gayatri Kumari Padhi 22
20. Impact of Climate Change on Tropical Fruit Production Systems and its Mitigation Strategies Vishal Nath and Gopal Kumar 23
21. Tackling Climate Change: A Breeder’s Perspective P.K. Singh and R.S. Singh 24
22. Ecological Balancing through Natural Resource Management A.K. Dhawan, S.K. Chauhan, S.K. Bal and S.S. Walia 25
23. Eco-friendly Strategies of Managing Foliar Disease in Apple for Sustaining Apple Production Hilal A. Bhat, Sajad Hassan Wani, Rayees A. Ahanger, Mumtaz A. Ganie, Aarif H. Bhat and J.I. Mir 26
24. Impact Assessment of Biopriming Mediated Nutrient Use Efficiency for Climate Resilient Agriculture Amitava Rakshit 27
25. Land Economics vs. Land Use Planning B.B. Mishra 27
26. Nanotechnology in the Arena of Changing Climate Nintu Mandal, Rajiv Rakshit, Samar Chandra Datta and Ajoy Kumar Singh 28
THEME 1: CLIMATIC UNCERTAINTIES, IMPACT AND ADAPTATION IN AGRICULTURE
Climatic Uncertainties and its Impact on Agriculture Crop Adaptation and Management Interventions for Climate Resilient Agriculture
27. Differential Yield Response of Crops Due to Climatic Change and Variability in Coffee-Cardamom Hot Spots, India Murugan M., Anandhi A., Solai M.A., Ravi R., Rajangam R., Ramesh R., Gowda S.J.A., Dhanya M.K. and Shajan K. 31
28. Influence of Environmental Temperature on Biomass Production Rate, Sporulation and Sporocarp Germination in Azolla Arun Kumar Jha 32
29. Effect of Crop Growing Environment on Phenology, Heat-unit Requirement and Yield of Wheat (Tritucum avestivum) Genotypes I.B. Pandey and Manish Kumar 34
It is I
LLEGAL t
o cop
y, pri
nt or
save
any c
onten
t of th
is PDF,
in pa
rt or in
full,
on an
y retr
ieval
syste
m,
withou
t the E
XPRESS WRITTEN PERMISSIO
N of th
e cop
yrigh
t-hold
er

National Conference on Climate Change and Agricultural Production: Adapting Crops to Climate Variability and Uncertainty, 6th–8th April, 2017
[xi]
30. Exogenous-Applied Salicylic Acid Alleviates Adverse Effects of High Temperature on Photosynthesis in Late Sown Wheat (Triticum aestivum) During Reproductive Stage through Changes in Antioxidant Defense Shailesh Kumar, V.P. Singh, Ajay Arora and Sweta Mishra 36
31. Efficient Water Conservation Measures for Fugmented Farm Productivity in NICRA Adopted Eastern Indian Villages F.H. Rahman and S.K. Roy 38
32. Mitigation of Climate Changes Impact on Maize Production through Training Programmes Pankaj Kumar, Rama Kant Singh, S.K. Singh, S.B. Singh and S.K. Sinha 39
33. Reliability of Multi-Sources Observational Data Sources for Assessing Long-Term Rainfall Change over North-Central Indian Region Javed Akhter, Debjyoti Majumder and Lalu Das 41
34. Effect of Conservation Tillage on Wheat Yield and Soil Physical Properties in Rice-Wheat Cropping System Seema, D.K. Singh and P.C. Pandey 42
35. Inter-Relationship between Climate Change and Agriculture Sima Sinha, Ravi Shankar Singh, Anand Kumar and Ravi Ranjan Kumar 44
36. Forecasting Food Grain Production in Perspective of Climate Change Manoj Kumar and Subrat Keshori Behera 45
37. Observation of Climatic Variability in Srinagar District of Kashmir Valley, India Latief Ahmad, R.H. Kanth, Sabah Parvaze, Saqib Parvaze and S. Sheraz Mahdi 46
38. Temperature Correlation with the Population Dynamics of Fruit Fly, Bactrocera dorsalis (Hendel) on Guava Meenakshi Devi and G.S. Yadav 47
39. Analysis of Radiation Use Efficiency, Yield Attributes and Quality Parameters of Basmati Rice (Oryza sativa L.) Cultivars under Different Dates of Transplanting in Eastern Agroclimatic Conditions of Haryana Abhilash, Chander Shekhar Dagar, Raj Singh, Premdeep and Sagar Kumar 48
40. Assessment of Climatic Vulnerability to Agriculture in Kosi Region of Bihar Jyoti Bharti, Meera Kumari, S.M. Rahaman, S.L. Bairwa and L.K. Meena 50
41. Effect of Planting Dates and Crop Geometry on Growth and Yield of Pigeonpea (Cajanus cajan L. Millsp.) Cultivars under Limited Irrigation Akhilesh Sah, Md. Naiyar Ali and Amarjeet Kumar 51
42. Evaluation of Clones for Populus Deltoides and Economics of Raising Entire Rooted Transplants (Etps) under Nursery Condition in North-Eastern Part of Haryana Pradyuman Singh, K.S. Bangarwa, Vinita Bisht and Md. Sarware Alam 52
43. System of Root Intensification in Mustard: Climate Change Mitigation and Climate Resilience Strategy Shashank Tyagi, Sanjay Kumar, M.K. Singh and Sunil Kumar 54
44. Awareness and Adaptations by the Farmers of Keonjhar District under Climate Change Scenario M. Ray, S. Biswasi, H. Patro, N. Mishra and K.C. Sahoo 55
It is I
LLEGAL t
o cop
y, pri
nt or
save
any c
onten
t of th
is PDF,
in pa
rt or in
full,
on an
y retr
ieval
syste
m,
withou
t the E
XPRESS WRITTEN PERMISSIO
N of th
e cop
yrigh
t-hold
er

National Conference on Climate Change and Agricultural Production: Adapting Crops to Climate Variability and Uncertainty, 6th–8th April, 2017
[xii]
45. Growth and Economic of Bamboo and Forage Crops under Silvipasture System Asha Puran, M.S. Malik, P.R. Oroan and Abhay Kumar 57
46. Characterization of Stress Tolerant Mungbean Rhizobia as PGPR and Plant Growth Promotion under Abiotic Stress Hemanta Kumar Mondal, Shikha Mehta, Harshpreet Kaur and Rajesh Gera 58
47. Short and Medium Duration Varieties of Pulses and Oil Seeds to Mitigate Monsoon Vagaries in Rainfed Agriculture D.V. Srinivasa Reddy, Sreenath Dixit, N. Loganandhan, Manjunath Gowda, B. Mohan, S. Sheeba, B.O. Mallikarjuna and M. Anitha 59
48. Assessment of Vulnerability and Farmers Adaptations to Climate Variability under Krishna River Basin of Andhra Pradesh N.S. Praveen Kumar, Y. Radha and K.S.R. Paul 61
49. Farmer’s Awareness about Climate Change and Adaptation Practices: A Study in North Himalayan Region of India Rupan Raghuvanshi, Mohammad Aslam Ansari and Amardeep 62
50. Effect of Drought Stress on Carbohydrate Content in Drought Tolerant and Susceptible Chickpea Genotypes Sarita Devi Gupta, Pratibha Singh Manjri and Akanksha Singh 64
51. Crucial Reproductive Traits as Indices for Screening Brinjal (Solanum melongena L.) under High Temperature Stress Shirin Akhtar, S.S. Solankey, Rashmi Kumari, Nisha Rani, Randhir Kumar and P.K. Singh 65
52. Effect of High Temperature Stress on Morpho-Biochemical Traits of Tomato Genotypes under Polyhouse Condition S.S. Solankey, Shirin Akhtar, J.B. Tomar, Pallavi Neha, Meenakshi Kumari
and Randhir Kumar 67 53. Climate Change and its Impact on Food Quality
Mudasir Ahmad Bhat 68 54. Genetic Variability of Chickpea Genotypes under Heat Stress Condition:
Character Association and Path Coefficient based Analysis Sanjay Kumar, Anand Kumar, Anil Kumar, Ravi Ranjan Kumar and Tejashwini Agrawal 69
55. Exploration of Potential of Indigenous and Exotic Lentil (Lens culinaris Medik.) Genotypes for Yield and Earliness with Respect to Climate Resilient Anjali Kumari, Anil Kumar, Sanjay Kumar, Anand Kumar, Ravi Ranjan Kumar
and P.K. Singh 71
56. Photosynthetic Activity and Yield Improvement of Wheat under Terminal Heat Stress through Foliar Applied Synthetic Compounds in Eastern Gangetic Plains of Bihar, India Asheesh Churasiya, Arnab Roy Chowdhury, R.P. Sharma, Mainak Ghosh, Manohar Lal, Awadhesh Pal, Shivasankar Acharya, S.K. Dutta and Durgesh Singh 72
57. Effects of Climate Change on Vegetable Production: Ways forward for Resilience and Mitigation with Special Reference to Eastern India Vishal Tripathi, C.K. Panda, S.R. Singh and A.K. Jha 74
It is I
LLEGAL t
o cop
y, pri
nt or
save
any c
onten
t of th
is PDF,
in pa
rt or in
full,
on an
y retr
ieval
syste
m,
withou
t the E
XPRESS WRITTEN PERMISSIO
N of th
e cop
yrigh
t-hold
er

National Conference on Climate Change and Agricultural Production: Adapting Crops to Climate Variability and Uncertainty, 6th–8th April, 2017
[xiii]
58. Evaluation of Genetic Variability and Identification of Micronutrients Rich Recombinant Inbred Lines in Mungbean [Vigna radiata (L.) Wilczek] Kritika, Rajesh Yadav and Sunayana 75
59. Yield Improvement in Wheat (Triticum aestivum L.) through Foliar Supplement of Potassium Nitrate under Low Photo thermal Exposure around Anthesis Arnab Roy Chowdhury, Sunil Kumar, Mainak Ghosh, S.S. Acharya and J. S. Deol 76
60. Future Changes in Rainfall and Temperature under Emission Scenarios over India for Agriculture P. Parth Sarthi 77
61. Comparative Assessment of the Effect of Weather Parameters on Linseed (Linum usitatissimum L.) Crop Production in Adaptation to Climate Change Scenario in Bihar S.S. Acharya, Sunil Kumar, Mainak Ghosh, R.B.P. Nirala, A. Roy Chowdhury, S.K. Gupta, S.K. Choudhary and S.S. Mahdi 78
62. Trends and Impact of Aerosol on Yield of Rice and Wheat Crop in Bihar Sunil Kumar, Sanjay Kumar, S. Sheraz Mahdi, Saurabh Choudhary, Shashank Tyagi, Pravesh Kumar, S.K. Gupta and Rakesh Kumar 80
63. Response of Blue Green Algae on Rice (Oryza sativa) Crop Production at Elevated Temperature Vimal Kumar, S. Panneerselvam, Jeetendra Kumar Soni, A. Lakshmanan
and P. Arun Kumar 82
64. Sand Mining-Effects and Extent for Changing Irrigation and Agriculture Scenario in Banka District of Bihar India Sunita Kushwah, Kumari Sharda, R.P. Sharma and S.R. Singh 83
65. Correlation and Path Coefficient Analysis for Combining High Grain Yield and Protein Content based on Nitrogen Remobilization Efficiency in Wheat (Triticum aestivum L.) Tilak Raj, Sukhpreet Kaur Sidhu, Ashutosh Srivastava and S.S. Sidhu 85
66. Chlorophyll Stability: A Better Trait for Grain Yield in Rice under Drought Sareeta Nahakpam 86
67. Harnessing Under-utilized Crop Species—A Promising Way towards Sustainability Madhumita 87
68. Thermal Utilization and Heat Use Efficiency of Rice Cultivars under Different Dates of Transplanting in Indo-Gangetic Plain of Bihar S.K. Dutta, Mainak Ghosh, Sunil Kumar, Sanjay Kumar, S. Sheraz Mahdi and G.S. Panwar 88
69. Effect of Weed Management on Performance of Direct Seeded Rice (Oryza sativa L.) under Moisture Stress Condition Shaheen Naz, Ravi Nandan and D.K. Roy 90
70. Development of Innovative Farming Practices to Mitigate the Effects of Climate Change K. Sathiya Bama, E. Somasundaram, R. Sathya Priya and K.R. Latha 91
It is I
LLEGAL t
o cop
y, pri
nt or
save
any c
onten
t of th
is PDF,
in pa
rt or in
full,
on an
y retr
ieval
syste
m,
withou
t the E
XPRESS WRITTEN PERMISSIO
N of th
e cop
yrigh
t-hold
er

National Conference on Climate Change and Agricultural Production: Adapting Crops to Climate Variability and Uncertainty, 6th–8th April, 2017
[xiv]
71. Adaptation of Pulses as Relay Crop: A Potential Technology under Changing Climate Scenario G.L. Choudhary and K. Lakshman 92
72. Improving Heat Tolerance Ability of Late Sown Wheat through Foliar Application of Bioregulators Savitri Sharma, B.S. Shekhawat, S.M. Gupta and H.L. Yadav 94
73. Impacts of Planting Techniques and Nutrient Management on Yield-Scaled Greenhouse Gas Emissions from Rice Crop in Eastern India Suborna Roy Choudhury, Anupam Das, R.P. Sharma and S. Sheraz Mahdi 95
74. Impact of Climate Change on Production and Productivity of Pulses in Banka District, Bihar Raghubar Sahu, Kumari Sharda and Sanjay Kumar Mandal 97
75. Innovative Techniques to Obviate Edaphic and Drought Stresses in Orchards Grown on Shallow Basaltic Soils of Deccan Plateau Y. Singh, D.D. Nangare, P. Suresh Kumar, M. Kumar, S.K. Bal, J. Rane and N.P. Singh 98
76. Understanding and Restoring SOC for Climate Smart Agriculture Ruby Saha, Ajay Kumar and Ram Pal 100
77. Response of Wheat Varieties to Foliar Application of Bioregulators under Late Sown Condition Savitri Sharma, B.S. Shekhawat, Surendra Singh and R.R. Choudhary 101
78. Effect of Weather Parameters on Flowering and Fruiting Behavior of Litchi (Litchichinensis Sonn,) in Agro Climate of Indo Gangetic Plain of Bihar Ruby Rani, H. Mir, V.B. Patel, Shweta Kumari and Rashmi Kumari 102
79. Acclimatization Capacity of Purple Nutsedge (Cyperusrotundus) under Future Climate Scenarios Ajit Kumar Mandal, Ga. Dheebakaran, Mahamaya Banik and Arun Kumar 103
80. Assessment of Genetic Divergence in Fenugreek (Trigonella foenum-graecum L.) based on Biological Characters Preeti Yadav, S.K. Tehlan and Sumit Deswal 104
81. Direct Seeded Rice (DSR): Potent Technology to Mitigate Green House Gases from Paddy Fields in Changing Climatic Scenario N.K. Singh, Rajesh Kumar, Avinash Kumar, Santosh Kumar and Nilanjaya 106
82. Response of Fertilizer Levels and Cutting Management on Growth and Yield Parameters in Oat (Avena sativa L.) Priti Malik, Meena Sewhag and Karmal Malik 107
83. Exploring Genetic Diversity for Heat Tolerance among Lentil (Lens culinaris Medik.) Genotypes Anil Kumar Anjali Kumari, Sanjay Kumar, Anand Kumar, Ravi Ranjan Kumar
and P.K. Singh 109
84. Evaluation of Gerbera Varieties for Yield and Quality under Protected Environment Conditions in Bihar Paramveer Singh, Ajay Bhardwaj, Randhir Kumar and Deepti Singh 110
It is I
LLEGAL t
o cop
y, pri
nt or
save
any c
onten
t of th
is PDF,
in pa
rt or in
full,
on an
y retr
ieval
syste
m,
withou
t the E
XPRESS WRITTEN PERMISSIO
N of th
e cop
yrigh
t-hold
er

National Conference on Climate Change and Agricultural Production: Adapting Crops to Climate Variability and Uncertainty, 6th–8th April, 2017
[xv]
85. Evaluation of Finger Millet Varieties under Rainfed Region of South Bihar: Climate Change Compliant Crop and Climate Resilience Strategy M.K. Singh, Vinod Kumar, Shambhu Prasad and Birendra Kumar 112
86. Influence of Temperature on Plant Growth, Flowering and Fruiting of Strawberry in Agro Climate of Bihar Kanchan Bhamini, Ruby Rani, R.R. Singh, Feza Ahmad, Sunil Kumar and Ravi Kumar 113
87. Climate Smart Nutrient Management (CSNM) for Enhanced use Efficiencies and Productivity in Ice and Wheat under Rice-Wheat Cropping System A. Qureshi, D.K. Singh and P.C. Pandey 114
88. Genetic Divergence for Morpho-Physiological and Yield Components Associated with Cold Tolerance in Maize (Zea mays L.) Inbreds Ranju Kumari A.K. Singh and P.K. Singh 116
89. Quantification of Carbon Sequestration in Open Field and Agri-Horti System Manoj Kumar Gond, Pravesh Kumar, Ramesh Kumar Singh, Shashank Tyagi, Sunil Kumar, A.K. Singh, S.K. Chaudhary and S.K. Pandey 117
90. Evaluation of Climate Resilient Genotypes of Pointed Gourd for Agroclimatic Zones of Bihar R.B. Verma, Randhir Kumar and Ravi Kumar 118
91. Characters Association and Path Coefficient Studies for Plant Selection in Pigeonpea (Cajanus cajan (L.) Millsp.) Ajay Tiwari, R.N. Sharma, A.K. Sarawgi and P.K. Chandrakar 119
92. Identification of Potential Donors for Development of Climate-Resilient Aerobic Rice for Water-Short Irrigated Areas of Bihar Anand Kumar, S.P. Singh, Satyendra, Mankesh Kumar, Ravi Ranjan Kumar, R.B.P. Nirala and P.K. Singh 120
93. Stripe Rust Resistance in Himalayan Landraces of Wheat with Relevance to Climate Change and New Pathotypes Evolution B.R. Raghu and O.P. Gangwar 122
94. Assessment of Wheat (Triticum aestivum L.) Cultivars under Irrigated Late Sown Condition K.M. Singh, A.K. Saha, Niraj Prakash, S. Sheraz Mahdi and Hemant Kumar Singh 123
95. Study for Chilling Stress on Early Growth of Boro Rice (O. sativa L.) Seema, N.Y. Azmi, M. Kumar and R. Kumari 124
96. Rainfall Trend Analysis a Part of Sone River basin in Bihar, India, from 46 Year Record (1969–2014) MD Jafri Ahsan and Mohd Imtiyaz 126
97. Thermal and Radiation Use Efficiency of Wheat under Different Growing Environments and Irrigation Levels M.K. Nayak, Diwan Singh, Mahender Singh, Anil Kumar and Raj Singh 127
98. Exo-Polysaccharide Producing Bacterial Diversity and Activity under Elevated Carbon Dioxide and Moisture Stress Condition in Rice Soil Debasmita Dutta, Mohammad Shahid, A. Kumar and A.K. Nayak 128
It is I
LLEGAL t
o cop
y, pri
nt or
save
any c
onten
t of th
is PDF,
in pa
rt or in
full,
on an
y retr
ieval
syste
m,
withou
t the E
XPRESS WRITTEN PERMISSIO
N of th
e cop
yrigh
t-hold
er

National Conference on Climate Change and Agricultural Production: Adapting Crops to Climate Variability and Uncertainty, 6th–8th April, 2017
[xvi]
99. Response of Rice Growth, Water Productivity, Plant Water Status and Antioxidant Metabolite Activities under Anticipated Elevatedatmospheric CO2
Concentrationand Water Deficit Stress Anjani Kumar, A.K. Nayak and B.S. Das 130
100. Assessment of Integrated Nutrient Management Strategies in rabi Maize Vinod Kumar, Mukesh Kumar, Ashok Kumar and M.K. Singh 131
101. Optimization of Irrigation and Fertilizer Scheduling based on Climatological Data and the Predicted Data for the Cropping Period using Cropwat 8.0 for Hybrid Maize Under Fully Automated Drip Irrigation Arthi T. and K. Nagarajan 133
102. Development of a Sensors System for Efficient Water Management and Agricultural Productivity based on Smart Irrigation A. Selvaperumal and K. Ramasamy 135
103. Carbon Density and Sequestration by Conifer Tree Species of Shankaryacharya Reserve Forest Shazmeen Qasba, T.H. Masoodi, S.J.A. Bhat, P.A. Sofi and G.M. Bhat 137
104. Carbon Storage and Mitigation Potential of Cupressus torulosa (Himalayan cypress) in Kashmir Valley Nasir Rashid Wani, Khwaja Naved Qaisar, Shazmeen Qasba and Amir Farooq Bhat 139
105. Greenhouse Gas Emission from Selected Cropping Patterns in Bangladesh M.M. Haque, J.C. Biswas, M Maniruzzaman, A.K. Choudhury, U.A. Naher, B. Hossain, S. Akhter, F. Ahmed and N Kalra 141
106. Crop Adaptation and Management Interventions for Climate Resilient Agriculture Identification of Climate Resilient Production System and Crop under Semi-Arid Tropics (SAT) M. Shamim, N. Ravisankar, A.S. Panwar, A.B. Singh and K. Ramesh 142
107. Biodiesel Fuel Production from Algae Oil using Crude Enzyme of Newly Isolated Aneurinibacillusmigulanus Strain Chavan Dhanpal and C.N. Khobragade 144
108. Optimization of Sowing Window and Fertilizer Dose for Enhancing the Productivity of Okra (Abelmaschusasculentus) in Changing Climatic Scenario S.K. Rai and P.K. Singh 145
THEME 2: WEATHER BASED INFORMATION, CROP SIMULATION MODELING AND REMOTE SENSING APPLICATIONS IN CLIMATE CHANGE
Weather Based Information on Risks Management in Agriculture Crop Simulation Modeling and Remote Sensing Applications in Climate Change
109. Quantification of Relationship of Weather Parameters with Cotton Productivity Premdeep, Ram Niwas, M.L. Khichar, Abhilash and Sagar Kumar 149
110. Temporal Change in Tal and Diara Lands and Their Impact on Agriculture: A Case Study of Bhagalpur District, Bihar, India Binod Kumar Vimal, N. Chattopadhayay, C.D. Choudhary, Anshuman Kohli, Y.K. Singh, Rakesh Kumar, Sunil Kumar, Ragni Kumari, Sweta Shambhawi, Vinay Kumar, Jajati Mandal, Rajeev Padbhushan, Ghanshyam Singh and Rajkishore Kumar 150
It is I
LLEGAL t
o cop
y, pri
nt or
save
any c
onten
t of th
is PDF,
in pa
rt or in
full,
on an
y retr
ieval
syste
m,
withou
t the E
XPRESS WRITTEN PERMISSIO
N of th
e cop
yrigh
t-hold
er

National Conference on Climate Change and Agricultural Production: Adapting Crops to Climate Variability and Uncertainty, 6th–8th April, 2017
[xvii]
111. Statistical Modelling for Forecasting of Pearl millet Productivity based on Weather Variables Satvinder Kour, P.R. Vaishnav, S.K. Behera and U.K. Pradhan 151
112. Sensitivity Analysis of InfoCrop Model for Indian-Mustard Cultivars in Western Region of Haryana Yogesh Kumar, Raj Singh, Anil Kumar, Sagar Kumar and M.K. Nayak 152
113. Drought Investigation in Srinagar Region of Kashmir using Standard Precipitation Index Sabah Parvaze, Latief Ahmad, R.H. Kanth, Saqib Parvaze and S. Sheraz Mahdi 154
114. Weather based Forewarning of Predators in Tasar Silkworm (Antheraea mylitta D) at Kathikund, Dumka (Jharkhand-India) J. Singh, A. Kumar, S. Mukherjee, G.P Singh, S. Ray, T. Pandiaraj and A.K. Sinha 155
115. Modeling Rice-Wheat Yield Estimation over a Sub-Humid Climatic Environment of Bihar, India S. Sheraz Mahdi, Mizanul Haque, R.K. Sohane, Sunil Kumar, Swaraj Kumar Dutta, S.K. Gupta and Suborna Roy Choudhury 156
116. Sensitivity Analysis of DSSAT CROPGRO-Cotton Model for Cotton under Different Growing Environments Sagar Kumar, Ram Niwas, M.L. Khichar, Yogesh Kumar, Amit Singh Premdeep and Abhilash 157
117. Assessment of Soil Fertility of Tal and Diara Land using Remote Sensing and GIS Techniques: A Case Study of Bhagalpur District, Bihar, India Sumitap Ranjan, Binod Kr. Vimal, C.D. Choudhary and Rajkishore Kumar 158
118. Estimation of Evapotranspiration using Variable Infiltration Capacity Model and Artificial Neural Network Sirisha Adamala and Ankur Srivastava 159
119. Estimation of Monsoon Season Rainfall and its Sensitivity Analysis using Artificial Neural Networks Bhaskar Pratap Singh, Pravendra Kumar, Tripti Srivastava and Vijay Kumar Singh 161
120. Agricultural Risk Management through Weather based Insurance Sankhyashree Roy and S.K. Acharya 162
121. Multi-Temporal Analysis of Sentinal-1 SAR Data for Urban Flood Inundation Mapping-Case study of Chennai Metropolitan City Sreechanth S. and Kiran Yarrakula 163
122. Modeling Residue Concentration of Chlorpyrifos in Apple Cultivation using HYDRUS-1D Samreen Nabi, J.N. Khan, Latief Ahmad, Sabah Parvaze, Saqib Parvaze, I. Mehraj, S.S. Mahdi and R.H. Kanth 165
123. Statistical Comparison of Reference Evapotranspiration Methods in Lalgudi Taluk, Trichy P.R. Anjitha Krishna and R. Lalitha 167
124. Modeling of Runoff using Curve Expert for Dachigam-Telbal Catchment Mehlath Shah, Syed Midhat Fazil, Shahzad Faisal, Latief Ahmad and Anaum Chishti 168
It is I
LLEGAL t
o cop
y, pri
nt or
save
any c
onten
t of th
is PDF,
in pa
rt or in
full,
on an
y retr
ieval
syste
m,
withou
t the E
XPRESS WRITTEN PERMISSIO
N of th
e cop
yrigh
t-hold
er

National Conference on Climate Change and Agricultural Production: Adapting Crops to Climate Variability and Uncertainty, 6th–8th April, 2017
[xviii]
125. Modeling of Water Movement under Organic and Inorganic Conditions in a Polyhouse Iqra Mehraj, J.N. Khan, Latief Ahmad, Sabah Parvaze, Samreen Nabi and R.H. Kanth 169
126. A Crop Simulation Approach: To Estimate the Growth and Yield Response of Potato under Present Climatic Variability Priyanka Singh, S. Naresh Kumar, K.K. Singh and Arpita Rastogi 171
127. Land Use Land Cover Changes in Dal Catchment in Srinagar, J&K Anaum Chishti, J.N. Khan, Mehlath Shah, Samreen Nabi, Syed Midhat, Iqra Mehraj, Sabah Parvaze, Mir Ikhlaq Ahmad, Latief Ahmad and Sameera Qayoom 172
128. Assessment of Groundwater Contamination Vulnerability by using Drastic Model In Relation To Agriculture Production Sujitha E. and Shanmuga Sundaram K. 173
129. Impacts of Local and Large Scale Weather Phenomenon on Crop Yield Variability in Eastern India B.S. Dhekale, S. Sheraz Mahdi and K.P. Vishwajith 174
THEME 3: NATURAL RESOURCE MANAGEMENT, INFORMATION & COMMUNICATION MANAGEMENT CONCERNING CLIMATE SMART AGRICULTURE
Natural Resource Management for Sustainable Agriculture Climate Change and Horticulture Information & Communication Management Concerning Climate Smart Agriculture
130. Productivity and Economics of Wheat in Pearlmillet-Wheat Cropping System as Affected by Various Nutrient Sources in Sandy Loam Soils Babli and Pawan Kumar 179
131. Growth and Yield of Different Wheat Varieties under Agri-Silvi-Horticultural System in Semi-Arid Region of India Vishal Johar, R.S. Dhillon, K.K. Bhardwaj, Tarun Kumar, S.B. Chavan and Vinita Bisht 180
132. Periodic Changes in Light Intensity Under Populus Deltoides based Agroforestry System in North-Western India Chhavi Sirohi, K.S. Bangarwa and R.S. Dhillon 182
133. Effect of Fertilizer and Organic Manures on Growth and Yield Attributes of Wheat and Paddy Variety under Casuarina (Casuarina equisetifolia) based Agrisilviculture System Neeraj, O.P. Rao, Pradyuman Singh, K.S. Bangarwa and Vinita Bisht 183
134. Impact of Integrated Nutrient Management on Soybean (Glycine Max L. Merill) under Temperate Environment Conditions M.A. Aziz, S.S. Mahdi, Tahmina Mushtaq, Tahir Mushtaq and Tajamul Islam 185
135. Effect of Real Time Nitrogen Management on Performance of Rice (Oryza sativa L) Rama Kant Singh, Pankaj Kumar, S.K. Singh, S.B. Singh and S.K. Sinha 186
136. Establishment of in vitro Micropropagation Protocol for Rose (Rosa x hybrida) C.V. Raktagandha, Shyama Kumari, Kanwar Pal Singh, Surendra Kumar, Meenu Kumari and Subhashish Sarkhel 187
It is I
LLEGAL t
o cop
y, pri
nt or
save
any c
onten
t of th
is PDF,
in pa
rt or in
full,
on an
y retr
ieval
syste
m,
withou
t the E
XPRESS WRITTEN PERMISSIO
N of th
e cop
yrigh
t-hold
er

National Conference on Climate Change and Agricultural Production: Adapting Crops to Climate Variability and Uncertainty, 6th–8th April, 2017
[xix]
137. Diversity of Energy Plant Species: Key Driver for Sustainable Biofuel Production in India Mukul Kumar and Prasann Kumar 188
138. Dynamics of Microbial Communities in Metal Polluted Areas of Heterogeneous Environments: An Overview Prasann Kumar 189
139. Novel Molecular Screening Tools for Analysis of Free-Living Diazotroph in Soil Saurabh Kumar Choudhary and Prasann Kumar 190
140. Influence of Different Establishment Methods and Sources of Nitrogen on Productivity of Rice (Oryza sativa L.) Md. Naiyar Ali, P.C. Pandey, Akhilesh Sah, Tajwar Izhar and A.B. Kujur 191
141. Response of Nitrogen Management Practices on Productivity of Various Varieties of Late Sown Wheat (Triticum aestivum L.) Abhinav Kumar, R.A. Singh and Neha Sharma 192
142. Effects of Land Use on Soil Properties of Banka District, Bihar Amarjeet Kumar, Yanendra Kumar Singh, Rajeev Padbhushan, Anshuman Kohli, Akhilesh Sah, Mainak Ghosh, Bipin Bihari and Samrat Adhikary 194
143. Bio-Efficacy of Sequential Application of Herbicides in Direct Seeded Rice (Oryza sativa) Ajay Singh, D.P. Nandal and S.S. Punia 195
144. Determination of Critical Limits of Available Phosphorus for Indian Mustard (Brassica juncea L.) in Vijaypur Soil of Jammu Region by Linear Response Plateau Model M. Nayeem Sofi and Sanjay Swami 196
145. Optimizing Rate of Fluchloridone 20% CS Herbicide in Sunflower R.K. Singh and Vishal Tyagi 198
146. Diversity and Pollination Efficiency of Insect Pollinators of Potential Tree Lasora (Cordia myxa L.) Anoosha Vadde, Sumit Saini, Sunita Yadav and H.D. Kaushik 199
147. Impact of Long Term Green Manuring on Adsorption-Desorption Behavior of Zinc in Calcareous Soil Sunil Kumar, Amit Kumar Pradhan, S.C. Paul, Ghanshyam and Dhananjay Kumar 201
148. Performance of Wheat under need based Nitrogen Management Strategies and Different Tillage Options in Eastern Indo-Gangetic Plains Mizanul Haque, Mainak Ghosh, S.S. Mahadi, Tejpratap and Birendra Kumar 202
149. Effect of Growth Regulators and Micronutrients on Quality of Strawberry (Fragaria x ananassa Duch) cv. Winter Dawn Indira Yadav, Jitendra Singh and Bharat Meena 203
150. Effect of Integrated Nutrient Management on Soil Fertility and Productivity in Wheat-Rice Cropping System for Mitigating Climate Change Birendra Kumar, S. Sheraz Mahdi, Sanjay Kumar, M. Haque and S.K. Mukhopadhyay 205
151. Sustainable Utilization of Wastes for Enhancement of Biogas Production Shikha Mehta, R.C. Anand, Kamla Malik, Hemanta and Naveen Kumar 206
It is I
LLEGAL t
o cop
y, pri
nt or
save
any c
onten
t of th
is PDF,
in pa
rt or in
full,
on an
y retr
ieval
syste
m,
withou
t the E
XPRESS WRITTEN PERMISSIO
N of th
e cop
yrigh
t-hold
er

National Conference on Climate Change and Agricultural Production: Adapting Crops to Climate Variability and Uncertainty, 6th–8th April, 2017
[xx]
152. Screening of Low P Tolerant Rice Cultivars under Organic and Sustainable Agriculture Himanshu Patel, Vidyanand Mishra, Brajendra, Rajkamal Patel and Amarjeet Kumar 208
153. Yield Attributes, Yield and Economics of Bed Planted Barley Cultivars in Relation to Crop Geometry and Moisture Regimes Naveen Kumar, Suresh Kumar, S.K. Kakraliya and Mohinder Singh 209
154. Assessment of Genetic Variation among Different Provenances of Acacia nilotica CPTs for Seed Traits Amit Singhdoha, R.S. Dhillon and K.S. Bangarwa 210
155. Effect of Minimum Tillage on Yield and Yield Contributing Characters of Sweet Corn-Pulses Intercropping System A.D. Deshmane, M.R. Ghanbahadur, K.R. Chavhan and N.K. Bodkhe 211
156. Analysis of Value Added Traditional Product (kadhi) Containing Fresh Green Beans Mamta Rani and Darshan Punia 212
157. Importance of Antioxidant Enzymes in the Survival of Rice Seedlings after De-Submergence Manjri, A.K. Singh, Sarita Devi Gupta and Akanksha Singh 214
158. A Study on Adaptation Behaviour of Farmers in Ranchi, Jharkhand Varsha Kumari and O.P. Mishra 215
159. Genetic Diversity Analysis in Groundnut (Arachis hypogaea L.) Genotypes using D Statistics Tulsi Ram Dhakar, Hemlata Sharma, Namrata and Prashant Bisen 216
160. Evaluation of Growth and Yield Parameters of Cotton Hybrids as Influenced by Different Growing Environments Abhijeet Sharma, M.L. Khichar, Ram Niwas and Premdeep 217
161. Production and Marketing Constraints of Milk in Rewari District of Haryana Manish Yadav, Ashok Dhillon, Jitender Kumar Bhatia and Dalip Bishnoi 219
162. Effect of Zinc Application on Marketable Leaf Production of Betelvine Shivnath Das, Prabhat Kumar and Ajit Kumar Pandey 220
163. Evaluation of Tomato Varieties under Protected Condition for Growth, Yield and Quality U. Thapa, R. Mondal and T. Gupta 222
164. Impact of Tillage Systems, Cropping Systems, Nutrient Management and Mulch on Crop Productivity and Profitability W.N. Narkhede, R.N. Khandare, G.S. Khazi and M.J. Bende 223
165. Effect of Eucalyptus Bund Plantation on Yield of Agricultural Crops and Soil Properties in Semi-Arid Region of India K.K. Bhardwaj, R.S. Dhillon, K.S. Bangarwa, Sushil Kumari, V. Dalal and S.B. Chavan 224
166. Effect of Different input Factors on Growth and Yield of Soybean [Glycine max (L.) Merill] A.S. Karle, R.V. Gite, D.N. Gokhale and G.S. Khazi 225
It is I
LLEGAL t
o cop
y, pri
nt or
save
any c
onten
t of th
is PDF,
in pa
rt or in
full,
on an
y retr
ieval
syste
m,
withou
t the E
XPRESS WRITTEN PERMISSIO
N of th
e cop
yrigh
t-hold
er

National Conference on Climate Change and Agricultural Production: Adapting Crops to Climate Variability and Uncertainty, 6th–8th April, 2017
[xxi]
167. Productivity and Economics of Soybean (Glycine Max L. Merill) as Influenced by Major Production Constraints R.V. Gite, A.S. Karle, G.S. Khazi and D.N. Gokhale 227
168. Effect of Nutrient Levels and Weed Management on Weed Dynamics and Yield of Hybrid Rice (Oryza sativa) Manish Ranjan, Md Riton Chowdhury and I.B. Pandey 228
169. Morphological Characterisation and Media Preferences in Wilsonomycescarpophilus, the Causal Agent of Shot Hole Disease of Stone Fruits in Kashmir Asha Nabi, M.D. Shah, B.A. Padder, M.S. Dar and Mushtaq Ahmad 230
170. Effects of Biofertilizers on Yield and Protein Content of Pearlmillet (Pennisetum glaucum L.) Durgesh Singh, Krishna Raghuvanshi, Abhishek Sagar, Asheesh Chaurasiya, S.K. Pandey and P.J. George 231
171. Influence of Pressurised Irrigation with Fertigation on Nutrient Uptake, Yield and Quality Parameters of Groundnut Jeetendra Kumar Soni, N. Asoka Raja, Vimal Kumar and Ashutosh Kumar 233
172. Interaction Effect of Foliar Spray of Boron, Zinc and Iron on Yield of Gynoecious Cucumber under Polyhouse Condition Dharmendra Kumar Patidar, Pravin Singh and Balram Meena 234
173. Influence of Potassium and Zinc Application on Growth and Yield Traits of Sweet Potato (Ipomoea batatas L.) cv. CO-34 Pravin Singh, Dharmendra Kumar Patidar and Om Prakash Prajapat 236
174. Effect of Combining Organic and Inorganic Fertilizers and Weed Management for Sustained Productivity of Aromatic Rice Pooja Kumari and D.K. Roy 237
175. Herbicides Combinations for Control of Complex Weed Flora for Sustained Wheat Production D.K. Roy and Dharminder 238
176. Unsung Hero of Carbon Assimilation: Exploring the Heat Stable RuBisCO Activase from Wheat and Characterizing their Role in Activation of RuBisCo for the Development of ‘Climate-Smart’ Crop R.R. Kumar, Suneha Goswami, G.K. Rai, Viswanathan Chinnusamy and Shelly Praveen 240
177. Estimation of Crop Water Requirement using CROPWAT v8.0 Model for Bina Command Area, Madhya Pradesh Anshu Gangwar, T.R. Nayak, R.M. Singh and Ashutosh Singh 241
178. Effect of Genotype and Planting Geometry on Cormyield and Quality of Gladiolus (Gladiolus x hybridus Hort.) Balram Meena, Dharmendra Kumar Patidar and Pravin Singh 242
179. Effect of Different Row Arrangement on Performance of (Linum usitatissimum L.) + Dwarf Field Pea (Pisum sativum L.) Intercropping Association Shiv Bahadur 244
It is I
LLEGAL t
o cop
y, pri
nt or
save
any c
onten
t of th
is PDF,
in pa
rt or in
full,
on an
y retr
ieval
syste
m,
withou
t the E
XPRESS WRITTEN PERMISSIO
N of th
e cop
yrigh
t-hold
er

National Conference on Climate Change and Agricultural Production: Adapting Crops to Climate Variability and Uncertainty, 6th–8th April, 2017
[xxii]
180. Effect of Tree Spacings on Litter Productionand Decomposition under Eucalyptus tereticornis based Agroforestry System Tarun Kumar, Bimlendra Kumari, K.S. Bangarwa and Vishal Johar 245
181. Effect of Light Intensity on Yield of Wheat under Eucalyptus tereticornis SM. based Agri-Silvi-Horticultural System Vishal Johar, R.S. Dhillon, K.K. Bhardwaj, Vinita Bisht and Tarun Kumar 246
182. Effect of Conservation Tillage Practices and Maize Residues on Weed-Wheat Ecosystems Pravin Kumar Upadhyay, K. Ramesh, S.K. Choudhary and R.K. Singh 248
183. Effect of Climate Change on Banana Scarring Beetle (Basilepta sp., Colaspis sp.) in Koshi Region of Bihar, India Shyam Babu Sah, Gireesh Chand, S. Prakash and Rajesh Kumar 250
184. Changes in pH during Earthworm, Eudrilus eugeniae (Kinberg) Mediated Vermicomposting of Different Types of Wastes Shefali and R.K. Gupta 251
185. Performance of Wheat Crop under Eucalyptus tereticornis based Agroforestry System in North-East India Vinita Bisht, K.S. Bangarwa, R.S. Dhillon and Vishal Johar and Pradyuman Singh 252
186. Effect of Moisture Regimes on Physiological and Biochemical Parameters of Chickpea (Cicer arietinum L.) Genotypes Maniram, Raj Bahadur, Ompal Singh, Anjali Tiwari, Sunil Prajapati and A.H. Khan 254
187. Effect of Diversification and Intensification of Rice-Wheat Cropping System on Weed Dynamics in Different Vegetable based Crop Sequences in Nalanda District of South Bihar S.K. Chaudhary, A.K. Singh, S.K. Yadav, M.K. Singh, P.K. Singh and Pawan Kumar 255
188. Impact of Multifunctional Actinomycetes on Saline Soil and Growth Promotion in Maize (Zea mays) Vinita Verma 256
189. Inoculation Effects with Penicillium Bilaii on Maize (Zea mays) S.S. Walia and Vikrant Dhawan 258
190. Water Credits: A Potential Benefactor and Game Changer for Indian Farmers in Climate Change Scenario M.I. Bhat, S.A. Bangroo, Faisul Ur. Rasool and S.S. Mahdi 259
191. Dissemination and Utilization of Market Information System by Farmers for Gram Crop in Bhiwani District of Haryana Veer Sain, K.K. Kundu and V.P. Mehta 260
192. Impact of Different Levels of Vermicompost in Various Combinations with Chemical Fertilizers on Yield of Wheat Crop and Soil Properties Deo Kumar, Ashok Kumar, S.K. Gupta and R.N. Gupta 262
193. Alteration in Antioxidant Enzyme Activity by Chromium in Sorghum Bicolor (L.) Sweety Sihag, Neha Wadhwa, U.N. Joshi, Anjali Dahiya and Ritu Saini 263
It is I
LLEGAL t
o cop
y, pri
nt or
save
any c
onten
t of th
is PDF,
in pa
rt or in
full,
on an
y retr
ieval
syste
m,
withou
t the E
XPRESS WRITTEN PERMISSIO
N of th
e cop
yrigh
t-hold
er

National Conference on Climate Change and Agricultural Production: Adapting Crops to Climate Variability and Uncertainty, 6th–8th April, 2017
[xxiii]
194. Yield and its Attributes Affected by Different Sowing Dates and Different Maturity Classes Cultivar on Direct Seeded Rice Sucheta Dahiya, S.S. Punia, Jagdev Singh, S.K. Kakraliya and Balwinder Singh 265
195. Effect of Different Levels of Micronutrients and FYM on Plant Growth, Survival Percentage and Establishment of Pomegranate, Punica Granatum (L.)Cv. Khandhari under Allahabad Agro Climatic Conditions Amit Pandey, V.M. Prasad, Prateek Singh, V. Manju Vani and Deepak Kumar Jaiswal 266
196. Influence of Nitrogen and FYM Application on Quality of Pear (Pyrus pyrifolia Nakai) in North India Shahroon Khan, R.K. Godara and R.S. Malik 267
197. Standardization of Time of Grafting and Scion Cultivars for Epicotyl Grafting under Western Uttar Pradesh Conditions Sohanveer, Satya Prakash, Manoj Kumar Singh, Syed Sami Ullah and Ranjeet Kumar 268
198. Impact of Tillage Practices on Growth, Yield and Economics of Lathyrus under Rainfed Rice based Cropping System of Chhattisgarh Tej Ram Banjara, G.P. Pali and Abhishek Shori 269
199. Analytical Study on Fabrication of Family Size Biomass Cooking Gas Stove using Natural Biomass as Fuel Dinesh Kumar, Kranti Kumar, R.M. Singh and Akhilesh Kumar 271
200. Productivity and Soil Fertility of SugarcanePlant-Ratoon in Sub-Tropical Region under Integrated Nutrient Management System S.K. Sinha, C.K. Jha, Vipin Kumar and S.K. Thakur 272
201. Enhancing Soil Fertility, Nutrient Uptake and Sugarcane Productivity through Integrated Use of Iron and Organics in Sub-Tropical System C.K. Jha, S.K. Sinha, Vipin Kumar, Smita Kumari and S.K. Thakur 273
202. Nutrient Uptake and Tuber Yield Influenced by Nitrogen Levels and Fertigation Frequency in Potato (Solanum tuberosum L.) Vikram Ghiyal, A.K. Bhatia and V.K. Batra 274
203. Effect of Endomycorrhizae Inoculation on Growth of Direct Seeded Rice under Alluvial Soil Ranjeet Kumar, Mahendra Singh, G.S. Panwar and Rajiv Rakshit 275
204. Comparative Assessment of Physicochemical and Biological Quality Characters of Vermicompost from Different Biomass Substrates Ajeet Kumar, Sankar Ch. Paul, Rajiv Rakshit, Mahendra Singh, Sunil Kumar and Amit Kumar Pradhan 277
205. Spatial Distribution of Lead in Soils of Different Agro-climatic Zones of Jharkhand Rakesh Kumar, Shweta Shambhavi, Rajkishore Kumar and Sunil Kumar 278
206. Effect of Integrated Nutrient Management on Yield of Maize and Soil Fertility R.K. Singh 279
207. Studies of Vase Life and Corm Characters in Gladiolus (Gladiolus hybridus Hort.) Genotypes Dhara Singh, Ashutosh Mishra, Jitendra Singh and Balram Meena 281
It is I
LLEGAL t
o cop
y, pri
nt or
save
any c
onten
t of th
is PDF,
in pa
rt or in
full,
on an
y retr
ieval
syste
m,
withou
t the E
XPRESS WRITTEN PERMISSIO
N of th
e cop
yrigh
t-hold
er
National Conference on Climate Change and Agricultural Production: Adapting Crops to Climate Variability and Uncertainty, 6th–8th April, 2017
[xxiv]
208. Performance of Baby Corn under Different Plant Densities and Fertility Levels in Lateritic Soils of Eastern India Mainak Ghosh, Swapan Kumar Maity, Sanjeev Kumar Gupta
and Arnab Roy Chowdhury 282 209. Effect of Integrated Nutrient Management on the Growth and Yield of Wheat
(Triticum aestivum L.) R.N. Maurya, Shiv Bahadur, A.C. Yadav and R.A. Yadav 284
210. Effect of Fertility Levels and Biofertilizers on Macro Nutrient Content and Uptake by Black Gram (Vigna Mungo L.) Chetan Kumar Jangi, D.P. Singh and Jitendra Sharma 285
211. Performance of Rice under Various Establishment Methods and Different Cropping Systems in Indo-Gangetic Plains of Bihar Prashant Kumar, Sanjay Kumar, Mainak Ghosh, Koushik Sar, Vinod Kumar, Prince Kumar, Swaraj Kumar Dutta, Mizanul Haque, Vivek and Ranjeet Kumar 286
212. Effect of Different Seed Rate and Row Spacing on Growth, Yield and Yield Attributes of Aerobic Rice (Oryza sativa L.) Ambuj Gautam, V.K. Verma, Alok Pandey and V. K. Srivastava 288
213. Assessment of Performance of Balanced Fertilization and Integrated Use of Vermicompost on Yield of Okra (Abelmoschus esculentus L.) var. Kashi Kranti K.P. Singh, C.N. Choudhary, Rakesh Kumar, Ratan Kumar and R.K. Sohane 289
214. Effect of Microbes and Fertilizers on Growth and Yield of Cabbage (Brassica oleracea L. var. capitata) Kamal Kant, Devi Singh and V.M. Prasad 291
215. Implication of Nitrogen and Phosphorus on Nutrient Content and Uptake in Grain and Fodder of Popcorn (Cv. Zea mays variety everta) Shalini Kumari and Solanki Dharmik Ratilal 292
216. Influence of Photoselective Shed Net on Quality Production of Litchi Fruits S.K. Purbey, Amrendra Kumar, S.D. Pandey and Alemwati Pongener 293
217. Nutrient Dynamics during Fruit Growth of Various Mango Cultivars Rajni Sinha, Md. Feza Ahmad and U.S. Jaiswal 294
218. Influence of Date of Sowing on Yield Attributes and Yield of Linseed (Linum usitatissimum L.) Varieties under Dryland Condition in Eastern Uttar Pradesh Avinash Chandra Maurya, Raghuveer M., Gargi Goswami and Santosh Kumar 296
219. Influence of Different Establishment Techniques in Rice based Cropping Systems on Productivity, Economics and Soil Health Sanjay Kumar, S.K. Dutta, Ravi Gopal Singh, G.S. Panwar, Rakesh Kumar, Sunil Kumar, K. Beura, Sunil Kumar, B. Kumar, S. Suman and Prashant Kumar 297
220. Multiple Shoot Regeneration in Zea Mays L. (Jk Hybrid Parental Line) from Meristem Region Preeti, Pratima Chaudhary and Himanshu Shekhar Garg 299
221. Changes of Microbial Population in Rhizosphere of Mustard (Brassica juncea L.) due to Various Mulches with RDF Jayant Shekhar, Bihari Ram Maurya and Indra Bahadur 300
It is I
LLEGAL t
o cop
y, pri
nt or
save
any c
onten
t of th
is PDF,
in pa
rt or in
full,
on an
y retr
ieval
syste
m,
withou
t the E
XPRESS WRITTEN PERMISSIO
N of th
e cop
yrigh
t-hold
er

National Conference on Climate Change and Agricultural Production: Adapting Crops to Climate Variability and Uncertainty, 6th–8th April, 2017
[xxv]
222. Growth, Yield and Quality of Indian Mustard (Brassica juncea L.) Influenced by Dose and Source of Sulphur Vinod Kumar, Shashank Tyagi, Sushant, S.K. Choudhary, S.C. Paul, S.K. Dubey, Shruti Suman, Prashant Kumar and Koushik Sar 301
223. Crop Diversification for Sustainable Production of Rice based Cropping System through Natural Resources Management Santosh Kumar, Gargi Goswami, Anand Chaudhary, Pankaj Kumar Ray, Ashutosh Singh, Amit Kumar Pandey 303
224. Effect of Sulphur and Vermicompost on Onion (Allium CepaL) under Onion-Maize Cropping System in Calciorthents Vipin Kumar, R. Laik, S.K. Singh and R.K. Prasad 304
225. Climate Resilient Integrated Approach for Increasing Growth, Yield and Economics of Onion (Allium cepa L.) S.K. Sinha, R.B. Verma, V.K. Singh, V.B. Patel, G.S. Panwar and D.K. Bharati 306
226. Foliar Feeding of Micronutrients: A Mitigation Option of Changing Climate to Enhance the Growth, Yield and Quality of Bitter Gourd (Momordica charantia L.) D.K. Bharati, R.B. Verma, V.K. Singh, M. Feza Ahmad, G.S. Panwar and S.K. Sinha and Ravi Kumar 307
227. An Assessment of Genetic Integrity of Strawberry Plants Regenerated by Callus Culture Anuradha, S.K. Sehrawat and D.S. Dahiya 308
228. Response of Growth, Yield and Economics on Different Scented Rice (Oryza sativa L.) Varieties to Different Fertility Levels Tej Partap, Naveen Prakash Singh, Divya Prakash Singh, S.K. Choudhary and Ved Prakash Singh 309
229. Effect on Soil Properties under Poplar-Soybean Intercropping based Agroforestry System Indra Singh, Abhay Kumar and P.R. Oroan 310
230. Mechanical Rice Transplanter: A Tool for Copping Climate Change Ram Pal, Alok Bharti, Devendra Mandal, Ruby Saha and Ajay Kumar 311
231. Effects of Anti-browning Agents on Quality Characters of Agaricus bitorquis (Quel.) Sacc. Varsha Bharti, Shaheen Kausar, Shazia Paswal, Seethiya Mahajan and Shahida Ibrahim 313
232. Effect of Foliar Spray of Chemicals on Fruit Yield and Quality of Mango (Mangifera Indica L.) Cv. Langra under Changing Climate Jyoti Kumari, Ravindra Kumar, Sanjay Sahay, M. Feza Ahmad and Syed Razaul Islam 314
233. Assessment of Different Storage Practices for Storage of Pulses for Household Nutritional Security Anita Kumari and Vinod Kumar 315
234. Weed Management Strategies in Pigeonpea under Alfisol and Vertisol Shruti Suman, Gurusharan Panwar, Myer G. Mula, Sanjay Kumar, Mainak Ghosh and Vinod Kumar 316
235. Variations in Morphological and Phenological Traits of Selected Sunflower Populations and Hybrids Reveal their Relative Preference to Four Honey Bees Rinku, O.P. Chaudhary and H.D. Kaushik 318
It is I
LLEGAL t
o cop
y, pri
nt or
save
any c
onten
t of th
is PDF,
in pa
rt or in
full,
on an
y retr
ieval
syste
m,
withou
t the E
XPRESS WRITTEN PERMISSIO
N of th
e cop
yrigh
t-hold
er

National Conference on Climate Change and Agricultural Production: Adapting Crops to Climate Variability and Uncertainty, 6th–8th April, 2017
[xxvi]
236. High Frequency Multiple Shoot Differentiation from Cultured Seeds of Rice Cultivars Rima Kumari, Pankaj Kumar, V.K. Sharma and Harsh Kumar 320
237. Effect of Compaction Levels and Integrated Nutrient Management on Growth and Yield of Chickpea (Cicer arietinum L.) Sumant Kumar, Md. Sarware Alam, Mohmmad Amin Bhat, Pradyuman Singh
and Arun A. David 321 238. Effect of Various Herbicide Molecules on Weed Management in Indian Mustard
(Brassica juncea L. Czern & Coss) A.K. Yadav, R.S. Kureel, V.K. Verma, Tej Pratap and S. K. Dubey 322
239. Evaluation of Different Substrates for cultivation of ‘Pink Pleurotus’ (Pleurotus djamor (Rumph. EX. FR.) Boedijn) Mushroom Shazia Paswal, Seethiya Mahajan, Varsha Bharti and Richa Sharma 324
240. Evaluating Physico-Chemical Attributes Among Different Cultivars of Litchi Grown Under South Zone of Bihar Pushpa Kumari, Kalyan Barman, Muneshwar Prasad and M. Feza Ahmad 325
241. Genotypic Variation of Grain Iron Contents and Agronomic Traits in Rice under Iron Treatment Ritu Saini, Anjali Dahiya, Harnek Singh Saini, Sandeep Gupta and Sunita Jain 326
242. Genetic Architectural Improvement for Yield and Yield Attributes in Elite Genotypes of Bitter Gourd (Momordica charantia L.) Durga Prasad Moharana, M.M. Syamal and Anand Kumar Singh 327
243. Integrated Nutrient Management in Rice (Oryza Sativa) in Red and Lateritic Soils of West Bengal Gayatri Sahu, Nitin Chatterjee and Goutam Kumar Ghosh 329
244. Climate Resilient Agriculture through Engineering Interventions Satish Kumar, Ashok Kumar and Sanoj Kumar 330
245. Transient Allelopathic Propensity of Melia composita Willd. Leaf Litter Allelochemicals on Chickpea (Cicer arietinum L.) N.S. Thakur, Dinesh Kumar and R.P. Gunaga 332
246. Growth and Physiological Parameters of Ocimum spp. under Teak (Tectona grandis L.f.) Ocimum spp. based Silvi-medicinal and Sole Cropping Systems Mukesh Kumar, N.S. Thakur, Kirti Bardhan and J.B. Bhusara 333
247. Inoculation Effects with Penicillium Bilaii on Maize (Zea Mays) S.S. Walia and Vikrant Dhawan 334
248. Performance of Scented Rice Varieties under Different Fertility Levels Naveen Prakash Singh, Tej Partap, Anupam Adarsh, Avaneesh Kumar Yadav, S.K. Dubey, S.K. Chaudhary and Divya Prakash Singh 336
249. Effect of Seed Rate, Row Spacing and Nitrogen Levels on Growth, Yields and Economics of Malt Barley Seema Dahiya, Jagdev Singh, Bhagat Singh and Rajbir Singh Khedwal 337
250. Impact of Climate Change on Cultivation of off-Season Summer Squash under Low Tunnel in Bihar Region Satish Kumar, Alok Kumar and Sardar Sunil Singh 338
It is I
LLEGAL t
o cop
y, pri
nt or
save
any c
onten
t of th
is PDF,
in pa
rt or in
full,
on an
y retr
ieval
syste
m,
withou
t the E
XPRESS WRITTEN PERMISSIO
N of th
e cop
yrigh
t-hold
er

National Conference on Climate Change and Agricultural Production: Adapting Crops to Climate Variability and Uncertainty, 6th–8th April, 2017
[xxvii]
251. Site-Specific Nutrient Management with Rice-Wheat Crop in South Bihar Alluvial Plain Zone of India Sanjeev Kumar Gupta, Mainak Ghosh, Anshuman Kohli, Sheetal Sharma, Uday Kumar, Koneru Lakshman, R.K. Sohane, Y.K. Singh, Sunil Kumar, Anand Kumar Jain, Beerendra Singh and K.K. Prasad 340
252. Variations in Soil Properties under Different Land Use Systems in Western Central Agro-climatic Zones of Odisha Dhaneshwar Padhan 342
253. Effect of Preharvest Foliar Spray of Nutrients on Yield and Quality of Apple (Malus domestica Borkh.) in Uttarakhand, India Anjali Tripathi, Shweta Uniyal and Paramjeet Sajwan 343
254. Quantitative and Qualitative Attributes of Aloe vera under Melia composita-Aloe vera and Sole Cropping Systems D.J. Jilariya, N.S. Thakur and R.P. Gunaga 344
255. Standardization of Date of Planting and Variety of Sprouting Broccoli (Brassica oleracea L.var italica Plenk) U. Thapa, R. Mondal, S. Kr. Subba, P.H. Prasad and S. Nandi 346
256. Performance of a Set of Tomato Parental Linesand their Hybrids under Field Conditions of Bengaluru Bharath Kumar M.V., Sadashiva A.T. and Pradeep Kumar Jatav 347
257. Evaluation of Drought Tolerant Rice Varieties under Various Methods of Stand Establishment in Rainfed Drought-Prone Condition of Bihar Rajeev Singh, Nityanand, G.S. Panwar, Sudhanshu Singh and Ashok Yadav 348
258. Influence of Sowing Environments on Yield Attributes and Yield of Wheat (Triticum aestivum L.) Varieties under System of Wheat Intensification and its Effect on Soil Fertility A.K. Sonkar and J.K. Singh 350
259. Effect of Nitrogen Management in Boro Rice during Post-Flood Environment in Rainfed Lowland Rice Ecosystem Pooja, U.P. Singh, J.K. Singh, Swati S. Pradhan and Sandeep Kumar 351
260. Effect of Puddling on Rice Varieties and Succeeding Lentil under Drought-Prone Rainfed Lowland Environment of Eastern India G.S.Panwar, Suborna, Roy Choudhary, Amarendra Kumar, Sanjay Kumar, Sudhanshu Singh, Ashok Yadav and Virendar Kuma R. 353
261. Integrated Weed Management Studies in Onion Sukhjinder Singh, T.R. Nandal and Saurav Sharma 355
262. Weed Management in Direct Seeded Rice in Rainfed Upland Ecology Amit Kumar, G.S. Panwar, Sanjay Kumar, S.R. Chaudhury, Sudhanshu Singh, Ashok Yadav and Ravi Gopal Singh 356
263. Performance of Organic and Inorganic Sources of Nutrients in Paddy Saurav Sharma, J.P. Saini, Ranu Pathania and Sukhjinder Singh 358
264. Effect of Zinc Application under Different Salinity on Yield and Yield Attributes of Wheat Sonia Rani, Manoj Kumar Sharma and Pooja Rani 359
It is I
LLEGAL t
o cop
y, pri
nt or
save
any c
onten
t of th
is PDF,
in pa
rt or in
full,
on an
y retr
ieval
syste
m,
withou
t the E
XPRESS WRITTEN PERMISSIO
N of th
e cop
yrigh
t-hold
er

National Conference on Climate Change and Agricultural Production: Adapting Crops to Climate Variability and Uncertainty, 6th–8th April, 2017
[xxviii]
265. Varietal Performance of Okra (Abelmoschus esculentus L. Moench) on Farmer's Field in Kishanganj District of Bihar Hemant Kumar Singh, K.M. Singh, Niraj Prakash and R.K. Sohane 361
266. Effect of Foliar Sprays of 2, 4-D and Frequency of Application on Pre-harvest Fruit Drop, Yield and Quality in Kinnow Mandarin Hidayatullah Mir, D.B. Singh, H. Itoo and S.R. Dar 363
267. Influence of Integrated Application of Biofertilizers and Chemical Fertilizers on Growth Parameters, Productivity and Profitability of Field Pea (Pisum sativum l.) Sarita Rani, Parveen Kumar and Anil Kumar 364
268. Effect of Aerobic Environment on Physio-Morphological Traits in Aerobic and Lowland Indica Rice Genotypes at Late Vegetative Stage Anjali Dahiya, Harnek Singh Saini, Ritu Saini and Sunita Jain 366
269. Performance of Drought Tolerant Rice Varieties under Various Methods of Crop Establishment in Rainfed Drought-Prone Condition of Bihar Nityanand, Rajeev Singh, G.S. Panwar, Sudhanshu Singh and Ashok 367
270. Correlation and Path Analysis Studies of Yield and Economic Traits in Chilli (Capsicum annuum L.) Ashish Kumar Maurya, M.L. Kushwaha, S.K. Maurya and Yadav Ram P. 369
271. Performance of Tuberose (Polianthes Tuberosa L.) under Varying Planting Time and Spacing Prince, G.S. Rana, D.S. Dahiya, Vivek Beniwal and Arvind Malik 370
272. Effect of Foliar Application of Boron and Molybdenum on Curd Quality of Broccoli (Brassica oleracea L. var. italica Plenk) Atul Patel, Sutanu Maji, Sandeep Kumar Mauriya, Virendra Singh Gehlot
and Kusum Meena 372
273. Evaluation of Rice (Oryza Sativa) based Cropping System by Different Sources of Nutrient in Jharkhand Niru Kumari, C.S. Singh, Diwakar Paswan and Rupa Rani 373
274. Resolving Crop Residue Burning Issue by Engineering Intervention Jitendra Kumar, Satish Kumar, Ashok Kumar and Sanoj Kumar 375
275. Effect of Foliar and Soil Application of Nitrogen on Growth, Yield and Economics of Wheat (Triticum aestivum L.) Nikhil Kumar, M. Haque, Santosh Kumar, Tej Ram Banjara, Hemlata Kumari, Ashish K. Maurya, Neeraj Kumar and Abhishek Shori 376
276. Morphometric and Biochemical Profiling of Promising Myrobalan Accessions (Terminalia chebula Retz.) for Nutritional Security: A Multipurpose Fruit Yielding Agroforestry Tree Mahantappa Sankanur, N.B. Singh, Sanjeev Thakur, Saresh N.V. and Archana Verma 377
277. Influence of Organic Manure, Crop Residues and Inorganic Fertilizers on Microbiological Properties of Calcareous Soil Ashutosh Singh, Amit Kumar Pandey, J. Prasad, Umesh Singh and Santosh Kumar 379
278. Role of Biofertilizer and Chemical Fertilizer for Sustainable Onion (Allium cepa L.) Production V.K. Singh, Amrita Kumari, V.K. Chaudhary and S. Shree 380
It is I
LLEGAL t
o cop
y, pri
nt or
save
any c
onten
t of th
is PDF,
in pa
rt or in
full,
on an
y retr
ieval
syste
m,
withou
t the E
XPRESS WRITTEN PERMISSIO
N of th
e cop
yrigh
t-hold
er

National Conference on Climate Change and Agricultural Production: Adapting Crops to Climate Variability and Uncertainty, 6th–8th April, 2017
[xxix]
279. Evaluation of Melia composita Willd. Families for Germination Traits and Growth Variation at Nursery Stage R.S. Chauhan, N.S. Thakur, M.S. Sankanur, H.T. Hegde and S.K. Jha 381
280. Effect of Different Level of Nitrogen and Phosphorus on Dry Matter Yield at Different Growth Stages of Popcorn in Saurashtra Region of Gujarat P.J. Marsonia, Shalini Kumari, Santosh Kumar, Ramjeet Yadav and Rajkishore Kumar 383
281. In Vitro Propagation of Banana cv. Grand Naine Ravi Kumar, Feza Ahmad, Hidayatullah Mir and R.K. Sohane 384
282. Effect of Nutripriming and Mulching on Growth and Yield of Chickpea (Cicer arietinum L.) under Limited Irrigation K. Pramanik and S. Poddar 385
283. Long Term Influence of Organics and Inorganic Fertilizer on Distribution and Transformation of Boron under Rice-Wheat Cropping System in Calciorthents Amit Kumar Pandey, Ashutosh Singh, J. Prasad and Umesh Singh 387
284. Engineering Interventions for Reducing Postharvest Losses in Food Grains under Climate Smart Agriculture in Bihar Ashok Kumar, Satish Kumar, Sanoj Kumar, Prasanta Kalita and Kent Rausch 388
285. Information and Communication Technology for Knowledge Management in Climate Smart Agriculture C.K. Panda and S.R. Singh 389
286. Study on Flowering Behaviour of Elite Mango Cultivars in Subtropical Conditions of Bihar Khushboo Azam, Hidayatullah Mir, Ravindra Kumar and Bishun Deo Prasad 390
287. In Vitro Multiplication of Guava Rootstocks: Psidium Guajava cv. Lucknow-49 and Psidium Friedrichsthalianum (Chinese Guava) Shashi Kala, Suneel Sharma, Subhash Kajla and Hidayatullah Mir 391
288. Effect of Irrigation Levels and Nitrogen Doses on Crop Water Use and Water Use Efficiency of Late Sown Wheat Mukesh Kumar, R.K. Pannu and Bhagat Singh 393
289. Impact of Natural Resource Management Intervention under National Innovation in Climate Resilient Agriculture (NICRA) Project in Jehanabad District of Bihar: Some Reflections Shobha Rani, Jeetendra Kumar, A.K. Singh and R.K. Sohane 394
290. Impact of Improved Crop Interventions Suitable for Climate Resilient Agriculture Shobha Rani, Jeetendra Kumar, A.K. Singh and R.K. Sohane 396
291. Rooting of Black Pepper (Piper nigrum) Cuttings as Influenced by Media Pranay Kumar and D.K. Ghosh 397
292. Effect of Different Sources of Nutrient Combination and Vermicompost on Growth and Yield of Mungbean (Vigna radiata L. Wilczek) Shashidhar Yadav, R.B. Yadav and Vinay Kumar 399
293. Simple and Efficient Method for the Extraction of Genomic DNA in Litchi (Litchi chinensis Sonn.) Hidayatullah Mir, Abha Kumari, Bishun Deo Prasad, Ruby Rani and Feza Ahmad 400
It is I
LLEGAL t
o cop
y, pri
nt or
save
any c
onten
t of th
is PDF,
in pa
rt or in
full,
on an
y retr
ieval
syste
m,
withou
t the E
XPRESS WRITTEN PERMISSIO
N of th
e cop
yrigh
t-hold
er

National Conference on Climate Change and Agricultural Production: Adapting Crops to Climate Variability and Uncertainty, 6th–8th April, 2017
[xxx]
294. Effect of Organic and Inorganic Fertilizers on Growth, Yield and Quality Attributes of Hybrid Bitter Gourd (Momordica charantia L.) Sangeeta Shree, Champa Lal Regar, Fiza Ahmad and Amrita Kumari 402
295. Influence of Seed Rate and Nitrogen Levels on Photosynthetic CO2 Assimilation, Chlorophyll Content on Growth and Productivity of Dual Purpose Wheat Cultivars R.D. Ranjan, C. Azad, A.S. Gontia, S. Kumar and A.K. Pal 403
296. Quality and Production of Pearl Millet [Pennisetum glaucum (L.) R. Br. Emend Stuntz] as Influenced by Varieties and Bio-Regulators Anshul Gupta, O.P. Sharma and R.B. Solanki 404
297. Evaluation of Host Defense Inducing Bioagents against Alternaria tenuissima (Kunze ex pers.) Wiltshire Causing Dieback Disease of Chilli C.S. Azad, A. Kumar, R.N. Gupta, G. Chand and R.D. Ranjan 406
298. Demonstration of Direct Seeded Rice for Enhancing the Productivity of Rice, Improving Resource Use and Minimize the Production Cost in Buxar District of Bihar Deokaran, Mandhata Singh, Ramkewal, J.S. Mishr, B.P. Bhatt, Reema Prasad
and Arif Parwez 407
299. Performance of Rabi Maize under Indigenous Nutrient for Site-Specific Management in Alluvial Plain Zone of India Yanendra Kumar Singh, Anshuman Kohli, Mainak Ghosh, Sanjeev Kumar Gupta, Rajeev Padbhushan and Shalini Kumari 409
300. Evaluation of Sticky Colour Traps for Monitoring of Shoot and Fruit Borer (Leucinodes orbonalis gueene.) in Brinjal Aravinda M., S.S. Udikeri and S.S. Karabhantanal 410
301. Effect of Different Biofertilizers on the Growth and Yield of French bean (Phaseolus vulgaris) Arka Anoop Madhvi Sharma, Kodihally Manchegowda, Harini Kumar, Bhagyawathi and Shahida Ibrahim 412
302. Effect of Chemical Fertilizer and Farm Yard Manure on Soil Physico-Chemical Properties and Yield of Wheat Kunj Bihari Meena, Md. Sarware Alam, Mohammad Amin Bhat, Inderpal Singh, A.K. Mishra, Tarence Thomas and Pradyuman Singh 413
303. Responses of Mango (Mangifera Indica L.) Seedlings to Waterlogging Conditions Muneshwar Prasad, Hidayatullah Mir, Rawati Raman Singh, Feza Ahmad and Amit Raj 414
304. Investigations on Pollen Quality in Some Newly introduced Pomegranate (Punica granatum L.) Germplasm Accessions Suparna Sinha, Dinesh S. Thakur, Divakar Kumar Bharati, Jyoti Kumari, R.R. Singh, H. Mir and M. Feza Ahmad 415
305. Changes in the Biochemical Constituents of Elephant Foot Yam (Amorphophallus paeoniifolius) Corms during Ambient Storage Payel Panja, Pran Krishna Thakur, Surajit Mitra and Jayanta Tarafdar 417
306. Constraints Perceived by Diara and Tal Land of Gram Growers Farmers in State of Bihar Neeraj Kumar and Ashok K. Singh 418
It is I
LLEGAL t
o cop
y, pri
nt or
save
any c
onten
t of th
is PDF,
in pa
rt or in
full,
on an
y retr
ieval
syste
m,
withou
t the E
XPRESS WRITTEN PERMISSIO
N of th
e cop
yrigh
t-hold
er

National Conference on Climate Change and Agricultural Production: Adapting Crops to Climate Variability and Uncertainty, 6th–8th April, 2017
[xxxi]
307. Effect of Temperature on Fermentation and Quality of Sauerkraut Pran Krishna Thakur, Payel Panja and Jahangir Kabir 419
308. Effect of Intregated Nutrient Management on Onion (Allium cepa L.) Yield, Quality Attributes, Soil Properties and Production Economics under Field Condition Arun Sharma, Payel Panja, Joydip Mandal and Smaranika Mohanta 421
309. Rice-wheat Cropping System under Long Term Effect of Integrated Nutrient Management S.S. Walia and Vikrant Dhawan 422
310. Effect of Environment, Season and Spacing on Growth Pattern and Seed Yield of Muskdana (Abelmoschus moschatus L.) Ritu Mishra, Anil Kumar Gupta and Raj Kishori Lal 424
311. Effect of Phosphorus Management on Productivity of Sunflower (Helianthus annuus L.) Virendra Singh, O.V.S. Thenua and Y.S. Shivay 425
312. Effects of Irrigation Schedules and Nutrient Levels on Mustard (Brassica juncea L.) Satybhan Singh and O.V.S. Thenua 427
313. Effect of High Density Planting System (HDPS) and Varieties on Growth and Yield of Desi Cotton Pradeep Kumar, A.S. Karle, Deshraj Singh, Keteku Agbesi Kwadzo and Lalita Verma 428
314. Effect of Different Crop Establishment Methods on Performance of Wheat in Rice-Wheat Cropping System Mona Nagargade, A. Sen, V. Tyagi and Ekta Kumari 430
315. Influence of Date of Planting and Varieties on Growth, Yield and Productivity of Potato C.K. Patel, S.K. Chongtham, R.N. Patel, J.K. Patel and D.M. Zapadiya 431
316. Productivity and Economic Feasibility of Rice (Oryza sativa L.)-Wheat (Triticum aestivum L.) Cropping System under Different Rice Establishment Methods and Nutrient Management Practices A.L. Jat, V.K. Srivastava, S.K. Chongtham and S.K. Choudhary 433
317. Weed Management of Dry Seeded Rice under Different Crop Establishment Methods S.K. Chongtham, R.P. Singh, R.K. Singh, A.L. Jat, J. Lhungdim and S.K. Choudhary 435
318. Impact of Long-term Intensive Cropping and Fertility Levels on Yield of Crops under Rice-wheat-sorghum Rotation N.Y. Azmi, Seema, M. Kumar, R. Kumari and M.D. Ojha 436
319. Enhancement of Production and Economic Efficiency through Intercropping of Winter Vegetables in Mango Mother Orchard under Changing Climate Sangeeta Kumari, Shivnath Das, Ruby Saha and R.N. Singh 438
320. Pre-Treatments Maintain the Quality of Banana Flakes Md. Shamsher Ahmad, M.W. Siddiqui, J.P. Singh, M.A. Aftab and Md. Abu Nayyer 439
It is I
LLEGAL t
o cop
y, pri
nt or
save
any c
onten
t of th
is PDF,
in pa
rt or in
full,
on an
y retr
ieval
syste
m,
withou
t the E
XPRESS WRITTEN PERMISSIO
N of th
e cop
yrigh
t-hold
er

National Conference on Climate Change and Agricultural Production: Adapting Crops to Climate Variability and Uncertainty, 6th–8th April, 2017
[xxxii]
321. Spatial Distribution of Prosopis Juliflora Using the Fusion of Hyperspectral and Landsat OLI Imagery M. Vignesh Kumar and Kiran Yarrakula 441
322. Enhancing Production of Bio Potato through Low Cost Tuberlet Technology in Changing Climatic Scenario of Bihar Sima Sinha, Anand Kumar, Kumari Rajani and Shambhu Kumar 443
323. Demonstration of TPS (True Potato Seed) Technology for Standardization and Popularization among Farmers of Bihar S.K. Varshney, Birender Singh, R.N. Singh and S.K. Gupta 444
324. Effect of Various Growing Media on Seed Germination and Seedling Growth of Khayasenegalensis (Desr.) A. Juss. R.L. Sondarva, V.M. Prajapati, N.D. Mehta, J.B. Bhusara and B.K. Bhatt 446
325. Impact of Nutrient Management Technologies, Soil Biomass and Enzymatic Activities in Transplanted Rice (Oryza sativa L.) under Irrigated Domains of Eastern Plain Zone in India Ajay Babu, Y.V. Singh, Maneesh Verma, Akhila Nand Dubey and S.S.S. Yadav 447
326. Germination and Biochemical Parameters of Mulberry Seedlings under Different Seed Rates M. Younus Wani, M.R. Mir, M.F. Baqual, M.A. Malik, Showket A. Dar, M.R. Dar and S. Rasool 449
327. Effect of Plant Growth Regulators on Growth and Flowering Characters of China aster (Callistephuschinensis L. Nees) cv. Ostrich Feather Sonu Kumar, A.K. Singh, Archana Singh and Amar Singh 450
328. Synergistic Effect of Iron and Phytohormones Application on Enzyme Activity, Chlorophyll, and Grain Yield of Maize in Iron-Deficient Soil Kavita and Vipin Kumar 452
329. Optimisation of Nitrogen Level and Cutting Interval for Growth and Yield of Ipomoea reptans Satish Kr. Subba, Reva Mondal, Umesh Thapa and Deepsil Gurung 453
330. Assessment of Status and Indigenous uses of some Economically Important Medicinal Plants in District Kullu of Himachal Pradesh, Northwestern Himalaya Shalu Devi Thakur, K.S. Kapoor and S.S. Samant 455
331. Response of Drip Fertigation on Nutrient Distribution in Soil of High Density Apple (Malusdomestica) Orchard Syed Midhat Fazil, Rohitashw Kumar, Mehlath Shah, Anaum Chishti, Syed Nuzhat Fazil and Latief Ahmad 456
332. Influence of Different Tillage and Fertilizer Management Practices on Periodic Dry Matter Accumulation of Maize Todar Mal and S.S. Walia 458
333. Assessing the Effect of Conservation Tillage and Fertilizer Management on Soil Biodiversity under Different Cropping Systems Todar Mal, S.S. Walia and S.K. Gosal 459
It is I
LLEGAL t
o cop
y, pri
nt or
save
any c
onten
t of th
is PDF,
in pa
rt or in
full,
on an
y retr
ieval
syste
m,
withou
t the E
XPRESS WRITTEN PERMISSIO
N of th
e cop
yrigh
t-hold
er

National Conference on Climate Change and Agricultural Production: Adapting Crops to Climate Variability and Uncertainty, 6th–8th April, 2017
[xxxiii]
334. Subsoil Nutrient Pool and Fertilizer Recommendation—Is there any Relevance? Mumtaz A. Ganie, M.A. Malik, Aabid H. Lone, J.A. Sofi, Anil Sharma, D.B. Singh and S. Sheraz Mahdi 461
335. Floristic Diversity and Life Form Spectrum of Vegetation in Betula Dominant Tree Stands along the available Altitudinal Gradient in North Western Himalayas of Kashmir Naseer A. Mir and T.H. Masood 462
336. Standardization of Optimum Sieve Size for Grading Cockscomb (Celosia cristata L.) Seeds M. Govindaraj, K. Sundarlingam, S. Sathish and R. Prabhu 464
337. Improvement of Quality and Shelf Life of Osmotic Dehydrated Product of Guava Slices Minakshi Kumari and Vijay Bahadur 466
338. Effect of Micronutrients Foliar Application to Direct Seeded Basmati Rice on Micronutrients Status in Soil Jagjot Singh Gill and Sohan Singh Walia 467
339. Standardization of Time and Technique of Grafting for Quality Production of Nursery Plants of Amrapali Mango (Mangifera indica L.) Syed Sami Ullah, Sunil Malik, Satya Prakash, Ranjeet Kumar and Sohanveer 469
340. Organic Farming Practices: A Way for Sustainable Agriculture V. Sakthirama and S.D. Sivakumar 470
341. Effect of Chitosan based Superabsorbent on Water Retention Behaviour of Soil and Seedling Growth of Alfalfa (Medicago Sativa) Priyal Pandey and Nirmal De 472
342. Response of Wheat to Wastewater Irrigation and NPK Levels under Flat and Raised Bed Planting Rajender Kumar, D.S. Gurjar, Rajendra Singh, Neeta Dwivedi and Ravinder Kaur 473
343. Cultivation of Mushrooms as an Option for Mitigating Climate Risks Durga Prasad, V.B. Patel, Shridhar Patil and A.B. Patel 474
THEME 4: CROP WEATHER PEST DYNAMICS AND INNOVATIVE AGRONOMIC AND BREEDING PRACTICES
344. Seasonal Incidence of Pigeonpea Pod Fly, Melanagromyza obtusa Mall M.P. Pathade and S.L. Borkar 477
345. Effect of Different Bio-Insecticides and Deltamethrine on Storability of Green Gram (Vigna radiata (L.) Wilczek) Sagar Kumar Sharma, Poonam Singh, C.P. Sachan, Arpit Gaur, Satypriy Sikarwar, Udai Singh Chaudhary, Parikshit Singh and Shabir H. Wani 478
346. A Reproducible Regeneration Protocol for Brassica carinata Cultivar PC-05 Javeed A. Lone, Shabir H. Wani, S.K. Gupta and Manmohan Sharma 480
347. Diversity and Abundance of Insect Visitors and Pollinators on Pumpkin, Cucurbita moschata (Duch.ex Lam) Lalita and Yogesh Kumar 481
It is I
LLEGAL t
o cop
y, pri
nt or
save
any c
onten
t of th
is PDF,
in pa
rt or in
full,
on an
y retr
ieval
syste
m,
withou
t the E
XPRESS WRITTEN PERMISSIO
N of th
e cop
yrigh
t-hold
er

National Conference on Climate Change and Agricultural Production: Adapting Crops to Climate Variability and Uncertainty, 6th–8th April, 2017
[xxxiv]
348. Genetic Variation for Protein Content and Yield Related Traits in Recombinant Inbred Lines (RILs) Population of Bread Wheat (Triticum aestivum L. Em. Thell) in Normal and Late Sown Environments Pinki and Vikram Singh 483
349. Pollinator Diversity and Relative Abundance of Insect Visitors on Apple (Malus domestica Borkh) in Kashmir Valley Tahmina Mushtaq, Sheikh Bilal, M.A. Aziz and Tahir Mushtaq 484
350. Characterization of Okra Germplasm through Leafy Characteristics Utilization in Breeding Programme Sunil Kumar, Archana Brar and S.K. Dhankhar 485
351. Functional and Pasting Characteristics of Flour of Different Pearl Millet Varieties of Haryana Isha Kaushik and Raj Bala Grewal 486
352. Integrated Management of Colletotrichum capsici Incitant of Dieback and Fruit Rot of Chilli under Temperate Conditions of Kashmir, India Ali Anwar, Mudasir Bhat, Lubna Masoodi, Najeeb Mughal, Mir G. Hassan and V.K. Ambardar 488
353. Studies on Genetic Divergence in Potato (Solanum tuberosum L.) Sunidhi Mishra, Jitendra Singh and Versha Kumari 489
354. Genotypic Reaction towards Brinjal Fruit and Shoot Borer Incidence in Hot Summer Season under Bihar Conditions Nisha Rani, Rashmi Kumari, Shirin Akhtar, S.S. Solankey, Aakanksha, Randhir Kumar and Sangeeta Kumari 490
355. Ecology of Yellow Stem Borer, Scirpophaga Incertulas and Leaf Folder, Cnaphalocrocis Medinalis of Rice in Northern India Ingle Dipak Shyamrao, M. Raghuraman and Santeshwari 491
356. Studies on Heterosis Involving Diverse Cytoplasmic Male Sterility Systems in Pearl Millet A. Kumar, R. Kumar, Dev Vart, A.K. Dehinwal and S. Yadav 492
357. Phenotyping of F2 Population of Wheat Satender Yadav, Y.P.S. Solanki, Vikram Singh, Shikha, Yashveer and Anil Kumar 494
358. Genetic Variability for Seed Yield and Protein Content in Lentil Umakant Banjare, H.C. Nanda, Chitralekha Shyam, Upendra Sahu, Mallesh Parsagoni and Arun Patel 495
359. Seasonal Incidence of Sesame Leaf Webber and Capsule Borer, Antigastra catalaunalis (Duponchel) on Sesame and its Correlation with Weather Parameters Shalini Pandey, R.S. Jaglan and Sunita Yadav 497
360. Phenotypic Screening of Segregating Population for Salinity Tolerance at Seedling Stage in Rice (Oryza sativa L.) Patil Srihari Reddy, S. Thirumeni, K. Paramasivam, J. Karthick, Geddam Satyadevi and N. Selvarajeswari 498
It is I
LLEGAL t
o cop
y, pri
nt or
save
any c
onten
t of th
is PDF,
in pa
rt or in
full,
on an
y retr
ieval
syste
m,
withou
t the E
XPRESS WRITTEN PERMISSIO
N of th
e cop
yrigh
t-hold
er

National Conference on Climate Change and Agricultural Production: Adapting Crops to Climate Variability and Uncertainty, 6th–8th April, 2017
[xxxv]
361. Impression of Elevated CO2 on the Herbivory of Tomato Fruit Borer (Helicoverpa armigera, Hubner) Kalpana Bisht and Vijay Kumar Mishra 499
362. Comparative Toxicity of Conventional and Novel Acaricides against the Vegetable Mite Tetranychus Neocaledonicus Andre on Brinjal Crop Pushpa Singh and R.N. Singh 500
363. Genetic Variability and Correlation Studies in Cluster Bean A.M. Apturkar and P.S. Umbarkar 501
364. Evaluation of Drought Tolerance Indices for Screening Some of Rice Genotypes Himanshu Shekhar Garg, Chandan Bhattacharya, Rajesh Kumar, Sudeshna Panja and Akhilesh Kumar Singh 503
365. Genetic Diversity in Maize (Zea Mays L.) Inbred Lines under Heat Stress Condition Neha Rani, R.B.P. Nirala, Anand Kumar, Sweta Kumari and P.K. Singh 504
366. Effect of Abiotic Factors on Population Dynamics of Important Insect and Gastropod Pest in Makhana Crop under Field Conditions Paras Nath, Anil Kumar, Rajesh Kumar, M. Udaya Kumar and Shambhu Nath 506
367. Assessment of Genetic Divergence in Brinjal (Solanum melongena L.) under Temperate Conditions Azra Lateef and Mohammad Iqbal Makhdoomi 507
368. Phytophthora Leaf Rot and Anthracnose Leaf Spot Severity in Magahi Panas Influenced by Weather Conditions Prabhat Kumar, Shivnath Das and Ajit Kumar Pandey 509
369. Effect of Gamma Radiations on Yield and Yield Attributing Characters of Cultivars of Dolichos Bean (Lablab purpureus L.) in M2 Generation Harish Kumar, Shivaputra, Manohar Lal Meghwal and S.M. Ghawade 510
370. Efficacy Evaluation of Phytotherapeutic Substances against Root-knot Nematode Meloidogyne incognita cucumerinum Affecting Cucumber in Polyhouse under Protected Cultivation Jaydeep Patil, Anil Kumar and S.R. Goel 512
371. Efficacy Evaluation of Neem (Azadirachta indica) against Root-Knot Nematodes (Meloidogyne incognita) in Tomato Saroj Yadav, Jaydeep Patil and Anil Kumar 513
372. Prevalence and Evaluation of Fungitoxicants against Noxious Marsoninajuglandis Causing Anthracnose Disease of Walnut (Juglansregia L.) in Kashmir Mudasir Hassan, Khurshid Ahmad, N.A. Khan, Mudasir Bhat and Imran Bashir 514
373. Genetic Studies on Divergence in Recombinant Inbred Lines of Rice (Oryza Sativa L.) Akanksha Singh, D.K. Dwivedi, Anurag Verma, Gaurav Kumar, Sarita Devi Gupta, Manjri, Kunvar Gyanendra, Chhavi, Vikas Dubey, Avinash Singh, Divya Prakash Singh and K.N. Singh 516
It is I
LLEGAL t
o cop
y, pri
nt or
save
any c
onten
t of th
is PDF,
in pa
rt or in
full,
on an
y retr
ieval
syste
m,
withou
t the E
XPRESS WRITTEN PERMISSIO
N of th
e cop
yrigh
t-hold
er

National Conference on Climate Change and Agricultural Production: Adapting Crops to Climate Variability and Uncertainty, 6th–8th April, 2017
[xxxvi]
374. Evaluation of Rice (Oryza sativa) Genotypes for Drought Tolerance Vikas Dubey, D.K. Dwivedi, Gaurav Kumar, Akanksha Singh, Chhavi, Avinash Singh, Rajesh Maurya and Divya Prakash Singh 517
375. Genetic Variation Delineation among Fodder Pearl Millet [Pennisetum glaucum (L.)] Accessions and Napier Grass Germplasm using SSR Markers Santosh Kumar, C. Babu, S. Revathi and P. Sumathi 518
376. Evaluation of Fungi Toxicants against Diplodiaseriata Causing Smoky Canker of Pear in Jammu and Kashmir, India Arif Hussain Bhat, Nisar Ahmad Khan, Mudasir Bhat and Hilal Ahmad 520
377. Heterosis Studies in Vegetable Cowpea [Vigna unguiculata (L.) Walp.] for Yield and Quality Attributes Risha Varan, Y.V. Singh, Vikas Kumar Jain and Prashant Bisen 521
378. Field Performance of Some Nutritional Practices on the Incidence of Major Insect and Disease Pests in Rice-Mustard Cropping System Debashis Roy, Sukamal Sarkar, Somnath Sardar and Kajal Sengupta 522
379. Temperature and Salinity Tolerant Trichoderma Isolates with Antagonistic Activities against Soil Borne Pathogens M.A. Anwer, Kundan Singh and Bishun Deo Prasad 524
380. Integrated Management of Major Fungal Diseases of Tomato in Kashmir Valley Mudasir Bhat, Ali Anwar, Mohmmad Najeeb Mughal, G. Hassan Mir and V.K. Ambardar 525
381. Influence of Weather Factors on Development of Marssonina Leaf Blotch of Apple caused by Marssonina coronaria [(Ell. & J.J. Davis) J.J. Davis] in Kashmir Valley, India S.A. Rather, M.A. Bhat, N.A. Khan, Z.A. Bhat and F.A. Mohiddin 526
382. Myco-diversity of Freshly Harvested Seed in Maize Growing Zone-III Shrvan Kumar, Asha Sinha, Shakshi Singh and Shrishti Lingwal 528
383. Characterization of Chilli Leaf Curl Virus Asif Ahmed, Abhishek Sharma, Syed Berjes Zehra and S.S. Kang 529
384. Evaluation of Pollinator’s Diversity and Activity on Guava S.N. Ray, Tamoghna Saha, Chandan Kumar, Shyam Babu Sha and A.P. Bhagat 531
385. Grey Weevil (Mylocerus discolour) New Pest of Jute from Bihar, India M.K. Singh 532
386. Residue Dynamics and Dissipation Kinetics of Hexythiazox on Apple in Kashmir, India Abid Showkat, Sheikh Bilal, Malik Mukhtar and Mudasir Bhat 533
387. Crossability Studies of Inter-specific Hybridization among Vigna species A. Nishant Bhanu, M.N. Singh, K. Srivastava and Y. Gokidi 535
388. Varietal Evaluation of Radish (Raphanus sativus L.) under Valley Conditions of Kashmir K. Mallikarjunarao, Ranjit Kumar Das, Aashish Vivek Vaidya and Ashutosh Kumar 536
It is I
LLEGAL t
o cop
y, pri
nt or
save
any c
onten
t of th
is PDF,
in pa
rt or in
full,
on an
y retr
ieval
syste
m,
withou
t the E
XPRESS WRITTEN PERMISSIO
N of th
e cop
yrigh
t-hold
er

National Conference on Climate Change and Agricultural Production: Adapting Crops to Climate Variability and Uncertainty, 6th–8th April, 2017
[xxxvii]
389. Biology and Morphometry of Earias vittella (Fabricius) (Lepidoptera: Noctuidae) on Okra G. Srasvan Kumar and S.V.S. Raju 537
390. Inter Relationship between Yield and Yield Attributing Traits in Eggplant for Future Breeding Programme Neetu Nand, Randhir Kumar, Shirin Akhtar and Anupam Adarsh 538
391. Study of Pollen Fertility in CGMS based Pigeonpea [Cajanus cajan(L.) Millspaugh] Hybrids Akhouri Nishant Bhanu, Yugandhar Gokidi, Pankaj Kumar Pandey and M.N. Singh 540
392. Assessment of Morphological and Molecular Genetic Diversity of Staminate Pointed Gourd (Trichosanthes dioica Roxb.) Pankaj Kumar, Anupam Adarsh, Bishun Deo Prasad, R.B. Verma, Sangita Sahni, Chandan Kishore and Randhir Kumar 541
393. Study on the per Se Performance of Parental Lines and their Hybrid for Disease Resistance and Yield in Brinjal (Solanummelongena L.) Ravi Kumar, Randhir Kumar, Amit Kumar and Sangeeta Shree 542
394. Predatory Potential of Neoseiulus longispinosus (Evans) (Acari: Phytoseiidae) on the Two Spotted Spider Mite, Tetranychus urticae Koch (Acari: Tetranychidae) K. Sankara Rao, R. Vishnupriya and K. Ramaraju 544
395. Climatic Change and its Impacts on Agriculture Productivity in India S. Avinash, S. Monoj, L. Dalpat and K. Nirupa 545
396. Characterization and Similarity of Rice (Oryza sativa L.) Germplasm Lines through SSR Markers Mankesh Kumar, Nitu Kumari, Satyendra, Anand Kumar, S.P. Singh and P.K. Singh 546
397. Molecular Diversity Analysis of Maize (Zea maize L.) Inbreeds using SSR Markers S.K. Sathua, J.P. Shahi, P. Kumar, A. Mahato and Varsha Gayatonde 547
398. Understanding Genetic Diversity of Rice Genotypes Tested under Complete Flash Flood Environment of Zone IIIA of Bihar State Rahul Singh, Mankesh Kumar, S.P. Singh, Anand Kumar, P.K. Singh and Satyendra 548
399. Genetic Variation and Association among Some Morpho-Physiological Traits for Rice Improvement under Submergence Condition Rajesh Kumar, Nilmani Prakash and Vinay Kumar 549
400. Chickpea Wilt Disease Development Influenced by Different Dates of Planting under Changing Climate Sangita Sahni, Devendra Singh and Birendra Kumar 551
401. Exploration of Sclerotium rolfsii Adapting High Temperature Regime in Successive Generation Ritesh Kumar, Abhijeet Ghatak and Arun P. Bhagat 552
402. Transmission and Temporal Response of Groundnut bud necrosis virus Infecting Potato Crop in Diverse Ecology Mohammad Ansar, Ashok Kumar Meena and V.S. Pundhir 554
It is I
LLEGAL t
o cop
y, pri
nt or
save
any c
onten
t of th
is PDF,
in pa
rt or in
full,
on an
y retr
ieval
syste
m,
withou
t the E
XPRESS WRITTEN PERMISSIO
N of th
e cop
yrigh
t-hold
er

National Conference on Climate Change and Agricultural Production: Adapting Crops to Climate Variability and Uncertainty, 6th–8th April, 2017
[xxxviii]
403. Studies on Life-Tables and Key Mortality Factors of Aproaerema Modicella Deventer on Sole Soybean and Soybean Intercropped with Pigeonpea S.V. Phatak and V.K. Bhamare 555
404. Morpho-biochemical Properties of Momordica charantia against Fruit Fly Infestation in Kharif Season of Bihar Preeti Kumari, R.B. Verma, S.S. Solankey, Randhir Kumar, Wasim Siddiqui, Satyendra and Ravi Kumar 557
405. Effect of Environment against Stem Rot of Chickpea Caused by Sclerotinia sclerotiorum Seethiya Mahajan, Shazia Paswal, Varsha Bharti and Richa Sharma 558
406. Genetic Diversity Analysis in Indian Mustard [Brassica juncea (L.)] for Salinity Tolerance using Microsatellite SSR Markers Rekha Patel, Ram Avtar, Geeta D. Boken, Sumit Jangra, Disha Kamboj, Baldeep Singh, Monika, Neelam R. Yadav and R.C. Yadav 559
407. Climatic, Pathogenic and Host Conditions for Successful Induction of Ustilaginoidea virens Causing False Smut of Rice Durga Prasad and R.N. Singh 561
408. Character Association and Component Analysis in Rice (Oryza sativa L.) Suman Yadav, Pankaj Kumar and B.G. Suresh 562
409. Assessment of Genetic Variability, Heritability and Genetic Advance for Growth, Yield and Quality Characters in Chilli (Capsicum annuum L.) Ashish Kumar Maurya, M.L. Kushwaha, S.K. Maurya, Santosh Kumar and Vikas Kumar Jain 563
410. Population Dynamics, Crop Loss Assessment and Acaricidal Management of Yellow Mite, Polyphagotarsonemus latus (Banks) (Acari: Tarsonemidae) Infesting Mungbean under Gangetic Basin of West Bengal Sagarika Bhowmik, Suvadip Saha, Choyang Sherpa and Krishna Karmakar 565
411. Impact of Climate Change on Incidence of Insect Pests of Tomato Plant Sudeepa Kumari Jha and Manoj Kumar 566
412. Incidence of Major Sucking Insect Pests of Okra, Abelmoschus esculentus (L) Moench in Relation to Weather Parameters in New Alluvial Zone of West Bengal S. Saha, S. Bhowmik, A.K. Senapati and L. Laishana Devi 567
413. Study of Genetic Variability and Heritability in Litchi (Litchi Chinensis Sonn.) Hybrids Abha Kumari, Abhay Mankar, Hidayatullah Mir, Bishun Deo Prasad and Km Lalita 568
414. Evaluation of Sesame (Sesamum indicum L.) Genotypes to the Shaded Uplands of Southern Region Abhijatha A., Kuduka M. and Arya K. 570
415. Correlation and Path Analysis of Different Parameters with Yield in Elite Genotypes of Tomato (Lycopersicon esculentum Mill.) Pradeep Kumar Jatav, V.P.S. Panghal, Bharath Kumar M.V., Sachin S. Chikkeri, Harshita Singh and Hemant Gemeray 571
It is I
LLEGAL t
o cop
y, pri
nt or
save
any c
onten
t of th
is PDF,
in pa
rt or in
full,
on an
y retr
ieval
syste
m,
withou
t the E
XPRESS WRITTEN PERMISSIO
N of th
e cop
yrigh
t-hold
er

National Conference on Climate Change and Agricultural Production: Adapting Crops to Climate Variability and Uncertainty, 6th–8th April, 2017
[xxxix]
416. Establishment of the Relationship among the Three Morphotypes of Cape Gooseberry (Physalisperuviana L.) K.M. Lalita, D.H. Dwivedi, A. Kumari, S.K. Mauriya and H. Mir 572
417. Impact of Climate Change on Pest and Disease Free Vegetable Cultivation in Bihar Shyam Babu Sah, J.N. Srivastwa, T. Saha, R.N. Gupta, S.N. Ray and Rajesh Kumar 573
418. Impact of Climate Change on Virus-vector Relationships Monika Karn, Mohammad Ansar and A. Srinivasaraghavan 575
419. Ovipositional Behaviour of Pod Sucking Bug, Clavigralla Gibbosa Spinolaon Pigeonpea Chitralekha, Roshan Lal, Tarun Verma and Prince 576
420. Climate Change and Plant Disease: Positive Side of the Story Sujata Kumari, A. Srinivasaraghavan and Mohammad Ansar 577
421. Variability and Character Association Analysis in Rice (Oryza sativa L.) Genotypes for Grain Yield and Yield Attributing Traits under Agro-climatic Conditions of Allahabad Banashri Roy and G.M. Lal 578
422. Seasonal Incidence and Distribution Pattern of Leaf Webber (Orthaga exvinacea Hamp.) on Mango N. Kasar, J.C. Marak, U.K. Das and S. Jha 579
423. Studies on Population Dynamics of Diamond Back Moth Plutella Xylostella (L.) and Bio-Effectiveness Insecticide Chemistries and Bio-Pesticides in Cabbage Ecosystem of West Bengal L. Maity, G. Padhi, A. Samanta and P.K. Sarkar 581
424. Population Dynamics of Whitefly (Bemisia tabacci Genn) in Chilli and Screening of Chilli Genotypes against Chilli Leaf Curl Virus Gayatri Kumari Padhi, Labani Maity, Arup Chattopadhyay and Arunava Samanta 582
425. Association and Heritability Studies for Drought Tolerance at Reproductive Stage under Varied Hydrological Regimes in Rice (Oryza Sativa L.) in Red & Lateritic Zone of West Bengal Sudeshna Panja, H.S. Garg, K.K. Sarkar, A. Roy Ainch, V. Mandi and C. Bhattacharya 583
426. Management of Sheath Blight of Rice throughIntegrated Application of Bio-agents, Organics and Resistance Inducing Chemicals Durga Prasad 585
427. Effect of Weed Management and Nitrogen on Weed Dynamics and Yield of Rice under Aerobic Condition Neha Nandan and D.K. Roy 586
428. Cultural and Physiological Characters of Curvularia lunata Causal Agent of Leaf Spot in Maize Kotramma C. Adaangadi, S.I. Harlapur and Basamma R. Hadimani 587
429. Gamma Irradiation Enhances Tolerance to Biotic Stresses in Rice (Oryza sativa L.) Bishun Deo Prasad, Pankaj Kumar, Abhijeet Ghatak, Sangita Sahni, Sonam Kumari, Awadhesh Kumar Pal and P.K. Singh 589
It is I
LLEGAL t
o cop
y, pri
nt or
save
any c
onten
t of th
is PDF,
in pa
rt or in
full,
on an
y retr
ieval
syste
m,
withou
t the E
XPRESS WRITTEN PERMISSIO
N of th
e cop
yrigh
t-hold
er

National Conference on Climate Change and Agricultural Production: Adapting Crops to Climate Variability and Uncertainty, 6th–8th April, 2017
[xl]
430. Studies on Somatic Embryogenesis from Stem Internodes in Lentil (Lens culinaris Medik) Abhilasha Sinha, Nishi Kumari, Shahnishan Tabassum, Amrita Singh, A.K. Pal, B.D. Prasad, R.S. Singh and P.K. Singh 590
431. Effect of High Temperature on Pseudo Seeds Development in Wheat (Triticum aestivum L.) Shahnishan Tabassum, Nishi Kumari, Abhilasha Sinha, Amrita Singh, A.K. Pal, Bishun Deo Prasad, Ravi Shankar Singh and P.K. Singh 592
432. Rapid and Eefficient Method for Pre-Field Screening of Mutants for Salt Tolerance in Rice Pankaj Kumar, Bishun Deo Prasad, Sonam Kumari, Sangita Sahni, Awadhesh Kumar Pal, Neha Kumari and P.K. Singh 593
433. Genetic Diversity Analysis in Peach (Prunus Persica L.) Cultivars using RAPD Markers Hidayatullah Mir, D.S. Dahiya and S.K. Sherawat and Shashi Kala 594
434. Initial Screening of Rice Germplasm for Germination and Early Growth in Anaerobic Conditions Caused by Flooding Satyendra, Mankesh Kumar, S.P. Singh, Anand Kumar, Rahul Singh and P.K. Singh 595
435. Genetic Transformation of Indica Rice with Plant Nuclear Factor Y (NF-Y) B2 Subfactor Gene for Enhanced Drought Tolerance Vinod Kumar, Nimmy M.S., Sweta Sinha, Ravi Ranjan Kumar and Dharamsheela 596
436. Genome-wide Analysis of Multidrug and Toxic Compound Extrusion (MATE) Gene Family in Chickpea (Cicer arietinum L.) Nimmy M.S., Vinod Kumar, Jain P.K. and R. Srinivasan 598
437. Studies on Genetic Divergence in Bitter Gourd (Momordica charantia L.) Nidhi Tyagi, V.B. Singh and Vishal Tripathi 600
438. PerSe Performance of Parents and Hybrids of Cowpea (Vigna unguiculata) A.K. Verma, A.K. Naidu, A.K. Mehta and R.P. Singh 601
439. Impact of Stunt Disease on Yield and Yield Attributing Characters on Different Sowing Dates of Chickpea Sourabh Kumar, R.N. Gupta, G. Chand, C. Azad, S.K. Gupta, A. Ghatak and S.B. Sah 602
440. Analysis of Genetic Variability and Correalation of Seed Yield and Morpho-physiological Traits in Mungbean (Vigna radiata (L.) Wilczek) Under Irrigated Condition Sunayana, M.S. Punia and Rajesh Yadav 603
441. Genetic Variability Analysis for Plant Selection in Custard Apple (Annona squamosa L.) J.L. Nag, S.N. Dikshit, N. Mehta, O.P. Kashyap, Neeraj Shukla, R.R. Saxena and P. Singh 605
442. Novel Approach in Screening Pea Genotype for Brassinosteriod (Brassinolide) Tannu Priya and A. Hemantranjan 606
It is I
LLEGAL t
o cop
y, pri
nt or
save
any c
onten
t of th
is PDF,
in pa
rt or in
full,
on an
y retr
ieval
syste
m,
withou
t the E
XPRESS WRITTEN PERMISSIO
N of th
e cop
yrigh
t-hold
er

National Conference on Climate Change and Agricultural Production: Adapting Crops to Climate Variability and Uncertainty, 6th–8th April, 2017
[xli]
443. Studies on Evaluation of Turmeric (Curcuma Longa L). Cultivars against Leaf Blotch (Taphrina maculens Butler) and Shoot Borer (Conogethes punctiferalis Guen.) Siddalingayya Salimath, Y.K. Kotikal, Revanna Ravannavar and J. Venkatesh 608
444. Screening of Core Rice Germplasm Accession for Resistance to the Brown Plant Hopper, Nilaparvata lugens (STAL) Atul Kumar Pachauri, S. Bhandarkar, Deepak Sharma, D.K. Rana and A.K. Sarawgi 610
445. Crop Weather Population Dynamics of Aphid (Lipaphiserysimi (Kalt.) on Radish (Raphanussativus L.) Megaladevi P. and Manjunatha M. 611
446. Screening of Different Macrophomina phaseolina Isolates on Susceptible (RMG-62) Variety of Mungbean Paritosh Kumar, V.K. Gaur and Anand Kumar Meena 613
447. Forecasting Model for Mango (Mangifera indica) Malformation in New Delhi and Lucknow Srinivasa Reddy and K. Usha 614
448. Biology and Morphometry of Brinjal Shoot and Fruit Borer, Leucinodes orbonalis (Guenee) on Brinjal (Solanum melongena mill.) Under Laboratory Condition M.A. Laichattiwar and R.S. Meena 616
449. Study of Character Association and Path Analysis in Newly Developed Single Crosses of Maize (Zea mays.L) Mukesh kumar, Ajay Kumar, Himanshu Shekhar Garg, Nitesh Kumar and Papia Biswas 617
450. Screening for Drought Tolerance in Eggplant (Solanum melongena L.) Genotypes Using Polyethylene Glycol (PEG-6000) Gobu R., Harish Babu B.N., Shankar M. and Kailash Chandra 618
451. Effect of Trichoderma Strains IRRI BMP on Growth, Nodulation and Yield of Lentil under Lowland Rainfed Ecology Mandhata Singh, Deokaran, Santosh Kumar, U.R. Sangle, J.S. Mishra and B.P. Bhatt 620
452. Population Dynamics and Foraging Pattern of Different Honeybees on Toria (Brassica compestris) B.B. Singh, Manish Kumar and H.Chand 621
453. Assessment of Quantitative Differences among Diverse Genotypes of French Bean (Phaseolus vulgaris L.) for Yield and Yield Attributing Traits Vaibhav Singh, Anand Kumar Singh, Durga Prasad Moharana, Bhagat Singh, Deepak Kumar Jaiswal and Dhirendra Kumar Singh 622
454. Efficacy of Acetamiprid against Brown Plant Hoppers (Nilaparvatalugens Stal) in Rice Raju K. Panse, A.P. Bhandarkar, Atul Shrivastava, S.K. Rajak and D.M. Kadam 623
455. Combining Ability Analysis in Maize (Zea mays L.) over Multi Environment Birender Singh, R.S. Rai and A.K. Singh 624
456. Graphical Analysis for Yield and Yield Attributing Traits in Brinjal (Solanum melongena L.) K. Hussain, S.H. Khan, B. Afroza, S.B. Zehra, F. Mushtaq, M.I. Mukhdoomi, S. Mufti and G. Nazir 626
It is I
LLEGAL t
o cop
y, pri
nt or
save
any c
onten
t of th
is PDF,
in pa
rt or in
full,
on an
y retr
ieval
syste
m,
withou
t the E
XPRESS WRITTEN PERMISSIO
N of th
e cop
yrigh
t-hold
er

National Conference on Climate Change and Agricultural Production: Adapting Crops to Climate Variability and Uncertainty, 6th–8th April, 2017
[xlii]
457. Insect Community in Agro Forestry: Role of Weather Parameters on Population Dynamics Md. Ruhul Amin 627
458. Bioefficacy of Certain Newer Insecticides on Mortality of Brown Plant Hopper (Nilaparvata Lugens Stal.) and Gundhi Bug (Leptocorisa AcutaThunberg) in Rice (Oryza sativa L.) Ecosystem M. Raghuraman, Santeshwari and Ingle Dipak Shyamrao 629
459. Behavioural Responses of the Melon Fly, Bactrocera cucurbitae (Diptera: Tephritidae) to Colour Pheromone Traps Sajad Hussain Mir, Showket Ahmad Dar and Ghulam Mohammad Mir 630
460. Nesting Behaviour of Andrena cineraria Linnaeus (Hymenoptera: Andrenidae) in Temperate Areas of India Showket Ahmad Dar, Sajad Hussain Mir and Gh. Mohmmad Mir 631
461. Physiological and Biochemical Assessment of Genotypic Variation in Soybean (Glycine max L.) [Merrill] Genotypes Devendra Vasht, S.K. Dwivedi and Ompal Singh 633
462. Ecological and Economic Aspect of Integrated Pest Management (IPM) in Paddy (Oryza sativa L.) Ecosystem R. Sudha, M. Chandrasekaran and A. Rohini 634
463. The Immunity System in Plants—A Mechanism Hilal A. Bhat, Rayees A. Ahanger, Mumtaz A. Ganie, Sajad Hassan Wani, Aarif H. Bhat and J.I. Mir 636
464. Identification of Drought Tolerant Rice (Oryza sativa L.) Genotypes Carrying the Drought QTL under Stressed and Non-stressed Natural Field Conditions S.P. Singh, Anand Kumar, Satyendra, Mankesh Kumar, Santosh Kumar and P.K. Singh 637
THEME 5 CLIMATE CHANGE AND LIVESTOCK, FISHERIES AND POULTRY
465. Seasonal Variation and its Adaptation in Pigs in Northeast India Y. Vashi, S. Naskar, T. Chutia, S. Banik, J. Goswami and V.P. Bhadana 641
466. Studies on Physico-Chemical and Sensory Characteristics of Orange (Citrus reticulate) based Whey Beverage H.V. Wadatkar, S.D. Chavan, R.R. Shelke and P.A. Kahate 642
467. Genomic Selection of Livestock in the Context of Climate Change—An Overview Rajkumar Sah and S.P. Dixit 643
468. Livestock Production with Changing Climate in Bihar Bibha Kumari, Ranveer Kumar Sinha and Rakesh Kumar 644
469. Study on Effect of Climatic Variables on Growth Rate and Egg Production Performance Layer Birds (BV-300) Amit Kumar, Rajesh Kumar and M.Z. Hoda 645
470. Goat Husbandry Practices under Changing Climate Scenario in Banka District, Bihar Dharmendra Kumar, Asit Chakrabarti, Sanjiv Kumar and Kumari Sharda 647
471. Study on Willingness to Adoption of Mitigation Measures of Greenhouse Gases Emission in Dairy Farming Pampi Paul, B.S. Meena, Mukesh Kumar and Mahesh B. Tengli 648
It is I
LLEGAL t
o cop
y, pri
nt or
save
any c
onten
t of th
is PDF,
in pa
rt or in
full,
on an
y retr
ieval
syste
m,
withou
t the E
XPRESS WRITTEN PERMISSIO
N of th
e cop
yrigh
t-hold
er

National Conference on Climate Change and Agricultural Production: Adapting Crops to Climate Variability and Uncertainty, 6th–8th April, 2017
[xliii]
472. Ameliorative Effect of Chromium and its Correlation with Heat Stress Markers in Tropical Buffaloes G.M. Vidyalakshmi, M.C. Patak, M.R. Verma, K. Narayanan and Gyanendra Singh 650
473. Combating Negative Effects of Climate Change through Improved Management Practices for Animals Madhu Shelly 651
474. Effects of Climate Change on Poultry Production in Rohtas District of Bihar Alok Bharti, Ajay Kumar and Ram Pal 652
475. Disease Incidences in Pigs Due to o Seasonal Variation and Climatic Effect in an Organized Farm Asit Chakrabarti and Dharmendra Kumar 653
476. Production Potential and Feasibility of Different Forage based Cropping System in Bihar Sanjeev Kumar Gupta, G.S. Panwar, Rajesh Kumar, Amit Kumar, Mainak Ghosh, S. Sheraz Mahdi and Sunil Kumar 655
477. Green Technologies and Utilities in Dairy and Food Industries for Sustainability in Rural India: A Review Jahangir Badshah, Rakesh Kumar and A.K. Jha 656
478. Effect of Climate Change on Indian Fisheries Sector: Adaptation Strategies Brajendu Kumar and Satendra Kumar 658
479. Impact of Long Term Heat Stress Exposure on Feed and Water Intake of Tharparkar Cattle (Bos indicus) Jaya, Mihir Sarkar and Puneet Kumar 659
480. Training Needs of Small Holder Dairy Farmers Regarding Efficient Feeding Practices for Ecologically Sustainable Milk Yield in Muktsar Madhu Shelly 660
481. Chlorpyrifos Toxicity in Broilers under Subtropical Environmental Conditions Henna Wani and Shafiqur Rahman 662
CIMMYT SPECIAL SESSION: SUSTAINABLE INTENSIFICATION AND CLIMATE SMART AGRICULTURE FOR SMALLHOLDERS
482. Climate Smart Agriculture in Intensive Cereal based Systems: Scalable Evidence from Indo-Gangetic Plains of South Asia M.L. Jat 665
483. Sustainable and Resilient Farming Systems Intensification (SRFSI) in Eastern IGP: An Evidence from India, Nepal and Bangladesh Akbar Hossain, Anup Ghosh, Apurba Chowdhury, Arunva Ghosh, A.S.M. Rahman Khan, Atiquer Rahman, Bedanad Choudhary, Biplab Mitra, Dinesh Thapa, Hari Krishna Shrestha, Illias Hossain, Kalyan Kanti Das, Kaushik Pradhan, K.K. Rao, Mamunur Rashid, Mazharul Anwar, Nur-E-A Siddque, Pawan Srivastawa, Prakash Paneru, Prateek M. Bhattacharya, Ram Datt, Ramesh K. Saphi, Ranvir Kumar, Rashadul Islam, Renuka Shrestha, Saiful Islam, Samim Hossain, Sanjay Kumar, Sarita Manandhar, Shakhawat Hossain, Surya Prasad Adhikari, Swaraj Dutta, Tapamay Dhar, Thakur P. Tiwari, Ujjwal Kumar, Umesh Archarya and Mahesh K. Gathala 668
It is I
LLEGAL t
o cop
y, pri
nt or
save
any c
onten
t of th
is PDF,
in pa
rt or in
full,
on an
y retr
ieval
syste
m,
withou
t the E
XPRESS WRITTEN PERMISSIO
N of th
e cop
yrigh
t-hold
er

National Conference on Climate Change and Agricultural Production: Adapting Crops to Climate Variability and Uncertainty, 6th–8th April, 2017
[xliv]
484. Developing Sustainable and Climate Resilient Future Cropping Systems for Eastern IGP Raj Kumar Jat, Deepak Bijarnia, Mahesh K. Gathala and M.L. Jat 670
485. Innovation Systems for Sustainable Intensification and Resilient Farming Systems in Eastern IGP Ram Datt, Ranvir Kumar, Sanjay Kumar, Mahesh K. Gathala and T.P. Tiwari 672
486. Conservation Agriculture based Sustainable Intensification and Cereal Systems Implications on Soil Health H.S. Jat, Ashim Datta, A.K. Yadav, Madhu Choudhary, P.C. Sharma, M.K. Gathala and M.L. Jat 673
487. Role of Micro-entrepreneurship in Sustainable and Resilient Farming Systems Intensification for Smallholders P.M. Bhattacharya, K.K. Das, A.K. Chowdhury, T. Dhar, A.K. Sinha, A. Ghosh, B. Mitra, M. Gathala and T.P. Tiwari 674
IRRI SPECIAL SESSION: ABIOTIC STRESS TOLERANT RICE FOR ADAPTATION TO A CLIMATE CHANGE
488. Weed Management in Direct Seeded Rice under Rainfed Ecology G.S. Panwar, Suborna, Roy Choudhary, Amarendra Kumar, Sanjay Kumar, Sudhanshu Singh, Ashok Yadav and Virendar Kumar 677
489. Fighting a Lethal Combination of Submergence, Drought and Salinity in Rainfed Lowland through Stress-tolerant Rice Varieties and Climate Smart Agronomy A.K. Srivastava, Sudhanshu Singh and U.S. Singh 678
490. Raising Productivity of Rice based Cropping Systems in Drought Prone Rainfed Upland Environment Virendar Kumar, Sudhanshu Singh, A.K. Srivastava, J.S. Mishra, G.S. Panwar, S. Kumar, A. Kohli and S.K. Dwivedi 679
491. Use of Microbes for Abiotic Stress Management in Rice under Stress Prone Ecologies Najam Waris Zaidi, Uma Shankar Singh and Sudhanshu Singh 680
492. Precision Nutrient Management for Rainfed Condition: Pivotal to Mitigate Risk of Climate Change Amit Mishra and Sheetal Sharma 682
493. Zinc Fertilization for Rice-wheat Cropping System and Transformation in Soil in a Calciorthent Ranjan Laik, Santosh Kumar Singh, Vipin Kumar, S.P. Singh and R.C. Yadav 684
AUTHOR INDEX 685
It is I
LLEGAL t
o cop
y, pri
nt or
save
any c
onten
t of th
is PDF,
in pa
rt or in
full,
on an
y retr
ieval
syste
m,
withou
t the E
XPRESS WRITTEN PERMISSIO
N of th
e cop
yrigh
t-hold
er

National Conference on Climate Change and Agricultural Production: Adapting Crops to Climate Variability and Uncertainty, 6th–8th April, 2017
[1]
LEAD PAPERS
It is I
LLEGAL t
o cop
y, pri
nt or
save
any c
onten
t of th
is PDF,
in pa
rt or in
full,
on an
y retr
ieval
syste
m,
withou
t the E
XPRESS WRITTEN PERMISSIO
N of th
e cop
yrigh
t-hold
er

It is I
LLEGAL t
o cop
y, pri
nt or
save
any c
onten
t of th
is PDF,
in pa
rt or in
full,
on an
y retr
ieval
syste
m,
withou
t the E
XPRESS WRITTEN PERMISSIO
N of th
e cop
yrigh
t-hold
er

National Conference on Climate Change and Agricultural Production: Adapting Crops to Climate Variability and Uncertainty, 6th–8th April, 2017
[3]
Exposed to Global Warming―Challenges, Opportunities and Future Directions
A.K. Singh1, S. Sheraz Mahdi2* and R.K. Sohane3 1Vice Chancellor, 2Department of Agronomy, 3Directorate of Extension Education,
Bihar Agricultural University, Sabour–813210, Bhagalpur, India E-mail: *[email protected]
Global warming and climate change is one of the most extensively researched and discussed topical issues affecting the environment. Food security threatened by climate change is one of the most important challenges in the 21st century to supply sufficient food for the increasing population while sustaining the already stressed environment. There is growing evidence that, as a result of climate change, temperature increase is likely to be 1.8-5.0oC. There will be a 10-percent increase in annual mean monsoon intensity and a 15-percent increase in year-to-year variability in monsoon precipitation. This would lead to more frequent hot extremes, floods, droughts and cyclones and gradual recession of glaciers in India over the next 20-50 years, which in turn would result in greater instability in food production. Of the total annual crop losses in agriculture, many are due to direct weather and climatic effects such as droughts, flash floods, frost, storms, hail, heat and cold wave. It is estimated that crop production loss in India by 2100 AD could be 10-40% despite the beneficial effects of higher CO2 on crop growth. The impact of climate change on water availability will be particularly severe for India. About 54 percent of India's groundwater wells are decreasing, with 16 percent of them decreasing by more than one meter per year. Dynamic of pests and diseases will be significantly altered leads to the emergence of new patterns of pests and diseases which will affect crops yield. An important source of uncertainty in anticipating the effects of climate change on agriculture is limited understanding of crop responses to extremely high temperatures. This uncertainty partly reflects the relative lack of observations of crop behaviour in farmers’ fields under extreme heat. Notwithstanding, wide variety of adaptation and mitigation options have been identified as having the potential to reduce vulnerability of agricultural systems to risks related to climate change. The paper aims to discuss (i) increasing temperature trends causing the agro-meteorological risks, (ii) their impact on crop production and, (iii) strategies for management of these climatic risks for better crop production.
Keywords: Global Warming, Impact, Crop Production and Climate Change Adaptation
Climate Change and Agriculture in India
Rattan Lal Carbon Sequestration Center, The Ohio State University, Columbus, OH–43210 USA
E-mail: [email protected]
Between 1800 and 2050, the population of India would increase from 255 million to 1.71 billion, by a factor of 7, with a strong environmental impact. Rapid urbanization and its encroachment on agricultural land is a consequence of increase in population. Between 1950 and 2025, the population (106) would increase from 1.4 to 28.6 (20.4 times) of New Delhi, 4.5 to 20.1 (4.5 times) of Kolkata, 2.9 to 25.8 (8.9 times) of Mumbai, 0.6 to 6.6 (11.0 times) of Pune, 1.1 to 8.9 (8.1 times) of Hyderabad, 0.7 to 9.5 (13.6 times) of Bengaluru, and 1.5 to 9.6 (6.4 times) of Chennai. The city of Mumbai generates 11 thousand Mg of waste per day or 4
It is I
LLEGAL t
o cop
y, pri
nt or
save
any c
onten
t of th
is PDF,
in pa
rt or in
full,
on an
y retr
ieval
syste
m,
withou
t the E
XPRESS WRITTEN PERMISSIO
N of th
e cop
yrigh
t-hold
er

National Conference on Climate Change and Agricultural Production: Adapting Crops to Climate Variability and Uncertainty, 6th–8th April, 2017
[4]
million Mg per year, which if recycled effectively, can improve urban and peri-urban agriculture. It takes about 40,000 ha of land to provide accommodation and infrastructure to 1 million people. An annual increase of 11.5 million people in India encroaches upon 0.5 million hectare (Mha) of agricultural land. Thus, there is a strong need to protect prime agricultural land against other uses. By 2025, India will have 7 cities of >10 million people, and a city of 10 million consumes 6000 Mg of food per day. Thus, nutrients brought into the city must be returned to the land by recycling waste as compost and for producing energy. Climate change, with increase in frequency of extreme events, is exacerbating vulnerability of agricultural soils to degradation processes. Land area (Mha) in India already affected by degradation includes 93.7 by water erosion, 9.5 by wind erosion, 14.3 by waterlogging, 5.9 by salinity/alkalinity, 16.0 by soil acidity and 7.4 by complex problems. In addition to the impacts of changing and uncertain climate, soil degradation is exacerbated by burning of crop residues, use of cow dung for household cooking rather than as manure, uncontrolled grazing, unbalanced use of fertilizers, and other extractive farming practices. The drought-flood syndrome, caused by water misuse and mismanagement, adversely affects agronomic productivity and wellbeing of millions of people despite the fact that India receives 4000 km3 of annual precipitation.
A systematic understanding is needed of the coupled cycling off water, carbon, nitrogen, phosphorus and sulfur at ecoregions and watershed scale to enhance provisioning of essential ecosystem services from agroecosystem (e.g., food feed, fiber, fuel, water, biodiversity). In addition to the drought-flood syndrome, other ramifications of the mismanagement of coupled cycling include emission of greenhouse gases from agroecosytems, especially of CH4 and N2O with global warming potential of 21 and 310, respectively.Adaptation and mitigation of agroecosystems to climate change necessitate adoption of the strategies of sustainable intensification. The latter implies “producing more from less”: more agronomic yield per unit of land area, and input of water, energy, fertilizers, pesticides and gaseous emissions. The large yield gap, difference in agronomic yield of research plots and the national average yield, can be abridged by adoption of the best management practices (BMPs). Thus, soil health must be restored by increasing soil organic carbon (SOC) concentration to the threshold level of ~1.5-2.0% in the root zone (0-40 cm depth).
Soils of agroecosystems in India, similar to those of other countries in South Asia and Sub-Saharan Africa, are severely depleted of their SOC stocks. The magnitude of depletion is high in soils prone to accelerated erosion by water and wind, and other degradation processes. The SOC stock can be restored by adaptation of BMPs which control erosion and create a positive soil/ecosystem C budget. Important among these are afforestation of degraded and marginal soils, restoration and management of wetlands, use of conservation agriculture in conjunction with mulch farming/cover cropping, integrated nutrient management, and establishment of biofuel plantations on degradedlands.
The SOC restored must also be stabilized/ protected to prolong its mean residence time to centennial/millennial scale. There is no one-size-fit-all BMP, and site-specific adaptation/fine-tuning is essential with due consideration of the biophysical, socio-economic and cultural (the human dimensions) factors. In addition to adaptation and mitigation of climate change, restoration of degraded soils is also essential to local, national, regional and global peace and harmony. Fertile soils of good health, rich in SOC stock, and teaming with biodiversity of intense activity are essential to advancing food and nutritional security, improving water quality and renewability and adapting and mitigating climate change. Healthy soils are the engine of economic development especially under changing and uncertain climate.
It is I
LLEGAL t
o cop
y, pri
nt or
save
any c
onten
t of th
is PDF,
in pa
rt or in
full,
on an
y retr
ieval
syste
m,
withou
t the E
XPRESS WRITTEN PERMISSIO
N of th
e cop
yrigh
t-hold
er

National Conference on Climate Change and Agricultural Production: Adapting Crops to Climate Variability and Uncertainty, 6th–8th April, 2017
[5]
Climate Change and Rainfed Agriculture
B. Venketeswarlu Vice-Chancellor,
Vasantrao Naik Marathwada Krishi Vidyapeeth, Parbhani–431402, India
E-mail: [email protected]
Agriculture is one of the most vulnerable sectors to climate change. Indian agriculture being primarily dependent on monsoon rainfall is particularly vulnerable to inter-annual and intra seasonal climate variability. Unlike developed countries, the adaptive capacity of Indian farmers to climate extremes is quite low due to their poor economic status and inadequate infrastructure and credit support in rural areas. Research under the National Agriculture Research system revealed that most rainfed crops are likely to be affected negatively due to changed rainfall pattern and increased temperatures. Though C3 crops like pulses and oilseeds might benefit from increased CO2 levels, these benefits are likely to be offset by warmer climate and changed rainfall pattern. As per model predictions, the total rainfall in most parts of the country is likely to remain unchanged or slightly increase in future, but its distribution is projected to change significantly with decrease in number of rainy days and more extreme rainfall events (Krishna Kumar, 2009). This is likely to pose challenges to rainfed agriculture where in situ and ex-situ conservation of rain water becomes more critical than ever before, besides developing and adopting crop varieties and cropping systems that can cope with long dry spells and short term water logging.
Adaptation to climate change requires both short term and long term strategies. In short term, we must make use of the available knowledge base to formulate and implement crop contingency plans for aberrant weather conditions. In the long term, however, strategic research on development of drought and heat tolerant crop varieties, livestock breeds that sustain heat stress are required. Prudent land and water management practices contribute to both adaptation and mitigation. Adaptation strategies can be crop based which include new crop varieties with short duration, heat tolerance, that benefit from elevated CO2 and changed cropping patterns and crop calendars. Resource management based strategies may include soil and water conservation, efficient use of irrigation water, use of renewable energy in farm operations and agroforestry systems for carbon sequestration. Risk management through weather insurance also plays an important role in adapting to climate change. Besides technology, strengthening of local institutions and a suitable policy framework are required to adapt Indian agriculture to the current and future climate variability (Venkateswarlu and Shankar, 2009).
REFERENCES [1] Krishna Kumar 2009. Impact of climate change on India’s monsoon climate and development of high resolution climate change scenarios
for India. Presented at MoEF, New Delhi on October 14, 2009 (http:moef.nic.in). [2] Venakteswarlu B and Shankar A K 2009. Climate change and agriculture adaptation and mitigation strategies. Indian Journal of
Agronomy 54: 226-230.
It is I
LLEGAL t
o cop
y, pri
nt or
save
any c
onten
t of th
is PDF,
in pa
rt or in
full,
on an
y retr
ieval
syste
m,
withou
t the E
XPRESS WRITTEN PERMISSIO
N of th
e cop
yrigh
t-hold
er

National Conference on Climate Change and Agricultural Production: Adapting Crops to Climate Variability and Uncertainty, 6th–8th April, 2017
[6]
Impact of Climate Change on Temperate Fruit Production in North Western Himalayan Region of India–Challenges,
Opportunities and Way Forward
Nazeer Ahmed*, F.A. Lone and K. Hussain S.K. University of Agricultural Sciences and Technology of Kashmir,
Shalimar Srinagar–190025, J&K, India E-mail: *[email protected]
The Himalayan region in India which is about 2500 km long with width ranging from 240 to 340 km and altitude above 8,000 m above mean sea level has well-defined agro-ecosystem occupying about 23,600 sq. km. area. This entire Indian Himalayan region is further divided into four zones as North Western Himalayas, Central Himalayas, Eastern Himalayas and North Eastern Himalayas. The North Western Himalayas however mainly consist of three states namely Jammu and Kashmir, Himachal Pradesh and Uttarakhand and has a unique and fragile eco-system, where people are heavily dependent on their natural resources for their sustenance and livelihood. More than 65 per cent people in this region are dependent on agriculture and allied activities of which horticulture is of major importance and draws about 70 per cent of Gross Domestic Product (GDP) from the surrounding ecological resources. The climate is temperate type mainly characterized by extreme cool winters and mild summer. It offers tremendous opportunity for production of high quality horticultural crops like apple, peach, plum, apricot, almond, walnut and minor fruits and berries. It covers an area of about 8.35 lakh hectares and produces fruits of approximately 40 lakh tonnes. Although, on one hand there has been seen marked growth in area and production of these crops but on other hand productivity is far less than the advanced countries. The low productivity is mainly attributed by several factors including climatic, physiological and biological. According to inter-governmental panel on climate change (IPCC) report, climate change refers to any change in climate over time, due to natural variability or as a result of human activity. Over the years, climatic change is playing a significant role in occurrence of erratic rain and snowfall, increase in temperature, fast receding glaciers, change in seasons etc which is greatly affecting horticultural crops especially major fruits, apple and almond. Due to climate change, low production of horticultural crop productivity and quality is greatly affected. Due to severe cold wave horticultural crops suffer a yield loss of 10–100% depending upon crop and variety. Production of apple in Uttarakhand in last two decades showed a decreasing trend. The global warming has caused loss of vigour, fruit bearing ability, reduction in size of fruits, less juice content, low colour, reduced shelf life and increasing attack of pests resulting in low production and quality of apples. Unusual or very early flowering or late snowfall affecting almond which has either no or very less fruit set. Abnormal high temperature during winter cause poor flowering, irregularity in flowering duration, pattern of flowering and poor yield in apple, cherry and pear due to non-availability of sufficient chilling hours during winter months. In Kashmir valley due to erratic and extreme weather conditions all kinds of pome, stone and nut fruits are getting heavily damaged and quite often there is a coincidence of snowfall and flowering in most of the fruit and nut crops resulting in severe frost injury and in some cases the higher average temperature during winter inducing early bloom and maturity. The impact of fluctuation in temperature change is so much that most apple and almond trees sprout 2-3 weeks earlier instead of their normal sprout in mid March and April respectively. Cherries are also fast disappearing from their traditional growing areas of Kashmir valley. In Himachal Pradesh and Uttarakhand due to rise in temperature and decline in overall precipitation, the apples in lower attitudes are
It is I
LLEGAL t
o cop
y, pri
nt or
save
any c
onten
t of th
is PDF,
in pa
rt or in
full,
on an
y retr
ieval
syste
m,
withou
t the E
XPRESS WRITTEN PERMISSIO
N of th
e cop
yrigh
t-hold
er

National Conference on Climate Change and Agricultural Production: Adapting Crops to Climate Variability and Uncertainty, 6th–8th April, 2017
[7]
shifting upwards replacing with low chilling crops like peach and apricots. The diseases like Alternaria leaf spot and scab in apple, gummosis in stone fruits and nuts have become severe. The aphid attack is occurring approximately two weeks earlier under increased temperature. The red mite, white grub and scale insects have emerged seriously in almost all crops impacting productivity and quality of the produce. In the light of increased global warming, there is a need to develop climate resilient varieties where crop architecture and physiology may be genetically altered to adapt to changing environmental conditions and at the same time develop technologies measures to mitigate the climate change both at local, regional and state level with equal and proactive participation of all stake holders including, farmers, scientific community and administrators of the line/ field department. The horticulturists will have to play a significant role in the climate change scenario and proper strategies have to be envisaged for saving high value temperate fruits. Some of the significant achievements made in developing and identifying climate resilient genotypes and technologies are discussed to mitigate impact of climate change in temperate fruit crops.
Climate Resilient Agriculture: Global and National Initiatives
Ch. Srinivasa Rao ICAR-Central Research Institute for Dryland Agriculture, Santoshnagar, Hyderabad–500059, India
E-mail: [email protected]/ [email protected]
International Panel on Climate Change (IPCC) in its Fifth Assessment Report observed that ‘Warming of climate system is unequivocal, and since the 1950s, many of the observed changes are unprecedented over decades to millennia. The atmosphere and oceans have warmed, the amount of snow and ice have diminished, and sea levels risen’. Climate change projections for Indian sub continent upto 2100 indicate an increase in temperature by 2–4oC, with different regions expected to experience differential change in the amount and distribution of rainfall. Government of India has committed for the reduction of emission intensity of GDP by 33–35% of its Green House Gas (GHG) emissions by 2030 from 2005 levels. Based on the recommendations of Standing Parliamentary Committee on Agriculture, Government of India and Ministry of Agriculture and Farmers Welfare is implementing National Innovations in Climate Resilient Agriculture (NICRA) since 2011–12. Meeting the challenges of sustaining domestic food production in the face of changing climate and to generate technologies towards adaptation and mitigation of climate change in agriculture are the important objectives of NICRA besides supporting and to articulate the country’s views at different Global fora like UNFCCC, SBSTA and CoP etc. Forty-eight ICAR research institutes are working on developing strategic research related to development multiple tolerant stress tolerant crop verities, livestock breed, and adaptation and mitigation strategies by integrating weather-soil-water systems. Technology demonstration component of NICRA is implemented in 151 model villages covering various climatic vulnerabilities. Outputs of NICRA project are contributing to several national project reports i.e., Intended Nationally Determined Contribution (INDC), Biennial Update Report (BUR), Nationally Appropriate Mitigation Action (NAMAs), National Mission on Sustainable Agriculture (NMSA) and several other Missions under Prime Minister National Action Plan on Climate Change. This is the unique project, which brings all sectors of agriculture viz. crops, horticulture, livestock, fisheries, NRM and extension scientists on one platform for addressing climate concerns. ICAR-CRIDA in association with our NARS, KVKs, Agri Universities have developed 619 district agriculture contingency plans out of targeted 651 rural districts to meet the challenges various weather aberrations and extreme climatic events. Large scale sensitization and capacity building is taken place during past 3 years, with state level interface meetings with DAC on one side
It is I
LLEGAL t
o cop
y, pri
nt or
save
any c
onten
t of th
is PDF,
in pa
rt or in
full,
on an
y retr
ieval
syste
m,
withou
t the E
XPRESS WRITTEN PERMISSIO
N of th
e cop
yrigh
t-hold
er

National Conference on Climate Change and Agricultural Production: Adapting Crops to Climate Variability and Uncertainty, 6th–8th April, 2017
[8]
and state Agri/horti/animal husbandry dept. other side by involving every district office towards implementation of these plans towards meeting the weather aberrations and extreme climatic events. Prime Minister Fasal Bheema Yojana, PMKSY, national level soil health programs etc are some of the recent initiatives, which contribute, to resilience to agriculture production systems in the event of climate change and increased frequency of its impacts.
Adaptation and Intervention in Crops for Managing Atmospheric Stresses
N.P. Singh, S.K. Bal, N.S. More, Yogeshwar Singh and A. Gudge ICAR-National Institute of Abiotic Stress Management,
Malegaon, Baramati, Pune–413115, India
Climate change is the variation in the statistical distribution of weather patterns when that change lasts for an extended period of time. The relationship between climate change and agriculture is complex, both ecologically and politically. Climate variability is inherently linked to the productive capacity of agricultural production systems worldwide. In India population depends highly on agriculture and they created excessive pressure on natural resources with poor coping mechanisms. The significant negative impacts have been noticed with respect to climate change, predicted to reduce yield by 4.5 to 9 per cent, roughly up to 1.5 per cent of GDP per year. India is more challenged with impacts of looming climate change, and agricultural production in the country is becoming increasingly vulnerable to climate variability and change characterized by altered frequency, timing and magnitude of precipitation and temperature. Therefore, it is need of the hour to enhance resilience of agriculture to climate change through planned adaptation and mitigation strategies.
Simulating the Impact of Climate Change and its Variability on Agriculture
Naveen Kalra Former Head, Division of Agricultural Physics, Indian Agricultural Research Institute
New Delhi–111012, India E-mail: [email protected]
Indian agriculture is mostly intensive and presently showing concerns of decline in productivity primarily due to deteriorating soil health (in terms of physical, chemical and biological), surface/ground waters concerns (quality and quantity), and newly emerging insects/ pests). Climate change and climatic variability are of great concerns, especially in India. Probabilities of occurrence of extreme/ episodic events have increased over the last three decades. There is need to sustain agricultural productivity and safeguard the environment under these climatic/episodic events.
Agricultural productivity can be affected by climate change; directly, due to changes in temperature, precipitation or CO2 levels and indirectly, and through changes in soil health and infestation by insects/ pests. Our country has numerous and complex agro-ecologies and production environments, so there is a need to evaluate the impact of climate change on regional scale, by incorporating socio-economic and bio-physical
It is I
LLEGAL t
o cop
y, pri
nt or
save
any c
onten
t of th
is PDF,
in pa
rt or in
full,
on an
y retr
ieval
syste
m,
withou
t the E
XPRESS WRITTEN PERMISSIO
N of th
e cop
yrigh
t-hold
er

National Conference on Climate Change and Agricultural Production: Adapting Crops to Climate Variability and Uncertainty, 6th–8th April, 2017
[9]
drivers along with the climatic elements. Crop models (mainly dynamic/ mechanistic) can effectively integrate these aspects for assessing the impact of future climate change as well suggest suitable options for suggesting suitable mitigation and adaptation strategies. Several simulation models viz. INFOCROP, WTGROWS, ORYZA, DSSAT, APSIM have been developed and widely used for resource and inputs management, plant ideo-typic designs, climate change/ its variability impact evaluation, yield forecasting and addressing extreme/ episodic events. By using these models, differential response of reduced crops yields to rising temperatures was evaluated at several locations. Interaction of changes in CO2 concentration and solar radiation with temperature was noticed through modifications in soil and crop processes and subsequent realization in grain yield.
Crop models have been successfully employed for suggesting suitable mitigation and adaptation strategies (such as choice of crops/ cropping systems, water/ nutrients management options, adoption of suitable agronomic management) for reduction in GHGs emission and sustenance of agricultural production. Crop models have been successfully employed for assessing extreme/ episodic events, viz. aerosol impact on crops as evaluated by using WTGROWS and DSSAT in the UNEP sponsored ABC project. The crop-pest-weather interaction and socio-economic components in the climate change impact evaluation, at present are relatively weak but are being continuously improved. We should develop agro-forestry models for effective land use planning. We also need to emphasize on development of inter-and intra-sectoral assessment models (IAM), for developing appropriate methods for sustaining systems’ productivity under the prime concern of climatic variability/ climate change.
Weather Based Information on Risk Management in Agriculture
K.K. Singh*, A.K. Baxla, Priyanka Singh and P.K. Singh Agromet Advisory Service Division,
India Meteorological Department, New Delhi–110003, India E-mail: *[email protected]
In recent decades, aberrant weather and climate have drastically impact agricultural production and increase risks in India, it also impact the quality, if not the absolute production levels, of a crop. The rising weather risks affect the livelihoods of farmers and GDP growth of the country. Under increasing threat condition, it is becoming increasingly important for farmers to proactively manage the weather and climate risks to agriculture to protect their livelihoods.
WEATHER FORECAST AND AGROMET INFORMATION
IMD mandate to issue weather forecast for different time scale in advance, it provides opportunity to efficiently minimize the loss from adverse weather and took the benefit from benevolent weather.
SHORT RANGE WEATHER FORECAST
Short range forecast of up to 3 days resolution and now-casting of 3 hours to 6 hours resolution having significance in efficient utilization of agricultural inputs. Network of 17 Doppler Weather Radar (DWR) of IMD efficiently monitors the track of tropical cyclone, cloud movements, rainfall occurrence etc. informs very well in advance.
It is I
LLEGAL t
o cop
y, pri
nt or
save
any c
onten
t of th
is PDF,
in pa
rt or in
full,
on an
y retr
ieval
syste
m,
withou
t the E
XPRESS WRITTEN PERMISSIO
N of th
e cop
yrigh
t-hold
er

National Conference on Climate Change and Agricultural Production: Adapting Crops to Climate Variability and Uncertainty, 6th–8th April, 2017
[10]
MEDIUM RANGE WEATHER FORECAST
Medium range forecast (MRF) having temporal resolution of 3–10 days, for in situ agricultural practices this forecast is considered to be most important. IMD issues Multi Model Ensemble technique based Medium Range Weather Forecast quantitatively for seven weather parameters viz., rainfall, maximum temperature, minimum temperature, wind speed, wind direction, relative humidity and cloudiness. In addition, weekly cumulative rainfall forecast is also provided. Present system of medium range weather forecast use GFS T-1534 model forecast output of 12.5 km resolution. The accuracy of forecast is around 70%. Model has been very successfully capturing the weather related to synoptic system leading to large scale rainfall and such forecast are very important for agricultural operations such as irrigation, fertilizer application and chemical spray.
EXTENDED RANGE FORECAST
Long breaks in critical growth periods of agricultural crops lead to substantially reduced yield. Thus, the forecast of this active/ break cycle of monsoon, commonly known as the Extended Range Forecasts (ERF) is very useful. The forecasts of precipitation on this intermediate timescale are critical for the optimization of planting and harvesting. Prediction of monsoon break 2 to 4 weeks in advance, therefore, is of great importance for agricultural planning (sowing, harvesting, etc.) and yield forecasting, which can enable tactical adjustments to the strategic decisions that are made based on the longer-lead seasonal forecasts, and also will help in timely review of the ongoing monsoon conditions for providing outlooks to farmers.
IMD has been issuing experimental extended range forecast since 2009 using available products from statistical as well as multi-model ensemble (MME) based on outputs available from dynamical models (NCEP_CFS, IITM_CFS, JMA, ECMWF etc) from various centres in India and abroad. The MME forecast is being prepared once in a week with the validity for subsequent four weeks. However model runs is made for 45 days every week. The latest generation coupled models are found to be very useful in providing skillful guidance on extended range forecast. The performance of extended range forecasts for the southwest monsoon seasons clearly captured the delay/ early onset of monsoon over Kerala, active/break spells of monsoon and also withdrawal of monsoon in the real time in providing guidance for various applications. On experimental basis the MME forecast on meteorological subdivision level up to two weeks are also being used in providing the agromet advisory for farming community. During the other season the MME based ERF also provides encouraging results in case of northeast monsoon rainfall over southern peninsula and tropical cyclo-genesis over the north Indian Ocean during the post monsoon season from October to December (OND). In addition, the MME based ERF forecast also provides useful guidance pertaining to rainfall associated with Western Disturbances (WD) over northwest India during winter. The ERF forecast for minimum and maximum temperatures during winter and summer seasons are also found to be very useful.
LONG RANGE FORECAST
Long-range forecast (LRF)/ Seasonal forecast, based on statistical methods LRF has been issued for the southwest monsoon rainfall over India (ISMR) since many years in two stages. Rainfall induced stress associated with amount and date of occurrence viz. early, mid and late deficit in rainfall is predicted by long range forecast. Long range forecast provides lead time for strategic planning in agriculture.
It is I
LLEGAL t
o cop
y, pri
nt or
save
any c
onten
t of th
is PDF,
in pa
rt or in
full,
on an
y retr
ieval
syste
m,
withou
t the E
XPRESS WRITTEN PERMISSIO
N of th
e cop
yrigh
t-hold
er

National Conference on Climate Change and Agricultural Production: Adapting Crops to Climate Variability and Uncertainty, 6th–8th April, 2017
[11]
GRAMIN KRISHI MAUSAM SEWA
India Meteorological Department (IMD) is rendering district level weather based agromet advisory service named as “Gramin Krishi Mausam Sewa” since 2008 in the country to cope up with weather and climatic risks and uncertainties. GKMS is multidisciplinary and multi-institutional project. It involves all stake holders such as State Agricultural Universities (SAUs), Indian Council for Agriculture Research (ICAR), Krishi Vigyan Kendra (KVKs) Department of Agriculture & Cooperation and Farmers’ Welfare, State Department of Agriculture, NGOs, Media Agencies etc. Under GKMS scheme weather based crop and locale-specific agro-advisories for 633 rural districts are prepared and disseminated to farmers deploying various modes of information dissemination e.g. radio, television, print media, internet, Kisan Call Centres and mobile phones. Presently 1.14 crore farmers receive abridged advisories through SMS on their mobile phone.
The services at its current spatial resolution made significant contribution to reduce risk and improve agricultural productivity farm income, despite local climate variations. It also focuses on environment friendly integrated solutions that are within the farmers’ capabilities. It was observed that there has been substantial increase in productivity for cereals, oilseeds and vegetable. A comprehensive study on impact assessment and economic benefits of this service carried out in year 2010 by the National Council of Applied Economic Research (NCAER) report that the contribution to GDP is estimates Rs. 50,000 crores. Weather forecast and warnings have helped to enhance the livelihood security for farmers and rural community in the project region.
Further to improve the relevance of this service at block level with high–resolution weather forecast will be utilized to develop the services. As a part of Gramin Krishi Mausam Sewa it is proposed to establish 240 District Agromet Units (DAMUs) at Krishi Vigyan Kendra (KVKs) at each district will be included in a phase manner. Efforts are being made to atomize the process of farm advisory preparation and dissemination through Kisan portal. Service delivery at village level will be established using all the dissemination channels including DD Kisan, Kisan portal, the Ministry of IT and the Department of Electronics and IT (DeitY), the Department of Post, CSC etc. and other initiatives under Digital India Movement.
STRUCTURING A WEATHER RISK MANAGEMENT TOOLS/ SOLUTION
The emerging weather and climate risk clearly offers new risk management tools and opportunities for agriculture. Identifying the location wise risk to weather, time period during which risk is prevalent and further quantifying and designing a weather risk management strategy based on an index is more pertinent to neutralize the risk in agriculture.
Under GKMS scheme, more focus has been started to be given to use the crop simulation model to decide crop management strategies, for the given weather condition. This will help the farmers and planners in tactical and strategical decisions regarding irrigation scheduling and efficient water management in both irrigated and rainfed agriculture system. The ERFS forecasts of IMD were used for providing advisory and risk management for particular districts based on realized forecast for strategic/ tactical decision support system were generated in few states; the outcomes of risk management options are useful for taking decisions well in advance for crop as well as for other input management and farm activities during different stages of the crop growing season.
It is I
LLEGAL t
o cop
y, pri
nt or
save
any c
onten
t of th
is PDF,
in pa
rt or in
full,
on an
y retr
ieval
syste
m,
withou
t the E
XPRESS WRITTEN PERMISSIO
N of th
e cop
yrigh
t-hold
er

National Conference on Climate Change and Agricultural Production: Adapting Crops to Climate Variability and Uncertainty, 6th–8th April, 2017
[12]
Are GCM and Crop Simulation Models Capable to Provide Useful Information for Decision Making?
Lalu Das Department of Agricultural Meteorology and Physics,
Bidhan Chandra Krishi Viswavidyalaya, Mohanpur–741252 Nadia, India
E-mail: [email protected]
Climate change, as a result of increased greenhouse gases in the atmosphere, is one of the important global environmental issues. Its regional assessment is highlighted in the different assessment reports particularly assessment report 4 (2007) and assessment report 5 (2013) of the Intergovernmental Panel on Climate Change (IPCC), as the vulnerabilities are expected to be more in the developing countries at sub-regional and local scales. Due to the actual occurrence of rainfall are highly uncertain and its erratic nature of distribution within a season and wihin few kilometers (within district and block level), the agricultural systemsare under threats in the context of climate change. So, a detailed study has been undertaken to investigate the district level past climate change informations as well as its future projection over several districts of West Bengal using station data as well as CMIP5 GCMs simulations. GCMs are the essential tools to provide useful information in past and future time scale, but still today it attracts critism due to it limited abilities to simulate the sub-regional and local scale details information necessary for impact study or other purposes of implementing proposed adaptation and mitigation options at distrcits and block level towards combating climate change. Therefore, assesing the GCMs skill in local scale and highlighting it uncertainty is crusial for make use of GCMs in any decission making.
The district wise rainfall change for the whole state of west Bengal has been quantified during last century using stations data as well as GCMs simulations. The whole dataset has been divided into four periods 1901–30, 1931–60, 1961–90 and 1991–2000 and percentage change of rainfall has been calculated with respect to the base period 1971–2000. In general north Bengal districts receive more annual rainfall than the south Bengal districts. In north Bengal, annual rainfall varies from 1500 mm in Malda district to 3950 mm Jalpaiguri with a regional averaged annual rainfall is 2540 mm whereas in south Bengal it varies from the minimum of 1320 mm in Nadia district to a maximum 1762 mm in South 24 parganas district. The annual rainfall trend of 100 years data has revealed that all the districts except Nadia, Jalpaiguri, South Dinajpur and Bardhaman have shown a positive trend. The maximum increase in rainfall was observed in South 24 Parganas (671.73 mm) followed by Cooch Behar (526.18 mm) while Nadia (-161.59 mm) showed the maximum decrease in rainfall. Seasonal trend analysis has shown that maximum increase was in South 24 Parganas (80.66 and 98.50 mm for pre and post monsoon, respectively) while it was Cooch Behar (520.25 mm) and Darjeeling (15.47 mm) during monsoon and winter season, respectively. Except Jalpaiguri, South Dinajpur and Nadia all other districts have received an increased amount of rainfall during monsoon season.
It is I
LLEGAL t
o cop
y, pri
nt or
save
any c
onten
t of th
is PDF,
in pa
rt or in
full,
on an
y retr
ieval
syste
m,
withou
t the E
XPRESS WRITTEN PERMISSIO
N of th
e cop
yrigh
t-hold
er

National Conference on Climate Change and Agricultural Production: Adapting Crops to Climate Variability and Uncertainty, 6th–8th April, 2017
[13]
The future rainfall analysis using the better performing GCMs reveals that in the 21st century there is a significant increasing trend of seasonal and annual rainfall except the winter season. Under different 30 years climatological periods of 2020s, 2050s and 2080s, the RCP8.5 has shown higher Sen’s slope value than any other RCPs. Analysis of percentage change of rainfall reveals that winter rainfall has shown 60–117% surplus in future for different RCP scenarios, whereas the post-monsoon has shown a 1–15% surplus of rainfall in future over North Bengal. Similarly, the annual rainfall over south Bengal has projected a deficient precipitation of 16 to 25% under different RCP scenarios and different climatological as well as long-term period while 3-24% surplus of rainfall is projected for different RCP scenarios in the post-monsoon season.
Such a change can alter the productivity of rice as assessed through Oryza 2000, a crop simulation model for rice. GWB and its neighbourhood is expected to experience nominal change in the either sides as rice production increases by about 10% with 1oC rise in temperature and falls by 30% with a rise of temperature by 2oC. However, the same study should be carried out under different environmental conditions at different district locations of the study area. It may be extended to consider the other agricultural products so as to have a comprehensive picture on the implications on agriculture sector as a whole.
Impact of El-Nino and La-Nina on Indian Climate and Crop Production
Vyas Pandey*, A.K. Misra and S.B. Yadav Department of Agricultural Meteorology, B.A. College of Agriculture,
Anand Agricultural University, Anand–388110, India E-mail: *[email protected]
El-Nino refers to a large-scale ocean-atmosphere climate interaction associated with the episodic warming in sea surface temperatures (SST) across the central and east-central Equatorial Pacific. La Nina is an opposite event of El Niño which is termed as the episodic cooling of ocean SST in the central and east-central equatorial pacific. El Niño events are mostly associated with warm and dry conditions in southern and eastern inland areas of Australia, as well as Indonesia, Philippines, Malaysia and central Pacific islands such as Fiji, Tonga and Papua New Guinea. The inter-annual variability of Indian summer monsoon rainfall (ISMR) has been linked to variations of Sea Surface Temperatures (SST) over the equatorial Pacific and Indian Oceans. ENSO events have a profound impact on summer monsoonal rainfall across India and most of the major droughts have occurred during El Niño events. However, its reverse is not always true. Previously El Niño had a strong association with droughts in India but this relationship has been weekend in recent years. El Niño conditions mostly coincide with a period of weak monsoon and rising temperatures in India and thus the probability of drought occurrence surges during El Nino events that could be disturbing for Indian crop production and water supply. Moreover, El Niño resulting in deficit rainfall tends to lower the summer crops production such as rice, sugarcane, cotton and oilseeds and therefore the outcome might be seen in form of high inflation rates and lower GDP due to high contribution of agriculture sector in Indian economy. This paper describes the occurrence of El Niño events, its impact on climate in different parts of world with special reference to Indian monsoon and crop production.
It is I
LLEGAL t
o cop
y, pri
nt or
save
any c
onten
t of th
is PDF,
in pa
rt or in
full,
on an
y retr
ieval
syste
m,
withou
t the E
XPRESS WRITTEN PERMISSIO
N of th
e cop
yrigh
t-hold
er

National Conference on Climate Change and Agricultural Production: Adapting Crops to Climate Variability and Uncertainty, 6th–8th April, 2017
[14]
Looking at Climate Change and its Socio-economic and Ecological Implications through BGC (Bio-Geo-Chemical Cycle)-Lens: An ADAM (Accretion of Data and Modulation) and EVE (Environmentally Viable
Engineering Estimates) Analysis
J.S. Pandey CSIR-National Environmental Engineering Research Institute
(NEERI), Nagpur–440020, India E-mail: [email protected]
Whether scientific research should follow a policy driven approach or a curiosity driven approach ? This question assumes its significance and importance especially in view of the financial crunch and continuously depleting global natural resources. Transmission and distribution of impacts under interactive and integrated influence of climate change and environmental pollution is an important area of research, which helps in quantifying human and ecosystem health risks. This also helps ultimately in converting them into the real economic terms-financial benefits accrued or costs incurred. The real scientific challenge, today, is to find out the ways and means of quantifying the following scientific facts:
Intricate interaction between climate change and environmental pollution, and their impacts in terms of human and ecosystem health.
Alterations in land cover, biodiversity, air, water and soil pollution, and their implications on climate change impacts and on availability of food-items and nutrients.
Impacts of above-mentioned alterations on disease transmission and dynamics.
In this context, it is important to reiterate that forests have one very important ecological role i.e. they regulate all the natural bio-geo-chemical cycles-for instance, carbon cycle, water cycle, nitrogen cycle and phosphorus cycle etc. One very pertinent fact which should not be overlooked is the fact that alterations and aberrations in temperature and humidity are very closely linked with significant perturbations in bio-geo-chemical cycles (BGCs).
In essence, this means that climate change problem should ideally be viewed as a significant perturbation in BGCs. Viewing climate change merely as a change in temperature or humidity levels is a very narrow way of looking at the problem, which in essence has a much wider implication and ramification. Ideally, there is no such anthropogenic activity (be it residential, commercial or industrial), which does not involve alterations in surrounding ecosystems and bio-geo-chemical cycling. Consequently, pollution generation can simply be construed as a land-use impact. Therefore, a given shift in land use pattern would essentially result in a consequential shift in pollution levels (air, water and soil) and generation of various green house gases. It is now gradually getting understood and established that alterations in land use and cover changes also affect (very significantly) the transmission and distribution dynamics of various diseases. The need of the hour, therefore, is to study the directions of these alterations and quantifications of their implications and impacts through ADAM (Accretion of Data and Modulation) and EVE (Environmentally Viable Engineering Estimates) Analysis. While discussing above-mentioned issues in the present paper, some case studies are also presented.
It is I
LLEGAL t
o cop
y, pri
nt or
save
any c
onten
t of th
is PDF,
in pa
rt or in
full,
on an
y retr
ieval
syste
m,
withou
t the E
XPRESS WRITTEN PERMISSIO
N of th
e cop
yrigh
t-hold
er

National Conference on Climate Change and Agricultural Production: Adapting Crops to Climate Variability and Uncertainty, 6th–8th April, 2017
[15]
Mapping Agriculture Dynamics and Associated Flood Impacts in Bihar using Satellite Data
C. Jeganathan* and Praveen Kumar Department of Remote Sensing, Birla Institute of Technology (BIT)
Mesra, Ranchi–835215, India E-mail: *[email protected]
Agriculture is the prime requirement for sustaining human life on earth, and agriculture sustainability depends on soil health and suitable climatic variations. Human have adopted many local-weather-dependent crop types and its cultivation patterns based on knowledge about long term climatic and environmental conditions (Altieri, 2004). Any anomaly in these factors would result in unforeseen reduction in the food production and associated socio-economic chaos at local/regional to global scale. Due to anthropogenic activities like expansion of urban area, industrialization, deforestation etc. have increased the greenhouse gases (GHGs) level and hence the mean earth surface temperature has increased (IPCC, 2013). The world mean surface temperature has increased by 0.74oC during 1900 to 2000 AD and it is anticipated to rise by 1.4-5.8oC during 2000 to 2100 AD with notable local differences (IPCC, 2007) which would result in increase in the frequency of drought, flood, sea level rise etc. and will drastically affect the crop production (Olesen and Bindi 2002; McCarl et al., 2008; Schlenker and Roberts 2009; Ortiz-Bobea 2013). Bihar is one of the fertile region in India, gifted with numerous water resources like Ganga, Gandak and Kosi and many more rivers. But these rivers are both boon and bane to Bihar because most of the rivers flood during monsoon season. Hence it would be interesting to know the Agriculture cropping pattern over a decade, its changing scenario and the impact of flood on agriculture area in Bihar. In this regard, current study attempted to use time-series remote sensing data from 2001 to 2012 in deriving spatio-temporal, seasonal and annual cropping pattern, and as well as flood scenario purely based on space based observation.
Climate Adaptive Technologies ior Sustainable Rice Production in Sub-Tropical India
Dillip Kumar Swain Department of Agricultural and Food Engineering, Indian Institute of Technology,
Kharagpur–721302, India E-mail: [email protected]
Climate change will affect food security of the world in general and of developing countries located in tropical subtropical latitudes in particular. Production of rice, the major food grain in world and the most important in Asia including India, is threatened by the climate change. There is a need to increase the rice grain productivity using suitable adaptations to climate change. The cultivar ‘Swarnasub1’ was found to be better adaptable to rising temperature under future climate scenarios as compared to IR36 and Swarna. Grain yield of the cultivar ‘Badshabhog’ was favoured under rising CO2 and temperature environment. Use of crop model simulated changes in rice grain yield of −13%, −17%, −4%, and +7% for the four cultivars IR 36, Swarna, Swarna sub1 and Badshabhog, respectively with increasing [CO2] level 100 ppm and rising temperature 1 °C above the ambient environment and they were comparable with observed yield changes from the controlled environmental experiment at Kharagpur. The grain yield of rice was simulated for the
It is I
LLEGAL t
o cop
y, pri
nt or
save
any c
onten
t of th
is PDF,
in pa
rt or in
full,
on an
y retr
ieval
syste
m,
withou
t the E
XPRESS WRITTEN PERMISSIO
N of th
e cop
yrigh
t-hold
er

National Conference on Climate Change and Agricultural Production: Adapting Crops to Climate Variability and Uncertainty, 6th–8th April, 2017
[16]
base period (1969–1999) and future periods 2020 (2011–2040), 2050 (2041–2070) and 2080 (2071–2100) under A2 and B2 scenarios of HadCM3 Global Climate Model. Under the A2 and B2 scenarios, the yield of rice declined from base period to the future periods at different locations in subtropical India. Earlier transplanting time of rice compared to normal planting (15 July) increased the simulated yields athigher latitude and reduced the yield loss at lower latitude in future climate scenarios. Delayed planting caused maximum grain yield reduction in futureclimate scenarios for all the locations. Varietal, planting time and water and nutrients management adaptations could minimize the adverse effect of climate change on rice production of subtropical India.
Climate Change: Impact on Land Degradation, Emerging Issues and Strategies
S.S. Walia*, Vikrant Dhawan and A.K. Dhawan Punjab Agriculture University, Ludhiana–141004, India
E-mail: *[email protected]
Changes in climate are recognized as one of the major factors responsible for land degradation. Land degradation can be considered in terms of the loss of actual or potential productivity due to natural or anthropic factors, actually it is the decline in land quality and land could become infertile as a result of climate change. Land degradation hazards included wind and water erosion, loss of soil carbon, nutrient decline mass movement, soil structure decline, acid sulfate soils and soil acidification. Mechanisms that initiate land degradation include physical, chemical, and biological processes. Important among physical processes are a decline in soil structure leading to soil crusting, compaction, erosion, desertification, anaerobism, environmental pollution, and unsustainable use of natural resources. Significant chemical processes include acidification, leaching, salinization, decrease in cation retention capacity, and fertility depletion. Biological processes include reduction in total and biomass carbon, and decline in land biodiversity including soil microflora. The latter comprises important concerns related to eutrophication of surface water, contamination of groundwater, and emissions of trace gases (CO2, CH4, N2O, NOx) from terrestrial/aquatic ecosystems to the atmosphere. Factors of land degradation are the biophysical processes and attributes that determine the kind of degradative processes, e.g. erosion, salinization, etc. Wind and water erosion are the most widespread form of degradation. The removal and deposition of soil particles from the top soil surface occurs by action of winds. The climate change also effect the organic matter and their decomposition rate increases with increased temperature. Majority of this organic matter had been lost as carbon dioxide in the atmosphere. Soil nutrient quantity is often affected by climatic factor. Change in temperature and precipitation affect soil nutrient levels. Increasing temperatures could aggravate the leaching and the downward movement of water in soil leads to loss of soil nutrient; which affects the soil nutrient level. Moreover, decrease in rainfall may cause upward movements of nutrients and thus leads to stalinization. In tropical and subtropical countries, loss of soil nutrient is an increasing problem.
The biophysical (land use and land management, including deforestation and tillage methods), socioeconomic (e.g. land tenure, marketing, institutional support, income and human health) and political (e.g. incentives, political stability) forces that influence the effectiveness of processes and factors of land degradation.
The resource is degraded due to soil erosion, salinity/ alkalinity, water logging, depleting under-ground water, deforestation, removal of natural vegetation, frequent use of heavy machinery, overgrazing, improper crop rotation and poor irrigation practices.
It is I
LLEGAL t
o cop
y, pri
nt or
save
any c
onten
t of th
is PDF,
in pa
rt or in
full,
on an
y retr
ieval
syste
m,
withou
t the E
XPRESS WRITTEN PERMISSIO
N of th
e cop
yrigh
t-hold
er

National Conference on Climate Change and Agricultural Production: Adapting Crops to Climate Variability and Uncertainty, 6th–8th April, 2017
[17]
Natural disasters, including droughts and floods also contribute in the process of land degradation.
Land degradation may be responsible for decline in land quality and productivity.
Physical degradation results in deterioration in the physical properties of soils. It includes compaction and hard setting of soils due to dispersion of soil aggregates.
Reduction in organic matter results in poor aggregation, cumulative infiltration rate and lower water holding capacity in the soil.
Chemical degradation is due to nutrient depletion, excessive leaching, build up of some toxic elements and elemental imbalance. Reduction in organic matter, decline in biomass, decrease in microbial activities and diversity of soil fauna are ramifications of biological land degradation.
The problem of water logging has also been controlled in several areas by constructing large number of drains, sand dunes have been cleared/ leveled by farmers to bring them under irrigated.
In case of water logged areas, the eucalyptus can be raised for bio drainage preferably on raised beds by using normal soil in rhizosphere with slight depression on the top so that the rain water is directly infiltrates into root zone of plant and may help to leach down the salts.
CONSERVATIVE STEPS FOR PRODUCTIVITY RESTORATION
Nutrient recycling through organic matter is not new, the economic significance of organic waste has gained momentum in recent years throughout the world due to its various utilizations as renewable source of energy sector.
ALTERNATIVE LAND USAGE
Introduction of forestry species or horticultural plant species in place of rising of traditional field crops or intercropping trees with field crops have proved to be helpful in restoring productivity of soils and improving the livelihood security of farmers.
Eco friendly systems based on the use of nitrogen fixing tress such as Leucaena leucocephala (subabul) has potential to bring about favorable changes in soil properties by promoting soil conservation.
Prosopis Juliflora, Terminalia arjuna (arjun) and Albizzia lebbek (siris), Acacia nilotica (kikar/babul) and Eucalyptus tereticornis (safeda) have proved more useful in management of alkali soils.
INTRODUCTION OF AGRO-FORESTRY SYSTEMS
Tree Species have ameliorative capacity for land restoration. The plantation adds sufficient residues to soil, reduces run off and soil loss and also provides economic returns to the farmers.
Multipurpose tree species can be introduced into agro forestry systems to regenerate soil health without any appreciable investments.
INTER CROPPING SYSTEMS
Introduction of legumes through bio-intensive complementary cropping systems, crop rotation, intercropping, mixed cropping or some other forms add leaf litter to soil for maintaining soil health.
Nitrogen content is also improved by biological nitrogen fixation.
It is I
LLEGAL t
o cop
y, pri
nt or
save
any c
onten
t of th
is PDF,
in pa
rt or in
full,
on an
y retr
ieval
syste
m,
withou
t the E
XPRESS WRITTEN PERMISSIO
N of th
e cop
yrigh
t-hold
er

National Conference on Climate Change and Agricultural Production: Adapting Crops to Climate Variability and Uncertainty, 6th–8th April, 2017
[18]
RECYCLING OF OF-FARM WASTES
Degraded soils are inherently poor in fertility and crop production, therefore invariable respond to fertilizer application. Efficiency of applied inorganic fertilizers is usually low and results in uneconomic return to the users.
Application of FYM not only increased N-use efficiency of urea but also improved the fertility status of soils. Crop residues are efficient source of nutrient substitution for FYM and compost.
The left over crop residues can be used as mulch or can be incorporated the soil improving soil organic matter content.
In the country like India the combined use of organic manures with chemical fertilizers is essential for sustaining soil fertility and crop productivity. The benefits accruing to integrated approach include increase in organic matter content, available plant nutrient and improvement in physical, chemical and biological properties of soil and help to save the economy of chemical fertilizers. Integrated management of fertilizers and organic manures aims at synchronizing availability of nutrients in the soil as the growth of the plant proceeds and reduce nutrient losses from the soil-plant system. Application of inputs use with great precision not only reduces the cost of production by ensuring the rational use of resources and sustaining the productivity over longer period of time.
Climate Change Impact on Agriculture and Forest Land of Bangladesh
Md. Farid Hossain School of Agriculture and Rural Development,
Bangladesh Open University, Gazipur–1705, Bangladesh E-mail: [email protected]
Bangladesh is an agricultural country with an area of 147,570 sq. km having a population of 160 million. The majority of the population depends on agriculture and natural resources for their food and livelihood. Due to climate change frequency and intensity of disasters have increased, affecting agriculture and forest of Bangladesh. Forest is a very important renewable resource in Bangladesh. Over one million people directly or indirectly depend on the forest for their livelihood. The forest and agricultural land areas are drastically decreasing annually.
Agriculture and forest are always vulnerable to unfavorable climatic conditions. It is clear that monthly minimum temperature has been increased significantly during the winter season (October to February) than that of summer season (June to August) and increase predominantly over the last 20-30 years. Several studies indicated that climate is changing and becoming more unpredictable every year in Bangladesh. Hazards like floods, droughts, cyclones and salinity intrusion are likely to be aggravated by climate change and sea level rise. The north western part is prone to drought mainly due to rainfall variability in the pre-monsoon and the post-monsoon periods. The severity of salinity problem in Bangladesh has increased much due to the intrusion of saline sea water. Problem like flood and water logging in the central region, flash-flood in the northeast region, drought in the northwest and southwest region and salinity intrusion and inundation in the coastal region would be more acute in future in Bangladesh. Crops and land are affected by climate change in different ways. Therefore, changes of climate will severely decline grown of various crops in the north and central parts of the country. Climate change is now a major challenge in Bangladesh. Regional collaborative efforts are inevitable to mitigate adverse impact of climate change.
It is I
LLEGAL t
o cop
y, pri
nt or
save
any c
onten
t of th
is PDF,
in pa
rt or in
full,
on an
y retr
ieval
syste
m,
withou
t the E
XPRESS WRITTEN PERMISSIO
N of th
e cop
yrigh
t-hold
er

National Conference on Climate Change and Agricultural Production: Adapting Crops to Climate Variability and Uncertainty, 6th–8th April, 2017
[19]
Global Climate Change and Inland Open Water Fisheries in India: Impact and Adaptations
B.K. Das*, U.K. Sarkar and K. Roy ICAR-Central Inland Fisheries Research Institute,
Barrackpore 700120. Kolkata–700120, India E-mail: *[email protected]
India has crossed the fisheries production of 10 million tonnes in 2015 and presently on its way to achieve the second blue revolution. Among all the major factors impeding sustainability of fisheries, factor of climate change is the recent addition. Climate change trends along major river basins of India have revealed a warming trend (0.2–0.5°C), declining rainfall (257–580 mm) and shifting seasonality of rainfall occurrence. Rising sea levels (1.06–1.75 mm/ year), receding Himalayan glaciers and frequent occurrence of extreme weather events are also a matter as per IPCC AR5. It has been found that the impact of climate change on Indian inland fisheries is quite wide. The present article discusses the contributions made by ICAR-CIFRI since 2004 on climate change vulnerability assessment framework, changes in breeding phenology of fishes, models on fish reproduction and diversity, thermal tolerance of fishes, carbon sequestration potential of wetlands and indigenous climate smart fisheries adaptation strategies. Impact on inland fisheries ranges from changes in range distribution, breeding behavior, growth rates, thermal tolerance, stress physiology, invasion of exotics to impact on aquatic primary productivity, habitat quality through sedimentation, water stress, aquatic weed proliferation and salt water intrusion. Wetlands are considered to be the most negatively impacted through climate change. The impact of climate change on inland fish production is mixed in nature ranging from being detrimental to beneficial in various cases. Fishes are continuously adapting themselves to this changing climate at both physiological and behavioral levels. Public awareness, capacity building, careful planning at policy making levels is imperative. Understanding the response and adaptation capacity of fishing and fishers to the physical and biological changes are also necessary.
Climate Change Impacts on Insect Dynamics and Management Interventions
Subhash Chander Division of Entomology, Indian Agricultural Research Institute,
New Delhi–110012, India E-mail: [email protected]
Climate is an important determinant of the abundance and distribution of biological species. Over past hundred years, the global temperature has increased by 0.8°C and is expected to reach 1.1–5.4°C by the end of next century. On the other hand, CO2 concentration in the atmosphere has increased drastically from 280 to 390 ppm and is likely to be doubled by 2100. Climate change will have both direct and indirect effect on insect population. Temperature will affect insects directly by influencing their development and period of activity, while CO2 will affect them through host plants. Elevated CO2 will increase C: N ratio in plants and will affect feeding rate of insects. The climate change impacts on insects may include shifts in species distributions to higher latitudes and elevations, changes in insect phenology with life cycles beginning earlier in spring and continuing later in autumn, increase in population growth rates and number of generations,
It is I
LLEGAL t
o cop
y, pri
nt or
save
any c
onten
t of th
is PDF,
in pa
rt or in
full,
on an
y retr
ieval
syste
m,
withou
t the E
XPRESS WRITTEN PERMISSIO
N of th
e cop
yrigh
t-hold
er

National Conference on Climate Change and Agricultural Production: Adapting Crops to Climate Variability and Uncertainty, 6th–8th April, 2017
[20]
change in migratory behaviour, alteration in crop-pest synchrony and natural enemy-pest interaction, and changes in interspecific interactions. Besides, efficacy of pest management components such as, host-plant resistance, bio-pesticides, natural enemies and synthetic chemicals is liable to change as a result of global warming.
Impact of global climate change on pest population can be assessed through experimental studies as well as through simulation models. Impact of CO2 on insect population via host plants can be studied through open top chambers (OTCs) and free air carbon dioxide enrichment (FACE). Brown planthopper (BPH) was found to inflict more yield loss in rice under elevated CO2 in OTC, owing to higher pest population as well as sucking rate. Probable impact of temperature rise on insect populations can be known by comparing current and projected temperature conditions at a location with a species’ favourable temperature range. Data on temperature dependent development period and survival can be used to determine favorable temperature range and computing thermal constant and development thresholds for the species.
Both empirical and simulation models would prove useful to gauge climate change impacts on insects. Empirical models based on long-term data on pest incidence and weather variables can be used to assess the likely impact of climate change on pest status in a region. Simulation models have been used widely to assess climate change impact on yield of various crops in different agro ecological zones. However, insects have in general been ignored in these studies Emphasis thus needs to be laid on population dynamic simulation and their coupling with crop growth simulation models. Insect population simulation model can be developed based on various bio-ecological factors of a species viz., fecundity, sex ratio, migration, abiotic and biotic mortality factors, development thresholds and thermal constants Population simulation model can be coupled to crop growth model at relevant plant processes depending on pest damage mechanisms. Crop-pest model can then be used to analyze impact of climate change on insect dynamics as well as crop-pest interactions.
Pest management components such as host-plant resistance, bio-pesticides, natural enemies and synthetic chemicals are likely to be affected as a result of global warming. To sustain agricultural productivity under climate change, pest management adaptations assume significance to ensure effectiveness of management tactics against pests.
Potential Impacts of Recent Invasive Whiteflies and its Natural Enemies in Indian Agriculture
K. Selvaraj1*, T. Venkatesan1, Ankita Gupta1, S.K. Jalali1 and R. Sundararaj2 1ICAR-National Bureau of Agricultural Insect Resources, Hebbal, Bengaluru–560024, India
2Institute of Wood Science and Technology, Malleswaram, Bengaluru–560003, India E-mail: *[email protected]
The agricultural economy of India is vulnerable to the threat posed from the introduction of exotic pests/ diseases. In recent years, there is an increase in movement of invasive exotic species from one region to another region of the world. In India, about 120 exotic insect species were reported so far. Whteflies and mealybugs constitute a major part of the invasion among the economically important arthropods. Exotic whiteflies have invaded several countries causing direct losses in agriculture, horticulture and forestry. Currently, there are 442 species of whiteflies belonging to 63 genera known from India; of these, a few are economically important. Two invasive whiteflies viz., the solanum whitefly Aleurothrixus trachoides (Back) (Hemiptera: Aleyrodidae) (Dubey and Sundararaj, 2015) and the rugose spiraling whitefly (RSW)
It is I
LLEGAL t
o cop
y, pri
nt or
save
any c
onten
t of th
is PDF,
in pa
rt or in
full,
on an
y retr
ieval
syste
m,
withou
t the E
XPRESS WRITTEN PERMISSIO
N of th
e cop
yrigh
t-hold
er

National Conference on Climate Change and Agricultural Production: Adapting Crops to Climate Variability and Uncertainty, 6th–8th April, 2017
[21]
Aleurodicus rugioperculatus Martin (Sundararaj and Selvaraj, 2017) invaded India in 2014 and 2016, respectively. A. trachoides and A. rugioperculatus believed to be originated from neotropical and Central America, respectively and reported to feeds on many agricultural and horticultural crop plants including ornamental plants. A. trachoides mainly feeds on Solanaceae plants such tomato, brijal, capsicum etc. Initially, A. rugioperculatus was found infesting coconut. Subsequently, pest was found to feeds on banana, custard apple, sapota and several ornamental plants in Tamil, Nadu, Andhra Pradesh and Kerala. Nymphs and adults congregate generally on the lower surface of the leaves, stem, fruits and suck the sap. The copious white, waxy flocculant material secreted by nymphs is readily spread elsewhere by wind and creates a very unsightly nuisance. Furthermore, prodigious quantities of honey excretion which serves as substrate for dense growth of sooty mold development, which interfere with photosynthesis. In case of spiraling whiteflies, shows typical concentric waxy spiraling symptoms on various parts of infested plants. A. rugioperculatus produces profuse quantity of wax filaments from the immature stages both tufts of fluffy white and long crystal like glassy rods. The puparium of these species is used for taxonomic identification. A. trachoides, early nymphal instars are flat, round to oval shaped, light to golden yellow in color, and may also bear eight spherical patches on the dorsal surface. As the nymphal instars mature they become more convex, their color turns darker, and they produce a dense, cottony wax and long, thin, waxy filaments. RSW adults are about three times larger and closely related to giant whitefly, Aleurodicus dugesii. Like other spiraling whitefly (Aleurodicus dispersus), the female of RSW lays eggs on the underside of leaves in a circular pattern or concentric waxy spiraling giving rise to their name and covers them with wax. Eggs are elliptical and creamy white to dark yellow in color and immature stages are creamy brownish yellow in colour which turn slightly dark before adult emergence. The adult whitefly after emerging mostly congregates and reproduces near the midrib of undersurface coconut leaflets was observed. RSW adults can be distinguished by their large size and the presence of a pair of irregular light brown bands across the wings. Natural enemies, aphelinid parasitoid, Encarsia guadeloupae Viggiani (Hymenoptera: Aphelinidae) with maximum parasitism (20.0 to 60.0%), several predators such as Dichochrysa astur (Neuroptera: Chrysopidae), Jauravia pallidula; Cybocephalus sp. (Coleoptera: Coccinellidae), Neoseiulus sp. (Arachnida: Acari: Phytoseiidae) on RSW and Axinoscymnus puttarudriahi (Coleoptera: Coccinellidae) on A. trachoides. In this paper, diagnosis through morphological as well as molecular tools, potential impacts of its invasion, distribution, host plant ranges, biology, symptoms of damage, natural enemies and its management strategies dealt briefly.
REFERENCES [1] Dubey AK and Sundararaj R. 2015. A new combination and first record of genus Aleurothrixus Quaintance &Backer (Hemiptera:
Aleyrodidae) from India. Biosystematica 9(1&2):23–28. [2] Sundararaj R and Selvaraj K 2017. Invasion of rugose spiraling whitefly, Aleurodicus rugioperculatus Martin (Hemiptera: Aleyrodidae): a
potential threat to coconut in India. Phytoparasitica. DOI:10.1007/s12600-017-0567-0.
It is I
LLEGAL t
o cop
y, pri
nt or
save
any c
onten
t of th
is PDF,
in pa
rt or in
full,
on an
y retr
ieval
syste
m,
withou
t the E
XPRESS WRITTEN PERMISSIO
N of th
e cop
yrigh
t-hold
er

National Conference on Climate Change and Agricultural Production: Adapting Crops to Climate Variability and Uncertainty, 6th–8th April, 2017
[22]
Emergence of Bemisia tabaci as New World Pest of Crops and Challenges in Management
Shantanu Jha* and Gayatri Kumari Padhi Dept. of Agril. Entomology,
Bidhan Chandra Krishi Viswavidyalaya, Mohanpur–741252 Nadia, Indial E-mail: *[email protected]
The importance of whiteflies as economic pests seems to expand continually. Reaumer in 1736 first described the importance of Whiteflies as an important group of economic pests of crops. Although Mound and Halsey (1978) catalogued 1156 species of whiteflies (Homoptera: Aleyrodidae), only a limited number of whitefly species are considered pests of economic importance. Two of the key whitefly pests throughout the tropics are Bemisia tabaci (Gennadius) and Trialeurodes vaporariorum (Westwood). Dr. Julio bird first recognized 100 global invasive species (Global Invasive Species Database) with its ability to phenotypic variations of Bemisia tabaci (Gennadius) (Hemiptera: Aleyrodidae) which is considered one of the top attacker i.e. 900 host plants (Simmons et al. 2008) and vector of 111 plant virus pecies (Jones 2003). B. tabaci is actually is a species complex with at least 36 previously identified biotypes (De Barro et al. 2011). Agricultural production losses due to B. tabaci infestations have escalated over the past 25 years and more virulent biotypes have spread to all continents except Antarctica (De Barro et al. 2005). The two most invasive biotypes that pose the greatest threat to growers are the B and Q biotypes (Perring2001).The introduction of an exotic pesticide resistant biotype (B) of B. tabaci too many world locations during 1986–1992 drew increasing attention to the pest and vector status of B. tabaci. In addition, B. tabaci is a vector of plant begomoviruses (Geminiviridae:Begomovirus). These whitefly transmitted viruses (WTVs) are among the most destructive plant viruses; early virus infection often results in total crop loss. During 1975–1990, begomoviruses emerged widely as viral pathogens in crops throughout tropical world, in mild temperate and Mediterranean locales. The begomovirus vector B. tabaci is an insect species complex that has geographically distinct phenotypic and genotypic variants exhibit no corresponding morphological characters (Frohlich et al., 1999). The route followed by begomoviruses in their insect vector and the velocity of translocation of the various viruses seem to be intrinsic to the whitefly, not to the virus. The coat protein is the only begomoviral gene product that directly interacts with whitefly factors during the circulative transmission of the virus. A. GroEL homologue produced by the whitefly endosymbiotic bacteria facilitates the survival of the virus in the insect gut. Monopartite as well as bipartite begomoviruses is transmitted during mating. Indistinguishable in appearance of B. tabaci biotype B and biotype Q is extremely problematic to agricultural production because populations are highly prone to develop resistance to insect growth regulators and neonicotinoid insecticides (Horowitz et al. 2004). Pupal morphology in B. tabaci responds to plant surface topology by alteration of size and shape of setae, hairs and pores and waxy protusions-making it adaptive–but at times make it difficult to correctly identify the species. Small size of whiteflies is also a constraint for monitoring by the farmers and it requires an ample of knowledge about the above mentioned pest for development of a proper quite essential management system for the same.
It is I
LLEGAL t
o cop
y, pri
nt or
save
any c
onten
t of th
is PDF,
in pa
rt or in
full,
on an
y retr
ieval
syste
m,
withou
t the E
XPRESS WRITTEN PERMISSIO
N of th
e cop
yrigh
t-hold
er

National Conference on Climate Change and Agricultural Production: Adapting Crops to Climate Variability and Uncertainty, 6th–8th April, 2017
[23]
REFERENCES [1] DeBarro P J, S. Liu L M Boykin and A B Dinsdale. 2011. Bemisia tabaci: a statement of species status. Annual Review of Entomology. 56:
1-19. [2] De Barro, P J 2005. Genetic structure of the whitefly Bemisia tabaci in the Asia-Pacific region revealed using microsatellite markers.
Molecular Ecology 14: 3695-3718. [3] Frohlich D, Torres-Jerez I, Bedford I D, Markham P G, Brown J K. 1999.A phylogeographic analysis of the Bemisia tabaci species
complex based on mitochondrial DNA markers. Molecular Ecology 8:1593-1602. [4] Horowitz, A. R., S. Kontsedalov, and I. Ishaaya. 2004. Dynamics of resistance to the neonicotinoids Acetamiprid and thiamethoxam in
Bemisia tabaci (Homoptera: Aleyrodidae). Journal of Economic Entomology 97: 2051-2056. [5] Jones D R 2003. Plant viruses transmitted by whiteflies. European Journal Plant Pathology 109: 195-219. [6] Mound L A, Halsey S. H. 1 978. Whitef1y of the World. New York: Wiley. 340 pp. [7] Perring T M. 2001. The Bemisia tabaci species complex. Crop Protection 20: 725-737. [8] Simmons A M, Harrison H F and Ling K S. 2008. Forty nine new host plant species for Bemisia tabaci (Hemiptera: Aleyrodidae).
Entomological Science 11:385-390
Impact of Climate Change on Tropical Fruit Production Systems and its Mitigation Strategies
Vishal Nath* and Gopal Kumar ICAR-NRC on Litchi, Musahari, Muzaffarpur–842002, India
E-mail: *[email protected]/ [email protected]
Scientists are almost unanimous of the opinion that tropics will be first and most to suffer due to climate change even though the magnitude of projected change as well as past climate trend is moderate as compared to other part of the words. Reason are though complex, includes poor economic conditions of majority of population, higher dependence on natural resources and ecosystem service, relatively narrow temperature ranges means even the small deviation is likely to have significant effect. On an average projection of climate change for tropics indicates rise in temperature of 0.4–1°C, 0.8–3.2°C and 1.2–6°C by the 2020, 2050 and 2100 respectively as compared to base line period (1961–1990). Atmospheric CO2
concentration is likely to be 550–800 ppm from the present level of 400 ppm by the end of the century. The change associated with climate has never been smooth and likely to be expressed in terms of increased uncertainties and extremities of weather. Number of heat waves witnessed during last 25 years (1990–2015) in tropics has exceeded the same in last 100 years. Similarly the number of extreme rainfall events as well as drought has also increased in recent past.
Fruit production being one of the important activities in tropical regions has been largely ignored from the systematic impact analysis of climate change and adaptation studies. Tropical fruits are attuned to the prevailing weather conditions marked by high temperature. There is range of temperature at different phenophases for optimum production of different fruits. Any deviation from the optimum is likely to affect production and quality of tropical fruits. The complex interaction of altered temperatures, corresponding phenophases of different fruits, relative suitability of species and cultivars, elevated CO2, water availability, pollinators, pest and disease and management practices will largely determine the tropical fruit production. Tropical fruits whose production is presently limited by high temperature are likely to suffer most and probably have to shift to new areas. Some tropical fruits growing in elevated/fringe areas and production is limited by law temperature are likely to be benefited from elevated temperature. For rest of the large section
It is I
LLEGAL t
o cop
y, pri
nt or
save
any c
onten
t of th
is PDF,
in pa
rt or in
full,
on an
y retr
ieval
syste
m,
withou
t the E
XPRESS WRITTEN PERMISSIO
N of th
e cop
yrigh
t-hold
er

National Conference on Climate Change and Agricultural Production: Adapting Crops to Climate Variability and Uncertainty, 6th–8th April, 2017
[24]
of tropical areas, a strong adaptation strategy needs to be developed. In all above three cases, preparedness which is essential part of adaptation is must to deal with extreme weather events and increased uncertainties. In general higher resilience of tropical perennial fruits against climate change as compared to annuals needs to be properly harnessed through adaptation mechanisms.
Suitable and improved cultivars, alteration in cultural practices including plant architectural management, water management, micro climate modifications, soil organic carbon built-up etc offers possible adaptation strategy. Shifting tropical fruit cultivation to new areas as an option is still debatable to be considered as adaptation but seems necessary owing to extending tropics. Adaptation strategy must have imbedded some mitigation potential in long run. In this paper, attempt has been made to provide updates of climate change its impact on tropical fruits and potential adaptation strategies.
Tackling Climate Change: A Breeder’s Perspective
P.K. Singh* and R.S. Singh Department of Plant Breeding and Genetics, Bihar Agricultural University,
Sabour, Bhaglpur–813210 E-mail: *[email protected]
The threat of climate change is well evident by the fact of increasing temperature and more frequent severe drought and floods in recent times, and higher incidence of insects-pest and diseases impacting agriculture and food production. This situation has aggravated the scarcity of food and hunger around the world. To mitigate the ill effects of climate change, developing climate resilient varieties for heat, cold, drought and flood stresses is one of the options, where breeders can play major role. Several Institutions in the world are engaged in developing viable strategies. This will require a much better understanding of our genetic resources, the underlying mechanism of gene interactions and pyramiding multi-stress related genes for developing new variety or improving the already cultivated variety. The most suited approaches should involve conventional breeding as well as new emerging technologies like doubled haploidy, marker-assisted selection, high throughput phenotyping and bioinformatics to hasten the crop improvement. For breeders, ample opportunity lies in developing climate resilient high-yielding varieties, resistant/tolerant to biotic and abiotic stresses that help increasing food production and productivity, thus ease the cultivation under climate change regime. In this direction, several international institutes have initiated work on developing climate resilient crops, for example, the International Rice Research Institute (IRRI) has released 44 varieties of rice that are resilient to the effects of climate change and work is underway on a tripartite rice variation to cope with stresses like droughts, floods and saltiness. Even, the International Crops Research Institute for the Semi-Arid Tropics (ICRISAT) identified 40 germplasm lines of chickpea with resistance to extreme weather conditions such as drought, high temperature and salinity. In India, various ICAR institutes and state agricultural universities, under National Innovations on Climate Resilient Agriculture (NICRA) programme, made the concerted efforts to develop different high yielding cultivars with enhanced tolerance to heat, drought, flooding, chilling and salinity stresses for different agro-climatic zones. Thus, effect of climate change can be withstand to a greater extent with a suitable genetic blue print in our cultivars and that need more focussed research and development from breeder’s side.
Keywords: Climate Change, Plant Breeding, Genetic Resources, Climate Resilient Varieties
It is I
LLEGAL t
o cop
y, pri
nt or
save
any c
onten
t of th
is PDF,
in pa
rt or in
full,
on an
y retr
ieval
syste
m,
withou
t the E
XPRESS WRITTEN PERMISSIO
N of th
e cop
yrigh
t-hold
er

National Conference on Climate Change and Agricultural Production: Adapting Crops to Climate Variability and Uncertainty, 6th–8th April, 2017
[25]
Ecological Balancing through Natural Resource Management
A.K. Dhawan, S.K. Chauhan, S.K. Bal and S.S. Walia Indian Ecological Society, Punjab Agricultural University, Ludhiana 141 004, India
E-mail: [email protected]
Keywords: Ecology, Livelihood, NRM, Sustainability, Water Scarcity
Natural Resources Management (NRM) should contribute to poverty alleviation, and that natural resources should be used in a sustainable manner to enhance human welfare. Good natural resource management also expands income and employment opportunities throughout the wider community—for instance, through eco/agrotourism or through agro-forestry production that attracts downstream processing industries. The growing human population and its increasing use and misuse of resources is exerting enormous pressure on the “Earth’s Life Support Capacity”. We have been interfering with nature since the dawn of civilization. Extreme weather events are part of a new pattern of more extreme weather across the globe, shaped in part by human-induced climate change which cause a great damage to standing crops even though these occur for a very short duration. As the climate has warmed, some types of extreme weather have become more frequent and severe in recent decades, with increases in extreme heat, severe storms, intense precipitation, drought and hailstorm. Heat waves are longer and hotter. It is likely that human influence has more than doubled the probability of occurrence of heat waves in some locations. Food crops are highly sensitive to heat. Extreme heat exposure will undoubtedly lead to crop losses in India. Heavy rains and flooding are more frequent. In the name of progress, land has been denuded, water resources poisoned with hazardous chemicals and air polluted with noxious gases resulting in changing ecology. However, the nature retaliates and gives warning signals in the form of drought, floods, changing temperature, earth quake, diseases, etc. The global warming has put the survival of man in danger and pollution has made the air, water and food unfit for human consumption. Protection of land resources and environment is an important agenda for the man today, lest it might become too late. However, with overexploitation of ground water resources, water scarcity is one of the major challenges, threatening livelihoods of people and environment. Unfavourable climatic factors such as erratic rainfall, higher evaporative demand, and several droughts, among others, contribute to the increasing water scarcity. Therefore, our concerns for future trends and scenarios should centre on enhanced water productivity, sustainability of irrigated ecosystems, livelihood. Investment in tree plantations always remained relatively low in India, inspite of the fact that the existing forests cannot continue to meet our wood requirements and tree farming is ecologically as well as economically more viable than traditional agriculture. However, realizing the existing problem, the expenditure on afforestation has been increased enormously from fifth five year plan onwards but still the results on the land are not encouraging and we have not been able to increase forest cover as well as the productivity. The misery caused to the entire nation due to this unprecedented eco-degradation is enormous and warrants immediate remedial measures. To counteract this impending crisis, use of fast growing tree species managed with intensive cultural operations especially in tree farming have opened new vistas in wood biomass production. The short rotation forestry has attained a success and many private concerns have initiated plantation activities. Populus deltoides, Eucalyptus tereticornis, Acacia mangium, Ceiba pentendra, Gmelina arborea, Leucaena leucocephala, etc. have been exploited by the private companies in the country because of their fast growth. Private companies have been offering spectacular returns through investment in teak plantation programme. With the view to improve the productivity and profitability of plantations and making farm forestry an attractive landuse option, focus on genetic improvement of planting stock and improvement of practices in silviculture are required. Major gain in plantation productivity can be achieved within a short span through
It is I
LLEGAL t
o cop
y, pri
nt or
save
any c
onten
t of th
is PDF,
in pa
rt or in
full,
on an
y retr
ieval
syste
m,
withou
t the E
XPRESS WRITTEN PERMISSIO
N of th
e cop
yrigh
t-hold
er
National Conference on Climate Change and Agricultural Production: Adapting Crops to Climate Variability and Uncertainty, 6th–8th April, 2017
[26]
the application of vegetative and cloning techniques for gainful exploitation of the existing useful variations. The Indian agriculture will experience lots of ups and downs in the coming years due to natural resource depletion and changing climate events. Farming has to be better adapted to cope with the direct and indirect consequences of these biotic and abiotic stresses. Working Group on Natural Resource Management and Rainfed Farming has strongly emphasized that sustainable and inclusive growth is not possible unless the processes contributing to resource degradation and vulnerability of rainfed agriculture and production systems are squarely addressed and reversed. This however, holds good in other ecosystems as well.
Eco-friendly Strategies of Managing Foliar Disease in Apple for Sustaining Apple Production
Hilal A. Bhat1*, Sajad Hassan Wani3, Rayees A. Ahanger1, Mumtaz A. Ganie2, Aarif H. Bhat1 and J.I. Mir3
1Division of Plant Pathology, SKUAST-K, Shalimar, Srinagar, J&K–190025, India 2Division of Soil Science, ICAR-CITH, Rangreth Srinagar, J&K–191132, India
3Division of Biotechnology, ICAR-CITH, Rangreth Srinagar, J&K–191132, India E-mail: *[email protected]
Apple scab (Venturia inaequalis (Cke.) Wint.,) can affect 100% of the yield if no control measures are applied, especially in temperate regions which have cool and wet weather in spring. Generally the apple growing sector is of the most intensive users of synthetic fungicides per hectare for the management of apple scab. Inappropriate and increased use of fungicides has resulted in fungal resistance and ecological imbalance (Pramilia and Dubry, 2004). Furthermore, all commercially important cultivars are still reputed to be susceptible to varying extents. Resistance in some commercial genotypes and wild Malus species can be broken by the development of new scab races as a result of repeated use of systemic fungicides (Genet.; 2016). In order to reduce the dependence on synthetic fungicides there are alternative eco-friendly management strategies, and among those use of plant based extract and molecules is one. The present study investigated the biological potency of crude extracts as well as isolated and characterized compounds against apple scab. All the crude extracts were found potent in limiting the mycelia growth and the effect were found to be dose dependent, furthermore the bioassay guided fractionation of the crude extracts resulted in isolation of pure compound that was characterized by using physical as well as spectroscopic techniques. The pure compound was evaluated against apple scab at different concentration in order to evaluate its efficacy against apple scab. All the tested concentrations were found effective and the inhibition were found dose dependent. Furthermore, the test compound @ 5000 ppm proved significantly most effective by providing (82.49%) inhibition in the mycelia growth of apple scab. Quantitative analysis of the compound was carried out by using RP-HPLC. The HPLC showed an excellent performance in separating the irigenin in different species of Iris plant. From this study it is clear that irigenin is potent compound which can be used for controlling the growth of respective pathogen.
REFERENCES [1] Genet, J., Luc, G. J. and Francine D. 2006. Effect of dose rate and mixtures of fungicides on selection for QoI resistance in populations of
Plasmopara viticola. Pest management science 62(2): 188-194. [2] Pramila, T. and Dubey, N.K. 2004. Exploitation of natural products as an alternative strategy to control postharvest fungal rotting of fruit
and vegetables. Postharvest Biology and Technology 32(3): 235-245.
It is I
LLEGAL t
o cop
y, pri
nt or
save
any c
onten
t of th
is PDF,
in pa
rt or in
full,
on an
y retr
ieval
syste
m,
withou
t the E
XPRESS WRITTEN PERMISSIO
N of th
e cop
yrigh
t-hold
er

National Conference on Climate Change and Agricultural Production: Adapting Crops to Climate Variability and Uncertainty, 6th–8th April, 2017
[27]
Impact Assessment of Biopriming Mediated Nutrient Use Efficiency for Climate Resilient Agriculture
Amitava Rakshit Department of Soil Science and Agricultural Chemistry, Institute of Agricultural Science,
Banaras Hindu University–221005, U.P., India E-mail: [email protected]
Since environmental stress negatively affects crop growth and productivity throughout the world and the energy crisis threatens the sustainability of both irrigated and rainfed system, it is becoming increasingly evident that priming techniques can enhance and improve the performance of crops without deteriorating the natural resource base. Among the available options, on-farm seed priming is a simple, proven technology that has been an age old practice, tested, and refined in laboratories, in experimental plots, and by farmers themselves in their fields. It's easy to use with a wide range of crops in many different farming conditions. Farmers in the indo-gangetic plains of Utta Pradesh, India prime rice, wheat, maize and pulse seed before sowing. This simple method is now spreading to other parts of the country as well. Although priming with water or tiny amounts of phosphorus, boron and zinc is common but use of microbes can make a huge difference. Biopriming is becoming a potentially prominent technique to induce profound changes in plant characteristics and to encourage desired attributes in plants growth associated with fungi and bacteria coatings. Biological factors such as fungi and bacteria are used in biopriming which includes: fungi and antagonist bacteria and the most important of all are Trichoderma, Pesodomonas, Glomus, Bacillus, Agrobacterium and Gliocladium. Therefore, seed priming in combination with low dosage of biocontrol agents has been used to improve the plant performance, stabilize the efficacy of biological agentsin the present set up of agriculture and reducing dependency on chemical inputs.
Land Economics vs. Land Use Planning
B.B. Mishra Professor, School of Natural Resource Management & Environmental Sciences,
Haramaya University, Ethiopia E-mail: [email protected]
Today’s lifestyle and high-tech economic race above the ground is challenging to the global sustainability. We need air, water, food and ecosystem for our existence and survival and so we need technologically sound land use planning (LUP) in its broad spectrum in order to insure overall sustainability of the land units and assured profitability of the land uses that we identify at planning stage in a given land unit. The land use or land produce is subject to insure profitability. Thus, the concept of land economics is very relevant to make our land use profitable by applying economic principles within the control of farmers. Importantly, adoption of conservation agriculture based on land evaluation will significantly help in building up not only a healthy soil and producing quality food, but also for sequestering carbon in soil significantly preferably on continued basis. The agri-business techniques including the supply chain process will simultaneously help to alleviate
It is I
LLEGAL t
o cop
y, pri
nt or
save
any c
onten
t of th
is PDF,
in pa
rt or in
full,
on an
y retr
ieval
syste
m,
withou
t the E
XPRESS WRITTEN PERMISSIO
N of th
e cop
yrigh
t-hold
er

National Conference on Climate Change and Agricultural Production: Adapting Crops to Climate Variability and Uncertainty, 6th–8th April, 2017
[28]
the poverty in a big way. Thus, land economics must be included in course curriculum in Universities across the globe to insure overall sustainability of our land/ soil. The Food and Agriculture Organization of UNO may preferably work exhaustively on this line to approve the criteria of how best land economics would be the driving force to streamline the approaches under LUP leading to poverty alleviation, continued carbon sequestration, organic farming and quality food production by restoring the overall soil health. Land economics may be a powerful tool for climate change adaptation-mitigation including poverty alleviation in India.
Keywords: Land Economics, Land Use Planning, Conservation Agriculture, Food Safety, Climate Change Mitigation, Poverty Alleviation
Nanotechnology in the Arena of Changing Climate
Nintu Mandal1*, Rajiv Rakshit1, Samar Chandra Datta2 and Ajoy Kumar Singh3
1Department of Soil Science and Agricultural Chemistry, Bihar Agricultural University, Sabour, Bhagalpur
2Emeritus Scientist, Division of Soil Science and Agricultural Chemistry, Indian Agricultural Research Institute, New Delhi–110012
3Vice-Chancellor, Bihar Agricultural University, Sabour, Bhagalpur E-mail: *[email protected]
Climatic aberrations are increasing day by day causing adverse impact on essential ecosystem functions. Spatial and temporal shifting of amount and frequency of rainfall is affecting agricultural operations in a massive way. Climatic extremities (Heat wave, cold wave etc ) are affecting agricultural production system in a bigger way.
Surface temperature is projected to rise over the 21st century under all assessed emission Scenarios. It is very likely that heat waves will occur more often and last longer, and that extreme precipitation events will become more intense and frequent in many regions. The ocean will continue to warm and acidify, and global mean sea level to rise. There are multiple mitigation pathways that are likely to limit warming to below 2°C relative to pre-industrial levels. These pathways would require substantial emissions reductions over the next few decades and near zero emissions of CO2 and other long-lived greenhouse gases by the end of the century. Implementing such reductions poses substantial technological, economic, social and institutional challenges, which increase with delays in additional mitigation and if key technologies are not available. Limiting warming to lower or higher levels involves similar challenges but on different timescales.
Technolological interventions in the changing climatic conditions seem to be imperative in formulating adaptation and mitigation strategies. Nanoscience is the study of matter at atomic or nano (1 nm=10-9 m) scale. Nanotechnology deals with fabrication of materials at nanoscale. Nanomaterials are materials having at least one dimension in 1–100 nm scale as per USEPA (United State Environment Protection Agency). Nanotechnological interventions in increasing input use efficiency, effective pest control and draught management in agriculture are of utmost importance in present day agriculture and in future also.
It is I
LLEGAL t
o cop
y, pri
nt or
save
any c
onten
t of th
is PDF,
in pa
rt or in
full,
on an
y retr
ieval
syste
m,
withou
t the E
XPRESS WRITTEN PERMISSIO
N of th
e cop
yrigh
t-hold
er

National Conference on Climate Change and Agricultural Production: Adapting Crops to Climate Variability and Uncertainty, 6th–8th April, 2017
[1]
THEME 1 Climatic Uncertainties, Impact and Adaptation in Agriculture
Climatic Uncertainties and its Impact on Agriculture
Crop Adaptation and Management Interventions for Climate Resilient Agriculture
It is I
LLEGAL t
o cop
y, pri
nt or
save
any c
onten
t of th
is PDF,
in pa
rt or in
full,
on an
y retr
ieval
syste
m,
withou
t the E
XPRESS WRITTEN PERMISSIO
N of th
e cop
yrigh
t-hold
er

It is I
LLEGAL t
o cop
y, pri
nt or
save
any c
onten
t of th
is PDF,
in pa
rt or in
full,
on an
y retr
ieval
syste
m,
withou
t the E
XPRESS WRITTEN PERMISSIO
N of th
e cop
yrigh
t-hold
er

National Conference on Climate Change and Agricultural Production: Adapting Crops to Climate Variability and Uncertainty, 6th–8th April, 2017
[31]
Differential Yield Response of Crops Due to Climatic Change and Variability in Coffee-Cardamom Hot Spots, India
Murugan M.1*, Anandhi A.2, Solai M.A.3, Ravi R.4, Rajangam R.5, Ramesh R.6, Gowda, S.J.A.3, Dhanya M.K.1 and Shajan K.7
1Cardamom Research Station, Kerala Agricultural University, Pampadumpara–685553, India 2College of Agriculture and Food Sciences, Florida State A&M University, Tallahassee, FL 32307, USA
3Cardamom Research Centre, ICAR-IISR, Appangala–571201, India 4Division of Materials Engineering, Indian Institute of Science, Bangalore–560012, India
5Horticultural Research Station, Tamil Nadu Agricultural University, Kodaikkanal–624103, India 6Physical Research Laboratory, Navrangpura, Ahmadabad–380009, India
7Kerala Agricultural University, Vellanikkara, Thrissur–680556, India E-mail: *[email protected]
Keywords: Tropical Mountains, Spices, Plantation Agriculture
INTRODUCTION
Agriculture across the world is under stress leading to diminishing returns and productivity. The world’s coffee-cardamom sector provides employment and livelihood for over 60 million people. India is the sixth and second largest coffee and cardamom producing country in the world accounting over 4 and 40% of the world’s production correspondingly. More than 92% of the Indian coffee and the entire cardamom production come from three states namely Karnataka, Kerala and Tamil Nadu. Kerala is the leading producer of small cardamom in the country followed by Karnataka and Tamil Nadu. Major share of coffee and cardamom production in India originates from small to medium farms which are more vulnerable to climatic change and variability (Murugan et al., 2012 and Murugan et al., 2012). Cardamom and coffee like elevation induced forest ecosystem, and cardamom being more closely related to rain forest environment than coffee, which require cooler subtropical climate. Hence these crops are predominantly cultivated in the high ranges and high uplands of the southern Indian Western Ghats. Except the upper Pulneys (Kodaikkanal), where many temperate fruit and vegetable crops are dominating the other places of the hot spots are farmed with high value spices and plantation crops. Present and future climatic change present unprecedented challenges to coffee-cardamom cultivations by influencing crop distribution and production and by increasing the economic and environmental risks associated with the production systems.
MATERIALS AND METHODS
Long term climate data from four representative climate stations located in three south Indian states along with productivity data of select crops were subjected for statistical analysis using Mann-Kendall test. Significant trends were identified at annual, seasonal and monthly scale using two tailed Z-Test. Future rainfall variability and patterns for all three montane hot-spots were studied. Future climate is uncertain and unknown. Global Climate Models (GCMs) are among the most advanced tools, which simulate climatic conditions on earth hundreds of years into the future. The scenarios are often used in investigating the potential consequences of anthropogenic climate change and natural climate variability. A scenario is a coherent, internally consistent and plausible description of a possible future state of the world. The fifth phase of the Climate Model Intercomparison Project (CMIP5), a freely available state-of-the-art multi-model dataset (multiple GCMs and RCPs), was designed to advance our knowledge of climate variability and climate change. The methodology was explained by empirically exploring the climate changes in the up to the year 2099 using monthly simulations from 35 GCMs
It is I
LLEGAL t
o cop
y, pri
nt or
save
any c
onten
t of th
is PDF,
in pa
rt or in
full,
on an
y retr
ieval
syste
m,
withou
t the E
XPRESS WRITTEN PERMISSIO
N of th
e cop
yrigh
t-hold
er
National Conference on Climate Change and Agricultural Production: Adapting Crops to Climate Variability and Uncertainty, 6th–8th April, 2017
[32]
participating in CMIP5 for two future emission scenarios (RCP4.5 and RCP8.5). They provide a wide range of potential climate change outcomes which then can be re-sampled from observed data. The results could be later used to access both mitigation and adaptation alternatives to reduce vulnerabilities in managed ecosystems (agriculture and urban systems) and water resources.In this paper we tried to explain and explore how current climate change and variability had impacted the yields of select crops grown in these delicate mountain ecosystems by statistical analysis and comparison. Regression models were used to explain the crop yields’ variability using growing season climate data.
RESULTS AND DISCUSSION
The observed variability in precipitation levels on seasonal and monthly scales was the greatest for lower and upper Pulneys (Tamil Nadu) followed by cardamom hills (Kerala) and Kodagu hills (Karnataka). Productivity of crops was highly variable with hot-spots. Coffee yields have decreased significantly over time in Pulney hills while considerable increase was observed for the other two hot-spots. Even forty per cent decrease in annual total rainfall did not affect the yields of coffee in cardamom hills, but reduced cardamom yield to nearly 50%. Increasing atmospheric air temperatures coupled with high variability in precipitation amounts could further stress groundwater reservoirs, leading to withdrawal rates that become even more unsustainable for the mountainous regions. High precipitation variability (with higher propensity for localized intense rainfall events) observed in the region can be a key factor for these ecosystems and water management. Our results showed a high variability in the future change in precipitation and temperature in all three hot spots. The observed atmospheric air temperature in the regions consistently increased causing significant challenges in water management of these sensitive crops. In future, the results could be used to access both mitigation and adaptation alternatives to reduce vulnerabilities in managed ecosystems (Mountain agriculture and Hill- urban systems) and water resources.
REFERENCES [1] Murugan M, Shetty PK, Anandhi A and Ravi R 2012. Present and Future Climate Change in Indian Cardamom Hills: Implications for
Cardamom Production and Sustainability. British Journal of Environment & Climate Change 2 (4): 368-390. [2] Murugan M, Shetty P K, Ravi R, Anandhi A and Rajkumar A J 2012.Climate change and crop yields in the Indian cardamom hills,
1978-2007 CE.Climatic Change 110 (3):737-753.
Influence of Environmental Temperature on Biomass Production Rate, Sporulation and Sporocarp Germination in Azolla
Arun Kumar Jha Department of Soil Science & Agricultural Chemistry,
Bihar Agricultural College, Sabour, Bhagalpur–813210, India E-mail: [email protected]
Keywords: Environmental Temperature, Azolla, Biomass Production Rate, Sporulation
INTRODUCTION
Azolla is a small aquatic fern harbouring symbiotic association with nitrogen fixing diazotrophic cyanobacteria. It has multifaceted use due to fast multiplication rate, high nutritional value, easy mineralization and phytoremediatin potential of its biomass. The optimum temperature range for higher biomass production and sporocarp germination of Azolla is ranging from 20ºC to 32ºC (Yadav, et al., 2014). Slight variation in climatic components from the optimum range retarded biomass production very drastically in China (Li et al., 1982). In the view of above facts, efforts have been made in present investigation to study the effect of environmental temperature on biomass production rate, sporulation and sporocarp germination of various species/collections of Azolla under zone III A conditions for selecting the best one for its use in agriculture.
It is I
LLEGAL t
o cop
y, pri
nt or
save
any c
onten
t of th
is PDF,
in pa
rt or in
full,
on an
y retr
ieval
syste
m,
withou
t the E
XPRESS WRITTEN PERMISSIO
N of th
e cop
yrigh
t-hold
er

National Conference on Climate Change and Agricultural Production: Adapting Crops to Climate Variability and Uncertainty, 6th–8th April, 2017
[33]
MATERIALS AND METHODS
Six species (caroliniana, filiculoides, maxicana, microphylla, pinnata and rubra) and three collections (BAUAS –1, BAUAS – 2 and BAUAS-3) of Azolla were grown in 2.4 m X 1.5 m sized pits under open field conditions of Bihar Agricultural University, Sabour, Bhagalpur, for selecting the best Azolla species/collections based on their biomass production rate in peaks of winter and summer during 2011 and 2012. The experiment was conducted in randomized block design with nine treatments and three replications. Each of nine Azolla species/collections, discussed above was considered as a treatment. Biomass of Azolla was introduced in pits as inoculums @ 0.5 Kg/m2 on the first day of test months and harvested on last day of the same month. Weight of the harvested fresh biomass of Azolla was recorded in gram and with the help of calculation; biomass production rate was expressed in term of g Kg-1 day-1. Pot experiment was conducted in completely randomized Block Design with thirteen treatments and three replications during the years 2014–15 and 2015–16 to study the effect of environmental temperature and technique of sporocarp storage on germination of sporocarp and its conversion to Azolla plants. Treatments comprised of techniques of sporocarp storage (sun drying of sporocarp, sun drying of sporocarp bearing biomass and mixing of sporocarp bearing biomass with soil in the ratio of 1:15), temperature/conditions of sporocarp storage (at 25ºC in incubator, at 15±3ºC inrefrigerator and at ambient temperature under room conditions) and species of Azolla (A. microphylla and A. pinnata). On the first day of test months, sporocarps were seeded in above soil standing water of the pots and observations were recorded on last day of the same month.
RESULTS AND DISCUSSION
Environmental temperature was found to be the most important factor governing biomass production rate of Azolla in aquatic environment. Both, maximum and minimum temperatures during 2012 were higher than that in 2011 especially in May, June and July and as a result biomass production rate of every species of Azolla decreasedduring 2012 in comparison to that recorded in 2011. But, decrease in biomass production rate was recorded to be the minimum in A.microphylla. Due to 3.4, 3.3 and 0.1ºC increase in maximum temperature and 1.3, 3.3 and 0.1ºC increase in minimum temperature during May, June and July, 2012 compared to that during the year 2011, biomass production rate of, A. microphylla decreased by 6.8, 13.0% and 0.72 percent in respective months of the year 2012. A. pinnata was found to be the most sensitive against high temperature and struggled for its existence during test period of both the years. Though, it is difficult to rate Azolla species based on their high temperature tolerance, but on the basis of detailed and intensive investigation of data, it can be concluded that high temperature tolerance in Azolla species is in order to A. microphylla>A. maxicana>A. caroliniana>A. filiculoides>A. rubra>A. pinnata. This order changed regarding cold tolerance of Azolla species. Maximum and minimum temperature in December, 2011 were 21.2ºC and 10.1ºC respectively, however, these values were 21.0ºC and 8.6ºC in December, 2012. Due to 0.2ºC decrease in maximum temperature and 1.5ºC in minimum temperature biomass production rate of A.caroliniana, A.filiculoides, A.maxicana, A.microphylla, and A.rubra increased by 1.38, 5.82, 5.32, 4.98 and 5.08 percent respectively during December, 2012 compared to those recorded during December, 2011. Increase in the growth rate was probably due 1.35 higher humidity at 7.00AM and 8.4% lesser humidity at 1400 hours. On the basis data on percentage increase in biomass production rate, it can be concluded that low temperature tolerance in Azolla species is in order to A. filiculoides>A. maxicana> A. rubra>A. microphylla>A. caroliniana>A. pinnata. Sporoluation and sporocarp germination was found to be affected adversely by the rise in atmospheric temperature. Both, A. microphylla and A. pinnata sporulated during the year 2015; however, A. pinnata refused to sporulate during 2016. It was probably due to higher sensitivity of A.pinnata against high temperature during the period of sporocarp formation. The maximum temperature in the month of December, January, and February during the year 2015-16 were respectively 2ºC, 1.8ºC and 3.2ºC higher than those during the respective months of the year 2014-15. Increase in maximum atmospheric temperature during 2016 reduced the number of sporocarp and delayed the process of sporocarp formation even in the species A. microphylla. Sporocarps of A. microphylla matured in the month of February during the year 2015, however, month of sporocarp maturity by one month during the year 2016 and matured in March, 2016. Sporocarp germination and conversion of germinated
It is I
LLEGAL t
o cop
y, pri
nt or
save
any c
onten
t of th
is PDF,
in pa
rt or in
full,
on an
y retr
ieval
syste
m,
withou
t the E
XPRESS WRITTEN PERMISSIO
N of th
e cop
yrigh
t-hold
er

National Conference on Climate Change and Agricultural Production: Adapting Crops to Climate Variability and Uncertainty, 6th–8th April, 2017
[34]
sporocarps into Azolla plants also decreased during the year 2016. Beside rise in atmospheric temperature, technique and period of sporocarp storage were answerable for this poor germination and conversion of sporocarps into plants. Storage technique, mixing of sporocarp biomass of Azolla in fertile soil in the ratio of 1:15 and storage at 15±3ºC temperature under refrigerated conditions was found to be the best treatment for sporocarp germination and conversion of germinated sporocarps into Azolla plants. 36.2 and 30.4 percent freshly collected sporocarps of A.microphylla converted into Azolla plants and germinated but not converted into plants respectively during the year 2015; however, only 32 percent of freshly collected and seeded sporocarps could convert into Azolla plants during the year 2016. Even after one month of sporocarp storage, percentage of sporocarp converted into Azolla plants and sporocarp germinated but not converted into Azolla plants were 28.2 and 27.1 percent respectively during the year 2015, whereas one month old sporocarps did not convert into Azolla plants during the year 2016. It was probably due to 1.8ºC and 6.1ºC increase in maximum temperature in the months of March and April, 2016 compared to that recorded in the respective months of the year 2015. Maximum atmospheric temperature in April, 2016 (month of first seeding in 2016) was 80C higher than that in March, 2015 (month of first seeding in 2015). On the basis of experimental findings, it can be concluded that Azolla is very sensitive against temperature variation. Degree of heat and cold tolerance in various Azolla species is varying very greatly. A. microphylla and A. filliculoides were identified as the highest hot and cold tolerant species for agro-climatic zone III A of Bihar. Propagation of Azolla through sexual propagation technique has only little scope in agro-climatic zone III A due to decrease in viability of the sporocarp with increase in the period of its storage and higher temperature of the zone during the time of its seeding.
REFERENCES [1] Li Z.X., Zhu S.X., Mao M.F. and Lumkin T.A. 1982. Study on the utilization of 8 Azolla species in agriculture. Zhungguo, Nongue
Kexur 1: 19-27. [2] Yadav R K, Abraham G, Singh Y V and Singh P K 2014.Advances in the utilization of Azolla-Anabaena system in relation to sustainable
agricultural practices.Proceedings of the Indian Natitional Science Academy 80 (2): 301-316.
Effect of Crop Growing Environment on Phenology, Heat-unit Requirement and Yield of Wheat (Tritucum avestivum) Genotypes
I.B. Pandey1* and Manish Kumar2 1,2Department of Agronomy, Tirhut College of Agriculture,
Dr. Rajendra Prasad Central Agricultural University, Pusa, Samastipur–848125, Bihar E-mail: *[email protected]
Keywords: Growing degree days, Phenophase, Wheat genotypes, Heat-use efficiency.
INTRODUCTION
Duration of phenophases in wheat (Triticum avestivum) shows a wide range of diversity, depending on the genotype and environment and has significant effect on seed yield. Changes in ambient temperature during both vegetative and reproductive phase affect the onset and duration of phenological stages and hence the yield of crop. The effect of temperature on plant growth and phenological development can be inferred by way of accumulated heat units system which is based on idea that plants have difinit temperature requirement before they attain certain phenological stage. In north Indian condition, the maturity of wheat is hastened due to gradual rise in ambient temperature under delayed sowing. Hence, it becomes imprative to have knowledge of exact duration of phenological stages in a particular crop growing environment and their impact on yield of crop. Hence, an experiment was conducted to determine the phenology and heat-unit requirnment of promising wheat genotypes under different crop growing envrionment of Bihar.
It is I
LLEGAL t
o cop
y, pri
nt or
save
any c
onten
t of th
is PDF,
in pa
rt or in
full,
on an
y retr
ieval
syste
m,
withou
t the E
XPRESS WRITTEN PERMISSIO
N of th
e cop
yrigh
t-hold
er

National Conference on Climate Change and Agricultural Production: Adapting Crops to Climate Variability and Uncertainty, 6th–8th April, 2017
[35]
MATERIALS AND METHODS
A field experiment was conducted during the rabi season of 2012-13 to 2014-15 at research farm of Rajendra Agricultural University, Pusa, Samastiur (25º98' N 85º76' E and an attitude of 51.3 MSL). The soil was clay loam in texture having pH 8.1. The treatment comprised five planting dates viz, 15 November, 25 November, 5 December, 15 December and 25 December and three wheat genotypes, viz, RW 3711, HD 2842 and HD 2733. The experiment was laid out in randomised block design with 3 replications. Growing degree days (GDD) was computed by simple arithmetic accumulation of daily mean temperature above the base temperature value 5ºC. The accumulated GDD for each phenophases were obtained by:
RESULT AND DISCUSSION
Table 1: Effect of Crop Growing Environment on Phenophases, Heat-unit Requirement and Yield of Prominent Wheat Genotypes (Pooled Mean of Three Years)
Treatment Milk Stage Dough Stage Maturity Grain Yield Heat-Use Efficiency (g/m2/ Degree Days) DAS GDD DAS GDD DAS GDD
Date of Sowing 15 November 95.6 1151.6 127.4 1659.6 136.6 1863.7 39.87 0.21 25 November 93.0 1094.8 119.8 1579.2 130.6 1751.6 42.57 0.25 5 December 89.0 1048.4 112.2 1505.7 123.1 1683.5 40.69 0.25 15 December 86.0 979.3 106.0 1398.5 115.5 1594.3 34.07 0.22 25 December 82.7 986.5 100.0 1359.4 107.9 1493.3 29.93 0.20 CD (P=0.05) 2.6 24.7 1.8 28.1 2.1 29.3 2.58 -
Genotypes RW 3711 87.9 1040.6 112.0 1489.5 122.0 1666.9 35.43 0.21 HD 2824 90.1 1070.1 113.2 1529.6 123.0 1695.3 38.30 0.23 HD 2733 89.8 1062.3 114.0 1505.6 123.5 1719.1 38.60 0.23 CD (P=0.05) 2.0 20.6 1.3 22.7 NS 22.9 1.98 - DAS–Days after sowing. GDD–Accumulated growing degree–days.
The phenological stages in terms of calendar days and growing–degree days for different phenological stages decreased with delay in sowing time. The crop sown on 15 November took maximum calendar days and growing degree days for milk stage, dough stage and maturity which got reduced with subsequent delay in sowing time and recorded lowest value on 25 December sown crop. However, the highest heat–use efficiency and grain yield were obtained when sowing was done on 25 November, both heat–use efficiency and grain yield decreased significantly in earlier sown crop on 15 November as well as later sown crop on 15 and 25 December. The reduction in grain yield was recorded to the tune of 6.34% in earlier sown crop on 5 November and 4.42, 19.97 and 29.69% when sowing was delayed on 5 December, 15 December and
Accumulated GDD= ∑ [T maximum + T minimum/2] – Tb
Where,
Tmax, daily maximum temperature (0C) Tmin, daily minimum temperature (0C) Tb, base temperatue (0C) I, start of phenophase N, end of phenophase Heat – Use Efficiency as :
Dry matter accumulation (g/m2) HUE =
Accumulated GDD (degree-days)
I
N
It is I
LLEGAL t
o cop
y, pri
nt or
save
any c
onten
t of th
is PDF,
in pa
rt or in
full,
on an
y retr
ieval
syste
m,
withou
t the E
XPRESS WRITTEN PERMISSIO
N of th
e cop
yrigh
t-hold
er

National Conference on Climate Change and Agricultural Production: Adapting Crops to Climate Variability and Uncertainty, 6th–8th April, 2017
[36]
25 December respectively as compared to 25 November sown crop. Among the genotypes, RW 3711 took minimum calendar days and also accumulated lower heat unit for these phenophases. HD 2824 and HD 2733 took similar calendar days and also accumulated similar heat unit for these phenophases except maturity. Wheat genotypes, HD 2824 and HD 2733 also recorded higher heat-use efficiency and produced significantly more grain yield than RW 3711.
Exogenous-Applied Salicylic Acid Alleviates Adverse Effects of High Temperature on Photosynthesis in Late Sown Wheat
(Triticum aestivum) During Reproductive Stage Through Changes in Antioxidant Defense
Shailesh Kumar1*, V.P. Singh2, Ajay Arora2 and Sweta Mishra3 1Dr. Rajendra Prasad Central Agricultural University, Pusa–848115, Samastipur, India
2Indian Agricultural Research Institute, New Delhi–110012 3Sardar Krushinagar Dantiwada Agricultural University, S.K. Nagar, Banaskantha–385506, India
E-mail: [email protected]
Keywords: Wheat, Photosynthesis, Enzyme, Salicylic acid, SPAD
INTRODUCTION
Wheat is one of the most important staple food crops of the world including India in terms of the harvested area, human nutrition and grown primarily for its grain. The excess active oxygen species (AOS) generated during high temperature stress leads to oxidative stress in plant system (Hasanuzzaman et al., 2012). Yield reduction in wheat under high temperature (HT) stress is caused by hastened phasic development, decrease in photosynthesis, fast senescence. Based on background knowledge and prior scientific facts, it is apparent that the effects of salicylic acid (SA) were studied only at seedling stage and controlled conditions (short duration of heat stress) in wheat. However, outcome of exogenous SA depends on various factors for instance the species and developmental stage of the plant, the mode of application, and the concentration of SA and its endogenous level in the specified plant. On the other hand, late sown wheat crop encounters prolonged heat stress throughout reproductive phase. Therefore, this study was accomplished to elucidate the role of SA in imparting thermal tolerance to wheat crop during reproductive stage.
MATERIALS AND METHODS
A pot culture experiment was conducted in completely randomized design (CRD) with three replications using four wheat varieties four wheat genotypes in the study, viz., HD3086, HD2985, HD3043, and HD3076.The experiments were performed at pot culture facility of Division of Plant Physiology, IARI, in the year of 2013-14 and 2014-15. The staggered sowing strategy was used for terminal heat stress treatment. When anthesis started, foliar application of salicylic acid (SA) (0.1mM) was done. Flag leaves were collected from control and SA treated wheat genotypes at 2 days and ten days after foliar spray (DAFS) of SA for biochemical estimations. Physiological parameters were also measured in flag leaf at 2 DAFS and 10 DAFS of SA in all samples. Membrane stability index (MSI) was estimated according to the procedure illustrated by Premachandra et al. (1990). Soil and plant analyser development (SPAD) values were determined in the centre of flag leaves by means of portable Minolta SPAD-502 chlorophyll meter (Minolta camera Co. Ltd., Osaka, Japan). Photosynthesis (Pn) was estimated by means of Infrared Gas Analyser (IRGA), LI-6400XT
It is I
LLEGAL t
o cop
y, pri
nt or
save
any c
onten
t of th
is PDF,
in pa
rt or in
full,
on an
y retr
ieval
syste
m,
withou
t the E
XPRESS WRITTEN PERMISSIO
N of th
e cop
yrigh
t-hold
er

National Conference on Climate Change and Agricultural Production: Adapting Crops to Climate Variability and Uncertainty, 6th–8th April, 2017
[37]
Model (Li-COR Ltd., Lincoln, Nebraska, USA). The SOD activity was estimated based on formation of blue coloured formazone, adhering to the method given by (Dhindsa et al., 1981). The CAT activity was estimated, adhering to the method given by Aebi et al., (1984). The total Ascorbate peroxidase activity was determined following the procedure described by Nakano and Asada, (1981).
RESULTS AND DISCUSSION
The photosynthesis rate (Pn) decreased significantly in all genotypes grown under late sown (high temperature stress) condition as compared to normal sown condition, with maximum decrease evinced in HD3043 (28%) followed by HD3076 (27%) and HD 3086 (27%) and minimum in HD2985 (17%). Foliar spray of SA enhanced Pn significantly in late sown condition. Foliar spray of SA maintained significantly higher SPAD value in late sown condition and maximum value recorded in HD2985 (9%) than respective control. Foliar spray of SA maintained significantly higher MSI in late sown condition. 2 DAFS of SA, the MSI enhanced significantly in the late sown crop, with maximum increase evinced equally by HD 2985 (15%) and HD3086 (15%) and minimum by HD3076 (7%). Foliar spray of SA reduced the catalase activity significantly in normal sown as well in late sown crops. Under late sown condition, 2 DAFS of SA, a significant drop in the catalase activity in all genotypes was measured with most of the decrease substantiated in HD3076 (18%) and least decrease in HD2985 (15%). Foliar spray of SA further enhanced the superoxide dismutase (SOD) and ascorbate peroxidase (APOX) activity significantly in normal sown and in late sown crops. In general antioxidant enzyme activity after foliar application of SA on reproductive stage of wheat plants enhanced the activities of SOD and APOX not only in late sown crop (high temperature stress conditions), but also improved their activities in normal sown crops in all genotypes.The results are similar with Wang et al. (2006) who have also observed in grape, that SA application (0.1mM) promptly increased SOD and peroxidase (POD) activities in grape leaves. Contrast to our finding Wang et al. (2014) have also reported that only slight enhancement of SOD activity in response of 0.3mM SA application in wheat plant under short term heat stress. The SPAD values were maintained significantly higher in treated plant compared to respective control in all genotypes. Similar to our results, Khan et al. (2013) also reported that SA application ameliorated the adverse effect of heat stress on SPAD value in wheat seedling. Findings of present study are in agreement with that of Wang et al. (2010) who reported that, SA did not significantly affect the net photosynthesis rate (Pn) of grape leaves prior to heat stress, but, SA pretreatment alleviated the reduction in Pn under heat stress, by keeping a higher Rubisco activation state and greater PSII efficiency and may also increase PSII revival. On the other hand, Khan et al. (2013) explained that SA application elevated photosynthesis even during no stress condition, and lessened the harmful outcome of heat stress in wheat. From present study, it can be concluded that the exogenous application of SA (0.1mM) positively modulated the antioxidant defense system and protected the photosynthetic apparatus from reactive oxygen species when analyzed two days after foliar application, however, the enzyme activity shown decreasing trends when analyzed ten days after foliar spray.
REFERENCES [1] Hasanuzzaman M, Nahar K, Alam M M, Roychowdhury, R and Fujita M 2013. Physiological, biochemical, and molecular mechanisms of
heat stress tolerance in plants. International Journal of Molecular Sciences14: 9643-9684. [2] Wang L J, Fan L, Loescher W, Duan W, Liu G J, Cheng J S and Li, S H 2010. Salicylic acid alleviates decreases in photosynthesis under
heat stress and accelerates recovery in grapevine leaves. BMC Plant Biology10:34-38. [3] Khan M I R, Iqbal N, Masood A, Per T S and Khan N A 2013. Salicylic acid alleviates adverse effects of heat stress on photosynthesis
through changes in proline production and ethylene formation. Plant Signal Behaviour 8: 263-74.
It is I
LLEGAL t
o cop
y, pri
nt or
save
any c
onten
t of th
is PDF,
in pa
rt or in
full,
on an
y retr
ieval
syste
m,
withou
t the E
XPRESS WRITTEN PERMISSIO
N of th
e cop
yrigh
t-hold
er

National Conference on Climate Change and Agricultural Production: Adapting Crops to Climate Variability and Uncertainty, 6th–8th April, 2017
[38]
Efficient Water Conservation Measures for Fugmented Farm Productivity in NICRA Adopted Eastern Indian Villages
F.H. Rahman* and S.K. Roy ICAR-Agricultural Technology Application Research Institute, Kolkata–700097, India
E-mail: *[email protected]
Keywords: Climate Change, Natural Resource Management, Livelihood
INTRODUCTION
Climate change is gradually becoming a serious Indian concern too as most of India’s population depend on agriculture for their livelihood. Farmers need to adapt to the changing climate in order to sustain crop yields and farm income. Enhancing resilience of agriculture to climate risk is of paramount importance for protecting livelihoods of small and marginal farmers. Traditionally, technology transfer in agriculture has aimed at enhancing farm productivity. However, in the context of climate change and variability, farmers need to adapt quickly to enhance their resilience to increasing threats of climatic variability such as droughts, floods and other extreme climatic events. Adoption of such resilient practices and technologies by farmers appears to be more a necessity than an option. Participatory on-farm demonstration of site-specific technologies will go a long way in enabling farmers cope with current climate variability. To reorient the whole gamut of technology transfer in Indian perspective, a national-wide initiative, namely, National Innovations in Climate Resilient Agriculture (NICRA) was taken up during the year 2011–12 and constant and critical reviewing of one of its modules, i.e., Technology Demonstration Component (TDC) brought out some salient effects of technology demonstration which can lead to more resilience of Indian agriculture to the climatic vagaries. In order to document the water conservation technologies to be adopted in the face of drought and evaluate their effects on farm productivity, the present study was conducted in different districts of Bihar and Jharkhand.
MATERIALS AND METHODS
The present study was carried out in 11 different KVK districts of Bihar (6) and Jharkhand (5). Every KVK selected a village and after preliminary baseline works, the agro-climatic characteristics were outlined for the purpose of future improvement of their livelihood. All areas were hot and dry. Crop production was very poor, farmers used local variety and only one crop was produced in a season in most of the villages under study. Most villages had no irrigation facility, no rainwater harvesting structure and the villagers did not adopt any moisture conservation technique or have zero tillage facilities. Major water conservation technologies were demonstrated in the selected villages for evaluating their beneficial effects on farm production and the technologies were: tank-cum-well-cum-pond, ahars, borabandh, 5% model, brown manuring, lift irrigation, Jalkund, bunding, renovation and de-silting, sprinkler system, drip irrigation, zero tillage and plastic and organic mulching. The data on various technology demonstrations in terms of crop yieldand areas covered were collected and subjected to suitable statistical analysis.
RESULTS AND DISCUSSION
The major emphases of the intervention were on augmenting rainwater availability through its efficient use by adopting site-specific rainwater harvesting strategies (RWH). Major interventions included in-situ moisture conservation; construction/ renovation of new water harvesting and recycling structures/farm ponds/checks dams/tank roof water harvesting tank, land shaping and RWH structure, conservation tillage where appropriate, artificial ground water recharge and water saving irrigation methods, green manuring, 5% model of irrigation;
It is I
LLEGAL t
o cop
y, pri
nt or
save
any c
onten
t of th
is PDF,
in pa
rt or in
full,
on an
y retr
ieval
syste
m,
withou
t the E
XPRESS WRITTEN PERMISSIO
N of th
e cop
yrigh
t-hold
er

National Conference on Climate Change and Agricultural Production: Adapting Crops to Climate Variability and Uncertainty, 6th–8th April, 2017
[39]
crop residue management; bunding of field; broad bed furrow; soil test based nutrient application, micro irrigation techniques, compost pits, participatory soil health management through identification and correction of major and micro nutrients. The impact of interventions aimed at enhancing rainwater harvesting and thus utilization capacity registered a very significant increase across the clusters. The efforts in this area resulted in the creation of an additional rainwater harvesting capacity of over 91.3 lakh cu m leading to increase cropping intensity by bringing around 1950 ha of area under protective irrigation regime. These initiatives paved way to better crop productivity and higher profits due to augmented rainwater availability and its improved management. Thus, NRM interventions rightly played the role of flagship interventions (Rahman et al., 2015).Various water conservation measures were employed to evaluate their effect on the farm production and the results of demonstration were presented.Different types of alternative irrigation were used under KVKs through NICRA project. Low cost irrigation channel used for irrigation (borabandi, 5% model, renovation of well, construction channel, construction of pond, desiltation). In-situ moisture conservation adopting 5% model was promoted in medium lands to harvest the rainwater. After assessing the available water resources in the area, the KVK mobilized the villagers to store water by building a sand bag dam locally called “Bora-bandi” across the seasonal rivulet Mahsaria. This changed lives of Gunia villagers and opened up the opportunity for double and triple cropping by providing source for irrigation during rabi and summer seasons. Ahar (reservoir of water) and Pyne are the only source of irrigation as the drainage channel. Ponds were renovated for enhancing the rainwater harvesting capacity of the village. After the renovation work, water level began to appear only at four feet depth. Rainwater storage in the pond and the water table of nearby open wells increased and these ponds were able to provide irrigation to transplanted rice in kharif and vegetables during summer. The seepage loss from these ponds as well as percolation loss from the paddy fields was harvested back in an open dug well downstream of each pond. This well served for providing water for nursery raising of paddy and vegetables in pre-monsoon period and to irrigate additional area under vegetables during summer. Mulching with husk, paddy stubbles and leaves in vegetable and plantation crops was introduced for soil moisture conservation resulting in more infiltration, reduced evaporation and less crop water requirement during the dry period. Interventions were taken up to popularize low-cost rainwater harvesting structures ‘Jalkund’ having a high storage capacity, for harvesting rainwater during rainy season and subsequent use during dry periods for life saving irrigation in high value winter vegetables.
REFERENCE [1] Rahman F H, Ghosh D and Singh A K 2015. NICRA-Annual Report 2014-15, ICAR-Zonal Project Directorate Zone-II, Kolkata.
Mitigation of Climate Changes Impact on Maize Production through Training Programmes
Pankaj Kumar1*, Rama Kant Singh1, S.K. Singh1, S.B. Singh2 and S.K. Sinha1 1Krishi Vigyan Kendra Katihar, 2Krishi Vigyan Kendra, Purnea
1,2Bihar Agricultural University, Sabour, Bhagalpur–813210, India E-mail: *[email protected]
Keywords: Climate change, Adoption, Training, Maize
INTRODUCTION
To find out the success and limitations of any program a periodic appraisal and evaluation is essential, so that suitable changes can be made to make the program more effective. The KVK, Katihar under Bihar
It is I
LLEGAL t
o cop
y, pri
nt or
save
any c
onten
t of th
is PDF,
in pa
rt or in
full,
on an
y retr
ieval
syste
m,
withou
t the E
XPRESS WRITTEN PERMISSIO
N of th
e cop
yrigh
t-hold
er

National Conference on Climate Change and Agricultural Production: Adapting Crops to Climate Variability and Uncertainty, 6th–8th April, 2017
[40]
Agricultural University, Sabour designed an evaluation study to assess the results and impact due to the training programms conducted on Maize for mitigating climate change effects.
MATERIALS AND METHODS
The study was conducted in Katihar district of Bihar to find out the extent of knowledge and adoption of maize technology by the farmers and to list out the constraints and suggestions for improving future training programmes. The study was conducted by KVK, Katihar during the year 2013-14 and 2014-15.The data were collected through personal contacts with the help of well-structured interview schedule. Pre and post evaluation of the trainees was done to find out the level of change in their knowledge and skills after training programmes. Thirteen practices were selected to find out the extent of knowledge and adoption.
RESULTS AND DISCUSSION
Out of 150 sample farmers,87 percent had gained knowledge about seed treatment and germination test followed by sowing (92.0 percent), spacing (73 percent), water requirement (34 percent) plant protection methods (42.6 percent),storage and marketing (48 percent),harvesting (31 percent), fertilizer application (33 percent), weeding (12 percent), land preparation (6 percent)and climatic issues (29 percent).The impact created by the training programme was determined based on percentage increase in area,cost of cultivation,level of confidence,yield levels and use of market survey. The positive impact of training program reflected from the fact that a higher percentage of trained farmers reported increase in acreage under maize, confidence levels, use of different practices and increase in yield (92 percent). Maize areas increase after training because the farmers it was a profitablewith adoption of technologies given in different training programmes. The post training cost of cultivation increased because that all production,recommendations in maize cultivation carried out with them some economic costs but finally benefit cost ratio increased. The impact of training was significant in terms of increased yield. This means that training on different cultivation practices has helped the farmers to improve the yield at the rate 4.30 qha-1.The constraints as stated by farmers for the adoption of technology were non availability of timely good quality inputs, labours, financial and Climatic issues. Suitable suggestions like provision of inputs and supply of credits with mitigation of climatic issues for the adoption of technology were expressed by the farmers. The majority of the respondents agreed that the information given by the trainers was more informative and helped in changing their knowledge and skill.
REFERENCES [1] Ajrawat B and Kumar A 2012. Impact of KVK training programme on socio-economic status and knowledge of trainees in Kathua
District.Journal of Krishi Vigyan 1 (1): 31-34. [2] Borua S and Brahma A K 2012. A study on the knowledge level and extent of adoption of selected technology by rural youth trained in
KVKs of AAU in Assam. Journalof Academia and Industrial Research 1 (7): 374-378. [3] Joseph R2008. Impact of krishivigyankendra training programme on maize production. Evaluation capacity building in rural resources
management: A Manual. Indian Agriculture Research Institute, Pusa, New Delhi.
It is I
LLEGAL t
o cop
y, pri
nt or
save
any c
onten
t of th
is PDF,
in pa
rt or in
full,
on an
y retr
ieval
syste
m,
withou
t the E
XPRESS WRITTEN PERMISSIO
N of th
e cop
yrigh
t-hold
er

National Conference on Climate Change and Agricultural Production: Adapting Crops to Climate Variability and Uncertainty, 6th–8th April, 2017
[41]
Reliability of Multi-Sources Observational Data Sources for Assessing Long-Term Rainfall Change over North-Central Indian Region
Javed Akhter1, Debjyoti Majumder2* and Lalu Das2 1Department of Physics, Jadavpur University, Kolkata–700032, India
2Department of Agricultural Meteorology and Physics, Bidhan Chandra Krishi Viswavidayalaya, Mohanpur, Nadia–741252, India
E-mail: *[email protected]
Keywords: GCM, RCM, Gridded Data, Skill Score
INTRODUCTION
Most of the regions of North central regions of India are rainfed and the agricultural production depends significantly on the variability of seasonal as well as annual rainfall. Thus, under the context of climate change scenarios, it is necessary to assess the reliability of past rainfall change of multi sources observational data in order to understand the impact of climate change over agricultural production. Gridded representations of observed data on the basis of a variety of instruments, locations, platforms, retrieval algorithms, and analysis schemes are widely employed in climate research with various goals (Schneider et al., 2014). Typically, only a limited number of such data sets were available, and most climate studies employed a single data set which includes features needed for their analyses. Observational gridded datasets are one of the key ingredients of climatic research for the assessment of climate change of a region as well as for the validation of GCM and RCM outputs of that region mostly depend vastly on this datasets as real observations are not available and inadequate in many cases (Kannan et al., 20140). One of the major problems of any type of climatic or agro-climatic analysis over India is lack of availability of good quality and long-term station data over many parts of the country. Besides, station data is not freely available in India. In this situation, we need some alternative and reliable datasets which we can obtain using different gridded data sets. However, all datasets may not be equally reliable over every region. Therefore, it is necessary to select one or a set of better datasets. Keeping this in mind, the present study assessed the quality of various gridded observations through several visual and statistical analyses with respect to available reference observed rainfall data over North Central India.
MATERIALS AND METHODS
Present study evaluated the performance of different observational datasets e.g. IMD gridded data (10 x 10 and 0.250 x 0.250), CRU (0. 50 x 0. 50), APHRODITE (0. 50 x 0. 50), GPCC (2.50 x 2.50, 10 x 10and (0. 50 x 0. 50), and NCAR/NCEP (0.250 x 0.250) reanalysis data against the reference data set of IMD observational data assumed to be the true data in different seasons (MAM, JJAS, ON and DJF) through skill score and linear trend analysis as well as visual comparison of annual scale for the period 1951-2003 over North central India-a region of subtropical monsoon climate.
RESULTS AND DISCUSSION
All the datasets have simulated the observed annual cycle quite well. But APHRODITE and NCEP reanalysis have shown large wet bias in all seasons. IMD, APHRODITE and GPCC data are highly correlated with observed rainfall. The observed rainfall has shown 0.63 mm, 0.42 mm, 0.19 mm and 1.12 mm increase per year for MAM, JJAS, DJF seasons and annual rainfall respectively whereas 0.22 mm decrease per year for ON season. Only GPCC data set has been able to capture similar trend for all seasons. Performance of NCEP reanalysis is worse as compared to others. GPCC high resolution data has shown smallest bias among all the datasets and also obtain superior skill scores than others. Therefore, more confidence may be put on GPCC
It is I
LLEGAL t
o cop
y, pri
nt or
save
any c
onten
t of th
is PDF,
in pa
rt or in
full,
on an
y retr
ieval
syste
m,
withou
t the E
XPRESS WRITTEN PERMISSIO
N of th
e cop
yrigh
t-hold
er

National Conference on Climate Change and Agricultural Production: Adapting Crops to Climate Variability and Uncertainty, 6th–8th April, 2017
[42]
high resolution gridded data for climatic analysis of this region. In general it is revealed that the different sources of data has different types of inherent problems to reproduce the reference rainfall over North-central India although GPCC and IMD data have shown better skills compared to other on annual scale.
Table 1: Skill Score (Taylor 2001) MAM JJAS ON DJF Annual
IMD-high 0.98 0.98 0.99 0.97 0.98 CRU 0.95 0.84 0.93 0.88 0.87 APHRO-high 0.96 0.95 0.93 0.98 0.96 APHRO-low 0.96 0.94 0.93 0.97 0.95 IMD-low 0.97 0.98 0.99 0.99 0.99 GPCC-low 0.99 0.97 0.98 0.99 0.98 NCEP 0.71 0.81 0.84 0.83 0.84 GPCC-high 0.99 0.98 0.99 0.99 0.99 GPCC-med 0.99 0.98 0.99 0.99 0.99
Table 2: Trends (mm/ Decade) OBS IMD-High CRU APHRO-
High APHRO-
Low IMD- Low GPCC-
Low NCEP GPCC-
High GPCC-
Med MAM 6.30* 3.69 2.59 6.19** 6.23** 3.30 5.63* -3.37 5.15* 5.34* JJAS 4.18 -1.78 -30.46* -1.15 -0.69 4.04 3.54 17.43 4.46 4.97 ON -2.18 -2.08 -2.14 -1.18 -1.14 -2.08 -0.48 -5.89 -0.51 -0.38 DJF 1.90 -0.23 -0.57 1.99 2.05 0.62 3.01 -1.13 3.07 3.13 Ann 10.19 -0.39 - 30.58* 5.86 6.45 5.88 11.70 7.04 12.18 13.06
‘*’-significant at 10% level; ’**’-significant at 5% level; ’***’-significant at 1% level
REFERENCES [1] Kannan S., Ghosh S., Mishra V. and Salvi K. 2014. Uncertainty resulting from multiple data usage in statistical downscaling. Geophysical
Research Letters 41: 4013-4019. [2] Schneider U., Becker A. and Finger P. 2014. Theoretical and Applied Climatology, 115. 15. doi:10.1007/s00704-013-0860-x [3] Taylor K.E. 2001. Summarizing multiple aspects of model performance in single diagram.Geophysical Research Letters 106: 7183-7192.
Effect of Conservation Tillage on Wheat Yield and Soil Physical Properties in Rice-Wheat Cropping System
Seema1,2*, D.K. Singh1 and P.C. Pandey1 1Department of Agronomy,
G.B. Pant University of Agriculture and Technology, Pantnagar–263145, India 2Department of Agronomy, BAU, Sabour–813210, Bhagalpur, India
E-mail: *[email protected]
Keywords: Conservation Tillage, Soil Temperature, Wheat, Rice-Wheat Cropping System
INTRODUCTION
Rice-wheat cropping system is one of the major agricultural systems of south Asia. It is the source of livelihood, employment and income for hundreds of millions of rural and urban poors. Intensive tillage and residue burning have led to depletion of soil organic carbon, resulting in decreasing soil fertility and factor productivity. Declining/stagnating crop and factor productivity and a deteriorating resource base in cereal systems such as rice–wheat have led to the promotion of conservation agriculture. To realize the fullbenefits of zero tillage, which otherwise are lost by doing puddling in rice,serious efforts are being made to develop
It is I
LLEGAL t
o cop
y, pri
nt or
save
any c
onten
t of th
is PDF,
in pa
rt or in
full,
on an
y retr
ieval
syste
m,
withou
t the E
XPRESS WRITTEN PERMISSIO
N of th
e cop
yrigh
t-hold
er

National Conference on Climate Change and Agricultural Production: Adapting Crops to Climate Variability and Uncertainty, 6th–8th April, 2017
[43]
zero-tillage rice followed by zero tillagewheat commonly referred to as “double zero tillage.” Considering all these problems and issues of conventional rice-wheat system and potential and prospects of alternate methods, the present study was formulated.
MATERIALS AND METHODS
A field experiment was conducted during the rainy season of 2012-13 and 2013-14 at Borlaug Crop Research Centre of G.B. Pant University of Agriculture and Technology, Pantnagar, India. The soil of experimental field was sandy clay loam in texture andwas rich in organic matter, low in available nitrogen, medium in phosphorus and potassium and neutral to slightly alkaline in reaction. The experiment was laid out in the split-split plot design having three tillage systems (zero tillage, minimum tillage and conventional tillage) in main plot, two rice varieties (Pant Sankar Dhan 3 and Pant Dhan 16) in sub plot and residue management (with residue and without residue) in sub-sub plot with three replication. After sowing of the crop, residue of the previous crop (rice residue in wheat and wheat residue in rice) was applied manually in the plots according to the treatments at the rate of 4 t/ha.
RESULTS AND DISCUSSION
The tillage practise had non-significant I first year and significant effect in next year on grain yield of wheat. In first season higher grain yield (4.02 t ha-1) under zero tillage was statistically at par to MT and CT. In next season of crop, grain yield under zero tillage (4.25 t/ha) was significantly higher than CT and MT (4.15 t ha-1and 4.07 t ha-1respectively). Lower yield (3.90 t ha-1) was observed with residue retention which was at par with non-residue retention in the year 2012-13. In the next year, grain yield under residue retention was (4.31 t ha-1) significantly higher than non-residue application. The higher yields in straw retained plot was due to the reason that the nutrient in crop residue and soil could be improved through the adjustment of abundant microorganism after straw residue returning to the field (Xu et al., 2009). In first year of rice-wheat system, tillage practices did not influence the soil moisture. The soil moisture content increased with the advancement of depth. The range of soil moisture was 13.5 per cent in 0-5 cm to 18.0 per cent in 10-15cm depth. At all the soil depth significantly higher moisture content was observed under residue retention than non-residue retention. In second year similar pattern was found. Maximum soil moisture content was recorded with zero tillage which was at par with MT and CT. In general, more plant residue were left on or near the soil surface in zero tillage which led to lower evaporation and higher content of soil water in the upper soil layer (Singh and Kaur, 2012). Soil temperature was recorded in wheat crop at tillering, heading and grain maturity stage. At tillering stage of wheat crop, temperature during morning and evening showed greater variation during the first year of wheat crop than second year. In case of morning hours higher soil temperature was under residue retention as compare to non-residue retention. The variation between residue and non-residue was more in minimum tillage and lower in conventional tillage. Opposite result was observed in case of maximum soil temperature. During heading stage of wheat crop, temperature was higher than those recorded during tillering stage and more increment in soil temperature was recorded during first year than the second year. Similar trend was observed under residue and non-residue as during tillering stage. At grain maturity stage, the variation in morning hour’s soil temperature was less as compared to evening hour’s temperature during both the years. Residue retention resulted lower soil temperature than non-residue in morning hours. Similarly at evening hours lower soil temperature was recorded under residue retention than non-residue during both the years. The tillage practices did not result variation in soil temperature. Crop residue left on the soil surface as mulch as compared to incorporation, removal or burning are known to be beneficial for crop production. If used as mulch, the residue can modify soil temperature and soil temperature is lowered by the plant residue left on the soil surface. Similar results are reported by Fengyun et al., 2011 and Singh and Kaur, 2012. From the experiment conducted two years it can be concluded that conservation tillage improved the soil physical properties and also found remunerative. So, it can be recommended that DSR followed by wheat in zero or minimum tillage with residue mulching may be adopted.
It is I
LLEGAL t
o cop
y, pri
nt or
save
any c
onten
t of th
is PDF,
in pa
rt or in
full,
on an
y retr
ieval
syste
m,
withou
t the E
XPRESS WRITTEN PERMISSIO
N of th
e cop
yrigh
t-hold
er

National Conference on Climate Change and Agricultural Production: Adapting Crops to Climate Variability and Uncertainty, 6th–8th April, 2017
[44]
REFERENCES [1] Singh A and Kaur J 2012. Impact of conservation tillage on soil properties in rice-wheat cropping system. Agricultural Science Research
Journal 2 (1): 30-41. [2] Fengyun Zhang, Pute Wu, Xining, Zhao and Xuefeng Cheng 2011. The effect of no-tillage practices on soil physical properties. African
Journal of Biotechnology 10 (77): 17645-17650. [3] Xu G W, Tan G L, Wang Z Q, Liu L Jand Yang J C 2009. Effect of wheat residue application and site specific nitrogen management on
growth and development in direct-seeding rice. Acta Agronomica Sinica 35:685-694
Inter-Relationship between Climate Change and Agriculture
Sima Sinha*, Ravi Shankar Singh, Anand Kumar and Ravi Ranjan Kumar Department of Plant Breeding and Genetics, BAU, Sabour–813210, India
E-mail: *[email protected]
Keywords: Green House Gases (GHGs), Climate Change, Mitigation, Adaptation
Climate change is grave environmental concern adversely affecting agricultural production and productivity. It refers to a statistically significant variation in either the mean state of the climate or its variability, persisting for an extended period. As the temperature and resource availability varies between different countries it results in variation of agricultural contribution to climate change. In developing countries, Green House Gas (GHG) emission from agriculture sector is much more because of large number of cattle and inadequate manure management, improper use of agro-chemicals and mismanagement of the land. Globally, agriculture contributes to 58% of total nitrous oxide (N2O) emission. N2O and methane (CH4) are two of the most potent non-CO2 GHG, which contributes about half of the global emissions of the world, according to the World Bank (2008). In addition to the basic role of agriculture to produce food, fabrics and raw materials for uses, it also performs maintains the renewable natural resources, construction and protection of land, conservation of biodiversity and the maintenance of socio-economic activities. Agriculture sustenance human life that also affected by climate change. In India, climate is mainly influenced by its geography like the Himalayas, Thar Desert, Arabian Sea and Bay of Bengal that controls temperature as well as rainfall affecting the agricultural production and productivity. Therefore, contribution of agricultural activities to climate change, its causes, impact as well as mitigation strategies need to be addressed for sustaining agricultural productivity. There is several adaptation methods that the agricultural sector can undertake to cope with future climate change. These include (1) changing planting dates, (2) planting different varieties or crop species, (3) development and promotion of alternative crops, (4) developing new drought and heat resistant varieties, (5) improved crop residue and weed management, (6) more use of water harvesting technique, (7) better pest and disease control, (8) improving the irrigation system, (9) reducing water leakage, and (10) conservation of soil moisture. With the help of the right agricultural practices and the consideration of suitable policy measures would be necessary to changing agricultural patterns in the climate change scenario.
REFERENCES [1] Thornton P and Lipper L 2013. How does climate change alter agricultural strategies to support food security? Background paper for the
conference “Food Security Futures: Research Priorities for the 21st Century”, 11-12 April 2013, Dublin. [2] World Bank 2008. Agriculture for Development Policy Brief: Adaptation and Mitigation of Climate Change in Agriculture: World
Development Report 2008.
It is I
LLEGAL t
o cop
y, pri
nt or
save
any c
onten
t of th
is PDF,
in pa
rt or in
full,
on an
y retr
ieval
syste
m,
withou
t the E
XPRESS WRITTEN PERMISSIO
N of th
e cop
yrigh
t-hold
er

National Conference on Climate Change and Agricultural Production: Adapting Crops to Climate Variability and Uncertainty, 6th–8th April, 2017
[45]
Forecasting Food Grain Production in Perspective of Climate Change
Manoj Kumar1* and Subrat Keshori Behera2 1ICAR-Central Institute of Agricultural Engineering, Bhopal–462038, India
2Bihar Agricultural University, Bhagalpur–813210, India E-mail: *[email protected]
Keywords: Climate change, Food grain production, Structural time series model
INTRODUCTION
Climate change is a serious topic of discussion and it has been discussed intensively on many platforms in the current decade. It affects agriculture in many ways due to changes in average temperatures, rainfall, pests and diseases incidence and thus affecting the total food grain production. In the present paper, time series data on rainfall, fertilizer consumption and food grain production from 1950-51 to 2014-15 have been analyzed and forecasting of food grain production have been done using structural time series model.
MATERIALS AND METHODS
The time series data on rainfall, fertilizer consumption and food grain production from 1950-51 to 2014-15 was collected from directorate of economics and statistics, department of agriculture and co-operation, government of India and open government data platform, India. The data on fertilizer consumption and food grain production was analyzed to study the response of fertilizer to total food grain production. The data on rainfall pattern was also analysed to investigate the changes in rainfall pattern. The structural time series model like local linear trend model described by Harvey (1996) is used for forecasting the food grain production.
RESULTS AND DISCUSSION
The rainfall pattern a followed normal distribution at p value 0.05. During 1980, 0.043 unit of fertilizer was used in production of each unit of food grain but in 2010-11 required 0.115 unit of fertilizer to produce one unit of food grain which indicate that fertilizer response to crop is decreasing. The structural time series model described by Harvey (1996) was fitted and the food grain production was forecasted using the fitted model. The estimates of level as well as slope are presented in table 1 along with their standard error and p value. Both, the level and slope were highly significant as p value is <0.0001. The forecast of food grain production along with their confidence interval is given in table 2.
Table 1: Estimates of the Components and Significance Components Estimates Standard error p value
Level 259.026 4.907 <0.0001 Slope 3.818 0.774 <0.0001
Table 2: Food Grain Production with Confidence Interval Year Food Grain Production (Million Tonnes) 95% Confidence Interval 2016 266.662 244.994 to 288.331 2017 270.481 247.581 to 293.380
REFERENCES [1] Harvey A C 1996. Forecasting structural time- series models and the kalman filter. Cambridge University Press, U.K. [2] Mahato A 2014. Climate change and its impact on agriculture, International Journal of Science and Research 4 (4): 2250-3153.
It is I
LLEGAL t
o cop
y, pri
nt or
save
any c
onten
t of th
is PDF,
in pa
rt or in
full,
on an
y retr
ieval
syste
m,
withou
t the E
XPRESS WRITTEN PERMISSIO
N of th
e cop
yrigh
t-hold
er
National Conference on Climate Change and Agricultural Production: Adapting Crops to Climate Variability and Uncertainty, 6th–8th April, 2017
[46]
Observation of Climatic Variability in Srinagar District of Kashmir Valley, India
Latief Ahmad1*, R.H. Kanth1, Sabah Parvaze1, Saqib Parvaze2 and S. Sheraz Mahdi3 1Division of Agronomy, 2Division of Agricultural Engineering,
1,2Sher-e-Kashmir University of Agricultural Sciences and Tech. of Kashmir, Shalimar–190025, India 3Department of Agronomy, Bihar Agricultural University, Sabour–813210, India
E-mail: *[email protected]
Keywords: Linear regression, Man-Kendall test, Sen-Slope estimate, Trend analysis
INTRODUCTION
Precipitation and air temperature are primary elements of weather systems. This necessitates the analysis of their behavior in order to understand climate variability. The spatial and temporal variation for both variables is also high at different local and worldwide levels. The range of variability for these climatic variables must be studied in order to predict forthcoming climatic conditions (Karabulut et al., 2008).Projected climate change models like SDSM (Statistical Downscaling Model) and ANN (Artificial Neural Network) have predicted a warming trend in future for this region (Parvaze etal., 2016).The present study was undertaken to examine the precipitation and temperature trends in the Srinagar district of Kashmir Valley. The study was carried out using temperature and precipitation data from SKUAST-K weather station located in the Srinagar district for a period of 31 years.
MATERIALS AND METHODS
Daily series of observed maximum temperature, minimum temperature and precipitation data for a period of 31 years (1985-2011) were obtained from SKUAST-Kashmir weather station. These were reduced to annual time series of cumulative precipitation and average maximum and minimum temperature. The numbers of rainy days per year for the same period were also computed. The time series were then analyzed for presence of trends using parametric and non-parametric approaches. Linear regression method was used for parametric trend analysis while Mann-Kendall test was used for non-parametric trend analysis. The magnitude of the trend was quantified using a non-parametric index known as Sen-Slope.
RESULTS AND DISCUSSION
The monthly mean maximum temperature, mean minimum temperature, rainfall and number of rainy days did not exhibit statistically significant trends with respect to time for most of the incidences. A statistically significant decreasing trend was observed in the number of rainy days in the month of May. The month of September indicated a statistically significant decreasing trend in case of mean minimum temperature decreasing by 0.05°C in the month. The total monthly precipitation and the number of rainy days indicated a statistically significant increasing trend increasing by 1.25mm and 0.074 days respectively in September. The annual statistical parameters for trend analysis are tabulated in Table 1. This study signifies that annual and monthly mean maximum temperature as well as annual and monthly precipitation values did not show any statistically significant trends with respect to time. A very small significant decreasing trend was observed in the annual mean minimum temperature by both linear regression and Mann-Kendall methods. The minimum mean temperature exhibited a decreasing trend for the September as the monthly precipitation and number of rainy days for this month exhibited a significant increasing trend. The trends exhibited by these climatic
It is I
LLEGAL t
o cop
y, pri
nt or
save
any c
onten
t of th
is PDF,
in pa
rt or in
full,
on an
y retr
ieval
syste
m,
withou
t the E
XPRESS WRITTEN PERMISSIO
N of th
e cop
yrigh
t-hold
er

National Conference on Climate Change and Agricultural Production: Adapting Crops to Climate Variability and Uncertainty, 6th–8th April, 2017
[47]
variables in other months showed very small insignificant trends. The results obtained from the analysis suggest that there has been no significant change in the climate of Kashmir valley over last 31 years.
Table 1: Annual Temperature and Precipitation Trends in Srinagar District Time Series Linear Regression Mann-Kendall Trend Sen's Slope Estimate
Test Z Result Test Z Result β β min95 β max95 Maximum Temperature (°C) 1.979 NS 1.67 NS 0.033 -0.005 0.072
Minimum Temperature (°C) -2.492 S -2.02 S -0.020 -0.036 0
Rainfall (mm) 0.48 NS -0.27 NS -1.486 -9.054 11.462 Rainy Days 0.194 NS 0.36 NS 0.091 -0.369 0.6
S=Significant; NS=Non- Significant
REFERENCES [1] Karabulut M, Gürbüz M and Korkmaz H 2008. Precipitation and temperature trend analyses in Samsun. Journal International
Environmental Application & Science 3 (5): 399-408. [2] Parvaze S, Parvaze S, Haroon S, Khurshid N, Khan J N and Ahmad L 2015. Projected change in climate under A2 Scenario in Dal lake
catchment Area of Srinagar City in Jammu and Kashmir. Current World Environment 11 (2): 429-438.
Temperature Correlation with the Population Dynamics of Fruit Fly, Bactrocera dorsalis (Hendel) on Guava
Meenakshi Devi* and G.S. Yadav Department of Entomology, CCS Haryana Agricultural University, Hisar–125004, India
E-mail: *[email protected]
Keywords: Bactrocera dorsalis, Guava, Methyl eugenol trap, Population dynamics
INTRODUCTION
The oriental fruit fly, Bactrocera dorsalis (Hendel), is a serious pest of guava fruit crop in all the parts of India. Among the various alternate strategies available for the management of fruit flies, the use of methyl eugenol traps stands as the most outstanding alternative. Methyl eugenol specially attracts the males of Bactrocera dorsalis, B. correcta and B.zonata. These traps have high specificity at low cost and outstanding alternative. Methyl eugenol has both olfactory as well as phagostimulatory action and is known to attract fruit flies from a distance of 800m. Fruit fly population increases due to weather parameters prevailing during preceding and corresponding periods. The pest status does not remain static throughout the year but changes accordingly based on abiotic factors like temperature, relative humidity, rainfall and light etc. Recent studies have been planned to record the effect of temperature with the population dynamics of B. dorsalis on guava and management by methyl eugenol trap under agro-climatic conditions of Haryana.
MATERIALS AND METHODS
The population dynamics studies were carried out in the orchard of CCS HAU, Hisar from June to August during 2013 on guava trees (var. Hisar Safeda). The monitoring was carried out with the help of four methyl eugenol traps per acre installed on the guava trees for observing the fluctuation in adult fruit fly population. A ply board block (1.5×1.5×1.5 cm) was impregnated by keeping it in methyl eugenol for about 48 hrs and placed inside the loop of the wire. The methy eugenol was dispenser was replaced after-one month. The male adult fruit flies were counted in the traps at weekly intervals during July to, September, 2013. Correlations were worked out between trap catches and mean weather parameter for every standard week.
It is I
LLEGAL t
o cop
y, pri
nt or
save
any c
onten
t of th
is PDF,
in pa
rt or in
full,
on an
y retr
ieval
syste
m,
withou
t the E
XPRESS WRITTEN PERMISSIO
N of th
e cop
yrigh
t-hold
er

National Conference on Climate Change and Agricultural Production: Adapting Crops to Climate Variability and Uncertainty, 6th–8th April, 2017
[48]
RESULTS AND DISCUSSION
The average population of fruit fly, Bactrocera dorsalis (Hendel) varied between 5 to 28 during 27 and 35 standard week (Table 1). The average temperature varied from maximum (38.6ºC) to minimum (25.2ºC), R.H of 96.1-55% (M-E) and rainfall of 4.3-25.7 mm was found during the experimental period. The peak activity of population (28 fruit fly/ trap) was recorded in 33th standard metrological week when average maximum and minimum temperature was 31.4ºC- 25.2ºC and the morning and evening relative humidity was 96.1 and 81.5 per cent. These results are in close proximity with the Sarada et al. (2001) and Rajitha and Viraktamath (2006). They reported that the fruit fly on guava population was positively correlated with relative humidity (r = 0.431) and rainfall (r = 0.548) whereas it was negatively correlated with maximum temperature (r = –0.409).
Table 1: Temperature Correlation with the Population Dynamics of Fruit Fly on Guava Standard
Weeks Average
Temperature (ºC) Average Relative Humidity (%) Rainfall (mm) Mean Population/
Trap Max. Min. M E
27 38.6 27.5 78.1 55 7.3 11 28 35.7 26.4 82.5 60.8 9.3 20 29 36.1 26.3 84.4 67.1 0.0 17 30 35.3 26.1 85.4 59 4.3 21 31 34.5 26.9 86.8 67.1 9.8 23 32 32.8 26.1 92.3 76.2 9.5 26 33 31.4 25.2 96.1 81.5 25.7 28 34 33.6 26.1 91.4 68.7 0.0 16 35 35.3 25.3 77.7 55.3 0.0 5.3
Correlation(r) –0.668* 0.126(NS) 0.814* 0.789* 0.695* – *indicates significance at p = 0.05
REFERENCES [1] Sarada G, Maheswari T U and Purushotham K 2001. Seasonal incidence and population fluctuation of fruit flies in mango and guava.
Indian Journal of Entomology 63: 272-276. [2] Rajitha A.R. and Viraktamath S 2006. Monitoring of fruit flies (Diptera: Tephritidae) in guava orchard at Dharwad, Karnataka. Karnataka
Journal of Agricultural Science 19: 35-49.
Analysis of Radiation Use Efficiency, Yield Attributes and Quality Parameters of Basmati Rice (Oryza sativa L.) Cultivars under Different Dates of Transplanting in Eastern Agroclimatic Conditions of Haryana
Abhilash*, Chander Shekhar Dagar, Raj Singh, Premdeep and Sagar Kumar Department of Agricultural Meteorology, College of Agriculture,
CCS Haryana Agricultural University, Hisar–125004, India E-mail: *[email protected]
Keywords: Basmati rice, Yield, Quality parameters, Radiation use efficiency
INTRODUCTION
Rice (Oryza sativa L.) is among one of the most important cereal crops grown under different hydrological conditions in Asia. About 90percent production and consumption of world’s rice occurs in Asia (FAO, 2014). India holds second position in production of rice in the world with production of 105.48 million tonnes from
It is I
LLEGAL t
o cop
y, pri
nt or
save
any c
onten
t of th
is PDF,
in pa
rt or in
full,
on an
y retr
ieval
syste
m,
withou
t the E
XPRESS WRITTEN PERMISSIO
N of th
e cop
yrigh
t-hold
er

National Conference on Climate Change and Agricultural Production: Adapting Crops to Climate Variability and Uncertainty, 6th–8th April, 2017
[49]
43.90 million hectares, with a productivity of 2390 kg/ha during 2015 (Economic survey, 2015-16).Time of planting is one of the most important factor in influencing the yield of the crop. Performance of a genotype entirely depends upon the time of transplanting and delay in transplanting generally results in yield reduction which cannot be compensated by any other means. Thus, by adjustment of transplanting time, the plant can take advantage of natural conditions favorable for its growth (BRRI, 2004). Based on the above propositions, the present study was undertaken to find out the optimum transplanting time and to select the elite basmati cultivar having high yield potential to increase production in kharif season.
MATERIALS AND METHODS
A field experiments was conducted during Kharif season of 2015 at Chaudhary Charan Singh Haryana Agricultural University, Rice Research Station, Kaul, India to study the comparative performance of various scented basmati rice cultivars with respect to radiation use efficiency, yield attributes and quality parameters under different dates of transplanting. The treatments included three dates of transplanting viz. 25th June, 10th July and 25th July in the main plots and four cultivars namely CSR 30, PB 1121, PB 1509 and HB 2 in the subplots each of size 4.0 x 3.6 m, resulting in 12 treatment combinations. The experiment was laid out in a split-plot design with each treatment replicated four times.
RESULTS AND DISCUSSION
Yield attributes viz. number of effective tillers, panicle length and panicle weight, number of grains per panicle, less number of unfilled spiklets per panicle, 1000 grain weight, grain and straw yield, harvest index were significantly higher at all growth stages when the crop was transplanted on 25th June as compared to the crop transplanted on 10th July and 25th July. The crop transplanted on 25th June gave better results in terms quality parameters, more grain length and breadth, L/B ratio and head rice recovery. Maximum value of RUE and HUE were also observed in 25th June transplanted crop. The present studies indicate that HB 2 variety basmati rice transplanted on 25th June is most suitable for cultivation under eastern agroclimatic conditions of Haryana, however, there is need to conduct the long term study under different agro climatic conditions.
Table 1: Effect of Transplanting Time on Yield Attributes of Basmati Rice Varieties Treatments Grain Yield
(kg ha-1) Straw Yield
(kg ha-1) Harvest Index
(%) 1000 Grain Weight
(gm) Transplanting Dates
25th June 3791 7469 37.02 28.3 10th July 3760 7127 35.18 27.9 25th July 3357 6585 33.62 27.3 CD (p=0.05) 161 512 1.37 N.S.
Varieties CSR 30 3464 8790 28.92 25.9 PB 1121 3740 6844 36.41 28.9 PB 1509 3439 5791 37.34 27.6 HB 2 3902 6816 38.42 28.9 CD (p=0.05) 152 511 1.83 1.2
REFERENCES [1] Dawadi K.P. and Chaudhary N.K. 2013. Effect of sowing dates and varieties on yield and yield attributes of direct seeded rice in Chitwan,
Nepal. International Journal of Agricultural Science Research 2: 95-102. [2] Abid M, Khan I, Mahmood F, Ashraf U, Imran M and Anjum SA2015. Response of Hybrid Rice to Various Transplanting Dates and
Nitrogen Application Rates. The Philippine Agricultural Scientist 98(1): 98-104.
It is I
LLEGAL t
o cop
y, pri
nt or
save
any c
onten
t of th
is PDF,
in pa
rt or in
full,
on an
y retr
ieval
syste
m,
withou
t the E
XPRESS WRITTEN PERMISSIO
N of th
e cop
yrigh
t-hold
er

National Conference on Climate Change and Agricultural Production: Adapting Crops to Climate Variability and Uncertainty, 6th–8th April, 2017
[50]
Assessment of Climatic Vulnerability to Agriculture in Kosi Region of Bihar
Jyoti Bharti1, Meera Kumari1, S.M. Rahaman1, S.L. Bairwa2 and L.K. Meena1* 1Department of Agricultural Economics, Bihar Agricultural University, Sabour, Bhagalpur–813210, India
2Department of Agricultural Economics, Dr. Kalam Agricultural College, Kisanganj, India E-mail: *[email protected]
Keywords: Climate change, Exposure, Sensitivity, Adaptive capacity, Vulnerability.
INTRODUCTION
Climate is the primary determinant of agricultural productivity. Their impact has multi-dimensional effect on humanities in terms of several socio-economic parameters. Bihar is one of the most disaster prone states of the county.Vulnerability to climate change is closely related to poverty as the poor are least able to respond to climate change. Among natural disasters, flood is the most common and a regular annual phenomenon in Bihar resulting in enormous loss of life and property. In addition to floods, increasing population pressure, high density of buildings and their poor construction quality, the settlement in vulnerable areas and inadequate or no investment on mitigation/preparedness measures has further increased the vulnerability need to be assessed.
MATERIALS AND METHODS
The present study was conducted in Kosi region of Bihar to assess vulnerability to agriculture and was based on data from 1976 to 2015. The secondary data were collected from various published source like Indian Meteorology Departments (IMD), DES, Patna, Ministry of Agriculture, Govt. of India. For the construction of vulnerability index several sub-indicators were used and those indicators relevant to study site were identified. Keeping in view the availability of data, 8 districts of Kosi region of Bihar were selected. To construct the index, Patnaik and Narayanan’s method of equal weight and simple average score were used and to assess the degree of vulnerability, expert judgement method based on expert opinion with different weight on variables were used. In order to obtain figures which are free from the units, they were normalized so that they all lie between 0 and 1. A region with highest index was said to be most vulnerable and it is given the rank1, the region with next highest index was assigned rank 2 and so on.
RESULTS AND DISCUSSION
Kisanganj district ranked first in the overall vulnerability to climate change amongst all the selected districts with respect to different indicator of vulnerability in different period of study. Data (Table 1) pertaining to contribution of sources of vulnerability as well factors affecting vulnerability showed that the agricultural sector played a significant role in construction of vulnerability followed by occupational, climatic indicator and demographic indicators in all most all period which was selected for the study. District- wise analysis indicated that, as per ranking Kishanganj district placed at the first position by contributing 46 percent towards the vulnerability due to agricultural indicators followed by Khagaria, Saharsha and Purnia. On the basis of variable with unequal weight, the Kisanganj district was placed again under highly vulnerable district, however the district of Supaul, Saharsa, Madhepura, Purnea and Khagaria were placed under moderate vulnerability whose degree of vulnerability varied from 28.42- to 73.14 percentand the Araria district least vulnerable district. Therefore, it is suggested that climate change has devastating impacts on agriculture and. it is important to focus on the impacts of climate change on livelihoods, and re-establish the links among
It is I
LLEGAL t
o cop
y, pri
nt or
save
any c
onten
t of th
is PDF,
in pa
rt or in
full,
on an
y retr
ieval
syste
m,
withou
t the E
XPRESS WRITTEN PERMISSIO
N of th
e cop
yrigh
t-hold
er

National Conference on Climate Change and Agricultural Production: Adapting Crops to Climate Variability and Uncertainty, 6th–8th April, 2017
[51]
poverty, livelihood and environment. However, focusing on the communities only are not enough and so long as the community initiatives do not become part of the government policies,
Table 1: Source Wise Percentage Contribution of Vulnerability Index from 1976–2015 District Demographic Climate Agril. Occupational Overall Rank
Kishanganj 6.71 10.52 46.18 36.59 12.98 1 Khagaria 13.2 14.82 36.62 35.35 12.85 2 Supaul 11.32 20.52 25.53 42.64 10.69 3 Purnea 20.35 26.72 36.22 16.71 9.12 4 Madhepura 17.37 24.57 22.62 35.44 9.00 5 Saharsa 19.36 16.07 32.42 32.14 8.99 6 Araria 9.75 24.48 42.67 23.1 5.89 7 Katihar 36.13 27.92 23.43 12.53 5.83 8 Overall 15.42 19.41 33.92 31.25 100
REFERENCES [1] Hiremath D B and Shiyani R L 2012.Evaluating Regional Vulnerability to Climate change: A Case of Saurashtra. Indian Journal of
Agricultural Economics 67 (3): 334-344 [2] Mall R K, Singh R, Gupta A, Srinivasan G and Rathore L S 2006. Impact of Climate Change on Indian Agriculture: A Review. Climatic
Change 78: 445-478
Effect of Planting Dates and Crop Geometry on Growth and Yield of Pigeonpea (Cajanus cajan L. Millsp.) Cultivars under Limited Irrigation
Akhilesh Sah1*, Md. Naiyar Ali1 and Amarjeet Kumar2 1Birsa Agricultural University, Ranchi–834006, India
2Bihar Agricultural University, Sabour–813210, India E-mail: *[email protected]
Keywords: Climate change, Crop geometry, Planting date, pigeonpea
INTRODUCTION
Pigeonpea (Cajanus cajan L. Millsp.) is a tropical crop grown in India, predominantly during the kharif season as either sole or inter crop. Pigeonpea is also one of the major grain legume crops cultivated in most parts of Jharkhand. Its deep rooting and drought tolerant character makes it a successful crop in areas of low and uncertain rainfall. Most genotypes of pigeonpea are photoperiod- sensitive and therefore sowing date has an important influence on the vegetative and reproductive processes in the changing scenario of climate. So the present study was undertaken to quantify the responses of pigeonpea to planting dates, plant geometry and genotypes in terms of leaf area index, yield attributing characters and yield.
MATERIALS AND METHODS
A field experiment was conducted at Zonal Research Station, Chianki (24.25o N and 84.04oE with an altitude of 228.6 m above the mean sea level), Jharkhand, India during four consecutive years (2008 – 09 to 2011-12) with a objective to investigate the performance of pigeonpea cultivars planted at three different dates and different crop geometry with a view to select the optimal date and spacing for each of the cultivars. Climatically, the area is sub-tropical with annual average rainfall of 1179 mm. The soil is sandy loam having pH 6.2, organic carbon 0.37%, available nitrogen 114 kg/ha, phosphorus 18 kg/ha and potassium 128 kg/ha. The experiment design was split-plot based on randomized complete block design, in three replications; with the planting date (25th June, 25th July and 25th August) in main plots, spacing(60x25 cm2, 75x25 cm2 and 90x25 cm2) in sub plots and cultivars (ICPH2671 and Bahar) in sub-sub plots.
It is I
LLEGAL t
o cop
y, pri
nt or
save
any c
onten
t of th
is PDF,
in pa
rt or in
full,
on an
y retr
ieval
syste
m,
withou
t the E
XPRESS WRITTEN PERMISSIO
N of th
e cop
yrigh
t-hold
er

National Conference on Climate Change and Agricultural Production: Adapting Crops to Climate Variability and Uncertainty, 6th–8th April, 2017
[52]
RESULTS AND DISCUSSION
Significantly higher plant height (129.6 cm) was recorded in cultivar Bahar at 75 cm row spacing in in the planting date of 25th June. Least plant height (68.0 cm) was observed in cultivar ICPH2671 in the planting date of 25th August. The total dry matter production per plant was significantly higher in cultivar ICPH2671 at 75 cm row spacing in all the three planting dates. The highest leaf area index was observed in cultivar ICPH2671 at 60 cm i.e. 0.53 in planting date of 25th June, 0.48 in planting date of 25th July and 0.41 in planting date of 25th August. Planting date had no significant effect on leaf area index (Wilson et al., 2012). The maximum number of pods per plant was in cultivar ICPH2671 in all the three planting dates at row spacing of 75 cm. The significantly higher 100 seed weight was in cultivar ICPH2671 at 75 cm row spacing i.e.32.0 gm in 25th June of planting, 30.1 gm in 25th July of planting and 22.8 gm in 25th August of planting. The lowest value was in cultivar Bahar at all row spacing in all the three planting dates. The maximum yield was in cultivar ICPH2671 at 75 cm row spacing in all the three planting dates i.e. 28.63 q/ha in 25th June of planting, 18.47 q/ha in 25th July of planting and 8.69 q/ha in 25th August of planting Egbe et al. (2013) also reported that the effect of cultivars and interaction effects of date of planting × cultivars were significant. The study revealed that the first sowing date (25th June) was significantly superior to all other sowing dates. The row spacing of 75 cm was significantly superior to all other row spacing. The row spacing of 60 cm and 90 cm were statistically at par with each other. Interaction of sowing dates and row spacing indicated that all sowing dates performed well under 75 cm row spacing. The cultivar ICPH2671 was significantly superior to cultivar Bahar.
REFERENCES [1] Egbe M O, Aku A A and Odebiyi S 2013.Effect of planting dates on the performance of Pigeonpea varieties in southern Guinea savanna
ecology of Nigeria. Journal of Biology, Agriculture and Healthcare 3 (8): 22-28 [2] Wilson C, Hui D, Nwaneri E, Wang J, Deng Q, Duseja D and Tegegne F 2012. Effects of planting dates, densities and varieties on
ecophysiology of Pigeonpea in the south-eastern United States. Agricultural Sciences 3 (2): 147-152
Evaluation of Clones for Populus Deltoides and Economics of Raising Entire Rooted Transplants (Etps) under Nursery Condition in
North-Eastern Part of Haryana
Pradyuman Singh*, K.S. Bangarwa, Vinita Bisht and Md. Sarware Alam CCS Haryana Agriculture University Hisar–125004, India
E-mail: *[email protected]
Keywords: Agroforestry, Climate change, Populus deltoides
INTRODUCTION
Agroforestry as alternative land management system addresses many of the global challenges, including deforestation, unsustainable cropping practices, loss of biodiversity, increased risk of climate change, as well as rising hunger, poverty and malnutrition (Garrity, 2004). Intercropping with high density short rotation tree species is the best option to meet increasing food and industrial raw material requirement through sustainable utilization of natural resources (Sarvade et al., 2014). Populus deltoides a fast growing exotic species of poplar, having great potential to meet this demand has successfully been planted in tarai region of Uttranchal, Uttar Pradesh, Jammu and Kashmir, Haryana, Punjab and Himachal Pradesh as pure plantation or in agroforestry system.
It is I
LLEGAL t
o cop
y, pri
nt or
save
any c
onten
t of th
is PDF,
in pa
rt or in
full,
on an
y retr
ieval
syste
m,
withou
t the E
XPRESS WRITTEN PERMISSIO
N of th
e cop
yrigh
t-hold
er

National Conference on Climate Change and Agricultural Production: Adapting Crops to Climate Variability and Uncertainty, 6th–8th April, 2017
[53]
MATERIALS AND METHODS
The present study was conducted during 2015-16 at kailvillage in Yamunanagar district (77º 28' E longitude and 30º 10' N latitude and elevation of Yamunanagar is 255 m (837 ft) above m.s.l). This field of about 5 acre belongs to Kulvir Singh is a progressive nursery grower. Ten cuttings per replication (20-22 cm in length and 1-1.5 cm in thickness) of seven populus deltoides clones obtained from WIMCO seedling Ltd. Rudrapur, Uttrakhand were planted in nursery following spacing of a 60 x 45 cm during fifteen February, 2015. The experiment was laid out in randomized block design with four replications. Uniform fertilizer and irrigations were provided. Weeding and hoeing were done as and when required. The observations on basal diameter (mm) with digital verneer caliper and height (m) with a long graduated bamboo stick were recorded at interval of three months during the year.
RESULTS AND DISCUSSION
Comparative mean performance of basal diameter and height growth recorded in May, August, November and February months are presented in Table1. The growth in both parameters (basal diameter and height) had been completed up to February in all the clones. The differences among clones for basal diameter and height were statistically significant. Basal diameter ranged from 25.72 mm to 36.24 mm in clone Uday and WSL-22, respectively. Four clones obtained from WIMCO namely WSL-22, WSL109, WSL-110 and WSL-81 was found significantly better over general mean (31.71 mm) for basal diameter. G-3,G-48 and Uday performed significantly inferior than the general mean for basal diameter. The mean height ranged from 4.60 m in Uday and 6.11 m in WSL-110 with overall mean 5.57 m. Like basal diameter the overall performance recorded for height of WIMCO clones were found better than the other clones. This experiment was concluded that the performance of WIMCO clones such as WSL-110, WSL-109, WSL-22 and WSL-81 was found much better as compared to G-3, G-48 and Uday.
Table 1: Comparative Growth Performance of Poplar Clones for Height (m) and Basal Diameter (mm) in WIMCO Nursery with 60 × 45 cm Spacing
Clone May (3MAP) August (6 MAP) November (9MAP) February (12 MAP) Height (m) Basal
Diameter (mm)
Height (m) Basal Diameter (mm)
Height (m) Basal Diameter
(mm)
Height (m) Basal Diameter
(mm) G-3 0.56 6.07 1.47 11.78 2.62 17.04 4.63 25.88 G-48 0.61 6.62 1.92 14.51 3.31 22.58 5.85 27.66 Uday 0.50 5.95 1.36 13.63 2.93 19.22 4.60 25.72 WSL-22 0.81 7.86 1.91 13.23 3.96 25.68 6.02 36.24 WSL-109 0.73 7.13 2.43 16.36 3.27 18.79 5.98 35.85 WSL-110 0.83 8.06 2.43 16.36 4.48 26.80 6.11 35.79 WSL-81 0.69 7.40 2.16 15.42 3.88 24.65 5.83 34.82 Mean 0.68 7.01 1.95 14.47 3.49 22.11 5.57 31.71 CD (p=0.05) 0.10 0.98 0.24 1.61 0.24 1.89 0.83 1.49
REFERENCES [1] Garrity D P 2004. Agroforestry and the achievement of the millennium development goals.Agroforestry Systems 61: 5-17. [2] Sarvade S, Mishra H S, Kaushal R, Chaturvedi S, Tewari S and Jadhav T A 2014. Performance of wheat (Triticum aestivum L.) crops
under different spacing of trees and fertility levels. African Journal of Agricultural Research 9 (9): 866-873.
It is I
LLEGAL t
o cop
y, pri
nt or
save
any c
onten
t of th
is PDF,
in pa
rt or in
full,
on an
y retr
ieval
syste
m,
withou
t the E
XPRESS WRITTEN PERMISSIO
N of th
e cop
yrigh
t-hold
er

National Conference on Climate Change and Agricultural Production: Adapting Crops to Climate Variability and Uncertainty, 6th–8th April, 2017
[54]
System of Root Intensification in Mustard: Climate Change Mitigation and Climate Resilience Strategy
Shashank Tyagi*, Sanjay Kumar, M.K. Singh and Sunil Kumar Department of Agronomy, Bihar Agricultural University, Sabour–813210, Bhagalpur, India
E-mail: *[email protected]
Keywords: Root intensification, Mustard, Climate change
INTRODUCTION
System of Root Intensification (SRI) is based on basic principles viz., transplanting of young seedlings (8 days old), avoiding trauma to roots by quick and shallow planting, planting single seedling at wider spacing, use of organics, mechanical weeding and alternate wetting and drying. Yield enhancement in SRI mustard might owe to reduce competition among individuals for light, nutrient, space, water etc. under changing climate. SRI enhances root proliferation which favours to survive under water stress condition and little emission of green house gases from the field of alternate wetting and drying and also from organic manures instead of chemical fertilizers (Adhya et al., 2014). Keeping in view these issues, the present investigation was undertaken to study the yield potentiality and spatial requirement of mustard varieties (Brassica juncea L.) in system of root intensification (SRI) under existing climate change scenario of Bihar.
MATERIALS AND METHODS
A field experiment was conducted during rabi season of 2013-14, 2014-15 and 2015-16 at Bihar Agricultural University farm, Sabour, Bhagalpur, Bihar with the objective to evaluate the yield & yield attributes, root depth and economics of mustard varieties under system of root intensification versus conventional sowing method. Three varieties i.e. Rajendra suflam, pusa bold and Rajendra anukul were put in main plot while different spacing kept as 30×30, 45×45, 60×60 cm on SRI pattern and 30×15 cm as conventional sowing were placed into sub plots. The experiment was laid out in split plot design with three replications.
RESULTS AND DISCUSSION
Length of siliqua, number of siliqua/plant and number of seeds/siliqua were significantly influenced by varieties and spacing of mustard. Rajendra anukul exhibited maximum number of siliqua/plant followed by Rajendra suflam (Table 1). Length of siliqua and number of seeds/siliqua were highest under Rajendra suflam followed by Rajendra anukul. Length of siliqua and number of seeds/siliqua were found maximum under 60×60 cm spacing on SRI pattern and was superior over rest of spacings. Different varieties and spacing caused significant variations in grain yield of mustard. Rajendra suflam exhibited significantly highest grain yield over Rajendra anukul and Pusa bold. It was maximum under 45×45 cm spacing and was significantly superior over rest of the spacings and recorded 26.2% higher grain yield over conventional spacing. Maximum net return was obtained from Rajendra suflam which was significantly higher over rest of the varieties. However, SRI spacing at 45×45 cm apart exhibited maximum net return and was significantly superior over rest of the spacings. The present findings are in agreement with Mirza and Karim (2007). Root depth was not significantly influenced by varieties. However, SRI spacing caused significant variation in root depth which provides tolerance against drought. Conclusion may be drawn that SRI mustard at 45×45 cm apart with Rajendra suflam variety could be best alternative crop adaptation for farm beneficiaries of Bihar in perspective of climate resilient farming for mitigating global warming ill effects.
It is I
LLEGAL t
o cop
y, pri
nt or
save
any c
onten
t of th
is PDF,
in pa
rt or in
full,
on an
y retr
ieval
syste
m,
withou
t the E
XPRESS WRITTEN PERMISSIO
N of th
e cop
yrigh
t-hold
er

National Conference on Climate Change and Agricultural Production: Adapting Crops to Climate Variability and Uncertainty, 6th–8th April, 2017
[55]
Table 1: Effect of Different Treatments on Yield, Yield Attributes, Root Depth and Economics of Mustard (Pooled over Three Years)
Treatment No. of Siliqua/ Plant
No. of Seeds/ Siliqua
Length of Siliqua(cm)
Grain Yield (q/ha)
Root Depth (cm)
Net Return (Rs./ha)
Varieties V1-R.Anukul 361.6 13.8 4.3 14.2 52.0 36925 V2-Pusa bold 338.4 13.4 4.2 13.9 52.7 36253 V3-R.Suflam 356.8 14.1 4.6 14.5 53.3 38895 CD (p=0.05) 14.6 0.3 0.1 0.2 NS 1317 Spacing S1-30×15cm 134.2 11.3 3.9 12.2 42.9 31098 S2-30×30 cm 223.9 13.0 4.2 14.7 54.2 37745 S3-45×45cm 433.3 14.9 4.6 15.4 56.0 42005 S4-60×60cm 617.5 16.0 4.9 14.4 57.6 38582 CD (p=0.05) 14.7 0.5 0.1 0.3 0.9 1552
REFERENCES [1] Adhya T.K., Linquist B, Searchinger T, Wassmann R and Yan X 2014. Wetting and drying: Reducing green house gas emissions and
saving water from rice production. Instalment 8 of ‘Creating a Sustainable Food Future’, World Resources Institute, Working paper pp. 1-28.
[2] Mirza H and Karim M.F. 2007. Performance of rapeseed (Brassica compestris L.) cv. SAU Sarisha-1 under different row spacings and irrigation levels. Research Journal of Agriculture and Biological Sciences 3 (6): 960-965.
Awareness and Adaptations by the Farmers of Keonjhar District under Climate Change Scenario
M. Ray1*, S. Biswasi2, H. Patro1, N. Mishra1 and K.C. Sahoo1 1Gramin Krishi Mausam Sewa,
Regional Research and Technology Transfer Station [RRTT] S-Keonjhar–758001, India 2Regional Research and Technology Transfer Sub Station, Kerei–770073, India
E-mail: *[email protected]
Keywords: Adaptation, Climate change, Constraints, Diversification
INTRODUCTION
Climate change is one of the biggest challenges the world is facing today The climate has changed and the major environmental problem in both crop and livestock production is recurrent droughts, hailstorms, floods, and pest incidence (Befekadu and Berhanu, 2000).Agriculture in India and entire world is mostly dependent on the persisting weather conditions. The various studies show the overall loss in the crop production in the country in the last few years due to the anticipated rise in the temperature. With unpredictable weather, farmers keep changing crop management practices by growing resistant varieties and are prepared for constant change in the farming practices (UNFCCC 1992).Thus, the impacts of climate change are diversified and need to be understood, so as to workout pragmatic strategies to mitigate ill-effects. With this background, this study has been designed to understand perception of farmers on climate change parameters and the influence of climate change on enterprise diversification, farmers’ livelihood in terms of changes in income, employment and food consumption.
MATERIALS AND METHODS
For assessing the issues outlined above, the study was undertaken in Keonjhar district of Odisha state. The mean annual rainfall trend from 1980 to 2014 has been reported as declining, alongside rise in average
It is I
LLEGAL t
o cop
y, pri
nt or
save
any c
onten
t of th
is PDF,
in pa
rt or in
full,
on an
y retr
ieval
syste
m,
withou
t the E
XPRESS WRITTEN PERMISSIO
N of th
e cop
yrigh
t-hold
er

National Conference on Climate Change and Agricultural Production: Adapting Crops to Climate Variability and Uncertainty, 6th–8th April, 2017
[56]
annual temperature by 3.10 C in Keonjhar. Two villages were selected from the project area “Economic Impact of AAS (Agromet Advisory Services) of NCMRWF (National Centre for Medium Range Weather Forecasting)” .The sample procedure used to select the farmers was the purposive sampling. Accordingly, farmers were selected, 20 Agromet Advisory Services (AAS) farmers and another 20 farmers from the adjoining villages who did not receive any services from AAS were selected as control farmers. The collected data were subjected to statistical analysis. Simple descriptive statistics like averages and percentages were used. Tabular presentation was employed for comparison of relevant parameters before and after 2014. Relevancy ranking was used in testing the relevancy of the suggestions made by the farmers in mitigating the ill effects of climate change. The respondents were asked to rate the relevancy on a four point relevancy continuum viz., more important, important, less important, ignored. The ranks assigned for each of the above responses were 4, 3, 2 and 1, respectively. The relevancy coefficient for the ith value/ function was worked out by using the following formula;
Total score of all the respondents for the ith factor RC = ——————————————————————
Total number of continuum respondents
The suggestions were then ranked based on the relevancy coefficient such that the suggestion having the highest relevancy coefficient was ranked first.
RESULTS AND DISCUSSION
The farmers have adapted several coping mechanisms in crop production and soil and water conservation practices in response to changes in climatic parameters (Table 1). Majority of farmers (80% AAS and 45% control) have changed from growing of long duration varieties to short duration varieties. Similarly, a sizable proportion of farmers have changed their cropping pattern that instead of growing paddy alone, they shifted to maize/black gram and vegetable. Majority of farmers, particularly AAS category have started adopting few soil and water conservation practices. Farmers have also changed the spacing, quantity of seeds used, fertilizer application and frequency of irrigation. This finding was complemented with the findings of Nhemachena and Hassan (2007), who have reported that the common adaptation methods in agriculture include use of new crop varieties and livestock species that are better suited to drier conditions, crop diversification, adaptation of mixed crop and livestock farming systems. The adaptation methods also include changing planting dates, using different crop varieties, changing planting and harvesting dates, increased use of water and soil conservation techniques, and diversifying from farm to non–farm activities to cope up with climate change. Similar observations were reported by Gahendar and Dinanath (2008) that the farmers of the Chitwan district of central Nepal have taken up number of adaptations against climate change, they constructed check dams and other infrastructures.
Table 1: Adaptation Measures in Crop Production in Response to Changes in Rainfall and Temperature Adaptation Measures Measure Initiated
AAS Farmers (n=20) Control Farmers (n=20) Crop Production Changed from long duration to short duration varieties
16(80) 9(45)
Changed from sole Paddy to Maize/Black gram 11(55) 8(40) Changed from sole Paddy to Vegetables 7(35) 9(45) Changed planting dates 18(90) 13(65) Soil and water conservation practices Graded bunds 18(90) 10(50) Ridges and furrows 15(75) 3(15) Additional Bore wells 4(20) 1(05)
Note: Figures in paranthses are percentage to total; AAS-Agromet Advisory Services
It is I
LLEGAL t
o cop
y, pri
nt or
save
any c
onten
t of th
is PDF,
in pa
rt or in
full,
on an
y retr
ieval
syste
m,
withou
t the E
XPRESS WRITTEN PERMISSIO
N of th
e cop
yrigh
t-hold
er

National Conference on Climate Change and Agricultural Production: Adapting Crops to Climate Variability and Uncertainty, 6th–8th April, 2017
[57]
REFERENCES [1] Befekadu D. and Berhanu N 2000. Annual Report on the Ethiopian Economy Vol. 1. Ethiopian Economic Association. AddisAbaba,
Ethiopia. [2] Nhemachena C and Hassan R 2007. Micro-level analysis of farmers’ adaptations to climate change in Southern Africa. IFPRI Discussion
Paper No. 00714. International Food Policy Research Institute, Washington, D.C. [3] UNFCCC 1992. United Nations Framework Convention on Climate Change, UK.
Growth and Economic of Bamboo and Forage Crops under Silvipasture System
Asha Puran, M.S. Malik, P.R. Oroan and Abhay Kumar* Faculty of Forestry, Birsa Agricultural University, Kanke, Ranchi–834006, India
E-mail: *[email protected]
Keywords: Bamboo, Forage, Silvipasture, Agroforestry system, Agrobiodiversity
INTRODUCTION
Agroforestry system may potentially provide options for improvement in livelihoods through simultaneous production of food, fodder and firewood as well as ecological benefits such as carbon sequestration, mitigation of climate change, enhancing soil fertility and water use efficiency, biodiversity conservation, biological pest control, sustainable land use, shelterbelt and windbreaks, micro-climate amelioration, breaking the poverty and food insecurity circle (Kumar and Nair, 2011). Silvipastoral land use has been identified as a holistic approach to rehabilitate the degraded lands and wastelands for meeting the demand and supply of multitude of commodities by rural masses and conservation of natural resources (Paroda, 1990).
MATERIALS AND METHODS
The experiment was carried out during 2014-15 in experimental field of Birsa Agricultural University, Ranchi,India.The experiment was carried with Bamboo species (Bambusa vulgaris) under intercropping of annual grasses viz. Sudan grass (Sorghum sudanense), Napier grass (Pennisetum purpureum) andGuinea grass(Megathyrsus maximus) in RBD design with three replications and seven treatment ( T1 Bamboo + Sudan, T2 Bamboo + Napier, T3 Bamboo + Guinea ,T4 bamboo, T5 Sole Sudan, T6 Sole Napier and T7 Sole Guinea). The spacing of Bamboo species was5 x 5 m and the row spacing of forage crops 25 ×25 cm.
RESULTS AND DISCUSSION
The differences between all treatments were highly significant with respect plant height, crude protein content and dry matter yield of grasses.The maximum plant height and forage yield was in T1 and minimum in T6. The level of crude protein percent was highest in silvipastoral system T2 and minimum in T5. In case of dry matter yield, the maximum was in T3. The net return of Bambusa vulgaris and pasture were maximum in treatment T1 (Rs.1, 22,405/ha) and minimum was in T6 (Rs. 11499/ha) Similarly, total return was in T1 (Rs. 150205./ha) and the minimum was observed in T6 (Rs. 27299/ha).
It is I
LLEGAL t
o cop
y, pri
nt or
save
any c
onten
t of th
is PDF,
in pa
rt or in
full,
on an
y retr
ieval
syste
m,
withou
t the E
XPRESS WRITTEN PERMISSIO
N of th
e cop
yrigh
t-hold
er

National Conference on Climate Change and Agricultural Production: Adapting Crops to Climate Variability and Uncertainty, 6th–8th April, 2017
[58]
Table 1: Plant Height, Crude Protein Content, Dry Matter Yield and Forage Yield of Forage Treatment Plant Height(cm) Crude Protein% Dry Matter Yield (qha-1) Forage Yield (qha-1)
T1 232.17 12.6 80.16 432.82 T2 139.68 14.03 81.78 126.48 T3 166.92 12.05 86.96 227.68 T4 No forage crops T5 221.37 11.4 79.63 376.39 T6 133.49 13.23 68.20 121.33 T7 148.50 12.30 84.51 231.84
CD (p=0.05) 12.602 2.029 9.966 20.184
REFERENCES [1] Kumar BM and Nair PKR 2011. Carbon Sequestration potential of agro forestry systems opportunities and challenges. Springer Dordrecht
Heidelberg, London, New York. [2] Paroda R.S. 1990. Silvopstoral approach for wasteland development: present option and future strategy-inaugural address. In:
Silvipastoral system in India (eds. Range Management Society of India), Indian Grassland And Fodder Research Institute, Jhansi. pp: 1-3
Characterization of Stress Tolerant Mungbean Rhizobia as PGPR and Plant Growth Promotion under Abiotic Stress
Hemanta Kumar Mondal*, Shikha Mehta, Harshpreet Kaur and Rajesh Gera Department of Microbiology,
College of Basic Sciences & Humanities, CCS HAU, Hisar–125004, India E-mail: *[email protected]
Keywords: Mungbean, High temperature, Drought tolerance
INTRODUCTION
Mungbean is one of the important kharif legumes grown in arid and hyper-arid zones of India. Abiotic stresses severely affect the growth and nodulation efficiency of mungbean. Inoculation of abiotic stress tolerant rhizobia enhances the nitrogen fixation ability of legumes under stress conditions. Hence, the present investigation was focused on the isolation and characterization of high temperature and drought tolerant strains of mungbean rhizobiafrom hyper-arid zone of Rajasthan. We also analyzed rhizobialPGPR traits under in vitro condition. We evaluated abiotic stress tolerance of rhizobia under axenic condition in Leonard jars and pot-house conditions in different soil moisture regimes.
MATERIALS AND METHODS
Rhizospheric soil and nodule samples from hyper-arid zone of Rajasthan were collected in the year 2015 from four districts Churu, Bikaner, Jaisalmer and Barmer. Isolation of rhizobia from nodulesand in vitroabiotic stress tolerance of rhizobial isolates were performed by standard methods. Different PGPR traits like nitrogen fixation, P solubilization, ACC deaminase activity and bacteriocin production were analyzed by standard methods (Kumar et al., 2014). High temperature tolerance by Leonard jar and pot-house experiments with different soil moisture regimes (100%, 50% and 25% field capacity) were also performed by standard methods. ANOVA techniques were applied to analyze the data using SPSS 22.0.
RESULTS AND CONCLUSION
Total 96 mungbeanrhizobial isolates from different nodules samples were isolated. Out of 96 isolates, 26 isolates showed combined high drought tolerance of 40% concentration of polyethylene glycol (PEG 6000)
It is I
LLEGAL t
o cop
y, pri
nt or
save
any c
onten
t of th
is PDF,
in pa
rt or in
full,
on an
y retr
ieval
syste
m,
withou
t the E
XPRESS WRITTEN PERMISSIO
N of th
e cop
yrigh
t-hold
er

National Conference on Climate Change and Agricultural Production: Adapting Crops to Climate Variability and Uncertainty, 6th–8th April, 2017
[59]
and high temperature tolerance at 45oC. Biochemical characterization further revealed that most of the rhizobial isolates were harboring multiple PGPR traits, i.e. nitrogenase activity (3.60- 56.24 nmol ethylene mg−1 protein h−1), bacteriocin production (28.6%), phosphate solubilization (86.2%) with maximum P solubilization index of 3.50 and ACC deaminase activity (62.07%).Four rhizobial isolates i.e. MuJs10A,MuJs15A, MuJs23B and MuBk20B along with one reference strain (703), commercially used for biofertilizer production were tested for nodulation efficiency and plant growth promotion under high temperature in Leonard jar assemblies and drought experiment in pot-house condition with different soil moisture regimes (100%, 50% and 25% FC). Leonard jar experiment showed the inoculation of two rhizobial isolates MuJs10A& MuJs23B showed significant increase in plant biomass (394.73%, 330.07%) than nonbacterizedcontrol and enhanced fresh nodule massthan reference commercial strain 703. In pot experiment, the rhizobial isolate MuJs10A showed significantly enhanced performance with maximum increase in plant biomass and fresh nodule massthan nonbacterizedcontrol at 25% field capacity. The isolate MuJs10Ashowed as a promising high abiotic stress tolerant rhizobial isolate. Hence it has enormous potential for effective bioinoculant for arid and hyper-arid zone after field trials.
Table 1: Effect of High Temperature on Root, Shoot and Total Dry Matter Yield of Mungbean in Leonard Jars at 60 DAS
Treatment RDM SDM TDM Per cent Increase Control 0.029a 0.106b 0.133a - 703 0.032a 0.123b 0.165b 24.06 MuJs10A 0.238ab 0.440cd 0.658ab 394.73 MuJs15A 0.051b 0.239c 0.226c 69.92 MuJs23B 0.199bc 0.341cd 0.572d 330.07 MuBk20B 0.078b 0.321bc 0.348cd 161.65
Note: RDM-Root dry matter, SDM- Shoot dry matter, TDM-Total dry matter; Values followed by the same letter are not significantly different at p= 0.05 .
REFERENCES [1] Kumar V, Kayasth M, Chaudhary V and Gera R 2014. Diversity of diazotrophs in arid and semi-arid zones of Haryana and evaluation of
their plant growth promoting potential on Bt-cotton and pearl millet. Annals of Microbiology 64: 1301-1313.
Short and Medium Duration Varieties of Pulses and Oil Seeds to Mitigate Monsoon Vagaries in Rainfed Agriculture
D.V. Srinivasa Reddy1*, Sreenath Dixit1, N. Loganandhan1, Manjunath Gowda2, B. Mohan3, S. Sheeba4, B.O. Mallikarjuna5 and M. Anitha6
1KVK Hirehalli-572168, 2KVK Chikkaballapru-563125, 3KVK Namakkal-673001, 4KVK Villupuram-604002, 5KVK Davanagere-577004,
6ICAR-Agricultural Technology Application Research Institute, MRS, Hebbal, Bengaluru–560024, India E-mail: *[email protected]
Keywords: Pigeon pea, Pulse crop, Oil seed crop, Yield
INTRODUCTION
Pulse and oilseed crops are predominantly grown under rainfed conditions. Increasing frequency of rainfall changes leading to early, mid and late season droughts is affecting the production of these crops grown under resource constrained situations. Keeping this in view, NICRA crop intervention module promoted available short and medium duration crop varieties among farmers to ensure sustainable production and income to the pulse and oilseed farmers.
It is I
LLEGAL t
o cop
y, pri
nt or
save
any c
onten
t of th
is PDF,
in pa
rt or in
full,
on an
y retr
ieval
syste
m,
withou
t the E
XPRESS WRITTEN PERMISSIO
N of th
e cop
yrigh
t-hold
er

National Conference on Climate Change and Agricultural Production: Adapting Crops to Climate Variability and Uncertainty, 6th–8th April, 2017
[60]
MATERIALS AND METHODS
The crop intervention module under National Innovations in Climate Resilient Agriculture (NICRA) promoted the available short and medium duration crop varieties with farmers’ participatory research mode at select drought-prone districts of Karnataka and Tamil Nadu under ATARI, Zone VIII during 2011 to 2015 through KVKs. These crop varieties were demonstrated for drought situations through 820 farmers’ field covering an area of 266.5 ha in the districts of Belgavi with variable amount of rainfall ( 333.1 , 235.6 , 505.5 and 343.7 mm during 2011-12, 2012-13, 2014-15 and 2015-16 respectively as against normal rainfall of 538.0 mm), Chikkaballapura (107.5 , 799.9and 827.5 mm during 2011-12 to 2013-14 respectively as against normal rainfall of 740.0 mm), Davanagere ( 368.9 , 699.9 and 786.3 mm during 2012-13 to 2014-15, respectively as against normal rainfall of 648.0 mm), Tumkur ( 779, 824 , 1082 and 1132 mm during 2012-13 to 2015-16 respectively as against normal rainfall of 696.0 mm) of Karnataka and Namakkal (548.3 mm against normal rainfall of 410.0 mm during 2014-15), Villupuram ( 936.5, 957.5, 1158.1and 1095.7 mm during 2011-12 to 2014-15 respectively as against normal rainfall of 1058.0 mm of Tamil Nadu.
RESULTS AND DISCUSSION
Table 1: Performance of Short and Medium Duration Varieties of Pulses and Oilseeds in Rainfed Agriculture
Cro
p
Var
iety
KV
K D
istr
ict
Yea
r
No.
of
Dry
Spel
ls
>10-1
5 D
ays
Dem
onst
rati
ons
(No.
)
Are
a (h
a)
Yie
ld
(kg/
ha)
Yie
ld incr
ease
(%
)
B:C
rat
io
Dem
o
Far
mer
s P
ract
ice
(FP
)
Dem
o
FP
Dem
o
FP
Pigeon pea TS-3R Local Belgavi 2011-13 (Avg. of 2 Years)
5 20 9.5 1152 858 34.2 3.03 2.42
BRG-1 TTB-7 Chikkaballapura 2011-14 (Avg. of 3 Years)
6 100 40 1363 1141 19.4 2.68 2.06
BRG-2 TTB-7 Chikkaballapura 2011-14 (Avg. of 3 Years)
6 83 20.6 1252 1062 17.9 2.58 2.02
BRG-2 Local Tumkur 2011-16 (Avg. of 5 Years)
3 262 47 1188 962 23.8 2.54 1.93
CORG 7 VBN 1 Villupuram 2014-15 12 10 4 731 669 9.30 2.25 2.13 Green gram S-4 Local Belgavi 2011-12 5 6 4 700 500 40.0 2.76 2.40
Co.8 Co.6 Namakkal 2014-15 11 7 5 810 738 9.8 2.64 2.50 VRM (Gg) 1 VBN 1 Villupuram 2012-13 13 20 4 820 630 30.2 1.82 1.50
Horse gram GPM-6 Local Belgavi 2015-16 8 9 0.8 650 475 36.8 2.60 1.90 PHG-9 Local Chikkaballapura 2011-12 3 30 12 972 738 31.7 3.17 2.18 PHG-9 Local Davanagere 2014-15 1 33 13.2 543 239 127.2 2.86 1.78
Black gram Co.6 T.9 Namakkal 2014-15 11 18 37.8 843 718 17.4 3.02 2.67 VBN 5 VBN 2 Villupuram 2011-12 12 14 5.6 465 420 10.7 1.18 1.09 VBN 6 VBN 2 Villupuram 2012-15
(Avg. of 3 Years) 11 70 14 725 637 14.0 1.75 1.58
VBN 7 VBN 2 Villupuram 2014-15 12 20 4 650 623 4.30 1.70 1.67 Bengal gram JG-11 A-I Belgavi 2012-13 and 2014-
15 6 38 14.4 1780 1290 38.2 3.43 3.07
Soybean JS-335 Monetta Belgavi 2011-13 (Avg. of 2 Years)
5 19 10.3 2875 2205 32.0 3.64 3.18
Groundnut KCG-2 JL-24 Chikkaballapura 2011-12 3 20 8 1067 813 31.2 2.83 2.13 ICGV-91114 TMV-2 Davanagere 2012-14
(Avg. of 2 Years) 2 4 1.3 1795 1460 22.9 1.79 1.49
TMV-13 Local Villupuram 2012-15 (Avg. of 3 years)
11 22 6 1172 961 21.5 1.64 1.37
CO.6 Local Villupuram 2014-15 12 5 1 1284 1033 24.3 1.87 1.53 Sesame TMV (Sv) 7 Local Villupuram 2012-13 13 10 4 743 621 19.6 2.40 2.10 Total 820 266.5 Mean ? ? ? ? /
It is I
LLEGAL t
o cop
y, pri
nt or
save
any c
onten
t of th
is PDF,
in pa
rt or in
full,
on an
y retr
ieval
syste
m,
withou
t the E
XPRESS WRITTEN PERMISSIO
N of th
e cop
yrigh
t-hold
er

National Conference on Climate Change and Agricultural Production: Adapting Crops to Climate Variability and Uncertainty, 6th–8th April, 2017
[61]
The loss in yield due to late onset of monsoon or mid-season moisture stress due to frequent dry spells during 2011-2015 was much less in the varieties introduced by the project compare to the local varieties cultivated by the farmers (Table 1). In Karnataka state, the short and medium duration varieties of pigeon pea (TS-3R, BRG-1, BRG-2), horse gram (GPM-6, PHG-9), bengal gram (JG-11), green gram (S-4) and soybean (JS-335) in the districts of Belgavi, Chikkaballapura, Davangere and Tumkur out yielded their local checks by registering an increase of 17.9 to 127.2 per cent in yield and with BCR ranging from 1.79 to 3.64 as compared to farmers practice (BCR ranged from 1.49 to 3.18). In Tamil Nadu state, the short duration and drought tolerant varieties in black gram (CO-6, VBN-5 and VBN6), green gram (CO-8, VRM(Gg)-1 and pigeon pea (CORG-7) have performed superior by recording an increased yield of 4.3 to 30.2 percent in spite of frequent dry spells and deficit rainfall during 2011-2015 in the districts of Namakkal and Villupuram.
Assessment of Vulnerability and Farmers Adaptations to Climate Variability under Krishna River Basin of Andhra Pradesh
N.S. Praveen Kumar1*, Y. Radha1 and K.S.R. Paul2 1Department of Agricultural Economics,
2COC Scheme, Agricultural College, Bapatla–522101, India E-mail: *[email protected]
Keywords: Climate change, Vulnerability index, Krishna river basin
INTRODUCTION
Climate change (CC) will have multi-dimensional effect on mankind in terms of several socio-economic parameters. Among the different sectors, agriculture is the most important sector which will be severely affected by CC. Any scientific study on CC should take into account vulnerabilities of the different regions and then proceed to study its impacts on several sectors. IPCC (2007) defines vulnerability as ‘the degree to which a system is susceptible to, and unable to cope with, adverse effects of climate change, including climate variability and extremes. Vulnerability is a function of the character, magnitude, and rate of climate change and variation to which a system is exposed, its sensitivity, and its adaptive capacity’.Krishna river basin cover major part of the combined state of Andhra Pradesh irrigation of 10 districts within the river basin namely, Anatapur, Kurnool, Prakasam, Guntur, Krishna, Khammam, Nalgonda, Warangal, Mahboobnagar and Rangareddy. Moreover the area is also influenced due to frequent droughts and floods under the command area. Hence, with the above background the present was carried out to assess the vulnerability index and rank the districts under Krishna river basin accordingly and to analyse the farmers adaptability to climate variability.
MATERIALS AND METHODS
Krishna river basin cover major part of the Andhra Pradesh irrigation needs which extends about 76,252 Km2. Guntur district was selected purposively as it has the highest command area covering 39 mandals in the district. Moreover the area is also influenced due to frequent droughts and floods under the command area in the district. Iyengar and Sudarshan (1982) methodology was employed for the development of composite index of vulnerability to CC from multivariate data and it was used to rank the districts in terms of their economic performance. The farmers perceptions and adaptation strategies followed is analyzed by simple tabular analysis.
It is I
LLEGAL t
o cop
y, pri
nt or
save
any c
onten
t of th
is PDF,
in pa
rt or in
full,
on an
y retr
ieval
syste
m,
withou
t the E
XPRESS WRITTEN PERMISSIO
N of th
e cop
yrigh
t-hold
er

National Conference on Climate Change and Agricultural Production: Adapting Crops to Climate Variability and Uncertainty, 6th–8th April, 2017
[62]
RESULTS AND DISCUSSION
The results of the study indicate that out of the 9 districts, Anantapur district occupies rank first in term of vulnerability under all the three components and also overall vulnerability. The second rank is occupied by Ranga Reddy in terms of vulnerability. Warangal district is least vulnerable among the districts of Krishna basinThe study revealed that 59.17 percent of farmers adapted strategies to climate change of which 49.29 percent of farmers adapted to water saving methods followed by crop diversification (22.53%), change to livestock by (15.49%) and off farm activities by 12.67 (%). Lack of information was the major constraint contributing to about 42.86 percent, followed by shortage of labour with 24.49 percent, lack of money with 18.37 percent, poor potential of irrigation with8.16 percent and shortage of land contributing to 6.12 percent.
Table 1: Vulnerability Index and Ranks for Districts under Krishna River Basin Districts Vulnerability index Rank
1 Anantapur 0.614 1 2 Guntur 0.437 6 3 Hyderabad(Ranga Reddy ) 0.510 2 4 Khammam 0.412 7 5 Krishna 0.465 4 6 Kurnool 0.439 5 7 Mahabubnagar 0.481 3
REFERENCES [1] IPCC2007. Climate Change: Impacts, Adaptation and Vulnerability. Contribution of Working Group II to the Fourth Assessment Report of
the Intergovernmental Panel on Climate Change, M.L. Parry, O.F. Canziani, J.P. Palutikof, P.J. van der Linden and C.E. Hanson, Eds., Cambridge University Press, Cambridge, UK, 976 pp.
Farmer’s Awareness about Climate Change and Adaptation Practices: A Study in North Himalayan Region of India
Rupan Raghuvanshi, Mohammad Aslam Ansari* and Amardeep Department of Agricultural Communication, College of Agriculture
GB Pant University of Agriculture and Technology, Pantnagar–263145, India E-mail: *[email protected]
Keywords: Farmers’ awareness, Climate change, Adaption practices, North Himalayan Region
INTRODUCTION
Climate change has emerged as an integral component of global development dialogue and debates. Almost all the nations–developed as well as developing countries–are affected by adverse climatic changes. It presents a serious threat to national (as well as global) food security and sustainable agriculture development. Several global studies have indicated that India is particularly vulnerable to climate change, and is likely to suffer with damage to agriculture, food and water security, human health and cattle populations. Farmers’ awareness about factors leading to climate change is therefore of critical importance as they can undertake adaptation measures to mitigate the losses due to climatic variations. The present study was undertaken to ascertain farmers’ awareness about climate change and find out the adaptation practices followed to mitigate the adverse impact of climate change on farming.
It is I
LLEGAL t
o cop
y, pri
nt or
save
any c
onten
t of th
is PDF,
in pa
rt or in
full,
on an
y retr
ieval
syste
m,
withou
t the E
XPRESS WRITTEN PERMISSIO
N of th
e cop
yrigh
t-hold
er

National Conference on Climate Change and Agricultural Production: Adapting Crops to Climate Variability and Uncertainty, 6th–8th April, 2017
[63]
MATERIALS AND METHODS
The study was conducted in 2015 in Tehri Garhwal district which was selected purposively because National Initiative on Climate Resilient Agriculture (NICRA) of ICAR was implemented through Krishi Vigyan Kendra (KVK), Ranichauri inTehri Garhwal district. It is one of the largest districts in the hill state of Uttarakhand, located at the western boundary of Uttarakhand on the external range of the middle Himalayan mountains. Two villages (Dabri and Kalheth) were purposively selected. The study sample comprised of randomly selected 110 farmers from the two selected villages. Awareness of farmers was studied using a pretested structured interview schedule containing open ended questions. Respondents were personally interviewed by the researcher.
RESULTS AND DISCUSSION
The study findings revealed that all the farmers (100%) were aware of climate change. Further, when asked about the indicators of climate change, 97.25 percent farmers reported ‘irregular, untimely and increases in frequency of extreme rainfall’ as the major indicator of climate change’; and 95 percent told ‘decrease in agriculture productivity’ was its main consequence. When asked about causes of climate changes, 58.18 percent farmers ‘over population’ and ‘factories and industries’ as the major causes of climate change followed by ‘deforestation’ (56.36%), forest fires (52.72%) as other factors. However key adopted practices for mitigating climate change impact was ‘changing crop variety’ as the most important and prevalent practice (71.18%), followed by ‘changing sowing dates’ (61.81%), reducing use of chemicals and fertilisers (50.90%) and ‘changing size of land under crop’ (43.63%). As regards constraints to adaptation practices, 98.18 percent farmers mentioned ‘lack of capital’ as the major constraint followed by ‘lack of access to water’ by 97.27 per cent and ‘lack of information’ by 50.9 percent farmers. Additionally, regarding impact of climate change on agriculture, ‘crop failures’ was mentioned by 80.9 percent farmers followed by ‘crop damage/ reduced yield’ reported by 72.7 percent, and ‘shift/changes in cultivation practices’ by 26.36 percent farmers. Awareness about climate change was positively correlated related with size of land holding, education, social participation, socio-economic status, information seeking behaviour, mass media exposure, decision making ability, economic motivation and scientific orientation of the farmers.Thus, the selected targeted interventions (as under ICAR-NICRA project) have been able to generate high levels of awareness about climate change among the farmers along with knowledge about causes and indicators of climate change. However, the adaptation measures have not been adopted by sufficient number of farmers.
REFERENCES [1] Adebayo A A, Onu J I, Adebayo E F and Anyanwu S O 2012. Farmers’ awareness, vulnerability and adaptation to climate change in
Adamawa State, Nigeria. British Journal of Arts and Social Sciences 9 (11): 104-113. [2] Raghuvanshi Rupan. 2015. A Study on Awareness about Climate Change and Adaptation of Agricultural Practices by Farmers in
Uttarakhand. Unpublished Master’s Thesis, Department of Agriculture Communication, College of Agriculture, G. B. Pant University of Agriculture and Technology, Pantnagar, Uttarakhand.pp 150.
It is I
LLEGAL t
o cop
y, pri
nt or
save
any c
onten
t of th
is PDF,
in pa
rt or in
full,
on an
y retr
ieval
syste
m,
withou
t the E
XPRESS WRITTEN PERMISSIO
N of th
e cop
yrigh
t-hold
er

National Conference on Climate Change and Agricultural Production: Adapting Crops to Climate Variability and Uncertainty, 6th–8th April, 2017
[64]
Effect of Drought Stress on Carbohydrate Content in Drought Tolerant and Susceptible Chickpea Genotypes
Sarita Devi Gupta1* Pratibha Singh1 Manjri2 and Akanksha Singh3
1Department of Agriculture Biochemistry, 2Department of Crop Physiology, 3Department of PMB & GE,
1,2,3Narendra Deva University of Agriculture & Technology, Kumarganj, Faizabad–224229, India E-mail: *[email protected]
Keywords: Drought stress, Chickpea, Genotype, Tolerant, Carbohydrate
INTRODUCTION
Drought stress increased water soluble carbohydrate concentration at flowering stage. Plants usually had the highest carbohydrate levels when grown under drought during vegetative phase and during anthesis. Owing to their solubility they may help plants to survive periods of osmotic stress induced by drought. Tolerant variety accumulated more soluble carbohydrate than the sensitive variety. Mafakheri et al. (2011). Carbohydrate roles as a compatible solute under drought stress and might be a useful marker for selecting more drought tolerant varieties. Changes in carbohydrate, in addition to depending on severity and duration of water deficit, might also reflect genotypic differences in the regulation of carbon metabolism Praxedes et al. (2005). Objective of this research is to assess carbohydrate variation in different drought tolerant and susceptible chickpea genotypes.
MATERIALS AND METHODS
The research was carried out in the rabi season of the year 2013-14 and 2014-15 with thirteen chickpea genotypes in whichseven genotypes (K 850, KWR 108, RSG 888, BG256, BG 362, JG 11 and SAKI 9516) were tolerant and rest (DCP 92-3, JG 315, GCP 105, NDG 54, PUSA 372 and Pant G 186) were susceptible. Thesegenotypes were obtained from the department of Genetics and Plant Breeding of the university (N. D. U. A. & T.) Kumarganj, Faizabad. Total carbohydrate content was determined by Yemme and Wills (1954). One g of dried sample was used for estimation and development of colour was measured on spectronic-20.
RESULTS AND DISCUSSION
Drought stress increased carbohydrate concentration in all drought tolerant chickpea genotypes in comparison to drought susceptible chickpea genotypes. It was estimated that carbohydrate content ranges between 61.51 to 66.64 per cent in the year 2013-14 and 61.44 to 66.53 per cent in the year 2014-15. First year and second year experiment recorded highest carbohydrate content in same genotype in K 850 (66.64%) and K 850 (66.53%), respectively. Analysis of the data indicates that genotypes diferred significant with regard to carbohydrate content in both of the years. Experimental findings revealed that drought tolerant chickpea genotype ‘K 850’ had the maximum carbohydrate content and genotype ‘PUSA 372’ the lowest carbohydrate content. The tolerant genotype accumulated maximum carbohydrate than the sensitive one. Results indicated that severe drought stress increased carbohydrate in drought resistance chickpea. Chickpea (C. arietinum L.) is an agronomically significant plant which has an essential role in the economy and human diet especially in developing countries. Chickpea is successfully grown under conditions which limit growth of other plants. It is especially affected by drought which delays flowering and decreases yield in mediterranean and sub-tropical climates. The aim of this study was to determine the effect of drought on tolerant and
It is I
LLEGAL t
o cop
y, pri
nt or
save
any c
onten
t of th
is PDF,
in pa
rt or in
full,
on an
y retr
ieval
syste
m,
withou
t the E
XPRESS WRITTEN PERMISSIO
N of th
e cop
yrigh
t-hold
er

National Conference on Climate Change and Agricultural Production: Adapting Crops to Climate Variability and Uncertainty, 6th–8th April, 2017
[65]
susceptible chickpea genotypes which can be used to identify chickpea plant tolerance to drought stress. The results show that the varietal differences are significant regarding carbohydrate content and severe drought stress increased carbohydrate content in drought resistance chickpea genotypes.
Table 1: Variation in Carbohydrate Content in Different Genotypes of Tolerant and Susceptible Chickpea Genotypes
Genotype 2013-14 2014-15 K 850 66.64 66.53 KWR 108 66.47 66.40 DCP 92-3 62.87 62.57 RSG 888 66.54 66.43 BG 256 64.86 64.91 BG 362 63.34 63.22 JG 315 63.17 63.10 JG 11 64.80 64.40 SAKI 9516 63.88 63.83 GCP 105 63.21 63.12 NDG 54 61.91 61.86 PUSA 372 61.51 61.44 Pant G 186 62.29 62.31 CD (p=0.05) 0.69 1.24
REFERENCES [1] Mafakheri A, Siosemardeh A, Bahramnejad B, Struik PC and Sohrabi Y 2011. Effect of drought stress and subsequent recovery on
protein, carbohydrate contents, Catalaseand peroxidase activities in three chickpea (Cicer arietinum) cultivars.Australian Journal of Crop Science 5 (10):1255-1260.
[2] Praxedes S C, DaMatta F M, Loureiro M E G, Ferrao M A and Cordeiro A T 2005. Effects of long- term soil drought on photosynthesis and carbohydrate metabolism in mature robusta coffee (Coffea canephora Pierre var. kouillou) leaves. Environmental and Experimental Botany 56: 263-273.
Crucial Reproductive Traits as Indices for Screening Brinjal (Solanum melongena L.) under High Temperature Stress
Shirin Akhtar1*, S.S. Solankey1, Rashmi Kumari1, Nisha Rani1, Randhir Kumar1 and P.K. Singh2 1Department of Horticulture (Vegetable and Floriculture),
2Department of Plant Breeding and Genetics 1,2Bihar Agricultural University, Sabour–813210, Bhagalpur, Bihar
E-mail: *[email protected]
Keywords: Brinjal, Heat tolerance, Reproductive traits, Screening
INTRODUCTION
Brinjal (Solanum melongena L.), one of the major vegetable crops in India has two distinct seasons of brinjal cultivation in northern and eastern plains of India, viz., autumn-winter (August to March) and summer-rainy (March to September) seasons. Autumn-winter is the preferred season with perfect conditions for growth, development and fruiting. However, summer-rainy brinjal has high demand due to premium price, but high temperature, low humidity, strong desiccating winds have marked effect on fruitset (Singh and Kalda, 2000). The optimum temperature for fruitset in brinjal is 18-21°C, and rise in temperature more than 35°C leads to reduced fruitset owing to flower drop in most cultivars (Pandit et al., 2010). Expression of crucial reproductive characters under high temperature is responsible for heat tolerance which is inherent to tolerant
It is I
LLEGAL t
o cop
y, pri
nt or
save
any c
onten
t of th
is PDF,
in pa
rt or in
full,
on an
y retr
ieval
syste
m,
withou
t the E
XPRESS WRITTEN PERMISSIO
N of th
e cop
yrigh
t-hold
er

National Conference on Climate Change and Agricultural Production: Adapting Crops to Climate Variability and Uncertainty, 6th–8th April, 2017
[66]
genotypes. The present investigation aimed to study on different floral and fruitset characters manifested in normal and heat stress condition to identify the crucial characters to be considered for high temperature tolerance in brinjal.
MATERIALS AND METHODS
Twenty six genotypes including commercial varieties and local cultivars were grown in randomised block design in summer-rainy (March end to September) and autumn-winter (August end to March) seasons of 2015-16 with average day/night temperatures being 33.10°C/23.03°C in summer-rainy and 29.43°C/ 17.37°C in autumn-winter respectively. Different observations recorded included days to first flowering, days to 50% flowering, days to first fruitset, ratio of long and medium styled flowers to short and pseudo short flowers, length of long style, pollen viability, pollen germinability, fruit number per plant, average fruit weight, fruit length, fruit girth and yield per plant. Simple linear correlation coefficient was measured for different characters for determining the degree and direction of association among the characters. The direct and indirect effects by path analysis on some important characters were also estimated.
RESULTS AND DISCUSSION
The reproductive traits were highly sensitive to the high temperature stress. Great variability among the genotypes for the different characters and sensitivity to heat stress was observed. Under high temperature stress the pollen viability of the genotypes was significantly reduced, overall mean being 50.34 percent compared to 68.94 percent in main season. This reduced pollen viability might have been a cause of non-setting of fruits. There was increase in the length of long styles which resulted in exertion of stigma to a greater length above the anthers which might have inhibited the pollens from reaching the stigma head. The ratio of long/medium: short/pseudo-short style flowers increased during the summer-rainy season. Since, the long/medium styled flowers only set fruit in brinjal, hence lesser proportion of these flowers hampered fruitset. All these have been reflected in the lesser number of fruits per plant and ultimately the yield per plant, the respective overall mean in autumn-winter being 18.48 per plant and 1554.98g/plant as compared to 7.00/plant and 392.12g/plant respectively in summer-rainy season. The average weight of fruits, fruit length and fruit girth have also shown marked decrease in the summer-rainy season under high temperature stress conditions, overall mean in autumn-winter being respectively 96.37g, 15.6cm and 18.58cm compared to 66.20cm, 9.24cm and 12.25cm respectively in summer-rainy. BRBL-01, BRBL-02, Pusa Purple Cluster and BRBL-04 having respective yields of 1046.38g/plant, 1010.38g/plant, 679.50g/plant and 656.82g/plant in summer-rainy season have performed well under the high temperature stress. Rajendra Baingan-2, VR-2, IBH-2 and Pusa Shyamla have been found to be the most high temperature sensitive genotypes (respective yield in summer being 85.62g/plant, 138.25g/plant, 139.90g/plant and 152.28g/plant).Correlation and path studies revealed that pollen viability and ratio of long/medium: short/pseudo-short style flowers were the most important selection indices for fruitset and fruit yield under high temperature conditions.
REFERENCES [1] Pandit M K, Thapa H, AkhtarS and Hazra P 2010.Evaluation of brinjal genotypes for growth and reproductive characters with seasonal
variation.Journal of Crop and Weed 6 (2): 31-34. [2] Singh N and Kalda T S 2000. Brinjal. In: Text book of vegetables, tuber crops and spices (Eds) S. Thamburaj and N. Singh, ICAR, New
Delhi: 31.
It is I
LLEGAL t
o cop
y, pri
nt or
save
any c
onten
t of th
is PDF,
in pa
rt or in
full,
on an
y retr
ieval
syste
m,
withou
t the E
XPRESS WRITTEN PERMISSIO
N of th
e cop
yrigh
t-hold
er

National Conference on Climate Change and Agricultural Production: Adapting Crops to Climate Variability and Uncertainty, 6th–8th April, 2017
[67]
Effect of High Temperature Stress on Morpho-Biochemical Traits of Tomato Genotypes under Polyhouse Condition
S.S. Solankey1*, Shirin Akhtar1, J.B. Tomar2, Pallavi Neha1,3, Meenakshi Kumari1,4 and Randhir Kumar1
1Department of Horticulture (Vegetables & Floriculture), 2Directorate of Research, 1,2Bihar Agricultural University, Sabour , Bhagalpur–813 210, India
3Department of Division of Post Harvest Technology and Agricultural Engineering, Indian Institute of Horticultural Research, Hessaraghatta-560 089, India
4Department of Vegetable Science, Chandra Shekhar Azad University of Agriculture & Technology, Kanpur–208 002, India
E-mail: *[email protected]
Keywords: Heat stress, Tomato, Genotypes, Morphological traits, Biochemical traits
INTRODUCTION
Tomato (Solanum lycopersicum L.) is an important vegetable crop in most regions of the world. Lack of tolerance to high temperature in most tomato cultivars presents a major limitation for growers. The optimum temperature for tomato cultivation is from 25 to 30°C during the day and 20°C at night (Carvalho et al., 2011). Heat stress adversely affects the vegetative and reproductive stages of tomato and ultimately reduces yield and fruit quality (Solankey et al., 2015).Increase in optimal temperature up to 2 to 4°C adversely affects gamete development and inhibits ability of pollinated flowers to develop into seeded fruit, resulting in reduced yield. Therefore, considering the present need, the study wasunder taken to compare genotypic differences inrespect of different yield contributing characters under high temperature condition for selectingsuperior heat tolerant genotypes of tomatoessuitable for summer season.
MATERIALS AND METHODS
The experimental material used in thestudies was comprised forty six tomato genotypes including two wild species (S. peruvianum and S.chilense) and six check varieties (Arka Vikas, Arka Meghali, Kashi Vishesh, Pusa Rohini) collected from various research institutes of India were evaluated under polyhouse condition during summer season, 2014-15 for their heat tolerance. The transplanting of 26 days old seedlings were done in the 3rd week of April. The nursery of each genotype was transplanted in the raised bed of polyhouse. The seedlings were planted in rows having 20-plants per row keeping row to row and plant to plant distances of 60 cm and 40 cm, respectively. The data were taken from the middle 5 plants leaving plants on either ends of the row to avoid the border effects. Normal agronomic and plant protection measures were adopted to obtain healthy plants. The measurements of different morphological and biochemical parameters viz., number of fruits per plant, average fruit weight (g), fruit yield per plant (g), pollen viability (%), T.S.S. content (%), lycopene and total carotenoids content (mg/ 100g) were taken during the month of June-July when averagetemperature inside the polyhouse was 42 – 46oC. However, the maximum and minimum temperature during cropping season was 48.1°C (inside temperature), 44.9°C (outside temperature), 29.4 0C (inside temperature) and 25.1°C (outside temperature), respectively.
It is I
LLEGAL t
o cop
y, pri
nt or
save
any c
onten
t of th
is PDF,
in pa
rt or in
full,
on an
y retr
ieval
syste
m,
withou
t the E
XPRESS WRITTEN PERMISSIO
N of th
e cop
yrigh
t-hold
er

National Conference on Climate Change and Agricultural Production: Adapting Crops to Climate Variability and Uncertainty, 6th–8th April, 2017
[68]
RESULTS AND DISCUSSION
The findings indicate that the number of fruits per plant were higher in the genotypes viz., Sun Cherry, VRT 101 A, CH-155, CLN B, CLN-1621 L, Selection-18, EC 362948, S. peruvianum, CLN R and Azad T-6 performed better however, higher fruit yield per plant (g) were observed in the genotypes i.e. CLN-1621 L, Selection-18, Sun Cherry, NDT-3, S. peruvianum, EC 620571, CH-155, S. chilense, Indam-1006, CLN R and Arka Vikas. Moreover, pollen viability (%) was higher in the genotypes such as, CLN B, Sun Cherry, Sel-18, Kalyanpur Type-1 and EC 520077. On the basis of biochemical analysis it has been observed that the genotypes, Sel-18, Sun Cherry, VRT 101 A, CH-155, EC-13580 were better for T.S.S. content (%) moreover, the genotypes, CLN R, CH-155, VRT 101 A, EC-520046, Azad T – 5 perform better for lycopene and total carotenoids content (mg/ 100g). The correlation studies indicated that number of fruits per plant and average fruit weight were the major yield contributing traits for tomato under heat stress condition. These better performing genotypes especially, CLN-1621 L, Selection-18, Sun Cherry, NDT-3 and S. peruvianum,can be a better donor for future hybrid breeding programme of tomato during summer season for heat tolerance.
REFERENCES [1] Carvalho R.F, Takaki M, and Azevedo R A 2011. Plant pigments: the many faces of light perception. Acta Physiologia Plantarum 33:
241–248. [2] Solankey S S, Singh R K, Baranwal D K, and Singh D K 2015. Genetic expression of tomato for heat and drought stress tolerance: an
overview. International Journal of Vegetable Science 21 (5): 496–515.
Climate Change and its Impact on Food Quality
Mudasir Ahmad Bhat Sher-e-Kashmir University of Agricultural Science and Technology Shalimar, Srinagar–190001, India
E-mail: [email protected]
Keywords: Climate change, Food quality, Mycotoxins, Adaptation andmitigations.
Human activities have changed the composition of the earth’s atmosphere resulting in rising global temperatures and sea levels. Continuation of GHG’s emission will increase temperature from 1.1-5.4 oC by 2100 (IPCC, 2007). The higher temperatures reduce net carbon gain by increasing plant respiration more than photosynthesis (Barnabás et al., 2008).Temperature increase and the effects of greenhouse gases are among the most important issues associated with climate change. The production and quality of fresh fruit and vegetable crops can be directly and indirectly affected by high temperatures and exposure to elevated levels of carbon dioxide and ozone (Sage and Kubien, 2007). The increase in temperature affects photosynthesis directly, causing alterations in sugars, organic acids, flavonoid contents, firmness and antioxidant activity (Wang and Zheng, 2001). High concentrations of atmospheric ozone can potentially cause reduction in the photosynthetic process, growth and biomass accumulation. The attack of toxigenic fungi on crops and products has the potential of creating great risk. Mycotoxins are climate dependent, also influenced by non-infectious factors (e.g. bioavailability of (micro) nutrients, insect damage, and other pests attack), that are in turn driven by climatic conditions. Climate represents the key agro-ecosystem driving force of fungal colonization and mycotoxin production (Magan, et al., 2003). The main thrust is on the effect of different climatic factors on the quality attributes of the food. Adaptation is needed to reduce adverse impacts of climate change but it also should focus on exploiting possible opportunities via technological, institutional and societal innovations (IPCC, 2007). In agriculture adaptation strategies are strongly linked to mitigation strategies, both should be evaluated in coherence and not in isolation.
It is I
LLEGAL t
o cop
y, pri
nt or
save
any c
onten
t of th
is PDF,
in pa
rt or in
full,
on an
y retr
ieval
syste
m,
withou
t the E
XPRESS WRITTEN PERMISSIO
N of th
e cop
yrigh
t-hold
er
National Conference on Climate Change and Agricultural Production: Adapting Crops to Climate Variability and Uncertainty, 6th–8th April, 2017
[69]
REFERENCES [1] Barnabas B, Järgen Kand Feher A 2008. The effect of drought and heat stress on reproductive processes in cereals.Plant, Cell and
Environment 31: 11–38. [2] IPCC (2007). Climate Change 2007: Mitigation of Climate Change. Contribution of Working Group III to the Fourth Assessment Report of
the Intergovernmental Panel on Climate Change, Cambridge University Press, New York. [3] Magan N, Hope R, Cairns V and Aldred D 2003. Post-harvest fungal ecology: Impact of fungal growth and mycotoxin accumulation in
stored grain. European Journal of Plant Pathology 109:723–730 [4] Sage R F and Kubien D 2007. The temperature response of C3 and C4 photosynthesis.Plant, Cell and Environment30: 1086–1106. [5] Wang S Y and Zheng W 2001. Effect of plant growth temperature on antioxidant capacity in strawberry.Journal of Agricultural Food
Chemistry 49 4977–4982.
Genetic Variability of Chickpea Genotypes under Heat Stress Condition: Character Association and Path Coefficient based Analysis
Sanjay Kumar1*, Anand Kumar1, Anil Kumar1, Ravi Ranjan Kumar2 and Tejashwini Agrawal1 1Department of Plant Breeding and Genetics,
2Department of Molecular Biology and Genetic Engineering, 1,2Bihar Agricultural University, Sabour, Bhagalpur–813210, India
E-mail: *[email protected]
Keywords: Chickpea, Correlation, Heat tolerance, Path coefficient
INTRODUCTION
Chickpea is a cool season food legume and incurs heavy yield losses when exposed to high temperatures (≥35°C) at reproductive stage. Heat stress is increasingly becoming a major constraint to chickpea production in India because, increase in area under late sown conditions due to increasing cropping intensity or late maturity of rainy season crop, and expected increase in overall temperatures due to climate change. (Gaur et al, 2008 and Gowda et al, 2009). By 2050, a rise in temperature by at least 20C, particularly the night temperatures, is being predicted with higher levels of warming in northern parts of India. Predicted climate change, particularly high temperature will reduce grain yield in chickpea. For example, the yield of chickpea declined by up to 301 kg/ha per 1˚C increase in mean seasonal temperature in India (Karla et al. 2010). Therefore, development of heat tolerant genotypes is essential for chickpea variety under heat stress condition in resilient to climate change and enhance opportunities for expanding chickpea cultivation to new niches.
MATERIALS AND METHODS
The experimental material consisted of twenty nine chickpea genotypes (procured from ICRISAT) were sown on 15th December 2015 at Pulse Research farm, Bhitti, Bihar Agricultural University, Sabour (Bhagalpur). The experiment was laid out in a randomized complete block design with three replications during Rabi 2015-16 under All India Coordinated Research Project on Chickpea. The plot size was 4.0 x 1.2 m = 4.8 m2, with 1 row of 4 m length. Data were recorded on eight quantitative traits and subjected to statistical analysis to work out genotypic (GCV) and phenotypic (PCV) coefficients of variation (Burton, 1952), heritability (Hanson et al., 1956) and genetic advance as per cent of mean (Johnson et al., 1955) as per standard methods. The genotypic and phenotypic correlation coefficients were computed using genotypic and phenotypic variances and co-variances (Al. Jibouri et al., 1958). The path coefficient analysis was done according to the method by Dewey and Lu (1959).
It is I
LLEGAL t
o cop
y, pri
nt or
save
any c
onten
t of th
is PDF,
in pa
rt or in
full,
on an
y retr
ieval
syste
m,
withou
t the E
XPRESS WRITTEN PERMISSIO
N of th
e cop
yrigh
t-hold
er

National Conference on Climate Change and Agricultural Production: Adapting Crops to Climate Variability and Uncertainty, 6th–8th April, 2017
[70]
RESULTS AND DISCUSSION
The analysis of variance revealed the significant differences among the genotypes for all the traits indicating presence of sufficient variability among the genotypes for various traits. The high GCV and PCV were observed for disease reaction to wilt, number of pods per plant, 100-seed weight and grain yield. High heritability with high genetic advance as percentage of mean was noticed for number of pods per plant, 100-seed weight and disease reaction to wilt. Seed yield per plant was positively and significantly correlated with plant stand at harvest and number of pods per plant while highly significantly and negatively correlated with disease reaction to wilt indicating that these three traits were main yield attributing traits. The Path analysis (Table-1) revealed that the plant stand at harvest and number of pods per plant had maximum direct effect on seed yield Talebi et al. (2007) and Babbar et al. (2012). On the basis of seed yield Phule G-13110 (2080kg/ha), RKG 11-155(2038kg/ha), PBC 501(1920kg/ha) and CSJ (1907kg/ha) were identified as promising heat tolerant genotypes. The potential for indirect selection for heat stress tolerance using these associated characters may be useful to the breeder to formulate appropriate breeding plans for selection of the genotype which tolerate high temperature conditions.
Table 1: Direct and Indirect Phenotypic Effect of Different Characters towards Seed Yield in Chickpea
SI.
No
.
Cha
ract
ers
Day
s to
5
0%
Fl
ower
ing
Day
s to
M
atur
ity
Pla
nt
Hei
ght
(cm
)
No.
of
Pod
s pe
r P
lant
Dis
ease
R
eact
ion
to
Wil
t (%
)
Pla
nt
Sta
nd a
t H
arve
st
(%)
10
0-S
eed
Wei
ght
(g)
Cor
rela
tion
w
ith
See
d
Yie
ld /
Plo
t
1. Days to 50% flowering
0.0772 0.0479 0.0155 0.0047 0.0115 -0.0078 0.0180 -0.1525
2. Days to maturity -0.0925 -0.1490 -0.0236 -0.0008 -0.0298 0.0015 -0.0251 -0.22788* 3. Plant height(cm) -0.0200 -0.0157 -0.0995 0.0257 -0.0157 0.0201 -0.0388 -0.1860 4. No. of Pods per
Plant -0.0134 -0.0011 0.0563 0.2176 0.0235 -0.0092 0.0347 0.1189*
5. Disease reaction to Wilt (%)
-0.0775 -0.1045 -0.0825 0.0565 -0.5223 -0.0080 -0.0827 -0.5324**
6. Plant stand at harvest (%)
-0.0220 -0.0023 -0.0450 0.0095 0.0034 0.2232 0.0022 0.2198*
7. 100-seed weight(g)
-0.0043 -0.0031 -0.0072 0.0030 -0.0029 -0.0002 -0.0186 -0.1103
The residual effect = 0.7773; *, ** Significant at 5% and 1% levels of significance, respectively.
REFERENCES [1] Gowda CLL, Parthasarathy Rao P, Tripathy S, Gaur PM and Deshmukh RB 2009. Regional shift in chickpea production in India. In:
Masood Ali, Shiv Kumar (eds). Milestones in Food Legumes Research.Indian Institute of Pulses Research, Kanpur, India. pp 21-35. [2] Gaur PM, Kumar J, Gowda CLL, Pande S, Siddique KHM, Khan TN, Warkentin TD, Chaturvedi SK, Than AM and Ketema D 2008.
Breeding chickpea for early phenology: perspectives, progress and prospects. In: Kharkwal MC (ed) Food Legumes for Nutritional Security and Sustainable Agriculture, Vol. 2, New Delhi,India: Indian Society of genetics and Plant Breeding. pp. 39-48.
It is I
LLEGAL t
o cop
y, pri
nt or
save
any c
onten
t of th
is PDF,
in pa
rt or in
full,
on an
y retr
ieval
syste
m,
withou
t the E
XPRESS WRITTEN PERMISSIO
N of th
e cop
yrigh
t-hold
er

National Conference on Climate Change and Agricultural Production: Adapting Crops to Climate Variability and Uncertainty, 6th–8th April, 2017
[71]
Exploration of Potential of Indigenous and Exotic Lentil (Lens culinaris Medik.) Genotypes for Yield and Earliness
with Respect to Climate Resilient
Anjali Kumari1, Anil Kumar1*, Sanjay Kumar1, Anand Kumar1, Ravi Ranjan Kumar2 and P.K. Singh1
1Department of Plant Breeding and Genetics, 2Department of Molecular Biology and Genetic Engineering,
1,2Bihar Agricultural University, Sabour–813210, India E-mail: *[email protected]
Keywords: Lentil, Genetic variability, Correlation coefficient, Path coefficient analysis.
INTRODUCTION
Heat stress at reproductive stage causes heavy loss in grain yield of lentil. Therefore, in coming years, high temperature can be an important constraint in lentil production, if night temperature rises by at least 2 °C. Due to this in India, northern part can have higher levels of warming by 2050, while its central and north-eastern parts now have about 11.7 mha as fallow after late harvest of rice and delayed sowing of lentil in these areas encounters force maturity due to high temperature (Subbarao et al., 2001). Thus, heat tolerant cultivars can provide not only an opportunity of horizontal expansion of lentil cultivation in rice-fallow lands of Bihar but also can help to increase lentil productivity by minimizing the yield losses occurring due to forced maturity. It can be visualized that the increases in temperature will have more adverse effects on lentil crops (Kumar et al., 2016). Therefore, identification of heat tolerant genotypes in available germplasm and their utilization can help to tackle situation of terminal heat stress through the development of heat tolerant cultivars.
MATERIALS AND METHODS
The experiment was conducted during Rabi, 2015-16 at the Pulse Research farm, Bhitti, Bihar Agricultural University, Sabour, ), Bihar, India to assess the genetic variability and interrelationship and path coefficient analysis among the important fifteen characters in relation to seed yield in forty nine genotypes of lentil including with four checks viz., HUL-57, Arun, Noori and KLS-218 in a simple lattice design with two replications. All the genotypes were grown in 4 rows of 4 m length with distance of 30 cm between rows and 10 cm between plants.Standard statistical procedure were used for the analysis of variance, GCV and PCV , heritability , genetic advance, genotypic and phenotypic correlation coefficients and path coefficient analysis .
RESULTS AND DISCUSSION
The analysis of variance revealed the significant differences among the genotypes for all the traits, except number of primary branches per plant indicating presence of sufficient variability among the genotypes for various traits. Seed yield per plant exhibited positive and highly significant correlations with number of pods per plant, biological yield per plant and plant height while, negative and highly significant association with days to 1st flowering, days to 50% flowering and days to maturity. Path coefficient analysis revealed that harvest index showed maximum and positive direct effect on seed yield followed by biological yield per plant, number of pods per plant and number of primary branches per plant. Thus present study revealed that harvest index was the most positive direct contributor towards grain yield followed by biological yield per
It is I
LLEGAL t
o cop
y, pri
nt or
save
any c
onten
t of th
is PDF,
in pa
rt or in
full,
on an
y retr
ieval
syste
m,
withou
t the E
XPRESS WRITTEN PERMISSIO
N of th
e cop
yrigh
t-hold
er

National Conference on Climate Change and Agricultural Production: Adapting Crops to Climate Variability and Uncertainty, 6th–8th April, 2017
[72]
plant, number of pods per plant and number of primary branches per plant. Hence these traits could be used for the improvement of seed yield resulting in the development of high yielding varieties of lentil under heat stress condition. On the basis of grain yield and its attributing traits genotypes GP 2961, PL-234 and LKH-2 were identified as promising heat tolerant genotypes of lentil.
REFERENCE [1] Kumar J, Kant R, Kumar S, Basu P S, Sarker A, and Singh N P 2016. Heat tolerance in lentil under field conditions.Legume Genomics
and Genetics 7 (1): 1-11.
Photosynthetic Activity and Yield Improvement of Wheat under Terminal Heat Stress through Foliar Applied Synthetic Compounds in Eastern Gangetic Plains of Bihar, India
Asheesh Churasiya*, Arnab Roy Chowdhury, R.P. Sharma, Mainak Ghosh, Manohar Lal, Awadhesh Pal, Shivasankar Acharya, S.K. Dutta and Durgesh Singh
Department of Agronomy, Bihar Agricultural University, Sabour–813210, Bhagalpur, India E-mail: *[email protected]
Keywords: Heat stress, Net photosynthesis, Yield and Wheat.
INTRODUCTION
Wheat often faces terminal heat stress in Eastern Gangetic Plains due to late sowing, leading to abrupt rise in temperature beyond 20° C during anthesis and grain filling stages (Tewolde et al., 2006). Consequently, photosynthetic activity of flag leaf reduces causing reduction in grain yield. Synthetic compounds like potassium nitrate, calcium chloride, glycine betaine and arginine have beneficial effect on yield of wheat when applied exogenously during the period of high temperature stress mainly through protection of chlorophyll content in leaves and thereby maintaining net photosynthesis. Therefore, an attempt was made to quantify the effect of the synthetic compounds on leaf photosynthesis and crop productivity of wheat cultivars growing under late sown irrigated condition and facing high temperature stress.
MATERIALS AND METHODS
A field experiment was conducted at Bihar Agricultural University, Sabour, during the rabiseason of 2014-15, in a split-plot design, by taking two varieties of wheat DBW-14 and K 307 in main plot, sown on 20th December, 2014 and 14 treatments in sub plot, replicated thrice. The subplots include spraying of [email protected]%, [email protected]%, glycine betaine@100 mM and [email protected] each either at booting or anthesis stage and spray of [email protected]%, [email protected]%, glycine betaine@50 mM and [email protected], both at booting and anthesis stages, along with foliar spray of water both at heading & anthesis stages and no foliar spray as control. Net photosynthetic rate (µmol CO2 m-2 s-1) was measured by portable photosynthesis system (LI-6400XT) during grain-filling stage from flag leaves of each plot and final grain yield was estimated from the net plot harvested.
It is I
LLEGAL t
o cop
y, pri
nt or
save
any c
onten
t of th
is PDF,
in pa
rt or in
full,
on an
y retr
ieval
syste
m,
withou
t the E
XPRESS WRITTEN PERMISSIO
N of th
e cop
yrigh
t-hold
er

National Conference on Climate Change and Agricultural Production: Adapting Crops to Climate Variability and Uncertainty, 6th–8th April, 2017
[73]
RESULTS AND DISCUSSION
Foliar spray of [email protected]% both at booting and anthesis stage maintained maximum net photosynthetic rate in flag leaves of wheat during the grain-filling stage and led to highest grain yield in both thevarieties. The effect was significant in DBW-14 when compared with no spray, whereas in K-307 the treatment could not produce significant impact. The treatments received a single spray of 1.0% KNO3 or 0.2% CaCl2 only at anthesis stage and two foliar spray of 0.1% Cacl2 both at booting and anthesis stage were statisticallyatpar in terms of net photosynthesis and grain yield, when compared with the treatment which has maximized these parameters (Table-1). NO3
- ions delays abscisic acid synthesis and promotes cytokinin activity in leaves of cereals which maintains the normal physiological activity of flag leaf even under stressful situation and might have contributed towards higher grain yield with KNO3. Significantly higher net photosynthetic rate in flag leaf under these treatments over no spray also supports that KNO3 protects photosynthetic apparatus of leaves against high temperature stress. Besides, K+ ion also might have playedbeneficial role in carbohydrate redistribution and starch synthesis in storage organs. Therefore, a single foliar spray of 1.0% KNO3 or 0.2% Cacl2 at anthesis stage can improve yield of late sown wheat, facing terminal heat stress, through maintaining optimum net photosynthesis in flag leaf.
Table 1: Grain Yield (qha-1) and Net Photosynthetic Rate (µmol CO2 m-2 s-1) of Late Sown Wheat as Affected by Foliar Spray of Synthetic Compounds
Sub Plots Grain Yield (qha-1) Net Photosynthetic Rate (µmol CO2 m-2 s-1) Variety Mean Variety Mean
DBW14 K307 DBW14 K307 No Spray 31.51 29.92 30.72 10.17 9.60 9.88 KNO3 Spray @1.0% at B 34.13 29.97 32.05 14.40 11.03 12.72 KNO3 Spray @1.0% at A 36.52 30.63 33.58 17.63 13.73 15.68 KNO3 Spray @ 0.5% each at B + A 36.96 31.23 34.10 18.60 13.23 15.92 CaCl2 Spray @0.2% at B 32.57 30.48 31.53 13.13 10.97 12.05 CaCl2 Spray @0.2% at A 36.20 31.04 33.62 16.60 13.47 15.03 CaCl2 Spray @ 0.1% each at B + A 36.22 31.73 33.97 16.61 13.60 15.10 GB Spray @ 100mM at B 34.08 27.42 30.75 11.00 9.97 10.48 GB Spray @ 100mM at A 34.11 28.71 31.41 10.87 10.63 10.75 GB Spray @ 100mM each at B + A 34.10 29.17 31.64 11.03 10.43 10.73 Arg. Spray@ 2.5mM at B 34.04 27.94 30.99 10.33 10.36 10.34 Arg. Spray@ 2.5mM at A 34.08 29.44 31.76 10.90 10.80 10.85 Arg. Spray@ 2.5mM each at B + A 33.39 31.17 32.28 11.03 10.77 10.90 Water Spray at H + A 31.69 30.82 31.25 10.40 10.23 10.32 Mean 34.26 29.98 - 13.05 11.34 - C.D. (P=0.05) Variety 1.56 NS Foliar spray 1.80 1.63 Interaction 2.54 2.31
B=Booting stage; A= Anthesis stage; H= Heading stage; GB= Glycine betaine; Arg.= Arginine mM= Millimolar
REFERENCES [1] Tewolde H, Fernandez CJ and Erickson CA 2006. Wheat cultivars adapted to post-heading high temperature stress. Journal of Agronomy
and Crop Science 192: 111-120.
It is I
LLEGAL t
o cop
y, pri
nt or
save
any c
onten
t of th
is PDF,
in pa
rt or in
full,
on an
y retr
ieval
syste
m,
withou
t the E
XPRESS WRITTEN PERMISSIO
N of th
e cop
yrigh
t-hold
er

National Conference on Climate Change and Agricultural Production: Adapting Crops to Climate Variability and Uncertainty, 6th–8th April, 2017
[74]
Effects of Climate Change on Vegetable Production: Ways forward for Resilience and Mitigation with Special Reference to Eastern India
Vishal Tripathi1*, C.K. Panda2, S.R. Singh3 and A.K. Jha2 1Department of Soil Science & Agricultural Chemistry, 2Department of Extension Education
1,2Bihar Agricultural College, Sabour, Bhagalpur–813210, India E-mail: *[email protected]
Keywords: Climate change, Vegetable production, Salt stress
Climate change may refer to a change in average weather conditions, or in the time variation of weather around longer-term average conditions. The mean annual temperature of India is increased by 0.460C over a period of last 111 years since 1901 (24.230 C) to 2012 (24.690 C) (Kondinya et al., 2013). Climate change will influence the severity of environmental stress imposed on vegetable crops and agriculture as whole, consequently affecting the world’s food supply, as vegetable is set to eventually in the national economy by producing 171 million tonnes during the year 2014-15. More erratic rainfall pattern and unpredicted high temperature spell shall affect the productivity of vegetable crops viz. tomato, cauliflower, pepper etc. influence survival and distribution of pest population, hasten nutrient mineralization in soils, decrease fertilizer use efficiency and increase evapo-transpiration with reduced water use efficiency. Fluctuation in daily maximum and minimum temperature causes significant losses in tomato productivity. In pepper, high post-pollination temperatures inhibited fruit set, while in beans delays flowering. In cucurbits, temperature fluctuations delay the ripening of fruits and reduce the sweetness. Water stress condition will affect in shallow rooted crops viz. onion, tomato etc; adversely affects the germination of seeds in vegetable crops like onion and okra and sprouting of tubers in potato. Plant sensitivity to salt stress is reflected in loss of turgor, growth reduction, wilting, leaf curling and epinasty, leaf abscission, decreased photosynthesis, respiratory changes, loss of cellular integrity, tissue necrosis, and potentially death of the plant. National Agricultural Research System during the last few decades developed stress tolerant varieties and continue breeding of crop varieties. Recently, Indian Institute of Vegetable Research (IIVR), Varanasi screened 250 genotypes and 30 lines of tomato in which EC-538380, CLN-2026, CLN-1621, EC-620419, and EC-620419 grow better under high temperature stress, while EC- 625659 and EC-538404 are yielding in low moisture deficit condition. Grafting has been used primarily to control soil borne diseases. However, it can also provide tolerance to soil related environmental stresses viz. grafting of tomato on egg plant rootstock for flood sensitive tomato crop is also developed. Plastic low tunnel technology protects the crop from adverse climate along with crop advancement from 20-30 days earlier. Use of improved vegetable varieties, change in sowing and planting dates, growing of short duration varieties, green manuring, use of vermicompost and use of water-efficient technology (micro irrigation) viz. sprinkler/drip irrigation are also other means for mitigation. So, there is a need for systematic review of research works further more in this regards to identify existing technologies available and research gap till exist for eastern India for resilience and mitigation of climate change effect on vegetable cultivation.
REFERENCES [1] Kondinya A, Sidhya Pand Pandit M.K. 2014. Impact of Climate Change on Vegetable Cultivation-A Review. International Journal of
Agriculture, Environment & Biotechnology 7 (1): 145-155. [2] Singh, H.P., Singh, J.P. and Lal, S.S. 2010. Challenges of Climate Change: Indian Horticulture. New Delhi: Westville Publishing House.
It is I
LLEGAL t
o cop
y, pri
nt or
save
any c
onten
t of th
is PDF,
in pa
rt or in
full,
on an
y retr
ieval
syste
m,
withou
t the E
XPRESS WRITTEN PERMISSIO
N of th
e cop
yrigh
t-hold
er

National Conference on Climate Change and Agricultural Production: Adapting Crops to Climate Variability and Uncertainty, 6th–8th April, 2017
[75]
Evaluation of Genetic Variability and Identification of Micronutrients Rich Recombinant Inbred Lines in Mungbean
[Vigna radiata (L.) Wilczek]
Kritika, Rajesh Yadav and Sunayana* Pulses Section, Department of Genetics and Plant Breeding, CCS Haryana Agricultural University, Hisar–125004, India
E-mail: *[email protected]
Keywords: Micronutrient, Mungbean, Genetic variability
INTRODUCTION
Legumes are among the world’s most important crops, second only to cereals. It is the fourth most important pulse crop of India after chick pea, pigeon pea and black gram. Micronutrient malnutrition is recognized as a massive and rapidly growing public health issue especially among poor people. In that context, mungbean is a very good option as it is an excellent and cheap source of high-quality dietary protein, carbohydrates, folate and micronutrients. Micronutrients, zinc and iron, are important for their requirement in maintaining metabolic regulation and organ functioning. The objective of this study is to assess the genetic variability among 70 mungbean Recombinant Inbred Lines (RILs) grown in untreated and treated (ZnSO4 and FeSO4) environments and to identify high micronutrient (Zn and Fe) content RILs.
MATERIALS AND METHODS
The field experiment was carried out in Kharif 2015 at the Pulses Research Area of Department of Genetics and Plant Breeding, CCSHAU, Hisar with 70 mungbean recombinant inbred lines (RILs) in F6 generation, their two parents (ML 776 and MH 2-15) and three popular cultivated varieties of mungbean as yield checks (MH 125, MH 421 and MH 318). The experiment was conducted in two sets: untreated [recommended doses of fertilizer (RDF) only] and treated [RDF + 25 kg/ha ZnSO4 as basal dose + 0.5% solution of FeSO4 as foliar spray at flowering stage] environments. Both the sets of the experiment were laid out in RBD with three replications with a plot size of 2 rows × 2 m and row to row distance was kept 30 cm and plant to plant distance 10 cm. The investigation was conducted to evaluate mungbean genotypes for morphological traits, seed yield and micronutrients content. Zinc and iron content in seed samples was estimated by Benton-Jones (1989) Atomic Absorption Spectrophotometer (AAS) analysis. The data collected on different traits was subjected to analysis of variance [Fisher, 1930], correlation coefficient [Al-Jibouri et al., 1958], coefficient of variation [Burton and Devane, 1953], heritability [Hanson et al., 1956] and genetic advance [Johnson et al., 1955].
RESULTS AND DISCUSSION
The present study in mungbean revealed high degree of variability among the genotypes for all the characters except harvest index. High GCV and PCV were observed for number of branches per plant, seed yield per plot, biological yield per plot, reaction to MYMV, zinc and iron content in seeds. High heritability estimates coupled with high genetic advance were recorded for plant height, number of branches per plant, number of pods per plant, seed and biological yield per plot, reaction to MYMV, zinc and iron content in seeds. Number of branches per plant, seed and biological yield per plot, reaction to MYMV, zinc and iron content in seeds had high GCV and corresponding heritability and genetic advance. Seed yield was positively associated with
It is I
LLEGAL t
o cop
y, pri
nt or
save
any c
onten
t of th
is PDF,
in pa
rt or in
full,
on an
y retr
ieval
syste
m,
withou
t the E
XPRESS WRITTEN PERMISSIO
N of th
e cop
yrigh
t-hold
er

National Conference on Climate Change and Agricultural Production: Adapting Crops to Climate Variability and Uncertainty, 6th–8th April, 2017
[76]
plant height, number of branches per plant, number of pods per plant, number of seeds per pod, 100-seed weight, biological yield and harvest index. Zinc content was found positively and significantly correlated with iron content. This positive correlation was confirmed in 90 genotypes of Phaseolusvulgaris by Tryphone and Msolla (2010).
REFERENCES [1] Benton Jones J 1989.Plant analysis techniques.Benton-Jones Laboratories, Georgia. [2] Burton G W and Devane E H 1953. Genetic variability and heritability in soybean. Agronomy Journal 45: 478-481. [3] Hanson C F, Robinson H F and Comstock R E 1956. Biometrical studies on yield in segregating population of Korean Lespedesa.
Agronomy Journal 48: 248-272. [4] Johnson H F, Robinson H F and Comstock R E 1955. Estimates of genetic and environmental variability in soybean. Agronomy Journal
47: 314-318. [5] Tryphone G M Msolla S N 2010. Diversity of common bean (Phaseolusvulgaris L.) genotypes in iron and zinc contents under screen
house conditions. African Journal of Agricultural Research 5 (8): 738-747.
Yield Improvement in Wheat (Triticum aestivum L.) through Foliar Supplement of Potassium Nitrate under Low Photo
thermal Exposure around Anthesis
Arnab Roy Chowdhury1,2*, Sunil Kumar2, Mainak Ghosh2, S.S. Acharya2 and J. S. Deol1 1Department of Agronomy, Punjab Agricultural University, Ludhiana–141004, India
2Department of Agronomy, Bihar Agricultural University, Sabour–813210, India E-mail: *[email protected]
Keywords: Wheat, Yield, Photothermal quotient, Potassium nitrate
INTRODUCTION
A proper combination of radiation and temperature, measured by photothermal quotient (PTQ), is required to optimize yield in wheat (Ortiz-Monasterio et al., 1994). PTQ exposure may get reduced around anthesis, causing low yield in wheat, under changing climate due to elevated mean atmospheric temperature.Under this situation, foliar supplements of potassium and nitrogen can maintain yield of wheat by virtue of their role in restoring optimum number of grains m-2 and 1000 grain weight. Therefore, an attempt was made to quantify the different PTQ exposures around anthesis, mostly associated with yield variation in wheat and to test theextent of yield restorative capacity of potassium nitrate on wheat facing low PTQ exposure during a specific period around anthesis.
MATERIALS AND METHODS
A field experiment was conducted at Punjab Agricultural University, Ludhiana, during rabi 2011-12 in split-plot design with four replications. Main plots consists of four different PTQ exposures by sowing wheat in four different dates, viz. 5th, 15th , 25th November and 5th December. The sub-plots includes: recommended dose of fertilizers (RDF, i.e., 155: 62.5: 30 kg N: P2O5:K2O ha-1) applied in different splits (50% as basal and 50% at 30DAS; 50% as basal, 25% at 30 DAS and 25% at 60 DAS); RDF applied in three splits as above with either a single foliar supplement of 1.0% KNO3at heading or anthesis or two foliar supplements of 1.0% KNO3 both at heading and anthesis stages. The photothermal quotient was calculated on a daily basis for each date of sowing with the following formulas:
If T > 10, PTQ day-1 = Solar radiation / (T-4.5)
It is I
LLEGAL t
o cop
y, pri
nt or
save
any c
onten
t of th
is PDF,
in pa
rt or in
full,
on an
y retr
ieval
syste
m,
withou
t the E
XPRESS WRITTEN PERMISSIO
N of th
e cop
yrigh
t-hold
er

National Conference on Climate Change and Agricultural Production: Adapting Crops to Climate Variability and Uncertainty, 6th–8th April, 2017
[77]
If T < 4.5, PTQ day-1 = 0; and
If 4.5< T < 10, PTQ day-1 = Solar radiation x [(T – 4.5) /5.5] /5.5, where, T is the daily mean temperature [(max + min) / 2] and PTQ is expressed as MJ m-2 day-1 °C-1
RESULTS AND DISCUSSION
Variation in grain yield was highly linked with variation in PTQ exposure 20 days before to 10 days after anthesis (PTQ20+10), which had its maximum value when the crop was sown at 15th November and led to the significantly higher grain yield than other dates of sowing. The crop could get minimum exposure to PTQ20+10 when it was sown during 1st December and consequently yield reached to its minimum value. But, with the two foliar supplements of 1.0% KNO3 both at heading and anthesis, the yield of wheat significantly increased and got maximized as compared to the treatments without any supplement of KNO3 even under low exposure to PTQ20+10 corresponds to 1stDecember sowing.Result indicates the beneficial effect of KNO3 in maintaining optimum grain yield of wheat under low PTQ exposure during anthesis.
REFERENCES [1] Ortiz-Monasterio R J I, Dhillon S S and Fischer R A 1994. Date of sowing effect on kernel yield and yield components of irrigated spring
wheat genotypes and relationships with radiation and temperature in Ludhiana, India. Field Crops Research 37: 169-184.
Future Changes in Rainfall and Temperature under Emission Scenarios over India for Agriculture
P. Parth Sarthi Center for Environmental Science Central University
of South Bihar, Patna–80014, India E-mail: *[email protected]
Keywords: ISMR, T, Tmax, Tmin, CMIP5, RCPs
INTRODUCTION
The spatial and temporal variability of Indian Summer Monsoon Rainfall (ISMR) does influence agriculture and water resources. The fast increase in earth's surface temperature is affecting patterns of weather and climate and influencing the agriculture. Using Coupled Model Intercomparison Project phases 5 (CMIP5) simulated ISMR, annual T, Maximum Temperature (Tmax) and Maximum Temperature (Tmax) under Representative Concentration Pathway (RCP) 4.5 and 8.5 experiments is aimed to analyze for homogeneous monsoon and temperature regions of India. These future projections may be used in crop simulation and growth models for adaptation to climate change in farming practices, cropping patterns, and new technologies.
MATERIAL AND METHODS
The gridded observed rainfall data of India Meteorological Department (IMD) and of Global Precipitation Climatology Project (GPCP) is used to evaluate CMIP5 model’s performance. Only well validated CMIP5 models under Representative Concentration Pathways (RCPs) 4.5 and 8.5 experiments are used for this purpose. The simulation of a Historical experiment in CMIP5 is equivalent to 20thcentury experiment (20C3M) of CMIP3. For rainfall, the period of historical experiment is 1961-2005 and for future project is 2006-2050; for surface temperature, the period for historical experiment is 1971-2005 and for future project is 2021-2055.
It is I
LLEGAL t
o cop
y, pri
nt or
save
any c
onten
t of th
is PDF,
in pa
rt or in
full,
on an
y retr
ieval
syste
m,
withou
t the E
XPRESS WRITTEN PERMISSIO
N of th
e cop
yrigh
t-hold
er

National Conference on Climate Change and Agricultural Production: Adapting Crops to Climate Variability and Uncertainty, 6th–8th April, 2017
[78]
RESULTS AND DISCUSSIONS
Students T test at 99% and 95% confidence levels is applied on the projected values. The future projected percentage changes in JJAS (mm/month) rainfall during 2006–2050 under RCPs of 4.5 and 8.5 of BCC-CSM1.1 (m),CCSM4, CESM1 (BGC), CESM1 (CAM5), CESM1 (WACCM), CESM1 (FASTCHEM) and MPI-ESM-MR with respect to historical experiment (1961–2005) shows possibility of excess rainfall over homogeneous monsoon regions of NWI, NEI, WCI and PI, while deficit rainfall over NWI, NEI, WCI, CNI and PI. At 99% and 95% confidence levels, deficit rainfall is found over CNI, NWI and PI. The future projected changes in Tmax, Tmin and T during 2021-2055 under RCPs 4.5 and 8.5 with respect to Historical experiment (1971-2005) are analyzed. CMIP5 models GISS-E2-H, BCC-CSM1.1m and GISS-E2-H-CC for Tmax; GFDL-CM3, MRI-CGM3 and MRI-ESM1 for Tmin; and CESM1 (CAM5) for T are able to simulate temperaturesfor the period of 1961-2005. In RCPs 4.5 and 8.5 experiments, significant warming of 0.5°C–0.7°C at 99% confidence level may be possible over homogeneous temperature regions of NC, NW, and WC. The changes of 0.2°C-0.5°C might be possible at other locations. These future projections may be used in crop simulation models which may assist adaptation to climate change-through changes in farming practices, cropping patterns, and use of new technologies.
REFERENCES [1] ParthSarthi P, Dash S.K. and Mamgain A 2012. Possible changes in the characteristics of Indian Summer Monsoon under warmer climate.
Global and Planetary Changes 92–93: 17–29 [2] Pattnayak C, Kar S C and Kumari P R 2015. Projections of Rainfall and Surface Temperature from CMIP5 Models under RCP4.5 and 8.5
over BIMSTEC Countries, In EGU General Assembly Conference Abstracts 17: pp. 5
Comparative Assessment of the Effect of Weather Parameters on Linseed (Linum usitatissimum L.) Crop Production in Adaptation
to Climate Change Scenario in Bihar
S.S. Acharya1*, Sunil Kumar1, Mainak Ghosh1, R.B.P. Nirala2, A. Roy Chowdhury1, S.K. Gupta1, S.K. Choudhary1 and S.S. Mahdi1
1Department of Agronomy, 2Department of Plant Breeding and Genetic 1,2Bihar Agricultural University, Sabour–813210, Bhagalpur, India
E-mail: *[email protected]
Keywords: Linseed, Date of sowing, Variety, Climate change
INTRODUCTION
Linseed (Linum usitatissimum L.) is one of the oldest, conventional and an important rabioilseed crop of India because of its medicinal and industrial importance. In India, the average yield of the crop is very low due to its growing under improper agronomic management practices and lack of knowledge among the farming community in choosing appropriate variety, to suit the particular agro-climatic zone in the perspective of climate change scenario. Among the various factors affecting yield, genetic and environmental factors along with interaction between them plays a very important role in deciding the yieldof any crop (Leon et al., 2003). Linseed crop requires cool and moderate temperature during vegetative stage and a temperature of 21o-26oC during flowering stage. Temperature above 32oC accompanied with drought during the flowering stage reduces the seed yield, oil content in seed and also the quality of the oil. Shaikh et al. (2009) reported that sowing date has significant effect on seed yield and oil contents of linseed.With very
It is I
LLEGAL t
o cop
y, pri
nt or
save
any c
onten
t of th
is PDF,
in pa
rt or in
full,
on an
y retr
ieval
syste
m,
withou
t the E
XPRESS WRITTEN PERMISSIO
N of th
e cop
yrigh
t-hold
er

National Conference on Climate Change and Agricultural Production: Adapting Crops to Climate Variability and Uncertainty, 6th–8th April, 2017
[79]
limited research conducted in India, on the effect of weather parameters on linseed crop production, the present study was conducted to study the performance of linseed varieties under different sowing dates and their interaction on yield and yield components in adaptation to climate change scenario in South East Alluvial Plain Zone of Bihar.
MATERIALS AND METHODS
Field experiment was conducted at Bihar Agricultural University, Sabour, Bhagalpur, Bihar, in two successive rabiseasons of 2014-15 and 2015-16, to study the influence of weather parameters on linseed production in adaptation to climate change scenario. The experiment was laid out in split plot design by taking four linseed varieties viz, Shekhar, Shubhra, Garima and T-397 in sub plot, grown under four dates of sowing, viz, 25th November, 10th December, 25th December and 10th January of the respective years, taken in main plot, with recommended agronomic practices. The data on yield parameters and yield were statistically analyzed to compare treatment means.
RESULTS AND DISCUSSION
A variation in temperature, relative humidity and rainfall received during the crop growth stages were observed in comparison to normal weather data, which had a great impact on yield parameters and yield of linseed, in both the years of experimentation. Among the dates of sowing, the pooled data of both the years revealed highest yield parameters and seed yield of linseed, along with lowest disease incidence for the first date of sowing, i.e., 25th November, with a seed yield of 1211 kg ha-1, which superior to later dates of sowing. The reduction in grain yield with later dates of sowing was due to exposure of the crop to diseases under unfavourable weather situation. Among the varieties, the highest pooled mean grain yield of 850 kg ha-1 was recorded by the variety Shubhra, which differed significantly with other varieties like Shekhar, Garima and T-397. The interaction effect showed significantly highest seed yield of 1518 kg ha-1 by the variety, Shubhra, when sown in first date of sowing and was followed by the variety Shekhar, sown at first date of sowing, yielding 1265 kg ha-1. The highest yield of the variety Shubhra, sown at first date of sowing, was due to relatively highest growth and yield parameters, along with lowest disease incidence, compared to all other varieties and other dates of sowing. The lowest seed yield was obtained with the varieties Garima and T-397, when sown at 4th date of sowing at 10th January of each year of experimentation. As the sowing of linseed beyond first fortnight of December drastically reduced seed yield under unfavourable weather conditions in the present climate change scenario, hence the sowing of linseed should be completed within second fortnight of November in the South East Alluvial Plain Zone of Bihar and the variety, Shubhra, should be preferred followed by Shekhar, for maximising the seed yield and giving substantial return to the farmer.
REFERENCES [1] Leon A J, Andrade F H and Lee M 2003.Genetic analysis of seed-oil concentration across generations and environments in
sunflower.Crop Science 43: 135-140. [2] Shaikh F G, Gokhale D N, Rokade B S and Jadhav P J 2009.Effect of sowing date on some growth characters in linseed.Journal of
Agrometeorology 11 (2): 203-205.
It is I
LLEGAL t
o cop
y, pri
nt or
save
any c
onten
t of th
is PDF,
in pa
rt or in
full,
on an
y retr
ieval
syste
m,
withou
t the E
XPRESS WRITTEN PERMISSIO
N of th
e cop
yrigh
t-hold
er

National Conference on Climate Change and Agricultural Production: Adapting Crops to Climate Variability and Uncertainty, 6th–8th April, 2017
[80]
Trends and Impact of Aerosol on Yield of Rice and Wheat Crop in Bihar
Sunil Kumar1*, Sanjay Kumar1, S. Sheraz Mahdi1, Saurabh Choudhary1, Shashank Tyagi1, Pravesh Kumar1 and S.K. Gupta1 and Rakesh Kumar2
1Department of Agronomy, 2Department of Soil Science and Agricultural Chemistry 1,2Bihar Agricultural University, Sabour, Bhagalpur–813210, India
E-mail: *[email protected]
Keywords: Aerosol, Grain yield, Rice crop, Wheat crop
INTRODUCTION
A large sustained increasing aerosol loading trend has been found over Northern India in Indo- Gangetic plain area in the past two decades (Massie et al., 2004). Burning of fossil fuels and biomass have increased aerosol in the Indo-Gangetic plain. Aerosol can affect the flux of solar radiation directly or indirectly and thus may affect the major crops rice and wheat yields. Which needs the impact of aerosol on yields of rice and wheat crop in the region affected by increasing aerosol.
MATERIALS AND METHODS
Weather data of Pusa (Zone I) and Sabour (Zone III A) were collected for the period 1955-2012 and ofPurnea (Zone II) and Patna (Zone III B) for the period 1969-2012. Satellite data of aerosol optical thickness was downloaded from the website of Goddard space, NASA between latitudes 24-27 o N and longitude 82-86 oE for Bihar region for the period 2001-2012. Trends of temperature and rainfall based on long term weather data and trends of aerosol optical thickness using the data for the period 2001-2012 were tested by Mann Kendall test. Correlations were examined between aerosol optical thickness and different weather parameters viz. solar radiation, maximum temperature, minimum temperature and rainfall for different seasons for different stations. Correlations were also examined among aerosol and productivity of rice (var. Swarna) and wheat (var. HD 2733) crop for different regions. The generic grain cereal simulation model CERES Version 4.5 (Ritchie et al., 1998) was used to estimate the effect of aerosol on crop yield and had been integrated in the Decision Support System for Agro technology Transfer (DSSAT). The model was modified so that RUE was not a longer static variablebut was dynamically calculated as a function of the diffuse fraction on each simulationday.
RESULTS AND DISCUSSION
Trend statistics of maximum temperature indicates significant decreasing trend of annual maximum temperature (-0.0080 Cy-1) and (-0.0120 Cy-1) for stations Pusa and Sabour respectively. There is significant increasing trend (0.0410 C y-1) of maximum temperature in kharif in Purnia whereas decreasing trend (-0.0130 C y-1) of maximum temperature in rabi season in Sabour. Minimum temperature of all the four stations showed significant increasing trend in rabi season (0.0220 , 0.0810 ,0.0260 and 0.0380 C y-1for Pusa, Purnia, Sabour and Patna respectively). Purnia shows significant increasing trend (0.0370 C y-1) of minimum temperature in kharif season too. Purnia, Sabour and Patna show significantly increasing trend of annual minimum temperature (0.0570 (0.0140 and (0.0250 C y-1 respectively). In Pusa, rainfall is decreasing significantly (-1.471 mm y-1) in rabi season. In all the stations except Sabour, annual rainfall is decreasing but they are statistically non-significant. At Sabour station, there is increasing trend of Kharif and annual rainfall but statistically non-significant.There is significant decreasing trend (-0.008) of aerosol in Kharif
It is I
LLEGAL t
o cop
y, pri
nt or
save
any c
onten
t of th
is PDF,
in pa
rt or in
full,
on an
y retr
ieval
syste
m,
withou
t the E
XPRESS WRITTEN PERMISSIO
N of th
e cop
yrigh
t-hold
er

National Conference on Climate Change and Agricultural Production: Adapting Crops to Climate Variability and Uncertainty, 6th–8th April, 2017
[81]
season in zone II. Though there is also decreasing trend in Kharif season and in annual mean of aerosol in all the zones and increasing trend in Rabi season but statistically not significant. There is significant negative correlation between aerosol andmaximum temperature, in post monsoon season in zone I and II and in winter season in zone III B.In pre monsoon and winter season in zone II and III A respectively it was found significant negative correlationbetween aerosol and minimum temperature.In zone II, correlation between aerosol and rainfall was found significantly positive in Pre monsoon season. There is significant negative correlation between aerosol and rice yield in zone III A and III B. In case of wheat, it was found significantly positive correlation with aerosol in zone III A. Yield for wheat and rice was predicted to decrease linearly if RUE does not change resulting in a maximum reduction of approximately 30% at aerosol optical depth (AOD = 1.0). If RUE fluctuates as a function of the diffuse fraction, the predicted influence on wheat and rice yield is positive. If the maximum change in RUE is 50%, the maximum increase in yield is approximately 15% at AOD = 0.5. If change in RUE = 100%, the maximum increase is nearly 44% at AOD = 0.8 in case of rice and 41% in wheat crop yield. An increase in the diffuse fraction can increase the amount of photosynthesis occurring in shaded leaves. Aerosol light scattering decreases total PAR at the same time that it increases the diffuse fraction, aerosols are therefore expected to increase RUE in rice and wheat crops. The increase in RUE is likely to be less at low LAI than in mid-growing season when a crop is fully developed and has multiple canopy layers and a high LAI. The decrease in radiation associated with increasing aerosol concentrations also results in less water loss due to soil evaporation and leaf transpiration. The change in mean yield as a function of aerosol optical depth is highly dependent on the radiation use efficiency of the crop. RUE itself is dependent on the fraction of radiation that is diffuse. The amount of increase in RUE seems to be the most important factor in determining the magnitude and in a few cases even the sign of the change in yield. If RUE increases more than 50% over the base value at high diffuse fractions, this increased efficiency frequently offsets the reduction in PAR due to the influence of aerosols, and consequently, yields are predicted to either increase or decrease by less than if the RUE does not change. There are good correlations of aerosols with weather parameters like maximum temperature, minimum temperature, rainfall and solar radiation. The influence on rice yields is predicted to be in the range of -28 to +44% decrease or increase depending on aerosol and sky conditions. Similarly, the wheat yield depends on the conditions during the growing season and ranges from -29.4 to +40.9% decrease or increase due to aerosol.
REFERENCES [1] Massie S T, Torres O and Smith S J 2004. Total Ozone Mapping Spectrometer (TOMS) observations of increases in Asian aerosol in
winter from 1979 to 2000.Journal Geophysical Research 109 (D18): 211. [2] Ritchie J T, Singh U, Godwin D C, Bowen W T 1998. Cereal growth, development and yield. In: Tsuji, G.Y., Hoogenboom, G.,
Thornton, P.K. (Eds.), Understanding Options for Agricultural Production. Kluwer Academic Publishers, Dordrecht, Netherlands. Rochette, P., Desjardins, R. L., Pattey, E. and Lessard, R. 1996. Instantaneous measurement of radiation and water use efficiencies of a maize crop. Agronomy Journal 88: 627–635.
[3] Schwartz S 1996. The white house effect–shortwave radiative forcing of climate by anthropogenic aerosols: An overview Journal of Aerosol Science 27: 359-382.
It is I
LLEGAL t
o cop
y, pri
nt or
save
any c
onten
t of th
is PDF,
in pa
rt or in
full,
on an
y retr
ieval
syste
m,
withou
t the E
XPRESS WRITTEN PERMISSIO
N of th
e cop
yrigh
t-hold
er

National Conference on Climate Change and Agricultural Production: Adapting Crops to Climate Variability and Uncertainty, 6th–8th April, 2017
[82]
Response of Blue Green Algae on Rice (Oryza sativa) Crop Production at Elevated Temperature
Vimal Kumar1*, S. Panneerselvam1, Jeetendra Kumar Soni2, A. Lakshmanan3 and P. Arun Kumar1
1Agro. Climate Research Centre, 2Department of Agronomy, 3Department of Microbiology 1,2,3Tamil Nadu Agricultural University, Coimbatore–641003, India
E-mail: *[email protected]
Keywords: Blue Green Algae, Current temperature, Elevated temperature, Rice crop, Crop yield
INTRODUCTION
The global average surface temperature has increased over time, with observations indicating that it has increased by 0.74°C for the last century. Rice (Oryza sativa L.) crop is the most common staple food for large number of populations living on the earth. To meet the demands of increasing population and maintain self-capability, present production level in India needs to be increased to 120 million tonnes by 2020 (Veeramani, 2010). Increases in maximum temperature during the ripening phase contribute to an increase in rice yield up to a critical threshold of 32°C. When maximum temperature goes beyond this threshold, rice yield declines. The photosynthetic systems such as blue green algae and Azolla are capable of increasing the rice production due to increasing the nutrients availability to plants. The application of Blue Green Algae improve the rice productivity at future climatic condition and high temperature level
MATERIALS AND METHODS
The present investigation was carried out to know the response of blue green algae on rice production at elevated temperature. The experiment was conducted at Agro Climate Research Centre, TNAU, Coimbatore, during Rabi season (November 2014 – March 2015) with rice variety CO-51 in randomized block design. The experiment had four treatments and five replications. Experiment was conducted under four environmental condition likewise (T1) growing of rice under elevated temperature at +20C with the application of blue green algae (BGA), (T2) growing of rice under elevated temperature at +20C without BGA,(T3) growing of rice under current temperature with BGA, (T4) growing of rice under current temperature without BGA. Plants were grown in standard tubs (1.5 X 1.0 m) under open environment as well as under temperature control chamber (TCC). Inside the TCC the temperature was set at +20C. The relative humidity ranged from 80-90 per cent under open environment and under TCC, it was 75-85 percent. Biometric observations viz., plant height, number of tillers and leaf area index were recorded at 15, 30, 45, 60 DAT and harvesting stage and grain yield.
RESULTS AND DISCUSSION
The plants grown under +20C elevated temperature with BGA recorded highest plant height in all stage of crop growth compared to plants which were grown in current temperature. The number of tillers per plant more when crop was grown under current temperature with and without BGA (T3 and T4) as compared to +20C elevated temperature with and without BGA (T1 and T2). The number of tillers per plant increase by the application of BGA in open environmental condition (T3) which recorded 25 tillers per plant at harvest stage followed by without application of BGA (T4) in open environmental condition. In open environmental condition the number of grains per panicle increases with the application of BGA than without application of BGA. At +20C elevated temperature the number of grains per panicle increases with application of BGA (T1)
It is I
LLEGAL t
o cop
y, pri
nt or
save
any c
onten
t of th
is PDF,
in pa
rt or in
full,
on an
y retr
ieval
syste
m,
withou
t the E
XPRESS WRITTEN PERMISSIO
N of th
e cop
yrigh
t-hold
er

National Conference on Climate Change and Agricultural Production: Adapting Crops to Climate Variability and Uncertainty, 6th–8th April, 2017
[83]
compared to with application of BGA (T2). The data on interaction between temperature levels and BGA indicated that open environment with application of BGA recorded higher percentage of filled grains per panicle than elevated temperature with and without BGA. The rice crop grown under +20C elevated temperature recorded lesser grain yield compared to open condition. The highest rice grain yield (7448 kg ha-1) was under open environment with BGA (T3). Under elevated temperature the reduction of rice grain yield was 36.91% higher when rice grown without BGA followed by with BGA (23.04%). Rice crop grown under both ambient and +20C elevated temperature by the application of BGA significantly increased the grain yield.
REFERENCES [1] Veeramani P 2010. Enhancement of mat nursery management and planting pattern (using rolling markers) in System of Rice
Intensification (SRI) Technique.Libyan Agriculture Research Center Journal International 5:279-283.
Sand Mining-Effects and Extent for Changing Irrigation and Agriculture Scenario in Banka District of Bihar India
Sunita Kushwah1*, Kumari Sharda1, R.P. Sharma2 and S.R. Singh2 1Krishi Vigyan Kendra, Banka–813102, India
2Department of Extension Education Bihar Agricultural University, Sabour, Bhagalpur–813210, India
E-mail: *[email protected]
Keywords: Watershed programme, Sand mining, Irrigation, Nutrients use
INTRODUCTION
Sand mining is a practice that is used to extract sand, mainly through an open pit and is an important mineral for our society in protecting the environment. In Bihar, there has been a significant increase in sand mining since the beginning of the 2005 following a boom in the construction industry and the activity reached alarming proportions in several areas, particularly in the southern and western regions of the State (Ghose et al., 2004). However, court restrictions on sand mining came into effect in Bihar since 2016 but illegal mining is still continuing. The Chandan and OIdhani catchment area in district Banka has led to the depletion of groundwater levels and environmental degradation in the villages on the banks of the river in Bihar.
MATERIALS AND METHODS
In district Banka sand mining started in the year 2005. Therefore, a field survey conducted in the year 2016-17 in severely affected sand mining areas by Chandan river (seasonal mountainous river) with 80 randomly selected farmers both men and women from Banka, Amarpur, Baunsi, Katoria block of district Banka through proportionate cum random sampling technique. The study conducted by Krishi Vigyan Kendra, Banka. Data collected from eight villages and average calculated for all particulars for 80 respondents. Questionnaire was based on the questions related to the impact of sand mining, their socioeconomic status, change in agriculture and adverse affects.. The extent of effect of sand mining was measured for the all particulars by using a three point & two point rating scale of ‘2’ for fully agree, ‘1’ for partial agree and ‘0’ not agree.
It is I
LLEGAL t
o cop
y, pri
nt or
save
any c
onten
t of th
is PDF,
in pa
rt or in
full,
on an
y retr
ieval
syste
m,
withou
t the E
XPRESS WRITTEN PERMISSIO
N of th
e cop
yrigh
t-hold
er

National Conference on Climate Change and Agricultural Production: Adapting Crops to Climate Variability and Uncertainty, 6th–8th April, 2017
[84]
RESULTS AND DISCUSSION
After close study based on survey from sand mining areas , resources available for irrigation having significant changes in their role. It is evident from Table 1, water table of river recorded negative relative change 58.15 percent after sand mining. Depth of river (ft) recorded 109.56 percent relative change. It indicates there is down fall in the water table and depth of river increases rapidly during last 10 years after river sand mining. Sand lifting per day (t) also recorded positive relative change 1350.90 percent. These results, indicates that sand mining per day is above the recommended level by the Govt. It would be harmful for the agricultural crops. Availability of water from surface of the sand in river (m) were also observed high downfall of fresh water inside the sand layer in river i.e. (578.13%). Similar findings reported by (Singh etal., 2007 ; Chauhan, 2010). Per day sand digging or lifting is directly associated with down fall of water level. It is found during study government should plan a concrete river sand mining system to enhance the development of construction industry as well as agricultural industry by consuming the natural agricultural resources like water air and soil fertility. An adverse consequence indicates that there is an urgent need to plan programme to minimize these causes for the livelihood of the farmers who depends upon the river for their day to day needs. The socio-economic significance of mining operations is often overlooked, and there is a need to protect its economic and social benefits.
Table 1: Suggestions by Respondent to Minimize Adverse Consequences of Sand Mining on Agriculture, Irrigation Systems and Natural Habitat (n=80)
S. No. Particulars Frequency Percentage 1 Construction of water conservation structures to reduce the water loss 67 83.75 2 Prohibited mining at night 34 42.5 3 Sand lifting from wasteland areas 32 40 4 Reuse and recycling of building material to reduce demand for river sand 12 15 5 To stop illegal mining 56 70 6 Allow sand mining during certain seasons of the year but not in rainy and summer season 22 27.5 7 Close monitoring and evaluation of sand mining 42 52.5 8 Replanting vegetation on mined areas to prevent further damage 70 87.5 9 Part of royalties can be paid to Village Development Committees so that villagers shall
develop water harvesting devices like ponds and canals. 78 97.5
10 Government should provide subsidy for pulses, oil seeds and low water loving crops 47 58.75 11 Construction of small check dams in river 67 83.75
REFERENCES [1] Ghose M.K. and Anjay Kumar 2004. Mineral industries and their environmental aspects in Indian context. Indian Journal of Engineering
& Materials Sciences 11: 433-437. [2] Chauhan S.S. 2010. Mining, Development and Environment: A Case Study of Bijolia Mining Area in Rajasthan, Indian Journal of Human
Ecology 31(1): 65-72. [3] Singh G, Mehta K.K., Sharma R.C., Chawla K.L., Joshi P.K. and Yaduvanchi N.P. 2007. “Sand mining or no mining in Agricultural fields
in Haryana”, Technical bulletin.
It is I
LLEGAL t
o cop
y, pri
nt or
save
any c
onten
t of th
is PDF,
in pa
rt or in
full,
on an
y retr
ieval
syste
m,
withou
t the E
XPRESS WRITTEN PERMISSIO
N of th
e cop
yrigh
t-hold
er

National Conference on Climate Change and Agricultural Production: Adapting Crops to Climate Variability and Uncertainty, 6th–8th April, 2017
[85]
Correlation and Path Coefficient Analysis for Combining High Grain Yield and Protein Content Based on Nitrogen Remobilization
Efficiency in Wheat (Triticum aestivum L.)
Tilak Raj1, Sukhpreet Kaur Sidhu2, Ashutosh Srivastava2* and S.S. Sidhu3 1Punjab Agriculture University, Krsihi Vigyan Kendra, Faridkot–151203, India
2Department of Botany, 3Department of Math. Stat. and Physics 2,3Punjab Agricultural University, Ludhiana–141004, India
E-mail: *[email protected]
Keywords: Wheat, NUE, Correlation, Nitrogen Remobilization Efficiency, Path analysis
INTRODUCTION
Grain yield and grain protein concentration are important traits affecting the economic value of wheat. Grain protein is of primary importance in determining the bread-making quality of wheat. Higher nitrogen rates mainly increased dry matter production and leaf area index in growing season and at reproductive growth stage (Giunta et al., 2009). A recently released cultivar PBW-550, suggests that genetic improvement in grain yield and grain protein concentration can occur simultaneously. Objective of this study for evaluation of different traits association to nitrogen accumulation, remobilization and partitioning in varieties too in expressing high grain yield and high grain protein concentration.
MATERIALS AND METHODS
The experiment was carried out at the experimental area and laboratories of the Punjab Agricultural University, Ludhiana during rabi season 2010-11. The bread wheat cultivars used in this experiment were PBW-550, PBW-502 and PBW-343. The experimental design was a split plot with three replications. Nitrogen was applied at a rate of 120 and 180 kg N ha-1. Plant samples were taken at anthesis, anthesis + 4 days, anthesis + 8 days, anthesis + 12 days, Milk stage of kernel development, Soft dough stage of kernel development, and physiological maturity. The various parameters referring to dry matter and nitrogen remobilization were recorded and calculated as follow. Pearson correlation coefficient and path analysis were analyzed by using statistical software SPSS 7.5.
RESULTS AND DISCUSSION
Physio-biochemical traits showed various responses with increasing of nitrogen level among different varieties. The grain yield was highly positively correlated with biological yield (r = 0.9766) followed by total plant nitrogen at maturity (r = 0.9688), remobilized nitrogen at post anthesis (r = 0.9296), number of kernels per spike (r = 0.9195), grain protein yield (r = 0.9069), number of spikes per plant (r = 0.8973), grain protein concentration (r = 0.8236), remobilization efficiency (r = 0.8068), while vegetative nitrogen at maturity (r = 0.4517) had no correlation with grain yield (Table 1). It concluded that grain protein concentration could be improved by enhancing grain nitrogen. Similarly, grain yield could be increased by selecting for harvest index. Grain protein concentration improved without reducing grain yield by selecting cultivars with both high grain protein yield and remobilization efficiency.
REFERENCE [1] Giunta F, Giovanni P and Rosella M 2009.Radiation interception and biomass and nitrogen accumulation in different cereal and grain
legume species.Field Crops Research 110: 76–84.
It is I
LLEGAL t
o cop
y, pri
nt or
save
any c
onten
t of th
is PDF,
in pa
rt or in
full,
on an
y retr
ieval
syste
m,
withou
t the E
XPRESS WRITTEN PERMISSIO
N of th
e cop
yrigh
t-hold
er

National Conference on Climate Change and Agricultural Production: Adapting Crops to Climate Variability and Uncertainty, 6th–8th April, 2017
[86]
Table 1: Pearson Correlation Analysis between Grain Yield and Different Traits in Wheat Characters 1 2 3 4 5 6 7 8 9 10 11
1. Grain protein concentration
1.000
2. Grain protein yield 0.9847** 3. Remobilized N 0.6511** 0.7622** 4. Biological yield 0.7741** 0.8703** 0.9298** 5. No. of spikes per
plant 0.7079** 0.7859** 0.8600** 0.8646**
6. No. of kernels per spike
0.8668** 0.9092** 0.8121** 0.8589** 0.8449**
7. 1000-kernel weight 0.5024* 0.3802 -0.2054 -0.0209 0.0144 0.3009 8. Total nitrogen at
maturity 0.8720** 0.9358** 0.9306** 0.9490** 0.8621** 0.9202** 0.0953
9. Vegetative nitrogen at maturity
0.0818 0.0755 0.6764** 0.4974* 0.4649 0.2656 -0.7189 0.4112
10. Remobilization efficiency
0.9183** 0.9093** 0.6727** 0.7111** 0.7574** 0.8652** 0.5250* 0.8232** 0.0272
11. Grain yield 0.8236** 0.9067** 0.9296** 0.9766** 0.8973** 0.9195** 0.0925 0.9688** 0.4517 0.8068** 1.000 * and ** Significant at 1 and 5% level respectively
Chlorophyll Stability: A Better Trait for Grain Yield in Rice under Drought
Sareeta Nahakpam Bihar agricultural University, Sabour, Bhagalpur–813210, India
E-mail: [email protected]
Keywords: Chlorophyll stability, Chl a, Chl b, Drought, Yield
INTRODUCTION
Changing climate affects a variety of factors associated with drought and extreme drought land area is likely to increase from 1-30% by 2100. Drought stress progressively disrupts photosynthetic pigments and thereby the crop yield. In agriculture, screening against drought stress is not only the matter of adaptation but also its productivity. This work aimed at elucidating some of the drought sustaining characters that gives direct impact on grain yield. The CSI is one important index that helps the plants to withstand stress through better availability of chlorophyll and leading to increased photosynthetic rate and dry matter production in crops. The present work revealed significant variations among the rice genotypes and positive correlation between CSI and grain yield. Irrespective to alterations in chlorophyll contents due to drought, chlorophyll stability index may probably be an advantageous component for obtaining better yield in rice grown under drought conditions.
MATERIALS AND METHODS
The present study was conducted using eight rice genotypes (IR-83381-B-B-18-3, BRR-0026, Sabour Ardhjal, IR-87759-5-2-1-3, BRR-0028, Sabour Surbhit, MAS-946, R Bhagwati) in direct seeded condition and data were collected after 60 days of sowing. Drought stress was imposed by withholding irrigation and bringing the soil moisture content (SMC) upto 25%. Chlorophyll content and chlorophyll Stability Index (CSI) in the leaf was estimated by standard mentods. The antioxidant enzyme activities and ROS expression were also worked out. The correlation analysis between physiological parameters was performed with simple coefficient matrix at P ≤ 0.05 and P ≤ 0.01.
It is I
LLEGAL t
o cop
y, pri
nt or
save
any c
onten
t of th
is PDF,
in pa
rt or in
full,
on an
y retr
ieval
syste
m,
withou
t the E
XPRESS WRITTEN PERMISSIO
N of th
e cop
yrigh
t-hold
er

National Conference on Climate Change and Agricultural Production: Adapting Crops to Climate Variability and Uncertainty, 6th–8th April, 2017
[87]
RESULTS AND DISCUSSION
Drought generally altered the amount of chlorophyll and built large differences amongst the genotypes and treatments. Reduction in chlorophyll contents were observed in the genotypes exposed to drought. This reduction could be a typical symptom of oxidative stress. However, increased in chlorophyll a and b content were in genotypes Sabour Ardhjal under drought situation whereby genotypes IR-87759-5-2-1-3 and BRR-0028 showed its increased in chl a only (Table 1). A significant variation for the chlorophyll a/b ratio was observed, revealing variation in the activity of chlorophyll synthesizing mechanism among genotypes when exposed to drought stress. The significant differences in chlorophyll stability index were observed between control and drought stressed plants. BRR-0028 showed the highest CSI with higher yield irrespective of less chlorophyll content. The enhanced activities of antioxidant enzymes like peroxidise (POD), catalase (CAT) and superoxide dismutase (SOD) scavenging reactive oxygen species i.e. hydrogen peroxide and superoxide anion in the genotypes with higher chlorophyll stability index was observed. This chlorophyll stability index is an indicative of the maintenance of photosynthetic pigments under drought and is more dependent parameter for drought tolerance than chlorophyll content. The CSI showed significant (r = 0.804**) positive correlation with the grain yield. Therefore, chlorophyll stability index has paved a way to an advantageous parameter for screening tolerant rice genotypes to obtain better yield under drought condition.
Harnessing Under-utilized Crop Species— A Promising Way towards Sustainability
Madhumita Department of Extension Education, Bihar Agricultural University, Sabour, Bhagalpur, India
E-mail: [email protected]
Keywords: Neglected and under-utilized crops (NUCS), Agro-diversity, Sustainability, Resilience, Food and nutritional security
Agriculture is reeling under intense pressure to constantly produce increased quantities of food, feed and biofuel out of limited land resources. Present over-reliance on a handful of major staple crops has inherent agronomic, ecological, nutritional and economic risks and is probably unsustainable in the long run (Ebert, 2014). Modern agricultural systems that promote cultivation of a very limited number of crop species have relegated indigenous crops to the status of neglected and under-utilized crop species (NUCS).NUCS are indispensable in reducing food and nutrition insecurity,owing to their wider resilience to climate variability and inherent nutritional composition(Chivenge et al., 2015). Currently underutilized food sources ranging from minor grains and pulses, root and tuber crops and fruits and vegetables to non-timber forest products have the potential to make a substantial contribution to food and nutrition security, to protect against internal and external market disruptions and climate uncertainties, and lead to better ecosystem functions and services, thus enhancing sustainability. The integration of these species diversifies agricultural system and makes it much more resilient as well as strengthens its adaptation, mitigation and coping mechanisms. A wider use of neglected and undervalued crops and species, either intercropped with main staples in cereal-based systems or as stand-alone crops, would provide multiple options to build temporal and spatial heterogeneity into uniform cropping systems, thus enhancing resilience to biotic and abiotic stress factors and ultimately leading to a more sustainable supply of diverse and nutritious food. As source of essential vitamins, micronutrients, protein and other phytonutrients, traditional vegetables and underutilized legume crops such as mungbean have the potential to play a major role in strategies to attain nutritional security(Ebert, 2014). Many of these traditional crops grown for food, fiber, fodder, oil and as sources of traditional medicine play a major role in
It is I
LLEGAL t
o cop
y, pri
nt or
save
any c
onten
t of th
is PDF,
in pa
rt or in
full,
on an
y retr
ieval
syste
m,
withou
t the E
XPRESS WRITTEN PERMISSIO
N of th
e cop
yrigh
t-hold
er

National Conference on Climate Change and Agricultural Production: Adapting Crops to Climate Variability and Uncertainty, 6th–8th April, 2017
[88]
the subsistence of local communities and frequently are of special social, cultural and medicinal value.They also contribute to the diversity and stability of agro-ecosystems and are potential crops for the diversification of agriculture. These species often play a strategic role in fragile ecosystems such as those of arid and semi-arid lands, mountains, steppes and tropical forests. Most of the these crops do not require high inputs and can be successfully grown in marginal, degraded and wastelands with minimal inputs and at the same time can contribute to increased agricultural production, enhanced crop diversification and improved environment and have the potential to contribute useful genes to breed better varieties capable of withstanding and sustain the climate change scenario (Sthapit et al., 2009). Thus this agro-biodiversity is of immense importance to sustainability.Significant research, breeding and development efforts are needed for a range of promising crops to convert existing local landraces into competitive varieties with wide adaptation and promising commercial potential. Access to genetic diversity of these selected crops is a pre-condition for success (Ebert, 2014).The fact that under- utilized crops are the product of generations of landrace agriculture supports the idea that they are resilient and adapted to the needs of farmers in marginal agricultural environments. In addition, under- utilized crops are also seen as offering economic advantages due to their uniqueness, suitability to environments in which they are grown and low input requirements (Mabhaudi et al., 2016). However, what is required to promote NUCS is scientific research including agronomy, breeding, post-harvest handling and value addition, and linking farmers to markets(Chivenge et al., 2015).The paper largely emphasizes on –the potential of neglected and under-utilized crops in the present context owing to global menace of climate change and raised concerns of food and nutritional security for growing population, viable solutions and recommendations to promote its conservation as well as effective use in mainstream agriculture.
REFERENCES [1] Chivenge P, Mabhaudhi T, Modi A Tand Mafongoya P 2015. The potential role of neglected and underutilised crop species as future
crops under water scarce conditions in Sub-Saharan Africa. International journal of Environmental Research and Public Health 12(6): 5685-5711.
[2] Ebert A W 2014. Potential of underutilized traditional vegetables and legume crops to contribute to food and nutritional security, income and more sustainable production systems. Sustainability 6 (1): 319-335.
[3] Mabhaudhi T, O’Reilly P, Walker S, and Mwale S 2016. Opportunities for underutilised crops in southern Africa’s post–2015 development agenda. Sustainability 8 (4): 302.
[4] Sthapit B, Padulosi S and Mal B 2010.Role of on-farm/in situ conservation and underutilized crops in the wake of climate change. Indian Journal of Plant Genetic Resources 23 (2): 145.
Thermal Utilization and Heat Use Efficiency of Rice Cultivars under Different Dates of Transplanting in Indo-Gangetic Plain of Bihar
S.K. Dutta*, Mainak Ghosh, Sunil Kumar, Sanjay Kumar, S. Sheraz Mahdi and G.S. Panwar Department of Agronomy, Bihar Agricultural University, Sabour–813210, Bhagalpur, India
E-mail: *[email protected]
Keywords: Rice, Growing degree days, Heat use efficiency
INTRODUCTION
The growth and development of a crop is the function of genotype x environment interaction. Crop development rate can be modified by several factors, such as photo-period, soil moisture, solar radiation and fertility, but it is primarily affected by temperature. The efficiency of temperature utilization varies with genotype as well as spatial and temporal variability. Rice (Oryza sativa L.) is a staple food crop of the world
It is I
LLEGAL t
o cop
y, pri
nt or
save
any c
onten
t of th
is PDF,
in pa
rt or in
full,
on an
y retr
ieval
syste
m,
withou
t the E
XPRESS WRITTEN PERMISSIO
N of th
e cop
yrigh
t-hold
er

National Conference on Climate Change and Agricultural Production: Adapting Crops to Climate Variability and Uncertainty, 6th–8th April, 2017
[89]
as well as India and is grown under varying conditions of climate, altitude and management practices. During growth and development of a cereal crop several growth stages are distinguishable in which important physiological processes occur (Sikder, 2009). As thermal time is an independent variable to describe plant development therefore it can be used as a tool for characterizing thermal responses in a crop. In the present study an attempt was made to predict the growth and yield of rice varieties based on thermal indices through genotype environment interaction.
MATERIALS AND METHODS
A field experiment was conducted in the sandy loam soil at Bihar Agricultural University, Sabour, Bhagalpur during the Kharif season of 2013 and 2014. The soil was neutral in reaction with a pH 6.9, and 118, 20 and 112 kg/ha available N, P and K respectively. Rice varieties V1-Rajendra Sweta, V2 – Rajendra Mahsuri, V3 – MTU 7029 and V4 – MTU 1001 was transplanted under all four dates of transplanting viz. D1 – 30 June, D2 – 15 July, D3 – 30 July and D4 – 15 August in split plot design with sixteen treatment combinations and three replications. All treatment combinations received in total 100-40-20 kg N-P2O5-K2O/ha fertilizer where 25-40-20 kg N-P2O5-K2O/ha was applied as basal followed by top dressing of 25 kg/ha each at active tillering, panicle initiation and heading stages of rice crop. Seedlings were raised on an area of 1m2 for each variety and the seedbed was laid out 25 days prior to the respective transplanting dates. The phenological stages of crop were recorded by visual observations. Growing degree days were calculated by simple arithmetic accumulation of daily mean temperature above the base temperature value of 10 °C considered for the rice crop. The different indices for each stage were calculated as suggested by (Nuttonson, 1955).
The heat use efficiency was calculated using the following formula:
퐻푒푎푡 푈푠푒 퐸푓푓푖푐푖푒푛푐푦 (푘푔/ℎ푎/C푑푎푦) = ( / ) ( )
RESULTS AND DISCUSSION
Table 1: Accumulated Growing Degree Days (oC Day) for Different Phonological Stages of Rice Cultivars Sown under Different Dates of Transplanting
Phenological Stage D1 D2 D3 D4 V1 V2 V3 V4 V1 V2 V3 V4 V1 V2 V3 V4 V1 V2 V3 V4
Kharif 2013
Transplant 507 507 507 507 500 500 500 500 535 535 535 535 504 504 504 504
Panicle Initiation 1936 1998 2094 2058 1813 1873 1913 1873 1696 1762 1762 1728 1605 1665 1636 1681
Heading 2213 2231 2346 2312 2096 2168 2222 2149 1884 1937 1965 1937 1805 1846 1832 1875
Anthesis 2329 2379 2449 2431 2222 2280 2346 2280 1980 2030 2062 2062 1889 1943 1916 1969
Harvest 2676 2800 2829 2829 2542 2669 2669 2669 2322 2398 2419 2419 2094 2189 2189 2189
Kharif 2014
Transplant 505 505 505 505 489 489 489 489 493 493 493 493 485 485 485 485
Panicle Initiation 1890 1962 1962 1962 1838 1855 1874 1874 1633 1690 1747 1747 1480 1604 1621 1586
Heading 2088 2210 2229 2229 2023 2118 2118 2118 1841 1907 1937 1952 1651 1765 1778 1749
Anthesis 2193 2323 2362 2362 2136 2232 2232 2232 1937 1992 2021 2021 1734 1846 1861 1832
Harvest 2601 2714 2756 2756 2483 2578 2578 2578 2243 2320 2352 2352 2033 2136 2136 2136
(Dates of transplanting) D1 – 30 June, D2 – 15 July, D3 – 30 July and D4 – 15 August; (Varieties)V1-Rajendra Sweta, V2 – Rajendra Mahsuri, V3 – MTU 7029 and V4 – MTU 1001
The earlier transplanted crop recorded higher growing degree- days (GDD) in all the growth stages during both the seasons and with delay in each date of transplanting the degree- day accumulation decreased (Table 1). Among the different varieties higher GDD was accumulated in MTU 7029 and MTU 1001 which
It is I
LLEGAL t
o cop
y, pri
nt or
save
any c
onten
t of th
is PDF,
in pa
rt or in
full,
on an
y retr
ieval
syste
m,
withou
t the E
XPRESS WRITTEN PERMISSIO
N of th
e cop
yrigh
t-hold
er

National Conference on Climate Change and Agricultural Production: Adapting Crops to Climate Variability and Uncertainty, 6th–8th April, 2017
[90]
had similar accumulated GDD values over all the dates of transplanting for both the years. It was closely followed by the variety Rajendra Mahsuri while the least GDD accumulation was obtained for the variety Rajendra Sweta. Over the different dates of transplanting the accumulated GDD decreased by 5, 14and 23% for 15th, 30th July and 15th of August transplanting respectively compared to 30th of June transplanting. The heat use efficiency (HUE) was higher for early transplanted crop however the HUE increased from 30th June transplanting to 15th July transplanting thereafter which it gradually declined over the later dates of transplanting. The variety MTU 7029 recorded the highest HUE followed by MTU 1001, Rajendra Mahsuri and Rajendra Sweta for all the dates of transplanting. Delay in transplanting of rice coupled with elevated temperature affects the rice crop duration through attainment of phenological stages earlier and reduced accumulation of GDD. The effect of high temperature on development of rice ultimately results in yield loss of the crop due to spikelet sterility thereby reducing the HUE.
REFERENCES [1] Nuttonson M Y 1955. Wheat-climate relationships and the use of phenology in ascertaining the thermal and photo-thermal requirements
of wheat.American Institute of Crop Ecology Washington DC, pp: 338. [2] Sikder S 2009. Accumulated heat unit and phenology of wheat cultivars as influenced by late sowing heat stress condition. Journal of
Agriculture & Rural Development 7 (1): 59-64.
Effect of Weed Management on Performance of Direct Seeded Rice (Oryza sativa L.) under Moisture Stress Condition
Shaheen Naz*, Ravi Nandan and D.K. Roy Department of Agronomy,
Dr. Rajendra Prasad Central Agricultural University, Pusa–848125, India E-mail: *[email protected]
Keywords: Planting methods, Weed Management, Direct Seeded Rice, Yield
INTRODUCTION
Rice is staple food of majority of the world’s population. In India about 43.97 mha of lands are under rice cultivation with production of 104.32 million tones and an average productivity of about 23.72 q/ha.In Bihar, rice is cultivated in around 3.34 mha with a production of 7.2 million tones and productivity of 21.58q/ha. Rice is grown in both kharif and rabi seasons under diverse ecological and climatic conditions apart from socio-economic diversities of the state. 33 percent of total area under rice has got irrigational facilities and rest is totally dependent upon rainfall. Among various depressing factors, abiotic stress i.e. water and nutrient stress and biotic stress i.e. weed infestations in the field are the most crucial factors due to which rice production is unpredictable and considerably low.Weed infestation during early period of crop growth caused yield reduction or sometimes more depending upon the type of the weeds and their population.
MATERIALS AND METHODS
Present experiment aims to investigate different planting methods and weed control measureson growth parameters, yield attributes and yield of direct seeded rice crop grown under sub-tropical situation. The experiment was laid down under split plot design with three main plots(planting methods) and seven weed control measures (sub-plots) with three replications.
It is I
LLEGAL t
o cop
y, pri
nt or
save
any c
onten
t of th
is PDF,
in pa
rt or in
full,
on an
y retr
ieval
syste
m,
withou
t the E
XPRESS WRITTEN PERMISSIO
N of th
e cop
yrigh
t-hold
er

National Conference on Climate Change and Agricultural Production: Adapting Crops to Climate Variability and Uncertainty, 6th–8th April, 2017
[91]
RESULTS AND DISCUSSION
Major weeds associated with direct seeded rice were Cyperusrotundus (62.66%), Cyanodondactylon (26.5%), Physallis minima (10.16%) and Dactylocteniumaegyptium(3.11%) during the entire growth period of rice. Among different planting methods, puddling reduced the population of all the weed species as well as total population as compared with the zero tillage and dry seeding method. Dry seeding after monsoon resulted in higher population of all the weeds. Two hand weedin gat 20 and 40 DAS recorded least weed population (14.97/m2) followed by Pretilachlora.i. 1.5 Kg/ha + one hand weeding at 30 DAS (19.23/ m2) as compared to control (52.63 /m2).Yield attributes such as plant height, number of tillers and panicle length were significantly increased in puddling method. Themaximum rice yield was recordedin puddling (35.77q/ha) followed by zero-tillage (33.91q/ha) and least in dry seeding (28.63 q/ha) planting method.In case of weed control measures the maximum yield was recorded (38.20q/ha) in two hand weeding at 20 and 40 DAS. The magnitude of yield increased by 5.91% and 19.96% in puddling over dry seeding and zero-tillage planting method, respectively.
REFERENCES [1] Mishra J.S. and Singh V.P. 2008. Integrated weed management in dry-seeded irrigated rice (Oryza sativa). Indian Journal of Agronomy
53 (4): 299-305. [2] Singh Kayam and Tripathi H P 2007. Effect of nitrogen and weed control practices on performance of irrigated direct-seeded rice (Oryza
sativa). Indian Journal of Agronomy 52 (3): 231-234.
Development of Innovative Farming Practices to Mitigate the Effects of Climate Change
K. Sathiya Bama, E. Somasundaram, R. Sathya Priya and K.R. Latha Department of Agronomy, Directorate of Crop Management,
Tamil Nadu Agricultural University, Coimbatore-641003, India E-mail: *[email protected]
Keywords: Farming Practices, Minimum tillage, Carbon stock
INTRODUCTION
Conservation agriculture is one of the farming practices which can contribute to making agricultural systems more resilient to climate change. It has proven fact of potential to improve crop yields along with environmental and financial sustainability and to reduce greenhouse gas emissions and enhance their role as carbon sinks (Zuber, 2015). Promoting farm practices such as crop rotation, tillage practices, residue addition and nutrient management can help meet this goal. Research result may be region and soil specific. Thus, the objective of this study is to determine the effect of crop rotation, nutrient sources and tillage on crop productivity and soil health sustenance in an vertisol of Tamil Nadu.
MATERIALS AND METHODS
To study the effect of tillage practices in different cropping sequences with nutrient sources on soil health and to identify the suitable climate change mitigation practices, the experiment was initiated at Tamil Nadu Agricultural University, Coimbatore during 2012-13. It was continued for three years. The treatments are tillage practices (minimum and conventional) are the main plots, cropping sequences (Cotton-Green Gram, Veg. Cowpea–Sunflower , Red gram–Maize , Bhendi–Maize ) and sub-plots viz., Mulch (M1 : No mulch,M2 : Crop
It is I
LLEGAL t
o cop
y, pri
nt or
save
any c
onten
t of th
is PDF,
in pa
rt or in
full,
on an
y retr
ieval
syste
m,
withou
t the E
XPRESS WRITTEN PERMISSIO
N of th
e cop
yrigh
t-hold
er

National Conference on Climate Change and Agricultural Production: Adapting Crops to Climate Variability and Uncertainty, 6th–8th April, 2017
[92]
residue mulch -crop residue recycled as in–situ) and nutrient sources (F1: Recommended dose of Fertilizer (RDF), F2: 75% RDF + 25% N through organic manure ). Fertiliser doses vary for different crops followed in different cropping system and applied as per Tamil Nadu crop production guide recommendation. Crop yield and energy use interm of carbon foot print also worked out using standard protocol.
RESULTS AND DISCUSSION
To compare and identify the suitable farming practices, the crop economic yield was converted into cotton equivalent yield and the results are discussed. The results indicated that irrespective of the cropping sequence conventional tillage recorded higher economic yield (2956 kg/ha). Irrespective of tillage and crop rotation, higher cotton equivalent yield recorded in mulch + 75% recommended dose of fertilizers and 25% N through organics (3014 kg/ha). Over all higher cotton equivalent yield of 4390 kg/ha was recorded under in bhendi maize cropping sequence followed by cotton-green gram (3250 kg/ha). The results on soil carbon indicated that irrespective of other treatments, the cropping sequence bhendi-maize recorded higher carbon stock of 11.24 t/ha/yr followed by cotton-green gram (10.86 t/ha/yr).Temperature of soil is one of the chief factors influencing the activity of plants and soil organism and the chemical reactions that take place in the soil. Minimum tillage recorded comparatively less soil temperature (37.1oC) than conventional tillage practices (41.0oC). Irrespective of the cropping system, at 75% recommended dose of fertiliser + 25% N through organics with residue addition, recorded minimum soil temperature of 37.8oC. To conclude minimum tillage with 75% recommended dose of fertilizer + 25% N through organics with mulching is suitable for majority of the crops, to mitigate the effects of climate change. Bhendi-maize cropping sequence is found to be registered more carbon in the soil as well as fix more carbon in biomass fromthe atmosphere through photosynthesis.
REFERENCES [1] Zuber S M, Gevan D, Behnke, Emerson D, Nafziger and Maria B Villamil 2015. Crop Rotation and Tillage Effects on Soil Physical and
Chemical Properties in Illinois Agronomy Journal 107: 971–978.
Adaptation of Pulses as Relay Crop: A Potential Technology under Changing Climate Scenario
G.L. Choudhary1 and K. Lakshman2 1Regional Research Sub-Station, Jalalgarh–854337
2Jute Research Station, Katihar–854103, India E-mail: *[email protected]
Keywords: Climate change, Pulses, Relay cropping
Relay cropping, a new technique of multiple cropping developed at the Indian Agricultural Research Institute, New Delhi is analogous to a relay race where one crop hands over the land to the next crop in quick succession. The relay cropping system aims at increasing the efficiency of farm inputs to maximize output through a judicious selection of crops and their varieties tailored to fit into a tight schedule of farm operations and opening vast avenues of employment opportunities even on small farms. In humid regions of North-East India and drier regions of central and coastal regions of South India, there is a practice of growing some of the pulses like urdbean, mungbean, lentil, lathyrus etc. before harvest of previous crop commonly known as paira/utera cropping which facilitates double cropping and sustainable production of the systems. This practice facilitates double crop and is sustainable. Here, pulse seeds are broadcast in the standing crop of rice
It is I
LLEGAL t
o cop
y, pri
nt or
save
any c
onten
t of th
is PDF,
in pa
rt or in
full,
on an
y retr
ieval
syste
m,
withou
t the E
XPRESS WRITTEN PERMISSIO
N of th
e cop
yrigh
t-hold
er

National Conference on Climate Change and Agricultural Production: Adapting Crops to Climate Variability and Uncertainty, 6th–8th April, 2017
[93]
about two weeks before harvest, enabling use of available soil moisture. Experimental evidences showed that paira cropping produced more yield of pulses than planting with tillage after harvest of rice (ICRISAT, 2016). This system is generally followed for sowing of lentil under aman (kharif) rice. Under such conditions, timely planting is very important for utilization of residual soil moisture for obtaining better emergence and early establishment. Sowing of primed seeds 15 days before rice harvest helps in improving plant stand, growth and yield of lentil (Bhowmick, 2010). Uttera system does not allow agronomic intervention such as tillage, weeding, irrigation and fertilizer application. However, rice variety decides the productivity of pulses in this system. There are certain issues which needs to be resolved for better productivity and profitability. To achieve higher productivity of the pulses under utera conditions, location specific high yielding genotypes with early vigour, earliness, close canopy, synchronous maturity, resistance to key diseases and insect-pests and tolerance to moisture stress need to be developed for various agro climatic zones. Other issues to be solved are identification and use of efficient strains of Rhizobium and phosphate solubilizing bacteria (PSB) for seed inoculation, developing an integrated nutrient management schedule for the system as a whole, exploring the possibilities of foliar nutrition, choosing genotypes with higher weed suppression ability, identification of post-emergence herbicides and efficient application techniques and utilizing residual efficacy of herbicides by applying the same in preceding crops. Most of the area of south eastern Uttar Pradesh in Vindhyan region is rainfed and chickpea is grown after rice. Sowing of chickpea is generally delayed by 10-15 days when sown after the harvest of the rice for soil to reach proper moisture after pre-sowing irrigation and for seedbed preparation. Due to this, delayed sowing of chickpea in the end of November may cause heavy reduction in chickpea yield. Sowing of chickpea by Uttera method in standing rice crop (about 10 days before rice harvest) gave 45% higher yield than the sowing after proper seed bed preparation (Tripathi, 1986). The primary reason for the benefits from pulses in lowering green house gases (GHG) emissions is due to lower fertilizer requirements and reducing the need of fertilizers in the succeeding crops especially nitrogenous fertilizer due to their nitrogen fixation ability. Pulses supply their own nitrogen and contribute nitrogen to succeeding crops (Lemke et al., 2007). The second way of reducing the GHG emission by pulses under relay cropping is due to reducing the fossil fuel requirement for field preparation. This technique also saves the huge quantity of irrigation water as pre-saving irrigation. Under changing climate scenario this technique can be prove as climate resilient technique by reducing the non-renewable resource use and mitigating the adverse effects on crop. So, by adopting this technique we can produce higher pulses production with lesser efforts and conserving the environment.
REFERENCES [1] Bhowmick M.K 2010. Effect of planting time and seed priming on growth and yield of lentil under rice-utera system. Journal of Food
Legumes 23 (2): 152-153. [2] ICRISAT 2016. Catch the Pulse. Patancheru 502 324, Telangana, India: International Crops Research Institute for the Semi-Arid Tropics.
pp: 36. [3] Lemke RL, Zhong Z, Campbell CA and Zentner R 2007. Can Pulse crops play a role in mitigating green house gases from North American
agriculture Agronomy Journal 99: 1719-1725. [4] Tripathi H.P. 1986. Performance of chickpea under different methods of sowing after paddy in low and Vindhyan soils. International
Chickpea Newsletter 14: 16-17.
It is I
LLEGAL t
o cop
y, pri
nt or
save
any c
onten
t of th
is PDF,
in pa
rt or in
full,
on an
y retr
ieval
syste
m,
withou
t the E
XPRESS WRITTEN PERMISSIO
N of th
e cop
yrigh
t-hold
er

National Conference on Climate Change and Agricultural Production: Adapting Crops to Climate Variability and Uncertainty, 6th–8th April, 2017
[94]
Improving Heat Tolerance Ability of Late Sown Wheat through Foliar Application of Bioregulators
Savitri Sharma*, B.S. Shekhawat, S.M. Gupta and H.L. Yadav Rajasthan Agricultural Research Institute,
Shri Karan Narender Rajasthan Agricultural University, Jobner–285171, India E-mail: *[email protected]
Keywords: Wheat, Heat tolerance, Bioregulators, Foliar application
INTRODUCTION
Climate change and its variability are emerging as the major challenges likely to impact the sustainability of the Indian agriculture production system. The higher inter and intra- seasonal variability in rainfall distribution, extreme temperature and rainfall events are resulting in crop damage and huge losses to farmers. About 61% total area in Rajasthan is under arid environment and experiences climate extremes events like drought, frost and heat stress. Kalra et al. (2008) conducted an experiment with objective to investigate the effect of increasing seasonal temperature on yield of four important winter crops of the northwestern part of the country namely, wheat, mustard (Brassica sp.), barley (Hordeum vulgare) and chickpea (Cicer arietinum); evaluation of optimum sowing dates for exploring maximum yield potential of wheat and mustard crops, and to understand the variability of climate change on growth and yield of wheat in northwest India using the WTGROWS model and also revealed that rise in temperature by 1°C lead to decline in wheat production by 250 kg ha-1 in Rajasthan and 400 kg ha-1 in Haryana.
MATERIALS AND METHODS
A field experiment was conducted at Agronomy farm, R.A.R.I, Durgapura-Jaipur (Rajasthan) during Rabi, 2013-14 and 2014-15 on loamy sand soil. The twenty treatment combinations consisting of 4 varieties (Raj 4037, Raj 4079, Raj 3765 and DBW 17) and 5 bioregulators (Control, water spray, salicylic acid, thiosalicylic acid and thioglycolic acid) were tested in split plot design with four replications. The soil was loamy sand in texture, alkaline in reaction (pH 8.1). The bioregulators were sprayed with knapsack sprayer at tillering and ear emergence stages as per layout plan. The biological, grain and straw yields recorded under each plot were converted to per hectare by multiplying appropriate factor.
RESULTS AND DISCUSSION
Yield attributing characters viz. effective tillers per metre row length, length of spike (cm), number of grains per spike and 1000-grain weight were positively affected by foliar application of different bioregulators ( salicylic acid, thioglycolic acid and thiosalicylic acid) in all the varieties. Raj 4037 produced significantly higher number of effective tillers per metre row length, length of spike (cm), number of grains per spike and 1000-grain weight and was significantly superior to variety Raj 4079 and DBW 17 and at par with variety Raj 3765. Foliar spray of 100 ppm salicylic acid being at par with 100 ppm of thioglycolic acid and thiosalicylic acid resulted in significantly higher number of effective tillers per metre row length, length of spike (cm), number of grains per spike and 1000-grain weight as compared to control and water spray (Table 1).
Grain and straw yields of wheat was significantly affected by various foliar spray of bioregulators with respect to wheat varieties. Grain yield showed significant variation among the varieties during both the years. Wheat variety Raj 4037 produced significantly higher grain and straw yield than Raj 4079 and DBW 17. With regard to application of bioregulators, foliar spray of 100 ppm salicylic acid resulted in maximum grain yield and
It is I
LLEGAL t
o cop
y, pri
nt or
save
any c
onten
t of th
is PDF,
in pa
rt or in
full,
on an
y retr
ieval
syste
m,
withou
t the E
XPRESS WRITTEN PERMISSIO
N of th
e cop
yrigh
t-hold
er

National Conference on Climate Change and Agricultural Production: Adapting Crops to Climate Variability and Uncertainty, 6th–8th April, 2017
[95]
straw yield which were significantly higher over control and water spray while, it proved at par with TSA and TGA. The response of foliar spray was more pronounced probably due to rapid initial development of the crop and later foliar response of the bioregulators. Sahu (2009) and Godara et al. (2012) in wheat also reported similar results. Different treatments of varieties failed to cause significant variation in harvest index of wheat during both the years. foliar spray of bioregulators significantly increased harvest index during both the years (Table 1).
Table 1: Effect of Varieties and Bioregulators on Yield Attributes and Yield of Wheat (Pooled Data of 2 Years) Treatments Effective
Tillers/m Row Length
Length of Spike (cm)
Number of Grains/ Spike
1000-Grain Weight (g)
Grain Yield (q/ha)
Straw Yield (q/ha)
Harvest Index (%)
Varieties Raj 4037 60.70 11.30 43.12 36.79 38.26 49.96 43.35 Raj 4079 59.03 10.43 40.59 35.40 35.34 46.14 43.36 Raj 3765 59.34 10.87 42.00 35.85 38.02 49.96 43.21 DBW 17 54.78 9.66 37.96 32.14 32.32 42.07 43.43 CD (P=0.05) 2.47 0.45 1.50 1.62 1.68 2.20 NS Bioregulators No spray (control) 55.07 9.83 38.14 32.60 33.07 43.97 42.93 Water spray 56.44 10.06 39.12 33.81 34.11 45.19 42.99 Thiosalicylic acid (100 ppm) 59.69 10.85 41.65 35.81 37.10 48.23 43.48 Salicylic acid (100 ppm) 61.04 11.10 43.33 37.01 38.06 49.26 43.63 Thioglycolic acid (100 ppm) 60.07 10.98 42.34 35.99 37.59 48.50 43.67 CD (P=0.05) 2.53 0.37 1.69 1.58 1.68 2.19 0.42
REFERENCES [1] Godara A S, Gupta U S and Singh R 2012. Effect of heat stress Mitigating strategies an growth and productivity of wheat under semi-arid
conditions of Rajasthan. 3rdInteranational Agronomy Congress held at New Delhi 2: 26-30. [2] Kalra N, Chakraborty D, Sharma A, Rai H K, Jolly M, Chander S, Kumar R, Bhadraray P, Barman S, Mitta D, La R B and Mohanand
Sehgal M 2008. Effect of increasing temperature on yield of some winter crops in North-West India.Current Sciences 94: 82-88. [3] Sahu M 2009. Role of thiourea in improving productivity of wheat (Triticum aestivum L.).Plant Growth Regulators 14: 169-173.
Impacts of Planting Techniques and Nutrient Management on Yield-Scaled Greenhouse Gas Emissions from Rice Crop in Eastern India
Suborna Roy Choudhury1*, Anupam Das2, R.P. Sharma1 and S. Sheraz Mahdi1 1Department of Soil Science and Agricultural Chemistry, 2Department of Agronomy
1,2Bihar Agricultural University, Sabour–813210, Bhagalpur, India E-mail: *[email protected]
Keywords: Greenhouse Gas, Organics, Labile Carbon, DSR
INTRODUCTION
Increased interest in direct seeded rice (DSR), results from changes in the economic circumstances of crop production, on account of more profit, less water and labour requirement as compared to system of rice intensification (SRI) and transplanted rice (TPR) along with the nutrient management interventions in the cultivation practices of rice crop, is raised. Highly nutrient input oriented soil and persisting climate exert a strong influence on the success of the rice sowing method used. Moreover, crop establishment methods influence the carbon dynamics and greenhouse gas emission. Thus this study was aimed to reveal the integrated effect of planting methods and nutrient management on greenhouse gas emission and carbon pools in rice.
It is I
LLEGAL t
o cop
y, pri
nt or
save
any c
onten
t of th
is PDF,
in pa
rt or in
full,
on an
y retr
ieval
syste
m,
withou
t the E
XPRESS WRITTEN PERMISSIO
N of th
e cop
yrigh
t-hold
er

National Conference on Climate Change and Agricultural Production: Adapting Crops to Climate Variability and Uncertainty, 6th–8th April, 2017
[96]
MATERIALS AND METHODS
Afield experiment was conducted during 2013-15 at the Bihar Agricultural University, Sabour, India, in rice crop (var. Rajendra Suwashini) with the treatments viz. SRI, TPR and DSR in main plots and 100 percent recommended dose of fertilizer (RDF) [100 kg N + 40 kg P2O5+ 20 kg K2O ha-1
] through mineral fertilizer, 25 percentN of RDF substituted through organics (vermicompost), 50 percent N of RDF substituted through organics and 100 percent RDF + greenmanuring (Mung) @ 25kgha-1in subplots; arranged in split plot design with three replication. The gas samples were analyzed by gas chromatograph (SCION 456-GC, Bruker). Based on a 100-year time frame, the global warming potential (GWP) coefficients for CO2, CH4 and N2O are 1, 25 and 298, respectively (IPCC, 2007).
RESULTS AND DISCUSSION
DSR was superior as compared to SRI and TPR as far as greenhouse gas intensity (GHGI) is concerned. DSR reduced the CH4emission by 52.7 and 62.6 percent over SRI and TPR respectively hence, the GWP was reduced by 47-57 percent over SRI and TPR.Incorporation of green manure with 100percent RDF reduced the GHGI rather than N substitution through organics by 14.7-27 percent. This is due to the less greenhouse gas emission and increase in yield over other organics substituted treatments. The synergistic effect of green manuring also combat N2O flux than 100 percent RDF (Table 1).In addition to that direct seeded rice resulted highest organic carbon content among the other crop establishment methods which was 1.9-7.6 percent higher than TPR and SRI mostly due to the increase in labile carbon pools. Addition of organic manure significantly increased organic carbon content. Fractionation of organic carbon showed significant variation in labile carbon, whereas non labile pool of carbon did not show any significant change (Table2). Direct sowing of rice along with the efficient utilization of natural resources are, therefore, of great concern to cope with anticipated climate change impacts, for maintaining the food security and sustainability of agricultural production and could be encouraged by government financial assistance in recognition of environmental benefits, and crop adaptability is concerned.
REFERENCES [1] IPCC2007. Contribution of Working Group II to the Fourth Assessment Report of the Intergovernmental Panel on Climate Change.
M.L. Parry, O.F. Canziani, J.P. Palutikof, P.J. van der Linden and C.E. Hanson (eds), Cambridge University Press, Cambridge, United Kingdom and New York, NY, USA.
[2] Matthews R2002. Rice Production. Climate Change and Methane Emissions: Adaptation and Mitigation Options. Rice Science: Innovations and Impact for Livelihood. Proceedings of the International- Rice Research Conference, Beijing, China, 16-19 September–2002 p. 585–598.
[3] Muramatsu Y and Inubushi K2009. Estimation of Seasonal Changes in Methane Oxidation in Paddy Soil.Horticulture Research 63: 27-33.
Table 1: Effect of Cultivation Techniques on Cumulative Greenhouse Gas Emission and Greenhouse Gas Intensity in Rice
Treatment CH4-C Emission (Kg
ha-1)
CO2-C Emission (kg ha-1)
N2O-N Emission (Kg ha-1)
GWP (Kg CO2 eq ha-1)
GHGI (Kg CO2 eqkg-1
Grain Yield) Main Plot System of rice intensification (SRI) 471.0b 120.7b 0.50b 16608b 3.41b Transplanted rice (TPR) 596.5a 107.5c 0.27c 20526a 4.42a Direct seeded rice DSR) 223.0c 184.2a 0.77a 8829c 2.15c Sub plot 100% RDF 386.7b 92.9c 0.59a 13784a 2.98b 75% RDF + 25% Organics 443.2a 112.7a 0.47b 15627a 3.52a 50% RDF + 50% Organics 471.8a 114.5a 0.44b 16629a 3.90a 100% RDF + green manuring 418.1b 100.1b 0.54a 14810a 3.07ab
It is I
LLEGAL t
o cop
y, pri
nt or
save
any c
onten
t of th
is PDF,
in pa
rt or in
full,
on an
y retr
ieval
syste
m,
withou
t the E
XPRESS WRITTEN PERMISSIO
N of th
e cop
yrigh
t-hold
er

National Conference on Climate Change and Agricultural Production: Adapting Crops to Climate Variability and Uncertainty, 6th–8th April, 2017
[97]
Table 2: Soil Organic Carbon Pools as affected by Crop Establishment Methods Treatments Very Labile Labile Less labile Non labile
Main Plot (g C kg-1) System of rice intensification (SRI) 3.01c 1.75b 0.34b 0.36 Transplanted rice (TPR) 3.20 b 1.81a 0.39a 0.40 Direct seeded rice DSR) 3.25a 1.86a 0.40a 0.41ns Sub Plot (g C kg-1) 100% RDF 3.05c 1.75a 0.36b 0.36 75% RDF + 25% Organics 3.31b 1.69b 0.40b 0.38 50% RDF + 50% Organics 3.39a 1.65b 0.46a 0.39 100% RDF + green manuring 3.07c 1.74a 0.36b 0.37ns
Different letters within the same column indicate significant differences in variable means among treatments over the seasons based on the Tukey’s HSD mean separation test (P<0.05)
Impact of Climate Change on Production and Productivity of Pulses in Banka District, Bihar
Raghubar Sahu*, Kumari Sharda and Sanjay Kumar Mandal
Krishi Vigyan Kendra, Banka–813102, India E-mail: *[email protected]
Keywords: Climate Change, Production, Productivity, Pulses, Banka.
INTRODUCTION
The global climate change and extreme weather fluctuations are the most threatening challenges of this century to agriculture. Pulse production, pulse security and climate change are intrinsically linked. Whether in the form of droughts, floods, hurricanes or soil acidification, climate change impacts every level of pulse production and the food security of affected farming communities. While its impact varies across crops and regions, climate change puts global food security even more at risk and heightens the dangers of under nutrition in poor regions. With rising temperature and uncertainty in climate, the prediction of biotic and abiotic stresses more severe and complicated in terms of their scope and spectrum, which adversely impact productivity and stability of production of pulse crops. To meet these emerging challenges of climate change, there is an urgent need for improving productivity of pulse crop by mitigating and combating adverse impacts of climate change and climate variability in Banka district. Date of sowing play an important role in pulse production in today’s climate change Agriculture. Therefore, this study has been taken in Banka district to know the constraints of increasing production and productivity of pulses so that needful operations can be applied to improve pulse production.
MATERIALS AND METHODS
The present study of chickpea has been conducted under cluster frontline demonstration programme of ministry of agriculture and farmers’ welfare, govt. of India. The cluster frontline demonstration was conducted in 05 villages of the different blocks of Banka district. All the fields are well leveled having good soil condition and drainage facility available. The soil sample used for mechanical analysis were analysed for available nitrogen, phosphorus, potassium, organic carbon, soil ph and electrical conductivity. The treatments are comprised with different dates of sowing particularly third, fourth week of November and first second week of December as harvesting of paddy is late in this district. The experiment is analysed with Randomized Block design with three replications. Data (plant height, total dry matter at harvest, pods/plant, no. of branches at
It is I
LLEGAL t
o cop
y, pri
nt or
save
any c
onten
t of th
is PDF,
in pa
rt or in
full,
on an
y retr
ieval
syste
m,
withou
t the E
XPRESS WRITTEN PERMISSIO
N of th
e cop
yrigh
t-hold
er

National Conference on Climate Change and Agricultural Production: Adapting Crops to Climate Variability and Uncertainty, 6th–8th April, 2017
[98]
harvest, no. of root nodules at 60 DAS (Days after sowing), dry matter of nodules seeds/plant at 60 DAS as well as seed and haulm yield) were gathered by using self made interview schedule and time to time visit of the farmers’ field. The chickpea variety GNG-1581 was sown for the experiment on different dated with different locations at 7 days interval ie. 17 November, 24 November, 01 December and 08 December. Nitrogen 18 kg/ha and phosphorus 46 kg/ha were applied through Diammonium phosphate as per recommendation. The available nitrogen and phosphorus are low and potassium is medium in range during experiment.
RESULTS AND DISCUSSION
It is revealed from the data, all the growth and yield attributing characters ie. plant height, total dry matter at harvest, pods/plant, no. of branches at harvest, no. of root nodules at 60 DAS, dry matter of nodules seeds/plant at 60 DAS as well as seed and haulm yield were significantly higher with GNG-1581 as compared to local variety which has been sown in 24 November. Thus the net return (67800) and B: C (1:3.05) ratio was significantly superior in GNG-1581 of 24 November sowing. Thus it may be concluded that the GNG-1581 variety of chickpea was most suitable crop if it is sown during third week of November is B: C Ratio and net return was also higher in crop grown during this period as compared to local variety of chickpea in Banka district for higher production and productivity.
Innovative Techniques to Obviate Edaphic and Drought Stresses in Orchards Grown on Shallow Basaltic Soils of Deccan Plateau
Y. Singh*, D.D. Nangare, P. Suresh Kumar, M. Kumar, S.K. Bal, J. Rane and N.P. Singh ICAR-National Institute of Abiotic Stress Management, Baramati, Pune, India
E-mail: *[email protected]
Keywords: Pomegranate, Basaltic land, Shallow soil, Edaphic stress
INTRODUCTION
About 42% (6 m ha) of degraded land in India mainly suffers with hard pan and having shallow soil depth. Resultant edaphic and drought stresses in these lands reduce the longevity and potential yields of orchards especially due to high vulnerability to droughts. Moreover, the impact of climate change on land degradation has drawn worldwide attention wherein the importance of geological formation has been taken as an important stress parameter to define the quantum of degradations. The negative impacts of shallowness in terms of low water retention, hard rocks and murrum etc. are the major constraints for establishment of orchards in shallow basaltic soils of Maharashtra. Therefore an experiment has been initiated at ICAR-NIASM, Baramati address these issues.
MATERIALS AND METHODS
Experiment entitled “Innovative Techniques to obviate edaphic & drought stresses on pomegranate grown in shallow basaltic soils” has been initiated in 2013 at ICAR-NIASM on pomegranate (shallow rooted), guava (medium rooted) and sapota (deep rooted) to evaluate the various planting methods and soil mixtures for better establishment and productivity. The planting methods included viz., auger, trench, mini trench, pit planting along with filling mixtures (native murrum soil, black soil, mixture of murrum and black soil) and in addition micro-blasting was carried out to enhance rooting depth by 1 m. Experiment has been conducted in
It is I
LLEGAL t
o cop
y, pri
nt or
save
any c
onten
t of th
is PDF,
in pa
rt or in
full,
on an
y retr
ieval
syste
m,
withou
t the E
XPRESS WRITTEN PERMISSIO
N of th
e cop
yrigh
t-hold
er

National Conference on Climate Change and Agricultural Production: Adapting Crops to Climate Variability and Uncertainty, 6th–8th April, 2017
[99]
RBD with four replications. Plant responses are being measured in terms of plant height, rootstock and scion girth, no. of branches, canopy spread, pruned biomass weight and physiological responses.
RESULTS AND DISCUSSION
Data revealed that there is significant influence of various treatments on pomegranate in terms of growth, physiological, hyperspectral responses (Fig. 1) and yield (Table 1). The plant height, stem diameter, canopy spread and pruned wood removal in pomegranate were monitoredsignificantly higher in pit and trench planting methods filled up with mixture of native murrum and black soil. Pomegranate yield was also maximum in these treatments as compared to other treatments as well as farmer’s practice. Similarly, net photosynthetic rate (32.44 µmol m-2 s-1) and stomatal conductance (163.36 m mol m-2 s-1) measured through IRGA, revealed that highest values were obtained under treatments planted by pit and trench methods having mixture of soils with additional 1 m soil depth by micro-blasting. Thesoil moisture content was higher in treatments with blasting (19.50%) than without blasting (14.98%). Mixtures of black soil and native murrum are performing better than 100 percentblack soil in terms of plant growth and its physiological activities under limited moisture availability. The activity of enzymes like nitrate reductase, catalase and superoxide dismutase activities were also lower under treatment having mixture of soils and planted in pit and trench with additional 1 m depth by micro-blasting. Micro-blasting proved its superiority over without micro-blast treatments in establishment of these orchards. Overall, the mixtures of soil with micro-blasting and planted either in trench or pit performed better than all other treatments. Black soil, in spite of popular belief resulted inferior performance than mixtures of soil and native murrum.
Table 1: Effect of Various Treatments on Pomegranate Yield (kg/ Plant) Planting Method
Without blasting With Blasting
Native Native + Spent Wash
Native + Black
Black
Native Native + Spent Wash
Native + Black
Black
Auger 13.3 13.6 15.6 10.9 13.9 14.3 16.5 11.7 Pit 15.5 16.5 19.9 - 18.2 - 22.3 - Trench (2*1) 16.0 - 21.1 - 18.7 - 24.3 - Trench 15.6 - 20.6 - 18.2 - 23.1 - FP 12.9 13.4 - - - - - -
Fig. 1: Influence of Various Treatments on Hyper-spectral Reflectance
REFERENCE [1] Minhas P S, Bal S K, Suresh Kumar P, Singh Yogeshwar, Wakchaure G C, Ghadge S V, Nangare D D and Taware P B 2015. Turning
Basaltic Terrain into Model Research Farm: Chronicle Description.NIASM Technical Bulletin 8, ICAR-National Institute of Abiotic Stress Management, Baramati, Pune, Maharashtra (India) pp. 64.
It is I
LLEGAL t
o cop
y, pri
nt or
save
any c
onten
t of th
is PDF,
in pa
rt or in
full,
on an
y retr
ieval
syste
m,
withou
t the E
XPRESS WRITTEN PERMISSIO
N of th
e cop
yrigh
t-hold
er

National Conference on Climate Change and Agricultural Production: Adapting Crops to Climate Variability and Uncertainty, 6th–8th April, 2017
[100]
Understanding and Restoring SOC for Climate Smart Agriculture
Ruby Saha1*, Ajay Kumar1 and Ram Pal2 1Irrigation Research Station, Bikramganj, Bihar Agriculture University, Sabour–813210, India
2Krishi Vigyan Kendra, Bikramganj, Rohtas, India E-mail: *[email protected]
Keywords: Soil, Soil organic carbon, GIS, Climate
INTRODUCTION
Soil organic carbon (SOC) is an important component of the three main aspects of soil fertility: helping release of nutrients such as nitrogen and phosphorous, binding soil mineral particles together for increased water holding and infiltration capacity and providing a key food source for flora and fauna. Increasing and retaining SOC content is therefore an important mechanism for improving soil ‘health’ as well as mitigating climate change by reducing carbon emissions. The present studies aimed to explore various technologies which targets on enriching the soil organic carbon.
MATERIALS AND METHODS
For increasing SOC and to rectify imbalance use of fertilizers besides boosting productivity and farm incomes “Soil Health Card” scheme is launched by Government of India in the year 2015. This scheme is an ambitious makeover of Government’s earlier scheme NPMSH & F (National Project on Management of Soil Health and Fertility), launched during 2008-09. Under this surface samples were collected using a hand held GIS (Geographical Information System) on grid points. Latitude of Bikramganj block ranges from 25008.560’ N to 25014.869 N and longitude from840 10’240”E to 840.20’355”E whereas for Karakat block 2504.590 N to 25012.705N and 840 15’595” and 840 25’115” respectively. A total number of 115 and 193 surface soil (0-15 cm) samples were collected with GIS from different locations of Bikramganjand Karakatblocks on Grid basis, respectively. The soil organic carbon (OC) content of the collected soils samples were determined by chromic acid wet oxidation method (Walkley and Black, 1934).
RESULTS AND DISCUSSION
Soils were categorized as low, medium and high as per criteria used in soil testing laboratories. Interesting variation with respect to SOC content was observed. Based on the limits for organic carbon i.e. low(<0.50%), medium (0.50-0.75%) and high (>0.75%), the soils were categorized in three categories. The range of organic carbon was 0.30 to 0.74% in Bikramganj and 0.15 to 0.72%in Karakat.Thecomparisonof different years data indicate that in 2015-16 more number of samples fall under ‘low category’than in the year 2010-11. Similarly very few number of samples fall under the category high in the year 2015-16 than in the year 2010-11. It shows that over the years there is a decline in SOC content in the soils of Bikramganj and Karakat blocks. This is mainly due to excess use of chemical fertilizers and burning of crop residues in the field.Farmers in Rohtas district especially inBikramganj and Karakat blocks dispose a large part of rice straw by burning in situ. The main reason for burning crop residue is unavailability of labour and use of combine harvester in rice-wheat cropping system prevailing in this area. Organic carbon content in soil can be increased by more precise nutrient management employing Grid Sampling and adopting certain technologies likezero tillage (zero till seed drill, happy seeder, strip till drill etc.) bio-char production, residue management (straw bailerand strawreaper).All these technologies and management will increase the soil organic matter hence improving ‘soil health’ as well as mitigating climate change.
REFERENCE [1] Walkley A J and Black C A 1934.Estimation of soil organic carbon by the chromic acid titration method. Soil Science 37:29-38.
It is I
LLEGAL t
o cop
y, pri
nt or
save
any c
onten
t of th
is PDF,
in pa
rt or in
full,
on an
y retr
ieval
syste
m,
withou
t the E
XPRESS WRITTEN PERMISSIO
N of th
e cop
yrigh
t-hold
er

National Conference on Climate Change and Agricultural Production: Adapting Crops to Climate Variability and Uncertainty, 6th–8th April, 2017
[101]
Response of Wheat Varieties to Foliar Application of Bioregulators under Late Sown Condition
Savitri Sharma*, B.S. Shekhawat, Surendra Singh and R.R. Choudhary Rajasthan Agricultural Research Institute
Shri Karan Narender Rajasthan Agricultural University, Jobner-302018,India. E-mail: *[email protected]
Keywords: Wheat, Varieties, Bioregulators
INTRODUCTION
Variability in Climate is the most important global environmental challenge facing humanity with implications for natural ecosystems, agriculture and health. The perusal of general circulation models (GCM s) on climate change indicate that rising levels of greenhouse gases are likely to increase the global average surface temperature by 1.5-4.5°C over the next 100 years. The difference of average temperature between the last ice age and present climate is 6°C. This will raise sea-levels, shift climate zones pole ward, decrease soil moisture and storms.
MATERIALS AND METHODS
A field experiment was conducted at Agronomy farm, R.A.R.I, Durgapura-Jaipur (Rajasthan) during rabi, 2013-14 and 2014-15 on loamy sand soil. The twenty treatment combinations consisting of 4 varieties (Raj 4037,Raj 4079,Raj 3765 and DBW 17) and 5 bioregulators (Control, water spray, salicylic acid, thiosalicylic acid and thioglycolic acid) were tested in split plot design with four replications. The soil was loamy sand in texture, alkaline in reaction (pH 8.1). The bioregulators were sprayed through knapsack sprayer at tillering and ear emergence stages as per layout plan. The biological, grain and straw yields recorded under each plot were converted to per hectare by multiplying appropriate factor. Data was statistically analysed by the standard procedure.
RESULTS AND DISCUSSION
The wheat varieties differed significantly with respect to the plant height and dry matter accumulation at all the growth stages. Variety Raj 3765 recorded the significantly highest plant height over rest of the varieties and accumulated the maximum and significantly higher dry matter accumulation plant-1 over Raj 4079 and DBW17, However it was at par with Raj 3765 at 60, 90 DAS and at physiological maturity. Significant increase in plant height at 60, 90 DAS and at harvest was observed due to foliar application of 100 ppm salicylic acid (SA) and also found Significant increase in dry matter accumulation per plant at 60, 90 DAS and at physiological maturity as compared to control and water spray and remained at par with thiosalicylic acid and thioglycolic acid . Variety Raj 4037 produced significantly higher CGR, LAI, LAD and NAR and was significantly superior to variety Raj 4079 and DBW 17 and at par with variety Raj 3765. Dhynani et al. (2013) also reported differential growth behavior of wheat varieties in terms of CGR, RGR and NAR. Foliar spray of 100 ppm salicylic acid being at par with 100 ppm of thioglycolic acid and thisalicylic acid resulted in significantly higher CGR, LAI, LAD and NAR as compared to control and water spray.
REFERENCES [1] Dhynani K., Ansari M.W., Rao Y.R., Verma R.S. and Shukla A. Tuteja 2013. Comparative Physiological response of wheat genotype
under terminal heat stress. Plant Signal Behaviour 12(6): 8.
It is I
LLEGAL t
o cop
y, pri
nt or
save
any c
onten
t of th
is PDF,
in pa
rt or in
full,
on an
y retr
ieval
syste
m,
withou
t the E
XPRESS WRITTEN PERMISSIO
N of th
e cop
yrigh
t-hold
er

National Conference on Climate Change and Agricultural Production: Adapting Crops to Climate Variability and Uncertainty, 6th–8th April, 2017
[102]
Effect of Weather Parameters on Flowering and Fruiting Behavior of Litchi (Litchichinensis Sonn,) In Agro Climate of Indo
Gangetic Plain of Bihar
Ruby Rani*, H. Mir, V.B. Patel, Shweta Kumari and Rashmi Kumari Department of Horticulture (Fruit & Fruit Technology) Bihar Agricultural University, Sabour–813210, India
E-mail: *[email protected]
Keywords: Litchi, Flowering, Fruiting, Maturity, Temperature, Humidity
INTRODUCTION
Litchi is an evergreen subtropical fruit crop and is very fastidious for its climatic requirement and requires very specific temperature for its vegetative growth, flowering and fruiting behaviour, maturity and fruit quality. The climate of Bihar is well suited for litchi cultivation and this state is leading in litchi production in the country .The unusual change in weather parameters has greatly affected the yield and quality of litchi (Menzel and Simpson, 1995) Thus the experiment was conducted to study the effect of weather parameters on flowering and fruiting behavior in commercial litchi cultivars.
MATERIALS AND METHODS
The experiment was conducted at Bihar Agricultural College, Sabour in seven bearing litchi cultivars. Observations on flowering and fruiting parameters like date and duration of panicle emergence, anthesis, duration of flowering, fruit set and retention, maturity period , fruit cracking and yield were recorded for continuous five years from 2011 to 2015 The seven commercial varieties chosen to study were Deshi, shahi,Ojhauli, Purbi, China, Bedana and Kasba. Meteorological data like weekly maximum and minimum temperature , humidity and rainfall were recorded for the period from November to June for all the five years. The data on flowering and fruiting like initiation of flowering and fruit set, extent of fruit drop, maturity time of litchi were correlated with weather parameters.
RESULTS AND DISCUSSION
Significance influence of variation in weather parameters during different years on flower and fruit set pattern in different varieties of litchi were recorded. Effect of temperature was observed on flowering behavior of litchi.The average maximum and minimum temperature of 19.9 C and 7.5 C, respectively 40 days before panicle emergence during 2012-13 delayed the initiation of panicle emergence by 8-12 days in different litchi varieties. Whereas it enhanced by 6-7 days during 2015-16 when the average maximum and minimum temperature were 22.8 and 8.9 C , respectively. Similarly temperature also played important role in duration of flowering and fruit set, fruit drop and fruit maturity. An average maximum and minimum temperature of 36.91 C and 22.23 C , respectively during fruit growth period hasten the colour break period and fruit maturity 10-12 days during 2015-16 whereas it delayed during 2012-13 by 6-9 days when average maximum and minimum temperature during the same period was 34.32 C and 21.06C , respectively. Pronounced effect of temperature and humidity during fruit growth and development on sun scalding and fruit cracking was also observed. Varietal response was also noted in this regard.Change in weather parameters greatly affected the initiation of flowering and fruits set. Higher temperature caused early and short duration in flowering and fruit set. High temperature immediately after fruit set resulted in high extent of fruit cracking and hastened fruit maturity by 7-10 days in different.
REFERENCES [1] Menzel C M and SimpsonD R 1995. Temperatures above 20°C reduce flowering in lychee (Litchi chinensis Sonn.).Journal of Horticultural
Science 6: 981-987.
It is I
LLEGAL t
o cop
y, pri
nt or
save
any c
onten
t of th
is PDF,
in pa
rt or in
full,
on an
y retr
ieval
syste
m,
withou
t the E
XPRESS WRITTEN PERMISSIO
N of th
e cop
yrigh
t-hold
er
National Conference on Climate Change and Agricultural Production: Adapting Crops to Climate Variability and Uncertainty, 6th–8th April, 2017
[103]
Acclimatization Capacity of Purple Nutsedge (Cyperusrotundus) under Future Climate Scenarios
Ajit Kumar Mandal1, Ga. Dheebakaran1, Mahamaya Banik2 and Arun Kumar3 1Department of Agro Climate Research Centre,
Tamil Nadu Agricultural University, Coimbatore-641003, India 2Department of Plant Breeding and Genetics,
Mahatma Phule Krishi Vidhyapeeth, Rahuri–413722, India 3Department of Environmental Science,
G.B. Pant University of Agriculture and Technology, Pantnagar–263145, India E-mail: *[email protected]
Keywords: Purple nutsedge, Future climate, Elevated temperature, Moisture stress
INTRODUCTION
IPCC, 2013 indicated increase of annual mean temperatures by 1.5–40C by the end of 21th century. Plants may be more often subjected to high temperatures and low soil moisture during the growing season in spring and summer (Knapp et al., 2008). Climate change will impose several challenges for managing weeds. Globally, there is a growing list of recent changes in species’ distributions, abundances and life cycles that are likely to be due to climate change (Naidu et al., 2014).Purple nutsedge is the world’s worst weed distributed in all parts of the world (Holm et al., 1977).
MATERIALS AND METHODS
Pot culture experiments were conducted at Climate Control Chamber of Agro Climate Research Centre, Tamil Nadu Agricultural University, Coimbatore, during 2015 – 2016. The study was conducted with 10 treatments and three replication in Completely Randomized Design. Each treatment was a combination of one temperature and one moisture level. The temperature levels were varied as ambient (0oC), two degree (+2oC), four degree (+4oC) increase over the ambient temperature. The moisture levels were, supply of moisture at 100 per cent of evaporation (M100) and 60 per cent of evaporation (M60) occurred previous day. Trial was conducted for three generations of weed and the temperature levels were varied generation to generation, as per treatment. Each generation is restricted to 45 days and harvested near the ground at the end of each generation.
RESULTS AND DISCUSSION
The data observed at 15 DAP for the effects of different treatments of Plant height (cm), number of leaves (number/plant) and leaf area (cm2) in all three generation are depicted in table 1. The mean value of Plant height, number of leaves per plant and leaf area at 15 DAP were ranged from 14.2 to 21.7, 12.7 to 20.5 and 11.2 to 27.0 cm., 5.6 to 6.9, 7.3 to 8.8 and 7.3 to 9.3 and 11.3 to 27.6, 12.8 to 35.5 and 7.2 to 51.6 cm2 during 1st, 2nd and 3rd generations, respectively. The results of different treatments on growth parameters were positively influenced by elevated temperature and negatively by moisture stress. Treatment T4, received elevated temperature of +40C and 100 per cent moisture produced significantly more height, leaves and leaf area than all other treatments.The same temperature level (+40C) with moisture stress (T9) had also produced more growth than the other treatments with moisture stress (T6, T7 and T8). Ghannoum et al. (2000) and Sage and Kubien (2003) reported that the C4 species exhibit positive responses at arid conditions to elevated temperature and this is in line with present result. The Cyperusrotundus had high acclimatization
It is I
LLEGAL t
o cop
y, pri
nt or
save
any c
onten
t of th
is PDF,
in pa
rt or in
full,
on an
y retr
ieval
syste
m,
withou
t the E
XPRESS WRITTEN PERMISSIO
N of th
e cop
yrigh
t-hold
er

National Conference on Climate Change and Agricultural Production: Adapting Crops to Climate Variability and Uncertainty, 6th–8th April, 2017
[104]
capacity and produced more growth under elevated temperature up to +4oC, with sufficient moisture. Hence, in future elevated temperature condition, during the rainy season, the crop production will suffer with weed menace. So study has to be done to adopt weeds stress tolerance gene to our crops for mitigating climate change impact.
REFERENCES [1] Ghannoum OCS, Ziska LH, and Conroy JP 2000. The growth response of C4 plants to rising atmospheric CO2 partial pressure a
reassessment. Plant, Cell and Environment 23: 931–942. [2] Holm LG, Plucknett DL, Pancho JV and Herberger JP 1977. The World's Worst Weeds. Distribution and Biology. Honolulu, Hawaii, USA
University. [3] IPCC (Intergovernmental panel on climate change) 2013. Climate change 2013 the physical science basis.
(<http://www.ipcc.ch/report/ar5/wg1/>, March 2014). [4] Knapp A K, Beier C, Briske D D, Slassen A T, Luo Y, and Reichstein M 2008. Consequences of more extreme precipitation regimes for
terrestrial ecosystems. Bioscience 58 (9): 811–821. [5] Naidu VSGR, and Murthy TGK, 2014. Crop-weed interactions under climate change.Indian Journal of Weed Science 46 (1): 61–65. [6] Sage R F and Kubien D S 2003. An eco-physiological perspective on global change and the future of C4 plants. Photosynthesis Research
77: 209–225.
Assessment of Genetic Divergence in Fenugreek (Trigonella foenum-graecum L.) based on Biological Characters
Preeti Yadav*, S.K. Tehlan and Sumit Deswal Department of Vegetable Science, CCS Haryana Agricultural University, Hisar–125004
E-mail: *[email protected]
Keywords: D2 statistic, Genetic divergence, Fenugreek, Trigonella foenum-graecum.
INTRODUCTION
The present investigation was carried out to study the extent and pattern of genetic diversity following Mahalanobis D2 (1936) analysis and the population was grouped into clusters by adopting the Tocher’s method as described by Rao (1952) in 60 accessions of fenugreek (Trigonella foenum-graecum L.). Mahalanobis D2 analysis calculates the degree of diversity and determines the relative contribution of each component traits to the total divergence. Information on these aspects in fenugreek is limited and hence there is need for identifying the genotypes having better performance for yield and quality traits which belongs to diverse parents.
MATERIALS AND METHODS
The field experiment was laid out at CCS HAU, Hisar (29°15ˈN, 75°69ˈE) during rabi 2015-16 in randomized block design with three replications. The row length of each genotype was of 3 m with spacing 50 cm. Observations were recorded on ten randomly selected plants from each genotypes in each replications for characters viz. field emergence index, days to 50% flowering, plant height, number of pods per plant, number of branches per plant, number of seeds per pod, pod length, seed yield (q/ha), test weight, seed germination, seed vigour index-I and II.
RESULTS AND DISCUSSION
The genotypes were grouped into seven clusters and the study indicated that there was lack of parallelism between genetic and geographic diversity. Among these, cluster I consisted of 16 genotypes, followed by
It is I
LLEGAL t
o cop
y, pri
nt or
save
any c
onten
t of th
is PDF,
in pa
rt or in
full,
on an
y retr
ieval
syste
m,
withou
t the E
XPRESS WRITTEN PERMISSIO
N of th
e cop
yrigh
t-hold
er

National Conference on Climate Change and Agricultural Production: Adapting Crops to Climate Variability and Uncertainty, 6th–8th April, 2017
[105]
cluster IV (15), cluster II and VI (8), clusters V (7), cluster III (5) and cluster VII was monogenotypic. Intra-cluster distance was highest in cluster VI followed by cluster III. Inter cluster distance was observed maximum in cluster VII and III followed by cluster VII and II and minimum distance observed in cluster I and II. On the basis of cluster mean performance, cluster III and I can be considered better for selecting superior genotypes for most of the characters. The study also revealed that for acquiring heterotic response and better segregants, inter-mating between genotypes of diverse clusters may be undertaken in breeding programmes for improvement of yield and quality traits. Therefore, on the basis of present investigation it can be concluded that hybridization among genotypes of these cluster combinations is expected to enhance variability in fenugreek for the targeted traits.
Fig. 1: Average Intra-(in Circle) and Inter-(between Circle) Cluster D2 Values in 60 Genotypes of Fenugreek
REFERENCES [1] Mahalonobis PC 1936. On the generalized distance in statistics. In: Proceedings of theNational Academy of Sciences (India) 2: 49-55. [2] Rao CR 1952. Advanced statistical methods in biometrical research. John Wiley and Sons, New York.
Euclidean Distance (Not to the Scale)
It is I
LLEGAL t
o cop
y, pri
nt or
save
any c
onten
t of th
is PDF,
in pa
rt or in
full,
on an
y retr
ieval
syste
m,
withou
t the E
XPRESS WRITTEN PERMISSIO
N of th
e cop
yrigh
t-hold
er

National Conference on Climate Change and Agricultural Production: Adapting Crops to Climate Variability and Uncertainty, 6th–8th April, 2017
[106]
Direct Seeded Rice (DSR): Potent Technology to Mitigate Green House Gases from Paddy Fields in Changing Climatic Scenario
N.K. Singh*, Rajesh Kumar, Avinash Kumar, Santosh Kumar and Nilanjaya Department of Plant Breeding and Genetics,
Dr. Rajendra Prasad Central Agricultural University, Pusa–848125, India E-mail: *[email protected]
Keywords: DSR (Direct Seeded Rice), Green House Gases, Herbicide
INTRODUCTION
Global warming is an important issue for humans. A major attributor of global warming is increase in Green House Gases (GHGs). Submerged rice fields are considered to be one of the major sources of CH4 emission from soils. N2O is emitted when nitrogen-based fertilizers are used in agriculture. So, greenhouse gas emissions from paddy fields are considered as one of the most important emission sources. DSR is the technology which is water, labour and energy efficient along with eco-friendly characteristics and can be a potential alternative to TPR (Kumar and Ladha, 2011). Recently, India on 2nd Oct. 2016 ratified provisions of the United Nations Climate Change Conference, 2015 held in Paris, France with a goal of limiting global warming to <2 °C. The agreement calls for zero net anthropogenic greenhouse gas emissions to be reached during the second half of the 21st century. In this context adoption of DSR technology in rice can contribute significantly in limiting the GHG emissions from paddy fields. Keeping in view the above facts, a case study on DSR was conducted by the University at various locations with the objectives; to Create and extend the awareness of DSR technology, popularize package of practices for DSR technology, conserve the resources through DSR and to save environment from methane pollution.
MATERIALS AND METHODS
To achieve these objectives, five KVK’s were selected in five different districts viz. Saran, Muzaffarpur, East Champaran, Begusarai and Siwan of North Bihar and trials were conducted for two consecutive seasons that is Kharif 2014 and Kharif 2015. From each KVK two progressive farmers were identified. For each location one acre of land was utilized. Half acre was used for normal TPR (Traditionally Puddled Rice) and another half acre was used for DSR (Direct Seeded Rice) with appropriate package of practices at all 10 locations and one acre at University farm, Pusa. In DSR trials, selective pre-emergence weedicide Pendimethalin was used within 48 hours of sowing at the dose of 1000ml/200 lit. of water while selective post emergence weedicide Nominee gold (Bispyribac Sodium) was used within 15-20 days of sowing at the rate of 100ml/200 lit. of water for one acre. Irrigation was applied next day and gap filling was also done with subsequent top dressing of Urea for better crop establishment and uniform plant density.
RESULTS AND DISCUSSION
During Kharif-2014 data recorded from farmer’s field for both DSR and TPR trials indicated that yield performance for DSR ranged from 38 to 56 q/ha while, in TPR it ranged from 35 to 48 q/ha (Singh N. K., 2014-15). In DSR more than 40 q/ha yield was recorded at all places except one of the farmer’s field in Siwan district, similarly yield for TPR also exhibited more than 40 q/ha at all places except farmer’s field in Bhatoina village, Muzaffarpur. On critical examination of DSR results it was found that there was no significant difference between DSR and TPR performance. During Kharif-2015, data recorded from farmer’s
It is I
LLEGAL t
o cop
y, pri
nt or
save
any c
onten
t of th
is PDF,
in pa
rt or in
full,
on an
y retr
ieval
syste
m,
withou
t the E
XPRESS WRITTEN PERMISSIO
N of th
e cop
yrigh
t-hold
er

National Conference on Climate Change and Agricultural Production: Adapting Crops to Climate Variability and Uncertainty, 6th–8th April, 2017
[107]
field ranged from 30 to 55q/ha in DSR whereas 40 to 48q/ha in TPR. TPR trials could not succeed in farmer’s field at Paharpur village of East Champaran. In DSR trial, highest yield of 55q/ha was recorded at Choraili village of Siwan district while lowest yield of 30q/ha was recorded in Hariharpur village of Muzaffarpur district. In TPR the highest yield of 48q/ha was recorded in Keshawe village of Begusarai district while lowest yield of 40q/ha was recorded in the field of Bheldi village of Saran and Choraili village of Siwan district.Through this study, inference can be drawn that the DSR technology coupled with proper dose and timely application of effective molecules of weedicide is most appropriate and alternative way for rice cultivation against TPR. Because, there is tremendous saving of labour and water in comparison to TPR. Therefore, more and more awareness should be created to promote DSR technology, especially among poor and marginal farmers of Bihar.
REFERENCES [1] Kumar V and Ladha J K 2011. Direct seeding of rice: Recent developments and future research needs. Advances in Agronomy
111: 297-413. [2] Singh N K 2014-2015.Project Report.Accelerating theTtechnological Adoption of Direct Seeded Rice (DSR) in Bihar. Dr. RPCAU, Pusa,
Bihar. pp. 1-39.
Response of Fertilizer Levels and Cutting Management on Growth and Yield Parameters in Oat (Avena sativa L.)
Priti Malik*, Meena Sewhag and Karmal Malik Chaudhary Charan Singh Haryana Agricultural University, Hisar–125004, India
E-mail: *[email protected]
Keywords: Fertility levels, Cutting management, tillers, plant height, panicles, spikelets, test weight
INTRODUCTION
Beside the huge requirement of forage crops, Indian forage cultivated land subsist only a meagre part. Forage production in India is around 4.4% of cultivated land with a total annual production of 833 MT against the yearly forage requirement of 1594 MT to feed the livestock population of 512.05 million. Oats (Avena sativa L.) are grown for fodder as well as grain production. It is a non leguminous, multicutting fodder crop which has fast growth and rattoning ability. Balancing of phosphorus and nitrogen content of fertilizers is also very necessary for plant growth and therefore the present experiment was conducted to find out the role of nutrition in oat crop during discrete cutting schedules.
MATERIALS AND METHODS
HJ 8 an oat variety was grown under the field research farm of Haryana agricultural university, Hisar during winter season of year 2012-13. Four levels of fertilizers were Control, N40+P20, N80+P40 and N120+P60 with three cuttings at 50, 60 and 70 DAS. Gross plot size and net plot size were 5 x 3 m=15 m2 and 4 x 2.5 m =10 m2 respectively. Factorial randomized block design (FRBD) was used. Five tillers were randomly selected from each plot and the average of these was taken as the plant height. Numbers of active growing shoots were counted per metre row length from three spots of each plot and averaged. Within each plot five panicles were randomly selected. The spikelets per panicle were counted and mean was taken.
It is I
LLEGAL t
o cop
y, pri
nt or
save
any c
onten
t of th
is PDF,
in pa
rt or in
full,
on an
y retr
ieval
syste
m,
withou
t the E
XPRESS WRITTEN PERMISSIO
N of th
e cop
yrigh
t-hold
er

National Conference on Climate Change and Agricultural Production: Adapting Crops to Climate Variability and Uncertainty, 6th–8th April, 2017
[108]
RESULTS AND DISCUSSION
Control has the lowest numbers of tillers per meter of length (97.2) which increased significantly in other treatments N40+P20, N80+P40, and N120+P60 as 103.7, 110.5 and 118.34 numbers of tillers per meter of length respectively (Table 1). Plant height recorded at 70 DAS (65.9) was maximum and significantly different from 60 DAS (53.8cm) and 50 DAS (45.9cm). Nitrogen and phosphorus application significantly increased the number of panicles per metre row length. Control has the lowest number of panicles (61.8) per metre of row length and number of panicles increased significantly for N40+P20 (66.9) over control. Similarly panicles number were increased significantly N80+P40 (72.12) and significantly highest number of panicles were obtained under N120+ P60 (75.0) over all other treatments. Nitrogen and phosphorus application increased the number of spikelets per panicle and the increment for N40+ P20, N80+ P40 and N120+P60/ha were from 41.7 to 42.9, 45.6 and 46.5 respectively, over control. According to Browne et al. (2006) nitrogen application increased both number of panicles/m2 and grains per panicle. However, seeds per panicle were found highest (66.0) under 50 DAS cut and it decreased with delay in cut for fodder (70 DAS). Nitrogen and phosphorus application also increased the number of seeds/panicle and the increase was from 60.6 to 62.8, 65.0 and 66.9 with N40+ P20, N80+ P40 and N120+P60/ha respectively, over control. Significantly highest test weight of oat was found with 60 DAS (39.2) cut over 50 and 70 DAS. Treatment N120+P60/ha was recorded with highest test weight of 39.8 followed by N80+P40 (38.59), then N40+ P20, (35.16) and least by control (30.88).
Table 1: Response of Fertility Levels and Cutting Management on Plant Height, Tillers/m Row Length, DMA, GMA, no. of Panicles, Grains/ Panicle, Spikelets/ Panicle and Test Weight
Fertility Levels Plant Height (cm)
Tillers/m Row Length
DMA (g/m)
GMA (g/m)
No. of Panicles
Grains/ Panicle Spikelets/ Panicle Test Weight
Control 49.8 97.2 20.8 106.0 61.8 60.6 41.7 30.9 40 kg N+20 kg P2O5
55.9 103.7 25.5 133.8 66.9 62.8 42.9 35.2
80 kg N+40 kg P2O5
56.3 110.5 32.7 176.7 72.1 65.0 45.6 38.6
120 kg N+60 kg P2O5
60.1 118.3 37.5 207.5 75.0 66.9 46.5 39.8
C.D.(P=.05) 4.1 6.1 4.2 24.2 3.9 2.8 2.7 2.5 Cutting Management
Cut at 50 DAS 45.9 105.9 22.4 140.2 70.5 66.0 45.0 34.9 Cut at 60 DAS 53.8 108.6 30.6 155.0 69.8 66.3 43.8 39.2 Cut at 70 DAS 65.9 107.8 34.4 172.6 66.6 62.2 43.8 34.2 C.D.(P=.05) 3.6 NS 3.6 20.9 NS 2.5 NS 2.1
REFERENCES [1] Browne R A, White E M, and Burke J I 2006. Effect of nitrogen on yield and yield attributes in oats. Journal of Agricultural Science
144: 533-545.
It is I
LLEGAL t
o cop
y, pri
nt or
save
any c
onten
t of th
is PDF,
in pa
rt or in
full,
on an
y retr
ieval
syste
m,
withou
t the E
XPRESS WRITTEN PERMISSIO
N of th
e cop
yrigh
t-hold
er

National Conference on Climate Change and Agricultural Production: Adapting Crops to Climate Variability and Uncertainty, 6th–8th April, 2017
[109]
Exploring Genetic Diversity for Heat Tolerance among Lentil (Lens culinaris Medik.) Genotypes
Anil Kumar1* Anjali Kumari1, Sanjay Kumar1, Anand Kumar1, Ravi Ranjan Kumar2 and P.K. Singh1
1Department of Plant Breeding and Genetics, 2Department of Molecular Biology and Genetic Engineering
1,2Bihar Agricultural University, Sabour–813210, Bhagalpur, India E-mail: [email protected]
Keywords: Lentil (Lens culinaris Medik.), genetic diversity, D2 statistics and seed yield
INTRODUCTION
Pulse crops including lentil are particularly sensitive to the effects of heat stress at the reproductive stages of development when plants are in full bloom. Even a few days of high temperature (30 -35°C) limits many processes including photosynthesis, metabolic pathways, electron flow and respiration rates (Redden et al, 2014), causing flower and pod abortion, resulting in yield losses by reducing seed set, seed weight and accelerating senescence (Siddique, 1999; Gaur et al., 2015). Heat waves (temperatures >35°C) during flowering and pod-filling of lentil can result in significant reductions in seed yield, quality and profitability. The presence of genetic diversity and genetic relationships among genotypes is a prerequisite and paramount important for successful lentil breeding programme. Cluster analysis helps to understand the genetic relation among the genotypes and also to facilitate the selection of genetically diverse parents in hybridization programme resulting in considerable amount of heterosis and wide range of segregation. In views of these facts, the current research was undertaken to assess the magnitude of genetic diversity and characters contributing to genetic diversity among late sown lentil genotypes.
MATERIALS AND METHODS
The experiment was conducted during, Rabi, 2015-16 at Bihar Agricultural University, Sabour, (Bhagalpur), Bihar, India in a simple lattice design with two replications to assess the genetic diversity among the important fifteen characters in relation to seed yield in forty nine genotypes of lentil including four checks viz., HUL57, Arum, Noori and KLS 218. All the genotypes were grown in 4 rows of 4 m length with distance of 30 cm between rows and 10 cm between plants. Five competitive plants were taken at random from each row to record fifteen yield and yield attributing traits. Genetic divergence was estimated by using D2 statistics of Mahalanobis (1936) and clustering of genotypes was done according to Tocher’s method as described by Rao (1952) and Ward minimum variance method as suggested by Ward (1963).
RESULTS AND DISCUSSION
Analysis of genetic diversity revealed considerable amount of diversity among the genotypes. All the genotypes were grouped into eight clusters in Ward minimum variance method, with cluster IV containing the maximum of 10 genotypes followed by 9 genotypes in cluster VI, 8 genotypes each in cluster II and V, 6 genotypes each in cluster I, 4 genotypes in cluster III and 2 genotypes each in cluster VII and VIII. In Tocher method, all the forty nine genotypes were also grouped into eight clusters, with cluster V containing the maximum 12 genotypes followed by 9 genotypes in cluster VIII, 8 genotypes in cluster VII, 4 genotypes in cluster IV and 3 genotypes in cluster I, II and III. The inter-cluster D2 value ranged from 10.70 to 62.34 in Ward minimum variance method (Table-1). The highest inter cluster distance was observed between cluster
It is I
LLEGAL t
o cop
y, pri
nt or
save
any c
onten
t of th
is PDF,
in pa
rt or in
full,
on an
y retr
ieval
syste
m,
withou
t the E
XPRESS WRITTEN PERMISSIO
N of th
e cop
yrigh
t-hold
er

National Conference on Climate Change and Agricultural Production: Adapting Crops to Climate Variability and Uncertainty, 6th–8th April, 2017
[110]
IV and VIII followed by cluster IV and VII, cluster III and VII these lines may be utilized in further breeding programme for the exploitation of hybrid vigour. The intra cluster distance was maximum in cluster VIII followed by cluster I indicate hybridization involving genotypes within the same clusters may result in good cross combinations. In Tocher’s method the intra-cluster D2 value ranged from 343.91 to 2939.34 while, inter cluster D2 value ranged from 2877-123429 (Table- 2). The highest inter cluster distance was observed between cluster V and VI followed by cluster IV and VI , I and VI and cluster II and VI, suggesting wide diversity between them and genotypes in these clusters could be used as parents in hybridization programme to develop desirable type because crosses between genetically divergent lines will generate heterotic segregants (Zaman et al., 2005, Saxena et al., 2013). The promising genotypes for grain yield, number of pods per plant, 100-seed weight, harvest index and early maturity were identified from cluster VII, VIII and IV on the basis of mean values which could be utilized for hybridization programme for the development of high yielding genotypes. Among the fifteen traits studied, maximum contribution was made by plot yield (56.38%) followed by plant stand at harvest (30.10%) and number of pods per plant (11.48%). Therefore, these characters may be given importance during hybridization programme to improve the tolerance of lentil to heat stress, leading to better yield stability and profitability for growers.
REFERENCES [1] Gaur P, Saminen S, Krishnamurthy L, Kumar S, Ghane M, Beebe S, Rao I, Chaturvedi S, Basu P, Nayyar H, Jayalakshmi V, Babbar A,
Varshney R 2015. High temperature tolerance in grain legumes.Legume Perspectives 7: 23-24. [2] Redden RJ, Hatfield PV, Prasad V, Ebert AW, Yadav SS, O’Leary G J 2014. Temperature, climate change, and global food
security.Temperature and Plant Development 8: 181-202.
Evaluation of Gerbera Varieties for Yield and Quality under Protected Environment Conditions in Bihar
Paramveer Singh*, Ajay Bhardwaj, Randhir Kumar and Deepti Singh Department of Horticulture (Vegetable and Floriculture),
Bihar Agricultural University, Sabour–813210, India E-mail: [email protected]
Keywords: Gerbera, Polyhouse, Evaluation, Growth, Stalk length, Quality
INTRODUCTION
Global warming and climate change is the greatest concern of mankind in 21st century. The established commercial varieties of flowers will perform poorly in an unpredictable manner due to irregularity of climate. Commercial production of floricultural plants particularly grown under open field conditions will be severely affected. Due to high temperature and physiological disorder crops will be more pronounced. Hence there is a need to protect these valuable crops for sustainability against the climate change scenario. The most effective way is to adopt protected cultivation. To sustain the productivity, modification of present practices and greater use of greenhouse technology are some of the solutions to minimize the effect of climate change. Identification of new cultivars of gerbera crop tolerant to high temperature, resistant to pests and diseases and producing good yield under stress conditions, as well as adoption of hi–tech horticulture and judicious management of natural resources will be the main strategies to meet this challenge.Gerbera is one of the leading cut flowers and ranks among the top ten cut flowers of the world. It has a wide applicability in the floral industry as cut flower and potted plant. It is an important commercial flower grown throughout the world in a wide range of climatic conditions. Its cut blooms remain fresh at least for a week and are in great
It is I
LLEGAL t
o cop
y, pri
nt or
save
any c
onten
t of th
is PDF,
in pa
rt or in
full,
on an
y retr
ieval
syste
m,
withou
t the E
XPRESS WRITTEN PERMISSIO
N of th
e cop
yrigh
t-hold
er

National Conference on Climate Change and Agricultural Production: Adapting Crops to Climate Variability and Uncertainty, 6th–8th April, 2017
[111]
demand for presentation and interior decoration. The marketing potential can be exploited by introduction and evaluation of gerbera cultivars. There are many excellent varieties of gerbera with magnificent flowers in exhaustive range of colours, different shades, size and wide range of keeping quality. It is very much necessary to evaluate gerbera cultivars. Hence, present investigation was conducted to study the relative performance of 10 genotypes of gerbera for their growth, flowers quality and yield characters under protected conditions at BAU, Sabour.
MATERIALS AND METHODS
The present investigation was carried out during 2014-2015 at the polyhouse complex, Bihar Agricultural University, Sabour, to evaluate ten gerbera cultivars under naturally ventilated poly house conditions. Experimental material consist of 10 cultivars of gerbera were procured from private company. Ten cultivars viz., Laura, Szantal, Delfin, Newada, Olympia, Kormoran, Partrizia, Rock, Feliks, Samuraj were selected for this study.Healthy tissue cultured plants were planted at a spacing of 30.0 cm × 40 cm in a raised beds of 30 cm height. The experiment was laid out in randomized block design with three replications.Five plants from each replication of a cultivar were used for recording observation. The recommended package of practices was followed for raising the successful crop. Observations on different parameters of vegetative growth, floral quality and yield parameters were recorded. The mean values of the recorded data on various biometrical parameters were subjected to statically analysis.
RESULTS AND DISCUSSION
There was significant difference among the different varieties of gerbera regarding vegetative growth, floral quality and yield parameters.The maximum plant height was in Laura (43.53 cm) followed by Delfin (43.33 cm) whereas the minimum plant height was in Samuraj (30.60 cm) followed by Kormoran (30.80 cm) and Partrizia (32.00 cm). Gerbera cultivars showed significant variation for number of leaves per plant. Maximum number of leaves was observed from Partrizia (10.33/ plant) and minimum from Laura and Samuraj (7.20/plant). Leaf length and width showed significant variation among gerbera cultivars. Maximum leaf length and width were from Szantal (28.33 cm and 16.33 cm, respectively). The marked variation in vegetative characters may be due to differential characters of individual varieties that expressed their genetic characters. These results were conformity of findings of Sarmahet al. (2014). The results of different varieties of gerbera regarding flower characters were found to be significant. The variety, Kormoranrequired minimum days (101.67) for flowering andNewada required maximum days (121.33).The longest stalk of gerbera flower was found from Partrizia (80.20 cm) while the shortest was found from Kormoran (50.07 cm).The stalk length is a genetic factor therefore, it is expected to vary among the cultivars. Stalk length is a very important factor for gerbera cut flower. It decides the quality cut flowers. As there will be more stalk length more reserved food will be stored in the stalk which will later be available to the flower for longer time period. The results were conformity of findings of Ahlawatet al. (2012), Chobe et al. (2010). Flower diameter showed significant variation among the gerbera cultivars after blooming. Maximum flower diameter was in Szantal (10.73 cm) while minimum from Rock (8.27 cm). The size of these flowers may be due to bigger ray florets which are in conformity with the findings of Sarmah et al. (2014) in gerbera. The bigger diameter ofSzantal might be due to the inherent characters of individual varieties. Significant variation was recorded among gerbera cultivars performance in respect to the number of flower per plant. Maximum number of flower was found from Partrizia (16.53/plant) whereas minimum was recorded form Samuraj (11.53/plant).The above mentioned findings indicated that considering the important characteristics, Partrizia is the best variety having longest stalk length and more number of flowers per plant. While, Szantal and Feliks also exhibited acceptable physical and flowering quality characteristics, so it can also be cultivated under polyhouse.
It is I
LLEGAL t
o cop
y, pri
nt or
save
any c
onten
t of th
is PDF,
in pa
rt or in
full,
on an
y retr
ieval
syste
m,
withou
t the E
XPRESS WRITTEN PERMISSIO
N of th
e cop
yrigh
t-hold
er

National Conference on Climate Change and Agricultural Production: Adapting Crops to Climate Variability and Uncertainty, 6th–8th April, 2017
[112]
REFERENCES [1] Ahlawat T.R., Barad A V and Giriraj Jat 2012. Evaluation of gerbera cultivar under naturally ventilated polyhouse. Indian Journal of
Horticulture 69 (4): 606-608. [2] Chobe R.R., Pachankar P.B. and Wanade S D 2010.Performance of different cultivars of gerbera under polyhouse condition. The Asian
Journal of Horticulture 2: 333-335. [3] Sarmah D., Kolukunde S. and Mandal T. 2014. Evaluation of gerbera varieties for growth and flowering under polyhouse in the plains of
west Bengal. International Journal of Scientific Research 3 (12): 135-136.
Evaluation of Finger Millet Varieties under Rainfed Region of South Bihar: Climate Change Compliant Crop and Climate
Resilience Strategy
M.K. Singh1*, Vinod Kumar2, Shambhu Prasad1 and Birendra Kumar1 1Department of Agronomy, Bihar Agricultural University, Sabour, Bhagalpur–813210, India
2SMS Agronomy, KVK, Munger–811201 E-mail: *[email protected]
Keywords: Finger millet, varieties, climate resilience, crop adaptation
INTRODUCTION
Selective utilization of crops and varieties in recent times have threatened agro biodiversity leading to rapid erosion of natural resources and consequently affecting the nutritional security. One of the possible pathways for conservation of such neglected agro biodiversity resources is to bring them into use thereby making them viable crops within the contemporary social and economic context. Climate change portends less and erratic rain, more heat, reduced water availability and increased malnutrition. Under such situation finger millet crop can withstand these challenges and produce multiple securities (food, fodder, health, nutrition, livelihood and ecological) making them the crops of agricultural security. All these qualities of millet farming system make them the climate change compliant crops and helping in mitigation of climate change.
MATERIALS AND METHODS
The field experiment was carried out at Dry land Research Station, KVK, Munger during Kharif 2013-14 and 2014-15 to evaluate yield potential, economics and thermal utilizationof finger millet varieties under rainfed conditionof sub-humid environment of South Bihar. The sandy-loam soil of the experimental field was low in organic carbon (0.26%), available N (182.5 kg/ha), and available P2O5 (19.5 kg/ha) and medium in K2O (168.6 kg/ha) content, having pH 6.8. Experiment was laid out in Randomised Block Design and replicated thrice with eleven finger millet varieties viz. VL 149, VL 315, VL324, GPU 28, GPU 45, GPU 67, A 404, JWM 1, BM 2, RAU 3 and RAU 8(check). The grain, stover and biological yield were recorded as per treatments and expressed in q ha-1. Growing degree days (GDD), heliothermal units (HTU), phenothermal index (PTI), heat use efficiency (HUE), and heliothermal use efficiency (HTUE) were computed using the daily meteorological data. The base temperature of 10 oC was used for computation of GDD on daily basis (Leong and Ong, 1983).
RESULTS AND DISCUSSION
The perusal ofmean data showed that variety GPU28 was tallest (110 cm) but at par to RAU 3 (109.9 cm) and RAU 8(100 cm) and significant over remaining varieties.The longer finger size and higher weight was
It is I
LLEGAL t
o cop
y, pri
nt or
save
any c
onten
t of th
is PDF,
in pa
rt or in
full,
on an
y retr
ieval
syste
m,
withou
t the E
XPRESS WRITTEN PERMISSIO
N of th
e cop
yrigh
t-hold
er

National Conference on Climate Change and Agricultural Production: Adapting Crops to Climate Variability and Uncertainty, 6th–8th April, 2017
[113]
received in GPU 28 followed by GPU 67 and VL 149. Significantly higher grain yield (q/ha), net return (Rs 28287) and B:C ratio 1.69 were noticed in variety GPU 67 that values were at par to RAU-8 (20.32, 26503 and 1.59) but found significantly superior over remaining varieties. At 50% anthesis stage the highest growing degree days (1526.9 oC day), heliothermal units (7428.2 oC day hours), phenothermal index (19.4
oC days day-1) were noticed in variety GPU 67 followed by RAU 8 and GPU 28 and lowest in VL 149. At maturity stage the highest Growing degree days (2051.6 oC day), heliothermal units (10765.1 oC day hours) were noticed in variety GPU 67 followed by RAU 8 and GPU 28 and lowest in VL 149. The highest values of heat use efficiency (1.06 kg ha-1 oC day) and Helio-thermal use efficiency (0.20 kg ha-1 oC day hour) were noticed in variety GPU 67 followed by GPU 45 and VL 315.
REFERENCES [1] Kalra N, Chakraborty D, Sharma A, Rai H.K., Jolly M., Chander S, Kumar R P, Bhadraray, S, Barman, D, Mittal, R B, Lal, M and Sehga
M 2008. Effect of increasing temperature on yield of some winter crops in northwest India.Current Science 94 (1): 82-88. [2] Leong S K and Ong C K 1983. The influence of temperature and soil waster deficit on the development and morphology of groundnut
(Arachis hypogaea L.). Journal of Experimental Botany 34: 1551-1561. [3] Prakash V, Niwas R, Khichar, M L, Sharma, D, Manmohan and Singh B 2015. Agrometeorological indices and intercepted
photosynthetically active radiation in cotton crop under different growing environments. Journal of cotton Research and Development 29 ( 2): 268-272.
Influence of Temperature on Plant Growth, Flowering and Fruiting of Strawberry in Agro Climate of Bihar
Kanchan Bhamini1, Ruby Rani1, R.R. Singh1, Feza Ahmad1, Sunil Kumar2 and Ravi Kumar1
1Department of Horticulture (Fruit & Fruit Technology), 2Department of Agronomy, 1,2Bihar Agricultural University, Sabour, Bhagalpur–813210, India
E-mail: *[email protected]
Keywords: Temperature, Strawberry, Plant growth, Flowering, Fruiting
INTRODUCTION
Strawberry is very unique, attractive, delicious and nutritive temperate fruit crop planted at different times of the years in different part of India for its commercial cultivation. The critical photoperiod and temperature have very important role for adaptability and suitability ofstrawberry cultivars in specific region (Sharma and Sharma, 2004). Thus the investigation were carried out to understand the suitable temperature for flowering, fruiting maturity and harvesting span of strawberry in Bihar by manipulating planting time. The aim was to standardise the planting time of strawberry for better yield and quality in very short span of winter season in this zone.
MATERIALS AND METHODS
The experiment was conducted at Horticulture Garden Bihar Agricultural University, Sabour Bhagalpur during cropping season of 2012-13 in split plot design with four planting dates i.e. 15th October, 1st November, 15th November and 1stDecember as main plot and varieties Sweet Charlie, Festival and Winter Dawn as sub plot with three replications. Weather parameters pertaining to temperature, relative humiditywere taken from University observatory from 1st date of planting to last date of harvesting during the cropping season. Data pertaining to plant growth, flowering, fruiting and harvesting span were recorded for all the varieties.
It is I
LLEGAL t
o cop
y, pri
nt or
save
any c
onten
t of th
is PDF,
in pa
rt or in
full,
on an
y retr
ieval
syste
m,
withou
t the E
XPRESS WRITTEN PERMISSIO
N of th
e cop
yrigh
t-hold
er

National Conference on Climate Change and Agricultural Production: Adapting Crops to Climate Variability and Uncertainty, 6th–8th April, 2017
[114]
RESULTS AND DISCUSSION
The highest growth in terms of plant height, spread and number of leaves per plant were noted in 15th October planting when average maximum and minimum temperature duringinitial plant growth were 28.220C and 13.160C, respectively and minimum growth was noted in 1st December planting when the maximum and minimum temperatures were 21.30C and 7.140C respectively. Positiverelation was observed between average maximum temperature during early stage of plant growth and plant spread. The faster pace of plant growth was at higher temperature.The highest number of fruits per plant was in 15th October and 1st November planting positive correlation was also noted between maximum temperature 60 days before flowering and number of flowers and fruits. However the minimum temperature was negatively correlated with these parameters. The effect of prevalent climatic conditions at the time of planting and subsequent period on plant growth has also been reported by Singh et al. 2008. The maximum (88.60%) of marketable fruits were in 1st November planting and the lowest of 76.80 per cent was in 1st December planting. Variety Sweet Charlie andFestival performed wellwhen average maximum and minimum temperatures during cropping season were 23.860C and 9.940C, respectivelyat 1st November planting whereas var. Winter Dawn has highest yield in 15th October planting whenaverage maximum and minimum temperatures during cropping season were 25.90C and 10.40C, respectively. Thus planting time from 15th October to 1st November was ideal for planting strawberry in Bihar. The planting time of 15th October and 1st November was suitable for better flowering, fruiting and yield in strawberry in agro climate of Bihar.
REFERENCES [1] Sharma R.R. and Sharma V.P. 2004.Plant growth and albinism disorder in different strawberry cultivars under Delhi conditions.Indian
Journalof Horticultural Sciences 61: 92-93. [2] Singh A, Patel R K, De L C and Periera L S. 2008.Performance of strawberry cultivars under sub-tropics of Meghalaya.Indian Journal of
Agricultural Sciences 78 (7): 1-4.
Climate Smart Nutrient Management (CSNM) for Enhanced use Efficiencies and Productivity in Ice and Wheat under
Rice-Wheat Cropping System
A. Qureshi1*, D.K. Singh2 and P.C. Pandey2
1College of Agriculture & Research Station, Kanker, Indira Gandhi Krishi Vishwavidyalaya, Raipur–492012, India
2Department of Agronomy, G.B. Pant University of Agriculture and Technology, Pantnagar, India E-mail: *[email protected]
Keywords: Climate Smart Nutrient management, SSNM, Nutrient Use Efficiencies
INTRODUCTION
Due to excessive use of fertilizers in imbalanced ratios causing the low nutrient use efficiency and associated environmental problems which has raised the serious concerns about the existing nutrient management practices.Imbalanced use and application of N at wrong time is common. Farmers tend to use more nitrogen (N) fertilizer than needed mainly because of subsidized price (CREMNET, 1998). Use of N fertilizer at higher dose as well as at wrong time makes plants succumb to lodging, attractive to insect pests and diseases and causing serious threat to environment. It is high time to develop site specific nutrient management (SSNM) technologies which are able to make synergy with crop–soil nutrient dynamics. Production of more grain
It is I
LLEGAL t
o cop
y, pri
nt or
save
any c
onten
t of th
is PDF,
in pa
rt or in
full,
on an
y retr
ieval
syste
m,
withou
t the E
XPRESS WRITTEN PERMISSIO
N of th
e cop
yrigh
t-hold
er

National Conference on Climate Change and Agricultural Production: Adapting Crops to Climate Variability and Uncertainty, 6th–8th April, 2017
[115]
yield with less fertilizer by using site-specific nutrient management based on Nutrient Expert® recommended fertilizer may secure the higher productivity as well as reduces the chances of soil water pollution.With the objectives to compare the nutrient use efficiencies, yield and profitability of various field specific fertilizer recommendation with the existing blanket recommendation and farmers practices in rice and wheat crop the experiment was planned and executed.
MATERIALS AND METHODS
A study was conducted at Norman E. Borlaug Crop Research Centre of G.B. Pant University of Agriculture and Technology, Pantnagar during kharif and rabiseasons of 2014-15 and 2015-16. Treatments comprised of 6 nutrient management approaches viz. recommended dose of fertilizers (RDF), Nutrient Expert recommended fertilizer (NE-RF), Nutrient Expert recommended fertilizer under SSNM (NE-SSNM),recommended dose of fertilizer with nano-fertilizer (RDFNf), farmer’s fertilizer practices (FFP) and soil test crop response (STCR) along with 4 nutrient omission treatments viz. PK, NK, NP and –NPK (Absolute control). The experiment was laid out in randomized block design with three replications.
RESULTS AND DISCUSSION
During 2015 the NE-SSNM (Nutrient Expert recommended fertilizer under SSNM) produced 1064 kg ha-1 more grain yield over FFP. In comparison to FFP, the SSNM technology i.e. NE-SSNM produced 3.73 and 16.88% more grain yield in 2014 and 2015, respectively with less fertilizer (Table 1). In Nutrient Expert-based nutrient management, plant nutrients are applied based on the SSNM principle of ‘feeding crops with nutrient as and when they are needed’. The site specific nutrient management led to a large gain in N use efficiency. During 2015-16, significantly higher grain and straw yield of wheat was recorded in Nutrient Expert recommended fertilizer under SSNM.Production of more grain yield with less fertilizer N can be obtained in SSNM based fertilizer application which minimizes the possible risks to the pollution. NE based SSNM is able to mitigate crop driven N demand at the critical stages of crops which is economical and environment friendly.
Table 1: Effect of Nutrient Management Approaches on PFP, AE, Grain and Straw Yield of Rice Treatments Partial Factor
Productivity (kg Grain kg-1
N)
Agronomic Efficiency kg
Grain Increase kg-1 Nutrient
Applied
Grain Yield (kg ha-1) Straw Yield (kg ha-1)
2014 2015 2014 2015 2014 2015 Pooled 2014 2015 Pooled T1: RDF N120P 60K40 + Znf 49.48 55.45 27.30 18.61 5938 6654 5938 6654 5938 6654
T2: NE-RF N118P 27K 52 48.75 59.49 26.19 22.03 5753 7020 5753 7020 5753 7020 T3: NE-SSNM (LCC) N118P27K 52 50.71 62.43 28.16 24.97 5984 7366 5984 7366 5984 7366
T4: T2 – N (N0P27K52) PK 0.00 0.00 0.00 0.00 2662 4420 2662 4420 2662 4420
T5: T2-P (N118P0K52) NK 42.77 50.54 20.21 13.08 5047 5964 5047 5964 5047 5964
T6: T2– K (N118P27K0) NP 46.69 51.21 24.13 13.75 5510 6043 5510 6043 5510 6043
T7: Absolute Control (NPK)
0.00 0.00 0.00 0.00 2766 3793 2766 3793 2766 3793
T8: RDF N120P60K40 + Nano- fertilizer (RDFNf)
49.39 56.75 27.20 19.91 5926 6810 5926 6810 5926 6810
T9: FFP– Farmers’ Fertilizer Practices N130P40K20
44.81 48.47 24.33 14.47 5825 6302 5825 6302 5825 6302
T10: STCR (N133P96K 54) 45.43 52.66 25.41 19.43 6042 7004 6042 7004 6042 7004
C.D. (p=0.05) 481.11 595.32 481.11 595.32 481.11 595.32 C.V.% 5.45 5.65 5.45 5.65 5.45 5.65
It is I
LLEGAL t
o cop
y, pri
nt or
save
any c
onten
t of th
is PDF,
in pa
rt or in
full,
on an
y retr
ieval
syste
m,
withou
t the E
XPRESS WRITTEN PERMISSIO
N of th
e cop
yrigh
t-hold
er

National Conference on Climate Change and Agricultural Production: Adapting Crops to Climate Variability and Uncertainty, 6th–8th April, 2017
[116]
REFERENCES [1] CREMNET 1998. Farmer-anticipatory approach to nitrogen management in rice production using leaf color chart.In: CREMNET Tech.
Eva. Protocol No. 1. IRRI, Philippines.
Genetic Divergence for Morpho-Physiological and Yield Components Associated with Cold Tolerance in Maize (Zea mays L.) Inbreds
Ranju Kumari1* A.K. Singh2 and P.K. Singh1
1Nalanda College of Horticulture, Noorsarai, Nalanda–803113, India 2Dr. Rajendra Prasra Central Agricultural University, Pusa–848 125, SamastipurIndia
E-mail: *[email protected]
Keywords: Maize, Zea mays L, Genetic divergence
INTRODUCTION
Maize is called ‘queen of cereal’. Due to its multiple uses for food, feed and industrial sectors, we need to produce more from same or even less favorable environment through genetic enhancement of tolerance to biotic and abiotic stress genotypes. Determination of genetic diversity of any crop species is a suitable precursor for improvement of the crop because it generates base line data to guide selection of parental lines and design of breeding scheme. The objective of the present investigation was to measure the genetic divergence among the inbred for morphological and yield components related to cold tolerance for the development of wide array of single crosses.
MATERIALS AND METHODS
Materials for the present investigation were included eight inbred lines (CML 142, CML 144, CML 150, CML 176, CML 186, CM 300, CM 400 and CM 600) obtained from AICRP on maize, Dholi Centre and experiment was carried out in Rajendra Agricultural University, Pusa, Bihar in the year 2010-11. These inbreds were planted with row to row and plant to plant spacing of 60 cm and 20 cm respectively in randomized block design (RBD) with three replication. Observations were recorded for ten morpho-physiological traits viz., plant height (cm), ear length (cm), ear girth (cm), number of kernel rows per ear, number of kernels per row, 100 kernel weight (g), yield per plant (g), days to 50 per cent tassel emergence, days to 50 per cent silk emergence and days to 50% maturity. Numerical taxonomic approach (Sneath and Sokal, 1973) were used for assessing genetic divergence using data on morpho-physiological characters.
RESULTS AND DISCUSSION
The mean values of the traits obtained was used to evaluate genetic divergence. Average taxonomic distance were used as a measure of dissimilarity for assessing the nature and extent of genetic divergence. At phenon level forty dissimilarity units eight inbreds were clustered into five groups (Table.1). The highest inter cluster distance was found between cluster AI and cluster BI (2.1189) and the smallest between clusters AI and AII (b) (0.8766). The highest intra cluster distance (0.9964) was recorded in cluster AII b and AII b . The intra-cluster distances were smaller than the inter-cluster distances indicating the distinctness of the different clusters. The highest inter cluster distance between cluster AI and BI, showing greater divergence between inbreds of these two clusters also showed wider differences in their mean values. The data on inter cluster distance and perse performance of the genotypes for selecting genetically diverse and agronomically superior
It is I
LLEGAL t
o cop
y, pri
nt or
save
any c
onten
t of th
is PDF,
in pa
rt or in
full,
on an
y retr
ieval
syste
m,
withou
t the E
XPRESS WRITTEN PERMISSIO
N of th
e cop
yrigh
t-hold
er

National Conference on Climate Change and Agricultural Production: Adapting Crops to Climate Variability and Uncertainty, 6th–8th April, 2017
[117]
genotypes.Based on the result it might be concluded that genotypes of divergent inter cluster groups would be used in crossing programme for the development of high heterotic crosses.
Table 1: Average Intra Cluster (Diagonal) and Inter Cluster Distances of Five Clusters of Maize Clusters AI AII(a) AII (b) BI BII
AI 0.6275 1.001 0.8766 2.1189 2.0935 AII (a) 0.000 0.9964 1.6900 1.4919 AII (b) 0.7081 1.3477 1.2556 BI 0.000 1.1413 BII 0.000
REFERENCE [1] Sneath P.H.A. and Sokal R.R. 1973. Numerical taxonomy. In: The Principle and Practice of Numerical Classification. W.H. Freeman and
Company, San Francisco, New York.
Quantification of Carbon Sequestration in Open Field and Agri-Horti System
Manoj Kumar Gond1, Pravesh Kumar2, Ramesh Kumar Singh1, Shashank Tyagi2, Sunil Kumar2, A.K. Singh3, S.K. Chaudhary2 and S.K. Pandey1
1Department of Agronomy, Institute of Agricultural Sciences, BHU, Varanasi–221005, India 2Department of Agronomy, BAU, Sabour–813210, India
3ICAR Research Complex for Eastern Region, Patna, India E-mail: *[email protected]
Keywords: Carbon Sequestration, Open Field, Agri-Horti System
INTRODUCTION
Agroforestry provides an unique opportunity to combine the twin objectives of climate change adaptation and mitigation. Although agroforestry systems are not primarily designed for carbon sequestration, there are many recent studies that substantiate the evidence that agroforestry systems can play a major role in storing carbon in aboveground biomass, soil and in belowground biomass. Some of the earliest studies of potential carbon storage in agroforestry systems and alternative land use systems for India had estimated a sequestration potential of 68-228 Mg C/ha (Dixon et al., 1994).
MATERIALS AND METHODS
The study was done during kharif season of 2013 at the Agricultural Research Farm of the RGSC, Barkachha, Mirzapur (BHU) which is situated (25º 10’ latitude, 82º 37’ longitude and altitude of 147 meters above msl) in India.The experiment was conducted in Randomized Complete Block Design (RCBD) comprised 9 treatments replicated thrice. Various crops and tree-crop combinations were studied such as mungbean, sesame and pearl millet in open field and as an intercrop with seven-year old custard apple and guava at a spacing of 5x5 and 7x7 meter respectively, as agri-horti systems. Total carbon sequestration was estimated by sum up of total carbon sequestration in trees, crops and soil.
RESULTS AND DISCUSSION
Total carbon sequestration was found significantly highest in Custard Apple+Pearl Millet (24.23 t/ha) while the lowest was obtained in Open Field sesame (9.49 t/ha). Total carbon sequestration is the sum of
It is I
LLEGAL t
o cop
y, pri
nt or
save
any c
onten
t of th
is PDF,
in pa
rt or in
full,
on an
y retr
ieval
syste
m,
withou
t the E
XPRESS WRITTEN PERMISSIO
N of th
e cop
yrigh
t-hold
er

National Conference on Climate Change and Agricultural Production: Adapting Crops to Climate Variability and Uncertainty, 6th–8th April, 2017
[118]
aboveground carbon sequestration, belowground carbon sequestration and soil organic carbon and these parameters depend on the higher values of aboveground and belowground biomass which is the function of higher density and volume resulted into the highest total carbon sequestration in Custard Apple+Pearl Millet agri-horti system. Similar amount of carbon sequestration was also reported by Rizvi et al. (2011) in agri-silviculture system and in horticultural system.On the basis of above experimental findings it can be inferred that maximum carbon sequestration potential will be obtained from Custard Apple + Pearl Millet agri-horti system (24.23t/ha). While on an average basis the maximum carbon sequestration was found in Custard Apple based agri-horti system (22.11 t/ha) followed by Guava based agri-horti system (19.16 t/ha) and Open Field crops (12.31 t/ha).
REFERENCES [1] Dixon R.K., Brown S., Houghton R.A., Solomon A.M., Trexler M.C. and Wisniewski J 1994. Carbon pools and fluxes of global forest
ecosystems. Science 263: 185–190. [2] Rizvi R.H., Dhyani S.K., Yadav R.S. and Singh R 2011. Biomass production and carbon stock of popular agroforestry systems in
Yamunanagar and Saharanpur districts of north-western India. Current Science 100: 736–742.
Evaluation of Climate Resilient Genotypes of Pointed Gourd for Agroclimatic Zones of Bihar
R.B. Verma*, Randhir Kumar and Ravi Kumar Department of Horticulture (Veg. & Flori),
Bihar Agricultural University, Sabour-813210, Bhagalpur, India E-mail: *[email protected]
Keywords: Bihar, Pointed gourd, Genotypes, Evaluation
INTRODUCTION
Global horticulture has several challenges and opportunities, however a new challenges, that is climate change has drawn the attention of horticulturists worldwide. It is shifting the habitat range of plants and animals (Pereira et al. 2010) including agricultural crops as the crop productive in one area may no longer be so or the other way around.Changing climate parameters like temperature, moisture concentration and CO2 levels have diverse impacts on agriculture production system and appearance of pest and pathogens. Productive and sustainable horticulture systems might help to reduce the poverty in the context of climate change because they are a good source of income and nutrition. There have been several technologies to mitigate the negative impact of climate change and to increase and maintain food security, a holistic approach need to be optimised in which the exploration of genetic variability for the development of adverse climate tolerant varieties may be the one. Keeping the facts in to consideration a systematic plan for exploitation of genetic resources for varietal development of pointed gourd was made during 2012-13 to 2015-16 to explore the climate resilient ideal varieties for the agroclimatic zones of Bihar.
MATERIALS AND METHODS
In this context 30 diverse genotypes were collected from different parts of Uttar Pradesh and Bihar. Collected genotypes were characterised on the basis of morphological and yield attributing characteristics. Out of 30 genotypes six genotypes were identified as promising with respect to their yield potential and they were further tested with two standard check RP-1 and RP-2 in randomised block design replicated thrice at vegetable farm, BAU, Sabour during 2014-15 and 2015-16. The data were recorded on qualitative
It is I
LLEGAL t
o cop
y, pri
nt or
save
any c
onten
t of th
is PDF,
in pa
rt or in
full,
on an
y retr
ieval
syste
m,
withou
t the E
XPRESS WRITTEN PERMISSIO
N of th
e cop
yrigh
t-hold
er

National Conference on Climate Change and Agricultural Production: Adapting Crops to Climate Variability and Uncertainty, 6th–8th April, 2017
[119]
parameters like leaf colour, leaf type, leaf margin, fruit colour at marketable stage, fruit stripes, fruit shape and fruit curvature and quantitative parameters like days to first flowering, number of nodes to first flower, number of fruits/vine, number of seeds/ fruit, fruit length (cm), fruit diameter (cm), average fruit weight (g) and yield of fruit (kg/plant). A total soluble solid (TSS) was also measured in terms of 00 Brix.
RESULTS AND DISCUSSION
On the basis of average of two years yield attributing data it was observed that the out of six genotypes evaluated with two standard check varieties, the genotype, BRPG 12-9 was found to be outstanding and recorded highest number of fruits per vine (152.45 fruits), more length of fruits (8.97cm), average fruit weight (36.80g) and yield of fruits per vine (5.40kg), which was statistically at par with genotype BRPG 12-1 in almost all the parameters and statistically superior over the best check under the experimentation. Though the TSS content in fruit did not brought any significant improvement due to genotypes, yet the value was also observed maximum in BRPG 12-9 (3.870Brix) followed by RP-1(3.630Brix), BRPG 12-7(3.500Brix) and BRPG 12-1 (3.400Brix), which could be used for quality improvement.Thus it can be inferred that the genotypes BRPG 12-9 followed by BRPG 12-1 are the more climate resilient genotypes performed well under the agroclimatic condition of Bihar. They recorded highest 5.40 and 4.87kg fruits yield per vine and surpassed the best check RP-1(3.63kg) by the margin of 48.97 and 34.19 per cent, respectively.
REFERENCE [1] Pereira HM, Leadley PW, Proenca V, Alkemade R, Scharlemann JPW and Fernandez Manjarres JF 2010. Scenarios for Global
Biodiversity in the twenty -first century.Science 330:1496-1501
Characters Association and Path Coefficient Studies for Plant Selection in Pigeonpea (Cajanus cajan (L.) Millsp.)
Ajay Tiwari*, R.N. Sharma, A.K. Sarawgi and P.K. Chandrakar Department of Genetics and Plant Breeding,
Indira Gandhi Krishi Vishwavidyalaya, Raipur–492012, India E-mail: *[email protected]
Keywords: Correlation, Path coefficient, Plant Selection, Pigeonpea
INTRODUCTION
Pigeonpea [Cajanus cajan (L.) Millsp.]is one of the most important food legumes grown in over 82 countries across the globe (FAOSTAT, 2012), it ranks as the world's fifth most important pulse crop. It is governed by several component characters and their environmental interactions. The correlation and path analysis for plant selection on various yield and yield related components. It is helps to choose an efficient selection procedure and base it to a required balance, when two opposite desirable characters affecting the principal characters are being selected. As the trait plant height exhibited the positive correlation with seed yield per plant had direct and positive effect indicating the effectiveness of direct selection.
MATERIALS AND METHODS
The field experiment was conducted during the kharif 2012-13 and 2013-14 at Department of Genetics & Plant Breeding at Research cum Instructional Farm, Indira Gandhi Krishi Viswavidyalaya, Raipur. In hybridization programme 5 male parents were crossed to each of the 7 Female to generate a set of hybrids in
It is I
LLEGAL t
o cop
y, pri
nt or
save
any c
onten
t of th
is PDF,
in pa
rt or in
full,
on an
y retr
ieval
syste
m,
withou
t the E
XPRESS WRITTEN PERMISSIO
N of th
e cop
yrigh
t-hold
er

National Conference on Climate Change and Agricultural Production: Adapting Crops to Climate Variability and Uncertainty, 6th–8th April, 2017
[120]
a line x tester fashion as proposed by (Kempthorne 1957). The experimental material consisted 12 parents and their 35 crosses produced. The experiment was laid out in a Randomized Complete Block Design (RCBD) with three replications during kharif 2013-14. The material was sown in single rows of 4.0 m length and 60 cm apart with 20 cm plant to plant spacing. Sowing of material was done in first week of July. Five plants were randomly selected and tagged in each genotype per replication for recording the observations for the 13 characters.
RESULTS AND DISCUSSION
Correlation coefficient analysis: The phenotypic (P), genotypic (G) and environmental (E) correlation coefficients for seed yield and its components were worked out separately.The character, days to flowering initiation exhibited highly significant positive correlation with days to 50% flowering, and days to maturity at both genotypic and phenotypic levels, while it had significant positive correlation with number of seeds per pod, whereas it was negatively correlation with number of pods per cluster and protein content (%) at genotypic level only.
Genotypic path coefficient analysis :Genotypic correlation coefficients of various seed yield and its components characters for seed yield were further partitioned into direct and indirect effects.The highest positive direct effect contributing to seed yield per plant was observed due to plant height (0.6562) followed by number of pods per plant (0.1989), number of primary branches per plant (0.1262), protein content (0.0530), days to flowering initiation (0.0457) number of seeds per pod (0.0432), pod length (0.0291), 100 seed weight (0.0103) and number of pods per cluster (0.0069).In the present investigation, correlation and path coefficient analysis was carried out by taking seed yield per plant as dependent variables and rest of the quantitative traits as independent variables. Hence, the highest positive direct effect contributing to seed yield per plant. The plant breeding programme can be used as selection criteria for improvement in seed yield per plant. Other trait which had shown their indirect contribution for pigeonpea improvement.
REFERENCES [1] FAOSTAT 2012.Food and Agriculture Organization of United Nation. [2] Kempthorne O 1957. An Introduction to Genetic Statistics. John Wiley and Sona Inc., New York.
Identification of Potential Donors for Development of Climate-Resilient Aerobic Rice for Water-Short Irrigated Areas of Bihar
Anand Kumar1*, S.P. Singh1, Satyendra1, Mankesh Kumar1, Ravi Ranjan Kumar2, R.B.P. Nirala1 and P.K. Singh1
1Department of Plant Breeding and Genetics, 2Department of Molecular Biology & Genetic Engineering
1,2Bihar Agricultural University, Sabour, Bhagalpur, Bihar, India E-mail: *[email protected]
Keywords: Aerobic rice, Drought tolerance, Climate change
INTRODUCTION
Over 17 million ha of Asia's irrigated rice may experience “physical water scarcity” and 22 million ha may experience “economic water scarcity” by 2025 (Tuong and Bouman, 2003). With predictions that many Asian countries will have severe water problems by 2025, aerobic rice gives hope to farmers who do not have access to enough water to grow flooded lowland rice. Approx. 59% area of irrigated ecology suffers
It is I
LLEGAL t
o cop
y, pri
nt or
save
any c
onten
t of th
is PDF,
in pa
rt or in
full,
on an
y retr
ieval
syste
m,
withou
t the E
XPRESS WRITTEN PERMISSIO
N of th
e cop
yrigh
t-hold
er

National Conference on Climate Change and Agricultural Production: Adapting Crops to Climate Variability and Uncertainty, 6th–8th April, 2017
[121]
from physical and economic water scarcity. Therefore it is a need to developed “Aerobic rice production systems” that can cope with water scarcity. Bihar state is facing vagaries of climate change, labour shortage and shortage in rainfall and so far there is no any stable genotype is available addressing this problem. Thus, by developing high yielding Aerobic rice lines, water short irrigated lowland, favorable upland and rainfed lowland in Bihar brought under cultivation. With these background the present investigation was carried out to identify drought tolerance donors to intogressed drought tolerance QTL into the popular high yielding varieties of irrigated ecology.
MATERIALS AND METHODS
The field experiments were conducted at Bihar Agricultural University, Sabour, (Bihar), India during Kharif, 2015 with twenty four drought tolerance rice genotypes for including check Swarna. Experiments were laid out in randomized block design with three replications with 20 x 15 cm spacing. For reproductive stage drought stress standing water was kept up to 28 days after transplanting. Thereafter, the field was drained to allow them dry and for stress to develop. The drought stress experiments were not provided any supplemental irrigation after drainage. Observations of yield and yield contributing traits were recorded on five randomly selected plants per genotype per replication.
RESULTS AND DISCUSSION
The results related to yield attributes of rice genotypes under drought stress at reproductive stage have been presented in Table 1. The analysis of variance revealed significant differences among the genotypes for yield and yield attributing characters. Yield differences were found to be varied from 949 kg/ha (Koi Murali) to 4348 kg/ha (Binuhangin). Out of 24 rice genotypes evaluated, three were identified as promising drought tolerance genotypes which performed better than check and existing high yielding varieties of eastern region. The maximum grain yield was exhibited by Binuhangin (4348 kg/ ha) followed by Kali Aus (3713 kg/ha) and Uri (3611kg/ha). However, under reproductive stress conditions, the genotype MTU 1010 and IR64 were found to be superior to the best check Swarna for grain yield but not showed drought tolerance physiological traits. The identified potential donors were crossed with popular high yielding medium irrigated varieties Rajendra Sweta and Sita for developing aerobic rice varieties.
Table 1: Performance of Different Drought Tolerance Donors for Yield and its Attributing Traits S. No. Genotypes Days to 50% Flowering Plant Height (cm) Grain Yield (kg/ha) Ranking
1 ARC 10376 79 132 2014 2 Aus 257 88 147 3287 3 Dular 78 126 2824 4 4 Juma 81 106 1944 5 Koi Murali 72 117 949 6 ARC 10955 83 127 2106 7 Binuhangin 84 99 4398 1 8 Dangar 82 134 2824 9 DhalaShaita 84 125 3009
10 GulMurali 79 113 1574 11 Jabor Sail 85 120 2389 12 Kalamkati 85 123 2593 13 Kali Aus 80 114 3713 14 BPT 5204 105 94 2731 15 Mikhudeb 86 133 3287 7 16 Moshur 72 128 1019 17 MoynaMoti 82 134 1852 18 N-22 81 120 3611 4 19 DhariaBoalia 78 115 2153 20 Chengri-2 88 128 2528 21 IR-64 85 86 3657 3 22 Swarna © 104 80 3519 5 23 IR 74371-70-1-1 84 109 3495 6 24 MTU 1010 84 102 4167 2
CD (p=0.05) 1.66 14 624
It is I
LLEGAL t
o cop
y, pri
nt or
save
any c
onten
t of th
is PDF,
in pa
rt or in
full,
on an
y retr
ieval
syste
m,
withou
t the E
XPRESS WRITTEN PERMISSIO
N of th
e cop
yrigh
t-hold
er

National Conference on Climate Change and Agricultural Production: Adapting Crops to Climate Variability and Uncertainty, 6th–8th April, 2017
[122]
REFERENCES [1] Toung TP, Bouman BAM 2003.Rice production in water scarce environments. In: Kijne J W, Barker R, Molden D (eds). Water productivity
in agriculture: limits and opportunities for improvement. CABI Publishing, UK, pp: 53–67. [2] Bouman B.A.M., Hengsdijk H., Hardy B., Bindraban P.S. andTuong T.P. 2002. Water-wise rice production.Proceedings of the International
Work-shopon Water-wise Rice Production, 8–11 April 2002, International Rice Research Institute Los Baños, Philippines, pp: 356.
Stripe Rust Resistance in Himalayan Landraces of Wheat with Relevance to Climate Change and New Pathotypes Evolution
B.R. Raghu1* and O.P. Gangwar2 1ICAR-Vivekananda Parvatiya Krishi Anusandhan Sansthan, Almora, India
2ICAR-Indian Institute of Wheat and Barley Research, Regional Station, Shimla, India E-mail: *[email protected]
Keywords: Climate change, Crop adaptation, Stripe rust, Wheat
INTRODUCTION
Many reports testimonials for the devastating influence of climate change on wheat disease incidences worldwide. The severe form of stripe rust in China and Sweden has been linked to long-term climate change. In India, stripe rust appeared in severe form during 2010-11. In addition to existing 28 pathotypes in India, five new pathotypes of stripe rust was reported during 2014.The new pathotype 110S119 was most dominant and spreading very fast. Under such circumstances, a study was initiated at ICAR-VPKAS, Almora to identify novel sources of resistance against most virulent and new pathotypes of stripe rust among Himalayan hills germplasm of wheat.
MATERIALS AND METHODS
The study was conducted at Hawalbagh (ICAR- Vivekananda Parvatiya Krishi Anusandhan Sansthan, Almora) a hot spot for wheat stripe rust. A total of 26 hill wheat germplasm collected from different parts of Uttarakhand (Himalayan state of India) during different time periods (1978 to 2003) were screened for stripe rust resistance under natural ephiphytotic conditions from rabi 2013-14 to 2014-15. Subsequently, germplasm were assayed for multi-pathotyping against existing but most virulent (46S119 and 78S84) and a new but dominant pathotype (110S119) at seedling under glass house conditions at ICAR-IIWBR regional station Flowerdale, Shimla.
RESULTS AND DISCUSSION
Out of 26 Himalayan hill wheat germplasm screened under natural conditions against stripe rust, 8 germplasm found highly resistant (Reaction type: 0, TR, TS and 5S), 9 germplasm found moderately resistant (RT: 10S) and 9 germplasm were highly susceptible (RT: >20S). The results from multi-pathotype testing revealed that, 6 germplasm found resistant against both pathotypes, 46S119 and 78S84 (RT: 0;-;), 9 germplasm were resistant against pathotype 78S84 and remaining 11 germplasm were showed higher degree of susceptibility (RT: 3+) for both pathotypes. Subsequently, 6 resistant germplasm were subjected to seedling test against a new and dominant pathotype 110S119 and the results showed that only one hill wheat germplasm VHC 6285 found to be resistant. The results indicated that, presence huge variability for field as well as seedling resistance among Himalayan hill wheats. Pedigree analysis of given germplasm indicated that, there was a temporal and special variability exist among Himalayan germplasm for pathotype
It is I
LLEGAL t
o cop
y, pri
nt or
save
any c
onten
t of th
is PDF,
in pa
rt or in
full,
on an
y retr
ieval
syste
m,
withou
t the E
XPRESS WRITTEN PERMISSIO
N of th
e cop
yrigh
t-hold
er

National Conference on Climate Change and Agricultural Production: Adapting Crops to Climate Variability and Uncertainty, 6th–8th April, 2017
[123]
specific resistance. Kumar et al., 2016 reported new source of leaf and yellow rust resistance among exotic and indigenous germplasm of wheat. In the present study, a novel source of stripe rust resistance, Himalayan hill wheat VHC 6285 was identified particularly against new and dominant pathotype 110S119. The identified source could play vital role in resistance breeding programme under climate change regime. Therefore, in the future more such explorations trips and screening of Himalayan germplasm against new pathotypes can be taken up to identify the new sources of disease resistance in wheat.
REFERENCE [1] Kumar S, Archak S, Tyagi R K, Kumar J V K V and Jacob SR 2016. Evaluation of 19460 wheat accessions conserved in the Indain
national Genebank to identify new sources of resistance to rust and spot blotch diseases. pLoS ONE 11 (12): 167-702.
Assessment of Wheat (Triticum aestivum L.) Cultivars under Irrigated Late Sown Condition
K.M. Singh1, A.K. Saha1, Niraj Prakash1, S. Sheraz Mahdi2 and Hemant Kumar Singh1*
1Krishi Vigyan Kendra, Kishanganj–855107, India 2Department of Agronomy, Bihar Agricultural University, Sabour–813210, India
E-mail: *[email protected] Keywords: Wheat, cultivar, heat stress and yield
INTRODUCTION
Wheat (Triticum aestivum L.) has a prominent position among the cereals that supplement nearly one third of the total world population’s diet. It occupies an area of 31.19 million hactares with production of 95.91 million tonnes and productivity of 3075 kg/ha in India. Wheat has significant area of about 16670 ha in Kishanganj district of Bihar with an average productivity of 1693 kg/ha (PLCP 2015-16 NABARD, Kishanganj). The region specific significant efforts were carried out to reduce the vast gap between actual production and production potential of wheat cultivars through available technological interventions in different agro-ecological environments. In India terminal heat stress is a major reason of yield decline in wheat due to delayed planting (Joshi et al., 2007) suffering yield losses up to 40-50 per cent. Keeping in the view to improve the productivity of wheat, this study was arranged to evaluate the new varieties of wheat on farmer’s field under irrigated late sown condition in kishanganj district of Bihar.
MATERIALS AND METHODS
The present investigation was conducted as on farm trial on farmer’s field during 2014-15& 2015-16 for assessment of wheat (Triticum aestivum L.) cultivars under irrigated late sown condition in Kishanganj district of Bihar. The experiment was laid out in randomized block design considering individual farmers plot as replication in individual plot size of 0.1 ha. The four HYVs of wheat namely DBW-14,BR-934, HI -1563,and HD-2985 were tested with farmers local variety commonly known as NL. The study area is situated in sub-tropical climate with extremes of temperature in summer 460C and in winter 40C. These trials were conducted on 10 farmer’s field. The crop was grown with recommended seed rate of 150 kg /ha and fertilizer dose of 120:60:40 kg N: P2O5 and K2O/ha under irrigated condition. The soil was sandy loam in texture having initial soil fertility status (PH 6.8, organic carbon 0.48%, available N: P2O5 and K2O 252:10 and 195 kg /ha respectively. Need based all the agronomic management practices were practiced and kept uniform. The observations on different aspects of parameter were taken as per standard methodology.
It is I
LLEGAL t
o cop
y, pri
nt or
save
any c
onten
t of th
is PDF,
in pa
rt or in
full,
on an
y retr
ieval
syste
m,
withou
t the E
XPRESS WRITTEN PERMISSIO
N of th
e cop
yrigh
t-hold
er

National Conference on Climate Change and Agricultural Production: Adapting Crops to Climate Variability and Uncertainty, 6th–8th April, 2017
[124]
RESULTS AND CONCLUSION
An investigation as On Farm Trial (OFT) conducted on farmers field to assess the wheat (Triticum aestivum L.) cultivars under irrigated late sown condition in Kishanganj district of Bihar during the Rabi season of 2014-15 & 2015-16 revealed that the cultivar HD-2985 recorded higher grain yield (31.0 q/ha) which was on par with the cultivar HI-1563 (30.20 q/ha) in comparison to other cultivars and lowest grain yield by farmers local variety NL (23.20 q/ha).The yield attributing characters were also found significantly higher in cultivar of HD- 2985 with respect to others and poor expression by farmers local variety NL. The differential behavior of wheat genotypes with heat stress environment in eastern indogangetic plains of Bihar have been reported by Diwedi et al., 2015. It is believed to have a protected role under environmental stress in late planting of wheat (Reynolod et al., 2001). The improvement in yield of wheat under said treatment might be due to favourable growth and yield contributing characters (effective tillers/m2, spike length, no. of grains/spike, test wt.).This might be further due to ability to tolerance heat stress during reproductive phase result in fewer more number of spikes and more production of dry matter (Sattar et al., 2010). This variety also recorded higher net return (Rs. 25,500/ha) and B:C ratio (2.32). The farmers under test were satisfied with the technology of improved wheat cultivar HD-2985 for its cultivation in irrigated late sown condition (10-25 December) for obtaining higher yield and profit.
It is concluded from this study that wheat variety HD-2985 performed well under irrigated late sown condition under Rice-Wheat cropping system in Kishanganj district of Bihar.
REFERENCES [1] Anonymous 2016. Potential Linked Credit Plan (2015-16) NABARD, Kishanganj. [2] Dwivedi S.K., Kumar S. and Prakash V. 2015. Effect of late sowing on yield and yield attributes of wheat genotypes in astern Indo
Gangetic Plains .Journal of Agricultural Search 2(4):304-306 [3] Joshi A.K., Chand R., Arun B., Singh R.P. and Ortiz F.G. 2007. Breeding crops for reduced-tillage management in the intensive, rice–
wheat systems of South Asia.Euphytica 153: 135–151. [4] Sattar A., Cheema M.A., Farooq M. Wahid M.A. Wahid A. and Babar B.H. 2010. Evaluating the performance of wheat cultivars under
late sown conditions. International Journal of Agriculture and Biology 12 (4):561-565.
Study for Chilling Stress on Early Growth of Boro Rice (O. sativa L.)
Seema1*, N.Y. Azmi 2, M. Kumar3 and R. Kumari4 1Department of Botany & Plant Physiology, 2Department of Soil Science,
3Department of Ag. Engineering, 4Department of Plant Breeding and Genetics 1,2,3,4NCOH, Noorsarai, Nalanda-803 113,India
E-mail: *[email protected]
Keywords: Boro rice, Cold stress, Germination, Vigour
INTRODUCTION
Boro rice crop sown in November and December after recession of flood water in deep water areas is benefited on account of the fovourable residual moisture, fertility and chemical changes that take plase in soil due to long submergence, high radiation,favourable ripening time and low insect and disease attack (Tiwari et al., 2009). As a result boro season rice produces more yield (2.5-4.5t/ha) than the kharif rice (1.5-2.7t/ ha) in the same ecology (Chatterjee et al., 1996). Among the problem, low temperature at germination and seedling stage has been identified as pre dominant abiotic stress affecting the sustainability of boro rice cultivation seedling survival is a serious problem under temperature below 10oC. Accordingly this experiment
It is I
LLEGAL t
o cop
y, pri
nt or
save
any c
onten
t of th
is PDF,
in pa
rt or in
full,
on an
y retr
ieval
syste
m,
withou
t the E
XPRESS WRITTEN PERMISSIO
N of th
e cop
yrigh
t-hold
er

National Conference on Climate Change and Agricultural Production: Adapting Crops to Climate Variability and Uncertainty, 6th–8th April, 2017
[125]
was conducted to assess the effect of cold stress on seedling growth of boro rice.The present study of chilling response to seed germination and early seedling growth for their basic morphological and physiological parameters of tolerant and susceptible genotypes were undertaken for improved varieties of boro rice.
MATERIALS AND METHODS
The experiment was conducted in Rabi season during November-January of 2003-2004 at Rajendra Agriculture University, Pusa campus. The maximum and minimum temperature during the period ranged between 24.37 to 8.76. 26 genotypes of rice were subjected to preliminary screening under boro season. Genotypes were selected on the basis of their differential ability to tolerate cold condition at seedling stage. For detailed study six genotypes V1 (Gautam), V2 (Richharia), V3 (Dhanlaxmi) were from tolerant and V4 (Turanta), V5 (Jaya), V6 (Heera) from susceptible type were selected on the basis of their cold tolerance score. The data presented in the mean value of the two year experiment. Seed germination was studid in January (T2) under low temperature(3.22-16.6ºC) and in November(T1) under non-chilling low temperature(14.7-22.4ºC).
RESULTS AND DISCUSSION
The result showed that percent germination and germination relative index under the prevailing low temperature in January were, on the whole, lower by 31.52 percent and 50.33 percent than in November, respectively. Low temperature induced decline in germination has been attributed to (a)killing of imbibed seeds (b) structural lessons in the radicles during initial hydration (c) abortion of radical and (d) disruption in metabolic process. The range in germination percentage of 72.75-81.50 depicted by Gautam, Richharia and Dhanlaxmi in January was relatively low and the values were more than those obtained for Turanta, Jaya and Heera genotypes where in the values were relatively less and depicting a wider range of 48.25-60.00. In comparison to the germination observed in non-stress condition(T1) the former three genotypes depicted decline of 15.54-25.76 percent only as against the decline of 34.96-49.74 percent shown by the latter three genotypes. The significant differences among the genotypes are a reflection of the genotypic variability in the trait(Ali et al., 2006). The vigour index in January (T2) was relatively less than that obtained in November (T1). The mean values of vigour index of different genotypes varied between 1738.95 to 1078.95(Table-2). The variations among genotypes were significant, depicting that the six varieties of rice studied in the present investigation possessed seeds of varied vigour. The seedling vigour ranged between 72.49 to 172.54 in January and 372.70 to 282.60 in November (Table-2). On the whole, germination parameters were severely affected in Jaya, Turanta and Heera and relatively less in Gautam, Richharia and Dhanlaxmi. Such a response is further supportive of the degree of genotypic sensitivity to cold stress. It was evident that the germination under chilling condition reduced the germination percentage and germination relative index and adversely affected the mobilization efficiency and seedling vigour (Ellison et al,. 1983).Such a variation affords opportunities for selection of resistant genotypes and parents for modifying chilling sensitivity by breeding and biotechnological methods. Since germination percentage, germination relative index, seedling vigour and mobilization efficiency these parameters could be used to screen the available varities against the chilling stress.
REFERENCES [1] Ali M G, Naylor R E L and Matthews S 2006. Distinguishing the effects of genotypes and seed physiological age on low temperature tolerance of
rice (Oryza sativa L.). Experimental Agriculture 42(3):337-349. [2] Chatterjee S.D., Singh R.K., Thakur R, Chaudhary R.C., Rao U.P., Pathak A.K. and Rai J.N. 1996. Exploiting boro rice potential for increasing rice
production in deep water areas of eastern India. Int. Workshop on Flood Prone Rice Ecosystem, RAU, Pusa, 28-31 October 1996. [3] Ellison F, Deresa N F and Pederson L 1983. Inheritance of physiological characters associated with yield variation in bread wheat. Euphytica 32:
241-255. [4] Tiwari V., Rautaray S.K. and Singh U.D. 2009. Response of rice genotypes to cold temperature in boro season. Rice Genetics Newsletter 25: 40-41.
It is I
LLEGAL t
o cop
y, pri
nt or
save
any c
onten
t of th
is PDF,
in pa
rt or in
full,
on an
y retr
ieval
syste
m,
withou
t the E
XPRESS WRITTEN PERMISSIO
N of th
e cop
yrigh
t-hold
er

National Conference on Climate Change and Agricultural Production: Adapting Crops to Climate Variability and Uncertainty, 6th–8th April, 2017
[126]
Rainfall Trend Analysis a Part of Sone River basin in Bihar, India, from 46 Year Record (1969–2014)
MD Jafri Ahsan* and Mohd Imtiyaz Vaugh School of Agricultural Engineering & Technology,
Sam Higginbottom University of Agriculture, Technology & Sciences, Allahabad–211007 (U.P.), India E-mail: *[email protected]
Keywords: Trend analysis; Sen’s slope; Annual rainfall; Monsoonal rainfall; Sone River basin
Knowing the variations in the general rainfall pattern of a river basin is vital to understanding the hydrological cycle and water budget of the basin. The study of long-term precipitation record is critically important for a country, whose food security and economy rely on the timely availability of water. In this study, the historical 46 year (1969 – 2014) rainfall data of Arrah, Arwal, Aurangabad, Bhabua (Kaimur), Buxar, Jahanabad, Patna, Rohtas districts catchment area of Sone River basin (SRB), India, were analyzed for seasonal and annual trends. The Mann – Kendall test and Sen’s slope model were used to identify the trend and the magnitude of the change, respectively. Five (62.5 %) of the eight stations showed a negative trend. Even though there is a decreasing trend in all of these five stations: Arwal (−1.0672 mm/year), Aurangabad (−1.4139 mm/year), Buxar (−7.8906 mm/year), Patna (−3.1483 mm/year), and Rohtas (−4.8324 mm/year), the trends showed no statistical significance at the 5 % significance level with linear trends ranging from −1.0672 to −7.8906 mm/year. Only three stations Arrah (7.1083 mm/year), Bhabua (0.0583 mm/year) and Jahanabad (4.4185 mm/year) showed an increasing trend in rainfall and only Arrah revealed statistically significant trend with a Sen’s magnitude of 7.1083 mm/year. The Monsoonal season total rainfall showed similar trends to the annual trend pattern. Five stations are Arwal (−2.1577 mm/year), Aurangabad (−1.7143 mm/year), Buxar (−10.4435 mm/year), Patna (−1.7091 mm/year), and Rohtas (−5.0657 mm/year), the trends showed no statistical significance at the 5 % significance level with linear trends ranging from −1.7091 to −5.0657 mm/year. On the other hand, only three stations Arrah (5.9546 mm/year), Bhabua (1.3000 mm/year) and Jahanabad (4.9118 mm/year) showed an increasing trend in rainfall and only Arrah revealed statistically significant trend with a Sen’s magnitude of 5.9546 mm/year. However, all negative trends were statistically insignificant at 95 % confidence level. The analysis revealed the significantly decreasing precipitation trend in both monsoonal and annual rainfall in the span of 46 years.
It is I
LLEGAL t
o cop
y, pri
nt or
save
any c
onten
t of th
is PDF,
in pa
rt or in
full,
on an
y retr
ieval
syste
m,
withou
t the E
XPRESS WRITTEN PERMISSIO
N of th
e cop
yrigh
t-hold
er

National Conference on Climate Change and Agricultural Production: Adapting Crops to Climate Variability and Uncertainty, 6th–8th April, 2017
[127]
Thermal and Radiation Use Efficiency of Wheat under Different Growing Environments and Irrigation Levels
M.K. Nayak1*, Diwan Singh1, Mahender Singh2, Anil Kumar1 and Raj Singh1 1Department of Agricultural Meteorology, CCS Haryana Agricultural University, Hisar–125004 India
2Agrometeorology Section, Division of Agronomy, SKUAT, Jammu–180009, India E-mail: *[email protected]
Keywords: Growingenvironments, Irrigation levels, Wheat phenophases, Thermal use efficiency, Photo thermal index, Radiation use efficiency
INTRODUCTION
Wheat (Triticum aestivum L.) is one of the most important cereal crops globally. It provides about 20% of total food calories for human race. Wheat cultivation in India is very old. India covers about 29.9 million hectares area with total production of 93.9 million tonnes and productivity of 31.40 q/ha. (Anon., 2012).Winter crops are vulnerable to high temperature during reproductive stages and differential response of temperature change (rise) to various crops has been noticed under different production environments (Kalra, 2008). There is a positive correlation between grain yield and irrigation frequencies.
MATERIALS AND METHODS
The field experiment was conducted at agro meteorology observatory, Department of Agricultural Meteorology, CCS Haryana Agricultural University, Hisar, Haryana, India during the Rabi season in the year 2013-14 and 2014-15. Experiment was laid out with four growing environments (D1-last week of Oct., D2-second week of Nov., D3-last week of Nov., and D4- second week of Dec.) along with four irrigation levels was applied at different phenophases (I1-CRI, I2- CRI and heading, I3- CRI+ jointing and milking, I4- CRI+ jointing +anthesis and dough stage) under strip plot design with four replication at semi arid climatic condition of Hisar zone. The thermal use efficiency (TUE) was calculated according to the formula of Monteith (1984) and photothermal index was calculated by using the formula of Rajput (1980) for different phenophases of wheat.
RESULTS AND DISCUSSION
The results revealed that thermal use efficiency of wheat crop was linearly increased from CRI to dough stage (DS) than slightly decreased at physiological maturity. The highest thermal use efficiency (TUE) 0.79 & 0.77 (g 0C day-1) was recorded by the crop sown on D2 (second week of Nov.) and D1 (last week of Oct.) with I4 and I1 irrigation level as compared to other treatments in the year of 2013-14 & 2014-15, respectively. Similar results were also reported by Paul and Sarkar (2000), Haque (2000) and Chakravarty et al. (1984). Highest Photothermal index (PTI) 15.4 & 13.6 (0C day) was recorded under D1 crop sown during the year 2013-14 & 2014-15 with I4 irrigation level. Highest radiation use efficiency (RUE) 2.02 & 2.11 (MJ/m2) was recorded by the crop sown on D1 followed by D2. There was significant reduction in RUE in late sown wheat crop due to shortening of vegetative and reproductive growth stages as affected by high temperature stress in the late sown wheat crop at reproductive stage.
It is I
LLEGAL t
o cop
y, pri
nt or
save
any c
onten
t of th
is PDF,
in pa
rt or in
full,
on an
y retr
ieval
syste
m,
withou
t the E
XPRESS WRITTEN PERMISSIO
N of th
e cop
yrigh
t-hold
er

National Conference on Climate Change and Agricultural Production: Adapting Crops to Climate Variability and Uncertainty, 6th–8th April, 2017
[128]
Table 1: Effect of Sowing Dates and Irrigation Levels on Thermal Use Efficiency (g 0C Day-1) of Wheat at Different Phenophases during the Year 2013–14
Growing Environments Phenophases CRI TL JT BT HD AT ML DS PM
D1 0.038 0.066 0.166 0.326 0.432 0.533 0.672 0.757 0.743 D2 0.043 0.063 0.201 0.382 0.486 0.598 0.752 0.794 0.704 D3 0.042 0.071 0.210 0.386 0.496 0.611 0.704 0.755 0.696 D4 0.063 0.100 0.245 0.416 0.469 0.516 0.612 0.658 0.660
Irrigation Levels I1 0.035 0.050 0.153 0.303 0.390 0.492 0.607 0.709 0.720 I2 0.034 0.053 0.154 0.303 0.399 0.500 0.607 0.726 0.717 I3 0.036 0.057 0.153 0.310 0.405 0.515 0.651 0.714 0.731 I4 0.038 0.063 0.160 0.318 0.412 0.502 0.634 0.712 0.748
REFERENCE [1] Kalra N 2008. Effect of increasing temperature on yield of some winter crops in North West India. Current Science 94 (1): 82-88.
Exo-Polysaccharide Producing Bacterial Diversity and Activity under Elevated Carbon Dioxide and Moisture Stress Condition in Rice Soil
Debasmita Dutta, Mohammad Shahid*, A. Kumar and A.K. Nayak Crop Production Division, ICAR-National Rice Research Institute, Cuttack–753006, Odisha
E-mail: *[email protected]
Keywords: Climate Change, Elevated carbon dioxide, Polyethylene glycol, Rice, Water scarcity; 16S rDNA
INTRODUCTION
Global warming and climate change refer to an increase in average global temperatures. Increasing concentrations of greenhouse gases such as carbon dioxide (CO2), methane, nitrous oxide etc. in the earth’s atmosphere are of major concern worldwide. Recent years show increasing temperatures in various regions, and increasing extremities in weather patterns including drought. Scientists expect the amount of land affected by drought to grow by mid-century. Microorganisms are capable of producing substances which helps in the water retention and thus helps the plants to overcome the moisture stress condition. These substances include exo-polysaccharides (EPS) which is being secreted by the microorganisms. An attempt was made to assess the effect of elevated CO2 on the soil microbial population and EPS producing bacterial diversity under moisture stress condition isolated from open top chambers at ICAR-NRRI.
MATERIALS AND METHODS
The present study is conducted in the open top chambers (OTC).The rice variety Naveen was grown inside OTCs with CO2 fumigation. In the OTCs the experiment was laid out with eighteen treatments combination which include three carbon dioxide concentrations C390, C550 and C700 (390, 550 and 700 ppm); two moisture levels MF and MS (flooded and moisture stress at -60 kpa); and three nitrogen levels N0, N100 and N150 (0, 100 and 150 kg ha-1). Soil samples were collected at PI stage and analyzed for MBC, MBN and bacteria population. The EPS producing bacteria were isolated on Trypticase soy agar (TSA) medium and selected by mucoid bacterial colonies. Screening of EPS bacteria was done by different Polyethylene Glycol (PEG) stress as mentioned by Sandhya et al. (2009) and bacterial isolates showed maximum growth at 25% of PEG stress
It is I
LLEGAL t
o cop
y, pri
nt or
save
any c
onten
t of th
is PDF,
in pa
rt or in
full,
on an
y retr
ieval
syste
m,
withou
t the E
XPRESS WRITTEN PERMISSIO
N of th
e cop
yrigh
t-hold
er

National Conference on Climate Change and Agricultural Production: Adapting Crops to Climate Variability and Uncertainty, 6th–8th April, 2017
[129]
were selected and identified using 16S rDNA gene sequence analysis. Isolated organisms were used for the production of exo-polysaccharides.
RESULTS AND DISCUSSION
The results indicate that elevated carbon dioxide has a positive effect on microbial biomass carbon, microbial biomass nitrogen, soil enzymes and on soil bacterial population. Flooded condition has a positive effect on soil microbial population whereas; soil microbial population decreased under moisture stress condition. Exo-polysachharide producing bacteriawere found maximum in C700 which was significantly higher than the values obtained for C390 and C550. The difference between C550 and C390 treatments was significant and higher value was observed under C550 treatment. With regards to nitrogen treatment exo-polysachharide producing bacteria was found maximum in N150 treatment which was significantly higher than the N0 and N100 treatments. The difference between N100 and N0 treatments was also significant and higher value was observed under N550 treatment. With regards to moisture treatment EPS bacteria was found maximum in MF treatment which was significantly higher than the values obtained for MS. The analysis of morphological structure of EPS producing bacterial isolates showed structural diversities. The drought-tolerant Bacillus spp. strains exhibiting multiple PGP traits under normal and stress conditions were selected and identified as Bacillus sp. (KX583513),Bacillus sp. (KX583515), Pseudomonas sp. (KX583531), Duganella sp. (KX583523), Brevibacillus sp. (KX583525), Bacillus sp. (KX583526), Bacillus sp. (KX583528), Bacillus sp. (KX583529), Bacillus sp. (KX583530) on the basis of 16S rDNA gene sequence analysis. Bacterial isolates were grown in a growth medium for production of exo-polysachharide and it was found that Bacillus spp. strain Bacillus sp. (KX583513) secrete conspicuous amounts of EPS (1.4 g) under stress conditions (Table 1). EPS forms an organo-mineral sheath around the cells, which leads to an increase in microaggregates as an indirect additional effect, which improves the plant growth under drought stress by increasing aggregate stability (Tang et al., 2011) and help in the survival of plant under drought stress (Sandhya et al., 2009).
Table 1: Weight of Dry EPS Produced by EPS Producing Bacteria Isolated from the Soil under Different Treatments
Identification Accession no. Weight (g) Bacillus sp. KX583513 1.436 Bacillus sp KX583515 0.608 Pseudomonas sp KX583531 0.516 Duganellanigrescenssp KX583523 0.46 Brevibacillussp KX583525 0.545 Bacillus sp KX583526 0.236 Bacillus sp KX583528 0.664 Bacillus sp KX583529 0.382 Bacillus sp KX583530 0.418
REFERENCES [1] Sandhya V, Ali Z, Grover M, Reddy G, and Venkateswarlu B 2009. Alleviation of drought stress effects in sunflower seedlings by the
exopolysaccharides producing Pseudomonas putida strain GAP-P45. Biology and Fertility of Soils 46: 17–26. [2] Tang J, Mo Y, Zhang J, and ZhangR 2011. Influence of biological aggregating agents associated with microbial population on soil
aggregate stability. Applied Soil Ecology 47:153–159.
It is I
LLEGAL t
o cop
y, pri
nt or
save
any c
onten
t of th
is PDF,
in pa
rt or in
full,
on an
y retr
ieval
syste
m,
withou
t the E
XPRESS WRITTEN PERMISSIO
N of th
e cop
yrigh
t-hold
er

National Conference on Climate Change and Agricultural Production: Adapting Crops to Climate Variability and Uncertainty, 6th–8th April, 2017
[130]
Response of Rice Growth, Water Productivity, Plant Water Status and Antioxidant Metabolite Activities under Anticipated
Elevatedatmospheric CO2 Concentrationand Water Deficit Stress
Anjani Kumar1*, A.K. Nayak2 and B.S. Das1 1Agricultural and Food Engineering Department, IIT, Kharagpur, India
2Crop Production Division, Central Rice Research Institute, Cuttack, India E-mail: *[email protected]
Keywords: Elevated CO2, Leaf water potential, Proline, Electrolyte leakage, Open top chamber.
INTRODUCTION
Rice is an excessive user of water and is sensitive to water deficit stress (WD) with reductions in yield at different levels of WD (Yang et al., 2007). Elevated CO2 (ECO2) decreases transpiration and increases canopy photosynthesis, plant growth and grain yield (Baker and Allen, 2005). Thus, increased atmospheric CO2 may reduce the impact of WD on rice production. Keeping in mind the economic importance of this crop, studies on the interaction of ECO2, temperature rise and water deficit stress on rice agronomic and physiological parameters are urgently needed. We hypothesized that ECO2 would reduce the negative effects of WD stress by improving plant water relations and increasing the antioxidant metabolite activities in rice. The present study aims tostudy the effects of ECO2 on plant water status and changes in activity of antioxidant metabolites of rice plant under WD.
MATERIALS AND METHODS
The study was conducted at the research station of the Central Rice Research Institute (CRRI), Cuttack (20°27’10’’ N, 85°56’9’’ E; elevation from mean sea level 24 m) in Eastern India.Six circular shaped, UV shielded OTCs were used for conducting the CO2 enrichment experiment. Considering the present ambient CO2 and anticipated increase in CO2 levels in next several decades as per IPCC (2007), three CO2 levels were considered for the OTC experiments including ambient (400 ± 10 µmol mol−1) and elevated (550 ± 20 µmol mol−1; CC500 and 700 ± 20 µmol mol−1; CC700). The rice variety used in the experiment was Naveen (CR-749-20-2; IET-1446) having the parentage Sattari × Jaya. Rice plants were grown inside OTCs installed in the field, with CO2 fumigation from transplanting to harvest. Standard agronomic practices for Eastern India were followed.Analysis for different physiological and biochemical parameters was done following standard protocols.
RESULTS AND DISCUSSION
Atmospheric CO2 enrichment exhibited a positive response on plant growth, grain yield and water productivity of rice as compared to ambient CO2. The effect of elevated atmospheric CO2 concentration on grain yield, harvest index and water productivity was more pronounced when the plants were exposed to WD as compared to WW. Under ECO2 (CC550 and CC700) there was a decrease of 11-14% and 5% in irrigation water input under WW and WD, respectively, as compared to ambient CO2. As compared to ambient CO2, significant (p ≤ 0.05) change in relative water content, electrolyte leakage, leaf water potential, proline, catalase and peroxidase activity was recorded at both the increased CO2 concentrations, which helped the plant to combat the adverse effects of WD and resulted in significant (p ≤ 0.05) increase in harvest index.
It is I
LLEGAL t
o cop
y, pri
nt or
save
any c
onten
t of th
is PDF,
in pa
rt or in
full,
on an
y retr
ieval
syste
m,
withou
t the E
XPRESS WRITTEN PERMISSIO
N of th
e cop
yrigh
t-hold
er

National Conference on Climate Change and Agricultural Production: Adapting Crops to Climate Variability and Uncertainty, 6th–8th April, 2017
[131]
Table 1: Water Productivity and Harvest Index of Rice Crop Grown under Different CO2 Concentrations and Water Regimes
Water Regime Water Productivity (kg m-3) Ambient CO2 level Elevated CO2 level
C400 CC400 CC550 CC700 % CO2 effect£ % CO2 effect¥ WW 0.37bB 0.37bB 0.5aB 0.48aB +35.1 +29.7 WD 0.47bA 0.47bA 0.7aA 0.69aA +48.9 +46.8 % Water Deficit Effect
+27 +27 +40 +43.8
Harvest Index Water
Regime Ambient CO2 level Elevated CO2 level
C400 CC400 CC550 CC700 % CO2 effect£ % CO2 effect¥ WW 0.42aA 0.42aA 0.42aA 0.42aA - - WD 0.35bB 0.35bB 0.42aA 0.42aA +20 +20 % Water Deficit Effect
-16.7 -16.7 - -
Different lower case letters indicate significant (p ≤ 0.05) difference among treatments in a row, whereas different upper case letters indicate significant (p ≤ 0.05) difference among the treatments in a column by Duncan Multiple Range Test. Values represents (average of two years) ± standard error (n=2). C400 = Open field and ambient CO2, CC400 = Chamber control and ambient CO2, CC550 = Elevated CO2 (550±20 ppm) in OTC, CC700 = Elevated CO2 (700 ±20 ppm) in OTC. £ =% CO2 effect at CC550 over CC400, ¥ =% CO2 effect at CC700 over CC400. WW = Well watered, WD = Water deficit.
REFERENCES [1] Baker JT and Allen Jr L.H. 2005.Rice Growth, Yield and Photosynthetic Responses to Elevated Atmospheric Carbon Dioxide
Concentration and Drought.Journal of Crop Improvement 13 (1): 7- 30. [2] Yang J, Liu K, Wang Z, Du Y and Zhang J 2007.Water-Saving and High-Yielding Irrigation for Lowland Rice by Controlling Limiting
Values of Soil Water Potential.Journal of Integrative. Plant Biology 49 (10): 1445–1454.
Assessment of Integrated Nutrient Management Strategies in rabi Maize
Vinod Kumar1*, Mukesh Kumar1, Ashok Kumar1 and M.K. Singh2 1Krishi Vigyan Kendra, Munger, Bihar–811201
2Department of Agronomy, B.A.C., Sabour–813210 E-mail: *[email protected]
Keywords: INM, Vermicompost, Bio fertilizer, Maize
INTRODUCTION
India, Maize is grown though out the year under cereal crop due to photo thermal insensitive characters. The productivity of Rabi maize affected by various factors including weather and nutrients during winter season. Maize crop is more nutrient exhaustive crop and require balanced proportion of macro and micronutrients for optimum growth and yield potential. Among the nutrients nitrogen is key element for better harvest needed about 150 kg/ha N (Prasad et. al, 1987). Balance supply of organic sources viz. FYM, vermicompost, Azotobacter or Azospirillum with inorganic sources may increase production, grain quality and soil health. Azotobacter is an important free living organism and ability to fix the atmospheric nitrogen in to soil ranging from 20-30 kg N per hectare and phosphorous solubilising bacteria is major role to availability of phosphorous from insoluble phosphorous to soluble phosphorous in to soil. It is most important that
It is I
LLEGAL t
o cop
y, pri
nt or
save
any c
onten
t of th
is PDF,
in pa
rt or in
full,
on an
y retr
ieval
syste
m,
withou
t the E
XPRESS WRITTEN PERMISSIO
N of th
e cop
yrigh
t-hold
er

National Conference on Climate Change and Agricultural Production: Adapting Crops to Climate Variability and Uncertainty, 6th–8th April, 2017
[132]
adequate quantity of farm yard manure and bio fertilizers (Azotobacter or Azospirillum) to be applied under integrated manner with organic sources has become sustained production over high cost of chemical fertilizers (Nanjappaet .al., 2001). Keeping the above point in views an strategies made for conducting on farm trial at farmers field in respect to integrated nutrient management (INM) for Rabi maize and it aims to reduce the higher dose inorganic fertilizers to assess integrated nutrient options in quality of grain and enrichment of soil health by using as few as possible technical options of any organic, bio fertilizers and inorganic fertilizers. We analysed the impact of INM strategies on reducing chemical fertilizer use on Rabi maize in Bihar.
MATERIALS AND METHODS
A field study was conducted in Bahachowki and Sunderpur two villages of Dharahara block of Munger district of Bihar state during the year 2014-15 and 2015-16 in two Rabi seasons, respectively. The field survey was conducted in selected villages under innovative maize growers/farmers. On the basis of field survey problem was identified in the farmers fields applied higher dose of inorganic fertilizers in Rabi maize for this On- Farm Trial. three technical strategies like 100% recommended dose of NPK fertilizer (120:75:50 kg/ha NPK), 75% recommended dose of NPK fertilizer with 2.5 tonne vermicompost per ha and 75% recommended dose of NPK fertilizer with 2.5 kg per ha Azotobacter and 2.5 kg per ha phosphorous solubilising bacteria (PSB) and farmers practice(100:60.40 kg/ha NPK) was randomly demonstrated in 06 farmers field of a village during both the years. The soil of the demonstrated trial was analyzed by standard procedures. clay loam having pH 6.8 to 7.6, rich in organic carbon (0.35 to 0.56%), and medium in available P2O5 (20.3 to 25.8 kg/ ha) and K2O (193.4 to 206.2 kg/ha) in irrigated situations of both the villages of Dharahrabolck of Munger district. KVK, Munger was supplied maize hybrid seed, chemical fertilizers, vermicompost and bio-fertilizers for conducting on farm trial. Data on growth, yield attributes and yield were recorded and data analysed with the suitable statistical methods to compare the yield of farmer's practice and on farm trial plots.
RESULTS AND DISCUSSION
The average highest grain yield (72.6 and76.2 qt. / ha) and stover yield (72.6 and76.2 qt./ ha) was with 75% recommended NPK + 2.5 t/ ha vermicompost, followed by 75% recommended NPK + 2.5 kg/ ha azotobacter and 2.5 kg/ ha phosphorous solubilising bacteria and 100% recommended NPK over farmer's practiceduring both the years consecutively . However, The average 1000-grain weight, number of grains per row, cob length was influenced with 75% recommended NPK + 2.5 t/ ha vermicompost, followed by 75% recommended NPK + 2.5 kg/ ha azotobacter and 2.5 kg/ ha phosphorous solubilising bacteria and 100% recommended NPK over farmers practice during both the years. Application of 75% recommended NPK + 2.5 t/ha vermicompost was obtained 35.1% and 37.0% higher grain yield and 26.8% and 31.7% higher stover yield over farmer's practice in both the years.The average highest gross return (Rs.100260 and 107680/ ha) and net returns (Rs. 68650 and Rs. 72880/ ha) was recorded with 75% recommended NPK + 2.5 t/ ha vermicompost, followed by 75% recommended NPK + 2.5 kg/ ha azotobacter and 2.5 kg/ ha phosphorous solubilising bacteria and 100% recommended NPK over farmer's practice (Rs.66140 and 68290/ ha) during both the years consecutively . However, The B:C ratio ( 2.17and 2.09) was recorded with 75% recommended NPK + 2.5 t/ ha vermicompost, followed by 75% recommended NPK + 2.5 kg/ ha azotobacter and 2.5 kg/ ha phosphorous solubilising bacteria and 100% recommended NPK over farmers practice(1.39 and 1.25) during both the years.
Thus, it indicated that application of 75% recommended NPK + 2.5 t/ha vermicompost is most suitable option in supply of nutrient for Rabi maize in diara area of the Munger district.
It is I
LLEGAL t
o cop
y, pri
nt or
save
any c
onten
t of th
is PDF,
in pa
rt or in
full,
on an
y retr
ieval
syste
m,
withou
t the E
XPRESS WRITTEN PERMISSIO
N of th
e cop
yrigh
t-hold
er

National Conference on Climate Change and Agricultural Production: Adapting Crops to Climate Variability and Uncertainty, 6th–8th April, 2017
[133]
REFERENCES [1] Lelei JJ, Onwonga RN, Freyer B 2009. Organic based nutrient management strategies: Effect on soil nutrient availability and maize (Zea
mays L.) Performance in Njoro, Kenya. Afr. Journal of Agricultural Research 4: 092-099. [2] Nanjappa HV 2001. Effect of integrated nutrient management in yield and nutrient balance in maize.Indian Journal of Agronomy 46:
698-701. [3] Sujatha MG, Lingraju BS, Palled YB, Ashalatha KV 2008. Importance of Integrated Nutrient Management Practices in Maize under
Rainfed Condition.Karnataka Journal of Agricultural Sciences 21: 334-338.
Optimization of Irrigation and Fertilizer Scheduling Based on Climatological Data and the Predicted Data for the Cropping Period
using Cropwat 8.0 for Hybrid Maize Under Fully Automated Drip Irrigation
Arthi T.* and K. Nagarajan Department of Soil and Water Conservation Engineering,
Agricultural Engineering College & Research Institute, Kumulur, Trichy, Tamil Nadu E-mail: *[email protected]
Keywords: Iirrigation scheduling, Climatological data, CROPWAT8.0
INTRODUCTION
Agriculture provides livelihood to majority of population and thus remains linchpin of Indian economy. WATER is the vital source for crop production and is the most limiting factor in Indian agricultural scenario. Water makes a significant contribution to food security as it directly affects agricultural productivity. The experiment was conducted to optimize the requirement of irrigation and fertilizer level for hybrid maize during rabi season based on the climatic data and in order to find the water use efficiency. On this basis irrigation scheduling and fertilizer scheduling is programmed in the fully automated drip irrigation system. This investigation is carried out in order to Calculate the CWR and to provide irrigation scheduling for hybrid maize (NK 6240) based on the climatic data using CROPWAT 8.0.
MATERIALS AND METHODS
Experiment was conducted in Irrigation Cafeteria of Water Technology Centre of TNAU, Coimbatore, to evaluate the yield effects under optimized irrigation condition for which irrigation is scheduled based on the climatic data obtained for past 25 years and also for the cropping period using CROPWAT 8.0. CWR is calculated by using formula and also by CROPWAT 8.0 produced by FAO. Biometric characters were observed during the cropping period. Other hydraulic parameters like uniformity co-efficient, wetting pattern, clogging effect etc were also concentrated during the study. The soil moisture distribution was found by taking soil samples at different depth and distances. The reading and distribution pattern were given in surfer.
It is I
LLEGAL t
o cop
y, pri
nt or
save
any c
onten
t of th
is PDF,
in pa
rt or in
full,
on an
y retr
ieval
syste
m,
withou
t the E
XPRESS WRITTEN PERMISSIO
N of th
e cop
yrigh
t-hold
er

National Conference on Climate Change and Agricultural Production: Adapting Crops to Climate Variability and Uncertainty, 6th–8th April, 2017
[134]
Fig. 1: Irrigation Requirement Calculated for Hybrid Maize by CROPWAT8.0 (Based on Climatic Data
CONCLUSION
Irrigation scheduling was done based on the climatological data obtained for 25 years and the forecasted data obtained for the cropping period .The result revealed that irrigation scheduling done using CROPWAT 8.0 using climatogical data was effective and the forecasted data helped us to manage the irrigation frequency, volume of irrigation and application of time of fertilizer. Leaching of soil was very much reduced. Hence only required volume of water is alone given to the plant, effective utilization of water and fertilizer was found. Wastage of water and fertilizer was much reduced resulting in saving of 20- 30% . WUE and FUE was found to be high when compared to the practice followed by the farmers usually and irrigation scheduling done based the climatogical data. Using of CROPWAT8.0 gives accurate CWR, which is useful for programming in fully automated condition results in 20 -30% of irrigation water saving and hence fertilizer is applied at correct time at the root zone results in effective utilization of the fertilizers.
REFERENCES [1] Sheng-Feng K, Bor-Jang L, Horng-Je Sh. 2001. Cropwat model to evaluate crop water requirements in Taiwan.International Commission
, Irrigation and Drainage. 1st Asian Regional Conference. Seoul. [2] Smith M. 1992.CROPWAT- A computer program for irrigation planning and management. FAO Irrigation and Drainage paper 46.
y = 0.215x + 3.159R² = 0.928
Net
irrig
atio
n re
quire
d (m
m)
Days
It is I
LLEGAL t
o cop
y, pri
nt or
save
any c
onten
t of th
is PDF,
in pa
rt or in
full,
on an
y retr
ieval
syste
m,
withou
t the E
XPRESS WRITTEN PERMISSIO
N of th
e cop
yrigh
t-hold
er

National Conference on Climate Change and Agricultural Production: Adapting Crops to Climate Variability and Uncertainty, 6th–8th April, 2017
[135]
Development of a Sensors System for Efficient Water Management and Agricultural Productivity Based on Smart Irrigation
A. Selvaperumal1* and K. Ramasamy2 1Department of Soil and Water Conservation Engineering,
Agricultural Engineering College & Research Institute, Kumulur, Trichy, India 2Department of Water Technology Centre,
Tamil Nadu Agricultural University, Coimbatore-641 003, India E-mail: *[email protected]
Keywords: Resistance moisture sensor, Gypsum Block Sensor, Water level Sensor
INTRODUCTION
Agricultural sector is playing vital role in Indian economy, in which irrigation mechanism is of key concern. Automatic agricultural systems can be programmed to discharge more precise amounts of water in the field, which promotes water conservation (Zhang Feng, 2011). GSM based controller has been linked with sensor unit for switch on and off the agricultural pump sets. Automation of irrigation systems has the potential to provide maximum water use efficiency by maintaining water level in paddy field and soil moisture at optimum levels as revealed from field experiments. In addition, the developed irrigation method removes the need for workmanship for flooding irrigation. Hence the present research had been proposed to fulfill the following objective is Development of low cost durable sensors for standing water depth above the soil surface and soil moisture content for the soils cultivated with rice.
MATERIALS AND METHODS
The experimentwas conducted in AEC&RI, Kumulur during 2015-16. The main hypothesis in regards to this work is that using sensor technology to automate irrigation in which it improves water usage efficiency.Resistive type of moisture sensor is made up of two carbon electrodes (replaced for metallic) probes to pass current through the soil, and then we read that resistance to get the moisture level. Water level sensor is a set of mechanical moment holding system with or without submergence inside water using principle of floating. It was connected to the automation unit and it was observed that the sensor was working properly and the motor was switched ON and OFF automatically with respect to the preset value of water depth. Gypsum soil moisture sensor is the electrical resistance between electrodes embedded in a porous medium (block) is proportional to its water content, which is related to the soil water matric potential of the surrounding soil. GSM based controller has been linked with sensor unit for switch on and off the agricultural pump sets.
RESULTS AND DISCUSSION
A system is proposed for automatic irrigation system based on soil moisture requirement. This system uses three nodes which communicate each other and irrigate agricultural field automatically. The system consist of soil moisture sensor to detect the moisture level and automatically irrigate the field by means of solenoid valve to control the flow of water from source to field and pressure sensor to control the power supply to
It is I
LLEGAL t
o cop
y, pri
nt or
save
any c
onten
t of th
is PDF,
in pa
rt or in
full,
on an
y retr
ieval
syste
m,
withou
t the E
XPRESS WRITTEN PERMISSIO
N of th
e cop
yrigh
t-hold
er

National Conference on Climate Change and Agricultural Production: Adapting Crops to Climate Variability and Uncertainty, 6th–8th April, 2017
[136]
water pump.Observation of specified standing water depth (3cm, 4cm and 5 cm) in 4 corners of the field and time taken for disappearance was done in Central farm, Kumulur, TNAU. Crop yield was increased by 19.7% with water saving of 15.6% in the sensor installed field compared to control field in the first season (2014). In the first kuruvai season July 2015 the water saving to a tune of 20.1% was achieved compared the non sensor field with the water use efficiency of 4.93 kg /ha per mm with the rice crop yield 5360kg/ha.The second season Sep 2015-Feb 2016, recorded the rice yield of 3904kg/ha with a water saving of 18% and water use efficiency of 3.54kg/ha/mm (Farmers field).Gypsum block soil moisture sensor was calibrated in two locations of Tamil Nadu Agricultural University (i) Wetlands and (ii) Eastern block farm and the electrical resistance values for the corresponding soil moisture were observed for one week at every two hours interval. The developed soil moisture sensor was tested in four soil types namely (Clay loam, Silty clay loam, sandy loam and clay soil) at field conditions.Crop yield was increased by 22.2% with water saving of 18.0% in the sensor installed field compared to control field in the first season.
Table 1: Performance Evaluation of Water Level Sensor in Field Condition
Particulars Sensor Placed Field Control Plot
AnnaR4 rice crop-Kuruvai season (July’15 to Nov’15)
Total water used 795 1000
% Water saving 20.1
Grain yield/ ha(Kg) 5360 4466
% yield increase 21.0
ADT49 crop-Samba season in farmer field (Sep’15 to Feb’16)
Total water used 630 1000
% Water saving 18
Grain yield/ ha (Kg) 3904 3250
% yield increase 20
Fig. 1: Layout of Resistance Soil Moisture Sensor System Installed in the Area
REFERENCES [1] Zhang Feng 2011. Research on water-saving irrigation automatic control system based on internet of things, Electric Information and
Control Engineering (ICEICE), International Conference, 4(1): 2541-2544.
It is I
LLEGAL t
o cop
y, pri
nt or
save
any c
onten
t of th
is PDF,
in pa
rt or in
full,
on an
y retr
ieval
syste
m,
withou
t the E
XPRESS WRITTEN PERMISSIO
N of th
e cop
yrigh
t-hold
er
National Conference on Climate Change and Agricultural Production: Adapting Crops to Climate Variability and Uncertainty, 6th–8th April, 2017
[137]
Carbon Density and Sequestration by Conifer Tree Species of Shankaryacharya Reserve Forest
Shazmeen Qasba*, T.H. Masoodi, S.J.A. Bhat, P.A. Sofi and G.M. Bhat Faculty of Forestry, Sher-e-Kashmir University of Agricultural Sciences
& Technology of Kashmir, Benihama, Ganderbal, India E-mail: *[email protected]
Keywords: Carbon, Density, Sequestration, Conifer, Reserve forest
INTRODUCTION
Forests account for approximately 40% (5.1 billion ha) of the land area of the earth’s surface (FAO, 1995). In global terms, these forests are a major carbon store house and accommodate about 331 Gt of carbon in biomass, 656 Gt in soil. These are significant portions of the global carbon pool in relation to the atmosphere while houses 750 Gt, of carbon (Loarie et al., 2001). Trees and forests are thus crucial to the global carbon cycle with total carbon content of forests being more than the amount held in the entire atmosphere. New plantation forests offers intrinsic value to carbon industry as a basis for gaining carbon credits to offset continuing greenhouse emissions. The information generated from this study has helped to generate a valuable data on carbon density and its sequestration by some conifers which comprise prominent component of its vegetation structure.
MATERIALS AND METHODS
The present investigations were carried out during 2012-2013 on Shankaracharya hillock, Srinagar, Kashmir which stands declared as a reserve forest. The altitude of the study site varies from 1575 to 1967 m asl .The following attributes were recorded to determine carbon stock and its sequestration by conifers recorded at the hillock.
CARBON STOCK
Carbon stock was calculated by multiplying the biomass with factor 0.45 as per Woomer (1990).
Cb = α M
Where,
Cb is carbon density
α is default carbon content (0.45)
M is total biomass (tons ha-1 or kg tree-1)
Carbon sequestration (CO2e)
The elementalcarbon removed from the atmosphere (CO2) was then calculated as per procedure followed by Dury et al. (2002).
CO2e = Cb × 3.67
The data collected in the field was statistically analysed according to well designed procedures prescribed by Gomez and Gomez (1984).
It is I
LLEGAL t
o cop
y, pri
nt or
save
any c
onten
t of th
is PDF,
in pa
rt or in
full,
on an
y retr
ieval
syste
m,
withou
t the E
XPRESS WRITTEN PERMISSIO
N of th
e cop
yrigh
t-hold
er

National Conference on Climate Change and Agricultural Production: Adapting Crops to Climate Variability and Uncertainty, 6th–8th April, 2017
[138]
RESULTS AND DISCUSSION
On middle altitude Cedrus deodara recorded with highest, total carbon density of 53.11 tons ha-1 and total carbon sequestration of 195.0 Co2e tons ha-1, Pinus helpensis emerged as co-dominantspecieswith total carbon density 38.7 tons ha-1 and total carbon sequestration of 142.3 Co2e ton ha-1. Cupressus torulosa averaged with total carbon density of 21.3 tons ha-1 and total carbon sequestration of 78.47 Co2e tons ha-1
on lower altitude and on middle altitude total carbon density 10.7 tons ha-1 and total carbon sequestration of 39.47 Co2e tons ha-1.The lowest total carbon density and total carbon sequestration of 6.21 tons ha-1 and 22.7 Co2e tons ha-1 was displayed by Pinus canariensis, respectively. The over all total carbon density and total carbon sequestration by all coniferous species on Shankaracharya reserved forest was 226.18 tons ha-1 and 830.74Co2e tons ha-1 respectively. Our results are also in conformity with the findings of Yadava (2011), who reported species specific variation in carbon sequestration potential at various places.This study was concluded as Cedrus deodara recorded the maximum carbon density and carbon sequestration potential among all the conifers on the study site. Thus, this conifer will provide a long term carbon fixation capacity as compared to other conifer species.
Table 1: Total Average Carbon Density and Carbon Sequestration of Conifer Tree Species of Shankaryacharya Reserve Forest along an Altitudinal Gradient
Species Altitude Ranges Altitude Total Carbon
Density (Ton ha-1) Total Carbon
Sequestration (Co2e) Cupressus torulosa
1575-1705 m asl (Lower)
Lower 21.3 78.47 Middle 10.7 39.47
Pinus helpensis Middle 38.7 142.3 Cedrus deodara 1705-1835 m asl
Middle Middle 53.11 195.0 Upper 61.65 226.2
Pinus wallichiana 1835-1967 m asl Upper
Upper 27.04 99.2 Pinus roxburghii Middle 7.47 27.4 Pinus canariensis Middle 6.21 22.7
Total 226.18 830.74
REFERENCES [1] Anonymous. 1995. Food and Agricultural Organization report. [2] Dury S.J., Polgase P Jand Vercose T 2002.Greenhouse kit for Private Forest Growers.Common Wealth Department of Agriculture and
Forestry, Canberra, Australia IV.pp: 95. [3] Gomez K A and Gomez A A 1984. Statistical procedures for agricultural research. John Viley and Sons, New York pp: 304-308. [4] Loarie M, Naeem S, Inchausti P, Bengtsson J, Grime J P, Hector A, Hooper D U, Huston M A, Raffaelli D, Schmid B, Tilman D, Wardle
D A et al. 2001. Biodiversity and ecosystem functioning: current knowledge and future challenges. Science 294: 804-808.Find all citations by this author (default).Orfilter your current searchFind all citations by this author (default).Orfilter your current search
[5] Woomer P L 1990. Impact of cultivation of carbon fluxes in woody savannas of southern Africa.Water Air Soil Pollution70: 403-412. [6] Yadava A K 2011. Potential of agroforestry systems in carbon sequestration for mitigating climate changes in Tarai region of central
Himalaya. Nature and Science 9: 72-80.
It is I
LLEGAL t
o cop
y, pri
nt or
save
any c
onten
t of th
is PDF,
in pa
rt or in
full,
on an
y retr
ieval
syste
m,
withou
t the E
XPRESS WRITTEN PERMISSIO
N of th
e cop
yrigh
t-hold
er

National Conference on Climate Change and Agricultural Production: Adapting Crops to Climate Variability and Uncertainty, 6th–8th April, 2017
[139]
Carbon Storage and Mitigation Potential of Cupressus torulosa (Himalayan cypress) in Kashmir Valley
Nasir Rashid Wani*, Khwaja Naved Qaisar, Shazmeen Qasba and Amir Farooq Bhat Faculty of Forestry, Sher-e-Kashmir University of Agricultural Sciences
and Technology of Kashmir, Shalimar–190025, India E-mail: *[email protected]
Keywords: Biomass, Carbon stock, Carbon dioxide mitigation, Cupressus torulosa
INTRODUCTION
The concentration of CO2 and other greenhouse gases in the atmosphere has considerably increased over the last century and is set to rise further. Carbon is accumulating in the atmosphere at a rate of 3.5per annum, the largest proportion of which resulting from the burning of fossil fuels and the conversion of tropical forests to agricultural production (Paustian et al., 2000). The Cupressus torulosa (Himalayan Cypress) belongs to the family coniferae is a large evergreen tree with a pyramidal crown and drooping branchlets.In Kashmir valley it is mostly found in gardens and parks. Thus keeping in view the importance of the tree species an attempt was made to quantify the ability of the tree species to sequester atmospheric carbon under Kashmir conditions.
MATERIALS AND METHODS
The present study was carried out at Sher-e-Kashmir university of Agricultural sciences and technology of Kashmir (SKUAST-K), Shalimar during 2009 and 2010. The trees were planted during March, 1990 having 19 years of age. After survey of the experimental site, a quadrate of size 10 x 10 m was laid at the area and total 24 trees in a particular quadrate were enumerated according to diameter at breast height (DBH). These trees were then classified into three diameter classes viz; 0-10 cm, 10-20 cm and 20-30 cm for measuring volume, biomass and carbon stock.The diameters at breast height (DBH) of the trees falling in the plot of size 10 x 10 m were measured . Form factor and volume was calculated by using the following formula given by Pressler (1865) and Bitlerlich (1984).
hhf
3
2 1
Where, f is the form factor, h1 = height at which diameter is half of DBH and h is the total height.
The volume (V) was calculated by Pressler’s formula:
V = f × h × g Where,f = form factor, h = total height (m) and g = basal area, g = πr2 or π (dbh/2)2 Where, r = radius
Biomass was calculated by the formula
Stem biomass = Specific gravity × stem volume
Biomass carbon stock was estimated by ash content method described by Negi et al. (2003).
The carbon dioxide equivalent was calculated as per the following equation:
Carbon dioxide equivalent = Carbon stock × 3.66
It is I
LLEGAL t
o cop
y, pri
nt or
save
any c
onten
t of th
is PDF,
in pa
rt or in
full,
on an
y retr
ieval
syste
m,
withou
t the E
XPRESS WRITTEN PERMISSIO
N of th
e cop
yrigh
t-hold
er

National Conference on Climate Change and Agricultural Production: Adapting Crops to Climate Variability and Uncertainty, 6th–8th April, 2017
[140]
RESULTS AND DISCUSSION
Among the different diameter classes, the DBH, height, basal area and volume increased with the increase in diameter class and the maximum DBH (24.57 cm/tree) was recorded in diameter class 20-30 cm during 2010 and minimum (7.84 cm/tree) was observed in diameter class 0-10 cm during 2009. Similarly other parameters follow the same trend.The increase in DBH, height, basal area and volume is due to radial and apical growth of the trees (Heryati et al., 2011).The average stem dry biomass of Cupressus torulosa increased with corresponding increase in diameter class (Table 2) and was recorded maximum in diameter class 20-30 cm during 2010 and minimum in diameter class 0-10 cm during 2009.Since biomass of trees varies from species to species according to climatic conditions, because climate plays a vital role in biomass development of trees.It is clear from the data presented in (Table 3) that stem carbon showed an increasing trend with the corresponding increase in diameter class and was recorded maximum under diameter class 20-30 cm during 2010 and minimum under diameter class 0-10 cm during 2009. Terakunpisut et al. (2007) has reported that carbon stock is more in trees having greater diameter as compared to trees having lower diameter.Thus trees with greater diameter are the largest component of biomass and carbon stock.Perusal of the data in (Table 4) reveals that stem CO2equivalent shows an increasing trend with the increase in diameter class and was recorded maximum under diameter class 20-30 cm during 2010 and minimum under diameter class 0-10 cm during 2009. CO2 mitigation potential is more in higher diameter class as compared to lower diameter class because in higher diameter class, there is higher biomass production which is directly related to CO2 mitigation (Yadava, 2010).
REFERENCES
[1] Bitlerlich W 1984. The Relaskop Idea Slough: Common Wealth Agricultural Bureause, Farnham Royal, England. [2] Heryati Y, Belawan D, Abdu A and Mahat M N 2011.Growth performance and biomass accumulation of a Khaya ivorensis plantation in
three soil series of ultisols.American Journal of Agricultural and Biological Sciences6(1):33-44. [3] Negi J D S, Manhas R K and Chauhan P S 2003. Carbon allocation in different components of some tree species of India : A new
approach for carbon estimation. Current Science85(11):1528-1531. [4] Paustian K, Six J, Elliott E T and Hunt H W 2000. Management options for reducing CO2 emissions from agricultural soils.
Biogeochemistry48: 147–163. [5] Pressler M 1865. Das Gesetzder Stambildung Leipzig pp: 153. [6] Terakunpisut J, Gajaseni N and Ruankawe N 2007.Carbon sequestration potential in aboveground biomass of thong phan phum national
forest, Thailand.Applied Ecology and Environmental Research 5(2): 93-102. [7] Yadava A K 2010. Biomass production and carbon sequestration in different agroforestry systems in Tarai region of central
Himalaya.Indian Forester136(2): 234-244.
It is I
LLEGAL t
o cop
y, pri
nt or
save
any c
onten
t of th
is PDF,
in pa
rt or in
full,
on an
y retr
ieval
syste
m,
withou
t the E
XPRESS WRITTEN PERMISSIO
N of th
e cop
yrigh
t-hold
er

National Conference on Climate Change and Agricultural Production: Adapting Crops to Climate Variability and Uncertainty, 6th–8th April, 2017
[141]
Greenhouse Gas Emission from Selected Cropping Patterns in Bangladesh
M.M. Haque1, J.C. Biswas1*, M Maniruzzaman1, A.K. Choudhury2, U.A. Naher1, B. Hossain1, S. Akhter2, F. Ahmed2 and N Kalra3
1Bangladesh Rice Research Institute, Gazipur, Bangladesh 2Bangladesh Agricultural Research Institute, Gazipur, Bangladesh
3Indian Agricultural Research Institute, New Delhi, India E-mail: *[email protected]
Keywords: Global warming potential, Cropping patterns
INTRODUCTION
The demand for food is increasing in Bangladesh due to rapid population growth. Farmers are growing different crops in a year to increase food production following different cultural managementoptions including use of variable amounts of fertilizers. Most of the farmers use excessive nitrogenous fertilizer (Biswas et al. 2004) and try to keep paddy field continuously flooded. These practices not only increase cost of production but also enhance additional greenhouse gas (GHG) emission from crop fields. Rice crop covers about 85% of agricultural land in Bangladesh and contribute to global warming potential (GWP) because of methane (CH4), nitrous oxide (N2O) and carbon dioxide (CO2) gas emissions (Solomon et al. 2007; Lee 2010). Globally 81% of agricultural emissions come from nitrogenous fertilizer production and its use (Iserman 1994). These imply that climate smart agricultural practices need to be followed for reducing GHG emission from crop fields; but pattern based emission data are lacking in Bangladesh. So, GWP for selected major cropping patterns were determined for ecosystem modification and adaptation in crop production.
MATERIALS AND METHODS
Field experiments data were collected from hand book of agricultural technology (BARC & AFACI, 2013) proceedings research review and planning workshop of soils program of NARS institutes (2015) and different research organization in Bangladesh.Cool Farm Tool Beta-3 was used to determine total GHG gas emission under different cropping patterns and expressed as global warming potential (GWP). Many major cropping patterns are working at different district. Among them Jute-T.Aman-Fallow, Jute-Fallow-Onion, Boro-Fallow-T.Aman, Mustard-Boro-T. Aman, Mustard-Boro-Fallow, Wheat-T. Aus-T. Aman, Potato-Boro-T. Aman, Maize-Fallow-T. Aman Potato-Maize-T. Aman Wheat-Mungbean-T. Aman cropping patterns are used for estimation of total GHG and GWP.
RESULTS AND DISCUSSION
Estimated GWP was the least (2125 CO2eq kgha-1) in Onion-Jute-Fallow pattern and the highest (7853.8 2125 CO2eq kgha-1) in Mustard-Boro-T. Aman pattern.Fallow-Jute-T.Aman (2348.2 CO2eq kgha-1), Wheat-Mungbean-T. Aman (3315.2 CO2eq kgha-1) and Maize-Fallow-T. Aman (3987.9 CO2eq kgha-1) patterns could also be better options for mitigation of GHG emission in Bangladesh. However, Wheat-T.Aus-T. Aman (4591.9 CO2eq kgha-1) and Potato-Maize-T. Aman (4618.3 CO2eq kgha-1) patterns need to be adopted
It is I
LLEGAL t
o cop
y, pri
nt or
save
any c
onten
t of th
is PDF,
in pa
rt or in
full,
on an
y retr
ieval
syste
m,
withou
t the E
XPRESS WRITTEN PERMISSIO
N of th
e cop
yrigh
t-hold
er

National Conference on Climate Change and Agricultural Production: Adapting Crops to Climate Variability and Uncertainty, 6th–8th April, 2017
[142]
considering food security of the country (Table 1). Boro based cropping pattern gave higher GWP than T.Aus and T. Aman based cropping patterns because of variations in rice varieties having higher growth duration and yield and more fertilizer and water requirements than T. Aus and T. Aman rice varieties. Water and efficient fertilizer management needs to be adopted for reducing GWP from rice based cropping patterns.
Table 1:Global Warming Potential from Selected Cropping Patterns under Standard Management Practices, Bangladesh
Cropping Pattern GWP (CO2 eq kg ha-1) Fallow-Jute-T. Aman 2348.2 Onion-Jute-Fallow 2125.0 Boro-Fallow-T. Aman 7180.8 Mustard-Boro-T. Aman 7853.8 Mustard-Boro-Fallow 6375.6 Wheat-T. Aus-T. Aman 4591.9 Potato-Boro-T. Aman 7811.2 Maize-Fallow-T. Aman 3987.9 Potato-Maize-T. Aman 4618.3 Wheat-Mungbean-T. Aman 3315.2
REFERENCES [1] Biswas J.C., Islam M.R., Biswas S.R., and Islam M.J. 2004. Crop productivity at farmers fields: Options for soil test based fertilizer use and
cropping patterns. Bangladesh Agronomy Journal 10 (1 & 2): 31-41. [2] Lee Y.H. 2010. Evaluation of no-tillage rice cover crop cropping system for organic farming. Korean Journal of Soil SciFert 43: 200–208. [3] Iserman K. 1994. Agriculture's share in the emission of trace gases affecting the climate and some cause-oriented proposals for sufficiently
reducing this share. Environmental Pollution 83 (1-2): 95-111. [4] Solomon S., Qin D., Manning M., Chen Z. and Marquis M 2007. Contribution of Working Group I to the fourth assessment report of the
intergovernmental panel on climate change. Cambridge, University Press, Cambridge.
Crop Adaptation and Management Interventions for Climate Resilient Agriculture Identification of Climate Resilient Production
System and Crop under Semi-Arid Tropics (SAT)
M. Shamim1*, N. Ravisankar1, A.S. Panwar1, A.B. Singh2 and K. Ramesh2 1ICAR-Indian Institute of Framing Systems Research, Modipuram–250110 (U.P.)
2ICAR-Indian Institute of Soil Science, Bhopal–462038 (M.P.) E-mail: *[email protected]
Keywords: Climate resilient, production systems, soybean, wheat, mustard, chickpea
INTRODUCTION
Climate change will severely set back agricultural development in tropical countries, where an increasing share of the poorest and most vulnerable population resides.Climate change and variability are posing serious challenges impacting Indian agriculture especially in view of the climate where about 2/3rd area is under rainfed situation and huge population dependency on agriculture with poor coping mechanism. As the crop production systems are more vulnerable due to changing climate with weather extremes and poor physical condition of soil particularly in semi-arid conditions. Besides other crop management practices e.g. shifting of sowing window of the crops, growing of tolerant/resistant cultivars towards inclement weather,
It is I
LLEGAL t
o cop
y, pri
nt or
save
any c
onten
t of th
is PDF,
in pa
rt or in
full,
on an
y retr
ieval
syste
m,
withou
t the E
XPRESS WRITTEN PERMISSIO
N of th
e cop
yrigh
t-hold
er

National Conference on Climate Change and Agricultural Production: Adapting Crops to Climate Variability and Uncertainty, 6th–8th April, 2017
[143]
inherently organic systems are highly adaptive to climate change due to the application of traditional skills and farmers’ knowledge, resistant to lodging of crops, soil fertility-building techniques and a high degree of diversity. In this endeavour, the present study explores climate resilient production systems and crops as possible adaptation strategies under changing climate.
MATERIALS AND METHODS
Using the data of 11 years (2004-05 to 2014-15) of field experimentation on vertisols of semi-arid tropics, having three management practices viz., organic (supply of 100% nutrients through organic sources and complete organic management as per NPOF standards), towards organic (supply of nutrients through 50% organic + 50% inorganic with complete organic management) and 100% inorganic management and 3 cropping systems viz., (Soybean-wheat, soybean-mustard, soybean-chickpea) and also the long term meteorological data viz., rainfall, maximum and minimum temperature (1951 to 2015), climate resilient production system and crops were identified by working out % gain in yield over inorganic management during normal, high and deficit rainfall years.
RESULTS AND DISCUSSION
Soybean grown under organic and towards organic production systems gained 17.3 and 5.8% yield respectively over inorganic production systems under high rain fall during crop season (June –September). However gain in yield of soybean was higher during deficit rainfall condition in the organic (18.4%) and towards organic production systems (7.8%). Similarly, the yield gain of wheat during high rainfall was found to be 7.8 & 4.9 % under organic and towards organic systems. However, the gain was higher (8.7 and 6.8% respectively) in deficit rainfall situation (Fig. 1).
Fig. 1: Per Cent Yield Gain in a) Soybean and b) Wheat through Organic and towards Organic Production System over Inorganic
Mustard grown under organic production systems gained 6.3 and 12.1% yield under higher rainfall and deficit rainfall conditions respectively. In case of mustard with towards organic production management, the yield difference among high and deficit rainfall situation during crop season was less (5.7 & 5.8% under high & low rainfall years). Chickpea was found to be more resilient crop as compared to others as up to 22.2% yield gain was recorded in chickpea grown under organic production system in comparison to inorganic in the case of high rainfall. However towards organic practice was found to be better climate resilient practice for chickpea under deficit rainfall condition.
5.2
17.318.4
2.1
5.8
7.8
0
2
4
6
8
10
12
14
16
18
20
Normal (two years) High (three years) Deficit (six years)
% Y
ield
gai
n ov
er In
orga
nic
prdu
ctio
n sy
stem
Organic Production System Towards Organic Production System
a)
7.8
4.9
8.7
6.8
0
1
2
3
4
5
6
7
8
9
10
High (three years) Deficit (eight years)
% y
ield
gai
n ov
er in
orga
nic
prod
uctio
n sy
stem
Organic Production System
Towards Organic Production System
b)
It is I
LLEGAL t
o cop
y, pri
nt or
save
any c
onten
t of th
is PDF,
in pa
rt or in
full,
on an
y retr
ieval
syste
m,
withou
t the E
XPRESS WRITTEN PERMISSIO
N of th
e cop
yrigh
t-hold
er

National Conference on Climate Change and Agricultural Production: Adapting Crops to Climate Variability and Uncertainty, 6th–8th April, 2017
[144]
Fig. 2: Per Cent Yield Gain in a) Mustard and b) Chickpea through Organic and towards Organic Production System over Inorganic
It can be concluded that soybean-chickpea cropping system with organic or towards organic management package is found to be better climate resilient production system under high and deficit rainfall situations for Semi-Arid tropics.
Biodiesel Fuel Production from Algae Oil using Crude Enzyme of Newly Isolated Aneurinibacillusmigulanus Strain
Chavan Dhanpal1 and C.N. Khobragade2 1Department of Microbiology ACS College Gangakhed, Maharashtra–431514 India
2Department of Biotechnology School of Life Sciences S.R.T.M. University Vishnupuri Nanded, Maharashtra–431601, India
E-mail: [email protected]
Keywords: Algae oil, crude enzymes, biodiesel, transesterification
INTRODUCTION
Microalgae are a diverse group of microorganisms; they are either prokaryotic or eukaryotic in nature, in recent year microalgae have gained attentation as a possible solution to fossil fuel. current diesel are short supply and cause environment pollution and it is exhaustible fuels, to overcome this problem many alternative sources are being sought out, biodiesel from vegetable oil with alkali based trans esterification currently being used and commercialized, vegetable oil is obtained from crop oil in India. the oil contain of these crop is less than algae, algae can be grown on waste water and the production is harvested with 15 days as compare with oil crop, algae cultivation is chief and feasible. In the present investigation algae was isolated from Godawari river and oil content was found to contain32%, this oil extracted and subjected to enzyme based trans esterification for the production of biodiesel, this study reveals the biodiesel production.
MATERIALS AND METHOD
The study was conducted by isolating oil production scenedesmus algae on BG11 media with light and dark period of 18:6 hour light and dark reaction. 12clux light bulb was used. Algae identified using 18s rRNA
5.8 6.35.7
12.1
0
2
4
6
8
10
12
14
High (three years) Deficit (eight years)
% y
ield
gai
n ov
er in
orga
nic p
rodu
ctio
n sy
stem
Organic Production System
Towards Organic Production System
a
9.8 10.8
22.2
6.8
15.7
12.3
0
5
10
15
20
25
Normal (two years) Deficit (eight years) High (one year)
% y
ield
gai
n ov
er in
orga
nic
prod
ucti
on s
yste
m
Organic Production System
Towards Organic Production System
b)
It is I
LLEGAL t
o cop
y, pri
nt or
save
any c
onten
t of th
is PDF,
in pa
rt or in
full,
on an
y retr
ieval
syste
m,
withou
t the E
XPRESS WRITTEN PERMISSIO
N of th
e cop
yrigh
t-hold
er

National Conference on Climate Change and Agricultural Production: Adapting Crops to Climate Variability and Uncertainty, 6th–8th April, 2017
[145]
sequencing and conforms as speciesScenedesmus sp. YACCYB70. Oil extracted using soxhlet apparatus with hexane as a solvent. Crude oil was analyzed using GCMS and found to contain essential fatty acids.Algae oil was transesterified using crude enzyme of newly isolated bacteria and reaction maintained at 400c at 150 rpm, reaction mixture taken in 50 ml flask containing 6ml algae oil, 2 to 3 ml methanol and 10% volume of crude enzyme.
Analysis of biodiesel: FTIR and GCMS analysis revels presence of methyl ester.
RESULT AND DISCUSSION
In the present investigation isolated microalgae Scenedesmus sp. YACCYB70 , Contain 23% oil and GCMS study reveals it contain olic acid 65%, linolic acid 20.10% ,palmitic acid 5.81%. These fatty acids are good source for biodiesel production.In order to biodiesel production transesterification reaction conform the production of biodiesel to the novel lipase obtained from bacteria Aneurinibacillusmigulanus .Transesterification reaction at optimized condition conforms the methyl ester formation.Form the result and discussion we conclude that newly isolated Scenedesmus sp. YACCYB70 contain 23% oil and it contain essential fatty acids like oilic acid,linolinic acid,palmitic acid ,these fatty acid are raw material for biodiesel. In our study we found that bacteria Aneurinibacillusmigulanus produced novel lipase which can carry out transesterification, this can be purified and further optimized for production of biodiesel.
REFERENCES [1] Heshammsaeed et.al 2005’purification and characterization of two extracellular lipas from pseudomonas aeruginosaps-X.vol
4vol. 3 233-240. [2] Simas A. lapan 2009 optimization of enzymatic transesterification of rapseed oil using response surface surface technology.
Optimization of Sowing Window and Fertilizer Dose for Enhancing the Productivity of Okra (Abelmaschusasculentus) in Changing
Climatic Scenario
S.K. Rai1* and P.K. Singh2 1Department of Horticulture,
Dr. Rajendra Prasad Central Agricultural University, Pusa, Samastipur–848125, Bihar 2College of Horticulture, Noorsarai, BAU, Sabour, Bihar
E-mail: *[email protected]
Keywords: Okra, fertilizer, calendar days, fruit length.
Abstract: Okra seeded on 10 May took maximum calendar days for flower initiation and it decreased with advancement of seeding dates. The crop seeded on this date also enhanced fruit length, number of fruits / plant, fruit yield / plant and finally the fruit yield. The crop fertilized with 150 : 80 : 75 kg NPK/ha took more thermal period for flower initiation and recorded higher fruit length, number of fruits / plant, fruit yield / plant and fruit yield than the lower levels fertilizers. Hence, 10 May was found optimum seeding time and 150: 80: 75 kg NPK / ha was worked out suitable fertilizer dose for enhancing the productivity of Okra in agro ecological condition of Bihar.
It is I
LLEGAL t
o cop
y, pri
nt or
save
any c
onten
t of th
is PDF,
in pa
rt or in
full,
on an
y retr
ieval
syste
m,
withou
t the E
XPRESS WRITTEN PERMISSIO
N of th
e cop
yrigh
t-hold
er

National Conference on Climate Change and Agricultural Production: Adapting Crops to Climate Variability and Uncertainty, 6th–8th April, 2017
[146]
INTRODUCTION
Okra(Abelmaschusasculentus) is one of the most important commercial vegetable crop grown in India. Many factors influencing the rate of plant growth and development including light, (quality, quantity and photoperiod), water, nutrient availability and CO2. However, temperature cited as the most important environmental factor that affects plant development, growth and yield. Changes in temperature from optimum range during plant growth period adversely affects the phasic duration and dry matter accumulation of crop by influencing the physiological process. Of the various production practices, known to enhances Okra productivity, fertilizer is one of the costliest inputs. Imbalanced application of fertilizer resulted in poor yield and deterioration of soil health. Hence, the present study was undertaken to work out suitable fertilizer dose and optimum seeding time for enhancing the productivity in changing global scenario.
MATERIALS AND METHODS
The field experiment was conducted at the Research Farm of college Of Horticulture, Noorsarai, Nalanda (Bihar) during Kharifseason of 2010-11. The soil of the experimental field was sandy loam with pH 7.5. The treatment comprised three sowing dates viz. 10 April, 25 April and 10th May and three levels of fertilizers viz. Control (0 : 0 : 0 kg NPK/ha), 100 : 60 : 50 kg NPK/ha and 150 : 80 : 75 kg NPK/ha). The experiment was laid out in randomized block design with four replications. The fertilizer was applied in the form of urea, single super phosphate and muriate of potash. Okra variety AakaAnamika was sown rows at distance of 30 x 30 cm. After germination 10 plants were tagged in each plot randomly for recording the observation.
RESULT AND CONCLUSION/DISCUSSION
The crop seeded on 10 May took maximum thermal period for flower initiation and it decreased with advancement of seeding time. The yield insces and fruit yield of okra is also significantly influenced by seeding time. The crop seeded later on 10 May attain maximum plant height, bear more number of leaves / plant, enhanced number of fruits / plant, fruit length, fruit yield / plant and finally the fruit yield than earlier sown crop on 25 April and 10 April. Similarly, plant height, yield attributing parameter and fruit yield were also varied significantly among the fertilizer does.The crop fertilized with 150 : 80 : 75 kg NPK/ha recorded higher plant height, number of fruits / plant, fruit length, fruit yield / plant and fruit yield / ha than the lover levels of fertilizer. Similarly, the thermal period for flower initiation was also enhanced at higher level of fertilizer than its lower levels.
Table 1: Effect of Crop Growing Environment and Nutrient Management on Growth and Yield of Okra cv. Arka Anamika
Treatment
Plant Height (cm)
No. of Leaves/ Plant
No. of Days to Flowering
No. of Fruit/Plant
Fruit Length (cm)
Fruit Yield / Plant(gm)
Fresh Fruit Yield / ha (Tones)
Sowingdate (10 April) 121.52 30.02 54.02 24.88 11.61 313.76 12.031 (25 April) 126.18 32.02 54.77 26.25 11.81 316.94 11.827 (10 May) 130.46 33.35 57.20 27.88 12.94 349.06 13.475 SEm± 0.38 0.18 0.18 0.16 0.07 1.84 0.076 CD (P=0.05) 1.10 0.54 0.51 0.45 0.19 5.38 0.223 Fertilizer levels F1 = Control 125.93 31.99 54.91 26.37 11.97 325.30 12.548 F2= 100 :60:50 kgNP K/HA 124.53 31.43 55.81 25.74 11.84 315.00 11.742 F3 = 150 :80: 75 kgNPK 127.70 31.97 55.27 26.91 12.56 339.39 13.043 SEm± 0.37 0.18 0.17 0.15 0.06 1.84 0.07 CD (P=0.05) 1.03 0.53 0.51 0.45 1.18 5.38 0.22
It is I
LLEGAL t
o cop
y, pri
nt or
save
any c
onten
t of th
is PDF,
in pa
rt or in
full,
on an
y retr
ieval
syste
m,
withou
t the E
XPRESS WRITTEN PERMISSIO
N of th
e cop
yrigh
t-hold
er

National Conference on Climate Change and Agricultural Production: Adapting Crops to Climate Variability and Uncertainty, 6th–8th April, 2017
[23]
THEME 2 Weather Based Information, Crop Simulation Modeling and Remote Sensing Applications in Climate Change
Weather Based Information on Risks Management in Agriculture
Crop Simulation Modeling and Remote Sensing Applications in Climate Change
It is I
LLEGAL t
o cop
y, pri
nt or
save
any c
onten
t of th
is PDF,
in pa
rt or in
full,
on an
y retr
ieval
syste
m,
withou
t the E
XPRESS WRITTEN PERMISSIO
N of th
e cop
yrigh
t-hold
er

It is I
LLEGAL t
o cop
y, pri
nt or
save
any c
onten
t of th
is PDF,
in pa
rt or in
full,
on an
y retr
ieval
syste
m,
withou
t the E
XPRESS WRITTEN PERMISSIO
N of th
e cop
yrigh
t-hold
er

National Conference on Climate Change and Agricultural Production: Adapting Crops to Climate Variability and Uncertainty, 6th–8th April, 2017
[149]
Quantification of Relationship of Weather Parameters with Cotton Productivity
Premdeep*, Ram Niwas, M.L. Khichar, Abhilash and Sagar Kumar Department of Agricultural Meteorology, CCS Haryana Agricultural University, Hisar–125004, India
E-mail: *[email protected]
Keywords: Cotton, Weather parameters, Productivity
INTRODUCTION
Cotton lint provides a source of high quality fiber for the textile industry and the cotton seeds are primary by product of lint production an important source of oil for human consumption, and high protein meal used as cattle/livestock feed. It is estimated that a cotton plant can produce one open boll and four more bolls which are nearly 85% mature with approximate 1000 heat units but the crop termination due to defoliation at this stage of plant development may results in nearly 1% loss in the total expected yield without affecting the fiber quality (Wrona et al., 1996). Hence, keeping in view the effect of weather parameters on the growth and development of cotton the present study was planned to quantify the relationship between the weather parameters with the cotton crop growth under different dates of sowing.
MATERIALS AND METHODS
The study was carried out during winter season of 2013-14 in the research area of Department of Agricultural Meteorology, CCS Haryana Agricultural University, Hisar, India.Four dates of sowing i.e. 2nd week of April, 4th week of April, 2nd week of May and 1st week of June constituting the main plots treatments and three cotton varieties viz., HD 123, H 1098 and RASI 134 constituting the sub-plots were analyzed under split plot design to quantify the crop weather relationship under different growing environments. Different yield and yield attributing parameters viz. lint, seed cotton, cotton seed, bolls/ plant were recorded timely upto harvest. Daily weather data recorded at agrimet observatory were used to compute the following agro meteorological indices.
RESULTS AND DISCUSSION
The correlation coefficients of weather parameters with cotton crop during various phenophases were pooled for different cultivars and growing environments. Maximum and minimum temperatures during boll opening stage had significant positive correlation with seed cotton, cotton seed, cotton lint and bolls per plant, whereas minimum temperature during vegetative and flowering stage showed significant negative correlation with the above said crop parameters. This might be due to low temperatures resulted in lower respiration losses. Sunshine hours during flowering had highly significant positive correlation with seed cotton, cotton seed, cotton lint and bolls per plant with correlation coefficients of 0.86, 0.78, 0.96 and 0.89, respectively, but correlation coefficient was highly significant with cotton lint as compared to other crop parameters. Relative humidity at morning and evening hours had significant negative correlation with seed cotton, cotton seed, cotton lint and bolls per plant during vegetative, flowering and boll opening stage but more significant during flowering stage.
REFERENCES [1] Roussopoulos D, Liakatas A and Whittington, WJ 1998. Controlled temperature effects on cotton growth and development. Journal of
Agricultural Sciences 130:451–462. [2] Wrona AF, Banks JC, Hake K, Lege K, Patterson M, Roberts B, Snipes CE, and Supak J 1996. Achieving a clean finish. Cotton
Physiology Today 7(6): 25-31.
It is I
LLEGAL t
o cop
y, pri
nt or
save
any c
onten
t of th
is PDF,
in pa
rt or in
full,
on an
y retr
ieval
syste
m,
withou
t the E
XPRESS WRITTEN PERMISSIO
N of th
e cop
yrigh
t-hold
er

National Conference on Climate Change and Agricultural Production: Adapting Crops to Climate Variability and Uncertainty, 6th–8th April, 2017
[150]
Temporal Change in Tal and Diara Lands and Their Impact on Agriculture: A Case Study of Bhagalpur District, Bihar, India
Binod Kumar Vimal, N. Chattopadhayay, C.D. Choudhary, Anshuman Kohli, Y.K. Singh, Rakesh Kumar, Sunil Kumar, Ragni Kumari, Sweta Shambhawi,Vinay Kumar, Jajati Mandal,
Rajeev Padbhushan, Ghanshyam Singh and Rajkishore Kumar* Department of Soil Science and Agricultural Chemistry,
Bihar Agricultural College, Sabour–813210, Bhagalpur, India E-mail: *[email protected]
Keywords: NDVI, NIR band, RS-GIS, Tal and Diara land
INTRODUCTION
Adjoining of river Ganges, there is vast stretch of backwaters having saucer shaped low land ecology known as “Tal” where most of the rivers and rivulets coming from the south get lost. However, the flood plains of Ganga, which get reworked, get eroded and deposited at regular intervals, are lighter than “Tal” lands are known locally as Diara lands. Both lands having specific geomorphic features are the source of agricultural potential where diversified crops governed the agricultural economics at the present scenario. In this context, present study was carried out for the assessment of temporal change in Tal and Diaralands and their impact on agriculture over the period of 1990 to 2015 under RS-GIS domain.
MATERIALS AND METHODS
The study area i.e. Bhagalpur district (2612.55 km2) is distributed in Bhagalpur division of Bihar. It lies between 25 012’N and 25032’N and 46042’E and 47032’E. The River Ganga separates north Bhagalpur from south Bhagalpur. The area south of Ganga comprises the major portion of the district with generally plain surface, comprising nine blocks known as Sultanganj, Shahkund, Nathnagar, Jagdishpur, Gaura dih, Sabour, Sanhaula, Kahalgaon and Pirpainty. The portion north of the Ganga is comprised of the seven Blocks i.e. Bihpur, Narayanpur, Kharik, Naugachhia, Rangra, Gopalpur and Ismailpur under Naugachhia Subdivision. Major coverage of Diara land was noticed in north portion of Bhagalpur district but concentration of Tal land was observed in south portion and both are the lands have significant role for agricultural potential. In this context, to fulfil the objective, Land sat TM (1990) and IRS-AWiFS (2015) the satellite data were used for the visual interpretation, image classification and mapping. In continuation of temporal change in vegetation, NDVI was used for the confirmation of vegetative growth over the period. Lillesand et al. (2005) reported that healthy vegetation appears green due to high reflectance of green band comparison to blue and red bands means red objects appear red in same layer stacked bands. Ground truth was done to validate the results by using GPS, toposheets and ancillary data during validation. All field verification work was done during the month of March and June, 2015. IRS, AWiFS data provides four spectral bands; green (0.52-0.59μm), red (0.62-0.68 μm), near infra red (0.77-0.86μm) and short wave infra red(1.55-1.70μm) having 56 m spatial resolution respectively and widely used for a variety of land targets like water, soil, rock, snow and vegetation (Singh et al,.2009). Licensed version geo-spatial related soft ware’s viz. TNT Mips, ENVI 5.1 and Arc GIS 10.1 are available in the Department were used for digital image processing and mapping.
It is I
LLEGAL t
o cop
y, pri
nt or
save
any c
onten
t of th
is PDF,
in pa
rt or in
full,
on an
y retr
ieval
syste
m,
withou
t the E
XPRESS WRITTEN PERMISSIO
N of th
e cop
yrigh
t-hold
er

National Conference on Climate Change and Agricultural Production: Adapting Crops to Climate Variability and Uncertainty, 6th–8th April, 2017
[151]
RESULTS AND DISCUSSION
The maximum change was noticed in Diara land comparison to Tal land where as sifting in course of Ganga played an important role towards spread in Diara land. In terms of geographical area under different blocks major change (increasing trends) was observed in Sultanganj, Nathnagar, and Kahalgaon blocks. Encroachment of river Ganga in Gopalpur, Rangara and Naugachhiya blocks was traced in 2015 comparison to 1990. However, analysed NDVI (Normalised Difference Vegetation Index) indicated the agricultural growth in different blocks of Diara land over the period. Research findings may be helpful for the assessment of Tal and Diara lands in respect to land use planning in Bihar.
REFERENCES [1] Singh R B, Mahtab A and Ajai 2009. Target reparability analysis for resourcesat-1AWiFS data. Journal of Geomatics 19: 19-22. [2] Lillesand M, Ralph Thomas, Kiefer W, Jonathan W and Chipman 2005. Remote Sensing and Image Interpretation, Fifth edition. Wiley,
New York.
Statistical Modelling for Forecasting of Pearl millet Productivity Based on Weather Variables
Satvinder Kour1, P.R. Vaishnav1, S.K. Behera2* and U.K. Pradhan3 1Department of Agricultural statistics, B.A. College of Agriculture,
Anand Agricultural University, Anand–388110, India 2Department of Statistics, Mathematics & Computer Application, Bihar Agricultural university, Sabour–813210, Bhagalpur, Indiar
3ICAR-Indian Agricultural Statistics Research Institute, New Delhi–110012, India E-mail: *[email protected]
Keywords: MLR model, Forecasting, Weather variables, Pearl millet yield.
INTRODUCTION
A timely and reliable forecast of yield of crop needs little emphasis for monsoon dependent country like India where, the economy is mainly based on agricultural production. Weather is a major factor affecting crop production in advanced agricultural systems. The large variation due to climate change in yield from year to year and place to place is dominated by the weather parameters. In view of fluctuating climate, a timely and reliable forecast of crop productivity could help in deciding the policies. The present study has been taken up to explore the possibility of suggesting suitable statistical model for pre-harvest forecasting of productivity of summer pearl millet for Kheda district of Gujarat, using weather parameters.
MATERIALS AND METHODS
The present study was undertaken to investigate the feasibility of estimating the productivity of pearl millet based on combined effects of weather parameters and technological advancement, using past weather records for Kheda district of middle Gujarat state using MLR models. considering the specific objectives of the study, pearl millet productivity data for summer season and historical weather data including bright sunshine hours, maximum temperature, Minimum temperature, weekly total rainfall, morning relative humidity, afternoon relative humidity of Kheda district of middle Gujarat for the years 1980 to 2013 were collected from Directorate of Agriculture, Gandhinagar, Gujarat and Department of Agricultural Meteorology, Anand Agricultural University, Anand, respectively. For selecting the best regression equation among number of
It is I
LLEGAL t
o cop
y, pri
nt or
save
any c
onten
t of th
is PDF,
in pa
rt or in
full,
on an
y retr
ieval
syste
m,
withou
t the E
XPRESS WRITTEN PERMISSIO
N of th
e cop
yrigh
t-hold
er

National Conference on Climate Change and Agricultural Production: Adapting Crops to Climate Variability and Uncertainty, 6th–8th April, 2017
[152]
explanatory variables, the stepwise regression procedure was adopted (Draper and Smith, 1981). SPSS statistical Software was used for the analysis of the data. Three sets of multiple linear regression equations were obtained separately for 27, 28 and 29 years data for each model.
RESULTS AND DISCUSSION
In this approach, generated weather variables using correlation coefficient as weight were utilized to fit the model. The fitted equations, coefficients of multiple determinations, the standard errors (S.E.), root mean square error (RMSE) and mean absolute error (MAE) for two different models corresponding to 11 and 12 weeks summer pearl millet crop periods. .Among the equations fitted under this approach, in model of 11 and 12 weeks using data of 27 years, for 11 weeks R2 was (54.5%) and 12 weeks (62.4%) model and deviations of simulated forecasts ranged from 0.9 to 10.9 percent and from 3.7 to 20.9 percent for 11 and 12 weeks models, respectively. In case of 11 and 12 weeks models using data for 28 years, R2 was 67.2 percent for 11 weeks with deviation ranging from 2.2 to 10.5 percent from observed data and for 12 weeks, R2 was 63.0 percent with deviations ranging from 2.2 to 21.9 percent . For data of 29 years, the R2 was 57.0 percent (11 weeks), having deviation from 2.75 to 10.19 percent and R2 was 65.0% for 12 weeks with deviation ranging from 0.36 to 11.37 percent from observed data. Looking to higher adjusted R2 (61.6%), lower S.E. (170.72), deviations (2.24 to 10.55), RMSE (158.28) and MAE (123.46) in prediction among all models, the model of 11 weeks using data of 28 years could be considered as pre harvest forecast model which can predict the productivity at 2 weeks before harvest with R2 value 67.20 percent.
REFERENCES [1] Draper NR and Smith H. 1981 Applied Regression Analysis. 2nd Edition, John Wiley & Sons, New York.
Sensitivity Analysis of InfoCrop Model for Indian-Mustard Cultivars in Western Region of Haryana
Yogesh Kumar*, Raj Singh, Anil Kumar, Sagar Kumar and M.K. Nayak Department of Agricultural Meteorology,
CCS Haryana Agricultural University, Hisar–125004, Haryana E-mail: *[email protected]
Keywords: Indian mustard, Sensitivity analysis, InfoCrop model
INTRODUCTION
Indian mustard is much sensitive to climatic variables and hence climate change could have significant effect on its production. Global production of the annual crops is expected to reduce significantly due to climate change by the end of 21st century. IPCC global studies indicate considerable probability of loss in crop production in India with increases in temperature (IPCC, 2014). InfoCrop model can successfully simulate growth and yield of mustard crop across different locations in India. Simulated yield of mustard was found to be sensitive to changes in atmospheric CO2 and temperature variation (Boomiraj et al., 2010).The scientific information on simulation of growth and yield of mustard crop using modeling in Haryana state is very limited. Hence, keeping in view the importance of the study, the present investigation was carried out to validate and carry out sensitivity analysis of InfoCrop model for Indian-mustard crop.
It is I
LLEGAL t
o cop
y, pri
nt or
save
any c
onten
t of th
is PDF,
in pa
rt or in
full,
on an
y retr
ieval
syste
m,
withou
t the E
XPRESS WRITTEN PERMISSIO
N of th
e cop
yrigh
t-hold
er

National Conference on Climate Change and Agricultural Production: Adapting Crops to Climate Variability and Uncertainty, 6th–8th April, 2017
[153]
MATERIALS AND METHODS
The model was validated with the data sets generated respectively during rabi 2014-15, through field experiment laid out in split plot design with three sowing dates (D1-25th Oct., D2-5th Nov. and D3-15th Nov.), and three cultivars cv. Kranti, RH 406, and RH 0749. There were four replications and experiment was conducted at Research farm of Agril. Meteorology, CCSHAU, Hisar. Sensitivity analysis was carried out for daily Tmax. and Tmin. (1 to 5 ºC), rainfall with increasing and decreasing trend of rainfall ±10 percent from season rainfall and different levels of CO2 concentration (415- 640 ppm) from crop season rabi 2014-15 using InfoCrop model.
RESULTS AND DISCUSSION
Simulated effect of varying levels of daily maximum temperature on yield of mustard varieties have been presented in Table 1. The InfoCrop model was simulated for its sensitivity to maximum temperature in scenarios of climate change. The results indicated that yield increased with increasing daily maximum temperature (3 ºC above during crop season 2014-15) .Similar condition found in decreasing maximum temperature (-1 to -3 ºC below crop season 2014-15) but percent decreased in yield reduction was maximum in ( ± 4 to 5 ºC above & below during season 2014-15). The effect of percent change in yield was higher in RH 0749 followed by RH 406 and Kranti. The simulated results indicated that decrease in maximum temperature was more beneficial as comparison to increase because of increasing temperature lowered days to flowering and days to maturity, which in turn lowered total crop duration. The sensitivity analysis revealed that change of ± 2 ºC in daily maximum and minimum temperature from 2014-15 crop season value produced higher yield in mustard crop. The CO2 concentration elevation from 390 to 490 ppm increased the yield of mustard crop but increase of CO2 further resulted in sharp decrease in yield. Similarly, a change in rainfall of 10 to 20 percent (±) from 2014-15 crop season rainfall produced increased the yield of mustard crop but increase or decrease beyond that led to decrease in the yield.
Table 1: Simulated Effect of Varying Levels of Daily Deviation of Maximum Temperature on Yield of Mustard Cultivars
Tmax. Change over the Base Value % Change Variety Kranti RH 406 RH 0749 Kranti RH 406 RH 0749
Base Yield (kg/ha)* 1318.57* 1479.21* 1697.93* 1318.57* 1479.21* 1697.93* 5 1041.67 1212.95 1426.26 -21 -18 -16 4 1120.78 1272.12 1460.22 -15 -14 -14 3 1397.68 1612.34 1884.70 6 9 11 2 1503.17 1686.31 1969.60 14 14 16 1 1582.28 1878.61 2173.35 20 27 28 -1 1661.41 1908.18 2190.33 26 29 29 -2 1542.73 1715.88 2020.54 17 16 19 -3 1199.91 1346.11 1562.09 -9 -9 -8 -4 1041.76 1183.37 1409.28 -21 -20 -17 -5 988.93 1153.78 1341.36 -25 -22 -21
*Base yield (kg/ha): Values with * as superscript are base yields
REFERENCES [1] IPCC 2014. The Synthesis Report of the Intergovernmental Panel on Climate Change WG II: Impacts, vulnerability and adaptation. [2] Boomiraj K, Chakrabarti B, Aggarwal P K, Choudhary R and Chander S 2010. Assessing the vulnerability of Indian mustard to climate
change. Agricultural Ecosystems and Environment 138: 265-273.
It is I
LLEGAL t
o cop
y, pri
nt or
save
any c
onten
t of th
is PDF,
in pa
rt or in
full,
on an
y retr
ieval
syste
m,
withou
t the E
XPRESS WRITTEN PERMISSIO
N of th
e cop
yrigh
t-hold
er

National Conference on Climate Change and Agricultural Production: Adapting Crops to Climate Variability and Uncertainty, 6th–8th April, 2017
[154]
Drought Investigation in Srinagar Region of Kashmir using Standard Precipitation Index
Sabah Parvaze1, Latief Ahmad1*, R.H. Kanth1, Saqib Parvaze2 and S. Sheraz Mahdi3 1Division of Agronomy, 2Division of Agricultural Engineering,
Sher-e-Kashmir University of Agricultural Sciences and Technology of Kashmir, Shalimar–190025, India 3Department of Agronomy, Bihar Agricultural University, Sabour–813210, Bhagalpur, India
E-mail: *[email protected]
Keywords: Standardized precipitation index, Temperate, Drought monitoring
INTRODUCTION
Drought is a naturally occurring event caused due to deficiency in precipitation over an extended period of time. It is a slow-onset, creeping natural hazard that affects continuously all parts of the world. In India, the most drought prone areas are the arid and semi-arid areas (Appa Rao, 1991). Droughts in Kashmir Valley of the state of Jammu and Kashmir are not a common occurrence. The parts of the state which are drought prone lie mostly in the Jammu region including Doda, Kathua Udhampur and Jammu Districts. However, during the severe drought of 1971-1918, the River Jhelum of Kashmir is reported to have dried up completely (Nagarajan, 2003). The present study has been undertaken to study the variability of temporal drought conditions in the Shalimar area of Kashmir valley of Jammu and Kashmir state over a period of 31 years.
MATERIALS AND METHODS
The study area used for the present study was Kashmir Valley in India which has a moderate climate, which is largely defined by its geographic location, with the towering Karakoram Range in the north, Pir Panjal Range in the south and west and Zanskar Range in the east. The most widely accepted index is Standardized Precipitation Index (SPI) which is based on probability concept was used in this study. Daily precipitation data for the period of 30 years (1985 – 2015) was obtained from AMFU Shalimar station (Division of Agronomy, SKUAST-K). The daily precipitation data was tabulated into monthly precipitation data which was used as input for the calculation of SPI. SPI based on long-term precipitation is calculated as:
푆푃퐼 =푥 − 푥̅휎
Where,
푥 = Monthly rainfall record for the station 푥̅ = Rainfall Mean 휎 = Standard Deviation
RESULTS AND DISCUSSION
SPI was computed time scales of 1, 3, 6, 9 and 12-months. It was observed that on smaller scales such as SPI-1 and SPI-3 series, the drought intensities are highly variable and become less than −1.0 and greater than 1.0 on several occasions. However, on longer times cales, SPI-6, SPI-9 and SPI-12 drought intensity decreases. This variation is due to a seasonal component found in the rainfall data since SPI is relative to the rainfall characteristics of that area. The lowest SPI values on different time scales along with the year of occurrence are given in Table 1. For both Kharif and Rabi cropping season, the most critical year in terms of drought was 1999.
It is I
LLEGAL t
o cop
y, pri
nt or
save
any c
onten
t of th
is PDF,
in pa
rt or in
full,
on an
y retr
ieval
syste
m,
withou
t the E
XPRESS WRITTEN PERMISSIO
N of th
e cop
yrigh
t-hold
er

National Conference on Climate Change and Agricultural Production: Adapting Crops to Climate Variability and Uncertainty, 6th–8th April, 2017
[155]
Table 1: Lowest SPI Values for Shalimar Weather Station Different Time Scales Time Scale Lowest SPI Value Year of Occurrences
1-Month -3.45 2007 3-Month -2.84 1989 6-Month -2.43 1995 9-Month -2.22 1999 12-Month -2.35 2001
REFERENCES [1] Appa Rao G 1991. Drought and southwest monsoon. In “ Monsoon Meteorology”, 3rd WMO Asian/African Monsoon Workshop, Pune,
India. [2] Nagarajan R 2003. Drought: Assessment, Monitoring, Management and Resource Conservation, Capital Publishing Company, New Delhi.
Weather based Forewarning of Predators in Tasar Silkworm (Antheraea mylitta D) at Kathikund, Dumka (Jharkhand-India)
J. Singh*, A. Kumar, S. Mukherjee, G.P Singh, S. Ray, T. Pandiaraj and A.K Sinha Central Tasar Research and Training Institute, Ranchi–835303, India
E-mail: *[email protected]
Keywords: Brushing date, Congenial weather, Pest outbreak
INTRODUCTION
Tropical tasar silkworm, Antheraea mylitta D (Lepidoptera: Saturniidae) is a commercially important and valuable component of Asian non-mulberry silk industry. Forest dependent people rear its larvae on different forestry host plants for small household income. It is a backbone for tribal development because about 1.25 lakh tribal families are associated with tasar culture in the country (Reddy et al., 2015). Tasar culture is forest based outdoor rearing; therefore, silkworms are highly influenced by predators and environmental conditions. However, if we mitigate or adapt the harmful effect of both factors it can be enhanced the quality and quantity of tasar silk. Hence, the main objective of the study was undertaken to assess the congenial weather for outbreak of predators in tasar culture.
MATERIALS AND METHODS
An experiment was carried out during the year of 2016 in the first crop rearing of Tasar silkworm at Pilot Project Centre (PPC), Kathikund with replicated thrice in completely randomized block design. The treatments consists with three brushing date of tasar larva in July (i.e., 16th, 21st and 26th at an interval of 5 days) and four directions (i.e., North, South, East and West). Daily weather and predator’s data have been collected from rearing field and expressed in weekly basis. Interactive relationship was made between weather and predators in tasar silkworm by using weekly data.
RESULTS AND DISCUSSION
On the basis of interactive approach between weekly weather and predators’ data, the weather condition was favourable for high infestation of predators during 31st standard meteorological week (SMW). During this period, weekly mean maximum temperature, minimum temperature, morning relative humidity, evening relative humidity and rainfall were 32.67oC, 24.67oC, 87.17%, 58.50%, < 83 mm, respectively. In this week, highest predator infestation per disease free laying egg (Dfl) was observed viz., reduvid bug (12), canthecona bug (8) and wasp (8). After and before 31st SMW, the predator’s infestation was very low or absence in all date of brushing
It is I
LLEGAL t
o cop
y, pri
nt or
save
any c
onten
t of th
is PDF,
in pa
rt or in
full,
on an
y retr
ieval
syste
m,
withou
t the E
XPRESS WRITTEN PERMISSIO
N of th
e cop
yrigh
t-hold
er

National Conference on Climate Change and Agricultural Production: Adapting Crops to Climate Variability and Uncertainty, 6th–8th April, 2017
[156]
and direction, which indicates after and before 31st SMW week, weather condition was unfavourable for predators. On the basis of above results, can forewarn to tasar sericulture farmers for adapting best integrated management practices before 31st SMW or during 1st crop rearing . Such tasar advisory (forewarning) for predators would help growers to be in preparedness at times of anticipated economic damage by predators and to optimize the time of insecticidal application for increased production and profit.
REFERENCE [1] Reddy M P M, Gupta V P and Lokesh G 2015. Impact of trainers training programmes of integrated skill development scheme (ISDS) in
tasar technologies. Global Journal of Bio-Science and Biotechnology 4 (1): 17-20.
Modeling Rice-Wheat Yield Estimation over a Sub-Humid Climatic Environment of Bihar, India
S. Sheraz Mahdi1*, Mizanul Haque1, R.K. Sohane2, Sunil Kumar1, Swaraj Kumar Dutta1, S.K. Gupta1 and Suborna Roy Choudhury1
1Department of Agronomy, 2Directorate of Extension Education 1,2Bihar Agricultural University, Sabour–813210, Bhagalpur, India
E-mail: *[email protected]
Keywords: Long term weather data, Stepwise regression technique, Model validation, Yield estimation
INTRODUCTION
Crop yield forecasts are widely recognized an important input for climate-related risk management (CRM) through an efficient delivery system that can alert policy makers and food officials to assure food security long before the actual natural hazard sets in and can be useful elements of the decision-making process in CRM (Challinor, 2009). It is said that ‘farming’ in India is largely gamble in weather conditions. Weather variables affect the crop differently during different stages of development and the extent of weather influence on crop yield depends not only on the magnitude of weather variables, but also on the distribution pattern of weather over the crop season. Once the detailed knowledge has been acquired of how, and at what growth stages, climatic factors influence the yield, it is possible to derive complex variates that give appropriate weight to the different factors for correlation with yield in naturally varying climates, and use them to predict yield from meteorological records. Forecasting of crop yields based on relatively simple weather variables using regression type model make it simple to use in large scale yield predictions andis becoming essentialin mitigating food price instability and climate risks. In this study, an attempt was made to develop the forecast models to predict the yield of rice and wheat in six districts falling in agro-climatic zone IIIA and B of Bihar.
MATERIALS AND METHODS
Rice and wheat crop yield data at farmers level for the period of recent 27 years (1987-2014) of agro-climatic zone-IIIA and B of Bihar were used to develop yield forecasting models. The daily weather data were arranged in a standard meteorological week (SMW) and was used starting from 22nd to 41th SMW of each year, i.e. the period from transplanting to harvest of rice and from 44th SMW of current year to 11th SMW of next year from the date of sowing to harvesting ofwheat. Licensed Statistical Package for Social Science (SPSS v 22.0) computer software was used for the analysis of data with a probability level of 0.05 to enter and 0.1 to remove the variables. A regression model was fitted considering the entered variables obtained from individual stepwise regression analysis to predict the yield of rice and wheat for the subsequent years. The multiple linear stepwise regression analysis has been developed on the basis of examination of coefficients of determination (R2), standard error (SE) of estimate values resulted from different weather variables. Two statistical tests, percent Mean Bias Error (MBE) and percent Root Mean Square Error (RMSE)
It is I
LLEGAL t
o cop
y, pri
nt or
save
any c
onten
t of th
is PDF,
in pa
rt or in
full,
on an
y retr
ieval
syste
m,
withou
t the E
XPRESS WRITTEN PERMISSIO
N of th
e cop
yrigh
t-hold
er

National Conference on Climate Change and Agricultural Production: Adapting Crops to Climate Variability and Uncertainty, 6th–8th April, 2017
[157]
are used to the degree of accuracy of each considered correlation to fit the measured data. Yield forecast models for all six districts falling in agro-climatic zone-IIIA and B of Bihar have been developed and their performances have been validated against observed yields in 2012-13 and 2013-2014.
RESULTS AND DISCUSSION
The forecast models developed for rice and wheat were validated for independent data set. Models for each district were selected based upon higher R2 and lower model error values. The R2 varied from 0.63 to 0.97 with error less than 10 percent for accepted model. The comparison between observed and forecasted cropyield over different districts exhibited a close agreement. Thus, the models developed could be used for forecasting the yield of rice and wheat for six districts of agro-climatic zone IIIA and B of south Bihar. The result also showed that climatic parameters and technological factors influenced the yield of rice and wheat differently in different districts. Among the climatic parameters, maximum and minimum temperatures in combination with rainfall have formed most important agro-meteorological indices affecting the crop yields.
REFERENCE [1] Challinor A 2009. Towards the development of adaptation options using climate and crop yield forecasting at seasonal to multi-decadal
timescales. Environmental Science &Policy 12: 453–465.
Sensitivity Analysis of DSSAT CROPGRO-Cotton Model for Cotton under Different Growing Environments
Sagar Kumar*, Ram Niwas, M.L. Khichar, Yogesh Kumar, Amit Singh Premdeep and Abhilash Department of Agricultural Meteorology,
CCS Haryana Agricultural University, Hisar–125004, India E-mail: *[email protected]
Keywords: Cotton, Growing environment, DSSAT, Sensitivity analysis
INTRODUCTION
The Decision Support System for Agrotechnology Transfer (DSSAT) is the major product of the IBSNAT (International Benchmark Site Network for Agrotechnology Transfer) project, initiated in 1982 (Uehara and Tsuji, 1998). Although this project ended in 1993, its developers have expanded since then and continue to update and maintain this software under the auspices of ICASA. The central components of the DSSAT software are crop simulation models and programs to facilitate their application in different regions of the world. It is the quantitative tool based on scientific knowledge that can evaluate the effect of climatic, edaphic, hydrological and agronomic factors on crop growth and yield. The decision support system for agro-technology transfer (DSSAT) has been in use for the last 15 years by researchers worldwide (Hoogenboom et al., 2012; Jones et al., 2003). This package incorporates models of 28 different crops with software that facilitates the evaluation and application of the crop models for different purposes to develop to assess yield, resource use and risk associated with different crop production practices (Tsuji et al., 1994)
MATERIALS AND METHODS
Daily maximum temperature was recorded at 2:27 PM placed in Single Stevenson screen. The daily minimum temperature was recorded at 7:27 AM. Daily rainfall amount was recorded by rain gauge both automatic and standard rain gauge about 50meter away from the experiment site.The minimum data required for running CROPGRO-Cotton are soil data, experiment data, weather data and management data.
It is I
LLEGAL t
o cop
y, pri
nt or
save
any c
onten
t of th
is PDF,
in pa
rt or in
full,
on an
y retr
ieval
syste
m,
withou
t the E
XPRESS WRITTEN PERMISSIO
N of th
e cop
yrigh
t-hold
er

National Conference on Climate Change and Agricultural Production: Adapting Crops to Climate Variability and Uncertainty, 6th–8th April, 2017
[158]
RESULTS AND DISCUSSION
The results indicated that increasing daily maximum temperature (1 to 5ºC above during crop season 2015-16) led to decrease in the yield and similar condition found in decreasing maximum temperature ( 5ºC below crop season 2015-16) but percent increase in yield in decreasing daily maximum temperature 1 to 4ºC below during season 2015-16. The effect of percent increase in yield was higher in SP 7121 followed by Pancham 541 and RCH 791. The results revealed that increase in daily minimum temperature by 1 to 3 ºC and decreased by 1 to -3 ºC for crop season of 2015-16 then yield was increased but after 4 to 5 ºC above and below from crop season 2015-16 then yield was decreased. The highest benefits were obtained by increasing minimum temperature 1ºC to the tune of above and below during crop season, the effect of percent change in yield was maximum in RCH 791 (22.8 and 26 % from the base yield) followed by SP 7121 (16.3 and 24 % from the base yield) and Pancham 541 (13.3 and 18 % from the base yield).Increasing rainfall amount from the crop season 2015-16, led to the increase in the yield but start decreasing from 50% above the crop season as compared to 40%. Model and was found to predict higher yield reduction in case of RCH 791 variety followed by Pancham 541 and SP 7121. The percent increase in yield form base yield was maximum in SP 7121 (20.8%) followed by Pancham 541 (15.4 % ) and RCH 791 (13.1 %).
REFERENCES [1] Hoogenboom G, Jones J W, Wilkens P W, Porter C H, Boote K J, Hunt L A, Singh U, Lizaso J L , White J W, Uryasev O, Royce F S,
Ogoshi R, Gijsman A J, Tsuji G Y and Koo J 2012. Decision Support System for Agrotechnology Transfer (DSSAT) Version 4.5. University of Hawaii, Honolulu, Hawaii.
[2] Jones J W, Hoogenboom G, Porter C H, Boote K J, Batchelor W D, Hunt L A, Wilkens P W, Singh U, Gijsman A J and Ritchie J T 2003. DSSAT Cropping System Model. European Journal of Agronomy 18: 235‐265.
[3] Uehara G and Tsuji G Y 1998. Overview of IBSNAT. In: Tsuji, G.Y., Hoogenboom, G., Thornton, P.K. (Eds.), Understanding Options for Agricultural Production. Kluwer Academic Publishers, Dordrecht, The Netherlands, pp 1–7.
Assessment of Soil Fertility of Tal and Diara Land using Remote Sensing and GIS Techniques: A Case Study of Bhagalpur
District, Bihar, India
Sumitap Ranjan*, Binod Kr. Vimal, C.D. Choudhary and Rajkishore Kumar Department of Soil Science & Agricultural Chemistry,
Bihar Agricultural College, Sabour–813210, Bhagalpur, India E-mail: *[email protected]
Keywords: Soil fertility, Tal and Diara land, Remote sensing
INTRODUCTION
Based on surface and sub-surface soil samples, soil fertility is assessed towards site suitability for different crops. In continuation of available natural resources, the soils of ‘Tal’ which are highly clayey throughout their depths, grey to dark grey in colour, neutral to slightly alkaline in reaction and low to medium availability of NPK were marked in adjoining of river Ganges with specific geomorphic characteristics. However, in same river basin, the other geomorphic feature which is locally known as the Diara land, found in between the natural levees of the river and formed due to periodical erosion and deposition of sediments (alluvium) under the influence of meandering and course changing behaviour of the rivers. In terms of soil properties, the Diara land consists light textured having light grey colour, neutral range of soil pH and low to medium range
It is I
LLEGAL t
o cop
y, pri
nt or
save
any c
onten
t of th
is PDF,
in pa
rt or in
full,
on an
y retr
ieval
syste
m,
withou
t the E
XPRESS WRITTEN PERMISSIO
N of th
e cop
yrigh
t-hold
er

National Conference on Climate Change and Agricultural Production: Adapting Crops to Climate Variability and Uncertainty, 6th–8th April, 2017
[159]
of avail. NPK. To characterize and classify the Tal and Diara land of Bhagalpur district and to study the soil physico-chemical status of Tal and Diara land of Bhagalpur district.
MATERIALS AND METHODS
Geo-coded False Color Composite (FCC) image of IRS LISS III, 2013 was used to delineation of the Diara and Tal land with adequate ground truth on 1:50000 scale. The land form is characterized by polygons features in shape file of old and new diara land based on tone, texture, pattern and morphological expression of the relief features.GPS receiver and topo sheets were used for ground truth and validation of data. licenced version spatial related softwares viz.TNT Mips and Arc-GIS were used for image processing and mapping in computer system. All physical and chemical parameters like bulk density, soil texture, and chemical parameters like EC, pH, organic carbon (OC), Available N, P2O5, K2O and DTPA- Fe, Mn, Zn, and Cu, CEC and ESP were estimated by standard procedure.
RESULTS AND DISCUSSIONS
The result revealed with texture from clay to silty clay, soil bulk density was high; The pH, EC, OC, available N, P2O5, K2O, and DTPA-Fe, Mn, Zn, and Cu showing status of available N was Low and available P2O5, K2O were low to medium. pH was neutral to slightly alkaline in nature, ESP was non-sodic,organic carbon status was medium in nature, EC was non-saline and all DTPA micronutrients was sufficient in nature except DTPA- Zn was low to medium in nature. Heavy and light textured soils, surface soil and high bulk density in certain areas of Tal and Diara are some of the major soil physical constraints relating crop production and for which suggested technological interventions for higher crop production and income are appropriate soil conservation measures. Results corroborated with the works done elsewhere by Pati and Mukhopadhyay (2011) for soils from tarai situations of West Bengal for N and Behera and Shukla (2013) in soils of different areas on DTPA-extractable micronutrients.
REFERENCES [1] Behera S.K. and Shukla A.K. 2013. Depth-wise Distribution of Zinc, Copper, Manganese and iron in Acid Soils of India and Their
Relationship with Some Soil Properties. Journal of Indian Society of Soil Science. 61 (3): 244-252. [2] Pati R and Mukhopadhyay D 2011. Distribution of Cationic Micronutrients in Some Acid Soils of West Bengal. Journal of Indian Society
of Soil Science 59 (2): 125-1 33.
Estimation of Evapotranspiration using Variable Infiltration Capacity Model and Artificial Neural Network
Sirisha Adamala1 and Ankur Srivastava2 1Department of Applied Engineering,
Vignan’s Foundation for Science, Technology and Research (VFSTR) University, Vadlamudi, India 2Agricultural and Food Engineering Department, IIT Kharagpur, Kharagpur, India
E-mail: *[email protected] Keywords: Evapotranspiration, Artificial Neural Network, Model, Climate, Physical Model
INTRODUCTION
Evapotranspiration (ET) is one of the significant components in the global hydrologic cycle. Accurate estimation of ET is important for solving various crops, land, and water related problems. Reference evapotranspiration (ETo) which mainly depends on climate data is the basis for computing crop irrigation water requirements. There exist a direct measurement methods (lysimeters) and indirect estimation
It is I
LLEGAL t
o cop
y, pri
nt or
save
any c
onten
t of th
is PDF,
in pa
rt or in
full,
on an
y retr
ieval
syste
m,
withou
t the E
XPRESS WRITTEN PERMISSIO
N of th
e cop
yrigh
t-hold
er

National Conference on Climate Change and Agricultural Production: Adapting Crops to Climate Variability and Uncertainty, 6th–8th April, 2017
[160]
procedures (physical and empirical based) for modeling ETo. Many direct (lysimeters) and indirect (empirical or semi-empirical) methods have been developed for estimating ETo as a function of climate data. The globally accepted physically based FAO-56 Penman Monteith (PM) method indeed gives highly accurate estimates for ETo, but it requires detailed climate data of air temperature, solar radiation, wind speed, and relative humidity. Therefore, although highly accurate, the FAO-56 PM model cannot be used for locations where sufficient or reliable climatic data are not available, and in those cases the empirical or semi-empirical methods can be used, which require limited climate variables. However, empirical/ semi-empirical methods often valid only for the local conditions under which they were derived, or when they applied to areas with climatic conditions similar to those for which they were developed (Kumar et al., 2002). Therefore, care should be taken not to use them outside the prescribed conditions. These limitations inspired the researchers for developing alternative models such as artificial neural networks (ANNs) which are simple, independent on specific climatic condition, ignoring the physical meanings and modelling nonlinear ETo accurately based on weights sensitization (Adamala et al., 2014). But, at the same time ANNs are producing the results without considering their physical meaning. Therefore, to estimate ETo, we need to consider physically based model, i.e. Variable Infiltration Capacity (VIC). The VIC model (Billah et al., 2015, Liang et al., 1994) is a large-scale hydrology model that has been used to simulate land surface water and energy fluxes from the scale of large watersheds to global simulations. The advantages of this model over other hydrological model is that it incorporates the representation of sub-grid variability in soil infiltration capacity, vegetation classes and calculates the vertical energy with moisture flux in grid cell based on specification at each grid cell.
MATERIALS AND METHODS
In this study, the ETo was estimated by two different methods, namely, Variable Infiltration Capacity (VIC) and ANN for Mohanpur location in India using meteorological data. Four major input files are required to prepare the VIC model input database. These are vegetation parameter file, vegetation library file, soil parameter file and forcing files. Thereafter, it simulates the stream flow by the coupling of route part which includes flow direction, fraction, and station file of the study area. ANNs are empirical models, which solely depend on data sets pertaining to the process and their ability to acquire knowledge through learning makes them quite suitable for exploring correlations from very noisy and imprecise information such as climate data. ANNs estimate ETo from climatic data accurately without requiring the explicit mechanisms underlying the process.
RESULTS AND DISCUSSION
The ETo was estimated using two models such as VIC and ANN. Both the models results were compared using three performance indices such as correlation coefficient, coefficient of determination and index of agreement. The results reveal that the VIC simulated ETo showed the correlation coefficient, r = 0.853, coefficient of determination, R2 = 0.727 and index of agreement, d = 0.924 with the FAO-56 PM method; while ANN models showed better agreement with r = 0.999, R2 = 0.998 and d = 0.999 with the FAO-56 PM method. Hence, it is concluded that the ANN showed better results as compared to VIC model for ETo estimation in Mohanpur climatic location.
REFERENCES [1] Adamala S, Raghuwanshi NS, Mishra A and Tiwari M.K. 2014. Evapotranspiration modeling using second-order neural networks. Journal
of Hydrological Engineering 19 (6): 1131-1140. [2] Billah M.M., Goodall J.L., Narayan U, Reager J.T., Lakshmi V and Famiglietti JS 2015. A methodology for evaluating evapotranspiration
estimates at the watershed-scale using GRACE. Journal of Hydrological Engineering 523: 574-586. [3] Kumar M, Raghuwanshi NS, Singh R, Wallender WW and Pruitt WO 2002. Estimating evapotranspiration using artificial neural network.
Journal of Irrigation Drainage and Engineering 128 (4): 224-233. [4] Liang X, Lettenmaier DP, Wood EF and Burges SJ 1994. A simple hydrologically based model of land surface water and energy fluxes for
general circulation models. Journal of Geophysics Research 99: 412-415.
It is I
LLEGAL t
o cop
y, pri
nt or
save
any c
onten
t of th
is PDF,
in pa
rt or in
full,
on an
y retr
ieval
syste
m,
withou
t the E
XPRESS WRITTEN PERMISSIO
N of th
e cop
yrigh
t-hold
er

National Conference on Climate Change and Agricultural Production: Adapting Crops to Climate Variability and Uncertainty, 6th–8th April, 2017
[161]
Estimation of Monsoon Season Rainfall and its Sensitivity Analysis Using Artificial Neural Networks
Bhaskar Pratap Singh1*, Pravendra Kumar2, Tripti Srivastava3 and Vijay Kumar Singh2
1Department of Farm Engineering, Institute of Agricultural Sciences, Banaras Hindu University, Varanasi–221005, India
2Department of Soil and Water Conservation Engineering, Gobind Ballabh Pant University of Agriculture & Technology, Pantnagar–263145, India
3Narendra Deva University of Agriculture and Technology, Kumarganj, Faizabad–224229, India E-mail: *[email protected]
Keywords: Artificial neural networks, Sensitivity analysis, Pooled average relative error
INTRODUCTION
The continuous fluctuations in overall climate and the irregular spatial and temporal distribution of rainfall are causes for severe problems like floods and droughts. Typical extent of rain is not easily known until it takes place. Timely forecasting of rainfall provide useful information to water management personnel for making prime decisions related to flood control structures, drought management and reservoirs operation. In the present study the artificial neural network with hyperbolic tangent axon function has been virtually applied to foresee the rainfall on daily basis for Pusa in Samastipur district of Bihar, India.
MATERIALS AND METHODS
The daily observed data of mean temperature (T), relative humidity (RH), vapour pressure (VP) and rainfall (P) during the years 1981 to 2013 (with four years missing data) were used for development of models. For model development current day rainfall is used as function of current day as well as previous day’s (T), (RH), (VP) and (P). Three different patterns of ANN models have been employed for this study to find the effect of different input variables on the current day rainfall. The first pattern contains nine inputs, second one has six inputs and last pattern had three input variables in both single and double hidden layers networks. All the three cases are treated with feed forward back-propagation algorithm. The functional form of the model can be represented as:
Pi,j = f (Ti,j , Ti,j-1, Ti,j-2, RHi,j, RHi,j-1, RHi,j-2, VPi,j, VPi,j-1, VPi,j-2,)
The performance of models were assessed by employing various statistical and hydrological indices viz. mean square error (MSE), coefficient of correlation (CC), Akaike's information criterion (AIC), coefficient of efficiency (CE) and pooled average relative error (PARE). The sensitivity analysis was carried out by removing the each of the parameters in turn from the input parameters used on ANN model networks and then comparing the performance statistics. The greater the effect observed in the output, the greater is the sensitivity of that particular input parameter. The sensitivity examination of the various parameters on the output rainfall for current day has been done by utilizing the performance indices viz. MSE, CC, AIC and CE.
RESULTS AND DISCUSSION
Among the different networks run by using the networks having minimum value of MSE, the maximum value of CC and the minimum value of AIC were chosen as the best models. The results of the different performance indices for the best selected single and double hidden layers networks during testing period (2009-2013) are shown in Table 1. Based on overall performance, the network (3-33-1) has been preferred for the sensitivity analysis.
It is I
LLEGAL t
o cop
y, pri
nt or
save
any c
onten
t of th
is PDF,
in pa
rt or in
full,
on an
y retr
ieval
syste
m,
withou
t the E
XPRESS WRITTEN PERMISSIO
N of th
e cop
yrigh
t-hold
er

National Conference on Climate Change and Agricultural Production: Adapting Crops to Climate Variability and Uncertainty, 6th–8th April, 2017
[162]
Table 1: Performance Evaluation of Developed ANN Models during Testing Period for the Best Selected Networks
Performance Indices Tan Hyperbolic Axon based ANN Models Single Hidden Layer Double Hidden Layers
9-32-1 6-20-1 3-33-1 9-14-15-1 6-4-7-1 3-16-20-1 MSE 0.0040 0.0044 0.0046 0.0060 0.0066 0.0067 CC 0.8177 0.8394 0.9384 0.8365 0.8022 0.9421 AIC -3225.23 -2981.54 -2946.62 -2921.40 -2775.01 -2863.50 CE (%) 76.05 88.26 86.12 67.43 75.79 85.42 PARE -0.0234 -0.0381 -0.0266 -0.0309 -0.0238 -0.0324
REFERENCES [1] French M N, Krajeswski W F and Cuykendall R R 1992. Rainfall forecasting in space and time using neural network. Journal of Hydrology
137: 1-31. [2] Nastos P T, Moustris K P, Larissi I K and Paliatsos A G 2013. Rain intensity forecast using Artificial Neural Networks in Athens, Greece.
Atmospheric Research 199: 153-160.
Agricultural Risk Management through Weather Based Insurance
Sankhyashree Roy* and S.K. Acharya Department of Agricultural Extension,
Bidhan Chandra Krishi Viswavidyalaya, Mohanpur, Nadia–741252, India E-mail: *[email protected]
Keywords: Weather, Insurance, Risk Management.
Agriculture production and farm incomes in India are frequently affected by natural disasters such as droughts, floods, cyclones, storms, landslides and earthquakes. Susceptibility of agriculture to these disasters is compounded by the outbreak of epidemics and man-made disasters such as fire, sale of spurious seeds, fertilizers and pesticides, price crashes etc. Agricultural insurance is considered as an important mechanism to effectively address the risk to output and income resulting from various natural and manmade events. Agricultural insurance is a means of protecting the agriculturist against financial losses due to uncertainties that may arise agricultural losses arising from named or all unforeseen perils beyond their control (AIC, 2008).
RISK AND RISK MANAGEMENT
Risk considers not only the potential level of harm arising from an event or condition, but also the likelihood that such harm will occur. Risk conditions are climate-related and include hazards such as droughts and heat waves. The inability to accept and manage risk respectively reflected in the inability to accumulate and retain wealth is sometimes referred to as the "the poverty trap" (World Bank2001).
AGRICULTURE INSURANCE COMPANY OF INDIA LTD. (AIC)
Recognizing the necessity for a focused development of crop insurance program in the country and an exclusive organization to carry it forward, Government created an exclusive organization-Agriculture Insurance Company of India Limited (AIC) on 20th December 2002 (www.aicofindia.org). AIC introduced rainfall insurance known as ‘Varsha Bima’ during the 2004 South-West Monsoon period.
It is I
LLEGAL t
o cop
y, pri
nt or
save
any c
onten
t of th
is PDF,
in pa
rt or in
full,
on an
y retr
ieval
syste
m,
withou
t the E
XPRESS WRITTEN PERMISSIO
N of th
e cop
yrigh
t-hold
er

National Conference on Climate Change and Agricultural Production: Adapting Crops to Climate Variability and Uncertainty, 6th–8th April, 2017
[163]
CROP INSURANCE
Crop insurance is purchased by agricultural producers, including farmers, ranchers, and others to protect themselves against either the loss of their crops due to natural disasters, such as hail, drought, and floods, or the loss of revenue due to declines in the prices of agricultural commodities. The two general categories of crop insurance are called crop-yield insurance and crop-revenue insurance. The idea of crop insurance emerged in India during the early part of the twentieth century. Yet it was not operated in a big way till recent years. J.S. Chakravarti proposed a rain insurance scheme for the Mysore State and for India as a whole with view to insuring farmers against drought during 1920s. Crop insurance received more attention after India’s independence in 1947.
WEATHER INSURANCE
As the name suggest, weather insurance is an insurance coverage against the vagaries of weather. Around 65% of Indian agriculture is heavily dependent on rainfall. Many agricultural inputs such as soil, seeds, fertilizer, management practices etc. contribute to productivity. However, weather, particularly rainfall has overriding importance over all other inputs.
WEATHER-INDEX
Index-based weather risk insurance contracts in agriculture have emerged as an alternative to traditional crop insurance. These are linked to the underlying weather risk defined as an index based on historical data (for example, for rainfall, temperature, snow, etc.) rather than the extent of loss (for example, crop yield loss).
WEATHER INSURANCE PILOTS IN INDIA
ICICI-Lombard was the first general insurance company in India to introduce rainfall insurance pilot based on a ‘composite rainfall index’ in 2003. It implemented a pilot project in Mahabubnagar district of Andhra Pradesh for groundnut and castor.
Despite various schemes launched from time to time in the country agriculture insurance has served very limited purpose. The coverage in terms of area, number of farmers and value of agricultural output is very small, payment of indemnity based on area approach affected farmers outside the compensated area, and most of the schemes are not viable. Insurance could be brought down to a village panchayat level. Insurance products for the rural areas should be simple in design and presentation so that they are easily understood.
REFERENCES [1] Agriculture Insurance Company of India Ltd. 200): www.aicofindia.org accessed 2006 to 2008. [2] World Bank. 2001. World Development Report 2000/2001: Attacking Poverty. Washington www. aicofindia. org
Multi-Temporal Analysis of Sentinal-1 SAR Data for Urban Flood Inundation Mapping-Case study of Chennai Metropolitan City
Sreechanth S. and Kiran Yarrakula* Vellore Institute of Technology-VIT University, Vellor–632014, India
E-mail: *[email protected]
Keywords: Synthetic Aperture Radar (SAR), Multi-Temporal analysis, Risk mapping, Flood, Grey Level Co-Occurrence Matrix (GLCM), Support Vector Machine (SVM), Sentinels Application Platform (SNAP).
It is I
LLEGAL t
o cop
y, pri
nt or
save
any c
onten
t of th
is PDF,
in pa
rt or in
full,
on an
y retr
ieval
syste
m,
withou
t the E
XPRESS WRITTEN PERMISSIO
N of th
e cop
yrigh
t-hold
er

National Conference on Climate Change and Agricultural Production: Adapting Crops to Climate Variability and Uncertainty, 6th–8th April, 2017
[164]
INTRODUCTION
In 2015, Chennai flood was a record breaking flood causing immense damages and loss of lives. Population explosion results in urbanization and illegal encroachments. Such activities lead to exposure of population to urban floods. The major cause of flood in Chennai is due to encroachments and unplanned urbanization. The flood was majorly observed in few parts of Chennai which was recently developed into residential area. This is due to the fact that illegal structures were constructed in dried up lakes and stream draining pathway was used for development. The outcome of flood in urban based locality resulted in more property loss when compared to other form of floods. Microwave remote sensing play an important role in disaster risk management especially in floods. Synthetic Aperture Radar (SAR) sensors are preferred for flood detection rather than visible band sensors because of their ability to penetrate the cloud that is often present at times of flood, and to image at night-time as well as during the day (Bolanos et al., 2016). At microwave frequencies, smooth surfaces of water acts like a specular reflector, and the amount of backscattered energy is very less (Schmitt et al., 2013). Hence, signature of water appears as dark in a microwave image. The objective of the study is to extract and mapping of flooded region using multi-temporal technique for change detection scenario of pre-disaster and during disaster. Flood mapping allows us to study about the change in existing water bodies and possible future regions likely to be affected by floods.
MATERIALS AND METHODS
The study was carried out in the city of Chennai for 2015 floods. The study area lies between latitude 120 9' to 130 9' N and longitude 800 12' to 800 19’ E and with 14m elevation above sea level.Sentinel-1 data is used for flood inundation mapping. SNAP, S1tbx Tools, ENVI and SARscape modules were used for image processing. Pre-processing such as radiometric calibration, speckle filtering and geometric correction was carried out. Image classification and image differencing was performed for flood inundation region extraction. Multi-Temporal analysis and feature extraction was carried out for detecting the change in existing water bodies and recently formed flood regions.
RESULTS AND DISCUSSION
The multi temporal pattern detected from the SAR data clearly illustrates the extent of flooded region and with image analysis and classification of the temporal pattern. SNAP platform was used for pre-processing which includes radiometric calibration followed by speckle filtering and geometric correction. Image Analysis was carried our using GLCM from SNAP and supervised classification was performed using ENVI module. The multi-temporal analysis by detecting the change between the SAR data was calculated and flooded region were mapped showing risk prone zones in Chennai city. SVM for supervised classification was preferred for classification of flooded regions. Bands such as energy, entropy, homogeneity, contrast were derived from GLCM image analysis and different band combinations were made to extract the flooded regions. The change in boundaries of existing water bodies such as lakes and rivers were mapped by image differencing method. Combination of GIS-aided classification and spatio-temporal analysis proves to be an optimal way for calculating flood risk and flood damage. The results shows accurate regions flooded during 2015 Chennai flood. The use of advanced satellite technology and GIS aided processing systems can be effectively used for mapping flood disasters and Risk zones. Multi-Temporal analysis will be useful in prediction future scenario and for planning necessary mitigation and management plans for both pre-disaster and post-disaster scenario.
It is I
LLEGAL t
o cop
y, pri
nt or
save
any c
onten
t of th
is PDF,
in pa
rt or in
full,
on an
y retr
ieval
syste
m,
withou
t the E
XPRESS WRITTEN PERMISSIO
N of th
e cop
yrigh
t-hold
er

National Conference on Climate Change and Agricultural Production: Adapting Crops to Climate Variability and Uncertainty, 6th–8th April, 2017
[165]
Table 1: Spatio-temporal Image Analysis for Sentinel 1A Data S.No Figures Details
1
November 12th, Sentinal 1A, De-Grandi filtered,SVM classified
2
November 24th, Sentinal 1A, De-Grandi filtered,SVM classified.
3
Spatio-Temporal image , November 12th and 24th, existing water body change detection
4
Feature extration, Raster color slicing, Only flooded region extraction.
REFERENCES [1] Bolanos S, Stiff D, Brisco B, and Pietroniro A 2016. Operational Surface Water Detection and Monitoring Using Radarsat 2. Remote
Sensing 8 (4): 285 [2] Schmitt and Brisco B 2013. Wetland Monitoring Using the Curvelet-Based Change Detection Method on Polarimetric SAR Imagery.
Water 5: 1036-1051
Modeling Residue Concentration of Chlorpyrifos in Apple Cultivation using HYDRUS-1D
Samreen Nabi*, J.N. Khan, Latief Ahmad, Sabah Parvaze, Saqib Parvaze, I. Mehraj, S.S. Mahdi and R.H. Kanth
Division of Agricultural Engineering, Sher-e-Kashmir University of Agricultural Sciences and Technology of Kashmir, Srinagar–190025, India
E-mail: *[email protected]
Keywords: Residue concentration, Modeling, Apple, HYDRUS-1D
INTRODUCTION
Indiscriminate use of pesticides without any basic scientific recommendations is posing a threat to environment (Soil, Water and Air) and also affecting the plants and animal life. To find out the pesticide residues in soil, water and plants after use, requires some cumbersome experimnentation, time, finances and expert scientists. Hence, a need for a quicker, cheap yet accurate and cognitive method arises. The present study was undertaken to simulate the movement of chloropyrifos after application into the soil, plant and water.
It is I
LLEGAL t
o cop
y, pri
nt or
save
any c
onten
t of th
is PDF,
in pa
rt or in
full,
on an
y retr
ieval
syste
m,
withou
t the E
XPRESS WRITTEN PERMISSIO
N of th
e cop
yrigh
t-hold
er

National Conference on Climate Change and Agricultural Production: Adapting Crops to Climate Variability and Uncertainty, 6th–8th April, 2017
[166]
MATERIALS AND METHODS
A study entitled “Modeling Residue Concentration of chlorpyrifos in Apple Cultivation using HYDRUS-1Dwas conducted at Division of Agricultural Engineering in the year 2016 in which HYDRUS-1D model was used to simulate the water flow, general solute transport and root uptake of Chloropyrifos for a simulation period of 100 days below 100 cm depth of soil, at a predefined number of print times taken as 10. The finite element model was constructed by dividing the entire profile into 100 layers of the thickness of 2.5 cm. Loam soil was selected in the database for the study area (Tailbal, Hazratbal) which calculated the parameters including the residual and saturated water contents, saturated hydraulic conductivity, and empirical coefficients using Rosetta, to predict the values of these parameters. It was assumed to have a constant pressure head at depth 100 cm as a lower boundary condition and variable pressure head as an upper boundary condition. Equilibrium solute transport model was selected with Crank-Nicholson as time weight scheme and Galerkin finite elements as space weight scheme. A concentration flux was used as an upper boundary condition and Zero concentration gradient was assumed as a lower boundary condition with liquid phase concentrations as an initial condition. Given the root zone depth of 45 cm, the Feddes model with parameters defined for Apple (Deciduous Fruit) was applied to simulate the root water uptake. The collected data was statistically analyzed using statistical parameters i.e. root mean square error (RMSE), coefficient of determination (R2).
RESULTS AND DISCUSSION
Chlorpryrifos concentration within the soil profile was expressed as the total amount of solute per unit mass of the soil at predefined print times. The concentration of chlorpyrifos increased gradually at nodes N1, N2, N3 and N4 for almost 35 days. No concentration was recorded upto 83 days in the soil but the model showed increasing Chloropyrifos residues at node N5 after 83 days. Also, the concentration of Chloropyrifos was observed to be in the range of 250-390 ppm initially, but as the depth increased, the concentration towards the concentration axis. The peak concentration value of above 800, indicated by the massive bulge in the curve, was recorded for the print time 10 at a depth of almost 50 cm. Concentration of chlorpyrifos then gradually decreases to zero at a depth about 90 cm from the ground level because of the seepage of pesticide deep into the soil with the help of water due to rainfall. The HYDRUS 1D simulated result of root solute uptake of chloropyrifos residues in time is parabolic in nature indicating that the solute flux initially was zero but increased at a fast rate initially for almost 40 days. The increase then became diminished and slow till the simulated period of 100 days, because majority of the solute was taken up by the root just after the application of the pesticide. The uptake became slow as some portion of the solute seeped into deeper layers of the soil and assimilation thus became slow yet didn’t stop completely. The coefficient of determination (R2) and RMSE values generated were 0.738 and 0.21 for showing good simulation. The chlorpyrifos was assumed to be translocated from the root system of the crop to the fruits (apple) and thus the values obtained from the model, HYDRUS-1D were compared with the experimental values of pesticide residues in plant (fruit). The value of coefficient of determination (R2) and RMSE thus generated for chloropyrifos was 0.631 and 2.40 respectively. Based on the results of the experiment, it may be concluded that Hydrus 1D was an appropriate model for simulation of residue analysis of chlorpyriphos.
REFERENCES [1] Behbahaninia A and Sarraf A 2015. Simulation of Nickel in soils affected by wastewater and sludge by using Hydrus 1D. Journal of
Biodiversity and Environmental Sciences 6(1): 51-55. [2] De Silva C S 2015. Simulation of Potential Groundwater Recharge from the Jaffna Peninsula of Sri Lanka using HYDRUS-1D Model.
OUSL Journal 7(2): 15-18.
It is I
LLEGAL t
o cop
y, pri
nt or
save
any c
onten
t of th
is PDF,
in pa
rt or in
full,
on an
y retr
ieval
syste
m,
withou
t the E
XPRESS WRITTEN PERMISSIO
N of th
e cop
yrigh
t-hold
er

National Conference on Climate Change and Agricultural Production: Adapting Crops to Climate Variability and Uncertainty, 6th–8th April, 2017
[167]
Statistical Comparison of Reference Evapotranspiration Methods in Lalgudi Taluk, Trichy
P.R. Anjitha Krishna1* and R. Lalitha2 Department of Soil and Water Conservation and Agricultural Structures,
Tamilnadu Agricultural University, Coimbatore–641003, India E-mail: *[email protected]
Keywords: Reference evapotranspiration, FAO-56 PM, Regression
INTRODUCTION
Evapotranspiration is the critical parameter in irrigation scheduling in such a way that the amount of water irrigation applied shouldn’t exceed the maximum amount that can be used by plants through evapotranspiration (ET). Reference crop evapotranspiration (ET0) is the evapotranspiration rate from a reference surface, which provides information on the evaporation demand of the atmosphere, independent of the type of the crop, its stage of development and the management practices. Empirical methods of ET0 estimation are widely used due to simplicity and they demand the input of weather parameters. FAO-56 Penman Monteith (FAO-56 PM) is revealed as the most accurate among all methods under all climatic conditions. But the method demands all weather parameters for estimation. The aim of the present study is to evaluate the performance of the selected methods (Thornthwaite method, Hargreaves method, Makkinth Radiation, Priestly Taylor and two pan coefficient based methods-Pereira method and FAO-24 Pan Coefficient method) in Lalgudi taluk of Trichy district, Tamilnadu to propose an alternate equation for estimation of ET0 with fewer requirements of climatic parameters.
MATERIALS AND METHODS
The study was carried in Agricultural Engineering College and Research Institute, Kumulur during 2016. The study area lies between latitude 100 56’ 34.05’’ N and longitude 780 49’ 34.89’’ E at an elevation of 72.2376 m above mean sea level. Annual average rainfall of Lalgudi is 881.412 mm. The average monthly relative humidity is 60.5 percent . The daily records of meteorological parameters were collected from Meteorological observatory at Agricultural Engineering College and Research Institute, Kumulur for the period from 1991 to 2015. The daily data were further converted to monthly data. The selected methods were evaluated based on statistical parameters such as Root mean square Error (RMSE), mean absolute error (MAE) and percentage error of estimate (PE) and the methods were ranked. Regression equations were fitted between the selected and standard method.
RESULTS AND DISCUSSION
TThe result showed that all the six methods over estimated ETO values (Table 1 and Fig1). FAO-24 Pan Coefficient method showed best performance among other five methods with RMSE of 0.68 mm/day, PE of 28.005 and MAE of 0.57 mm/day, which demand data on pan evaporation, relative humidity and wind velocity. Thornthwaite method is the poorest among all with highest PE of 149, MAE of 3.316 mm/day and RMSE of 3.74 mm/day, which requires only temperature data for estimation of ETO. The methods are ranked according to the estimated parameters. Priestly Taylor method, Pereira method, Makkinth Radiation and Hargreaves method resulted in PE of 33, 36, 39 and 116 respectively. Regression equations were fitted between the selected methods and reference method and the details are given in Table 2. The equations are ranked according to the R2 values.
It is I
LLEGAL t
o cop
y, pri
nt or
save
any c
onten
t of th
is PDF,
in pa
rt or in
full,
on an
y retr
ieval
syste
m,
withou
t the E
XPRESS WRITTEN PERMISSIO
N of th
e cop
yrigh
t-hold
er

National Conference on Climate Change and Agricultural Production: Adapting Crops to Climate Variability and Uncertainty, 6th–8th April, 2017
[168]
Fig. 1: Estimated Monthly Average Values of ETo (mm/ Day) by the Selected Methods
Table 1: Regression Coefficients between FAO-56 PM Method and other Methods ET0 Method Intercept Slope R2 (%) Rank
Pereira model (PC-1) 0.896 0.954 88.7 1 FAO-56 Pan coefficient method (PC-2) 0.643 0.988 87.7 2 Hargreaves method(HM) 3.203 0.711 69.5 3 Thornthwaite method(TW) 1.274 1.876 69.2 4 Makkinth Radiation method (MR) 2.355 0.301 37.9 5 Priestly Taylor(PT) 1.476 0.463 15.1 6
REFERENCE [1] Amatya D M, Skaggs E W and Gregory J D 1995. Comparison of Methods for Estimating REF-ET. Journal of Irrigation and Drainage
121(6): 427–435.
Modeling of Runoff using Curve Expert for Dachigam-Telbal Catchment
Mehlath Shah*, Syed Midhat Fazil, Shahzad Faisal, Latief Ahmad and Anaum Chishti Division of Agricultural Engineering,
Sher-e-Kashmir University of Agricultural Science and Technology, Srinagar–190025, India E-mail: *[email protected]
Keywords: Rainfall, Runoff, Curve Expert, Catchment
INTRODUCTION
Runoff is the most basic and important data needed when planning water control strategies, such as waterways, storage, facilities or erosion control structures. Runoff estimation depends on various factors related to rainfall properties, geomorphologic characteristic of catchment and cover management. Since, all these parameters are not readily available; rainfall becomes important for runoff estimation (Kannan, 2007). Curve expert Professional is a cross platform solution for curve fitting and data analysis. Data can be modeled using a toolbox of linear regression models, non linear regression models, smoothing methods, or various kinds of splines. The software is designed with the purpose of generating high quality results and output while saving time in the process.
0123456789
10
ETo(
mm
/day
)
Month
PC-1 (Pereira model)
PC-2 (FAO-56)
PT(Priestly Taylor)
TW(Thornthwaite method)
It is I
LLEGAL t
o cop
y, pri
nt or
save
any c
onten
t of th
is PDF,
in pa
rt or in
full,
on an
y retr
ieval
syste
m,
withou
t the E
XPRESS WRITTEN PERMISSIO
N of th
e cop
yrigh
t-hold
er

National Conference on Climate Change and Agricultural Production: Adapting Crops to Climate Variability and Uncertainty, 6th–8th April, 2017
[169]
METHODOLOGY
The required rainfall data and run-off data for the year 1990-2011 was obtained from LAWDA and Division of Agronomy, SKUAST-K, Shalimar campus respectively. This data was arranged and processed in a proper manner using MS EXCEL spread sheet. Regression models were developed for runoff estimation using rainfall as single predictor determining the volume of runoff for Dachigam-Telbal Catchment, Srinagar. The curve expert has several linear, polynomial, and non linear inbuilt models which it tested for the applied data. First five ranked models were used to predict runoff for given set of data.
RESULTS AND DISCUSSION
Regression analysis was carried out to establish relation between rainfall and runoff, both linear as well as nonlinear, which indicated highest coefficient of determination (R2). The predicted models indicated high possibility of making prediction of monthly as well as annual runoff based on rainfall amount alone. It was found that rainfall alone can explain runoff in a better manner. All the non linear and linear models fitted by the software gave best results for both annual and monthly prediction of runoff for year 2006-2011 with coefficient of determination ranging from 0.88 to 0.93 and 0.94 to 0.94 respectively.
Table 1: Table of Mean Square Error and Root Mean Square Error for Developed Models for Monthly Analysis Name of Model MSE RMSE
Linear Regression Model 0.10 0.32 Vapor Pressure Model 0.74 0.86 Shifted Power Model 0.09 0.31 Heat Capacity Model 0.09 0.30 Rational Model 0.09 0.31
Table 2: Table of Mean Square Error and Root Mean Square Error for Developed Models for Annual Analysis Name of Model MSE RMSE
Heat Capacity Model 0.06 0.41 Steinhart-Hart Equation 0.05 0.23 Modified Power 0.06 0.25 Farrazdaghi-Harris Equation 0.04 0.20 Linear Model 0.05 0.23
REFERENCE [1] Kannan N, White S M, Worrall F and Whelan M J 2007. Sensitivity analysis and identification of the best evapotranspiration and runoff
options for hydrological modeling in SWAT-2000. Journal of Hydrology 332(3-4): 456-466.
Modeling of Water Movement under Organic and Inorganic Conditions in a Polyhouse
Iqra Mehraj1*, J.N. Khan1, Latief Ahmad2, Sabah Parvaze2, Samreen Nabi and R.H. Kanth1 1Division of Agricultural Engineering, 2Division of Agronomy
1,2Sher-e-Kashmir University of Agricultural Sciences and Technology of Kashmir–190025 India E-mail: *[email protected]
Keywords: Modeling, Aqua Crop, FYM
INTRODUCTION
Water is useful in the process of plant growth. Deficiency of water in the root zone of soil results in reduced plant growth and affects the crop yield, thus objective of irrigation is to maintain adequate moisture content in the root zone, such that crop yield is not affected adversely. Analysis of moisture dynamics in the soil-
It is I
LLEGAL t
o cop
y, pri
nt or
save
any c
onten
t of th
is PDF,
in pa
rt or in
full,
on an
y retr
ieval
syste
m,
withou
t the E
XPRESS WRITTEN PERMISSIO
N of th
e cop
yrigh
t-hold
er

National Conference on Climate Change and Agricultural Production: Adapting Crops to Climate Variability and Uncertainty, 6th–8th April, 2017
[170]
plant-atmosphere continuum is an important aspect of the crop water management. Modeling moisture dynamics in soil-plant-atmosphere continuum is a difficult task, due to the complexity of the various processes involved in the system. The field experiment was carried out on tomato (Solanum lycopersicum) to simulate water movement within the soil profile.
MATERIALS AND METHODS
AquaCrop model was usedto describe accurately the retention and movement of water in the soil profile throughout the growing season. The experiment was carried out on tomato Hybrid Vijeta in a greenhouse oriented in North-South direction with a dimension of 15×8×3.5m at Experimental Farm (34.145° N latitude and 74.87° E longitude and 1605m above mean sea level) of SKUAST-Kashmir, Shalimar during Kharif season of 2015. Data loggers were installed inside the greenhouse to measure air temperature (Ta) and relative humidity (RH). The sensors were installed at three different depths i.e. 60cm, 40cm and 20cm in the plant root zone in inorganic and FYM treated soil. The suction recorded was converted into volumetric moisture content (%) using Van Genuchten (1980) equation. For the month of May, June, September and October the water was applied at an interval of 2 to 3 days while for the month of July and August the water was applied at an interval of 1 to 2 days. During last month of November irrigation was given once by means of drip irrigation system. The model requires the environment and climate (Temperature, ETo, Rain, CO2, Irrigation and Field, Soil profile and Groundwater) data. For simulation run it requires the initial conditions and field data.
RESULTS AND DISCUSSION
Soil water status at different root depths in the root zone gives an idea about the availability of moisture for plant moisture uptake. Roots are primary pathway for water and nutrient uptake by plants.They connect the soil environment to the atmosphere through water and energy flux exchanges between vegetation canopy and atmosphere (Feddes et al., 2001). Plants have the ability to preferentially uptake water from portions of the root zone where water is more freely available. Soil water content or soil moisture content trend for both organic (FYM) and inorganic treated soils at a depth of 25cm was modeled using AquaCrop. Results revealed that the soil water content during initial stage shows a decreasing trend resulting in downward movement of water. This is due to the reason that the canopy cover of the crop is less initially and the soil being unsaturated simulates the downward movement of water resulting in less moisture depletion. As the crop enters in to the crop development stage and mid stage, the crop water requirement is increased causing more soil moisture depletion as the temperature has started rising and the plant has attained maturity resulting in an upward movement of water. At the end stage where water is not a limiting factor, less moisture depletion occurs resulting in decreased water content simulating downward movement of water. The soil water content for inorganic treated soil ranged from 23.2 to 37.9 percent. The soil water content for organic (FYM) treated soil ranged from 24.9 to 39.3 percent.
REFERENCE [1] Feddes R A, Hoff H, Bruen M, Dawson T, Rosnay P D, Dirmeyer P, Jackson R B, Kabat P, Kleidon A, Lilly A and Pitman A J 2001.
Modeling root water uptake in hydrological and climate models. Bulletin of the American Meteorological Society 82(12): 2797-280.
It is I
LLEGAL t
o cop
y, pri
nt or
save
any c
onten
t of th
is PDF,
in pa
rt or in
full,
on an
y retr
ieval
syste
m,
withou
t the E
XPRESS WRITTEN PERMISSIO
N of th
e cop
yrigh
t-hold
er

National Conference on Climate Change and Agricultural Production: Adapting Crops to Climate Variability and Uncertainty, 6th–8th April, 2017
[171]
A Crop Simulation Approach: To Estimate the Growth and Yield Response of Potato under Present Climatic Variability
Priyanka Singh1, S. Naresh Kumar2, K.K. Singh1 and Arpita Rastogi3 1Agromet Advisory Services Division, India Meteorological Department, New Delhi
2Center for Environment Science and Climate Resilient Agriculture, Indian Agriculture Research Institute, New Delhi–110012, India
3Meteorological Center, India Meteorological Department, Patna E-mail: *[email protected]
Keywords: Gridded data, GIS (Geographic Information System), InfoCrop model.
INTRODUCTION
State of Bihar is located on the fertile land of the Indo Gangetic plains and potato is the fourth major food crop after rice, wheat and maize in Bihar. Potato is a heat sensitive crop and under the well irrigated and fertilized condition temperature is the only yield limiting factor for potato, therefore the challenges that climate variability causes to crop productivity require an unprecedented ability to predict the responses of crop production in climate variability. The present study aimed to assess the impact of weather element on tuber yield of potato with the use crop simulation modeling.
MATERIALS AND METHODS
In the present study 1990-2015district wise observed potato yield of Bihar has been collected and analyzed. Attempt has been made to simulate the potato yield using .5*.5 km resolution IMD gridded weather data for temperature and rainfall, InfoCropcrop simulation model, the model is well calibrated and validated for the potato cultivars using time course data on potato growth and development from 1976-1999 (Singh et al. 2005).The model has been run for the KufriChandramukhi Variety for historic 30 years of weather data and for sowing date 01 November to study the impact of climate variability on potato yield in the state.Bihar state is covered with 266 grids of .5 km resolution and simulated output obtained at each grid; the gridded output has been processed with the GIS (Geographic Information System) to obtain the yield at district level and to study the spatial variation in yield.Simulated output has been compared with the observed yield data applying various statistical methods and tests.
RESULTS AND DISCUSSION
The observed yield has shown a sudden drop during the year 2006-2010, broadly model simulation are found to address the sudden yield drop in observed yield. The yield increase 2010 onwards influenced by technology –rating factor which accounts for the impact of fertilization, management and pest control and introduction of new variety. Thus the only uncontrollable source of variability in the yield of a crop is agro-climatic condition of the region and the simulated model broadly able to estimate the impact of weather on tuber yield of potato. The trend observed between the observed and simulated yield are found same and the range of RMSE calculated for the 9 major potato growing for 1990-2016 districts are 508 kg/Ha to 1172 kg/Ha. The output is further analyzed to study the impact of weather on the phenological phases and yield determining factors of potato.
It is I
LLEGAL t
o cop
y, pri
nt or
save
any c
onten
t of th
is PDF,
in pa
rt or in
full,
on an
y retr
ieval
syste
m,
withou
t the E
XPRESS WRITTEN PERMISSIO
N of th
e cop
yrigh
t-hold
er

National Conference on Climate Change and Agricultural Production: Adapting Crops to Climate Variability and Uncertainty, 6th–8th April, 2017
[172]
REFERENCES [1] Aggarwal P.K, Kalara N, Chander S and Pathak H 2004. Infocrop-A generic simulation model for annual crops in tropical environment;
Indian Agricultural Research Institute, New Delhi. pp: 132. [2] Singh J P, Praharaj C S, Govindakrishnan P M, Lal S S and Aggarwal P K 2003. Parameterization and validation of the InfoCrop-
POTATO model. Journal of Indian Potato Association 30: 57-58. [3] Singh J P, Govindakrishnan P M, Lal S S and Aggarwal P K 2008. Infocrop-Potato A Model for Simulating Growth and Yield of Potato in
the Sub-Tropics. Technical Bulletin No. 87, Central Potato Research Institute, Shimla.
Land Use Land Cover Changes in Dal Catchment in Srinagar, J&K Anaum Chishti1, J.N. Khan1, Mehlath Shah1, Samreen Nabi1, Syed Midhat1, Iqra Mehraj1,
Sabah Parvaze2, Mir Ikhlaq Ahmad3, Latief Ahmad2 and Sameera Qayoom2 1Division of Agricultural Engineering, 2Division of Agronomy,
3Centre for Climate Change and Mountain Agriculture 1,2,3Sher-e-Kashmir University of Agri. Sciences and Technology of Kashmir Srinagar–190025, India
E-mail: *[email protected]
Keywords: Water quality, Dal Lake, GIS, LULC changes.
INTRODUCTION
Land use land cover changes play an important role in the study of global change. Land use/land cover and human/natural modifications have largely resulted in deforestation, biodiversity loss, global warming and increase of natural disaster-flooding (Divedi et al., 2005). The alterations in LULC are generally caused by the mismanagement of urban, rural, range and forest lands and hence lead to environmental problems like floods and landslides. Hence the LULC data available can help in devising better ways for the environmental protection.The growing population and increasing socio-economic necessities creates a pressure on land use/land cover. This pressure results in unplanned and uncontrolled changes in LULC (Seto et al., 2002). The present study was undertaken to analyze the land use change patterns in one of the most sensitive catchments of Srinagar i.e. the Dal Catchment. The study was carried out using two satellite images for the years 1991 and 2013 and 13 different LULC classes were identified using Arc GIS.
MATERIALS AND METHODS
Satellite images of the Dal catchment for the year 1991 (October) (LandSat) and 2013 (October) (LISS IV) provided by the Centre for Climate Change &Mountain Agriculture, SKUAST-K, Shalimar were used in this study. These images were classified using Arc GIS and a total of 13 LULC classes were identified on the basis of visual interpretation and the ground data that was collected by identifying different points taken on the GPS. The LULC classes identified in both the images werethen compared with each other on the basis of area of each of the classes.
RESULTS AND DISCUSSION
The comparison of land use classes for the year 1991 and 2013 shows a decrease of 1.15% in agricultural field, 2.28% in barren land, 5.35% in evergreen forests, 6.5% in orchards and horticulture, 0.41% in open forests, 0.15% in grasslands and meadows and 0.72% in waterbody. However an increase of 7.91% in built up, 2.4% in mixed plantation, 0.62% in recreational park , 1.86% in scrub land, 0.81% in snow and glacier and 3.17% in vegetable field was ascertained. The results obtained from the study show that there has been a considerable amount of change in the study area in the last 2 decades and the effect of human interference (unplanned urbanization and land conversions) is easily detected.
It is I
LLEGAL t
o cop
y, pri
nt or
save
any c
onten
t of th
is PDF,
in pa
rt or in
full,
on an
y retr
ieval
syste
m,
withou
t the E
XPRESS WRITTEN PERMISSIO
N of th
e cop
yrigh
t-hold
er

National Conference on Climate Change and Agricultural Production: Adapting Crops to Climate Variability and Uncertainty, 6th–8th April, 2017
[173]
Table 1: Shows the Area in sq.km under Different LULC Classes for Both the Years and the % Area Increase/ Decrease in the Different Land Use Classes in the Year 2013 from the Year 1991
LULC Feature Area (sq. km) (1991) Area (sq. km) (2013) % Change in LULC Classes Agriculture Field 21.78 17.59 -1.15 Barren Land 48.19 39.87 -2.28 Builtup 16.80 45.67 7.91 Evergreen Forest 138.17 118.65 -5.35 Grassland and Meadows 1.63 1.09 -0.15 Mixed Plantation 6.91 15.67 2.40 Open Forest 8.29 6.78 -0.41 Orchards and Horticulture 38.59 14.83 -6.51 Recreational Park 0.80 2.33 0.62 Scrub Land 14.72 21.49 1.86 Snow and Glacier 41.49 44.46 0.81 Vegetable Field 10.29 21.84 3.17 Water body 17.23 14.6 -0.72
REFERENCES [1] Dwivedi R.S., Sreenivas K. and Ramana K.V. 2005. Land-use/land-cover change analysis in part of Ethiopia using Landsat Thematic
Mapper data. International Journal of Remote Sensing 26(7): 1285–1287. [2] Seto K.C., Woodcock C E, Song C, Huang X, Lu J and Kaufmann R K 2002. Monitoring land use change in the Pearl River Delta using
Landsat TM. International Journal of Remote Sensing 23(10): 1985–2004.
Assessment of Groundwater Contamination Vulnerability by using Drastic Model In Relation To Agriculture Production
Sujitha E.1* and Shanmuga Sundaram K.2 1Research Scholar, Department of Soil and Water Conservation Engineering,
Agricultural Engineering College & Research Institute, Kumulur, Trichy–621712, Tamil Nadu 2Professor, Department of Soil and Water Conservation Engineering,
Agricultural Engineering College &Research Institute, Kumulur, Trichy–621712, Tamil Nadu E-mail: *[email protected].
Keywords: DRASTIC model, Groundwater contamination, Aquifer vulnerability, Agriculture
INTRODUCTION
Groundwater resources are high dependence due to its uses for many purposes, i.e. domestic, agricultural, industrial, commercial, etc. This results in increasing pressure on the quantity and quality of such water source. The high withdrawal for industrial and agricultural activities, due to an increase in the population and low recharge, reduces the amount of available groundwater. This contributes significantly to the deterioration in groundwater quality (Piscopo, 2001). The assessment of groundwater vulnerability to contamination has proven to be an effective tool for the delineation of protection zones in the affected area. DRASTIC is one of the popular methods used to assess the groundwater vulnerability. This paper reviews how DRASTIC model helps in studying ground water pollution severity and its impacts over Agriculture
REASON FOR THIS REVIEW
Groundwater is a very important natural resource as the demand for water has increased rapidly. Almost 70 percent of people utilize groundwater in their daily routines. This contributes significantly to the deterioration in groundwater quality. In order to meet the objectives, a popular groundwater assessment model named
It is I
LLEGAL t
o cop
y, pri
nt or
save
any c
onten
t of th
is PDF,
in pa
rt or in
full,
on an
y retr
ieval
syste
m,
withou
t the E
XPRESS WRITTEN PERMISSIO
N of th
e cop
yrigh
t-hold
er

National Conference on Climate Change and Agricultural Production: Adapting Crops to Climate Variability and Uncertainty, 6th–8th April, 2017
[174]
DRASTIC is chosen. The DRASTIC is a hydrogeological vulnerability ranking method uses a set of seven hydrogeologic parameters to classify the vulnerability or pollution potential of an aquifer.The resulting index maps are classified into three levels of vulnerability zones, i.e. low, medium, and high which can provide an indicator for protection and prevention measures by the governing authority.
MATERIALS AND METHODS
The word DRASTIC is an acronym of seven hydrogeological parameters which helps in defining groundwater regime and its vulnerability towards pollution. The seven thematic parameters are depth to aquifer (D), recharge (R), aquifer media (A), soil type (S), topography (T), intermediate zone (I), and conductivity (C), generated in the geographic information system (GIS) environment. Each parameter has been assigned different weight and rating value on its relative behavior towards groundwater pollution and its rating value varies from 1 to 10 (Aller et al. 1987). The application of GIS in the DRASTIC approach makes the work very easy and gives more reliable result in terms of accuracy. An approach has been adopted to determine the vulnerable zone of groundwater pollution in the area by applying DRASTIC concept in the GIS environment.
RESULTS AND CONCLUSION/DISCUSSION
Studying the groundwater contamination and vulnerability prediction in the aquifer is a tedious and a time consuming process. But it is an important process that helps in implementation of pollution prevention measures and conservation methods based on the severity level and it should be taken for every kind of relevant activity within the whole basin.Thus the DRASTIC tool in the Geographic Information System and Remote Sensing help in the prediction of groundwater contamination level and crop planning accordingly.
REFERENCE [1] Dipankar Saha & Fakhre Alam., (2014).Groundwater vulnerability assessment using DRASTIC and Pesticide DRASTIC models in intense
agriculture area of the Gangetic plains, India. Environ Monit Assess (2014) 186:8741–8763.
Impacts of Local and Large Scale Weather Phenomenon on Crop Yield Variability in Eastern India
B.S. Dhekale1, S. Sheraz Mahdi2 and K.P. Vishwajith3 1School of Earth Ocean & Climate Science,
Indian Institute of Technology, Bhubaneswar, India–751 007 2Department of Agronomy, Bihar Agricultural University, Sabour–813210, Bhagalpur, India
3Department of Agricultural Statistics, Bidhan Chandra Krishi Vishwavidyalaya, Nadia–741252, India E-mail: *[email protected]
Keywords: Climate variability and change, Crop yield, Weather, ENSO
INTRODUCTION
Many studies have examined the role of mean climate change in agriculture, but an understanding of the influence of inter-annual climate variations on crop yields in different regions of remains elusive (Osborne & Wheeler, 2013). Not only climate change but also climate variability imposes a wide range of possible consequences on agricultural production. El Nino-Southern Oscillation phenomenon (ENSO) is one of the principle sources of inter-annual climatic variability which affects seasonal temperature and precipitation (Yadav et al., 2010). In addition, it is also responsible for droughts, hurricanes, and tsunamis which indirectly
It is I
LLEGAL t
o cop
y, pri
nt or
save
any c
onten
t of th
is PDF,
in pa
rt or in
full,
on an
y retr
ieval
syste
m,
withou
t the E
XPRESS WRITTEN PERMISSIO
N of th
e cop
yrigh
t-hold
er

National Conference on Climate Change and Agricultural Production: Adapting Crops to Climate Variability and Uncertainty, 6th–8th April, 2017
[175]
affects crop yield. In present study, an attempt has been made to analyze the crop yield responses to climate and climatic variability role in Bihar, Odisha and West Bengal. The Influence of large scale climate indices (Arctic Oscillation (AO), North Atlantic Oscillation (NAO), Southern Oscillation Index (SOI) and Indian Ocean Sea Surface Temperature for Nino 3.4 region (NINO 3.4 SST) on local weather phenomenon has also been discussed.
MATERIALS AND METHODS
The data on the yield of major crops i.e. Kharif & summer Rice, Wheat, Rapeseed & Mustard, Jute and total food grain for eastern India (Bihar, Odisha and West Bengal) from 1969 to 2014 was obtained from Directorate of Economics and Statistics, Department of Agriculture and Cooperation, Ministry of Agriculture, Government of India. Station wise weather data viz. Tmax, Tmin and Precipitation for the selected states of same period was obtained from India Meteorological Department, Pune, Maharashtra. Weather data on the Odisha was available from 1981 and hence to keep parity in analysis, crop yield statistics of same period for Odisha state was used for analysis. Weather data for particular state was compiled by averaging different station weather data of that state. Data on various climate indices (Nino3.4 region SST, SOI, AO and NAO) were obtained from http://www.cgd.ucar.edu/cas/catalog/climind. The detrended data series were used to study the impact of variability on the local precipitation, Tmin and Tmax temperatures, and climate indices of Nino3.4 SST, SOI, AO and NAO on different crops over eastern India.
RESULTS AND DISCUSSION
The Nino 3.4 SST is significantly correlated with the precipitation in all selected state (Table 1). SOI has shown significant correlation with Precipitation in Bihar state, whereas, AO was found significantly correlated with Tmax and Tmin of Bihar, Tmin of Odisha. NAO has also shown significant relationship with Tmin of all selected states. These results revealed that the large scale complex weather phenomenon like AO, NAO, Nino 3.4 SST and SOI are correlated with the local weather phenomenon and bring changes in local weather in eastern India. The production of kharif rice in eastern India is significantly negatively influenced by Nino3.4 SST (Table 2). It can be concluded that negative association between kharif rice yield with ENSO. Increase in sea surface temperature in Nino 3.4 SST (EL-Nino) region negatively influencing the rainfall in India and indirectly affecting kharif rice production.
The productivity of summer rice, wheat, total food grain and rapeseed-mustard is influenced mainly by NAO in Bihar, West Bengal and Odisha state while SOI is significantly correlated with summer rice, rapeseed and mustard of Odisha. In addition, SOI is also influencing wheat production in West Bengal. The existence of a varying solid relationship between crop yields and large scale phenomenon such as NAO, AO, Nino 3.4 SST and SOI indicates the complexity of influence of these indices on local climate and which in turn affects the crop yield. These results may be very useful as guideline for determining the strategies for sustainable production through integrated crop management techniques for eastern India.
It is I
LLEGAL t
o cop
y, pri
nt or
save
any c
onten
t of th
is PDF,
in pa
rt or in
full,
on an
y retr
ieval
syste
m,
withou
t the E
XPRESS WRITTEN PERMISSIO
N of th
e cop
yrigh
t-hold
er

National Conference on Climate Change and Agricultural Production: Adapting Crops to Climate Variability and Uncertainty, 6th–8th April, 2017
[176]
Table 1: Correlation Coefficients between the Local Weather Parameter (Precipitation, Tmax and Tmin) and Different Climatic Indices for the Period 1969–1970 to 2014–2015
Climate Indices
Bihar West Bengal Odisha Rainfall Tmax Tmin Rainfall Tmax Tmin Prec Max Min
AO 0.04 -0.29* -0.29** 0.25* 0.03 -0.12 0.08 -0.13 -0.34** NAO -0.02 -0.15 -0.22* 0.21 0.02 -0.33** -0.15 -0.29* -0.36** Nino3.4 SST -0.30** 0.17 0.14 -0.24* 0.01 0.06 -0.29* -0.04 -0.06 SOI 0.25* -0.1 -0.14 0.13 0.03 -0.05 -0.02 0.19 0.16
*significant at 95% confidence level, **significant at 99% confidence level
Table 2:Correlation Coefficients between the Yield of Major Crops of Bihar and Different Climatic Indices for the Period 1969–1970 to 2014–2015
Kharif Rice Summer Rice Wheat Rapeseed and Mustard Jute Total Food grain Bihar
AO 0.28** 0.01 0.17 0.09 0.14 0.11 NAO 0.06 -0.28** -0.24* -0.28** -0.17 -0.29** Nino3.4 SST -0.27** 0.06 -0.09 -0.03 -0.09 -0.14 SOI 0.25* 0.01 0.12 0.11 0.15 0.22
West Bengal AO 0.02 0.17 -0.03 0.08 0.18 0.17 NAO -0.03 -0.07 -0.22 -0.27** -0.14 -0.25** Nino3.4 SST -0.24* 0.05 -0.21 -0.06 -0.05 -0.01 SOI 0.10 -0.02 0.27** 0.16 0.09 0.10
Odisha AO 0.16 -0.04 0.11 -0.11 0.30* 0.30* NAO 0.11 -0.41** 0.20 -0.40** 0.48** 0.05 Nino3.4 SST -0.29* -0.22 0.05 -0.21 0.09 0.02 SOI 0.02 0.45** -0.10 0.40** -0.23 0.02
*and**significant at 95% and 99% confidence level
REFERENCES [1] Osborne T.M. and Wheeler T.R. 2013. Evidence for a climate signal in trends of global crop yield variability over the past 50 years.
Environmental Research Letters 8: 024001. [1] Yadav RK, Yoo JH, Kucharski F, Abid MA 2010. Why is ENSO influencing northwest India winter precipitation in recent decades?
Journal of Climatology23:1979–1993. It is I
LLEGAL t
o cop
y, pri
nt or
save
any c
onten
t of th
is PDF,
in pa
rt or in
full,
on an
y retr
ieval
syste
m,
withou
t the E
XPRESS WRITTEN PERMISSIO
N of th
e cop
yrigh
t-hold
er

National Conference on Climate Change and Agricultural Production: Adapting Crops to Climate Variability and Uncertainty, 6th–8th April, 2017
[23]
THEME 3 Natural Resource Management, Information &
Communication Management Concerning Climate Smart Agriculture
Natural Resource Management for Sustainable Agriculture
Climate Change and Horticulture
Information & Communication Management Concerning Climate Smart Agriculture
It is I
LLEGAL t
o cop
y, pri
nt or
save
any c
onten
t of th
is PDF,
in pa
rt or in
full,
on an
y retr
ieval
syste
m,
withou
t the E
XPRESS WRITTEN PERMISSIO
N of th
e cop
yrigh
t-hold
er

It is I
LLEGAL t
o cop
y, pri
nt or
save
any c
onten
t of th
is PDF,
in pa
rt or in
full,
on an
y retr
ieval
syste
m,
withou
t the E
XPRESS WRITTEN PERMISSIO
N of th
e cop
yrigh
t-hold
er

National Conference on Climate Change and Agricultural Production: Adapting Crops to Climate Variability and Uncertainty, 6th–8th April, 2017
[179]
Productivity and Economics of Wheat in Pearlmillet-Wheat Cropping System as Affected by Various Nutrient Sources in Sandy Loam Soils
Babli* and Pawan Kumar Department of Agronomy, CCS Haryana Agricultural University, Hisar–125004, India
E-mail: *bablimamoriagmail.com
Keywords: Economics, Nutrient Sources, Pearlmillet, Productivity, Wheat
INTRODUCTION
Pearlmillet-wheat cropping system is one of the important cropping systems of the country and its contribution in total food production is considerably large. This system is very exhaustive and continuous use of inorganic fertilizers and other agrochemicals has resulted in deterioration in the soil health and disturb the microbial environment leading to unsustainable productivity, also increase the micro-nutrient deficiency in the soil and increase the cost of production. Application of organic manure alone or in combination with inorganic fertilizers is know to have favourable effect on soil environment and correct marginal deficiency of secondary nutrients, micronutrients and enhance the nutrient use efficiency. Therefore, there is need to improve nutrient supply for sustainable production of this system of India, by integrated nutrient use (organic manure and inorganic fertilizer). Therefore, a field experiment was undertaken to study the productivity and economics in pearlmillet-wheat cropping system influenced by various fertilizer levels applied through the organic and inorganic sources.
MATERIALS AND METHODS
The field experiment on pearlmillet-wheat cropping syatem was laid out in Randomized Block Design in 12 treatment combinations with three replications at Agronomy Research Farm of Chaudhary Charan Singh Haryana Agricultural University, Hisar. The treatments were: T1 - Control (no fertilizer); T2 - 50 per cent recommended NP to pearl millet and wheat through fertilizers; T3 - 50 per cent recommended NP to pearl millet and 100 per cent recommended NP to wheat through fertilizers; T4 - 75 per cent recommended NP to pearl millet and wheat through fertilizers; T5 - 100 per cent recommended NP to pearl millet and wheat through fertilizers; T6 - 50 per cent NP through fertilizers + 50 per cent N (farmyard manure) to pearl millet and 100 per cent NP to wheat through fertilizers; T7 - 75 per cent NP through fertilizers + 25 per cent N (farmyard manure) to pearl millet and 75 per cent NP to wheat through fertilizers; T8 - 50 per cent NP + 50 per cent N (wheat straw) to pearl millet and 100 per cent NP to wheat through fertilizers; T9 - 75 per cent NP + 25 per cent N (wheat straw) to pearl millet and 75 per cent NP to wheat through fertilizers; T10 - 50 per cent NP + 50 per cent N (Sesbania spp.) to pearl millet and 100 per cent NP to wheat through fertilizers; T11 - 75 per cent NP + 25 per cent N (Sesbania spp.) to pearl millet and 75 per cent NP to wheat through fertilizers and T12-farmers’ practice. Recommended package of practices were followed in both the crops for other agronomic operations.
RESULTS AND DISCUSSION
The dry matter accumulation, length of spike, grains per spike, straw yield, grain yield and harvest index of wheat was significantly higher with the application of 50% RD-NP + 50% N through FYM in pearl millet and 100% RD-NP (T6) in wheat under pearlmillet-wheat cropping system (Table 1). Dry matter accumulation and straw yield was maximum 6293.00 and 6687 kg/ha, respectively in T6 while lowest yield of dry matter (2022.44 kg/ha) and straw (1309 kg/ha) was in T1. Spike length was significantly higher in T6 which was 12.2
It is I
LLEGAL t
o cop
y, pri
nt or
save
any c
onten
t of th
is PDF,
in pa
rt or in
full,
on an
y retr
ieval
syste
m,
withou
t the E
XPRESS WRITTEN PERMISSIO
N of th
e cop
yrigh
t-hold
er

National Conference on Climate Change and Agricultural Production: Adapting Crops to Climate Variability and Uncertainty, 6th–8th April, 2017
[180]
cm with 44 grains per spike over control (T1). Harvest index and grain yield were significantly high 46.95 percent (T3) and 5582 kg/ha (T6), respectively in while lowest harvest index and grain yield was in T6 and T1, respectively. The results are in close proximity with the result of Awasthi and Bhan, (1993). Hence the productivity of succeeding wheat crop was improved in pearl millet-wheat cropping system. FYM supply macro and micro nutrients in the soil by mineralization process in adequate amount for crop growth because the FYM release nutrients gradually in the soil, which are used by the crop for a longer time which improves the yield contributing characters of wheat in the pearlmillet-wheat cropping system.
Table 1: Effect of Different Nutrient Sources on the Yield Contributing Characters and Yield of Wheat Treatments Dry Matter at
Maturity (kg/ha) Spike
Length (cm) Grains/ Spike Grain
Yield(kg/ha) Straw
Yield(kg/ha) Harvest Index(%)
T1 2022 6.6 29.7 1190 1309 46.73 T2 5698 8.0 34.0 3610 4188 46.29 T3 5902 8.8 37.2 4649 5253 46.95 T4 5816 8.6 35.8 4640 5196 47.17 T5 6236 11.5 41.1 5490 6560 45.56 T6 6293 12.2 44.0 5582 6687 45.49 T7 6046 10.0 38.8 5036 5841 46.29 T8 6163 10.8 40.0 5127 6049 45.87 T9 5946 9.2 38.0 4742 5405 46.73 T10 6176 11.0 40.0 5421 6450 45.66 T11 5989 9.6 38.4 4749 5461 46.51 T12 6132 10.4 39.2 5085 5949 46.08 CD (p=0.05) 12 0.5 2.0 47 81 0.002
REFERENCES [1] Awasthi U D and Bhan S 1993.Performance of wheat varieties with different levels of nitrogen in moisture-scarce conditions.Indian
Journal of Agronomy38: 200-203.
Growth and Yield of Different Wheat Varieties under Agri-Silvi-Horticultural System in Semi-Arid Region of India
Vishal Johar*, R.S. Dhillon, K.K. Bhardwaj, Tarun Kumar, S.B. Chavan and Vinita Bisht CCS Haryana Agricultural University, Hisar–125004, India
E-mail: *[email protected]
Keywords: Wheat, Eucalypts, Kinnow, Agroforestry
INTRODUCTION
Indian agriculture is facing challenges and constraints due to growing demographic pressure, increasing food, feed and timber needs, natural resources degradation and climate change (Dhyani and Handa, 2013). Diversification of existing farming systems by developing suitable agroforestry models seems to be the need of the day (Dhillon et al., 2012). Agroforestry system greatly contribute toward production of wood for industrial and other commercial purposes, besides maintaining ecological balance, uplifting of socioeconomic status of the farmers and at the same time diversify the traditional agricultural cropping rotation. Productivity in terms of grain yield and nutritional security in agri-silvi-horticultural system is comparatively higher than the productivity of sole agriculture and seems to be a potentially viable land use system for maximum and sustainable productivity on farmer’s field. Keeping in view the vital importance of agroforestry systems in present day context, the present study was planned to assess the effect of shade, multitier interaction and
It is I
LLEGAL t
o cop
y, pri
nt or
save
any c
onten
t of th
is PDF,
in pa
rt or in
full,
on an
y retr
ieval
syste
m,
withou
t the E
XPRESS WRITTEN PERMISSIO
N of th
e cop
yrigh
t-hold
er

National Conference on Climate Change and Agricultural Production: Adapting Crops to Climate Variability and Uncertainty, 6th–8th April, 2017
[181]
nutritional competition of both annual (grain crop) and perennial (Kinnow plus Eucalypts) components of agri-silvi-horticultural system on production potential of various wheat varieties in semi-arid tract of Haryana.
MATERIALS AND METHODS
The study was carried out during rabi season of 2015-16 in the research farm of Department of Forestry, CCS Haryana Agricultural University, Hisar, India. A pre-established five year old plantation of Kinnow alone and Kinnow +Eucalypts was used as the basic agroforestry model in the study. The experiment was laid out in split-plot design with three replications. Four wheat varieties viz., WH-1105, WH-711, HD-2967 and DPW-621-50 representing early sown varieties of north-western India were selected to test their performance under agri-silvi-horticultural system in comparison to control (devoid of trees). Four fertilizer levels i.e. recommended dose of fertilizer [RDF: 150 kg N + 60 kg P2O5 + 30 kg K2O + 25 Kg ZnSO4 per hectare), RDF + 10% additional dose of N, RDF + 20% additional dose of N and RDF + 30% additional dose of N were applied. Sowing of all the above varieties was carried out in the second fortnight of November following all the package and practices. Observations for plant population, yield and yield attributing parameters such as plant height, number of tillers per plant, ear length, number of grains per ear, 1000-grain weight etc were recorded to assess the performance of different varieties under agri-silvi-horticultural system in comparison to control.
RESULTS AND DISCUSSION
Table 1: Effect of Fertilizer Levels on Yield of Wheat Varieties in Agri-silvi-horticulture System Treatments Yield (Tones/ha)
WH-1105 HD-2967 WH-711 DPW-621-50 Kinnow + Wheat RDF 2.30
(3.71) 2.50
(3.88) 2.03 (3.58) 2.23
(3.54) RDF + 10% 2.67
(4.32) 2.80
(4.15) 2.27
(3.68) 2.51
(4.17) RDF + 20% 2.78
(4.61) 2.94
(4.31) 2.39
(3.79) 2.64
(4.18) RDF + 30% 2.83
(4.58) 2.90
(4.25) 2.292 (3.73)
2.29 (4.29)
Mean 2.68 (4.36)
2.80 (4.20)
2.27 (3.74)
2.54 (4.11)
CD (p=0.05): AFS Fertilizer levels AFS × FLS
0.125 (0.245) 0.273 (NS)
NS (NS) Kinnow + Eucalypts + Wheat RDF 1.21
(1.92) 1.31
(2.09) 1.05
(1.67) 1.17
(1.86) RDF + 10% 1.38
(2.14) 1.47
(2.29) 1.19
(1.87) 1.32
(2.07) RDF + 20% 1.43
(2.18) 1.54
(2.33) 1.25
(1.93) 1.38
(2.13) RDF + 30% 1.44
(2.18) 1.53
(2.32) 1.21
(1.88) 1.39
(2.14) Mean 1.37
(2.13) 1.48
(2.29) 1.19
(1.86) 1.33
(2.08) Control 4.85
(6.96) 4.70
(6.80) 4.06
(5.78) 4.25
(6.08) CD at 5%: AFS Fertilizer levels AFS x FLS
0.077 (0.121) 0.141(NS) NS (NS)
*Straw yield (t/ha) is depicted in parenthesis; RDF= Recommended dose of fertilizer (160 kg/ha)
The grain yield (1.48 t/ha, 2.80 t/ha) and straw yield (2.29 t/ha, 4.20 t/ha) of wheat variety HD-2967 was significantly higher than all other wheat varieties in both the systems i.e. Kinnow + Eucalyptus + Wheat and
It is I
LLEGAL t
o cop
y, pri
nt or
save
any c
onten
t of th
is PDF,
in pa
rt or in
full,
on an
y retr
ieval
syste
m,
withou
t the E
XPRESS WRITTEN PERMISSIO
N of th
e cop
yrigh
t-hold
er

National Conference on Climate Change and Agricultural Production: Adapting Crops to Climate Variability and Uncertainty, 6th–8th April, 2017
[182]
Kinnow + Wheat, respectively which indicate that this variety is more shade tolerant (Table 1). Nevertheless, the grain yield and straw yield was observed significantly lesser in wheat variety WH-711 under both the systems. However, it was observed that the variety WH-1105 performed superior in control (devoid of trees) followed by variety HD-2967. The protein content was found highest in all wheat varieties under study in both agri-silvi-horticultural and agri-horticultural systems as compared to sole crop of all wheat varieties under study. Similar results were also recorded for various yield attributing characters. The quantitative reduction in yield and yield attributing parameters of wheat under both agri-silvi-horticultural and agri-horticultural systems may be due to competition for moisture, nutrients and solar radiations amongst the annual and perennial components. However the screening of wheat varieties for higher yield in present study will certainly help in the increase of overall productivity of the system.
REFERENCES [1] Dhyani S K and Handa A K 2013. India needs agroforestry policy urgently: Issues and challenges. Indian Journal of Agroforestry
15 (2): 1-9. [2] Dhillon W S, Chauhan S K, Jabeen N, Singh C and Singh N 2012.Growth performance of intercropping system components and nutrient
status of soil under horti-silviculture system. International Journal of Environment and Resource 1 (1): 31-38.
Periodic Changes in Light Intensity UnderPopulus Deltoides Based Agroforestry System in North-Western India
Chhavi Sirohi*, K.S. Bangarwa and R.S. Dhillon Department of Forestry, CCS Haryana Agricultural University, Hisar–125004, India
*E-mail: [email protected]
Keywords: Agroforestry, Light intensity, Poplar
INTRODUCTION
Agroforestry is emerging as one of the diversification options for farmers in north-western states in India. In the coming years, the tree-based direct needs will exclusively be met from farm forestry or agroforestry and poplar based agroforestry systems, adopted extensively by the farmers on a commercial scale, will play a significant role to meet the economic, social and environmental concerns of the people. Competition for light has been comprehensively studied in a wide range of tropical and temperate agroforestry systems and general models developed at various levels of spatial and temporal disaggregation (Charbonnier et al. 2013). Poplar based agroforestry models whether block or boundary are popular throughout the north-western states in India. Poplar being deciduous in nature is more favourable for winter crops when shading is not a problem and sunlight is available to the under storey crops. This study was undertaken to assess the pattern of light intensity at monthly interval under poplar based agroforestry system.
MATERIALS AND METHODS
The present study was conducted during 2013-14 and 2014-15 in an already established 7 and 8 years poplar plantation spaced at 5 × 4 m, 10 × 2 m and 18 × 2 × 2 m at research farm of CCS Haryana Agricultural University, Hisar (290 09' N latitude and 750 43' E longitude at an elevation of 215 m above mean sea level), situated in the arid region of North-Western India. Light intensity was measured by “Luxmeter” (electronic digital Luxmeter) at crop surface. The reading was taken at monthly interval under agroforestry system and in open area during the study period. The data were recorded at 007, 009, 1100, 1300, 1500 and 1700 hours.
It is I
LLEGAL t
o cop
y, pri
nt or
save
any c
onten
t of th
is PDF,
in pa
rt or in
full,
on an
y retr
ieval
syste
m,
withou
t the E
XPRESS WRITTEN PERMISSIO
N of th
e cop
yrigh
t-hold
er

National Conference on Climate Change and Agricultural Production: Adapting Crops to Climate Variability and Uncertainty, 6th–8th April, 2017
[183]
RESULTS AND DISCUSSION
Among different spacings of poplar plantation, the maximum light intensity (625.9 Lux) was recorded in paired row planting (18 × 2 × 2 m) than 10 × 2 m (513.6 Lux) and 5 × 4 m (327.1 Lux) at 1300 hours (2013-14). The pattern of light intensity under different spacings of poplar were observed in the increasing order from 007 to 1300 hours, however, it was reduced from 1500 to 1700 hours (Table 1). The light intensity received by the sole crop was higher in all the time periods than different spacings of poplar. The interaction effect between spacing and time period were significant. Similar trend of light intensity was also recorded during the year 2014-15. On the basis of these experimental findings, it might be concluded that paired row planting (18 × 2 × 2 m) of poplar was found best for providing maximum sun-light throughout the day followed by 10 × 2 m and 5 × 4 m.
Table 1: Light Intensity (Lux) during Growing Period of Wheat under Different Spacings of Poplar 2013
Spacing (m) Time Period Mean 007 hr 009 hr 1100 hr 1300 hr 1500 hr 1700 hr
5 × 4 25.4 53.5 173.7 327.1 123.7 31.4 122.5 10 × 2 35.6 75.4 307.1 513.6 293.2 56.7 213.6 18 × 2 × 2 60.4 231.1 487.7 625.9 422.4 82.4 318.3 Control 86.5 311.1 586.9 723.2 525.8 176.8 401.7 Mean 52.0 167.8 388.8 547.4 341.3 86.8 C.D. (p=0.05) Spacing: 9.18; Time period: 11.2; Spacing ×Time period: 22.5
2014 5 × 4 22.9 49.6 167.8 321.4 117.6 27.6 117.8 10 × 2 32.0 70.5 299.1 507.7 286.4 50.4 207.7 18 × 2 × 2 54.3 226.2 481.8 619.9 416.6 75.8 312.4 Control 81.4 304.2 577.6 717.3 518.7 170.7 395.0 Mean 47.7 162.6 381.6 541.6 334.8 81.1 C.D. (p=0.05) Spacing: 9.03; Time period: 11.0; Spacing x Time period: 22.1
REFERENCES [1] Charbonnier F, le Maire G, Dreyer E, Casanoves F, Christina M, Dauzat J, Eitel JU, Vaast P, Vierling LA and Roupsard O
2013.Competition for light in heterogeneous canopies: Application of MAESTRA to a coffee (Coffea arabica L.) agroforestry system. Agricultural and Forest Meteorology 18: 152–169.
Effect of Fertilizer and Organic Manures on Growth and Yield Attributes of Wheat and Paddy Variety under Casuarina (Casuarina equisetifolia)
based Agrisilviculture System
Neeraj*, O.P. Rao, Pradyuman Singh, K.S. Bangarwa and Vinita bisht Department of Forestry
N.D. University of Agriculture and Technology, Kumarganj, Faizabad–224229, India E-mail: *[email protected]
Keywords: Rice, Wheat, Organic manure, Agri-silviculture, Casuarina
INTRODUCTION
Agri-silviculture system which is gaining ground in most developing countries, which ensures an intensive utilization of the land. It provides employment means of subsistence to people. This system provides the basic
It is I
LLEGAL t
o cop
y, pri
nt or
save
any c
onten
t of th
is PDF,
in pa
rt or in
full,
on an
y retr
ieval
syste
m,
withou
t the E
XPRESS WRITTEN PERMISSIO
N of th
e cop
yrigh
t-hold
er

National Conference on Climate Change and Agricultural Production: Adapting Crops to Climate Variability and Uncertainty, 6th–8th April, 2017
[184]
requirement of fodder, fuel, pulp and green manure for agricultural crops (Sanchez, 1995). Farmers of our country integrate fast growing trees on their farm land in association with agricultural crops. The higher income from agroforestry unlike monocropping of agricultural crops is a major reason for farmer to plant more trees in association with agricultural crops. The main advantage of planting casuarinas is the fixation of atmospheric nitrogen due to its association with Frankia, in the root nodules, thus enriching the soil with nitrogen. Therefore the present study was undertaken to study the effect of fertilizer and organic manures on growth and yield potential of Wheat and Paddy Variety under Casuarina (Casuarina equisetifolia) based agri-silviculture system on salt affected soil.
MATERIALS AND METHODS
The present study was conducted during 2012-2013 in already established 15 years Casuarina plantation spaced at 10 x 3 m at N. D. University of Agriculture and Technology, Kumarganj, Faizabad (26027' N latitude and 820 12' E longitude at an elevation 113 m above mean sea level).The annual rainfall during 2012-2013 was 1148 mm.Paddy variety- Sarjoo-52 was sown inRBDexperimental design with four replications in 5treatments: T1.Control (Open area) T 2. NPK (120:60:40 kg ha-1) T3. FYM (24 t ha-1) T4.Paddy straw (24 t ha-1) T5. Pressmud (10t ha-1).Paddy crop was estimated in terms of yield parameter (Grains/panicle, test weight (g), grain and straw yield (q/ha) by quadrate method at the time of harvest. Five quadrates of 1 m2 were selected per replication between rows of Casuarina. The paddy crop was raised by following all recommended.
RESULTS AND DISCUSSION
The yield and yield attributing characters of paddy variety Sarjoo-52 exhibited significant differences under different treatments. The number of grains/ panicle, grain yield (q/ha) and straw yield (q/ha) were significantly lesser in T1 –control (open area) under agri-silviculture system due to more shade and competition for moisture and nutrients between annual and perennial plants. The result indicated that the significantly higher number of grains panicle-1 (175), grain yield (38.40 q/ha) and straw yield (55.70 q/ha) in T2 –NPK (120:60:40 kg/ha) under agri-silviculture system, which was significantly superior over other treatments due to maximum amount of inorganic fertilizer was applied in that treatment, whereas the maximum test weight (24.20 g) was inT2 - NPK-(120:60:40), In case of open area higher value was recorded in T2- (24.50 g). But variations were non-significant in both system and open area. The vegetative and reproductive growth was promoted by increasing N rates. The T3, T4 and T5 were statistically at par. In open area, comparatively significantly higher number of grains panicle-1 (179), grain yield (40.70 q/ha) and straw yield (59.40 q/ha) were recorded in T2 –NPK (120:60:40 kg/ha) because no shade and competition for moisture and nutrients between annual and perennial plants. Reduction in yield of paddy crop under system may be because of fact that shade negatively affects grain yield. The reduction in yield depends on the direction of tree line, its composition, height, spacing and also quantity of light intensity. Similar finding was also reported by Sirohi et al. (2012).
REFERENCES [1] Sanchez P A 1995. Science in agroforestry. Agroforestry Systems 30: 5-55. [2] Sirohi C, Rao O P Rana B S 2012. Performance of wheat and paddy intecropped under Casuarina equisetifolia based agri-silviculture
system on sodic wasteland. Indian Journal of Forestry 35 (4):431-434.
It is I
LLEGAL t
o cop
y, pri
nt or
save
any c
onten
t of th
is PDF,
in pa
rt or in
full,
on an
y retr
ieval
syste
m,
withou
t the E
XPRESS WRITTEN PERMISSIO
N of th
e cop
yrigh
t-hold
er

National Conference on Climate Change and Agricultural Production: Adapting Crops to Climate Variability and Uncertainty, 6th–8th April, 2017
[185]
Impact of Integrated Nutrient Management on Soybean (Glycine Max L. Merill) under Temperate Environment Conditions
M.A. Aziz 1*, S.S. Mahdi2, Tahmina Mushtaq3, Tahir Mushtaq4 and Tajamul Islam5 1,3,4Division of Soil Science
1,3,4Sher-e-Kashmir University of Agri. Sciences and Technology of Kashmir, Salimar–1900025, India 2Departmen of Agronomy, Bihar Agricultural University, Sabour–813210, India
5Sher-e-Kashmir University of Agri. Sciences and Tech. of Jammu (SKUAST-J), Jammu–180009, India E-mail: *[email protected]
Keywords: Soybean, Organic and inorganic nutrients, Yield
INTRODUCTION
Soybean, being an important pulse as well as oilseed crop, needs special mention to overcome crisis in edible oil production in the country. It is also called as “Gold of Soil”. The soils although being rich in nutrients but still unfortunately only a small portion of it becomes available to plants especially under temperate climatic conditions. Integration of organic and inorganic sources of nutrients along with bio-fertilizers is found to give higher productivity and monetary returns in soybean (Bhattacharyya et al., 2008). Integrated nutrient management (INM) involves the use of manures, biofertilizers and chemical fertilizers to achieve sustained crop production and maintain better soil health. The present study aimed to assess the impact of INM on soybean and soil health.
MATERIALS AND METHODS
The Field experiment “Effect of integrated nutrient management for soybean (Glycine max (L.) Merill) under temperate conditions” was conducted during kharif seasons of 2009 and 2010 at Krishi Vigyan Kendra, Shuhama, Srinagar, Sher-e-Kashmir University of Agricultural Sciences and Technology of Kashmir. The soil of the experimental field was silty clay loam having pH 7.8 was medium in organic carbon (0.70%), available Phosphorus (15.36kg ha-1), available Potassium (120.62 kg ha-1) and was low in available Nitrogen (125.52 kg ha-1). The experiment was laid out in 3 x 3 x 2 factorial randomized block design with 3 levels of inorganic fertilizer, 3 levels of organic manure and 2 levels of biofertilizers. Chemical fertilizer comprised of three levels C1(50% RD of N, P, K, Zn),C2(75% RD of N, P, K, Zn),C3 (100% RD of N, P, K, Zn). Farmyard manure (0.58% N, 0.34% P, 0.60% K) at the rate of 10 t ha-1 and Dalweed (0.35% N, 0.23% P, 0.40% K) at the rate of 10 t ha-1 were incorporated treatment-wise in the soil 15 days before sowing of seeds.
RESULTS AND DISCUSSION
Application of FYM @ 10 t ha-1 was found superior and recorded the highest (33.02) number of nodules followed by Dalweed and over no manure. Integrated application of inorganic fertilizers along with application of FYM @ 10 t ha-1 and inoculation with Rhizobium and PSB showed significantly superior results over all other treatments. The interaction effect of inorganic fertilizers, organic manures and bio fertilizers in relation to number of nodules/plant was significant. The data pertaining to number of nodules/plant of soybean revealed that with increase in dose of recommended inorganic fertilizers the number of nodules/plant increased significantly.
REFERENCE [1] Bhattacharyya R, Kundu S, Prakash R and Gupta H S 2008.Sustainability under combined application of mineral and organic fertilizers in
a rainfed soybean-wheat `system of the Indian Himalayas. European Journal of Agronomy 28(1): 33-46.
It is I
LLEGAL t
o cop
y, pri
nt or
save
any c
onten
t of th
is PDF,
in pa
rt or in
full,
on an
y retr
ieval
syste
m,
withou
t the E
XPRESS WRITTEN PERMISSIO
N of th
e cop
yrigh
t-hold
er

National Conference on Climate Change and Agricultural Production: Adapting Crops to Climate Variability and Uncertainty, 6th–8th April, 2017
[186]
Effect of Real Time Nitrogen Management on Performance of Rice (Oryza sativa L)
Rama Kant Singh, Pankaj Kumar, S.K. Singh, S.B. Singh and S.K. Sinha Krishi Vigyan Kendra, Katihar, Bihar Agriculture University, Bhagalpur–813210, India
E-mail: *[email protected]
Keywords: Rice, CLCC, Nitrogen
INTRODUCTION
Climate change poses serious threats on crop productivity. Global warming may change growth and development pattern of crop plant, which alters most of the physiological and biochemical processes in plant. As an adaptation strategy, currently recommended cultivation practices, especially fertilizer need to be adjusted suitably according to climate and plant growth. The CLCC determines the suitable time of N application to the rice crop by measuring leaf color intensity which is related to leaf N status; in addition, it also helps in N use efficiency, thus resulting in reasonably high yield; identification of correct threshold values of the CLCC is essential as they differ according to location, season, variety, and rice ecosystem. The experiment was conducted with the main objectives to compare farmers and standard nitrogen fertilizer use practices with the CLCC based method, to improve understanding of farmer’s fertilizer management decisions, to increase nitrogen use efficiency, and to observe the effect of CLCC use on minimizing lodging incidence.
MATERIALS AND METHODS
To study was conducted during at farmer fields of Katihar adopted by Krishi Vigyan Kendra, Katihar under Bihar Agriculture University, Sabour, Bhagalpur. The experiment was laid out in RBD with split plot arrangement in net plot size was 10 m x 10 m having ten replications and three treatments with rice cultivar Sahbhagi. The details of different treatment was T1 – Farmer Practices (80:40: 20:: N:P:K Basal + 50 kg N at 25 DAT+ 50 kg N at 50 DAT), T2 - RDF (Basal 60:60:40 kg N:P:K + 45 kg N at 30 DAT+ 45 kg N at 60 DAT) and T3 – RDF (Basal 60:60:40 NPK + Real Time Application of balance N by using Customised Leaf Colour Chart.The seedlings of rice cultivar Sahbhagi was transplanted on second week of July 2014 after treatment wise applications of basal doses of fertilizers between spacing 20 x 20 cm of spacing. The collected data on different parameters under the experiment were statistically analyzed to obtain the level of significance using the computer MSTAT package program developed by Russel (1986).
RESULTS AND DISCUSSION
The maximum plant height, productive tillers, panicle length, filled kernels, test weight, paddy and straw yield was observed for leaf color chart practice (T3), followed by T2, while minimum was observed for farmer practice (Table 2).Nitrogen fertilization amount had an important role in improving morphophysiological characteristics of rice and N could increase rice leaves and roots growth to prepare an appropriate Leaf Area Index (LAI) to obtain most plant height and grain yield (Barai et al., 2009). Moreover, application of N in splits according to the plant needs in the CLCC practice might be the reason for better rice growth parameters (Salman, 2012; Sathiya and Ramesh, 2009). The CLCC practice of nitrogen application provide the most appropriate dose of N in rice crop which should be applied at plant requirements stages.
It is I
LLEGAL t
o cop
y, pri
nt or
save
any c
onten
t of th
is PDF,
in pa
rt or in
full,
on an
y retr
ieval
syste
m,
withou
t the E
XPRESS WRITTEN PERMISSIO
N of th
e cop
yrigh
t-hold
er

National Conference on Climate Change and Agricultural Production: Adapting Crops to Climate Variability and Uncertainty, 6th–8th April, 2017
[187]
Table 1: Effect of Different Treatments on Physico-chemical Properties of Experimental Soil Treatments pH ECe OC N P K
(1: 2.5) (d Sm-1) (%) Available Nutrients (Kg ha-1)
Initial Final Initial Final Initial Final Initial Final Initial Final Initial Final T1 6.92 6.81 0.24 0.26 0.42 0.41 181.2 162.4 16.8 18.2 238.2 199.4T2 6.95 6.98 0.27 0.31 0.44 0.45 176.4 183.6 16.2 16.5 247.4 212.4T3 6.88 6.91 0.27 0.28 0.45 0.45 185.5 194.2 16.6 15.4 244.5 236.2CD (p=0.05) 0.02 0.04 NS 0.01 0.2 NS 1.2 1.5 NS 0.7 2.11 4.21
Table 2: Effect of Different Treatments on Paddy Yield and Economics Treatments Plant
Height (cm)
Tiller/ Plant
Panicle Length (cm)
Kernels / Plant
Filled Kernel/ Plant
Productive Tillers (m-2)
Test Weight (g)
Paddy Yield
(t ha-1)
Straw Yield
(t ha-1)
BC Ratio
T1 106.00 9.20 23.21 187 145 172.22 14.80 3.69 4.14 2.33 T2 115.00 12.60 26.20 206 178 188.54 15.87 5.32 6.22 2.46 T3 123.00 14.72 32.40 231 202 201.42 17.22 7.06 8.24 2.77
CD (p=0.05) 5.3 1.4 1.5 8.2 12.8 12.4 1.2 1.4 1.2
REFERENCES [1] Barai T.D., Gazanchian A., Pirdashti H.A. and Nasiri M. 2009. Flag leaf morpho-physiological response to different agronomic treatments
in promising line of rice (Oryza sativa L.), American-Eurasian Journal of Agriculture & Environmental Sciences 5 (3): 403-408. [2] Salman D, Morteza S and Dariush Z 2012.Application of nitrogen and silicon rates on morphological and chemical lodging related
characteristics in rice (Oryza sativa L.) at North of Iran. Journal of Agricultural Science 4 (6): 12-18. [3] Sathiya K., and Ramesh T 2009. Effect of split application of nitrogen on growth and yield of aerobic rice. Asian Journal of Experimental
Sciences 23 (1): 303–306.
Establishment of in vitro Micropropagation Protocol for Rose (Rosa x hybrida)
C.V. Raktagandha1, Shyama Kumari1,2*, Kanwar Pal Singh1, Surendra Kumar1, Meenu Kumari1 and Subhashish Sarkhel1,3
1Floriculture and Landscape Architecture, Indian Agricultural Research Institute, New Delhi–110012, India
2Department of Vegetable and Floriculture, 3Department of Pathology, 2,3Bihar Agricultural College, BAU, Sabour–813210, India
E-mail: *[email protected]
Keywords: Rose, Raktagandha, Micropropagation, In vitro regeneration.
INTRODUCTION
As population pressures increase and climate change produces additional production constraints, the challenge is to use plant tissue culture to develop sustainable and durable horticultural production systems from an environmental and human health perspective. Micropropagation procedures have facilitated mass production of good quality plantlets giving a boost to rose floriculture industry. With this background in view, the present study was carried out to standardize the suitable protocol for rapid in vitro propagationof rosecv. Raktagandha.
MATERIALS AND METHODS
The experiment was conducted at the division of Floriculture and Landscape Architecture, IARI, New Delhi during 2011-12.Axillary buds were used for experiment. The explants were washed with Teepol solution after
It is I
LLEGAL t
o cop
y, pri
nt or
save
any c
onten
t of th
is PDF,
in pa
rt or in
full,
on an
y retr
ieval
syste
m,
withou
t the E
XPRESS WRITTEN PERMISSIO
N of th
e cop
yrigh
t-hold
er

National Conference on Climate Change and Agricultural Production: Adapting Crops to Climate Variability and Uncertainty, 6th–8th April, 2017
[188]
that treated with different chemicals such as: (i) carbendazim, 8-HQC, diathane M-45 along with control (distilled water) for 3 h. The pre-treated explants were surface-sterilized with HgCl2. Then explants were cultured on MS medium with BAP, NAA and GA3 to find out the best treatment combination for culture establishment and shoot proliferation. The individual micro-shoots were transferred onto elongation media. Elongated shoots were then transferred to rooting media and were acclimatized. The data was analyzed employing completely randomized design (CRD) and data was subjected to Arc Sin √% transformation.
RESULTS AND CONCLUSIONS
Out of different pre-treatments of explants tried, the highest explant survival (78.05 %) was with carbendazim (0.2%) + diathane M-45 (0.2%) + 8-HQC (200 mg/l) for 3 h on a horizontal shaker (120 rpm). Sucrose concentration of 30 g/l in the medium seems to be optimal for in vitro shoot multiplication. Murashige and Skoog medium supplemented with 4.0 mg /l BAP + 0.1 mg/l NAA + 0.5 mg/l GA3 (Table 1) was most effective for culture establishment and shoot proliferation with highest number of micro-shoots (4.62 shoots / explants). Rooting of micro-shoots was induced on half-strength MS basal medium supplemented with NAA (0.5 mg/l) + IBA (0.5 mg/l). The regenerated plantlets were efficiently hardened in glass jars filled with vermiculite + agropeat (1:2) moistened with half-strength MS medium salts and covered with polypropylene lids, thereafter plants were successfully transferred to the glasshouse with good survival. Hence, this regeneration protocol could be used to obtain large number of quality plantlets from this valuable flower plant.
Table 1: Effect of Growth Regulators on in vitro Explant Survival and Bud Sprouting in Hybrid Tea Rose cv. Raktagandha (RG)
Treatments Explant Survival (%) Bud Sprouting (%) Days to Bud Sprouting
MS + No hormone (control) 37.32 (37.67) 31.97 (34.45) 11.13 MS + BAP (3mg/l) + NAA (0.1mg/l) + GA3 (0.3mg/l) 61.38 (51.60) 54.27 (47.48) 9.12 MS + BAP (3mg/l) + NAA (0.1mg/l) + GA3 (0.5mg/l) 71.66 (57.86) 63.73 (53.00) 7.41 MS + BAP (3.5mg/l) + NAA (0.1mg/l) + GA3 (0.3mg/l) 71.11 (57.52) 72.40 (58.34) 6.79 MS + BAP (4.0mg/l) + NAA (0.1mg/l) + GA3 (0.5mg/l) 79.55 (63.15) 73.60 (59.1) 6.65 CD (p=0.05) 2.72 1.21 0.51
The value given in parentheses denote the arcsin √% values
REFERENCE [1] Ozel C A and Arslan O 2006.Efficient micropropagation of English Rose “Heritage” under In vitro conditions. International Journal of
Agricultural& Biological Sciences 8: 626-629.
Diversity of Energy Plant Species: Key Driver for Sustainable Biofuel Production in India
Mukul Kumar1* and Prasann Kumar2
1Department of Botany and Plant Physiology, M.B.A.C., Agwanpur–852202, Saharsa, India 2Department of Plant Physiology, I.A.S., B.H.U., Varanasi–221005, India
E-mail: *[email protected]
Keywords: Biofuel, Diversity, Energy, Forest, Jatropha, Premna Benghalensis
Among the renewable energy sources, biofuels are gaining consequences and there had been technically progress in developing biofuels from various sources. The congregation on biodiversity has accredited the concerns of biofuel production on biodiversity and recommended scientific research to assess the positive as
It is I
LLEGAL t
o cop
y, pri
nt or
save
any c
onten
t of th
is PDF,
in pa
rt or in
full,
on an
y retr
ieval
syste
m,
withou
t the E
XPRESS WRITTEN PERMISSIO
N of th
e cop
yrigh
t-hold
er

National Conference on Climate Change and Agricultural Production: Adapting Crops to Climate Variability and Uncertainty, 6th–8th April, 2017
[189]
well as negative impacts of biofuels production on biodiversity. Indeed, almost all kinds of trees and shrubs are used as fuel wood. Forest Survey of India, Ministry of Environment and Forest, Dehra Dun, India; planted both exotic and indigenous tree species under social forestry programme without having exact information about their energy status. Energy plantation with fast growing tree species can not only supply fuel wood, but on a commercial basis of production, it can create rural employment also. Fast growing tree species which can be used in a rotation of 3-4 years is useful in energy plantation for power generation. Many scientists reported some local grown trees species of North-East India for fuel wood quality and these plants are Machilus bombycina, Castanopsis indica, Litsea monopetala, Litsea glutinosa, Lagerstroemia specicisa, Derris indica and Cassia fistula. (Koh, 2007). Jatropha grows wild in many areas of India and even thrives on infertile soil. A good crop can be obtained with little effort. Depending on soil quality and rainfall, oil can be extracted from the Jatropha nut after two to five years. The annual nut yield ranged from 0.5 to 1.2 tons per hectare. (Fargione, et al., 2008). The kernel consists of oil to about 60%; it can be transformed into bio-diesel fuel through esterification. Recently workers reported fuel wood characterization of some indigenously grown tree species of North-East India. They reported that Albizia lucida, Syzygium fruticosum, Pterospermum lanceaefolium and Premna benghalensis are some of the indigenous tree species, which can be recommended for energy tree plantation. (Kumar P and Dwivedi P, 2011). The aquatic duck weed (Lemna gibba), buffalo grass (Buchloe dactyloides) and switch grass have been identified as a potential source of biofuel because their growth rate is fast, they contain high amount of cellulose and hemi-cellulose and can yield large amount of dry mass.
REFERENCES [1] Fargione J, Hill J, Tilman D, Polasky S, Hawthorne P and Jason 2008. Land cleaning and the biofuel carbon department of Science319:
1235-1238. [2] Koh L P 2007. Potential habitat and biodiversity losses from intensified biodiesel feedstock production.Conservation. Biology21: 1373-
1375. [3] Kumar P and Dwivedi P 2011. Land Use Policy is the Key Driver for Biodiversity Management. International Journal of Agricultural and
Environmental Biotechnology 4: 291-297.
Dynamics of Microbial Communities in Metal Polluted Areas of Heterogeneous Environments: An Overview
Prasann Kumar Department of Plant Physiology,
Institute of Agricultural Sciences, Banaras Hindu University, Varanasi–221005, India E-mail: [email protected]
Keywords: Abiotic, biological, Communities, Microorganism
Species are the fundamental taxonomic units of biological classification and are considered to be the units for measuring biodiversity. Microorganisms are chosen as ‘test organisms’ because they are present in high amounts in all kinds of habitats and play key roles in food webs and nutrient cycles. Also, their high surface to volume ratio, their intimate contact and interaction with the environment suggest that microorganisms are very sensitive and respond quickly to environmental stress. Microorganisms have been found to be sensitive to different types of pollution, antibiotics, xenobiotics, PAHs, radioactive fall outs, agricultural runoff, sewage/sludge, heavy metals and other sources. Investigations have shown that the numbers and the diversity of bacterial communities can decrease as a response to pollution and the remaining bacterial communities can have genetic and physiological characteristics differing from reference communities. There are studies where microbial communities have been investigated to assess effects of heavy metals (Kumar et
It is I
LLEGAL t
o cop
y, pri
nt or
save
any c
onten
t of th
is PDF,
in pa
rt or in
full,
on an
y retr
ieval
syste
m,
withou
t the E
XPRESS WRITTEN PERMISSIO
N of th
e cop
yrigh
t-hold
er

National Conference on Climate Change and Agricultural Production: Adapting Crops to Climate Variability and Uncertainty, 6th–8th April, 2017
[190]
al., 2011). Several heavy metals such as copper, zinc and iron are essential for the physiological functioning of living organisms; however, they all become toxic at high concentrations. The toxicity of a metal depends on the metal itself, its total concentration, the availability of the metal to the organism, and on the organism itself. Depending on the organism and the metal, different modes of action are recognized: binding to macromolecules (Proteins, DNA and RNA), disruption of enzymatic functions, catalisation of radical formation etc. Copper is, for example, an essential element, yet toxic to cells in high concentration (Seaward et al., 1990). It can damage biomolecules by radical formation and consequently, the intracellular copper needs to be carefully controlled. Therefore, it is important to develop techniques to determine the risk of heavy metals to ecosystems. Also, few studies have been conducted in moderately metal-contaminated ecosystems. However, discrimination between effects of heavy metals and the impact of natural soil and sediment properties on microbial communities is still a challenge. So on the basis of above discussion this paper respect the fact that microorganism can play as a tool for cure to those area which are highly affected with heavy metal i.e., hazardous waste site or cultivate crop land. It also supports the facts that only remediation through engineered plant called phytoremediation will be disabled if it is not supported by the microbes.
REFERENCES [1] Kumar P, Mandal B. and Dwivedi P. 2011. Heavy metal scavanging capacity of Menthaspicata and Alliumcepa. Medicinal Plant-
Intlernational Journal Phytomedical Related Industry 3(4): 315-318. [2] Seaward MRD, and Richardson DHS 1990. Atmospheric sources of metal pollution and effects on vegetation. Heavy metal tolerance in
plants: Evolutionary Aspects. CRC Press Inc, Boca Raton, Florida, pp 75-92.
Novel Molecular Screening Tools for Analysis of Free-Living Diazotroph in Soil
Saurabh Kumar Choudhary1 and Prasann Kumar2* 1Department of Agronomy, Bihar Agricultural University, Sabour–813210, India
2Department of Plant Physiology, Institute of Agricultural Sciences, Banaras Hindu University, Varanasi–221005, India
E-mail: *[email protected]
Keywords: Amplify, Molecular Screening, Soil, Diazotroph, PCR
Molecular methods founded on widespread PCR finding of the nifH marker gene have been positively applied to define Diazotroph population in the atmosphere. However, the use of highly degenerate primers and low-stringency amplification conditions render these methods prone to amplification bias, while less decadent primer sets will not amplify all nifH genes. Burgmann et al. 2004, have developed a fixed primer site approach with six PCR protocols using less degenerate to nondegenerate primer sets that all amplify the same nifH fragment as a PCR protocol for universal amplification. These procedures target different groups of Diazotroph and allowed for direct comparison of the PCR products by use of restriction fragment length polymorphism fingerprinting. The new protocols were optimized on DNA from 14 reference strains and were subsequently tested with bulk DNA extracts from six soils. Scientist reported that these analyses revealedthat new PCR primer sets amplified nifH sequences that were not detected by the universal primer set. Furthermore, the scientist of this paper concludes that they were better suited to distinguish between Diazotroph populations in the different soils. As we are the men of heavy metal toxicity, so these techniques can also be applied for the Diazotroph population grown at contaminated site of heavy metal toxicity (Kumar, 2011).
It is I
LLEGAL t
o cop
y, pri
nt or
save
any c
onten
t of th
is PDF,
in pa
rt or in
full,
on an
y retr
ieval
syste
m,
withou
t the E
XPRESS WRITTEN PERMISSIO
N of th
e cop
yrigh
t-hold
er
National Conference on Climate Change and Agricultural Production: Adapting Crops to Climate Variability and Uncertainty, 6th–8th April, 2017
[191]
REFERENCES [1] Burgmann H. Widmer F., Sigler WV, Zeyer J. 2004. New Molecular Screening Tools for analysis of Free Living Diazotropha in soil.
Applied and Environmental Microbiology 70:240-247. [2] Kumar P, Mandal B and Dwivedi P. 2011. Screening plant species for their capacity of scavenging heavy metals from soils and sludges.
Journalof Applied Horticulture 3 (2): 144-146.
Influence of Different Establishment Methods and Sources of Nitrogen on Productivity of Rice (Oryza sativa L.)
Md. Naiyar Ali1,2*, P.C. Pandey1, Akhilesh Sah2, Tajwar Izhar2 and A.B. Kujur2 1Department of Agronomy, College of Agriculture,
G.B. Pant University of Agriculture & Technology, Pantnagar–263145, India 2Department of Agronomy, BAU, Ranchi–834006, Jharkhand
E-mail: *[email protected]
Keywords: Aerobic rice, SRI, Conventional transplanting, Grain yield
INTRODUCTION
Increasing water scarcity is becoming real threat for rice cultivation. Hence water saving technology which also maintains soil health and sustainability and as well as economically beneficial needs to be developed. The SRI is a new methodology for increasing the productivity of irrigated rice by changing the management of plants, soil, water and nutrients resulting in both healthy soil and plants. The objective of study were to evaluate the establishment methods and effect of sources of nitrogen on rice
MATERIALS AND METHODS
Field experiments were carried out at A-2 block of N.E. Borlaug Crop Research Centre, G.B. Pant University of Agriculture and Technology, Pantnagar, District U.S. Nagar, Uttarakhand, India during 2010-11. The experiment consisted of twelve treatment combinations with three rice establishment methods viz., Conventional Transplanting (CT), System of Rice Intensification (SRI) and Direct seeded Aerobic rice (DSR) in main plots, and four nutrient resources in sub plots replicated four times was laid out in split plot design. The crop was uniformly fertilized with 120-60-40 kg N-P-K/ha and 25 kg ZnSO4/ha in N120 (urea), 60kg N (from urea and FYM) and entire amount of phosphorus, potassium and ZnSO4 was applied uniformly as basal dose before puddling and incorporated thoroughly into the soil with the help of a spade. The remaining 60kg N was top-dressed in two equal installments the first (30kg N) at active tillering and the second (30kg N) at panicle initiation stage. Five random plants were sampled from each plot for growth and yield attributes. Chlorophyll content of leaf was recorded at 90 DAT with the help of SPAD meter (Minolta, Japan). For this, 30 shoots were randomly selected from each plot and SPAD Value will be recorded from the middle of the fully top most leaf of each selected shoot. The area of leaves of five plants was measured with the help of leaf area meter (Model 3100, USA). Chlorophyll content of leaf was recorded at30, 60 90 DAT/DAS with the help of SPAD meter (Minolta, Japan).
RESULTS AND DISCUSSION
Significantly higher chlorophyll content, root volume hill-1, shoot dry matter-2 and yield attributes were noticed in SRI compared to conventional transplanting and aerobic during both the years. N75FYM+ N45 (Urea) caused significantly more, root volume hill-1, chlorophyll content, shoot dry matter and yield attributes compared to remaining INM treatments and N100(Urea) during both the years but being at par with N50
It is I
LLEGAL t
o cop
y, pri
nt or
save
any c
onten
t of th
is PDF,
in pa
rt or in
full,
on an
y retr
ieval
syste
m,
withou
t the E
XPRESS WRITTEN PERMISSIO
N of th
e cop
yrigh
t-hold
er

National Conference on Climate Change and Agricultural Production: Adapting Crops to Climate Variability and Uncertainty, 6th–8th April, 2017
[192]
(FYM) + N70 (Urea). In SRI, 9.8% (in 2010) and 14.0 % in 2011 increase in grain yield was noticed as compared to conventional transplanting. Among the nutrient sources significantly highest grain yield (5.02and 5.32 t ha-1) was noticed due to N75(FYM) + N45 (urea) during both the years as compared to N25(FYM)+ N95(Urea) and N100(Urea) but at par with N25 (FYM)+ N95(Urea). Almost similar results were obtained by Velliangiri et al. (2011).The SRI recorded significantly higher available NPK as compared to aerobic and conventional transplanting. The highest amount of available NPK were found due to application of N75 (FYM) +N45 (Urea) which was significantly superior to N (Urea). SRI provided perceptible gains in productivity over conventional method. Integrated nutrient management comprising of 75 kg N through FYM + 45 kg N through urea/ha under SRI seems to be the viable option to realize higher yields.
REFERENCE [1] Velliangiri G, Thanakkan R, Azhagu P and Lakshmanan 2011. Agronomic evaluation of rice cultivation systems for water and grain
Productivity. Archives of Agronomy and Soil Science 57 (2):159–166.
Response of Nitrogen Management Practices on Productivity of Various Varieties of Late Sown Wheat (Triticum aestivum L.)
Abhinav Kumar1*, R.A. Singh2 and Neha Sharma1
1Dept. of Agronomy, Institute of Agricultural Sciences, BHU, Varanasi–221 005, India 2Dept. of Agronomy, Narendra Deva University of Agriculture & Technology, Faizabad–224229, India
E-mail: *[email protected]
Keywords: Nitrogen management, Triticum aestivum, Late sown wheat
INTRODUCTION
Balanced fertilizer through organic and inorganic sources improves the soil health as well as boost the productivity of wheat. Organic matter is the substrate for a large number of soil living beneficial organisms which are essential to keep the plant healthy. The soil which is enriched in organic matter has been found to respond better to the application of nitrogenous fertilizers (Subbiah and Bajaj, 1968). Different varieties under late sown condition respond variably to various nitrogen management practices.
MATERIALS AND METHODS
The field experiment was carried out at Narendra Deva University of Agriculture & Technology, Narendra Nagar (Kumarganj), Faizabad during Rabi season of 2012-13 with the objective to study the response of late sown wheat varieties to different nitrogen management practices. There were twenty treatments consisted of five doses of nitrogen (90 kg N ha-1, 120 kg N ha-1, 90 kg N ha-1 + 25% N through FYM, 120 kg N ha-1 + 25% N through FYM, 150 kg N ha-1) and four varieties of wheat (HUW-234, HP-1633, NW-1014 and Raj-3077).The experiment was conducted in Randomized Block Design (R.B.D.) factorial with three replications on silt loam soil having low organic carbon (0.38%), nitrogen (203 kg ha-1), medium in phosphorus (15.25 kg ha-1) and potassium (265 kg ha-1).
RESULTS AND DISCUSSION
The growth characters like plant height, dry matter accumulation, number of tillers, leaf area index were significantly higher under 120 kg N ha-1 + 25% N through FYM being at par with 150 kg N ha-1 over rest of
It is I
LLEGAL t
o cop
y, pri
nt or
save
any c
onten
t of th
is PDF,
in pa
rt or in
full,
on an
y retr
ieval
syste
m,
withou
t the E
XPRESS WRITTEN PERMISSIO
N of th
e cop
yrigh
t-hold
er

National Conference on Climate Change and Agricultural Production: Adapting Crops to Climate Variability and Uncertainty, 6th–8th April, 2017
[193]
the levels and among the varieties HUW-234 was at par with NW-1014 while significantly superior over HP-1633 and Raj-3077. The yield components like number of ears per meter row length, ear length (cm), number of grain ear-1, grain weight ear-1(g), grain yield (kg ha-1), straw yield (kg ha-1) and nitrogen uptake at harvest (kg ha-1) were maximum under 120 kg N ha-1 + 25% N through FYM and among the varieties HUW-234 being at par with NW-1014. Harvest index and 1000-grain weight (g) were not influenced significantly due to nitrogen management practices and varieties. The maximum net return (Rs. 75894.50 ha-1) was obtained at 120 kg N ha-1 + 25% N through FYM with HUW-234 and B:C ratio 1.59 was computed with the same variety HUW-234 at 120 kg N ha-1 + 25% N through FYM. Thus, it may be concluded that nitrogen management practice of 120 kg N ha-1 + 25% N through FYM proved as the most suitable practice for exploitation of the yield potential of late sown wheat. Among the varieties HUW-234 and NW-1014 were found most suitable for cultivation under late sown condition for achieving higher yield and economics.
Table 1: Effect of Different Treatments on Yield Contributing Characters of Wheat Treatments Number of
Ears per Meter Row Length
Ear Length (cm)
Number of Grains Ear-1
Grain Weight ear-1 (g)
Test Weight (1000-Grain Weight)
(A) Varieties HUW-234 64.04 8.83 38.84 1.48 37.94 HP-1633 57.94 7.97 35.16 1.33 37.84 NW-1014 62.20 8.56 37.74 1.43 37.89 Raj-3077 59.80 8.23 36.25 1.37 37.79 CD (P=0.05) 3.03 0.47 1.83 0.10 NS
(B) Nitrogen Management Levels 90 kg N ha-1 56.73 7.80 34.43 1.25 36.33 120 kg N ha-1 58.55 8.06 35.50 1.31 36.93 90 kg N ha-1 + 25% N through FYM
61.60 8.48 37.35 1.43 38.33
120 kg N ha-1 + 25% N through FYM
65.28 9.00 39.60 1.55 39.03
150 kg N ha-1 62.83 8.65 38.11 1.47 38.73 CD (P=0.05) 3.39 0.52 2.05 0.11 2.00
Table 2: Effect of Different Treatments on Grain Yield, Straw Yield and Harvest Index
Treatment Grain Yield (q ha-1)
Straw Yield (q ha-1)
Harvest Index (%)
(A) Varieties HUW-234 33.93 44.66 43.12 HP-1633 30.02 40.23 42.69 NW-1014 32.12 43.64 42.24 Raj-3077 29.26 40.59 41.83 CD (P=0.05) 1.50 2.39 NS
(B) Nitrogen Management Levels
90 kg N ha-1 24.65 34.24 41.85 120 kg N ha-1 27.43 36.83 42.53 90 kg N ha-1 + 25% N through FYM
31.30 42.92 42.14
120 kg N ha-1 + 25% N through FYM
31.30 42.92 43.02
150 kg N ha-1 37.31 49.51 42.80 CD (P=0.05) 1.67 2.67 NS
REFERENCE [1] Subbiah B V and Bajaj J C 1968. Association of certain soil factors with higher paddy yields. Journal of Indian Society of Soil Science
16 (3):297-300.
It is I
LLEGAL t
o cop
y, pri
nt or
save
any c
onten
t of th
is PDF,
in pa
rt or in
full,
on an
y retr
ieval
syste
m,
withou
t the E
XPRESS WRITTEN PERMISSIO
N of th
e cop
yrigh
t-hold
er

National Conference on Climate Change and Agricultural Production: Adapting Crops to Climate Variability and Uncertainty, 6th–8th April, 2017
[194]
Effects of Land Use on Soil Properties of Banka District, Bihar
Amarjeet Kumar1*, Yanendra Kumar Singh1, Rajeev Padbhushan1, Anshuman Kohli1, Akhilesh Sah3, Mainak Ghosh2, Bipin Bihari1 and Samrat Adhikary1
1Department of Soil Science and Agricultural Chemistry, 2Department of Agronomy, 1,2Bihar Agricultural University, Sabour, Bhagalpur–813210, India
3Department of Agronomy, Birsa Agricultural University, Ranchi–834006, India E-mail: *[email protected]
Keywords: Land use change, Agricultural intensification, Nutrient mining, Dry land
INTRODUCTION
Land use is understood as a part of a land which is managed or used by humans for their long-term sustainability on earth. It influences the basic resources within the landscape, including the soil resources that are directly related to the subsistence. It plays as one of the main driving force to deal with many processes of the environmental change. Poor soil management directly threat to the soil environment and require ameliorative measures for their maintaining natural conditions. Knowledge and understanding of soil properties ensures remediation or reclamation of damaged soils. Agricultural sustainability requires periodic evaluation of soil fertility status which is important in understanding the factors that impose serious constraints to crop production (Chimdi et al., 2012). Keeping in view the above fact an attempt was made to verify the impact of different land use on soil nutrient status in the Banka district.
MATERIALS AND METHODS
The study was targeted for Banka district which is located in South Bihar Alluvial Plain Zone i.e. the Agro-climatic Zone IIIA hot sub-humid climatic condition of Bihar in the year 2014-15. Geographic coordinates of the districtare Latitude ranges from 24° 45'48.5" to 24°58' 46.8" N, Longitude ranges from 86° 53' 74.8" to 86° 57' 69.2"E and Altitude ranges 50 to 140 m respectively. Four major land use types namely forest, grazing land, cultivated and orchards land were identified for this study. Triplicate soil sample from two depths 0-15 and 15-30 cm were collected from representative sites of each land use types with three replications and then air dried ground and passed through a 2 mm sieve to determine soil properties. Determination of available nitrogen by alkaline potassium permanganate method, available phosphorus (P) was extracted by the molybdenum blue method. Available K were determined by flame photometer after extracting the soil with neutral normal ammonium acetate and available micronutrient (Mn, Fe, Cu and Zn) was determined by DTPA extraction method. Statistical difference in soil characteristics among land use types was analyzed and represented by bar diagram and standard error at 0.05. Pearson correlation analysis was employed to assess mean difference and the association between soil variables.
RESULTS AND DISCUSSION
The result of the study showed that the impact of land use on soil pH in surface (0-15cm) and subsurface (15-30 cm) soil of Banka district of Bihar. Most of the soil was slightly acidic to normal in nature. In surface soil, the maximum pH was recorded in cultivated land use (6.20) followed by orchard land (6.13), forest land (5.87) and the lowest in grazing land (5.86) whereas in subsurface soil the highest pH was observed in cultivated land (6.35) followed by orchard land (6.02), grazing land (5.86) and the lowest in forest land (5.81). Light textured soil and heavy rainfall during rainy season results in leaching of bases and consequently lowering the pH of forest soil. Continued application of fertilizer, irrigation and other agronomic
It is I
LLEGAL t
o cop
y, pri
nt or
save
any c
onten
t of th
is PDF,
in pa
rt or in
full,
on an
y retr
ieval
syste
m,
withou
t the E
XPRESS WRITTEN PERMISSIO
N of th
e cop
yrigh
t-hold
er

National Conference on Climate Change and Agricultural Production: Adapting Crops to Climate Variability and Uncertainty, 6th–8th April, 2017
[195]
practices in cultivated soil resulted in higher soil pH in comparison to other land uses. Similar results were reported by Sharma et al. (2014) in Himalaya’s foothill. Soil organic carbon as influenced by land use in surface and subsurface soil in Banka district. In plough layer soil, SOC was noted descending order 0.75, 0.51, 0.45 and 0.39 percent respectively in forest land use followed by orchard, grazing and cultivated land while in subsurface soil the more SOC was observed in forest land (0.46 %) followed by orchard and grazing land (0.33 %) and the minimum in cultivated land (0.29 %). Maximum soil organic carbon content was observed forest soil that may be due to continuous leaf fall and growing of grasses on the surface layer of soil. The continued tillage operation year after year, less use of organic matter and turning over of soil has resulted in decrease of organic carbon content in cultivated soil
REFERENCES [1] Chimdi A, Heluf G, Kibebew K and Abi T 2012. Status of selected physicochemical properties of soils under different land use systems of
Western Oromia, Ethiopia. Journal of Biodiversity and Environmental Sciences 2(3): 57-71. [2] Sharma V, Hussain S, Sharma K R and Arya V M 2014. Labile carbon pools and soil organic carbon stocks in the foothill Himalayas
under different land use systems. Geoderma 232–234: 81-87.
Bio-Efficacy of Sequential Application of Herbicides in Direct Seeded Rice (Oryza sativa)
Ajay Singh*, D.P. Nandal and S.S. Punia Department of Agronomy, CCS Haryana Agricultural University, Hisar–125004, India
E-mail: *[email protected]
Keywords: Weed control efficiency, Direct seeded rice, Grain yield
INTRODUCTION
In India, rice is commonly grown by transplanting seedlings into puddled soil. But, repeated puddling adversely affects soil physical properties. Moreover, puddling and transplanting require large amount of water and labour. All these factors demand a major shift from puddle-transplanted rice to direct seeding of rice which requires less water, labour and capital input. But weed control is major limitation for the success of DSR (Chauhan, 2012). Success of DSR depends largely on weed control especially with chemical methods. Therefore, application of several herbicides in sequence can be more useful (Chauhan and Yadav, 2013).
MATERIALS AND METHODS
The study was conducted during the kharif 2012 at College Farm of Agriculture, Kaul Campus, CCS Haryana Agricultural University with 14 treatments and replicated thrice in randomized complete block design. Two pre emergence herbicides pendimethalin 1000 g/ha and oxadiargyl 100 g/ha in combinations with four post emergence herbicides namely bispyribac sodium 25 g/ha, fenoxaprop-p-ethyl 67 g/ha, ethoxysulfuron 18.75 g/ha and ready mix of chlorimuron ethyl and metsulfuron methyl 4/ha. Rice variety PUSA 1121 was seeded on 19th June 2012 in rows 22.5 cm apart using seed drill. Weed density (no. /m2) were recorded species wise in each plot using quadrate of 50 × 50 cm (0.25 m2) from the area selected randomly for observations.
RESULTS AND DISCUSSION
Weed flora of the experimental field was mainly dominated by Cyperusdifformis, Cyperusrotundus, Leptochloachinensis, Echinochloaglabrescens, Eclipta alba and Ammaniaspp. All the treatments recorded significant reduction in the density of weeds compared to weedy check. Among all herbicidal treatment,
It is I
LLEGAL t
o cop
y, pri
nt or
save
any c
onten
t of th
is PDF,
in pa
rt or in
full,
on an
y retr
ieval
syste
m,
withou
t the E
XPRESS WRITTEN PERMISSIO
N of th
e cop
yrigh
t-hold
er

National Conference on Climate Change and Agricultural Production: Adapting Crops to Climate Variability and Uncertainty, 6th–8th April, 2017
[196]
sequential application of pendimethalin 1000 g/hafbbispyribac sodium 25 g/ha and metsulfuron methyl + chlorimuron ethyl 4 g/ha gave minimum density of Echinochloaglabrescens, Cyperus spp. and Ammaniaspp. However, the minimum density of Leptochloachinensis was reported with herbicidal combination of pendimethalin 1000 g/ha as pre emergence fb fenoxaprop 67 g/ha. All the treatments produced significantly higher number of effective tillers, higher grain and straw yield than weedy check. Weed free treatment recorded highest number of effective tillers (210), grain yield (4.12 t/ha) and straw yield (5.97 t/ha). Among all herbicidal treatment, sequential application of pendimethalin 1000 g/hafbbispyribac sodium 25 g/ha and metsulfuron methyl + chlorimuron ethyl 4 g/ha produced minimum weed density at 45 DAS, highest number of effective tillers (209.3), grain yield (3.97 t/ha) and straw yield (5.75 t/ha) which was at par with weed free.
REFERENCES [1] Chauhan B S 2012. Weed ecology and weed management strategies for dry-seeded rice in Asia. Weed Technology 26: 1-13. [2] Chauhan B.S. and Yadav A 2013. Weed management approaches for dry-seeded rice in India: a review. Indian Journal of
Weed Science 45 (1): 1-6.
Determination of Critical Limits of Available Phosphorus for Indian Mustard (Brassica juncea L.) in Vijaypur Soil of Jammu Region
by Linear Response Plateau Model
M. Nayeem Sofi* and Sanjay Swami Division of Soil Science and Agricultural Chemistry,
Sher-e-Kashmir University of Agricultural Sciences and Technology of Jammu Main Campus–180009, India E-mail: *[email protected]
Keywords: Indian mustard, Dry matter yield, Available phosphorus, Critical limits.
INTRODUCTION
Phosphorus (P) is among the principle elements required for crop growth. It plays a key role in photosynthesis, metabolism of sugars, energy storage and transfer, cell division, cell enlargement and transfer of genetic information. Application of P not only affect its own absorption and assimilation in plants but also influence a number of other essential as well as non essential elements present in the soil. Increase in yield brought by P application is significant and economically viable owing to its wide spread deficiency in soils of India in general and particularly in Jammu and Kashmir (J&K) Hasan (1996). Several soil test methods have been developed to evaluate the available phosphorus status of soils for predicting the response of applied phosphorus and to establish its critical limits for various crops.
MATERIALS AND METHODS
Bulk surface soil samples (0 to 15 cm depth), extremely deficit in available phosphorus, were collected from selected mustard growing location. The soil sample were air dried and grounded to pass through 2 mm stainless steel sieve to remove gravels and crop residues. The processed soils were thoroughly mixed and stored in polyethylene lined gunny bags for conducting pot culture experiment. Sample of the processed soil was brought to the laboratory for analysis. Ten levels of phosphorus at the rate of 0, 10, 20, 30, 40, 50, 60, 70, 80 and 100 mg P kg-1 soil. The phosphorus treated soils were incubated in pots at field capacity for 28 days. A representative sample of soil was drawn from each treatment for the analysis of available phosphorus
It is I
LLEGAL t
o cop
y, pri
nt or
save
any c
onten
t of th
is PDF,
in pa
rt or in
full,
on an
y retr
ieval
syste
m,
withou
t the E
XPRESS WRITTEN PERMISSIO
N of th
e cop
yrigh
t-hold
er

National Conference on Climate Change and Agricultural Production: Adapting Crops to Climate Variability and Uncertainty, 6th–8th April, 2017
[197]
by Olsen (Olsen et al., 1954) soil test method. Indian mustard (Brassica juncea L.) (cv. RSPR-03) was raised as a test crop. The critical limits of available P were established by using linear response plateau (LRP) model as described by Waugh et al. (1973).
RESULTS AND DISCUSSION
There were significant relationship between dry matter yield and available P determined by different soil tests as well as between P uptake and available P. Out of the five methods tested. Olsen’s method gave the highest correlation coefficients values with dry matter and P uptake by Indian mustard crop in Vijaypur. The linear response and plateau lines were established and the point of intersection was used to determine the critical limits of available P. Hence, the critical limits of available P for Indian mustard (Cv.RSPR-03) were established as by Olsen soil test for Vijaypur with the help of these critical limits (Fig.1). One can determine the area of probable deficiency for available P in soils. The present investigation indicated that below 10 kg P ha-1 by Olsen soil test method, farmer may get definite response to application of P in Vijaypur soil, and above these critical limits, farmer may get very little response or may not get response at all. Therefore, the farmers will have to apply higher P fertilizer doses in these soils for obtaining the optimum yield of Indian mustard crop.
Fig. 1: Determination of Critical Limit of Available Phosphorus (Olsen Method) for Indian Mustard (Cv. RSPR-03) in Vijay Pur Soil of Jammu Region by Linear Response Plateau (LRP) Model
REFERENCES [1] Hasan R. 1996. Phosphorus status of soils in India. Better crops International 2 (10): 4-5. [2] Olsen S.R., Cole C.V., Watanabe F.S. and Dean L.A. 1954. Estimation of available P in soil by extraction with sodium bicarbonate.
U.S.D.A. Circular 939. [3] Waugh D.L, Cate R.B Jr. and Nelson L.A. 1973. Discontinuous models for rapid correlation, interpretation and utilization of soil analysis
and fertilizer response data. Tech. Bull. No.7, ISFEL series, North Carolina State University Releigh, W.C. Ltd., Calgary, Alberta, 325-374.
It is I
LLEGAL t
o cop
y, pri
nt or
save
any c
onten
t of th
is PDF,
in pa
rt or in
full,
on an
y retr
ieval
syste
m,
withou
t the E
XPRESS WRITTEN PERMISSIO
N of th
e cop
yrigh
t-hold
er

National Conference on Climate Change and Agricultural Production: Adapting Crops to Climate Variability and Uncertainty, 6th–8th April, 2017
[198]
Optimizing Rate of Fluchloridone 20% CS Herbicide in Sunflower
R.K. Singh and Vishal Tyagi* Department of Agronomy, Institute of Agricultural Sciences,
Banaras Hindu University, Varanasi–221005, India E-mail: *[email protected]
Keywords: Flurochloridon, Hand weeding, Weedy check
INTRODUCTION
Sunflower (Helianthus annuus) is an important oil seed crop of India. Despite higher yield potential average productivity of sunflower is very low (752 kg/ha), due to various biotic and abiotic factors, indicating wider scope for improving the yield potential. The most devastating factor for its low yield is weeds competition. Further, non-availability of labour and high rate of wages during peak periods of agricultural operations increased hiring charges of bullock-drawn intercultural implements (Sankar and Subramanyam, 2011). Thus, herbicide based weed management is becoming popular among farmers on account of its lower cost and less labour requirement. Keeping these facts in view herbicide Flurochloridon was used to evaluate bio-efficacy against major weeds.
MATERIALS AND METHODS
The field experiment was conducted at Banaras Hindu University, Varanasi during Zaid/Spring season of year 2014 and 2015. The experiment comprised of six treatments replicated four times in randomized block design. Treatments consisted of three rates of Flurochloridone 20% CS at 500, 625 and 750 ml a.i./ha, Pendimethalin 30% EC at 1000 ml a.i./ha, weed free (Hand weeding) and untreated control (weedy). Hand weeding was taken up at 20 and 40 days after sowing. Data was recorded from an area enclosed in the quadrate of 1x1 m2 randomly selected at three places in each plot. Weed species were separately counted from each sample and their density was recorded as average number/ m2. Hand weeding was taken up at 20 and 40 days after sowing. Weeds data were subjected to square root transformation (√x+0.5) before statistical analysis.
RESULTS AND DISCUSSION
The relevant data on weed density reveals that application of Flurochloridon 20% CS at 3750ml/ha as pre emergence recorded significantly lower population of all the weed species and was on par with Flurochloridon 20% CS at 3125ml/ha during both the stages. Both these treatments were superior to standard check treatments i.e. Pendimethalin 30% EC. Further, perusal of data clearly showed that among the various treatments of weed control, the lowest weed dry weight was recorded with Flurochloridon 20% CS at 3750ml/ha closely followed by Flurochloridon 20% CS at 3125ml/ha during both the stages. However, all the herbicide treatments were superior to untreated control in reducing weed growth at all the stages of observation. Maximum yield of sunflower was recorded in hand weeding treatment followed by Flurochloridon 20% CS at 3750ml/ha but did not differ significantly from Flurochloridon 20% CS at 3125ml/ha. Both these treatments had significantly higher yield than standard check treatment. Based on present study, it can be concluded that Flurochloridon 20% CS at 3750ml/ha as pre-emergence is effective against most of monocot and dicot weeds observed in sunflower.
It is I
LLEGAL t
o cop
y, pri
nt or
save
any c
onten
t of th
is PDF,
in pa
rt or in
full,
on an
y retr
ieval
syste
m,
withou
t the E
XPRESS WRITTEN PERMISSIO
N of th
e cop
yrigh
t-hold
er

National Conference on Climate Change and Agricultural Production: Adapting Crops to Climate Variability and Uncertainty, 6th–8th April, 2017
[199]
Table 1: Effect of Different Treatments on Total Weed Density, Weed Dry Weight and Seed Yield in Sunflower (Data Pooled over Two Years)
Treatments Rate (ml/ha)
Weed Density (no/m2) Weed Dry Weight (g/m2) Seed Yield (q/ha) 30 DAA 45 DAA 30 DAA 45 DAA
Flurochloridon 20% CS 2500 6.58 (42.83)
6.63 (43.44) 5.99 (35.90)
6.57 (42.72) 7.75
Flurochloridon 20% CS 3125 4.37 (18.63)
4.31 (18.10) 3.63 (13.20)
4.33 (18.23) 12.15
Flurochloridon 20% CS 3750 4.09 (16.25)
4.13 (16.57) 3.50 (12.26)
4.19 (17.07) 12.55
Pendimethalin 30% EC 3300 5.24 (26.92)
5.18 (26.30) 4.62 (21.34)
5.14 (25.88) 9.90
Weed free (Hand weeding) - 3.15 (9.43)
3.88 (14.55) 2.50 (6.25)
3.93 (14.92) 12.90
Weedy check (Control) - 10.44 (108.47)
11.08 (122.22) 9.69 (93.84)
11.29 (127.07)
7.00
CD (P=0.05) - 0.86 0.80 0.98 0.80 1.0 Figures in the parentheses are original values, DAA-days after application.
REFERENCE [1] Sankar S.K. and Subramanyam D 2011.Weed flora and yield of sunflower (Helianthus annuus L.) as influenced by pre- and post-
emergence application of herbicides. Indian Journal of Weed Science 43 (1 and 2):105-109.
Diversity and Pollination Efficiency of Insect Pollinators of Potential Tree Lasora (Cordia myxa L.)
Anoosha Vadde, Sumit Saini*, Sunita Yadav and H.D. Kaushik Department of Entomology, CCS Haryana Agricultural University, Hisar–125004, India
E-mail: *[email protected]
Keywords: Lasora, Diversity, Pollination efficiency, Insect
INTRODUCTION
Lasora (Cordia myxa L.) belongs to the family Boraginaceae. Pollination is largely dependent on insect pollinators especially honey bees which are one of the cheapest and ecofriendly inputs in maximizing the yields of cross pollinated crops. Potential fruit crops serve as good source of nectar and/or pollen. Scanty information is available on underutilized fruit plants as source of bee forage. Keeping this in view, Cordia myxa (L).was selected for recording the diversity and pollination efficiency of insect pollinators.
MATERIALS AND METHODS
The insect visitors and pollinators of Cordia myxa L. flowers were collected by hand net to observe the diversity during their flowering period i.e., April 2014 and 2015. Sweeps were made throughout flowering period of the crop at two hourly intervals from the morning to the evening. Pollination efficiency was calculated by using the following formula:
Pollination efficiency = Abundance X foraging Rate X number of loose pollen grains sticking on the body of the bee:
It is I
LLEGAL t
o cop
y, pri
nt or
save
any c
onten
t of th
is PDF,
in pa
rt or in
full,
on an
y retr
ieval
syste
m,
withou
t the E
XPRESS WRITTEN PERMISSIO
N of th
e cop
yrigh
t-hold
er

National Conference on Climate Change and Agricultural Production: Adapting Crops to Climate Variability and Uncertainty, 6th–8th April, 2017
[200]
RESULTS AND DISCUSSION
Total fifteen insect species belonging to eight families of four orders were recorded on lasora flowers. These belonged to Hymenoptera, Coleoptera, Diptera and Lepidoptera. Among the insect pollinators, Honey bees (Apis dorsata, A. florea and A. cerana) were the most frequent pollinators. A. dorsata (25.00) carried highest number of loose pollen grains (‘000) followed by A. cerana (20.50) and A. florea (16.75)A. dorsata came out to be most efficient pollinator of C. myxa with pollination index of 1476.08 followed by A. florea (182.14) and A. cerana (84.93) under agro-ecological conditions of Hisar (Haryana). Similar findings were reported by Bhattacharya et al. (2005) who reported that out of all the flower visitors of Jatropha curcas, honey bees (A. florea, A. dorsata, A. mellifera and A. cerana) were the effective pollinators.
Table 1: Diversity of Insect Visitors/ Pollinators of Lasora Order Family Insect Species
Hymenoptera Apidae Apis florea Fabricius Apis dorsata Fabricius Apis cerana Fabricius Apis mellifera Linnaeus
Megachilidae Megachile sp. Vespidae Polistes sp.
Coleoptera Coccinellidae Coccinella septempunctata Linnaeus Chilomenes sexmaculata Fabricius
Diptera Syrphidae Eristalinus obliquus Wiedemann
Eristalis sp. Tephritidae Bactrocera nigrofemoralis Tsuruta & White Calliophoridae Chrysomya rufifacies (Macquart)
Lepidoptera
Noctuidae Mythimna separata Walker Plusia sp. Thysanoplusia orichalcea Fabricius
Table 2: Pollination Efficiency of Major Insect Pollinators on Lasora Insect Species Abundance Foraging
Rate Loose Pollen Grains Sticking on the Body
of Insect Species (‘000)
Pollination Index (Abundance x Foraging
Rate x Loose Pollen Grains)
Pollination Efficiency (Rank)
Apis dorsata 4.49 13.15 25.00 1476.08 1st Apis cerana 0.49 8.37 20.50 84.93 3rd Apis florea 2.95 3.68 16.75 182.14 2nd
REFERENCE [1] Bhattacharya A, Datta K and Datta S K 2005. Floral biology, floral resource constraints and pollination limitation in Jatropha curcas L.
Pakistan Journal of Biological Sciences 8 (3): 456-460.
It is I
LLEGAL t
o cop
y, pri
nt or
save
any c
onten
t of th
is PDF,
in pa
rt or in
full,
on an
y retr
ieval
syste
m,
withou
t the E
XPRESS WRITTEN PERMISSIO
N of th
e cop
yrigh
t-hold
er

National Conference on Climate Change and Agricultural Production: Adapting Crops to Climate Variability and Uncertainty, 6th–8th April, 2017
[201]
Impact of Long Term Green Manuring on Adsorption-Desorption Behavior of Zinc in Calcareous Soil
Sunil Kumar*, Amit Kumar Pradhan, S.C. Paul, Ghanshyam and Dhananjay Kumar Department of Soil Science and Agricultural Chemistry,
Bihar Agricultural University, Sabour–813210, Bhagalpur, India E-mail: *[email protected]
Keywords: Zinc, Organic farming, Adsorption-Desorption
INTRODUCTION
Micronutrient deficiencies in Indian soils and crops are increasing since the adoption of modern agricultural technology with increased use of high analysis NPK fertilizers generally free from micronutrients. Calcareous soils of Bihar are deficient in Zinc (Zn) to the extent of 80 per cent (Singh et al., 2003). Adsorption-desorption pattern of Zn ion in soils controls its availability to plants (Zhenli et al., 2005). Zn applied to calcareous soils appears to be ionically adsorbed and precipitates as carbonates. Hence, it is important to study the adsorption- desorption behavior of Zn in calcareous soils especially influenced by the addition of organics.
MATERIALS AND METHODS
Study was conducted in a highly calcareous Zn-deficient soil under a long-term experiment started in Kharif 2000 for rice-wheat system at RAU, Pusa. Treatments included T1-control, T2-Sunhemp every year, T3-sunhemp alternate year, T4-Dhaincha every year, T5- Dhaincha alternate year, T6- Green gram every year, T7- Green gram + 2.5 t FYM ha-1 every year, T8-Green gram + 5.0 t FYM ha-1 every year, T9-10 t FYM ha-1 every year and T10-10 kg Zn ha-1 alternate year. After completion of 5th cycle, soil samples were collected, analyzed and the experimental data were fitted into Freundlich and Langmuir adsorption isotherms. Samples were sequentially extracted with distilled water, 1N NH4OAc and DTPA and Zn desorption was determined by AAS.
RESULTS AND DISCUSSION
The adsorption data were fitted into Freundlich equation to test its fitness. A linear relationship between log x/m Vs log Ce was observed for all soils as evident by R2 values 0.9909** to 0.9972** at 15ºC and 0.9888** to 0.9980** at 30ºC. The highest value of ‘K’ was observed at every year dhaincha green manuring treatment T4 (0.3547) at 15ºC, while, at 300C the corresponding value was observed in T9 (0.3616). The lower ‘K’ values were in control treatment (0.2498 and 0.2637 at 15ºC and 30ºC, respectively). The adsorption data were also fitted into Langmuir equation. A linear relationship between Ce/x/m Vs Ce was observed for all soils. The constant ‘K’ and adsorption maxima content ‘b’ values were computed from intercept and slope respectively. The bonding energy ranged from 0.0900 to 0.03774 and 0.0111 to 0.00357 L mg-1 at 15 and 30ºC, respectively. Adsorption maxima varied between 5000 to 10000 mg kg-1 in different treatments at the two temperatures. The per cent desorption of Zn at 15ºC by distilled water, 1N NH4OAc and DTPA varied from 38.10 to 55.94% which at 30ºC it varied from 38.07 to 61.58 % indicating that a portion of applied Zn is retained by the soils in forms, other than exchangeable or cheated and may therefore remain unavailable to plants. In conclusion, Zn adsorption-desorption capacity of soils can be enhanced by green manuring and its extent was more at higher temperature which can enhance the use efficiency of micronutrient fertilizers.
It is I
LLEGAL t
o cop
y, pri
nt or
save
any c
onten
t of th
is PDF,
in pa
rt or in
full,
on an
y retr
ieval
syste
m,
withou
t the E
XPRESS WRITTEN PERMISSIO
N of th
e cop
yrigh
t-hold
er

National Conference on Climate Change and Agricultural Production: Adapting Crops to Climate Variability and Uncertainty, 6th–8th April, 2017
[202]
REFERENCES [1] Singh A P, Sakal R, Pandeya S B, Sinha R B and Choudhary K 2003. Zinc research and agricultural production in Bihar. Technical
Bulletin, Department of Soil Science, Faculty of Agriculture, Rajendra Agricultural University, Bihar, Pusa, Samastipur. [2] Zhenli L He, Xiaoe E Yang and Peter J Stoffella 2005. Trace elements in agro ecosystems and impacts on the environment. Journal of
Trace Elements in Medicine and Biology 19(2): 125-140.
Performance of Wheat under Need Based Nitrogen Management Strategies and Different Tillage Options in Eastern Indo-Gangetic Plains
Mizanul Haque*, Mainak Ghosh, S.S. Mahadi, Tejpratap and Birendra Kumar Department of Agronomy, Bihar Agricultural University,
Sabour, Bhagalpur, Bihar–813210, India E-mail: *[email protected]
Keywords: Zero Tillage, Conservation Agriculture, Transplanted Rice, Cropping System
INTRODUCTION
Requirement of N must be based on variability in soil and micro-climatic conditions that occur within the field. The scale of N management recommendation domains change from large regions to farms or even single parcel within a large field. The farmers of eastern Indo-Gangetic Plain are used to apply blanket recommended N rate without considering the supply capacity of the soil and the demand of the crop. This inadequate and untimely application leads to lower N use efficiency and may cause the deterioration of soil health. Recent advances of N management tools like Nutrient Expert, Green Seeker and SPAD (Soil Plant Analysis Development) metre have shown promising effect in increasing crop productivity and N use efficiency of crops with minimizing environmental foot prints (Mondal and Basu, 2012). Excessive tillage operation in conventional farming also has the negative environmental impacts such as soil erosion, groundwater pollution and atmosphere contamination. Therefore, farming systems must be more sustainable to reach economical and social profitability as well as environmental preservation. Realizing the importance of N, an attempt was made in this study to quantify the precise N management strategy under different tillage options on performance of wheat.
MATERIAL AND METHODS
The experiment was laid out in split plot design with three replications consisting of two tillage options i.e., conventional tillage (CT) and zero tillage (ZT) in main plots and five nutrient (N) management viz., recommended dose (150:60:40 kg N:P2O5:K2Oha-1) with top dressing after irrigation (N1), recommended dose with top dressing before irrigation (N2), nutrient management based on Nutrient Expert tool(N3), nutrient management based on nutrient expert tool (70% N) + remaining N as guided by Green Seeker (N4) and nutrient enriched plot having 150%N and P2O5& K2O as per recommendation (N5). The wheat variety HD2733 was sown during dry season in two successive years of 2014-15 and 2015-16 in this study.
RESULTS AND DISCUSSION
The yield attributes like ear head numbers, grains per ear head and test weight did not varied significantly between zero tillage and conventional tillage. However, among different N management options N4 recorded the highest yield attributing characters. The different tillage options did not differ significantly among themselves in recording grain yield of wheat. However, the conventional tillage yielded non significantly
It is I
LLEGAL t
o cop
y, pri
nt or
save
any c
onten
t of th
is PDF,
in pa
rt or in
full,
on an
y retr
ieval
syste
m,
withou
t the E
XPRESS WRITTEN PERMISSIO
N of th
e cop
yrigh
t-hold
er
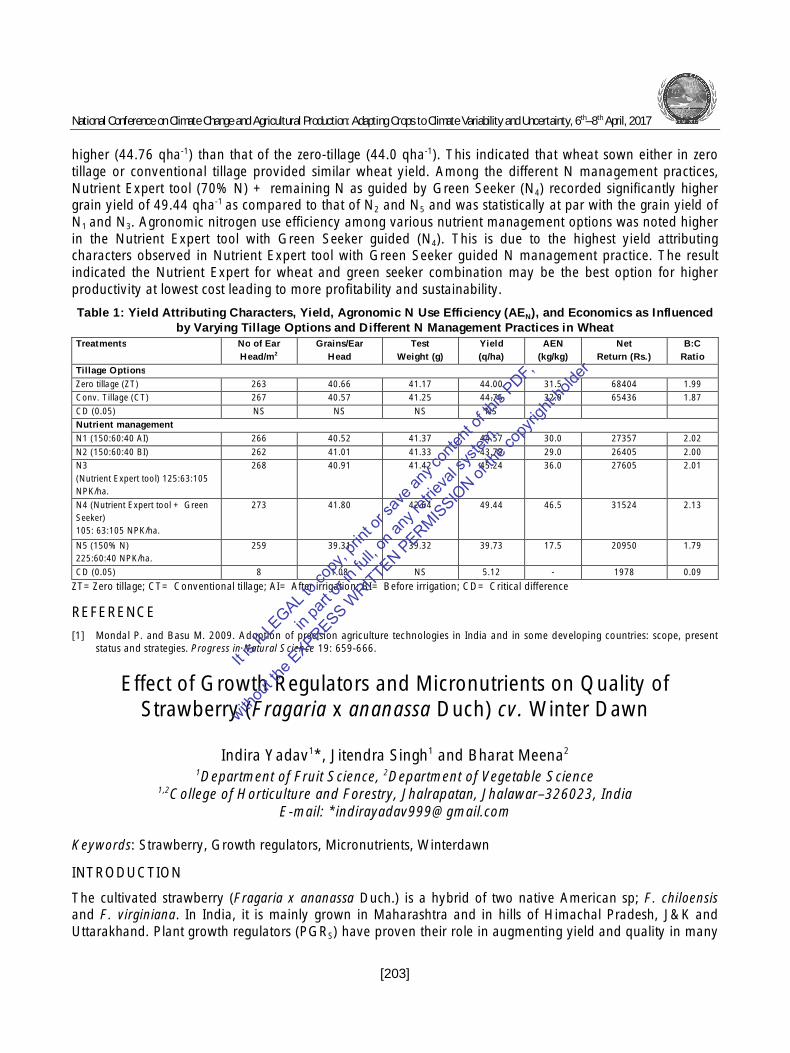
National Conference on Climate Change and Agricultural Production: Adapting Crops to Climate Variability and Uncertainty, 6th–8th April, 2017
[203]
higher (44.76 qha-1) than that of the zero-tillage (44.0 qha-1). This indicated that wheat sown either in zero tillage or conventional tillage provided similar wheat yield. Among the different N management practices, Nutrient Expert tool (70% N) + remaining N as guided by Green Seeker (N4) recorded significantly higher grain yield of 49.44 qha-1 as compared to that of N2 and N5 and was statistically at par with the grain yield of N1 and N3. Agronomic nitrogen use efficiency among various nutrient management options was noted higher in the Nutrient Expert tool with Green Seeker guided (N4). This is due to the highest yield attributing characters observed in Nutrient Expert tool with Green Seeker guided N management practice. The result indicated the Nutrient Expert for wheat and green seeker combination may be the best option for higher productivity at lowest cost leading to more profitability and sustainability.
Table 1: Yield Attributing Characters, Yield, Agronomic N Use Efficiency (AEN), and Economics as Influenced by Varying Tillage Options and Different N Management Practices in Wheat
Treatments No of Ear Head/m2
Grains/Ear Head
Test Weight (g)
Yield (q/ha)
AEN (kg/kg)
Net Return (Rs.)
B:C Ratio
Tillage Options Zero tillage (ZT) 263 40.66 41.17 44.00 31.5 68404 1.99 Conv. Tillage (CT) 267 40.57 41.25 44.76 32.0 65436 1.87 CD (0.05) NS NS NS NS Nutrient management N1 (150:60:40 AI) 266 40.52 41.37 44.57 30.0 27357 2.02 N2 (150:60:40 BI) 262 41.01 41.33 43.79 29.0 26405 2.00 N3 (Nutrient Expert tool) 125:63:105 NPK/ha.
268 40.91 41.42 45.24 36.0 27605 2.01
N4 (Nutrient Expert tool + Green Seeker) 105: 63:105 NPK/ha.
273 41.80 42.64 49.44 46.5 31524 2.13
N5 (150% N) 225:60:40 NPK/ha.
259 39.31 39.32 39.73 17.5 20950 1.79
CD (0.05) 8 1.08 NS 5.12 - 1978 0.09
ZT=Zero tillage; CT= Conventional tillage; AI= After irrigation; BI= Before irrigation; CD= Critical difference
REFERENCE [1] Mondal P. and Basu M. 2009. Adoption of precision agriculture technologies in India and in some developing countries: scope, present
status and strategies. Progress in Natural Science 19: 659-666.
Effect of Growth Regulators and Micronutrients on Quality of Strawberry (Fragaria x ananassa Duch) cv. Winter Dawn
Indira Yadav1*, Jitendra Singh1 and Bharat Meena2 1Department of Fruit Science, 2Department of Vegetable Science
1,2College of Horticulture and Forestry, Jhalrapatan, Jhalawar–326023, India E-mail: *[email protected]
Keywords: Strawberry, Growth regulators, Micronutrients, Winterdawn
INTRODUCTION
The cultivated strawberry (Fragaria x ananassa Duch.) is a hybrid of two native American sp; F. chiloensis and F. virginiana. In India, it is mainly grown in Maharashtra and in hills of Himachal Pradesh, J&K and Uttarakhand. Plant growth regulators (PGRS) have proven their role in augmenting yield and quality in many
It is I
LLEGAL t
o cop
y, pri
nt or
save
any c
onten
t of th
is PDF,
in pa
rt or in
full,
on an
y retr
ieval
syste
m,
withou
t the E
XPRESS WRITTEN PERMISSIO
N of th
e cop
yrigh
t-hold
er
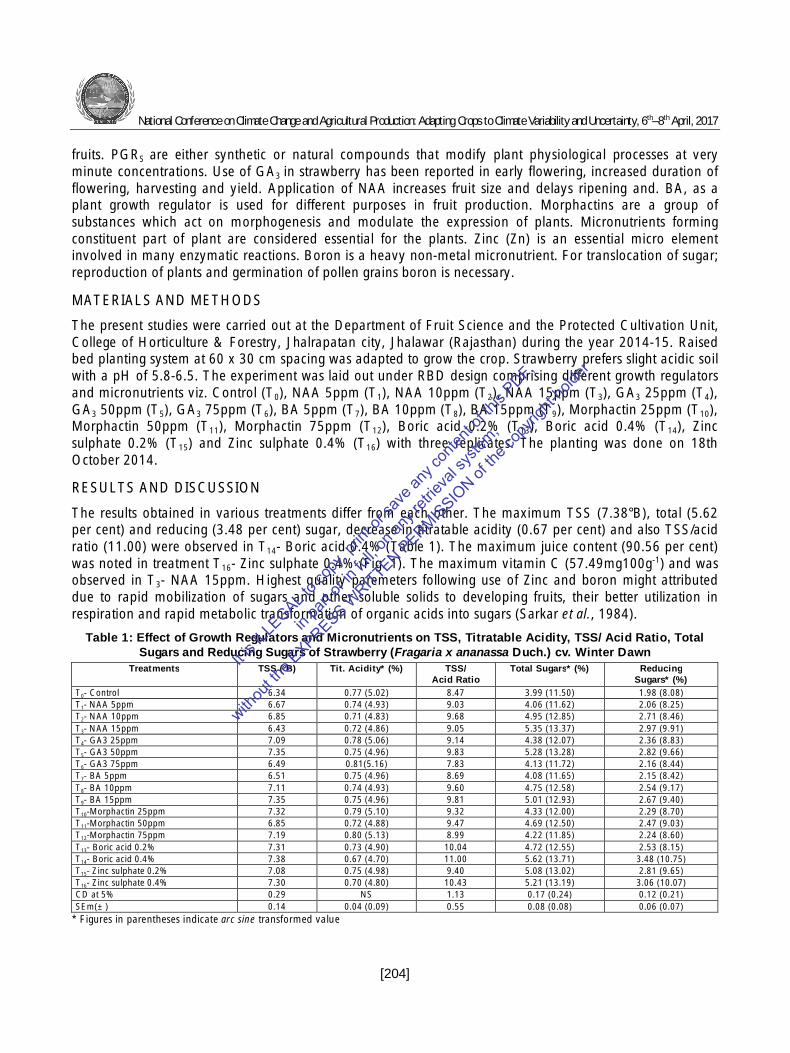
National Conference on Climate Change and Agricultural Production: Adapting Crops to Climate Variability and Uncertainty, 6th–8th April, 2017
[204]
fruits. PGRS are either synthetic or natural compounds that modify plant physiological processes at very minute concentrations. Use of GA3 in strawberry has been reported in early flowering, increased duration of flowering, harvesting and yield. Application of NAA increases fruit size and delays ripening and. BA, as a plant growth regulator is used for different purposes in fruit production. Morphactins are a group of substances which act on morphogenesis and modulate the expression of plants. Micronutrients forming constituent part of plant are considered essential for the plants. Zinc (Zn) is an essential micro element involved in many enzymatic reactions. Boron is a heavy non-metal micronutrient. For translocation of sugar; reproduction of plants and germination of pollen grains boron is necessary.
MATERIALS AND METHODS
The present studies were carried out at the Department of Fruit Science and the Protected Cultivation Unit, College of Horticulture & Forestry, Jhalrapatan city, Jhalawar (Rajasthan) during the year 2014-15. Raised bed planting system at 60 x 30 cm spacing was adapted to grow the crop. Strawberry prefers slight acidic soil with a pH of 5.8-6.5. The experiment was laid out under RBD design comprising different growth regulators and micronutrients viz. Control (T0), NAA 5ppm (T1), NAA 10ppm (T2), NAA 15ppm (T3), GA3 25ppm (T4), GA3 50ppm (T5), GA3 75ppm (T6), BA 5ppm (T7), BA 10ppm (T8), BA 15ppm (T9), Morphactin 25ppm (T10), Morphactin 50ppm (T11), Morphactin 75ppm (T12), Boric acid 0.2% (T13), Boric acid 0.4% (T14), Zinc sulphate 0.2% (T15) and Zinc sulphate 0.4% (T16) with three replicates. The planting was done on 18th October 2014.
RESULTS AND DISCUSSION
The results obtained in various treatments differ from each other. The maximum TSS (7.38°B), total (5.62 per cent) and reducing (3.48 per cent) sugar, decrease in titratable acidity (0.67 per cent) and also TSS/acid ratio (11.00) were observed in T14- Boric acid 0.4% (Table 1). The maximum juice content (90.56 per cent) was noted in treatment T16- Zinc sulphate 0.4% (Fig. 1). The maximum vitamin C (57.49mg100g-1) and was observed in T3- NAA 15ppm. Highest quality paremeters following use of Zinc and boron might attributed due to rapid mobilization of sugars and other soluble solids to developing fruits, their better utilization in respiration and rapid metabolic transformation of organic acids into sugars (Sarkar et al., 1984).
Table 1: Effect of Growth Regulators and Micronutrients on TSS, Titratable Acidity, TSS/ Acid Ratio, Total Sugars and Reducing Sugars of Strawberry (Fragaria x ananassa Duch.) cv. Winter Dawn
Treatments TSS (°B) Tit. Acidity* (%) TSS/ Acid Ratio
Total Sugars* (%) Reducing Sugars* (%)
T0- Control 6.34 0.77 (5.02) 8.47 3.99 (11.50) 1.98 (8.08) T1- NAA 5ppm 6.67 0.74 (4.93) 9.03 4.06 (11.62) 2.06 (8.25) T2- NAA 10ppm 6.85 0.71 (4.83) 9.68 4.95 (12.85) 2.71 (8.46) T3- NAA 15ppm 6.43 0.72 (4.86) 9.05 5.35 (13.37) 2.97 (9.91) T4- GA3 25ppm 7.09 0.78 (5.06) 9.14 4.38 (12.07) 2.36 (8.83) T5- GA3 50ppm 7.35 0.75 (4.96) 9.83 5.28 (13.28) 2.82 (9.66) T6- GA3 75ppm 6.49 0.81(5.16) 7.83 4.13 (11.72) 2.16 (8.44) T7- BA 5ppm 6.51 0.75 (4.96) 8.69 4.08 (11.65) 2.15 (8.42) T8- BA 10ppm 7.11 0.74 (4.93) 9.60 4.75 (12.58) 2.54 (9.17) T9- BA 15ppm 7.35 0.75 (4.96) 9.81 5.01 (12.93) 2.67 (9.40) T10-Morphactin 25ppm 7.32 0.79 (5.10) 9.32 4.33 (12.00) 2.29 (8.70) T11-Morphactin 50ppm 6.85 0.72 (4.88) 9.47 4.69 (12.50) 2.47 (9.03) T12-Morphactin 75ppm 7.19 0.80 (5.13) 8.99 4.22 (11.85) 2.24 (8.60) T13- Boric acid 0.2% 7.31 0.73 (4.90) 10.04 4.72 (12.55) 2.53 (8.15) T14- Boric acid 0.4% 7.38 0.67 (4.70) 11.00 5.62 (13.71) 3.48 (10.75) T15- Zinc sulphate 0.2% 7.08 0.75 (4.98) 9.40 5.08 (13.02) 2.81 (9.65) T16- Zinc sulphate 0.4% 7.30 0.70 (4.80) 10.43 5.21 (13.19) 3.06 (10.07) CD at 5% 0.29 NS 1.13 0.17 (0.24) 0.12 (0.21) SEm(±) 0.14 0.04 (0.09) 0.55 0.08 (0.08) 0.06 (0.07)
* Figures in parentheses indicate arc sine transformed value
It is I
LLEGAL t
o cop
y, pri
nt or
save
any c
onten
t of th
is PDF,
in pa
rt or in
full,
on an
y retr
ieval
syste
m,
withou
t the E
XPRESS WRITTEN PERMISSIO
N of th
e cop
yrigh
t-hold
er
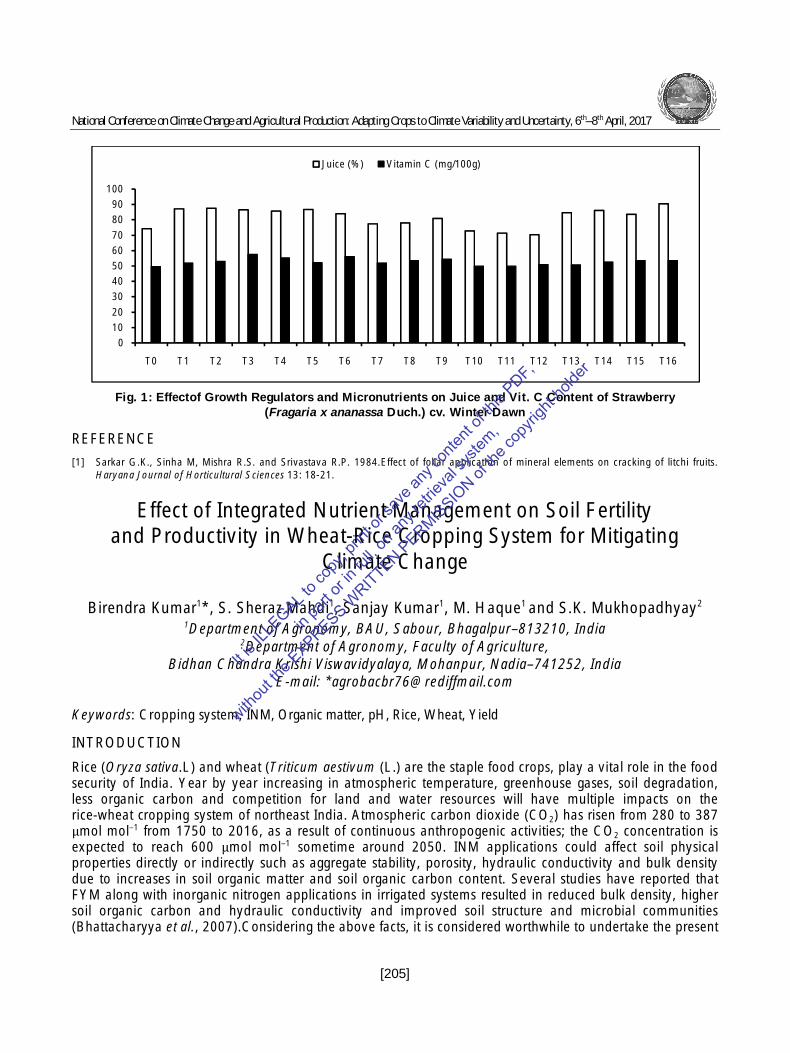
National Conference on Climate Change and Agricultural Production: Adapting Crops to Climate Variability and Uncertainty, 6th–8th April, 2017
[205]
Fig. 1: Effectof Growth Regulators and Micronutrients on Juice and Vit. C Content of Strawberry (Fragaria x ananassa Duch.) cv. Winter Dawn
REFERENCE [1] Sarkar G.K., Sinha M, Mishra R.S. and Srivastava R.P. 1984.Effect of foliar application of mineral elements on cracking of litchi fruits.
Haryana Journal of Horticultural Sciences 13: 18-21.
Effect of Integrated Nutrient Management on Soil Fertility and Productivity in Wheat-Rice Cropping System for Mitigating
Climate Change
Birendra Kumar1*, S. Sheraz Mahdi1, Sanjay Kumar1, M. Haque1 and S.K. Mukhopadhyay2 1Department of Agronomy, BAU, Sabour, Bhagalpur–813210, India
2Department of Agronomy, Faculty of Agriculture, Bidhan Chandra Krishi Viswavidyalaya, Mohanpur, Nadia–741252, India
E-mail: *[email protected]
Keywords: Cropping system, INM, Organic matter, pH, Rice, Wheat, Yield
INTRODUCTION
Rice (Oryza sativa.L) and wheat (Triticum aestivum (L.) are the staple food crops, play a vital role in the food security of India. Year by year increasing in atmospheric temperature, greenhouse gases, soil degradation, less organic carbon and competition for land and water resources will have multiple impacts on the rice-wheat cropping system of northeast India. Atmospheric carbon dioxide (CO2) has risen from 280 to 387 μmol mol–1 from 1750 to 2016, as a result of continuous anthropogenic activities; the CO2 concentration is expected to reach 600 μmol mol–1 sometime around 2050. INM applications could affect soil physical properties directly or indirectly such as aggregate stability, porosity, hydraulic conductivity and bulk density due to increases in soil organic matter and soil organic carbon content. Several studies have reported that FYM along with inorganic nitrogen applications in irrigated systems resulted in reduced bulk density, higher soil organic carbon and hydraulic conductivity and improved soil structure and microbial communities (Bhattacharyya et al., 2007).Considering the above facts, it is considered worthwhile to undertake the present
0102030405060708090
100
T0 T1 T2 T3 T4 T5 T6 T7 T8 T9 T10 T11 T12 T13 T14 T15 T16
Juice (%) Vitamin C (mg/100g)
It is I
LLEGAL t
o cop
y, pri
nt or
save
any c
onten
t of th
is PDF,
in pa
rt or in
full,
on an
y retr
ieval
syste
m,
withou
t the E
XPRESS WRITTEN PERMISSIO
N of th
e cop
yrigh
t-hold
er

National Conference on Climate Change and Agricultural Production: Adapting Crops to Climate Variability and Uncertainty, 6th–8th April, 2017
[206]
investigation to find out the effectiveness of organic manure, biofertilizers and their combination with chemical fertilizers for mitigating climate change in wheat-rice cropping system under prevailing agro-climatic condition of New Alluvial Zone of West Bengal.
MATERIALS AND METHODS
Field experiments were conducted during Rabi and Kharif seasons of 2013-14 and 2014-15 at Bidhan Chandra Krishi Viswavidyalaya, Mohanpur, Nadia, West Bengal. The experiment was laid out in a split-split plot design, while comprising two levels of FYM (0 and 10 t ha-1) in main plots, three chemical fertilizers levels viz. No NPK, 75% RDF and 100% RDF in Sub plots and four combinations of biofertilizers viz. No biofertilizer, Azotobacter, phosphate solubilizing bacteria and Azotobacter + phosphate solubilizing bacteria in Sub-sub plots with three replications. After harvesting of wheat, rice Shatabdi variety was sown at 20 cm apart in rows in the first fortnight of June, it depends upon the onset of monsoon during the cropping seasons.
RESULTS AND DISCUSSION
Significant effect of FYM, chemical fertilizers and biofertilizers were observed on pH, EC, organic carbon, bulk density, porosity percent and microbial status of soil after completion of cropping sequence. The pooled data pertaining to soil pH, EC, organic carbon, bulk density, porosity percent and microbial population showed in improving trend with the integration of FYM, chemical fertilizers and biofertilizers. However, the control treatments where no FYM, chemical and biofertilizers were applied resulted in lower organic carbon content and porosity percent than the initial value. Similarly, all the combined application lowered the pH, EC and soil bulk density from initial values. The treatments receiving combined application of FYM, chemical fertilizers and bio-fertilizers registered the highest microbial count over the initial value in the soil. The difference in OC values under INM treatments involving FYM might be due to their varying C:N ratios. Besides these beneficial effects, organic manures also help in improving the soil structure which in turn increases the infiltration and water retention, improves soil aeration and moderates the soil temperature.
REFERENCE [1] Bhattacharyya R, Chandra S, Singh R, Kundu S, Srivastva A and Gupta H 2007. Long-term farmyard manure application effects on
properties of a silty clay loam soil under irrigated wheat-soybean rotation. Soil Tillage Research 94: 386–396.
Sustainable Utilization of Wastes for Enhancement of Biogas Production
Shikha Mehta1*, R.C. Anand1, Kamla Malik1, Hemanta1 and Naveen Kumar2 1Department of Microbiology, COBS & H, 2Department of Processing and Food Engineering,
1,2COAE&T, CCS Haryana Agricultural University, Hisar–125004, India E-mail: *[email protected]
Keywords: Sustainable, Influent, Biogas slurry
INTRODUCTION
In today’s energy demanding life style, there is a need for exploring and exploiting new sources of energy that are renewable, as well as, eco-friendly. The availability of fossil fuels such as oil, gas, coal has decreased while the consumption has increased because fossil fuels are nonrenewable energy sources. Besides that, burning of these fuels causes the global warming. Biogas technology plays an important role in creating a sustainable society and reducing dependence on oil. Thus, we analyzed the effect of mixing landfill waste, kitchen waste, compost, paddy soil, biogas slurry and cow dung on biogas yield.
It is I
LLEGAL t
o cop
y, pri
nt or
save
any c
onten
t of th
is PDF,
in pa
rt or in
full,
on an
y retr
ieval
syste
m,
withou
t the E
XPRESS WRITTEN PERMISSIO
N of th
e cop
yrigh
t-hold
er

National Conference on Climate Change and Agricultural Production: Adapting Crops to Climate Variability and Uncertainty, 6th–8th April, 2017
[207]
MATERIALS AND METHODS
For determining the effect of kitchen waste, compost, landfill waste and paddy soil on biogas production, various combinations of these materials were made and then fed into aspirator bottles of 5 litre capacity. The experiment was conducted in batch conditions for 8 weeks. Rate of biogas production was determined by water displacement method. Total nitrogen in dried samples was estimated by standard micro Kjeldahal method. Total phosphorous content of sample was determined by method of John (1970). Potassium content of the sample was determined flame photometrically as described by Antil et al. (2002).
RESULTS AND CONCLUSION
The influent slurry comprising of different combinations was analyzed for various parameters. The pH in various digesters varied in a range of 7.62 - 8.82. Total solid content was in the range of 14.89 to 16.89 percent and volatile solids ranged between 82.0 - 97.0 (% of TS). After completion of batch anaerobic digestion for 8 weeks, the samples were withdrawn and analyzed for various parameters. The pH was found to decrease after 8 weeks of digestion. Decrease in TS and VS (% of TS) was observed in all the digesters. The maximum degradation (31.6%) of total solids was observed in digester-14 (Cattle dung (3kg) + kitchen waste @5%+ compost @ 5% + landfill waste @ 5%+ paddy soil @ 5%) and minimum degradation (24.8%) was in digester-1 (CD + biogas slurry@ 10%). Nitrogen, phosphorus and potassium content were found to increase after completion of digestion. Maximum increase in nitrogen content was found in digester, D14 (Cattle dung (3kg) + kitchen waste @5%+ compost @ 5% + landfill waste @ 5%+ paddy soil @ 5%). The biogas production increased in eight weeks of digestion. The maximum biogas production was observed in digester, D14 (Cattle dung (3kg) + kitchen waste @5%+ compost @ 5% + landfill waste @ 5%+ paddy soil @ 5%) with the range of 3.9 to 32.1 litres/week (Fig 1). Thus, co-digestion of these wastes and cow dung is one way of addressing the problem of insufficient gas production in this country.
Fig. 1: Weekly Biogas Production from Cattle dung Supplemented with Combination of Different Inocula During Batch Digestion
REFERENCES [1] Antil R S, Singh A and Dahiya S S 2002.Practical manual of soil and plant analysis. Department of Soil Science, CCS Haryana
Agricultural University, Hisar. [2] John M K 1970. Colorimetric determination of phosphorus in soil and plant materials with ascorbic acid. Soil Science 109: 214-220.
0
5
10
15
20
25
30
35
1 2 3 4 5 6 7 8
Biog
as p
rodu
ctio
n (li
tres
)
Time (weeks)
Cattle dung (3kg) + Biogas slurry @ 10% Cattle dung (3kg) + Biogas slurry @ 20%Cattle dung (3kg) + compost @ 10%Cattle dung (3kg) + landfill waste @10%Cattle dung (3kg) + paddy soil @10%Cattle dung (3kg) + compost @ 5% + landfill waste@ 5%Cattle dung (3kg) + compost @ 5%+ paddy soil @ 5%Cattle dung (3kg) + landfill waste@ 5%+ paddy soil @ 5%Cattle dung (3kg) + compost @ 5% + landfill waste @ 5%+ paddy soil @ 5%Cattle dung (3kg) + kitchen waste @ 10%Cattle dung (3kg) +kitchen waste@5% + landfill waste @5%Cattle dung (3kg) + kitchen waste@5% + paddy soil @5%Cattle dung (3kg) + kitchen waste@5% + compost @5%Cattle dung (3kg) + kitchen waste @5%+ compost @ 5% + landfill waste @ 5%+ paddy soil @ 5%
It is I
LLEGAL t
o cop
y, pri
nt or
save
any c
onten
t of th
is PDF,
in pa
rt or in
full,
on an
y retr
ieval
syste
m,
withou
t the E
XPRESS WRITTEN PERMISSIO
N of th
e cop
yrigh
t-hold
er

National Conference on Climate Change and Agricultural Production: Adapting Crops to Climate Variability and Uncertainty, 6th–8th April, 2017
[208]
Screening of Low P Tolerant Rice Cultivars under Organic and Sustainable Agriculture
Himanshu Patel1*, Vidyanand Mishra1, Brajendra2, Rajkamal Patel3 and Amarjeet Kumar4 1Department of Soil Science and Agricultural Chemistry, 3Department of Agronomy
1,3Indira Gandhi Krishi Vishwavidyalaya, Krishak Nagar, Raipur–492012, India 2Department of Soil Science and Agricultural Chemistry,
Indian Institute of Rice Research Rajendranagar, Hyderabad–500030, India 4Department of Soil Science and Agricultural Chemistry,
Bihar Agricultural University, Sabour, Bhagalpur, Bihar–813210, India E-mail: *[email protected]
Keywords: Phosphorus, Low-P tolerant cultivars, Environmental pollution
INTRODUCTION
Phosphorus application is essential to minimize yield loss on the soil. However, most of the P applied to soil is converted into unavailable forms and cannot be easily utilized by plants. With an increase in the price of P fertilizers and a growing concern about environmental pollution, screening, and cultivating low-P tolerant cultivars have become a prime research field. Release of P efficient genotypes in both high and low input farming systems would reduce the production cost associated with P fertilizer applications, minimize environmental pollution and contribute to the maintenance of P resources globally (Vance et al., 2003).The objective of experiment is to study the P uptake pattern of rice genotypes and an attempt has been made in this study to screen out low P tolerates rice cultivators in Deccan Plateau zone of India.
MATERIALS AND METHODS
The field experiment was conducted in kharifseason 2015 at the research farm of Indian Institute of Rice Research, Rajendranagar, Hyderabad, Telangana. Initial soil analysis characterization will be carried out for which previous soil analysis shows near neutral soil pH (7.2 to 8.2) with low to high status in available phosphorus. This augments well as a gradient can be selected. Out of number of plots available, low P plots will be used for selecting the genotypes tolerant to low P condition. However, to screen the genotypes for their P use efficiency and response to its application, the 30 genotypes need to be grown under different gradients so as to compare their performance under different regimes of P application. Therefore, low P plots will be divided into 4 sub-plots with different gradients (i.e. absolute control, 20 kg P2O5/ha, 40kg P2O5/ha and 60kg P2O5/ha) and separated with some barrier which can block water movement from one gradient to another. Factorial randomized block designed was used in this experiment replicated thrice.
RESULTS AND DISCUSSION
Among the 30 rice genotypes results on total P uptake revealed that overall mean of total P uptake in 60kg P2O5 is 8.29 kg/ha followed by 7.45 kg/ha in 40kg P2O5 followed by 6.03 kg/ha in20kg P2O5 and 3.37 kg/ha in control. It ranged from 2.68 kg/ha to 4.39 kg/ha in absolute control, 5.28 to 7.07 kg/ha in 20kg P2O5/ha group, 6.67 to 8.67 kg/ha in 40 kg P2O5/haand 7.35 to 9.28 kg/ ha under 60kg P2O5/ha group. Higher uptake was noticed as increasing the level of P. Among genotypes in absolute control swarna uptakes highest 4.39 kg/ha total P followed by kasalath (4.11 kg/ha) followed by akshayadhan (3.98 kg/ha), in 20 kg P2O5/ha highest total P uptake done by swarna (7.07 kg/ha) followed by kasalath (6.79 kg/ha) followed by IET24036 (6.41 kg/ha), in 40kg P2O5/ha highest total P uptake done by kasalath (8.67 kg/ha) followed by swarna (8.08
It is I
LLEGAL t
o cop
y, pri
nt or
save
any c
onten
t of th
is PDF,
in pa
rt or in
full,
on an
y retr
ieval
syste
m,
withou
t the E
XPRESS WRITTEN PERMISSIO
N of th
e cop
yrigh
t-hold
er

National Conference on Climate Change and Agricultural Production: Adapting Crops to Climate Variability and Uncertainty, 6th–8th April, 2017
[209]
kg/ha) followed by aditha (7.89 kg/ha) and in 60kg P2O5/ha kasalath uptakes highest total P (9.28 kg/ha) followed by swarna (9.20 kg/ha) followed by aditha (8.86 kg/ha). Akshaydhan, swarna and PR133 performed very well in absolute control plot hence this genotypes is suitable for organic farming.
REFERENCE [1] Vance C P, Uhde-Stone C and Allan DL 2003. Phosphorus acquisition and use: critical adaptations by plants for securing a non
renewable resource. New Phytol. 157: 423-447.
Yield Attributes, Yield and Economics of Bed Planted Barley Cultivars in Relation to Crop Geometry and Moisture Regimes
Naveen Kumar*, Suresh Kumar, S.K. Kakraliya and Mohinder Singh Department of Agronomy, CCS Haryana Agricultural University, Hisar–125004, India
E-mail: *[email protected]
Keywords: Bed Planted Barley, Yield, Crop geometry, Moisture regimes
INTRODUCTION
Barley (Hordeum vulgare L.) is cultivated in about 54 million hectares area with production of 124 million tonnes. In India, barley is grown on 0.649 million hectares area with 1.61 mt production and average yield of 2480 kg/ha. Furrow irrigated raised bed planting system (FIRBS) has proved to be one of the important components of low cost sustainable production system. Soil moisture is also one of the most important factors influencing the availability of water and nutrients to plants. It is important to quantify the level of moisture regime under FIRBS planting to maximize the yield attributes, yield and economics.
MATERIALS AND METHODS
A field experiment was conducted during rabi, 2011-12 at Research Farm, CCS HAU, Hisar (India) to study the productivity and economics of barley cultivars planted on raised beds in relation to crop geometry and moisture regimes. The experiment was laid out in split plot design with three replications keeping three cultivars viz., BH 393, BH 902 and BH 885 and two rows spacing viz., 2 rows per bed and 3 rows per bed (70 cm wide with 40 cm top and 30 cm furrow) in main plots and three moisture regimes (irrigation at IW/CPE 0.3, 0.4 and 0.5) in sub-plots.
RESULTS AND DISCUSSION
The results revealed that yield attributes and grain yield were recorded significantly higher in cultivars BH 902, followed by BH 393 and lowest in BH 885. Shantveerayya et al. (2015) also reported higher grains per spike with BH 902 cultivar due to its genetic ability to produce higher grain per spike. Significantly higher yield attributes and grain yield were produced by planting of barley on raised beds with 3 rows per bed than 2 rows per bed (Kumar et al., 2010). The yield attributes and grain yield increased significantly with increase in moisture regime from irrigation at IW/CPE 0.3 to IW/CPE 0.4 or 0.5, the latter two being at par with each other. The net return were maximum in BH 902, followed by BH 393 and BH 885. Planting of barley with 3 rows per bed resulted into higher net return than 2 rows per bed. Increase in moisture regime from IW/CPE 0.3 to 0.5 increased net return of barley cultivation. Similar results have been reported by Singh et al. (2013).
It is I
LLEGAL t
o cop
y, pri
nt or
save
any c
onten
t of th
is PDF,
in pa
rt or in
full,
on an
y retr
ieval
syste
m,
withou
t the E
XPRESS WRITTEN PERMISSIO
N of th
e cop
yrigh
t-hold
er

National Conference on Climate Change and Agricultural Production: Adapting Crops to Climate Variability and Uncertainty, 6th–8th April, 2017
[210]
REFERENCES [1] Kumar M, Sheoran P and Yadav A 2010. Productivity potential of wheat in relation to different planting methods and nitrogen
management strategies. Indian Journal of Agricultural Sciences 80 (5): 427-429. [2] Shantveerayya, Mansur C P, Alagundagi S C and Salakinkop S R 2015.Productivity of barley (Hordeum vulgare L.) genotypes to
integrated nutrient management and broad bed and furrow method of cultivation in watershed area. International Journal of Agricultural Sciences 7 (4): 497-501.
[3] Singh J, Mahal S S and Manhas S S 2013.Yield and quality of malt barley (Hordeum vulgare) as influenced by irrigation, nitrogen and methods of sowing. Indian Journal of Agronomy 58 (3): 354-62.
Assessment of Genetic Variation among Different Provenances of Acacia nilotica CPTs for Seed Traits
Amit Singhdoha*, R.S. Dhillon and K.S. Bangarwa Department of Forestry, CCS Haryana Agricultural University, Hisar–125004, India
E-mail: *[email protected]
Keywords: Acacia nilotica, Seed, Pod
INTRODUCTION
Acacia nilotica, belonging tofamily Fabaceae, is one of the most important, versatile and multipurpose tree species. The species is very popular among farmers in Asia and Africa for its valuable uses as timber, fiberwood, fodder, bark tannin, gum etc. and also its natural ability to fix atmospheric nitrogen which in turn replenish fertility of soil.It has an extensive and diverse natural distribution ranging from Egypt, Mautritiana southwards to southern Africa and Asia eastward to India. It is an evergreen, usually moderate-size (2.5-25m) with a short, thick and cylindrical trunk; bark is grey, reddish brown or black, rough, furrowed.The present study was initiated to find extant genetic variation in Acacia nilotica among different geographical siteson the basis of seed and pod traits.
MATERIALS AND METHODS
To conduct the present investigation six eco-geographical regions viz. Firozpur (Punjab), Roopnagar (Punjab), Sonipat (Haryana), Dausa (Rajasthan), Nagour (Raj.) and Hanumangarh (Raj.) were surveyed during June, 2014 for candidate plus tree selection and collection of quality pods. Pods were collected from ten individual trees from each provenance, keeping an isolation of 200 m to provide a sample of prevailing genetic variation in the population. Sufficient numbers of pods were collected from each selected tree and different observations were recorded i.e. pod length (cm), pod width (mm), seeds per pod, seed length (mm), seed width (mm), seed thickness (mm), 100 seed weight (g).
RESULTS AND DISCUSSION
In the present study on Acacia nilotica, the phenotypic coefficient of variation (PCV) for seed and pod characters varied from 3.17% for seed width to 12.23% for seed weight (Table 1). Regarding genotypic coefficient of variation (GCV), almost similar trend was observed. The difference between PCV and GCV were observed low for all the seed and pod characters. Meenaet al. (2015) estimated genetic parameters in pods and seed traits of candidate plus trees of Tecomella undulate. Heritability has an important place in tree breeding as it provides an index of the relative strength of heritability versus environment. It is also useful for ranking importance of each trait in cross breeding programmes. Heritability estimates in broad sense were observed highest for seed weight (78.06%) followed by pod length (71.82%) and seeds per pod (70.85). It
It is I
LLEGAL t
o cop
y, pri
nt or
save
any c
onten
t of th
is PDF,
in pa
rt or in
full,
on an
y retr
ieval
syste
m,
withou
t the E
XPRESS WRITTEN PERMISSIO
N of th
e cop
yrigh
t-hold
er
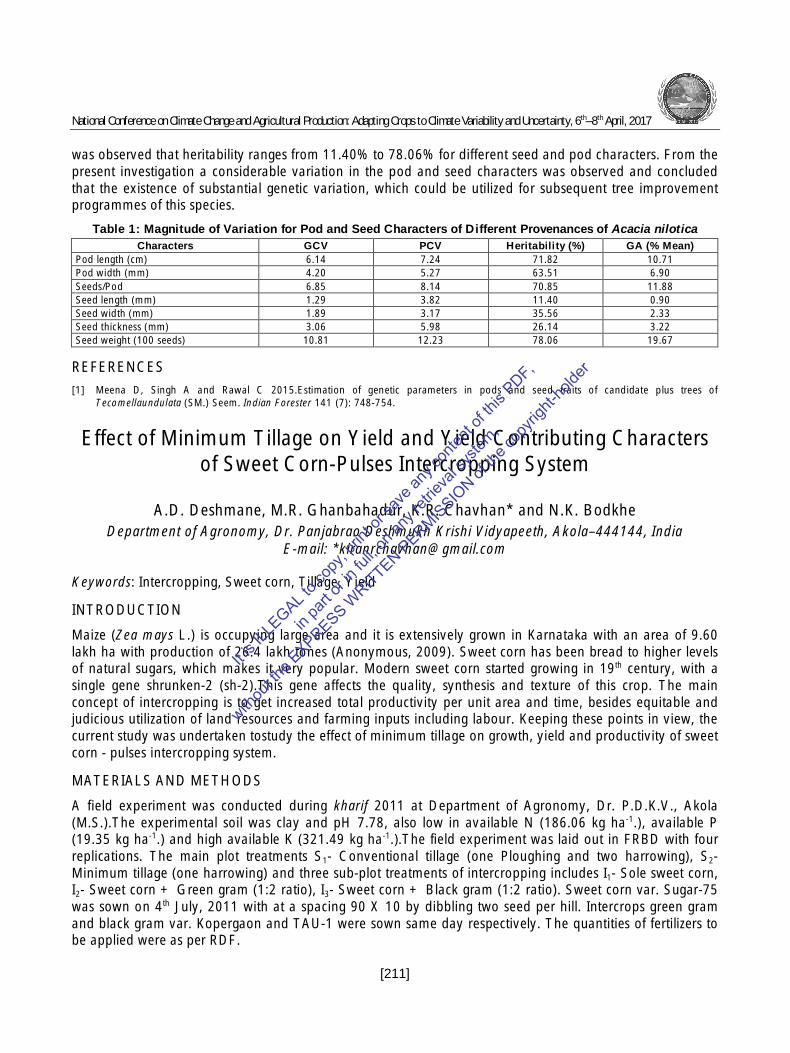
National Conference on Climate Change and Agricultural Production: Adapting Crops to Climate Variability and Uncertainty, 6th–8th April, 2017
[211]
was observed that heritability ranges from 11.40% to 78.06% for different seed and pod characters. From the present investigation a considerable variation in the pod and seed characters was observed and concluded that the existence of substantial genetic variation, which could be utilized for subsequent tree improvement programmes of this species.
Table 1: Magnitude of Variation for Pod and Seed Characters of Different Provenances of Acacia nilotica Characters GCV PCV Heritability (%) GA (% Mean)
Pod length (cm) 6.14 7.24 71.82 10.71 Pod width (mm) 4.20 5.27 63.51 6.90 Seeds/Pod 6.85 8.14 70.85 11.88 Seed length (mm) 1.29 3.82 11.40 0.90 Seed width (mm) 1.89 3.17 35.56 2.33 Seed thickness (mm) 3.06 5.98 26.14 3.22 Seed weight (100 seeds) 10.81 12.23 78.06 19.67
REFERENCES [1] Meena D, Singh A and Rawal C 2015.Estimation of genetic parameters in pods and seed traits of candidate plus trees of
Tecomellaundulata (SM.) Seem. Indian Forester 141 (7): 748-754.
Effect of Minimum Tillage on Yield and Yield Contributing Characters of Sweet Corn-Pulses Intercropping System
A.D. Deshmane, M.R. Ghanbahadur, K.R. Chavhan* and N.K. Bodkhe Department of Agronomy, Dr. Panjabrao Deshmukh Krishi Vidyapeeth, Akola–444144, India
E-mail: *[email protected]
Keywords: Intercropping, Sweet corn, Tillage, Yield
INTRODUCTION
Maize (Zea mays L.) is occupying large area and it is extensively grown in Karnataka with an area of 9.60 lakh ha with production of 26.4 lakh tones (Anonymous, 2009). Sweet corn has been bread to higher levels of natural sugars, which makes it very popular. Modern sweet corn started growing in 19th century, with a single gene shrunken-2 (sh-2).This gene affects the quality, synthesis and texture of this crop. The main concept of intercropping is to get increased total productivity per unit area and time, besides equitable and judicious utilization of land resources and farming inputs including labour. Keeping these points in view, the current study was undertaken tostudy the effect of minimum tillage on growth, yield and productivity of sweet corn - pulses intercropping system.
MATERIALS AND METHODS
A field experiment was conducted during kharif 2011 at Department of Agronomy, Dr. P.D.K.V., Akola (M.S.).The experimental soil was clay and pH 7.78, also low in available N (186.06 kg ha-1.), available P (19.35 kg ha-1.) and high available K (321.49 kg ha-1.).The field experiment was laid out in FRBD with four replications. The main plot treatments S1- Conventional tillage (one Ploughing and two harrowing), S2- Minimum tillage (one harrowing) and three sub-plot treatments of intercropping includes I1- Sole sweet corn, I2- Sweet corn + Green gram (1:2 ratio), I3- Sweet corn + Black gram (1:2 ratio). Sweet corn var. Sugar-75 was sown on 4th July, 2011 with at a spacing 90 X 10 by dibbling two seed per hill. Intercrops green gram and black gram var. Kopergaon and TAU-1 were sown same day respectively. The quantities of fertilizers to be applied were as per RDF.
It is I
LLEGAL t
o cop
y, pri
nt or
save
any c
onten
t of th
is PDF,
in pa
rt or in
full,
on an
y retr
ieval
syste
m,
withou
t the E
XPRESS WRITTEN PERMISSIO
N of th
e cop
yrigh
t-hold
er

National Conference on Climate Change and Agricultural Production: Adapting Crops to Climate Variability and Uncertainty, 6th–8th April, 2017
[212]
RESULTS AND DISCUSSION
Conventional tillage recorded significantly maximum grain and fodder yield (72.91 and 89.06 q ha-1. respectively) than minimum tillage (Table 1). Sole sweet corn recorded significantly higher grain (76.50 q ha-1.) and fodder yield (90.42 q ha-1.) were significantly superior over sweet corn + black gram treatment. The increase in yield component of sweet corn might be due to efficient utilization of light, moisture, nutrients and space, for better development of sweet corn in pure stand. There was no intercrops competition. Similar type of results were reported by Anup Das (2002). The interactions were found to be non significant. Conventional tillage recorded higher biological yield and harvest index than minimum tillage. Sole sweet corn recorded maximum cob yield than other intercropping treatments.
Table 1: Effect of Different Treatments on Yield and Yield Attributes Treatments Length of
Cob (cm) Girth of
Cob (cm)
Cobs per Plant
Grain Per Row
Grain Rows
Per Cob
Grain Per Cob
Number of Cob/ ha.
Green Cob Yield q/ ha.
Grain Yield q/ha.
Dry Fodder Yield q/ ha.
Tillage S1-Conventional tillage (one loughing and two harrowing)
28.34 19.90 1.51 38.41 14.15 543.21 154299 262.57 72.91 89.06
S2-Minimum tillage (one harrowing)
25.91 18.53 1.26 36.53 12.6 460.73 126840 250.86 69.46 80.55
C.D. at 5% 1.86 1.33 0.12 1.85 1.32 60.1 13237 10.94 3.45 5.53 I1- Sole Sweet corn 28.77 20.10 1.49 38.38 14.48 555.49 151885 267.28 76.50 90.42 I2 -Sweet corn + green gram (1:2 ratio)
27.44 19.79 1.30 35.67 12.41 442.53 131100 254.41 67.07 80.14
I3- Sweet corn + black gram (1:2 ratio)
25.17 17.75 1.37 38.36 13.24 507.9 138724 248.46 69.98 83.86
C.D. at 5% 2.28 1.63 0.14 2.27 1.62 73.6 16211 13.40 4.23 6.77 Interaction Effect (S X I)
C.D. at 5% NS NS NS NS NS NS NS NS NS NS
REFERENCES [1] Anonymous 2009. Single cross hybrid maize production technology published by Directorate of maize Research, ICAR, New Delhi. [2] Anup Das, Gnanamurthy A.P. and Narendra Kumar 2002. Effect of vegetable intercropping and source of nutrient on yield attributing
character and yield of pigeon pea. Indian Journal Agronomy 47 (3): 340-344.
Analysis of Value Added Traditional Product (kadhi) Containing Fresh Green Beans
Mamta Rani* and Darshan Punia Department of Foods and Nutrition,
CCS Haryana Agricultural University, Hisar–125004, India E-mail: *[email protected]
Keywords: Beans, Oroximates, Dietary fiber, Kadhi, Minerals,
INTRODUCTION
The study in the department of Foods and Nutrition (CCS HAU, Hisar) was carried out to analyse the nutritional potential of the green beans. Fresh green beans are very low in calories and contain no saturated fat, but are very good source of vitamins, minerals and plant derived micronutrients. The vitamin A and C present in green beans are excellent source of antioxidants that reduces the amount of free radicals in the body and prevents the building up of plaque in arteries and veins (Khanumet al., 2000).The traditional products keep a primary place in the menu of every culture. Traditional home preparation of pod is primarily
It is I
LLEGAL t
o cop
y, pri
nt or
save
any c
onten
t of th
is PDF,
in pa
rt or in
full,
on an
y retr
ieval
syste
m,
withou
t the E
XPRESS WRITTEN PERMISSIO
N of th
e cop
yrigh
t-hold
er

National Conference on Climate Change and Agricultural Production: Adapting Crops to Climate Variability and Uncertainty, 6th–8th April, 2017
[213]
aimed at making them more palatable and improving their flavor. This paper reports the nutrient composition of local preparation of kadhi prepared by incorporating different green beans.
MATERIALS AND METHODS
The fresh samples of the green beans viz., cluster bean (Cyamposistetragonaloba), cowpea bean (Vignaunguiculata), french bean (Phaseolus vulgaris) and sem bean (Dolichhos lablab) were used for the preparation of kadhi. All the four types of kadhi, were oven-dried to a constant weight at 60C, ground to a fine powder in an electrical grinder and analyzed for various nutrients. Proximate composition including moisture, protein, fat, ash, and crude fiber were determined by standard methods (AOAC, 2000). The total dietary fiber, insoluble dietary fiber and soluble dietary fiber were estimated by enzymatic method (Furda, 1969). Total minerals were analyzed using an Atomic Absorption Spectrophotometer according to the method of Lindsey and Norwell (1969).
RESULTS AND DISCUSSION
The Moisture and fat content of kadhi prepared using different beans showed a very narrow variation. The crude protein content was 22.34, 22.91, 22.62 and 22.35 per cent in cluster bean kadhi, cowpea bean kadhi, french bean kadhi and sem bean kadhi, respectively. The values of protein content found are consistent to those reported by Rachna (2006) in Moringaoleifera products. Crude fiber was the highest in cluster bean kadhi (2.23%) followed by cowpea bean kadhi (2.20%), french bean kadhi (2.17%) and sem bean kadhi (1.63%). The highest ash content was observed in cluster bean kadhi (9.56 %) while lowest in sem bean kadhi (8.51%). Cluster bean and french bean kadhi differed non significantly (p≤0.05) from each other in ash but had significantly (p≤0.05) higher ash content than the cowpea bean and sem bean kadhi. It is evident from the table that ash content of cowpea bean and sem bean kadhi did not differ significantly (p≤0.05) from each other. These results are consistent to those reported by Rachna (2006).
Table 1: Proximate Composition of Traditional Productkadhi Containing Beans (% Dry Weight Basis) Type of Kadhi Moisture Crude Protein Fat Crude Fiber Ash
Cluster bean (Cyamposistetragonaloba)
83.23 22.34 14.17 2.23 9.56
Cowpea bean (Vignaunguiculata)
83.17 22.91 13.77 2.20 8.66
French bean (Phaseolus vulgaris)
83.74 22.62 14.83 2.17 9.20
Sem bean (Dolichhos lablab)
83.83 22.35 14.00 1.63 8.51
CD (P<0.05) NS 0.04 NS 0.32 0.38 Values are mean ± SE of three independent determinations
REFERENCES [1] AOAC 2000. Official Methods of Analysis of Association of Official Agriculture Chemist. Association of Analytical Chemist, Washington.
D.C. [2] Furda I 1981. Simultaneous analysis of soluble and insoluble dietary fiber.The Analysis of Dietary Fiber in Food. W.P.T. James and O.
Theander (Eds).Marcel Dekker, Inc., New York. pp 163-172. [3] Khanum F, Swamy M S, Krishna K S R, Santhanam K and Viswanathan K R 2000. Dietary fiber content of commonly fresh and cooked
vegetables consumed in India.Plant Foods for Human Nutrition 55 (3): 207-218. [4] Lindsey W L and Norwell M A 1969. A new DPTA-TEA soil tests for zinc and iron. Agronomy Abstract61: 84. [5] Rachna 2006. Development and nutrient composition of value added products from Drumstick (Moringaoleifera). Ph.D. Thesis, CCS
HAU, Hisar, India.
It is I
LLEGAL t
o cop
y, pri
nt or
save
any c
onten
t of th
is PDF,
in pa
rt or in
full,
on an
y retr
ieval
syste
m,
withou
t the E
XPRESS WRITTEN PERMISSIO
N of th
e cop
yrigh
t-hold
er

National Conference on Climate Change and Agricultural Production: Adapting Crops to Climate Variability and Uncertainty, 6th–8th April, 2017
[214]
Importance of Antioxidant Enzymes in the Survival of Rice Seedlings after De-Submergence
Manjri1*, A.K. Singh1, Sarita Devi Gupta2 and Akanksha Singh3
1Department of Crop Physiology, 2Department of Agriculture Biochemistry, 3Department of Plant Molecular Biology and Genetic Engineering
1,2,3Narendra Deva University of Agriculture and Technology, Kumarganj, Faizabad–224229 E-mail: *[email protected]
Keywords: Super Oxide Dismutase, Peroxidase, Antioxidant, Submergence, Rice
INTRODUCTION
Rice plants are much damaged by several days of total submergence. The effect can be a serious problem for rice farmers in the rainfed lowlands of Asia, and runs contrary to a widespread belief amongst plant biologists that rice is highly tolerant of submergence. Analysis of flooding pattern in rainfed lowland of Southeast Asia reveals that about 20 million ha comes under medium-deep to deep and very deep ecology based on water stagnation. Here the ideal response to flooding is submergence tolerance (survival under water) together with some antioxidants mechanism. To study the antioxidant defence mechanism under submergence condition in rice.
MATERIALS AND METHODS
The experiment was conducted during 2014-2015 in cemented pond at the experimental site of the Department of Crop Physiology N.D.U.A. & T., Kumarganj, Faizabad (U.P.). Bold and healthy seeds of 100 rice genotypes were sown in augmented block design. Here, we explained about 4 rice genotypes (Swarna Sub-1, Sambha, NDR8610-2 and Lalkadhan). Submergence was given to 35 days old seedlings at vegetative stage. At the time of submergence, water level was maintained at 30cm.Plant survival % was recorded after 20 days of de-submergence. Estimation of SOD and peroxidase activity (enzyme unit g-1 fresh weight) spectrophotometrically.
RESULTS AND DISCUSSION
Among four genotypes maximum SOD activity and Peroxidase activity was in NDR8610-2 followed by Swarna sub-1 and minimum was in Sambha after desubmergence over control. Maximum survival percent occur in NDR8610-2 followed by Swarna sub-1 and minimum was occur in Sambha. Result showed that relationship between survival percent and antioxidative enzymes (Fig. 1). Genotypes which had maximum survival percent gave maximum antioxidative enzyme activity. This result agreed with the H2O2 accumulation and its concomitant effects in the plants resulting oxidative degradation have also been documented in plants including rice and other cereals (Vijayalakshmi et al., 2014). H2O2, though not a free radical, also possess the characteristic phenomena to lyse the tissue beyond its cellular threshold concentration. SOD is marked as the first line of defense which lyses O2 - into H2O2 and O2. A number of tolerant species may differ from susceptible members to vary in SOD activity during the exposure of submergence after entering the post anoxic condition on receding of water level. Conclusively, it is well perceived that survival percent was positively correlated with SOD activity and Peroxidase activity under submergence condition in rice genotypes. Highest survival percent was found in NDR8610-2 with highest survival percent. Antioxidant enzymes protect plant from oxidative damage.
It is I
LLEGAL t
o cop
y, pri
nt or
save
any c
onten
t of th
is PDF,
in pa
rt or in
full,
on an
y retr
ieval
syste
m,
withou
t the E
XPRESS WRITTEN PERMISSIO
N of th
e cop
yrigh
t-hold
er

National Conference on Climate Change and Agricultural Production: Adapting Crops to Climate Variability and Uncertainty, 6th–8th April, 2017
[215]
Fig. 1: Relationship between Survival% and Antioxidant Enzyme
REFERENCE [1] Vijayalakshmi D.S. Srividhya, S. Muthulakshmi and Satishraj R 2014. Induction of oxidativestress by hydrogen peroxide treatment in rice
genotypes to study the osmolyte accumulation pattern and antioxidant capacity. Journal of Stress Physiology & Biochemistry, 10: 37-46.
A Study on Adaptation Behaviour of Farmers in Ranchi, Jharkhand
Varsha Kumari* and O.P. Mishra Department of Extension Education,
Institute of Agricultural Sciences, Banaras Hindu University, Varanasi–221005, India E-mail: *[email protected]
Keywords: Farmers, Climate change, Adaptation
INTRODUCTION
Climate change is a vital natural phenomenon. It has both positive and negative impact on living creatures of earth like increase in carbon dioxide concentration enhances the crop health. However, from last few decades these changes had increased many folds due to industrial revolution causing emission of Green house gases1. Farmers are one the most vulnerable group2 in the current situation and they are trying their best to perform positively through adopting various adaptation strategies. But still they are in difficult situation due to various known and unknown reasons. This study was conducted with the objective to explore reasons that are effecting farmer’s development through adaptation against climate change.
MATERIALS AND METHODS
The study was conducted in two blocks (Ormanjhi and Angara) of Ranchi district of Jharkhand state in India during 2016 as these were operational area under Climate Change Knowledge Network in Indian Agriculture Programme. Sample of 105 respondents were selected from these two blocks purposively from 26 villages of these two blocks. A well developed Interview schedule was used for collecting first hand information. Exploratory research design was used in this study to know the adaptation behaviour of farmers. Collected data were analysed on the basis mean, standard deviation, frequency and percentage. Further they were classified in three different groups.
67.885.21
72.21 64.55
719.83
75.25
726.5 708.17598.06
143.09
604.18 565.33
0100200300400500600700800
Swarna sub-1 Sambha NDR8610-2 Lalkadhan
Relationship between survival% and antioxidant enzyme
survival%
POX
SOD
It is I
LLEGAL t
o cop
y, pri
nt or
save
any c
onten
t of th
is PDF,
in pa
rt or in
full,
on an
y retr
ieval
syste
m,
withou
t the E
XPRESS WRITTEN PERMISSIO
N of th
e cop
yrigh
t-hold
er
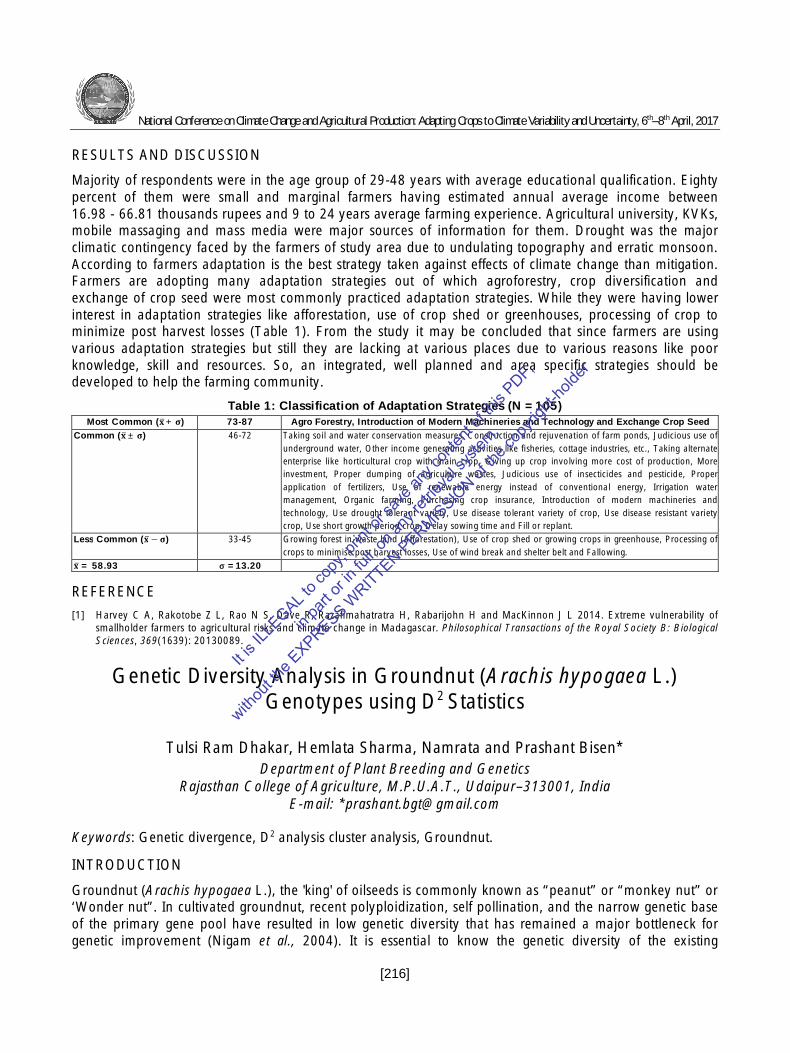
National Conference on Climate Change and Agricultural Production: Adapting Crops to Climate Variability and Uncertainty, 6th–8th April, 2017
[216]
RESULTS AND DISCUSSION
Majority of respondents were in the age group of 29-48 years with average educational qualification. Eighty percent of them were small and marginal farmers having estimated annual average income between 16.98 - 66.81 thousands rupees and 9 to 24 years average farming experience. Agricultural university, KVKs, mobile massaging and mass media were major sources of information for them. Drought was the major climatic contingency faced by the farmers of study area due to undulating topography and erratic monsoon. According to farmers adaptation is the best strategy taken against effects of climate change than mitigation. Farmers are adopting many adaptation strategies out of which agroforestry, crop diversification and exchange of crop seed were most commonly practiced adaptation strategies. While they were having lower interest in adaptation strategies like afforestation, use of crop shed or greenhouses, processing of crop to minimize post harvest losses (Table 1). From the study it may be concluded that since farmers are using various adaptation strategies but still they are lacking at various places due to various reasons like poor knowledge, skill and resources. So, an integrated, well planned and area specific strategies should be developed to help the farming community.
Table 1: Classification of Adaptation Strategies (N =105) Most Common (퐱+ 훔) 73-87 Agro Forestry, Introduction of Modern Machineries and Technology and Exchange Crop Seed
Common (퐱 ± 훔) 46-72 Taking soil and water conservation measures, Construction and rejuvenation of farm ponds, Judicious use ofunderground water, Other income generating activities like fisheries, cottage industries, etc., Taking alternateenterprise like horticultural crop with main crop, Giving up crop involving more cost of production, Moreinvestment, Proper dumping of agriculture wastes, Judicious use of insecticides and pesticide, Properapplication of fertilizers, Use of renewable energy instead of conventional energy, Irrigation watermanagement, Organic farming, Purchasing crop insurance, Introduction of modern machineries andtechnology, Use drought tolerant variety, Use disease tolerant variety of crop, Use disease resistant varietycrop, Use short growth period crop, Delay sowing time and Fill or replant.
Less Common (퐱 − 훔) 33-45 Growing forest in waste land (Afforestation), Use of crop shed or growing crops in greenhouse, Processing ofcrops to minimise post harvest losses, Use of wind break and shelter belt and Fallowing.
퐱 = 58.93 σ =13.20
REFERENCE [1] Harvey C A, Rakotobe Z L, Rao N S, Dave R, Razafimahatratra H, Rabarijohn H and MacKinnon J L 2014. Extreme vulnerability of
smallholder farmers to agricultural risks and climate change in Madagascar. Philosophical Transactions of the Royal Society B: Biological Sciences, 369(1639): 20130089.
Genetic Diversity Analysis in Groundnut (Arachis hypogaea L.) Genotypes using D2 Statistics
Tulsi Ram Dhakar, Hemlata Sharma, Namrata and Prashant Bisen* Department of Plant Breeding and Genetics
Rajasthan College of Agriculture, M.P.U.A.T., Udaipur–313001, India E-mail: *[email protected]
Keywords: Genetic divergence, D2 analysis cluster analysis, Groundnut.
INTRODUCTION
Groundnut (Arachis hypogaea L.), the 'king' of oilseeds is commonly known as “peanut” or “monkey nut” or ‘Wonder nut”. In cultivated groundnut, recent polyploidization, self pollination, and the narrow genetic base of the primary gene pool have resulted in low genetic diversity that has remained a major bottleneck for genetic improvement (Nigam et al., 2004). It is essential to know the genetic diversity of the existing
It is I
LLEGAL t
o cop
y, pri
nt or
save
any c
onten
t of th
is PDF,
in pa
rt or in
full,
on an
y retr
ieval
syste
m,
withou
t the E
XPRESS WRITTEN PERMISSIO
N of th
e cop
yrigh
t-hold
er

National Conference on Climate Change and Agricultural Production: Adapting Crops to Climate Variability and Uncertainty, 6th–8th April, 2017
[217]
genotypes so as to select most divergent parent before undertaking any crop improvement programme. Therefore, the present study was carried out to estimate the nature and magnitude of genetic diversity present in groundnut.
MATERIALS AND METHODS
90 diverse genotypes along with 3 checks of groundnut were evaluated in a Augmented Design with six blocks during kharif-2014 at the Instructional Farm, College of Technology and Engineering, MPUAT, Udaipur. Observations were taken on eleven morphological- biochemical traits. For oil content and protein content analysis, soxhlet and micro-kjeldahl method was used, respectively. Analysis of variance was carried out as per procedure given by Federer (1956). Genetic diversity analysis was done for all fifteen characters by using Mahalanobis D2 Statistics (1936)and different clusters were formed by following the ward (1963) method.
RESULTS AND DISCUSSION
The results revealed significant differences among genotypes for all studied traits, indicated the presence of adequate variability among the genotypes. All the genotypes were grouped into 8 clusters. Cluster VI was the largest, containing 18 genotypes followed by, 16 in cluster VII, 15 in cluster I, 12 in cluster V and cluster VIII, 10 in cluster IV, 7 in cluster III and 3 in cluster II.. While at maximum intra cluster distances were recorded for cluster V (D2= 101.80) followed by cluster V (D2=93.89), cluster VI (D2=85.56), cluster VII (D2=83.72), cluster VIII (D2=82.62), cluster I (D2=80.82). Maximum average inter cluster values, was obtained between cluster III and VIII. The genotype included (viz., UG-151, cluster III and UG-126, cluster-VIII) in the diverse clusters can be used as promising parents for hybridization programme for obtaining high heterotic response and thus better sergeants in groundnut.
REFERENCES [1] AOAC 1965.Official methods for oil analysis for association of official agricultural chemists 10th Ed. Washington D.C. [2] Federer W T 1956. Augmented designs. Hawaiian Planters Record55:191-208. [3] Kjeldahl J 1883. A new method for the estimation of nitrogen in organic compounds. Journal of Analytical Chemistry22: 366. [4] Mahalanobis P C 1936. On test and measure of group divergence. Journal Asiatic Society of Bengal26: 541-588. [5] Nigam S N, Giri D Y and Reddy A G S 2004. Groundnut Seed Production Manual, Patencheru- 502324
Evaluation of Growth and Yield Parameters of Cotton Hybrids as Influenced by Different Growing Environments
Abhijeet Sharma, M.L. Khichar, Ram Niwas and Premdeep* Department of Agricultural Meteorology,
CCS Haryana Agricultural University, Hisar–125004, India E-mail: *[email protected]
Keywords: Cotton, Yield parameters, Environment, Weather
INTRODUCTION
Cotton has retained its unique fame and name as the “king of fibres” and “white gold” because of its higher economical value among cultivable crops for quite a long period. Cotton is important commercial cash crop in India contributing a prominent share in foreign exchange earnings of the country. The production and productivity of different crop species are governed by the climatic condition of a particular location. The
It is I
LLEGAL t
o cop
y, pri
nt or
save
any c
onten
t of th
is PDF,
in pa
rt or in
full,
on an
y retr
ieval
syste
m,
withou
t the E
XPRESS WRITTEN PERMISSIO
N of th
e cop
yrigh
t-hold
er

National Conference on Climate Change and Agricultural Production: Adapting Crops to Climate Variability and Uncertainty, 6th–8th April, 2017
[218]
meteorological factors play an important role in the development of plant growth and insect pest population. The most important meteorological variables associated with agricultural production are air temperature (minimum and maximum values), solar radiation and precipitation.Untimely rainfall, as well as humid weather during later stages of cotton growth, primarily once the bolls begin to open, may complicate defoliation; reduce yield and quality, lower the crop’s ginning properties. A better understanding of weather resources can help increase the crop productivity.Hence, keeping the above facts in view, the present research work was planned to evaluate growth and yield parameters of cotton hybrids as influenced by the different growing environments.
MATERIALS AND METHODS
The study was conducted at research farm of Department of Agricultural Meteorology, Chaudhary Charan Singh Haryana Agricultural University, Hisar, during kharif season 2013. Three dates of sowing i.e. 4th week of April, 2nd week of May and 4st week of May constituting the main plots treatments and three cotton varieties viz. Ankur 3028 BG II, BIO 6588 BG II and HHH-223 constituting the sub-plots having two row orientation i.e. north-south and east-west were analyzed under split plot design to quantify the crop weather relationship under different growing environments. Different yield and yield attributing parameters viz. lint, seed cotton, cotton seed, bolls/ plant were recorded timely upto harvest. Daily weather data recorded at agrimet observatory were used to compute the agro-meteorological indices.
RESULTS AND DISCUSSION
The results revealed that the maximum Leaf area index (LAI) and dry matter (DM) accumulation was observed under 15th May sown crop as compared to 30th April and 30th May sown crop under north-south conditions (Table 1). Similarly leaf area index and dry matter accumulation were lowest when crop was sown on 30th May under east-west conditions. This might be due to more time available for crop growth and development in 15th May sown crop which resulted better leaf area. Increased leaf area contributes more accumulation of dry matter in plant Among Hybrids Ankur 3028 BG II produced higher leaf area index and dry matter accumulation as compared to BIO 6588 BG II and HHH 223 under north-south and east-west conditions. This was due to because of more absorption PAR in Ankur 3028 BG II as compared to other varieties.
Table 1: Leaf Area Index of Cotton Hybrids at Various Growth Intervals under Different Growing Environments Treatments 30DAS 60DAS 90DAS 120DAS 150DAS 180 DAS
D1 0.11 0.19 1.27 3.10 4.19 1.46 D2 0.13 0.23 1.55 3.55 4.56 1.88 D3 0.10 0.17 0.97 2.98 3.89 1.13
CD at 5% 0.01 NS 0.13 NS NS 0.13 V1 0.12 0.21 1.30 4.03 4.67 1.60 V2 0.12 0.20 1.15 3.09 4.23 1.39 V3 0.10 0.19 1.08 2.52 3.55 1.48
CD (p=0.05) 0.01 NS 0.06 NS NS 0.06 NS 0.12 0.20 1.18 3.21 4.35 1.49 EW 0.11 0.17 1.14 3.17 4.30 1.43
CD (p=0.05) NS NS NS NS NS NS
It is I
LLEGAL t
o cop
y, pri
nt or
save
any c
onten
t of th
is PDF,
in pa
rt or in
full,
on an
y retr
ieval
syste
m,
withou
t the E
XPRESS WRITTEN PERMISSIO
N of th
e cop
yrigh
t-hold
er

National Conference on Climate Change and Agricultural Production: Adapting Crops to Climate Variability and Uncertainty, 6th–8th April, 2017
[219]
Production and Marketing Constraints of Milk in Rewari District of Haryana
Manish Yadav*, Ashok Dhillon, Jitender Kumar Bhatia and Dalip Bishnoi Department of Agri. Economics, CCS Haryana Agricultural University, Hisar–125004, India
E-mail: *[email protected]
Keywords: Production, Marketing, Efficiency, Constraints
INTRODUCTION
India has been predominantly known as an agrarian economy. Despite of change of focus towards industrial development in present time, agriculture continues to be the main stay of Indian economy. Agriculture and allied activities contribute fourteen percent of GDP and 55 percent of Indian population is still dependent on agriculture for earning its livelihood. At the village, there are dairy co-operative structures of milk producers which are federated into milk union at the district level. At state level, milk unions have been federated into an apex body called Haryana Dairy Development Co-operative Federation Ltd. (HDDCF). Milk being the highly perishable commodity needs quick and an efficient marketing system. There is growing concern that the consumers are losing purchasing power due to rising prices while the producers are not getting remunerative prices of their products.
MATERIALS AND METHODS
The study was conducted in Rewari district of Haryana state which was purposively selected for economic analysis of production and marketing of milk during the year 2013-2014. Both primary as well as secondary data have been used for attaining the objectives of the study undertaken. The milk producing households were divided into three size categories on the basis of number of milch animals (cows and buffaloes) by cumulative total method. The three size groups of milk producers were as small category maintaining 1-2 milch animals, medium category maintaining 3-4 milch animals and large category who maintained five and more milch animals. A sample of 30 milk producing households was taken from each village. Thus from all the four villages a total sample of 120 households was taken.
RESULTS AND DISCUSSION
Major problems faced by the milk producers in production of milk were lack of good quality feeds and their higher prices (72.50 percent), lack of veterinary services at village level (77.50 percent), lack of good quality breeds (68.33 percent), lack of insemination facilities (67.50 per cent), lack of green fodder (72.50 percent), less profitable (64.16 percent), low fat percentage (61.66 percent). Regarding the marketing problems, almost all the farmers (75 percent) faced the problem of inadequate marketing intelligence, lack of good procurement centre (70 percent), lack of A.I. facilities (69 percent), transportation problems (64 percent), lower prices for milk (65 percent), dispute over quality of milk (61 per cent), irregular payment (54 percent) and poor conception through A.I. (62 percent) and distance (54 percent) were the other problems faced by the farmers in the study area. These results got the support from the finding of Kumar et al. (2011).
It is I
LLEGAL t
o cop
y, pri
nt or
save
any c
onten
t of th
is PDF,
in pa
rt or in
full,
on an
y retr
ieval
syste
m,
withou
t the E
XPRESS WRITTEN PERMISSIO
N of th
e cop
yrigh
t-hold
er

National Conference on Climate Change and Agricultural Production: Adapting Crops to Climate Variability and Uncertainty, 6th–8th April, 2017
[220]
Table 1: Problems Faced by the Farmers in Production of Milk S. No. Production problems Rewari
(N=60) Bawal (N=60)
Overall Av. (N=120)
Ranking
1 Lack of finance 15 (25.00)
25 (41.66)
40 (33.33)
11
2 Less profitable 36 (60.00)
41 (68.33)
77 (64.16)
4
3 Lack of good quality feed 30 (50.00)
35 (58.33)
65 (54.16)
7
4 High prices of feed 42 (70.00)
45 (75.00)
87 (72.50)
2
5 Lack of green fodder 43 (71.66)
44 (73.33)
87 (72.50)
2
6 Lack of veterinary services 47 (78.33)
46 (76.66)
93 (77.50)
1
7 Lack of good quality breeds 40 (66.66)
42 (70.00)
82 (68.33)
3
8 Lack of insemination facility 37 (61.66)
38 (63.33)
75 (62.50)
4
9 Low fat percentage 35 (58.33)
39 (65.00)
74 (61.66)
5
10 Inadequate knowledge of feeding 31 (51.66)
29 (48.33)
60 (50.00)
7
11 Inadequate housing system 25 (41.66)
28 (46.66)
53 (44.16)
8
12 Lack of subsidy for housing 20 (33.33)
25 (41.66)
45 (37.50)
10
13 Lack of technical skills for housing 23 (38.33)
27 (45.00)
50 (41.66)
9
14 Inadequate equipment at veterinary Hospital
38 (63.33)
37 (61.66)
75 (62.50)
4
15 Lack of subsidy for treating the animal 30 (50.00)
34 (56.66)
64 (53.33)
6
Note: Figures in parentheses indicate percentage to the number of producers in respective blocks and to the total number of sample producers in the case of overall average. Total number of farmers selected was 120. (60 farmers from each block)
REFERENCE [1] Kumar N, Suhag K S, Godara A K and Kumar J 2011. Economical constraints perceived by farmers in rearing dairy animals in Haryana.
Environment and Ecology29 (2): 709-713.
Effect of Zinc Application on Marketable Leaf Production of Betelvine
Shivnath Das*, Prabhat Kumar and Ajit Kumar Pandey Bihar Agricultural University, Sabour, Betelvine Research Centre, Islampur, Nalanda–801303
E-mail: *[email protected]
Keywords: Betelvine, Magahi pan, Zinc, Marketable betel leaves,
INTRODUCTION
Magahi pan (Piper beetle L.) is a leading cultivar of Bihar origin, mainly cultivated in agro-climate Zone IIIB of Bihar by small and marginal farmers particularly in the Magadh region which comprises four districts-Aurangabad, Gaya, Nawada and Nalanda (O’Malley, 1906). Betel vine crop occupied an area about 4000 ha in Bihar out of which Magahi pan covered about 439 ha area (Jha and Kumar, 2014).Magahi pan growing in these areas are of excellent quality and fetch higher market price than other cultivars of betel leaf. Its betel quid is pungent, less fibrous, and easily soluble inside mouth. The low production of betel leaf in Bihar is attributed by several factors including balance nutrition. Balanced nutrition especially application of zinc to the betevine crop is one of the important inputs that can enhance productivity to a great extent. In
It is I
LLEGAL t
o cop
y, pri
nt or
save
any c
onten
t of th
is PDF,
in pa
rt or in
full,
on an
y retr
ieval
syste
m,
withou
t the E
XPRESS WRITTEN PERMISSIO
N of th
e cop
yrigh
t-hold
er

National Conference on Climate Change and Agricultural Production: Adapting Crops to Climate Variability and Uncertainty, 6th–8th April, 2017
[221]
Bihar, there is tendency to use indiscriminate amount of nitrogenous fertilizers and very limited amount of other nutrients (P2O5, K2O and Sulfur) however, application of micro nutrient like Zn is still neglected. The Zn deficient soil act as limiting factor for sustainable production of betel vine in agro-climate Zone IIIB of Bihar. Therefore, the present experiment was undertaken.
MATERIALS AND METHODS
The present investigation was conducted on Magahi pan cultivar of betelvine at the Betelvine Research Centre, Islampur (25°07' N and 85°24' E) under AICRP on MAP &Betel vine during three consecutive years 2013-14, 2014-15 and 2015-16. The soil of experimental field was medium in Zn content. The experiment was laid out in randomised block design with six treatments (Control, 10 kg ZnSO4/ha, 15 kg ZnSO4/ha,20 kg ZnSO4/ha, 25 kg ZnSO4/ha and30 kg ZnSO4/ha) replicated three times. Planting of Magahi pan was done during the month of May-June in the respective years by applying a common dose of N:P:K @ 200: 100: 100 kg/ha in all the treatments,. Observations on Number of marketable leaves/vine, fresh weight of 100 leaves, Number of lateral branch/vine and vine length were recorded by tagging five randomly selected plants excluding the border rows from each treatment and their average values were worked out.
RESULTS AND DISCUSSION
Analyzed pooled data of three consecutive years revealed that the soil application of Zn showed marked influence on number of marketable leaves/vine, fresh number of lateral branch/vine and vine length and fresh leaves weight of betel vine as compared to control (Table 1). Significantly higher betel leaf (74.70marketable leaves/vine) was with the application of ZnSO4 @ 30 kg/ha which exhibited its superiority over rest of the treatments followed by ZnSO4 @ 25 kg/ha (71.70marketable leaves/vine). However, the variations in marketable leaves/vine between these treatments were not marked. The increase in marketable leaves with 30 kg/ha ZnSo4 was 4.0.6, 10.04, 15.66, 20.62 and 26.51percent more than that of 25, 20, 15, 10 kg/ha ZnSo4 and control, respectively. Almost similar influence of micronutrient on number of lateral branches/vine and length of vine were observed as noted in case of marketable leaves/vine but reverse trend was obtained in terms of fresh leaves weight of betel vine during the years of experimentation. The highest marketable leaves attribute with 30 kg/ha ZnSo4 as a result of more branching and vine length of betel vine on account of adequate and prolonged supply of zinc. Based on three years experimentation it may be concluded that soil application of ZnSO4 @ 30 Kg/ha is suitable for higher production of Magahi pan in agro-climate Zone IIIB of Bihar where Zn was found to be deficient followed by 25kg ZnSO4/ha.
Table 1: Effect of Zinc Application on Production of Betelvine (cv. Magahi pan) Treatments Pooled Data of Three Years (2013-14, 2014-15 and 2015-16)
Marketable Leaves/ Vine
No. of Lateral Branches/ Vine
Length of Vine (cm.) Fresh Weight of 100 Leaves (gm)
T1- Control 54.9 3.0 144.1 130.3 T2- 10 kg ZnSO4/ha 59.3 3.3 151.9 127.2 T3- 15 kg ZnSO4/ha 63.0 3.5 160.1 124.1 T4- 20 kg ZnSO4/ha 67.2 3.8 164.6 119.2 T5- 25 kg ZnSO4/ha 71.7 4.6 173.4 114.7 T6- 30 kg ZnSO4/ha 74.7 5.2 180.10 113.1 C.D. (P=0.05) 1.73 0.3 5.5 2.2
REFERENCES [1] Jha P.K. and Kumar N. 2014. Status of betelvine crop in Bihar, pp. 102-105. In: Hima B K, Surayanarayana M.A. and Vasantha K.T.
(eds.)Compendium, National meet on Betelvine-Farmers, Traders and Researchers Interface, February 22-23, IIHR, Bengaluru. [2] O’Malley LSS. 1906. Bengal District Gazetteers: Gaya. Lagoss Press, New Delhi (Reprint 2007), pp. 113.
It is I
LLEGAL t
o cop
y, pri
nt or
save
any c
onten
t of th
is PDF,
in pa
rt or in
full,
on an
y retr
ieval
syste
m,
withou
t the E
XPRESS WRITTEN PERMISSIO
N of th
e cop
yrigh
t-hold
er

National Conference on Climate Change and Agricultural Production: Adapting Crops to Climate Variability and Uncertainty, 6th–8th April, 2017
[222]
Evaluation of Tomato Varieties under Protected Condition for Growth, Yield and Quality
U. Thapa*, R. Mondal and T. Gupta Department of Vegetable Crops, Faculty of Horticulture,
Bidhan Chandra Krishi Viswavidyalaya, Mohanpur, Nadia–741252, India E-mail: *[email protected]
Keywords: Tomato, Protected Condition, Growth, Yield
INTRODUCTION
Tomato (Solanum lycopersicum L.) is one of the largest grown vegetable crop. It considered as ‘Protective food’ based on its nutritive value and antioxidant properties due to the presence of lycopene, flavonoids and has great demand in international market. To overcome environmental stresses, protected cultivation of vegetables has been recommended. Protected cultivation of tomato offers distinct advantages of earliness, higher productivity, quality fruits and higher returns to growers (Sharma and Singh, 2015). Being an important vegetable crop, research on every aspect of tomato cultivation becomes essential and it can be grown off-season successfully under cover (Lekshmi and Celine, 2015). Some progressive farmers of West Bengal are recently adapting tomato cultivation under poly house for getting supreme quality fruit and to catch early market. Keeping these in view, the present investigation was undertaken with the objectives that to study the performance of different tomato varieties under protected condition for growth, yield and quality characters.
MATERIALS AND METHODS
The present experiment was carried out in a polyhouse in Faculty of Horticulture, Bidhan Chandra Krishi Viswavidyalaya Mohanpur, Nadia (West Bengal) during 2015-16 with objectives to find out suitable variety of tomato for growth, yield and quality parameters under naturally ventilated arched saw teeth type Polyhouse. Eleven tomato varieties namely VL-642, Kundan, Karan, Karina, Kohinoor, DEB 2913, PAN 1286, Amlika, DEB 2912, Chiranjeev, Namdhari were used to investigate. The experiment was laid out in Randomized Block Design with three replications.
RESULTS AND DISCUSSION
Statistically significant variation found in different varieties for most of the characters. Maximum plant height recorded in variety PAN 1286 (191.73 cm) While minimum plant height recorded in variety NS 538 (151.20 cm). Significant difference not observed for number of primary branches in different varieties of tomato. Kohinoor has taken minimum days (26.33 days) to produce first flower and 39 days to first fruit set whereas Chiranjeevi and NS 538 variety has shown late flowering. Tomato variety VL-642 recorded maximum number of flowers per cluster (6.60) and Chiranjeevi showed minimum number of flower per cluster i.e. 4.86 days. Kundan was recorded highest number of clusters per plant (13.00). Lowest number of clusters per plant observed in variety Amlika (8.33). Maximum number of fruit per cluster recorded from variety VL-642 (5.80) whereas Variety NS 538 shows minimum fruit per cluster of 4.46. Variety VL-642 was recorded with maximum fruit weight of 108.09 g and fruit yield per plant (5.15 kg/plant). Lowest fruit yield was recorded in Chiranjeevi (1.93 kg/plant). Quality parameters are also found significant. Highest Ascorbic acid of 19.26 mg has been recorded from Kundan whereas DEB 2912 has shown maximum Lycopene content (5.16gm/100g of edible portion of fruit). From the present investigation, it can be concluded that for better quality fruits as
It is I
LLEGAL t
o cop
y, pri
nt or
save
any c
onten
t of th
is PDF,
in pa
rt or in
full,
on an
y retr
ieval
syste
m,
withou
t the E
XPRESS WRITTEN PERMISSIO
N of th
e cop
yrigh
t-hold
er

National Conference on Climate Change and Agricultural Production: Adapting Crops to Climate Variability and Uncertainty, 6th–8th April, 2017
[223]
well as for good production growing of tomato under polyhouse can be suggested. Among all eleven varieties VL-642 has been found promising in Gangetic new alluvial plains of West Bengal under protected cultivation.
REFERENCES [1] Lekshmi S L and Celine V A 2015.Evaluation of tomato hybrids for fruit, yield and quality traits under polyhouse conditions. International
Journal of Applied and Pure Science and Agriculture 1 (7):58-64. [2] Sharma V K and Singh T 2015.Performance evaluation of Tomato (Solanum Lycopersicum L.)Hybrids for Increased Productivity under
Polyhouse Conditions in Temperate Areas. Journal of Agriculture and Crops 1 (6): 68-74.
Impact of Tillage Systems, Cropping Systems, Nutrient Management and Mulch on Crop Productivity and Profitability
W.N. Narkhede*, R.N. Khandare, G.S. Khazi and M.J. Bende AICRP on Integrated Farming Systems
Vasantrao Naik Marathwada Krishi Vidyapeeth, Parbhani–431402, India E-mail: *[email protected]
Keywords: Cropping systems, Mulching, Minimum tillage, Nutrient management
INTRODUCTION
Soybean-Rabi Sorghum is one of the most dominant systems in Marathwada region. Diversification and intensification with suitable tillage operations (Zero/Minimum) is the only answer if farmers are to make their farming profitable as well as achieving higher cropping intensity. Tillage plays an important role in the nutrient storage and release from soil organic matter with conventional tillage, soil disturbance through tillage is a major cause of reduction in the number and stability of soil aggregates and subsequently organic matter depletion. So, present investigation was undertaken to assess the effects of resource conservation technologies, cropping system and crop residue on yields between different cropping systems.
MATERIALS AND METHODS
An experiment was initiated during 2012-13 at AICRP on Integrated Farming Systems, Vasantrao Naik Marathwada Krishi Vidyapeeth, Parbhani to study the effect of resource conservation technologies cropping systems and nutrient management on crop productivity and profitability in Marathwada region. The soil of the experimental site was clayey in texture, 143.5 kg/ha available N, 11.5 kg/ha available P and 340.5 available K. the experiment was in split-split plot design with three replications viz., Two tillage practices and four cropping systems as main plot treatments; T1: Minimum tillage, T2: Conventional tillage; C1: Soybean-Rabi sorghum, C2: Soybean- Wheat, C3: Maize- Gram, C4: Maize-Wheat. The two levels of mulch i.e., M1: No mulch, M2: with mulch 5 tonne /ha. And the levels of nutrients; N1:RDF, N2: 75% RDF were taken as sub-plot treatments. The doses of fertilizers were 30:60:0, 100:75:75, 100:50: 50 and 25:50:0 NPK kg/ha for soybean, maize, wheat and gram respectively. SEY were calculated on the basis of farm gate prices for each crop.
RESULTS AND DISCUSSION
The results revealed that tillage had significant effect in respect of SEY, GMR and NMR of sequences during individual years and on pooling the data. Conventional tillage recorded significantly highest SEY (108.37 q/ha) to the tune of 6.15% over minimum tillage. Same trend was observed in case of GMR and NMR. The transition from intensive to conservative tillage systems will require the modification of N dynamics in the soil
It is I
LLEGAL t
o cop
y, pri
nt or
save
any c
onten
t of th
is PDF,
in pa
rt or in
full,
on an
y retr
ieval
syste
m,
withou
t the E
XPRESS WRITTEN PERMISSIO
N of th
e cop
yrigh
t-hold
er

National Conference on Climate Change and Agricultural Production: Adapting Crops to Climate Variability and Uncertainty, 6th–8th April, 2017
[224]
plant systems on crop productivity and on efficiency of N fertilizer use (Jat et al.,(2012). Significantly highest soybean equivalent yield (SEY) (27.31 q/ha) was under Maize- Gram during the 2012-13, while in 2013-14 and 2014-15 Soybean-Rabi sorghum was significantly superior over the rest of the cropping systems. In case of net profit, Soybean-Rabi sorghum recorded significantly highest net profit returns during individual years and as well as in pooled data due to higher land use efficiency of this cropping sequence. Desai et al. (2014) also reported similar findings in relation with the cropping systems. SEY was significantly highest with additional fertilizer during 2012-13 (25.46 q/ha), 2013-14 (41.83 q/ha) and 2014-15 (38.61 q/ha) over 75% RDF, while in pooled results, 100% RDF recorded significantly more SEY (35.3 q/ha) over 75% RDF. The treatment with mulch application (M2) recorded significantly highest SEY. In pooled data, mulching (34.23 q/ha) recorded significantly higher SEY over no mulch. Mulching provided significantly more gross and net profit over no mulch. These results are in accordance with the findings of Jat et al. (2012).
REFERENCES [1] Desai L.J., Thanki J.D., Gudadhe N.N. and Dungarani R.A. 2014. Effect of cropping systems on crop productivity and profitability under
south Gujarat condition. Indian Journal of Ecology 41(2): 240-242. [2] Jat R.A., Wani, S.P., Singh S.P., Pathak P., Srinivas K and Velmurgan 2012.Effect of conservation agriculture on productivity and
economics of different cropping systems under rainfed condition in the semi arid tropics.3rd International congress 3:26-30.
Effect of Eucalyptus Bund Plantation on Yield of Agricultural Crops and Soil Properties in Semi-Arid Region of India
K.K. Bhardwaj1*, R.S. Dhillon1, K.S. Bangarwa1, Sushil Kumari1, V. Dalal1 and S.B. Chavan2
1Department of Forestry, CCS Haryana Agricultural University, Hisar–125004 India 2Central Agroforestry Research Institute, Jhansi–284001 India
E-mail: *[email protected]
Keywords: Eucalyptus bund plantation, Soil properties
INTRODUCTION
Trees under agroforestry besides providing the tree products, improves soil productivity through ecological and physico-chemical changes (Chauhan et al. 2012). Eucalyptusbased agroforestry system is most commonly accepted practice in India by the farmers for fulfilling the market demand of plywood, paper, pole and furniture industries. The boundary planting of Eucalytpus is preferred by farmers due to their less interference with agricultural operations. We studied the effect of Eucalyptus tereticornis bund plantingon the yield of agricultural crops and soil properties in Haryana.
MATERIALS AND METHODS
The study was conducted in 8 year old eucalyptus bund plantation of East-West and North-South directions at Hisarduring 2015-2016. Barley crop in rabi and dhaninha in kharif were raised in association with eucalyptus. The treatments consisted of six distances viz. 0-3, 3-6, 6-9, 9-12, 12-15 and 15-18 m at 3 m intervals from tree rows upto 18 m. The yield and yield attributing parameters for barley and dhanicha were recorded at different distances from eucalyptus. The soil samples were taken before sowing and after harvest of crops from field for soil analysis. The treatments were replicated four times using two factorial randomised block design. The differences among treatments were compared by applying test of significance at 5% probability.
It is I
LLEGAL t
o cop
y, pri
nt or
save
any c
onten
t of th
is PDF,
in pa
rt or in
full,
on an
y retr
ieval
syste
m,
withou
t the E
XPRESS WRITTEN PERMISSIO
N of th
e cop
yrigh
t-hold
er
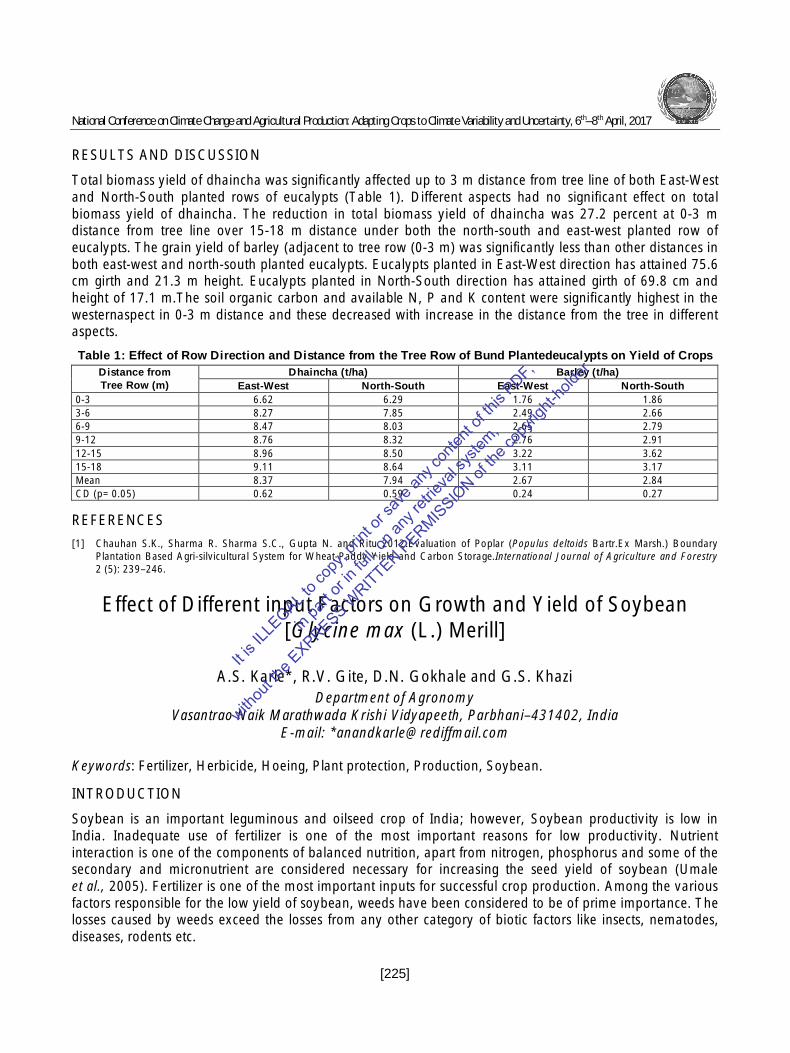
National Conference on Climate Change and Agricultural Production: Adapting Crops to Climate Variability and Uncertainty, 6th–8th April, 2017
[225]
RESULTS AND DISCUSSION
Total biomass yield of dhaincha was significantly affected up to 3 m distance from tree line of both East-West and North-South planted rows of eucalypts (Table 1). Different aspects had no significant effect on total biomass yield of dhaincha. The reduction in total biomass yield of dhaincha was 27.2 percent at 0-3 m distance from tree line over 15-18 m distance under both the north-south and east-west planted row of eucalypts. The grain yield of barley (adjacent to tree row (0-3 m) was significantly less than other distances in both east-west and north-south planted eucalypts. Eucalypts planted in East-West direction has attained 75.6 cm girth and 21.3 m height. Eucalypts planted in North-South direction has attained girth of 69.8 cm and height of 17.1 m.The soil organic carbon and available N, P and K content were significantly highest in the westernaspect in 0-3 m distance and these decreased with increase in the distance from the tree in different aspects.
Table 1: Effect of Row Direction and Distance from the Tree Row of Bund Plantedeucalypts on Yield of Crops Distance from Tree Row (m)
Dhaincha (t/ha) Barley (t/ha) East-West North-South East-West North-South
0-3 6.62 6.29 1.76 1.86 3-6 8.27 7.85 2.49 2.66 6-9 8.47 8.03 2.65 2.79 9-12 8.76 8.32 2.76 2.91 12-15 8.96 8.50 3.22 3.62 15-18 9.11 8.64 3.11 3.17 Mean 8.37 7.94 2.67 2.84 CD (p=0.05) 0.62 0.59 0.24 0.27
REFERENCES [1] Chauhan S.K., Sharma R. Sharma S.C., Gupta N. and Ritu 2012.Evaluation of Poplar (Populus deltoids Bartr.Ex Marsh.) Boundary
Plantation Based Agri-silvicultural System for Wheat-Paddy Yield and Carbon Storage.International Journal of Agriculture and Forestry 2 (5): 239–246.
Effect of Different input Factors on Growth and Yield of Soybean [Glycine max (L.) Merill]
A.S. Karle*, R.V. Gite, D.N. Gokhale and G.S. Khazi Department of Agronomy
Vasantrao Naik Marathwada Krishi Vidyapeeth, Parbhani–431402, India E-mail: *[email protected]
Keywords: Fertilizer, Herbicide, Hoeing, Plant protection, Production, Soybean.
INTRODUCTION
Soybean is an important leguminous and oilseed crop of India; however, Soybean productivity is low in India. Inadequate use of fertilizer is one of the most important reasons for low productivity. Nutrient interaction is one of the components of balanced nutrition, apart from nitrogen, phosphorus and some of the secondary and micronutrient are considered necessary for increasing the seed yield of soybean (Umale et al., 2005). Fertilizer is one of the most important inputs for successful crop production. Among the various factors responsible for the low yield of soybean, weeds have been considered to be of prime importance. The losses caused by weeds exceed the losses from any other category of biotic factors like insects, nematodes, diseases, rodents etc.
It is I
LLEGAL t
o cop
y, pri
nt or
save
any c
onten
t of th
is PDF,
in pa
rt or in
full,
on an
y retr
ieval
syste
m,
withou
t the E
XPRESS WRITTEN PERMISSIO
N of th
e cop
yrigh
t-hold
er

National Conference on Climate Change and Agricultural Production: Adapting Crops to Climate Variability and Uncertainty, 6th–8th April, 2017
[226]
MATERIAL AND METHODS
An experiment was initiated during 2015-16 at department of agronomy, Vasantrao Naik Marathwada Krishi Vidyapeeth, Parbhani. The objective of the study was to know the effect of different input factors alone or in combination on production of soybean. The area is characterized by fairly hot summer, moderately humid and warm monsoon with heavy rains. The soil of the experimental site was clayey in texture, 143.5 kg/ha available N, 11.5 kg/ha available P and 340.5 available K. The experiment was in randomized block design with three replications viz., T1:Whole Package (WP) means the application of fertilizers, herbicides, plant protection measures and hoeing as per the recommendations,T2:WP – Fertilizer, T3:WP – Herbicide, T4:WP – Hoeing,T5:WP – Plant Protection,T6:WP – Fertilizer + Herbicide,T7:WP – Fertilizer + Hoeing,T8:WP – Fertilizer + Plant Protection,T9:WP – Herbicide + Hoeing,T10:WP – Herbicide + Plant Protection,T11:WP – Hoeing + Plant Protection and T12:Control plot. The recommended dose of fertilizer was 30:60:30NPK kg/ha for soybean.
RESULTS AND DISCUSSION
It was observed from the data presented in Table 1 that plant height (cm), mean no. of functional leaves, branches, leaf area (dm2) and dry matter production per plant (g) increased progressively till the harvest. Adoption of whole package (T1) to soybean croprecorded more growth parameters than rest of treatments. But it was found at par with T4 and T5. The increase in growth attributes may be due to better uptake and translocation of plant nutrients to growing plants. Weed free plots in which herbicides are applied i.e. T1, T2, T4, T5, T7, T8, and T11 recorded significantly higher plant height, number of functional leaves, leaf area, number of branches and dry matter over the weedy plots i.e. T3, T6, T9, T10 and T12 where herbicides are not applied. Data presented in Table 1 indicated that hoeing increased yield of soybean due to less competition of weed and proper aeration of soil at critical growth stages of crop. Mechanical weed control (hand hoeing at 45 DAS) gave the highest soybean yield and lowest weed numbers. The significantly higher seed yield kg ha-1, straw yield kg ha-1, biological yield, and harvest index were reported by treatment whole package (T1) than rest of the treatment. Weed free plots recorded significantly seed yield kg ha-1; straw yield kg ha-1, biological yield, and harvest index were reported by weed free plots. Adoption of whole package (T1) to soybean crop recorded significantly higher seed yield (2523 kg ha-1), straw yield (3482 kg ha-1), biological yield (6005 kg ha-1) and harvest index (42%) than rest of the treatments.
Table 1: Growth and Yield of Soybean as Influenced by Different Treatments
Treatment Plant
Height (cm)
No. of Functional
Leaves
Leaf Area (dm2)
No. of Branches
Total Dry Matter Plant-1
Seed Yield
kg ha-1
Straw Yield kg ha-1
Biological Yield kg ha-1
Harvest Index %
T1 Whole Package (WP) 59.73 13.17 11.80 6.00 22.73 2523 3482 6005 42 T2 WP– Fertilizer 54.03 11.12 10.43 5.47 19.67 2097 3104 5201 40 T3 WP– Herbicide 52.13 10.00 10.33 5.40 19.33 2052 3057 5109 40 T4 WP– Hoeing 57.87 12.83 11.13 5.90 21.83 2379 3307 5687 42 T5 WP– Plant protection 56.57 12.53 11.00 5.80 21.33 2240 3136 5376 42 T6 WP– (Fertilizer + Herbicide) 46.77 5.40 8.23 3.97 18.83 1205 1843 3048 39
T7 WP– (Fertilizer + Hoeing)
48.73 9.37 8.90 5.27 19.50 1648 2389 4037 41
T8 WP– (Fertilizer+ Plant protection)
48.43 8.70 8.40 4.87 19.33 1509 2203 3713 41
T9 WP– (Herbicide + Hoeing) 46.67 8.50 8.03 4.73 19.07 1431 2117 3548 40
T10 WP – (Herbicide + Plant protection)
45.57 7.77 7.83 4.67 18.63 1317 1962 3278 40
T11 WP– (Hoeing + Plant protection)
49.20 8.00 9.93 5.33 19.70 1815 2577 4392 41
T12 Control plot 44.13 5.00 6.90 3.07 16.60 1018 1577 2595 39 C.D. at 5% 4.06 3.00 1.17 0.92 1.60 291 424 715 - General Mean 50.81 9.37 9.41 5.03 19.71 1769 2563 4332 41
REFERENCE [1] Umale V S, Apotikar V A, Kakade S U, Nemade S U and Kulkarni U S 2005. Studies on integrated weed control in soybean [Glycine max
(L.) Merrill]. Crop Research Hisar 29 (3): 416-420.
It is I
LLEGAL t
o cop
y, pri
nt or
save
any c
onten
t of th
is PDF,
in pa
rt or in
full,
on an
y retr
ieval
syste
m,
withou
t the E
XPRESS WRITTEN PERMISSIO
N of th
e cop
yrigh
t-hold
er

National Conference on Climate Change and Agricultural Production: Adapting Crops to Climate Variability and Uncertainty, 6th–8th April, 2017
[227]
Productivity and Economics of Soybean (Glycine Max L. Merill) as Influenced by Major Production Constraints
R.V. Gite, A.S. Karle*, G.S. Khazi and D.N. Gokhale
Department of Agronomy Vasantrao Naik Marathwada Krishi Vidyapeeth, Parbhani–431402, India
E-mail: *[email protected]
Keywords: Fertilizer, Herbicide, Hoeing, Plant protection, Production, Soybean.
INTRODUCTION
Soybean is an important leguminous and oilseed crop of India; however, Soybean productivity is low in India. Inadequate use of fertilizer is one of the most important reasons for low productivity. Nutrient interaction is one of the components of balanced nutrition, apart from nitrogen, phosphorus and some of the secondary and micronutrient are considered necessary for increasing the seed yield of soybean. (Dhaker et al., 2012).Fertilizer is one of the most important inputs for successful crop production. The losses caused by weeds exceed the losses from any other category of biotic factors like insects, nematodes, diseases, rodents etc. Hence, among the various factors responsible for the low yield of soybean, weeds have been considered as prime importance.
MATERIALS AND METHODS
An experiment was initiated during 2015-16 at Department of Agronomy, Vasantrao Naik Marathwada Krishi Vidyapeeth, Parbhani. The objective of the study was to know the effect of different input factors alone or in combination on productivity of soybean. The area is characterized by fairly hot summer, moderately humid and warm monsoon with heavy rains. The soil of the experimental site was clayey in texture, 143.5 kg/ha available N, 11.5 kg/ha available P and 340.5 available K. The experiment was in randomized block design with three replications viz., T1:Whole Package (WP) means the application of fertilizers, herbicides, plant protection measures and hoeing as per the recommendations,T2:WP – Fertilizer, T3:WP – Herbicide, T4:WP – Hoeing,T5:WP – Plant Protection,T6:WP – Fertilizer + Herbicide,T7:WP – Fertilizer + Hoeing,T8:WP – Fertilizer + Plant Protection,T9:WP – Herbicide + Hoeing,T10:WP – Herbicide + Plant Protection,T11:WP – Hoeing + Plant Protection and T12: Control plot. The recommended dose of fertilizer was 30:60:30 NPK kg/ha for soybean.
RESULTS AND DISCUSSION
The adoption of whole package (T1) to soybean crop recorded higher mean number of pods plant-1 (34.53) than rest of treatments but it was at par with T4 and T5. Significantly higher yield attributing character such as pod yield plant-1(g), seed yield plant-1(g), number of seeds plant-1, seed index, number of seeds pod-1, seed yield kg ha-1, straw yield kg ha-1, biological yield, and harvest index were reported by treatment whole package (T1) than rest of the treatment. Herbicide spray had controlled the weeds to minimum level. It means that the weeds were controlled during critical crop competition period in herbicide treatments. This has reflected in yield attributing characters and yield also. Effect of plant protection showed that adoption of whole package (T1) to soybean crop recorded significantly higher seed yield (2523 kg ha-1) as compared to treatment T5 (WP- plant protection), T8 and T11. Lowest seed yield (1018 kg ha-1) was observed in control (T12).Gross and net monetary returns of soybean were significantly influenced due to different input factors. Adoption of whole package (T1) to soybean recorded significantly highest gross (Rs. 95104 ha-1) and net
It is I
LLEGAL t
o cop
y, pri
nt or
save
any c
onten
t of th
is PDF,
in pa
rt or in
full,
on an
y retr
ieval
syste
m,
withou
t the E
XPRESS WRITTEN PERMISSIO
N of th
e cop
yrigh
t-hold
er
National Conference on Climate Change and Agricultural Production: Adapting Crops to Climate Variability and Uncertainty, 6th–8th April, 2017
[228]
monetary returns (Rs.60898 ha-1) as compared to rest of treatments and at par with treatment T4 (whole package–hoeing) Rs. 89689 ha1 and T5 (whole package– plant protection) Rs.84455 ha-1. Lowest gross monetary return of soybean was obtained by control (T12)of Rs. 38442 ha-1. Similar type of trend was observed in net monetary returns and B: C ratio. Adoption of whole package (T1) to soybean crop recorded significantly highest net monetary return, B: C ratio (2.8) and it was at par with T4 and T5. Lowest B: C ratio of soybean was obtained by control T12 (1.5).Adoption of whole package (T1) to soybean crop recorded significantly higher seed yield (2523 kg ha-1), straw yield (3482 kg ha-1), biological yield (6005 kg ha-1) and harvest index (42%) and yield attributes than rest of the treatments.
REFERENCES [1] Dhaker S C, Mundra S L and Nepaliya V 2010.Effect of weed management and sulphur nutrition on productivity of soybean. Indian
Journal of Weed Science 42 (3&4):232-234.
Effect of Nutrient Levels and Weed Management on Weed Dynamics and Yield of Hybrid Rice (Oryza sativa)
Manish Ranjan1, Md Riton Chowdhury2* and I.B. Pandey1 1Department of Agronomy, Dr. Rajendra Prasad Central Agricultural University, Pusa–800020, India
2AICRP on Sesame and Niger, IAS, University of Calcutta, Kolkata E-mail: *[email protected]
Keywords: Hybrid rice, Nutrient management, Weed management
INTRODUCTION
Nutrient management must be sound for achieving the production target in sustainable manner. Use of chemical fertilizer is the fastest way of counteracting the pace of nutrient mining. It promotes the growth and development of rice crop and is responsible for over 50 per cent of the crop yield increment. Weed is one of the most important negative factor limiting the rice production, which not only compete with crop for applied nutrients but also impair the quality of the produce. Besides yield reduction, weeds deplete nutrient a large amount of from soil. Weed management is an important component of plant protection improving the production potential of crops. It includes management of weeds in a way that the crop sustains its production potential without being harmed by the weeds.
MATERIALS AND METHODS
Keeping in view of the above facts, a field experiment was carried out at research farm of Rjendra Agricultural University, Pusa during Kharif season of 2013-14. The experiment was laid out in split-plot design and replicated thrice The treatments comprised three nutrient levels viz., 100: 50: 30 kg NPKha-1, 120: 60: 40 kg NPKha-1 and 140: 70: 50 kg NPKha-1 in main plot and five weed control treatments viz. weedy check, hand weeding (25 and 50 DAT), conoweeder (25 and 50 DAT), pretilachlor @ 0.5 kg a.i./ha (pre-emergence) and pyrazosulfuron @ 40 g a.i./ha (post-emergence) in sub-plot. The test was variety PRH-10.
RESULTS AND DISCUSSION
Among the three nutrient management treatments growth & yield attributes, yield and economics was noticed superior with the nutrient level F3but was found at par with F2and both proved their superiority over F1(Table 1). Nitrogen and protein content in grains were found non-significant with F3 showing the higher
It is I
LLEGAL t
o cop
y, pri
nt or
save
any c
onten
t of th
is PDF,
in pa
rt or in
full,
on an
y retr
ieval
syste
m,
withou
t the E
XPRESS WRITTEN PERMISSIO
N of th
e cop
yrigh
t-hold
er

National Conference on Climate Change and Agricultural Production: Adapting Crops to Climate Variability and Uncertainty, 6th–8th April, 2017
[229]
values followed by F2 and F1 was the inferior. Likewise, nitrogen and protein content under all weed management treatment resulted non-significant. Minimum weed count and weed dry weight was recorded at lowest level of fertilizer (100:50:30 kg NPK ha-1). However, application of 140: 70: 50 kg NPKha-1 attained maximum growth and recorded significantly higher yield than the lower levels of fertilizer(Table 1).Among the weed control treatments, hand weeding found most effective for suppressing the weeds and recorded significantly lower weed count and weed dry weight than other weed control treatments. Conoweeder was found equally effective with respect to yield indices and produce similar grain yield to hand weeding. Among the weed control treatments maximum net return per rupee of investment was recorded in conoweeder which was at par with pyrazosulfuron and pretilachlor and these three were significantly beaten hand weeding. Whereas, the net return per rupee of investment recorded in hand weeding and weedy check did not differ significantly(Table 1). So, it can be concluded that application of 120: 60: 40 kg NPK/ha was worked out to be economic dose of fertilizer for hybrid rice under Bihar condition. Use of conoweeder and herbicides (pyrazosulfuron and pretilachlor) were found economically viable weed control method. Similar result was also reported by Jayaveda et al. (2009) and Sadhana and Velayutham (2012).
Table 1: Effect of Different Nutrient Levels and Weed Management Practices on Yield and Economics of Hybrid Rice
Treatment Grain Yield (q/ha)
Nitrogen Content (%)
Protein Content (%)
Weed Dry Biomass (g/m2)
Weed Control Efficiency (%)
Net Return/ Rupee Investment (Rs/Re)
Nutrient Levels F1 52.30 1.029 6.46 10.00
(99.57) - 1.56
F2 55.62 1.033 6.48 10.39 (107.49)
- 1.66
F3 57.73 1.036 6.50 10.69 (113.91)
- 1.69
SEm (±) 0.78 0.03 0.08 0.07 - 0.04 CD (P=0.05) 3.07 NS NS 0.27 - NS
Weed Management W1 45.20 1.018 6.40 14.69
(215.58) - 1.36
W2 60.84 1.045 6.53 7.30 (52.81)
75.50 1.44
W3 59.65 1.041 6.50 8.56 (72.85)
66.20 1.89
W4 54.06 1.028 6.46 10.23 (104.27)
51.63 1.74
W5 56.33 1.036 6.47 9.52 (90.29)
58.11 1.77
SEm (±) 1.06 0.06 0.10 0.09 - 0.09 CD (P=0.05) 3.12 NS NS 0.28 - 0.28
Interaction (Nutrient Levels × Weed Management) NS NS NS NS - NS
REFERENCES [1] Jayadeva H.M., Bhairappanavar S.T., Somasheharappa P.R. and Rangaswamy B R 2009.Efficacy of Azimsulfuron for Weed control in
transplanted rice. Indian Journal of Weed Science 41 (3 & 4): 172-175 [2] Sadhana R B and Velayutham A 2012. Weed management practices on nutrient uptake, yield attributes and yield of rice under system of
rice intensification. Madras Agricultural Journal 99(1-3): 51-54
It is I
LLEGAL t
o cop
y, pri
nt or
save
any c
onten
t of th
is PDF,
in pa
rt or in
full,
on an
y retr
ieval
syste
m,
withou
t the E
XPRESS WRITTEN PERMISSIO
N of th
e cop
yrigh
t-hold
er

National Conference on Climate Change and Agricultural Production: Adapting Crops to Climate Variability and Uncertainty, 6th–8th April, 2017
[230]
Morphological Characterisation and Media Preferences in Wilsonomycescarpophilus, the Causal Agent of Shot Hole
Disease of Stone Fruits in Kashmir
Asha Nabi*, M.D. Shah, B.A. Padder, M.S. Dar and Mushtaq Ahmad Plant Virology and Molecular Pathology Laboratory, Division of Plant Pathology, Sher-e-Kashmir University of Agricultural Sciences and Technology of Kashmir,
Shalimar, Srinagar-190 025, India E-mail: *[email protected]
Keywords: Morphological characterisation, Wilsonomycescarpophilus, Stone fruits, Shot hole
INTRODUCTION
Shot hole blight caused by Wilsonomycescarpophilus is an economically important disease of peach, nectarine, apricots, almonds, plums and cherries. Knowledge of variability of the fungal population associated with an infection improves the disease management strategies. Therefore, an attempt to carry out nutritional studies and morphological characterisation was made.
MATERIALS AND METHODS
Twenty five isolates of the pathogen were sampled from different stone fruits (peach, plum, apricot, almond) and cherry grown in different areas of three districts: Srinagar, Ganderbal and Baramulla in the year 2011-2012. Pathogenicity tests of isolates were carried out by inoculating them on respective hosts using detached leaf technique to prove the Koch’s postulates. Colony characteristics such as growth type, type of margins and colony colour of different isolates were assessed on potato dextrose agar medium (PDA) and colony diameter. Colony diameter, vegetative growth rate was recorded on three different media viz., PDA (self prepared), PDA (HiMedia, BioSciences) and Asthana and Hawker’s media and at different time intervals (2 to 10 days after incubation).
RESULTS AND DISCUSSION
All the isolates sampled were found pathogenic when inoculated on respective hosts. Different isolates of Wilsonomycescarpophilus cultured on potato dextrose agar medium showed significant variations in their colony characteristics. Isolates exhibited significant variations in terms of colony diameter. The highest average colony diameter (43.4 mm) was recorded in WcS5 followed by WcS3. PDA (self prepared) was the best medium followed by Asthana and Hawker’s medium and PDA (Hi-Media) (Table 1). On PDA (self prepared), the maximum colony diameter was recorded in isolates WcS8. On Asthana and Hawker’s medium WcS5 showed maximum colony diameter and isolate WcS5 on PDA (Hi-Media), These resuts indicate that isolates vary in their nutritional requirements. Significant variations were observed in growth rates of the isolates also. The overall growth rate increased upto sixth day of incubation and then started decreasing afterwards. Moreover, growth rates of different isolates peaked at different intervals. Wilsonomycescarpophilus exhibited remarkable morphological variation and variation in nutritional requirements implicating that there is high diversity in shot hole pathogen in Kashmir. This variation may be attributed to adaptation of Wilsonomycescarpophilus to diverse hosts and different agroclimatic conditions of geographical areas.
It is I
LLEGAL t
o cop
y, pri
nt or
save
any c
onten
t of th
is PDF,
in pa
rt or in
full,
on an
y retr
ieval
syste
m,
withou
t the E
XPRESS WRITTEN PERMISSIO
N of th
e cop
yrigh
t-hold
er

National Conference on Climate Change and Agricultural Production: Adapting Crops to Climate Variability and Uncertainty, 6th–8th April, 2017
[231]
Table 1: Colony Diameter of Different Wilsonomycescarpophilus Isolates on Different Culture Media Isolate No.$ Colony Diameter (mm) on Different Media after 10 Days of Incubation* Mean
Asthana and Hawker’s PDA (Hi-Media)
PDA (Prepared in Lab)
WcS1 27.9 27.6 39.1 31.5f WcS2 35.2 30.5 48.6 38.1c WcS3 43.0 36.5 49.4 43.0a WcS4 41.6 30.0 47.0 39.5b WcS5 40.8 39.0 50.4 43.4a WcS6 37.0 28.2 44.4 36.5d WcS7 36.4 27.5 38.4 34.1e WcS8 42.3 25.4 52.6 40.1b WcS9 40.6 28.5 49.0 39.4b WcS10 34.8 27.6 33.4 31.9f WcS11 41.6 28.0 36.4 35.3d WcS12 37.6 23.2 45.6 35.5d WcG1 42.9 27.3 50.7 40.3b WcG2 42.0 27.2 44.8 38.0c WcG3 36.0 30.6 45.4 37.3c WcG4 38.2 34.8 47.0 40.0b WcG5 43.5 25.2 44.2 37.6c WcG6 39.9 25.2 45.4 36.8d WcB1 39.7 37.2 46.6 41.2b WcB2 43.0 22.8 37.2 34.3e WcB3 40.4 26.0 51.4 39.3b WcB4 37.2 24.2 45.8 35.7d WcB5 38.4 31.7 30.2 33.4e WcB6 39.9 25.4 22.0 29.1g WcB7 42.2 23.4 42.8 36.1d Mean 39.3 28.5 43.5
CD (0.05) Isolate: 1.9 Media: 0.7 Isolate x Media: 3.3
Effects of Biofertilizers on Yield and Protein Content of Pearlmillet (Pennisetum glaucum L.)
Durgesh Singh*, Krishna Raghuvanshi, Abhishek Sagar, Asheesh Chaurasiya, S.K. Pandey and P.J. George
Department of Agronomy, SHIATS, Allahabad–211007, India E-mail: *[email protected]
Keywords: Pseudomonasfluorescens, Azotobacterchroococcum, Azospirillumlipoferum, Acetobacterdiazotrophicus, Trichoderma viride and Pearlmillet.
INTRODUCTION
Pearlmillet [Pennisetum glaucum (L.)] is largely grown for grain and fodder purpose and is most drought tolerant crop which able to grow under wide range of temperature. More use of chemical inputs in agriculture causes more degradation in soil and food materials as well as contribute to climate change. Soil microbes play an important role in many critical ecosystem processes, including nutrient cycling and homeostasis, decomposition of organic matter, as well as promoting plant health and growth as bio-fertilization. In pearlmillet crop inoculation of nitrogen fixing and phosphate solubilising microorganisms alone or in combination increased plant height, number of tillers and ultimately the yield (Saxena, 1997). Chemical
It is I
LLEGAL t
o cop
y, pri
nt or
save
any c
onten
t of th
is PDF,
in pa
rt or in
full,
on an
y retr
ieval
syste
m,
withou
t the E
XPRESS WRITTEN PERMISSIO
N of th
e cop
yrigh
t-hold
er

National Conference on Climate Change and Agricultural Production: Adapting Crops to Climate Variability and Uncertainty, 6th–8th April, 2017
[232]
fertilizers needed for millet can reduce by 50 percent using biofertilizers without loss in the yield (El- Kholy and Gomaa 2000). Therefore, by the use of biofertilizers we can get sustainable production with less cost and mitigation of climate change related problems.
MATERIALS AND METHODS
A field experiment was conducted during the rainy (Kharif) season 2014 at Sam Higginbottom Institute of Agriculture, Technology & Sciences, Allahabad, India, to study the effects of biofertilizers on yield and protein content of pearlmillet (Pennisetumglaucum L.). The diazotrophic bacteria namely-Pseudomonasfluorescens (10 g kg-1 of seed), Azotobacterchroococcum (25 g kg-1 of seed), Azospirillumlipoferum (10 ml kg-1 of seed)and Acetobacterdiazotrophicus (20 g kg-1 of seed) one fungi-Trichoderma viride (10 g kg-1 of seed) alone and in combinations were used as seed treatment for UMA 7111 variety of pearlmillet. The experiment was in randomized block design with three replications. The inoculated seeds were sown in the field at a spacing of 45×15 cm. Nitrogen and phosphorus were applied uniformly to each treatment @ 50 and 30 kg ha-1 through urea and diammonium phosphate respectively. The soil of the experimental field was sandy loam in texture having pH 7.4 with 188.3 kg N, 34.5 kg P2O5 and 130.5 kg K2O ha-1.
RESULTS AND DISCUSSION
The grain yield, test weight, B:C ratio and protein content of pearlmillet exhibited significant variation due to use of biofrtilizers. The maximum grain yield (3.01 t ha-1), test weight (14.07 g), B:C ratio (1.60) and protein content(13.43 %), was in P.fluorescens+A. chroococcum+A. lipoferum+A. diazotrophicus + T. Viride), while lowest was observed in control. The increase in yield may be attributed to increased uptake of nitrogen and phosphorus by the plants, which was made available through nitrogen fixation and phosphate solubalization by the microorganisms. Variousresults obtained proved the efficacy of nitrogen fixing and phosphate solubilizing microorganisms to enhance growth and yield of pearlmillet crop with least investment on chemical inputs. Apart from these it also maintain physical, biological and chemical condition of soil. Thus by adopting biofertilizers farmer can get better yield and benefits with limited chemical use on one hand and contribute to a pollution free environment on the other hand.
Table 1: Effects of Biofertilizers on Grain Yield, Test Weight, Net Returns, B:C Ratio and Protein Content of Pearlmillet Crop
Treatments Grain yield (t ha-1)
Test Weight (g) Net Returns ( × ha-1)
B: C Ratio Protein Content (%)
Pseudomonas fluorescens 2.76 9.77 29439 1.35 10.24 Azotobacterchroococcum 2.94 12.90 33128 1.52 10.62 Azospirillumlipoferum 2.74 10.03 27333 1.25 10.73 Acetobacter diazotrophicus 2.73 10.30 27003 1.24 9.43 Trichoderma viride 2.78 9.83 29689 1.36 9.21 P.fluorescens + A.chroococcum 2.82 12.10 31163 1.43 10.51 P.fluorescens + A.lipoferum 2.08 10.27 18226 0.83 11.43 P.fluorescens + A. d. 2.10 10.07 19655 0.90 9.15 P.fluorescens + T.viride 2.01 9.80 18355 0.84 10.45 A.chroococcum + A.lipoferum 2.02 11.47 17723 0.81 12.78 A.chroococcum + A. d. 2.54 11.40 25996 1.19 11.16 A.chroococcum + T. viride 2.45 11.60 24869 1.14 10.02 A.lipoferum + A. d. 2.97 13.37 33760 1.55 12.10 A.lipoferum + T. viride 2.74 11.93 26531 1.21 9.64 A.d.+ T. viride 2.72 10.73 28080 1.29 10.13 P.f.+ A.c. + A. l. + A. d.+ T. v. 3.01 14.07 35123 1.60 13.43 Un-inoculated (control) 1.68 8.37 12264 0.56 8.45 CD (p= 0.05) 0.39 3.09 - - -
P. f. - Pseudomonas fluorescens, A. c. - Azotobacter chroococcum, A. l. - Azospirillum lipoferum, A.d. - Acetobacter diazotrophicus and T. v. - Trichoderma viride.
It is I
LLEGAL t
o cop
y, pri
nt or
save
any c
onten
t of th
is PDF,
in pa
rt or in
full,
on an
y retr
ieval
syste
m,
withou
t the E
XPRESS WRITTEN PERMISSIO
N of th
e cop
yrigh
t-hold
er

National Conference on Climate Change and Agricultural Production: Adapting Crops to Climate Variability and Uncertainty, 6th–8th April, 2017
[233]
REFERENCES [1] El-Kholy M A and Gomaa A M 2000. Biofertilizers and their impact on forage yield and N-content of millet under low level of mineral
fertilizers. Annals of Agricultural Science, Moshtohor 38 (2): 813–822. [2] Sexsena A 1997.Response of pearlmillet to inoculation with biofertilisers in the Indian arid zone.Proceedings- Symposium-Recent
Advances in Arid Ecosystem,Jodhpur, India,March 3-5,1997,pp 283-286.
Influence of Pressurised Irrigation with Fertigation on Nutrient Uptake, Yield and Quality Parameters of Groundnut
Jeetendra Kumar Soni1*, N. Asoka Raja, Vimal Kumar2 and Ashutosh Kumar3 1Department of Agronomy, 2Department of A.C.R.C.
1,2Tamil Nadu Agricultural University, Coimbatore–641003, India 3Department of Vegetable and Floriculture,
Bihar Agricultural University, Sabour–813210, India E-mail: *[email protected]
Keywords: Groundnut, Pressurized irrigation, Fertigation, Nutrient uptake, Yield, Quality
INTRODUCTION
Groundnut (Arachis hypogaea L.) occupies a predominant position in Indian oilseed economy. It ranks first in area and production with respect to the total oil seeds production in the country. In order to achieve sustained production under changing climate, the most important crop management factors i.e., irrigation and fertilization must be efficiently utilized by farmers. Thus, the use of pressurized irrigation comprisesdrip and micro sprinkler offers a great degree of control over water and fertilizer application to meet the requirement of crops (El-Habbasha et al., 2014). In view of the above, an investigation was undertaken to assess the influence of pressurised irrigation with fertigation on nutrient uptake, yield and quality parameters of groundnut.
MATERIALS AND METHODS
A field experiment was carried out at TNAU, Coimbatore, during 2015 with groundnut variety TMV 13 in a randomized block designwith threereplications comprising of 11 treatments. The recommended dose of fertilizer (RDF) at 25: 50: 75 kg NPK ha-1 with row spacing of 30 x 10 cm was maintained. Drip and micro sprinkler irrigation was based on daily pan evaporation (PE) and fertigation was based on nutrient uptake pattern at different growth stage of groundnut as suggested by Loganathan and Krishnamoorthy (1977), at once in three days interval. Surface irrigation at 0.8 IW/CPE ratio with 5cm depth of water. The observations on nutrient uptake (kg ha-1), yield (kg ha-1) and quality parameters viz., oil content (%), oil yield (kg ha-1), crude protein content (%) and crude protein yield (kg ha-1) were recorded using standard method harvest stage respectively. The soil was sandy, clay, loam type and rainfall received during crop growing period was 4.3mm only.
RESULTS AND DISCUSSION
Among different treatments nitrogen, phosphorus and potassium uptake at harvest were recorded significantly high 128.19, 25.16 and 98.06 kg ha-1 respectively under drip irrigation at 100% PE with fertigation at 100% RDF as WSF (T1) followed by drip irrigation at 75% PE with fertigation at 100% RDF as WSF (T2) with 110.37, 22.38 and 88.47 kg ha-1 respectively (Table 1).The surface irrigation (5 cm depth) at
It is I
LLEGAL t
o cop
y, pri
nt or
save
any c
onten
t of th
is PDF,
in pa
rt or in
full,
on an
y retr
ieval
syste
m,
withou
t the E
XPRESS WRITTEN PERMISSIO
N of th
e cop
yrigh
t-hold
er

National Conference on Climate Change and Agricultural Production: Adapting Crops to Climate Variability and Uncertainty, 6th–8th April, 2017
[234]
0.8 IW/ CPE ratio with soil application at 100% RDF as NF (T11) recorded significantly lower N, P and K uptake compare to all treatments. The data pertaining to dry pod yield (kg ha-1) revealed that drip irrigation at 100% PE with fertigation at 100% RDF as WSF (T1) recorded significantly higher pod yield (3495 kg ha-1). The drip irrigation at 100% PE with fertigation at 100% RDF as WSF (T1) registered higher oil content (51.80%), oil yield (1339 kg ha-1) and crude protein yield (706 kg ha-1) however, crude protein content (27.32%) was statistically at par with drip irrigation at 75% PE with fertigation at 100% RDF as WSF (T2: 26.32%), The significantly lower yield and quality parameters were observed in surface irrigation (5 cm depth) at 0.8 IW/ CPE ratio with soil application at 100% RDF as NF.
Table 1: Nutrient Uptake, Oil Content (%) and Crude Protein Content (%) as Influenced by Pressurizedirrigation with Fertigation at Different Levels of Irrigation and Fertilizers in Groundnut Irrigation
with Fertigation at Different Levels of Irrigation and Fertilizers in Groundnut(T11) Treatments Nutrient Uptake (kg ha-1) Oil
Content (%) Crude Protein Content (%) N Uptake P Uptake K Uptake
T1 DI at 100% PE + fertigation at 100% RDF with WSF 128.19 25.16 98.06 51.80 27.32 T2 DI at 75% PE + fertigation at 100% RDF with WSF 110.37 22.38 88.47 51.10 26.32 T3 DI at 100% PE + fertigation at 75% RDF with WSF 98.63 19.08 80.11 49.03 25.14 T4 DI at 75% PE + fertigation at 75% RDF with WSF 84.20 14.10 64.34 45.52 22.89 T5 DI at 100% PE + fertigation at 100% RDF with NF 99.66 19.06 80.30 47.86 24.85 T6 MS at 100% PE + fertigation at 100% RDF with WSF 105.77 20.22 82.83 50.02 25.90 T7 MS at 75% PE + fertigation at 100% RDF with WSF 92.57 18.46 75.74 46.87 24.34 T8 MS at 100% PE + fertigation at 75% RDF with WSF 89.39 17.73 71.31 46.48 23.57 T9 MS at 75% PE + fertigation at 75% RDF with WSF 82.58 13.01 60.23 44.52 22.93 T10 MS at 100% PE + fertigation at 100% RDF with NF 84.65 17.18 71.86 45.60 23.11 T11 SI (5 cm depth) + soil application at 100% RDF with NF 76.69 11.15 54.20 44.30 22.61
CD (p=0.5) 6.91 2.03 7.51 2.56 2.12 DI - Drip Irrigation, MS- micro sprinkler, WSF- Water soluble fertilizers, NF- Normal fertilizers, SI-Surface irrigation.
REFERENCES [1] Loganathan S and Krishnamoorthy K K 1977.Total uptake of nutrients at different stages of the growth of groundnut and the ratios in
which various nutrient elements exist in groundnut plant.Plant and Soil 46: 565-570. [2] El-Habbasha S F, Okasha E M, Abdelraouf R E and Mohammed A S H 2014. Effect of pressured irrigation systems, deficit irrigation and
fertigation rates on yield, quality and water use efficiency of groundnut. International Journal of Chemical Technology Research 07 (01): 475-487.
Interaction Effect of Foliar Spray of Boron, Zinc and Iron on Yield of Gynoecious Cucumber under Polyhouse Condition
Dharmendra Kumar Patidar*, Pravin Singh and Balram Meena College of Horticulture & Forestry, Jhalarapatan, Jhalawar–326023, India
E-mail: *[email protected]
Keywords: Gynoecious Cucumber, Boron, Foliar spray, Polyhouse
INTRODUCTION
Cucumber (Cucumis sativus L.) is one of the important vegetable grown in field as well as polyhouse condition in India. It is grown for its tender fruits for fresh consumption as salad or as pickling cucumber. The deficiency of micronutrient is the primary cause of crop losses worldwide. Deformed fruits and nutrional disorders are major shackles in cucumber cultivation especially under polyhouse condition. Application of micronutrients at proper stage helps in correcting micronutrients deficiency and improves yield and quality of cucumber.
It is I
LLEGAL t
o cop
y, pri
nt or
save
any c
onten
t of th
is PDF,
in pa
rt or in
full,
on an
y retr
ieval
syste
m,
withou
t the E
XPRESS WRITTEN PERMISSIO
N of th
e cop
yrigh
t-hold
er

National Conference on Climate Change and Agricultural Production: Adapting Crops to Climate Variability and Uncertainty, 6th–8th April, 2017
[235]
MATERIALS AND METHODS
The experiment was conducted in factorial randomized block design with three replications under naturally ventilated polyhouse condition during 2014 – 2015 at College of Horticulture and Forestry, Jhalarapatan City, Jhalawar (Rajasthan).The present experiment comprised of 27 treatment combinations including three levels of boron (control, 20 and 40 ppm), three levels of zinc (control, 20 and 40 ppm) and three levels of iron (control, 40 and 80 ppm). The crop was grown on raised beds at 60 x 30 cm spacing on drip system. Each treatment consisted of 10 plants for which 10-seeds were sown in a two rows of 1.5 meter length laid out in factorial randomized block design with three replications.
RESULTS AND DISCUSSION
The variation in yield of cucumber might be due to different levels of application of boron, zinc and iron might had rapidly provided nutrients in proper amount, required by plants for its growth and development. Essential micronutrients like boron, zinc and iron play an important role in physiology of crop and these are being a part of enzyme system or catalyst in enzymatic reactions. Amongst these role of micronutrients (boron, zinc and iron) seems to be one of the factors that may enhance fruit and seed yield. Similar findings earlier reported in tomato by Kumari, 2012 and Sainju et al., 2003.
Table 1: Interaction Effect of Foliar Spray of Boron, Zinc and Iron on Yield Attributes S. No. Treatments Number of Fruits
Per Plant Average Fruit
Weight (g) Volume of Fruit
(cc) Yield Per Plant (kg)
0 B0 Zn0 Fe0 20.80 106.88 111.47 2.22 1 B0 Zn0 Fe40ppm 25.06 108.08 113.37 2.71 2 B0 Zn0Fe80ppm 26.67 108.44 113.67 2.89 3 B0 Zn20ppmFe0 24.20 108.16 113.47 2.62 4 B0 Zn20ppm Fe40ppm 28.00 110.88 115.90 3.10 5 B0 Zn20ppm Fe80ppm 29.00 111.55 116.53 3.23 6 B0 Zn40ppm Fe0 25.13 108.45 113.73 2.73 7 B0 Zn40ppm Fe40ppm 30.13 111.73 116.70 3.37 8 B0 Zn40ppm Fe80ppm 31.47 112.78 117.90 3.55 9 B20ppm Zn0 Fe0 23.60 107.00 111.93 2.53
10 B20ppm Zn0 Fe40ppm 27.60 109.53 114.57 3.02 11 B20ppm Zn0 Fe80ppm 28.73 109.84 114.90 3.16 12 B20ppm Zn20ppm Fe0 27.80 108.16 113.22 3.02 13 B20ppmZn20ppmFe40ppm 32.40 118.53 123.70 3.84 14 B20ppmZn20ppmFe80ppm 33.93 121.26 116.15 4.11 15 B20ppmZn40ppmFe0 29.13 109.45 114.50 3.19 16 B20ppmZn40ppmFe40ppm 34.00 121.21 126.30 4.12 17 B20ppmZn40ppmFe80ppm 36.00 122.67 127.87 4.42 18 B40ppmZn0 Fe0 25.00 107.51 112.60 2.69 19 B40ppmZn0Fe40ppm 29.20 110.40 115.45 3.22 20 B40ppmZn0 Fe80ppm 30.27 111.65 116.72 3.38 21 B40ppmZn20ppmFe0 29.13 109.32 114.40 3.18 22 B40ppmZn20ppmFe40ppm 33.46 124.03 129.13 4.15 23 B40ppmZn20ppmFe80ppm 35.93 125.98 131.11 4.53 24 B40ppmZn40ppmFe0 30.40 109.60 114.70 3.33 25 B40ppmZn40ppmFe40ppm 40.03 129.17 134.27 5.17 26 B40ppmZn40ppmFe80ppm 43.13 130.33 135.43 5.62
C.D. (5%) 0.44 4.21 3.74 0.125
REFERENCES [1] Kumari S 2012.Effect of micronutrients on quality of fruit and seed in tomato (SolanumlycopersicumL.). International Journal of Farm
Sciences 2 (1): 43-46. [2] Sainju U M, Dris R and Singh B2003. Mineral nutrition of tomato. Journal of Food Agriculture and Environment 2 (1):176 –183.
It is I
LLEGAL t
o cop
y, pri
nt or
save
any c
onten
t of th
is PDF,
in pa
rt or in
full,
on an
y retr
ieval
syste
m,
withou
t the E
XPRESS WRITTEN PERMISSIO
N of th
e cop
yrigh
t-hold
er

National Conference on Climate Change and Agricultural Production: Adapting Crops to Climate Variability and Uncertainty, 6th–8th April, 2017
[236]
Influence of Potassium and Zinc Application on Growth and Yield Traits of Sweet Potato (Ipomoea batatas L.) cv. CO-34
Pravin Singh1*, Dharmendra Kumar Patidar1 and Om Prakash Prajapat2 1Department of Vegetable Science, College of Horticulture and Forestry, Jhalawar–326023, India
2Division of Agronomy, Rajasthan Agriculture Research Institute, Durgapura, Jaipur, India E-mail: *[email protected]
Keywords: Sweet potato, Potassium, Zinc.
INTRODUCTION
Sweet potato (Ipomoea batatas L.) is an herbaceous dicotyledonous plant with creeping, perennial vines and adventitious roots crop. Potassium appears to be the most important nutrient in the production of sweet potato as its application increases yield by the formation of larger sized tubers. Foliar Zinc is an important element with specific and essential physiological functions in plants; required in small quantities for normal growth and development of plants. The aim of this work is to investigate effect of potassium and zinc on growth and yield of sweet potato as till traditional practices is followed as it invites low yield.
MATERIALS AND METHODS
A field experiment was conducted during rabi 2014 with sweet potato crop (cv.CO-34) at Department of Vegetable Science, College of Horticulture and Forestry, Jhalawar (Rajasthan, India). The black cotton soil of the experimental site was clay and loam in texture, having pH 6.6, EC 0.56 dSm-1 and organic carbon 0.58 per cent. The soil contained 218.3, 28.01 and 2.10.6 kg ha-1 of available N, P2O5 and K2O, respectively. The treatment consisted of combination of four levels of potassium (0, 80, 100 and 120 kg/ha through muriate of potash (MOP) and four levels of zinc (control i.e. water spray, 10, 20 and 30 ppm) through zinc sulphate. zinc was two foliar applications at 45 and 90 days after transplanting.
RESULTS AND DISCUSSION
Significant differences were recorded 120 kg K2O/ha with 30 ppm Zn was the best in all the characters (Table 1). Potassium is an important nutrient for plant meristematic growth and physiological functions, including regulation of water and gas exchange in plants, protein synthesis, enzyme activation, photosynthesis and carbohydrate translocation in plants. Similar, Zinc is main building part of some enzymes viz. alcohol dehydrogenase, carbonic anhydrase, superoxide dismutase that is needed for the root development and increasing the absorption of carbon dioxide per leaf area unit and this increasing the photosynthesis and biomass production and yield. The interaction effect of potassium and zinc responded positively to K and Zn increasing rate (Abd El-Baky et al. 2010).
It is I
LLEGAL t
o cop
y, pri
nt or
save
any c
onten
t of th
is PDF,
in pa
rt or in
full,
on an
y retr
ieval
syste
m,
withou
t the E
XPRESS WRITTEN PERMISSIO
N of th
e cop
yrigh
t-hold
er

National Conference on Climate Change and Agricultural Production: Adapting Crops to Climate Variability and Uncertainty, 6th–8th April, 2017
[237]
Table 1: Effect of Potassium and Zinc on Growth and Yield Attributes of Sweet Potato Treatments Chlorophyll
Content (mg/100g)
Number of Branches Per
Vine at 90 DAT
Number of Tubers Per Plant
Length of Tuber (cm)
Diameter of Tuber (cm)
Yield per Plant (g)
Interaction (K × Zn) K0Zn0 28.32 8.23 2.94 10.92 3.21 473 K0Zn1 29.38 10.07 3.30 11.35 3.71 523 K0Zn2 30.45 10.44 3.24 12.18 3.92 545 K0Zn3 31.57 13.33 3.58 18.62 4.41 590 K1Zn0 28.85 10.68 3.23 12.28 4.40 626 K1Zn1 28.97 11.31 3.80 13.97 4.61 681 K1Zn2 31.16 11.63 3.97 15.93 4.65 717 K1Zn3 34.08 11.72 4.10 16.77 4.96 758 K2Zn0 28.55 11.80 4.27 12.69 5.13 780 K2Zn1 31.10 12.40 4.40 14.47 5.16 813 K2Zn2 32.46 12.68 4.57 16.77 5.15 837 K2Zn3 33.83 13.89 4.53 17.28 5.29 880 K3Zn0 31.51 13.08 4.43 14.00 5.33 892 K3Zn1 32.85 13.99 4.57 15.54 5.60 919 K3Zn2 34.51 14.60 4.86 17.71 5.86 971 K3Zn3 37.00 16.28 4.52 19.82 5.97 1102 S.Em± 3.10 0.50 0.10 0.74 0.11 20.11
C.D. at 5% 9.00 NS 0.30 2.14 0.32 40.12 NS=Non Significant
REFERENCE [1] Abd El-Baky M M H, Ahmed A A, El-Nemr M A and Zaki M F 2010.Effect of potassium fertilizer and foliar zinc application on yield and
quality of sweet potato. Research Journal of Agriculture and Biological Sciences 6 (4):386-394.
Effect of Combining Organic and Inorganic Fertilizers and Weed Management for Sustained Productivity of Aromatic Rice
Pooja Kumari* and D.K. Roy Department of Agronomy,
Dr. Rajendra Prasad Central Agricultural University, Pusa–848 125, India E-mail: *[email protected]
Keywords: Aromatic Rice, Integrated nutrient management (INM), Integrated weed management (IWM).
INTRODUCTION
Rice is cultivated as rainfed crop under transplanted ecosystem during Kharif season. Several field research reports have indicated that high and sustainable crops yields are only possible with integrated use of mineral fertilizer with organic manure (Satyanarayana et al., 2002). The integration of organic sources and synthetic sources of nutrients not only supply essential nutrients but also have some positive interaction with chemical fertilizers to increase their efficiency and thereby reduce environmental hazards. Weeds are problem in rice production and uncontrolled weeds reduce yield. Therefore, principles of IWM should provide the foundation for developing optimum weed control systems.
MATERIALS AND METHODS
The study was conducted at Dr. Rajendra Prasad Central Agricultural University, Pusa, Bihar in kharif 2016. The experiment was laid out in split plot design with eight treatments. The variety used was Rajendra
It is I
LLEGAL t
o cop
y, pri
nt or
save
any c
onten
t of th
is PDF,
in pa
rt or in
full,
on an
y retr
ieval
syste
m,
withou
t the E
XPRESS WRITTEN PERMISSIO
N of th
e cop
yrigh
t-hold
er

National Conference on Climate Change and Agricultural Production: Adapting Crops to Climate Variability and Uncertainty, 6th–8th April, 2017
[238]
Bhagwati. The soil was silty clay loam having pH 8.4. The fertilizer dose was 120-60-40 kg N-P2O5-K2O/ha. Data pertaining to various parameters i.e weeds and growth, yield and yield attributes of crop were subjected to statistical analysis.
RESULTS AND DISCUSSION
The lowest weed population (13.60 /m2) and weed dry weight (26.12 g/m2) were recorded in 50% RDN through inorganic source + 50% RDN through vermicompost which were significantly superior over rest of the treatments in main plots and the lowest weed population (10.89 /m2) and weed dry weight (20.20 g/m2) were recorded in weed free treatment (2 HW at 20 & 40 DAT)which were significantly superior over rest of the treatments in sub plots. The highest grain yield of rice (4.90 t/ha) was recorded by the treatment 50% RDN through inorganic source + 50% RDN through vermicompost which was statistically at par with 75% RDN through inorganic source + 25% RDN through vermicompost (4.70 t/ha) in main plots and the highest grain yield of rice (4.67 t/ha) was recorded by weed free treatment (2 HW at 20 & 40 DAT) which was significantly superior over rest of the treatments except Pretilachlor 1.5 kg/ha (P.E.) + 1 HW at 20 DAT treatment (4.48 t/ha) which was statistically at par with weed free treatment. The highest net return (₹51,740/ha) was recorded by the treatment 100% RDN (120 kg N-60 kg P205- 40 kg K2O/ha) through inorganic source which was significantly superior over rest of the treatments in main plots and the highest net return (₹46,933/ha) was recorded by the treatment weed free (2 HW at 20 & 40 DAT)which was statistically at par with Pretilachlor 1.5 kg/ha (P.E.) + 1 HW at 20 DAT (₹ 46,109/ha) and Pretilachlor 1.5 kg/ha (P.E.) + bispyribac sodium 20 g/ha at 20 DAT (₹ 46,308/ha) in sub-plots. The highest B: C ratio (2.74) was also recorded by the treatment 100% RDN (120 kg N-60 kg P205- 40 kg K2O/ha) through inorganic source which was significantly superior over rest of the treatments in main plots. In sub plots, the highest B:C ratio (2.44) was recorded by Pretilachlor 1.5 kg/ha (P.E.) + Bispyribac sodium 20 g/ha at 20 DAT which was significantly superior over rest of the treatments in sub plot treatments.
REFERENCE [1] Satynarayana V M, Vera P V, Murphy V R K, Boots K J 2002. Influence of Integrated use of farmyard manure and inorganic fertilizer on
yield and yield components of irrigated lowland rice. Journal of Plant Nutrition 25 (10): 281-2090.
Herbicides Combinations for Control of Complex Weed Flora for Sustained Wheat Production
D.K. Roy* and Dharminder Dr. Rajendra Prasad Central Agricultural University,
Bihar, Pusa, Samstipur-848125, India E-mail: *[email protected]
Keywords: Wheat, Herbicides, Weed flora
INTRODUCTION
Wheat (Triticum aestivum L.) in India contributes 40% to the total food grain production. In Bihar, wheat is grown on an area of 2.21m ha and contributes 5. m tonnes of food grains with an average productivity of 2.42 t/ha. Weeds are one of the major factors which inflict the yield losses to the extent of 50% (Azad, 1997). Under irrigated conditions wheat is infested with heavy population of Avena fatua, Cynodon dactylon, Phalaris minor, Cyperus rotundus, Anagalis arvensis, Chenopodium album, Cirsium arvense, Convolvulus arvensis, Eclipta alba, Fumaria purviflora, Launia pinnatifida, Melilotus alba, Physalis minima, Rumex dentatus and Vicia hirsute. In the recent past Sulfosulfuron and Clodinafop have shown high efficacy wheat (Singh et al.,2003).
It is I
LLEGAL t
o cop
y, pri
nt or
save
any c
onten
t of th
is PDF,
in pa
rt or in
full,
on an
y retr
ieval
syste
m,
withou
t the E
XPRESS WRITTEN PERMISSIO
N of th
e cop
yrigh
t-hold
er

National Conference on Climate Change and Agricultural Production: Adapting Crops to Climate Variability and Uncertainty, 6th–8th April, 2017
[239]
MATERIALS AND METHODS
A field experiment was carried out during rabiseasons of 2014-15 and 2015-16 in young alluvial calcareous sandy loam soil at Crop Research Centre, Pusa in North Bihar ecosystem in R.B.D. layout replicated thrice. The study was conducted to find out the effective and economic weed control practices for wheat crop. The soil of the experimental plot was sandy loam having average fertility status of available N (271 kg/ha), available phosphorus (17.89 kg/ha) and available potassium (142.3 kg/ha). The recommended dose of fertilizers i.e., 120-60-40 kg N, P2O5 and K2O were applied. Herbicides were applied with the help of Knapsack sprayer fitted with flat fan nozzle. Data were recorded on weeds and yield of the crop.
RESULTS AND DISCUSSION
The lowest weed count (18.5/m2) and weed dry weight (8.94 g/ m2) and highest grain yield of Wheat (45.44 q/ha) were recorded by Sulfosulfuron+metsulfuron (Total) 0.03 +0.002 kg/ha at 5 WAS which was statistically at par with Pendimethalin fb sulfosulfuron 1.0 fb 0.018kg/ha as PE fb PO (44.08 q/ha), Pinoxaden+ metsulfuron (Premix) 0.06 + 0.004 at 5 WAS (43.89 q/ha), Clodinafop + metsulfuron (Premix) (Vesta) 0.06 + 0.004 kg/ha (44.51 q/ha) and Mesosulfuron + iodosulfuron (Atlantis) 0.012 + 0.0024 kg/ha at 5 WAS and found significantly superior over rest of the treatments. The highest weed control efficiency was recorded in two hand weedings (84.14 %) which was closely followed by Sulfosulfuron+metsulfuron (Total) (75.19 %). The highest net return (Rs. 51136/ha) and B:C ratio (2.24) were recorded by Sulfosulfuron + metsulfuron (Total). The highest B:C ratio (2.24) was recorded by Sulfosulfuron + metsulfuron (Total) which was statistically at par with Mesosulfuron + iodosulfuron (Atlantis) and Clodinafop + metsulfuron (Premix) (Vesta). Sulfosulfuron + metsulfuron (Total) 0.03 +0.002 kg/ha at 5 WAS or Mesosulfuron + iodosulfuron (Atlantis) 0.012 + 0.0024 kg/ha at 5 WAS or Clodinafop + metsulfuron (Premix) (Vesta) 0.06 + 0.004 kg/ha was found effective in controlling weeds, producing higher grain yield (45.44 or 43.30 or 44.51 q/ha) and fetching the highest net return (Rs. 51136/ha or Rs. 47244/ha or Rs. 49208/ha) and B:C ratio (2.24 or 2.05 or 2.15).
Table 1: Herbicides Combinations for Control of Complex Weed Flora in Wheat Herbicides Dose (kg/ha) Application
Time Weed
Density N./m2 at 60 DAS
Weed Biomass
(g/m2) at 60 DAS
Grain Yield (q/ha)
WCE (%)
Gross Return (Rs/ha)
Net Return (Rs/ha)
B:C Ratio
Pendimethalin 0.75 PRE 38 18.76 38.16 47.94 61914 38934 1.69 Sulfosulfuron 0.025 PO 31 16.15 39.94 50.99 64801 41618 1.79 Metribuzin 0.21 PRE 39 19.12 38.03 46.94 61592 38676 1.68 Clodinafop 0.06 PO 34.5 17.25 39.39 52.15 63664 40294 1.72 Pendimethalin+metribuzin 1.0+0.175 PRE 29.5 14.30 40.77 60.32 65868 42238 1.78 Pendimethalin fb sulfosulfuron 1.0+ 0.018 PRE & PO 22.5 10.59 44.08 70.63 71604 47844 2.01 Sulfosulfuron+metsulfuron (Total)
0.03 +0.002 5 WAS 18.5 8.94 45.44 75.19 73931 51136 2.24
Pinoxaden+ metsulfuron (Premix)
0.06+0.004 5 WAS 22.5 10.92 43.89 69.69 71128 43538 1.57
Mesosulfuron + iodosulfuron (Atlantis)
0.012 +0.0024 5 WAS 24 11.49 43.30 68.25 70184 47244 2.05
Clodinafop + metsulfuron (Premix) (Vesta)
0.06 + 0.004 5 WAS 21.5 10.04 44.51 72.14 72103 49208 2.15
2 HW 11 5.72 47.57 84.14 78247 43877 1.27 Un-weeded control 63 36.04 31.97 - 52247 29877 1.33 LSD (P=0.05) 4.4 2.64 3.04 - 4499 4499 0.19
REFERENCES [1] Azad B S 1997. Influence of nitrogen and Isoproturon on nutrient uptake by weeds and Wheat (Triticum aestivum L.) Indian Journal of
Agronomy 42 (3): 471-473. [2] Singh G, Singh V P, Singh M and Singh R K 2003. Effect of dose and stages of application of sulfosulfuron on weeds and wheat yields.
Indian Journal of weed Science 35 (3 and 4): 183-185.
It is I
LLEGAL t
o cop
y, pri
nt or
save
any c
onten
t of th
is PDF,
in pa
rt or in
full,
on an
y retr
ieval
syste
m,
withou
t the E
XPRESS WRITTEN PERMISSIO
N of th
e cop
yrigh
t-hold
er

National Conference on Climate Change and Agricultural Production: Adapting Crops to Climate Variability and Uncertainty, 6th–8th April, 2017
[240]
Unsung Hero of Carbon Assimilation: Exploring the Heat Stable RuBisCO Activase from Wheat and Characterizing their Role in
Activation of RuBisCo for the Development of ‘Climate-Smart’ Crop
R.R. Kumar1*, Suneha Goswami1, G.K. Rai2, Viswanathan Chinnusamy3 and Shelly Praveen1 1Division of Biochemistry, 3Division of Plant Physiology,
1,3Indian Agricultural Research Institute, New Delhi–121012, India 2School of Biotechnology,
Sher-e-Kashmir University of Agricultural Sciences and Technology, Jammu–180009, India E-mail: *[email protected]
Keywords: RuBisCO activase, RuBisCO, Wheat, Heat stress
INTRODUCTION
RuBisCo activase (Rca) is ATPases Associated with diverse cellular Activities (AAA+), which utilizes the energy from ATP to remodel the conformation by releasing the tightly-bound sugar phosphate, and restore its activity. Rca is a nuclear-encoded chloroplastic enzyme discovered by Salvucci et al. (1985) in higher plants. Rca is relatively abundant constituting about 5% of the soluble leaf protein (He et al., 1997). Under the optimal conditions, it removes the inhibiting sugar phosphates that block RuBisCo active sites, and restores RuBisCo to its fully functional state (Portis, 2003). Rca is highly heat-labile (Salvucci et al., 2001). RuBisCo deactivation occurs at temperatures above 30–32◦C, in most plants and at higher temperature (>40◦C), heat-induced loss of RuBisCo activity becomes irreversible (Kim and Portis, 2004).
MATERIALS AND METHODS
Data generated through RNA-Seq was mined for the identification of putative RuBisCO activase genes from wheat. Further, Based on digital fold expression, a novel Rca was cloned from wheat cv. HD2985. Expression analysis of cloned Rca was carried out in contrasting wheat cvs. HD2985 and Halna (thermotolerant) and PBW621 and HD2329 (thermosusceptible) under differential heat stress at different stages of growth and development. Activity assay of RuBisCO and Rca was also carried out using the modified protocol of Salvucciet al., (2001). The activity of Rca was correlated with the RuBisCO and photosynthetic rate of wheat under terminal heat stress.
RESULTS AND DISCUSSION
Eight novel transcripts from wheat through data mining predicted to be Rca and cloned a transcript of 1.4 kb from cv. HD2985, named as TaRca1 (GenBank acc. no. KC776912). Single copy number of TaRca1 was observed in wheat genome. Expression analysis in diverse wheat genotypes (HD2985, Halna, PBW621, and HD2329) showed very high relative expression of TaRca1 in Halna under control and HS-treated, as compared to other cultivars at different stages of growth. TaRca1 protein was predicted to be chloroplast-localized with numerous potential phosphorylation sites. Northern blot analysis showed maximum accumulation of TaRca1 transcript in thermotolerant cv. during mealy-ripe stage, as compared to thermosusceptible. Decrease in the photosynthetic parameters was observed in all the cultivars, except PBW621 in response to HS. We observed significant increase in the Rca activity in all the cultivars under HS at different stages of growth. HS causes decrease in the RuBisCo activity; maximum reduction was observed during pollination stage in thermosusceptible cvs. as validated through immunoblotting. The uniform carbon
It is I
LLEGAL t
o cop
y, pri
nt or
save
any c
onten
t of th
is PDF,
in pa
rt or in
full,
on an
y retr
ieval
syste
m,
withou
t the E
XPRESS WRITTEN PERMISSIO
N of th
e cop
yrigh
t-hold
er

National Conference on Climate Change and Agricultural Production: Adapting Crops to Climate Variability and Uncertainty, 6th–8th April, 2017
[241]
distribution in different tissues of thermotolerant cvs., as compared to thermosusceptible. Similarly, tolerance level of leaf was observed maximum in Halna having high Rca activity under HS. A positive correlation was observed between the transcript and activity of TaRca1 in HS-treated Halna. Similarly, TaRca1 enzymeshowed positive correlation with the activity of RuBisCo. There is, however, need to manipulate the thermal stability of TaRca1 enzyme through protein engineering for sustaining the photosynthetic rate under HS—a novel approach toward development of “climate-smart” crop.
REFERENCES [1] Kim K and Portis J 2004. Oxygen-dependent H2O2 production by RuBisCo. FEBS Letter 571: 124-128. [2] Portis AR2003. RuBis Coactivase—RuBisCo’ scatalytic chaperone. Photosynthesis Research 75: 11-27. [3] Salvucci ME, Osteryoung KW, Crafts-Brandner SJ, and Vierling E 2001. Exceptional sensitivity of RuBisCoactivasetothermaldenaturation
invitro and invivo.PlantPhysiology127:1053–1064. [4] Salvucci ME, Portis AR, and Ogren WL 1985. Asolublechloroplastprotein catalyzesribulosebisphosphatecarboxylase/oxygenaseactivation
invivo. Photosynthesis Research 7: 193–201.
Estimation of Crop Water Requirement using CROPWAT v8.0 Model for Bina Command Area, Madhya Pradesh
Anshu Gangwar1*, T.R. Nayak2, R.M. Singh1 and Ashutosh Singh1 1Department of Farm Engineering, Banaras Hindu University, Varanasi–221005, India
2National Institute of Hydrology, Ganga Plains South Regional Centre, WALMI CAMPUS, Bhopal–462016, India
E-mail: *[email protected]
Keywords: Evapotranspiration, Crop water requirements, CROPWAT
INTRODUCTION
Water is an essential input for crop production so effective planning and accurate information of crop water requirement is needed. Hess (2005) defined crop water requirement as the total water needed for evapotranspiration, from planting to harvest for a given crop in a specific climate regime, when adequate soil water is maintained by rainfall/ irrigation so that it does not limit plant growth and crop yield. The objective of this study is to compute the crop water and net irrigation requirements of major Rabicrops in Bina command using long term climatic data by FAO Penman-Monteith method using CROPWAT 8.0 model.
MATERIALS AND METHODS
The Bina command area selected for the study is located at the longitude of 78º 02' to 78º 25' E and latitude of 23º47' to 24º 27' N at the altitude of 481 m above mean sea level in Sagar district of the Madhya Pradesh. The major cultivated Rabi crops in the study area are wheat, gram-pulses, and mustard. In the present study meteorological data (i.e. maximum and minimum daily air temperature, maximum and minimum relative humidity, sun shine hours and wind speed) of about 35 years period (1972 to 2007) of Bina station was obtained from India Meteorological Department, Pune, Maharashtra and used for the estimation of reference evapotranspiration via FAO Penman–Monteith equation using CROPWAT 8.0 model which is based on the United Nations’ Food and Agriculture Organization paper number 56 (FAO 56). The crop evapotranspiration (ETc) was calculated for different crop growth stages on ten-daily basis from FAO Penman-Monteith approach, which requires the crop coefficient (Kc). The crop water requirement is arrived at by summing up the ten-daily crop evapotranspiration over the entire crop period. Net irrigation requirement was determined
It is I
LLEGAL t
o cop
y, pri
nt or
save
any c
onten
t of th
is PDF,
in pa
rt or in
full,
on an
y retr
ieval
syste
m,
withou
t the E
XPRESS WRITTEN PERMISSIO
N of th
e cop
yrigh
t-hold
er

National Conference on Climate Change and Agricultural Production: Adapting Crops to Climate Variability and Uncertainty, 6th–8th April, 2017
[242]
by field balance equation in this model on the ten-daily basis. The crop water and net irrigation demand has also been estimated for the Bina command on canal command-wise.
RESULTS AND DISCUSSION
The reference evapotranspiration varied from 2.6 mm/day to 7.79 mm/day with average value of 4.62 mm/day. The total average effective rainfall was determined 610.3 mm, which was 52.77 % of the average annual rainfall (1156.5 mm).The average effective rainfall was maximum in the month of August (166.4 mm) and in the month of April it was minimum (0 mm). CROPWAT 8.0 model is used in order to estimate the water requirements for each crop using evapotranspiration, crop coefficient, effective rainfall and crop’s data. The crop water requirements of major rabicrops i.e wheat, mustard and gram-pulses in the command area were estimated at 349.80 mm, 316.80 mm and 304.10 mm respectively. Using the effective rainfall in the command area, the net irrigation requirement wheat, mustard and gram-pulses has been worked out as 319.90 mm, 285.20 mm and 277.40 mm respectively.The present study reveals that the wheat has maximum crop water and net irrigation demands followed by mustard, whereas minimum in gram-pulses. From this study, it was found that a vital recommendation that the FAO–CROPWAT 8.0 model could be used to effectively and efficiently to estimate the crop water requirements with different cropping patterns and an efficient planning of irrigation scheduling can be worked out using crop water and net irrigation requirement.
REFERENCES [1] Allen R G, Pereira L S, Raes D and Smith M 1998.Crop Evapotranspiration-Guidelines for Computing Crop Water Requirements. FAO
Irrigation and Drainage Paper 56, Rome. [2] Hess T 2005. Crop Water Requirements, Water and Agriculture, Water for Agriculture, WCA infoNET.
Effect of Genotype and Planting Geometry on Cormyield and Quality of Gladiolus (Gladiolus x hybridus Hort.)
Balram Meena*, Dharmendra Kumar Patidar and Pravin Singh College of Horticulture and Forestry Jhalarapatan, Jhalawar–326023, India
E-mail: *[email protected]
Keywords: Gladiolus, Planting Geometry, Corm yield
INTRODUCTION
Gladiolus (Gladiolus x hybridus Hort.) is an important cut flower crop, grown commercially in many parts of the world. The genus Gladiolus belongs to family Iridaceae and comprises about 250 species with more than 10,000 cultivars out of which about 20 species are grown commercially for cut flower purpose. They are widely distributed in central Europe, the Mediterranean region, central and south Africa. It has the basic chromosome number n=15. European species are tetraploids have chromosome ranges from 2n=30 to 120.
MATERIALS AND METHODS
The field experiment was conducted during winter season in 2014-15at College of Horticulture & Forestry, Jhalawar (Rajasthan). The experiment consisted of 12 treatment combinations (V1S1, V1S2, V1S3, V1S4, V1S5, V1S6, V2S1, V2S2, V2S3, V2S4, V2S5, V2S6) comprising of two genotypes (V1- American Beauty and V2-
It is I
LLEGAL t
o cop
y, pri
nt or
save
any c
onten
t of th
is PDF,
in pa
rt or in
full,
on an
y retr
ieval
syste
m,
withou
t the E
XPRESS WRITTEN PERMISSIO
N of th
e cop
yrigh
t-hold
er

National Conference on Climate Change and Agricultural Production: Adapting Crops to Climate Variability and Uncertainty, 6th–8th April, 2017
[243]
Psittacinus Hybrid-1) and six spacing (S1- 15 cm x 15 cm, S2- 20 cm x 20 cm, S3- 30 cm x 15 cm, S4- 30 cm x 20 cm, S5- 30 cm x 30 cm and S6- 40 cm x 30 cm) laid out in factorial randomized block design with three replications.
RESULTS AND DISCUSSION
The interactions had significant effect on corm quality of gladiolus (Table 1).It might be due to the genotype specific synthesis and mobilization of food reserves towards the sink (corm). Hence, it could be stated that variation among the varieties for number of corms produced per plant might be due to genotypic differences and environmental effect on rate of photosynthesis and translocation of the photosynthates towards the developing corms. The plant spacing also varied corm quality of gladiolus. This might be due to availability of more nutrients and light at wider spacing which ultimately increased the rate of net photosynthesis and translocation of assimilates to the storage organs. Similar results have also been reported by (Gupta et al., 2014) in gladiolus.
Table 1: Effect of Genotype and Planting Geometry on Corm Quality of Gladiolus Treatment Diameter of
Corm (cm) Weight of Corm (g)
Number of Cormels Produced per Plant
Weight of Cormels Produced per Plant (g)
Estimated Corm Yield per Hectare
(Lakh Numbers) Interaction
V1S1 4.75 52.33 11.13 8.80 4.38 V1S2 5.42 56.31 13.60 10.48 3.42 V1S3 6.05 58.78 15.80 11.83 3.13 V1S4 6.56 62.14 16.47 13.67 2.77 V1S5 6.95 65.68 18.80 14.67 2.13 V1S6 7.29 67.09 19.87 16.07 1.77 V2S1 3.64 36.97 10.67 19.26 5.40 V2S2 3.92 37.80 11.27 20.67 4.04 V2S3 4.14 39.52 12.33 22.09 3.79 V2S4 4.27 40.51 13.53 24.40 3.13 V2S5 4.55 41.85 15.13 26.50 2.29 V2S6 4.88 42.37 16.33 27.87 1.83
CD (p=0.05) 0.56 4.32 1.08 0.92 0.28
REFERENCE [1] Gupta YC, Parmar RS, Dhiman SR and Thakur P 2014. Growth and flowering behavior of newly evolved hybrid of gladiolus (Gladiolus x
hybridus Hort.) under different plant spacing and corm size in mid hill areas of Himachal Pradesh. Progressive Horticulture 46 (2): 42-44.
It is I
LLEGAL t
o cop
y, pri
nt or
save
any c
onten
t of th
is PDF,
in pa
rt or in
full,
on an
y retr
ieval
syste
m,
withou
t the E
XPRESS WRITTEN PERMISSIO
N of th
e cop
yrigh
t-hold
er

National Conference on Climate Change and Agricultural Production: Adapting Crops to Climate Variability and Uncertainty, 6th–8th April, 2017
[244]
Effect of Different Row Arrangement on Performance of (Linum usitatissimum L.) + Dwarf Field Pea (Pisum sativum L.)
Intercropping Association
Shiv Bahadur* Department of Agronomy, Institute o f Agricultural Science, BHU, Varanasi–221005, India
E-mail: *[email protected]
Keywords: Linseed, Dwarf field pea, Intercropping.
INTRODUCTION
Linseed is grown mainly for seed used for extracting oil in rainfed conditions and has excellent dyeing oil used in manufacturing paints and varnishes, oilcloth, waterproof fabrics and linoleum. Linseed cake is a very good manure and animal feed. Linseed straw produces fibre of good quality and is also used in making paper and plastics for which it is also known as plastic crop. However, in recent time, linseed oil has becoming more popular as functional food in the health. India is the largest producer and importer of the leguminous crop. It can fix atmospheric nitrogen about 75-80% of the total nitrogen requirements of crop can be met through symbiotic fixation andhelps in restoring soil fertility (Dubey and Datt, 2014).
MATERIALS AND METHODS
The field experiment was conducted during the rabi season of 2013-14 at Agricultural research farm, Institute of Agricultural Sciences, Banaras Hindu University, Varanasi, Uttar Pradesh. The experiment was conducted in randomized block design, with fourteen row arrangement treatment. The data were analyzed by applying in randomized block design for comparing performance of different row arrangements.
RESULTS AND DISCUSSION
The yield attributes of both crops significantly influenced by different row ratios except test weight (linseed) and seed index (dwarf field pea). The highest yield attributes of both crops was marked under sole planting. Among the intercropping association row ratio of 4:1 with 80% linseed + 20% dwarf field pea (T8) was significantly higher over the rest of the row arrangements. Where at par yield attributes was recorded with row ratio of 3:1 with 75% linseed + 25% dwarf pea (T3) and row ratio of 4:2 with 66.67% linseed + 33.34% dwarf field pea (T9) in linseed. In cash of dwarf field pea row ratio of 1:4 with 20% linseed + 80% dwarf field pea (T11) was recorded significantly highest over rest of the row arrangements. Where at par yield attributes was recorded under row ratio of 1:3 with 25% linseed + 75% dwarf field pea (T5) and row ratio of 2:4 with 33.34% linseed + 66.67% dwarf field pea (T12). This might be due to the fact that higher availability of natural resources which allows the plant to grow more as all the inputs are easily available with lesser competition among plants this finding closely corroborated with Baishya et al. (2014).
REFERENCES [1] Baishya L K, Ansari M A, Walling I, Sharma P K and Prakash N 2014. Productivity, profitability and energy budgeting of maize/greengram
intercropping system under rainfed conditions of Eastern Himalayan Region. Indian Journal of Agricultural Sciences 84 (9): 1073-1077. [2] Dubey Y P, and Datta N 2014. Influence of organic, inorganic and integrated use of nutrients on productivity and quality of pea (Pisum
sativum) vis-à-vis soil properties Indian Journal of Agricultural Sciences 84 (10): 1195–1200. [3] Nagaraj G 2009. Linseed In: Oil Seeds, Properties, Processing, Products and Procedures. Linseed, New India Publishing Agency, New
Delhi, India, pp 123.
It is I
LLEGAL t
o cop
y, pri
nt or
save
any c
onten
t of th
is PDF,
in pa
rt or in
full,
on an
y retr
ieval
syste
m,
withou
t the E
XPRESS WRITTEN PERMISSIO
N of th
e cop
yrigh
t-hold
er

National Conference on Climate Change and Agricultural Production: Adapting Crops to Climate Variability and Uncertainty, 6th–8th April, 2017
[245]
Effect of Tree Spacings on Litter Productionand Decomposition under Eucalyptus tereticornis Based Agroforestry System
Tarun Kumar*, Bimlendra Kumari, K.S. Bangarwa and Vishal Johar Department.of Forestry, CCS Haryana Agricultural University, Hisar–125004, India
E-mail: *[email protected]
Keywords: Litter, Eucalypts, Agroforestry, Tree spacing
INTRODUCTION
Eucalyptus tereticornis commonly known as ‘red gum’ isnative of Australia and Papua New Guinea. It has been promoted in manytropical countries owing to its fast growth rate, adaptabilityto wider climatic and edaphic conditions and multiple uses. Agroforestry is one ofthe best options to increase the tree cover outside theforest. The need of agroforestry has been necessitated inmany parts of the country, which face several agriculturaland ecological problems, predominant of which is soil degradation. The production of litter plays a fundamental role in the biogeochemical cycle of organic matter and mineral nutrients, thus becoming a key component in the functioning and stability of forest ecosystems. Organic residues coming in the form of litter fall and accumulated on the ground are a major reservoir of organic matter and nutrients, and influence or regulate most of the functional processes occurring throughout the ecosystem. In forest ecosystem tree leaves are periodically or continuously dropped on the ground. This leaf litter decomposes and release the substantial amount of nutrient into the soil and governs the regulatory mechanism of nutrient cycling and organic matter content (Singh et al., 2012).Thus, litterfall exerts a great influence on physical, chemical and biological characteristics of soil (Pande et al.,2002) as well as further growth of trees. Hence, keeping in view the importance of litter fall in nutrient dynamics the present study was planned to determine the effect of tree spacing on litter production and decomposition under Eucalyptus tereticornisbased agroforestry system.
MATERIALS AND METHODS
The present study was conducted at, CCS Haryana Agricultural University, Hisar during the year 2014-15. Twenty litter traps (1 x 1 m) made of steel mesh with wooden frame with a height of 25 cm above ground were arranged in each stand (3x3 m, 6x1.5 m and 17x1x1m spacings) andthe litterfall was recorded at 30 days intervals all year around. The oven-dried litter was sorted into leaves, small branches, flowers, fruits and miscellaneous material. The litterbag technique was used to quantify litter decomposition rate. A known amount of air-dried litter (20 g) of each was put into a 10 x 10 cm, 0.5 mm mesh size nylon bag. A total of 60 bags were prepared and were randomly placed under the soil. The decomposed material was taken after 1 month and the similar process was continued for 12 months. The retrieved bags were washed carefully to remove foreign material from it and dried at 60oC in oven until the constant weight was observed. The percentage of leaf litter decomposition and the rate of decomposition were determined using the desirable statistical tools.
RESULTS AND DISCUSSION
The results revealed that there is a significant amount of variation between the litter fall patterns under different spacings of Eucalypts (17x1x1, 6x1.5 and 3x3 m) during summer, winter and rainy season. The maximum amount of litter fall was witnessed in 6 x 1.5 m spacing during winter season (1.392 tonnes ha-1 year-1) The leaf fall constitute the major proportion of the litter fall in all the spacings and seasons followed by the woody proportion. The decomposition of plant litter is one of the most crucial processes in the biogeochemical cycle of the forest ecosystems. Decomposition rate was recorded highest between July -
It is I
LLEGAL t
o cop
y, pri
nt or
save
any c
onten
t of th
is PDF,
in pa
rt or in
full,
on an
y retr
ieval
syste
m,
withou
t the E
XPRESS WRITTEN PERMISSIO
N of th
e cop
yrigh
t-hold
er

National Conference on Climate Change and Agricultural Production: Adapting Crops to Climate Variability and Uncertainty, 6th–8th April, 2017
[246]
August followed by June-July. The maximum weight loss (15.91%) was obtained during July-August followed by the weight loss during June-July (14.92%). Hence, the result shows that the decomposition rate is stimulated with high temperature and high humidity during rainy season.
REFERENCES [1] Singh BR, Lal R and Strand L T 2012.Leaf litter fall and litter decomposition under Eucalyptus and coniferous plantations in Gambo
District, southern Ethiopia. ActaAgriculturae Scandinavica, Section B- Soil and Plant Science62(5): 467-476. [2] Pande PK, Meshram PB and Banarjee S K 2002. Litter production and nutrient return in tropical dry deciduous teak forests of Satpura
plateau in Central India. Tropical Ecology 43: 337-344.
Table 1: Litterfall Pattern in Different Seasons under Different Spacings of Eucalypts Based Agroforestry System (Tonnes/ha)
Season Spacing 3 X 3 6 X 1.5 17 X 1 X 1
Litter Component Litter Component Litter Component Leaf Woody Misc. Leaf Woody Misc. Leaf Woody Misc.
Summer 0.482 0.433 0.030 0.506 0.491 0.037 0.434 0.403 0.016 Rainy 0.489 0.581 0.000 0.502 0.582 0.000 0.458 0.530 0.000 Winter 1.374 0.211 0.008 1.392 0.241 0.015 1.343 0.176 0.009
CD (p=0.05) Spacing 0.16 Litter Production 0.027 Season 0.008 Interaction NS
Effect of Light Intensity on Yield of Wheat under Eucalyptus tereticornis SM. based Agri-Silvi-Horticultural System
Vishal Johar*, R.S. Dhillon, K.K. Bhardwaj, Vinita Bisht and Tarun Kumar Department of Forestry, CCS Haryana Agricultural University, Hisar–125004, India
E-mail: *[email protected]
Keywords: Agroforestry, light intensity, Eucalyptus tereticornis and wheat
INTRODUCTION
Agroforestry system greatly contribute toward production of wood for industrial and other commercial purposes, besides maintaining ecological balance, uplifting of socioeconomic status of the farmers and at the same time diversify the traditional agricultural cropping rotation. The challenge in agroforestry has been to plant optimally spaced trees to reduce the competition for light and at the same time produce high output. The shade of perennial woody plants causes reduction in growth and yield of arable crops (20-60%) is a commonly acceptable agroforestry practice (Thakur, 2002). Trees affect the understory herbaceous vegetation primarily by intercepting light which is the critical factor for herbaceous plants growth (Verma and Rana, 2014). Keeping the importance of light intensity in productivity of agroforestry system in to consideration, there was a dire need to investigate effect of light intensity on yield of wheat under Eucalypts based agri-silvi-horticultural system.
MATERIALS AND METHODS
The study was carried out during rabi season 2015-16 at CCS Haryana Agricultural University, Hisar, (290 09' N latitude and 750 43' E longitude at an elevation of 215 m above mean sea level), situated in the arid region
It is I
LLEGAL t
o cop
y, pri
nt or
save
any c
onten
t of th
is PDF,
in pa
rt or in
full,
on an
y retr
ieval
syste
m,
withou
t the E
XPRESS WRITTEN PERMISSIO
N of th
e cop
yrigh
t-hold
er

National Conference on Climate Change and Agricultural Production: Adapting Crops to Climate Variability and Uncertainty, 6th–8th April, 2017
[247]
of North-Western India. A pre-established five year old plantation of Kinnow alone and Kinnow + Eucalypts was used as the basic agroforestry model in the study.Light intensity was measured by “Luxmeter” (electronic digital Luxmeter) at crop surface. The reading was taken at monthly interval under agroforestry system and in control (devoid of trees) during the study period. The data were recorded at 0700, 0900, 11.00, 1300, 1500 and 1700 hours.
RESULTS AND DISCUSSION
The large crown of the tree produces a striking shade effect. Because the plant height ratio of tree-crop intercropping is far greater than that in pure crops, an entirely new pattern for light utilization is formed. Though, this intercropping system as a whole can increase the biological yield per unit area, the tree shade is inhibitory for crop growth. It is apparent from the data that the Kinnow + Eucalypts had more adverse effect on test crop as compared to Kinnow alone due to evergreen nature of both Kinnow and Eucalypts. The data reveals that the maximum light intensity (802.0 LUX) was recorded under Kinnow + Wheat while the minimum intensity was recorded under Kinnow + Eucalypts + Wheat (27.5 LUX) at 1300 and 0700hours, respectively. The pattern of light intensity under agroforestry systems were observed in the increasing order from 0700 to 1300hours, however, it declined from1400 to 1700hours. The light intensity received by the sole crop was higher during all the time periods than agroforestry systems (Table 1). The results revealed that the average grain yield reduction under Kinnow + Eucalypts and Kinnow alone was 68.9 and 40 per cent, respectively may due to competition of light.
Table 1: Measurement of Light Intensities (LUX) under Control and E. Tereticornis based Agri-silvi-horticultural System at Different Hours
Months Light Intensity (LUX)
0700 0900 1100 1300 1500 1700
Ope
n
K a
lone
K+
E
Ope
n
K a
lone
K+
E
Ope
n
K a
lone
K+
E
Ope
n
K a
lone
K+
E
Ope
n
K a
lone
K+
E
Ope
n
K a
lone
K+
E
Dec. 74.1 46.4 27.5 276.8 193.5 60.3 525.6 412.1 255.9 652.7 530.3 434.3 472.0 356.4 245.0 155.3 64.9 43.1
Jan. 88.0 56.9 32.1 333.4 231.7 73.4 633.5 493.5 309.2 782.2 635.7 521.1 567.1 426.7 295.3 187.3 77.4 52.7
Feb. 105.2 69.1 38.9 401.9 279.0 87.9 761.2 595.5 373.3 941.1 763.8 627.1 700.2 513.1 357.0 223.9 95.6 64.4
Mar. 130 72.6 40.8 484 293.0 92.3 918.4 625.3 392.0 1131.9 802.0 658.5 821.5 538.8 374.9 271.5 100.4 67.6
Average 99.3 61.3 34.8 374.0 249.3 78.4 709.7 531.6 332.6 876.9 682.9 560.2 640.2 458.7 310.6 209.5 338.3 56.9
CD (p=0.05)
9.05 7.23 7.04 9.72 8.10 7.37 15.21 12.11 9.76 17.41 14.04 12.02 14.34 13.86 13.08 12.83 12.09 14.7
REFERENCES [1] Thakur P.S. 2002. Canopy management in agroforestry. In: Tree Crop Interface (Chauhan and Gill, eds.). Samiksha Printing Press,
Khanna, Ludhiana. Pp: 47-49. [2] Verma S K and Rana B S 2014.Effect of light intensity on paddy and wheat grain yield under Eucalyptus tereticornis SM. Based Agri-
Silvicultural system. Indian Forester 140 (1): 23-28.
It is I
LLEGAL t
o cop
y, pri
nt or
save
any c
onten
t of th
is PDF,
in pa
rt or in
full,
on an
y retr
ieval
syste
m,
withou
t the E
XPRESS WRITTEN PERMISSIO
N of th
e cop
yrigh
t-hold
er

National Conference on Climate Change and Agricultural Production: Adapting Crops to Climate Variability and Uncertainty, 6th–8th April, 2017
[248]
Effect of Conservation Tillage Practices and Maize Residues on Weed-Wheat Ecosystems
Pravin Kumar Upadhyay1*, K. Ramesh2, S.K. Choudhary3 and R.K. Singh1
1ICAR-Indian Agricultural Research Institute, New Delhi–110012, India 2ICAR-Indian Institute of Soil Science, Bhopal, India
3Bihar Agricultural University, Sabaur–813210 E-mail: *[email protected]
Keywords: conservation tillage, maize, residue, weed and wheat
INTRODUCTION
Conservation agriculture systems utilize soils for the production of crops with the aim of reducing excessive mixing of the soil and maintaining crop residues on the soil surface in order to minimize damage to the environment (FAO, 2014). Residue retention strongly impacts weed emergence; several factors determine the extent of this influence including type and quantity of residue, nature of the residue, soil type, weather conditions, and prevailing weed flora. Phenolics in the surface residue may reduce the weed infestation (Farooq et al. 2011) in these systems. It is reported that increasing wheat residue levels reduces giant foxtail infestations in no-till systems. Increasing wheat residue to 12 Mg/ha, delayed emergence, and changed morphology and decreased foxtail density. A minimum of 6 Mg/ha of residue was necessary to reduce foxtail density by 50% relative to bare soil (http://docs.lib.purdue.edu/ dissertations/AAI9601598/). Based on the above finding the experiment was conducted with the objective of to reduce the weed density under different tillage system by graded levels of maize crop residue.
MATERIALS AND METHODS
An experiment was conducted at ICAR- Indian Institute of Soil Science, Bhopal farm during 2015 with 3 Tillage practices viz., T1-No till (no primary tillage), T2-Reduced tillage (only primary tillage), T3-Conventional till (primary and secondary tillage) and 5 residue (flat) cover viz., M1- No residue, M2- 25% residue cover, M3- 50% residue, M4- 75% residue, M5- 100% residue with test crop Durum Wheat or (Malwa Shakti HI 8498). The recommended dose of fertiliser viz., 110, 50 and 50 kg/ha of N, P and K respectively was applied uniformly. Half of total nitrogen and full dose of phosphorus and potash were applied as basal at the time of sowing and remaining half dose of nitrogen in the form of urea was top dressed in two equal splits after first and second irrigation. Three replications were maintained and the treatments were imposed in a split-plot design. An area of one square meter was selected randomly at two spots by throwing a quadrate. Data on weed population was recorded from 8 to 51 DAS from this area and expressed in No. m-2 and dry weight was also recorded. The data on mean grain, straw, biological yield and harvest index were subjected to standard statistical analysis.
RESULTS AND DISCUSSION
Broad leaved weed species were predominant in the field viz., Alternanthera sessilis, Tridox procumbens, Sonchus arvensis and Parthenium hysterophorus. However no sedge and grassy weeds were reported from the field. Further, only the density of A.sessilis was influenced by tillage practices and residue cover. Minimum density of A.sessilis was recorded under conventional tillage which was significantly lower than either no-till or reduced tillage. Among the crop residue levels, application of above 50% residue reduced density of A.sessilis significantly than no residue. Conventional till wheat recorded significantly lower density
It is I
LLEGAL t
o cop
y, pri
nt or
save
any c
onten
t of th
is PDF,
in pa
rt or in
full,
on an
y retr
ieval
syste
m,
withou
t the E
XPRESS WRITTEN PERMISSIO
N of th
e cop
yrigh
t-hold
er

National Conference on Climate Change and Agricultural Production: Adapting Crops to Climate Variability and Uncertainty, 6th–8th April, 2017
[249]
of total weeds at all stages as compared to no-till during 23 to 51 DAS which was at par with reduced tillage at 23 DAS. Conventional till wheat was most effective in minimizing total weed dry weight 50 to 100 percent residue level significantly reduced weed dry weight at all the growth stages. The weed control efficiency was worked out at 30, 37, 44 and 51 DAS revealed conventional till wheat crop establishment method recorded higher weed control efficiency as compared to no- till and reduced till at 30 DAS but at 37, 44 and 51 DAS reduced till had higher values over others. Among weed management practices, application of 100% residue recorded higher WCE at 37 and 51 DAS while 75% residue cover recorded higher WCE value at 30 and 44 DAS. The 50% and above ground cover caused maximum reduction in density and dry weight of weeds due to soil surface shading and weeds were not able to germinate.
It was found that significantly highest grain, straw and total biomass yield were recorded with conventional tillage which was 36.13, 24.04 and 30.96 per cent higher over no-till respectively. It is obvious from the data that crop residue levels significantly influenced the grain, straw, total biomass yield of wheat. The maximum grain yield, straw yield, total biomass 24.87, 19.66 and 44.53 q ha-1 was recorded under 50 per cent of crop residue level respectively over no residue. Interaction effect of tillage and different levels of crop residue on grain yield of wheat was found to be significant. Significantly the highest grain yield was observed with the treatment combination of conventional tillage along with 50% level of crop residue i.e. 32.28 q ha-1. Hence, it is concluded that residue cover in conservation tillage practices could help to a great extent in minimizing the weed incidence in wheat crop under central India conditions.
Table 1: Effect of Tillage and Residue Cover on Grain, Straw, Biological Yield and Harvest Index of Wheat Treatments Grain Yield (q/ha) Straw Yield (q/ha) Total Biomass(q/ha) Harvest index
Tillage No tillage 17.08 15.17 32.25 53.52 Reduced tillage 21.38 15.31 36.69 58.95 Conventional tillage 26.74 19.97 46.71 57.97 LSD (P=0.05) 1.32 2.06 3.08 2.95 Residue Level No residue 18.96 13.86 32.82 58.26 25% residue 20.80 15.57 36.37 57.93 50% residue 24.87 19.66 44.53 55.77 75% residue 22.56 19.93 42.49 53.21 100% residue 21.48 15.05 36.53 58.90 LSD (P=0.05) 0.58 3.43 3.60 5.18
REFERENCES [1] FAO, 2014.http://www.fao.org/resources/infographics/infographics-details/en/c/216754/ [2] Farooq M, Flower K, Jabran K, Wahid A, Siddique K H M 2011. Crop yield and weed management in rainfed conservation agriculture.
Soil Tillage Research117:172–183 [3] Reicosky DC and Allmaras R R 2003.Advances in tillage research in North American cropping systems. Journal of Crop
Production 8:75-125.
It is I
LLEGAL t
o cop
y, pri
nt or
save
any c
onten
t of th
is PDF,
in pa
rt or in
full,
on an
y retr
ieval
syste
m,
withou
t the E
XPRESS WRITTEN PERMISSIO
N of th
e cop
yrigh
t-hold
er

National Conference on Climate Change and Agricultural Production: Adapting Crops to Climate Variability and Uncertainty, 6th–8th April, 2017
[250]
Effect of Climate Change on Banana Scarring Beetle (Basilepta sp., Colaspis sp.) in Koshi Region of Bihar, India
Shyam Babu Sah1*, Gireesh Chand2 and S. Prakashand Rajesh Kumar1
1B.P.S.A.C., Purnea–854302, India 2B.A.C., Sabour–813210, Indiar E-mail: *[email protected]
Keywords: Banana, beetle, Basilepta sp., Koshi region, Bihar
INTRODUCTION
The effect of global warming on banana production are complex and are a combination of increased CO2 concentrations in the atmosphere, higher temperature, fluctuation in rainfall and solar radiation that results in increase in population of Basilepta sp and Colaspis sp in Koshi region of Bihar. This region is situated north eastern region of Bihar, in which soil is sandy due to silt of Koshi river, which is terror of Bihar. This region generally experiences a humid climate and maximum rainfall in the state of Bihar. Rainfall generally increases from the southwest toward northeast. About 82% of the total annual rainfall is received during the monsoon months of June to September. In Koshi region of Bihar, particularly in Katihar, Purnea and Naugachhia sub division of Bhagalpur, banana is grown by farmers on commercial basis and they use good agricultural practices for cultivation of banana. Although different types of pests attack on Banana plant causing damage to the plant, but it has been observed that the magnitude of problem of banana scarring beetle has increased in this area due to change in climate as well as improvement of nutritive quality of host plants, coupled with dense cropping system under assured irrigation. Thus the present investigation was carried out to observe the pattern of population build up of Banana scarring beetle on banana.
MATERIALS AND METHODS
To study the climate effect on population build up of Banana scarring beetle, a field experiment was conducted at Bhola Paswan Shastri Agricultural College, Purnea, which is situated Koshi region of Bihar during kharif March, 2014 to February, 16. Count was taken on the number of adults and its scars at 15 days interval from top leaf (furled or unfurled) of plant from 1600 hours onward, during the active period of the beetle.
RESULTS AND DISCUSSION
Adults of Banana scarring beetle hide in unfurled leaf of Banana plant and eat out tender leaf of Banana in the early stage of plant and when flower comes out from whorl this beetle appears in huge numbers and causes scars on fingers of new Banana. When temperature and humidity was high (in rainy season) population of banana scarring beetle was maximum from July to September, 51.67 per plant and minimum during December to January 7.11 per plant in 2014-15 and 69.17 per plant to 11.62 per plant respectively. Banana infested with scarring beetle that causes scars on finger of Banana that ranges from 14.07 to 58.75 scars /20cm2 area of banana in 2014-15 and 13.98 to 69.75 scars/20cm2 in 2015-16 respectively. That result in loss of yield and quality of bananas. Earlier Banana scarring beetle was minor pest of Banana, but due to climatic changes particularly variation in temperature and other climatic factors Banana scarring beetle is now a major insect pest of Banana in Koshi region of Bihar.
It is I
LLEGAL t
o cop
y, pri
nt or
save
any c
onten
t of th
is PDF,
in pa
rt or in
full,
on an
y retr
ieval
syste
m,
withou
t the E
XPRESS WRITTEN PERMISSIO
N of th
e cop
yrigh
t-hold
er

National Conference on Climate Change and Agricultural Production: Adapting Crops to Climate Variability and Uncertainty, 6th–8th April, 2017
[251]
Changes in pH during Earthworm, Eudrilus eugeniae (Kinberg) Mediated Vermicomposting of Different Types of Wastes
Shefali* and R.K. Gupta Department of Zoology, CCS Haryana Agricultural University, Hisar–125004, India
E-mail: *[email protected]
Keywords: Eudrilus Eugeniae, Earthworm, waste, pH, Vermicomposting
INTRODUCTION
Earthworms, annelids of the class Oligochaeta, are ubiquitous and are the major component of the soil macrofauna. They play a vital role in sustainable agriculture by formation and maintenance of fertile soils and are suitable bioindicators of toxicants in the soil. Eudrilus eugeniae is indigenous in Africa and are popularly called as “African night crawler”. In the present study the change in pH in different type of waste during vermicomposting using earthworm Eudrilus eugeniae have been investigated at the interval of 0,30,60,90 days.
MATERIALS AND METHODS
The test earthworms (Eudrilus eugeniae) were taken from vermicompost laborartory, department of Zoology, CCS Haryana Agricultural University, Hisar. All selected worms were adult and fully clitellate. The biogas slurry was obtained from biogas plant of department of microbiology, CCS HAU Hisar. The experiment was planted on August, 2016 in vermicompost laboratory, department of Zoology, CCS Haryana Agricultural University, Hisar. The mature earthworms were added to the tub of 40kg capacity containing cow dung. The moisture content was maintained between 50-70% throughout the study by sprinkling adequate quantities of water. The experiment was run for 90 days using sugarcane bagasse, wheat straw, vegetable waste, rice straw with cow dung in 1: 5 (type of waste: cow dung)combination.
RESULTS AND DISCUSSION
In present investigation the change in pH in different wastes with time during vermicomposting was observed. The pH in sugarcane baggase: cow dung in the ratio (1:5) was 7.89, 7.79, 7.72 and 7.69 after 0, 30, 60 and 90, days. In wheat straw, a change in pH was 7.69, 7.49, 7.29 and 7, after 0, 30, 60 and 90 days. In vegetable waste, pH was 7.59, 7.29, 6.79 and 6.6 after 0, 30, 60 and 90 days while in rice straw, pH was s 7.69, 7.6, 7.49 and 7.32 after 0, 30, 60, and 90 days, respectively. The maximum decrease in pH was found in vegetable waste and minimum decrease was observed in sugarcane baggase during vermicomposting at different time interval.
It is I
LLEGAL t
o cop
y, pri
nt or
save
any c
onten
t of th
is PDF,
in pa
rt or in
full,
on an
y retr
ieval
syste
m,
withou
t the E
XPRESS WRITTEN PERMISSIO
N of th
e cop
yrigh
t-hold
er

National Conference on Climate Change and Agricultural Production: Adapting Crops to Climate Variability and Uncertainty, 6th–8th April, 2017
[252]
Fig. 1: Change in pH in Different Waste during Vermicomposting using Eudrilus Eugeniae
REFERENCES [1] Kavitha P, Ravikumar G, and Manivannan S 2010. Vermicomposting of banana agro-waste using an epigeic earthworm Eudrilus
eugeniae (kinberg). International Journal of Recent Scientific Research 1: 032-035.
Performance of Wheat Crop under Eucalyptus tereticornis based Agroforestry System in North-East India
Vinita Bisht*, K.S. Bangarwa, R.S. Dhillon and Vishal Johar and Pradyuman Singh Department of Forestry, CCS Haryana Agricultural University, Hisar–125004, India
E-mail: *[email protected]
Keywords: Eucalyptustereticornis, Haryana, Wheat and soil erosion
INTORDUCTION
In semi arid region of Haryana, Eucalyptus tereticornisis considered the most important tree species. In Haryana where rainfall is low as well as salt affected soil, plantation of Eucalyptus tereticornis as a tree on eroding wastelands. The service functions of agroforestry are in control of soil erosion and improvement of soil fertility. Eucalyptus is the most popular choice to be planted along the edges, or bunds, of agricultural fields, and appears to be well incorporated and accepted in agro-forestry in India (Tejwani, 1994).
MATERIALS AND METHODS
The study on Eucalypts-based agroforestry was carried out during rabi season of 2013-14 in the research farm of Department of Forestry, at CCS Haryana Agricultural University, Hisar. The experiment was laid out in factorial RBD with three replications. In this study effect of different spacings of eucalypts viz., 3 ×3 m, 6 ×
5.5
6.0
6.5
7.0
7.5
8.0
0 30 60 90
Sugarcane baggase: cow dung Wheat straw: cow dung
Vegetable waste: cow dung Rice straw: cow dung
Time (Days)
pH
It is I
LLEGAL t
o cop
y, pri
nt or
save
any c
onten
t of th
is PDF,
in pa
rt or in
full,
on an
y retr
ieval
syste
m,
withou
t the E
XPRESS WRITTEN PERMISSIO
N of th
e cop
yrigh
t-hold
er

National Conference on Climate Change and Agricultural Production: Adapting Crops to Climate Variability and Uncertainty, 6th–8th April, 2017
[253]
1.5 m and 17×1×1 m on crop yield. Observations for grain yield (q/ha), straw yield (q/ha), biological yield (q/ha) and harvest index (%) were recorded to assess the performance of wheat under different spacings of eucalypts under agroforestry system in comparison to control.
RESULTS AND CONCLUSION
Experimental results revealed that growth attributing characters like height and dbh of Eucalyptus tereticornis were increased gradually with increasing the age of trees. Among three different spacings of Eucalyptus tereticornis maximum height (m) and DBH (cm) was achieved in 6×1.5m spacing during 2014-15 than 3×3m and 17×1×1 m spacings. It might be due to the closer spacing create a competition between trees and wider spacing (on the both side paired row spacing) which also effect the growth of trees, so that 6×1.5 m was suitable spacing, which had maintain the row maximum dbh was recorded in 6×1.5m spacing (23.4m) in 2nd year. The results presented in Table 1 indicated that different spacings of eucalypts were significantly influenced the grain yield (q/ha), straw yield (q/ha) and biological yield (q/ha). The higher grain yield (16 q/ha), straw yield (21 q/ha) and biological yield (37 q/ha) were found in paired row spacing 17×1×1 m as compared to closer spacings (6×1.5m and 3×3m) during 2013-14. It might be due to competition of light, nutrient and moisture were found maximum in closer spacing (3×3 m and 6×1.5 m) than wider spacing 17×1×1 m. Therefore, higher yield was found in control condition as compared three different spacings of eucalypts. Reduced value of yield parameters of wheat and mustard may be ascribed to competition for light, moisture and nutrients in addition to allelopathic effect of eucalyptus (Deswal and Nandal, 2008).
Table 1: Yield Parameters of Wheat Crop under Different Spacings of Eucalypts Based Agroforestry System during 2013-14 and 2014-15
Spacing (m) Yield of Wheat Crop (q/ha) 2013-14 2014-15
Grain Yield Straw Yield
Biological Yield
Harvest Index (%)
Grain Yield
Straw Yield
Biological Yield
Harvest Index (%)
3 × 3 9.0 14.0 23.0 38.0 8.0 13.0 21.0 34.6 6×1.5 12.0 18.0 30.0 38.4 11.0 16.0 27.0 34.9 17×(1×1) (Paired Row)
16.0 21.0 37.0 38.7 15.0 19.0 34.0 35.2
Control 44.0 49.0 93.0 47.0 40.0 45.0 85.0 46.9 CD (P=0.05) 2.0 4.0 6.0 0.5 2.0 5.0 7.0 0.4
REFERENCES [1] Deswal A K and D P S Nandal 2008. Growth and yield of wheat (Triticum aestivum) under varying levels of irrigation and fertilizer in
eucalyptus based agri silviculture system. Indian Journal of Agroforestry 10(1): 10-14. [2] Tejwani KG 1994. Agro-forestry in India. Oxford & IBH Publishing Company Pvt., New Delhi, India. 233p.
It is I
LLEGAL t
o cop
y, pri
nt or
save
any c
onten
t of th
is PDF,
in pa
rt or in
full,
on an
y retr
ieval
syste
m,
withou
t the E
XPRESS WRITTEN PERMISSIO
N of th
e cop
yrigh
t-hold
er

National Conference on Climate Change and Agricultural Production: Adapting Crops to Climate Variability and Uncertainty, 6th–8th April, 2017
[254]
Effect of Moisture Regimes on Physiological and Biochemical Parameters of Chickpea (Cicer arietinum L.) Genotypes
Maniram1*, Raj Bahadur1, Ompal Singh1, Anjali Tiwari2, Sunil Prajapati3 and A.H. Khan1
1Department of Crop Physiology, 2Deptartment of Forestry 1,2Narendra Deva University of Agriculture & Technology, Kumarganj, Faizabad–224229
3Department of Horticulture, Jawaharlal Nehru Krishi Vishwa Vidyalaya, Jabalpur–482004, India
E-mail: *[email protected]
Keywords: Chickpea, Rainfed, Irrigated, Genotype
INTRODUCTION
Chickpea is hardy crop and acclimatized a wide range of soils and environmental conditions. At present the developing countries account for 87% of the total pulses area and contribute 71% to the global production with an average yield of 645 kg/ha.Chickpea is the third most important food legume grown in over 45 countries in all continents of the world. Similarly, the chickpea production (7.35 million tonnes) also surpassed last 50 years record with productivity of 8.40 q ha-1. The area under chickpea has increased from 6.45 million ha to 8.74 million ha in 2009-10.Water deficit is also known to alter a variety of biochemical and physiological processes ranging from photosynthesis to protein synthesis and solute accumulation (Hu and Schmidhalter 1998). The objective of the present study to screen out drought tolerance and susceptible genotypesunder study.
MATERIAL AND METHODS
The present investigation was carried out at Narendra Deva University of Agriculture & Technology, Kumarganj, Faizabad, under natural condition during rabi season (2012-13). Six cultivars of chickpea was the test material of the present study. The experiment was laid out in randomized block design with three replications,growing in rainfed and irrigated condition. Five tagged plants were randomly uprooted from each treated plot at growth stage on i.e. 55, 75, 95 DAS. Plant height, number of branches, leaf area, dry matter partitioning, and root length as well as volume and number of nodules were recorded.
RESULTS AND DISCUSSION
The genotype KWR 108, RSG 888 and CSJD 884 were drought tolerant and K 850, PG 5 and JG 74 were drought susceptible. The drought tolerance capacity of tolerant genotypes was associated with retention of high RWC, less membrane damage, high total chlorophyll content and higher osmotic potential under stress conditions. The higher osmotic potential was associated with more accumulation of osmolite solutes like nitrate reductase contents in tolerant genotypes under stress condition. Regarding sink potential, the tolerant genotypes recorded less reduction in yield attributes like pods per plant, seeds per plant, 100-seed weight, harvest index and grain yield under conditions of water stress over the susceptible genotypes. High relative water content (RWC) at all stages coupled with less reduction in total chlorophyll as well as nitrate reductase activity.
It is I
LLEGAL t
o cop
y, pri
nt or
save
any c
onten
t of th
is PDF,
in pa
rt or in
full,
on an
y retr
ieval
syste
m,
withou
t the E
XPRESS WRITTEN PERMISSIO
N of th
e cop
yrigh
t-hold
er

National Conference on Climate Change and Agricultural Production: Adapting Crops to Climate Variability and Uncertainty, 6th–8th April, 2017
[255]
Table 1: Effect of Moisture Ecosystems on Crop Growth Rate (g m-2 day-1) and Relative Growth Rate (mg g-1 Day-1) of Chickpea Genotypes
Variety Crop Growth Rate Relative Growth Rate 55-75 DAS 75-95 DAS 55-75 DAS 75-95 DAS
RF IR Mean RF IR Mean RF IR Mean RF IR Mean KWR 108 0.180 0.198 0.189 0.31 0.34 0.33 0.068 0.075 0.072 0.045 0.050 0.048 PG 5 0.190 0.238 0.214 0.33 0.41 0.37 0.072 0.090 0.081 0.048 0.060 0.054 RSG 888 0.183 0.215 0.199 0.32 0.37 0.35 0.069 0.081 0.075 0.046 0.054 0.050 K 850 0.181 0.222 0.201 0.31 0.39 0.35 0.068 0.084 0.076 0.046 0.056 0.051 CSJD 884 0.151 0.166 0.158 0.26 0.29 0.27 0.057 0.063 0.060 0.038 0.042 0.040 JG 74 0.157 0.201 0.179 0.27 0.35 0.31 0.060 0.076 0.068 0.040 0.051 0.045 Mean 0174 0.206 0.190 0.30 0.36 0.33 0.066 0.078 0.072 0.044 0.052 0.048 CD (p=0.05) V-0.009 I-0.016 V×I-NS V-0.015 I-0.026 V×I-NS V-0.004 I-0.006 V×I-NS V-0.003 I-0.005 V×I-NS
RF=Rainfed IR=Irrigated
REFERENCE [1] Arora A, Sairam R K, Srivastava G C 2002.Oxidative stress and antoxidative system in plants.Current Science 82 (10):1227-1238.
Effect of Diversification and Intensification of Rice-Wheat Cropping System on Weed Dynamics in Different Vegetable Based Crop
Sequences in Nalanda District of South Bihar
S.K. Chaudhary1*, A.K. Singh2, S.K. Yadav3 M.K. Singh4 P.K. Singh5 and Pawan Kumar6 1,2Department of Agronomy, BAU, Kanke Ranchi–834006
3,5,6NCOH, Noorsarai, Nalanda–803113 4Department of Agronomy, BAC, Sabour–813210, India
E-mail: *[email protected]
Keywords: Diversification, Intensification, Relative weed density
INTRODUCTION
Agronomic research contributed to the tremendous increase in agricultural production and India has made impressive strides on the agricultural front during the last six decades. Among biotic stresses, crop losses due to weed competition throughout the world as a whole, are greater than those resulting from combined effect of insect-pests and diseases. Hence, this study was conducted for knowledge of weed dynamics and the interaction between the weeds and the crops.
MATERIALS AND METHODS
This experiment was conducted at College of Horticulture, Noorsarai, Nalanda during 2013 to 2015. The experiment was laid down in randomized block design with three replications. There were eight crop sequences have been taken for study. Weed flora of different crops in all three seasons have been counted (m-2). Various observations were recorded on pattern of weed infestation in various crops under different cropping systems at 25days after sowing/planting.
RESULTS AND DISCUSSION
Among all the crop sequences, maize-potato-onion reported highest number of weed population (636 m-2) followed by okra-cauliflower-sponge gourd (599 m-2) and onion-onion-bottle gourd (583 m-2) during first
It is I
LLEGAL t
o cop
y, pri
nt or
save
any c
onten
t of th
is PDF,
in pa
rt or in
full,
on an
y retr
ieval
syste
m,
withou
t the E
XPRESS WRITTEN PERMISSIO
N of th
e cop
yrigh
t-hold
er

National Conference on Climate Change and Agricultural Production: Adapting Crops to Climate Variability and Uncertainty, 6th–8th April, 2017
[256]
year of investigation. But, when years passed these respective crop sequences found reduction in number of weed population. In third year, the maize-potato-onion recorded (437), followed by okra-cauliflower-sponge gourd (397 m-2) and onion-onion-bottle gourd (293 m-2). Reduction in weed numbers in these crop sequences may be due to inter culture operations that performed at critical period of crop growth stages that reduces further seed formation and propagating materials. Tillage operations can have a major impact on the distribution of the weed flora; weed seeds and propagules in soil, because soil disturbance regimes are related to seed distribution and viability (Lutman et al., 2002). On the basis of the above study it is concluded that Cyperus rotundus being perennial is major weed in all the crop sequences, while, Coronopus, Phyllanthus, Eclipta and Amaranthus spp. being annuals can be reduced by growing crop sequences viz., onion-onion-bottle gourd, okra-cauliflower-sponge gourd and okra-cabbage-bottle gourd by inter culture operations.
REFERENCE [1] Lutman P J W, Cussans G W, Wright K J, Wilson B J, Wright G Mc N and Lawson H M 2002. The persistence of seeds of 16 weed
species over six years in two arable fields. Weed Research 42: 231–241.
Impact of Multifunctional Actinomycetes on Saline Soil and Growth Promotion in Maize (Zea mays)
Vinita Verma Babasaheb Bhimrao Ambedkar University Lucknow–226025, India
E-mail: *[email protected]
Keywords: Salinesoil, Actinomycetes Consortia, Proline and TCC
INTRODUCTION
Soil having electrical conductivity (EC) of saturation extract (ECe) in root zone exceeds 4dSm-1 at 25°C and has exchangeable sodium of 15% is referred as saline soil. Actinomycetes have more ability to bear not only high salt concentration but also high pH than bacteria and fungi. In addition, few reports are there about halotolerant actinomycetes and their role in salinity amelioration and growth promotion in maize plant. Therefore, the present study was undertaken to overcome the salinity issue by making the consortia of potent halotolerant actinomycetes isolates and to evaluate the growth promotion in maize by estimating proline and chlorophyll contents after treatment.
MATERIALS AND METHOD
The study was conducted in the research laboratory of department of environmental microbiology at Babasaheb Bhimrao Ambedker University, Lucknow. After morphological and biochemical characterization of actinomycetes following Bergey’s manual of Systematic Bacteriology, consortia were prepared (Baker, 1990) on starch casein agar plate according their salt tolerant capacity and plant growth promotory attributes of potent compatible isolates. Consortia were influenced in the pot containing saline soil (autoclaved) and sterilized maize seeds sown in it. Proline concentration (Bates et al., 1973) and total chlorophyll contents (TCC) of maize leaves were estimated after 15 days of treatment.
RESULTS AND DISCUSSION
The present investigation revealed the multifunctional properties of halotolerant actinomycetes isolates. In this study halotolerant actinomycetes consortia gave promising results for growth and yield in maize under
It is I
LLEGAL t
o cop
y, pri
nt or
save
any c
onten
t of th
is PDF,
in pa
rt or in
full,
on an
y retr
ieval
syste
m,
withou
t the E
XPRESS WRITTEN PERMISSIO
N of th
e cop
yrigh
t-hold
er

National Conference on Climate Change and Agricultural Production: Adapting Crops to Climate Variability and Uncertainty, 6th–8th April, 2017
[257]
saline condition which was observed by evaluating height, weight, root and shoot length and the number of leaves. On the other hand, inoculation of the actinomycetes consortia have greatly increased the concentration of proline and total chlorophyll content (TCC) in maize leaves after exposure to salt stress in comparison to the plant treated with single strain and non treated one. Proline acts as a potent compatible solute that protects the plant against osmotic stress and its concentration is directly correlated with salinity. Further, the results of the current study may serve as baseline data for selecting the actinobacteria strains as natural resource management for sustainable agricultural practices and improvement of the saline soil. The data reported in this study are quite encouraging in terms of promoting the use of halotolerant PGP actinobacteria as a means for improving plant growth under field conditions and maximizing the utilization of salt-affected soils for increasing agricultural production from these soils.
Fig. 1: Effect of Actinomycetes based Consortia on the Growth of Maize Uprooted after 15 Days of Treatment in Saline Soil
REFERENCES [1] Baker R 1990. An overview of current and future strategies and models for biological control.Biological Control of Soil borne Plant
Pathogens 375-388. [2] Bates L, Waldren RPand Teare ID 1973. Rapid determination of free proline for water-stress studies. Plant and Soil39: 205-207.
Height (cm)
Root length (cm)
Shoot length (cm)
Fresh weight
(gm)
Dry weight
(gm)
Proline (mg/ml)
TCC (mg/ml)
Control 18.4 6.6 3.5 0.8 0.28 0 0
Consortium1 44 10.15 9.75 0.695 0.2575 0.001 0.0323
Consortium2 40 10.95 11.5 1.19 0.228 0.0006 0.0121
0
5
10
15
20
25
30
35
40
45
50
Data of treated and non treated maize plants
Control Consortium1 Consortium2
It is I
LLEGAL t
o cop
y, pri
nt or
save
any c
onten
t of th
is PDF,
in pa
rt or in
full,
on an
y retr
ieval
syste
m,
withou
t the E
XPRESS WRITTEN PERMISSIO
N of th
e cop
yrigh
t-hold
er

National Conference on Climate Change and Agricultural Production: Adapting Crops to Climate Variability and Uncertainty, 6th–8th April, 2017
[258]
Inoculation Effects with Penicillium Bilaii on Maize (Zea mays)
S.S. Walia* and Vikrant Dhawan Department of Agronomy,
Punjab Agricultural University, Ludhiana, Punjab–141004, India E-mail: *[email protected]
Keywords: Cobs, Fungus, Grain, Inoculation, Maize, Penicillium Bilaii, Rice
INTRODUCTION
The continuous use of high analysis chemical fertilizers and decreased recycling of crop residues and manures induced several nutrient deficiencies, particularly of micronutrients and is adversely affecting the sustainability of agricultural production. P. bilaii promotes greater phosphate use efficiency, which results in quick emergence, early vigour, greater stress tolerance, and earlier, more even maturity. P. bilaii delivers a safe method of supplying phosphate to growing plants, and reduces the need to seed-place high rates of phosphate fertilizer with sensitive seed like canola, pea, and lentil. P. bilaii is a phosphate inoculants containing the naturally occurring soil fungus P. bilaii, discovered by Agriculture and Agri-Food Canada. It colonises (grows along) plant roots, releasing organic compounds that release the "bound" mineral forms of less available soil and fertiliser phosphate, making it immediately available for the crop to use. Studies have shown that P. bilaii solubilizes more rock phosphate in culture solution than other Phosphorus solubilizing microorganisms (Kucey, 1983; Asea et al., 1988).
MATERIALS AND METHODS
The ½ X, X and 2X rates for maize were 0.502, 1.083 and 2.166 g/kg seed, respectively.. The experiment comprised for the crop with 8 treatments, viz.T1- No seed inoculation + 50 % P per ha; T2 - No seed inoculation + 100 % P per ha; T3 - P. bilaii seed inoculation @ ½ X + 50 % P per ha; T4- P. bilaii seed inoculation @ X + 50 % P per ha; T5 - P. bilaii seed inoculation @ 2X + 50 % P per ha; T6 - P. bilaii seed inoculation @ ½ X + 100 % per ha T7- P. bilaii seed inoculation @ X + 100 % P per ha; T8- P. bilaii seed inoculation @ 2X + 100 % P per ha
Table 1: Composition Components % (w/w)
Pure culture of Penicillium bilaii fungus 3% -21.6% Other ingredients 78.4% - 97%
RESULTS AND DISCUSSION
The study revealed that all the treatments were statistically at par with respect to plant height during year 2014 and 2015. The plant height was slightly more in 100 % fertilizers along with P. bilaii treatment. The number of cobs per plant was statistically same with different treatments of P. bilaii and with chemical fertilizer as compared to alone chemical fertilizer. Similarly, the effect of treatments was observed to be statistically non significant for dry matter at harvest and thousand grain weight for year 2014 and 2015. The dry matter at harvest during 2014 was 217.5 g/plant has also increased to 230.2 g/plant during 2015 with 100 % recommended chemical fertilizer dose and 2X treatment of P. bilaii, however the results were non- significant during both the years. The highest grains per cob was observed in 2X treatment of P. bilaii along with 100 per cent chemical fertilizer, however it was statistically similar over treatment with 100 per cent chemical fertilizer with no inoculation of P. bilaii in year 2015. The grain yield was statistically similar among all the treatments during the year 2014. However, during second year of experimentation the 2X treatment of
It is I
LLEGAL t
o cop
y, pri
nt or
save
any c
onten
t of th
is PDF,
in pa
rt or in
full,
on an
y retr
ieval
syste
m,
withou
t the E
XPRESS WRITTEN PERMISSIO
N of th
e cop
yrigh
t-hold
er
National Conference on Climate Change and Agricultural Production: Adapting Crops to Climate Variability and Uncertainty, 6th–8th April, 2017
[259]
P. bilaii along with recommended dose of fertilizer produced the highest yield but this treatment was statistically similar with alone 100 percent chemical fertilizer. The stover yield was at par with 100% chemical fertilizer along with 2X dose of P. bilaii and 100% chemical fertilizer alone during 2014, however where 50 per cent chemical fertilizer was applied the stover yield was statistically less. The stover yield was at par among all the treatments in year 2015. The study revealed that the Penicillium bilaii fungus along with recommended fertilizer doses made an impact on grain yield and other yield attributing characters during the second year of study and was at par during the first year for both the crops. Improvement in morphological characters like plant height, cobs per plant, spikelet per panicles and grain yield per ha of both the crops was observed with this fungus treated seed but was statistically non-significant.
REFERENCES [1] Asea PEA, Kucey RMN and Stewart JWB 1988.Inorganic phosphate solubilization by two Penicillium species in solution culture and soil.
Soil Biology and Biochemistry (20), 459-464. [2] Kucey RMN 1983.Phosphate-solubilizing bacteria and fungi in various cultivated and virgin Alberta soils.Canadian Journal of Soil Science
(63), 671-678.
Water Credits: A Potential Benefactor and Game Changer for Indian Farmers in Climate Change Scenario
M.I. Bhat1, S.A. Bangroo2*, Faisul Ur. Rasool3 and S.S. Mahdi4 1KVK Budgam–191111, 2KVK Pombay–192233, 3KVK Shopian–192302
1,2,3Sher-e-Kashmir University of Agricultural Sciences and Technology of Kashmir, Shalimar–191121, Srinagar (J&K)
4Department of Agronomy, Bihar Agricultural University, Sabour–813210, Bhagalpur, India E-mail: *[email protected]
Keywords: Climate change, consumptive use, run-off, silting, water credits and water use efficiency.
Climate change is a manifest reality that cannot be eluded on behalf of the lame excuses. So are the facts that it in turn will impact the global distribution and patterns of precipitation, temperature fluctuations, sunshine hours, soil moisture regimes and its subsequent availability. The quality and quantity of the precipitation fluctuations not only will affect the vegetative cover of the terrestrial eco-system but will jeopardize the entire human civilization, if not addressed appropriately and timely. Agriculture and allied sectors form the very edifice of human development and progress. To evaluate how climate change will affect the balance between water demand and water availability, it is necessary to consider the entire suite of socially valued water uses and how the allocation of water across those uses is likely to change. Irrigation water withdrawals account for almost 70% of global water withdrawals and 90% of global consumptive water use (the water fraction that evapotranspires during use) (Shiklomanov and Rodda, 2003). Given the dominant role of irrigated agriculture in global water use, management practices that increase the productivity of irrigation water use (defined as crop output per unit of consumptive water use) can greatly increase the availability of water for other human and environmental uses (Tiwari and Dinar, 2002). According to an FAO study in which the climate change impact was not considered (Bruinsma, 2003), an increase in irrigation water withdrawals of 14% is foreseen by 2030 for developing countries and the climate change is going to increase it further. The significance of rainfed agriculture is that of 1.5 billion ha cropland worldwide, 82 % is rainfed. In dry sub-humid regions, and temperate and tropical arid and semi-arid regions, water management is often a key determinant for agricultural production and productivity (World Development Report, 2008). In India, rainfed areas currently constitute 55 per cent of the net sown area of the country and are home to two-thirds of
It is I
LLEGAL t
o cop
y, pri
nt or
save
any c
onten
t of th
is PDF,
in pa
rt or in
full,
on an
y retr
ieval
syste
m,
withou
t the E
XPRESS WRITTEN PERMISSIO
N of th
e cop
yrigh
t-hold
er

National Conference on Climate Change and Agricultural Production: Adapting Crops to Climate Variability and Uncertainty, 6th–8th April, 2017
[260]
livestock and 40 per cent of human population. Even after realizing the full irrigation potential, about 50 per cent of the cultivated area will remain rainfed (Planning Commission, Govt. of India 2012). The concept of Green water credits is based on the fact that run-off and high evaporation rates lead to the loss of green water, defined here as the water that is held in the soil. Soil and water conservation (SWC) measures such as mulching and contour cropping reduce the amount of run-off and evaporation. As a result, the amount of water available for plants and deep percolation to the groundwater (blue water) increases. Besides runoff and high evaporation, erosion leads to increased sediment loads in rivers causing silting up of dams. There are many soil and water management practices available to diminish accelerated soil erosion and improve water quality. The model of Green water credits that has been employed in many parts of the world to change the deplorable scenario with little modifications may be replicated in India for better socio-ecological and economical development of Indian population.
Dissemination and Utilization of Market Information System by Farmers for Gram Crop in Bhiwani District of Haryana
Veer Sain*, K.K. Kundu and V.P. Mehta Department of Agricultural Economics,
Choudhary Charan Singh Haryana Agricultural University, Hisar–123005, India E-mail: *[email protected]
Keywords: Marketing information system, gram, Market intelligent system
INTRODUCTION
Marketing Information Systems as an interacting structure of people, equipments and procedures to gather sort, analyze, evaluate and distribute, timely and accurate information for use by marketing decision makers to improve their marketing planning, implementation, and control. Market intelligence system is a set of procedures and sources used by managers to obtain their everyday information about pertinent developments in the marketing environment (Kotler and Armstrong, 2010).In Haryana, Hisar, Sirsa, Rohtak, Mahendergarh, Gurgaon, Jind, Kaithal and Karnal districts are the main producers. The bulk of gram in Maharashtra comes from Usmanabad, Ahmednagar, Aurangabad, Nashik, Solapur, Parbham and Beed districts and small quantity is also produced in Bihar, Gujarat, Karnataka Andhra Pradesh and Punjab. Gram was grown, currently, in an area of 55 thosand ha, with production of 42 thousand tonnes and productivity of646kg/ha.during 2014-15.
MATERIALS AND METHODS
The present study has been carried out on the basis of primary sources were collected by personnel interview method by using pre-tested structured schedule prepared for the purpose. Bhiwani district was purposively selected due to maximum production under Gram. In Bhiwani district two blocks (Siwani and Tosham) were selected due to the maximum area. From Bhiwani district four regulated markets were selected due to maximum arrivals of Bhiwani. From two blocks four villages (MIS Adopters and Non-Adopters) was randomly selected. Interview method was developed to get complete and reliable information with the help of well-structured schedule. To study the sources of agriculture market information and their utilization among the 60 farmers were selected for the study, based on random sampling technique. The find out nature, extent, sources and utilization of the market information system by farmers tabular analysis with simple averages, percentages etc. were computed. The farmers response was scored giving a weight of 3 for ‘always’, 2 for ‘sometime’, 1 for ‘rarely’ and 1 for ‘yes’ and 0 for ‘No’.
It is I
LLEGAL t
o cop
y, pri
nt or
save
any c
onten
t of th
is PDF,
in pa
rt or in
full,
on an
y retr
ieval
syste
m,
withou
t the E
XPRESS WRITTEN PERMISSIO
N of th
e cop
yrigh
t-hold
er

National Conference on Climate Change and Agricultural Production: Adapting Crops to Climate Variability and Uncertainty, 6th–8th April, 2017
[261]
RESULTS AND DISCUSSION
Sources of Market Information of Farmers: The result showed that the sources of market information at village level on arrival information indicated that Neighbors and newspapers (I Rank) and (II Rank) were the general sources of market information of Bhiwani district of village farmers. Whereas Relatives and Television (III Rank) and (IV Rank) in Bhiwani district of villages formed the sources of market information. Neighbor’s formed the major source of market information in Bhiwani district of Villages. The institutional agencies like Gram Panchayat, co-operative credit society and SHG’s did provide labor’s market information. However, Krishi Vigyan Kendra’s (KVKs) were part of market information to farmers at village level. Similar findings were also reported by Amrutha and Hugar (2009).
Utilization by Farmers: The result showed that the extent of market information utilized by Bhiwani district of farmers in decision making. It can be clearly seen that making use of market information on arrivals in decision making on various aspects of farming. However, about 93.3% used the information in deciding the crops to be sown. In case of post harvest technique majority was drying (96.7%) in Bhiwani district of farmers. Another case in selling decision majority was when to sell (90.0%) in Bhiwani district of farmers. In case of where to sell (85.0%) in Bhiwani district used the information on market arrivals, respectively. Similar findings were also reported by Hatai and Panda (2015).
Table 1: Farmers Sources of Market Information at Village Level in Bhiwani District of Haryana n=60 S.No. Sources Degree of Awareness
Always Sometime Rarely Total Score Rank Score Percentage Score Percentage Score Percentage
1 Newspaper 93 51.7 54 45.0 2 3.3 149 II 2 Television 72 40.0 46 38.3 13 21.7 131 IV 3 Radio 63 35.0 38 31.7 20 33.3 121 V 4 Gram Panchayat 9 5.0 18 15.0 48 80.0 60 XI 5 Neighbors 96 53.3 56 46.7 0 0.0 152 I 6 Relatives 87 48.3 46 38.3 8 13.3 141 III 7 KVKs 57 31.7 40 33.3 21 35.0 118 VI 8 Cooperative credit society 39 21.7 30 25.0 32 53.3 101 VII 8 SHGS 48 26.7 36 30.0 26 43.3 110 V 10 Magazine 30 16.7 36 30.0 32 53.3 98 VIII 11 Internet 33 18.3 24 20.0 37 61.7 94 IX
Table 2: Extent of Market Information Utilization by Farmers in Bhiwani District of Haryanan=60 Arrival and Price in Reference Market
S. No. Nature/Types of Decision No. Percentage 1 Production Decisions I Crops to be sown 56 93.3 II Area to be sown 21 35.0 2 Selling Decisions I When to sell 54 90.0 II Where to sell 51 85.0 III Whom to sell 46 76.7 IV Quantity to sell 40 66.7 3 Post Harvest Handling Decisions I Drying 58 96.7 II Bagging 42 70.0 III Transportation 48 80.0
It is I
LLEGAL t
o cop
y, pri
nt or
save
any c
onten
t of th
is PDF,
in pa
rt or in
full,
on an
y retr
ieval
syste
m,
withou
t the E
XPRESS WRITTEN PERMISSIO
N of th
e cop
yrigh
t-hold
er

National Conference on Climate Change and Agricultural Production: Adapting Crops to Climate Variability and Uncertainty, 6th–8th April, 2017
[262]
REFERENCES [1] Amrutha C F and Hugar L B 2009.An economic analysis of dissemination and utilization of market information on onion in Karnataka.
International Journal of Commerce and Busness. Management 2 (2): 132-135. [2] Kotler P and Armstrong G 2010.Principle of Marketing, 13th edition, New Jersey, Prentice Hall International. [3] Hatai L D and Panda D 2015. Agricultural Marketing Information System: A Case Study of Traders in Meghalaya. Economic Affairs 60
(2): 263-271.
Impact of Different Levels of Vermicompost in Various Combinations with Chemical Fertilizers on Yield of Wheat Crop and Soil Properties
Deo Kumar1, Ashok Kumar2, S.K. Gupta3 and R.N. Gupta3 1Banda University of Agriculture and Technology, Banda
2Sardar Vallabh Bhai Patel University of Agriculture and Technology, Meerut–225110, India 3Bihar Agricultural University, Sabour, Bhagalpu–813210, India
E-mail: *[email protected]
Keywords: Vermicompost, Chemical fertilizer, Soil health, Wheat
INTRODUCTION
The modern agriculture based on intensive cropping system mainly depends on the use of agro-chemicals in the form of chemical fertilizers and pesticides. In general, the production of chemical fertilizers is leading to depletion of fossil fuel, causing environmental and ground water pollution. The future agricultural growth at higher rate cannot be sustained with deteriorating soil resource base (Sharma & Sharma, 2005) so there is an urgent need to monitor the quality of soil resources and appropriate management strategies for sustained productivity with least environmental degradation. Vermicompost is a product obtained by the action of earthworms. Earth worms feed on any organic wastes, consume 2 to 5 times their body weight and after using 5-10 percent of the feedstock for their growth, excrete the mucus coated matter as worm cast. The average nutrient content of vermicompost is much higher than mostly used FYM. N percent in vermicompost (>3%) is on an average two times higher than FYM (0.75%) and phosphorus and potassium percent is more than ten times higher. It is therefore desirable to know the application of vermicompost with the use of minimum chemical fertilizers is a better for optimum crop yield and also enhanced the soil health by improving the availability of major and micro nutrients as well as properties and quality of the soil.
MATERIALS AND METHODS
The experiment was conducted at SVBPUA&T, Meerut during 2005 -07 impact of different levels of vermicompost in various combination with chemical fertilizers on yield of wheat crop. The treatments were applied in randomized block design with three replications with different levels of prepared vermicompost. The yield of wheat which ranged from 29.16 to45.14 and 29.56 to 49.14 q ha-1 during 2005-06 and 2006-07 respectively was influenced significantly by different treatments. During 2005-06 maximum grain yield (45.14 q ha-1) recorded in case of treatment T10 where 100% NPK with Vermicompost @ 3.0 t ha-1 was applied, was found statistically at par with treatment T7 where vermicompost @ 3.0 t ha-1 was applied with 75% NPK and significantly higher than the rest of the treatment.
It is I
LLEGAL t
o cop
y, pri
nt or
save
any c
onten
t of th
is PDF,
in pa
rt or in
full,
on an
y retr
ieval
syste
m,
withou
t the E
XPRESS WRITTEN PERMISSIO
N of th
e cop
yrigh
t-hold
er

National Conference on Climate Change and Agricultural Production: Adapting Crops to Climate Variability and Uncertainty, 6th–8th April, 2017
[263]
RESULT AND DISCUSSION
The minimum yield of wheat (29.16 q ha-1) was from treatment (T1) where only inorganic source were applied to supply 100% NPK during both years.. Similar trend on grain yield was also obtained during secondyear i.e. 2006-07.With exception of T2, grain yield recorded in T1 where 100% NPK was supplemented through inorganic source was significantly lower than the rest of the treatments. Graded does of vermicompost with similar does of NPK influenced the grain yield of wheat significantly during both the years with exception of T8 and T9. Results revealed that 50% NPK can be substituted by the application of @1.0 t ha-1vermicompost as the grain yield recorded in T1 and T2 was statistically similar while grain yield increased significantly due to application of vermicompost @ 2.0 t ha-1 with 50% NPK. Application of different does of vermicompost with 75% NPK yielded significantly higher than the T1 where only 100% NPK was applied during both the years. No significantly variation in grain yield of wheat was found between the treatments having application of 1 t ha-1vermicompost with either 50% or 75% NPK but yield varied significantly between treatments having the application of 1 t ha-1vermicompost with 50% or 100% NPK. Similarly no variation was also found between T3& T6 and T4& T7 while T4 and T10 varied significantly during both the years. The combination of vermicompost along with 75% NPK also enhanced the soil health by improving availability of different nutrient as well as physico–chemical properties of soil.
Table 1: Effect of Different Treatments on Grain, Straw and Biological Yields (q ha-1) of Wheat Treatments 2005–06 2006–07
Grain Yield Straw Yield Biological Yield Grain Yield Straw Yield Biological Yield T 1 29.16 49.65 78.55 29.56 51.04 80.60 T 2 32.36 58.84 91.20 32.85 59.77 92.62 T 3 36.20 64.54 100.74 38.27 64.93 103.53 T 4 41.33 75.30 116.62 43.53 75.97 119.50 T 5 34.65 61.08 95.73 35.03 61.82 96.84 T 6 38.53 66.34 104.86 39.78 67.16 106.94 T 7 43.85 75.53 119.05 47.92 76.60 124.48 T 8 37.45 65.72 103.17 38.19 66.53 104.72 T 9 39.86 69.64 109.50 40.05 70.43 110.48 T 10 45.14 77.63 122.77 49.14 77.77 126.91
CD (p=0.05) 3.66 5.07 8.12 3.88 5.07 8.60
REFERENCES [1] Kale R D and Krishnamoorthy R V 1981. Litter preference in the earthworm Lampitomauritii. In: Proceedings Indian Academy of Science
Animal Science 90 (1): 123-128.
Alteration in Antioxidant Enzyme Activity by Chromium in Sorghum Bicolor (L.)
Sweety Sihag*, Neha Wadhwa, U.N. Joshi, Anjali Dahiya and Ritu Saini Department of Chemistry and Biochemistry, CCS Haryana Agricultural University, Hisar–125004
E-mail: *[email protected]
Keywords: Antioxidant enzymes; Chromium; Metal toxicity; Sorghum bicolor
INTRODUCTION
Metals are necessary components of all ecosystems and occur naturally in the earth’s crust (Pinto et al., 2003). They appear in a wide range of oxidative states influencing their chemical characteristics and thus
It is I
LLEGAL t
o cop
y, pri
nt or
save
any c
onten
t of th
is PDF,
in pa
rt or in
full,
on an
y retr
ieval
syste
m,
withou
t the E
XPRESS WRITTEN PERMISSIO
N of th
e cop
yrigh
t-hold
er

National Conference on Climate Change and Agricultural Production: Adapting Crops to Climate Variability and Uncertainty, 6th–8th April, 2017
[264]
their bioavailability and toxicity (Verbruggen et al., 2009). Chromium exists in several oxidation states and the impact of its contamination on the physiology of plants depends on the metal speciation, which is responsible for its mobilization, subsequent uptake and resultant toxicity in the plant system (Shanker et al., 2005). The most stable and common forms of Chromium are Cr (III) and Cr (VI) species. There are many studies on Cr toxicity in crop plants. Chromium significantly affects the metabolism of plants such as barley (Hordeum vulgare) (Ali et al., 2004), cauliflower (Chatterjee and Chatterjee, 2000), wheat (Triticum aestivum cv. HD2204) (Sharma et al., 1995), maize (Zea mays) (Sharma and Pant, 1994) and sorghum. Sorghum (Sorghum bicolor L.) moench is the world’s fifth most important cereal crop, after rice, corn, wheat and barley; and the third leading crop in the USA. It belongs to family Gramineae, and also known as ‘durra’, ‘chari’ or ‘jowar’. Sorghum is cultivated for food, feed, fodder and the production of alcoholic beverage, but extensively grown for fodder in north India during kharif season due to its greater adaptability, high fodder yield, better palatability, quality and digestibility.
MATERIALS AND METHODS
The crop was raised during kharif season of 2011-2012 in the net house of Department of Biochemistry, CCS HAU, Hisar. The soil in each pot was treated with different levels of chromium (VI) (0.0, 1.0, 2.0 and 4.0 mg Cr (VI) kg-1 soil) in the form of potassium dichromate. At weekly intervals, the plants were supplied with equal quantities (250ml) of nutrient solution. The plant samples from each treatment were collected at different stages viz. vegetative (35 DAS), flowering (70-75 DAS), and grain filling (90-100 DAS) stages. The plants were treated with following Cr (VI) concentrations:T1 = control (No treatment),T2 = 1.0 mg Cr (VI) kg-
1 soil, T3 = 2.0 mg Cr (VI) kg-1 soil,T4 = 4.0 mg Cr (VI) kg-1 soil. Peroxidase was assayed according to the method of Shannon et al. (1966). Ascorbate peroxidase was assayed by the method of Nakano and Asada (1981). The amount of H2O2was estimated by the method of Sinha (1972). Ascorbic acid content was estimated with slight modifications of the method described by Roe (1964).Soluble protein in enzyme extracts was precipitated with 20% trichloroacetic acid and determined by the method of Lowry et al. (1951).
RESULT AND DISCUSSION
Peroxidase (POX) activity, increased with increasing concentration of Cr (VI) from 0.0 to 4.0 mg Cr (VI) kg-1 soil in leaves and stem of sorghum plants, at all the stages of growth. Maximum increase in activity was observed in 4.0 mg Cr (VI) kg-1 soil treated plants. The POX activity was observed to be maximum at 70 DAS, after which it declined at 90 DAS. At 70 DAS, the POX activity increased from 3.12 to 3.98 units in leaves and 3.16 to 4.37 units in stem with the increase in concentration of Cr (VI) from 0.0 to 4.0 mg Cr (VI) kg-1 soil. The POX activity was generally highest in stem followed by leaves except at 90 DAS. Sen et al. (1994) also observed an increase in peroxidase activity at concentrations above 10 g L-1 Cr (VI), whereas the enzyme activities were least affected at lower concentration of Cr (VI). Sinha et al. (2005) also observed increase in peroxidase activity by application of Cr (VI) in spinach leaves. The increase in antioxidant enzyme activity observed might have been in direct response to the generation of superoxide radical by Cr induced blockage of the electron transport chain in the mitochondria. The increase in the activityas the concentration of the external Cr increased might be due to the stimulatory effect of Cr ions on the enzyme itself (Shanker et al., 2005).
REFERENCES [1] Apel K and Hirt H 2004. Reactive oxygen species: metabolism, oxidative stress, and signal transduction. Annual Review of Plant Biology
55: 373–399. [2] Lowry O H Rosebrough N. J. Farr A. L. and Randall R. J. 1951.Protein measurement with the folin phenol reagent. Biological Chemistry,
193: 265-275. [3] Mittler R 2002. Oxidative stress, antioxidants and stress tolerance. Trends in Plant Sciences7: 405–410.
It is I
LLEGAL t
o cop
y, pri
nt or
save
any c
onten
t of th
is PDF,
in pa
rt or in
full,
on an
y retr
ieval
syste
m,
withou
t the E
XPRESS WRITTEN PERMISSIO
N of th
e cop
yrigh
t-hold
er

National Conference on Climate Change and Agricultural Production: Adapting Crops to Climate Variability and Uncertainty, 6th–8th April, 2017
[265]
[4] Nakano Y and Asada K 1981. Hydrogen peroxide is scavenged by ascorbate- specific peroxidase in spinach chloroplasts. Plant Cell Physiology 22 (5):867- 880.
[5] Roe J H 1964.Chemical determination of ascorbic, dehyroascorbic and diketo gluconic acids.In: methods in biochemical analysis. (Eds. Glick, D.), Inter – Science, New York, 115-139.
[6] Shanker A K, Cervantes C. Loza-Tavera H. and Avudainayagam S 2005.Chromum toxicity in plants.Environment International31:739-753.
[7] Shannon L. M. Key E and Law J Y 1966. Peroxidase isoenzymes from horse radish roots: isolation and physical properties. Journal of Biology and Chemistry241: 2166-2172.
[8] Sinha P, Dube B K and Chatterjee C 2005.Amelioration of chromium phytotoxicty in spinach by withdrawal of chromium or iron application through different modes.Plant Sciences169: 641-646.
[9] Volland S, Bayer E, Baumgartner V, Andosch A. Lütz C. Sima E. and Lütz-Meindl U 2014. Physiology rescue of heavy metal effects on cell physiology of the algal model system Micrasterias by divalent ions.Journal of Plant Physiology171: 154-163.
Yield and its Attributes Affected by Different Sowing Dates and Different Maturity Classes Cultivar on Direct Seeded Rice
Sucheta Dahiya*1, S.S. Punia1, Jagdev Singh1, S.K. Kakraliya1 and Balwinder Singh2 1Department of Agronomy, Chaudhary Charan Singh Haryana Agricultural University, Hisar–125004
2International Maize and Wheat Improvement Centre (CIMMYT), New Delhi–110012 E-mail: *[email protected]
Keywords: Direct seeding, Sowing dates, Different maturity class’s cultivar, Yield attributes
INTRODUCTION
Direct seeding of rice may be cost effective and give higher net returns because production cost is lower. Short duration varieties and efficient water management during early growth stages are some of the key factors needed to get higher yield under direct seeding (Malik and Yadav, 2008). The field experiment was conducted to appraise the effect of different sowing dates and different maturity class’s cultivars on yield and yield attributes of the direct seeded rice during the Kharif season of 2014 and 2015, at Central Soil Salinity Research Institute, Karnal.
MATERIAL AND METHODS
The geographical location of Karnal is 29o 42' N latitude and 76o 57' E longitude with an elevation of 243 m above the mean sea level. Experiment comprised of four sowing dates viz. 10th June, 25th June, 10th July, 25th July and different maturity classes cultivar viz. Arize 6129 (Early), Arize 6444 (Mid) and Pusa 44 (Long). Data on yield related parameters of direct seeded rice were recorded. The experimental data for various yield and yield attributing characters was statistically analyzed by the methods of analysis of variance (ANOVA). The significance of treatment effect was computed with the help of ‘F’ (variance ratio) test and to judge the significance of difference between means of two treatments, critical differences (CD) was worked out.
RESULTS AND DISCUSSION
Panicles (m-2): Maximum number of panicle m-2 (346,340) respectively for both consecutive years was observed when crop was sown on 10th June while the crop sown on 25th July gave minimum tillers m-2 (251,245) during both years. Early maturing variety Arize 6129 showed maximum number of panicle m-2 (316,311) and minimum number of panicle m-2 was recorded in Pusa 44 (316,311) for both consecutive years.
Total Florets per Panicle: Number of florets per panicle is significantly affected by different sowing dates. 10th June seeding produced maximum number of florets (152,151) while minimum number of kernels per panicle
It is I
LLEGAL t
o cop
y, pri
nt or
save
any c
onten
t of th
is PDF,
in pa
rt or in
full,
on an
y retr
ieval
syste
m,
withou
t the E
XPRESS WRITTEN PERMISSIO
N of th
e cop
yrigh
t-hold
er

National Conference on Climate Change and Agricultural Production: Adapting Crops to Climate Variability and Uncertainty, 6th–8th April, 2017
[266]
(137,136) for the year 2014 and 2015 respectively was produced by 25th July seeding.All the other sowing dates were non-significant to each other. Whereas, early maturing cultivar Arize 6129 showed up maximum florets per panicle for both years (149, 146) due to varietal character as compare to Arize 6444 and Pusa 44.
1000-Grain Weight (g): Rice sown on 10th June produced heavier grains while crop sown on 25th July produced minimum grain weight. Arize 6129, early maturing hybrid produced heavier grain than other two maturity classes during both years.
Paddy yield (Kg ha-1): 10th June sowing produced maximum paddy yield (8024, 7921 kg ha-1) while less paddy yield (3891, 3580 kg ha-1) was observed in 25th July sowing. Early maturing variety Arize 6129 showed maximum paddy yield 9 7185,6917) than other two maturity classes (6604,6404 kg/ha and 5876, 5743 kg/ha) respectively.
REFERENCES [1] Malik R.K. and Yadav A2008. Direct seedimg rice in Indo-Gangetic Plain: Progress, Problems and Oppurtunities. In Humphreys, E and
Roth. (Eds.) 2008. Permanent bed rice residue management of rice wheat system Indo- Gangetic Plains, In Proceedings of a Workshop held in Ludhiana, India, 7-9 September, 2006. ACIAR Proceeding No. 127 pp. 133-143.
Table 1: Effect of sowing Dates and Different Maturity Classes on Yield and Yield Attributing Characters Treatments Number of panicles/m2 Total Florets/ Panicle Test Weight (g) Grain Yield (kg/ha)
Sowing Dates 2014 2015 2014 2015 2014 2015 2014 2015 10 June 346 340 152 151 25.88 25.48 8024 7921 25 June 326 320 149 147 24.88 24.79 7880 7681 10 July 295 289 144 143 23.72 23.31 6425 6236 25 July 251 245 137 136 22.91 21.50 3891 3580 C.D at 5% 7.48 5.27 2.71 2.57 0.48 0.50 457 281 Cultivars Arize6129 (E) 316 311 149 146 24.72 24.38 7185 6917 Arize 6444 (M) 303 298 146 146 24.48 23.53 6604 6404 Pusa 44 (L) 293 286 141 141 24.29 22.93 5876 5743 C.D. (p=0.05) 5.20 4.22 2.39 1.73 0.28 0.37 235 203
Effect of Different Levels of Micronutrients and FYM on Plant Growth, Survival Percentage and Establishment of Pomegranate, Punica
Granatum (L.)Cv. Khandhari under Allahabad Agro Climatic Conditions
Amit Pandey1, V.M. Prasad1, Prateek Singh1, V. Manju Vani3 and Deepak Kumar Jaiswal2* 1Department of Horticulture, SHIATS, Allahabad–211007, India
2Department of Entomology and Agricultural Zoology, 3Department of Horticulture 2,3I.Ag.Sc. BHU, Varanasi–221005 (U.P.)
E-mail: *[email protected]
Keywords: Micronutrients, Growth, Survival percentage, Girth
INTRODUCTION
Pomegranate is an Important and ancient table fruit, a native to Iran (Persia). Ganesh, Mridula, Ruby, Arakta and Bhagwa are some of the important varieties of pomegranate grown in India. Use of various FYM and fertilizers is a good practice to maintain Physicochemical and biological properties of the soil. The extensive
It is I
LLEGAL t
o cop
y, pri
nt or
save
any c
onten
t of th
is PDF,
in pa
rt or in
full,
on an
y retr
ieval
syste
m,
withou
t the E
XPRESS WRITTEN PERMISSIO
N of th
e cop
yrigh
t-hold
er

National Conference on Climate Change and Agricultural Production: Adapting Crops to Climate Variability and Uncertainty, 6th–8th April, 2017
[267]
use of chemical fertilizers which affect the soil health results in decreased soil productivity. For effective utilization, the evaluation of pomegranate, Punica granatum (L.) cv. Khandari for different levels of Micronutrients and FYM on plant growth, survival percentage is the area of concern. Therefore, this experiment is about the impact of Micronutrients and FYM on plant growth, survival percentage advances made in the evaluation studies in pomegranate.
MATERIALS AND METHODS
The investigation was conducted during Nov. 2014–March 2015 at the Department of Horticulture, Allahabad School of Agriculture, Sam Higginbottom Institute of Agriculture Technology and Sciences, Allahabad. The experiment was laid out in a Randomized Block Design with 10 treatments and 3 replications. Variety selected for research was KHANDHARI (I.A.R.I., New Delhi) Maintaining a spacing of 4x4 m2 for transplanting. From the present investigation, it may possibly be concluded that treatment T9 (FYM 5kg+Zn 40mg + Mn 60mg + B 10mg) is recorded as best treatment in terms of better plant growth and survival percentage. This treatment can be considered most appropriate for pomegranate in this region which is survival percentage (100%) under Allahabad agro-climatic conditions.
REFERENCE [1] Bambal S.B., K.N. Wavhal and S.D. Nasralkar 1991. Effect of foliar application of micro-nutrients on fruit quality and yield of
pomegranate. (Punica granatum L.) cv. Ganesh. Maharashtra Journal of Horticultural Sciences 5: 32–36.
Influence of Nitrogen and FYM Application on Quality of Pear (Pyrus pyrifolia Nakai) in North India
Shahroon Khan1*, R.K. Godara1 and R.S. Malik2 1Department of Horticulture, 2Department of Soil Science
1,2CCS Haryana Agricultural University, Hisar–125004, India E-mail: *[email protected]
Keywords: Fruit quality, Farmyard manure, Nitrogen, Pear
INTRODUCTION
Pear is the most important pome fruit after apple and belongs to family Rosaceae. It is mainly grown in temperate climate, however, there is also little acreage occupied in sub-tropical areas. Punjab Beauty is a semi-soft variety of pear, usually upright in growth and requires low (150-200 h) chilling hours. The growers are more enthusiastic to grow Punjab Beauty cultivar due to its regular bearing and high yielding traits. Organic matter can mitigate some negative effects engendered by chemical fertilizers. Application of fertilizers is a common practice to ameliorate the level of particular nutrient element in the soil to get favorable response on yield and fruit quality. Heance, the study was undertaken to evaluate the effect of Nitrogen and FYM on biochemical contents of pear.
MATERIAL AND METHODS
The present investigation was carried out at CCS Haryana Agricultural University, Hisarduring 2012-13 to study the nitrogen and farmyard manure doses on fruit quality of Pear cv. Punjab Beauty. Urea as a source of nitrogen was applied in five treatments (0, 200, 400, 600 and 800 g) and three level of FYM (30, 60 and 90 kg/plant). The acidity was determined by titrating 5 ml of juice against 0.1 N NaOH solution using
It is I
LLEGAL t
o cop
y, pri
nt or
save
any c
onten
t of th
is PDF,
in pa
rt or in
full,
on an
y retr
ieval
syste
m,
withou
t the E
XPRESS WRITTEN PERMISSIO
N of th
e cop
yrigh
t-hold
er

National Conference on Climate Change and Agricultural Production: Adapting Crops to Climate Variability and Uncertainty, 6th–8th April, 2017
[268]
phenolphthalein as an indicator (A.O.A.C. 1990).Total sugar and reducing sugar were estimated by Hulme and Narain method (1931).The obtained results were statistically analyzed by using IRRISTAT at a significance level of p = 0.05.
RESULTS AND DISCUSSION
The fruit juice percent increased with increase in doses of nitrogen and FYM. Maximum juice content (56.71%) was recorded when plant was supplemented with 800 g nitrogen/plant, which was at par with 600 g/plant (56.07%) and minimum (52.53%) without application of nitrogen. Furthermore, maximum (56.79%) juice content was extracted with application of 90 kg FYM/plant. The interaction between nitrogen and FYM was significant (Table 1). The fruit quality in terms of TSS, TSS to acid ratio, total, reducing and non-reducing sugars improved with the application of 600 g nitrogen and 90 kg FYM per plant. However, minimum acidity in fruits was with nitrogen 800 g per plant and FYM 90 kg per plant.
Table 1: Effect of Nitrogen and FYM on Juice (%) of Pear cv. Punjab Beauty FYM
(kg/ Plant) Nitrogen (g/ Plant) Mean 0 200 400 600 800
Juice (%) 30 50.53 51.77 53.00 54.29 55.21 52.96 60 52.27 53.79 54.46 55.82 56.76 54.62 90 54.79 55.77 57.12 58.10 58.16 56.79
Mean 52.53 53.78 54.86 56.07 56.71 CD (p=0.05) N=1.27, FYM=1.21, Nitrogen x FYM=1.48
REFERENCES [1] AOAC 1990. Official Methods of Analysis. Association of Analytical Chemists (15th eds.), Washington, D. C., USA [2] Hulme AC and Narain R 1931. The ferry cyanide method for determination of reducing sugars.A modification of Hagedom-Jersen Hanes
Technique. Biochemical Journal 25: 1051-1061.
Standardization of Time of Grafting and Scion Cultivars for Epicotyl Grafting under Western Uttar Pradesh Conditions
Sohanveer1*, Satya Prakash1, Manoj Kumar Singh1, Syed Sami Ullah2 and Ranjeet Kumar1 1Department of Horticulture, Sardar Vallabhbhai Patel
University of Agriculture and Technology, Meerut–250110, India 2Division of Fruit Science, Sher-e-Kashmir University of Agricultural Sciences
and Technology of Kashmir, Srinagar–190025, India E-mail: *[email protected]
Keywords: Mango, Epicotyl grafting, Dashehari, Rataul.
INTRODUCTION
Mango (Mangifera indica L.) is one of the most important tropical fruits relished for its succulence, exotic flavour and delicious taste. It has great economic potentialities as it fulfils the requirements for nutritional, medicinal, commercial, industrial and religious needs. Mango is cross pollinated and heterozygous crop and propagation by seed leads to enormous variability in the progenies. Seedling trees never resemble the mother plants. Although seedling trees produce heavy crop but fruit size and quality is inferior and does not fetch good return in market. Researchers have suggested a number of propagation techniques in mango which have been practiced commercially. Grafting of scion on the germinating seedling in epicotyl grafting has been successfully used as an efficient, economic, rapid and convenient to adopt on commercial scale for propagation of mango.
It is I
LLEGAL t
o cop
y, pri
nt or
save
any c
onten
t of th
is PDF,
in pa
rt or in
full,
on an
y retr
ieval
syste
m,
withou
t the E
XPRESS WRITTEN PERMISSIO
N of th
e cop
yrigh
t-hold
er

National Conference on Climate Change and Agricultural Production: Adapting Crops to Climate Variability and Uncertainty, 6th–8th April, 2017
[269]
MATERIALS AND METHODS
The research was performed during the year 2013-2014. Seedling rootstocks for epicotyl grafting were raised from freshly extracted healthy mango stones of unknown cultivars. Mango stones were sown in black poly bags containing growing media of sand, farm yard manure and soil in the ratio of 1:1:1. Healthy scion shoots of 3-4 months old having 0.4 cm thickness and 8 cm length were selected from current season growth of mother plants of Dashehari, Bombay Green, Rataul and Chausa. The epicotyl grafting was performed by the wedge technique as suggested by Majumdar and Rathore (1970).
RESULTS AND DISCUSSION
Perusal of data recorded on days taken for sprouting indicated that among the treatments, earliest sprouting was recorded in Dashehari grafts (13.70 days) followed by Bombay Green (14.49 days), Rataul (14.72 days), while Chausa grafts had taken maximum days to sprout (20.52 days). Among all the grafts made on three different dates (9th July, 9th August and 9th September), the minimum days for sprouting was recorded in August followed by July (Table 1). The latest sprouting was however, recorded in grafts made in September. The interaction effect of time of grafting and scion cultivars ondays taken for bud sprouting was also found to be significant. Though the available literature on this aspect is too less in order to make a comparison between the different scion cultivars, Gurudatta et al.(2004 & 2012) had reported sprouting in Dashehari grafts in between 13 and 14 days. The latest sprouting reported in Chausa in the current study was also observed by Ram et al. (2012). Further the variation in the genetic makeup of the variety also influences the histological and physiological development within the shoots. The possible reason for earliest sprouting in Dashehari grafts as compared to other scion cutivars in the present study might be attributed to the hardy nature of the Dashehari which is highly adapted to the climatic condition prevailing in western Uttar Pradesh as compared to other scion cultivars (Upadhyay et al. 1988).
REFERENCE [1] Ram R.B., Kumar D., Priyamvada S., Rubee L. and Meena M.L. 2012. Standardization of stone grafting in some mango cultivars under
Lucknow conditions. Hort Flora Research Spectrum 1 (2):165-167.
Impact of Tillage Practices on Growth, Yield and Economics of Lathyrus under Rainfed Rice Based Cropping System of Chhattisgarh
Tej Ram Banjara1, G.P. Pali2 and Abhishek Shori1 1Department of Agronomy, Institute of Agricultural Sciences,
Banaras Hindu University, Varanasi–221005, India 2Department of Agronomy, Indira Gandhi Krishi Vishwavidyalaya, Raipur–492012, India
E-mail: *[email protected]
Keywords: Tillage practices, Rainfed, Cropping system
INTRODUCTION
Lathyrus is a very hardy pulse crop capable of growing in extreme moisture stress condition. It is a popular drought tolerant crop and its ability to provide economic yield under adverse conditions has made it important crop in subsistence farming in many developing countries. Tillage methods affect the sustainable resources through its influence on soil properties, crop growth and the use of excessive and un-necessary tillage operations is often harmful to soil (Dhar et al., 2008). The objective of experiment was to find out suitable tillage practices of rice based cropping system in residual soil moisture effect on the succeeding lathyrus crop.
It is I
LLEGAL t
o cop
y, pri
nt or
save
any c
onten
t of th
is PDF,
in pa
rt or in
full,
on an
y retr
ieval
syste
m,
withou
t the E
XPRESS WRITTEN PERMISSIO
N of th
e cop
yrigh
t-hold
er

National Conference on Climate Change and Agricultural Production: Adapting Crops to Climate Variability and Uncertainty, 6th–8th April, 2017
[270]
MATERIALS AND METHODS
The field experiment was carried out in RBD with three replications at research cum instructional farm IGKV Raipur. The treatment consisted of four tillage practices viz. T1- Zero tillage direct drilling of seeds and fertilizers at 2nd DAH of rice, T2 -Minimum tillage and line sowing of seeds at 3rd DAH of rice, T3-Minimum tillage at 6th DAH of rice, T4-Farmer practice broadcasting seeds and fertilizer at 12th DAH of rice. The sowing of crop in treatment T1, T2,T3 and T4 was done on 31 October, 1st, 4th and 10th November 2014, respectively. Plant population was recorded with the help of 1 square meter quadrate from the five random points in each plot. The five plant in each plot were randomly selected and tagged for recording growth parameters and observations namely plant height, no. of branches plant-1 were recorded at 30, 60, 90 day after sowing (DAS) and harvest. The data recorded for different characters under investigation were analyzed by following analysis of variance procedure as described by Gomez and Gomez (1984) and Windows-based SPSS program. The SPSS procedure was used for analysis of variance to determine the statistical significance of treatments effect. The Duncan’s multiple-range test was also used to compare treatment means at 5% probability level.
RESULTS AND DISCUSSION
Different tillage practices indicated significant difference in various parameters of lathyrus. At harvest significantly higher plant population (115 plant m-2) and growth parameters like plant height (52.74 cm), branches plant-1 (7.65) and dry biomass (4.25 g plant-1) were recorded at zero tillage direct drilling of seeds at 2nd DAH of rice as compared to other tillage practices, whereas, it was found at par with treatment T2 (minimum tillage and line sowing of seeds at 3rd DAH of rice). The higher number and dry weight of root nodules was observed at all dates of observations under treatment T2 as compared to other tillage practices. Yield and yield attributing characters like number of pods plant-1 (17.89), seed yield (12.16 q ha-1) and stover yield (18.73 q ha-1) was significantly higher in treatment T1 and was at par withT2. The maximum seed yield was in zero tillage and is similar to those of the reports of Kumar et al. (2006) who also noted the highest yield of chickpea under zero tillage practice. However, pod length (cm), number of seeds pod-1,seed index (g) and harvest index (%) did not significantly vary due to different tillage practices. Significantly highest gross return, net return and B:C ratio was observed in treatment T1, but gross return was statistically similar to treatment T2.On the basis of experiment results, it is concluded that zero tillage may be the better tillage practice for growing of the lathyrus in rainfed condition of Chhattisgarh region as zero tillage treatment recorded higher grain yield, economics incomparison to the rest of the tillage practices.
REFERENCES [1] Dhar S, Das S K, Kumar S and Singh J B 2008.Effect of tillage and soil moisture conservation practices on crop yield of chickpea (Cicer
arietinum) and soil properties under rainfed conditions. Indian Journal of Agricutural Sciences 78 (12): 1042-53. [2] Gomez K A and Gomez A A 1984. Statistical procedures for agricultural research. A Willey- Inter Sci. Publication. John Willey & Sons,
New York. [3] Kumar R, Arya R L and Mishra J.P. 2006.Effect of seed priming and tillage management on productivity of chickpea genotype under
rainfed conditions. Indian Journal of Agronomy 51 (1): 54-56.
It is I
LLEGAL t
o cop
y, pri
nt or
save
any c
onten
t of th
is PDF,
in pa
rt or in
full,
on an
y retr
ieval
syste
m,
withou
t the E
XPRESS WRITTEN PERMISSIO
N of th
e cop
yrigh
t-hold
er

National Conference on Climate Change and Agricultural Production: Adapting Crops to Climate Variability and Uncertainty, 6th–8th April, 2017
[271]
Analytical Study on Fabrication of Family Size Biomass Cooking Gas Stove using Natural Biomass as Fuel
Dinesh Kumar1*, Kranti Kumar1, R.M. Singh2 and Akhilesh Kumar1 1Faculty of Agricultural Engineering, Dr. Rajendra Prasad Central Agricultural University,
Pusa, Samastipur–848125, India 2Department of Farm Engineering, Institute of Agricultural Sciences,
Banaras Hindu University, Varanasi–221005, India E-mail: *[email protected]
Keywords: Biomass, Biomass cooking gas stove, Traditional chulha
INTRODUCTION
Biomass, in the form of agricultural forestry and industrial waste is good source of solid, liquid and gaseous fuel. Exposure to smoke from indoor biomass burning is to cause acute respiratory infection, incidence of eye, low birth weight, cancer and chronic lung disease (Kammen, 1999). Briquetted fuel, a substitute for cooking fuel can be obtained from agricultural waste through a process of charring. Keeping into view, a family size cooking stove was required to meet the necessity of nuclear families of villagers. Therefore, this study is analyzing the fabrication of stove by using natural biomass due to its higher energy density.
MATERIALS AND METHODS
Mild steel sheet and mild steel rod were used in fabrication, whereas rice husk, saw dust and coal were taken for it testing and finding for the efficiency. An aluminium pot of capacity of 22 litres and boiling of 20 litres of water was used for performance and testing purpose. It was also taken with the traditional chulha and LPG stove from the water boiling operation. The thermal efficiency of this stove was measured by the Geller et al. (1979) equation with the alternate use of rice husk and saw dust and comprised the efficiency of them.
RESULTS AND DISCUSSION
The temperature resisting capacity of mild still material was found good and it was efficient at more than 600 oC temperatures. The use of biomass fuel as rice husk and saw dust has been taken 24.33 and 24.03 min time to attained temperature 550-600 oC respectively. It has taken 1 hrs and 26 minutes for boiling of 20 litres water at 1000C, 1 hrs and 53 minutes by traditional chulha, whereas 1 hrs and 14 minutes time taken by LPG stove. The thermal efficiency of biomass cooking gas stove for rice husk and saw dust was found 26.81% and 28.64% respectively. The biomass cooking stove was found more economic than traditional chulha and LPG gas stove but their working ability is more efficient than traditional chulha and less than LPG stove, whereas the fuel cost per kg was less than LPG but more than traditional chulha Table1. In this study it was found that the biomass cooking gas stove has high rate of cooking and can achieve higher temperature than the traditional chulha. This is due to concentric flame and smokeless burn. In actual, the thermal efficiency of biomass cooking gas stove found to be more efficient than the traditional chulha but less than the thermal efficiency of LPG stove as reported.
Table 1: Economic Comparisonof Biomass Cooking Gas Stove with two others Types of Chulha Sl. No. Treatment Types of Fuel Used in
Chulha Boiling Time (hrs) for 20
Litres of Water Cost of Fuel per kg
(Rs.) Fuel Consum-ption
(kg) Economics
(Rs.) 1 Biomass cooking gas stove Coal 1.26 20 1.400 28.00 2 Traditional chulha Wood 1.53 06 4.250 25.50 3 LPG stove LPG 1.15 30.98 0.300 09.30
REFERENCE [1] Geller HS and Dutt GS 1979. Measuring Cooking Fuel Economy. Indian Institute of Science, Bangalore, India. Annex-III (a) 1:1085.
It is I
LLEGAL t
o cop
y, pri
nt or
save
any c
onten
t of th
is PDF,
in pa
rt or in
full,
on an
y retr
ieval
syste
m,
withou
t the E
XPRESS WRITTEN PERMISSIO
N of th
e cop
yrigh
t-hold
er
National Conference on Climate Change and Agricultural Production: Adapting Crops to Climate Variability and Uncertainty, 6th–8th April, 2017
[272]
Productivity and Soil Fertility of Sugarcane Plant-Ratoon in Sub-Tropical Region under Integrated Nutrient Management System
S.K. Sinha*, C.K. Jha, Vipin Kumar and S.K. Thakur Department of Soil Science
Dr. Rajendra Prasad Central Agricultural University, Pusa–848125, India E-mail: *[email protected]
Keywords: Productivity, Soil fertilizer, Organics, Sugarcane, Integrated nutrient management
INTRODUCTION
The productivity of sugarcane (Saccharum spp hybrid complex) has been adversely affected during the last decade due to insufficient use of soil organic matter and imbalance use of chemical fertilizers posing threat to the long-term productivity. Continuous reduction in returns obtained from applied inputs has been found to be associated with poor soil organic carbon content (<0.40%) of the sandy- loam soils prevalent in the sub-tropical north India. The proper management of sugar industry wastes will be helpful in improving soil health for profitable sugarcane production and its application reported to increase sugarcane productivity with significant improvement in soil properties.
MATERIALS AND METHODS
The field experiment was conducted on sandy loam calcareous soils (Typic Ustochrept) on sugarcane (cv. BO 147) plant-ratoon system for three consecutive spring season during 2008-2014 at Crop Research Farm, Pusa. The treatments consisted of recommended dose of fertilizers (RDF) and its combination with different organic sources viz. FYM, BC (Bio-compost) and BMDE (Biomethanated distillery effluent) with substitution of K2O @ 25, 50, 75 and 100% through BMDE. The quantity of potassium was adjusted through BMDE as per technical plan. The experiment was laid down in RBD with four replications. The soil, plant and juice quality were analyzed using standard procedures.
RESULTS AND DISCUSSION
The application of organics along with 100% NPK through inorganic fertilizer in cane plant (73.56 t ha-1) and its residual effect on subsequent ratoon crop (65.80 t ha-1) significantly increased number of millable cane, cane and sugar yield over control. The yield increased by 24.95 percent in plots treated with 100% NP + 100% BMDE followed by BC treated plots 22.47 percent in case of plant. The mean uptake of nutrients (N, P, and K) varied significantly due to different treatments and followed the similar trends as cane yield. At the end of plant-ratoon cycle, soil organic carbon varied significantly (0.47 to 0.54%) in organic treated plots as compared to control (0.43 %) and against initial level (0.43%). The soil organic carbon increased by 25.58 percent in plots treated with BMDE over control. The available nutrients (N, P, K and S) of the soil significantly increased in plots treated with organics. The higher fertility levels associated with higher cane and sugar yield of plant-ratoon system. The present findings revealed that integrated use of organics with inorganic fertilizers was superior over 100% NPK. The application of 100% NP + 100% BMDE (150m3) or 100% NP + BC @ 20 tha-1 in cane plant was found beneficial for obtaining higher cane yield and build up in fertility level of soil under sugarcane plant-ratoon system.
It is I
LLEGAL t
o cop
y, pri
nt or
save
any c
onten
t of th
is PDF,
in pa
rt or in
full,
on an
y retr
ieval
syste
m,
withou
t the E
XPRESS WRITTEN PERMISSIO
N of th
e cop
yrigh
t-hold
er
National Conference on Climate Change and Agricultural Production: Adapting Crops to Climate Variability and Uncertainty, 6th–8th April, 2017
[273]
Enhancing Soil Fertility, Nutrient Uptake and Sugarcane Productivity through Integrated Use of Iron and Organics in Sub-Tropical System
C.K. Jha, S.K. Sinha, Vipin Kumar, Smita Kumari and S.K. Thakur Department of Soil Science
Dr. Rajendra Prasad Central Agricultural University, Pusa–848125, India E-mail: *[email protected]
Keywords: Organic Manures, Iron, Sugarcane, Productivity, Nutrient uptake
INTRODUCTION
Sugarcane (Saccharum spp hybrid complex) is a long duration nutrient exhaustive crop grown extensively in tropical and sub-tropical regions of India as cash crop and plays a pivotal role in both agricultural and industrial economy of the country. The yield of sugarcane has reached a plateau due to decline in factor productivity (1). The loss in organic matter is the root cause for decline in factor productivity. Restoration of soil organic matter is thus, needed for improving productivity through correction of macro and micronutrients deficiencies and improvement in soil health. In addition, a great part of applied micronutrient remains in soil as unutilized due to very high fixation in Calciorthent. Continuous use of heavy doses of fertilizers and plant protection chemicals potentially impaired the soil microbial activity, leading to poor soil health (2).
MATERIALS AND METHODS
The field experiment was conducted on sandy-loam calcareous soils under Fe stress condition and low in organic matter on spring sugarcane (BO137) plant for two consecutive seasons at Crop Research Farm, Pusa, Bihar under SDF project, financed by Ministry of Consumers Affairs, Food and Public Distribution, New Delhi. The farm is situated at latitude 25o98’ N, longitude 85o67’ E at an altitude of 52.1 m above mean sea level. The treatments consisted of recommended dose of fertilizers ((150-85- 60 kg N–P2O5–K2O ha-1) either alone and its combination with different organic sources viz. pressmud and sugarcane trash applied @ 10 and 20 t ha-1 with substitution Fe (10 & 20 Kg Fe ha-1). The soil, plant and juice quality were analyzed using standard procedures. The experiment was laid down in RBD and data were analyzed statistically.
RESULTS AND DISCUSSION
The application of graded dose of Fe either alone or in combination with organics i.e. press mud and sugarcane trash significantly increased number of millable cane, cane yield (24.75%) and sugar yield (32.18%) over control (Table1). However, reduction in yield was recorded in treatment receiving sugarcane trash @ 20t ha-1. However, treatment receiving pressmud either alone or in combination with sugarcane trash with 50% Fe (10 kgha-1) significantly increased the uptake of Fe in particular and Zn, Mn and Cu in general over control with improvement in organic carbon and available macro and micro nutrients content of post harvest soil. The distribution pattern of micronutrients in different soils showed that the lowest fractions of Fe being present as water soluble + exchangeable form followed by insoluble ferrous iron and highest as residual fraction. It can be observed that Fe was more concentrated in non-labile fractions. The integrated use of organic and inorganic fertilizer (RDF 150:85:60 + PM 10 t ha-1 + ST 10 t ha-1 along with 10 kg Fe ha-1 (supplying 50% Fe) was beneficial for sustaining soil health and enhancing productivity of sugarcane in calcareous soil deficient in Fe.
It is I
LLEGAL t
o cop
y, pri
nt or
save
any c
onten
t of th
is PDF,
in pa
rt or in
full,
on an
y retr
ieval
syste
m,
withou
t the E
XPRESS WRITTEN PERMISSIO
N of th
e cop
yrigh
t-hold
er

National Conference on Climate Change and Agricultural Production: Adapting Crops to Climate Variability and Uncertainty, 6th–8th April, 2017
[274]
Table 1: Effect of Integrated Use of Iron and Organic Manures on Performance of Sugarcane Incalcareous Soil Treatments NMC
(000ha-1) Cane Yield
(t ha-1) Sugar Yield
(t ha-1) Response over Control
(%) Cane Yield Sugar Yield
T1 RDF 65.0 59.4 6.68 ---- -- T2 RDF+ Fe 20 kg ha-1 87.0 73.5 8.61 23.73 28.89 T3 RDF +Fe 10 ha-1 80.6 66.4 7.77 11.78 16.31 T4 RDF + ST 20 t ha-1 72.0 61.3 7.22 3.20 8.08 T5 RDF + PM 20 t ha-1 83.2 68.0 8.35 14.47 25.00 T6 RDF +P M 10 t + S T 10 t -1 80.0 65.0 7.73 9.42 15.71 T7 RDF +PM 10 t + ST 10 t + Fe 10 kg ha-1 90.0 74.1 8.83 24.75 32.18 CD (0.05) 13.1 12.5 1.26 --- ----
RDF-Recommended dose of fertilizer (N, 150:P2O5:85:K2O:60); ST-Sugarcane trash; PM-Pressmud
REFERENCES [1] Yadav RL, Yadav DS, Singh RM and Kumar A 1998 Long-term effect of inorganic fertilizer inputs and crop productivity in rice-wheat
cropping system. Nutrient Cycling in Agro-ecosystems 51: 193-200. [2] Singh KP, Srivastav TK, Singh PN and Suman A 2007 Enhancing soil fertility, microbial activity and sugarcane (Saccharum officinarum)
productivity through organics in sub-tropical system. Indian Journal of Agricultural Sciences 2:84-87.
Nutrient Uptake and Tuber Yield Influenced by Nitrogen Levels and Fertigation Frequency in Potato (Solanum tuberosum L.)
Vikram Ghiyal*, A.K. Bhatia and V.K. Batra
Department of Vegetable Science, CCS Haryana Agricultural University Hisar–125004, India
E-mail: *[email protected]
Keywords: Drip irrigation, Fertigation frequency, Nutrient uptake, Tuber yield
INTRODUCTION
Potato (Solanum tuberosum L.), a member of Solanaceae family, is believed to be the native of South America. India has the largest irrigation network in the world, but its irrigation efficiency is not more than 40 percent. Among modern irrigation techniques, drip system has been most efficient alternative method of irrigation than the furrow method in potato. In fertigation, the fertilizer use efficiency could be as high as 90% in comparison of conventional methods (40-60%). The amount of nutrients loss through leaching can be as low as 10 per cent in fertigation, whereas, it is 50 per cent in the traditional system. Keeping in view of the importance of crop problems and scope the present investigation has been planned to find out the effect of frequency and dose of nitrogen fertigation on yield of potato.
MATERIALS AND METHODS
The experiment comprising of four levels of nitrogen, i.e., 90(N1), 120(N2), 150(N3) and 180(N4) kg/ha and three fertigation frequencies, i.e., every 3rd day (F1), every 6th day (F2) and every 9th day (F3), was carried out at Chaudhary Charan Singh Haryana Agricultural University, Hisar during Rabi season of 2014-15. The treatments were laid out in with three replications. The net plot size was two rows of 8 m length (8.0x1.2 m).The observations were recorded on growth and tuber yield parameters.
It is I
LLEGAL t
o cop
y, pri
nt or
save
any c
onten
t of th
is PDF,
in pa
rt or in
full,
on an
y retr
ieval
syste
m,
withou
t the E
XPRESS WRITTEN PERMISSIO
N of th
e cop
yrigh
t-hold
er

National Conference on Climate Change and Agricultural Production: Adapting Crops to Climate Variability and Uncertainty, 6th–8th April, 2017
[275]
RESULTS AND DISCUSSION
The nitrogen levels and fertigation frequency significantly influenced nutrient (NPK) uptake and total tuber yield of potato crop. In case of nitrogen levels, maximum nutrient uptake by foliage (N: 5.12, P: 14.14 and K: 46.12 kg/ha) and tuber of potato (N: 142.00, P: 28.17 and K: 199.96 kg/ha) was observed with N2. Among the fertigation frequency, nitrogen uptake by foliage had non-significant effect, whereas, the maximum phosphorus (12.27 kg/ha) and potassium (46.49 kg/ha) uptake was with F1 and it’s also significantly maximum nutrient uptake (N: 135.07, P: 26.27 and 193.65 kg/ha) by tuber of potato. Interaction effects of different treatments showed maximum nutrient uptake by tuber of potato (P: 29.43 and K: 205.74 kg/ha). Similar to these findings Badr et al. (2011) reported that both nitrogen rate and fertigation frequency at shorter durations (daily, alternate and weekly) intended to stimulate the pattern of potato N uptake more than longest duration. The total tuber yield (q/ha) also varied significantly due to the interaction of nitrogen levels and fertigation frequency. The interaction between the treatments F1N2 revealed maximum total tuber yield (307.78 q/ha) followed by F1N3 (299.06 q/ha). Behnam Etemad and Mansour Sarajuoghi (2012) showed that the interaction of different levels of N fertilizer × different of application times significantly affected tuber yield (P ≤0.05). A distinct increase tubers yield was observed with T1 (424.12 Q/ha) (Drip each row) and T2 (406.75 Q/ha) (Drip each pair) during both the years and in pooled data (Kapadiya et al., 2013).It is concluded that the nutrient uptake and yield of potato were recorded maximum when nitrogen 120 kg/ha was supplied every 3rd day in split doses through drip in potato.
REFERENCES [1] Badr M.A., Taalab A.S. and El-Tohamy W.A. 2011. Nitrogen application rate and fertigation frequency for drip-irrigated potato
(Solanumtuberosum).Australian Journnal of Basic and Applied Sciences 5 (7): 817-825. [2] Behnam Etemad and Mansour Sarajuoghi 2012. Study of the Effect of Different Levels and Application Timing of Nitrogen Fertilizer on
Yield and Number of Potato Tuber of Agria in Ghorveh, Iran. Annals of Biological Research 3 (3): 1385-1387. [3] Kapadiya H.N, K. B. Gohil, S. A. Trivedi 2013. Potato Crop Performance and Economics under Various Irrigation Systems. Indian
Journal of Research 3: 103-104.
Effect of Endomycorrhizae Inoculation on Growth of Direct Seeded Rice under Alluvial Soil
Ranjeet Kumar1, Mahendra Singh1*, G.S. Panwar2 and Rajiv Rakshit1
1Department of Soil Science and Agricultural Chemistry, 2Department of Agronomy 1,2Bihar Agricultural University, Sabour–813210, Bhagalpur, India
E-mail: *[email protected]
Keywords: DSR, Mycorrhiza, Plant growth, Maize
INTRODUCTION
Mycorrhiza is a mutualistic symbiosis between certain groups of soil fungi and most plant root systems (Hata et al., 2010). The most publicized benefit of mycorrhiza is the improved growth of plants which is mainly due to enhanced phosphorus (P) nutrition. Various mechanisms (e.g. exploration of large soil volume, faster movement of mycorrhizal hyphae and solublization of soil phosphorus) are responsible for increasing the uptake of phosphorus by mycorrhizal plants that induced the plant growth.
It is I
LLEGAL t
o cop
y, pri
nt or
save
any c
onten
t of th
is PDF,
in pa
rt or in
full,
on an
y retr
ieval
syste
m,
withou
t the E
XPRESS WRITTEN PERMISSIO
N of th
e cop
yrigh
t-hold
er

National Conference on Climate Change and Agricultural Production: Adapting Crops to Climate Variability and Uncertainty, 6th–8th April, 2017
[276]
MATERIALS AND METHODS
The study was conducted in the Department of Soil Science and Agricultural Chemistry, Bihar Agricultural University, Sabour, Bhagalpur during kharif season 2015. The six species of Arbuscular Mycorrhizal (AM) fungi viz., Glomus mosseae, Glomus coronatum, Glomus intraradices Gigaspora decipien and Local were evaluated for the growth of maize plant.
RESULTS AND DISCUSSION
All the growth parameters viz., plant height (cm), shoot fresh weight, shoot dry weight (g), root fresh weight, root dry weight (g) were significantly increased by the application of AM fungi when compared with control (Table 1). Among all the applied AM fungi species the application of treatment T3 (Glomus mosseae + 100% RDF NK) significantly increased plant height (cm), shoot fresh weight (g), shoot dry weight (g), root fresh weight (g), root dry weight (g) over the all AM fungi application. The application of treatment T3 (Glomus mosseae + 100% RDF NK) gave significantly higher plant height at flowering stage by 51.83%, 10.25%, 5.13%, 5.49% and 18.33% than application of treatments T1 (control), T4 (Glomus intraradices + 100% N and K), T5(Glomus coronatum + 100% N and K), T6(Gigaspora decipien + 100% N and K) and T7 (BAU AM -1(Glomus sp.) + 100% RDF NK) respectively. This treatment also produced maximum shoot fresh weight (21.25 g plant-1) and gave significantly more shoot fresh weight by 74.35%, 28.61 %, 26.25 %, 33.31 % when compared with all the applied treatments, except treatment T2 (100 % RDF) and application of treatment T3 (Glomus mosseae + 100% RDF N and K), respectively. The similar trends were observed for root fresh and dry weight. It is evident from the data that AM fungi inoculation contributed to relative better plant growth over control.
Table 1: Effect of Mycorrhizal Inoculation on Plant Growth in Direct Seeded Rice Treatment Plant
Height (cm) Shoot
Fresh wt. (g) Shoot
Dry wt. (g) Root Fresh
wt. (g) Root
Dry wt. (g) T1 - Control 43.83 5.67 1.26 0.57 0.30 T2 - 100% RDF 99.67 20.00 12.73 5.67 3.05 T3 - Glomus mosseae + 100% NK 91.00 19.17 11.71 5.63 3.12 T4 – Glomus intraradices + 100% NK 80.67 15.17 10.05 4.09 2.17 T5 – Glomus coronatum + 100% NK 86.33 14.25 10.33 4.73 2.94 T6 – Gigaspora decipein + 100% NK 86.00 15.67 8.29 3.00 2.77 T7 – BAU AM-1(Glomus sp.) + 100%NK 74.33 14.17 6.67 2.94 1.96 CD (p=0.05) 3.34 3.98 0.43 0.80 0.39 C.V. 2.31 14.17 2.79 11.87 9.34
REFERENCES [1] Hata S, Kobae Y and Banba M 2010. Interactions between plants and arbuscular mycorrhizal fungi. International Review of Cell and
Molecular Biology 281: 1–48.
It is I
LLEGAL t
o cop
y, pri
nt or
save
any c
onten
t of th
is PDF,
in pa
rt or in
full,
on an
y retr
ieval
syste
m,
withou
t the E
XPRESS WRITTEN PERMISSIO
N of th
e cop
yrigh
t-hold
er

National Conference on Climate Change and Agricultural Production: Adapting Crops to Climate Variability and Uncertainty, 6th–8th April, 2017
[277]
Comparative Assessment of Physicochemical and Biological Quality Characters of Vermicompost from Different Biomass Substrates
Ajeet Kumar*, Sankar Ch. Paul, Rajiv Rakshit, Mahendra Singh, Sunil Kumar, Amit Kumar Pradhan
Department of Soil Science and Agricultural Chemistry, Bihar Agricultural University, Sabour–813210, Bhagalpur, India
E-mail: *[email protected]
Keywords: Physicochemical Character, Vermicompost, Biomass Substrate, Water Hyacinth
INTRODUCTION
The large amounts of plant residues produced globally may serve as potential sources of plant nutrients. These wastes may help in recycling by making manure, compost and vermicompost which is the best options for its management (Bhat and Prabakaran, 2013). However, the different organic wastes have different palatability, particle size, metabolites etc. that may influence the growth and performances of earthworms during vermicomposting (Suthar, 2007). The substrate dictates the essential properties of the compost like the C/N ratio, available macronutrients and micronutrients for plant and associated microflora and fauna. These factors affect the quality of vermicompost produced. Therefore, study has been taken to find out the qualitative differences between vermicomposts produced by specific biomass substrate.
MATERIALS AND METHODS
Two types of vermicomposts like vermicompost of water hyacinth and of coconut leaf were collected separately. Raw vermicomposts were analysed for pH and electrical conductivity, cation exchange capacity and maximum water holding capacity. Organic carbon, available N, exchangeable NH4
+-N and NO3--N, total
N content were determined by standard methods. For total content of P, K, S, Cu, Zn, Fe, Mn, aliquot was prepared by digestion followed by estimation of every elements using standard methods. Biological characteristics like population of fungi, bacteria, actinomycetes, azotobacter, PSB, dehydrogenase activity, microbial biomass carbon, urease enzyme were worked out through standard methods.
RESULTS AND DISCUSSION
Vermicompost of both types showed similar pH that is less than cultivated soil (7.94). The pH in Fertilizer Control Order (1985) method showed little higher than pH method (1:2.5) by Jackson but the magnitude of increase was higher in coconut leaf vermicompost (0.31) than water hyacinth vermicompost (0.22). EC value showed a similar trend. CEC of both types vermicompost were almost similar. Organic carbon content in water hyacinth and coconut leaf vermicompost was 23.1 and 22.5 percent. Water holding capacity was much higher in water hyacinth (213.90%) and coconut leaf vermicompost (226.20%) than cultivated soil (41.00%). Available nitrogen in both vermicompost contributed 3.26% and 2.87% of total nitrogen content. Ammonium nitrogen content was higher than the nitrate form in both the vermicompost. Available phosphorus content was higher in water hyacinth. But higher content of available K was in both water hyacinth and coconut leaf vermicompost which can explain 36.47 and 36.55 percent of the total content of K. Available sulphur content in water hyacinth as well as coconut leaf vermicompost was 4.28 and 4.04 percent of total S content respectively. Micronutrient content was much less than the macronutrient content. Results showed that available part of nutrients was more pronounced in water hyacinth vermicompost than coconut leaf vermicompost. Population of bacteria, fungi, actinomycetes, azotobacter and phosphate
It is I
LLEGAL t
o cop
y, pri
nt or
save
any c
onten
t of th
is PDF,
in pa
rt or in
full,
on an
y retr
ieval
syste
m,
withou
t the E
XPRESS WRITTEN PERMISSIO
N of th
e cop
yrigh
t-hold
er

National Conference on Climate Change and Agricultural Production: Adapting Crops to Climate Variability and Uncertainty, 6th–8th April, 2017
[278]
solubilising bacteria resulted higher in water hyacinth vermicompost than coconut leaf vermicompost. Dehydrogenase activity of water hyacinth vermicompost (87.55�m TPF h-1g-1) was more than coconut leaf vermicompost (59.06�m TPF h-1g-1). Microbial Biomass Carbon data revealed that vermicompost of water hyacinth was far better in quality than the vermicompost of coconut leaf. Activity of urease enzyme i.e. production capacity of ammonia was more pronounced in coconut leaf vermicompost than water hyacinth vermicompost. In conclusion, vermicomposts produced from different biomass substrate are different in quality with respect to nutrient contents as well as microbiological characteristics and water hyacinth vermicompost is better in quality than coconut leaf vermicompost.
REFERENCES [1] Bhat M.I. and Prabakaran S. 2013.Vermistabilization of Polyalthia longifoli a and Enterolobium saman leaf biomass with cow dung by an
epigeic earthworm Eisenia foetida. International Journal of Environmental Biology 3:115-117. [2] Suthar S. 2007.Composting potential of Perionyx sansibaricus (Perrier) in different waste material. Bioresource Technology
98: 1231–1237.
Spatial Distribution of Lead in Soils of Different Agro-climatic Zones of Jharkhand
Rakesh Kumar1*, Shweta Shambhavi1, Rajkishore Kumar1 and Sunil Kumar2 1Department of Soil Science and Agricultural Chemistry, 2Department of Agronomy
1,2Bihar Agricultural University, Sabour- 813210, Bhagalpur, India E-mail: *[email protected]
Keywords: Agro-climatic zone, Jharkhand, Lead, Soil
INTRODUCTION
Heavy metals are natural components of the Earth's crust. They cannot be degraded or destroyed. To a small extent they enter our bodies via food, drinking water and air. Soils are the major sink for heavy metals released into the environment by aforementioned anthropogenic activities (Kirpichtchikova et al., 2006). Inhalation and ingestion are the two routes of exposure, and the effects from both are the same. Pb accumulates in the body organs (i.e., brain), which may lead to poisoning (plumbism) or even death. Amendment of lead contaminated acidic soils with lime to pH 7 or greater to maintained soil containing lead at pH 7 to minimize plant uptake. Jharkhand is popularly known for industries and metalliferous ores. Soil characterization would provide an insight into lead speciation and bioavailability, attempt at remediation of lead contaminated soils would entail knowledge of the source of contamination, basic chemistry, and environmental and associated health effects (risks) of lead. Keeping these views in mind, the present investigation was started to know spatial distribution of lead in different agro-climatic zones of Jharkhand.
MATERIALS AND METHODS
The state having three agro-climatic zones viz. Central and north-eastern plateau i.e zone-IV (Baliapur, Jharia and Dhanbad), Western plateau i.e zone-V (Bagru, Pakharpat, Kisko and Lohardaga) and South eastern plateau i.e zone-VI (Moshabani, Jadugonda and Chandil). Out of the several sources, industrial effluents, sewage and mines are major sources of lead. Dhanbad, Jharia and Baliapur (zone-IV) were geologically comprised with Archean granites and gneisses, huge areas under coal mines. Bagru, Kisko, Pakharpat and Lohardaga (zone-V) were geologically comprised with Archean granites, gneisses and consist bauxite minerals. Mosabani, Jandugonda and Chandil (zone-VI) were geologically comprised with granites gneiss
It is I
LLEGAL t
o cop
y, pri
nt or
save
any c
onten
t of th
is PDF,
in pa
rt or in
full,
on an
y retr
ieval
syste
m,
withou
t the E
XPRESS WRITTEN PERMISSIO
N of th
e cop
yrigh
t-hold
er

National Conference on Climate Change and Agricultural Production: Adapting Crops to Climate Variability and Uncertainty, 6th–8th April, 2017
[279]
and schist and uranium and copper mines prominent. To achieve the objective of the research (Characterization of lead in soil), surface (0-20cm depth) soil samples were collected from different places and topo-sequence i.e. upland, midland and lowland from three agro-climatic zones. All the soil samples were analyzed by using standard procedure and prediction maps were prepared by ArcGIS 10.3 version. Statistical analysis was computed by using SPSS v 10.6 tool.
RESULTS AND DISCUSSION
DTPA (Diethylene triamine penta acetic acid) extractable lead in zone-IV was 0.02-4.3 mg kg-1; in zone-V 0.62-2.22 mg kg-1 whereas in zone-VI 0.48-2.7 mg kg-1 respectively. Total content of lead in zone-IV were 229-547 mg kg-1; in zone-V 177-711 mg kg-1 whereas in zone-VI 173-662 mg kg-1 respectively. Higher amount of DTPA-extractable and total content of lead was observed in lowland against the different topo-sequences. Step wise multiple regression equations showed more impact of soil pH and organic carbon on extractable Pb than other soil parameters whereas in case of total Pb content, organic matter was important determining factor. 48.09 % of available lead was determined by pH and organic carbon. In case of total content of lead, they were determined by organic carbon up to 30.85%.Mean value of DTPA-extractable lead and total content of lead in lowland soils were higher than midland followed by upland except zone-V due to topography of the areas which was related with slope, drainage and deposition of clay particles (Mitsimbonas et al., 1998). The 3D representation and contour plots of available Pb and total Pb in IV evidently identify, categorize and quantify the specific areas where the enrichment of Pb is higher. The available Pb was observed low in the centre as 3.0 mg kg-1.
Table 1: Predictability of Available and Total Content of Co, Ni and Pb with Relation to Soil Characteristics Stepwise multiple regression equation R2× 100 Available Pb Y = 1.617 – 0.168X1** + 0.1505X3** 48.09 Total Pb Y = 208.995 + 62.58X3** 30.85
*p< 0.05, **p <0.01, X1 and X3 indicate pH, and Organic carbon, respectively.
REFERENCES [1] Kirpichtchikova T.A., Manceau A., Spadini L., Panfili F., Marcus M.A. and Jacquet T. 2006. Speciation and solubility of heavy metals in
contaminated soil using X-ray microfluorescence, EXAFS spectroscopy, chemical extraction, and thermodynamic modeling. Geochimica et Cosmochimica Acta 70 (9): 2163–2190.
[2] Mitsimbonas T, Karyotis T, Haroulis A and Argyropoulos G 1998.Distribution of nutrients and heavy metals in agricultural soils of Larissa region.Georgike-Ereuna-Nea-Seira. Publication 20: 48-54.
Effect of Integrated Nutrient Management on Yield of Maize and Soil Fertility
R.K. Singh* Krishi Vigyan Kendra, Hazaribag–825301, India
E-mail: *[email protected]
Keywords: Maize, INM, Yield, Soil fertility, Economics
INTRODUCTION
Maize (Zea mays L.) constitutes one of the five major crops of the world. In India, it occupies an area of 7.59 million ha with a production of 14.71 million tones and with productivity of 1938 kg/ha (MOA 2010). Maize has higher genetic yield potential than other cereal crops. Hence it is called ‘miracle crop’ and also ‘queen of cereals’. Being a C4 plant, it is very efficient in converting solar energy in to dry matter. As heavy feeder of
It is I
LLEGAL t
o cop
y, pri
nt or
save
any c
onten
t of th
is PDF,
in pa
rt or in
full,
on an
y retr
ieval
syste
m,
withou
t the E
XPRESS WRITTEN PERMISSIO
N of th
e cop
yrigh
t-hold
er

National Conference on Climate Change and Agricultural Production: Adapting Crops to Climate Variability and Uncertainty, 6th–8th April, 2017
[280]
nutrients, maize productivity is largely dependent on nutrient management. Maize being an exhaustive crop requires all types of macro and micro nutrients for better growth and yield potential. The present hike in the price of chemical fertilizers has compelled the Indian farmers to use an alternative nutrient management system. Use of only organic manures does not produce spectacular increase in the crop yields, due to their low nutrient status and insufficient availability in time. On the other hand dependency on chemical fertilizers alone may not provide a viable economic option. Therefore, to maintain soil productivity on a sustainable manner an integrated nutrient management approach, using both organic and inorganic sources of nutrients should be adopted. In the present context, the use of manures must be given prime importance and fertilizer use should be limited to balance the nutrient requirement of the crops. So, in order to sustain soil fertility and to reap rich harvests of maize, it is imperative that both organic manuring and mineral nutrition have to be given adequate attention.Keeping this point in view, present investigation was conducted to find out best combination of organic and inorganic fertilizers for maximum production of maize with higher income level in a sustainable manner without affecting the soil qualities.
MATERIALS AND METHODS
The field experiment were carried out in the research demonstration farm area of the Krishi Vigyan Kendra, Hazaribag (Longitude 82o25’, Latitude 23o53’, and Altitude 614 m) with three treatment combinations and Three replications in kharif 2010-11 and 11-12. The experimental soil is sandy loam, gently sloppy, acidic in nature with pH 5.8 to 6.0, poor in organic matter (less than 0.5%), poor in available nitrogen, poor in available/exchangeable phosphorus and medium in available/exchangeable potassium. Agro climatic zone is central and North Eastern plateau region, agro ecological situation is rainfed. The average annual rainfall is 1200 mm, maximum temperature is 40.5o C, minimum temperature is 5.6o C and average relative humidity is 71%. The three treatments were T1 is NPK (Kg ha-1) 60:30:20 + 5 tones FYM, T2 is NPK (Kg ha-1) 80:40:30 + 5 tones FYM and T3 is NPK (Kg ha-1) 100:50:30 + 5 tones FYM. The agronomic data and yield data observed, soil samples were analyzed for organic carbon, available nitrogen, exchangeable phosphorus and exchangeable potassium at initial and at after harvest stage of the crop in both the years and benefit cost ratio were also been calculated on the basis of gross income and net income. The various treatments were estimated on the basis of approved market rates for inputs by taking in to accounts cost of seed, fertilizer, herbicides, pesticides, hiring charges of human labours. The collected data were analyzed statically analysis of variance technique and treatment means showing significant CD values.
RESULTS AND DISCUSSION
Average number of cobs plant-1 were one, two and two in treatment one, treatment two and treatment three respectively. Average length of cob (cm) is 21.80 cm in treatment three. It was significantly highest in all the treatment. It happened due the high use efficiency of chemical fertilizers. Plant heights (cm) in the treatment third were 34.10 cm and 149.20 cm in 25 DAS and 50 DAS respectively. It was significantly highest in all the treatments. Integrated useof organic and chemical fertilizers increased the yield significantly. It was highest in the treatment three in comparison to treatment one and treatment two. In treatment three the grain yield was 16.43 Q ha-1 where as in treatment one the grain yield was 11.42 Q ha-1. The highest yield in the treatment third was, because of maximum use efficiency of chemical fertilizers (Chandrashekara et al., 2000). For soil fertility status assessment, we analyzed organic carbon percentage, available nitrogen kg ha-1, available/exchangeable phosphorus kg ha-1and available/exchangeable potassium kg ha-1 at initial and at harvest stage of the crop in both the years. We adopted the standard procedures for the analyses of the soil. Economics analyses was done by taking pooled data of both the years. In all the treatments there was no significant difference in total expenditure but in total income (Rs. ha-1) and total gross income (Rs. ha-1), it was significantly higher in treatment third
It is I
LLEGAL t
o cop
y, pri
nt or
save
any c
onten
t of th
is PDF,
in pa
rt or in
full,
on an
y retr
ieval
syste
m,
withou
t the E
XPRESS WRITTEN PERMISSIO
N of th
e cop
yrigh
t-hold
er

National Conference on Climate Change and Agricultural Production: Adapting Crops to Climate Variability and Uncertainty, 6th–8th April, 2017
[281]
in comparison to other. B:C ratio was also got similar results. As per the finding of the experiment, treatment 3 with NPK (Kg ha-1) 100:50:30 + 5 tones FYM was the highest in agronomic dataand yield of grain. The benefit cost ratio was also highest for the same treatment. Soil organic carbon and available nitrogen have increasing trend in all the treatments. The field experimentation has thus revealed that an integrated supply of farm yard manure with chemical fertilizers resulted in higher grain yield in maize which has resulted in giving higher net returns, B:C ratio and improved fertility of the soil.
REFERENCES [1] Chandrashekara C P, Harlapur S I, Muralikrishna S and Girijesh GK 2000.Response of maize to organic manure with inorganic fertilizers.
Karnataka Journal of Agricultural Sciences,13: 144-146. [2] MOA 2010.Directorate of Economics and Statistics, Ministry of Agriculture, GOI. htpp://dacnet.in.
Studies of Vase Life and Corm Characters in Gladiolus (Gladiolus hybridus Hort.) Genotypes
Dhara Singh1*, Ashutosh Mishra1, Jitendra Singh2 and Balram Meena1 1Department of Floriculture and Landscaping, 2Department of Fruit Science
1,2College of Horticulture and Forestry, (Agriculture University, Kota) Jhalarapatan, Jhalawar–326023, India
E-mail: *[email protected]
Keywords: Gladiolus genotypes, Vase life, Characters
INTRODUCTION
Gladiolus (Gladiolus hybridus Hort.) is native to South Africa. Gladiolus is one the largest genera in Iridaceae family. Gladiolus is very popular cut spike. It is important commercial spike crop and having pivotal place as cut spike both in domestic and international markets. Gladiolus was introduced into cultivation towards the end of the sixteenth century. It is relatively easy to grow and is ideal for bedding and exhibition purposes. Except true blue, black and green, practically all colours are available in gladiolus.
MATERIALS AND METHODS
The present investigation was carried out during 2014-15 at the Instructional Farm, Department of Floriculture & Landscaping, College of Horticulture & Forestry, Jhalarapatan, Jhalawar, to identify important yield attributing characters for developing high yielding genotypes in gladiolus and to study performance of gladiolus under Jhalawarcondition. Recommended dose of NPK (30:20:20 g/m²) was applied in the form of Urea, Single Super Phosphate and Muriate of Potash, respectively. After field and plot preparations the varieties were allocated to experimental plots through randomization. Total 16 corms of specific variety were planted in each plot. Earthing up of plants was also done at the time of manual weeding after 45 days of planting to support the plants.
RESULTS AND DISCUSSION
The analysis of varietal performance reveled that treatments were significant for most of the characters indicating varietal differences for all the corm and vase characters studied. On the basis of finding of the present experiment the following conclusion may be drawn. Among the 12 varieties of gladiolus the ‘Legend’
It is I
LLEGAL t
o cop
y, pri
nt or
save
any c
onten
t of th
is PDF,
in pa
rt or in
full,
on an
y retr
ieval
syste
m,
withou
t the E
XPRESS WRITTEN PERMISSIO
N of th
e cop
yrigh
t-hold
er

National Conference on Climate Change and Agricultural Production: Adapting Crops to Climate Variability and Uncertainty, 6th–8th April, 2017
[282]
was found for best yielding variety in respect to, number of corms per plant (2.50) and number of corms per plot (37.67). The number of corms per plot showed positive correlated with number of corms per plant (Maurya et al., 2011). The variety ‘Trader Horn’ (70.83) produced more number of cormels per plant. The observed weight of cormels per plant was maximum in ‘Arti’ (65.50 g). The number of cormels per plant is genetic property of the varieties. However, it might have also been affected by the number of corms produced per plant and the number of cormels forming with each corm (Lepchaet al., 2007).On the basis of finding of the present experiment the following conclusion may be drawn. the best performance for maximum number of corms per plot was ‘Legend’(37.67) and ‘Trader Horn’ was maximum number of cormels per plant (70.83).
REFERENCES [1] Lepcha B, Nautiyal M.C. and Rao V.K. 2007. Variability studies in gladiolus under mid hill conditions of Uttarakhand. Journal of Ornamental
Horticulture 10 (3): 169-172. [2] Maurya P K, Binayak R K, Chakraborty R M and Mishra D S 2011.Genetic variability and correlation studies in gladiolus under tarai condition.
Annals of Horticulture 4 (2): 140-146.
Performance of Baby Corn under Different Plant Densities and Fertility Levels in Lateritic Soils of Eastern India
Mainak Ghosh1,2*, Swapan Kumar Maity1, Sanjeev Kumar Gupta2 and Arnab Roy Chowdhury2 1Department of Agronomy, Visva-Bharati University, Sriniketan, Birbhum–731236, India
2Department of Agronomy, Bihar Agricultural University, Sabour–813210, Bhagalpur, India E-mail: *[email protected]
Keywords: Summer maize, Plant population, Fertilizer dose
INTRODUCTION
Growing of maize for vegetable purpose, as baby corn is a diversified and value addition in cropping system and food processing industries. Baby corn is de-husked young ear of female inflorescence in the maize plant, harvested at silk emergence before fertilization, is sweet in taste and crisp. Baby corn ears are in light yellow colour with regular row arrangement, 10-12 cm long and a diameter of 1.0-1.2 cm are preferred in the market (Muthukumar et al., 2005). The cultivation of maize as baby corn is in vogue in the countries like Thailand, Taiwan, China and Japan since long and in India, it is relatively new introduction. Baby corn has revolutionized the food habits by providing diversified food items in the world over. The nutritional value of baby corn is at par or even superior to some vegetables. It is a rich source of fibres, protein, vitamins and iron and easy to digest. Baby corn is highly remunerative and farmers can get a high return in a short period of 45-60 days. Keeping the above idea in view and realizing the importance of baby corn, an attempt was made in this study for the development of plant density and nutrient level in baby corn production in lateritic belt of Indian sub-tropic.
MATERIALS AND METHODS
Field experiment was conducted at, Visva-Bharati University, West Bengal, India to study the effect of fertility level and plant density on growth, productivity and economics of baby corn in factorial randomized block design with three replications. The experiment included three fertility levels (F1: 100 kg N-50 kg P2O5-50 kg K2O/ha; F2: 75 kg N-37.5 kg P2O5-37.5 kg K2O/ha and F3: 50kg N-25kg P2O5-25kg K2O/ha) and four levels plant populations (P1: 60,000 plants/ha; P2: 80,000 plants/ha; P3: 100,000 plants/ha and P4: 120,000
It is I
LLEGAL t
o cop
y, pri
nt or
save
any c
onten
t of th
is PDF,
in pa
rt or in
full,
on an
y retr
ieval
syste
m,
withou
t the E
XPRESS WRITTEN PERMISSIO
N of th
e cop
yrigh
t-hold
er

National Conference on Climate Change and Agricultural Production: Adapting Crops to Climate Variability and Uncertainty, 6th–8th April, 2017
[283]
plants/ha). The spacing between the plants was 33.3 cm, 25 cm, 20 cm and 16.6 cm for P1, P2, P3 and P4 respectively with the fixed row spacing of 50 cm. The sources of fertilizers were urea for N, single super phosphate for P and muriate of potash for K. Half dose of nitrogen and full dose of phosphorus and potassium were applied as basal before sowing of corn. The remaining half of nitrogen was top dressed at knee high stage.
RESULTS AND DISCUSSION
High fertility level (F1) recorded significantly higher number of young cobs/ha and with increasing plant density up to 1,00,000 plants/ha, but declined marginally thereafter. The highest number of cob (1,40,000/ha) was harvested from the plot with 1,00,000 plants/ha which was statistically on a par with that of 80,000 and 1,20,000 plants/ha (Table 1). The slight decline in cob count at the highest plant density might be due to increased plant barrenness at that plant density as reported by Pandey et al. (2002). Young cob yield differed significantly among the fertility levels. The high fertility level (F1) recorded significantly higher quantity of cob yield (71.33 q/ha) than that of the medium (F2) and low fertility (F3) level. The high and medium fertility increased the young cob yield by 46.1 and 20.2 percent respectively over the low fertility level. The baby corn yield did not follow the trend of young cob yield exactly. Though the highest baby corn yield was obtained with the high fertility level and was statistically at par with medium fertility. The high and medium fertility levels recorded respectively 40.5 and 27.7 percent higher baby corn yield from the total harvests over low fertility level. The effect of plant density on young corn yield remained non significant. The highest corn yield (10.5 q/ha) was obtained from the plot having 1,00,000 plants/ha, but it was at par with those of all other plant densities.
Table 1: Effect of Fertility Level and Plant Density on Cob Number, Cob Yield, Corn Yield and Fodder Yield of Summer Maize Grown as Baby Corn
Treatment Cob Number (ha-1) Young Cobyield (q ha-1) Baby Cornyield (q ha-1) Fertility Level F1 (100-50-50 kg N-P2O5-K2O/ha) 1,42,216 71.33 11.00 F2 (75-37.5-37.5 kg N-P2O5-K2O/ha) 1,25,416 58.67 10.00 F3 (50-25-25 kg N-P2O5-K2O/ha) 1,10,000 48.83 7.83 C D (p=0.05) 18,750 7.33 1.50 Plant Density (plants/ha) P1 (60,000 108,333 62.00 9.00 P2 (80,000 120,000 58.67 9.00 P3 (100,000) 140,000 63.67 10.50 P4 (120,000) 136,850 54.33 9.67 C D (p=0.05) 21,666 8.33 NS
REFERENCES [1] Muthukumar V.B., Velayudham K and Tharaprakaash N 2005. Growth and yield of baby corn (Zea mays L.) as influenced by plant
growth regulators and different time of nitrogen application. Research Journal of Agriculture and Biological Sciences 1 (4): 303-307. [2] Pandey A K, Mani V P, Prakash, V, Singh R D and Gupta H S 2002.Effect of varieties and plant densities on yield, yield attributes and
economics of baby corn (Zea mays).Indian Journal of Agronomy 47 (2): 221-226.
It is I
LLEGAL t
o cop
y, pri
nt or
save
any c
onten
t of th
is PDF,
in pa
rt or in
full,
on an
y retr
ieval
syste
m,
withou
t the E
XPRESS WRITTEN PERMISSIO
N of th
e cop
yrigh
t-hold
er

National Conference on Climate Change and Agricultural Production: Adapting Crops to Climate Variability and Uncertainty, 6th–8th April, 2017
[284]
Effect of Integrated Nutrient Management on the Growth and Yield of Wheat (Triticum aestivum L.)
R.N. Maurya1*, Shiv Bahadur2, A.C. Yadav1 and R.A. Yadav1 1Department of Agronomy,
N.D. University of Agriculture & Technology Kumarganj, Faizabad–224229, India 2Department of Agronomy, Institute of Agricultural Sciences, B.H.U., Varanasi–228002, India
E-mail: *[email protected]
Keywords: INM, FYM, Bio-compost, Vermi-compost, Growth, Yield.
INTRODUCTION
In an intensively crop growing area of India, a high annual productivity of crops result in removal of nutrients in substantial amounts that after exceed replenishment through chemical fertilizer and manures ultimately leading to poor soil health. Yields decline and increasing production factors have been reported. Growers have started to use of higher doses of fertilizers, to maintain productivity. Such emerging trends of indiscriminate use of fertilizer without use of organic sources of nutrients are also responsible to deterioration of soil health. The integrated nutrient supply including the use of chemical fertilizers, organic manures like FYM along with bio-fertilizers helps not only in bridging the existing gap between the nutrient removal and addition but also in ensuring balanced nutrient proportion as well as boost the productivity of wheat. Organic matter is the substrate for a large number of soil living beneficial organisms which are essential to keep the plant healthy (Kumar et al. 2015). Keeping these aspects in mind, the present study was conducted to evaluate the effect of integrated use of inorganic and organic sources of nutrient on productivity and economics of wheat.
MATERIALS AND METHODS
The field experiment was carried out during the winter season of 2013-14 at N. D. University of Agriculture & Technology, Kumarganj, Faizabad. The experiment consisted of 12 treatments viz. T1 (75% RDF), T2 (100% RDF), T3 (125% RDF), T4 (75% RDF + 25% through FYM), T5 (75% RDF + 25% through bio-compost), T6 (75% RDF + 25% through vermicompost), T7 (100% RDF + 25% through FYM), T8 (100% + 25% through bio-compost), T9 (100% RDF + 25% through vermicompost), T10 (125% RDF + 25% through FYM), T11 (125% RDF + 25% through bio-compost) and T12 (125% RDF + 25% through vermicompost). The recommended dose of nitrogen, phosphorus and potassium @ 150 kg, 60 kg and 40 kg ha-1, respectively. Neem coated urea (46 %), DAP (18 % N, 46 % P2O5), MOP (60 % K2O), FYM (0.5 % N, 0.25 % P2O5, 0.5 K2O), Vermicompost (3.0 % N, 1.0 % P2O5, 1.5 % K2O) and Bio-compost (1.8 % N, 1.5 % P2O5, 2.0 % K2O) were used as the source of nitrogen, phosphorus and potassium. The inorganic manures singly and in combinations were applied uniformly as per treatment and incorporated into the soil three week before sowing. Full dose of phosphorus and potassium and half dose of nitrogen were given just before sowing and remaining half dose as top dress at 30 days after sowing through urea full dose in the treatment having RDF. Organic manures were applied 15 days before sowing. The irrigation was given at 21 days interval. All other operations were performed as per recommendation for the crop.
RESULTS AND DISCUSSION
Growth, yield attributing characters, grain and straw yield of wheat were significantly influenced by different treatments. Highest number of tillers, leaf area index, length of spike, number of grain per spike, grain and
It is I
LLEGAL t
o cop
y, pri
nt or
save
any c
onten
t of th
is PDF,
in pa
rt or in
full,
on an
y retr
ieval
syste
m,
withou
t the E
XPRESS WRITTEN PERMISSIO
N of th
e cop
yrigh
t-hold
er

National Conference on Climate Change and Agricultural Production: Adapting Crops to Climate Variability and Uncertainty, 6th–8th April, 2017
[285]
straw yield was recorded under 125% RDF+25% vermicompost (T12). Where second highest was observed under 125% RDF+25%Bio-compost (T11). This might be due to the fact that greater availability of nutrients in soil due to increasing application might have enhanced multiplication and elongation of cells leading to increased number of tillers and leaf area index. Significantly improvement in chlorophyll content in leaves might have resulted in better interception and utilization of solar energy leading to higher photosynthetic rate and finally more accumulation of dry matter by the crop. These results are in line with the (Sharma and Jain, 2014), under wheat-based cropping system. Greater availability of metabolites (photosynthates) and nutrients to developing reproductive structures seems to have resulted in increase in all the yield attributing characters which ultimately improved the yield of the crop similar findings were also reported in wheat by (Singh et al., 2010).
REFERENCES [1] Kumar A, Kumar AN, Dwivedi A, Dhyani BP, Shahi UP, Sengar RS, Singh A and Tomar SS 2015. Production potential, nutrient uptake
and factor productivity of scented rice in rice-wheat cropping system along with physico-chemical and microbiological properties under site specific integrated plant nutrient management. Journal of Pure and Applied Microbiology 9(2): 1487-1497.
[2] Sharma SK and Jain N K 2014.Nutritional management in wheat-based cropping system in sub humid southern zone of Rajasthan. Indian Journal of Agronomy 59(1): 26-33.
[3] Singh P, Singh P, Singh K N, Singh R, Aga F A, Bahar F, and Raja W 2010. Evaluation of wheat (Triticum aestivum L.) genotypes for productivity and economics under graded levels of nitrogen in temperate Kashmir. Indian Journal of Agricultural Sciences 80 (5): 380-84.
Effect of Fertility Levels and Biofertilizers on Macro Nutrient Content and Uptake by Black Gram (Vigna Mungo L.)
Chetan Kumar Jangi1*, D.P. Singh and Jitendra Sharma 1Maharana Pratap University of Agriculture and Technology, Udaipur–313001, India
E-mail: *[email protected]
Keywords: Fertility, RDF, Biofertilizers, PSB, Rhizobium, Content, Uptake
INTRODUCTION
Black grams are widely considered as digestable protein content as well as an excellent source water soluble vitamins and minerals of dietary significance. There is evidence of stagnation or low productivity of black gram and other kharif pulses even with the application of recommended doses of NPK fertilizers (Athokpam et al., 2009). Due to low and unstable production and increasing population pressure, the per capitaavailability of pulses has come down from 69 g in 1961 to about 39.4 g in 2011 against the minimum requirement of 80 g capita-1. Currently, a real challenge for the workers in the field of agricultural research is to stop the use of expensive agrochemicals/chemical fertilizers. Adoption of integrated nutrient management involving Inorganic fertilizers and biofertilizers application improved the soil health. The objective of this paper is to investigate the effect of fertility levels and biofertilizers on macro nutrient content and uptake by black gram.
MATERIALS AND METHODS
The experiment was conducted at institutional farm, rajasthan college of agriculture, Udaipur. The experiment comprised four fertility levels of control, 50% RDF (10 kg N and 15 kg P2O5 ha-1), 75% RDF (15 kg N and 22.5 kg P2O5 ha-1) and 100 % RDF (20 kg N and 30 kg P2O5 ha-1) and four biofertiliizers levels (control, PSB, Rhizobium and Rhizobium + PSB) were applied to the black gram var.T-9. Macro nutrient (N,P and K) content in seed and straw were estimated by using standard methods such as colorimetric
It is I
LLEGAL t
o cop
y, pri
nt or
save
any c
onten
t of th
is PDF,
in pa
rt or in
full,
on an
y retr
ieval
syste
m,
withou
t the E
XPRESS WRITTEN PERMISSIO
N of th
e cop
yrigh
t-hold
er
National Conference on Climate Change and Agricultural Production: Adapting Crops to Climate Variability and Uncertainty, 6th–8th April, 2017
[286]
method, Vando-molybdo phosphoric acid yellow colour method and flame photometer, respectively. Uptake of macro nutrient (N, P, K) at harvest were computed from the data of N, P, K content and grain and straw yield using the following formulae:
푀푖푐푟표푛푢푡푟푖푒푛푡푢푝푡푎푘푒 =Nutrient content in plant material (%) × Yield
100
RESULTS AND DISCUSSION
The interaction effect of fertility levels and biofertilizers increased the growth of the plants and nitrogen, phosphorus, but potassium content was non significantly affected in black gram. But combination effect of fertility levels and biofertilizers increased nitrogen, phosphorus and potassium uptake in black gram. The combined inoculation of seed with Rhizobium + PSB was more beneficial in enhancing all the above parameters due to increased solubility of phosphorus and higher nitrogen fixation in nodules, leading to increased availability of nitrogen and phosphorus. The interaction effect of 100% RDF (F3) and rhizobium + PSB (B3) were significantly increased nitrogen uptake (64.52 kg ha-1), phosphorus uptake (6.48 kg ha-1) and potassium (20.47 kg ha-1) uptake by seed due to increase nutrient content in the soil.Highest significantly biological yield (3262.54 kg ha-1) was obtained under treatment combination F3B3. The result of the present investigation reveals the significance of fertility levels with the combination of biofertilizers levels in black gram crop for maximization of yield and profits.
REFERENCE [1] Athokpam H S, Singh N C, Singh K K, Singh N G and Singh N B 2009. Effect of nitrogen, phosphorus and potassium on growth, yield
and nutrient uptake by black gram (Vigna mungo L.). Environment and Ecology 27 (2): 682-684.
Performance of Rice under Various Establishment Methods and Different Cropping Systems in Indo-Gangetic Plains of Bihar
Prashant Kumar1, Sanjay Kumar1*, Mainak Ghosh1, Koushik Sar1, Vinod Kumar1, Prince Kumar1, SwarajKumar Dutta1, Mizanul Haque1, Vivek1 and Ranjeet Kumar2
1Department of Agronomy, 2Department of Soil Scienceand Agricultural Chemistry 1,2Bihar Agricultural University, Sabour–813210, Bhagalpur, India
E-mail: *[email protected]
Keywords: Zero tillage, Conservation agriculture, Transplanted rice, cropping system
INTRODUCTION
Rice (Oryza sativa L.) is one of the most important food grains produced and consumed all over the world, it is expected to raise from 439 Mt in 2010 to 496 Mt in 2020 and further increase to 553 Mt in 2035 (FAO, 2013). In Bihar, India, rice is cultivated in about 3.2 Mha during wet season with the average production and productivity of 6.04 Mt and 1.95 t ha-1respectively. The farmers are very much believed in manual transplantingand they did not bother to acquire any type of risk or pain and this leads tolabour shortage during the major period. Direct seeding or zero tillage of rice is alternative option, as the researchers suggestedits wide applicability in various rice growing countries of the world (Adair et al., 1992). The present study was conducted to evaluate the performance of different crop establishment techniques under different rice based cropping systems with an aim to comprehend the most stable and profitable system for adoption in alluvial belt of Indo-Gangetic Plains for higher yields.
It is I
LLEGAL t
o cop
y, pri
nt or
save
any c
onten
t of th
is PDF,
in pa
rt or in
full,
on an
y retr
ieval
syste
m,
withou
t the E
XPRESS WRITTEN PERMISSIO
N of th
e cop
yrigh
t-hold
er

National Conference on Climate Change and Agricultural Production: Adapting Crops to Climate Variability and Uncertainty, 6th–8th April, 2017
[287]
MATERIALS AND METHODS
Field experiment was conducted in the research farm of Bihar Agricultural University, Sabour, Bhagalpur, India, during the wet season (June-October) of 2015 for identifying suitable crop establishment methods for rice perfect cropping systems. The experiment includedthree establishment methods of rice in main plots, i.e. zero tillage, permanent bed and transplanted puddled rice and three cropping systems in sub-plot, i.e. rice-wheat, rice-maize and rice-lentil. Rice variety Shusk Samrat is a cross of NDR 1045-2/IET-17458 was used in the present investigation. The half dose of nitrogen and full quantity of P2O5 and K2O were applied in opened furrow just before sowing in zero tillage and permanent bed. However, it is just before the final land preparation in transplanted puddled rice. The remaining half dose of nitrogen was applied at the time of maximum tillering. The fertilizer application was applied in each plot as 100:60:40 N, P2O5 and K2O, respectively. The data was statistically analyzed with respect to establishment methods and cropping systems.
RESULTS AND DISCUSSION
The puddled transplanted methods recorded maximum grain yield (45.40 q/ha) which was significantly superior and 14.3% higher to permanent bed (39.71q/ha) but was at par with zero tillage (44.19 q/ha). The continuous better environment of puddled transplanted rice induced improvement in effective tillers m-2, grains per panicle/spike, and test-weight led to increase in grain yield of rice crops. These results are in accordance with the findings of Naresh et al. (2013) and Sidhu et al.(2014).The lower yield of rice under permanent bed might be due to higher spacing on the beds (2 rows planted on 67.5 cm bed) than that on zero tillage (20cm) (Singh and Kaur, 2012). Rice-lentil system also recorded significant higher yield (44.63 q/ha) as compared to rice-maize and rice-wheat cropping system. The interaction effect was found non-significant. Straw yield was followed the similar trend of grain yield. Among different rice establishment methods gross return under puddled transplanted methods (Rs. 80402/ha) was significantly higher than permanent bed (Rs. 71464/ha) but was at par with zero tillage (Rs. 78606/ha).This might be owing to higher grain and straw yields of puddled transplanted rice. However, among different cropping system, rice-lentil system recorded significantly higher net return (Rs. 52089/ha) as compare to rice-wheat (Rs. 49311/ha) and rice-maize (Rs. 47033/ha). The different trend was observed in benefit: cost ratio (B:C ratio) of the study and it was significantly higher under zero tillage than permanent bed and transplanted puddled method. This is due to the production cost, which was lower in the zero tillage and permanent bed compared to puddled transplanted rice. The puddle transplanted rice incurred 24.5% higher production cost as compared to zero tillage and permanent bed system and this is due to transplanting manually in puddle method.
REFERENCES [1] Adair C R, Beachell H M, Jodon N E, David C C and Jones J W 1992. Comparative yields of transplanted and direct sown rice. Journal
of American Society of Agronomy 34 (2): 129-137. [2] Naresh R K, Misra A K and Singh S P 2013.Assessment of Direct Seeded and Transplanting Methods of Rice Cultivars in the Western Part
of Uttar Pradesh. International Journal of Pharmaceutical Sciences and Business Management1(1): 1-8. [3] Naresh R K, SinghP, Arya S P, Kumar V, Kumar V and Kumar D 2013. Enhancing Resource Productivity and Carbon-Based
Sustainability Index of Cereal Based Cropping System under Conservation Agriculture in Western Uttar Pradesh. International Journal of Research in Biomedicine and Biotechnology 3(1): 30-36.
[4] Sidhu A S, Kooner R and Verma A 2014.On-farm assessment of direct-seeded rice production system under central Punjab conditions. Journal of Crop and Weed10(1):56- 60.
[5] Singh Avtar and Kaur Jagmohan 2012.Impact of conservation tillage on soil properties in rice-wheat cropping system. Agricultural Science Research Journal 2(1): 30 – 41.
It is I
LLEGAL t
o cop
y, pri
nt or
save
any c
onten
t of th
is PDF,
in pa
rt or in
full,
on an
y retr
ieval
syste
m,
withou
t the E
XPRESS WRITTEN PERMISSIO
N of th
e cop
yrigh
t-hold
er

National Conference on Climate Change and Agricultural Production: Adapting Crops to Climate Variability and Uncertainty, 6th–8th April, 2017
[288]
Effect of Different Seed Rate and Row Spacing on Growth, Yield and Yield Attributes of Aerobic Rice (Oryza sativa L.)
Ambuj Gautam, V.K. Verma*, Alok Pandey and V.K. Srivastava Department of Agronomy, Institute of Agricultural Sciences,
Banaras Hindu University, Varanasi–221005, India E-mail: *[email protected]
Keywords: Row spacing, Aerobic rice, Seed rate, Yield
INTRODUCTION
Rice (Oryza sativa L.) is one of the most important cereal food crop of the world providing major source of the food energy for more than half of the human population. Rice is grown in 114 countries across the world on an area about 150 million ha with annual production of over 525 million tonnes, constituting nearly 11 percent of the world’s cultivated land (Rai, 2006). More than 90 per cent of the world’s rice is produced and consumed in Asia where it is an integral part of culture and tradition. In India, it is cultivated in an area of 44.10 million ha with total annual production of 105.24 million tonnes (Ministry of Agriculture, Directorate of Economics and Statistics, 2013). It is accounts for about 42 per cent of total food grain production and 55 per cent of cereal production in the country. Thus, Aerobic rice is becoming popular among farmers on account of its lower cost and less labour requirement. Keeping these facts in view, to evaluate the effect of different seed rate and row spacing on growth, yield and yield attributes of aerobic rice.
MATERIALS AND METHODS
A field experiment was conducted during Kharif season in 2012 at Institute of Agricultural Sciences, Banaras Hindu University, Varanasi (U.P.). It is located at 25.2o N latitude and 83.0o E longitude and at an altitude of 76.1 meters above mean sea level. Experiment was laid out in split plot design with three replications. The main plot treatments comprised with 4 seed rates (S1: 25, S2: 30, S3: 35 and S4: 40 kg ha-1) and sub-plot treatments comprised with three row spacing (20, 25 and 30 cm). A uniform dose of 120 kg N ha-1, 60 kg P2O5 ha-1 and 60 kg K2O ha-1 were applied in all the plots in the form of Urea, DAP, MOP, respectively and due to the deficiency of Zn, application of 25 kg ha-1 of ZnSO4.7H2O was done at the time of sowing.
RESULTS AND DISCUSSION
The perusal of data showed that the different seed rates and row spacing treatments brought about marked variation on growth, yield and yield attributes (Table 1). The maximum growth and yield was in S3 (35 kg ha-1) as compared to rest of the treatments. An increasing trend of the yield and yield attributes was viewed with the increased seed rate of the crop. As far as the different row spacing was concerned, an increasing trends were examined in case of yield and yield attributes with the decreasing row spacing. These yield attributes might be influenced by increasing seed rate and decreasing row spacing. These results were fully confirm the findings of Mahajan et al. (2010) and Chauhan (2013). It is concluded that the highest yield and yield attributes were recorded with 35 kg ha-1 seed rates along with 20 cm of row spacing as compared to rest of the treatments.
It is I
LLEGAL t
o cop
y, pri
nt or
save
any c
onten
t of th
is PDF,
in pa
rt or in
full,
on an
y retr
ieval
syste
m,
withou
t the E
XPRESS WRITTEN PERMISSIO
N of th
e cop
yrigh
t-hold
er

National Conference on Climate Change and Agricultural Production: Adapting Crops to Climate Variability and Uncertainty, 6th–8th April, 2017
[289]
Table 1: Effect of Various Seed Rates and Row Spacing on Yield and Yield Attributes of Rice (A) Main Plot Treatments: Seed Rates (kg ha-1)
Plant Height (cm)
Number of Tillers m-2
Dry Matter (g Running
Meter)
Panicle Length (cm)
Panicle Weight (g)
Grain Yield
(t ha-1)
Straw Yield
(t ha-1)
Harvest Index (%)
S1: 25 95.43 402.33 195.56 24.56 2.22 4.10 5.70 43.80 S2: 30 97.49 435.11 218.22 25.03 2.49 4.73 5.80 44.54 S3: 35 99.28 476.44 253.44 26.61 2.55 5.13 6.15 44.68 S4: 40 96.22 421.78 208.33 24.84 2.31 4.70 5.72 44.40 CD P=0.05) 1.99 43.66 31.63 NS NS 0.18 0.23 NS (B) Row Spacing (cm) L1: 20 99.83 483.83 242.50 26.13 2.61 4.97 6.14 44.79 L2: 25 97.84 429.33 217.50 24.95 2.31 4.74 5.87 44.25 L3: 30 93.64 388.58 196.67 24.71 2.26 4.29 5.53 44.03 CD P=0.05) 1.65 37.77 27.10 NS NS 0.18 0.23 NS
REFERENCES [1] Chauhan B.S. 2013. Effect of tillage systems, seeding rates, and herbicides on weed growth and grain yield in dry-seeded rice systems in
the Philippines Crop Protection 54: 244-250. [2] Mahajan G., Gill M.S. and Singh K. 2010. Optimizing seed rate to suppress weeds and to increase yield in aerobic direct-seeded rice in
northwestern Indo-Gangetic plains. Journal of New Seeds. 11: 225-238.
Assessment of Performance of Balanced Fertilization and Integrated Use of Vermicompost on Yield of Okra (Abelmoschus esculentus L.)
var. Kashi Kranti
K.P. Singh1*, C.N. Choudhary2, Rakesh Kumar3, Ratan Kumar4 and R.K. Sohane5 1,2,3Krishi Vigyan Kendra, Lodipur Farm, Arwal (Bihar)–804428
4Krishi Vigyan Kendra, Rohtas, Bihar 5Director Extension Education B.A.U., Sabour, Bhagalpur
Bihar Agricultural University, Sabour, Bhagalpur E-mail: *[email protected]
Keywords: Abelmoschus Esculentus, Kashi Kranti, Chemical Fertilizers, Vermicompost.
INTRODUCTION
Okra is a common annual vegetable belonging to the family Malvaceae which is grown as a garden or home yard crop throughout the tropical and sub-tropical part of the world. India is the largest producer of Okra followed by Nigeria and Pakistan. Bihar, West Bangal, Odisa, Maharashtra and Gujrat are major Okra growing states in India. Bhindi shares about 5.3% of total vegetable production in India and its productivity is about 13 tons/ha. It is more remunerative than other leafy vegetables. Okra may be cultivated upto an altitude of 400 feets and grows best under temperature ranges of 25°C to 35°C. It is very rich source of vitamins, proteins and minerals. Bhindi is also a good source of iodine as reported by Naskhede et al. (2011). Root and stem of Lady’s finger is used in cleaning sugar and in paper mills.
MATERIAL AND METHODS
A field experiment was conducted during the summer season of 2015-16 at the fields of adopted farmers of Krishi Vigyan Kendra, Lodipur Farm, Arwal, under Bihar Agricultural University, Sabour, Bhagalpur for
It is I
LLEGAL t
o cop
y, pri
nt or
save
any c
onten
t of th
is PDF,
in pa
rt or in
full,
on an
y retr
ieval
syste
m,
withou
t the E
XPRESS WRITTEN PERMISSIO
N of th
e cop
yrigh
t-hold
er

National Conference on Climate Change and Agricultural Production: Adapting Crops to Climate Variability and Uncertainty, 6th–8th April, 2017
[290]
assessing the performance of balanced fertilization and integrated use of vermicompost in different combination on yield of Okra var. Kashi Kranti. The experiment was laid out in Randomized Block Design involving 10 replications having net plot size of 4.5m x 3m. Each plot divided with 4 different combinations of chemical fertilizers and vermicompost as follows: T1 – Farmers Practice (use of only urea 150kg/ha), T2 – 100% of recommended dose of fertilizers (120:60:40kg/ha), T3 – 50% of recommended dose of fertilizers (60:30:20kg/ha) + 50% of vermicompost (12.5q/ha) and T4 – 100% of vermicompost (25q/ha). The number of experimental plots was 40 having spacing of 45cm x 30cm. Before sowing of the crop, initial soil sample was collected and analysed in soil and water laboratory at ARI, Patna (Bihar) to know the physico-chemical properties of soil. After analysis it was found that soil was slightly acidic in nature and its physico-chemical properties is presented in Table A. Inorganic fertilizers were applied in each plot on the recommended dose of NPK @ 120:60:40kg/ha, through urea, ssp and mop (Firoz, 2009) and 2.5 ton/ha vermicompost (CRIDA 2009, Hyderabad, India) throughout the crop duration. Seed was soaked for 24 hours in plain water and thereafter it was treated with Imidachlorprid 70ws@15kg/ha before sowing. Plant height and number of branches per plant were counted at 90 DAS. Number of fruits per plant, fruit length, fruit diameter, days to 50% flower initiation and yield/plant were recorded regularly. Fruits of randomly selected treatment wise 5 plants, for every replication was harvested to calculate yield (q/ha). A comparative data was prepared for each combination of treatments. The collected data were analyzed statistically with ANOVA one way difference test at 0.05 probability levels, to find the significant difference in the parameters studied between various treatments.
RESULTS AND CONCLUSION/ DISCUSSION
Vermicompost applied at very low rate (2.5ton/ha) can significantly increase yield of highly valuable vegetable and fruit crops. Vermicompost enhanced the quality of soil by enhancing microbial biomas which are key component in nutrients recycling production of PGR and protecting plants from soil borne disease (Pascual et al., 1997). Combination of vermicompost and inorganic chemical fertilizer resulted in the maximum number of flowers and fruits per plant of Okra plant. Hence, the combined application of appropriate dose of vermicompost and chemical fertilizers in the field acts as growth promoter resulting in higher yield of Okra. Proper combination of inorganics and organics least damage the soil health and helps to sustain its fertility for a longer period.
Table 1: Effect of Balanced Fertilizers and Vermicompost on the Yield of Okra Treatments Plant
Height (cm)
50% Flower Initiation
(DAS)
Number of Branches
/Plant
Number of Fruits/
Plant
Fruit Length (cm)
Fruit Diameter
(cm)
Fruit Weight
(g)
Fruit Yield/
Plant (g)
Yield (q/ha)
T1 – Farmers practice (use of only urea 120kg/ha)
91.54 43.00 2.89 14.12 9.15 4.22 21.10 116.64 82.41
T2 – 100% recommended dose of fertilizers (120:60:40kg/ha)
108.12 45.00 3.20 20.65 13.20 4.89 24.20 135.42 120.82
T3 – 50% recommended dose of fertilizers + 50% of vermicompost (12.5q/ha)
116.10 40.00 4.50 22.24 16.20 5.24 25.30 151.44 132.24
T4 - 100% of vermicompost (25q/ha)
94.14 48.00 2.95 16.40 12.30 4.49 22.40 120.48 96.10
CD (0.05) 4.9269 3.0666 0.2124 0.9580 0.9054 0.3228 0.9650 8.6354 6.1012 CV (%) 5.72 7.30 4.98 6.15 6.65 5.16 6.25 7.36 7.14 Diff. mean 2.4012 1.5075 0.1289 0.4727 0.4420 0.1401 0.4825 4.2136 2.9662 SE/plot 5.3632 3.3812 0.2912 1.0335 0.9942 0.3124 1.0435 9.4036 6.6089
It is I
LLEGAL t
o cop
y, pri
nt or
save
any c
onten
t of th
is PDF,
in pa
rt or in
full,
on an
y retr
ieval
syste
m,
withou
t the E
XPRESS WRITTEN PERMISSIO
N of th
e cop
yrigh
t-hold
er

National Conference on Climate Change and Agricultural Production: Adapting Crops to Climate Variability and Uncertainty, 6th–8th April, 2017
[291]
Table 2: Economic indicator of Okra Treatments Cost of Cultivation
(Rs./ha) Gross Income
(Rs./ha) Net Income
(Rs./ha) B:C Ratio
T1 – Farmers practice (use of only urea 120kg/ha) 52530.00 103012.50 50482.50 1.96 T2 – 100% recommended dose of fertilizers (120:60:40kg/ha)
53620.00 151025.00 97405.00 2.71
T3 – 50% recommended dose of fertilizers + 50% of vermicompost (12.5q/ha)
54225.00 165300.00 111075.00 3.09
T4 - 100% of vermicompost (25q/ha) 56000.00 120125.00 64125.00 2.15
REFERENCE [1] Ansari, A.A. and Sukhraj, K. (2010).Effect of vermi wash and vermicompost on soil parameter and productivity of Okra in GUYANA.
African J. Agric. Res., 5(4): 1994-1998. [2] Hooda, R.S., Pandita, M.L. and Sindhu, A.S. (1980). Studies on the effect of nitrogen and phosphorus on the growth and green pod yield
of Okra (Abelmoschus esculantus L.). Hariyana J. Hort. Sci., 9: 180-183.
Effect of Microbes and Fertilizers on Growth and Yield of Cabbage (Brassica oleracea L. var. capitata)
Kamal Kant*, Devi Singh and V.M. Prasad Department of Horticulture, Allahabad School of Agriculture,
Sam Higginbottoms Institute of Agriculture, Technology and Sciences, Allahabad–211 007, India E-mail: *[email protected]
Keywords: Microbes, NPK, Cabbage, Azotobacterand, Azospirillum.
INTRODUCTION
Cabbage (Brassica oleraceaL.var. capitata), is one of the most cruciferous vegetable widely grown all over India and abroad. However, the national productivity of cabbage is far below the global average productivity and farmers injudiciously use large quantities of chemical fertilizers for enhancing productivity that hampers the soil health and generates pollution. Mineral nutrition does play an important role in influencing the quality of crops but it is a fact that the soil health deteriorates (Savci, 2012). The integrated nutrient management paves the way to overcome these problems, which involves conjunctive use of fertilizers and organic manures to sustain crop production as well as maintenance of soil health. To maintain long term soil health and productivity there is a need for integrated nutrient management through manures and microbes apart from costly fertilizers for better yield of the crop. Therefore, this study was carried out to investigate the effect of different levels of fertilizers and microbes on growth and yield of cabbage.
MATERIALS AND METHODS
The present investigation was conducted in the winter season at Allahabad,, India. A common hybrid, Indam-216 was planted in RBD (factorial) design, replicated thriceat a spacing of 45 x 45cm.The treatments comprised of four microbes (M0-0, M1-Azotobacter, M2-Azospirillum, M3-VAM and M4-PSB) and five different levels fertilizers (F1-80:40:40, F2-120:60:60, F3- 160:80:80, F4- 200:100:100 and F5- 240:120:120 NPK kg/ha) in different combinations. Microbes were used as seedlings inoculation and soil application. Recommended practices for fertilizer application and for raising healthy crop were followed. Observations were recorded for different growth and yield attributing traits that were subjected to analysis of variance and comparison of treatment was made with the help of critical differences.
It is I
LLEGAL t
o cop
y, pri
nt or
save
any c
onten
t of th
is PDF,
in pa
rt or in
full,
on an
y retr
ieval
syste
m,
withou
t the E
XPRESS WRITTEN PERMISSIO
N of th
e cop
yrigh
t-hold
er

National Conference on Climate Change and Agricultural Production: Adapting Crops to Climate Variability and Uncertainty, 6th–8th April, 2017
[292]
RESULTS AND DISCUSSION
The maximum plant height (28.14cm), number of outer leaves (22.44) and plant spread (49.80cm) were obtained with, M2-Azospirillum and were significantly superior to other microbes. The maximum growth of plant in terms of height (28.61cm), number of outer leaves/plant (23.67) and plant spread (51.16cm) was at fertility level F4 (200:100:100 NPK kg/ha). Plant height and plant spread were influenced significantly due to interaction effect of fertilizers a microbes, being maximum at with M2F4. The various levels of microbes showed non-significant effect on head formation and head maturity after transplanting. The plants grown under the higher level of fertilizers F5 (240:120:120 NPK kg/ha) were earliest with respect to the days taken for initiation of head formation (52.20) and for head maturity (82.73) after transplanting. There was a significant variation among microbes in respect of diameter, number of inner leaves/plant, weight of head and head yield. The plants developed under application of microbes M2- Azospirillum produced heads with maximum diameter (22.43cm), number of inner leaves/plant (44.52) and maximum weight of head (1.75kg) and yield of head (787.47q/ha). The maximum head weight was recorded with the use of microbes Azospirillum which was significantly superior to Azotobacter. The maximum diameter (23.11cm), number of inner leaves/plant (44.48), weight of head (1.79kg) and yield (828.47q/ha) were obtained at fertility level of F4 (200:100:100 NPK kg/ha).All yield contributing characters such as diameter, depth and weight of head were favorably influenced by combined action of NPK and microbes Azospirillum which ultimately increased the head yield. The possible reason for this could be some growth promoting substances secreted by the microbes, leading to better root development, better transportation of water and more uptake and deposition of nutrients. From the study it was found that application of microbes basically Azospirillum as seedling treatment as well as application of NPK @ 200:100:100 kg/ha was the most effective treatment combination for higher growth and yield in cabbage cultivation. Hence, the use and management of natural resources in sustainable agriculture, the microbial fertilizers hold vast potential for future.
REFERENCES [1] Savci S 2012. An agricultural pollution: chemical fertilizer. International Journal of Environmental Science and Development 3(1):77-80.
Implication of Nitrogen and Phosphorus on Nutrient Content and Uptake in Grain and Fodder of Popcorn (Cv. Zea mays variety everta)
Shalini Kumari* and Solanki Dharmik Ratilal Department of Soil Science and Agricultural Chemistry,
Junagadh Agricultural University, Junagadh–362001, India E-mail: *[email protected]
Keywords: Zea mays, Popcorn, Nutrient Content, Uptake
INTRODUCTION
Popcorn (Zea mays var everta) is a popular and nutritious snack food. Majority of the world’s popcorn production is in the United States. Corn being an exhaustive crop, its requirement for fertilizers especially for nitrogen is prominent. Nitrogen is essential constituent of chlorophyll, protoplasm and enzymes. Popcorn yield increased with increasing levels of nitrogen application. Besides nitrogen, phosphorus is the second most important plant nutrient which influences vigor of plant, root growth and also improves the quality and yield of popcorn. The objective of this research to study the effect of nitrogen and phosphorus on nutrient content and uptake in grain and fodder of popcorn under medium black calcareous soils of Saurashtra region in Junagadh & eventually for the benefit to farmers.
It is I
LLEGAL t
o cop
y, pri
nt or
save
any c
onten
t of th
is PDF,
in pa
rt or in
full,
on an
y retr
ieval
syste
m,
withou
t the E
XPRESS WRITTEN PERMISSIO
N of th
e cop
yrigh
t-hold
er

National Conference on Climate Change and Agricultural Production: Adapting Crops to Climate Variability and Uncertainty, 6th–8th April, 2017
[293]
MATERIALS AND METHODS
A field experiment was conducted during rabi season of 2013-14 at Junagadh Agricultural University, Junagadh. The soil was clayey texture and slightly alkaline in reaction with pH 8.0 and EC 0.27 dS m-1.The crop was fertilized with nitrogen and phosphorus as per treatment allotted to each plot. The experiment comprised of total sixteen treatment combinations in which each of four levels of nitrogen (0, 90, 120 and 150 kg ha-1) and phosphorus (0, 45, 60 and 75 kg ha-1) were laid out in factorial randomized block design with three replications.
RESULTS AND DISCUSSION
The content and uptake of nitrogen and phosphorus in grain and fodder increased with increasing levels of nitrogen application at 30, 60 DAS and at harvest. Application of nitrogen @ 150 kg N ha-1 and phosphorus application @ 75 kg P2O5 ha-1 (P3) gave significantly higher value of N and P content in grain and fodder which were at par with N2 (120 kg N ha-1) and P2 (60 kg P2O5 ha-1). Whereas the content and uptake of P, K, S did not influenced significantly by nitrogen application and the content and uptake of N, K, S did not influenced significantly by phosphorus application. The significantly higher total nutrient uptake of N, P, K and S by popcorn crop was in N3 (150 kg N ha-1) and P3 (75 kg P2O5 ha-1) at 30 DAS, 60 DAS and at harvest. This increase content and uptake of N in grain and fodder might be due to favorable and synergistic effect on availability of nutrient. The improvement in content in grain and fodder may be ascribed to greater availability of nutrients in soil and their increased absorption by roots, their transportation towards foliage and later on translocation in the grain and fodder by various metabolic activities and more availability in soil nutrients by fixing atmospheric nitrogen through nodulation and dissolution of fixed and unavailable phosphorus in the soil. The uptake is arithmetic output of content and dry matter yield. Thus, significant improvement in uptake of N, P, K and S might be attributed to their concentration in grain and fodder and associated with higher grain and fodder yield. The results of present investigation are in close agreement with the findings of (Verma and Singh 2014) in popcorn. Whereas the Interaction effect of nitrogen and phosphorus was non-significant in respect of content and uptake of grain, fodder and total nutrients of popcorn. The present study indicate significantly the higher content, uptake of grain and fodder and total nutrients were obtained by nitrogen application @ 150 kg N ha-1 (N3) and phosphorus application @75 kg P2O5 ha-1 (P3) in medium black calcareous soils of Saurashtra region of Gujarat.
REFERENCE [1] Verma and Singh 2014. Effect of nitrogen and potassium levels on growth and yield of popcorn (Zea maysevrta) cv. VL Amber, The
Allahabad farmer, LXX, (1): 294-300, Department of Agronomy, SHIATS, Allahabad.
Influence of Photoselective Shed Net on Quality Production of Litchi Fruits
S.K. Purbey*, Amrendra Kumar, S.D. Pandey and Alemwati Pongener ICAR-National Research Centre on Litchi, Mushari, Muzaffarpur–842002, India
E-mail: *[email protected]
Keywords: Fruit, Litchi, Shed net, Weather
INTRODUCTION
In India and particularly in Bihar, the major litchi growing state, fruit development stage coincides with high temperatures (38-440C) and low humidity (15-25%RH) which leads to heavy fruit drop, fruit cracking, sun burn and finally the overall fruit quality. Shed net can provide physical protection (birds, hail, insects,
It is I
LLEGAL t
o cop
y, pri
nt or
save
any c
onten
t of th
is PDF,
in pa
rt or in
full,
on an
y retr
ieval
syste
m,
withou
t the E
XPRESS WRITTEN PERMISSIO
N of th
e cop
yrigh
t-hold
er

National Conference on Climate Change and Agricultural Production: Adapting Crops to Climate Variability and Uncertainty, 6th–8th April, 2017
[294]
excessive radiation), affect environmental modification (humidity, shade, temperature), and increase the relative proportion of diffuse (scattered) light as well as absorb various spectral bands, thereby affecting light quality. These effects can influence crops as well as the organisms associated with them. The present studies were undertaken to study the effect of shed nets and other treatments on quality of litchi fruits and identify factors for advance or delay the harvesting time for extending the marketing season in litchi
MATERIALS AND METHODS
Anexperiment was conducted to evaluate the effect of various shade nets on fruit retention, maturity and fruit quality of litchi, cv. Shahi National Research Centre on Litchi in Mushari, Muzaffarpur, during 2010 to 2013. The litchi trees were covered 20 to 25 days after fruit set with shade net of two colour (white and green) and two shading percentages (30 and 50 %) and uncovered control comprising of 9 treatment combinations in total. The observations were taken for fruit weight, size, colour, TSS, Acidity, Sun burn percentage, cracking percentage, borer infestation percentage, anthocyanin content and date od harvesting.
RESULTS AND DISCUSSION
The present study indicate that irrespective of colour and percent shading, shade net had a significant effects on fruit weight, percentage of Class I fruits, less discarded fruits and extending the harvesting period in comparison to control (uncovered). During the study there were different weather conditions (moderate, harsh and cloudy) during the entire experimental period between: 2010-2013. During 2010-11 (adverse climatic condition during fruit development stage) shade net has extended the harvesting period by almost 7-12 days with 50 % more fruit retention and less sun burn and cracking. During moderate climatic condition at fruit development stage (2012-13) shade net extended the harvesting period by almost 14-17 with slight decrease in total soluble solids and acidity. With the shed net s there were about 35% more Class I fruits and 7-9% discarded fruits as compare to 32 % under control. During 2011-12, due to periodic cloudy weather, shade nets had less effect on extending the harvesting period, however, the discarded fruit percentage was only 5 to 10% and fruit retention increased by 28 % compared to control. These results indicate that shading of 30% green or 50% white can be commercially utilized to improve fruit quality and overall appearance, as well as extend the harvesting period in litchi, cv. Shahi.
REFERENCES [1] Cerny TA, Faust J.E., Layne DR and Rajapakse NC 2003. Influence of photoselective films and growing season on stem growth and
flowering of six plant species. Journal of American Society of Horticuture Science128:486-491. [2] Shahak Y, Gussakovsky EE, Cohen Y, Lurie S, Stern R, Kfir S, Naor A, Atzmon I, Doron I and Greenblat-Avron Y2004. Color Nets: A
new approach for light manipulation in fruit trees. Acta Horticuture 636:609–616. [3] Stamps RH2008. Differential effects of colored shade nets on three cut foliage crop Acta Horticuture 70:169–176.
Nutrient Dynamics during Fruit Growth of Various Mango Cultivars
Rajni Sinha*, Md. Feza Ahmad and U.S. Jaiswal Bihar Agricultural University, Sabour–813210, Bhagalpur, India
E-mail: *[email protected]
Keywords: Mango, Nutrients, Nutrient management, Growth stage, Nutrient removal
INTRODUCTION
Global climate changes and periodical climatic variability trigger pressure on agricultural system and likely to cause obstacle in attainment of future production targets. Information about the nutritional status of a plant is
It is I
LLEGAL t
o cop
y, pri
nt or
save
any c
onten
t of th
is PDF,
in pa
rt or in
full,
on an
y retr
ieval
syste
m,
withou
t the E
XPRESS WRITTEN PERMISSIO
N of th
e cop
yrigh
t-hold
er
National Conference on Climate Change and Agricultural Production: Adapting Crops to Climate Variability and Uncertainty, 6th–8th April, 2017
[295]
a basic prerequisite for its adequate nutrition and crucial to achieve high yield productivity. So, by assessing the annual amount of nutrient that tree needs to absorb in order to successfully complete a vegetative and reproductive growth, chart for rational fertilization in orchards can be developed(Basar.,2006). Therefore, there is an urgent need to adopt this précised technique of nutrient management for efficient production. In the present context, the interpretation of nutrient dynamics in fruit at various fruit growth may provide an efficient idea for sustainable production.
MATERIALS AND METHODS
For estimating nutrient accumulation in fruits, fruit sample had been collected at various fruit growth stages of mango just as marble, prestone formation,stone hardening & harvest stageof cultivars Dashehari, Langra, Mahmood Bahar, Menka, Sabri, Langra, Zardalu. For conducting this experiment fruit were collected at different stages and brought to laboratory for estimation of primary nutrients (N,P,K) and secondary nutrients (Ca, Mg). The fruit sample were thoroughly washed first with tap water, then dipped in 0.1 N HCl and finally washed in double distilled water. After washing, the samples were dried in air firstly then cut into small pieces and again dried at 68oC under oven till constant weight is obtained. The dried sample were grinded and then kept in butter paper bags for chemical analysis. Available nitrogen were estimated by Kjeldhal method. For determining K, P, Ca and Mg, 0.5 g powdered sample of mango fruit were taken in 100 ml flask and digested in di-acid mixture of nitric acid and perchloric acid in the ratio of 9:4. The phosphorus content were determined by using ammonium molybdate: ammonium metavanedete (Champman and Pratt, 1961) and colour intensity measured at 440 nm in a spectrophotometer. Potassium and calcium were determined with flame photometry technique using corning flame photometer, U.K. (Jackson, 1967). The magnesium was estimated by using AAS. The experiment were designed in factorial randomized block with each treatment comprised of a single plant and was replicated two times. The test of significance was made with 5 per cent level of significance.
RESULTS AND DISCUSSION
The nutrient content particularly N,K and Mg were highest at marble stage while as P was accumulated maximum in pre stone formation stage. There were no conspicuous trend of nutrient accumulation among mango cultivars and least variation in Ca content at different stages. Nutrient status at maturity were used to estimate fruit nutrient removal on the basis of an estimated average fruit yield. It were demonstrated that each varieties removed each macronutrient from the orchard soil differently due to its inherent uptake and translocation capacity. Nitrogen were removed in the largest quantity followed by potassium and phosphorus while calcium and magnesium were removed in small quantity. Thus, the order of nutrient extraction: N > K > P > Mg > Ca. It clearly indicates that each stage is specific response for nutrient uptake so, fertilization should be applied at right time and in appropriate amount so that it could enhance yield, nutrient use efficiency (NUE) and also reduce wastage of fertilizer and residual toxicity.
REFERENCES [1] Basar H 2006. Elemental composition of various speech cultivars. Scientia Horticulturae. 107: 259-263. [2] Chapman H D and Pratt P F1961.Method of analysis for soil, plant and water. Division of Agricultural Science. University of California,
Berkley, USA, 61. [3] Jackson M L 1967. Soil chemical analysis, Asia Publishing House, Bombay.
It is I
LLEGAL t
o cop
y, pri
nt or
save
any c
onten
t of th
is PDF,
in pa
rt or in
full,
on an
y retr
ieval
syste
m,
withou
t the E
XPRESS WRITTEN PERMISSIO
N of th
e cop
yrigh
t-hold
er

National Conference on Climate Change and Agricultural Production: Adapting Crops to Climate Variability and Uncertainty, 6th–8th April, 2017
[296]
Influence of Date of Sowing on Yield Attributes and Yield of Linseed (Linum usitatissimum L.) Varieties under Dryland Condition
in Eastern Uttar Pradesh
Avinash Chandra Maurya1, Raghuveer M.1*, Gargi Goswami1 and Santosh Kumar2 1Department of Agronomy, Institute of Agricultural Sciences,
Banaras Hindu University, Varanasi–221005, India 2Regional Research Station, Agwanpur, Saharasa–852201, India
E-mail: *[email protected]
Keywords: Date of sowing, Linseed varieties, Dry land cultivation, Yield attributes
INTRODUCTION
India ranks first in terms of area under linseed cultivation and third in production in world. In India, linseed cultivated about 4.68 lakh ha and total linseed production is 1.63 lakh tones (Anonymous, 2012). Among the different oilseeds crops grown in country, linseed is considered the most important industrial oilseed crop of India. It is grown either for oil extracted from seed or for fiber from stem. Seed contain oil ranging from 37 to 43%. Every part of linseed plant is utilized commercially either directly or after processing most of oil is used in the industry for manufacture of paints, varnishes, inks, soap and very small fraction of it is used for edible purpose. In many regions farmers fail to undertake timely sowing which results to shorter growth period available to late sown linseed coupled with high temperature and hot winds during reproductive growth period, which leads to forced maturity and ultimately poor grain yield. The sowing date was a very important management tool in minimizing the negative impact of high temperature and moisture stress during the critical flowering and seed filling periods (Chauhan et al., 2008).The main objective of this study was to assess the influence of date of sowing and varieties on yield attributes and yield of linseed.
MATERIALS AND METHODS
The present investigation was carried out during Rabi season of 2011-2012 at Banaras Hindu University, Varanasi. The experiment comprised of nine treatment combinations was planned in a split plot design replicated thrice. Dates of sowing were kept in main plot and varieties in sub-plot. It is evident from soil analysis that soil of the experimental field was sandy clay loam category with moderate fertility status having low available nitrogen, medium available phosphorus, and potassium.
RESULTS AND DISCUSSION
There was significant effect of dates of sowing on number of capsule plant-1. The maximum number of capsule plant-1 was in crop sown on 4 November (38.68) which was significantly superior over both November 11 and 18 sown crop. The number of seed capsule-1 exhibited increase trend with delayed sowing. The maximum number of seed capsule-1 was in 18 November sowing (9.27) which was significantly higher than both the crops sown on 11 (8.90) and 4 (8.50) November. The test weight significantly decreased with delay in sowing. It was maximum in the crop sown on 4 November (9.30 g) which was significantly higher than 11 November (8.42 g) and 18 November sowing (7.87 g), respectively. Varieties did significant effect for number of capsule plant-1 however, highest number of capsule plant-1 was recorded in Shekhar (38.58) followed by Neelam (36.19) and T 397 (31.25). The difference in number of seed capsule-1 among varieties was significant. The highest number of seed capsule-1 was in Shekhar (9.75) followed by Neelam
It is I
LLEGAL t
o cop
y, pri
nt or
save
any c
onten
t of th
is PDF,
in pa
rt or in
full,
on an
y retr
ieval
syste
m,
withou
t the E
XPRESS WRITTEN PERMISSIO
N of th
e cop
yrigh
t-hold
er

National Conference on Climate Change and Agricultural Production: Adapting Crops to Climate Variability and Uncertainty, 6th–8th April, 2017
[297]
(8.79) and T 397 (8.13) The significantly higher test weight was in Shekhar (9.10 g) over T 397 (8.03 g) and was at par with Neelam (8.46 g). On the basis of the results of present investigation the following conclusion may be drawn that sowing of linseed crop on 4 November (first week of November) gave highest yield attributes and yield for the variety Shekhar.
Table 1: Effect of Dates of Sowing on Yield Attributes of Linseed Varieties Treatment Number of Capsule Plant-1 Number of Grain Capsule-1 1000 Grain Weight (g)
Date of Sowing 04-November 38.68 8.50 9.30 11-November 35.67 8.90 8.42 18-November 31.68 9.27 7.87 CD (P=0.05) 0.27 0.12 0.11 Varieties Shekhar 38.58 9.75 9.10 Neelam 36.19 8.79 8.46 T – 397 31.25 8.13 8.03 CD (P=0.05) 0.34 0.08 0.04
REFERENCES [1] Anonymous 2012.Economic survey of India, Economic Division, Ministry of Finance, GOI. [2] Chauhan D V S, Lodhi M D and Verma N K 2008. Effect of sowing dates, varieties and number of irrigations on yield attributes, yield and
quality of linseed under Bundelkhand condition of Uttar Pradesh. Agricultural Science Digest 28(4): 271-273.
Influence of Different Establishment Techniques in Rice based Cropping Systems on Productivity, Economics and Soil Health
Sanjay Kumar1*, S.K. Dutta1, Ravi Gopal Singh2, G.S. Panwar1, Rakesh Kumar3, Sunil Kumar3, K. Beura3, Sunil Kumar1, B. Kumar1, S. Suman1 and Prashant Kumar1
1Department of Agronomy, 3Department of Soil Science and Agricultural Chemistry, 1,2Bihar Agricultural University, Sabour–813 210, India
2Cropping Systems Agronomist, International Maize and Wheat Improvement Center (CIMMYT), Apdo.Postal 6-641, 06600 Mexico, D.F., Mexico.
E-mail: *[email protected]
Keywords: Zero tillage, permanent bed, conventional system and rice-based cropping system
INTRODUCTION
Change in the method of crop establishment from conventional to direct seeding of rice-based cropping systems has occurred in many rice growing areas of India in response to increasing production cost, especially for labour and water. Crop establishment includes repeated ploughing, cultivating, planking and pulverising the top soil which delay in planting, escalate costs, reduce profit, more water demand and deteriorating soil health (Jat et al., 2008). The ever growing human population in India and Bihar has been fuelling the need for enhanced agricultural productivity and improved resource use efficiency. Rice-wheat, rice-maize and rice-lentil are the major cropping system prevailing in this area. The rice-wheat system alone occupies 13.5 million ha of productive land in the Indo-Gangetic plains (Saharawat et al., 2010); moreover, the area under rice-maize and rice-lentil is also expanding rapidly, especially in eastern IGP. The present study was conducted to evaluate the performance of different crop establishment techniques in rice-based cropping systems with the aim of identifying the most stable and profitable system for adoption in this agro-ecological zone.
It is I
LLEGAL t
o cop
y, pri
nt or
save
any c
onten
t of th
is PDF,
in pa
rt or in
full,
on an
y retr
ieval
syste
m,
withou
t the E
XPRESS WRITTEN PERMISSIO
N of th
e cop
yrigh
t-hold
er

National Conference on Climate Change and Agricultural Production: Adapting Crops to Climate Variability and Uncertainty, 6th–8th April, 2017
[298]
MATERIALS AND METHODS
A field experiment was conducted from 2011-2015 at the Bihar Agricultural College farm, Sabour, Bihar (25° 23’ N and 87° 07' E; altitude: 37.19 m above mean sea level) under subtropical climatic conditions characterized by a hot, desiccating summer, cold winter, and moderate rainfall. The soil type is sandy loam having pH 7.35, organic carbon 0.53%, available nitrogen (N) 160.2 kg ha-1, phosphorus (P2O5) 26.7 kg ha-1
and potassium (K2O) 221.6 kg ha-1. The experiment was laid out in a split plot design which included three main plots using different crop establishment techniques, viz. zero tillage (ZT), permanent bed (PB), and conventional tillage (CONT), and subplot treatments comprised of three cropping systems, viz. rice-wheat, rice-maize, and rice-lentil, which were evaluated for their production potential and economics. Rice cv ‘Susk Samrat’, was grown during the kharif season, while maize cv ‘DHM-117’, wheat cv ‘HD-2888’ and lentil cv ‘HUL-57’ were sown during the winter season. The recommended fertilizer doses (per ha) of 80 kg N, 40 kg P2O5, and 20 kg K2O in rice, 120 kg N, 60 kg P2O5, and 40 kg K2O in wheat, 120 kg N, 75 kg P2O5, and 50 kg K2O in maize, and 20 kg N and 50 kg P2O5 in lentil were applied in all the treatments. In ZT and PB plots, prior to the seeding of crops, weeds were killed by a pre-plant application of glyphosate at the rate of 1 kg a.i ha-1. The plots were kept weed-free throughout the growing season by the use of pre-emergence or post-emergence herbicides. The data was statistically analyzed with respect to establishment methods and cropping systems.
RESULTS AND DISCUSSION
The highest rice equivalent yield (REY) during the kharif season among different crop establishment techniques was obtained in CONT (43.13 q/ha), which was statistically similar to ZT (42.69 q/ha) and significantly superior to PB (38.59 q/ha). The highest REY during rabi season was also recorded in ZT (46.99 q/ha) but it was at par with PB and CONT. The results pertaining to the total REY (kharif + rabi) showed that the highest REY was obtained under ZT (89.68 q/ha) which was statistically at par to CT (88.33 q/ha) and significantly superior to PB (84.16 q/ha). Significantly highest net return (Rs. 62822/ha/yr) and B:C ratio were recorded in ZT followed by PB and CONT. The savings were mainly due to the reduced cost of land preparation and planting method in the case of rice, low input costs and higher yields in case of wheat (Gupta and Seth, 2007), maize, and lentil under ZT and PB compared to CONT. Among different cropping systems, during the rabi season the highest REY was obtained in the rice-maize (R-M) cropping system (61.19 q ha-1) which was significantly superior than rice-wheat (R-W) and rice-lentil (R-L) system. Total REY (kharif +rabi) and net return were recorded 101.4 q/ha and Rs. 69,971/ha/yr respectively which was significantly superior to R-W and R-L cropping system. But significantly highest B:C ratio was recorded under R-L system (1.39) as compare to R-W (0.89) and R-M (1.19) cropping systems. This is due to the production cost, which was lower in the R-L system as compared to R-W and R-M system.
REFERENCES [1] Jat M L, Gathala M K, Singh KK, Ladha JK, Singh S, Gupta R K, Sharma S K, Saharawat YS and Tetarwal J P 2008. Experiences with
permanent beds in the rice-wheat system of the Western Indo-Gangetic plain. In: (Ed) Humphreys E, Roth CH. Permanent beds and rice residue management for rice-wheat system of the Indo-Gangetic plain. ACIAR Proceedings127: 98-107.
[2] Saharawat Y, Singh B, Malik R, Ladha JK, Gathala M, Jat M and Kumar V 2010. Evaluation of alternative tillage and crop establishment methods in a rice-wheat rotation in North Western IGP. Field Crops Research116: 260-267.
[3] Gupta R and Seth A 2007. A review of resource conserving technologies for sustainable management of the rice-wheat cropping systems of the Indo-Gangetic Plains (IGP). Crop Protection26: 436-447.
It is I
LLEGAL t
o cop
y, pri
nt or
save
any c
onten
t of th
is PDF,
in pa
rt or in
full,
on an
y retr
ieval
syste
m,
withou
t the E
XPRESS WRITTEN PERMISSIO
N of th
e cop
yrigh
t-hold
er

National Conference on Climate Change and Agricultural Production: Adapting Crops to Climate Variability and Uncertainty, 6th–8th April, 2017
[299]
Multiple Shoot Regeneration in Zea Mays L. (Jk Hybrid Parental Line) from Meristem Region
Preeti1, Pratima Chaudhary2 and Himanshu Shekhar Garg3* 1Maharashtra Hybrid Seeds Company Private Limited (Mahyco) Jalna–431203, India
2Department of Biotechnology Amity University Noida–201301 India 3Department of Plant Breeding & Genetics,
Dr. Rajendra Prasad Central Agricultural University, Pusa, Samastipur–848125, India E-mail: *[email protected]
Keywords: Maize, Shoot multiplication, Shoot apical meristem, Cytokinin
INTRODUCTION
Effect of various concentrations and combinations of plant growth regulators such as auxin and cytokinin on in vitro frequency and efficiency of Zea mays L. shoot meristem multiplication was studied. Mature maize seeds obtained from breeders from JK Seeds were sterilized using 0.5% Bavistin, 0.1% Mercuric Chloride solution and 0.2% Sodium Hypochlorite solution. Germination was induced on half MS medium with 3% sucrose. Shoot apical meristem was excised from uncontaminated seeds (rescued from fungal and bacterial contamination), after 7 days of germination, and inoculated in seven different media for in vitro multiplication. Shoot multiplication was best on MS medium containing 0.05mg/l IAA (Auxin) and 11.5mg/l Kinetin (Cytokinin). Explant, cultured on medium containing 2mg/l BAP (Cytokinin) also gave well multiple shoot formation response. But, at 4mg/l(ZM6), BAP had an inhibitory effect on shoot multiplication.
MATERIALS AND METHODS
Mature maize seeds obtained from JK Seeds (a JK maize hybrid in house parental line), and the experiment was conducted in Department of Biotechnology Amity University, were sterilized using 0.5% Bavistin, 0.1% mercuric chloride solution, 0.2% Sodium hypochlorite solution. Germination was induced on half MS medium with 3% sucrose. Shoot apical meristem was excised from uncontaminated seeds (rescued from fungal and bacterial contamination), after 7 days of germination, and inoculated in seven different media (ZM1 to ZM7) for in vitro multiplication. Effect of various concentrations and combinations of plant growth regulators such as auxin and cytokinin on in vitro frequency and efficiency of Zea mays L. shoot meristem multiplication was studied.
RESULT AND DISCUSSION
ZM3 medium containing moderate concentration of maltose (1%) led to an increase only in shoot length. In vitro shoot multiplication was observed at a high frequency in medium containing kinetin at a concentration of 1.5 mg/l and IAA at a concentration of 0.05 mg/l. Removal of elongated leaves & separation of multiple shoot clumps from each primary shoot meristem during subculture, increased the frequency of shoot multiplication. ZM7 medium was used as a control, which showed nearly 100% in vitro shoot multiplication after 6-7 days. It has been reported by, that corn shoot meristem can be manipulated to form either clumps of multiple shoots or somatic embryos, in vitro, by manipulating the concentrations of BAP and 2,4-D, primarily. The results showed that increase in concentration of BAP beyond 2mg/l increased the rate & frequency of shoot multiplication. However, at higher than optimal concentration, BAP had an adverse effect. This decrease may be related to toxicity of BAP at higher concentration.The treatment combination 0.05 mg/l of IAA+11.5mg/l of Kinetin was most effective for shoot multiplication. This is consistent with the findings
It is I
LLEGAL t
o cop
y, pri
nt or
save
any c
onten
t of th
is PDF,
in pa
rt or in
full,
on an
y retr
ieval
syste
m,
withou
t the E
XPRESS WRITTEN PERMISSIO
N of th
e cop
yrigh
t-hold
er

National Conference on Climate Change and Agricultural Production: Adapting Crops to Climate Variability and Uncertainty, 6th–8th April, 2017
[300]
that cytokinins induce shoot multiplication (Gomes et al., 2010) by playing a primary role in cell division; breaking the apical dominance and influencing shoot growth.
Table 1: Excised Shoot Apical Meristem was Inoculated in 7 Different Media for Multiplication Sl. No. Media ID Observation(after 14 Days)
Avg. No. of Shoot Avg. Shoot Height 1. ZM1 2.8 medium 42.7 high 2. ZM2 3.4 medium 25.6 low 3. ZM3 1.6 low 44.1 high 4. ZM4 1.4 low 21.8 low 5. ZM5 6.3 high 34.1 medium 6. ZM6 1.0 low 35.3 medium 7. ZM7 (Control) 2.9 medium 23.7 low
REFERENCES [1] Gomes F, Simoes M, Lopes M L, Canhoto and J M 2010.Effect of plant growth regulators and genotype on the micro-propagation of
adult trees of Arbutus unedo L.New Biotechnology 27(6):882-892. [2] Ramesh M., Murugiah, V and Gupta, A.K., 2009. Efficient in vitro plant regeneration via leaf base segments of indica rice (Oryzasativa L.).
Indian Journal of Experimental Biology 47: 68–74.
Changes of Microbial Population in Rhizosphere of Mustard (Brassica juncea L.) due to Various Mulches with RDF
Jayant Shekhar, Bihari Ram Maurya, and Indra Bahadur* Department of Soil Science and Agricultural Chemistry, Institute of Agricultural Science,
Banaras Hindu University, Varanasi–221005, India E-mail: *[email protected]
INTRODUCTION
With the changing climate the carbon content of agricultural land reduce drastically as increased temperature hasten the process of decomposition of organic matter which influence the microbial population in an adverse manner leads to the decrease in nutrient availability to the plants and finally affects yield. Mulches may be a potent solution to overcome these erratic change in climate like irregular rains, variable temperature and depletion of ground water etc. Mulching helps in reducing weed, conserve moisture, improve soil structure and fertility of soil by addition of organic material (Nin et al., 2016).By considering all the point objective of the research is to study the effect of sulphur, boron and various mulches on microbiota in rhizosphere of mustard.
MATERIAL AND METHOD
Field experiment was conducted on Research Farm Rajiv Gandhi South Campus, Barkachha (BHU), Mirzapur and laboratory work was carried out in microbiology laboratory of the department of Soil Science and Agricultural Chemistry, Institute of Agricultural Sciences, Banaras Hindu University, Varanasi, in 2013- 2014. Seven treatment combination with different levels of sulphur, boron and mulches in a randomized block design and three replication in Pusa Bold variety of mustard. Microbiological studies were carried out on rhizospheric soils of mustard fertilized with different levels of sulphur and surface soils covered with different mulches in rain fed condition of Mirzapur district in Uttar Pradesh, India during Rabi season 2013.
It is I
LLEGAL t
o cop
y, pri
nt or
save
any c
onten
t of th
is PDF,
in pa
rt or in
full,
on an
y retr
ieval
syste
m,
withou
t the E
XPRESS WRITTEN PERMISSIO
N of th
e cop
yrigh
t-hold
er

National Conference on Climate Change and Agricultural Production: Adapting Crops to Climate Variability and Uncertainty, 6th–8th April, 2017
[301]
RESULTS AND CONCLUSION
Population of actinomycetes increased with successive increases in time i.e. at 30 60 and 90 days after sowing. Treatment T3 showed maximum population of actinomycetes (26.3x 10⁵ cfu g-1 of soil) at 90 days. In general microbial population of phosphate solubilizing bacteria was maximum and increased at 60 DAS but slightly decreased at 90 DAS. Treatment T4 showed maximum 13.0 x 10⁵ cfu g-1 of PSB at 30 DAS while T5 gave maximum at 60 and 90 DAS of crop sowing. Treatment T7 caused significant and maximum population of Azotobacter at 30 DAS as compared to control. Furthermore, T4 treatment showed maximum population of Azotobacter at 60 DAS but slightly decreased at 90 DAS. The population of microbes was in order of Bacteria > Actinomycetes >Fungi>Azotobacter> PSB, respectively (Kumar et al., 2015).Microbial population of PSB was found maximum and increased at 60 DAS but slightly decreased at 90 DAS. Treatment T4 showed maximum 13.0 x 10⁵ cfu g-1 of PSB at 30 DAS. Application of RDF+40 kg S ha-1 + 2 kg B ha-1 + legume straw on mustard crop showed significant and maximum microbial population.
REFERENCES [1] Nin Y, Diao P, Wang Q, Zhang Q, Zhao Z and Li Z 2016.On-Farm-Produced Organic Amendments on Maintaining and Enhancing Soil
Fertility and Nitrogen Availability in Organic or Low Input Agriculture. Organic Fertilizers 13: 289. [2] Kumar A, Maurya BR and Raghuwanshi R 2015.Characterization of bacterial strains and their impact on plant growth promotion and
yield of wheat and microbial populations of soil. African Journal of Agricultural Research10(12): 1367-1375.
Growth, Yield and Quality of Indian Mustard (Brassica juncea L.) Influenced by Dose and Source of Sulphur
Vinod Kumar1*, Shashank Tyagi1, Sushant1, S.K. Choudhary1, S.C. Paul2, S.K. Dubey1, Shruti Suman1, Prashant Kumar1 and Koushik Sar1
1Department of Agronomy, 2Department of Soil Science & Agricultural Chemistr 1,2Bihar Agricultural University, Sabour, Bhagalpur 813210, India
E-mail: *[email protected]
Keywords: Climate change, Mustard, Oil quality, Sulphur, Yield
INTRODUCTION
India is one of the largest rapeseed mustard growing countries in the world. Sulphur is the fourth major plant nutrient after nitrogen, phosphorus, potassium and is essential for synthesis of amino acids, proteins, oils, a component of vitamin A and activates enzyme system in plant. Three amino acids viz. methionine (21% S), cysteine (26% S) and cystine (27%S) contain S which are the building blocks of proteins. Minimum use of low-analysis fertilizers like ammonium sulphate and single super phosphate and organic manures has rendered the Indian soils deficient in sulphur. Yield improvement with sulphur applications has been attributed to enhance nitrogen use efficiency possibly by increasing nitrate reductase activity. Climate can also be affected by a number of other agents in addition to greenhouse gases; important amongst these are small particles (aerosols). These aerosols are suspended in the atmosphere and some of them (e.g. sulphate aerosols derived from sulphur dioxide) reflect back solar radiation; hence they have a cooling effect on climate and in context of climate change, source and amount of sulphur in mustard has very important role to mitigate the atmospheric pollution (Mike et al., 2001). A number of such scenarios have been used in S cycle model to calculate the future rise in sulphate aerosol concentration. This investigation was undertaken to find out the suitability of various sources and doses of sulphur for mustard grown in middle gangetic plains of Bihar.
It is I
LLEGAL t
o cop
y, pri
nt or
save
any c
onten
t of th
is PDF,
in pa
rt or in
full,
on an
y retr
ieval
syste
m,
withou
t the E
XPRESS WRITTEN PERMISSIO
N of th
e cop
yrigh
t-hold
er

National Conference on Climate Change and Agricultural Production: Adapting Crops to Climate Variability and Uncertainty, 6th–8th April, 2017
[302]
MATERIALS AND METHODS
A field experiment was conducted during winter season of 2013-14 at Bihar Agricultural University, Sabour, Bhagalpur, India. The soil was sandy loam with pH 7.42 containing organic carbon 0.52%, available nitrogen 227.2 kg ha-1, P2O5 24.2 kg ha-1, K2O 152.1 kg ha-1 and sulphur 10.31 ppm. There were 12 treatment combinations comprising of three sources (gypsum, iron pyrite, and bentonite S) in main plot and four doses of sulphur (0, 20, 40, and 60 kg ha-1) in sub plots replicated thrice in factorial randomized block design.
RESULTS AND DISCUSSION
Growth parameters of mustard at harvest stage viz., plant height (6.0 cm), number of leaves per plant (25.0), leaf area index(6.03) and dry matter production per plant(81.3g), number of primary branches plant-l (7.0) and 1000-grain weight (4.23) increased significantly with bentonite S source with increasing S doses up to 40 kg ha-1 except dry matter production per plant which was recorded highest (84.4g) at 60 kg S ha-1 which might be due tosulphur role to enhance cell division, cell elongation or expansion and chlorophyll synthesis. It is also important in the activity of meristematic tissues and development of shoots. Thus in adequate supply of sulphur, it will be expected that plants grow taller with more number of leaves having bigger size and higher chlorophyll content. Similar results were obtained in seed yield (15.4 q ha-1) and stover yield (39.1q ha-1) significantly superior with bentonite S source increased with increasing S doses up to 40 kg ha-1. This increase in yield might be attributed to easy availability of SO4
2-S present in gypsum as compared to sulphide form in pyrite which essentially requires its oxidation to be converted into SO4
2- S prior to its absorption by the crop (Singh and Singh, 2007).The higher concentration of S in mustard grain than stover clearly indicates the mobilization of S from plant parts to grain. Soil low in S status was unable to supply the nutrient sufficiently for optimum yield of the crop. However, the lowest seed yield was recorded from iron pyrite. Quality parameters in terms of oil content in seed of mustard i.e. 40.5% with bentonite S source and 42.4% up to 60 kg S ha-1, respectively. Theincrease in oil content due to S application was mainly due to increase in glucoside formation (allyisothiocynate) and also sulphur as constituent of multi-enzyme complex “fatty acid synthase”. Sulphur plays a major role in the formation of amino acids and synthesis of oils.
Available sulphur in soil was not significantly affected by sources of sulphur resulting maximum sulphur content in soil with bentonite S and there was remarkable improvement in available S content in soil due to source and dose of S over the initial value. Sulphur doses significantly enhanced the available S status in soil with corresponding increase in their doses resulted in maximum S content under 60 kg S ha-1 which showed statistical parity with 40 kg S ha-1 and was significantly superior over rest of S doses. Sulphur content decreased with the advancement of growth stages of crop. Sulphur content in plant was significantly higher with bentonite S as compared to remaining sources at all the growth stages except at 21 days after sowing where non significant difference was observed. It might be ascribed to high sulphur concentration in bentonite S, S content in plant was progressively enhanced with each increase in S dose from 0 to 60 kg ha-1 resulting maximum value at 60 kg S ha-1 which was significantly higher over 40 kg S ha-1 except at 42 days after sowing.
REFERENCES [1] Mike H, Ruth D, Todd N, Mark N and David L 2001.African Climate Change, 1900–2100.Climate Research 17: 145–168. [2] SinghS and SinghV 2007.Effect of sources and levels of sulphur on yield, quality and nutrient uptake by linseed (Linum
usitatissimum).Indian Journal of Agronomy 52 (2): 158-159.0
It is I
LLEGAL t
o cop
y, pri
nt or
save
any c
onten
t of th
is PDF,
in pa
rt or in
full,
on an
y retr
ieval
syste
m,
withou
t the E
XPRESS WRITTEN PERMISSIO
N of th
e cop
yrigh
t-hold
er

National Conference on Climate Change and Agricultural Production: Adapting Crops to Climate Variability and Uncertainty, 6th–8th April, 2017
[303]
Crop Diversification for Sustainable Production of Rice Based Cropping System through Natural Resources Management
Santosh Kumar1*, Gargi Goswami2, Anand Chaudhary3, Pankaj Kumar Ray3, Ashutosh Singh4, Amit Kumar Pandey4
1Bihar Agricultural University, Sabour, Regional Research Station, Agwanpur–852201, India 2Chandra Bhanu Gupta Krishi Mahavidyalaya, Lucknow, India
3Bihar Agricultural University, Sabour, Krishi Vigyan Kendra, Saharsa–852201, India 4Mandan Bharti Agriculture Collage, Agwanpur–852201, India
E-mail: *[email protected]
Keywords: Labour employment, Productivity, Production efficiency, Rice-based crop sequences
INTRODUCTION
Crop diversification has been recognized as an effective strategy for achieving the objectives of food security, nutritional security, income growth, poverty alleviation, employment generation, and judicious use of land and water resources, sustainable agricultural development and environmental improvement. The alternative cropping system so developed may be practiced for better returns and or to enhance the sustainability of existing cropping system. There are indications of stagnation or even decline in the productivity of this cropping system due to decline in soil organic matter, over-mining of nutrient reserves, loss of nutrients and non availability of cost-effective fertilizers. The inclusion of crops in cropping system will improve the economic condition of the farmers owing to higher price and higher volume of their main and by-products. The objective of the study is to develop the technique for conservation of natural resources and balance the agro-ecosystems through crop diversification.
MATERIALS AND METHODS
The experiment was conducted at eastern part of Uttar Pradesh during kharif, rabi and summer seasons in the year 2012-2013. The experiment was laid out in randomized block design with 3 replications. Ten crop sequences viz., rice-wheat (T1), rice-wheat-green gram (T2), rice-wheat-Sesbania (T3), rice-wheat + mustard (5:1)-black gram (T4), rice-wheat + mustard (5:1)-cowpea (dual purpose) (T5), rice-mustard-green gram (T6), rice-toria-lady’s finger (T7), rice-veg. pea-lady’s finger (T8), rice-maize (cob) + veg. pea (1:2) - cowpea fodder (T9) and rice-potato-green gram (T10) were tested. Cultivation practices were followed as per local recommendation for each crop. Sesbania aculeate as green manure and green gram after last picking were cut from the ground level and was incorporated in soil. The other crops were harvested at maturity. Productivity (kg ha-1 day-1), profitability (Rs. ha-1 day-1) and land utilization efficiency was calculated with standard formulas. The total number of labour required for various agronomic practices under different cropping sequences were worked out.
RESULTS AND DISCUSSION
The rice-potato-green gram sequence recorded significantly highest system productivity (52.0 kg ha-1 day-1), among all other crop sequences (Table 1). This was mainly due to highest production efficiency of this sequence in which the contribution of potato and vegetable pea is quite obvious. The next best was rice-veg. pea-lady’s finger (T8) which being comparable to T9 proved significantly superior to other sequences with respect to system productivity. However, rice-wheat system proved to be the most inferior with system productivity of 20.9 kg ha-1 day-1. These results corroborate the finding of Sharma et al., 2004. As compared
It is I
LLEGAL t
o cop
y, pri
nt or
save
any c
onten
t of th
is PDF,
in pa
rt or in
full,
on an
y retr
ieval
syste
m,
withou
t the E
XPRESS WRITTEN PERMISSIO
N of th
e cop
yrigh
t-hold
er

National Conference on Climate Change and Agricultural Production: Adapting Crops to Climate Variability and Uncertainty, 6th–8th April, 2017
[304]
to rice-wheat sequence, all other sequences recorded higher profitability. Rice-potato-green gram recorded highest system profitability of 412 Rs ha-1 day-1 which was 209.7 % higher than rice-wheat sequence. This was mainly due to higher production potential of potato accompanied with good monetary return from green gram. Similar finding were also reported by Saumi et al., 2004. In general, sequences involving summer crops employed more labours. Rice- toria- lady’s finger sequence employed maximum number of labors followed by rice- potato green gram and rice- mustard- green gram sequence. This was mainly due to inclusion of additional crop in summer season that contributes to increase in number of labours for cultivation of that crop. The maximum land use efficiency was in rice- veg. pea lady’s finger followed by rice- toria- lady’s finger and rice- mustard- green gram sequence. This is due to inclusion of summer crop in the system land was occupied for longer period. A perusal of the data indicated that all the crop sequences with 300 % intensity employed more labor than rice-wheat crop sequence. Maximum labor employment was recorded in rice-toria-lady’s finger (327) sequence which was followed by T10, T6, T9, T4, T8, T2,T5 T3, T1 in order.
Table 1: System Productivity, Production Efficiency, Land Use Efficiency and Labor Employment of Different Crop Sequence
Treatments System Productivity (kg ha-1 Day-1) Production Efficiency (Rs. ha-1 Day-1)
Land Use Efficiency (%)
Labor Employed (ha-1 Year-1)
T1- Rice-Wheat-Fallow 20.9 133 73.7 188 T2- Rice-Wheat-Green gram 34.0 247 91.8 290 T3- Rice-Wheat-Sesbania (GM) 23.3 159 73.7 195 T4-Rice-Wheat + Mustard (5:1)-Black gram
32.4 219 95.9 308
T5- Rice-Wheat + Mustard (5:1)-Cow pea (DP)
30.8 207 93.4 288
T6- Rice-Mustard-Green gram 33.2 240 97.3 322 T7- Rice-Toria-Lady’s finger 33.2 222 97.8 327 T8- Rice-Veg. pea- Lady’s finger 36.5 264 98.6 298 T9- Rice-Maize (Green cob) + Veg. pea (1:2)-Cow pea (F)
35.6 243 96.4 314
T10- Rice-Potato-Green gram 52.0 412 95.9 323 CD (P = 0.05) 2.31 NS 2.93 NS
REFERENCES [1] Samui R C, Kundu A L, Majumder D, Mani P K and Sahu P K 2001. Diversification of rice (Oryza sativa)-based cropping system in new
alluvial zone of West Bengal. Indian Journal of Agronomy 49 (2):71-73. [2] Sharma R P, Pathak S K, Haque M and Raman R R 2004. Diversification of traditional rice (Oryza sativa) based cropping system for
sustainable production in south Bihar alluvial plains. Indian Journal of Agronomy 49(4):218-222.
Effect of Sulphur and Vermicompost on Onion (Allium CepaL) under Onion-Maize Cropping System in Calciorthents
Vipin Kumar*, R. Laik, S.K. Singh and R.K. Prasad Department of Soil Science,
Dr. Rajendra Prasad Central Agricultural University, Pusa–848125, Samastipur, India E-mail: *[email protected]
Keywords: Onion, Sulphur, Vermicompost, Cropping system
INTRODUCTION
Fertilizer is a key component of improved practices. The role of sulphur deserves a special mention in the nutrition of Liliac plants like onion (Allium Cepa L.) (Jaggi et al., 2006; Mondal et al., 2004). Contrarily, most
It is I
LLEGAL t
o cop
y, pri
nt or
save
any c
onten
t of th
is PDF,
in pa
rt or in
full,
on an
y retr
ieval
syste
m,
withou
t the E
XPRESS WRITTEN PERMISSIO
N of th
e cop
yrigh
t-hold
er

National Conference on Climate Change and Agricultural Production: Adapting Crops to Climate Variability and Uncertainty, 6th–8th April, 2017
[305]
of the Indian soils are deficient in sulphur. Mining of sulphur through high sulphur demanding crops like oilseeds, pulses and other vegetable with little or no advertent sulphur addition, lack of use of secondary nutrient and organic manure. Vermicompost, on the other hand, is a complete food for crops including sulphur with wide ranging benefits. Among the many constraints for sulphur mining and low productivity in onion, imbalance nutrition is the main limiting factor. The continuous and imbalanced use of fertilizers is adversely affecting the sustainability of agricultural production. Integrated nutrient management (INM) provide excellent opportunities to overcome all the imbalances besides sustaining soil health and enhancing crop production. Hence, the present investigation was undertaken to investigate the effect of Sulphur and vermicompost on growth and yield on onion.
MATERIALS AND METHODS
The field experiment was conducted to study the effect of sulphur and vermicomposton onion (Allium Cepa L.) cv. Agri and maize (Zeamays) cv. Shaktiman-1 for two consecutive years during rabi 2009-10 and 2010-11 at Dr. Rajendra Prasad Central Agricultural University, Pusa, Bihar. The experimental soil had pH (1:2) 8.4, EC 0.37 dSm-1
, organic carbon 5.1 g kg-1, available N 237 kg ha-1, available P2O519.9 kg ha-1, available K2O 105 kg ha-1 and available S 8.3 mg kg-1. Four levels of vermicompost viz. no vermicompost (VC0), 1.25 t ha-1(VC1.25), 2.50t ha-1(VC2.5) and 5.0 t ha-1 (VC5.0) were applied as treatment in main plots. The main plot was divided into 4 sub-plots in which treatments viz. no S (S0), 20 kg S ha-1 (S20), 40 kg S ha-1 (S40) and 60 kg S ha-1 (S60) were superimposed over vermicompost levels. The experiment was laid out in a split plot design with three replications and plot size was 5.0 x 2.0 m. Forty-five day old seedlings were transplanted in February at a spacing of 20 x 10 cm. At maturity, bulb and foliage were collected from each plot to determine dry matter accumulation.
RESULTS AND DISCUSSION
The effect of sulphur and vermi-compost on fresh bulb yield, dry bulb yield and dry foliage yield were significant. The highest fresh bulb yield, dry bulb yield and dry foliage yield were obtained at 60 kg S ha-1 which was at par with 40 kg S ha-1. Vermi-compost @ 5.0 t ha-1 increased fresh bulb yield significantly over control, 1.25 and 2.5 t vermicompost treatment. However, highest dry bulb yield and dry foliage yield did not differ significantly in 2.5 t and 5.0 t vermi-compost. The application of sulphur and vermin-compost increased total sulphur uptake from 5.95 to 8.65 kg ha-1 and 6.59 to 8.27 kg ha-1, respectively. The highest mean sulphur uptake was observed at 60 kg S ha -1 which was statistically at par with 40 kg S ha-1treatment.It can be concluded that higher levels of sulphur (40 and 60 kg sulphur) and higher levels of vermicompost recorded higher bulb yield. This was reflected in sulphur uptake by fresh bulb yield, dry bulb yield and dry foliage yield.
REFERENCES [1] Jaggi R.C., Sharma R.K. and Gupta S. 2006. Comparative response of onion (Allium Cepa L.) to two sources of sulphur. Journal of
Agricultural Sciences 76 (3):145-147. [2] Mondal S.S., Acharya D., Ghosh A. and Thapa U 2004 Integrated organic and inorganic sources of nutrients to improve productivity and
qualitative characters of rice and onion in rice-onion cropping sequence. Environment and Ecology 22:125-128.
It is I
LLEGAL t
o cop
y, pri
nt or
save
any c
onten
t of th
is PDF,
in pa
rt or in
full,
on an
y retr
ieval
syste
m,
withou
t the E
XPRESS WRITTEN PERMISSIO
N of th
e cop
yrigh
t-hold
er

National Conference on Climate Change and Agricultural Production: Adapting Crops to Climate Variability and Uncertainty, 6th–8th April, 2017
[306]
Climate Resilient Integrated Approach for Increasing Growth, Yield and Economics of Onion (Allium cepa L.)
S.K. Sinha1, R.B. Verma1, V.K. Singh1, V.B. Patel2, G.S. Panwar3 and D.K. Bharati1 1Department of Hort. (Veg. & Flori.), 2Department of Hort. (Fruit.), 3Department of Agronomy
1,2,3Bihar Agricultural University, Sabour–813210, Bhagalpur, India E-mail: *[email protected]
Keywords: Yield, Economics, Onion
INTRODUCTION
Onion is one of the most important commercial vegetable crops grown in India, which earns about 70% of foreign exchanges among the fresh vegetable. The area, production and productivity of onion in Bihar is 0.05 m ha, 1.25 m t and 22.97 t/ha respectively (NHB 2014-15), which is comparatively higher than national average productivity of 16.13 t/ha. Nitrogen, phosphorus and potassium are the major primary nutrients required in large quantity, however farm yard manure (FYM), vermicompost (VC) and poultry manure (PM) are the cheap and renewable sources of nutrients to sustain the fertility. This is the crop requiring extreme cold to extreme higher temperature for proper growth, development and maturity of the crop. However, transplanting after 15th of January drastically reduces the yield due to lesser period required for growth and development. In addition, the use of chemical fertilizers, pesticide and insecticide etc. have increased the crop yield manifold but their irrational use created environmental problems and finally health hazards. Therefore to mitigate the climatic hazards a holistic approach needs to be optimised.
MATERIALS AND METHODS
To explore the possibility of climate resilient approach for increasing the productivity of onion an investigation was carried out at Bihar Agricultural University, Sabour, Bhagalpur during 2011-12. Fourteen treatments consisting of integration of climate resilient organic and inorganic fertilizers were arranged in randomized block design replicated thrice with onion variety N-53. The data were recorded on various growth, yield and quality parameters and analyzed statistically to draw the valid conclusion. The recommended dose of nitrogen, phosphorus and potassium were 120, 60 and 80kg/ha, however, the organic sources used for experiment were farm yard manure, poultry manure and vermicompost respectively.
RESULTS AND DISCUSSION
The application of 25% RDF + 75% N of poultry manure showed significantly higher plant height (51.2cm), number of leaves (8.56), length of leaves (42.92cm), chlorophyll ‘a’(0.239 mg/g), total chlorophyll (0.350 mg/g), number of scale per bulb (9.13), length of bulb (5.75cm), diameter of Bulb (5.85cm), average bulb weight (49.64gm), bulb volume (60.28cc), total yield (288.41q/ha), gross return (Rs. 230728/ha), net return (Rs. 165861/ha) and B:C ratio (2.66) over the 25% RDF + 75% N of vermicompost, sole application of PM for 100% N. The superiority of vermicompost in combination with inorganic fertilizers with respect to improvement in growth and yield of onion over rest of the organic sources could be attributed to balanced C/N ratio, higher organic matter build up, efficient microbial activities which produced growth promoting substances, less leaching and more nutrient availability and translocation to aerial parts. The results are in close conformity with the findings of Bagali et al. (2012) and Singh et al. (2008). It can be inferred that the application of 25% RDF + 75 % N of poultry manure in a holistic approach is economically viable and climate resilient for the cultivation of onion along with maintaining the soil sustainability.
It is I
LLEGAL t
o cop
y, pri
nt or
save
any c
onten
t of th
is PDF,
in pa
rt or in
full,
on an
y retr
ieval
syste
m,
withou
t the E
XPRESS WRITTEN PERMISSIO
N of th
e cop
yrigh
t-hold
er
National Conference on Climate Change and Agricultural Production: Adapting Crops to Climate Variability and Uncertainty, 6th–8th April, 2017
[307]
REFERENCES [1] Singh A.P., Singh O., Singh V. and Kumar S. 2009. Effect of integrated use of FYM and inorganic fertilizers in yield and uptake of
nutrients by onion. Progressive Agriculture 8: 265-267. [2] Bagali A.N., Patil H.B., Chimmad V.P., Patil P.L. and Patil R.V. 2012. Effect of inorganics and organics n growth and yield of onion
(Allium cepa L). Karnataka Journal. of Agriculture Sciences 25 (1): 112-115.
Foliar Feeding of Micronutrients: A Mitigation Option of Changing Climate to Enhance the Growth, Yield and Quality of Bitter
Gourd (Momordica charantia L.)
D.K. Bharati1, R.B. Verma1, V.K. Singh1, M. Feza Ahmad2, G.S. Panwar3 and S.K. Sinha and Ravi Kumar1
1Department of Horticulture (Veg. & Flori.), 2Department of Horticulture (Fruit.), 3Department of Agronomy, Bihar Agricultural University, Sabour–813210, Bhagalpur, India
E-mail: *[email protected]
Keywords: Micronutrient, Foliar feeding, bitter gourd
INTRODUCTION
Bitter gourd is an important vegetable crop rank 1st amongst cucurbits due to higher medicinal and nutritional values. High yielding cultivars and hybrids demand more macro as well as micro nutrients. The agronomic adaptations like crop management, cropping system and input management like use of organic manures, use of micronutrients, use of biofertilizers etc., which are mitigations options of changing climate, require emphasis. Imbalance supply of organic inputs reduces the availability of essential micronutrients, which ultimately affect the growth, yield and quality of fruits. Boron, zinc and copper normally result in premature floral abscission that leads to failure of seed set (Brown et al. 2002). The productivity of bitter gourd (6.87t/ha) in Bihar is comparatively lower than the national productivity (110 q/ha), which emphasizes the need of judicious and balanced use of macro as well as micronutrients together with better management practices for the improvement in the availability of nutrients. Therefore, the rational dose of micro nutrients in view of changing climate needs to be explored.
MATERIALS AND METHODS
A field study was conducted at Bihar Agricultural University, Sabour, Bhagalpur during summer season of 2011-12 to explore the possibilities of enhancing the production of bitter gourd with better quality by foliar application of different micronutrients. Fourteen treatments [Boric acid 100ppm (0.571g/l), Zinc Sulphate 100ppm (0.246g/l), Ammonium Molybdate 50ppm (0.644g/l), Copper Sulphate 100ppm (0.52g/l), Ferrus Sulphate 100ppm (0.515g/l), Manganese Sulphate 100ppm (0.32g/l), Mixture of all 100ppm, Commercial formulation multiplex 100ppm, Mixture of all without Zn, Mixture of all without Mo, Mixture of all without Cu, Mixture of all without Fe, Mixture of all without Mn, Commercial formulation multiplex @ 4ml/l and control (water spray only)] were arranged in randomized block design replicated thrice. The plot size used for raising the crop was 3.0m x 3.0m and the spaying of micronutrients was done at 30, 40 and 50 days after sowing. The data were recorded on growth, yield and quality traits and the Economic feasibility of bitter gourd production was also calculated
It is I
LLEGAL t
o cop
y, pri
nt or
save
any c
onten
t of th
is PDF,
in pa
rt or in
full,
on an
y retr
ieval
syste
m,
withou
t the E
XPRESS WRITTEN PERMISSIO
N of th
e cop
yrigh
t-hold
er

National Conference on Climate Change and Agricultural Production: Adapting Crops to Climate Variability and Uncertainty, 6th–8th April, 2017
[308]
RESULTS AND DISCUSSION
The application of mixture of all micronutrients @ 100ppm being at par with boric acid @100 ppm sprayed at 30, 40, 50 DAS resulted in the maximum length of vines (5.58 m), fruit length (25.01 cm), fruit girth (10.75 cm), fruit weight/vine (2.197 kg), yield (197.01 q/ha), vitamin C (64.65 mg/100gm) and total dry matter accumulation/plant (298.15gm).along with minimum physiological loss of weight (PLW)and spoilage at room temperature (24.78). Highest B:C ratio (2.69) was also noticed under this treatment.Therefore, on the basis of economic feasibility, it can be inferred that mixture of all micronutrients as well as boric acid @ 100ppm at 30, 40 and 50 DAS is more beneficial in mitigating the problems and improving the yield and quality of bitter gourd.
REFERENCE [1] Brown P H, Bellaloui N, Wimmer M A, Bassil E S, Ruiz J, Hu H, Pfeffer H, Dannel F and Romheld V 2002. Boron in plant biology. Plant
Biology 4: 205–223.
An Assessment of Genetic Integrity of Strawberry Plants Regenerated by Callus Culture
Anuradha*, S.K. Sehrawat and D.S. Dahiya Department of Horticulture, CCS Haryana Agricultural University, Hisar–125004, India
E-mail: *[email protected]
Keywords: In vitro propagation, Strawberry, Auxins, Cytokinins, Genetic fidelity
INTRODUCTION
The genetic uniformity is one of the major concerns in commercial propagation. The generation of true to type propagules and genetic stability are the prerequisites for the application of in vitro strawberry propagation (Debnath and Teixieira da Silva, 2007). Thus, objectives of present study was conducted to determine the appropriate growth regulator concentration and combination to establish a mass production system of callus raised plant of strawberry cultivar Ofra and assess the genetic fidelity of the in vitro raised plants through RAPD markers. This can be a useful for establishing a reliable micropropagation system for the production of genetically uniform plants before they are released for large scale cultivation or commercial purposes.
MATERIALS AND METHODS
The experiment was carried out at the Centre of Plant Biotechnology and Department of Horticulture, CCS Haryana Agricultural University, Hisar during the 2014-2015. Young tender vegetative nodal segment of 5-10 cm length were excised. The MS medium supplemented with BAP, Kinetin IAA and NAA alone or in combination each other for direct regeneration and for callus induction by hit and trial method. The cultures were maintained thermal insulated tissue culture room with temperature of around 25±2 0C and light 4000 lux was similar in all experiment. PCR method was used for molecular analysis using RAPD marker. Completely Randomized Design was used for experiment.
RESULTS AND DISCUSSION
Among the growth regulators tested, maximum callus induction percentage with minimum number of days for callus induction was observed on treatment MS basal + 4.mg/l 0 NAA + 2.0 mg/l BAP. MS medium most
It is I
LLEGAL t
o cop
y, pri
nt or
save
any c
onten
t of th
is PDF,
in pa
rt or in
full,
on an
y retr
ieval
syste
m,
withou
t the E
XPRESS WRITTEN PERMISSIO
N of th
e cop
yrigh
t-hold
er

National Conference on Climate Change and Agricultural Production: Adapting Crops to Climate Variability and Uncertainty, 6th–8th April, 2017
[309]
effective with regards to multiple shoot formation and number of leaves for direct regenerated shoots and for callus derived shoots, it was observed on MS media supplemented with 2.5 mg/l KIN and 0.5 mg/l IAA whereas, shoot length was recorded maximum on MS basal + 2.0 mg/l KIN + 0.1 mg/l IAA. All RAPD profile for in vitro raised plants were monomorphic and similar to their field grown mother plants. No polymorphism was detected with in vitro raised plants.
REFERENCE [1] Debnath S C and Teixeira da silva J A 2007. Strawberry culture in vitro: applications in genetic transformation and biotechnology. Fruit,
Vegetable and Cereal Science Biotechnology 1 (1):1-12.
Response of Growth, Yield and Economics on Different Scented Rice (Oryza sativa L.) Varieties to Different Fertility Levels
Tej Partap1*, Naveen Prakash Singh2, Divya Prakash Singh3, S.K. Choudhary1 and Ved Prakash Singh2
1Department of Agronomy, Bihar Agricultural University, Sabour–813210, India 2Department of Agronomy, 3Department of Agriculture Biotechonology
2,3Narendra Dev University of Agriculture and Technology, Narendra Nagar, Faizabad–224229, India E-mail: *[email protected]
Keywords: Scented Rice, Fertility, Economics
INTRODUCTION
Rice (Oryza sativa L.) is important crop of India grown over an area of 44.1 m ha with production 106.68 millon tones.(2016). Increasing the production of high quality aromatic rice by the farmers for domestic as well as export purposes is major concern of future agriculture strategy. The judicious use of available irrigation water and application of suitable doses of fertilizer play important role in minimizing the present large gap between yields achieved and yields achievable. The present studies were undertaken to investigate the response of scented rice (Oryza sativa L) varieties to different fertility levels.
MATERIALS AND METHODS
The field experiment was conducted at the Narendra Deva University of Agriculture and Technology, Narendra Nagar Faizabad (U.P.) India. during Kharif season of 2011-12. The soil of experimental plot was silty loam. with the pH 7.72 containing organic carbon 0.37% available nitrogen 190.55 kg ha-1, P2O5
13.03kg ha-1, K2O 257.10 kg ha-1 The experiment was in split plot design with, 3 scented rice varieties name Kalanamak- 3131, Pusabasmati -1 and Improved Pusabasmatia main treatment and 4 fertilizer levels (F1 -60+30+30 Kg NPK ha-1, F2 -90+45+45 Kg NPK ha-1, F3 -60+30+30kg NPK+6tonFYM ha-1 and F4 -90+45+45kg NPK+6ton FYM ha-1) as sub treatment. There were 12 treatment incombinations, each replicated thrice.
RESULTS AND DISCUSSION
The maximum plant height (122.82 cm) was in variety Kalanamak-3131 as compared to Pusabasmati-1 and improved Pusabasmati. The application of NPK (90:45:45kg ha-1) in combination with 60 ton FYM ha-1 showed significantly higher plant height, shoot hill-1, leaf area index and dry matter accumulation as compared to other treatments. The maximum number of shoots, No of panicles m-2 (250.72), length of
It is I
LLEGAL t
o cop
y, pri
nt or
save
any c
onten
t of th
is PDF,
in pa
rt or in
full,
on an
y retr
ieval
syste
m,
withou
t the E
XPRESS WRITTEN PERMISSIO
N of th
e cop
yrigh
t-hold
er

National Conference on Climate Change and Agricultural Production: Adapting Crops to Climate Variability and Uncertainty, 6th–8th April, 2017
[310]
panicle (24.40cm), grain yield (39.41q ha-1), all were recorded in the variety improved Pusabasmati which significantly higher than other scanted rice variety This might be due to increased availability of nutrients which led to better root developments ultimately produced more number of shoots per hill.Tunga and Nayak (2000) also reported that higher rate of NPK fertilizer on different high yielding rice and hybrid rice gave more yield and yield attributing character than low rate of fertilizer. Regarding benefit cost ratio (1.46) is maximum with combination with improved Pusabasmati along with (90 + 45 + 45 kg NPK + 60 ton FYM ha-1).
REFERENCES [1] Bhattacharjee P, Singhal R S and Kulkarni P 2002. Basmati Rice-A Review. International Journal of Food Sciences and Technology
37 (1): 12. [2] Tunga A K and Nayak R L 2000. Effect of nitrogen, phosphorous, potassium and zinc on different high yielding rice and hybrid rice
varieties during wet season. Journal of Intercademis 9 (4): 562-563.
Effect on Soil Properties under Poplar-Soybean Intercropping based Agroforestry System
Indra Singh1, Abhay Kumar2* and P.R. Oroan1 1College of Agriculture, G.B. Pant University of Agriculture and Technology, Pantnagar–263145, India
2Faculty of Forestry, Birsa Agricultural University, Kanke, Ranchi–834006, India E-mail: *[email protected]
Keywords: Agrisilviculture, Agroforestry system, Sustainable agriculture
INTRODUCTION
Agroforestry is a dynamic, ecological based, natural resources management system that, through the integration of trees on farms and in the agricultural landscape, diversifies and sustains production for increased social, economic and environmental benefits, for land users at all levels (ICRAF). Agroforestry helps in the sustainability of agriculture and its diversification to attain higher benefits per unit area of land, when carefully selected and managed with the introduction of fast growing multipurpose trees with little effect on agriculture crops (Johl et al., 1986).Keeping in view the ever increasing demand of poplar wood and the interest of farmers in poplar, some progressive farmers has obtained three times higher income from poplar and agricultural crop combination than pure agriculture (Mandalet al., 2005).
MATERIALS AND METHODS
Field experiment was conducted during kharif season of 2014 at G.B. Pant University of Agriculture and Technology, Pantnagar to study the performance of poplar (G-48) plants raised from different planting stocks and its effect on soybean (PS-1347) as an intercrop and on soil nutrients status. Eight treatments (T1=ETP (Normal), T2=2 Year ETP, T3=Cut from 2 year ETP, T4= Branch (2cm Diameter) main, T5= Secondary branch, T6=Top shoot (1cm), T7=Cutting, T8=Seedling, C=Control (Only for soybean)) were planted in the experimental field under randomized block design (RBD) with three replications.
RESULTS AND DISCUSSION
The soil pH was insignificantly lower while soil EC, soil organic carbon, available soil nitrogen, phosphorus and potassium was recorded insignificantly higher under poplar-soybean intercropping as compared to open (control) condition. In thefield experimentbefore sowing soybeanaverage soil pH, EC, OC, N, P and K was
It is I
LLEGAL t
o cop
y, pri
nt or
save
any c
onten
t of th
is PDF,
in pa
rt or in
full,
on an
y retr
ieval
syste
m,
withou
t the E
XPRESS WRITTEN PERMISSIO
N of th
e cop
yrigh
t-hold
er

National Conference on Climate Change and Agricultural Production: Adapting Crops to Climate Variability and Uncertainty, 6th–8th April, 2017
[311]
observed 7.76, 0.38, 0.99, 232.48, 18.08 and 212.92kg ha-1respectively and after harvesting soybean 7.62, 0.35, 1.04, 251.64, 19.64 and 215.40 kg ha-1respectivelyunder poplar-soybean intercrop system. The average value of soil pH 7.76 under poplar-soybean intercrop decreased to 7.62 as the age of intercrop and under open (control) farming system. Soil EC was lower from 0.34 dSm-1 to 0.32 dSm-1 under open (control) farming system and from 0.38 dSm-1 to 0.34 dSm-1 under poplar-soybean intercrop. Soil organic carbon percent after harvest of soybean under different planting stocks of poplar and soybean intercrop was observed 1.04% whereas 0.94% was under open farming system. The available soil nitrogen, phosphorus and potassium before sowing of soybean up to 0-30 cm soil depth was observed 232.48, 18.08 and212.92 kg ha-1 under poplar-soybean intercrop system and 226.28, 16.76,and119.67kg ha-1respectively under open (control) farming (system). The soil pH was higher under open (control) condition while other parameters like soil EC, OC, available N, P and K under found maximum under poplar based agroforestry system.
Table 1: Influence of Poplar and Soybean Intercropping System on Available Soil SOC,N, P&K Treatments Soil Organic Carbon
(SOC) Percent Available Soil
Nitrogen (kg ha-1) Available
Soil P2O5 (kg ha-1) Available
Soil K2O (kg ha-1) Before Sowing
Soybean
After Harvesting Soybean
Before Sowing Soybean
After Harvesting Soybean
Before Sowing Soybean
After Harvesting Soybean
Before Sowing
Soybean
After Harvesting Soybean
T1 0.99 1.07 227.71 257.15 19.26 20.07 220.25 222.15 T2 0.98 1.03 233.15 244.56 17.78 18.81 202.56 205.08 T3 0.96 0.98 235.82 249.56 18.07 19.49 209.92 212.39 T4 0.99 0.99 233.96 252.13 19.88 20.00 229.64 231.72 T5 1.04 1.10 230.14 243.66 16.63 19.19 221.60 223.93 T6 1.01 1.06 231.21 243.77 16.76 18.37 203.57 205.25 T7 0.96 1.01 230.57 259.24 18.47 19.95 209.88 212.51 T8 0.98 1.06 237.25 263.01 17.78 21.20 205.90 210.15 T1-T8 (mean) 0.99 1.04 232.48 251.64 18.08 19.64 212.92 215.40 Open(control) 0.90 0.94 226.28 236.76 16.76 18.69 199.67 201.00 CD at 5% NS NS NS NS NS NS NS NS CV % 3.04 3.39 2.20 6.99 11.16 9.79 9.79 9.64
REFERENCES [1] Garrity D.P. 2004. Agroforestry and the achievement of the Millenium Development Goals. Agroforestry Systems 61: 5-17. [2] Mandal B.S., Chauhan R.S. and Singh V.P. 2005.Case study of a successful agroforestry cultivator of Karnal District (Haryana).In
National Seminar on Extension Methodological Issue in Impact Assessment of Agricultural and Rural Development Programs Bangalore.
Mechanical Rice Transplanter: A Tool for Copping Climate Change
Ram Pal1, Alok Bharti2, Devendra Mandal, Ruby Saha1 and Ajay Kumar2 1Krishi Vigyan Kendra, 2Irrigation Research Station
1,2All India Coordinated Rice Improvement Project, Bikramganj, Rohtas,, India E-mail: *[email protected]
Keywords: Rice mechanization, Paddy transplanter, Field capacity, Field efficiency, Economic feasibility
INTRODUCTION
Rice cultivation is a tedious job in which mechanization is not only necessary to reduce the drudgery and production cost but also provides a huge employment opportunity to rural youths without migration. Transplanting is one of the essential operations of rice cultivation and requires 250-350 man-hrs/ha if being done manually which is roughly 25 per cent of the total labour requirement of the crop. It is reported that a delay in transplanting by one month reduces the yield by 25% and a delay of two month reduced the yield by 70%. Rohtas, popularly known as Rice Bowl of Bihar, stands first in term of production and second in
It is I
LLEGAL t
o cop
y, pri
nt or
save
any c
onten
t of th
is PDF,
in pa
rt or in
full,
on an
y retr
ieval
syste
m,
withou
t the E
XPRESS WRITTEN PERMISSIO
N of th
e cop
yrigh
t-hold
er

National Conference on Climate Change and Agricultural Production: Adapting Crops to Climate Variability and Uncertainty, 6th–8th April, 2017
[312]
term of productivity of rice among the all district of Bihar and grows paddy in about 2 lakhs hectare with average productivity of 4178kg/ha. Frequent delayed in monsoon due to climate change, migration of agricultural workforce form agriculture; mechanical transplanter may be explore as atool to mitigate both effects and complete transplanting in time and also sustain the production and productivity level of rice in the district. Keeping these in mind Krishi Vigyan Kendra, Rohtas has assessed the technical and financial feasibility of self-propelled rice transplanter at its demonstration farm during Kharif-2015 and 2016 in a view to reduce time, drudgery and cost of cultivation.
MATERIALS AND METHODS
An eight row self-propelled paddy transplanter (Model 2ZT-238-8) was used for the purpose. The field was prepared before going for transplanting by rotavator and kept for hardening the soil after draining the excess water so that the traction would be better when the machine put for operation. Operating data like depth of planting, number of plant per hill, number of missing hills, number of floating hills, float sinkage, field capacity and efficiency, fuel consumption etc. were recorded during operation of machine. Financial analysis such as Net Present Value (NPV), Internal Rate of Return (IRR), Benefit–Cost ratio (BCR) and Payback period were calculated by following the standard methods and prevailing rates in the districts.
RESULTS AND DISCUSSION
The field capacity, field efficiency and fuel consumption of the transplanter were 0.1876 ha/hr, 93.73 per cent and 1.06 l/hr, respectively. Cost of mechanical transplanting was merely Rs.808/ha as compared to Rs.3450/ha in manual transplanting. To breakeven with the cost of manual transplanting, the mechanical transplanter should be used at least in an area of 14.69 hectares per year. Payback period and internal rate of return were1.08 year and 27.98%, respectively which confirms that the machine is very much suitable for rural entrepreneurs of Rohtas district. In case of delayed monsoon (may be ill-effect of climate change) seedling for mechanical transplanter can be grown in 60m2 as compared to 1000m2 in case of manual transplanting for one hectarearea and would be manage in very less quantity of water.Similarly quick transplanting by mechanical transplanter complete the whole transplanting in lesser time as compared to manual transplanting and is capable to mitigate the delayed effect of monsoon onset on productivity of rice and subsequent crop in Rabi.It can be inferred from the results that mechanical transplanter is a feasible tools to mitigate ill effect of climate change, delayed transplanting, labour migration etc.It can complete the paddy transplanting in very short time, reduce transplanting cost and raise seedlings in less water and land as compared to manual transplanting.
Table 1: Technical Performance of Mechanical Transplanter Sl. No. Particulars Year Average
2015 2016 1 Depth of planting, mm 34.26 22.12 28.19 2 Number of plant per hill 8.54 4.86 6.70 3 Missing hills,% 0.89 0.51 0.70 4 Floating hills, % 2.05 1.23 1.64 5 Damaged hills, % 0.34 nil 0.17 6 Buried hills,% nil nil nil 7 Float sinkage, mm 34.56 21.34 17.95 8 Field capacity, m2/hr 1785 1964 1875.5 9 Efficiency, % 89.25 98.20 93.73
10 Fuel consumption, l/hr 1.26 0.86 1.06
REFERENCES [1] Singh G, Sharma TR and Bockhop CW 1985. Field performance evaluation of a manual transplanter. Journal of Agricultural Engineering
Research 32: 259-268. [2] ChaudharyV P and Varshney B P 2003.Performance evaluation of self-propelled rice transplanter under different puddle field conditions
and sedimentation periods.Agricultural Mechanization in Asia, Africa and Latin America (AMA) 34: 23-33.
It is I
LLEGAL t
o cop
y, pri
nt or
save
any c
onten
t of th
is PDF,
in pa
rt or in
full,
on an
y retr
ieval
syste
m,
withou
t the E
XPRESS WRITTEN PERMISSIO
N of th
e cop
yrigh
t-hold
er

National Conference on Climate Change and Agricultural Production: Adapting Crops to Climate Variability and Uncertainty, 6th–8th April, 2017
[313]
Effects of Anti-browning Agents on Quality Characters of Agaricus bitorquis (Quel.) Sacc.
Varsha Bharti*, Shaheen Kausar, Shazia Paswal, Seethiya Mahajan and Shahida Ibrahim Sher-e-Kashmir University of Agricultural Science and Technology of Kashmi, Srinagar–190025, India
E-mail: *[email protected]
Keywords: Agaricus bitorquis, Anti-browning agents, Quality
INTRODUCTION
Mushrooms are an important part of human diet since antiquity because of its attractive colour, flavour and aroma. The undesirable browning of mushrooms is of great concern during post-harvest handling, processing and storage of mushrooms.Loss in colour often renders the product unacceptable by the consumer. Polyphenol oxidation which cause the oxidation of phenolic compounds is considered responsible for browning of mushrooms. Methods to prevent browning are the subject of a great deal of research in the field of food industry. Several treatments are used to preserve colour. Blanching food is a heat treatment.Blanching treatments are presented according to the heat medium used: blanching in boiling water or in steam. The blanching time varies depending on the technique used, the type of product, size or maturity status. This process inactivates the enzymatic systems responsible for sensory alterations and thus limits the oxidation (Ioannou and Ghoul 2013). Anti-browning agents alsoinhibited the enzymatic browning of the mushroom and helped to maintaining the color of mushroom during storage. Therefore the objective of the present study was to evaluate the effects of anti-browning agents on quality characters of Agaricus bitorquis.
MATERIALS AND METHODS
The present investigations were conducted at Sher-e-Kashmir University of Agricultural Sciences and Technology of Kashmir, Shalimar, Srinagar during the year 2014-2015. Freshly harvested fruit bodies of uniform size of Agaricus bitorquis were taken, trimmed, washed with running cold water to remove dirt and dust particles and given various pre-treatments such as: Blanching (hot water treatment at 96 ̊C for 10 minutes) and control taken as unblanched. Blanched and unblanched samples were kept in anti-browning agents for 15 minutes to minimum enzymatic discolouration such as NaCl (0.1, 0.2, & 0.5%) ascorbic acid (0.5, 0.75, and 1.0%) and potassium meta bisulphite (0.75, 1.0 and 1.5%).All the treatments were replicated thrice. The observations were recorded on colour of Agaricus bitorquis.
RESULT AND DISCUSSION
Maximum mean score for colour attribute of Agaricus bitorquis was in case of blanched fruit bodies due to treatment of KMS (3.60) and ascorbic acid (3.56) at 1.5 and 1 per cent respectively which were at par. Lower score was observed in unblanched fruit bodies due to treatment of NaCl (1.73) at 0.1 and 0.2 per cent.KMS solution showed best colour of Agaricus bitorquisand this is due to sulphuring or sulphiting, a process to prevent the enzyme catalysed oxidative changes and inhibit microbial deterioration. The present findings pertaining to quality parameters viz. colour is in agreement to findings of Arumuganthan, Hemkar and Rai (2004). In conclusion, it is recommended that treatment with 1.5 % or 1 % KMS is suitable for getting better colour of Agaricus bitorquis mushroom.
It is I
LLEGAL t
o cop
y, pri
nt or
save
any c
onten
t of th
is PDF,
in pa
rt or in
full,
on an
y retr
ieval
syste
m,
withou
t the E
XPRESS WRITTEN PERMISSIO
N of th
e cop
yrigh
t-hold
er

National Conference on Climate Change and Agricultural Production: Adapting Crops to Climate Variability and Uncertainty, 6th–8th April, 2017
[314]
Table 1: Effect of Anti-browning Agents on Colour of Agaricus bitorquis Anti-browning Agents Concentration (%) Blanched Unblanched
Colour Colour NaCl 0.1 2.73 1.73
0.2 2.73 1.73 0.5 3.10 2.10
Mean 2.85 1.85 Ascorbicacid 0.5 3.33 2.33
0.75 3.46 2.46 1 3.56 2.76
Mean 3.46 2.51 KMS 0.75 3.33 2.60
1 3.53 2.73 1.5 3.60 2.80
Mean 3.48 2.71 Overall Mean 3.26 2.35 CD (p=0.05): Blanched and unblanched-0.027, Anti-browning agents-0.033, and Concentration-0.033
REFERENCES [1] Arumuganathan T, Hemkar AK and Rai RD 2004. Studies on drying characteristics and effect of pre-treatments on the quality of sun-
dried oyster mushroom Pleurotus florida. Mushroom Research 13: 35-38. [2] Ioannou I and Ghoul M 2013. Prevention of enzymatic browning in fruits and vegetables. European scientific journal 9:310-341.
Effect of Foliar Spray of Chemicals on Fruit Yield and Quality of Mango (Mangifera Indica L.)Cv. Langra under Changing Climate
Jyoti Kumari*, Ravindra Kumar, Sanjay Sahay, M. Feza Ahmad and Syed Razaul Islam Department of Horticulture (Fruit and Fruit Technology),
Bihar Agricultural University, Sabour–813210, Bhagalpur, India E-mail: *[email protected]
Keywords: Calcium, Boron, Sorbitol, Potassium nitrate, NAA, Mango
INTRODUCTION
Langra is one of the important commercial mango variety of North India, imbalance nutrient supply significantly affect the quality and productivity of horticultural crops. Due to changing climatic condition, the productivity start decreasing day by day and the precise application of nutrient is essential for sustainable productivity. Keeping the climatic scenario in mind, use of different macro and micro nutrients is an emerging area of research. Hence, the present study on effect of foliar spray of certain chemicals on yield and quality of mango (Mangifera indica L.) Cv. Langra under changing climate was under taken to improve the yield and quality mango.
MATERIALS AND METHODS
An experiment was conducted (2014-15) on thirty five years old plants under RBD with four replication under AICRP on Fruits at BAC, Sabour. The treatments comprised calcium @ 0.06%, boron @0.2%, sorbitol 2%, urea 3%, NAA 10 ppm, potassium nitrate @2% and including one control (water spray). The treatments were applied as aqueous sprays at two different times i.e., first spray of calcium nitrate @0.06%, boron @0.2% and sorbitol 2%, was done just after completion of 50% of the inflorescence was bloomed and second spray of urea 3%, NAA 10 ppm, potassium nitrate @2% at the time of first fruit set.
It is I
LLEGAL t
o cop
y, pri
nt or
save
any c
onten
t of th
is PDF,
in pa
rt or in
full,
on an
y retr
ieval
syste
m,
withou
t the E
XPRESS WRITTEN PERMISSIO
N of th
e cop
yrigh
t-hold
er

National Conference on Climate Change and Agricultural Production: Adapting Crops to Climate Variability and Uncertainty, 6th–8th April, 2017
[315]
RESULTS AND DISCUSSION
Application of boron @ 0.2% was very effective in reducing the fruit drop. Maximum number of fruit (829) per tree was harvested with the application of calcium nitrate @ 0.6% followed by 0.2%. Similarly, the maximum yield/plant was also recorded to the tune of 270.86kg/tree with the same treatment. The percentage of pulp (79.05%) was maximum with boron at 0.2% followed by sorbitol @ 2% and calcium nitrate @ 0.6%. Spraying of potassium nitrate @ 2 % was most effective treatment in improving TSS (20.12 OB) then that of other treatments. However, the total sugar content (11.49%) was recorded highest with the application of boron 0.2%. While as the highest content of caroteniods (8.55 mg/100 gfw) of mango pulp was obtained in boron 0.2% of boron followed by potassium nitrate @ 2%.
REFRENCES [1] Sankar C, Saraladevi D and Parthiban S 2013. Effect of foliar application of micronutrients and sorbitol on fruit set quality and leaf
nutrient status of mango cv. Alphanso. Asian Journal of horticulture 8: 714-719. [2] Kumar A, Rai M, Ranjan. and Singh C 2009. Comparative studies physico-chemical characteristics of mango (Mangifera indica L.)
cultivars under Ranchi condition in Jharkhand. The Orissa Journal of Horticulture 37 (1): 53-56.
Assessment of Different Storage Practices for Storage of Pulses for Household Nutritional Security
Anita Kumari* and Vinod Kumar KVK Bhagalpur Bihar Agricultural University Sabour–813210, Bhagalpur, India
E-mail: *[email protected]
Keywords: Pulse, Grain storage, Indigenous storage practices, Climate change
INTRODUCTION
Pulses, once the cheapest source of protein for the common man is now increasingly becoming expensive and getting beyond the reach of large number of population due to poor productivity and inadequate post harvest storage. During storage quantitative as well as qualitative losses occur due to contamination with microorganisms and their metabolic products. Grain storage plays an important role in preventing losses which are caused mainly due to weevils, beetles, moths and rodent (Kartikeyan et al.,2009). Grain storage is an important homestead activity for rural women as it provides foods throughout the year that improve house hold nutrition and indirectly generates additional income by escaping the purchase of grain from market in off season when there is rise in food prices as well as sell of surplus amount. Therefore Proper storage of food grain is need of hour in general and particular in the wake of Climate change which will affect all dimensions of food security and the People who are already vulnerable and food insecure are likely to be the first affected. Keeping the aforesaid point in view the present study was conducted with the objective to explore the comparative performance of different indigenous storage practices for storage of pulses.
MATERIALS AND METHODS
The trial was conducted in Jichho, Sarath, Rampur, Mohanpur, Korha, Shahuparbatta, Amba, Dhuaave,Dharahra, Rannuchak, Malpur, Lodipur, Kajraili and Bandhav village of Bhagalpur district with twenty six farm woman in the year 2013 & 2014. Farm woman were indentified on the basis of problem and their willingness to conduct trial. Sample grain were collected from the stored grain of farmer under different technology option of trial. From each storage treatment 100 seeds were taken to ascertained the percentage of damaged seed. The weight loss due to insect damage was also recorded. The data as well as
It is I
LLEGAL t
o cop
y, pri
nt or
save
any c
onten
t of th
is PDF,
in pa
rt or in
full,
on an
y retr
ieval
syste
m,
withou
t the E
XPRESS WRITTEN PERMISSIO
N of th
e cop
yrigh
t-hold
er
National Conference on Climate Change and Agricultural Production: Adapting Crops to Climate Variability and Uncertainty, 6th–8th April, 2017
[316]
otherinformation were collected through personal visit, observation and discussion. Thecollected data were compiled and statistically analyzed for further interpretation.
RESULTS AND DISCUSSION
The weight loss was 0.58 Kg in storage of pulse in jute bag and time to time sun drying followed by 0.16 Kg in storage of pulse in container using garlic followed by 0.10 Kg in storage of pulse in the neem treated jute bag followed by 0.08 Kg in storage in container using dry neem leaf. The rate of infestation was 29% in storage of pulse in jute bag and time to time sun drying followed by 8% in storage of pulse in container using garlic followed by 5% in storage of pulse in the neem treated jute bag followed by 4% in storage in container using dry neem leaf (Table 1). On farm trial result revealed that among the different storage practices storage of pulse in the neem treated jute bag followed by storage in container using dry neem leaf is better than storage in jute bag and time to time sun drying with the BCR 1.34, 1.15 and 1.06 respectively. However; in long term, storage in container using dry neem leaf is better as the life of container will be at least 10 year and jute bag needs to change every year. Hence, gross cost in second and later on year will be reduced in storage in container using dry neem leaf but remain same in storage of pulse in the neem treated jute bag. On basis of trial it can be recommended for micro level situation that neem based products should be popularized for house hold storage.
Table 1: Assessment of Different Storage Practices for Storage of Pulses Technology Option Infested
Pulse (%) Loss wt.
(Kg) Final
Wt. (Kg) Gross
Cost (Rs./2 Kg) Gross Return (Rs./2
Kg) B:C Ratio
Jute bag with sun drying 29 0.58 1.42 80 85.2 1.06 Neem treated jute bag 5 0.10 1.90 85 114.0 1.34 Ccontainer using dry neem leaf 4 0.08 1.92 100 115.2 1.15 Container using garlic 8 0.16 1.84 124 110.4 0.89 CD p=0.05 1.18 0.04 0.03 - - - Initial weight 2.0kg
REFERENCE [1] Kartikeyan C, Veeraraghavantham D, Karpagam D and Firdouse 2009. Traditional storage practices. Indian Journal of Traditional
Knowledge 8 (4):564-568.
Weed Management Strategies in Pigeonpea under Alfisol and Vertisol
Shruti Suman1,2*, Gurusharan Panwar2, Myer G. Mula1, Sanjay Kumar2, Mainak Ghosh2 and Vinod Kumar2
1International Crops Research Institute for the Semi-Arid Tropics (ICRISAT), Patancheru–502324, Hyderabad, India
2Department of Agronomy, Bihar Agricultural University, Sabour–813210, Bhagalpur, India E-mail: *[email protected]
Keywords: Weed management, yield, weed control efficiency
INTRODUCTION
Pigeonpea [Cajanus cajan (L.) Millspaugh]is a versatile food legume crop of the semi arid tropics. In India, the area under pigeonpea has recorded a significant rise, but the productivity has remained stagnant at around 774 kg/ha over the last five decades (Sharma et al., 2013). Among the several constraints, associated with pigeonpea productivity, the biotic factors, weeds aremajor impediments. Considered a wet season crop, the intermittent rains provide to grow the weeds including thenarrow and broad-leaved. Weeds are the
It is I
LLEGAL t
o cop
y, pri
nt or
save
any c
onten
t of th
is PDF,
in pa
rt or in
full,
on an
y retr
ieval
syste
m,
withou
t the E
XPRESS WRITTEN PERMISSIO
N of th
e cop
yrigh
t-hold
er

National Conference on Climate Change and Agricultural Production: Adapting Crops to Climate Variability and Uncertainty, 6th–8th April, 2017
[317]
leadingconstraints in pigeonpea production through their ability tocompete for resources and their adverse impact on quality. The wider row spacing and initial slow growth of pigeonpea, escorts to encourage the weed which may lead to the yield reductionof pigeonpea by 40-64% (Ahlawat et al., 2005). The present investigation was focused asto how combinations of cultural and chemical weed management option help inimproving productivity and economics of pigeonpea.
MATERIAL AND METHODS
Experiments were conducted at ICRISAT (International Crops Research Institute for Semi Arid Tropics), Patancheru, Telangana, India during wet season of 2013-14 under randomized block design. In the first experiment, the soil was Alfisol with twelve treatments, replicated thrice and for the second experiment it was Vertisol with the same set of treatments and replications. The variety, Pusa-9 was common for both the experiment. The treatments for both the experiments were application ofImazethapyr 10 % SL @ 20 g (T1), 40 g (T2) & 60 g (T3) a.i./ha at 15 days after sowing (DAS),application ofImazethapyr 10 % SL @ 20 g (T4), 40 g (T5) & 60 g (T6) a.i./ha at 30DAS,application of Pendimethalin 30% EC @ 750 g a.i. /ha as pre emergence (PE) (T7),application of Pendimethalin 30% EC @ 750 g a.i. /ha as PE + Quizalofop-ethyl 5 % EC @ 50 g a.i. /ha as post emergence (POE) at 15 DAS (T8), intercropping of Pigeonpea + blackgram (T9), application of Metribuzin 70% WP @ 250 g a.i /ha as PE (T10), Weedy check(T11)and Control asweed free(T12). Data of weeds were subjected to square root transformation by using the formula √x + 0.5 (Chandel, 1984). The statistical analysis was done by using analysis of variance techniques (ANOVA) as described by Cochran and Cox (1985).
RESULTS AND DISCUSSION
The study showed that common weeds grown in Alfisol and Vertisol weregrassy (Echinocloa colona, Paspalum distichum, Digitaria sanguinalis, Eleusine indica, Dactyloctenium aegyptium); Broad leaf (Digera arvensis, Parthenium hysterophorus, Commelina benghalensis, Bidens biternata), and sedge (Cyperus rotundus). However, weeds like Chloris barbata and Celosia argentea were only observed inAlfisol. There was a significant variation in seed yield of pigeonpea on both soil types. In first experiment the weed free (T12) treatment recorded significantly higher seed yield (2180 kg/ha) than all other treatments, followed by T3 (1,907 kg/ha) in herbicidal option, which was statistically at par with T6 (1843 kg/ha) (Figure 1).The higher yieldwas due to higher weed control efficiency of 87.37% and 83.00% in T3 and T6, respectively than the others. The experiment two also recorded the highest seed yield in T12 treatment (2672 kg/ha) which was significantly higher overthe others (Figure 1). Here in Vertisol, T2 recorded the significantly higher yield of 2345 kg/ha which was found statistically at par with treatment T5 (2318 kg/ha) and T3(2248 kg/ha). In this study it was observed that pigeonpea grown in Vertisol gives more benefit than in Alfisol, as in the second experiment, the benefit: cost ratio was found higher in all the cases as compared to that of first experiment. Based on the results it was observed that the yield differed significantly among the treatments in respective soil types. Application of imazethapyr @ 40 g a.i./ha at 15 DAS (T2), imazethapyr @ 60 g a.i./ha at 15 DAS (T3) &imazethapyr @ 60 g a.i./ha at 30 DAS (T6) performed well in terms of yield as well as economics in both the experiments.
It is I
LLEGAL t
o cop
y, pri
nt or
save
any c
onten
t of th
is PDF,
in pa
rt or in
full,
on an
y retr
ieval
syste
m,
withou
t the E
XPRESS WRITTEN PERMISSIO
N of th
e cop
yrigh
t-hold
er

National Conference on Climate Change and Agricultural Production: Adapting Crops to Climate Variability and Uncertainty, 6th–8th April, 2017
[318]
Fig. 1: Yield of Pigeonpea Influenced by Weed Management Strategies under Alfisol and Vertisol
REFERENCES [1] Ahlawat IPS, Gangaiah B and Singh IP 2005. Pigeonpea (Cajanus cajan) research in India-an overview. Indian Journal of Agricultural
Sciences 75 (6): 309-320. [2] Chandel SRS.1984. Analysis of Variance. A Handbook of Agricultural Statistics. 7th Edition, Achal Prakashan Mandhir. pp. 358-359. [3] Cochran, W. G. and Cox, G. M. (1985). Experimental Designs, Second Edition, Asia publishing House, Bombay, India: 576. [4] Sharma MK, Sisodia BVS and Kanhaiya Lal. 2013. Growth and trends of pulse production in India. Journal of Food Legumes 26
(1&2):86-92.
Variations in Morphological and Phenological Traits of Selected Sunflower Populations and Hybrids Reveal Their Relative Preference
to Four Honey Bees
Rinku1, O.P. Chaudhary2 and H.D. Kaushik1 1Department of Entomology, CCS Haryana Agricultural University, Hisar–125004, India
2CCS Haryana Agricultural University, College of Agriculture, Kau–136021, India E-mail: *[email protected]
Keywords: Sunflower, Honey bees, Floral morphology, Phenology, Honey
INTRODUCTION
Sunflower (Helianthus annuus L.) being self incompatible, depends essentially on cross pollination especially by honey bees for 65.0% (range 40-90%) of its seed production (Klein et al., 2007). For honey bees, it provided copious amount of nectar and pollen and for bee keepers served as one of the most important source of high quality honey. However, since 1999, there is no honey extraction from North India, believed due to low amount of nectar production by modern day hybrids. We verified this hypothesis by studying relative attractiveness of old populations and new hybrids in relation to their morphological and phenological traits to the honey bees and pollinators.
0
500
1000
1500
2000
2500
3000
T1 T2 T3 T4 T5 T6 T7 T8 T9 T10 T11 T12
Yiel
d ( k
g/ha
)
Treatment
Alfisol Vertisol
It is I
LLEGAL t
o cop
y, pri
nt or
save
any c
onten
t of th
is PDF,
in pa
rt or in
full,
on an
y retr
ieval
syste
m,
withou
t the E
XPRESS WRITTEN PERMISSIO
N of th
e cop
yrigh
t-hold
er

National Conference on Climate Change and Agricultural Production: Adapting Crops to Climate Variability and Uncertainty, 6th–8th April, 2017
[319]
MATERIALS AND METHODS
The experiment was conducted at CCS HAU, Hisar during 2015 summer crop on two old populations (HS-1 and Morden) and six hybrids (HSFH-848, HSFH-1183,PSH-996, SH-3322, DK-3849 andPioneer 64A57) sown in randomized plots (10 m2). European honey bee, Apis mellifera L. visited from managed colonies and other bees from feral ones. Flowering phonology, plant morphology parameters of cultivars were recorded along with diversity and abundance of floral visitors (temporal and spatial) on them.
RESULTS AND DISCUSSION
Amidst significant variations, no specific pattern of flowering phenology and plant morphology traits was observed among old populations and new hybrids. Flowering initiation ranged from 56 (HS-1) to 67 (DK-3849 and Pioneer 64A57) days of sowing but was completed in 5-7 days, except in HS-1 and HSFH-848 (12 days). Narrow range of flowering period was recorded on plot (12-16 days) as well as capitulum basis (7-9 days). Phenomenal difference in plant height were recorded, the old population Morden (90.3 cm) was shortest while hybrid Pioneer 64A57 was more than twice its height (202.2 cm). Hybrids had significantly higher number of leaves (22.5-25.5/plant) compared to old populations (16.7-17.3/plant). Population Morden possessed longest (26.1 cm) while HS-1 shortest (17.33 cm) leaf dimensions than the hybrids (21.5-25.2 cm). Leaves in Morden were the greenest (40.99 mg chlorophyll/gram) along with two hybrids - DK-3849 (39.85) and Pioneer 64A57 (38.83 mg). Significant variations for individual morphological characters thus, existed among cultivars.Largest flower head (24.9 cm) was in hybrid HSFH-1183 followed by Morden (19.4) and the smallest was in HS-1 (9.3 cm). Sterile ray florets were arranged in a single row except in DK-3849 (double rows) that possessed smallest capitulum with maximum number of florets (65.1) while least numbers were in HS-1 (34.0) followed by Morden (50.1). Hermaphrodite disc florets were shortest in size in HS-1 (16.4 mm), relatively longer -but comparable to other hybrids- in Morden (18.2 mm) except Pioneer 64A57 (21.5) and DK-3849 (21.4) where they were longest. Corolla tube length was shortest in HS-1 (6.8 mm) followed by Morden (7.6) and HSFH-848 (7.4) and in other hybrids, it was comparatively longer. Old populations recorded shortest ovary length (8.3 mm in HS-1; 8.7 in Morden) compared to new hybrids (8.7-10.3 mm).Sunflower cultivars hosted a very narrow array of 14 floral visitors. Pollinators comprised of only 4 honey bee species (37.6%), predominated by A. mellifera (23.9%) followed by A. cerana (11.1%) while population of two other wild honey bees was extremely low, A. florea (2.2%) and A. dorsata (0.4%). Surprisingly, three lepidopteran pest species, namely Helicoverpa armigera (15.3%), Venessa cardui (13.8%) and Trichoplusia ni (11.2%) were the most abundant group of floral visitors (40.3%). It indicated of a critical agro-ecosystem scenario where 50.7% of floral visitors were either of questionable pollination contribution or were pests.New hybrids in general, were more attractive when considered for both total floral visitors as well as for honey bee visitors as compared to old populations. Population Morden was least preferred (0.33 bees/ capitulum/ minutes-2) followed by HS-1 (0.47) and hybrid PSH-996 (0.42 bees). Hybrids Pioneer 64A57, DK-3849 and SH-3322 (0.69, 0.60 and 0.57 bees) were the most preferred. Hybrids with moderate attractiveness included HSFH 848 (0.55) and HSFH 1183 (0.51 bees). Present studies thus, clearly indicated relatively higher preference of honey bees to the hybrids but remains mute to the phenomenon of non extraction of honey from these present day hybrids, indicating vividly the role of some other factors.
REFERENCE [1] Klein A M, Vaissière B E, Cane J H, Steffan-Dewenter I, Cunnigham S A, Kremen C and Tscharntke T 2007. Importance of pollinators in
changing landscapes for world crops. Proceedings of the Royal Society 274: 303–313.
It is I
LLEGAL t
o cop
y, pri
nt or
save
any c
onten
t of th
is PDF,
in pa
rt or in
full,
on an
y retr
ieval
syste
m,
withou
t the E
XPRESS WRITTEN PERMISSIO
N of th
e cop
yrigh
t-hold
er

National Conference on Climate Change and Agricultural Production: Adapting Crops to Climate Variability and Uncertainty, 6th–8th April, 2017
[320]
High Frequency Multiple Shoot Differentiation from Cultured Seeds of Rice Cultivars
Rima Kumari*, Pankaj Kumar, V.K. Sharma and Harsh Kumar Department of Agricultural Biotechnology and Molecular Biology,
Dr. Rajendra Prasad Central Agricultural University, Pusa, Samastipur–848125, India E-mail: *[email protected]
Keywords: Rice, Shoot differentiation, Rice
INTRODUCTION
Efficient multiple shoot regeneration from cultured cells and tissues requires successful application of biotechnology in crop improvement. The frequencies of callus induction and multiple shoot differentiation in tissue culture of rice are influenced by many factors: culture medium composition, explants source, genotype and environment (Torbert et al., 1998). It is to be noted here that many agronomical valuable rice genotypes are recalcitrant to in vitro manipulation because of their poor callus production and regeneration ability. The problem of shoot regeneration has also been encountered during plant regeneration experiments. Objective of this research paper: High frequency multiple shoot differentiation can facilitatethe improvement of the improvement of plant/crop through somacolna variation. These multiple shoot buds can also be used for as initial explant for desired genetic transformation and transgenic development.
MATERIALS AND METHODS
The experiment was conducted at Dr. Rajendra Prasad Central Agricultural University, Pusa (Samastipur) during 2016. Seeds of four rice cultivars namely MTU-7029, Narendra Usar Dhan-3, Rajendra Bhagwati and CSR-30 were tissue cultured on selected medium. Overnight soaked seeds were dehusked, sterilized and inoculated on selected medium under laminar air flow.Seeds were cultured on callusing medium, incubated and maintained at optimum conditions. The calluses of four cultivars were subcultured on regenerating medium. The main responses of 4 cultivars of rice were observed at regular intervals with respect to the frequencies of establishment of aseptic cultures, callus formation, differentiation of shoots and roots.
RESULTS AND DISCUSSION
Plant tissue culture is an important aspect of plant biotechnology and it has led to the development of many varieties of crop plant particularly rice, that are being grown in large areas of the world. One of the important mechanism by which these varieties were developed, is somaclonal variations, which are the variations among regenerated plants in tissue culture. It has provided a novel method for producing variations and selecting the variations at the cell, tissue, organ or the plant level for the desired characters required ultimately for the plant improvement. Tissue culture technique thus can be used for developing stress tolerance, crop plants including rice. Somaclonal variations are more when the plants are regenerated through callus phase. Seeds of the four selected cultivars of rice when cultured on callusing medium (MS + 2.0 mg l-12,4-D) showed callus formation. These cultivars also showed multiple shoot differentiation when formed calluses were subcultured on regeneration medium (MS + 1.5 mgl-1NAA + 1.5mgl-1 KIN). On the basis of callus formation and multiple shoot differentiation of cultured seeds cvs. Rajendra Bhagwati and CSR-30 showed high frequency of multiple shoot and root differentiation followed by cvs. MTU-7029 and Narendra Usar Dhan-3.
REFERENCE [1] Torbert KA, Rines HW and Somers DA 1998. Transformation of oat using mature embryo-derived tissue cultures. Crop Science
38: 226-231.
It is I
LLEGAL t
o cop
y, pri
nt or
save
any c
onten
t of th
is PDF,
in pa
rt or in
full,
on an
y retr
ieval
syste
m,
withou
t the E
XPRESS WRITTEN PERMISSIO
N of th
e cop
yrigh
t-hold
er

National Conference on Climate Change and Agricultural Production: Adapting Crops to Climate Variability and Uncertainty, 6th–8th April, 2017
[321]
Effect of Compaction Levels and Integrated Nutrient Management on Growth and Yield of Chickpea (Cicer arietinum L.)
Sumant Kumar1, Md. Sarware Alam2*, Mohmmad Amin Bhat2, Pradyuman Singh3and Arun A. David1
1Department of Soil Science, Allahabad School of Agriculture, Sam Higginbottom Institute of Agriculture, Technology & Sciences Allahabad–210007, India
2Department of Soil Science, CCS Haryana Agricultural University, Hisar–125004, India 3Department of Forestry, CCS Haryana Agricultural University, Hisar–125004, India
E-mail: *[email protected]
INTRODUCTION
Soil compaction has profound impact on agricultural sustainability through its influence on soil properties and crop development (Rahman et al., 2005). Soil compaction alters the function of soil to hold water, reduces infiltration rate and saturated hydraulic conductivity and enhances penetration resistance (Shafiq et al., 1994). Integrated nutrient management (INM) is very imperative in crop production. Several production problems (increasing cost, declining yield) can be marked out to inappropriate and ineffective use of nutrients. The INM takes into account the nutrient cycling in soils, crops and livestock, nutrient deficiencies, organic recycling, conjunctive use of organic manures and mineral fertilizers and biological nitrogen fixing potential (Kumar and Sreenivasulu, 2004; Sohu et al., 2015). The present study was undertaken to evaluate the influence of compaction levels and INM on growth and yield of chick pea.
MATERIALS AND METHODS
This experiment was conducted during Rabi season at crop research farm of the Department of Soil Science, Sam Higginbottom Institute of Agriculture Technology & Sciences, Allahabad. The experiment was laid out in randomized block design with three replications with eight treatments. The growth characters plant height (cm), number of branches per plant; yield attributes number of pods per plant, 1000-seed weight and yield (kg ha-1) was recorded.
RESULTS AND DISCUSSION
The growth, yield attributes and yield of chick pea were significantly influenced by different treatments. Among the treatments, T5 produced significantly highest plant height (45.11 cm), number of branches per plant (18.44), number of pods plant-1 (18.99), and 1000 seed weight (26.88 g). Similarly, highest grain yield (404.33 q/ha) was reported in T5. The increase in all the parameters in T5 may be ascribed to the higher nutrient availability and uptake n this treatment. Moreover, the compaction of the soils has improved the physical properties which resulted in higher values of these parameters in this treatment.
It is I
LLEGAL t
o cop
y, pri
nt or
save
any c
onten
t of th
is PDF,
in pa
rt or in
full,
on an
y retr
ieval
syste
m,
withou
t the E
XPRESS WRITTEN PERMISSIO
N of th
e cop
yrigh
t-hold
er

National Conference on Climate Change and Agricultural Production: Adapting Crops to Climate Variability and Uncertainty, 6th–8th April, 2017
[322]
Table 1: Effect of Compaction and Integrated Nutrient Management on Growth and Yield Parameters of Chick Pea
Treatments Plant height at Harvest (cm)
Number of Branches per
Plant at Harvest
Number of Pods per Plant
1000 Seed Weight (g)
Grain Yield (q/ha)
T0=C0I0 30.33 13.77 13.77 24.58 361.33 T1=C0I1 45.10 16.10 14.55 25.73 298.00 T2=C0I2 43.44 18.33 17.44 24.85 399.33 T3=C1I0 41.10 16.10 17.10 25.06 334.00 T4=C1I1 43.33 18.35 18.33 25.25 353.66 T5=C1I2 45.11 18.44 18.99 26.88 404.33 T6=C2I0 44.77 16.44 15.44 24.51 344.33 T7=C2I1 44.11 16.77 15.33 26.55 316.66 T8=C2I2 43.99 18.10 17.77 26.01 332.00 CD (0.05) 2.004 1.453 1.152 1.152 4.102
REFERENCES [1] Kumar B V and Sreenivasulu M 2004. Integrated nutrient management. Sci Tech: The Hindu, online Edition of India’s National
Newspaper, Thursday 12th August, 2004. [2] Rahman M H, Hara M and Hoque S 2005.Growth and Nutrient Uptake of Grain Legumes as Affected by Induced Compaction in
Andisols. International Journal of Agriculture & Biology 7 (5):740-743. [3] Shafiq M, Hassan A and Ahmad S 1994. Soil physical properties as influenced by induced compaction under laboratory and field
conditions. Soil & Tillage Research 29: 13-22. [4] Sohu I A W, Gandahi G R, Bhutto G R, Sarki M S and Gandah R 2015. Growth and yield maximization of chickpea (Cicer arietinum)
through integrated nutrient management applied to rice-chickpea cropping system. Sarhad Journal of Agriculture 31 (2): 131-138.
Effect of Various Herbicide Molecules on Weed Management in Indian Mustard (Brassica juncea L. Czern & Coss)
A.K. Yadav1*, R.S. Kureel1, V. K. Verma2, Tej Pratap1 and S. K. Dubey1 1Department of Agronomy, N.D. University of Agriculture & Technology, Faizabad–224229, India
2Department of Agronomy, Institute of Agricultural Sciences, Banaras Hindu University, Varanasi–221005 E-mail: *[email protected]
Keywords: PE- Pre-emergence, PPI- pre-plant incorporation, PoE- Post-emergence.
INTRODUCTION
Rapeseed-mustard (Brassica juncea L.) is an important group of oilseed crops occupying premier position in oilseed economy of India. It is becoming desirable edible oil and is also most common medium of pickling and food preserving. Weed infestation is one of the major causes of low productivity and causes 25-45 per cent yield reduction, depending on the type of weed flora and their intensity, stage, nature and duration of crop-weed competition (Singh et.al., 2001). The traditional methods of weed control (mechanical & manual) are highly laborious, expensive, intensive, insufficient and may cause the damage to the crop. As an alternative method, Chemical weed control has been found very effective to control the weeds in Indian mustard (Tiwari and Kurchania 1993).
MATERIALSAND METHODS
The field experiment was conducted during rabi season at Agronomy Research Farm of N.D. University of Agriculture and Technology, Narendra Nagar (Kumarganj), Faizabad (U.P.), India.The experiment was laid
It is I
LLEGAL t
o cop
y, pri
nt or
save
any c
onten
t of th
is PDF,
in pa
rt or in
full,
on an
y retr
ieval
syste
m,
withou
t the E
XPRESS WRITTEN PERMISSIO
N of th
e cop
yrigh
t-hold
er

National Conference on Climate Change and Agricultural Production: Adapting Crops to Climate Variability and Uncertainty, 6th–8th April, 2017
[323]
out in RBD with three replications, having ten number of treatments Viz. Pendimethalin 1000 g ha-1 (PE), Oxadiargyl 90 g ha-1 (PE), Trifluralin 750 g ha-1 (PPI), Oxyfluorfen 150 g ha-1(PE), Quizalofop 60 g ha-1(PoE) Clodinafop 60 g ha-1 (PoE), Isoproturon 1000 g ha-1 (PE), Isoproturon 1000 g ha-1 (PoE) with weedy and weed free check. The treatments were executed as pre-emergence, pre-plant incorporation, and post-emergence to weeds with the help of manually operated knapsack sprayer fitted with flat fan nozzle using 600 litres of water ha-1. The crop was sown on 30th Oct. 2011 and harvested on 10th March 2012.
RESULTS AND DISCUSSION
Weed density of different weed species and total weeds were affected significantly due to different herbicide treatments (Table-1).Oxadiargyl 90 g and Pendimethalin 1000 g were found being at par to each other in case of lower density of C. album over rest of the treatments, whereas lowest and highest density of C. album was recorded with weed free and weedy treatments, respectively. In case of A. arvensis, significantly lower density was recorded with Oxadiargyl 90 g, Pendimethalin 1000 g and Trifluralin 750 g being at par recorded significantly superior over rest of the herbicidal treatments. Significantly lower density of P. minor was recorded with Oxadiargyl 90 g being at par with Pendimethalin 1000 g over rest of the treatments’ except Quizalofop and Clodinafop 60 g ha-1 each. The density of C.dactylon did not differ significantly due to any of the weed control treatment. However, lowest density was recorded with weed free check. Similar type of trend was observed in case of C. rotundus also.It is concluded that the Pre-emergence application of Oxadiargyl 90 g ha-1was found more effective to control the weeds in mustard crop and achieved higher seed and stover yields as compared to rest of the treatments.
Table 1: Effect of Weed Control Treatments on Weed Density (No. m-2) of Different Weed Species at 60 DAS of Mustard Crop
Treatments BLWs Grassy Weeds Sedge Others Total C. album A. arvensis Phalaris
minor Cynodon dactylon
Cyperus rotundus
Pendimethalin 1000 g ha-1 (PE) 3.07 (8.95)
3.27 (10.23)
2.65 (6.80)
2.79 (7.30)
4.33 (18.30)
2.59 (6.20)
7.61 (57.51)
Oxadiargyl 90 g ha-1 (PE) 2.82 (7.50)
3.01 (8.60)
2.41 (5.36)
2.75 (7.10)
4.23 (17.50)
2.30 (4.80)
7.15 (44.86)
Trifluralin 750 g ha-1 (PPI) 3.45 (11.45)
3.42 (11.20)
3.20 (9.78)
2.73 (6.98)
4.27 (17.80)
2.61 (6.30)
7.99 (63.51)
Oxyfluorfen 150 g ha-1 (PE) 3.67 (12.95)
3.83 (14.20)
3.48 (11.65)
2.90 (7.90)
4.36 (18.50)
2.23 (9.35)
8.69 (75.13)
Quizalofop 60 g ha-1 (POE) 5.83 (33.56)
7.35 (53.66)
2.95 (8.20)
2.67 (6.65)
4.45 (19.29)
5.31 (27.72)
12.22 (149.08)
Clodinafop 60 g ha-1 (POE) 5.68 (31.77)
7.22 (51.63)
2.88 (7.78)
2.73 (6.95)
4.28 (17.79)
5.10 (25.53)
11.91 (141.45)
Isoproturon 1000 g ha-1 (PE) 5.23 (26.86)
6.77 (45.47)
4.23 (17.44)
2.79 (7.28)
4.31 (18.15)
4.90 (23.54)
11.79 (138.74)
Isoproturon 1000 g ha-1 (POE) 4.67 (21.42)
6.31 (39.44)
3.20 (9.80)
2.73 (6.98)
4.47 (19.58)
4.60 (20.69)
10.86 (117.91)
Weedy 6.17 (37.60)
7.73 (59.32)
5.97 (35.13)
2.97 (8.30)
4.55 (20.16)
6.33 (39.60)
14.16 (200.11)
Weed free 0.71 (0.00)
0.71 (0.00)
0.71 (0.00)
0.71 (0.00)
0.71 (0.00)
0.71 (0.00)
0.71 (0.00)
C.D. (p=0.05) 0.35 0.43 0.26 0.23 0.37 0.31 0.82 Figures in the parenthesis are the original value
Transformed by 0.5x ).
REFERENCES [1] Singh Harphool, Singh B P and Prasad Hanuman 2001. Weed management in Brassica species.Indian Journal of Agronomy
46 (3): 533- 537. [2] Tiwari J P and Kurchania S P 1993. Chemical control of weeds in Indian mustard (Brassica juncea L.).Indian Agricultural Sciences63(5): 272-
275.
It is I
LLEGAL t
o cop
y, pri
nt or
save
any c
onten
t of th
is PDF,
in pa
rt or in
full,
on an
y retr
ieval
syste
m,
withou
t the E
XPRESS WRITTEN PERMISSIO
N of th
e cop
yrigh
t-hold
er

National Conference on Climate Change and Agricultural Production: Adapting Crops to Climate Variability and Uncertainty, 6th–8th April, 2017
[324]
Evaluation of Different Substrates for cultivation of ‘Pink Pleurotus’ (Pleurotus djamor (Rumph. EX. FR.) Boedijn) Mushroom
Shazia Paswal1*, Seethiya Mahajan2, Varsha bharti3 and Richa Sharma4 1,3Sher-e-Kashmir University of Agricultural Sciences and Technology, Shalimar–199025, India
2,4Sher-e-Kashmir University of Agricultural Sciences and Technology, Chatha, Jammu–180009, India E-mail: *[email protected]
Keywords: Evaluation of substrates, Mushroom, Pink pleurotus, Pleurotus djamor
INTRODUCTION
Mushrooms often called as ‘Queen of vegetables’, are in fact a group of higher fungi, belonging to the class Basidiomycetes or Ascomycetes. More than 2000 edible mushrooms have been reported throughout the world while in India 283 have been recorded and eight are being cultivated commonly. ‘Pink Pleurotus’is edible mushroom containing high protein and low fats, essential amino acids, vitamins and mineral elements needed by human body. Mushrooms are commonly grown on pasteurized wheat or rice straw. However, they can be cultivated on a wide variety of lignocellulosic substrates, playing an important role in managing organic wastes whose disposal could otherwise be problematic
MATERIALS AND METHODS
The procedure described by Patil (2012) was followed for substrate preparation. Each substrate was chopped into 2 to 3cm pieces and separately soaked in water overnight. The substrates were then separately dipped in hot water for 30 minutes for sterilization. The substrates were taken out of hot water and squeezed lightly by hands to remove excess of water.Two kilograms (on dry weight basis) of each substrate was then filled in polythene bags (35 × 45cm) and pressed gently.
RESULTS AND DISCUSSION
Commonly available substrates viz., paddy straw, wheat straw, oats straw, apple leaves, poplar leaves and chinar leaves were evaluated for cultivation of ‘Pink Pleurotus’ mushroom. The parameters viz., complete spawn run, sporocarp initiation, first flush/harvest, number of sporocarps, weight of sporocarp, total yield, number of flushes, duration of crop, organoleptic rating and benefit cost ratio were investigated. In general, the straw substrates viz., paddy straw, wheat straw and oat straw were found superior than leafy substrates (apple, chinar and popular leaves). Paddy straw were most efficient and took minimum time (12.60 days) for complete spawn run, sporocarp initiation (14.60 days) and first flush (19.70 days) while maximum time for complete spawn run (21.40 days), sporocarp initiation (25.00 days) and first flush (28.40 days) was recorded in chinar leaves. The yield and benefit cost ratio of straw substrates was found higher than leafy substrates. Paddy straw resulted in highest yield (1500 g) and benefit cost ratio (2.00:1) followed by wheat straw which produced a yield of 1353.69 gram and resulted in benefit cost ratio of 1.52
Table 1: Effect of Different Substrates on Biological Efficiency, Yield and Benefit: Cost Ratio Substrates Biological Efficiency (%) Yield (kg/q) Benefit:
Cost Ratio Paddy straw 75.00 75.02 2.00:1 Oats straw 51.95 51.98 1.30:1 Apple leaves 47.15 47.19 1.44:1 Chinar leaves 26.20 26.20 1.00:1 Poplar leaves 44.59 44.59 1.31:1 Wheat straw (check) 67.68 67.68 1.52:1 C.D (p≤0.05) 0.005 0.456
REFERENCE [1] Patil S.S. 2012. Cultivation of Pleurotus sajor-caju on different agro wastes. Science Research Reporter 2 (3): 225-228.
It is I
LLEGAL t
o cop
y, pri
nt or
save
any c
onten
t of th
is PDF,
in pa
rt or in
full,
on an
y retr
ieval
syste
m,
withou
t the E
XPRESS WRITTEN PERMISSIO
N of th
e cop
yrigh
t-hold
er

National Conference on Climate Change and Agricultural Production: Adapting Crops to Climate Variability and Uncertainty, 6th–8th April, 2017
[325]
Evaluating Physico-Chemical Attributes Among Different Cultivars of Litchi Grown Under South Zone of Bihar
Pushpa Kumari1*, Kalyan Barman2, Muneshwar Prasad1 and M. Feza Ahmad1
1Department of Horticulture (Fruit and Fruit Technology), Bihar Agricultural University, Sabour–813210, Bhagalpur, India
2Department of Horticulture, Institute of Agricultural Sciences, Banaras Hindu University, Varanas–221005, India
E-mail: *[email protected]
Keywords: Litchi, Cultivars, Morphology, Fruit quality
INTRODUCTION
Litchi (Litchi chinensis Sonn.) is an evergreen subtropical fruit crop, belongs to family sapindaceae. It has good trade value due to fleshy juicy aril, refreshing taste and more nutritive value. Among different litchi growing state, Bihar leads in litchi production, covering 37.4% of total area and 40.0% of total production (Anonymous, 2014). Due to varying climatic condition and genetic constitution, physico-chemical attributes and sensory quality of fruit might be varied among different cultivar. Keeping in view, the objective of my research work was to evaluate different physico-chemical parameter among different cultivar of litchi grown under south zone of Bihar.
MATERIALS AND METHODS
In this study, fourteen litchi cultivars were harvested at ripe stage from the orchard of Horticulture Garden, Bihar Agricultural University, Sabour, Bhagalpur, Bihar. The litchi cultivars selected for the study were Purbi, China, Dehradun, Dehra Rose, Rose Scented, Shahi, Deshi, Kasba, Bombay, Bedana, Muzaffarpur, Large Red, Ajhouli and Green. In this, all fourteen litchi cultivars were evaluated for different physico-chemical attributes viz. fruit length, width, total fruit weight, peel, pulp and seed weight, total soluble solids, titratable acidity, TSS: acid ratio and pH.Data analysis were performed under completely randomized design with three replications, using univariate analysis of variances and means to compare the data using Duncan’s multiple range test. The statistical analysis software, SAS 9.2 was used to conduct the analysis.
RESULTS AND DISCUSSION
Results showed a significant variation in physico-chemical attributes among different cultivars of litchi. The total soluble solids and titratable acidity among cultivars varied between 19.17 and 23.33°Brix & 0.40 and 0.87%, respectively while, TSS: acid ratio ranged from 25.27 – 61.51 and the pH value ranged between 3.28 and 4.79. The length and width of fruit varied between 3.06 – 3.63 cm and 2.72 – 3.37 cm, respectively. The weight of fruit, peel, pulp and seed ranged from 16.40 – 23.42g, 1.93 – 3.53 g, 16.63 – 10.84 g and 1.35 – 4.25 g, respectively among the assessed cultivar. Total soluble solids content and titratable acidity in six litchi cultivars (Dehradun, Early Seedless, Rose Scented, Shahi, Green and Dehra Rose) were varied from 13.5 – 17.3°Brix and 0.67 – 1.07% respectively. (Nath et al., 2015). In five cultivars of litchi viz. Purbi, Bedana, Bombai, Serai and Gola, weight of fruit varied between 11.57 and 17.02 g, pulp content between 7.07 and 10.61 g, peel weight from 1.40 – 2.66 g and seed weight from 3.13 – 3.79 g (Waseem et al., 2002). These variations might be due to changes in environmental factors and genetic makeup among litchi cultivars.Fourteen cultivars of litchi grown under south zone of Bihar, showed significant variation with respect to total physical and biochemical attributes. Bombay Cultivar of litchi showed maximum fruit weight
It is I
LLEGAL t
o cop
y, pri
nt or
save
any c
onten
t of th
is PDF,
in pa
rt or in
full,
on an
y retr
ieval
syste
m,
withou
t the E
XPRESS WRITTEN PERMISSIO
N of th
e cop
yrigh
t-hold
er

National Conference on Climate Change and Agricultural Production: Adapting Crops to Climate Variability and Uncertainty, 6th–8th April, 2017
[326]
while maximum pulp content and minimum seed weight was noted in cv. Bedana. Maximum TSS: acid ratio was recorded in cv. Rose Scented.
REFERENCES [1] Anonymous 2014. Indian Horticulture Database. National Horticulture Board, Gurgaon, Haryana. [2] Nath V, Kumar A, Pandey S D and Tripathi P C 2015. Litchi in winter season- a way forward. Indian Horticulture60(2): 26-27. [3] Waseem K, Ghaffoor A and Rehman S U 2002. Effect of fruit orientation on the quality of litchi (Litchi chinenesis Sonn.) under the agro-climatic
conditions of Dera Ismail Khan–Pakistan. International Journal of Agricultural Biology 4(4): 503-505.
Genotypic Variation of Grain Iron Contents and Agronomic Traits in Rice under Iron Treatment
Ritu Saini*1, Anjali Dahiya1, Harnek Singh Saini1, Sandeep Gupta2 and Sunita Jain3
1Department of Biotechnology Engineering, University Institute of Engineering and Technology Kurukshetra University, Kurukshetra–136119, India
2Department of Animal Biochemistry and Physiology, Lala Lajpat Rai University of Veterinary and Animal Sciences, Hisar–125004, India
3Department of Molecular Biology, Biotechnology and Bioinformatics, CCS Haryana Agricultual University, Hisar–124004, India
E-mail: *[email protected]
Keywords: Rice, Iron, Grains, Agronomic traits, Yield
INTRODUCTION
Rice (Oryza sativa L.) is one of the main staple food crops which is inherently low in micronutrients, especially iron (Fe), and can lead to severe Fe deficiency in populations having higher consumption of rice (Wang et al., 2013). Iron acts as cofactor for many enzymes which is involved in a number of physiological processes both in plants and animals (e.g., respiration, photosynthesis, and oxygen transport) that are impaired under Fe deficiency. Genotypic variation in grain iron concentrations has been extensively studied among rice varieties [Gregorio, 2002]. Rice grain yield is determined by plant height, effective number of tillers, number of panicles, panicle length, number of grains per panicle, spikelet fertility, and total grain weight(Kim et al., 2011). Both deficiency and excess of nutrients may equally result in drastic reductions in grain production (Muller et al., 2015).Thus, the objective of this study was to evaluate the genotypic variation for agronomic characteristics and for the contents of Fe in grains of six rice varieties.
MATERIAL AND METHODS
The rice crop was raised during kharif seasons of 2013-2014 and 2014-2015 in net house of Department of Chemistry and Biochemistry, CCS HAU, Hisar. Seeds of six rice varieties were sown directly in pots and the pots were divided in three sets after 20 days of sowing and following treatment were given: One set was given Yoshida nutrient medium without Fe (0 mM EDTA-Fe(II)). Second set was given Yoshida nutrient medium with 0.1mM EDTA-Fe(II)) concentration. Third set was given Yoshida nutrient medium with high Fe concentration (0.5 mM EDTA-Fe (II)). Iron content of of grains was analyzed at maturity in all the six varieties of rice by using Atomic Absorption Spectrophotometery according to the method of Lindsey and Norwell (1978). Calibrations were done with the standard solutions of 1, 3 and 5 ppm iron. After the crop was matured in pots, 12 plants grown under each iron treatment were randomly selected and observations were recorded and data subsequently was analyzed to determine the variability on the plant height (cm),effective
It is I
LLEGAL t
o cop
y, pri
nt or
save
any c
onten
t of th
is PDF,
in pa
rt or in
full,
on an
y retr
ieval
syste
m,
withou
t the E
XPRESS WRITTEN PERMISSIO
N of th
e cop
yrigh
t-hold
er

National Conference on Climate Change and Agricultural Production: Adapting Crops to Climate Variability and Uncertainty, 6th–8th April, 2017
[327]
number of tillers per plant, grain yield per plant (g), grains per panicle, panicle length (cm), 1000-grain weight (g) at maturity. The data obtained in the present investigation was subjected to analysis of variance (ANOVA) technique and thus analyzed according to two/three factorial completely randomized designs. The critical difference value at 5% level was used for making comparison among various rice varieties grown under different iron treatments and at all the stages. OP stat was used to analyze experimental results statistically.
RESULTS AND DISCUSSION
Iron content in dehusked rice grains varied significantly between 27.63 (Govind) - 235.37 �g/g (Palman579) under control conditions (no additional Fe added in soil). Grain iron content increased linearly with increasing iron treatments in all the six varieties. In the present investigation, at 0.1 mM Fe treatment compared to control (no additional iron in the soil), the agronomic characteristics viz. plant height, effective tiller number, panicle length, grains/panicle, grain yield/plant and 1000 grain weight, increased maximally in all the six rice varieties.
REFERENCES [1] Gregorio G B 2002. Progress in breeding for trace minerals in staple crops. Journal of Nutrion 132: 500-502. [2] Kim J, Shon J, Lee CK, Yang W, Yoon W, Yang WH, Kim YG and Lee BW 2011. Relationship between grain filling duration and leaf
senescence of temperate rice under high temperature. Field Crops Research 122: 207-213. [3] Lindsay WL and Norwell W R 1978. Development of DTPA soil test for zinc, iron, manganese and copper. Soil Science Society of
America Journal 42: 421-428. [4] Muller C, Kuki KN, Pinheiro DT, de Souza LR, Silva AIS, Loureiro ME, Oliva M A and Almeida A M 2015. Differential physiological
responses in rice upon exposure to excess distinct iron forms. Plant Soil 391: 123-138. [5] Wang M, Gruissem W and Bhullar N K 2013. Nicotianamine synthase overexpression positively modulates iron homeostasis-related genes
in high iron rice. Frontiers of Plant Science 4: 156.
Genetic Architectural Improvement for Yield and Yield Attributes in Elite Genotypes of Bitter Gourd (Momordica charantia L.)
Durga Prasad Moharana*, M.M. Syamal and Anand Kumar Singh
Department of Horticulture, Institute of Agricultural Sciences, Banaras Hindu University, Varanasi–221005, India
E-mail: *[email protected]
Keywords: Bitter gourd, Phenotypic coefficient of variation, Heritability, Genetic advance
INTRODUCTION
Bitter gourd (Momordica charantia L., 2n=2x=22) is one of the prime crop belonging to the cucurbitaceae family. Genetic variability forms the basis for crop improvement. Genotypic and phenotypic coefficients of variation are useful in detecting the amount of variability present in the available genotypes. Study of variability, heritability and genetic advance in the germplasm will help to ascertain the real potential value of the genotypes.
It is I
LLEGAL t
o cop
y, pri
nt or
save
any c
onten
t of th
is PDF,
in pa
rt or in
full,
on an
y retr
ieval
syste
m,
withou
t the E
XPRESS WRITTEN PERMISSIO
N of th
e cop
yrigh
t-hold
er

National Conference on Climate Change and Agricultural Production: Adapting Crops to Climate Variability and Uncertainty, 6th–8th April, 2017
[328]
MATERIALS AND METHODS
The present experiment was conducted at Vegetable Research Farm, Department of Horticulture, Institute of Agricultural Sciences, Banaras Hindu University, Varanasi during Kharif season of 2014. The experimental farm comes under the Indo-Gangetic alluvial track of eastern Uttar Pradesh. The experiment was laid out with 20 genotypes in randomized complete block design in three replications. The unit plot size was 5 m2 (2.5 X 2 m). The plants were planted on the ridges of the row with a spacing of 2 m between the rows and 0.5 m between the plants.
RESULTS AND DISCUSSION
Table 1: Estimates of Mean, Range, Variability, Heritability and Genetic Advance as Per cent of Mean for 15 Characters in 20 Genotypes of Bitter Gourd
Sl.
No
.
Cha
ract
er
Ran
ge
Min
.– M
ax.
Gen
eral
M
ean
Phe
noty
pic
Var
ianc
e
Gen
otyp
ic
Var
ianc
e
Phe
noty
pic
Coe
ffic
ient
of
V
aria
tion
Gen
otyp
ic
Coe
ffic
ient
of
V
aria
tion
Her
itab
ilit
y in
Bro
ad
Sen
se (
h2b)
Gen
etic
A
dvan
ce a
s %
of
Mea
n
1. Node number of first staminate flower appearance
7.58 - 16.32 12.15 7.24 6.30 22.14 20.66 0.87 39.70
2. Node number of first pistillate flower appearance
12.50 – 23.15 19.36 10.43 8.15 16.68 14.75 0.78 26.85
3. Days to anthesis of first staminate flower
37.33 – 54.00 48.08 26.95 23.01 10.80 9.98 0.85 18.99
4. Days to anthesis of first pistillate flower
47.33 – 60.67 55.27 21.96 17.22
8.34
7.51 0.81 13.92
5. Days to 50% flowering 52.23 – 70.74 64.91 29.25
21.99
8.33
7.22 0.75 12.90
6. Days to first harvest 61.17 – 81.53 73.28 34.37
26.35
8.00 7.01 0.77 12.64
7. Number of primary branches per plant
6.63 – 10.49 8.70 2.38 1.55 17.73 14.32 0.65 23.83
8. Vine length (m) 1.76 – 3.09 2.58 0.16 0.13 15.70 13.83 0.78 25.09 9. Internodal length (cm)
4.61 – 6.83 5.54 0.36 0.31 10.86 9.97 0.84
18.86
10. Fruit length (cm) 7.42-16.04 11.88 5.29 3.32 19.37 15.35 0.63 25.04 11. Fruit circumference (cm) 7.98-13.56 11.03 4.44 3.39 19.10 16.68 0.76 30.00 12. Fruit diametre (cm) 2.98-4.76 3.71 0.23 0.18 13.08 11.43 0.76 20.57 13. Average fruit weight (g) 23.67-63.39 40.48 146.36 130.02 29.89 28.17 0.89 54.69 14. Number of fruits per
plant 10.44-25.31 16.70 18.62 12.86 25.83 21.47 0.69 36.75
15. Yield per plant (kg) 0.34-1.23 0.73 0.07 0.06 36.47 33.73 0.86 64.26
Analysis of Variance revealed significant differences among the genotypes for all fifteen traits. The mean performance of tested genotypes for different yield and yield attributes are presented. Yield is the character of utmost importance which decides the commercial acceptability of the variety; hence, the trait deserves highest consideration in any crop improvement programme. The extent of variability present in bitter gourd genotypes was measured in terms of mean, range, phenotypic variance, phenotypic coefficient of variation (PCV), genotypic variance, genotypic coefficient of variation (GCV), heritability (broad sense), genetic advance (GA) and genetic advance as per cent of mean in Table 1. The highest phenotypic coefficient of variation was observed for yield per plant i.e. 36.47 followed by average fruit weight (g), number of fruits per plant and number of first staminate flower appearance. The highest genotypic coefficient of variation was observed for yield per plant i.e. 33.73 followed by average fruit weight (g), number of fruits per plant and
It is I
LLEGAL t
o cop
y, pri
nt or
save
any c
onten
t of th
is PDF,
in pa
rt or in
full,
on an
y retr
ieval
syste
m,
withou
t the E
XPRESS WRITTEN PERMISSIO
N of th
e cop
yrigh
t-hold
er

National Conference on Climate Change and Agricultural Production: Adapting Crops to Climate Variability and Uncertainty, 6th–8th April, 2017
[329]
number of first staminate flower appearance. High heritability accompanied with high genetic advance as per cent of mean was found for average fruit weight (88.83, 54.69), yield per plant (85.52, 64.26), node number of first staminate flower appearance (87.02, 39.70), node number of first pistillate flower appearance (78.14, 26.85), vine length (77.59, 25.09), number of fruits per plant (69.06, 36.75), number of primary branches per plant (65.25, 23.83) and fruit length (62.74, 25.04).
REFERENCE [6] Yadav M, Pandey T K, Singh D B, and Singh G K 2013. Genetic variability, correlation coefficient and path analysis in bitter gourd.
Indian Journal of Horticulture 70 (1): 144-149
Integrated Nutrient Management in Rice (Oryza Sativa) in red and lateritic soils of West Bengal
Gayatri Sahu, Nitin Chatterjee and Goutam Kumar Ghosh*
Soil Scienceand Agricultural Chemistry, Institute of Agriculture, Visva-Bharati University, Sriniketan, India
E-mail: *[email protected]
Keywords: Rice, Integrated Nutrient Management, Yield
INTRODUCTION
In India rice is grown under widely varying conditions of altitude and climate. Nitrogen is considered as the most yield-limiting nutrient in irrigated rice production around the world (Samonte et al., 2006). Sulphur is also an important nutrient for plant growth and its uptake by plants accounts 9 to 15% of N uptake (Inal et al., 2003). Indian farmers apply N, P and K fertilizers widely, it is found that application of micronutrients such as B, Zn, and Mo is not a usual practices. A marked higher incidence of micronutrient deficiency is found in crop due to intensive cropping, loss of fertile top soil and losses of nutrient through leaching (Rahman et al., 2008; Singh et al., 2011; Somani, 2008). So combined application of both macro as well as micro nutrients are beneficial for growth and productivity of rice.
MATERIALS AND METHODS
A field experiment was conducted on sesame during kharif season of 2015 in red and lateritic soils of West Bengal at the Agricultural Farm of Palli Siksha Bhavana (Institute of Agriculture), Visva-Bharati, Sriniketan. The experiment was laid out in randomized block design with 15 treatments. The seed was inoculated properly with the culture of Azotobactor and Azospirillium in case of rice. The available nutrient status of soil, Total uptake of nutrients, Grain yield, Stover yield, Protein content and protein yield was calculated. The soil samples were analyzed in laboratory with their respective procedures. The data collected from the experiment was subjected to statistical analysis as described by Gomez and Gomez.
RESULTS AND DISCUSSION
The result of the study revealed that integrated application of NPK with sulphur, boron, molybdenum, and zinc along with biofertilizer recorded higher grain yield, total biological yield, crude protein content as well as protein yield, nutrient accumulation as well as uptake and maintained soil fertility. Combined application of sulphur, boron, molybdenum, zinc increased the use efficiency of N, P and K. Application of Azotobactor and Azospirillium along with NPK showed higher significant difference in case of growth and yield attributes of
It is I
LLEGAL t
o cop
y, pri
nt or
save
any c
onten
t of th
is PDF,
in pa
rt or in
full,
on an
y retr
ieval
syste
m,
withou
t the E
XPRESS WRITTEN PERMISSIO
N of th
e cop
yrigh
t-hold
er

National Conference on Climate Change and Agricultural Production: Adapting Crops to Climate Variability and Uncertainty, 6th–8th April, 2017
[330]
rice as compared to all other treatments but only application of Azotobactor along with NPK recorded no significant difference in case of growth parameters, yield attributes and uptake of nutrients. The highest value of crude protein content was due to dual application of Azotobactor and Azospirillium along with all inorganic fertilizer including NPK. Integrated nutrient applications are more beneficial when the rate of the nutrient application is below the normal rate. It also improved the crop yields, quality of the produce as well as improves the soil fertility, thus the overall profit of the farmers.
Table 1: Effect of INM Treatments on Rice Yield Treatments 2014-2015
Grain Yield Straw Yield Biological Yield Harvest Index (%) q ha-1
T1- Control 35.20 27.00 62.20 56.55 T2- N80P20K0 44.53 49.73 94.27 47.12 T3- N80P40K0 46.47 50.27 96.73 48.16 T4- N80P20K20 47.20 58.60 105.80 44.68 T5- N80P40K20Mo1.0 48.53 59.47 108.00 44.87 T6- N80P20K40B0.5 49.27 45.87 95.13 52.42 T7- N80P40K40Zn5 50.40 45.80 96.20 52.51 T8- N80P20K60Zn10.5 49.33 53.47 102.80 48.56 T9- N80P40K60Zn21 50.20 63.40 113.60 44.57 T10- N80P20K20+Azotobacter 51.27 73.07 124.33 41.10 T11- N80P20K20 +Azotobacter +Azospirillum 53.60 74.87 113.13 47.71 T12- N80P40K0S10Zn10.5 Mo1.0 53.67 72.60 116.27 47.24 T13- N80P40K0S20Zn21 Mo2.0 55.33 78.80 134.13 41.31 T14- N80P40K0S10Zn10.5 Mo1.0 B0.5 56.87 90.53 147.40 38.60 T15- N80P40K0S10 Zn10.5 Mo1.0 B1.0 57.93 93.47 151.40 38.28 CD(P=0.05) 9.794 15.353 19.204 12.001 CV% 12.48 15.66 11.04 16.53 RBD(0.05) S S S NS
REFERENCES [1] Samonte S.O.P., Wilson L.T., Medley J.C., Pinson S.R.M., McClung A.M. and Lales J S 2006. Nitrogen utilization efficiency; relationships
with grain yield, grain protein, and yield-related traits of rice. Agronomy Journal 98:168-176. [2] Inal A, Gunes A, Alpaaslan M, Adak MS, Taban S and Eraslan F 2003. Diagnosis of sulphur deficiency and effects of sulphur on yield and
yield components of wheat grown in central Anatolia, Turkey. Journal of Plant Nutrition 26: 1483-1498
Climate Resilient Agriculture through Engineering Interventions
Satish Kumar*, Ashok Kumar and Sanoj Kumar Department of Agricultural Engineering,
Bihar Agricultural University, Sabour–813210, Bhagalpur, India E-mail: *[email protected]
Keywords: Green House Gases (GHGs), Pyrolysis, Gasifier, Biochar, Producer Gas
Climate change has undoubtedly resulted in greater in public and scientific involvement. Climate change refers to any change in climate over time, whether due to natural variability or as a result of human activity. The United Nations Framework Convention on Climate Change (UNFCC) defined it as a change of climate that is attributed directly or indirectly to human activity which alters the composition of the global atmosphere and that is in addition to natural climate variability observed over comparable time periods. World Meteorology Organisation defines climate change as statistically significant variation in either the mean state of the climate or in its variability, persisting for an extended period (typically decades or longer).Agriculture releases significant amount of green house gases GHGs to the atmosphere. CO2 is released largely from
It is I
LLEGAL t
o cop
y, pri
nt or
save
any c
onten
t of th
is PDF,
in pa
rt or in
full,
on an
y retr
ieval
syste
m,
withou
t the E
XPRESS WRITTEN PERMISSIO
N of th
e cop
yrigh
t-hold
er

National Conference on Climate Change and Agricultural Production: Adapting Crops to Climate Variability and Uncertainty, 6th–8th April, 2017
[331]
microbial decay or burning of plant litter and soil organic matter (Smith, 2004; Janzen, 2004). CH4 is produced when organic materials decompose in oxygen-deprived conditions, notably from fermentative digestion by ruminant livestock, from stored manures, and from rice grown under flooded conditions (Mosier et al., 1998). N2O is generated by the microbial transformation of nitrogen in soils and manures, and is often enhanced where available nitrogen (N2) exceeds plant requirements, especially under wet conditions (Oenema et al., 2005). With an estimated global emission of non-CO2 GHGs from agriculture of between 5120 Mt CO2-eq/yr in 2005 (Denman et al., 2007) and 6116 Mt CO2-eq/yr (US-EPA, 2006) in 2005, agriculture accounts for 10-12% of total global anthropogenic emissions of green house gases GHGs (CO2, CH4 and NO2). Agriculture contributes about 47% and 58% of total anthropogenic emissions of CH4 and N2O, respectively, with a wide range of uncertainty in the estimates of both agriculture contribution and the anthropogenic total. N2O emissions from soils and CH4 from enteric fermentation constitute the largest sources with 38% and 32% respectively of total non-CO2 emissions from agriculture in 2005 (US-EPA, 2006). Biomass burning (12%), rice production (11%), and manure management (7%) account for the rest. CO2 emissions from agricultural soils are not normally estimated separately, but are included in the land use, land use change and forestry sector (e.g., in national GHG inventories).
Adoption of engineering intervention plays vital role to mitigate climate change and by the use of best practices of polyhouse green house gases in agriculture can be mitigated either by reducing emission or by enhancing removals and avoiding emission. The most prominent options for mitigating GHGs through agriculture and conservation agriculture, organic farming, improved crop and grazing land management (e.g., improved agronomic practices, nutrient use, tillage and residue management), application of bio-char/bio-carbon to soil, restoration of organic soils that are drained for crop production and restoration of degraded lands, improved water and rice management, precision farming for enhanced input use efficiency and agro-forestry; as well as improved livestock and manure management. GHG emission could also be reduced by substituting fossil fuels with energy produced from agricultural feed stocks (e.g., crop residue, dung, energy crops). The crop residues can be gainfully utilized for livestock feed, composting, power generation, bio-fuel production and mushroom cultivation besides several other uses like thatching, mat-making and toy making. Conversion of ligno-cellulosic biomass into alcohol is of immense importance as ethanol can either be blended with gasoline as a fuel extender and octane-enhancing agent or used as a neat fuel in internal combustion engines. Theoretical estimates of ethanol production from different feedstock (corn grain, rice straw, wheat straw, bagasse and saw dust) vary from 382 to 471 ton of dry matter. Bio-oil can be produced from crop residues by the process of fast pyrolysis, which requires temperature of biomass to be raised to 400-500 0C within a few seconds, resulting in a remarkable change in the thermal disintegration process. The crop residues can be used in the gasifiers for ‘producer gas’ generation. One ton of biomass can produce 300 kWh of electricity. The gasification technology can be successfully employed for utilization of crop residues in the form of pellets and briquettes. The generated ‘producer gas’ is cleaned using bio-filters and used in specially designed gas engines for electricity generation. Biochar is a high carbon material produced through slow pyrolysis (heating in the absence of oxygen) of biomass. It is a fine-grained charcoal and can potentially play a major role in the long-term storage of carbon in soil, i.e., C sequestration and GHG mitigation.
REFERENCES [1] Denman K.L., Brasseur G., Ciais P., Cox P.M., Dickinson R.E., Hauglustaine D, Heinze C, Holland E, Jacob D.S.C. and Zhang X 2007.
Coupling between changes in the climate system and biogeochemistry. In: Climate Change 2007. [2] Janzen H H2004. Carbon cycling in earth systems – a soil science perspective.Agriculture, Ecosystems and Environment 104: 399-417. [3] Mosier A R, Duxbury J M, Freney J R, Heinemeyer O, Minami K. and Johnson DE 1998. Mitigating agricultural emissions of methane.
Climate Change 40: 39-80. [4] Oenema O, Wrage N, Velthof G L, Van Groenigen J W, Dolfing J and Kuikman P J 2005. Trends in global nitrous oxide emissions from
animal production systems. Nutrient Cycling in Agro-ecosystems 72: 51-65. [5] Smith P2004. Engineered biological sinks on land. In: Global carbon Cycle. Integrating Humans, Climate and the natural world, C.B.
Field and M.R. Raupach (eds.). SCOPE 62, Island Press, Washington D.C., pp 479-491. [6] US-EPA2006. Global Anthropogenic Non-CO2 Greenhouse Gas Emissions: 1990-2020. United States Environment Protection Agency.
It is I
LLEGAL t
o cop
y, pri
nt or
save
any c
onten
t of th
is PDF,
in pa
rt or in
full,
on an
y retr
ieval
syste
m,
withou
t the E
XPRESS WRITTEN PERMISSIO
N of th
e cop
yrigh
t-hold
er

National Conference on Climate Change and Agricultural Production: Adapting Crops to Climate Variability and Uncertainty, 6th–8th April, 2017
[332]
Transient Allelopathic Propensity of Melia composita Willd. Leaf Litter Allelochemicals on Chickpea (Cicer arietinum L.)
N.S. Thakur*, Dinesh Kumar and R.P. Gunaga Department of Silviculture and Agroforestry,
College of Forestry, Navsari Agricultural University, Navsari–396450, India E-mail: *[email protected]
Keywords: Chickpea, Allelochemicals, Melia, Leaf litter
INTRODUCTION
Although research on allelopathy has been carried out to a great extant, however new tree-crop models are evolving with time and adopted by industry and farmers. Melia composita Willd. (Syn. Melia dubia Cav) is one such multipurpose tree species being preferred by farmers to take large scale plantations with different intercrops (Parthiban et al., 2009). There are no evidences of its allelopathic proclivities. Hence, keeping in view the increasing popularity of M. composita, present study was undertaken to investigate the alleged allelochemicals in leaf litter of M. composita and to investigate its allelopathic nature if any on chickpea.
MATERIALS AND METHODS
Leaf litter chemical compounds of M. composita used in present study, were determined through Gas Chromatography-Mass Spectrometery (GC-MS). The allelopathic effect of leaf litter aqueous extract (25, 50, 75, 100 per cent concentrations and leaf litter quantities (0, 12.5, 25, 37.5 and 50 g/pot) was assessed on germination traits, initial growth and biomass ofchickpea in laboratory and pot culture bioassays. To understand the allelopathic effect of leaf litter on growth, biomass and yield of test crop, separate pot experiment was conducted till crop maturity.
RESULTS AND DISCUSSION
Table 1: Allelopathic Effect of Leaf Aqueous Extract and Leaf Litter of M. composita on Germination Traits, Growth and Biomass of Chickpeain Laboratory and Pot Culture
Treatments Laboratory Bioassay (Aqueous Extract Treatments)
Leaf Litter Treatments Pot Culture Bioassay Till Cop Maturity
Germination (%)*
Shoot Length (cm)
Biomass (g/ Plant)
Germination (%)*
Shoot Length (cm)
Biomass (mg/ Plant)
Plant Height (cm)
Biomass (g/ Plant)
T1 96.00 (80.04) 5.30 54.23 93.20 (75.01) 18.60 97.69 38.04 4.42 T2 86.40 (68.50) 4.80 48.82 85.20 (67.39) 17.10 86.99 36.16 4.03 T3 77.20 (61.52) 3.80 43.10 79.20 (62.86) 16.50 79.84 35.18 4.38 T4 59.60 (52.71) 3.20 37.09 73.20 (58.81) 15.60 75.30 33.96 4.06 T5 59.20 (48.19) 2.60 30.30 65.60 (54.09) 14.60 72.24 34.72 4.31 CD (p=0.05) 5.54 0.18 3.00 2.67 0.67 1.49 N.S. N.S.
*Transformed values; aqueous extract treatments [T1 (0% control), T2 (25%), T3 (50%), T4 (75%), T5 (100%); Leaf litter treatments [T1 (No mulch), T2 (12.5 g), T3 (25 g), T4 (37.5 g), T5 (50 g/pot); G=Germination; DM=Dry Matter
Gas Chromatography Mass-Spectrometry (GCMS) studies revealed that leaf litter of M. composita contained 18 different phytochemicals. Petridish and pot culture bioassays revealed that, the aqueous leaf extract concentrations and leaf litter quantities of M. composita significantly suppressed the germination traits, initial growth and biomass of test crop, relative to control (Table 1). The inhibitory effect gradually increased with increase in extract concentrations or litter leaf litter amount, over the control. Despite validation of
It is I
LLEGAL t
o cop
y, pri
nt or
save
any c
onten
t of th
is PDF,
in pa
rt or in
full,
on an
y retr
ieval
syste
m,
withou
t the E
XPRESS WRITTEN PERMISSIO
N of th
e cop
yrigh
t-hold
er

National Conference on Climate Change and Agricultural Production: Adapting Crops to Climate Variability and Uncertainty, 6th–8th April, 2017
[333]
allelochemicals in M. composita through GC-MS analysis, the leaf litter did not exhibit inhibitory or stimulatory effect on final growth and biomass of both the test crop. This may be attributed to faster mulch decomposition, leaching out of allelo-chemicals due to frequent irrigation done to maintain the moisture in the pots, ephemeral nature of allele-chemicals, loss from soil through volatilization, especially phenolics (Narwal et al. 2011).
REFERENCES [1] Narwal S.S., Pavlovic P. and John J 2011. Forestry and Agroforestry- Research Methods in Plant Science, Vol. 2. Studium Press Houstan
Taxas USA. pp. 249. [2] Parthiban K.T., Bharathi A.K., Seenivasan R., Kamala K. and Rao MG 2009. Integrating Melia dubia in agroforestry farms as an alternate
pulpwood species. APA News 34: 3-4.
Growth and Physiological Parameters of Ocimum spp. under Teak (Tectona grandis L.f.) Ocimum spp. based Silvi-medicinal
and Sole Cropping Systems
Mukesh Kumar1, N.S. Thakur1*, Kirti Bardhan1 and J.B. Bhusara2 1Department of Silviculture and Agroforestry, 2Department of Basic Science and Humanities
1,2College of Forestry, Navsari Agricultural University, Navsari–396450, India E-mail: *[email protected]
Keywords: Agroforestry, Ocimum spp, Tectona grandis, Growth, Chlorophyll, Leaf nitrogen
INTRODUCTION
Today agroforestry is an important tool in combating global challenges (food security, hunger and poverty). Intercropping is considered a practical application of basic ecological principles such as diversity, competition and facilitation (Schoeny et al., 2010). These ecological principles do exist in agroforestry systems and light is the major limiting factor for the growth of understory vegetation in agroforestry system (Suvera et al., 2015). Therefore, the present study was intended to investigate the comparative effect of intercropping and sole cropping systems on growth and some physiological attributes of three Ocimum spp.
MATERIALS AND METHODS
Three Ocimum species namely O. tenuiflorum (O1), O. gratissimum (O2) and O. basilicum (O3) were intercropped Teak (Tectona grandis) plantation. The agroforestry systems so formed were named as silvi-medicinal systems (Tectona grandis+Ocimum spp. =LU1) and sole cropping system (Ocimum spp. in open=LU2). Growth and physiological parameter s were recorded following the standard methodologies.
RESULTS AND DISCUSSION
Growth and physiological attributes were significantly affected due to land use systems. Maximum plant height, no. of leaves per plant, no. of branches per plant and plant spread were recorded under sole cropping system compared to silvi-medicinal system (Table 1). Amongst Ocimum spp., superior plant height, maximum number of branches, leaves per plant and largest plant spread values were recorded for O. tenuiflorum. The specific leaf weight (SLW) was maximum under sole cropping whereas chlorophyll content index and leaf nitrogen was higher under silvi-medicinal system. Among Ocimum species, the maximum leaf area, specific leaf weight, chlorophyll content index and leaf nitrogen content was recorded for O.
It is I
LLEGAL t
o cop
y, pri
nt or
save
any c
onten
t of th
is PDF,
in pa
rt or in
full,
on an
y retr
ieval
syste
m,
withou
t the E
XPRESS WRITTEN PERMISSIO
N of th
e cop
yrigh
t-hold
er

National Conference on Climate Change and Agricultural Production: Adapting Crops to Climate Variability and Uncertainty, 6th–8th April, 2017
[334]
tenuiflorum. There was significant reduction in growth attributes under silvimedicinal land use, however, the chlorophyll content index and leaf nitrogen increased. Among Ocimum spp. growth and physiological attributes of O. gratissimum were better under teak based silvi-medicinal systems, hence this species proved better intercrop with teak.
Table 1: Growth and Physiological Parameter of Ocimum spp. under Teakbased Silvi-medicinal and Sole Cropping Systems
Land Use Systems
Height of Plant (m) Mean Specific Leaf Weight (mg/cm2)
Mean Chlorophyll Content Index (CCI)
Mean
O1 O2 O3 O1 O2 O3 O1 O2 O3
LU1 0.72 0.64 0.68 0.68 2.49 3.02 2.61 2.71 9.96 17.85 7.76 11.86 LU2 0.65 0.54 0.60 0.60 1.76 2.49 1.93 2.06 13.98 21.83 10.79 15.53 Mean 0.69 0.59 0.64 2.13 2.76 2.27 11.97 19.84 9.27 Sources C. D. at 5% C. D. at 5% C. D. at 5% LU 0.048 0.15 0.89 O 0.06 0.181 1.09 LU x O NS NS NS
LU1 = sole crops, LU2 = Teak + Ocimum species, O1 = Ocimum tenuiflorum, O2 = O. gratissimum and O3 = O.basilicum
REFERENCES [1] Suvera A H, Thakur N S and Jha S K 2015. Herbage and essential oil yield of Ocimum spp. intercropped under pongamia pinnata based
silvi medicinal system in Gujarat, India. The Bioscan 10 (1): 81-85. [2] Schoeny AS, Rouault, JF, Lemarchand E and Tivoli B 2010. Effect and underlying mechanism of pea-cereal intercropping on the
epidemic development of ascochyta blight. European Journal of Plant Pathology 126: 317-331.
Inoculation Effects with Penicillium Bilaii on Maize (Zea Mays)
S.S. Walia* and Vikrant Dhawan Department of Agronomy, Punjab Agricultural University, Ludhiana, Punjab–141004, India
E-mail: *[email protected]
Keywords: Cobs, Fungus, Grain, Inoculation, Maize, Penicillium bilaii, Rice
INTRODUCTION
The continuous use of high analysis chemical fertilizers and decreased recycling of crop residues and manures induced several nutrient deficiencies, particularly of micronutrients and is adversely affecting the sustainability of agricultural production. P. bilaii promotes greater phosphate use efficiency, which results in quick emergence, early vigour, greater stress tolerance, and earlier, more even maturity. P. bilaii delivers a safe method of supplying phosphate to growing plants, and reduces the need to seed-place high rates of phosphate fertilizer with sensitive seed like canola, pea, and lentil. P. bilaii is a phosphate inoculants containing the naturally occurring soil fungus P. bilaii, discovered by Agriculture and Agri-Food Canada. It colonises (grows along) plant roots, releasing organic compounds that release the "bound" mineral forms of less available soil and fertiliser phosphate, making it immediately available for the crop to use. Studies have shown that P. bilaii solubilizes more rock phosphate in culture solution than other Phosphorus solubilizing microorganisms (Kucey, 1983; Asea et al., 1988).
MATERIALS AND METHODS
The ½ X, X and 2X rates for maize were 0.502, 1.083 and 2.166 g/kg seed, respectively.. The experiment comprised for the crop with 8 treatments, viz.
It is I
LLEGAL t
o cop
y, pri
nt or
save
any c
onten
t of th
is PDF,
in pa
rt or in
full,
on an
y retr
ieval
syste
m,
withou
t the E
XPRESS WRITTEN PERMISSIO
N of th
e cop
yrigh
t-hold
er

National Conference on Climate Change and Agricultural Production: Adapting Crops to Climate Variability and Uncertainty, 6th–8th April, 2017
[335]
T1- No seed inoculation + 50 % P per ha; T2 - No seed inoculation + 100 % P per ha; T3 - P. bilaii seed inoculation @ ½ X + 50 % P per ha; T4- P. bilaii seed inoculation @ X + 50 % P per ha; T5 - P. bilaii seed inoculation @ 2X + 50 % P per ha; T6 - P. bilaii seed inoculation @ ½ X + 100 % per ha T7- P. bilaii seed inoculation @ X + 100 % P per ha; T8- P. bilaii seed inoculation @ 2X + 100 % P per ha
Table 1: Composition Components % (w/w)
Pure culture of Penicillium bilaii fungus 3% -21.6% Other ingredients 78.4% - 97%
RESULTS AND DISCUSSION
The study revealed that all the treatments were statistically at par with respect to plant height during year 2014 and 2015. The plant height was slightly more in 100 % fertilizers along with P. bilaii treatment. The number of cobs per plant was statistically same with different treatments of P. bilaii and with chemical fertilizer as compared to alone chemical fertilizer. Similarly, the effect of treatments was observed to be statistically non significant for dry matter at harvest and thousand grain weight for year 2014 and 2015. The dry matter at harvest during 2014 was 217.5 g/plant has also increased to 230.2 g/plant during 2015 with 100 % recommended chemical fertilizer dose and 2X treatment of P. bilaii, however the results were non- significant during both the years. The highest grains per cob was observed in 2X treatment of P. bilaii along with 100 per cent chemical fertilizer, however it was statistically similar over treatment with 100 per cent chemical fertilizer with no inoculation of P. bilaii in year 2015. The grain yield was statistically similar among all the treatments during the year 2014. However, during second year of experimentation the 2X treatment of P. bilaii along with recommended dose of fertilizer produced the highest yield but this treatment was statistically similar with alone 100 percent chemical fertilizer. The stover yield was at par with 100% chemical fertilizer along with 2X dose of P. bilaii and 100% chemical fertilizer alone during 2014, however where 50 per cent chemical fertilizer was applied the stover yield was statistically less. The stover yield was at par among all the treatments in year 2015. The study revealed that the Penicillium bilaii fungus along with recommended fertilizer doses made an impact on grain yield and other yield attributing characters during the second year of study and was at par during the first year for both the crops. Improvement in morphological characters like plant height, cobs per plant, spikelet per panicles and grain yield per ha of both the crops was observed with this fungus treated seed but was statistically non- significant.
REFERENCES [1] Asea PEA, Kucey RMN and Stewart JWB 1988.Inorganic phosphate solubilization by two Penicillium species in solution culture and soil.
Soil Biology and Biochemistry (20), 459-464. [2] Kucey RMN 1983.Phosphate-solubilizing bacteria and fungi in various cultivated and virgin Alberta soils. Canadian Journal of Soil
Science (63), 671-678.
It is I
LLEGAL t
o cop
y, pri
nt or
save
any c
onten
t of th
is PDF,
in pa
rt or in
full,
on an
y retr
ieval
syste
m,
withou
t the E
XPRESS WRITTEN PERMISSIO
N of th
e cop
yrigh
t-hold
er

National Conference on Climate Change and Agricultural Production: Adapting Crops to Climate Variability and Uncertainty, 6th–8th April, 2017
[336]
Performance of Scented Rice Varieties under Different Fertility Levels
Naveen Prakash Singh1*, Tej Partap2, Anupam Adarsh3 Avaneesh Kumar Yadav1, S.K. Dubey2, S.K. Chaudhary2 and Divya Prakash Singh4
1Department of Agronomy, 4Department of Agriculture Biotechonology 1,2Narendra Dev University of Agriculture and Technology, Narendra Nagar, Faizabad–224229, India
3Department of Horticulture (Vegetable and Floriculture), BAU Sabour–813210, India
2Department of Agronomy, BAU Sabour–813210, India E-mail: *[email protected]
Keywords: Scented Rice Varieties, Fertility, Growth and Yield
INTRODUCTION
Due to accumulation of greenhouse gases in the atmosphere has warmed the planet and caused global climate change that leads to injuries to rice crops in terms of quality and quantity. Grain quality in rice had played vital role in the food security (Nguyen, 2004).Scented rice had unidentified compound (a -pyrrolidone) which was not present in traditional rice Scented rice has photosensitive, require short day length during flowering and exquisite aroma, sweet taste, soft texture (Bhattacharjee et al., 2002). Demand for aromatic rice recognized as high valued than normal rice in the world market (Napsintuwong, 2012). However, the total production of aromatic rice in the country is nearly 5 million tonnes from an area of 0.7 m ha representing 1.5 per cent of the total rice area with an average productivity of 0.85 t ha-l the Indian aromatic rice including Increasing the production of high quality aromatic rice by the farmers for domestic as well as export purposes is major concern of future agriculture strategy. The improvement of grain quality of aromatic rice has been observed under integrated use of organic and inorganic fertilizers as compared to RDF (Recommended dose of fertilizers) applied with inorganic fertilizer. Keeping in view the above idea the present investigation was focused on integrated nutrient management on scented rice.
MATERIALS AND METHODS
The field experiment was conducted at the Narendra Dev University of Agriculture and Technology, Kumarganj, Faizabad (U.P.) India during Kharif season of 2011-12. The soil of experimental plot was silty loam. with the pH 7.72 containing organic carbon 0.37% available nitrogen 190.55 kg ha-1, P2O5 13.03kg ha-
1, K2O 257.10 kg ha-1 The experiment was in split plot design with, 3 scented rice varieties name Kalanamak- 3131, Pusabasmati -1 and Improved Pusabasmati a main treatment and 4 fertilizer levels (F1 -60+30+30 Kg NPK ha-1, F2 -90+45+45 Kg NPK ha-1, F3 -60+30+30kg NPK+6 ton FYM ha-1 and F4 -90+45+45kg NPK+6ton FYM ha-1) as sub treatment. The experiment was laid out in completely randomized block design with 12 treatment combinations replicated thrice.
RESULTS AND DISCUSSION
The maximum plant height (120.23cm) was recorded in the Kalanamak-3131 as compared to other varieties namely Pusa basmati and improved Pusa basmati at 90 days after transplanting of crop which might be due to inherited varietal character and among fertility The higher combined application of nutrients, (90 + 45 + 45 kg NPK + 60 ton FYM ha-1) levels showed significantly higher plant height as compared to other treatments. The maximum number of shoots (10.48) and Dry matter accumulation (15.96 g hill-1) were recorded in the variety improved Pusabasmati which found significantly higher than other varieties. This might be due to increased availability of nutrients which led to better root developments ultimately produced
It is I
LLEGAL t
o cop
y, pri
nt or
save
any c
onten
t of th
is PDF,
in pa
rt or in
full,
on an
y retr
ieval
syste
m,
withou
t the E
XPRESS WRITTEN PERMISSIO
N of th
e cop
yrigh
t-hold
er

National Conference on Climate Change and Agricultural Production: Adapting Crops to Climate Variability and Uncertainty, 6th–8th April, 2017
[337]
more number of shoots per hill and Dry matter accumulation at 90 days. The higher combined application of fertilizer (90 + 45 + 45 kg NPK + 60 ton FYM ha-1) showed significantly higher number of shoot hill-1 and Dry matter accumulation as compared to other level of fertility treatments at 90 days. In similar way yield attributing character like No. of grains/ panicle (299.47) Weight of grains/ panicle (2.08) Harvest index (39.29 %) and Grain yield (39.41q ha-1) are also significant higher in improved Pusabasmati varieties and infertility level (90 + 45 + 45 kg NPK + 60 ton FYM ha-1) showed significantly higher result. Regarding benefit cost ratio (1.46) it is found highest with combination with improved Pusabasmati along with (90 + 45 + 45 kg NPK + 60 ton FYM ha-1) levels.
REFERENCES [1] Bhattacharjee P, Singhal R S and Kulkarni P 2002. Basmati rice a review. International Journal of Food Sciences and
Technology 37(1): 12. [2] Kavitha M P, Balasubramania R., Babu R and Pandi V K 2008. Effect of nitrogen and potassium management on yield attributes, yield
and quality parameters of hybrid rice. Crop Resserch 35 (3): 172-175. [3] Nguyen N.V. 2004. Global climate changes and rice food security, International Rice Commission, FAO Rome, Italy
(Part I Overview) pp. 24-30. [4] Napsintuwong O 2012. Survey of Recent Innovations in Aromatic Rice Presentation- 131st EAAE Seminar, Prague, Czech Republic
(Sep.18-19).
Effect of Seed Rate, Row Spacing and Nitrogen Levels on Growth, Yields and Economics of Malt Barley
Seema Dahiya*, Jagdev Singh, Bhagat Singh and Rajbir Singh Khedwal Chaudhary Charan Singh Haryana Agricultural University, Hisar–125001, India
E-mail: *[email protected]
Keywords: Two-rowed barley, Seed rate, Nitrogen, Yields, Economics
INTRODUCTION
Barley is an important cereal grain and considered fourth largest cereal crop in the world (Pal et al., 2012). Seed rate, row spacing and nitrogen levels are the most important factors for realizing potential yield of barley. Sowing of seeds in optimum quantity influences economic grain yield of barley.Growth, yield attributes and yield of malt barley are affected by row spacing and nitrogen levels. The work undertaken on these aspects in two rowed barley is very meagre. Therefore keeping this in view a study was conducted on effect of seed rate, row spacing and nitrogen levels on growth and yields of malt barley.
MATERIALS AND METHODS
A field experiment was conducted during rabi 2014-15 at Research Farm of Department of Agronomy, CCS HAU, Hisar (India). The experiment consisted of two seed rates (87.5 and 100 kg/ha) and three spacings (22, 20 and 18 cm) in main plots and four nitrogen levels (60, 75, 90 and 105 kg N/ha) in sub plots. The 24 treatment combinations were tested in split plot design with three replications. The sowing of two rowed malt barley variety BH-885 was done on 28 November 2014 by pora method at 5-6 cm depth using different seed rate and row spacing as per treatments. Recommended dose of P and K and ½ dose of N as per treatments were applied at the time of sowing and remaining half dose of nitrogen as per treatments was top dressed at 1st irrigation.
It is I
LLEGAL t
o cop
y, pri
nt or
save
any c
onten
t of th
is PDF,
in pa
rt or in
full,
on an
y retr
ieval
syste
m,
withou
t the E
XPRESS WRITTEN PERMISSIO
N of th
e cop
yrigh
t-hold
er

National Conference on Climate Change and Agricultural Production: Adapting Crops to Climate Variability and Uncertainty, 6th–8th April, 2017
[338]
RESULTS AND DISCUSSION
The plant height, dry matter accumulation, leaf area index, yield attributes (number of effective tillers m-2, spike length, number of grains per spike), yields (grain and straw yield),harvest index and net returnswere significantly higher with seed rate of 100 kg/ha as compared to that of seed rate 87.5 kg/ha.Most of the growth parameters increased consistently with the decrease in each level of row spacing from 22 cm to 18 cm. Spike length, test weight and harvest index were not significantly influenced by various row spacing. The maximum number of grains per spike, grain and straw yields and net returns was recorded with the row spacing of 18 cm which was at par to 20 cm (except net returns) but significantly higher than 22 cm row spacing. The maximum plant height was recorded with 105 kg N/ha at maturity followed by nitrogen level 90 and 75 kg N/ha and minimum with 60 kg N/ha. Dry matter accumulation and LAI increased significantly with the increase in nitrogen level upto 90 kg N/ha as compared to 60 and 75 kg N/ha. However further increase in nitrogen level to 105 kg N/ha did not significantly improve values of these parameters as compared to 90 kg N/ha but was significantly superior to 75 and 60 kg N/ha.
REFERENCE [1] Pal D., Kumar S. and Verma R.P.S. 2012. Pusa Losar (BHS 380)–the first dual-purpose barley variety for northern hills of India.Indian
Journal of Agricultural Sciences, 82, 164-165.
Impact of Climate Change on Cultivation of off-Season Summer Squash under Low Tunnel in Bihar Region
Satish Kumar1, Alok Kumar2* and Sardar Sunil Singh3 1Department of Vegetable Science, Noorsarai, Nalanda–803113, India 2Nalanda College of Horticulture, Noorsarai, Nalanda–803113, India
3Department of Plant Breeding and Genetics, Noorsarai, Nalanda–803113, India E-mail: *[email protected]
Keywords: Summer squash, Plastic tunnel, Temperature
INTRODUCTION
Cucurbits are mainly warm season crops, which are mainly grown in tropical and subtropical region. But summer squash is one vegetable crop among the cucurbits which can be frown under mild low temperature. Summer squash needs 15-25º C temperature for successful cultivation. Plastic low tunnels technology, which protect the plants against low temperature hail injury and capture the market in early season to get good return of crop produce. Plastic low tunnel facilitates increase in temperature and entrapment of carbon dioxide, thereby enhancing the photosynthetic activity of plants and hence the yield. They create a favorable micro-climate around the crop by providing frost and pest protection and reducing moisture loss (Butter and Ross, 1999). These structures advance the crop by 45-60 days than normal season which get premium price in market. With the above background information the present investigation was undertaken to study the performance of summer squash under low tunnel in Bihar.
MATERIALS AND METHODS
The present investigation was carried out at Bihar Agricultural College, Sabour Bhagalpur during 2009-2010 and 2010-2011. The experiment was laid in randomized block design with treatments, replicated thrice. The treatments comprised the seven dates of savings i.e. 30th Nov open field, 15th Dec open field, 30th Jan under
It is I
LLEGAL t
o cop
y, pri
nt or
save
any c
onten
t of th
is PDF,
in pa
rt or in
full,
on an
y retr
ieval
syste
m,
withou
t the E
XPRESS WRITTEN PERMISSIO
N of th
e cop
yrigh
t-hold
er
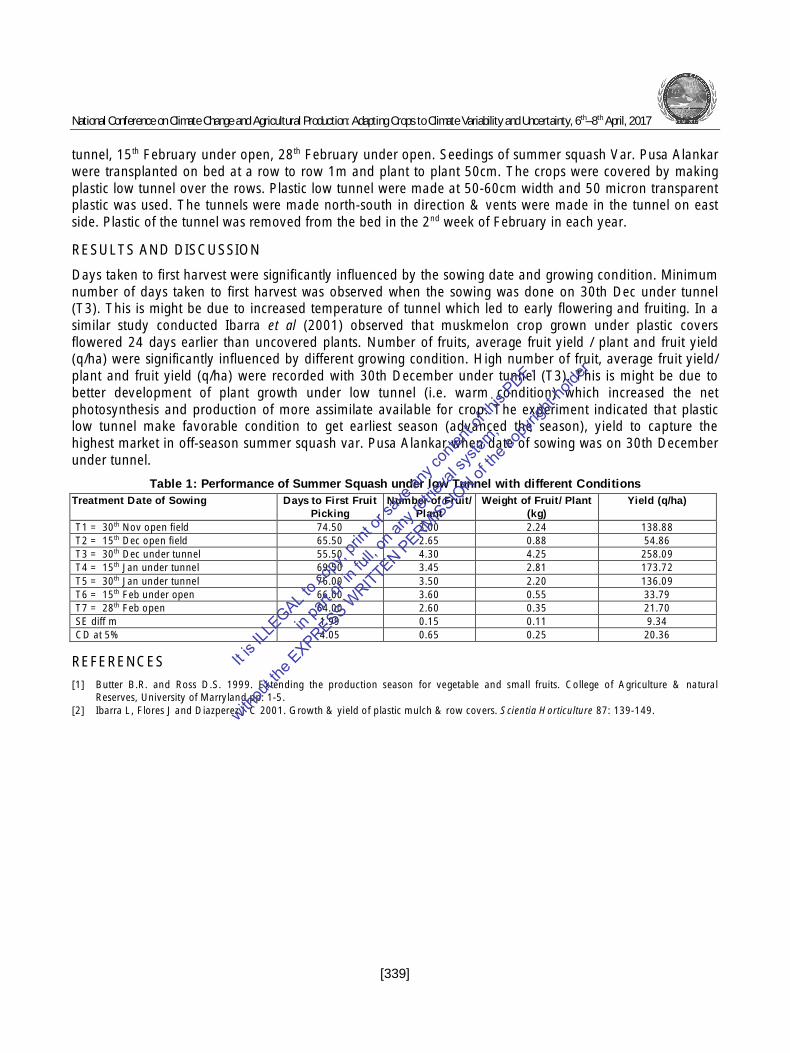
National Conference on Climate Change and Agricultural Production: Adapting Crops to Climate Variability and Uncertainty, 6th–8th April, 2017
[339]
tunnel, 15th February under open, 28th February under open. Seedings of summer squash Var. Pusa Alankar were transplanted on bed at a row to row 1m and plant to plant 50cm. The crops were covered by making plastic low tunnel over the rows. Plastic low tunnel were made at 50-60cm width and 50 micron transparent plastic was used. The tunnels were made north-south in direction & vents were made in the tunnel on east side. Plastic of the tunnel was removed from the bed in the 2nd week of February in each year.
RESULTS AND DISCUSSION
Days taken to first harvest were significantly influenced by the sowing date and growing condition. Minimum number of days taken to first harvest was observed when the sowing was done on 30th Dec under tunnel (T3). This is might be due to increased temperature of tunnel which led to early flowering and fruiting. In a similar study conducted Ibarra et al (2001) observed that muskmelon crop grown under plastic covers flowered 24 days earlier than uncovered plants. Number of fruits, average fruit yield / plant and fruit yield (q/ha) were significantly influenced by different growing condition. High number of fruit, average fruit yield/ plant and fruit yield (q/ha) were recorded with 30th December under tunnel (T3). This is might be due to better development of plant growth under low tunnel (i.e. warm condition) which increased the net photosynthesis and production of more assimilate available for crop. The experiment indicated that plastic low tunnel make favorable condition to get earliest season (advanced the season), yield to capture the highest market in off-season summer squash var. Pusa Alankar when date of sowing was on 30th December under tunnel.
Table 1: Performance of Summer Squash under low Tunnel with different Conditions Treatment Date of Sowing Days to First Fruit
Picking Number of Fruit/
Plant Weight of Fruit/ Plant
(kg) Yield (q/ha)
T1 = 30th Nov open field 74.50 3.00 2.24 138.88 T2 = 15th Dec open field 65.50 2.65 0.88 54.86 T3 = 30th Dec under tunnel 55.50 4.30 4.25 258.09 T4 = 15th Jan under tunnel 69.50 3.45 2.81 173.72 T5 = 30th Jan under tunnel 76.00 3.50 2.20 136.09 T6 = 15th Feb under open 66.00 3.60 0.55 33.79 T7 = 28th Feb open 64.00 2.60 0.35 21.70 SE diff m 1.99 0.15 0.11 9.34 CD at 5% 4.05 0.65 0.25 20.36
REFERENCES [1] Butter B.R. and Ross D.S. 1999. Extending the production season for vegetable and small fruits. College of Agriculture & natural
Reserves, University of Marryland.pp: 1-5. [2] Ibarra L, Flores J and Diazperez J C 2001. Growth & yield of plastic mulch & row covers. Scientia Horticulture 87: 139-149.
It is I
LLEGAL t
o cop
y, pri
nt or
save
any c
onten
t of th
is PDF,
in pa
rt or in
full,
on an
y retr
ieval
syste
m,
withou
t the E
XPRESS WRITTEN PERMISSIO
N of th
e cop
yrigh
t-hold
er

National Conference on Climate Change and Agricultural Production: Adapting Crops to Climate Variability and Uncertainty, 6th–8th April, 2017
[340]
Site-Specific Nutrient Management with Rice-Wheat Crop in South Bihar Alluvial Plain Zone of India
Sanjeev Kumar Gupta1, Mainak Ghosh1*, Anshuman Kohli2, Sheetal Sharma3 Uday Kumar4, Koneru Lakshman5, R.K. Sohane6, Y.K. Singh2, Sunil Kumar2, Anand Kumar Jain4,
Beerendra Singh4 and K.K. Prasad7 1Department of Agronomy, 2Department of Soil Science and Agricultural Chemistry,
4Department of Agronomy, V.K.S. College of Agriculture, Dumraon, 5Jute Research Station, 6Katihar, Directorate of Extension Education, 7Irrigation Research Station, Bikramganj, Rohtas,
Bihar Agricultural University, Sabour–813210, Bhagalpur, India 3International Rice Research Institute (IRRI), NASC Complex, Pusa, New Delhi–11001, India
E-mail: *[email protected]
Keywords: Site-specific nutrient management, Omission plot, Crop manager, Wheat
INTRODUCTION
The site specific nutrient management (SSNM) approach provides scientific principles for determining field-specific fertilizer nitrogen (N), phosphorus (P), and potassium (K) requirements for crops. Use of SSNM based fertilizer recommendations were shown to increase yields, net income of farmers, and provide positive impacts on the environment when compared to existing fertilizer practices (Pampolino et al., 2007).Recent advances in information and communication technology provide emerging opportunities to farmers with field-specific nutrient recommendations. International Rice Research Institute (IRRI) developed Nutrient Manager, the decision-making tool, which calculates field-specific nutrient recommendation and transmits to farmers through use of mobile phones (Buresh et al., 2014). Nutrient managersubsequently evolved in 2013 to country-specific versions of crop managerand rice-wheat crop manager was implemented in Bihar, India in the year 2015, addressing the needs of farmers for customized, field-specific advice on farming practices and varieties to complement the nutrient management recommendation. Nutrient manager for cereal systems will accommodate rice-wheat, rice-maize, maize-wheat, and maize-maize cropping systems; and it can serve as a precursor to the development of subsequent state-specific and country-specific versions of crop manager for rice-based systems. Keeping the above idea in view and realizing the importance of sustainability in changing climate, an attempt has been made in this study for location specific nutrient management in south Bihar alluvial plain zone of India.
MATERIALS AND METHODS
Field experiments were conducted on farmers’ fields in different villages of Bhagalpur district in Bihar under Bihar Agricultural University, Sabour, Bhagalpur, India, during 2013-14 to study the effect various fertilizer recommendation regimes on crop productivity vis-a-vis farmer’s practice. This involved four treatments namely farmer’s fertilizer practice (FFP), state fertilizer recommendation (SFR), soil test based recommendation (STR) and rice-wheat crop manager (RWCM) based recommendation as first experiment. In order to determine the nutrient limited yield (for each omitted nutrient) from the indigenous nutrient supply, another experiment on nutrient omission was conducted at a location contiguous with the first experiment. This experiment involved five treatments namely full dose of P, K and Zn (N omission) (T1), full dose of N, K and Zn (P omission) (T2), full dose of N, P and Zn (K omission) (T3), full dose of N, P and K (Zn omission) (T4) and full dose of N, P, K and Zn (T5). Eight locations were selected in the villages of Goradi, Sanhola, Shahkund, Rangra, Jagadishpur and Kahelgaon blocks of Bhagalpur, Bihar, India. Both Goradi
It is I
LLEGAL t
o cop
y, pri
nt or
save
any c
onten
t of th
is PDF,
in pa
rt or in
full,
on an
y retr
ieval
syste
m,
withou
t the E
XPRESS WRITTEN PERMISSIO
N of th
e cop
yrigh
t-hold
er

National Conference on Climate Change and Agricultural Production: Adapting Crops to Climate Variability and Uncertainty, 6th–8th April, 2017
[341]
and Sanhola blocks had two villages and the others had one. All the locations had two sets of field experiments conducted in randomized block design and the locations were taken as replications. Wheat variety ‘HD-2967’ was planted in rows 25 cm apart in this study. The state fertilizer recommended dose was 100-40-20-8 kg/ha N- P2O5- K2O and Zn respectively for wheat crop. The nutrient dose of the other treatments in the first experiment varied location wise. Nutrient omission plots had the recommended dose of 150-80-100-8 kg/ha N- P2O5- K2O and Zn respectively for all the locations.
RESULTS AND DISCUSSION
The grain yield, straw yield and harvest index did not vary significantly among the treatments in the first experiment (Table 1). The farmers in FFP applied less amount of N when compared with RWCM and in couple of locations they even not applied K. The amount of N and K2O applied in RWCM varied from 85-90 and 25-30 kg ha-1 respectively and were higher than those of FFP but was not much reflected in crop yield. The statistically similar performance of various treatments appears to have resulted due to the large variation in the yields between various farmers’ fields, which have been considered as replications. The nutrient omission technique showed significant effects on grain and straw yields. Maximum grain and straw yields were noted with the application of full dose of N, P, K and Zn (T5) and were significantly higher over other omission treatments (T1, T2 and T3) except Zn omission (T4) which produced crop yield comparable to that of T5. N omission (T1) recorded significantly lower grain and straw yields than those of other treatments. This justifies N as the key input in cereal production as it contributes to carbohydrate accumulation in culms and leaf sheaths during the pre-heading stage and in the grain during the ripening stage.
Table 1: Wheat Productivity under Different Nutrient Management Practices (Averaged over 8 Farmers’ Fields) Treatments Grain Yield Straw Yield Harvest Index FFP 35.68 43.61 0.45 SFR 35.88 43.71 0.45 STR 38.15 44.10 0.46 RWCM 37.31 45.31 0.45 CD at 5% NS NS NS
REFERENCES [1] Buresh R.J., Castillo R, van den Berg M and Gabinete G. 2014. Nutrient management decision tool for small-scale rice and maize
farmers. Food and Fertilizer ecology center, Taipei, Taiwan. [2] Pampolino M F, Manguiat I J S, Ramanathan H C, Gines P S, Tan T T N, Chi R R and Buresh R J 2007. Environmental impact and
economic benefits of site-specific nutrient management (SSNM) in irrigated rice systems. Agricultural Systems 93: 1-24.
It is I
LLEGAL t
o cop
y, pri
nt or
save
any c
onten
t of th
is PDF,
in pa
rt or in
full,
on an
y retr
ieval
syste
m,
withou
t the E
XPRESS WRITTEN PERMISSIO
N of th
e cop
yrigh
t-hold
er

National Conference on Climate Change and Agricultural Production: Adapting Crops to Climate Variability and Uncertainty, 6th–8th April, 2017
[342]
Variations in Soil Properties under Different Land Use Systems in Western Central Agro-climatic Zones of Odisha
Dhaneshwar Padhan Department of Agricultural Chemistry and Soil Science,
Bidhan Chandra Krishi Viswavidyalaya, Mohanpur, Nadia–741252, India E-mail: *[email protected]
Keywords: Land use types, Soil properties, Soil organic carbon, Water holding capacity
INTRODUCTION
Land use is one of the main drivers of many processes of environmental change, as it influences basic resources within the landscape, including the soil properties (Gonzalez et al., 2014). It is apparent that soil is one of the most important and determinant factors that strongly affects crop production. Soil is the foundation resource for nearly all land uses, and the most important component of sustainable agriculture (Mulugeta and Karl, 2010). Therefore, assessment of soil properties with respect to land use types, management practices is useful and is the primary indicator for sustainable agricultural production system. Understanding the effect of land use patterns on soil properties is useful for devising land management strategies.
MATERIALS AND METHODS
Composite soil samples (0-15cm and 15-30cm depth) were collected from different land use patterns viz., rice-rice, rice-mustard, fallow, forest and mango plantation following standard protocols from different locations of Bargarh district under the Western Central tableland Agro-climatic zones of Odisha. Moist soil samples were collected with the help core sampler and kept in moisture box for estimation of bulk density and water holding capacity of soils (Jackson, 1973). The soil samples were further air dried, processed to pass through 2mm sieve and analyzed for different soil parameters following standard protocols. Correlation matrix was drawn among the soil properties to justify their relationship.
RESULTS AND DISCUSSION
Results showed that a range of soil properties witnessed significant difference between land-uses. The soils were moderately acidic to slightly acidic with soil organic carbon (SOC) content of medium to high status. Bulk density (BD) of soils was typically high in the sub-surface soil layers of different land uses. Water holding capacity (WHC) and cation exchange capacity (CEC) of soils under forest vegetation was higher among all the land uses. However, significant differences existed in soil depths also for a range of soil parameters determined (pH, SOC, WHC, CaCO3 and clay content). Correlation matrix also showed dynamic relationships among the various soil properties. Soil organic carbon content maintained significant negative correlation with BD of soils indicating that with decline in SOC content the BD of soils increase and vice-versa. The SOC content showed strong correlation with CEC of soils. The CaCO3 content maintained strong relationship with all other soil properties except the BD of soils. Soil pH maintained significant positive correlation with CaCO3 content (r= 0.827; p<0.01) while strong negative correlation with water holding capacity (r= -0.821; p<0.01) of soils. Comparing the various land-use systems studied, it was therefore clear that high SOC content in soils optimized all other soil properties. So, in order to restore the soil properties in a particular landscape, retaining trees and forest is the most effective option.
It is I
LLEGAL t
o cop
y, pri
nt or
save
any c
onten
t of th
is PDF,
in pa
rt or in
full,
on an
y retr
ieval
syste
m,
withou
t the E
XPRESS WRITTEN PERMISSIO
N of th
e cop
yrigh
t-hold
er
National Conference on Climate Change and Agricultural Production: Adapting Crops to Climate Variability and Uncertainty, 6th–8th April, 2017
[343]
REFERENCES [1] Gonzalez A.P., de Abreu C.A., Tarquis A and Roldan E.M. 2014. Impacts of Land Use Changes on Soil Properties and Processes. The
Scientific World Journal. [2] Jackson M L 1973. Soil Chemical Analysis. Prentice-Hall of India Private Ltd., New Delhi. [3] Mulugeta D and Karl S 2010. Assessment of integrated soil and water conservation measures on key soil properties in south Gondar,
north-western Highlands of Ethiopia.Journal of Soil Science and Environmental Management 1(7):164-176.
Effect of Preharvest Foliar Spray of Nutrients on Yield and Quality of Apple (Malus domestica Borkh.) in Uttarakhand, India
Anjali Tripathi1*, Shweta Uniyal2 and Paramjeet Sajwan2 1Chaudhary Charan Singh Haryana Agricultural University, Hisar–125004, India
2Department of Horticulture, Uttarakhand University of Horticulture and Forestry, College of Forestry Ranichauri, India
E-mail: *[email protected]
Keywords: Apple, Malus domestica, Nutrients, Yield
INTRODUCTION
Apple (Malus domestica Borkh) is an important member of family Rosaceae and grown widely throughout the world. Nutrition plays an important role in maintaining the quality and production of fruits. The major nutrients (N, P, K, and Ca) which can be precisely applied either through foliar applications or fertigation have major effect on fruit quality. Nitrogen is an integral component of many compounds including chlorophyll, nucleic acid, proteins and enzymes which are essential for plant growth and development (Sah et al., 2014). Neilsen and Neilsen (2009) reported that increased P foliar spray increased yield and decreased water core and browning. Potassium fertilization increased fruit color and quality without increasing bitter pit. Keeping in view the above idea an attempt was made on foliar application of nutrients on yield and quality of apple.
MATERIALS AND METHODS
The experiment was conducted in Uttarakhand University of Horticulture and Forestry, Ranichauri, Tehri Garhwal, Uttarakhand,during the year 2013. In this experiment three sprays of different treatments were applied at an interval of thirty days after fruit set. The experiment was laid out in RBD with three replications and 11 treatments namely; T1 (foliar application of borax @ 0.5%), T2 (foliar application of borax @ 1%), T3
(foliar application of CaCl2 @ 0.4%), T4 (foliar application of CaCl2 @ 0.6%), T5 (foliar application of K2SO4
@ 1%), T6 (foliar application of K2SO4 @ 1.5%), T7 (foliar application of macronutrient NPK @ 1%), T8 (foliar application of macronutrient @ 1.5%), T9 (foliar application of micronutrient @ 0.5%), T10 (foliar application of micronutrients @ 1%) and T11 (control).
RESULTS AND DISCUSSION
The investigation clearly revealed that pre-harvest application of nutrients was effective in reducing fruit drop and increasing the yield and physico-chemical characteristics of the fruit compared to control. Among the different treatments T8 resulted in minimum fruit drop (46.90%), maximum fruit retention (53.46%), yield (33.17kg/tree), fruit weight (133.56g), fruit volume (88.16ml), fruit length (43.46 mm) and diameter (48.73mm) (Table 1). The total sugar percent in apple increase with increases the storage intervals total sugar gave significant effect with increases the storage intervals. The maximum total sugar was recorded in T8
It is I
LLEGAL t
o cop
y, pri
nt or
save
any c
onten
t of th
is PDF,
in pa
rt or in
full,
on an
y retr
ieval
syste
m,
withou
t the E
XPRESS WRITTEN PERMISSIO
N of th
e cop
yrigh
t-hold
er

National Conference on Climate Change and Agricultural Production: Adapting Crops to Climate Variability and Uncertainty, 6th–8th April, 2017
[344]
treatment (foliar application of macronutrients @ 1.5%). TSS and ascorbic acid content found maximum in fruits which were treated with potassium (foliar application of K2SO4 @ 1.5%) followed by macronutrients. Conclusively, it emerges that the pre harvest foliar spray of macronutrients (20:20:20 NPK) @ 1.5% was more effective in improving the quality and quantity of apple.Thus, three foliar spray of NPK mixture @ 1.5% on during first week of May, June and July was found to be most effective in increasing fruit yield and quality of apple cv. Royal Delicious in the mid hill condition of Uttarakhand.
Table 1: Effect of pre Harvest Foliar Spray of Nutrients on Fruit Retention, Drop, Yield, Fruit Weight, Fruit Volume, Fruit Length of Apple cv. Royal Delicious
Treatments Fruit Retention (%)
Fruit Drop (%)
Yield (kg/ Tree)
Weight (g)
Volume (ml) Length (mm)
Diameter (mm)
T1 53.16 47.16 26.46 74.43 36.76 30.46 38.93 T2 51.80 48.14 28.93 79.83 45.43 34.00 40.16 T3 50.90 49.21 29.48 102.06 60.46 37.20 41.56 T4 51.03 47.54 30.13 95.66 49.26 35.59 40.55 T5 50.20 49.70 32.06 108.33 53.66 34.72 38.13 T6 49.73 50.20 29.13 128.63 79.30 38.24 47.10 T7 51.83 47.83 27.80 123.53 74.26 40.73 42.63 T8 53.46 46.90 33.17 133.56 88.16 43.46 48.73 T9 52.16 47.81 27.31 82.86 46.96 35.58 42.16 T10 51.03 47.81 27.76 125.00 60.66 38.88 46.43 T11 48.13 51.31 23.82 55.76 33.10 27.75 29.96 Mean 51.22 49.35 28.73 100.88 57.09 36.05 41.46 CD (p=0.05) 1.69 1.62 1.2 2.81 1.98 1.50 3.91
REFERENCES [1] Neilsen D and Neilsen G 2009. Nutritional effects on fruit quality for apple trees. New York Fruit Quality 17(3): 21-24. [2] Sah H P, Kumar R and Topwal M 2014. Response of NPK on growth, yield and quality of Oriental pear. Indian Horticulture Journal4(1):
01-08.
Quantitative and Qualitative Attributes of Aloe vera under Melia composita-Aloe vera and Sole Cropping Systems
D.J. Jilariya, N.S. Thakur* and R.P. Gunaga Department of Silviculture and Agroforestry
College of Forestry, Navsari Agricultural University, Navsari-396450, India E-mail: *[email protected]
Keywords: Agroforestry, Aloe vera, Melia composita, growth, Phyto-chemicals, Aloe gel, Aloin
INTRODUCTION
Melia composita Willd. (Syn. Melia dubia Cav) is a multipurpose tree species being preferred by farmers to take large scale plantations with different intercrops (Parthiban et al., 2009). Many traditional and cash crops are traditionally grown or have been tested under agroforestry with both positive and negative interactions. Medicinal and aromatic plants are being advocated as under storey crops due to their shade loving nature (Suvera et al., 2015). Aloe vera is one of the commercially important medicinal plant. Therefore, keeping view the industrial importance of both the woody and non woody component, Quantitative and Qualitative Attributes of Aloe vera were studied under different spacings of M. composita.
It is I
LLEGAL t
o cop
y, pri
nt or
save
any c
onten
t of th
is PDF,
in pa
rt or in
full,
on an
y retr
ieval
syste
m,
withou
t the E
XPRESS WRITTEN PERMISSIO
N of th
e cop
yrigh
t-hold
er

National Conference on Climate Change and Agricultural Production: Adapting Crops to Climate Variability and Uncertainty, 6th–8th April, 2017
[345]
MATERIALS AND METHODS
Aloe vera was intercropped under 2 year o ld Melia composi ta. Four treatments namely T1
[Melia composita (2x2 m) + Aloe vera], T2 [Melia composita (3x2 m) + Aloe vera], T3 [Melia composita (4x2 m) + Aloe vera], comprised silvi-medicinal T4 (Aloe vera sole) and sole cropping systems. Aloe vera seedlings were planted, on ridges at 50 x 30 cm spacing. Intercultural operations were carried out following standard agro-techniques.Crop was harvested after 10 months of planting and quantitative parameters were recorded adopting standard procedures. The phytochemical profiling of gel was done with Gas Chromatography/Mass Spectrometry (GC/MS) analysis.
RESULTS AND DISCUSSION
The growth parameters of Aloevera showed decreasing trend with increase in M. composita spacing and minimum values were for sole grown aloe. The values of fresh and dry biomass parameters were significantly higher under M. composita (2×2 m)-aloe silvi-medicinal system. The fresh and dry biomass yield decreased significantly with increase in M. composita spacing. In total 11, 13, 9 and 9 different phyto-chemicals were identified in gel extract from M. composita (2×2 m)-aloe, M. composita (3×2 m)-aloe M. composita (4×2 m)-aloe silvi-medicinal and sole aloe cropping systems, respectively were identified through (Gas Chromatography-Mass Spectrometry) GC-MS on the basis peak area and molecular weight. The study substantiate that integration of Aloe vera under M. composita based silvi-medicinal systems proved beneficial due to positive tree-crop interface resulting in better growth and yield per plant. Thus, cultivation of Aloe vera under young M. composita plantations at closer spacing is ecologically sound.
REFERENCES [1] Suvera A H, Thakur N S and Jha S K 2015. Herbage and essential oil yield of Ocimum spp. intercropped under Pongamia pinnata based
silvi medicinal system in Gujarat, India. The Bioscan 10 (1): 81-85. [2] Parthiban K T, Bharathi A K R, Seenivasan K, Kamala and Rao M G 2009. Integrating Melia dubia in Agroforestry farms as an alternate
pulpwood species. APA News 34 3-4.
Table 1: Quantitative and Qualitative Parameter of Aloe vera under Melia Composita based Silvi-medicinal and Sole Cropping Systems
Land
Use
S
yste
ms
Pla
nt H
eigh
t (c
m)
No.
of
Mat
ure
Leav
es/ P
lant
Mat
ure
Leaf
Le
ngth
(cm
)
Tota
l Fr
esh
B
iom
ass
(kg/
P
lant
)
Fres
h M
atur
e Le
af Y
ield
(kg
/ P
lant
)
Fres
h G
el
Yie
ld (
kg/
Pla
nt)
Fres
h A
loin
(
g/
Pla
nt)
Tota
l D
ry
Bio
mas
s (k
g/
Pla
nt)
Dry
Mat
ure
Leaf
Yie
ld (
kg/
Pla
nt)
Dry
Gel
Yie
ld
(kg/
P
lant
)
Dry
Alo
in (
g/
Pla
nt)
T1 52.89 7.38 38.08 1.41 1.10 0.66 7.58 0.072 0.049 0.012 0.65 T2 42.08 6.03 32.78 0.99 0.82 0.49 4.08 0.052 0.037 0.009 0.32 T3 39.93 5.23 30.25 0.89 0.73 0.44 3.54 0.048 0.032 0.008 0.26 T4 34.07 4.82 27.33 0.51 0.38 0.19 3.20 0.031 0.017 0.004 0.24 C.D. a t 5 % 7.03 0.68 4.55 0.23 0.20 0.12 0.68 0.011 0.009 0.002 0.08 SE m( ±) 2.20 0.21 1.42 0.07 0.06 0.04 0.21 0.003 0.003 0.001 0.03
T1=[Melia (2x2 m)+Aloe vera], T2=[Melia (3x2 m)+Aloe vera], T3=[Melia (4x2 m)+Aloe vera], T4=Aloe vera sole
It is I
LLEGAL t
o cop
y, pri
nt or
save
any c
onten
t of th
is PDF,
in pa
rt or in
full,
on an
y retr
ieval
syste
m,
withou
t the E
XPRESS WRITTEN PERMISSIO
N of th
e cop
yrigh
t-hold
er

National Conference on Climate Change and Agricultural Production: Adapting Crops to Climate Variability and Uncertainty, 6th–8th April, 2017
[346]
Standardization of Date of Planting and Variety of Sprouting Broccoli (Brassica oleracea L.var italica Plenk)
U. Thapa*, R. Mondal, S. Kr. Subba, P.H. Prasad and S. Nandi Department of Vegetable Crops
Bidhan Chandra Krishi Viswavidyalaya, Mohanpur, Nadia 741252, India E-mail: *[email protected]
Keywords: Broccoli, Growth, Planting Date, Quality, Variety, Yield
INTRODUCTION
In Indian scenario especially in the plains of West Bengal the research work on broccoli (Brassica oleracea L.var italica Plenk)is meagre, therefore farmers are not aware of suitable production technology. Appropriate planting time is one of the important factors for boosting up the production (Dev, 2012).To get the maximum yield of the crop two factors, suitable variety and timely sowing/transplanting is very important as every variety requires specific temperature for head initiation and development (Karistsapol et al., 2013). Keeping this view in perspectives, the experiment was undertaken to standardize the date of planting and variety of sprouting broccoli.
MATERIALS AND METHODS
The present experiment was investigatedat Horticultural Research Station, Mondouri, Bidhan Chandra Krishi Viswavidyalaya, Mohanpur, Nadia, West Bengalduring the year (2015-2016).Four best performing varieties namely Early You, Princess, Fiesta and Nok Guk were evaluated with four different date of planting viz. 21st September, 15th October, 7th November and 30th November to find out the best performing variety and suitable sowing/planting dates and suitable The experiment was laid down in Factorial Randomized Block Design and replicated thrice.
RESULTS AND DISCUSSION
The effect of planting date with varieties produced maximum plant height as 41.58 cm with variety Early You 44.17 cm when transplanted on 7th November and the lowest plant height of 35.56cm from variety Fiesta when transplanted on 21st September. The maximum plant spread was observed as 6214.78 cm2 with Nok Guk and 5763.33 cm2 when transplanted on 7th November.Early You required 63.18 days for head initiation. The highest head diameter of 21.84 cm and 22.01 cm were recorded from Nok Guk and 7th November of planting, respectively. The maximum stem diameter was observed as 3.58 cmwith Nok Guk. The maximum head weight was noticed as 376.09 gm with Early You when transplanted on 7th November. The highest head yield of 120.35 q/ha was noticed from the variety Early You and 109.45 q/hawhen it was transplanted on 7th November. The lowest head yield of 85.53 q/ha was recorded fromPrinces. Thus it might be suggested that to find out the potential growth, yield and quality plant must be transplanted on 7th November and Early You has shown the best performance than other varieties.
REFERENCES [1] Dev H 2012. Standardization of planting time and spacing in broccoli cv green head for lower hills of Northern India. International
Journal of Farm Sciences 2(1): 36-42. [2] Karistsapola N, Quanchitb S and Sompong T 2013. Effect of planting date and variety on growth and yield of broccoliduring the dry
season in southern Thailand. International Journal of Plant, Animal and Environmental Sciences 3(2):121-124.
It is I
LLEGAL t
o cop
y, pri
nt or
save
any c
onten
t of th
is PDF,
in pa
rt or in
full,
on an
y retr
ieval
syste
m,
withou
t the E
XPRESS WRITTEN PERMISSIO
N of th
e cop
yrigh
t-hold
er

National Conference on Climate Change and Agricultural Production: Adapting Crops to Climate Variability and Uncertainty, 6th–8th April, 2017
[347]
Performance of a Set of Tomato Parental Linesand their Hybrids under Field Conditions of Bengaluru
Bharathkumar M.V.1*, Sadashiva A.T.2 and Pradeep Kumar Jatav3 1CCS Haryana Agricultural University, Hisar–125004, India
2Indian Institute of Horticultural Research, Bengaluru–560089, India 3Indian Institute of Agricultural Research, New Delhi–011012, India
E-mail: *[email protected]
Keywords: Tomato hybrid, Yield, Spacing
INTRODUCTION
Tomato, being the most widely used and nutritive vegetable has been grown throughout the world.It belongs to the family Solanaceae and is native of Peru, Ecuador region (Rick, 1969) and has a special importance in India due to its inevitable use in various dishes. In addition, fresh and processed tomatoes are the richest sources of the antioxidant lycopene, which is known to protect cells from cancer causing oxidants (Rao and Rao, 2007). Even though India is the second largest tomato producer next only to China, productivity lies below the productivity of many small countries due to various reasons, but most importantly due to poor selection of varieties. Commercially grown varieties are low yielder as compared to hybrid tomato. Hence the present experiment was designed to evaluate the 18 tomato hybrids developed by 9 diverse parents for quality and yield components under the conditions of Bengaluru.
MATERIALS AND METHODS
Present investigation was carried out at Division of vegetable crops, IIHR, Bengaluru located at an altitude of 890m above MSL 130.58’N latitude and 770.37’E longitude. Nine diverse parents were crossed in Line × Tester fashion during rabi 2013-14 to obtain 18 hybrids.Eighteen hybrids, along with their parents and standard checks (ArkaRakshak and Abhinava) were transplanted during February 2014 in3 replications. Each entry was represented by 40 plants in each replication at spacing of 100×45cm. cultivation practices recommended by IIHR was employed to raise the crop and 5 randomly selected fruits/plants in each replication were used to record the observation.
RESULTS AND DISCUSSION
The mean performances of the hybrids for various characters under investigation are presented in the Table1.Lowest plant height of 73.67 cm was recorded in IIHR 1816 x IIHR 2890 and the highest (91.08 cm) in IIHR2848xIIHR2853. Number of branches were least in IIHR2853 (5.33) and 5.57 (IIHR1816), whereas IIHR2890 (6.87) had highest number of branches. Among the parents, IIHR 2892 was found to be earliest to flower (28 days after transplanting), whereas IIHR2891xIIHR2852 was earliest to flower (26.33DAT) among the hybrids, which is earlier than checks ArkaRakshak (31DAT) and Abhinava (29DAT). ArkaRakshak (62.33DAT) and Abhinava (60DAT) were bit late to attain fruit maturity, however IIHR977xIIHR2890 (56.33DAT) took minimum days to attain first fruit maturity.Abhinava had highest TSS of 5.03 ̊B, followed by IIHR2850xIIHR2852 (4.84 ̊B) and high vitamin C content was found in IIHR1816 (20.06mg/100g), IIHR977xIIHR2853 (18.21mg/100g) and IIHR1816xIIHR 2890 (17.51mg/100g). Carotenoid and lycopene were highest in IIHR2892xIIHR2852 and IIHR2891xIIHR2853, while IIHR1816xIIHR2890 recorded the highest fruit weight of 155.95g.The highest yield of 4.07kg/plant was recorded by IIHR2850 x IIHR2852. None of the hybrids shown best performance in all the traits considered under this study, however
It is I
LLEGAL t
o cop
y, pri
nt or
save
any c
onten
t of th
is PDF,
in pa
rt or in
full,
on an
y retr
ieval
syste
m,
withou
t the E
XPRESS WRITTEN PERMISSIO
N of th
e cop
yrigh
t-hold
er

National Conference on Climate Change and Agricultural Production: Adapting Crops to Climate Variability and Uncertainty, 6th–8th April, 2017
[348]
IIHR1816xIIHR2852, IIHR1816xIIHR2853, IIHR1816xIIHR2890, IIHR2850xIIHR2852, IIHR2891xIIHR2853, IIHR2892xIIHR2852 and IIHR2892xIIHR2890 were best performing in maximum number of quality and yield attributing traits like vitamin C, carotenoids, lycopene, pericarp thickness, average fruit weight and yield/plant, hence they can be further evaluated and used for cultivation in Bengaluru’s condition since their performance is on par with that of standard check hybrids in many of the characters.
REFERENCES [1] Rao A V and Rao L G 2007. Carotenoids and human health. Pharmacological Research 55: 207–216. [2] Rick C M 1969. Origin of cultivated tomato (Lycopersicon esculentum Mill.), current status and the problem. Abstract, XI International
BotanicalCongress, pp: 180.
Evaluation of Drought Tolerant Rice Varieties under Various Methods of Stand Establishment in Rainfed Drought-Prone Condition of Bihar
Rajeev Singh, Nityanand, G.S. Panwar*, Sudhanshu Singh and Ashok Yadav Krishi Vigyan Kendra, Aurangabad, Bihar Agricultural University, Sabour–813210, Bhagalpur, India
E-mail: *[email protected]
Keywords: Rainfed rice, Direct seeded rice, Yield, Economics
INTRODUCTION
In India, rice occupies an area of 44 m ha with an average production of 90 m tonnes, with productivity of 2.0 tones/ha. Demand for rice is growing every year and it is estimated that in 2025 AD, the requirement would be 140 m tonnes. According to the projections made by the Population Foundation of India, India’s population will be1546 million by the end of 2030. It is estimated that the demand for rice will be 121.2 m tones. Rice cultivation requires large quantity of water and for producing 1 kg rice, about 3,000–5,000 litres of water is required depending on the different rice cultivation methods. There are evidences that cultivation of rice through direct seeding can increase rice yields and reduce water consumption as well as cost of production. Increasing water scarcity is becoming real threat to rice cultivation. Introduction of DSR is an alternative practice to solve water crisis, and as a methodology for increasing the productivity of rainfed rice. Hence, a field experiment was conducted to evaluate the performance of rice varieties under different crop establishment methods in rainfed ecology.
MATERIALS AND METHODS
The field experiments were carried out at the KVK, Aurangabad and farmers’ field (Latitude: 24.500 N, Longitude: 84.700 E, Mean sea level height: 332ft) during wet season 2014 and 2015 in rainfed lowland having clay loam soil type. Three rice varieties; Sahbhagi Dhan, Sushk Samrat and Abhishek were evaluated under three different method of establishment with BMP cultivation practices. The experiment was laid out in a split plot design (SPD) with four replications at KVK and one at farmers field in first year and second year four replications at KVK and five at farmers’ field. Three varieties were tested in (Direct seeded rice) DSR, unpuddled transplanted rice (UPTR) and puddled transplanted rice (PTR). Experimental field was fertilized with 80:40:20:25 kg NPK and Zn/ha. Chemical and mechanical weed control methods were used to control the weeds as practiced under BMP.
It is I
LLEGAL t
o cop
y, pri
nt or
save
any c
onten
t of th
is PDF,
in pa
rt or in
full,
on an
y retr
ieval
syste
m,
withou
t the E
XPRESS WRITTEN PERMISSIO
N of th
e cop
yrigh
t-hold
er

National Conference on Climate Change and Agricultural Production: Adapting Crops to Climate Variability and Uncertainty, 6th–8th April, 2017
[349]
RESULTS AND DISCUSSION
Number of tiller/m2 (297, 273), Number of panicle/m2 (280, 253) number of total grains/panicle (181, 172), number of filled grains/panicle (160, 156) were recorded maximum in DSR treatment which was significantly higher than UPTR and transplanted rice in both years. Number of unfilled grains/panicle were lower in PTR method (13.6, 10.2), which was significantly lower compared to UPTR and DSR method. However, panicle length was not significantly influenced by different method of establishment. Test weight was also not significantly affected by method of establishment. Days taken to 50% flowering and Maturity recorded maximum in UPTR being at par with PTR but both were significantly higher over DSR. Biological yield (11259, 10190 Kg/ha), grain yield (5262, 4390 kg/ha) and straw yield (5996, 5800 kg/ha) in DSR were significantly more over UPTR and PTR method. Net return Rs/ha (Rs. 34595, 25597/ha and benefit- cast ratio recorded maximum with DSR method (2.23, 1.90) were significantly more over UPTR and PTR method in both year. Similar result were also reported by Sharswat et al. (2010) and Bhullar et al. (2012). Number of tiller/m2 recorded maximum with Sushk Smarat (301, 275) which was significantly higher over Sahbhagi and Abhishek. Number of panicle/m2 was recorded significantly higher with Sushk Samrat (275, 251) and Sahbhagi over Abhishek (255.48) Number of total grain/ panicle, filled grain were significantly higher with Sushk Smrat over Sahbhagi and Abhishek.Number of unfilled grains/panicle recorded lower in Abhishek being at par with Susk Smrat which were significantly lower than Sahbhagi. However, panicle length (27.3cm) in Sushk Samrat was significantly higher. Test weight recorded in Sushk Samrat was also significantly higher over Sahbhagi Dhan and Abhisek.Days taken to 50% flowering and maturity were maximum in Abhishek over Sahbhagi and Sushk Smrat. Biological yield (11123, 10107 kg/ha), grain yield (5241, 4379 Kg/ha) and straw yield (5882, 5728 Kg/ha) were recorded significantly higher with Sushk Samrat. However, Harvest index was recorded significantly higher with Abhishek being at par with Sushk Samrat over Sahbhagi in. Net return (Rs. 31585, Rs. 22685/ha) and Benefit-cost (2.05,1.73) ratio was also significantly more in Sushk Samrat over Sahbhagi and Abhishek.
REFERENCES [1] Bhullar M S, Walia U S, Walia S S, Gill G and Kaur T 2012.Impact of establishment techniques brown manuring and weed control on
productivity of dry seeded rice (Oryza sativa L.) in semi-arid sub-tropical regions of Northern India, pp. 83. (In) Proceedings of International Conferenceon ClimateChange, Sustainable Agriculture and Public Leadership, held during 7–9 February, 2012 at NASC, New Delhi.
[2] Saharawat Y S, Singh S, Malik R K, Ladha J K, Gathala M, Jat M L and Kumar V 2010. Evaluation of alternative tillage and crop establishment methods in a rice–wheat rotation in NorthWestern IGP. Field Crops Research 116: 260–267.
It i
s ILL
EGAL to c
opy,
or sa
ve an
y con
tent o
f this
PDF,
in pa
rt or in
full,
on an
y retr
ieval
syste
m,
withou
t the E
XPRESS WRITTEN PERMISSIO
N of th
e cop
yrigh
t-hold
er

National Conference on Climate Change and Agricultural Production: Adapting Crops to Climate Variability and Uncertainty, 6th–8th April, 2017
[350]
Influence of Sowing Environments on Yield Attributes and Yield of Wheat (Triticum aestivum L.) Varieties under System of Wheat
Intensification and its Effect on Soil Fertility
A.K. Sonkar and J.K. Singh* Department of Agronomy, Institute of Agricultural Sciences,
Banaras Hindu University, Varanasi–221005, India E-mail: *[email protected]
Keywords: Soil Fertility, Sowing Dates, SWI, Wheat
INTRODUCTION
Wheat is an important cereal crop grown on 30.47 million ha area in India; producing 95.85 million tonnes of grain with an average productivity of 3146 kg/ ha (Agriculture Statistics at a glance, 2015). Wheat yield is far below than the potential yield due to many factors of which sowing time being most important. Hence, yield potential of wheat can be exploited by planting it at optimum time. Moreover, techniques of the System of Rice Intensification (SRI) has been extended to wheat and other crops with observed significant results. To assess such finding with respect to wheat, an experiment was conducted to find optimum planting time of different varieties under system of wheat intensification.
MATERIALS AND METHODS
A field experiment was carried out at Varanasi during winter season of 2014–15 with 18 treatment combinations comprising of three dates of sowing (25 November, 02 December and 09 December), wheat varieties (‘HUW-234’, ‘HUW-510’ and ‘HUW- 468’) and two systems of sowing (standard practices at 22.5 cm and system of wheat intensification (SWI) at 20x20 cm) were laid out using split-split plot design with three replications. In SWI, 25 kg seeds were selected by 20% saltwater solution. The seeds were treated with a biological mixture of 2 kg of vermicompost, 3-litre of cow urine and 2 kg of jiggery well-mixed together in an earthen pot with 10-litre of warm water (60 °C). The seeds were soaked in this mixture for 6–8 h. The treated seeds were then kept in the shade for 10–12 h, wrapped in rough linen (gunny bag), and during this period the seeds fully sprouted. The sprouted seeds were sown in the field by dibbling, planting two seeds/ hill, with the hills spaced in a square pattern of 20 × 20 cm apart. Seeds were sown at a depth of 2.5–3.0 cm, the soil having sufficient moisture to germinate the seeds.
RESULTS AND DISCUSSION
Results revealed that sowing of wheat on 25 November was recorded higher growth parameters, yield attributes, grain and straw yield and net return than 2 December and 9 December sown crop (Table 1). However, 25 sowing of crop observed longer duration of maturity (105-day) over rest of the sowing dates. The per cent increase in grain yield under 25 November over 2 and 9 December sowing crop was 34.9 and 9.7, respectively. Further, 9 December sowing of crop retained the higher available NPK in soil after harvest of the crop. Among wheat varieties, ‘HUW-234’ recorded higher growth parameters, yield attributes, grain and straw yield and net return than ‘HUW-510’ and ‘HUW-468’. Available NPK in soil after harvest of the crop were higher in ‘HUW-468’. Further, between systems of sowing, SWI was recorded higher growth and yield attributes, grain and straw yield over standard system of sowing. Further, per cent increase in grain yield by SWI at 20 cm20 cm over standard practice at 22.5 cm row spacing was 8.4. Relative economics indicated maximum net return (`90674/ ha) and benefit: cost ratio (2.76) was found with wheat variety ‘HUW-234’ under 25 November sown crop in system of wheat intensification.
REFERENCE [1] Agriculture Statistics at a glance 2015. Government of India, Ministry of Agriculture and Farmers Welfare, Department of Agriculture,
Cooperation & Framers Welfare, Directorate of Economics and Statistics, New Delhi, pp: 86-87.
It is I
LLEGAL t
o cop
y, pri
nt or
save
any c
onten
t of th
is PDF,
in pa
rt or in
full,
on an
y retr
ieval
syste
m,
withou
t the E
XPRESS WRITTEN PERMISSIO
N of th
e cop
yrigh
t-hold
er

National Conference on Climate Change and Agricultural Production: Adapting Crops to Climate Variability and Uncertainty, 6th–8th April, 2017
[351]
Table 1: Effect of Sowing Dates and System of Sowing on Growth Parameters, Yield Attributes, Yield, Net Return and Available NPK in Soil after Harvest of Wheat Varieties
Trea
tmen
t
Pla
nt H
eigh
t (
cm)
at H
arve
st
Dry
Mat
ter
Acc
umul
atio
n
(g/ r
unni
ng m
) a
t H
arve
st
Leaf
-Are
a In
dex
a
t 9
0 D
AS
Phy
siol
ogic
al
Mat
urit
y (D
ays)
Eff
ecti
ve T
ille
rs m
-2
(No.
)
Gra
ins
Spi
ke-1
(No.
)
10
00
-Gra
in
Wei
ght
(g)
Yie
ld (
t/ h
a)
Net
Ret
urn
(x
10
3`/
ha)
Ava
ilab
le N
utri
ents
(k
g/ h
a)
Dates of Sowing (D) Grain Straw N P2O5 K2O November, 25 97.6 199 4.6 105 333 38.2 37.5 3.83 6.08 90.7 182 22.6 165 December, 02 95.4 191 4.3 100 310 37.9 35.9 3.49 5.87 75.7 210 25.0 169 December, 09 93.2 186 3.9 93 285 34.9 33.1 2.84 5.12 59.8 233 28.1 176 SEm± 1.05 1.7 0.12 1.5 5.5 0.39 0.48 0.016 0.028 1.68 6.2 1.03 3.2 CD (P=0.05) 2.92 4.6 0.34 4.1 16 1.08 1.34 0.045 0.078 3.65 20 2.86 8.8 Varieties (V) HUW-234 100.3 196 4.8 102 324 38.6 36.2 3.61 5.80 88.1 198 23.1 166 HUW-510 96.6 192 4.2 100 314 36.3 35.9 3.35 5.72 73.3 215 25.1 170 HUW-468 89.4 188 3.9 97 296 36.1 34.4 3.21 5.54 62.3 230 27.5 172 SEm± 1.13 1.6 0.14 1.2 6 0.34 0.27 0.019 0.024 1.65 5 1.27 2.1 CD (P=0.05) 2.46 3.4 0.30 2.7 14 0.74 0.60 0.042 0.052 3.56 16 2.77 4.6 D x V S NS NS NS NS S S S S NS NS NS NS System of sowing (S) Standard Practice 94.1 190 4.1 98 290 36.2 34.7 3.25 5.57 71.2 218 24.3 168 SWI 96.8 194 4.5 101 323 37.8 36.3 3.53 5.80 93.0 228 26.2 172 SEm± 1.03 1.4 0.08 1.2 3 0.21 0.26 0.016 0.024 1.61 4 0.82 1.7 CD (P=0.05) 2.16 3.0 0.17 2.5 12 0.45 0.56 0.035 0.051 3.35 12 1.72 3.6 D x V x S NS NS NS NS NS NS NS NS NS NS NS NS NS
Standard Practice (S1) at 22.5 cm and System of wheat intensification (S2) at 20 x 20 cm spacing.
Effect of Nitrogen Management in Boro Rice during Post-Flood Environment in Rainfed Lowland Rice Ecosystem
Pooja*, U.P. Singh, J.K. Singh, Swati S. Pradhan and Sandeep Kumar Department of Agronomy, Institute of Agricultural Sciences,
Banaras Hindu University, Varanasi–221005, Indian E-mail: *[email protected]
Keywords: Boro Rice, Nitrogen Management, Nitrogen Recovery, Yield
INTRODUCTION
The boro rice is commonly known as winter rice.The boro rice in India accounted for around 12.6 m.tons or about 12% of the total 105.3 m tons of rice production from 2.1m ha area (Ministry of Agriculture, Govt. of India, 2014). Nitrogen is one of the major inputs to paddy which have favourable effect on its yield attributes (Qiao et al., 2011). As we know that there has been long-term adverse effect of continuous and indiscriminate use of inorganic fertilizers more, particular N-fertilizer due to low recovery and losses in soil-plant systems. Further, splitting of N-fertilizer is to be a better option. Hence, objective of the experiment was to identify levels and scheduling of nitrogen to achieve higher yield from bororice.
It is I
LLEGAL t
o cop
y, pri
nt or
save
any c
onten
t of th
is PDF,
in pa
rt or in
full,
on an
y retr
ieval
syste
m,
withou
t the E
XPRESS WRITTEN PERMISSIO
N of th
e cop
yrigh
t-hold
er

National Conference on Climate Change and Agricultural Production: Adapting Crops to Climate Variability and Uncertainty, 6th–8th April, 2017
[352]
MATERIAL AND METHODS
The study was conducted at Varanasi during the winter (boro) season of 2014–2015 with variety ‘IR 64’. The soil was sandy clay loam and moderately fertile being low in available nitrogen and zinc, medium in availablephosphorus and potassium. The experiment was laid out in RBD with 14 treatment and 3 replications. Nitrogen was applied as per the treatment. However, 60-60-5 kg PKZn/ ha were applied at the transplanting. Two to three seedlings/ hill of 92-day old seedlings was transplanted at 20x10 cm spacing on 13th February and harvested on 12th June, 2015. There were nine irrigations applied during the crop period.Rainfall received in the month of April was 61.3 mm out of total 90.1 mm during the crop period. Two manual weeding (35 and 50 DAT) were done to control weeds.
RESULTS AND DISCUSSION
All growth parameters were significantly affected by the treatment and significantly higher with the application of 150 kg N/ha [¼ at basal + ¼ at Active Tillering (AT) + ¼ at Panicle Initiation (PI) + ¼ at Heading (H) (T13)] over rest of the treatment (Table 1). The per cent increase in dry matter partitioning by root, stem, leaf and panicle with the application of 150 kg N/ha [¼ at basal + ¼ at AT + ¼ at PI + ¼ at H (T13)] over the control was 36.6, 112.8, 72.9 and 47.3, respectively. Application of 150 kg N/ ha either as 1/3 at basal + 1/3 at AT+ 1/3 (T12) or as ¼ at basal + ¼ at AT + ¼ at PI + ¼ at H (T13) being statistically at par with other and exhibited higher values of effective tillers/ m2, panicle length, grain/ panicle and test weight as compared to rest of the treatment. Further, application of 150 kg N irrespective of it scheduling being at par with 120 kg N/ ha either applied as ½ at basal+ ¼ at AT+ ¼ at PI (T6) or as ¼ at basal+ ¼ at AT+ ¼ at PI + ¼ at H (T9) recorded significantly more grain yield of boro rice over rest of the treatment. However, among scheduling of levels of nitrogen, 90 kg / ha (1/3 at Basal+ 1/3 at AT+ 1/3 at PI) found higher partial factor productivity (38 kg grain/ kg N) with 1.76% nitrogen harvest index. Thus, this is concluded that 150 kg N(¼ at basal + ¼ at AT + ¼ at PI+ ¼ at H) followed by 150 kg N/ha (½at basal+¼at AT+¼at PI) fetched higher grain yield, net returns and B: C ratio from bororice.
REFERENCE [1] Qiao J F, Liu Z H, Deng S Y, Ning H F, Yang X Y, Lin Z M, Li G H, Wang Q S, Wang S H and Ding Y 2011. Occurrence of perfect and
imperfect grains of japonica rice as affected by nitrogen fertilizer.Plant and Soil 349: 191-202.
It is I
LLEGAL t
o cop
y, pri
nt or
save
any c
onten
t of th
is PDF,
in pa
rt or in
full,
on an
y retr
ieval
syste
m,
withou
t the E
XPRESS WRITTEN PERMISSIO
N of th
e cop
yrigh
t-hold
er

National Conference on Climate Change and Agricultural Production: Adapting Crops to Climate Variability and Uncertainty, 6th–8th April, 2017
[353]
Effect of Puddling on Rice Varieties and Succeeding Lentil under Drought-Prone Rainfed Lowland Environment of Eastern India
G.S.Panwar1*, Suborna1, Roy Choudhary1, Amarendra Kumar1, Sanjay Kumar1, Sudhanshu Singh2, Ashok Yadav3 and Virendar Kuma R.4
1Bihar Agricultural University, Sabour-Bhagalpur–813210, India 2IRRI-India, New Delhi–110008, India
3IRRI-CSISA-Hub, Bhubaneswar–751003, India 4IRRI-IRRAS Project, Patna–800013, India
E-mail: *[email protected]
Keywords: Rice, Puddling, Unpuddling, Yield, Drought
INTRODUCTION
Transplanting rice (Oryza sativa L.) seedlings in puddled soil is a common practice of lowland rice production in the tropics and subtropics of Asia. Despite the proven advantages of puddling in rice, its adverse effect on subsequent crops is not unlikely. Puddling creates soil physical condition detrimental to the following crop in rice-based cropping system and makes land preparation difficult resulting in cloddy soil structure, loss of soil moisture, delayed planting and inadequate seed-soil contact (Sharma et al., 1995). Un-puddled transplanting of rice is reported to give similar yield compared to conventional puddling with additional benefits in fuel and water savings to the extent of 31–76% and 25–26%,respectively (Islam et al., 2012). Puddling deteriorates the physical properties of soil and creates negative impact on growth and development of succeeding crops in dry season. As an alternative practice, rice seedlings can be planted after rainfall without puddling at saturation level of soil on clean field which saves the water required for puddling. It also saves soil from harmful effect of puddling and encourages good growth of succeeding dry season crops like lentil/ lathyrus/ field pea/ faba bean. Considering above facts in view, an experiment was conducted to evaluate drought tolerant rice varieties/ genotypes under puddled and un-puddled tillage systems and also to study their impact on succeeding pulse crops in sequence sown with farmers’ practice and zero tillage machine by utilizing available residual moisture in rice field during rabi season.
MATERIAL AND METHODS
A field experiment was conducted during 2013–14 and 2014–15 at Research Farm of Bihar Agricultural University, Sabour having sub-tropical climate characterized with hot desiccating summer, cold winter and moderate rainfall. The soil of the experimental field was loamy in texture with slightly alkaline pH (7.48) and medium fertility status having O.C., N, P2O5 and K2O to the tune of 0.63%, 203.2, 22.6 and 220 kg/ha, respectively. The experiment having three replications was conducted with two planting methods of rice (Puddled and unpuddled) in the main plots, and seven rice genotypes, Sahbhagi Dhan,, CR Dhan 40, Sushk Samrat, IR83387-B-B-40-1, IR84899-B-183-CRA-19-1, IR82870-11 and Abhishek,in sub-plots in wet season, and in subsequent dry seasons, lentil (variety HUL 57) with two sowing methods (Paira and Zero Till) was super-imposed in sub-sub plots. Under un-puddled transplanting, the field was ploughed once under dry condition followed by harrowing and levelling once before water ponding, and transplanting of seedlings was done in saturated field condition. For puddled transplanting, the field was ploughed twice under dry condition, puddled twice at an interval of 4–5 days and then levelled properly. During both seasons, sowing of treated and pre-germinated seed for nursery raising was done in last week of June to accomplish transplanting in puddled and non-puddled conditions. Transplanting of 28 days old seedlings was done
It is I
LLEGAL t
o cop
y, pri
nt or
save
any c
onten
t of th
is PDF,
in pa
rt or in
full,
on an
y retr
ieval
syste
m,
withou
t the E
XPRESS WRITTEN PERMISSIO
N of th
e cop
yrigh
t-hold
er

National Conference on Climate Change and Agricultural Production: Adapting Crops to Climate Variability and Uncertainty, 6th–8th April, 2017
[354]
manually at a spacing of 20x15 cm both under puddled and non-puddled transplanted. Crop was fertilized with recommended fertilizer rates in both conditions. Weeds were controlled properly through recommended herbicides and manual weeding. In dry season, as per treatment protocol, paira sown lentil was broadcast in standing crop of rice 10 days prior to harvest, whereas zero till sowing was done by zero till machine after rice harvest utilizing available residual moisture in the rice field.
RESULTS AND DISCUSSION
Sahbhagi dhan and IR82870-11 performed better than other varieties in terms of yield, economic returns and overall system productivity as well as profitability. Omission of puddling in rice improved root nodulation and yield of subsequent lentil crop and productivity and profitability of rice-lentil system. Zero-till method of sowing lentil recorded higher yield of lentil, besides higher system productivity and net returns compared to paira sowing method. However, rice genotypes had no significant influence on yield and economic returns of subsequent lentil crop in the sequence. Omission of puddling has no adverse effect on yield of rice but results in better yield of subsequent dry season crop lentil, and profitability and profitability of rice-lentil system. Zero-till lentil recorded higher seed yield of lentil, besides higher system productivity and net returns compared to paira sowing method. Sahbhagi dhan and IR82870-11 performed better than other varieties in terms of yield, economic returns and overall system productivity as well as profitability.
Table 1: Productivityand Profitability of Rice-lentil System under Paira and ZT sown Lentil Preceded by Puddled and Un-puddled Rice (Pooled of Two-year)
Rice Genotypes Rice Equivalent Yield (kg/ha) Total Net Returns (Rs/ha) Lentil Paira Lentil ZT Lentil Paira Lentil ZT
Pud
dled
R
ice
Non
-P
uddl
ed
Ric
e
Pud
dled
R
ice
Non
-P
uddl
ed
Ric
e
Pud
dled
R
ice
Non
-pu
ddle
d
Ric
e
Pud
dled
R
ice
Non
-P
uddl
ed
Ric
e
SahbhagiDhan, 10045 11694 10787 12460 82480 102664 90920 111742 CR Dhan 40 10245 11280 10636 11720 84132 98880 90107 103059 SushkSamrat 9325 10678 10196 11153 73432 89959 82434 96265 IR83387-B-B-40-1 9124 10158 9573 10778 70147 83620 75222 91328 IR84899-B-183-CRA-19-1 8772 10070 9372 10797 65192 81283 73087 90392 IR82870-11 10284 11266 10948 11657 89587 96833 96492 103034 Abhishek 10245 11105 10819 11442 85150 95187 90617 101041 CD(P=0.05) 362 268 311 278 1112 1242 879 1298
REFERENCES [1] Alam M.K., Islam M.M., Salahin N. and Hasanuzzaman M. 2014. Effect of Tillage Practices on Soil Properties and Crop Productivity in
Wheat-Mungbean-Rice Cropping System under Subtropical Climatic Conditions. The Scientific World Journal 2014: 15 ttp://dx.doi.org/10.1155/2014/437283
[2] Islam A K M S, Hossain, M M, Saleque M A, Rahman, MA, Karmakar B And Haque M E 2012. Effect of minimum tillage on soil properties, crop growth and yield of aman rice in drought prone northwest Bangladesh. Bangladesh Agronomy Journal 15 (1):43-51.
[3] Sharma P K, Ingram K T and Harnpichitvitaya D 1995. Subsoil compaction to improve water use efficiency and yields of rainfed lowland rice in coarse–textured soils. Soil and Tillage Research 36: 33–44.
It is I
LLEGAL t
o cop
y, pri
nt or
save
any c
onten
t of th
is PDF,
in pa
rt or in
full,
on an
y retr
ieval
syste
m,
withou
t the E
XPRESS WRITTEN PERMISSIO
N of th
e cop
yrigh
t-hold
er

National Conference on Climate Change and Agricultural Production: Adapting Crops to Climate Variability and Uncertainty, 6th–8th April, 2017
[355]
Integrated Weed Management Studies in Onion
Sukhjinder Singh*, T.R. Nandal and Saurav Sharma Department of Vegetable Science and Floriculture, College of Agriculture
Chaudhary Sarvan Kumar Krishi Vishvavidhalaya, Palampur–176062, India E-mail: *[email protected]
Keywords: Randomized Block Design, Hand Weeding, Weed Management
INTRODUCTION
Onion (Allium cepa L.) is one of the most important vegetable crops in all over the world including India. It is most widely grown and popular vegetable crop among the alliums. It is consumed as fresh salad and/or added as a spice while cooking dishes. Apart from furnishing nutrition, it also provides relishing flavors to our dietes. Therefore, onion is popularly referred as ‘Queen of the kitchen’. Onion contains carbohydrates (11.0g), proteins (1.2g), fiber (0.6 g), moisture (86.8 g) and several vitamin like vitamin A (0.012 mg), vitamin C (11 mg), thiamin (0.08 mg), riboflavin (0.01 mg) and niacin (0.2 mg) and also some minerals like phosphorus (39 mg), calcium (27 mg), sodium (1.0 mg), iron (0.7 mg) and potassium (157 mg) (Rahman et al., 2013). Weeds posse’s production problems in onion fields. The weeds problem is becoming worse in irrigated areas where cropping intensity is rapidly increasing and weed management through cultivation practices has become a challenge (Uygur et at. 2010).
MATERIALS AND METHODS
The study was conducted at the Regional Research Station, Dhaulakuan CSK Himachal Pradesh Krishi Vishvavidyalaya, Palampur during Rabi 2013–14. The experiment was laid out with onion variety ‘N-53’ in a RBD and replicated thrice consisted of thirteen treatments.
RESULTS AND DISCUSSION
At harvest of the crop oxyfluorfen @ 0.30 kg ha-1 recorded significantly less dry weight of weeds (1.32 g m-2). The minimum dry weight of weeds was observed in weed free (1.00 g m-2) treatment. The maximum dry weight of weed was recorded in weedy check (15.87 g m-2) treatment. The minimum dry weight of weeds at all the stages of plant growth was recorded when oxyfluorfen @ 0.30 kg ha-1 was applied among herbicidal treatments and in weed free treatment among hand weeding. The maximum plant height (55.88 cm) was recorded in weed free treatment followed by two hand weeding (37.95 cm). Among herbicidal treatments oxyfluorfen @ 0.30 kg ha-1 recorded the maximum plant height (53.35 cm) and it was significantly higher from all other herbicidal treatments. The minimum plant height (13.69 cm) was recorded in weedy check treatment. It may be due to favorable environment in the root zone resulting in absorption of more water and nutrient from soil and good control of weed competition throughout the different growth stages of the crop.The maximum plant stand was recorded in weed free plot (276.33 per plot) and significantly higher among manual as well as herbicidal treatments. Oxyfluorfen @ 0.30 kg ha-1 (258.33 per plot) recorded maximum plant stand which was statistically at par with oxyfluorfen @ 0.20 kg ha-1 (251.67 per plot) and imazethapyr @ 0.10 kg ha-1 (253.00 per plot). The minimum plant stand was recorded in weedy check (204.33 per plot). This is may be due to the presence of higher number of weeds which competed with onion bulb for light, water, space and nutrients. Weed free treatment was responsible for better plant growth and development which resulted in better plant stand. In weed free treatment maximum bulb yield (272.22 q ha-
1) was recorded which was significantly higher from other treatments. Oxyfluorfen @ 0.30 kg ha-1 significantly recorded maximum yield (258.33 q ha-1) and significantly higher from other treatments. The minimum bulb
It is I
LLEGAL t
o cop
y, pri
nt or
save
any c
onten
t of th
is PDF,
in pa
rt or in
full,
on an
y retr
ieval
syste
m,
withou
t the E
XPRESS WRITTEN PERMISSIO
N of th
e cop
yrigh
t-hold
er

National Conference on Climate Change and Agricultural Production: Adapting Crops to Climate Variability and Uncertainty, 6th–8th April, 2017
[356]
yield was recorded in weedy check treatment (84.17 q ha-1). This might be due conservation of nutrients, increased soil temperature, prevention of water evaporation from soil and sustained adequate soil moisture at outer soil surface, where most onion root occur 0 to 30 cm. Therefore, searching for moisture to further soil depths is not required which in turn source sink assimilate for the vegetative growth and yield. Maximum Benefit: cost ratio (2.20) was recorded in weed free treatment. Among herbicidal treatments maximum benefit: cost ratio (2.92) was observed when application of oxyfluorfen @ 0.30 kg ha-1 was done. Hence application of oxyfluorfen @ 0.30 kg ha-1 found to be superior among herbicidal treatments for profitable production of onion.
Table 1: Effect of Treatments on Weed Dry Weight, Plant Height, Plant Population, Bulb Yield, B:C ratio Treatments Weed Dry Weight
(g m-2) Plant Height
(cm) Plant
Population Bulb Yield
q ha-1 B:C ratio
Clodinofop fb one HW (0.06 kg ha-1) 3.85 15.24 228.00 129.94 0.89 Imazethapyr fb one HW (0.06 kg ha-1) 3.68 28.93 231.00 120.83 0.76 Imazethapyr (0.08 kg ha-1) 4.40 32.14 235.00 163.61 1.50 Imazethapyr (0.10 kg ha-1) 2.25 47.16 253.00 195.06 1.98 Oxyfluorfen fb one HW (0.10 kg ha-1) 3.42 26.33 232.67 148.61 1.16 Oxyfluorfen (0.20 kg ha-1) 1.90 41.88 251.67 226.61 2.45 Oxyfluorfen (0.30 kg ha-1) 1.32 53.35 258.33 258.33 2.92 Pendimethalin (1.5 kg ha-1) 3.78 17.31 228.33 174.44 1.65 Quizalofop fb one HW (0.06 kg ha-1) 4.52 23.58 231.67 128.33 0.87 Two hand weeding 2.85 37.95 230.33 120.94 0.69 Farmer practice (Three HW) 1.35 33.61 241.33 218.89 1.93 Weed free 1.00 55.88 276.33 272.22 2.20 Weedy check 15.87 13.69 204.33 84.17 0.30 CD (P=0.05) 0.54 3.47 11.21 17.94 0.26
REFERENCES [1] Rahman H, Ullah K, Sadiq M, Javaria S, Ullah I and Khan M A 2012. Relationship between manual weeds removal timings and onion Yield.
Pakistan Journal of Weed Science Research 18: 201-207. [2] Uygur S, Gurbuz R and Uygur F.N. 2010. Weeds of onion fields and effects of some herbicides on weeds in Cukurova region, Turkey. African
Journal of Biotechnology 42: 7037-7042
Weed Management in Direct Seeded Rice in Rainfed Upland Ecology
Amit Kumar1* G S Panwar1, Sanjay Kumar1, S.R. Chaudhury1, Sudhanshu Singh2, Ashok Yadav2 and Ravi Gopal Singh1
1Department of Agronomy, Bihar Agricultural University Sabour–813210, Bhagalpur 2IRRI India Delhi–110008, India E-mail: *[email protected]
Keywords: Direct Seeded Rice, Weed Control, Rainfed
INTRODUCTION
Rice (Oryza sativa L.), a staple food crop in India, is grown on 42.5 m ha, which is the largest area among rice growing countries and provides 29% of the caloric requirement in India. (Chauhan 2015) Worldwide, it feeds about 50% of the population and provides 19% of the global calorie intake. Therefore, sustaining and improving the production of rice is essential for global food security. Transplanting is now facing several constraints i.e. non-availability of labour in time, late rice transplanting, drudgery to farm workers, high water use and restricted root system. The non-availability of labour in time often results in shortages and increasing
It is I
LLEGAL t
o cop
y, pri
nt or
save
any c
onten
t of th
is PDF,
in pa
rt or in
full,
on an
y retr
ieval
syste
m,
withou
t the E
XPRESS WRITTEN PERMISSIO
N of th
e cop
yrigh
t-hold
er

National Conference on Climate Change and Agricultural Production: Adapting Crops to Climate Variability and Uncertainty, 6th–8th April, 2017
[357]
labour costs. However, weeds are one of the limiting factors in direct- seeded rice, which reduce the yield up to 50–100%. (Bhullar 2015)
METERIALS AND METHODS
A field experiment was conducted duringkharifseason of 2014-and 20 at Bihar Agricultural University, to find out the cost-effective weed management practice affecting growth and yield of direct seeded rice. The experiment consisted of twelve weed control treatments viz. (mention treatments) was laid out in randomized complete block design with three replications and rice variety Susk Samrat as test crop.. Recommeded package of fertilizers @ 120 kg N, 60 kg P2O5 and 40 kg K2O/ha were applied uniformly through urea, single super phosphate and muriate of potash, respectively. Data on weed growth, yield performance and economics were recorded following standard procedures.
RESULTS AND DISCUSSION
Table 1: Weed Growth, Yield and Economics of Rice as Influenced by different Weed Control Treatments Treatment Weed Dry
Matter (gm-2) Weed Control Efficiency (%)
Grain Yield (qha-1)
B:C Ratio
T1 -Weedy check 11.94 (142.1) 0.0 38.1 1.67 T2- Weed free 0.71(0.00) 100.00 54.2 2.31 T3 - Pendimethalin @ 1.0 kg a.i./haas PE 8.56 (72.70) 48.12 38.4 2.21 T4 - Bispyribac-sodium @ 30 g a.i./ha as PoE 5.14 (26.0) 81.08 42.5 2.44 T5- Pendimethalin 1.0 kg a.i/ha fb bispyribac- sodium @ 25 g a.i./ha as PoE 4.73 (21.90) 82.95 45.4 2.42 T6- Pendimethalin 1.0 kg a.i./ha fb ethoxysulfuron @ 18.5 g a.i../ha as PoE 5.32 (27.80) 82.01 46.6 2.55 T7 -Pendimethalin @ 1.0 kg a.i./haas PE fb penoxsulam @ 22.5 g a.i./ha as PoE,
4.63 (20.9) 85.22 47.3 2.60
T8- Pendimethalin 1.0 kg a.i. /ha fb pyrazosulfuron + bispyribac- sodium @ 20+20 g a.i./ha as post-emergence
4.84 (22.90) 83.35 48.2 2.56
T9 –Pendimethalin fb Azimsulfuron +Bispyribac- sodium @ 1.0 Kg a.i./haPre-emergence fb @ 12.5+20 g a.i./ha Post-emergence,
4.53 (20.0) 85.75 48.0 2.57
T10 – Bispyribac sodium @ 25 g. a.i./ha + fenoxaprop (with safener) @ 60 g a.i./haas post-emergence
4.72 (21.80) 84.75 49.3 2.70
T11 - Penoxsulam + cyhalofop (RM) @ 150 g a.i./haas post-emergence 4.14 (16.60) 86.97 50.5 2.86 T12 - Pendimethalin 1.0 kg a.i./haas pre-emergence fbbispyribac-sodium @ 25 g a.i./ha as post-emergence + 1H.W.
4.27 (17.80) 88.06 53.9 2.56
LSD (P= 0.05) 0.07 1.12 5.6 0.31
The relative density of grasses, broad leaved weeds and sedges were 34.2, 28.4 and 36.1 % at 60 DAS. The maximum weed dry matter was recorded in weedy check at all stages of crop growth. Among the weed control treatments, minimum weed dry matter was recorded with treatment T12 pendimethalin fb bispyribac sodium + 1 HW followed by T11 penoxsulam + cyhalofop at 60 DAS of crop growth stages. However, total weed density of grassy weeds was minimum in T12 pendimethalin fb bispyribac sodiumwith one hand weeding (1.95) and T11penoxysulam + Cyhalofop T11 (2.02) which was significantly lower over rest of the treatments These treatments had greater reduction in total weed density and dry matter accumulation than other herbicidal treatments, hence they led to record higher weed control efficiency of 88.0 and 86.9% in T12 and T11, respectively. This could be attributed to greater reduction of dry weight of weeds by the combined effect of herbicides and hand weeding at later stage. Similar finding was reported by Subbaiah and Sreedevi (2005). Significantly higher grain yield was recorded in weed free plot (54.2 q/ha). The higher yield in weed free plot was mainly due to the complete elimination of weeds throughout the crop growth which enabled minimum competition and causing better plant growth along with higher values of yield attributing characters. Among the herbicidal treatments, pendimethalin fbbispyribac sodium with one hand weeding produced at par grain yield (53.9 q)with penoxsulam+ cyhalofop (50.5 q/ha) and bispyribac sodium + fenoxaprop with safener (49.3 q/ha) and significantly higher grain yield over rest of the treatment. Herbicidal treatments resulted in considerably lower cost of cultivation as compared to the treatment T12. However,
It is I
LLEGAL t
o cop
y, pri
nt or
save
any c
onten
t of th
is PDF,
in pa
rt or in
full,
on an
y retr
ieval
syste
m,
withou
t the E
XPRESS WRITTEN PERMISSIO
N of th
e cop
yrigh
t-hold
er

National Conference on Climate Change and Agricultural Production: Adapting Crops to Climate Variability and Uncertainty, 6th–8th April, 2017
[358]
higher benefit cost ratio (2.80) was observed with T11 pinoxsulam + cyhalofop (RM).It was concluded that post-emergence application of pinoxsulam + cyhalofop (RM) 150 g/ha was most effective for controlling weeds, improving grain yield and profitability of direct-seeded rice in upland rainfed ecology for sustainable crop production.
REFERENCE [1] Subbaiah SV and Sreedevi B 2005. Efficacy of herbicide mixtures on weed control in direct seeded rice under puddled condition. Indian
Journal of Weed science 32 (3/4): 199-200.
Performance of Organic and Inorganic Sources of Nutrients in Paddy
Saurav Sharma*, J.P. Saini, Ranu Pathania and Sukhjinder Singh Department of Agronomy, Forages and Grassland Management, College of Agriculture,
Chaudhary Sarvan Kumar Krishi Vishvavidhalaya, Palampur–176062, India E-mail: *[email protected]
Keywords: Vermicompost, Organic Matter, Vermiwash
INTRODUCTION
Rice forms staple food for more than half of the world population. In India, rice- the most important and extremely grown food crop, occupied 45.54 m ha of land and produced 148.77 m t paddy (99.2 m t rice) and ranked 1st in area and 2nd in production (after China that produced 193.35 m t from 29. 49 m ha) in the world during the corresponding year 2008 (Anonymous 2012). The per hectare yield of paddy (3.267 t/ha) in India is well below the world’s average yield of 4.369 t/ha (Anonymous 2012). Continuous use of inorganic fertilizers has not only brought about loss of vital soil fauna and flora but also resulted in loss of secondary and micro nutrients. The prolonged and over usage of chemicals has resulted in human and soil health hazards along with environmental pollution (Yadav et al., 2013).
MATERIALS AND METHODS
The experiment was conducted at the research farm of CSK Himachal Pradesh Krishi Vishvavidyalaya, Palampur during kharif 2014. The experiment was laid out with rice variety ‘RP 2421’ in a Split Plot Design and replicated thrice consisted of eight treatments comprising of combinations of four nutrient management treatments viz., Organic nutrient management (soil & seed treatment, vermicompost (VC) 10 t ha-1 & 3 sprays of vermiwash at 15, 30, 45 days after sowing), Inorganic nutrient management (recommended NPK), Integrated nutrient management (5 tonnes VC + 50% of recommended NPK), Control (Farmer’s practices) (2.5 tonnes VC + 25% of recommended NPK) with two ecosystems i.e transplanted and direct seeded paddy were evaluated.
RESULTS AND DISCUSSION
Number of effective tillers m-2 at harvest was significantly higher in transplanted ecosystem as compared to direct seeded. Integrated nutrient management produced significantly more effective tillers m-2 over control but was at par with organic treatment. An increase in number of effective tillers m-2 in integrated treatment may be due to continuous and slow availability of nutrients which might have resulted in higher nutrient accumulation in plant cells. Simultaneously, vermicompost application might have improved soil aeration leading to better root growth, tillering and further more number of tillers was survived upto grain filling and contributed towards grain yield of rice. The transplanted ecosystem produced significantly more number of
It is I
LLEGAL t
o cop
y, pri
nt or
save
any c
onten
t of th
is PDF,
in pa
rt or in
full,
on an
y retr
ieval
syste
m,
withou
t the E
XPRESS WRITTEN PERMISSIO
N of th
e cop
yrigh
t-hold
er

National Conference on Climate Change and Agricultural Production: Adapting Crops to Climate Variability and Uncertainty, 6th–8th April, 2017
[359]
spikelet per panicle as compared to direct seeded. Among different nutrient management treatments, integrated practice produced significantly more numbers of spikelet panicle-1 as compared to other treatments. It could be ascribed to the slow release of nutrients after decomposition ensuring continued availability. Among nutrient management treatments, integrated nutrient management being at par with organic produced significantly higher grain yield as compared to other treatments. Farmer’s practice produced significantly lowest grain yield over all other treatments. Integrated and organic nutrient management treatments produced 41.84 and 35.07 per cent more grain yield over farmer’s practice, respectively. Higher growth due to integrated and organic nutrient management owing to improvement in physical, chemical and biological properties resulted in higher assimilation area and more leaf area duration better nutrient supply and better translocation of photosynthates to storage organs might have improved the yield attributes and ultimately grain yield. Moreover, organics besides supplying macro and micronutrient have also solubilizing effect on native soil nutrients due to the action of organic acids produced during decomposition. So it is concluded that the transplanted ecosystem with integrated and organic nutrient management practices in paddy cultivation proved to be significantly better for recording higher yield.
Table 1: Effect of Treatments on Yield attributes and Grain Yield of Paddy Treatments Number of Effective
Tillers (m-2) Number of Spikelets
Panicle-1 Grain Yield Net Returns
per Rupee Invested Ecosystems Transplanted 404.6 152.4 4.40 1.25 Direct seeded 302.1 131.3 3.71 0.83 CD (P=0.05) 44.8 12.1 0.39 0.18 Nutrient Management Organic 381.7 147.6 4.39 1.09 Inorganic 335.8 133.8 3.96 1.08 Integrated 412.5 153.8 4.61 1.18 Farmer’s Practice 283.3 133.0 3.25 0.80 CD (P=0.05) 34.1 3.7 0.25 0.12
REFERENCES [1] Anonymous 2012. Research achievements during Kharif 2010 and research programmes focusing Kharif 2011. In research highlights: Kharif-
2010- Research Priorities: Kharif-2011. pp: 14 [2] Yadav SK, Babu S, Singh Y, Yadav G S, Singh K, Singh R and Singh H 2013.Effect of organic nitrogen sources and biofertilizers on production
potential and energy budgeting of rice (Oryza sativa)-based cropping systems. Indian Journal of Agronomy 58 (4): 459-464.
Effect of Zinc Application under Different Salinity on Yield and Yield Attributes of Wheat
Sonia Rani*, Manoj Kumar Sharma and Pooja Rani Department of Soil Science,
CCS Haryana Agricultural University, Hisar–125004, India E-mail: *[email protected]
Keywords: Salinity, Wheat, Zinc
INTRODUCTION
Soil salinity is one serious constraint to crop production among the abiotic stresses. In such circumstances, in addition to imposing with certain management principals, proper nutrition has an important role in improving plant conditions. It was estimated that about 20% (45 million ha) of irrigated land, producing 1/3 of the world food production, is salt affected (Bartels et al., 2005). In salt affected areas, zinc application could alleviate Na
It is I
LLEGAL t
o cop
y, pri
nt or
save
any c
onten
t of th
is PDF,
in pa
rt or in
full,
on an
y retr
ieval
syste
m,
withou
t the E
XPRESS WRITTEN PERMISSIO
N of th
e cop
yrigh
t-hold
er

National Conference on Climate Change and Agricultural Production: Adapting Crops to Climate Variability and Uncertainty, 6th–8th April, 2017
[360]
and Cl injury in plants (Alpaslan et al., 1999). Therefore, present study investigates the effect of zinc application under different saline conditions on yield (g plant-1) and other yield attributes.
MATERIALS AND METHODS
A pot experiment was conducted in year 2013-2014 and wheat were grown in dune sand soil, at four salinity levels (ECe 4, 8 and 12 dS m-1), each dominated by chloride (Cl:SO4 = 7:3) and sulphate (Cl:SO4 = 3:7) salts separately under natural conditions of screen house. Each ECe treatment including non-saline control was established with four level of zinc (0, 5, 10 and 15 mg kg-1 soil). Each treatment was replicated thrice with completely randomized design.
RESULTS AND DISCUSSION
The results of investigations showed that salinity led to a considerably decrease in effective tiller (pot-1), grains spike-1, 100-grain weight (g), grain yield (g plant-1) and biological yield (g pot-1) and increased with increase in zinc application. Generally, it can be concluded that combination of zinc and salinity caused a wide range of physiological response in wheat plants, which ameliorate the harmful effect of salinity and 100-grain weight (g), grain yield (g plant-1) and biological yield (g pot-1) significantly increased with increase in zinc application. The results concluded that addition of zinc under saline conditions can improve the hazardous effect of increasing salinity on wheat yield and other yield attributes through decreasing the effect of salinity.On the basis of the present investigation it could be concluded that there was significantly, increase in 100-grain weight (g), grain yield (g plant-1) and biological yield (g pot-1). So, zinc application could be considered as a nutrient management tool, especially under salinity.
Table 1: Effect on Biological Yield (g pot-1) in Relation to Types of Salinity and Zinc Levels
Zn Levels (ppm)
Chloride Salinity (dS m-1) Zn levels (ppm)
Sulphate Salinity (dS m-1) 0 4 8 12 Mean 0 4 8 12 Mean
Zn0 19.15 17.01 15.29 12.48 15.98 Zn0 19.15 17.80 16.40 13.20 16.64 Zn5 21.39 18.39 16.26 13.01 17.26 Zn5 21.39 19.13 17.69 13.96 18.04 Zn10 24.32 19.46 18.16 13.98 18.98 Zn10 24.32 20.81 18.17 15.53 19.71 Zn15 25.94 20.88 19.25 15.07 20.29 Zn15 25.94 22.53 19.88 16.46 21.20
Mean 22.70 18.93 17.24 13.63 Mean 22.70 20.06 18.03 14.79 CD (p=0.05) CD (p=0.05) Chloride = 0.48 Sulphate = 0.74 Zinc = 0.48 Zinc = 0.74 Chloride × Zinc = 0.96 Sulphate × Zinc = 1.48
REFERENCES [1] Alpaslan M, InalA, GunesA, ÇikiliY and OzcanH 1999. Effect of zinc treatment on the alleviation of sodium and chloride injury in tomato
(Lycopersicum esculentum (L.) Mill. cv. Lale) grown under salinity. Turkish Journal of Agriculture and Forestry 23:1–6. [2] Bartels D and Sunkar R 2005. Drought and salt tolerance in plants. Critical Review of Plant Science 24(1): 23–58.
It is I
LLEGAL t
o cop
y, pri
nt or
save
any c
onten
t of th
is PDF,
in pa
rt or in
full,
on an
y retr
ieval
syste
m,
withou
t the E
XPRESS WRITTEN PERMISSIO
N of th
e cop
yrigh
t-hold
er

National Conference on Climate Change and Agricultural Production: Adapting Crops to Climate Variability and Uncertainty, 6th–8th April, 2017
[361]
Varietal Performance of Okra (Abelmoschus esculentus L. Moench) on Farmer's Field in Kishanganj District of Bihar
Hemant Kumar Singh1*, K.M. Singh1, Niraj Prakash1 and RK Sohane2
Farm Science Center, Kishanganj, Directorate of Extension, Bihar Agricultural University, Sabour, Bhagalpur–813210, India
E-mail: *[email protected]
Keywords: Okra, Variety, Yield, B:C ratio
INTRODUCTION
Okra, ladies’ fingers or bhendi, Abelmoschus esculentus (L.) Moench is cultivated in tropical, subtropical and warm temperate regions around the world. It is a good source of vitamin A, B, C and is also rich in protein, carbohydrates, fats, minerals, iron and iodine. The immature pods are used as vegetable and its dried form is often used as soup thickener. In India, the total area of cultivation of okra was 532.7 thousand hectare, production was 6346.4 thousand tonnes and productivity was 11.9 t ha-1. Bihar holds second rank in okra production in the country however, West Bengal first rank (NHB, 2015). The farmers of Bihar mostly save their own seed for cultivation of okra. However, old traditional cultivars and poor seed quality often result poor yield and ultimately lower productivity (Meher et al., 2016). In Northern region of Bihar, okra is cultivated in almost all the districts. However, the productivity of these areas is not upto the mark comparing to some other okra growing regions. There is a considerable gap between the yield at farmers and experimental field. A good number of improved cultivars of private seed companies are now available locally in the market as well as farmers of the Kishanganj district are also taking interest for these new cultivars but they don’t know the best one. Considering the importance of okra in the terms of national and international markets, On Farm Testing demonstrations of four high yielding varieties/hybrids of okra developed by public sector were given in the farmer’s field of Kishanganj district of Bihar. Therefore, keeping the above points in mind, a research work has been formulated with an objective to evaluate their yield performance in comparison to the existing cultivars of this district to support the farmers in okra cultivation.
MATERIALS AND METHODS
The present experiment was laid out in Complete Randomized Block Design during the summer season (2015 & 2016) with ten replications under supervision of Farm Science Centre, Kishanganj, on different farmer’s fields in Kishanganj district of Bihar. These farmers were selected for the on Farm Testing of improved okra varieties/ hybrids based on their area and production. The plot size was kept 4.5m2 and plant spacing was given 45×30 cm. The sowing was done in second week of February, 2015 and 2016. The reactions of four commercial varieties of okra viz., Kashi Kranti, Kashi Pragati, Arka Anamika, Parbhani Kranti and existing cultivars were evaluated under farmer’s field condition. During the initial survey it has been found that majority of the growers are not satisfied with the existing cultivars due to their low yield and high infestation of pests and diseases. The yield data of demonstrated okra varieties/hybrids were collected along with the yield of practicing varieties/hybrids by the farmers in a particular district for two years, which was further analyzed and district wise mean yield value was calculated. The demonstrations of above okra varieties were regularly monitored and desired data were collected with the help of a questionnaire developed for the purpose (Thakral and Bhatnagar 2002), which was further analyzed for drawing the inferences. These improved varieties were demonstrated at 10 farmer’s field of different villages. Five competitive plants of each variety and replications were selected for taking observations. The observations
It is I
LLEGAL t
o cop
y, pri
nt or
save
any c
onten
t of th
is PDF,
in pa
rt or in
full,
on an
y retr
ieval
syste
m,
withou
t the E
XPRESS WRITTEN PERMISSIO
N of th
e cop
yrigh
t-hold
er

National Conference on Climate Change and Agricultural Production: Adapting Crops to Climate Variability and Uncertainty, 6th–8th April, 2017
[362]
was recorded on various growth (plant height, flowering) and yield attributes (number of fruits per plant, average fruit weight), and yield (yield per plant).
RESULTS AND DISCUSSION
The analysed data revealed that the apart from demonstrated variety Kashi Kranti having the highest yield (136.7 q/ha) followed by Kashi Pragati, Arka Anamika and Prabhani Kranti in summer season, 2015 and 2016 (Table 1). The variety Kashi Kranti has earliest days to 50 per cent flowering (52.30 days) and days to first fruit harvest (46.40 days), are most important traits for exploiting earliness and which are significantly associated (Dakahe et al., 2007). Early flowering behaviour might also be integrated to local okra due to the high market prices and demand in the early season (Duzyaman and Vural, 2003). The analysed data of BC ratio is high for cultivar Kashi Kranti (4.25) followed by Kashi Pragati, Arka Anamika, Prabhani Kranti and local cultivar.
Therefore, on the basis of above findings the okra cultivar Kashi Kranti is the most suitable for okra growers of Kishanganj district of Bihar for getting early fruits with higher yield and ultimately higher returns per unit area.
Table 1: Performance of Okra Cultivars in Summer Season (2015 & 2016) Cultivars 50% of
Flowering (Days)
Plant Height
(m)
Fruit Length (cm)
Ag. Fruit
Wt. (g)
First Fruit Harvest (Days)
No. of Fruits / Plant
Ag. Fruit Yield (q/ha)
Cost of Cultivation
(Rs./ha)
Gross Return (Rs/ ha)
Net Return
(Rs./ ha)
BC Ratio
Local Cultivar 61.50 1.06 11.94 11.68 52.50 11.90 81.8 36800 98160 61360 2.67 Kashi Kranti 52.30 1.02 14.81 14.09 46.40 15.50 136.7 38500 163920 125420 4.25 Kashi Pragati 56.30 1.01 13.68 13.20 52.00 14.30 118.6 38200 142320 104120 3.72 Arka Anamika 60.00 1.03 13.84 13.24 49.20 14.20 99.4 38400 119280 80880 3.10 Parbhani Kranti
62.20 1.03 13.33 12.70 50.40 14.00 94.5 38300 113400 75100 2.96
CV at 5% 3.29 2.50 3.78 5.29 4.34 7.57 9.33 -- -- -- -- CD at 5% 2.21 0.03 0.56 0.81 2.41 1.17 5.24 -- -- -- --
REFERENCES [1] Anonymous 2015. National horticulture board, Gurgaon, India. [2] Dakahe K, Patil H E and Patil S D 2007. Genetic variability and correlation studies in okra (Abelmoschus escutentus (L.) Moench.). Asian
JournalHorticulture 2: 201 – 203. [3] Duzyaman E and Vural H 2003. Managing the variability in okra breeding programs by considering the preferences of the domestic market.
Acta Horticulturae 598: 129 – 135. [4] Meher R, Mandal J and Mohanta S 2016.Performance of okra (Abelmoschus esculentus (L.) Moench)cultivars under red and laterite zone of
West Bengal.Journal of Crop and Weed 12(1): 142-144. [5] Thakral S K and Bhatnagar P 2002. Evaluation of frontline demonstration on chickpea in North Western region of Haryana, Agricultural
Science Digest 22 (3): 217-218.
It is I
LLEGAL t
o cop
y, pri
nt or
save
any c
onten
t of th
is PDF,
in pa
rt or in
full,
on an
y retr
ieval
syste
m,
withou
t the E
XPRESS WRITTEN PERMISSIO
N of th
e cop
yrigh
t-hold
er

National Conference on Climate Change and Agricultural Production: Adapting Crops to Climate Variability and Uncertainty, 6th–8th April, 2017
[363]
Effect of Foliar Sprays of 2, 4-D and Frequency of Application on Pre-harvest Fruit Drop, Yield and Quality in Kinnow Mandarin
Hidayatullah Mir1*, D.B. Singh2, H. Itoo3 and S.R. Dar4
1Department of Horticulture, Bihar Agricultural University, Sabour, Bhagalpur–813 210, India 2Sam Higginbottom Institute of Agricultural Technology and Sciences, Allahabad–211007, India
3,4Sher-e-Kashmir University of Agricultural Sciences and Technology of Kashmir, Srinagar–119 025, India
E-mail: *[email protected]
Keywords: Kinnow Mandarin, 2,4-D, Growth Regulators, Fruit Drop
INTRODUCTION
Kinnow is commercially cultivated due to its good yield, high processing quality, fresh consumption, aromatic flavor and better adaptation to agro-environmental conditions (Ahmed et al., 2006). Despite so many qualities of kinnow, it is, however, beset with the problem of excessive fruit drop. Although this fruit drop occurs in different stages but pre-harvest drop is of main concern as it results in direct economic loss to the growers as fruits are approaching maturity at that time. This drop has been estimated to the extent of 50 percent of the crop load (Nawaz et al., 2008). Preharvest fruit drop is major reason of low yield in India. Inspite of sufficient literature available on the causes and control of fruit drop in citrus, the problem still remains to be unsolved. Year to year variations in the extent of drop has been reported in different blocks in an orchard or trees in the same block. This shows that problem though universal in nature and location specific, needs separate control measures to be worked out under different agro-climatic conditions. Moreover, the existing findings are not applicable as such in kinnow, due to its hybrid nature, extended fruiting period and heavy cropping. So there was a need to test the efficacy of plant growth regulators to reduce fruit drop and improve the quality and yield of kinnow under agro-environmental conditions of Allahabad, India.
MATERIALS AND METHODS
This research work was conducted at Sam Higginbottom Institute of Agricultural Technology and Sciences, Allahabad. Seventeen years old, 45 plants of Kinnow mandarin (Citrus reticulata Blanco) grafted on rough lemon rootstock of uniform size and age were selected for this experiment. On the selected trees 2, 4-D (10 and 20ppm) were sprayed at monthly intervals i.e. 1st September, 1st October and 1st November based upon 15 treatments including control, replicated thrice and single tree was taken as an experimental unit to check the effect on pre harvest fruit drop and physiochemical properties of the fruit. All the experimental trees were maintained under similar agro-climatic condition. Number of fruits present on each selected tree was counted before the start of the experiment. The number of fruits that has dropped from the selected trees was counted at 5 days interval starting from 1st September and counted up to the 20th December and fruit drop percentage was calculated. Yield per tree was recorded by weighing and counting total number of fruits per tree at the time of harvesting. Fruit size was measured by measuring the length and breadth of 10 fruits per tree randomly with the help of Vernier caliper from each experimental tree. Average fruit weight was calculated by weighing ten fruits per tree on digital UWE–ESP Digital Electric Balance and average weight was calculated.
It is I
LLEGAL t
o cop
y, pri
nt or
save
any c
onten
t of th
is PDF,
in pa
rt or in
full,
on an
y retr
ieval
syste
m,
withou
t the E
XPRESS WRITTEN PERMISSIO
N of th
e cop
yrigh
t-hold
er

National Conference on Climate Change and Agricultural Production: Adapting Crops to Climate Variability and Uncertainty, 6th–8th April, 2017
[364]
RESULTS AND DISCUSSION
The perusal of the data shows that all the sprays of 2, 4-D significantly reduced the pre harvest drop compared to control. The lowest fruit drop (14.65%) was observed in T14 (20ppm 2, 4-D sprayed on 1st September + 1st October + 1st November) followed by T11 (20ppm 2, 4-D sprayed on 1st September + 1st October) with a fruit drop (15.71%), whereas, the maximum fruit drop (28.85%) was found in T15 (Control). In addition, 2, 4-D treatments proved better when concentration was increased up to 20ppm. Foliar sprays of2, 4-D proved very effective in improving the length, diameter, weight and juice content of retained fruits. The maximum fruit length (6.02cm), fruit breadth (6.81cm), fruit weight (149.65g) and juice content (40.94%) was recorded in T14 (20ppm 2, 4-D sprayed on 1st September + 1st October + 1st November). The data for yield was taken by counting the total number of fruits harvested per plant and also by weighing their corresponding weight per treatment. Here again foliar sprays of 2, 4-D proved superior to increase fruit yield per plant. The maximum fruit yield (53.05kg) was noticed in T14 (20ppm 2, 4-D sprayed on 1st September + 1st October + 1st November), while the minimum (37.24 kg) was found in case of T15 (Control), where growth regulator was not applied.From results it is clear that 2, 4-D treatments proved better when concentration was increased upto 20ppm and sprayed three times at (1st September + 1st October + 1st November).
REFERENCES [1] Ahmed W, Pervez M A, Amjad M, Khalid M, Ayyub C M and Nawaz M A 2006. Effect of stionic combinations on the growth and yield of
Kinnow Mandarin (Citrus reticulata Blanco). Pakistan Journal of Botany 38 (3): 603-612. [2] Nawaz M.A., Waqar A, Saeed A, and Mumtaz Khan M 2008. Role of growth regulators on pre harvest fruit drop, yield and quality in kinnow
mandarin. Pakistan Journal of Botany 40 (5): 1971-1981.
Influence of Integrated Application of Biofertilizers and Chemical Fertilizers on Growth Parameters, Productivity and Profitability
of Field Pea (Pisum sativum l.)
Sarita Rani*, Parveen Kumar and Anil Kumar Department of Agronomy, CCS HAU, Hisar–125004, India
E-mail: *[email protected]
Keywords: Biofertilizers, Fieldpea, Profitability, Productivity
INTRODUCTION
Field pea (Pisum sativum L.) is a high yielding, input responsive and relatively stable pulse crop of rabi season. In India, area under field pea is 0.76 million hectare and production is 0.71 million tonnes with the productivity of 966 kg ha-1. Though India is the world’s largest producer of pulses and second largest producer of field pea in the world yet it imports a large amount of pulses (3.8 million tonnes) to meet the growing domestic need. The scope of increasing the area under pulses is very limited due to their low productivity in comparison to high yielding dwarf varieties of cereal and millet crops. One of the possible ways is to increase the productivity per unit area by integrating the use of chemical fertilizers with bio-fertilizers. Seed inoculation with Rhizobium, PSB and PGPR prior to sowing is the cheapest means to improve the productivity of grain legumes.
It is I
LLEGAL t
o cop
y, pri
nt or
save
any c
onten
t of th
is PDF,
in pa
rt or in
full,
on an
y retr
ieval
syste
m,
withou
t the E
XPRESS WRITTEN PERMISSIO
N of th
e cop
yrigh
t-hold
er

National Conference on Climate Change and Agricultural Production: Adapting Crops to Climate Variability and Uncertainty, 6th–8th April, 2017
[365]
MATERIALS AND METHODS
The field experiment was conducted during Rabi season of 2013–14 at Research Area, CCS Haryana Agricultural University, Hisar, Haryana. The experiment was conducted in randomized block design with nine treatments viz., Control, seed inoculation with Rhizobium, Rhizobium + PSB, Rhizobium + PSB + PGPR, Recommended dose of fertilizers (RDF), RDF + Rhizobium, RDF + Rhizobium + PSB, RDF + Rhizobium + PSB + PGPR, RDF + ZnSO4 @ 25 kg ha-1. The seed of variety uttera was drilled at spacing of 30 cm X 15 cm. Seed was treated with biofertilizers @ 10 g/kg seed as per treatments. LAI and dry matter accumulation recorded periodically at 30 days interval, while yield parameters recorded at maturity.
RESULTS AND DISCUSSION
Growth parameters viz., dry matter accumulation and leaf area index showing increasing trend with advancement of crop growth and recorded maximum in the treatment having combined application RDF + Rhizobium + PSB + PGPR. Results revealed that the yield attributing character viz., number of pods plant-1, number of grains pod-1, yield (kg ha-1) were significantly superior in the same treatment over control treatment. Similarly, highest gross returns, net returns and B: C ratio was obtained in the same treatment among all the treatments. An overall increase in yield attributes and yield of field pea crop due to combined application of chemical fertilizers with biofertilizers has also been reported by Bhat et al. (2013).
Table 1: Effect of Bio-fertilizers and their Combination with Chemical Fertilizers on Yield Attributes and Yields of Field Pea
Treatments No. of Pods Plant-1
No. of Grainspod-1
100 Grainwt.(g)
Grain Yield
(kg ha-1)
Straw Yield (kg ha-1)
Biological Yield
(kg ha-1)
Harvest Index (%)
Control 12.0 4.20 13.3 1595 2798 4393 36.4 Rhizobium 13.3 4.26 15.1 1727 3012 4740 36.5 Rhizobium + PSB 14.5 4.26 15.3 1802 2873 4675 38.6 Rhizobium + PSB + PGPR 16.1 4.50 15.5 2116 3136 5252 40.2 RDF (20 N + 40 P2O5 kg ha-1) 19.9 5.23 16.3 2499 2925 5424 46.2 RDF + Rhizobium 21.2 5.40 16.6 2577 3019 5596 46.1 RDF + Rhizobium + PSB 22.2 5.50 16.7 2731 3025 5756 47.6 RDF+ Rhizobium + PSB + PGPR 23.3 5.70 16.9 2931 3095 6026 48.7 RDF + ZnSO4 @ 25 kg ha-1 20.3 5.30 16.5 2549 3058 5607 45.2 CD (P=0.05) 4.3 0.51 NS 137 NS 409 3.6
REFERENCE [1] Bhat TA, Gupta M, Ganai MA, Ahanger RA and Bhat HA 2013. Yield, soil health and nutrient utilisation of field pea (Pisum sativum L.)
as affected by phosphorus and bio-fertilizers under subtropical conditions of Jammu. International Journal of Modern Plant and Animal Science1(1):1-8.
It is I
LLEGAL t
o cop
y, pri
nt or
save
any c
onten
t of th
is PDF,
in pa
rt or in
full,
on an
y retr
ieval
syste
m,
withou
t the E
XPRESS WRITTEN PERMISSIO
N of th
e cop
yrigh
t-hold
er

National Conference on Climate Change and Agricultural Production: Adapting Crops to Climate Variability and Uncertainty, 6th–8th April, 2017
[366]
Effect of Aerobic Environment on Physio-Morphological Traits in Aerobic and Lowland Indica Rice Genotypes at Late Vegetative Stage
Anjali Dahiya1*, Harnek Singh Saini2, Ritu Saini and Sunita Jain3
1Department of Chemistry and Biochemistry, CCS Haryana Agricultural, University, Hisar–125004, India
2Department of Biotechnology Engineering, University Institute of Engineering and Technology Kurukshetra University, Kurukshetra–136119, India
3Department of Molecular Biology, Biotechnology and Bioinformatics, CCS Haryana Agricultural University, Hisar–125004, India
E-mail: *[email protected]
Keywords: Rice, Aerobic, Root Length, Relative Water Content, Osmotic Potential
INTRODUCTION
Rice (Oryza sativa L.) is cultivated under flooded lowland conditions and is a single biggest user of fresh water. Overexploitation of groundwater has caused serious problems in many parts of India including Haryana and Punjab(Bouman and Tuong 2001). A new development in water saving technologies is the concept of aerobic rice. Rice is considered a drought sensitive crop species, however, aerobic rice withstand water stress. In the present investigation, different morphological traits were studied in aerobic (MAS25, MAS26) and lowland (HKR47, PAU201, HBC 19 and PUSA1121) indica rice genotypes, grown under submerged and aerobic conditions in pots. Root length, root biomass and RWC attributes declined in all lowland rice genotypes while, conversely, aerobic rice genotypes showed enhancement under aerobic environment. Better performance displayed by aerobic varieties may be due to longer, thick and dense root system in these rice genotypes.In present study aims to study the differences between the aerobic and lowland rice cultivars under different water conditions
MATERIAL AND METHODS
The experiment was conducted during CCS, HAU, Hisar, Haryana during 2014-2015. The experimental material comprised of seeds of lowland indica (HBC19, PUSA1121, HKR47 and PAU201) and aerobic rice varieties (MAS25 and MAS26) and these rice varieties grown under aerobic and well watered conditions. All the growth parameters viz. root length (cm), fresh root weight (g) and dry root weight (g) were recorded for 12 rice seedlings each from all the six rice varieties under both aerobic and well watered conditions. RWC (%) was measured by the method of Turner (1981). Osmotic Potential (s) ofleaves of control and aerobically grown plants were recorded as described by Kumar et al. (1984).The data obtained in the present investigation was subjected to analysis of variance and OP stat was used to analyze experimental results statistically.
RESULTS AND DISCUSSION
Lowland rice varieties (HBC19, HKR47, PUSA1121 and PAU201) showed a significant decline in root length under aerobic conditions while, conversely, aerobic rice varieties showed enhancement in roots length under aerobic conditions. Averageroot length at late vegetative stage varied between 26.83 (MAS26) and 39.57 cm (HBC19). Lowland rice varieties also showed decline in root length at late vegetative stage which ranged between 27.87% (PUSA1121) and 48.16% (PAU201). Fresh root weight was more in lowland rice varieties as compared to aerobic rice varieties under well watered conditions however, it decreased
It is I
LLEGAL t
o cop
y, pri
nt or
save
any c
onten
t of th
is PDF,
in pa
rt or in
full,
on an
y retr
ieval
syste
m,
withou
t the E
XPRESS WRITTEN PERMISSIO
N of th
e cop
yrigh
t-hold
er

National Conference on Climate Change and Agricultural Production: Adapting Crops to Climate Variability and Uncertainty, 6th–8th April, 2017
[367]
significantly under aerobic conditions in all lowland indica rice varieties whereas, significant higher values were observed in the aerobic rice varieties. A similar pattern of decline in dry root weight in all the lowland rice varieties and enhancement in aerobic rice varieties under aerobic conditions was observed. Averagedry root weight varied from 1.95 (MAS26) to 3.81 g (HKR47) at late vegetative stage in conventional flooded conditions. Maximum decline in dry root weight was observed in PAU201 (35.19% respectively at late vegetative stage) under aerobic conditions respectively. Contrarily, a steep rise of 42.65% was observed in MAS26 at late vegetative stage under aerobic conditions. Relative water content (RWC) decreased significantly under aerobic conditions in all the six rice varieties. RWC ranged between 93.10 (HBC19) and 95.94% (MAS25) under conventional rice growing conditions. Relative water content declined at this stage also in all varieties under aerobic conditions and maximum reduction was noticed in HKR47 (6.70%) whereas reduction of 5.15 and 4.99% in RWC was observed in aerobic rice varieties MAS25 and MAS26, respectively.Osmotic potential, like RWC, significantly declined in all the six rice varieties under aerobic conditions. maximum reduction was recorded in PAU201 (57.14%). At reproductive stage, osmotic potential ranged from -1.31 (MAS26) to -0.76 MPa (HKR47) under control conditions. Here, the drop of as much as 40.48% was observed in HBC19 whereas MAS26 showed minimum reduction of 16.79%. There can be better performance of aerobic rice genotypes under water limited conditions thus could be attributed to their relatively better root length and biomass. Thus the study leads to conclusion that aerobic rice varieties perform better under aerobic conditions but lowland varieties perform better under well watered conditions
REFERENCES [1] Bouman B A M, Tuong T P 2001. Field water management to save water and increase its productivity in irrigated rice Agricultural Water
Management 49 (1):11–30. [2] Turner N.C.O. Toole J C, Cruz, R T, Yambao E B, Ahmad S, Namuco O S and DingkuhnM 1979. Responses of seven diverse rice cultivars to
water deficits. Field Crops Research. 13: 257–271. [3] Kumar A, Singh D P, Singh, H and Sharma H C 1984. Differences in osmoregulation in Brassica species. Annals of Botany 54: 537-541.
Performance of Drought Tolerant Rice Varieties under Various Methods of Crop Establishment in Rainfed Drought-Prone Condition of Bihar
Nityanand1*, Rajeev Singh1*, G.S. Panwar2, Sudhanshu Singh3 and Ashok3 1Krishi Vigyan Kendra, Aurangabad, Bihar Agricultural University, Sabour–813210, India
2Bihar Agricultural University, Sabour Bhagalpur–813210, India 3International Rice Research Institute, Office Delhi–120018, India
E-mail: *[email protected]
Keywords: Direct Seeded Rice, Methods of Crop Establishment, Varieties
INTRODUCTION
Rice (Oryza sativa L.) is the most important stable food crop in India that holds key to food security. In recent years, emphasis is shifting towards rainfed ecology which offers a great potential in enhancing rice productivity and production. Considerable progress in developing rice varieties with increased tolerance to submergence and drought. These stress tolerant varieties reduce farmers’ risk and stabilize rice productivity ultimately increasing crop intensification and diversification too. In order to tap the potential of these varieties under drought stress environment, best management practices including time of seeding/ transplanting and method of crop establishment need to be introduced. Proper establishment of the crop plays a vital role in its survival if faced with a stress situation such as submergence and drought. Direct seeded rice (DSR) has given
It is I
LLEGAL t
o cop
y, pri
nt or
save
any c
onten
t of th
is PDF,
in pa
rt or in
full,
on an
y retr
ieval
syste
m,
withou
t the E
XPRESS WRITTEN PERMISSIO
N of th
e cop
yrigh
t-hold
er

National Conference on Climate Change and Agricultural Production: Adapting Crops to Climate Variability and Uncertainty, 6th–8th April, 2017
[368]
promising results through wide number of experiments and large scale demonstrations/adaptive trials under low land ecologies and in flood prone areas. The results would reflect whether the direct dry seeding method holds promise in the target region. Hence, a field experiment was conducted to evaluate the performance of drought tolerant rice varieties under various methods of stand establishment in rainfed drought-prone condition of Bihar.
MATERIALS AND METHODS
The field experiments were carried out at the KVK, Aurangabad and farmers’ field (Latitude: 24.500 N, Longitude: 84.700 E, Mean sea level height: 332ft) during wet season of 2013, 2014 and 2015 in rainfed lowland having clay loam soil type. Performance of two rice varieties; Sahbhagi Dhan and Sushk Samrat were evaluated under different method of establishment with (Best management practices. The experiment was laid out in a split plot design (SPD) with four replications at KVK and one at farmers’ field.
RESULTS AND DISCUSSION
Biological yield of rice under DSR-ZT drill (11.97, 11.27 and 10.85 t/ha) were significantly higher than broadcasting and transplanting methods, similarly, the grain yield (4.95, 4.65 and 4.48 t/ha) DSR-ZTD was significantly higher compared to transplanting and broadcasting. Straw yield (7.02, 6.37 t/ha) in DSR-ZTD was significantly higher with DSR-ZTD method being at par with transplanting in 2013 and 2015 over broad casting. However, in 2014 significantly maximum straw yield was recorded with DSR-ZTD method over other crop establishment.. Benefit- cost ratio were recorded maximum with DSR- ZTD method (2.77, 2.60 and 2.61), it was significantly more over broadcasting and transplanting method in all the three years.The drought tolerant variety susk samrat recorded significantly higher biological yield (11.26, 10.65 and 10.29t/ha), and grain yield (4.72, 4.36 and 4.11t/ha) over Sahbhagi Dhan in 2013, 2014 and 2015 respectively. Benefit-cost ratio was also significantly more in Sushk Samrat over Sahbhagi dhan in all the three years. Similar result were also reported by Sharswat et al. (2010) and Bhullar et al. (2012).
Table 1: Effect of Different Methods of Establishment and Varieties on Appearance on Yield Treatment Biological Yield (t/ha) Grain Yield (t/ha) Straw Yield (t/ha) B: C ratio
2013 2014 2015 2013 2014 2015 2013 2014 2015 2013 2014 2015 Method of Establishment Broad coasting 9.20 8.92 8.75 3.78 3.52 3.44 5.42 5.40 5.31 2.18 2.06 2.12 Zero tillage sowing 11.97 11.27 10.85 4.95 4.65 4.48 7.02 6.62 6.37 2.77 2.60 2.61 Transplanting 10.94 10.44 9.94 4.60 4.31 4.00 6.35 6.14 5.94 2.24 2.16 2.08 LSD=0.05 0.95 0.67 0.58 0.3 0.25 0.26 0.76 0.47 0.41 0.18 0.13 0.16 Varieties Sahbhagi 10.15 9.77 9.40 4.16 3.96 3.84 5.99 5.81 5.56 2.25 2.17 2.19 Susk Smrat 11.26 10.65 10.29 4.72 4.36 4.11 6.53 6.29 6.18 2.55 2.37 2.34 LSD=0.05 0.74 0.63 0.54 0.27 0.221 0.19 0.49 0.48 0.38 0.15 0.13 0.11
REFERENCES [1] Bhullar M S, Walia, U S, Walia, S S, Gill G and Kaur T 2012. Impact of establishment techniques,brown manuring and weed control on
productivity of dry seeded rice (Oryza sativa L.) in semi-arid sub-tropical regions of Northern India pp. 83. In: Proceedings of International Conferenceon ClimateChange, Sustainable Agriculture and Public Leadership held during 7–9 February,2012 at NASC, New Delhi.
[2] Saharawat Y S, Singh S, Malik R K, Ladha J K, Gathala M, Jat M L and Kumar V 2010.Evaluation of alternative tillage and crop establishment methods in a rice–wheat rotation in NorthWestern IGP Field Crops Research 116: 260–26.
It is I
LLEGAL t
o cop
y, pri
nt or
save
any c
onten
t of th
is PDF,
in pa
rt or in
full,
on an
y retr
ieval
syste
m,
withou
t the E
XPRESS WRITTEN PERMISSIO
N of th
e cop
yrigh
t-hold
er

National Conference on Climate Change and Agricultural Production: Adapting Crops to Climate Variability and Uncertainty, 6th–8th April, 2017
[369]
Correlation and Path Analysis Studies of Yield and Economic Traits in Chilli (Capsicum annuum L.)
Ashish Kumar Maurya1*, M.L. Kushwaha2, S.K. Maurya2 and Yadav Ram P.1
1Department of Horticulture, Institute of Agricultural Sciences, Banaras Hindu University, Varanasi–221005, India
2Department of Vegetable Science, Govind Ballabh Pant University of Agriculture and Technology, Pantnagar–263145
E-mail: *[email protected]
Keywords: Chilli, Correlation, Path, Yield, Direct effect
INTRODUCTION
Chilli (Capsicum annuum L.) is one of the most commonly grown commercial vegetable cum spice crops at the global level. The productivity of the crop is low in view of coverage of large area under low yielding genotypes. Hence, there is need for development of new varieties and hybrids with high productivity. Since yield is a complex trait and its direct improvement is difficult, governed by a large number of component traits, it is imperative to know the interrelationship between yield and its component traits to arrive at an optimal selection index for improvement of yield. Therefore, field investigation was carried out with a view to study the character association and direct and indirect effect of independent characters on dependent green chilli yield by assessing the thirty genotypes of chilli.
MATERIALS AND METHODS
The present experiment was conducted during spring summer season of the year 2014 at Vegetable Research Centre of Govind Ballabh Pant University of Agriculture and Technology, Pantnagar (Uttarakhand) with 30 genotypes of chilli. The experiment was laid out in randomized block design with three replications. The five randomly selected plants in each replications were used to record observations on number of primary branches per plants, stem diameter (cm), days to 50 percent ripening, fruit length (cm), periferi width (cm), number of seeds per fruit, weight of seeds per fruit, 100 seed weight (mg), seed husk ratio, dry matter percent, average dry fruit weight, weight of seeds per plant, oleoresin content, pericarp thickness and yield per plant (g). The estimation of direct and indirect contribution of various yield contributing characters was carried as suggested by Wright (1921) and elaborated by Dewey and Lu (1959).
RESULTS AND DISCUSSION
Genotypic and phenotypic correlation coefficients of present study for yield and quality attributing characters with yield indicated that the estimates of genotypic correlations were higher in magnitude than the estimates of phenotypic correlation coefficients for almost all the character combinations. This suggested the predominance of genotypic effects over environmental factors.
Results indicated that fruit yield per plant had highly significant positive association with dry matter percent, average dry fruit weight, weight of seeds per plant and pericarp thickness which shows that these character are responsible for determining high yield; while it showed highly significant and negative correlation with days to 50 percent fruit ripening means plant having late ripening produce less yield as compared to those plant which takes less days to 50 percent ripening. Oleoresin content had highly significant and positive correlation with periferi width. The fact that a trait is correlated with yield does not imply that it is a
It is I
LLEGAL t
o cop
y, pri
nt or
save
any c
onten
t of th
is PDF,
in pa
rt or in
full,
on an
y retr
ieval
syste
m,
withou
t the E
XPRESS WRITTEN PERMISSIO
N of th
e cop
yrigh
t-hold
er

National Conference on Climate Change and Agricultural Production: Adapting Crops to Climate Variability and Uncertainty, 6th–8th April, 2017
[370]
component of yield. Hence Partitioning of phenotypic correlation into direct and indirect effects was also performed through path analysis by taking yield as dependent variable and other traits as independent variables. Every component character had a direct effect on yield. Maximum direct effect was found by weight of seeds per plant followed by average dry fruit weight and days to 50 percent ripening which shows its more accountability for higher yield. On thebasis of above finding it can be concluded that the characters, dry matter percent, average dry fruit weight, weight of seeds per plant and pericarp thickness exhibited highly significant positive correlation with fruit yield per plant indicating the useful of these traits for improving upon fruit yield in chilli.
REFERENCES [1] Dewey D R and Lu K H 1959. A correlation and path coefficient analysis of components of crested wheat grass seed production.
Agronomy Journal 51: 516-518. [2] Wright S 1921. Correlation and causation. Journal of Agricultural Research 20: 557-558.
Performance of Tuberose (Polianthes tuberosa L.) under Varying Planting Time and Spacing
Prince*, G.S. Rana, D.S. Dahiya, Vivek Beniwal and Arvind Malik Department of Horticulture, CCS Haryana Agricultural University, Hisar
E-mail: *[email protected]
Keywords: Bulb, Planting time, Prajwal, Spacing, Tuberose
INTRODUCTION
Polianthes tuberosa is a member of family Asparagaceae. It can be cultivated both in tropical and sub tropical condition. All flower lovers like tuberose due to its luxuriant vegetative growth, pretty and fragrant spikes, which have long vase life and transportability and fill a useful place in the flower market. It is used as vase decoration, bouquets, making veni, garland, button-holes or crown and frequently used during marriage or religious ceremonies. Due to varied agro climatic conditions prevailing in India tuberose is planted at different dates in different parts of the country. It is planted in February and March in the plains and in April and May in the hills. It required high humidity and moderate temperature around 30°C for its luxuriant vegetative growth and gradually ceases to grow on declining these two vital factors, especially in North Indian Plains from December onwards. Temperature above 40°C reduces the spike length and quality of flowers. Likewise, very low temperature and frost also damages the plants and flowers (Sharga, 1999). Gurav et al. (2005) studied the effect of planting time on yield and quality of tuberose cv. Shringar at Ganeshkhind (Pune) and observed that the April planting produced the maximum weight of bulb per plant (195.0 g) and number of bulbs per plant (33.0). Spacing between plants is particularly important for the cultivation of tuberose to maximize flower quality and quantity characteristics. According to Patel et al., 2006 tuberose planted at a closer spacing of 30 x 20 cm gave higher yield of bulbs. Climatic changes are taking place due to which the new crop production practices need to be standardize. It is also very much essential to find out the best growing time to expose the crop for a better environment for maximum productivity and successful cultivation. Optimum plant density is another important factor for better plant growth and yield. Spacing between plants is particularly important for the cultivation of tuberose to maximize flower quality and quantity characteristics. Plant density influences the yield and quality of flowers and bulbs obtained per unit area. Higher plant density has been found to produce greater yield of spikes, flowers and bulbs. Therefore,
It is I
LLEGAL t
o cop
y, pri
nt or
save
any c
onten
t of th
is PDF,
in pa
rt or in
full,
on an
y retr
ieval
syste
m,
withou
t the E
XPRESS WRITTEN PERMISSIO
N of th
e cop
yrigh
t-hold
er

National Conference on Climate Change and Agricultural Production: Adapting Crops to Climate Variability and Uncertainty, 6th–8th April, 2017
[371]
this study was undertaken with the objective to get standardized agro-technique in terms of optimum planting time and spacing for the region of Haryana.
MATERIALS AND METHODS
The present investigation entitled “Influence of planting time and spacing on bulb characteristics of tuberose under field experiment (Polianthes tuberosa L.)” was carried out at experimental orchard of the Department of Horticulture, CCS Haryana Agricultural University, Hisar during 2013–14. Beds were prepared by maintaining plot bed size 1.20 × 1.20 m for planting of bulbs. Total number of beds prepared was thirty six. Prajwal variety of tuberose was selected for the study. The planting was done at fortnight intervals starting in last week of March, second week of April, last week of April and second week of May in 2013. Bulbs were planted at three different spacing (20 × 10 cm, 20 × 20 cm, 20 × 30 cm). For collection of data from the field, ten plants were selected randomly and tagged in each treatment (plot) sparing the border plants.
RESULTS AND DISCUSSION
The data of Table 1 indicates that planting time and spacing were found significant in increasing the number of bulbs produced per plant in tuberose. Maximum number of bulbs (27.53) per plant was recorded in last week of April planting (T3 treatment) with wider spacing (20 x 30 cm) while it was minimum (16.53) in second week of May planting (T4 treatment) along with closer spacing (20 × 10 cm).From this study it is concluded that last week of April planting improved quality and quantity of bulbs as compared to early plantings. The results also indicate that last week of April planting along with wider spacing (20 x 30 cm) would be remunerative in respect to yield and quality of bulbs.
Table 1: Effect of Planting Time and Spacing on Number of Bulbs per Plant in Tuberose cv. Prajwal Treatments Spacing (cm) Mean
Time of Planting S1
(20 x 10 cm) S2
(20 x 20 cm) S3
(20 x 30 cm) T1 (Last week of March) 19.06 23.86 26.60 23.17 T2 (Second week of April) 20.53 23.93 27.13 23.86 T3 (Last week of April) 21.13 24.53 27.53 24.40 T4 (Second week of May) 16.53 19.90 23.26 19.90 Mean 19.31 23.05 26.13 CD at 5% T = 0.32 S = 0.28 T x S = 0.56
REFERENCES [1] Gurav S B, Singh B R, Desai U T, Katwate S M, Kakade D S, Dhane A V and Kanade V D 2005. Influence of planting time on the yield
and quality of tuberose. Journal of Horticulture 62 (2): 216-217. [2] Patel M M, Parmar P B and Parmar B R 2006. Effect of nitrogen, phosphorus and spacing on growth and flowering in tuberose
(Polianthes tuberosa L.) cv. Single. Journalof Ornamental Horticulture 9 (4):286-289. [3] Sharga A N 1999. ‘Tuberose’ NBRI Bulletin. 5:11.
It is I
LLEGAL t
o cop
y, pri
nt or
save
any c
onten
t of th
is PDF,
in pa
rt or in
full,
on an
y retr
ieval
syste
m,
withou
t the E
XPRESS WRITTEN PERMISSIO
N of th
e cop
yrigh
t-hold
er

National Conference on Climate Change and Agricultural Production: Adapting Crops to Climate Variability and Uncertainty, 6th–8th April, 2017
[372]
Effect of Foliar Application of Boron and Molybdenum on Curd Quality of Broccoli (Brassica oleracea L. var. italica Plenk)
Atul Patel1*, Sutanu Maji1, Sandeep2 Kumar Mauriya, Virendra Singh Gehlot1 and Kusum Meena1
1Department of Applied Plant Science (Horticulture), Babasaheb Bhimrao Ambedkar Lucknow–226025, India
2Department of Horticulture, Institute of Agricultural Sciences, Banaras Hindu University, Varanasi–221 005 India
E-mail: *[email protected]
Keywords: Broccoli, Cole crops, Micronutrients, Foliar spray
INTRODUCTION
Broccoli (Brassica oleracea L. var. italica Plenk) is an important member of crucifarae family such as cauliflower, cabbage, kale, Chinese kale etc. It is a nutritionally grown all over the world having important nutritional values due to its content of vitamins, antioxidants, glucosinolates and anti-carcinogenic compounds (Parente et al., 2013). 100 gram broccoli contains Carbohydrate 7g (2%), Fat-0.4g, Sodium-33 mg (1%), Potassium-316 mg (9%), Dietary fiber 2.6g (10%), Sugar-1.7g, Protein-2.8 g, Vitamin A-12%, Vitamin C–148%, Calcium-4%, Iron-3%, Vitamin B6-10%, Magnesium-5%, Phosphorus 79mg (Annonymus-2015). This flower vegetable is a rich source of vitamin-K and B-complex group of vitamins like niacin (vit B-3), pantothenic acid (vit.B-5), pyridoxine (vit.B-6), and riboflavin etc. Boron plays an important role in the pollination, flower initiation, fertilization and fruit setting. Sufficient yield reduction can occur without expression of any symptoms during prior to vegetative growth in some species (Noppakoonwong et al., 1997). It has been reported that the heads in the axil of the leaves develop strongly, especially after the removal of the terminal head (Chatterjee, 1986) and is a recommended practice for broccoli. It was observed that when apical head is removed then side heads produce profuse seeds (Firoz et al., 2000). Removing the terminal head or axillaries heads yielded equally good seed as compared to heads not removed (Ghimire et al., 1993). To study examine the effect of boron and molybdenum on quality of broccoli.
MATERIALS AND METHODS
The experiment was conducted during 2015–2016 at, Babasaheb Bhimrao Ambedkar University, Lucknow India, in the year 2015–2016. The soil of experimental field is sandy loam and slightly alkaline in nature with the soil pH 8.2. The experiment was laid out in randomized block design with three replications and ten treatment combinations which included various combinations of T0-control, T2-Recommended dose of fertilizer via. NPK (RDF), T3-RDF + Borax (1.5%), T3-RDF + Borax (2.5%), T4-RDF + Ammonium molybdate (1.5%), T5-RDF + Ammonium molybdate (2.5%), T6-RDF + Borax (1.5%) + Ammonium molybdate (1.5%), T7-RDF + Borax (1.5%) + Ammonium molybdate (2.5%), T8-RDF + Borax (2.5%) + Ammonium molybdate (1.5%), T9-RDF + Borax (2.5%) + Ammonium molybdate (2.5%).
RESULTS AND/ DISCUSSION
The significant increase the yield and quality of curd length, curd diameter, Curd moisture, vitamin C, T.S.S. (Total Soluble Solids), total sugars reducing sugar,non-reducing sugar,titratable acidity, The quality of curd under the treatments. The maximum equatorial curd diameter (17.15 cm) were found in the treatment T7 [RDF +
It is I
LLEGAL t
o cop
y, pri
nt or
save
any c
onten
t of th
is PDF,
in pa
rt or in
full,
on an
y retr
ieval
syste
m,
withou
t the E
XPRESS WRITTEN PERMISSIO
N of th
e cop
yrigh
t-hold
er

National Conference on Climate Change and Agricultural Production: Adapting Crops to Climate Variability and Uncertainty, 6th–8th April, 2017
[373]
Borax (1.5%) + Ammonium molybdate (2.5%) and the minimum (11.58 cm) length of curd was observed in the treatment T0. These results corroborated with the findings of Firoz et al. (2008) and Singh et al. (2014).
Table 1: Effect of Boron and Molybdenum on Curd Quality of Broccoli
Trea
tmen
ts
Cur
d L
engt
h (c
m)
Cur
d
Dia
met
er
(cm
)
Cur
d
Moi
stur
e (%
)
Tota
l S
ugar
s (%
)
Red
uci
ng
Sug
ar (
%)
Non
-R
edu
cing
S
ugar
(%
)
Vit
amin
C
(mg/
10
0g)
T.S
.S.
(0B
rix)
Titr
atab
le
Aci
dity
(%
)
T0 11.58 14.29 74.03 3.04 2.59 0.35 81.37 7.37 0.32 T1 12.47 15.28 75.15 3.26 2.79 0.51 83.41 8.03 0.36 T2 13.02 14.48 76.69 3.42 2.73 0.69 86.47 8.10 0.41 T3 12.30 15.05 76.80 3.33 2.79 0.53 85.25 7.73 0.36 T4 12.29 15.21 77.69 2.90 2.48 0.40 87.34 8.20 0.39 T5 12.07 14.86 74.44 3.23 2.73 0.53 85.98 8.20 0.38 T6 13.13 15.67 80.12 3.01 2.32 0.68 87.61 8.97 0.34 T7 14.06 17.15 82.55 3.71 3.12 0.92 91.70 9.10 0.42 T8 13.34 16.15 79.11 3.53 2.82 0.70 87.41 7.57 0.36 T9 12.25 15.38 77.17 3.16 2.80 0.69 85.32 8.20 0.36 CD (p=0.05)
1.18 1.54 4.39 0.80 0.43 0.225 3.70 1.29 0.174
REFERENCE [1] Shelp B J, Shattuck V I, Mclellan D and Liu L.1992. Boron nutrition and the composition of glucosinolates and soluble nitrogen
compounds in two broccoli (Brassica oleracea var. italica) cultivars. Canadian Journal Plant Sciences 72: 889 899
Evaluation of Rice (Oryza Sativa) Based Cropping System by Different Sources of Nutrient in Jharkhand
Niru Kumari1*, C.S. Singh2, Diwakar Paswan3 and Rupa Rani4 1Regional Research, Station Agwanpur, Saharsa, Bihar–852201, India
2Department of Agronomy, Birsa Agricultural University, Kanke, Ranchi–834006, India 3Regional Research, Station Agwanpur, Saharsa–852201, India
4Department of Horticulture, Bihar Agricultural University, Sabour, Bhagalpur–813210, India E-mail: *[email protected]
Keywords: Organic farming, Cropping System, Rice
INTRODUCTION
The situation of change in climate, inadequate and untimely rain has adversely affected the human and soil health and created the alarming situation to think for alternative farming system. Organic farming and crop diversification may be one of the suitable solutions to safeguard the crop production and soil health. Jharkhand state suit well for organic farming, the forest cover of state is 28.5% of its geographical area, which is naturally managed organically and is a store house of organic inputs and outputs. (Verma et al. 2008). The tribal farming community in the vicinity of forest even today practice aborigine technique for growing crops without chemicals. Keeping in view the adverse effect of chemicals on environment and human health an experiment was conducted to evaluate the performance of crop sequences such as basmati rice-wheat, basmati rice-potato, basmati rice-mustard, basmati rice-lentil under organic, inorganic and integrated nutrient management in Jharkhand.
It is I
LLEGAL t
o cop
y, pri
nt or
save
any c
onten
t of th
is PDF,
in pa
rt or in
full,
on an
y retr
ieval
syste
m,
withou
t the E
XPRESS WRITTEN PERMISSIO
N of th
e cop
yrigh
t-hold
er

National Conference on Climate Change and Agricultural Production: Adapting Crops to Climate Variability and Uncertainty, 6th–8th April, 2017
[374]
MATERIAL AND METHODS
A field experiment was conducted at Birsa Agricultural University, Ranchi for seven years (2004–2011) to evaluate the different nutrient input system of four cropping sequence. The soil was sandy loam with pH (5.60), low organic carbon (0.39%), high available P (48kg/ha) and medium in available K (270kg/ha). The experiment was laid out in strip plot design having organic, inorganic and integrated nutrient management system in main plot and four cropping sequence i.e basmati rice-wheat, basmati rice-potato, Basmati rice-lentil, basmati rice-mustard in sub plot and unreplicated. Rice (Birsamati), wheat (K9107), Potato (K. Ashoka), lentil (Pant L406) and mustard (Pusa Agrani) received recommended dose of fertilizers through different combination of inputs i.e organic (1/3rd FYM+1/3rd Vermicompost+1/3rd Karanj cake), Inorganic, Integrated (50% organic+50% inorganic). Soil pH, Organic carbon, Avail N,P&K, microbial population counts were determined by using standard method.
RESULTS AND DISCUSSION
The productivity level of organic rice during Ist and 2nd year of conversion period was lower than rice grown under inorganic and integrated management, which further improved after completion of three cycles and remained comparable to integrated nutrient management. During organic production period (after completion of 3 crop cycle) the system productivity under organic was increased by 1.62% and 19.5% from integrated (61.4 q/ha) and inorganic nutrient management (52.2 q/ha) respectively. Irrespective of source for fertilization, rice –potato system had maximum rice equivalent yield (90.9 q/ha) and net return (84155 Rs/ha) which is alternative to rice-wheat system (41.9 q/ha) in a diversification mode for higher productivity and profitability. Consequently, 100% organic fertilization had maximum net return of (Rs, 63384 Rs/ha) was 23.7% and 46% higher than integrated and inorganic nutrient management. The soil bulk density decreased while the water holding capacity increased with organic treatments. Decrease in bulk density with addition of organic manure was also reported by Singh et al. (2010). Higher pH, Organic carbon, available N,P&K, microbial population counts obtained with organic followed by integrated and minimum with inorganic management practice.It is concluded that the productivity of organic rice in initial year of conversion period was lower than organic rice, which improved slightly on completion of three crop cycle. Irrespective of source of fertilization rice-potato system had maximum rice equivalent yield, which is an alternative to rice –wheat system in a diversification mode.There was improvement in physical, chemical and biological reserve under organic compare to integrated and inorganic fertilized plot over time.
REFERENCES [1] Singh S K, Kumar D Lal, S S 2010.Integrated use of crop residues and fertilizers for sustainability of potato (Solanum tuberosum) based
cropping systems in Bihar. Indian Journal of Agronomy 55 (3):203-08 [2] Verma U N, Singh M K, Kumar B, Pal S K, Thakur R, Upasani R R 2008. Prospects and limitations of organic farming in Jharkhand.Technical
Bulletein BAU(Agronomy) 1 /2008:5
It is I
LLEGAL t
o cop
y, pri
nt or
save
any c
onten
t of th
is PDF,
in pa
rt or in
full,
on an
y retr
ieval
syste
m,
withou
t the E
XPRESS WRITTEN PERMISSIO
N of th
e cop
yrigh
t-hold
er

National Conference on Climate Change and Agricultural Production: Adapting Crops to Climate Variability and Uncertainty, 6th–8th April, 2017
[375]
Resolving Crop Residue Burning Issue by Engineering Intervention
Jitendra Kumar1*, Satish Kumar2, Ashok Kumar2 and Sanoj Kumar2 1Department of Agricultural Engineering, M.B.A.C., Agwanpur–852201, India
2Department of Agricultural Engineering, B.A.C., Sabour, Bhagalpur–813210, India E-mail: *[email protected]
Keywords: Gasification, Biochar, Bagasse, Biomass, Crop Residue
Crop residues are the parts of plants left in the field after the crops have been harvested and thrashed. Crop residues are good sources of plant nutrients, are the primary source of organic material added to the soil, and are important components for the stability of agricultural ecosystems. Crop residue is not a waste but rather a tremendous natural resource. About 25% of nitrogen (N) and phosphorus (P), 50% of sulphur (S), and 75% of potassium (K) uptake by cereal crops are retained in crop residues, making them valuable nutrient sources (Cannell, 2003). Leaving crop residue on the soil surface year around, before and after planting provides soil surface protection at critical times to protect the soil against wind and water erosion. Reducing tillage operations improves soil surface properties, including improved soil aggregation accounting for increased infiltration and percolation; less compaction due to less usage of field implements; and more biological activity due to an increase in organic matter. Adding soil surface cover increases water infiltration, reducing soil drying and maintains more moisture for crop utilization. The burning of paddy and wheat fields causes a huge loss of precious nutrients and pollutes the environment. The heat generated by burning paddy straw kills useful microbes in the soil, leading to poor soil health and loss of fertility. The authorities should enact a law prohibiting the burning of crop residue as there is no specific law thus far. Stringent punishment and heavy penalty for violators and disconnection of electricity supply to the tube wells of the farmers who burn their own fields after the crop would help curb this practice.
Complete retention of crop residues at the soil surface by using zero or reduced tillage systems. Successive crops can be sown using zero-tillage after straw is left on the soil surface. In areas where there is high demand for animal feed, controlled grazing may be permitted or a percentage of the crop residues are removed from the field for feed or silage. An adequate amount of residue must be left on the field to provide soil surface protection. The crop residues can be gainfully utilized for livestock feed, composting, power generation, bio-fuel production and mushroom cultivation besides several other uses like thatching, mat-making and toy making. Conversion of ligno-cellulosic biomass into alcohol is of immense importance as ethanol can either be blended with gasoline as a fuel extender and octane-enhancing agent or used as a neat fuel in internal combustion engines. Theoretical estimates of ethanol production from different feedstock (corn grain, rice straw, wheat straw, bagasse and saw dust) vary from 382 to 471 ton of dry matter. Bio-oil can be produced from crop residues by the process of fast pyrolysis, which requires temperature of biomass to be raised to 400–500 C within a few seconds, resulting in a remarkable change in the thermal disintegration process (Ritcher, 2004). The crop residues can be used in the gasifiers for ‘producer gas’ generation. One ton of biomass can produce 300 kWh of electricity (Choudhary et al., 2003). The gasification technology can be successfully employed for utilization of crop residues in the form of pellets and briquettes. The generated ‘producer gas’ is cleaned using bio-filters and used in specially designed gas engines for electricity generation. Biochar is a high carbon material produced through slow pyrolysis (heating in the absence of oxygen) of biomass. It is a fine-grained charcoal and can potentially play a major role in the long-term storage of carbon in soil, i.e., C sequestration and GHG mitigation (Schils et al., 2005). The process of bio-methanation utilizes crop residues in a non-destructive way to extract high quality fuel gas and produce manure to be recycled in soil. Biomass such as rice straw can be converted into biogas, a mixture of carbon dioxide and methane, which can be used as fuel.
It is I
LLEGAL t
o cop
y, pri
nt or
save
any c
onten
t of th
is PDF,
in pa
rt or in
full,
on an
y retr
ieval
syste
m,
withou
t the E
XPRESS WRITTEN PERMISSIO
N of th
e cop
yrigh
t-hold
er

National Conference on Climate Change and Agricultural Production: Adapting Crops to Climate Variability and Uncertainty, 6th–8th April, 2017
[376]
REFERENCES [1] Choudhary S K and Lovely D R, Electricity Generation Cells, Biotechnology 2003. 21:229-1232 [2] Cannell M G R 2003. Carbon sequestration and biomass energy offset: theoretical potential and achievable capacities globally in Europe
and the UK. Biomass and Bioenergy24: 97-116 [3] Ritcher B 2004. Using ethanol as an energy source. Science305-340. [4] Schils R L M, Verhagen A, Aarts, H F M, Sebek, L B J, 2005. A farm level approach to define successful mitigation strategies for GHG
emissions from ruminant livestock system. Nutrient Cycling in Agro-ecosystems71:163-175. [5] US-EPA 2006. Global Anthropogenic Non-CO2, Greenhouse Gas Emissions: 1990-2020. United States Environment Protection Agency.
Effect of Foliar and Soil Application of Nitrogen on Growth, Yield and Economics of Wheat (Triticum aestivum L.)
Nikhil Kumar1, M. Haque1, Santosh Kumar5, Tej Ram Banjara4, Hemlata Kumari2, Ashish K. Maurya6, Neeraj Kumar3 and Abhishek Shori4
1Department of Agronomy, 2Department of GPB, 3Department of Extension Education 1,2,3Bihar Agricultural University, Sabour–813210, India
4Department of Agronomy, 5Department of GP5, 6Department of Horticulture 4,5,6Institute of Agricultural Sciences, Banaras Hindu University, Varanasi–221005, India
E-mail: *[email protected]
Keywords: Foliar Fertilization, Sustainability, Economics, Food and Nutritional Security
INTRODUCTION
In India, wheat is the second most important cereal crop next to rice contributing nearly 35% to the national food basket and plays an important role in food and nutritional security of the nation. Efficient utilization of applied nitrogen fertilizers in both economic and environmental point of view is key factor for sustainability. Nitrogen is typically required in large quantity than any other nutrients but, inappropriate N management has detrimental effect on crop yield and the environment. Foliar fertilization is an efficient technique of fertilization which enhances the availability of nutrients. The aim of this experiment was to study the effect of foliar fertilization of urea on yield and yield components when applied at different growth stages of wheat.
MATERIALS AND METHODS
The field experiment was carried out in Randomized block design with three replications at Bihar Agricultural University Farm during rabi 2013–14. The treatment consisted of 8 different treatments of nitrogen management as two factors i.e., soil application of nitrogen and foliar feeding of urea in different concentration at different growth stages. Plant population and no. of tiller/ m2 was recorded with the help of 1 square meter quadrate from the five random points in each plot. The five plant in each plot were randomly selected and tagged for recording growth parameters and observations namely plant height, leaf area were recorded at various stages and at harvest stage length of ear head.(cm), number of fertile spikelets, number of grain per ear head. Grain and stover yield recorded from net plot area and converted to one hectare basis for statistical analysis. The data recorded for different characters under investigation were analyzed by following analysis of variance procedure as described by Gomez and Gomez (1984).
RESULTS AND DISCUSSION
The results revealed that growth yield and economics of wheat was significantly influenced by different nitrogen management practices. Plant height at different growth stages (Except at 30 DAS) was significantly
It is I
LLEGAL t
o cop
y, pri
nt or
save
any c
onten
t of th
is PDF,
in pa
rt or in
full,
on an
y retr
ieval
syste
m,
withou
t the E
XPRESS WRITTEN PERMISSIO
N of th
e cop
yrigh
t-hold
er

National Conference on Climate Change and Agricultural Production: Adapting Crops to Climate Variability and Uncertainty, 6th–8th April, 2017
[377]
affected by the soil and foliar application of nitrogen. However, at harvest tallest plant (94 cm), maximum numbers of tillers (240 m2), bigger ear head (14.5) and more number of grains per earhead (18.8), maximum test weight (41 g), grain (49.65q ha-1) and straw yield (70.75 q ha-1) were recorded under basal application of recommended dose of fertilizer i.e.T1 (50%N as basal + 25%N at CRI + 25%N at jointing), but it was found statistically at par with treatment T2 (50%N as basal + 25%N at CRI + 2% urea solution at jointing) and T8
(50%N as basal + 4 % urea solution at CRI, tillering and jointing stage). While, plant population (no. m2), harvest index was not significantly affected by both soil and foliar application of urea. The maximum gross return (Rs 96760 ha-1), net return (Rs 68508 ha-1) and B:C Ratio (2.42) were recorded under treatment T1 which was statistically similar with the treatment T2 (50%N as basal + 25%N at CRI + 2% urea solution at jointing stage of crop growth). The similar results observed by Yasmeen et al., 2012. Hence, it may be concluded that reduced dose of soil N and foliar feeding of urea may be an economically viable and ecologically sound option of nutrient supplementation of wheat during in season crisis of urea without significant yield reduction compared to 100% recommended doses of fertilizers with an added advantage of 21 to 26.61% saving of N in wheat crop.
REFERENCES [1] Gomez K A and Gomez A A 1984. Statistical procedures for agricultural research. A Willey- Inter Sci. Publication. John Willey & Sons,
New York. [2] Yasmeen A E A A, Abou El-Nour and S Shedeed 2012. Response of wheat to foliar spray with Urea and Micronutrients. Journal of
American Science 6 (9): 14-22.
Morphometric and Biochemical Profiling of Promising Myrobalan Accessions (Terminalia chebula Retz.) for Nutritional Security:
A Multipurpose Fruit Yielding Agroforestry Tree
Mahantappa Sankanur1*, N.B. Singh2, Sanjeev Thakur3, Saresh N.V.4 and Archana Verma5 1Navsari Agricultural University, Navsari–396450, India
2Central Agricultural University (CAU), Imphal–793103, India 3Dr. Yashwant Singh Parmar University of Horticulture and Forestry, Nauni, Solan–173230, India
4Regional Research Station (PAU), Ballowal Shahid Bhagat Singh Nagar–144521, India 5Central Arid Zone Research Institute, ICAR, Jodhpur–342003, India
E-mail: *[email protected]
Keywords: Accessions, Biochemical Profiling, Domestication, Morphometric, Nutritional Security, Terminalia chebula
INTRODUCTION
Terminalia chebula Retz. species is prized for its fruit which has medicinal value. The fruit is extensively used for the treatment of diarrhoea, dysentery, heartburn, flatulence, dyspepsia and liver as well as spleen disorders. The annual demand for the Harar fruit in India is 6778.4 tonnes which is growing @ 4.6 per cent annually. The fruit both fresh and dried has a ready market at Amritsar, Hoshiarpur and Delhi. The fruit is also exported to Pakistan and Gulf countries. The harvesting of fruits starts from August to September and continues till January. Majority (90%) of the trees bear small sized fruits of inferior quality locally known as kachra. Large sized fruits fetch a premium price, minimum three times higher to that of kachra type. Varieties with large fruits are used for making 'Murabba' and are, therefore, called as 'Murrabi' variety. Keeping these
It is I
LLEGAL t
o cop
y, pri
nt or
save
any c
onten
t of th
is PDF,
in pa
rt or in
full,
on an
y retr
ieval
syste
m,
withou
t the E
XPRESS WRITTEN PERMISSIO
N of th
e cop
yrigh
t-hold
er

National Conference on Climate Change and Agricultural Production: Adapting Crops to Climate Variability and Uncertainty, 6th–8th April, 2017
[378]
points in view selected six accessions from the natural population of Himachal Pradesh based on the previous study in the department. Further, these selected accessions were vegetatively propagated and planted in the field. The present investigation was carried out on these accessions at 10 years young age to characterize on the basis of morphological and biochemical levels.
MATERIALS AND METHODS
Six selected accessions of T. chebula viz., Kothi (G1), Paragpur-1 (G2), Paragpur-2 (G3), Kallar (G4), Bhella (G5) and Tamber (G6) which are grown at (lat. 32° 18′ N, long. 75° 65′ E and altitude 428 m) RHRS, Jachh, Kangara, were used for characterization on the basis of morphological and biochemical levels during the year 2011–12. These accessions were investigated for qualitative and quantitative morphological parameters with and four replications and the statistical analysis was done using RBD as described by Pillai and Sinha (1968). Further these were also studied for determination of chemical composition and minerals using standard procedures and methodologies (AOAC, 1980) with four replications and mean values reported. The entire data generated from the present investigation were put to statistical analysis was done using CRD in accordance with procedure outlined by Gomez and Gomez (1984).
RESULTS AND DISCUSSION
This study, makes comprehensive attempt to provide description accounts of variation in fruit and seed traits, this further provide an idea about the traits of interest for T. chebula domestication. Further, this study also revealed that there was considerable phenotypic variation in almost every qualitative fruit parameters measured and that of few traits are closely related. The present study also reveals that there is an opportunity to identify a small number of key traits (of both fruit traits and seed traits) that together would form an ‘ídeotype’ that combines highly desirable characteristics of potential value. The overall profile of various macro and micro minerals as well as other chemical constituents shows T. chebula fruits as highly nutritious. Average values of pH, titratable acidity, ascorbic acid, total carbohydrates, tannins, nitrogen and proteins, phosphorous and potassium in the fruits from the six accessions lied between 3.48 to 3.74, 564.00 to 762.10 ml of 0.1 N NaOH/100 g of fresh pulp weight, 7.86 to 11.70 mg/100 g of fresh pulp weight, 3.81 to 7.18%, 27.07 to 39.02% (dry weight basis), 0.43 to 1.38% (fresh weight basis), 2.71 to 8.66% (fresh weight basis) and 79.00 to 203.89% (fresh weight basis) and 229.46 to 486.13 mg/100 g (fresh weight basis) respectively. Amongst the micro minerals contents in the fruits; sulphur, magnesium, calcium and iron were in higher amounts than zinc, copper, manganese and iron. Average values (mg/100 g of fresh pulp weight) of sulphur, zinc, copper, magnesium, calcium, manganese and iron in the fruit samples from six accessions of T. chebula ranged from, 60.90 to 113.21 mg, 0.046 to 1.511 mg, 0.166 to 0.651 mg, 32.28 to 75.17 mg, 27.31 to 142.40 mg, 0.021 to 0.261 mg and 2.59 to 4.26 mg, respectively. Fresh fruits of T. chebula can be used as a source of vitamin C in human diet. These fruits should be regularly, used either in the raw form or in the form of 'Jams' and 'Murabba’ so that these fruits become an important part of our diet to supplement human dietary requirements. The study confirms the need for domestication of T. chebula accessions to be based on two ideotypes, one for fruit flesh [Paragpur 1 (G2)] and the other for seed trait [Paragpur 2 (G3)].
REFERENCES [1] AOAC 1980. Official methods of analysis of the association of official analytical chemists. AOAC. Washington. D.C.pp: 14-17. [2] Gomez K A and Gomez A A 1984. Statistical procedure for agricultural research. New York: John Wiley and Sons. pp: 680. [3] Pillai S K and Sinha H C 1968. Statistical methods for biological workers. Ram Prasad and Sons, Agra pp: 241-245.
It is I
LLEGAL t
o cop
y, pri
nt or
save
any c
onten
t of th
is PDF,
in pa
rt or in
full,
on an
y retr
ieval
syste
m,
withou
t the E
XPRESS WRITTEN PERMISSIO
N of th
e cop
yrigh
t-hold
er

National Conference on Climate Change and Agricultural Production: Adapting Crops to Climate Variability and Uncertainty, 6th–8th April, 2017
[379]
Influence of Organic Manure, Crop Residues and Inorganic Fertilizers on Microbiological Properties of Calcareous Soil
Ashutosh Singh1, Amit Kumar Pandey2*, J. Prasad3, Umesh Singh4 and Santosh Kumar5 1,2,4Department of Soil Science & Agricultural Chemistry, 5Department of Agronomy
1,2,4,5Bihar Agricultural University, Sabour, Bhagalpur–813210, India 3Department of Soil Science & Agricultural Chemistry,
Rajendra Agricultural University, Samastipr, Pusa–848125, India E-mail: *[email protected]
Keywords: Microbial Properties, Calcareous Soil Organic Manure, Crop Residue, Inorganic Fertilizer
INTRODUCTION
Depletion of organic matter in soil discourages activity of soil micro flora responsible for decomposition of organic matter to enrich soil fertility (Singh, 2008). Soil organism acts as primary driving agents of nutrient cycling, regulating the dynamics of soil organic matter, soil carbon sequestration greenhouse gas emission, modifying soil structure and water regimes, enhancing the amount of nutrient acquisition by vegetation, conferring stress tolerance, resisting pathogens and improving plant health. The main objective of this investigation is to assess the effect of conjoint use of crop residue, compost and chemical fertilizers on microbial population for soil of Bihar in general and calcareous soil of North Bihar in particular.
MATERIALS AND METHODS
A long-term field experiment was started in rabi 1988–89 at RAU Research Farm, Pusa. Sixteen treatments comprised of four main plot treatments {Control (No NPK fertilizer), 50% recommended NPK, 100% recommended NPK & 150% recommended NPK} and four sub plot treatments {Control (no compost and no crop residue), Compost @ 10 t ha-1, Crop residue & Compost + crop residue} were tested in split plot design with three replications. Soil samples were collected from each of the 48 subplots after harvest of wheat at a depth of 0–15 cm. Total bacterial population was counted by soil dilution and plating technique using Asparagine-Mannitol agar medium (Thornton, 1922). The fungal population in soil sample was estimated on Rose Bengal streptomycin agar medium (Martin, 1950) by pour-plate technique. Population of actinomycetes was enumerated using Jensen’s Casein agar medium (Jensen, 1930a) by pour plate method.
RESULTS AND DISCUSSION
There was considerable increase in the population of bacteria, fungi and actinomycetes with continuous application of chemical fertilizers and organic manure alone or in combination. Bacterial population increased to a tune of 8.73, 24.60 and 28.82 per cent over control (31.50 x 10⁶ cfu g-1soil). Fungal population increased to 26.5, 29.0 and 30.0 104 cfu g-1 soil over control (24 x 104 cfu g-1 soil) and actinomycetes population increased by 2.94, 9.41 and 11.17 per cent over control (42.50 x 10⁵ cfu g-1 soil) at 50, 100 and 150 per cent NPK. Incorporation of compost and crop residue also increased the population of bacteria, fungi and actinomycetes and their effectiveness follow the order: compost + crop residue > compost > crop residue > no manure.The grain and straw yield of rice and wheat increased significantly with increasing levels of NPK fertilizer in both the years. Maximum grain and straw yield of both the crops in both years were obtained with 150 per cent NPK which were at par with yield obtained with 100 per cent NPK. The yield of rice and wheat also increased with the application of organics in order of compost + crop residue > compost > crop residue > no manure. More or less similar yield due to incorporation of compost as well as crop residue indicated that compost @ 10 t ha-1 could be substituted with crop residue.
REFERENCE [1] Singh A K 2008. Soil Resource Management- Key to Food and Health Security.Journal of the Indian Society of Soil Science 9: 348-357.
It is I
LLEGAL t
o cop
y, pri
nt or
save
any c
onten
t of th
is PDF,
in pa
rt or in
full,
on an
y retr
ieval
syste
m,
withou
t the E
XPRESS WRITTEN PERMISSIO
N of th
e cop
yrigh
t-hold
er

National Conference on Climate Change and Agricultural Production: Adapting Crops to Climate Variability and Uncertainty, 6th–8th April, 2017
[380]
Role of Biofertilizer and Chemical Fertilizer for Sustainable Onion (Allium cepa L.) Production
V.K. Singh, Amrita Kumari*, V.K. Chaudhary and S. Shree Department of Horticulture (Vegetables and Floriculture)
Bihar Agricultural University, Sabour–813210, India E-mail: *[email protected]
Keywords: Biofertilizer, Chemical fertilizer, Onion
INTRODUCTION
It is needed to explore and exploit the potential of alternative sources of plant nutrients. Biofertilizer is an important component of Integrated Plant Nutrition System (IPNS). The use of biofertilizers in combination with chemical fertilizers offers a great opportunity to increase the crop production at less cost (Gunjan et al. 2005). The concept of sustainable agriculture envisages primary emphasis on manipulation and management of biological systems not only to maximize yield but also to stabilize the agro-systems and to minimize industrial input demands which may endure the adverse effect of climate change. Therefore, the experiment was conducted for sustainable production of onion.
MATERIALS AND METHODS
The experiment was carried out in the Department of Horticulture (Vegetable and Floriculture), Bihar Agricultural College Sabour during rabi season 2009 and 2010. The experiment was laid out in a factorial randomized block design, replicated thrice with onion variety Arka Kalyan. The experiment was framed with biofertilizers viz., M0- 0, M1- Azospirillum, M2- VAM, M3- PSB, M4- Azospirillum + VAM and M5- Azospirillum+ PSB and four levels of chemical fertilizers, F1- N60P30K40, F2- N90P45K60, F3- N120P60K80 and F4- N150P75K100 having 24 treatment combinations. Biofertilizers were used as seedling inoculation as well as soil application.Treatment wise different microbial inoculants at the rate of 10 g/ litre of water were mixed and the roots of uprooted seedlings were dipped for 20 minutes before transplanting. For soil, microbial inoculants were applied at the rate of 6 kg/ha. As per treatment microbial inoculants and dried F.Y.M in the ratio of 1:20 were mixed thoroughly andmixture was broadcasted and incorporated in the sub-plots. The statistical analysis of the data noted in all observations was carried out by the method of “Analysis of variance” as suggested by Fisher and Yates (1963).
RESULTS AND DISCUSSION
The results of the experiment showed that the fertility level F3 (N120P60K80) with inoculation of M4 (Azospirillum + VAM) i.e., M4F3 produced maximum plant height (51.96cm), number of leaves per plant (11.96), leaf length (45.71cm), fresh weight of leaves per plant (32.58g) as well as yield and its attributing components like bulb length (5.13cm), bulb diameter (5.85cm), bulb weight (81.44g), bulb volume (92.8cc), bulb yield (467.61q/ha), dry bulb weight (45.10q/h) and total dry weight of plants (63.92q/ha) were also achieved. The application of microbial inoculants M4(Azospirillum+ VAM) exhibited the maximum plant height and collar thickness which was statistically similar to M5 (Azospirillum+ PSB). Yield attributing characters like length and diameter of bulb, weight of bulb, volume of bulb and bulb yield were maximum due to main effect of M4 (Azospirillum+ VAM) as well as fertility level of F3 (N120P60K80) and both the treatments were outstanding being significantly superior to remaining treatments. However, inoculation of Azospirillum + VAM with seedling treatment as well as soil application at the fertility level of N90P45K60 was
It is I
LLEGAL t
o cop
y, pri
nt or
save
any c
onten
t of th
is PDF,
in pa
rt or in
full,
on an
y retr
ieval
syste
m,
withou
t the E
XPRESS WRITTEN PERMISSIO
N of th
e cop
yrigh
t-hold
er

National Conference on Climate Change and Agricultural Production: Adapting Crops to Climate Variability and Uncertainty, 6th–8th April, 2017
[381]
the most effective combination for higher net return and B: C ratio (3.47). The least B:C ratio of 1.08 was registered at the lowest fertility level of F1 (N60P30K40) without any inoculation of biofertilizer i.e. M0F1. Hence, it may be concluded that the use and management of natural resources in sustainable agriculture, the microbial fertilizers holds vast potential for the future.
REFERENCES [1] Gunjan Aswani, Paliwal R and Saralia, D K 2005. Effect of nitrogen and biofertilizers on yield and quality of rabi onion (Allium cepa L.)
cv. Puna Red. Agricultural Science Digest 25 (2): 124-126. [2] Fisher R A and Yates F 1963. Statistical tables for Biological, Agricultural and Medical Research, Long Man Group Limited, London. Sixth
Edition.
Evaluation of Melia composita Willd. Families for Germination Traits and Growth Variation at Nursery Stage
R.S. Chauhan1*, N.S. Thakur2, M.S. Sankanur1, H.T. Hegde3 and S.K. Jha1 1Department of Forest Biology and Tree Improvement,
2Department of Silviculture and Agroforestry, 3Department of Forest products and Utilization
1,2,3ASPEE College of Horticulture and Forestry, Navsari Agricultural University, Navsari, India
E-mail: *[email protected]
Keywords: Germination Percentage, Melia composita, Seed Parameters, Seedling Vigour Index
INTRODUCTION
Melia composita Willd. is a species of high industrial economic value commonly referred as Malabar Neem belongs to family Meliaceae. It is fast growing multipurpose, indigenous tree species which is an excellent raw material for wood based industries like paper and plywood. It is also an important medicinal tree and a good source of bio-pesticide. Present study was conducted to evaluate the seed morphological parameters, germination, growth and biomass parameters of different families of Melia composita under nursery condition.
MATERIALS AND METHODS
Present study was conducted at ASPEE College of Horticulture & Forestry, Navsari Agricultural University, Navsari, Gujarat in the year of 2012–13. Thirty half sib families of Melia composita Willd. were procured from Division of Genetics and Plant Propagation, FRI, Dehradun. Seed Morphological parameters like seed length seed width and 100 seed weight were recorded in the seed technology laboratory. Seeds were further sown in the net house nursery, as are received in three replications for evaluating germination traits. After 6 months of sowing date, growth variation and biomass parameters were recorded and seedling vigour indices (Abdul Baki & Anderson, 1973) derived to select overall good performing families in the nursery.
RESULTS AND DISCUSSION
There was significant difference in seed variation parameters among the 30 families of Melia composita. Seed length was found maximum (17.99 mm) in family no.115, which was at par with family no. 159 (17.40 mm), 28 (17.39 mm), 104 (17.21 mm), 260 (17.18 mm), 237 (16.93 mm) while minimum (11.66 mm) seed length was found in family no. 75. Seed width recorded highest (14.61 mm) in family no. 270 while, lowest
It is I
LLEGAL t
o cop
y, pri
nt or
save
any c
onten
t of th
is PDF,
in pa
rt or in
full,
on an
y retr
ieval
syste
m,
withou
t the E
XPRESS WRITTEN PERMISSIO
N of th
e cop
yrigh
t-hold
er

National Conference on Climate Change and Agricultural Production: Adapting Crops to Climate Variability and Uncertainty, 6th–8th April, 2017
[382]
(8.16 mm) width was recorded in family no. 69. Variability in seed weight among various families was studied. The seed weight ranged from 45.25 g to 172.07 g. Maximum 100 seed weight was recorded in family no. 237 (172.07 g) which was at par with family no 270 (167.28 g) and followed by 104 (160.30). Minimum weight was recorded in family no.69 (45.25 g). Seed shape varies from oblong to ellipsoid in various families with seed colour creamish yellow to light brown. Germination percentage was recorded maximum (55.42 %) in family no. 270, while minimum (2.50 %) germination was recorded in family no. 232. Germination starts from16 days and continues up to 3 months. Mean daily germination was recorded highest (1.39) in family no. 270 and minimum (0.06), MDG was recorded in 232. Germination period ranges from 28 to 39 days after sowing among the various families. Peak value of germination was found maximum (0.96) in family no. 267 and germination value was recorded higher (1.298) in family no. 270. Rate of germination (Figure 1) was found higher in family no. 259 followed by 270, 76, 195 and 24.
Fig. 1: Germination Rate of Different Families of Melia composita
Seedling shoot length was recorded highest (91.27 cm) in family no. 28 while, lowest shoot length (40.00 cm) was recorded in family no. 271. Collar diameter was found maximum (6.88 mm) in family no. 195 and minimum (3.40 mm) collar diameter was recorded in family no. 232. Root length among the families found significant. Maximum (30.70 cm) root length was recorded in family no. 195 while, minimum (10.87 cm) root length was recorded in family no. 257. Root shoot ratio was found higher (0.36) in family no. 195 and lower (0.18) root shoot ratio was found in family no. 115 and 69. It is evident from the seedling vigour index-I (Abdul -Baki and Anderson, 1973) that in terms of vigour, performance of family no. 267, 270, 259, 195, 76 and 24 were superior as compared to the other tested families of Melia composita. Highest shoot fresh weight (11.56 g) was recorded in family no. 64 and lowest (4.36 g) shoot fresh weight was recorded in family no. 271. Shoot dry weight was recorded highest in family no. 64 (5.38 g) and lowest (1.2 g) shoot fresh weight was recorded in family no. 271. Root fresh weight was found maximum in family no. 64 (21.6 3g) while; lower shoot fresh weight was recorded in family no. 115 (2.77 g). Root dry weight recorded maximum in family no. 64 (9.70 g). It is evident from the seedling vigour index-II (Abdul -Baki and Anderson, 1973) that in terms of biomass, performance of family no. 259, 270, 195, 76, 24 and 267 were excellent as compared to the other tested families of Melia composita. From the data it is inferred that family no. 237, 270, 104 and 159 excel in seed parameters like seed length, seed width and seed weight. As far as germination is concern, maximum germination percentage was recorded in family no. 270 which was followed by family no. 259, 76, 267, 195 and 24. Similarly, rate of germination was high in family no. 267,
0.0
10.0
20.0
30.0
40.0
50.0
60.0
24 25 28 32 64 69 75 76 104
114
115
128
159
195
232
233
237
256
257
258
259
260
261
262
263
265
267
268
270
271
It is I
LLEGAL t
o cop
y, pri
nt or
save
any c
onten
t of th
is PDF,
in pa
rt or in
full,
on an
y retr
ieval
syste
m,
withou
t the E
XPRESS WRITTEN PERMISSIO
N of th
e cop
yrigh
t-hold
er

National Conference on Climate Change and Agricultural Production: Adapting Crops to Climate Variability and Uncertainty, 6th–8th April, 2017
[383]
270, 76, 24 and 259. Overall seedling vigour index (I & II) of family no. 267, 259, 270, 195, 76, and 24 found high among the different families in nursery condition.
Effect of Different Level of Nitrogen and Phosphorus on Dry Matter Yield at Different Growth Stages of Popcorn in
Saurashtra Region of Gujarat
P.J. Marsonia, Shalini Kumari*, Santosh Kumar, Ramjeet Yadav and Rajkishore Kumar Department of Soil Science & Agril. Chemistry,
Junagadh Agricultural University, Junagadh–362001, India E-mail: *[email protected]
Keywords: Nitrogen, Phosphorus, Dry matter and Popcorn
INTRODUCTION
In Indian agriculture, maize assumes a special significance on account of its utilization as food, feed and fodder besides several industrial uses. Despite maize being predominantly rainfed crop its productivity is more than rice which is mainly grown under assured irrigated/ rainfed conditions. nowadays, the maize corn used for popcorn, is profitable for a lot of producers and traders. In Gujarat, the important districts growing maize are Dahod, Panchmahal, Vadodara, Sabarkantha, Kheda, Banaskantha, Bharuch, Anand and Dang. The area under popcorn in the Saurashtra region is almost negligible. It is mainly cultivated in kharif season, and due to photo insensitive crop, it is also grown as rabi and summer crop. The maize is classified into seven principal groups on the basis of endosperm and floral bract or glume character viz., pod corn, popcorn, flint corn, dent corn, soft corn, sweet corn and waxy corn. Popcorn is very popular snack food in many parts of the world. The use of popcorn confectionaries and popcorn products especially in amusement parks, moving picture theaters etc greatly increased the demand for popcorn products and have made a profitable outlet for those who desire to grow popcorn on a commercial scale. Nitrogen and phosphorus consumption has a strange effect on production of popcorn and expanding leaf area plants which receive the most nitrogen and phosphorus contain more leaf area index than wild plants. This study was carried out in order to investigate the effect of nitrogen and phosphorus on dry matter yield at different stages ofpopcorn.
MATERIALS AND METHODS
The research work was carried out during rabi season of 2013–14 at the field of laboratory Department of Agronomy, Junagadh Agricultural University, Gujarat. The soil was medium in available nitrogen (260.34 kg ha-1), medium in available phosphorus (42 kg ha-1) and medium in available potash (238 kg ha-1) and low in available sulphur about (12 kg ha-1), medium in alkaline in reaction with pH 8.0 and EC 0.27 dS m-1. The treatment comprises of sixteen combination with nitrogen and phosphorus. The treatment wise entire dose of phosphorus and half dose of nitrogen were applied as basal application in the form of Urea and SSP at just before sowing in the furrows. Remaining half dose of nitrogen were top dressed in two splits as urea at 20 and 40 DAS, whereas sulphur supplied through SSP was equalized by cosavet ferti- WG (90% S). The study were subjected to statistical analysis followed for factorial Randomized Block Design.
RESULTS AND DISCUSSION
The dry weight of leaves, stem, root and total plant was significantly influenced by the different levels of nitrogen and phosphorus (Table 1). The dry weight of leaves, stem, root and total plant was recorded
It is I
LLEGAL t
o cop
y, pri
nt or
save
any c
onten
t of th
is PDF,
in pa
rt or in
full,
on an
y retr
ieval
syste
m,
withou
t the E
XPRESS WRITTEN PERMISSIO
N of th
e cop
yrigh
t-hold
er

National Conference on Climate Change and Agricultural Production: Adapting Crops to Climate Variability and Uncertainty, 6th–8th April, 2017
[384]
significantly higher with 150 kg N ha-1 (N3) and phosphorus @ 75 Kg ha-1 (P3) of popcorn at 30, 60 DAS and at harvest. It was also remained at par with application of 120 kg N ha-1 (N2) and 60 kg P2O5 ha-1 (P2). The dry matter accumulation rate by virtue of increased photosynthetic efficiency. This phenomenon can be explained by the fact that the supply of nitrogen enhances the production of leaves, stem small roots and root hairs, which in turn facilitated the high absorbing capacity per unit dry weight. Increased dry matter production with increased fertilizer application was due to role of P in determining the efficiency of sunshine by the increased biomass and any inadequacy of nitrogen reduces the sunshine use efficiency or ability to photosynthesized as reported by (Wadsworth 2002). Thus greater availability of photosynthates, metabolites and nutrients to develop reproductive structures seems to have resulted in increased dry weight of vegetative parts of plants i.e leaves, stem, root and grain. The interaction effect of nitrogen and phosphorus did not produced significant effect on dry weight of leaves, stem, root, grain and total plant of popcorn at harvest.On the basis of one year field experimentation, it seems quite logical to conclude that significantly the higher dry matter yield of leaf, root, stem, grain and total plant at 30DAS, 60DAS and at harvest were obtained from rabi popcorn (cv. Amber) by fertilizing the crop with nitrogen application @ 150 kg N ha-1 (N3) and 75 kg P2O5 ha-1 (P3) in medium black calcareous soils of Saurashtra region of Gujart.
REFERENCE [1] Wadsworth G 2002. Forage maize fertilizer requirement, Potash Development Association, Brixtraw. pp: 25-29.
In vitro Propagation of Banana cv. Grand Naine
Ravi Kumar1, Feza Ahmad1, Hidayatullah Mir1 and R.K. Sohane2 1Department of Horticulture (F & FT), 2Directorate of Extension
1,2Bihar Agricultural University, Sabour–813210, Bhagalpur, India E-mail: *[email protected]
Keywords: Banana, Grand Naine, Micropropagation, In Vitro
INTRODUCTION
Banana is generally propagated vegetatively through suckers, which grow from lateral buds originating from corms and suckers. Suckers are used for production of individual plants. In some instances, complete or separated corms with one or several buds may be used. This process is very slow as the rate of multiplication of suckers through conventional vegetative means has been found to express several negative impacts which include transmission of diseases, low production and poor preservation of original plant genetic material. Further one banana plant produces only five to ten suckers in a year depending upon the variety and grow more slowly and produce smaller bunches. Quality planting material is the key for successful production of banana and tissue culture is an excellent option for producing low cost quality planting material. The rapid proliferation obtained in tissue culture allows nurserymen to meet an unexpected demand for a particular variety. Moreover tissue cultured plants have been reported to produce 39 per cent higher yield than plants from sword suckers (Farahani et al., 2008). Keeping in view the importance of tissue culture technology in banana an experiment was carried out for rapid multiplication of banana cv. ‘Grand Naine’ through tissue culture.
MATERIALS AND METHODS
The experiment was carried out at Plant Tissue Culture Laboratory, Bihar Agricultural College, Sabour, and Bhagalpur during the year 2014–15. Sword suckers of banana variety Grand Naine were collected from the
It is I
LLEGAL t
o cop
y, pri
nt or
save
any c
onten
t of th
is PDF,
in pa
rt or in
full,
on an
y retr
ieval
syste
m,
withou
t the E
XPRESS WRITTEN PERMISSIO
N of th
e cop
yrigh
t-hold
er

National Conference on Climate Change and Agricultural Production: Adapting Crops to Climate Variability and Uncertainty, 6th–8th April, 2017
[385]
experimental field and were used as explants. These suckers were washed in running tap water for 20 minutes to remove adhering soil. The roots and outer tissues of the suckers were removed with the help of a sharp knife. A number of outer leaves were removed until the shoot measured about 3.0–5.0 cm in length. All the experiments were performed on MS media (Murashige & Skoog’s 1962) supplemented with different concentrations of cytokinin alone and in combination with auxins for establishment and shoot multiplication. Half MS media with different concentrations of auxins were used to get rooting.Banana plantlets were finally placed on different potting mixtures for acclimatization.
RESULTS AND DISCUSSION
One of the most commonly encountered problems in in vitro culture establishment is the contamination. The efficiency of sterilizing agents was evaluated in terms of maximum aseptic explants sprout. The contamination significantly decreased with increase in concentration of sterilants and their time of exposure. Addition of cytokinin alone or in combination with auxins was found essential during shoot proliferation and multiplication. BAP 3.0 mg l-1 +NAA 1.0 mg l-1 was found most effective with regard to number of days (22.2) required for shoot induction and length of shoots (7.0 cm) where as maximum number of shoots (4.8) was achieved with BAP 4.0 mg l-1 +IAA 0.1 mg l-1.Half strength MS media with IBA 1.5 mg l-1 was found significantly higher over all other auxin treatments for various rooting parameters. Grand Naine plantlets obtained through in vitro propagation exhibited highest 80 percent survival in coco peat during acclimatization.
REFERENCE [1] Farahani F, Aminpoor H, Sheidai M Z, Noormohammadi Z and Mazinani M H 2008. An Improved System for in vitro propagation of
banana (Musa acuminata L.) cultivars. Asian Journal of Plant Science. 7: 116-118.
Effect of Nutripriming and Mulching on Growth and Yield of Chickpea (Cicer arietinum L.) under Limited Irrigation
K. Pramanik* and S. Poddar Department of Agronomy, Institute of Agriculture, Visva-Bharati, Sriniketan–731236, India
E-mail: *[email protected]
Keywords: Chick Pea, Seed Priming, Mulching, Irrigation
INTRODUCTION
Chickpea (Cicer arietinum L.) is mainly grown in semi-arid and arid zones under rain fed condition by using residual soil moisture. Efficient utilization of water is essential as water scarcity is the major problems in most of the chickpea growing areas. Micronutrient deficiency is also a common problem particularly zinc (Zn) and molybdenum (Mo) in chickpea growing belt. Zn Application through seed priming is contributed to increase the speed and synchrony of seed germination (Pirasteh-Anosheh et al., 2011) and also improved seedling establishment and enhanced plant growth. Seed priming with Zn significantly improved yield and related traits (Kaya et al., 2007). In plants, Mo is involved in nitrogen nutrition and assimilation. Mo helps non-legume plants to use nitrates taken up from the soil. In legumes, Mo serves an additional function: to help root nodule bacteria to fix atmospheric Nitrogen (Campo et al., 2000). As researchers observed that seed treatment is the effective method for Mo application than soil application, an attempt was made in this study using nutripriming and mulching on chick pea to increase the productivity in lateritic belt of Indian sub-tropic.
It is I
LLEGAL t
o cop
y, pri
nt or
save
any c
onten
t of th
is PDF,
in pa
rt or in
full,
on an
y retr
ieval
syste
m,
withou
t the E
XPRESS WRITTEN PERMISSIO
N of th
e cop
yrigh
t-hold
er

National Conference on Climate Change and Agricultural Production: Adapting Crops to Climate Variability and Uncertainty, 6th–8th April, 2017
[386]
MATERIALS AND METHODS
Field experiment was conducted during rabi season of 2013–14 at Agricultural College Farm, Palli Siksha Bhavana (Institute of Agriculture), Visva-Bharati, Sriniketan, Birbhum, West Bengal. The soil of the experiment site was sandy-loam in texture having high percentage of sand (62.5) and low percentage of clay (26.0). The soil was slightly acidic (6.1), low in soil organic carbon (0.49%), available nitrogen (136 kg ha-1) and phosphorus (11.5 kg ha-1), medium in potassium (160.5 kg ha-1) and available zinc was 0.504 ppm. The field experiment was carried out in factorial RBD with seed priming and mulching having three replications. The treatments were comprised of four nutripriming viz., control, hydro-priming, molybdenum priming (100 ppm), zinc priming (500 ppm) and Zinc priming (500 ppm) + molybdenum priming (100 ppm) and three mulching viz., control, straw mulching at 5t ha-1and straw mulching at 7.5t ha-1. The chick pea variety “Anuradha” was sown immediately after the harvest of the previous crop rice. For priming, chickpea seeds were subjected to hydro-priming, priming with zinc 500 ppm, molybdenum 100 ppm and priming with zinc 500 ppm + molybdenum 100 ppm for 8 hours at room temperature (25±2°C). Seed weight to solution volume ratio was 1:1.5 (w/v). For seed priming, seeds were soaked in respective solution or water. Thereafter seeds were removed, were given three surface washings and re-dried with forced air near to its original weight. Untreated seeds were used as control treatment. Dry rice straw material was applied in between rows of plans as mulching material for conserving soil moisture at 15 days after sowing (DAS).
RESULTS AND DISCUSSION
Result showed that crop under nutripriming increased plant height, leaf area index, dry matter production, relative water content and nodules number over the crop at without nutripriming. The result also indicates that combined nutripriming of zinc (500 ppm) + molybdenum (100 ppm) recorded the highest values of growth parameters than other nutripriming treatments. The crop at nutripriming with zinc (500 ppm) + molybdenum (100 ppm) also helped in recording greater number of number of pods plant-1, number of grains plant-1 and test weight which ultimately produced maximum grain yield of 993 kg ha-1 and 909 kg ha-1 of the crop with zinc (500 ppm) + molybdenum (100 ppm) and zinc (500 ppm) nutripriming over that of the crop under control, respectively. Application of 7.5 t of straw mulching ha-1 recorded the higher values of growth parameters. The crop receiving 7.5 t straw mulching ha -1 recorded the highest relative leaf water content. The crop receiving 7.5 t straw mulching ha -1 recorded the higher values of number of number of pods plant-1, and number of grains plant-1,and test weight of chickpea grain yield components. The crop receiving 7.5 t of straw mulching ha-1 produced the highest grain yield of 941 kg ha-1 and it was statistically at par with crop having 5.0 t of straw mulch ha-1.
REFERENCES [1] Campo R J, Albino U B and Hungria M 2000. Importance of molybdenum and cobalt to the biological nitrogen fixation. In: F.O. Pedrosa,
M. Hungria, Yates, G., Newton (eds.) W.E., Nitrogen Fixation: From Molecules to Crop Productivity, Springer, Netherlands. pp: 597–598. [2] Kaya C, Tuna A L, Ashraf M and Altunlu H 2007. Improved salt tolerance of melon (Cucummismelo L.) by the addition of proline and
potassium nitrate. Environmental and Experimental Botany60: 397-403. [3] Pirasteh-Anosheh H, Sadeghi H and Emam Y 2011. Chemical priming with urea and KNO3 enhances maize hybrids (Zea mays L.) seed
viability under abiotic stress. Journalof Crop Science and Biotechnology14: 289-295.
It is I
LLEGAL t
o cop
y, pri
nt or
save
any c
onten
t of th
is PDF,
in pa
rt or in
full,
on an
y retr
ieval
syste
m,
withou
t the E
XPRESS WRITTEN PERMISSIO
N of th
e cop
yrigh
t-hold
er

National Conference on Climate Change and Agricultural Production: Adapting Crops to Climate Variability and Uncertainty, 6th–8th April, 2017
[387]
Long Term Influence of Organics and Inorganic Fertilizer on Distribution and Transformation of Boron under Rice-Wheat
Cropping System in Calciorthents
Amit Kumar Pandey*, Ashutosh Singh, J. Prasad1 and Umesh Singh Department of Soil Science & Agricultural Chemistry
Bihar Agricultural University, Sabour–812210, Bhagalpur, India 1Department of Soil Science & Agricultural Chemistry,
Rajendra Agricultural University, Samastipur, Pusa–848125, India E-mail: *[email protected]
Keywords: Organics, Inorganic Fertilizer, Boron, Calciorthents
INTRODUCTION
Among all the micronutrient deficiency, boron occupiessecond rank after Zn in soils of Bihar. Most of the plant available B comes from decomposition of soil organic matter and from B adsorbed on the surface of soil colloid (Berger and Pratt, 1963). B is found in soil in various forms and is distinguished in many categories. However, only few forms are available to plant and their determination is important for estimation of its availability to plant. The supply of soil B to plants depends upon relative abundance of different forms and equilibrium among them. Owing to narrow limit between the sufficiency and the toxicity levels of B, its availability in calcareous soil that received fertilizers alone or with manure and crop residue assumes importance.
MATERIALS AND METHODS
A long-term field experiment is in progress since rabi 1988–99 at Experimental farm of RAU, Pusa, Bihar. The initial properties of surface soil were pH 8.4, EC 0.36 dSm-1, organic carbon 5.0 g kg-1, free CaCO3 34.2% and available boron 0.52 mg kg-1. Four fertility levels consisting of control, low fertility level, medium fertility level and high fertility level were used as treatment in main plots. Each main plot was divided into four sub-plots in which sub treatments: No crop residue or compost; Compost @ 10 t ha-1; Crop residue (100%) and Compost @ 10 t ha-1 + Crop residue (100%)were superimposed. The crop investigated and reportedin this paper was35th crop of rice (cv. Rajshree) in kharif and 36th crop of wheat (cv. UP 262). Available boron in post-harvest soil of 36th crop wheat was determined by the method described by Berger and Truog, 1939 and subjected to calorimetric estimation following reaction with carmin reagent.
RESULTS AND DISCUSSION
The available B content in surface soil (0–15 cm) varied from 0.43 to 0.75 mg kg-1, while that in 15–30, 30–45, 45–60, 60–90 and 90–120 cm depths ranged from 0.39 to 0.70, 0.33 to 0.64, 0.12 to 0.55, 0.03 to 0.43 and 0.01 to 0.31 mg kg-1, respectively. The total boron remained in residual form (3.4 to 6.54 mg kg-1) and the quantity of other forms like readily soluble-B, specifically adsorbed-B; oxide bound-B and organically bound-B were very low and varied from 0.065 to 0.166, 0.056 to 0.138, 0.075 to 0.174 and 0.274 to 0.620 mg kg-1, respectively.
REFERENCES [1] Berger KC and Truog E 1939.Extraction and determination of plant available boron in Soils. Soil Science 57: 32-37. [2] Berger K C and Pratt PJ 1963. Advances in secondary and micro-nutrientfertilization.In: McVickar MH, Bridger GL, Nelson LB (ed.).
Fertilizertechnology and use.SSSA, Madison, WI. pp: 281-340.
It is I
LLEGAL t
o cop
y, pri
nt or
save
any c
onten
t of th
is PDF,
in pa
rt or in
full,
on an
y retr
ieval
syste
m,
withou
t the E
XPRESS WRITTEN PERMISSIO
N of th
e cop
yrigh
t-hold
er

National Conference on Climate Change and Agricultural Production: Adapting Crops to Climate Variability and Uncertainty, 6th–8th April, 2017
[388]
Engineering Interventions for Reducing Postharvest Losses in Food Grains under Climate Smart Agriculture in Bihar
Ashok Kumar1*, Satish Kumar1, Sanoj Kumar1, Prasanta Kalita2 and Kent Rausch2 1Department of Agricultural Engineering, B.A.C., Sabour, Bhagalpur–813210, India
2University of Illinois, Urbana, Champaign, USA E-mail: *[email protected]
Keywords: Hermetic, Postharvest, Productivity, Milling, Storage, Drying
Food grain production in Bihar has improved from 3.76% in 2010–11 to 5.46% in 2012–13 due to productivity jump from 1478 kg/ha to 2647 kg/ha (2013–14). The productivity enhancement of rice doubled from 1095 in 2010–11 to 2523 kg/ha in 2013–14. Bihar incurs a total production of 5.38 Lakh tonnes of total pulses (including kharif and Rabi season during year 2014–15) and has total pulses area of 6.12 lakh hectare.Postharvest loss reduction activities have a major economic impact and should increasingly become a major focus in development strategies: carefully selected interventions leading to reductions in PHL are likely to be much more cost-effective than investments in additional production. Grain production has been steadily increasing due to advancement in production technology, but improper postharvest handling results in high losses in food grains. Post-harvest losses in India amount to 12 to 16 million metric tons of food grains each year, an amount that the World Bank estimates could feed one-third of India's poor or the entire population of the states of the Bihar and Haryana together for about one year (Nagpal and Kumar, 2012). The monetary value of these losses amounts to more than Rs. 50,000 crores per year. During processing and storage, quantitative as well as qualitative losses occur due to improper handling. A large number of insect pests have been reported to be associated with stored grains. Almost all species have remarkably high rates of multiplication and, within one season, may destroy 10–15% of the grain and contaminate the rest with undesirable odors and flavors.
In recent study of ongoing project it has been observed that major losses occurred during post harvest operations at the producer’s level. For the prevention of losses due to drying, storage and milling, a STR dryer has been fabricated for cereal and pulses crops which can remove the moisture up to 2–4% in 6 to 8 hours of operation and for storage, a super grain bag is low cost ultra hermetic bag is available for smallholder farmers. This bag is tested for farm conditions and can be relied upon to safely preserve dried agricultural commodities such as maize, wheat, rice paddy and lentil. It’s made from multilayer recyclable polyethylene plastic (PE) with a proprietary barrier layer with sufficiently low permeability to prevent the exchange of air and the absorption of moisture. It is designed to be used multiple times. As per milling is concerned which also play a vital role in postharvest losses. A mini dal mill and rubber roller sheller for paddy may be intervened to achieve the target. The type and material of the rolls and grinders varies for different type of grains and depends upon various process parameters such as inherent moisture in the paddy and pulses, their size and other factors.
REFERENCE [1] Nagpal M and Kumar A 2012. Grain losses in India and government policies. Quality Assurance and Safety of Crops & Foods4(3):143.
It is I
LLEGAL t
o cop
y, pri
nt or
save
any c
onten
t of th
is PDF,
in pa
rt or in
full,
on an
y retr
ieval
syste
m,
withou
t the E
XPRESS WRITTEN PERMISSIO
N of th
e cop
yrigh
t-hold
er

National Conference on Climate Change and Agricultural Production: Adapting Crops to Climate Variability and Uncertainty, 6th–8th April, 2017
[389]
Information and Communication Technology for Knowledge Management in Climate Smart Agriculture
C.K. Panda and S.R. Singh Department of Extension Education
Bihar Agricultural University, Sabour–813210, Bhagalpur, India E-mail: *[email protected]
ABSTRACT
Keywords: Climate Smart, ICT Tools, Extension Approaches, Farmers
Climate Smart Agriculture (CSA) is “agriculture that sustainably increases productivity, enhances resilience (adaptation), reduces/ removes GHGs (mitigation) where possible, and enhances achievement of national food security and development goals (FAO 2013)”. Climate-smart agriculture as an approach for transforming and reorienting agricultural development under the new realities of climate change (Lipper et al. 2014). Productivity, adaptation, and mitigation are three interlinked pillars necessary for CSA. Implementation and integration of these three pillars are knowledge intensive. Success of Knowledge intensive CSA technology application depends on Knowledge Management. As Knowledge management (KM) is the process of creating, sharing, using and managing the knowledge and information. Information and Communication Technology (ICT) tools can play major role for KM. Farmers are in centre for CSA; and KM through ICT tools is the means for attaining interlace of these three aforesaid pillars of CSA. However, the major challenges are ‘How to involve’ the farmers in CSA development and ‘How to address’ the heterogeneous farming community with CSA technologies and ‘How to practice’ CSA in farmers’ field. CSA is now in cross road for changing the farmers or farms for its adoption. It is fact that there is a change in cognitive domain of farmers on CSA, but, its utility in change the farms is wanting i.e. attainment to psychomotor domain is yet to reach in mass level for CSA; this raise the question on functionality of our agricultural extension approaches. Exiting agricultural extension approaches includes general extension approach, commodity specialized approach, training and visit approach, agricultural extension participatory approach, project approach, farming systems development approach, cost-sharing approach, educational institution approach, broad based extension approach (Axinn,1988). Due to heterogeneity of farming community on the bases of their socio-economic conditions, facilities availability, social capital etc., any single extension approach is not enough to support them with CSA, rather multiple agricultural extension approaches are needed with appropriate methods of technology transfer with best possible tools with minimum distortion of message in real time basis. In this regard, ICT tools are promising for Knowledge Management in CSA intervention. This research paper will introspect the issues and their interlace of in relation to: a) case studies on CSA in India and other developing and under developed nations; b) CSA Knowledge Management in Agriculture Extension; c) ICT tools identification for CSA Knowledge Management; and d) it will propose an Agricultural Extension model for Knowledge Management in CSA Technology. Finding of this research in the form of Agricultural Extension model for CSA intervention may give a new means for farmers, extension workers, policy makers and all the concern stakeholders under changing climate condition.
REFERENCES [1] Axinn G H 1988. Guide on Alternative Extension Approaches. Agricultural Education and Extension Service, Human Resources
Institutions and Agrarian Reform Division. Rome, FAO, M/S8971E/1/12.88/1000. [2] FAO 2013. Climate-Smart Agriculture: Sourcebook. Rome, Italy: Food and Agriculture Organization of the United Nations. [3] Lipper L, Thornton P, Campbell BM and Torquebiau E F 2014. Climate-smart Agriculture for Food Security. Nature, Climate Change
4:1068-1072.
It is I
LLEGAL t
o cop
y, pri
nt or
save
any c
onten
t of th
is PDF,
in pa
rt or in
full,
on an
y retr
ieval
syste
m,
withou
t the E
XPRESS WRITTEN PERMISSIO
N of th
e cop
yrigh
t-hold
er

National Conference on Climate Change and Agricultural Production: Adapting Crops to Climate Variability and Uncertainty, 6th–8th April, 2017
[390]
Study on Flowering Behaviour of Elite Mango Cultivars in Subtropical Conditions of Bihar
Khushboo Azam1*, Hidayatullah Mir2, Ravindra Kumar3 and Bishun Deo Prasad4 1,2,3Department of Horticulture (F&FT), 4Department of Plant Breeding and Genetics
1,2,3,4Bihar Agricultural University, Sabour–813210, Bhagalpur, India E-mail: *[email protected]
Keywords: Mango, Floral Biology, Inflorescence
INTRODUCTION
Flowering is decisive factor in the productivity of mango (Mangifera indica L). The process associated with mango involves shoot initiation followed by floral differentiation of apical bud, and panicle emergence (Murti and Upreti, 2000). All these developmental events occur in most of the mango cultivars sometimes during October-December under tropical as well as subtropical conditions. The induction of floral bud formation has strong links to prevailing environmental conditions and age of terminal resting shoots (Davenport, 2007). Flowering in mango is considered to be a complex phenomenon. Generally in Bihar, the flowering period starts from February and extended up to March. The flowering period of mango is usually of short duration of 2 to 3 weeks; low temperature may extend it, whereas higher temperature may shorten it. Mango exhibits a wide variation in flowering and fruiting habit due to varietal differences and diversity in agro-climatic conditions. The limited reports on the floral biology of popular cultivars of mango in Bihar prompted us to analyse the behaviour of this critical biological event among sixteen popular mango cultivars of Bihar.
MATERIALS AND METHODS
The study was carried out in Bihar Agricultural University, Sabour during the year 2016–17. Sixteen elite cultivars of mango were selected for this experiment and were given uniform cultural treatments. The experiment was laid out in randomised block design (RBD) with three replications.The mango tree canopy for each individual selected tree was marked and the panicles weretagged of each tree on four sides i.e., north, south, east and west using paper tag. The critical dates from bud initiation to fruit sets in all sixteen cultivars were recorded. The counting of the opened flowers within each panicle was carried out daily by using forceps and magnifying lens. Staminate and hermaphrodite flowers were observed and counted throughout the flowering period.
RESULTS AND DISCUSSION
The perusal of data recorded showed the earliest panicle emergence in cultivar Bombay Green while cultivar Neelum wasobserved late in panicle emergence. Zardalu most popular cultivar of Bhagalpur region showed the maximum number of panicles (2500) followed by Langra while Neelum recorded the least number of panicles (600). Swarnrekha showed the maximum panicle length (24.4 cm) followed by Dashehari. There were differences between cultivars in the date of first flower opening and in the time and duration of peak flowering. There is, therefore, the possibility of carrying out selection for earliness of flowering as well as the duration of flowering. In terms of the different flower types, all cultivars first produced staminate flowers then hermaphrodite one. Langra showed the maximum percentage of hermaphrodite flowers (75%). Maximum percentage of malformed panicle was recorded in the cultivar Mulgoa (43%) while other cultivars were found less affected with malformation.
REFERENCES [1] Murti GS R and Upreti KK2000. Plant hormones. In: Advances in Plant Physiology, (ed. A. Hemantaranjan), Scientific Publishers, Jodhpur
(India).3:109-148. [2] Davenport TL2007. Reproductive physiology of mango. Brazilian Journal of Plant Physiology19(4):363-376.
It is I
LLEGAL t
o cop
y, pri
nt or
save
any c
onten
t of th
is PDF,
in pa
rt or in
full,
on an
y retr
ieval
syste
m,
withou
t the E
XPRESS WRITTEN PERMISSIO
N of th
e cop
yrigh
t-hold
er

National Conference on Climate Change and Agricultural Production: Adapting Crops to Climate Variability and Uncertainty, 6th–8th April, 2017
[391]
In Vitro Multiplication of Guava Rootstocks: Psidium Guajava cv. Lucknow-49 and Psidium Friedrichsthalianum (Chinese Guava)
Shashi Kala*1, Suneel Sharma2, Subhash Kajla3 and Hidayatullah Mir4 1Department of Food Science and Postharvest Technology, 4Department of Horticulture
(Fruit & Fruit Technology), BAU, Sabour–813210, Bhagalpur, India 2Department of Horticulture, College of Agriculture, 3Center for Plant Biotechnology
2,3Chaudhary Charan Singh Haryana Agricultural University, Hisar–125004, India E-mail: *[email protected]
Keywords: Guava, In Vitro, Micropropagation, Rootstocks
INTRODUCTION
Guava is commercially propagated through vegetative method to produce true-to type plants which bear early. For vegetative propagation like grafting and budding rootstocks are essential. But guava rootstocks are generally propagated from seeds and seedling rootstocks have long juvenile period and are variable in both plant and fruit characteristics. Substantial variability is available in seedling populations in different guava growing regions (Srivastava, 2005). Rootstocks exhibit great effect on plant architecture, yield, and quality and impart resistance to biotic and abiotic stresses in fruit crops. Lucknow-49 (L-49) and P. friedrichsthalianum (Chinese guava) are commercially used as rootstocks in guava owing to its resistance to wilt. Tissue culture could be an efficient technique for clonal propagation of guava rootstocks and may be applied with the objective of enhancing the rate of multiplication. Over a million plants can be obtained from a small portion of explants within few months through tissue culture. Such a prolific rate of multiplication cannot be expected by any of the in vivo methods of clonal propagation. Crop improvement through genetic transformation also needs efficient in vitro regeneration system (Rai et al., 2007). The study was therefore conducted to develop an efficient regeneration system that could be helpful for rapid multiplication of these important guava rootstocks and hence improving the quality and production of guava fruit.
MATERIALS AND METHODS
The experiment was conducted in the year 2008–2010 at the CCS Haryana Agricultural University, Hisar and in the Centre for Plant Biotechnology, Haryana State Council for Science and Technology, Deptt. of Science and Technology, Government of Haryana at CCS HAU campus, Hisar, India. The vegetative shoots of 20–25 cm length were excised from the healthy trees of Psidium guajava cv. L-49 and P. friedrichsthalianum and were brought to the laboratory to be used as explants. Thereafter, shoots were washed under running tap water and leaves were removed with the help of scalpel. Nodal segment with first, second and third node from shoot apex was prepared with the help of clean scalpel. It was followed by complete sterilization process. The efficiency of sterilizing agents was evaluated in terms of maximum aseptic explants sprout. In order to reduce phenolic exudation, explants were treated for 12 minutes in Ascorbic acid (0.2%) + citric acid (0.4%) solution. For culture establishment MS basal media (Murashige and Skoog, 1962) supplemented with different concentrations and combinations of growth regulators were tried to get shoot proliferation, multiplication and rooting. Finally well developed plantlets were transferred to pots containing suitable potting mixture for their hardening in polyhouse.
It is I
LLEGAL t
o cop
y, pri
nt or
save
any c
onten
t of th
is PDF,
in pa
rt or in
full,
on an
y retr
ieval
syste
m,
withou
t the E
XPRESS WRITTEN PERMISSIO
N of th
e cop
yrigh
t-hold
er

National Conference on Climate Change and Agricultural Production: Adapting Crops to Climate Variability and Uncertainty, 6th–8th April, 2017
[392]
RESULTS AND DISCUSSION
In our experiment as the 6-benzylaminopurine (BAP) level was increased, the in vitro shoot regeneration was found to be increased. When the BAP + kinetin concentration was increased in the media, the percent regeneration of shoots increased however some values were found statistically at par. Shoot regeneration was also observed in MS (Murashige and Skoog) media supplemented with different concentration of BAP + NAA (1-Naphthaleneacetic acid). However, MS media supplemented with different concentration of TDZ (Thidiazuron ) was not found satisfactory for shoot regeneration. The significantly higher shoot regeneration in Psidium guajava cv. L-49 in terms of minimum number of days were recorded on media containing (MS + 2.0mg/l BAP + 0.5 mg/l NAA) followed by media having (MS + 3.0mg/l BAP + 0.5mg/l NAA). Similar trend was observed in rootstock of Psidium friedrichsthalianum for percent shoot regeneration. Maximum percent rooting was obtained in media containing (1/2MS + 2.0mg/l IBA (Indole-3-butyric acid) + 0.5NAA + activated charcoal) which also gave maximum number of roots per shoot. The number of days taken for visible root formation was also recorded minimum in the same media for both the rootstocks. Plantlets were then transferred to potting mixture Sand: Soil: FYM (1:1:1 v/v) for acclimatization. P. guajava cv. L-49 and P. friedrichsthalianum recorded 78.0 and 71.8 percent survival respectively in the same potting mixture. Root and shoot initiations are closely regulated by the relative concentrations of auxin and cytokinin in the medium (Rout et al., 2000). BAP is the most common cytokinin used for guava propagation. Superiority of BAP for shoot induction may be attributed to the ability of plant tissues to metabolize BAP more readily than other synthetic growth regulators or to the ability of BAP to induce production of natural hormones such as zeatin within the tissue (Malik et al. 2005). Rai et al. (2009) found BAP was more effective than kinetin in inducing shoot proliferation in guava. In rooting media involvement of IBA in ethylene biosynthesis has been suggested that auxin induced ethylene may induce adventitious root formation instead of auxin itself (Mudge, 1989).
REFERENCES [1] Malik S K, Chaudhury R and Kalia R K 2005. Rapid in vitro multipli-cation and conservation of Garcinia indica: a tropical medicinal tree species.
Scientia Horticulturae106:539–553. [2] Mudge M W 1989. Effect of ethylene on rooting. In: Davis, T.D.; Haissing, B.E. and Sankhla, N. (eds.). Adventitious root formation in cuttings.
Dioscorides Press, Portland, DR. pp: 150-161. [3] Rai M K, Jaiswal V S and Jaiswal U 2009. Effect of selected amino acids and polyethylene glycol on maturation and germination of somatic
embryos of guava (Psidium guajava L.). Scientia Horticulturae121: 233-236. [4] Rout G R, Samantaray S and Das P 2000. In vitro manipulation and propagation of medicinal plants. Biotechnology Advances18:91–120. [5] SrivastavaU 2005. Genetic resources management in guava. In: Kishun R, Mishra AK, Singh G, Chandra R (eds) Proceeding of 1st international
guava symposium. CISH, Lucknow, India, pp: 17–18.
It is I
LLEGAL t
o cop
y, pri
nt or
save
any c
onten
t of th
is PDF,
in pa
rt or in
full,
on an
y retr
ieval
syste
m,
withou
t the E
XPRESS WRITTEN PERMISSIO
N of th
e cop
yrigh
t-hold
er

National Conference on Climate Change and Agricultural Production: Adapting Crops to Climate Variability and Uncertainty, 6th–8th April, 2017
[393]
Effect of Irrigation Levels and Nitrogen Doses on Crop Water Use and Water Use Efficiency of Late Sown Wheat
Mukesh Kumar*, R.K. Pannu and Bhagat Singh Department of Agronomy, CCS Haryana Agricultural University, Hisar–125004, India
E-mail: *[email protected]
Keywords: Water Use, WUE, Late Sown Wheat
INTRODUCTION
During past few years, sowing of the wheat gets delayed due to late harvest of preceding crop as compulsion and not choice of the farmers.Irrigation water and fertilizers are the two vital but costly inputs in irrigated farming. Proper growth and development of wheat needs favorable soil moisture in the root zone. Nitrogen is an important constituent of chlorophyll and plays a vital role in metabolic processes. Balanced use of nitrogen is a key point for higher land profitability and healthy environment. Irrigation water dissolved the fertilizers and was made available to the crop for proper growth and development.
MATERIALS AND METHODS
Experiment was conducted to study the effect of irrigation and nitrogen levels on water use and WUE of late sown wheat during 2010–11 and 2011–12 at CCS Haryana Agricultural University, Hisar. The experiment consisting of three irrigation levels viz. one irrigation at CRI (I1), two irrigations at CRI and heading (I2) and four irrigations at CRI, late tillering, heading and milking (I3) in main plots and five nitrogen doses viz. 0 kg N/ha (F0), 50 kg N/ha (F1), 100 kg N/ha (F2), recommended dose of nitrogen (F3 -150 kg N/ha) and 200 kg N/ha (F4) in sub-plots was laid out in strip plot design with four replications. The consumptive use of water and WUE was determined by formula given by Dastane (1972) and Scott (2000).
RESULTS AND DISCUSSION
The maximum consumption of water was recorded in four irrigations crop at CRI, late tillering, heading and milking (I3) followed by two irrigations at CRI and heading (I2) and minimum consumption of water was recorded with one irrigation crop (Table 1). This might be due to application of more irrigations in I3 than I2 and I1. Frequent recharging of profile through irrigation in I3 kept the soil surface wet, resulted in more loss of water through process of evaporation. Applied nitrogen had marginal influence on seasonal water use. The maximum consumption of water was recorded with the application of 200 kg N/ha and consumption decreased with decreased N doses. Water use efficiency was slightly decreased with increase in irrigation frequency. Frequent recharging in I3 provided the plenty of water to crop and the loss of water was at potential rate, this is also visible from the crop water use and cumulative pan evaporation data. Water use efficiency increased with increased nitrogen dose. It was highest with treatment 200 kg N/ha, followed by RDF (150), 100, 50 kg N/ha and lowest with control (0 kg N/ha). The higher water use efficiency at higher nitrogen doses was mainly due to higher grain yield of crop with similar water use at higher nitrogen doses. These results are in agreement with Pradhan et al. (2013).
It is I
LLEGAL t
o cop
y, pri
nt or
save
any c
onten
t of th
is PDF,
in pa
rt or in
full,
on an
y retr
ieval
syste
m,
withou
t the E
XPRESS WRITTEN PERMISSIO
N of th
e cop
yrigh
t-hold
er

National Conference on Climate Change and Agricultural Production: Adapting Crops to Climate Variability and Uncertainty, 6th–8th April, 2017
[394]
Table 1: Effect of Irrigation and Nitrogen on Crop Water Use and Water Use Efficiency (WUE) of Late Sown Wheat
Treatments Crop Water Use (cm) WUE (kg/ha-mm) 2010–11 2011–12 2010–11 2011–12
Irrigation levels I1- One irrigation (CRI) 18.91 17.77 13.46 15.22 I2 – Two irrigations (CRI and heading) 24.11 23.90 13.20 13.69 I3- Four irrigations (CRI, late tillering, heading and milking)
29.79 30.79 12.86 12.95
Nitrogen levels F0- 0 kg N/ha 23.69 22.55 8.16 8.99 F1- 50kg N/ha 24.05 23.66 12.25 12.95 F2- 100 kg N/ha 24.21 24.57 14.35 14.75 F3- 150 kg N/ha 24.48 24.89 15.27 15.64 F4- 200 kg N/ha 24.91 25.09 15.43 15.95
REFERENCE [1] Pradhan S, Chopra U K, Bandhopadyay K K, Singh R, Jain A K and Chand I 2013. Effect of water and nitrogen management on water
productivity and nitrogen use efficiency of wheat in a semi-arid environment. International Journal of Agricultural Science and Food Science Technology4(7): 727-732.
Impact of Natural Resource Management Intervention under National Innovation in Climate Resilient Agriculture (NICRA) Project in
Jehanabad district of Bihar: Some Reflections
Shobha Rani1, Jeetendra Kumar2*, A.K. Singh3 and R.K. Sohane4 1,2KVK, Jehanabad
3,4Directorate of Extension Education, BAU, Sabour–813210, Bhagalpur, Bihar
E-mail: *[email protected]
Keywords: NRM, Water Harvesting, Irrigation, Climate, NICRA
INTRODUCTION
Changing climate scenario at the global levellike rise in environmental temperature, less and erratic rainfall pattern and degrading soil moisture conditions are adversely affecting the production and productivity of Indian Agriculture. Availability ofIrrigation water has become a great challenge before the farming community to carry out their farm operations efficiently. There is greater need to motivate the farmers to learn and adopt the different ways of Natural resource management (NRM) which is very important intervention for water conservation through demonstration of different types of water harvesting structures aiming towards stress management in drought condition. One such initiative has been undertaken by KVK Jehanabad under NICRA Project started by CRIDA, Hyderabad and ICAR, N. Delhi in Sakrorha village of Modanganj block of Jehanabad district. Farmers of this village have been facing water crisis since last 4–5 years since very less amount of rain water received during Kharif season creating drought like situation. Therefore, for growing paddy crop successfully in Kharif season and for pre irrigation in Rabi crops, various NRM works have been carried out under Technology Demonstration component of NICRA Project as well as in convergence mode with other agencies. This paper examines the impact of these NRM activities in terms of irrigation potential created and outscaling in nearby areas.
It is I
LLEGAL t
o cop
y, pri
nt or
save
any c
onten
t of th
is PDF,
in pa
rt or in
full,
on an
y retr
ieval
syste
m,
withou
t the E
XPRESS WRITTEN PERMISSIO
N of th
e cop
yrigh
t-hold
er

National Conference on Climate Change and Agricultural Production: Adapting Crops to Climate Variability and Uncertainty, 6th–8th April, 2017
[395]
MATERIALS AND METHODS
The Krishi Vigyan Kendra, Jehanabad has adopted village Sakrorha of Modanganj block under NICRA project. Crop cultivation in Sakrorha village is mostly dependent on rainfall. However, the village had some surface water structures as a network of pynes and also had some shallow depth ponds to tap rainwater but low capacity of these structures especially ponds were not capable of saving paddy crops in prevailing drought situation. The number of tube wells in the village is very less. Keeping these things in view, One Village Climate Risk Management Committee (VCRMC) initially composed of ten members was formed and after thorough discussion with the local people some previously existing surface water reservoirs have been renovated and some new created in the village which included ponds, check dams, miniature water bodies, pyne renovation, bunding, levelling and dug out pits.
RESULTS AND DISCUSSION
Accordingly, seven ponds were renovated at different points of the village to harvest and store water for crop cultivation. Seven check dams have also been constructed at different locations of pynes to buildup water head & to divert the flowing water into farmer's fields. Besides, five miniature water ponds have been dugout in 5% portion of each plot having 1/3rd acre size to harvest and store runoff water for supplemental irrigation during dry spells. Pyne renovation work have also been performed in convergence with MNREGA in order to clear out the siltation and increase the depth to enhance the water carrying capacity. In the same manner, bund strengthening work and levelling was carried out for in-situ moisture conservation and checking soil erosion with aided benefits of plantation on the borders. In addition to these, water storage structures also created by the small farmers themselves nearby their fields in form of dug out pits.Pond water harvested and used for supplemental/life saving irrigation in paddy crop, which prevented crop failure and created irrigation capacity of 414942.3 cubic ft whereas in Rabi season, pond water is being used for moisture retention for all rabi crops (Wheat, oilseed, pulses, barley, oat) and upto at least first irrigation in wheat. Thus, around 90% increase in cultivation area lying around the pond and irrigation provided in additional 63 ha area benefitting around 150 farmers each year. Likewise, the checkdams constructed were capable of storing 1028407.4 cubic ft water which helped in buildup water head in the pynes & diverted the stored water in farmer’s field. Thus, irrigation provided in additional 60 ha area benefitting around 120 farmers each year through these checkdams. Miniature water ponds have been dugout in 5 % portion of 1 acre land of each farmer thus covering a total of 5 acres land under irrigation. Further due to NRM work, the existing dry wells got recharged and now, there is availability of water round the year in these wells. Similarly, 3.2 ha area covered under irrigation by means of four dug out pits/ Jal Kund. Strengthening of bund helped in in-situ water conservation for paddy crop and these stored water contributed in maintaining moisture for timely sowing of rabi crops like gram, lentil in case of Mono cropping system otherwise farmers were compelled to sow pulses in late condition or require pre irrigation due to less moisture in the fields and it also promoted soil conservation by checking soil erosion whereas in-situ moisture conservation was done in 10.1 ha area through land levelling.
REFERENCES [1] Athavale RN 2003. Water harvesting and sustainable supply in India. Rawat Publications, Jaipur, India. pp: 48. [2] Oweis T, Hachum A and Kijne J 1999. Water Harvesting and Supplemental Irrigation for Improved Water Use Efficiency in the Dry Areas.
SWIM Paper 7. International Water Management Institute, Colombo.
It is I
LLEGAL t
o cop
y, pri
nt or
save
any c
onten
t of th
is PDF,
in pa
rt or in
full,
on an
y retr
ieval
syste
m,
withou
t the E
XPRESS WRITTEN PERMISSIO
N of th
e cop
yrigh
t-hold
er

National Conference on Climate Change and Agricultural Production: Adapting Crops to Climate Variability and Uncertainty, 6th–8th April, 2017
[396]
Impact of Improved Crop Interventions Suitable for Climate Resilient Agriculture
Shobha Rani1, Jeetendra Kumar2*, A.K. Singh3 and R.K. Sohane4 1,2KVK, Jehanabad
3BAU, Sabour 4Directorate of Extension Education, BAU, Sabour, Bhagalpur, Bihar
E-mail: *[email protected]
Theme: Crop Adaptation and Management Intervention for Climate Resilient Agriculture
Keywords: Conservation Tillage, Crop Diversification, Adaptation, Low Water Requiring Crops, Mulching, Sprinkler Irrigation, NICRA
INTRODUCTION
Agriculture production is highly vulnerable to climate change. Fast climatic changes happening across the globe has changed climatic characteristics of a season, which has resulted in uncertain rains and other fluctuations, raising the challenge to develop climate resilient technologies. A significant change in climate on a global scale has affected crop cultivation and agriculture as a whole, consequently affecting the world's food supply. Yield potential of majority of crops is affected by various climatic factors like temperature, solar radiations, humidity, rainfall, wind, drought, salinity etc. Increasing crop productivity in unfavorable environments will require advanced technologies to complement traditional methods which are often unable to prevent yield losses due to environmental stresses. There is an urgent need to better assess climate risks, understand the interconnections between climate change and improved agricultural management coping strategies and then accordingly farmers have to be motivated to adopt the suitable practices based on micro level contingency planning. With these facts in view, after visualizing the impact of climatic threats, various technologies related to agronomical interventions have been demonstrated by KVK, Jehanabad under NICRA project with far reaching impact in the adopted village. This paper is based on the assessment of impact of improved farming practices demonstrated with special reference to climate resilient agriculture.
METHODOLOGY
The Technology demonstration component was implemented during 2012–16 in adopted village Sakrorha, block- Modanganj which is 8 kilometers north-west of KVK, Jehanabad in Bihar. The village is facing with climatic vulnerability of drought. Various technologies related to agronomical interventions demonstrated with far reaching impact include promotion of community nursery, conservation tillage, promotion of short duration drought tolerant crop varieties, crop diversification along with low water requiring crops, intercropping/ mixed cropping as well as in-situ moisture conservation practices (mulching) and sprinkler irrigation in Rabi crops. All these technologies intend to maximize the production with minimum use of irrigation water.
RESULTS AND DISCUSSION
Community nursery was grown by the farmers on community basis in nearby areas of pond. Almost 20–22% saving in irrigation water each year in nursery raising of medium & short duration paddy was observed. Wheat sowing by zero tillage technology helped in timely cultivation using available residual soil moisture with saving of agricultural inputs (seed, irrigation water, labour, fuel) and an increase of 12–15 percent was
It is I
LLEGAL t
o cop
y, pri
nt or
save
any c
onten
t of th
is PDF,
in pa
rt or in
full,
on an
y retr
ieval
syste
m,
withou
t the E
XPRESS WRITTEN PERMISSIO
N of th
e cop
yrigh
t-hold
er

National Conference on Climate Change and Agricultural Production: Adapting Crops to Climate Variability and Uncertainty, 6th–8th April, 2017
[397]
observed in wheat yield. The land which were used to remain fallow in water crisis/ late monsoon situation are now being used for cultivation of short duration paddy varieties (Sahbhagi, Sabour Ardhjal, Abhishek, Susk Samrat, Prabhat) and Wheat (HD-2985). Farmers adopted improved varieties of other low water requiring crops like redgram, finger millet and pearl millet in kharif season and Pulses (Lentil, Chickpea), Oilseed (Tori, Rai, Mustard, Sesame, Linseed), and Spices Crop (Coriander, Fenugreek, Nigella, Omum). Farmers adopted intercropping/ mix cropping which helped to cope up with water scarcity situation with less input management. During kharif season crops like red gram along with millet and redgram along with jowar were grown. In Rabi season, gram with linseed as border crop and lentil with mustard were also practiced. Mulching technology contributed towards in situ moisture conservation in vegetable crops during Rabi/ summer season. Farmers have adopted the technology of plastic mulching in okra crop whereas straw mulching in bitter gourd and sprinkler irrigationin wheat, lentil along with rapeseed-mustard.
CONCLUSION
In order to obtain the optimum crop yield in rain fed drought situation, the farming community will have to adopt climate resilient technologies as per the need and prevailing trend of the climate.With unpredictable weather, farmers must keep changing crop management practices by growing tolerant varieties and be prepared for constant change in the farming practices.
REFERENCES [1] Passioura J 2006. Increasing crop productivity when water is scarce—from breeding to field management .Agric. Water Manag (80):
176–96 [2] Travis Lybbert and Daniel Sumner 2010. Agricultural Technologies for Climate Change Mitigation and Adaptation in Developing Countries:
Policy Options for Innovation and Technology Diffusion, ICTSD–IPC Platform on Climate Change, Agriculture and Trade, Issue Brief No.6, International Centre for Trade and Sustainable Development, Geneva, Switzerland and International Food & Agricultural Trade Policy Council, Washington DC, USA.
Rooting of Black Pepper (Piper nigrum) Cuttings as Influenced by Media
Pranay Kumar* and D.K. Ghosh Department of Spices and Plantation Crops, Faculty of Horticulture
B.C.K.V., Mohanpur–741253, India E-mail: *[email protected]
Keywords: Black Pepper, Growth Regulator, Cuttings, Root Parameters
INTRODUCTION
Black pepper (Pipernigrum L., Family: Piperaceae) popularly known as“king of spices”, is the oldest and most importantspice crop grown in India. It is native to Western Ghats and it is grown in 26 countries including India, Indonesia, Srilanka, Thailand, China, Vietnam, Cambodia, Brazil, Mexico and Guatemala. From medicinal point of view it is used as acarminative, stomachic and febrifuge. This crop is cultivated to a large extent in Kerala, Karnataka and Tamil Nadu and to a limited extent in Maharashtra, North eastern states and Andaman & Nicobar Islands. This crop is grown in about 201381 hectares with a production of 55000 tonnes annually (2012–13). There is an immense need toincrease the area under pepper plantation to meet thedomestic as well as export market is of greaterimportance. Growth regulators such as auxins increase more percentage of success and number of roots in black pepper cuttings. This would improve the vigour of
It is I
LLEGAL t
o cop
y, pri
nt or
save
any c
onten
t of th
is PDF,
in pa
rt or in
full,
on an
y retr
ieval
syste
m,
withou
t the E
XPRESS WRITTEN PERMISSIO
N of th
e cop
yrigh
t-hold
er

National Conference on Climate Change and Agricultural Production: Adapting Crops to Climate Variability and Uncertainty, 6th–8th April, 2017
[398]
freshly transplanted plant material in the field, thus reduces the rate of mortality of plants and helps to maintain adequate crop stand in theplantations. Therefore, the main objective is to study the effect of media on rooting of black pepper cuttings.
MATERIALS AND METHODS
The present investigation was carried out innaturally ventilated polyhouse with Completely Randomized Design B.C.K.V., Kalyani, West Bengal in the year 2016. The media formulations were T1-Soil:Sand:FYM (2:1:1), T2-Soil:Sand:FYM:SD (1:1:1:1),T3- Soil:Sand:FYM:SD (2:1:1:1), T4- Soil:Sand:FYM:SD(3:1:1:1), T5- Soil:Sand:FYM:CD (1:1:1:1), T6 -Soil:Sand:FYM:CD (2:1:1:1), T7-Soil:Sand:FYM:CD(3:1:1:1), T8- Soil:Sand: FYM: Ash (1:1:1:1), T9 -Soil:Sand:FYM:Ash (2:1:1:1),T10- Soil:Sand:FYM:Ash(3:1:1:1), T11-Soil:Sand:FYM:VC(1:1:1:1),T12 -Soil:Sand:FYM:VC (2:1:1:1),T13 - Soil:Sand:FYM:VC (3:1:1:1).Where, FYM = Farm yard manure, SD = Saw dust, CD = Coir dust, Ash and VC = Vermicompost.This crop was planted from February 2016 to June 2016. Potting mixture consisted jungle soil, sand and FYM in the ratio of 2:1:1 which was filled into 20 × 12 cm sized perforated polythene bag of 200 micron thickness. Media was drenched with Copper-oxy chloride (0.3%) as a prophylactic measures against fungal diseases.In each treatment 100 cuttings used which was replicated thrice. The experiment was conducted in naturally ventilated poly house.
RESULTS AND DISCUSSION
The present study indicated that, significant influence of rooting media on increasing the rooting percentage of black pepper cuttings propagated under naturally ventilated polyhouse.The effect was marked inrooting media viz., soil + sand + FYM + vermicompost(1:1:1:1 v/v) with 79% rooting, soil + sand + FYM +vermicompost (2:1:1:1 v/v) with 76.67 % rooting and soil +sand + FYM + coir dust (1:1:1:1 v/v) with 76.67% rooting. Similar views were reported by (Siddagangaiah et al., 1996) in vanilla. The maximum primary roots (12.03) were observed in the treatment soil + sand + FYM + vermicompost (1:1:1:1v/v). This may be attributed to the excellent structure,porosity and nutrients in available form such asnitrate nitrogen and soluble phosphorus for excellent rooting in vermicompost comprising media (Atiyeh et al., 2001).The fresh and dry weight of roots was significantly higher (5.02 and 2.01 g, respectively) in cuttings raised on soil + sand + FYM + vermicompost(1:1:1:1 v/v).
REFERENCES [1] Atiyeh RM, Edwards CA, Subler S and Metzger J D 2001. Pig manure vermicomposts as a component of a horticulturalbedding plant medium:
effects on physicochemical properties and plant growth. Bioresource Technology 78: 11-20. [2] Siddagangaiah, Vadiraj BA, Sudarshan M R and Krishnakumar V 1996. Standardisation of rooting media for propagation of vanilla (Vanilla
planifoliaAndr). Journal of Spices and Aromatic Crops 5: 131-13.
It is I
LLEGAL t
o cop
y, pri
nt or
save
any c
onten
t of th
is PDF,
in pa
rt or in
full,
on an
y retr
ieval
syste
m,
withou
t the E
XPRESS WRITTEN PERMISSIO
N of th
e cop
yrigh
t-hold
er

National Conference on Climate Change and Agricultural Production: Adapting Crops to Climate Variability and Uncertainty, 6th–8th April, 2017
[399]
Effect of Different Sources of Nutrient Combination and Vermicompost on Growth and Yield of Mungbean (Vigna radiata L. Wilczek)
Shashidhar Yadav1*, R.B. Yadav1 and Vinay Kumar2 1Department of Agronomy,
Sardar Vallabhbhai Patel University of Agriculture and Technology, Meerut, India 2Indian Agriculture Research Institute, Regional Station, Pusa, Samastipur–088020, India
E-mail: *[email protected]
Keywords: Nutrient, Vermicompost, Mungbean, Yield
INTRODUCTION
India is the major pulse growing country in the world, sharing 35–36 and 27–28% of total area and production, respectively. Pulses account for about 1/5th of the acreage under food grains. Domestic production of pulses after its peak of 14.94 million ton in 2003–04 had declined to 13.38 million ton in 2008–09 due to adverse climatic conditions prevalent in the major production zones (Ali and Kumar 2007). The production of pulses during 2011–12 was 16.51 million ton while has estimated that the demand for pulses in the country during the period is 19.11 million ton (Planning Commission 2011–12). Mungbean (Vigna radiate L.) is one of the important pulse crops of kharifseason which contains about 25% protein, 60% carbohydrate and 1.3% fat. It is grown in India on an area of 3.55m ha with production about 1.82m ton and productivity 512 kg ha-1 and in U.P. on an area 78,000 ha with production 45,000 ton and productivity 577 kg ha-1 (AICRP on MULLaRP, 2010–11). The management of fertilizers is one of the important factors that greatly affect the growth, development and yield of mungbean. Nitrogen, phosphorus and sulphur are integral component of virtually all the biochemical compounds that make plant life possible. There is no conceivable alternative for such elements to constructing the biochemical machinery of plants. It is absolutely clear that both nitrogen and phosphorus are essential elements in their structural, biochemical and physiological roles contributing to crop growth and the sulphur essential for the formation of the chlorophyll and production of protein.
MATERIALS AND METHODS
A field experiment was conducted in sandy loam soil at Crop Research Centre of Sardar Vallabhbhai Patel University of Agriculture and Technology, Meerut (U.P.), during kharif season of 2012. The experimental soil was sandy loam in texture, low in organic carbon and medium in available P and K., soil samples was taken from different places at site the experimental field from 0–15 cm depth before application of fertilizers. Composite sample was prepared by mixing all soil samples. Certified seed of mungbean SML 668 was sown @ 15 Kg ha-1 on 19.08.012 with a row to row distance 30 cm and gross plot size was 5 x 3.6m., the fertilizer NPK through source of Urea (46% N), DAP (18% N & 46% P2O5) and MOP (60% K2O) were used as experimental material during the experiment. Fertilizers were applied as per treatment description.
RESULTS AND DISCUSSION
Among all the treatment application of 50 kg phosphorus through SSP, 8 kg N through urea as basal along with 1.0 ton of vermicompost ha-1 gave maximum plant height, number of green try foliate, number of active nodules, number of pods plant -1, number of grains pod-1, straw and biological yield, which was significantly more than the other treatments. An increase of 84.4 percent in grain yield were recorded due to integration of nutrient sources compare to control treatments.
It is I
LLEGAL t
o cop
y, pri
nt or
save
any c
onten
t of th
is PDF,
in pa
rt or in
full,
on an
y retr
ieval
syste
m,
withou
t the E
XPRESS WRITTEN PERMISSIO
N of th
e cop
yrigh
t-hold
er

National Conference on Climate Change and Agricultural Production: Adapting Crops to Climate Variability and Uncertainty, 6th–8th April, 2017
[400]
Table 1: Effect of Nutrient Management Treatments on Yield Attribute and Yield of Mungbean Treatments Yield Attributes Yield (kg ha-1)
Pods Grains Test Grain Grain Straw Biolo H.I Plant-1 Weight Yield Yield Yield Gical (%) Pod-1 (g) Plant-1 (kg ha-1) (kg ha-1) Yield (g) (kg ha-1)
T1-Control 9.2 4.1 35.1 1.3 455 845 1300 35.0 T2-N.P.(23:60D) 10.1 4.7 36.2 1.7 591 1069 1660 35.6 T3-N.P.K.(23:60D:40) 10.8 4.9 36.6 1.9 661 1149 1810 36.5 T4-N.P.(23 U:60S) 13.1 5.2 36.9 2.5 850 1450 2300 37.0 T5-N.P.K.(23:60S:40) 13.5 5.3 37.2 2.6 911 1540 2451 37.1 T6 -N.P.(8U:50S) + VC1.0 ton 14.3 6.0 37.6 3.2 1090 1648 2738 39.9 T7-N.P.S.(23:60D:40G) 14.0 5.9 37.4 3.0 1050 1632 2682 39.1 T8-N.P.K.S.(23:60D:40:40G) 14.1 5.9 37.4 3.1 1060 1630 2690 39.4 T9-N.P.S.(23:60D:40ES) 13.7 5.4 37.2 2.7 935 1564 2499 37.4 T10-N.P.K.S.(23:60D:40:40 ES) 13.9 5.6 37.3 2.9 981 1609 2590 37.9 CD(P=0.05) 0.35 0.14 0.33 0.04 48.17 26.20 42.24 0.68
REFERENCES [1] All India Coordinated Research Project 2012. Annual Reports of mungbean and MULLaRP. [2] Masood A and KumarS 2007. Pulses: good options for rain fed areas. The Hindu Survey of Indian Agriculture. [3] Sutaria G S, Akbari K N, Vora V D, Hirpara D S and Padmani D R 2010. Response of legume crops to chemical fertilizer and vermicompost
under rain fed agriculture. Legume Research33(2): 128-130. [4] Yadav V S and Luthra J P 2005. Effect of organic manures at different levels of phosphorus on yield and economics of moongbean. Journal of
Horticultural Sciences11(2): 120-122.
Simple and Efficient Method for the Extraction of Genomic DNA in Litchi (Litchi chinensis Sonn.)
Hidayatullah Mir1*, Abha Kumari2, Bishun Deo Prasad3, Ruby Rani4 and Feza Ahmad5 1,2,4,5Department of Horticulture (Fruit & Fruit Technology), 3Department of Molecular Biology &
Genetic Engineering, Bihar Agricultural University, Sabour, Bhagalpur–813210, India E-mail: *[email protected]
Keywords: Litchi, DNA Extraction, Molecular
INTRODUCTION
Isolation of genomic DNA is prerequisite for molecular research in any crop. Numerous reports for isolation of genomic DNA in litchi are available. However, none of the protocols yield good quality genomic DNA which can be used for molecular analysis. The presence of high quantities of polyphenols, polysaccharides and tannins makes the DNA extraction procedure cumbersome (Shepherd et al., 2002). Contamination with high quantities of polyphenols, polysaccharides and tannins renders the extracted DNA unsuitable for further use. Phenolic compounds interfere with the action of restriction endonucleases on DNA and interact irreversibly with proteins and nucleic acids (Manoj et al., 2007), while polysaccharides become problematic due to their inhibitory effects on the activity of many biological enzymes, such as polymerases, ligases and restriction endonucleases (Sharma et al., 2002). Present study was conducted to develop an efficient and sustainable method of genomic DNA extraction procedure for litchi.
It is I
LLEGAL t
o cop
y, pri
nt or
save
any c
onten
t of th
is PDF,
in pa
rt or in
full,
on an
y retr
ieval
syste
m,
withou
t the E
XPRESS WRITTEN PERMISSIO
N of th
e cop
yrigh
t-hold
er

National Conference on Climate Change and Agricultural Production: Adapting Crops to Climate Variability and Uncertainty, 6th–8th April, 2017
[401]
MATERIALS AND METHODS
Litchi cultivars viz., Purbi, China, Bedana, Kasba, Shahi leaves were collected from the Horticulture garden, Bihar Agricultural University, Sabour, India. Leaves were harvested at different growth stages. All harvested leaves were wrapped in aluminum foil and carried to laboratory with icepacks. DNA extraction from leaf of different litchi cultivars was performed by an improved CTAB (Cetyl trimethyl ammonium bromide detergent) method. Quantification and purity analysis of genomic DNA was done by using UV spectrophotometer. Optical density values were recorded at four different wavelengths (230, 260, 280 and 320nm).The purity of DNA was determined by calculating the ratio of absorbance at 260 nm to that of 280 nm.
RESULTS AND DISCUSSION
Modified CTAB method of DNA extraction yielded good quality DNA in litchi but the yield was low. To examine the effect of modifications in DNA extraction procedure, we used both young and mature leaves of litchi. The effect of detergents in the DNA extraction buffer was investigated by using various combinations. Detergents CTAB, were added to the solution containing 100 mM Tris-HCl (pH 8.0), 20 m MEDTA (pH 8.0), 2% PVP [Mr: 40,000], 2 M NaCl and 2% �-mercptoethanol, the quality of DNA was improved. By using PVP (2.0% V/V) and 2% CTAB, phenolic and polysaccharide contaminations in DNA were reduced in the all the litchi samples used in the present study. The bands obtained through modified CTAB method following electrophoresis were intense. DNA concentration was found to be varying in range of 120-254 ng/�l with mean being 200.8 ng/�l. The highest concentration of DNA was observed in Bedana (254 ng/�l) while the lowest concentration was found in Kasba (120 ng/�l). The ratio of absorbance at 260 nm to that of 280 nm and 260 nm to that of 230 ranging between1.72-2.03 and 2.07-2.97 respectively indicates pure DNA (Table 1). DNA quality was estimated by measuring 260/280 UV absorbance ratio and found to be in the range of 1.8-2.0. However in few samples DNA contents were recorded in the ratio lower than 1.8. From the different steps followed and modifications made, it was observed that using fresh and tender leaves compare to older or mature ones reduces nucleic acid contamination by plant secondary metabolites that interfere with solubilisation of precipitated nucleic acids. Hence, Isolation of genomic DNA using the described modified method was found to be simple, efficient and convenient.
Table 1: Quality of Litchi DNA based on A260/A280 and A260/A230 Values with Modified CTAB Method Sl. No. Litchi Cultivars A260/A280 A260/A230 DNA Concentration
(μg/mL) 1. Purbi 1.83 2.07 192 2. China 1.95 2.97 218 3. Bedana 1.98 2.59 254 4. Kasba 1.72 2.83 120 5. Shahi 2.03 2.35 220
REFERENCES [1] Manoj K, Tushar B and Sushama C 2007. Isolation and purification of genomic DNA from Black Plum Eugenia Jambolana Lam. For
analytical applications. International Journal of Biotechnology and Biochemestry 3 (1): 49-55. [2] Sharma A D, Gill P K and Singh P 2002. DNA isolation from dry and fresh samples of polysaccharide-rich plants. Plant Molecular Biology
Reporter20(4):415-415. [3] Shephered M, Cross M, Stokoe L R, Scott L J and Jones M E 2002. High throughput DNA extraction from forest trees. Plant Molecular
Biology Reporter20: 425-425.
It is I
LLEGAL t
o cop
y, pri
nt or
save
any c
onten
t of th
is PDF,
in pa
rt or in
full,
on an
y retr
ieval
syste
m,
withou
t the E
XPRESS WRITTEN PERMISSIO
N of th
e cop
yrigh
t-hold
er

National Conference on Climate Change and Agricultural Production: Adapting Crops to Climate Variability and Uncertainty, 6th–8th April, 2017
[402]
Effect of Organic and Inorganic Fertilizers on Growth, Yield and Quality Attributes of Hybrid Bitter Gourd (Momordica charantia L.)
Sangeeta Shree*, Champa Lal Regar, Fiza Ahmad and Amrita Kumari
Department of Horticulture (Vegetable and Floriculture), Bihar Agricultural University, Sabour, Bhagalpru–813210, India
E-mail: *[email protected]
Keywords: Yield, Quality, Bitter Gourd, Integrated Nutrient Management
INTRODUCTION
Bitter gourd (Momordica charantia L.) is popular vegetable because of its rich nutritive value, high productivity and easy package of practices. It is being increasingly realized that organic manure is the cheapest eco-friendly resource for providing nutrients to plant and also helps in curtailing the use of chemical fertilizers. Manures also add organic matter, which improve physical condition of soil (Lundwick & Johnston, 2002). Bitter gourds respond favourably to application of different soil organic amendments like vermicompost. Therefore the present study was designed to evaluate the effect of different combinations of organic and inorganic source of nutrients on growth, yield and quality of bitter gourd.
MATERIALS AND METHODS
The experiment was carried out at Bihar Agricultural University, Sabour, Bhagalpur in factorial randomized block design with three replications in the summer in 2012 on F1 hybrid, Varun of bitter gourd. There were nine treatment combinations comprising of three levels each of vermicompost and inorganic fertilizers. The observations were recorded for growth, yield and quality characters of bitter gourd.
RESULTS AND DISCUSSION
The application of vermicompost @ 4.68 t ha-1recorded 3.99 kg/ fruits per vine with an average fruit weight of 62.18 g/fruit. The application of higher dose of vermicompost resulted in better yield and yield attributing traits because, vermicompost provided better nutrition status by improving the physical, biological and chemical properties of soil. Reddy and Rao (2004) reported similar findings in bitter gourd. Application of NPK @ 100:60:50 kg ha-1 recorded maximum fruit yield/vine (3.64 kg) and with average fruit weight 56.75 g/fruit. Interaction effect of vermicompost @4.68 t ha-1 and inorganic fertilizer, NPK @ 50:30:25 kg ha-1 was found to be best treatment combination for yield and yield attributing traits and as well as for benefit cost ratios. The maximum yield i.e. 36.81 t ha-1 was found under the combined use of vermicompost @ 4.68 t ha-1 and inorganic fertilizer@ 50:30:25 kg ha-1, which was superior to all other treatments combination. Minimum yield (22.77 t ha-1) was recorded with the application of of vermicompost@ 3.50 t ha-1and inorganic fertilizer @ 50:30:25 kg ha-1. It was also observed that some of the quality attributes like TSS (oBrix), Zn, Cu, Mn, Fe, and N content of the fruit were significantly influenced with the application of different levels of vermicompost while vitamin C and Fe were significantly affected with the application of both organic and inorganic fertilizers in different combinations. Combined application of vermicompost@ 4.68 t ha-1and inorganic fertilizer @ 50:30:25 kg ha-1 was also found to be the most remunerative treatment with the B:C ratio of 2.74.
REFERENCES [1] Ludwick A E and Johnstone, A M 2002. Organic nutrients. Better Crops86: 8-10. [2] Reddy P K and RaoP V 2004. Growth and yield of bitter gourd (Momordica charantia L.) as influenced by vermicompost and nitrogen
management practices. Journal of Research angrau32(3): 15-20.
It is I
LLEGAL t
o cop
y, pri
nt or
save
any c
onten
t of th
is PDF,
in pa
rt or in
full,
on an
y retr
ieval
syste
m,
withou
t the E
XPRESS WRITTEN PERMISSIO
N of th
e cop
yrigh
t-hold
er

National Conference on Climate Change and Agricultural Production: Adapting Crops to Climate Variability and Uncertainty, 6th–8th April, 2017
[403]
Influence of Seed Rate and Nitrogen Levels on Photosynthetic CO2 Assimilation, Chlorophyll Content on Growth and Productivity of
Dual Purpose Wheat Cultivars
R.D. Ranjan1*, C. Azad2, A.S. Gontia1, S. Kumar3 and A.K. Pal3
1Department of Plant Physiology, Jawaharlal Nehru Krishi Vishwavidyalaya, Jabalpur–482004, India 2Department of Plant Pathology, 3Department of Plant Breeding and Genetics,
Bihar Agricultural University, Sabour, Bhagalpur–813210, India E-mail: *[email protected]
Keywords: Phenological Seed Rates, Nitrogen Levels, Dual Wheat
INTRODUCTION
Wheat (Triticum aestivum L.) is the most important crop of the world and can be grown as dual purpose crop that provides greater benefit from both seeds/grains and fodder sown on same land (Shuja et al., 2010). Success of the dual purpose depends on management decisions regarding appropriate seed rate, sowing dates, choice of cultivars, harvesting time, stage and nitrogen levels. The rearing of livestock plays an important role in Indian agriculture by not only in agriculture practices but also generate income by their products. The scarcity of green fodder in the winter is the serious issue for rearing livestock in the country, thus there is urgent need for cultivation of fodder crops in the country. Furthermore, wheat straw as by product is another source of animal feed. So, there is a need to encourage the dual purpose wheat in Indian agriculture. Plant density is one of the major factors determining the ability of the crop to capture resources; it is of particular importance that it is being under fairly close control by the farmers in most wheat-producing systems. Nitrogen (N) deficiency induces changes in many physiological processes. Increasing N concentrations in wheat plants can be an effective method to adjust the properties of photosynthetic pigments, improve the photosystem II (PSII) potential activity and maximum quantum yield, decrease non-photochemical quenching, and increase the net photosynthetic rate (Ph) 10–12. (Iqtidar et al., 2006). Therefore keeping in view the current demand of both grain and fodder production, the present experiment was laid out for the determination of phonological performance and yield of wheat cultivars under dual purpose wheat system.
MATERIALS AND METHODS
In order to investigate influence of different nitrogen levels and seed rates on physiological mechanism of dual purpose wheat (VL 829 and 31-ESWYT-123), an experiment was conducted in a double split plot design with three replications at the Research farm, JNKVV, Jabalpur during 2014–15. The main plots included two wheat varieties (VL 829 and 31-ESWYT- 123), sub plot two seed rates (100 and 150 Kg/ha) and sub-sub plots three nitrogen levels (0, 120 and 150 kg/ha N), respectively. After surface sterilization, seeds were planted at the depth of 3–4 cm with row to row and plants to plant distance were 20 cm and 10 cm, respectively. Recommended agronomic package and practices were applied to raise a healthy crop. Data were recorded as Chlorophyll index, Photosynthetic rate, Mesophyll efficiency and Carboxylation efficiency.The green fodder was cut at about the mid height of the plant at specified days and weight was recorded and converted by the factor calculated for conversion to kg/h.
It is I
LLEGAL t
o cop
y, pri
nt or
save
any c
onten
t of th
is PDF,
in pa
rt or in
full,
on an
y retr
ieval
syste
m,
withou
t the E
XPRESS WRITTEN PERMISSIO
N of th
e cop
yrigh
t-hold
er

National Conference on Climate Change and Agricultural Production: Adapting Crops to Climate Variability and Uncertainty, 6th–8th April, 2017
[404]
RESULTS AND DISCUSSION
A present study was carried out to determine the influence of varying seed rates (100 kg and 150 kg ha-1) and nitrogen levels (0, 120 and 150 kg h-1) applied to dual wheat cultivars i.e. VL 829 and 31 ESWYT 123 during 2013–14. 31 ESWYT-123 recorded higher magnitudes for chlorophyll content index (16.44), higher values for photosynthetic rate (13.90 mol m-2s-1), Quantum efficiency (0.04) and Mesophyll efficiency (328.26 mol mol -1) and CO2 assimilation (12.80 mol m-2s-1(mol mol -1) which indicated its physiological superiority over VL 829. The study also revealed that the application of nitrogen at the rate of 150 kg/ha (N2) and higher seed rates 150 kg/ha (S2) resulted in significant increase in number of tillers (7.11), grain/ear heads (38.80), 1000-grain weight (41.20) and produced higher grains yield (3890.30 kg/ha) as well as green fodder (2815.40 kg/ha) yield than VL 829 (Table 1). Briefly, each increment of nitrogen fertilizer and seed rates responded better physiological efficiency leading o more growth, and productivity of cultivars.
Table 1 Characters 31 ESWYT 123 VL 829
Chlorophyll content index 16.44 15.40 Photosynthetic rate 13.90 mol m-2s-1 13.60 mol m-2s-1 Quantum efficiency 0.04 0.03 Mesophyll efficiency 328.26 mol mol -1 292.76 mol mol -1 CO2 assimilation 12.80 mol m-2s-1(mol mol -1) 12.14 mol m-2s-1(mol mol -1) Tillers /Plant 7.11 6.40 Grain/ear heads 38.80 36.85 1000-grain weight/g 41.20 39.60 Grains yield 3890.30 kg/ha 3673.70 kg/ha Green fodder 2815.40 kg/ha 2368.68 kg/ha
REFERENCES [1] Iqtidar H, K M Ayyaz and Ahmad K E 2006. Bread wheat varieties as influenced by different nitrogen levels. Journal of Zhejiang University
Science 7:70-78. [2] Shuja M N, Dure-Nayab M Ali, A Iqbal and I H Khalil. 2010. Evaluating the response of wheat genotypes to forage clipping. International
Journal of Agricultural Biology 12:111-114.
Quality and Production of Pearl Millet [Pennisetum glaucum (L.) R. Br. Emend Stuntz] as Influenced by Varieties and Bio-Regulators
Anshul Gupta*, O.P. Sharma and R.B. Solanki Department of Agronomy, Sri Karan Narendra Agriculture University, Jobner–285171, India
E-mail: *[email protected]
Keywords: Bio-regulators, Nutrient Uptake, Pearl Millet, Varieties, Yield
INTRODUCTION
In pearl millet improvement programme there is successful development of high yielding hybrids and open pollinated varieties with good adaptation to diverse environments. Hence, there is an urgent need to replace them with newly developed high potential cultivars for better production and profitability. Application of bio-regulators present a new possibility to break yield barrier particularly imposed to the environment. Bio-regulators are the group of chemicals which regulate the efficiency of plant i.e. physical and physiological activity. Therefore, keeping the above discussion in view present investigation was carried out to observe the effect of different bio-regulators on pearlmillet for increasing crop productivity.
It is I
LLEGAL t
o cop
y, pri
nt or
save
any c
onten
t of th
is PDF,
in pa
rt or in
full,
on an
y retr
ieval
syste
m,
withou
t the E
XPRESS WRITTEN PERMISSIO
N of th
e cop
yrigh
t-hold
er

National Conference on Climate Change and Agricultural Production: Adapting Crops to Climate Variability and Uncertainty, 6th–8th April, 2017
[405]
MATERIALS AND METHODS
A field experiment was conducted at Agronomy farm, S.K.N. College of Agriculture, Jobner (Rajasthan) during kharif, 2014 on loamy sand soil. The sixteen treatment combinations consisting of 4 treatments each of varieties (RHB-121, RHB-173, RHB-177, Raj-171) and bio-regulators (control, thiourea, thioglycolic acid and salicylic acid) were tested in randomized block design with three replications. Sowing was done at R x R spacing of 45 cm apart with 4 kg/ha seed rate. Each plot consisted gross dimension of 4.0 m X 3.6 m and net area 3.0 m x 1.8 m. The soil was loamy sand in texture, alkaline in reaction (PH value 8.2), poor in organic carbon (0.14%) with low available nitrogen (130 kg/ha) and medium in phosphorus and potassium content (18.9 and 175.6 kg/ha). Foliar sprays of bio-regulators viz. 500 ppm thiourea (TU), 100 ppm thioglycolic acid (TGA) and 100 ppm salicylic acid (SA) were done at 25 and 50 DAS.
RESULTS AND DISCUSSION
Total nitrogen uptake was found significantly higher under variety RHB-173 (66.08 kg/ha) over all other varieties. Variety RHB-173 estimated significantly higher protein content as compared to Raj-171 by 7.94 per cent and being at par with RHB-121 and RHB-177 (Table 1). Among the bio-regulators total nitrogen uptake was recorded with thiourea (67.82 kg/ha) which proved significantly superior to TGA, SA and control. Protein content in grain of pearlmillet was improved significantly by application of bio-regulators over control but difference among them was not significant. Variety RHB-173 produced the maximum grain yield and biological yield which was markedly higher over RHB-121, RHB-177 and Raj-171. Superior yield attributing characteristics in variety RHB-173 over RHB-121 and other varieties were also recorded in co-ordinated trials conducted at ARS Durgapura, Jaipur (Sharma et al., 2013). Stover yield was also found maximum with variety RHB-173 (5173 kg/ha) which was significantly higher over RHB-121 (4749 kg/ha) and RHB-177 (4697kg/ha). The highest harvest index represented by variety RHB-173 was at par with RHB-121 and RHB-177 (Table 1). The maximum grain yield (2162 kg/ha) and stover yield (5173 kg/ha) and biological yield (7601 kg/ha) recorded with TU was significantly higher over SA and control while it remained at par with TGA (Table 1).
Table 1: Quality and Yield (Kg/ha) as Influenced by Varieties and Bio-regulators Treatments Grain
Yield (kg/ha)
Stover Yield
(kg/ha)
Biological Yield (kg/ha)
Harvest Index (%)
Nitrogen Uptake (Kg/ha)
Phosphorus Uptake (Kg/ha)
Potassium Uptake (Kg/ha)
Protein Content in Grain
Varieties RHB-121 1968 4749 6718 29.35 57.15 10.04 29.35 11.81 RHB-173 2175 5173 7348 29.50 66.08 11.33 29.50 12.50 RHB-177 1816 4697 6514 28.87 54.04 9.57 28.87 11.84 Raj-171 1724 5106 6831 25.22 53.16 9.73 25.22 11.58 SEm+ 53 125 177 0.88 1.49 0.31 0.88 0.25 CD (P=0.05) 153 361 511 2.55 4.30 0.90 2.55 0.72 Bio-regulators Control 1639 4356 5996 27.36 45.93 8.15 27.36 11.11 Thiourea (500ppm)
2162 5439 7601 28.42 67.82 11.83 28.42 12.59
TGA (100 ppm) 2010 5082 7092 28.34 60.68 10.78 28.34 12.09 Salicylic acid (100 ppm)
1871 4850 6721 27.81 56.01 9.91 27.81 11.94
SEm+ 53 125 177 0.88 1.49 0.31 0.88 0.25 CD (P=0.05) 153 361 511 NS 4.30 0.90 NS 0.72 CV(%) 9.60 8.78 8.88 10.94 8.96 10.64 10.94 7.29
REFERENCE [1] Sharma L D, Singh Yogendra and Sharma Ramavtar 2013. All India Coordinated Research Project on Pearl millet [Pennisetum glaucum
(L.)], Notification of crop varieties and registration of germplasm. Indian Journal of Genetics and Plant Breeding73(2): 228-231.
It is I
LLEGAL t
o cop
y, pri
nt or
save
any c
onten
t of th
is PDF,
in pa
rt or in
full,
on an
y retr
ieval
syste
m,
withou
t the E
XPRESS WRITTEN PERMISSIO
N of th
e cop
yrigh
t-hold
er

National Conference on Climate Change and Agricultural Production: Adapting Crops to Climate Variability and Uncertainty, 6th–8th April, 2017
[406]
Evaluation of Host Defense Inducing Bioagents against Alternaria tenuissima (Kunze ex pers.) Wiltshire Causing Dieback Disease of Chilli
C.S. Azad1*, A. Kumar1, R.N. Gupta1, G. Chand1 and R.D. Ranjan2 1Department of Plant Pathology, 2Department of Plant Breeding and Genetics
1,2Bihar Agricultural University, Sabour, Bhagalpur—813120, India E-mail: *[email protected]
Keywords: Bioagents, Alternaria tenuissima, Dieback, Chilli
INTRODUCTION
Chilli (Capsicum annuum L.) has its unique place in the world diet in its ripe dried form (as a spice) as well as green fruit (as vegetable). Dieback disease caused by Alternaria tenuissima is very common problem in fields and greenhouse. Use of host defence biotic agents has been considered an alternate and effective approach for the control of pathogenic microbes. Plants can be sensitized for a more rapid and intense mobilization of defense responses leading to enhanced resistance to biotic or abiotic stresses. Induction of systemic resistance is associated with gene induction, activation of a wide range of resistance mechanisms and the production of variety of defense compounds. (Kuc, 1995; Walters and Fountaine, 2009). Thus, study on induction of host defense through biotic and abiotic factors can be considered as one of the effective sustainable approaches in disease management.
MATERIALS AND METHODS
To study the effect of bioagents, a glasshouse experiment was laid out in a completely randomized block design with three replications. After 30 days of transplanting, plants were challenged by spraying with spore suspension of 1x10⁶ spores/ml by sterilized atomizer of the Alternaria tenuissima (Kunze ex Pers.) Wiltshire. Top five leaves per treatments were harvested 24, 48, 72, 96 and 120 hours after challenge inoculation and brought to the laboratory in an ice box for analysis of the enzymes like total phenol, PPO and PO. Observations on Number of spots/leaf, Number of infected leaves/plant were recorded 15 days after inoculation. Disease severity was also recorded 15, 30, 45 and 60 days after inoculation on 0-5 scale and Percent disease index (PDI) was calculated.
RESULTS AND DISCUSSION
Among bioagents, highest increase in enzymatic activities, lowest no. of spot/leaves as well as severity was recorded in Trichoderma harzianum strainPBAT-21 + Pseudomonas fluorescens strain PBAP-27. Root dip application of bioagent was found better over soil application, but combination of soil application + root dip both proved to be the best. On biochemical analysis, significant increase in enzymatic activity was recorded in plants treated with biotic elicitor 24 hour after challenge inoculation of Alternaria tenuissima. Highest concentration of PPO, PO and total phenol was observed at 72 hours in all the treatments.However, after 72 hrs, there has been gradual decrease in enzymatic activity.
It is I
LLEGAL t
o cop
y, pri
nt or
save
any c
onten
t of th
is PDF,
in pa
rt or in
full,
on an
y retr
ieval
syste
m,
withou
t the E
XPRESS WRITTEN PERMISSIO
N of th
e cop
yrigh
t-hold
er

National Conference on Climate Change and Agricultural Production: Adapting Crops to Climate Variability and Uncertainty, 6th–8th April, 2017
[407]
Table 1: Bioagents Used for Evaluation of Resistance Induction in Chilli against Alternaria tenuissima (Kunze ex Pers.) Wiltshire
Sl. No. Name Dose (g/kg Soil)
Source
1 Trichoderma harzianum PBAT-21 10.00 GBPUAT, Pantnagar (Uttarakhand) 2 Pseudomonas fluorescens PBAP-27 10.00 do 3 Trichoderma harzianum PBAT-21 + Pseudomonas fluorescens PBAP-27 10.00 do 4 Trichoderma viride G2 mutant(BARC strain) 5.0 Bhabha Atomic Research Centre, Bombay 5 Bacillus subtilis var. amyloliquefaciens FZB24 4.0 Novazyme South Asia Pvt. Ltd.
REFERENCES [1] Kuc J 1995. Phytoalexins, stress metabolism, and disease resistance in plants. Annual Reveiw of Phytopathology33: 275-297. [2] Walters D R and Fountaine J M 2009. Practical application of induced resistance to plant diseases: an appraisal of effectiveness under
conditions. Journal of Agricultural Sciences147: 523-535.
Demonstration of Direct Seeded Rice for Enhancing the Productivity of Rice, Improving Resource Use and Minimize the Production Cost in
Buxar District of Bihar
Deokaran1*, Mandhata Singh1, Ramkewal1, J.S. Mishr2, B.P. Bhatt2, Reema Prasad1 and Arif Parwez1
1Krishi Vigyan Kendra, Buxar–802103, India 2ICAR Research Complex for Eastern Region, Patna–820020
E-mail: *[email protected]
Keywords: Direct Seeded Rice, Economics, Productivity, Yield
INTRODUCTION
Rice (Oryza sativa L.) is grown in different ecosystems and physical conditions of soil. Cultivation of rice by transplanting in rice–wheat cropping system is most popular in north India but it is highly labour-intensive and expensive method of cultivation, as well as it requires large quantity of water for puddling, transplanting and establishment of rice seedlings. Most of the farmers are marginal, unable to bear the cost in carrying out these operations. In addition, long turn-around time and unpredictable monsoon rain delays the sowing of succeeding crop. Direct seeding either in puddled or in non-puddled conditions eliminates the need of raising, maintaining and subsequent transplanting of seedlings, which is labour-intensive. Besides, it is cost effective can save water through earlier rice crop establishment and allows early sowing of wheat (Singh and Singh, 2010). Buxar district is facing low rain fall and erratic rainfall since 2013(681.4 mm), 2014 (590.1 mm) and 2015 (866.95mm) and productivity of rice very low 2000 to 2200 kg/ha. Farmer’s productivity of rice in the district is far lower than the potential yields of improved rice varieties and. Hence frontline demonstrations on direct seeded rice with improved technological management practices was conducted under NICRA Project with objective to increase water use efficiency and the productivity of rice and find out the technology gap and technology index.
MATERIALS AND METHODS
The present investigation was carried out by Krishi Vigyan Kendra, Buxar, Bihar during kharif seasons of 2014 and 2015 in the farmers’ fields of five adopted villages namely Kukurha, Surundha, Yadavdera,
It is I
LLEGAL t
o cop
y, pri
nt or
save
any c
onten
t of th
is PDF,
in pa
rt or in
full,
on an
y retr
ieval
syste
m,
withou
t the E
XPRESS WRITTEN PERMISSIO
N of th
e cop
yrigh
t-hold
er

National Conference on Climate Change and Agricultural Production: Adapting Crops to Climate Variability and Uncertainty, 6th–8th April, 2017
[408]
Geruabandh and Rajapur of Buxar district. During these two seasons of study, an area of 10 ha was covered with plot size of 0.4 ha under frontline demonstration with an active participation of 25 farmers. The packages of demonstration (DSR) and existing farmers’ practices (PTR) are presented in the Table 1. The soils under study were clay loam in texture with pH ranging from 7.2 to 7.8. The available nitrogen, phosphorus and potassium ranges from 161–249, 33–44 and 205–299 kg/ha, respectively. Technology gap and technology index was calculated with following formulae (Samui et al., 2000).
Technology gap: Potential yield-Demonstration yield
Technology index: Potential yield-Demonstration yield
X 100 Potential yield
RESULTS AND DISCUSSION
CROP GROWTH AND YIELD
Direct seeded rice under demonstration produced higher number of tillers/m2, panicles/m2, grains/panicle compared to puddled transplanted rice. This might be due to in direct seeded rice line to line distance and seed depth are properly maintained and this led to good germination and profuse tillering in DSR (Singh and Singh, 2010). Panicle length was recorded higher under PTR and was comparable with DSR. Fertility percentage was higher under DSR compared to PTR. DSR recorded 88% fertility compared to 83% in PTR. This might be due to early panicle initiation improve the fertility percentage. 1000 seed weight under PTR were higher but much closed to DSR. Grain yield under direct seeded rice was lower to puddled transplanted rice.
ECONOMICS
Gross return, net return and BCR were higher under DSR compared to farmers practice- transplanting. Net return of Rs 39875 was recorded under DSR which was 22.95% higher to farmers practice transplanting. Benefit cost ration of 2.74 recorded under DSR and 1.97 with farmers practice transplanting. Cost of cultivation minimum under DSR was due to direct sowing of seed with zero till seed drill, less requirement of water and labour.
TECHNOLOGY GAP AND TECHNOLOGY INDEX
Technology gap was recorded 5.0 q/ha during 2014 and 4.0 q/ha during 2015.0. Technology index was recorded 11.11 and 8.88 during 2014 and 2015, respectively.
REFERENCES [1] Samui S K, Maitra S, Roy D K, Mandal A K and Saha D 2000. Evaluation of front line demonstration on groundnut. Indian Journal of Coastal
Agricultural Research 18(2): 180-183. [4] Singh Mandhata and Singh R P 2010. Efficacy of herbicides under different methods of direct seeded rice (Oryza sativa) establishment. Indian
Journal of Agricultural Science 80(9):815-819.
It is I
LLEGAL t
o cop
y, pri
nt or
save
any c
onten
t of th
is PDF,
in pa
rt or in
full,
on an
y retr
ieval
syste
m,
withou
t the E
XPRESS WRITTEN PERMISSIO
N of th
e cop
yrigh
t-hold
er

National Conference on Climate Change and Agricultural Production: Adapting Crops to Climate Variability and Uncertainty, 6th–8th April, 2017
[409]
Performance of Rabi Maize under Indigenous Nutrient for Site-Specific Management in Alluvial Plain Zone of India
Yanendra Kumar Singh, Anshuman Kohli, Mainak Ghosh1*, Sanjeev Kumar Gupta1, Rajeev Padbhushan and Shalini Kumari
Department of Soil Science and Agricultural Chemistry, 1Department of Agronomy Bihar Agricultural University, Sabour–813210, India
E-mail: *[email protected]
Keywords: Maize Crop, Yield, Agronomic Efficiency, Omission Plot Technique
INTRODUCTION
Indigenous cropping systems were characterized by low level of external input with low yield levels but were sustainable due to soil-atmosphere-biosphere cycle was largely a closed composition in the indigenous systems. The demands of the crops were largely satisfied from the native nutrient supply of the soil. But with increasing potential yields and intensification of the cropping systems, the reliance on external inputs has steadily increased (Dobemann et al., 2003). Farmers usually applied excess dose of fertilizer when compared with existing recommended dose. As the cost of fertilizer as a percentage of total cost of production is quite small, farmers see an incentive in increasing the rate of fertilizer application beyond the recommended rate. However, indigenous system is highly detrimental for the soil environment, not only is the share of the indigenous soil nutrient supply, but the soil reserve is also depleted. Estimation of the soils’ indigenous nutrient supplying capacity can serve as an indicator of the soils’ use or abuse in the past and can simultaneously facilitate the recommendation of nutrients at optimal rates under intensive cropping systems. In the present investigation, an attempt has been made to determine the indigenous nutrient supplying capacity of two soils lying in the south Bihar Alluvial Plane Zone under intensive maize based cropping system.
MATERIALS AND METHODS
Field experiment was conducted at two locations namely college farm of Bihar Agricultural University, Sabour and in farmer’s field of Kumadpur. Bhagalpur district during the rabi season of 2013-14 and 2014-15 to evaluate the soil supplying capacity of different nutrients under hybrid maize.Maize variety DKC9081 was grown at each locations under varying combinations of fertilizer nutrients to enable limiting and application of graded doses of fertiliser N, P and K. Nine treatments were taken as T1 (Control), T2 (50% NPK), T3 (75% NPK), T4 (100% NPK), T5 (125% NPK), T6 (150% NPK) T7 (without N fertilizer, 100% PK), T8 (without P fertilizer, 100% NK) and T9 (without K, 100% NP). The recommended dose for rabi maize was 150:75:60 kg N:P2O5:K2O. The experiment was laid out in randomized block design, replicated thrice.
RESULTS AND DISCUSSION
The grain and straw yield recorded significant, positive and linear response with increasing fertilizer dose up to 150% recommended dose of fertilizer (RDF) (Fig. 1). Grain yield increased significantly at 125% RDF over 100 % RDF but was statistically similar with 150% RDF. The per cent yield increment with marginal increases in fertilizer application is substantial up to even 150% RDF. The result indicated that the recommended fertilizer dose for rabi maize might be modified and the linear relation between RDF and grain yield showed that the 150% RDF may not limit the grain yield of rabi maize (Fig. 2). The use efficiency of nitrogen showed increasing trend with increasing fertilizer dose for both the locations but 75% to 150% RDF recorded
It is I
LLEGAL t
o cop
y, pri
nt or
save
any c
onten
t of th
is PDF,
in pa
rt or in
full,
on an
y retr
ieval
syste
m,
withou
t the E
XPRESS WRITTEN PERMISSIO
N of th
e cop
yrigh
t-hold
er

National Conference on Climate Change and Agricultural Production: Adapting Crops to Climate Variability and Uncertainty, 6th–8th April, 2017
[410]
statistically similar result among the treatments. The experimental findings clearly depicts that among the nutrient omitted treatments, N is the most essential nutrient when compared with P and K. The N omitted treatment recoded the poorest yield than all other treatments except the control one (Fig.1). This justifies N as the key input in cereal production as it contributes to carbohydrate accumulation in culms and leaf sheaths during the pre-heading stage and in the grain during the ripening stage.
REFERENCES [1] Dobermann A, Witt C, Abdulrachman S, Gines H C, Nagarajan R, Son T T, Tan P S, Wang G H, Chien N V, Thoa V T K, Phung C V,
Stalin P, Muthikrishnan P, Ravi V, Babu M, Simbahan G C and Adviento M A A 2003. Soil Fertility and Indigenous Nutrient Supply in Irrigated Rice Domains of Asia.Agronomy Journal95 (4): 913-923.
Fig. 1: Effect of Different Recommended Dose of Fertilizer on Yield of Rabi Maize Crop
(Pooled Over Two Years)
Fig. 2: Relationship Between Grain Yield and Recommended Dose of Fertilizer
(Pooled Over Two Years) of Rabi Maize Crop
Evaluation of Sticky Colour Traps for Monitoring of Shoot and Fruit Borer (Leucinodes orbonalis gueene.) in Brinjal
Aravinda M., S.S. Udikeri and S.S. Karabhantanal* Department of Agricultural Entomology, College of Agriculture, Vijayapur
University of Agricultural Sciences, Dharwad–580005, India E-mail: *[email protected]
Keywords: Brinjal Shoot and Fruit Borer, Leucinodes Orbonalis, Sticky Colour Traps
INTRODUCTION
In India the area under brinjal cultivation was estimated to be 0.72 mha with total production of 13.56 mt and the productivity of 19.1 t ha-1. In Karnataka, it is grown in an area of 0.0158 mha with a total production of 0.4025 m t and the productivity is 25.4 t ha-1 (Anon. 2014). As many as 70 insect pests have been reported on brinjal, the major pest and destructive one is brinjal shoot and fruit borer (BSFB), (Leucinodes orbonalis Guenee: Pyralidae: Lepidoptera). In the early stage of the crop, larva bores into the shoots resulting in drooping, withering and drying of the affected shoot. During the reproductive stage, tiny shiny larva bores into the flower buds and fruits. The bore hole is invariably plugged with excreta. It inflicts sizeable damage up
0
40
80
120
160
Yie
ld, q
ha-1
Recommended Dose of Fertilizer
Grain yield (Sabour)Grain yield (Kumadpur)Straw yield (Sabour)Straw yield (Kumadpur) y = 0.259x + 30.63
R² = 0.746
y = 0.231x + 29.68R² = 0.768
20
40
60
80
100
0 50 100 150 200
Gra
in Y
ield
, q h
a-1
Recommended Dose od Fertilizer, kg ha-1
Grain yield (Sabour)Grain yield (Kumadpur)
It is I
LLEGAL t
o cop
y, pri
nt or
save
any c
onten
t of th
is PDF,
in pa
rt or in
full,
on an
y retr
ieval
syste
m,
withou
t the E
XPRESS WRITTEN PERMISSIO
N of th
e cop
yrigh
t-hold
er

National Conference on Climate Change and Agricultural Production: Adapting Crops to Climate Variability and Uncertainty, 6th–8th April, 2017
[411]
to 80 per cent in terms of fruit and content of vitamin-C (Ram Prasad Mainali, 2014).The yield loss could be as high as 70 per cent (Dhandapani et al., 2003) and may go up to 90 per cent in India (Kalloo, 1988). Therefore an attempt has been made to evaluate different types of sticky colour traps for monitoring Leucinodes orbonalis.
MATERIALS AND METHODS
Field investigations were carried out on brinjal shoot and fruit borer, Leucinodes orbonalis Gueene during kharif 2014 at Jumnal village of Vijayapur taluka under irrigated condition using Mahyco super-10 variety in randomized block design with eight treatments, three replications. Crop was grown in a plot size of 10 x 10 m2 as per the recommended package of practice except for plant protection (Anon., 2014b). Different traps which are made up of thin iron sheet (1.5’ x 1.0’ size) and are wrapped by different colour (violet, indigo, blue, green, yellow, orange, red) fluorescent stick sheets. These sheets were smeared with colourless grease on both sides (for sticking of moths). The traps were installed (in 1.0 acre area at 10 m X 10 m distance between traps) just above the crop canopy (30-50 cm).soon after transplanting and observation was recorded on number of moths caught in each trap after first week of installation at 10 days interval. Plants from ten feet radius from the point of installed traps were selected from each field for shoot damage observation. The extent of damage was expressed in percentage
RESULTS AND DISCUSSION
The moths were attracted to colour sticky traps. However negligible population (0.33 moths/trap) was caught in violet trap at 15 days after installation of traps (DAIT). Similarly 0.67 moths per traps were caught in red trap at 10 DAIT, in orange trap at 35 DAIT(0.67) and in green trap at 45 DAIT (0.677). The shoot damage ranged from 6.72 (75 DAIT) to 35.43 per cent (15 DAIT). Though the shoot damage was varied among the different traps at varied intervals of observations, but there was no statistical difference was noticed among the treatments. Further, the influence color sticky traps on fruit damage was non-significant among the treatments. However, the lowest average fruit infestation (27.46 %) was observed in red sticky trap, while the highest (32.94%) fruit damage was observed indigo sticky trap (Table 1).The trend of shoot and fruit damage as influenced by the colour sticky traps in reducing the fruit damage was further reflected on the marketable fruit yield. The yield data among the treatments were non significant. However, comparatively, highest yield of 270 kg per plot was recorded in yellow sticky trap, the lowest (136kg/ plot) was harvested from red sticky trap. (Table 1). Results revealed that none of the colour sticky traps were effective in trapping moths of L. orbonalis.
Table 1: Performance of Different Types of Colour Sticky Traps on Yield (kg plot-1) Due to L. orbonalis Monitoring in Brinjal Crop
Treatments Time of and No. of Moths Caught in Different Traps
Average Fruit Damage (%)
Yield (kg/Plot)
Voilet sticky trap At 15 DAIT (0.33 moths /trap) 27.89 188 Indigo sticky trap - 32.94 153 Blue sticky trap - 32.38 138 Green sticky trap 45DAIP
(0.67 moths/ trap) 30.56 175
Yellow sticky trap - 29.37 270 Orange sticky trap 35 DAIT
(0.67 moths/ trap) 29.09 151
Red sticky trap 10 DAIT (0.67 moths/ trap)
27.46 136
Control - 31.04 181 CD (p=0.05) NS NS
It is I
LLEGAL t
o cop
y, pri
nt or
save
any c
onten
t of th
is PDF,
in pa
rt or in
full,
on an
y retr
ieval
syste
m,
withou
t the E
XPRESS WRITTEN PERMISSIO
N of th
e cop
yrigh
t-hold
er

National Conference on Climate Change and Agricultural Production: Adapting Crops to Climate Variability and Uncertainty, 6th–8th April, 2017
[412]
REFERENCES [1] Anonymous 2014. National horticulture board, Ministry of Agriculture, Government of India 85, Institutional Area, Sector-18, Gurgaon-122
015, India. [2] Dhandapani N, Shelkar U R and Murugan M 2003. Bio-intensive pest management in major vegetable crops: An Indian perspective. Journal of
Food Agriculture and Environment1(2): 330-339. [3] Kalloo G 1988. Biochemical basis of insect resistance in vegetables. Vegetable Breeding (Vol. II), CRC Press Inc Boca Raton, Florida. 520-570. [4] Ram Prasad Mainali 2014. Biology and management of eggplant fruit and shoot borer, Leucinodes orbonalis Guenee (Lepidoptera: Pyralidae):
A review. International Journal of Applied Science and Biotechnology2(1): 18-28.
Effect of Different Biofertilizers on the Growth and Yield of French bean (Phaseolus vulgaris) Arka Anoop
Madhvi Sharma*, Kodihally Manchegowda Harinikumar, Bhagyawathi and Shahida Ibrahim 1Sher-e-Kashmir University of Agricultural Sciences and Technology, Chatha, Jammu–180009, India 2Dept. of Plant Biotechnology, University of Agricultural Sciences, GKVK, Bangalore–560065, India
E-mail: *[email protected]
Keywords: Biofertilizers, Pseudomonas, Nitrogen, French Bean, Yield
INTRODUCTION
The use of chemical fertilizers has drained the soil and resulted in the loss of crop productivity. So to obtain maximum return farmers need to apply ecofriendly bio-fertilizers that play a vital role in the formation of nodules to fix atmospheric nitrogen by symbiotic process in the root system of legume crops making the nutrient available to the plants and due to this culture the rate of use of bio-fertilizers are increasing day by day (Basu et al. 1990). Not much research work so far was made on the effect of bio fertilizer on French bean growth and yield. Keeping all these in view, the present study was undertaken to estimate the effect of biofertilizer on the growth characters and yield of French bean.
MATERIALS AND METHODS
An experiment was conducted in the green house at department of plant biotechnology, University of Agricultural Sciences, GKVK, Bangalore, from Jan to May 2015 to study the effect of different concentrations of bio-fertilizers on the growth and yield of French bean (Kumar et al. 2009). Experimental treatments comprised of three levels of biofertilizer (Rhizobia, Pseudomonas and PSB) with different combinations and concentrations (9gm each) in five treatments (T1,T2,T3,T4,T5) with three set of replications (R1,R2,R3). Inorganic fertilizers 9gm (N:P:K) which are widely used in agriculture were used as materials. Method of cultural operation was adopted as per recommended practices. And observations were recorded mainly on growth (germination count, plant height, number of leaves, no. of pods per plant, branches per plant, dry weight of plant, cluster per plant) and yield (no. of seed per pod, pods per plant, pods per cluster, pod length, pod yield).
RESULTS AND DISCUSSION
In all the observation aspects of growth and yield the maximum value was recorded under bio-fertilizer treatment (T3) 9 gm of Rhizobium leguminosarum +9 gm of phosphate solubilizing bacteria). But minimum value was found variably in different treatments and different observation aspects. The average growth and yield per plot was found highest in T3 with germination count of 10 days, plant height (48.34cm), no. of leaves per plant (28.83), no. of pods per plant (10), branches per plant (9.33), dry weight per plant
It is I
LLEGAL t
o cop
y, pri
nt or
save
any c
onten
t of th
is PDF,
in pa
rt or in
full,
on an
y retr
ieval
syste
m,
withou
t the E
XPRESS WRITTEN PERMISSIO
N of th
e cop
yrigh
t-hold
er

National Conference on Climate Change and Agricultural Production: Adapting Crops to Climate Variability and Uncertainty, 6th–8th April, 2017
[413]
(22.20gm), no. of seeds per pod (7), pods per plant (10), pods per cluster (3), pod length (15.23cm), pod yield (71.06gm) and lowest in T2 (9gm Rhizobium leguminosarum) having plant height (34.16cm), no. of leaves per plant (21.25), no. of pods per plant (2.30), branches per plant (8.33), dry weight per plant (16.28gm), no. of seeds per pod (4.33), pods per cluster (1.33), pod length (10.45cm), pod yield (56.41gm) respectively. From the above results and discussion, it may be concluded that French bean was most responsive to bio-fertilizer treatment (T3) on growth and yield in comparison to other treatments. It also concluded that bio-fertilizer is particularly good for farmers, consumers and ultimately for soil as it can be used as a resource for maximum crop productivity with more financial output in comparison to those chemical fertilizers.
REFERENCES [1] Basu T K and Bandyopadhyay S 1990. Effects of Rhizobium inoculation and nitrogen application on some yield attributes of mungeban.
Environment and Ecology 8(2): 650-654. [2] Kumar R P, Singh O N, Singh Y, Dwivedi Sand Singh J P 2009. Effect of integrated nutrient management on growth, yield, nutrient uptake and
ecnomics of french bean (Phaseolus vulgaris). Indian Journal of Agricultural Science79(2): 122-128.
Effect of Chemical Fertilizer and Farm Yard Manure on Soil Physico-Chemical Properties and Yield of Wheat
Kunj Bihari Meena1, Md. Sarware Alam2*, Mohammad Amin Bhat2, Inderpal Singh2, A.K. Mishra, Tarence Thomas1 and Pradyuman Singh2
1Department of Soil Science, Allahabad School of Agriculture, Sam Higginbottom Institute of Agriculture, Technology & Sciences Allahabad–211007 India
2Department of Soil Science, CCS Haryana Agricultural University, Hisar–125004, India E-mail: *[email protected]
INTRODUCTION
In India, wheat is the second most important food crop next to rice and it contributes nearly 35 per cent to the national food basket. Uttar Pradesh is the maximum wheat producing state in India and Punjab has the best productivity. Farm yard manure which is rather new innovation in organic manure and now a days gaining more and more importance as a substitute of other organic manures due to its comparatively higher nutrient concentration with quick release of nutrients and which are available mostly to the current crop (Manna and Hagra, 1996).
MATERIALS AND METHODS
The experiment was conducted during 2011–12 rabi season on crop research farm of department of Soil Science at Sam Higginbottom Institute of Agriculture. The soil texture Sandy loam. The treatment consisted of nine combination of organic and inorganic source of manures and fertilizers T0 Control, T1-C0F1 [N +P + K + ZnSO4 0% *RDF + FYM 5 t ha-1]. T2- C0F2 [N + P + K + ZnSO4 0% *RDF + FYM 10 t ha-1]. T3- C1F0 [N+P+K+ZnSO450% *RDF + FYM 0 t ha-1]. T4- C1F1 [N+P+K+ZnSO450% *RDF + FYM 5 t ha-1], T5- C1F2 [N+P+K+ZnSO450% *RDF + FYM 10 t ha-1]. T6- C2F0 [N+P+K+ZnSO4100% *RDF + FYM 0 t ha-
1].T7 - C2F1 [N+P+K+ZnSO4100% *RDF + FYM 5 t ha-1]. T8 C2F2 [N+P+K+ZnSO4100% *RDF + FYM 10 t ha-1].
It is I
LLEGAL t
o cop
y, pri
nt or
save
any c
onten
t of th
is PDF,
in pa
rt or in
full,
on an
y retr
ieval
syste
m,
withou
t the E
XPRESS WRITTEN PERMISSIO
N of th
e cop
yrigh
t-hold
er

National Conference on Climate Change and Agricultural Production: Adapting Crops to Climate Variability and Uncertainty, 6th–8th April, 2017
[414]
RESULTS AND DISCUSSION
There was progressive increase Test weight, Grain yield significantly higher and B: C ratio maximum T8 C2F2 [N + P + K + ZnSO4 100% *RDF + FYM 10 t ha-1] (52.50, 85.83 and 1:1.97 respectively) observed in treatment T8 C2F2 [N + P + K + ZnSO4 100% *RDF + FYM 10 t ha-1]. The above findings showed that the optimum dose of NPK ZnSO4 and farmyard manure and their interaction increased the test weight of grain significantly which may be attributed to bringing the inorganic fertilizer, ZnSO4 therefore helps in improving the test weight of grain and ultimately yield. Similar finding were reported by Biswas and Singh (2002).After harvesting of wheat available Nitrogen 280.22 kg ha-1, Phosphorus 26.10 kg ha-1 available Potassium 354.00 kg ha-1 and Organic carbon 0.52% were significantly higher observed in treatment T8 C2F2 [N + P + K + ZnSO4 100% *RDF + FYM 10 t ha-1]
REFERENCES [1] Biswas P K and Singh R K 2002. Performance of new wheat genotype under varying level of nitrogen application as effected by weather
condition. Research on crops2:3,441-442; 3 [4] Mann, M. and Hagra, J.N. (1996). Comparative performance of cowdung slurry, microbial inoculums and inorganic fertilizers on maize.
Journal of the Indian Society of Soil Science, 44: 526-528.
Table 1: Effect of Different Level of Chemical Fertilizer and Farm Yard Manure on Yield Attributes Economics and Post-harvest Soil Status
Treatment Test Weight
Grain Yield (q ha-1)
B:C Ratio pH (1:2 w/v)
N (kg ha-1) P2O5 (kg ha-1) K2O (kg ha-1)
Zn (kg ha-1)
Organic Carbon (%)
T0 32.63 40.00 1:2.00 7.56 234.05 12.46 246.00 2.53 0.20 T1 38.43 55.83 1:2.36 7.43 270.48 15.60 278.33 2.65 0.28 T2 40.76 67.55 1:2.47 7.70 276.62 17.66 292.33 2.61 0.27 T3 44.83 65.00 1:2.65 7.53 282.00 15.70 307.66 2.55 0.29 T4 45.16 70.00 1:2.20 7.40 256.42 16.90 344.66 2.45 0.33 T5 45.33 65.83 1:1.68 7.60 248.27 17.46 333.00 2.42 0.34 T6 49.76 75.00 1:2.58 7.63 254.66 23.60 347.00 2.56 0.41 T7 48.33 71.66 1:1.97 7.76 257.37 20.93 339.00 2.68 0.46 T8 52.50 85.83 1:1.97 7.80 280.22 26.10 354.00 2.46 0.52 F- test s s * NS S S NS NS S S. Ed () 0.50 1.75 - - 2.68 1.00 - 0.006 C. D. at 5% 0.50 3.71 - - 5.69 2.12 - 0.020
Responses of Mango (Mangifera Indica L.) Seedlings to Waterlogging Conditions
Muneshwar Prasad*, Hidayatullah Mir, Rawati Raman Singh, Feza Ahmad and Amit Raj Department of Horticulture (Fruit and Fruit Technology),
Bihar Agricultural University, Sabour, Bhagalpur–813210, India E-mail: *[email protected]
Keywords: Mango, Abiotic stress, Waterlogging, Lenticels, Phenol
INTRODUCTION
Waterlogging is a major environmental stress that severely limits crop productivity and it has become a major problem worldwide. Bihar is highly vulnerable to floods on account of its geo-climatic conditions and various other attributing factors. The State is the most flood prone in the country in terms of percentage of land susceptible to flooding. Soil waterlogging effect the growth, development and survival of numerous plant species, not only in natural ecosystems but also in agricultural and horticultural systems (Dat et al, 2006).Mango is the major fruit crop of India and is also sensitive to waterlogging at younger stage due to
It is I
LLEGAL t
o cop
y, pri
nt or
save
any c
onten
t of th
is PDF,
in pa
rt or in
full,
on an
y retr
ieval
syste
m,
withou
t the E
XPRESS WRITTEN PERMISSIO
N of th
e cop
yrigh
t-hold
er

National Conference on Climate Change and Agricultural Production: Adapting Crops to Climate Variability and Uncertainty, 6th–8th April, 2017
[415]
which a large number of mango trees in the alluvial soils of Bihar were vanished due to several floods. Little efforts have been made to study the effect of waterlogging on mango trees in a systematic way. Identification of waterlogging tolerant rootstocks and performance of scion cultivars on those rootstocks in waterlogging conditions will determine the success and expansion of mango area in the state. Hence an experiment was initiated to determine the physiological and growth responses of mango seedlings grown in earthen pots and exposed to flooding.
MATERIALS AND METHODS
The one year old mango (Mangifera indica L.) seedlings from three poly embryonic cultivars (Olour, Kurukan and Mylepelian), three monoembryonic cultivars (Maldah, Bambai and Dashehari) and two hybrids (Prabhashankar and Mahmood Bahar) were grown in earthen pots filled with mixture of garden soil + farm yard manure in the ratio 3:1. Plants were flooded and water levels in the pots were maintained 4 inches above the soil surface.Observations were recorded for total number of lenticels developed, total phenol content, total chlorophyll, photosynthetic rate,stomatal conductance, internal CO2 concentration (Ci) and transpiration rate from mango seedlings of all the eight cultivars at 0, 10, 20 & 30 days interval.
RESULTS AND DISCUSSION
The presence of hypertrophied lenticels is a common anatomical changes observed in all mango plants during waterlogging. From the perusal of data, the maximum number of lenticels per square cm was observed in cultivar Kurukan (17.33) followed by Bombay (15.67) after exposure of 30 days to waterlogging conditions.There was a steady rise in lenticels development with increase in exposure to waterlogging conditions. Total phenolics content was recorded highest 67.63 mg g-¹FW in cultivar Kurukan followed by 64.49 mg g-¹FW in cultivar Olour after 30 days of exposure to waterlogging, which indicates their capacity to tolerate abiotc stress (stress marker). Total chlorophyll, photosynthetic rate, stomatal conductance, internal CO2 concentration (Ci) and transpiration rate observed in all mango seedlings showed decreasing trend with increasing days of exposure to waterlogging conditions.
REFERENCE [1] Dat J, Folzer H, Parent C, Badot P M, Capelli N 2006. Hypoxia Stress: Current understanding and perspectives. In: Teixeira da Silva J
A(Ed) Floriculture, Ornamental and Plant Biotechnology: Advances and tropical issues3: 664-674
Investigations on Pollen Quality in Some Newly introduced Pomegranate (Punica granatum L.) Germplasm Accessions
Suparna Sinha1*, Dinesh S. Thakur2, Divakar Kumar Bharati1, Jyoti Kumari1, R.R. Singh1, H. Mir and M. Feza Ahmad
1Bihar Agricultural University, Sabour, Bhagalpur–813210, India 2Dr. Y.S.P. University of Horticulture and Forestry, Nauni, Solan–173230, India
E-mail: *[email protected]
Keywords: Pomegranate, Punica granatum, Germplasm Accessions, Pollen Viability, Pollen Germination
INTRODUCTION
In vitro pollen viability, germination and pollen tube magnification investigations are valuable implements utilized in identification of the effects of environmental factors and genotypic differences on pollen viability, germination and tube elongation (Engin and Hepaksoy 2003). As prominent, pollen germination and pollen
It is I
LLEGAL t
o cop
y, pri
nt or
save
any c
onten
t of th
is PDF,
in pa
rt or in
full,
on an
y retr
ieval
syste
m,
withou
t the E
XPRESS WRITTEN PERMISSIO
N of th
e cop
yrigh
t-hold
er

National Conference on Climate Change and Agricultural Production: Adapting Crops to Climate Variability and Uncertainty, 6th–8th April, 2017
[416]
tube magnification are indispensable for fertilization, seed and fruit formation in particular for fruit species.Agar, sucrose and boron are the most widely used medium for determining in vitro pollen germination and tube magnification (Ercisli, 2007). The antecedent studies on pomegranates showed that pollen viability and germination ratios vigorously effected not only by genotypes but additionally varies depending on methods used and the medium or chemical concentration (Derin and Eti 2001). For this reason, the opportune pollen viability test and germination medium should be resolute for our pomegranate germplasm accessions.
MATERIALS AND METHODS
The present investigations, in vitro pollen viability and germination capacity of pollens belongs to 20 pomegranate germplasm accessions (20090265, Alk Pust Ghermez Saveh, Al-sirin-nar, Cloud, Crab, Dewey, Eve, Green Globe, Gulyalek, Haku-botan, Kaimanar, Loulou, Nusai, Orange, Ovadan, Parfyanets, Podarok, Purple Heart, Saharnyi, Sogdiana) were carried out at, Dr. Y.S. Parmar University of Horticulture and Forestry, Nauni, Solan (H.P.) during 2012–13. Unopened mature anthers were abstracted from the flowers and sanctioned to dry in plastic vials at room temperature. When the anthers dehisced pollen grains were amassed in petri dishes and stored in a capped vials at +4 °C in refrigerator over crystalline CaCl2 (Ali et al. 1998). For in vitro pollen viability test, at first pollen grains were stained in 2% acetocarmine solution prepared by dissolving 2 grams of carmine powder in 45 ml of glacial acetic acid and making final volume 100 ml, by adding distilled water. Solution was boiled for five minutes and filtered through Whatman No. 1 filter paper. The pollen grains were dusted on glass slide and one to two drops of acetocarmine solution were put on these grains. Second pollen grains were stained in 0.1 per cent erythrosine B solution. The unstained pollen grains were considered viable in this method. Stain solution (0.1%) was prepared by dissolving 100 mg of erythrosine B in distilled water to make a final solution of 100 ml. The pollen germination experiments were conducted in vitro conditions by using cavity slides containing a hanging drop of sucrose solution and pollen tube growth was assessed in each germplasm under microscope. The pollen grains had pollen tube at least two times larger than pollen size were considered to be germinated. The different solutions used were as 5, 10, 12.5, 15 & 20 per cent sucrose solutions with 10 ppm boric acid.
RESULTS AND DISCUSSION
The highest pollen viability was recorded in Loulou (97.93%) and minimum in Kaim-anar (91.13%) when tested by 2 per cent acetocarmine. However, pollen viability was found to be highest in Loulou (89.42%) followed by Green Globe (89.26%) and least in Kaim-anar (83.24%) when tested with 0.1 per cent erythrosine B.Pollen germination was tested in seven different concentrations of sucrose and/or boric acid. Mean pollen germination was found to be maximum (52.3%) in solution containing 12.5 per cent sucrose + 10 ppm boric acid and minimum (4.38%) in 20 per cent sucrose solution. Under various treatment the treatment (12.5% + 10 ppm boric acid) was found to be best where the pollen germination ranged from 34.28 per cent in Kaim-anar to 69.72 per cent in Loulou.
REFERENCES [1] Ali M M, Bacha M A and Farahat F A 1998. Pollen viability, germination and rates of pollen tube growth in some pomegranate cultivars (Punica
granatum L.). Journal of King Saud University10: 7381. [2] Derin K and Eti S 2001. Determination of pollen quality, quantity and effect of cross pollination on the fruit set and quality in the pomegranate.
Turkish Journal of Agriculture and Forest25: 169-173. [3] Engin H and Hepaksoy S 2003. Determination of pollen germination of some pomegranate cultivars. Journal of Aegean University 40: 9-16. [4] Ercisli S 2007. Detemination of pollen viability and in vitro pollen germination of Rosa dumalis and Rosa villosa. Bangladesh Journal of
Botany 36: 185-187.
It is I
LLEGAL t
o cop
y, pri
nt or
save
any c
onten
t of th
is PDF,
in pa
rt or in
full,
on an
y retr
ieval
syste
m,
withou
t the E
XPRESS WRITTEN PERMISSIO
N of th
e cop
yrigh
t-hold
er

National Conference on Climate Change and Agricultural Production: Adapting Crops to Climate Variability and Uncertainty, 6th–8th April, 2017
[417]
Changes in the Biochemical Constituents of Elephant Foot Yam (Amorphophallus paeoniifolius) Corms during Ambient Storage
Payel Panja1*, Pran Krishna Thakur1, Surajit Mitra1 and Jayanta Tarafdar2 1Department of Post-Harvest Technology of Horticultural Crops, 2Department of Plant Pathology
1,2Bidhan Chandra Krishi Viswavidyalaya, Mohanpur, Nadia–741252, West Bengal, India E-mail: *[email protected]/ [email protected]
Keywords: Biochemical Constituents, Eephant Foot Yam, Sprouting, PLW
INTRODUCTION
Roots and tubers were critical components in the diet during the early evolution of mankind and the most important food crops of very ancient origin in the tropics and sub tropics, associate with human existence, survival and socioeconomic history (Asha and Nair, 2002). Elephant foot yam (Amorphophallus paeoniifolius) is an important crop cultivated for its edible corms. Elephant foot yam along with other tropical tuber crops has now become an obvious candidate as food security crop because of its capacity to do well on marginal soils even with low annual rainfall and its ability to give some return even in the years of droughts and flood (Mitra and Tarafdar, 2008). Elephant foot yam is a cheap source of carbohydrates, rich in calcium, phosphorus and vitamins grown for corm harvested after 6–7 months from planting and can be stored for longer period without damage. Corms being organs with a dormancy period are considered to be the least perishable of tropical root and tuber crops and therefore, well stored yam represents stored wealth which can be sold all year round by the farmer. Specifically the work investigates and evaluates the effect of storage period on nutritional and other quality parameters of elephant foot yam under ambient conditions.
MATERIALS AND METHODS
The experiment was conducted during December of 2013–2014 at AICRP Tuber Crops laboratory of Directorate of Research (ICAR), Kalyani, West Bengal. Fresh corms of twelve prominent elephant foot yam collections (BCA-1, BCA-2, BCA-3, BCA-4, BCA-5, BCA-6, BCA-7, AC-14, NDA-5, NDA-9, SREE PADMA & IGAM-1) were procured from research field at Horticultural Research Station, Mondouri. BCKV.Physiological characters including weight loss and sprouting were evaluated during the storage period. Biochemical characters such as TSS, ascorbic acid, starch, total sugar, titratable acidity, carbohydrate, total phenol were estimated with at 30 days intervals with complete randomized design (CRD) experimental design.
RESULTS AND DISCUSSION
The present study suggests that post-harvest quality in elephant foot yam is strongly influenced by storage after harvest. Corms hardening and deterioration in biochemical and physiological constituents were the major limiting factors in storage period. Elephant foot yam cultivars have a potential for long-term storage under tropical ambient conditions without causing highly significant changes in their chemical composition in comparison with other tropical fresh produce and therefore, well stored yam represents stored wealth which can be sold all year round by the farmer. Textural softening during storage is of commercial importance as it directly dictates shelf life, which is due to in vivo carbohydrate hydrolysis by respective carbohydrate hydrolases. It can be observed that significant reductions in moisture, carbohydrate, starch, ascorbic acid and acidity occurred whereas the total sugar and total soluble solid content of the tuber increased at the storage period. Enhanced breakdown of starch and production of sugars and early initiation of sprouting are
It is I
LLEGAL t
o cop
y, pri
nt or
save
any c
onten
t of th
is PDF,
in pa
rt or in
full,
on an
y retr
ieval
syste
m,
withou
t the E
XPRESS WRITTEN PERMISSIO
N of th
e cop
yrigh
t-hold
er

National Conference on Climate Change and Agricultural Production: Adapting Crops to Climate Variability and Uncertainty, 6th–8th April, 2017
[418]
occurred. Physiological loss of weight and carbohydrate occurs due to respiration, transpiration and sprouting of the tuber. Respiration results in a steady loss of carbohydrate as carbon dioxide and water, while at the same time transpiratory loss of water occurs. This could have been as the result of sprout development and growth, as some of the minerals are used for this physiological activity. Further studies are needed to investigate the impact of storage condition and duration on the composition of corms so that technologies may be invented for quality retention for a longer period.
REFERENCES [1] Asha K I and Nair M C 2002. Ethnic knowledge system on wild Dioscorea (yams) by the Kanikkars of Southern Western Ghats, Kerala. Indian
Journal of Plant Genetic Resources15:146–149. [2] Mitra S and Tarafdar J 2008. Present status and future prospects of elephant foot yam cultivation in West Bengal. In Palaniswami, M. S. et al.
ed., National Seminar on Amorphophallus: Innovative Technology, July 19-20, 2008, Patna, Bihar-abstract Book, Status papers and extended summery: 25-29.
Constraints Perceived by Diara and Tal Land of Gram Growers Farmers in State of Bihar
Neeraj Kumar1* and Ashok K. Singh2 1Research Scholar Department of Extension Education,
Bihar Agricultural University Sabour, Bhagalpur–813210, India 2University Professor, Department of Extension Education,
Dr. Rajendra Prasad Central Agricultural University Pusa, Samastipur–848125, Bihar, India E-mail: *[email protected]
Keywords: Constraints, Diara and Gram Growers
INTRODUCTION
The Diara ecosystem whosepotentials are yet to be exploited is situatedbetween the natural levees of rivers and isperiodically eroded and formed due tomeandering, braiding and course changing of rivers and remains inundated under floodwater for varied periods of time. It features a riverine landscape with unstable landsurfaces, subjected annually to erosion and redeposition with assortment of sedimentsdepending upon the velocity and duration of floods. Thearea has vast potential for enhancing thepulse and vegetable production. The farmersresiding in this area cultivate different cropsin their Diara land on migratory basis andthe large area is covered under gram andlentil crops which require low inputs andmeager management due to risk anduncertainty.Keeping in view these facts thepresent study was aimed at identifying the constraints perceived by diara and Tal land of Gram growers farmers in Bihar
MATERIALS AND METHODS
The study was carried out in Mokamablock of Patna district of Bihar purposelyas it is situated on the southern bank ofGanga. The land strip along the north ofGanga is called Diara which submerges inGanga during monsoon. On the south ofMokama is the Tal region which also getsthe backwaters of the Ganga duringmonsoon. For the purpose of the study alist of progressive farmers with respect togram producers of different villages of Mokama block was prepared first handwith the help of block agricultural officers, KVK scientists, subject matter specialistsand extension officials working in the area.Out of this list total one hundred (100) gramproducers who were involved in gramcultivation on regular basis were selectedas the sample of the study was based onproportionate probability principle. The datawere collected with the help of
It is I
LLEGAL t
o cop
y, pri
nt or
save
any c
onten
t of th
is PDF,
in pa
rt or in
full,
on an
y retr
ieval
syste
m,
withou
t the E
XPRESS WRITTEN PERMISSIO
N of th
e cop
yrigh
t-hold
er

National Conference on Climate Change and Agricultural Production: Adapting Crops to Climate Variability and Uncertainty, 6th–8th April, 2017
[419]
structuredpersonal interview method with knowledgeand constraints level of gram growers whichwere tabulated and analyzed for meaningfulresults.
RESULT AND DISCUSSION
The duration and extent of flood were major concern in Diara followed by variability in soil fertility and undulating topography of land. Some farmers expressed their grievances about lack of Govt. policy and programmes. The drainage pattern in Diara is the main point of concern for the planners. Farmers seek timely supply of improved seed followed by broadcasting of seed which affect poor crop stand.
It is evident from the study that the major constraints like duration and extent of flood were major concern in Diara followed by variability in soil fertility and undulating topography of land.The drainage pattern is the main concern for the planners.
REFERENCES [1] Burman R Roy, Singh SK and Singh AK 2010.Gapin adoption of improved pulse production inUttar Pradesh.Indian Research Journal
ofExtension Education 10(1): 99-104. [2] Rombade BD, Sadafal SS, Aagle SB and Pinjari SS2011. Adoption of recommended package ofpractices of Kagzilime by the
growers.International Journal of Agricultural Sciences 7(2):412-414. [3] Wadhwani MK and Singh SB 2007.Socio-economicand policy issues for sustainable developmentof Diara eco-system in the eastern
Gangeticplains. Proceedings, TAAL, The 12th World LakeConference, pp 1936-1943.
Effect of Temperature on Fermentation and Quality of Sauerkraut
Pran Krishna Thakur*, Payel Panja and Jahangir Kabir Department of Post Harvest Technology of Horticultural Crops,
Bidhan Chandra Krishi Viswavidyalaya, Mohanpur–741252, Nadia, India E-mail: *[email protected]
Keywords: Cabbage, Sauerkraut, Fermentation, Quality
INTRODUCTION
Cabbage (Brassica oleracea L. var. capitata) is a good source of vitamin B and C, carotene and minerals. Sauerkraut is an acidic cabbage which results from natural fermentation by bacteria indigenous to cabbage in the presence of salt. Temperature is important in sauerkraut production in relation to quality because it determines the role of different bacteria in fermentation process. Generally it is not advisable to allow the temperature to rise above 21oCor drop below 7oC, the optimum range being 13oC to 19oC. The ideal temperature considered for sauerkraut fermentation was 18oC. According to Pederson and Albury (1969) and Prescott et al., (2006), sauerkraut fermented at the higher temperatures will be more prone to yeast (so-called Mycoderma) spoilage partly because of its low content of carbon dioxide. It also darkens readily the sauerkraut. Pederson and Albury (1969) also observed that sauerkraut could be successfully fermented at low temperatures (7.5oC). Lauconostoc mesenteroides grows at lower temperature than other lactic acid bacteria involved in a normal fermentation. Under the circumstances present investigation was undertaken to assess the nature of fermentation at different temperature and standardize the best temperature condition for preparation of sauerkraut.
It is I
LLEGAL t
o cop
y, pri
nt or
save
any c
onten
t of th
is PDF,
in pa
rt or in
full,
on an
y retr
ieval
syste
m,
withou
t the E
XPRESS WRITTEN PERMISSIO
N of th
e cop
yrigh
t-hold
er

National Conference on Climate Change and Agricultural Production: Adapting Crops to Climate Variability and Uncertainty, 6th–8th April, 2017
[420]
MATERIALS AND METHODS
Sauerkraut was prepared by the standard procedure with each varieties in the Laboratory of PHT, B.C.K.V. during the period 2013–2014. Sauerkraut prepared from variety Shaan was allowed to ferment at three temperature conditions ie, low temperature (15–20oC), ambient temperature (25–30oC) and at high temperature (35–40oC) and quality was evaluated at different days interval. Observation of Sauerkraut was for titratable acidity (%), lactic acid (%) (Cappuccino et al., 1996) and ascorbic acid (mg/100g) at 7 days intervals.
RESULTS AND DISCUSSION
The chemical composition of fresh cabbage cv. Shaan showed that it contains 5.6% TSS, 5.48 pH, 0.204% acidity, 0.228% lactic acid, 24mg/100g ascorbic acid 2.20% sugar (Table 1). Acidity and lactic acid of sauerkraut at low temperature and ambient condition increased up to 21st day, at high temperature it increased upto 14 days and then it declined (Table 2). Maximum acidity and lactic acid of 2.07 and 2.91% respectively was recorded at 15–20oC (low temperature) followed by 1.60% and 2.25% respectively at 25–30oC (ambient temperature) on 21st day while at high temperature (35–40oC) maximum acidity and lactic acid of 1.47% and 2.07% was estimated on 14th day of fermentation. On 28th day maximum ascorbic acid (50.09mg/100g) was in sauerkraut fermented with low temperature followed by ambient temperature (40.54mg/100g) and high temperature (36.91mg/100g) (Table 3). Sensory quality of sauerkraut at different temperature revealed that at 15–20oC (low temperature), sensory score for colour, texture, flavour, acceptability remained higher than ambient temperature (25–30oC) and high temperature (35–40oC) throughout the period of fermentation. So the effect of temperature on fermentation indicated that low temperature of 15–20oC was most effective in fermentation as acidity and lactic acid reaches more than 2% on 21st and 14th day respectively and it maintains high ascorbic acid content. Thus, at low temperature i.e. 15oC–20oC fermentation is faster than ambient and higher temperature and retains the ascorbic acid.
Table 1: Chemical Composition of Fresh Cabbage Chemical Parameters Fresh Cabbage
TSS (°Brix) 5.6 pH 5.48 Acidity (%) 0.204 Lactic acid (%) 0.228 Ascorbic acid (mg/100g) 24.00 Total sugar (%) 2.20
Table 2: Changes of Acidity and Lactic Acid at Different Temperature Temperature Acidity (%) Lactic Acid (%)
Day Day 7 14 21 28 7 14 21 28
Low temperature (15-20°C) 1.08 1.47 2.07 1.98 1.53 2.07 2.91 2.77 Ambient temperature (25-30°C) 0.96 1.34 1.60 1.47 1.35 1.89 2.25 2.07 High temperature (35-40°C) 1.06 1.72 1.47 1.28 1.51 2.43 2.07 1.80 CD (p=0.05) 0.10 0.06 0.09 0.05 0.148 0.09 0.13 0.09
Table 3: Changes of Ascorbic Acid at Different Temperature Temperature Ascorbic Acid (mg/100g)
Day 7 14 21 28
Low temperature (15-20°C) 49.43 60.64 62.98 50.09 Ambient temperature (25-30°C) 36.50 47.97 51.98 40.54 High temperature (35-40°C) 34.52 45.29 47.59 36.91 CD (p=0.05) 1.53 1.59 1.64 1.50
It is I
LLEGAL t
o cop
y, pri
nt or
save
any c
onten
t of th
is PDF,
in pa
rt or in
full,
on an
y retr
ieval
syste
m,
withou
t the E
XPRESS WRITTEN PERMISSIO
N of th
e cop
yrigh
t-hold
er

National Conference on Climate Change and Agricultural Production: Adapting Crops to Climate Variability and Uncertainty, 6th–8th April, 2017
[421]
REFERENCES [1] Cappuccino J G and Sherman N 1996.Microbiology- A Laboratory manual. 4thed. Benjamin/ Cumming publishing, USA pp: 186. [2] Pederson C S and Albury M N 1969.The sauerkraut fermentation. Geneva, N.Y. New York State Agricultural Experimental Station Bulletin,824. [3] Prescott L M, Harley, J P and Klein D A 2006. Microbiology. 7th ed. McGraw Hill Companies, New York, pp. 992.
Effect of Intregated Nutrient Management on Onion (Allium cepa L.) Yield, Quality Attributes, Soil Properties and Production Economics
under Field Condition
Arun Sharma*1, Payel Panja2*, Joydip Mandal1 and Smaranika Mohanta3 1Department of Crop Improvement, Horticulture and Agricultural Botany (CIHAB)
3Department of Horticulture and Post-Harvest Technology, Institute of Agriculture, Visva-Bharati, Sriniketan–731236
2Department of Post-Harvest Technology of Horticultural Crops, Bidhan Chandra Krishi Viswavidyalaya, Mohanpur, Nadia–741252, India
E-mail: *[email protected]
Keywords: Onion, Fertilizers, Yield attributes, Soil Characters, Production Economy
INTRODUCTION
Onion (Allium cepaL. 2n=16), is an important bulb crop belonging to family Alliaceae. Onion is considered to be the second most important vegetable crop grown in the world. In India, 50 per cent of total onion production comes from rabi onion harvested in April-May, 30 per cent from late kharif harvested in January-February and 20 per cent from kharif onion harvested in October-November. There is critical gap in supply in the country from October-December and as a result the prices shoot up. The good harvest in kharif season tries to bridge the gap. Integrated nutrient management is one of the most important factors that greatly influenced the quality and yield of onion (Bagali et al., 2012). Hence the present study deals with the preparation to find out the effect of different levels of organic and inorganic fertilizer on yield and quality of onion and to find out the production economics of kharif onion cultivation under integrated nutrient management in Red and Laterite Zone of West Bengal.
MATERIALS AND METHODS
The experiment was conducted at the Horticulture Farm of Visva-Bharati during kharif season, 2014. The plot size was 4 m x 1.2 m. Seed of onion cv. Agrifound Dark Red was sown and 45 days old seedlings were transplanted in the main field at a spacing of 15 cm x 10 cm. Fine and fully decomposed farmyard manures @ 3 kg/m2 was mixed well 10 days before sowing of seed. A different dose of FYM (according to treatment) was applied 15 days before transplanting and different doses of N: P2O5: K2O (according to treatment) was applied at the time of transplanting. Half the dose of N along with entire phosphate and potash fertilizers was given as basal and rest N was top dressed in two split doses at 30 and 60 days after transplanting. Different morphological characters including yield and yield attributing traits were estimated. Biochemical characters such as TSS, pH, pyruvic acid, EC, organic carbon, available soil phosphorus and available soil potassium were estimated with Randomized block design (RBD). The cost of cultivation for bulb was worked out by taking all the important practices of onion bulb cultivation. Finally, benefit-cost ratio was worked out by division of net profit and total costs of cultivation.
It is I
LLEGAL t
o cop
y, pri
nt or
save
any c
onten
t of th
is PDF,
in pa
rt or in
full,
on an
y retr
ieval
syste
m,
withou
t the E
XPRESS WRITTEN PERMISSIO
N of th
e cop
yrigh
t-hold
er

National Conference on Climate Change and Agricultural Production: Adapting Crops to Climate Variability and Uncertainty, 6th–8th April, 2017
[422]
Treatments Different Doses T1 (Farmers practice) 7.5 t/ha FYM + NPK (115-40-75 kg/ha) T2 7.5 t/ha FYM + (state recommended) NPK (125-100-100 kg/ha) T3 7.5 t/ha FYM + (soil test based) NPK (156-100-75 kg/ha) T4 20 t/ha FYM + (state recommended) NPK (125-100- 100 kg/ha) T5 20 t/ha FYM + (soil test based) NPK (156-100-75 kg/ha) T6 10 t/ha FYM +Mustard Oil Cake (1t/ha)+(state recommended) NPK (125-100-100 kg/ha) T7 10 t/ha FYM + Mustard Oil Cake (1t/ ha) + (Soil test based) NPK (156-100-75 kg/ha)
RESULTS AND DISCUSSION
West Bengal state recommendation to onion for medium fertile soil is NPK @ 125-100-100 kg/ha. Keeping in mind the low nitrogen, medium phosphorus and high potassium content in soil, the soil test based recommended dose was worked out i.e. 25% higher the dose of nitrogen, at par dose of phosphorus and 25% reduced dose of potassium to the state recommended dose. Thus, finally the soil test based NPK dose was 156-100-75 kg/ha. Seeing low organic content in the experimental plots the organic manure doses was increased to FYM @ 20 t/ha or FYM @ 10 t/ha + Mustard Oil Cake 1 t/ha. The overall performance of kharif onion in this region was highly satisfactory. On an average it produced 21.8 t/ha, which is comparable to other kharif onion growing belt of this country. Different combinations of organic and inorganic nutrients had good influence on yield attributes, bulb yield and quality traits of kharif onion as revealed from different responses received for different treatments. T4 produced the maximum yield of 28.0 t/ha, closely followed by treatment combinations T6, T7 and T5. Application of medium to high doses of FYM and/ or Mustard Oil Cake along with state recommended/ soil test based NPK dressing enrich the post-harvest soil with organic carbon, increased the available phosphorus and maintain the available potassium level in soil. T4 at harvest (i.e. 120 DAT) resulted 50.5 mm polar and 53.8 mm equatorial diameter, 0.94 bulb shape index, 27.2 cm2 bulb index, 69.7g bulb weight, 28.0 t/ha bulb yield, 12.3°Brix TSS, 10.8 scales per bulb, 7.9 µmol/g pyruvic acid, highest net income (Rs. 328421.60) and benefit: cost ratio (3.75). Thus, onion (cv. Agrifound Dark Red) may be grown during kharif season with 20 t/ha FYM + (state recommended) NPK (125-100-100 kg/ha) (T4) for higher productivity, net return and benefit-cost ratio under Red and Laterite Zone of West Bengal.
REFERENCES [1] Bagali A N, Patil, H B, Chimmad, V P, Patil, P L and Patil, R V 2012. Effect of inorganics and organics on growth and yield of onion
(Allium cepa L.).Karnataka Journal of Agricultural Sciences 25(1): 112-115.
Rice-wheat Cropping System under Long Term Effect of Integrated Nutrient Management
S.S. Walia* and Vikrant Dhawan Department of Agronomy, Punjab Agricultural University, Ludhiana, Punjab–141004, India
E-mail: *[email protected]
Keywords: INM, Nutrient, Rice, Wheat
INTRODUCTION
During seventies and mid eighties, the agricultural growth rate increased rapidly and thereafter started steady declining and disturbing environment as a whole. The use of inputs has also increased to a much high level resulting in over exploitation of natural resources (Dhawan and Singh, 2015). With the introduction of high
It is I
LLEGAL t
o cop
y, pri
nt or
save
any c
onten
t of th
is PDF,
in pa
rt or in
full,
on an
y retr
ieval
syste
m,
withou
t the E
XPRESS WRITTEN PERMISSIO
N of th
e cop
yrigh
t-hold
er

National Conference on Climate Change and Agricultural Production: Adapting Crops to Climate Variability and Uncertainty, 6th–8th April, 2017
[423]
yielding varieties of crops, expansion of irrigation facilities, use of chemical fertilizers, weedicides and adoption of plant protection measures, the production of many crops has shown a drastic change. Nowadays, agriculture is faced with challenge of introducing high yielding cropping systems with judicious use of inputs and also to sustain ecological balance.
MATERIALS AND METHODS
The study was conducted during 2015–16 at the research farm of Department of Agronomy, Punjab Agricultural University, Ludhiana and was initiated during 1983. Fourteentreatments on rice- wheat cropping system with three different replications were evaluated for their production potential. The aim of the experiment was to develop suitable integrated nutrient supply system for rice-wheat crop sequence involving efficient use of fertilizer in conjunction with a judicious combination of organic manures by effective recycling techniques, without detriment to long term fertility and by improving crop productivity.
RESULTS AND DISCUSSION
A permanent plot experiment was conducted to develop suitable integrated nutrient supply system for rice-wheat involving different levels of chemical fertilizers and their combinations with FYM, crop residues and green manuring. The productivity was greatly influenced by the treatments where chemical fertilizers were supplemented with organic manures.The highest value of rice productivity (72.08 q/ha) was obtained where50 per cent N was applied through FYM along with recommended level of fertilizer and 25 per cent N was applied through GM along with 75 per cent recommended NPK (71.59 q/ha).It was closely followed by 70.60 q/ha where 50 per cent N through green manuring plus 50 per cent recommended NPK were applied; however all these treatments were at par amongst themselves. Green manuring and FYM application helped to save 50 per cent nitrogen and simultaneously produced higher grain yield over the recommended fertilizer treatments. The grain equivalent yield obtained in treatment T10, T11, T6, T7 (50/25 per cent N through GM or FYM + 50/75 per cent recommended NPK) was 12.34 t/ha, 12.32 t/ha, 12.31 t/ha and 12.29 t/ha and was 5.3, 5.1, 5.0 and 4.9 per cent more over recommended fertilizer treatment. Yield increase in integrated nutrient approach treatments may be due to positive influence of balanced source-sink relationship which is clearly evident from remarkable improvement in plant height, leaf area index (90 DAT), effective tillers, panicle length, spikelet/ panicle and 1000 grain weight. The results, thus clearly showed the beneficial effect of organic manures.
REFERENCES [1] Dhawan V and Singh J M 2015. Role of farm inputs in sustaining Punjab agriculture. Indian Journal of Economics and Development. 11
(1): 325-332.
It is I
LLEGAL t
o cop
y, pri
nt or
save
any c
onten
t of th
is PDF,
in pa
rt or in
full,
on an
y retr
ieval
syste
m,
withou
t the E
XPRESS WRITTEN PERMISSIO
N of th
e cop
yrigh
t-hold
er

National Conference on Climate Change and Agricultural Production: Adapting Crops to Climate Variability and Uncertainty, 6th–8th April, 2017
[424]
Effect of Environment, Season and Spacing on Growth Pattern and Seed Yield of Muskdana (Abelmoschus moschatus L.)
Ritu Mishra*, Anil Kumar Gupta and Raj Kishori Lal CSIR-Central Institute of Medicinal and Aromatic Plants, CIMAP, Lucknow–226015, India
E-mail: *[email protected]
Keywords: Muskdana, Vegetative Growth, Variability, Seed Yield, Cluster Analysis
INTRODUCTION
Abelmoschus moschatus L. is commonly known as muskdana or ambrette belongs to Malvaceae family (Srivastava, 1995). The seeds yield an essential oil and give a strong flowery musky brandy like odour of remarkable tenacity because of the presence of ambretrolide, a macrocyclic lactone in the seed coat (Abhishek et al., 2013; Kutlu et al., 2014). Determination of optimum sowing date is considered as important effort for optimum yields. Both quantitative and qualitative traits of crops depend on sowing on the proper date and growing season (Farrag, 1995). Muskdana plant sown in June as compared to August had good vegetative growth (Yadev and Dhankhar, 2001). Vigorous vegetative growth and high fruit setting were noticed in April compared to March sowings (Incalcaterra et al., 2000; Sharif et. al. 2002). Good vegetative growth and pod yield means high seed yield. Study showed (Islam et al., 2000; Yogesh et al., 2001) that high pod and seed yield from July sowings compared to late August and October sowings. Higher seed yield of a number of muskdana genotypes were obtained from June sowings compared to late July sowings (Shujat et al., 2006). Our objective of study is estimation of fixable and non fixable components of genetic variances for diverse traits of economic significance and identification of highly divergent clusters or genotypes in order to exploit them in hybridization programme.
MATERIALS AND METHODS
Fifty wild cultivated genotypes of muskdana were collected from various places of India. The genotypes were grown at the experimental farm of the CSIR–Central Institute of Medicinal and Aromatic Plants, Lucknow, during the year 2015–2016 under normal fertility condition. Split plot design in four replications as main plot and the three sowing dates as sub plot was used. The data were analyzed using MSTATC statistical software (version 3). Cluster analysis and correlation analysis was done using R-software (version 3.2.2) and SPSS (version 23) respectively to determine percentage contribution to total diversity and degree of association among these characters.
RESULTS AND DISCUSSION
Late sowing on 20th of July 10th of August had significant negative effects on plant height of genotypes at 50% flowering in both years. The highest plants and number of leaves of genotypes were obtained at early sowing on 1st of July. The reductions in plant height of genotypes were 14% and 32% due to late sowing on 20th of July and 10th of August, respectively. The growth habit and degree of branching of muskdana genotypes were highly variable. About 59% of genotypes were erect type while 24.7 and 16.4% of genotypes characterized with medium growth and procumbent type of growth habits, respectively. Regarding the branching habit of accessions 41.1% had strong branching habit but 25% were without branches. There were 30.1% of the genotypes were smooth glabrous stem while 54.1% of the muskdana collections had slight pubescence and 15.1% characterized withconspicuous pubescence on stems. Similarly the extent of pubescence varies on leaves and fruits of muskdana. Thirty percent of muskdana genotypes were smooth
It is I
LLEGAL t
o cop
y, pri
nt or
save
any c
onten
t of th
is PDF,
in pa
rt or in
full,
on an
y retr
ieval
syste
m,
withou
t the E
XPRESS WRITTEN PERMISSIO
N of th
e cop
yrigh
t-hold
er

National Conference on Climate Change and Agricultural Production: Adapting Crops to Climate Variability and Uncertainty, 6th–8th April, 2017
[425]
while the 35% were rough and prick type of pubescence.On the basis of quantitative characters 50 genotypes were grouped into 4 distinct clusters. The first cluster consists of 25 genotypes (50%), the second cluster consists of 13 genotypes (26%), the third cluster consists 8 genotypes (16%) and the fourth cluster consists only 4 genotypes (8%) out of total genotypes. The distribution pattern of genotypes into 4 clusters confirmed the existence of diversity among the genotypes.
It was concluded that for high muskdana seed yield, sowing during July (on the first two weeks) could be recommended for Uttar Pradesh State and areas of similar conditions. Early sowing (March-June) could be recommended for fresh pod production since seeds produced during July-August would be affected by rain and Yellow Mosaic Virus diseases. Genetic variation existed among the germplasms in all the characters studied. Accessions CIM-AM 22, CIM-AM 40 and CIM-AM 49 showed greater potential in terms of yield attributes as they outperformed the other genotypes, indicating their usefulness as promising genotypes.
REFERENCES [1] Abhishek B, Sumeet D and Balakrishnan BR 2013. Morphological and anatomical studies of medicinal seeds of the Abelmoschus moschatus
Medik. International Journal of Pharmacy Teaching and Practices 4(3): 765-7. [2] Kutlu T, Yıldırım I and Kırbağ S 2014. Comparison of Antımicrobial Activity of Methanol and Ethanol Extracts of Abelmoschus Moschatus Dry
Flowers. Issues.1(1). [3] Farrag M M 1995. Yield of 23 mung bean accessions as affected by planting date under El-Menia conditions. Asian Journal of Agricultrural
Sciences26(2): 49-62. [4] Incalcaterra G, Vetrano F G, Stoffell P J, Canttliffe D J and Damato G 2000. Effect of two sowing dates and plastic mulch on okra production.
Acta Horticulturae53:329-336. [5] Islam M S, Rahman M M and Chowdhury A K 2000. Off season performance of okra for edible pod and seed productionThailand Journal of
Agricultural Science33(3-4): 107-113. [6] Sharif H A B, Wahab A and Justus M 2002. Comparative studies on the effect of sowing dates and spacing on the growth and yield of okra in
different years. Journal of Biological Science3(12): 1173-1180. [7] Shujat H, Muhammed S, Noor-ul A and Zafar J 2006. Response of okra (Abelomischus esculentus L. Moench) cultivars to different sowing
times, Agricultural Journal of Biological Science1(1): 55-57. [8] Srivastava U C 1995. Ambrette seed. In: K.L. Chadha and Rajendra Gupta (Ed.), Advances in Horticulture, medicinal and aromatic plants,
Malhotra Publ. House, New Delhi. Advances in Horticulture11: 887-897. [9] Yadev S K and Dhankhar B S 2001. Seed production and quality of okra (Abelomischus esculentus L.Moench.) cv. Varshauphar as affected by
sowing time and position of fruit. Seed Research29(1): 47-51. [10] Yogesh P, S Gopal S, Prasad Y and Singh G 2001. Effect of nutrition and time of sowing on growth and seed production of okra (Abelomischus
esculentus L. Moench.)Vegetable Science28( 2): 186-187. 2001.
Effect of Phosphorus Management on Productivity of Sunflower (Helianthus annuus L.)
Virendra Singh1*, O.V.S. Thenua1 and Y.S. Shivay2 1Department of Agronomy, Amar Singh (PG) College Lakhaoti, Bulandshahr–203407, India
2Division of Agronomy, ICAR-Indian Agriculture Research Institute, New Delhi–110012, India E-mail: *[email protected]
Keywords: Sunflower, Phosphorus, Single Super Phosphate, Rock Phosphate, Pyrite
INTRODUCTION
India is the third major player in the world, after USA and China in terms of production of vegetable oils. Oilseeds, the second largest agricultural commodity after cereals in India, play a significant role in India’s agrarian economy sharing 14 per cent of the gross cropped area accounting for nearly 5 per cent of the gross national product and 10 per cent of the value of all agriculture products (Mandal et al., 2002). India as
It is I
LLEGAL t
o cop
y, pri
nt or
save
any c
onten
t of th
is PDF,
in pa
rt or in
full,
on an
y retr
ieval
syste
m,
withou
t the E
XPRESS WRITTEN PERMISSIO
N of th
e cop
yrigh
t-hold
er

National Conference on Climate Change and Agricultural Production: Adapting Crops to Climate Variability and Uncertainty, 6th–8th April, 2017
[426]
blessed with diverse agro-ecological conditions ideally suited for growing all nine-annual oilseed crop viz., groundnut, rapeseed and mustard, soybean, sesame, sunflower, safflower and niger (edible) and linseed and castor (non-edible) are cultivated in the country.Total area, production and productivity of sunflower in India was 0.67 million hectares, 0.50 million tonnes and 750 kg ha-1, respectively during 2013–14 (Anon., 2015) and in world was 25.20 million hectares, 41.42 million tonnes, respectively during 2014 (FAOSTAT, 2014).Phosphorus is the master key element for increasing yield of field crops.Phosphorus has an important role in several processes, viz. N2 –fixation, photosynthetic sate and transport of photosynthetic to roots furthermore, a reduction in N2 –fixation under low P supply in as number of legumes have been observed (Yahiya et. al., 1995) and sustaining soil productivity (Ali and Mishra., 2000).
MATERIALS AND METHODS
A field experiment was conducted during the kharif season of 2003 and 2004 at the Agricultural Research Farm of Amar Singh (P.G.) College, Lakhaoti (Bulandshahr). The treatments comprised three sources of phosphorus (Single super phosphate, Rock phosphate and Rock phosphate + pyrite (25% by weight) and four levels of phosphorus (0 kg P2O5 ha-1, 30 kg P2O5 ha-1, 30 kg P2O5 ha-1+VAM and 60 kg P2O5 ha-1). Design of experiment was factorial randomized design with three replications.
RESULTS AND DISCUSSION
Among the phosphorus sources single super phosphate produced highest seed yield (2142.0 kg and 2120.7 kg ha-1). Although the sunflower seed yield with application of 60 kg P2O5 ha-1 produced higher seed yield over 30 kg P2O5 ha-1 alone, however, it remained statistically on par with 30 kg P2O5 ha-1 + VAM. However, all the levels of phosphors applied to sunflower recorded significantly higher seed yield over control during both the years of study. Application of VAM along with 30 kg P2O5 ha-1 proved significantly superior over no application and the increase in seed yield was to the tune of 11.5 and 12.6 % in first and second year, respectively.Application of 60 kg P2O5 ha-1 recorded significantly higher (3440.8 and 3454.8 kg) stover yield over 30 kg P2O5 ha-1 alone, however, it remained statistically on par with 30 kg P2O5 ha-1 + VAM.The application of 30 kg P2O5 ha-1 + VAM also recorded significantly higher stover yield over 30 kg P2O5 ha-1 in both the years. All the levels of phosphorus application resulted significantly higher stover yield over control during both the years of experimentation.Harvest index significantly improved with increasing level of phosphorus in both the years. Higher dose i.e. 60 kg P2O5 ha-1, observed maximum values of harvest index which was on par with 30 kg P2O5 ha-1 + VAM in both the years. Application of 30 kg P2O5 ha-1 also observed higher harvest index over control.
Phosphorus applied through SSP and phosphorus level 60 kg P2O5 ha-1was produced better growth, yield & yield attributes and uptakesof nutrients in sunflower.
REFERENCES [1 ] Ali M and Mishra JP 2000. Nutrient management in Pulse-based cropping-system. Fertilizer News45( 4) : 57 - 69 . [2 ] Anonymous 2015. Sunflower: All-India Area, Production and Yield along with coverage under Irrigation.Agricultural Statistics at a Glance pp .
126- 12 7. [3] FAOSTAT 2014. Online Interactive Database on Agriculture. FAOSTAT. www.fao.org [4 ] Mandal KG, Ghosh PK, Wanjari R H, Hati K M, Bandyopadhyay KK and Mishra AK 2002. Practical implication on nutrient x nutrient
interaction to boost oilseeds productivity in India. Fertilizer News47( 7) : 1 3 -18 & 2 1-2 6 . [5 ] Yahiya M, Samiullah and Fatma A 1995. Influence of phosphorus on nitrogen fixation on chickpea cultivars. Journal of Plant
Nutrition18( 4) : 719 -72 7.
It is I
LLEGAL t
o cop
y, pri
nt or
save
any c
onten
t of th
is PDF,
in pa
rt or in
full,
on an
y retr
ieval
syste
m,
withou
t the E
XPRESS WRITTEN PERMISSIO
N of th
e cop
yrigh
t-hold
er

National Conference on Climate Change and Agricultural Production: Adapting Crops to Climate Variability and Uncertainty, 6th–8th April, 2017
[427]
Effects of Irrigation Schedules and Nutrient Levels on Mustard (Brassica juncea L.)
Satybhan Singh and O.V.S. Thenua Department of Agronomy, Amar Singh (PG) College, Lakhaoti, Bulandshahr–203407, India
E-mail: *[email protected]
Keywords: Irrigation, Phosphorus, Sulphur, Mustard, Economics
INTRODUCTION
Soybean, groundnut and rapeseed-mustard are the major oil seed crops in India. During 2009–10 rapeseed-mustard contributing 25.9% and 22.0% to the total oilseed production and acreage (Anonymous, 2010). The yield levels have been variable ranging from 854 kg ha-1 (2002–03) to 1,142 kg ha-1 (2009–10) during the past eight years. This crop is often grown in North and North-Western part of India. One of the main reasons of low productivity of the crop is inadequate nutrition dueto deficiency of phosphorus and sulphur. The phosphorus and sulphur requirements of the crop are further influenced by available moisture conditions of the soil. This review has laid to study the effects of phosphorus and sulphur with variable irrigation scheduling on mustard yield and its oil content.
MATERIALS AND METHODS
The field experiments were conducted during rabi 2009–10 and rabi 2010–11 at the research farm of Amar Singh (PG) College, Lakhaoti, Bulandshahr, (U.P.). The treatments consisted of four irrigation schedules viz. (I0- no irrigation, I1- one irrigation at pre-flowering, I2- one irrigation at grain filling, I3- two irrigations one each at pre-flowering and grain filling; three phosphorus levels viz. P0- control, P30- 30 kg P2O5 ha-1, P60- 60 kg P2O5 ha-1 and three sulphur levels viz. S0- control, S20- 20 kg S ha-1 and S40- 40 kg S ha-1). The experiments were laid out in split plot design and replicated in thrice. Healthy seeds of mustard cv. Varuna were used @ 6 kg ha-1.
RESULTS AND DISCUSSION
Effect of Irrigation: The growth and yield attributes were significantly affected by irrigation schedules (Table 1). The plant height at maturity, branches/plant (primary and secondary) and dry weight of plant were highest with two irrigations one each at pre-flowering and grain filling (Table 1). Highest number of siliquae plant-1, number of seeds siliquae-1, test weight, seed yield and oil content were also recorded due to I3 irrigation schedule. Increase in seed yield (q ha-1) might be due to the more number of siliquaeplant-1, more number of seeds siliquae-1 and higher test weight.
Effect of Phosphorus and Sulphur: The plant height at maturity, branches/plant (primary and secondary) and dry weight of plant increased significantly with increased levels of phosphorus and sulphur. The results are in conformity with those already reported by by Puniaet al. 1993and Singh and Thenua 2016. The yield attributing characters of mustard as like number of siliquaeplant-1, number of seeds siliquae-1, test weight and seed yield were found to be highest with P2O5@60 kg/ha and sulphur @40 kg/ha (Table 1). However, oil content was significantly increased with increase of sulphur doses while it did not respond to phosphorus. The Highest net returns and benefit: cost ratio were found out with irrigation schedule (I3), P2O5 @60 kg/ha and sulphur@40 kg/ha. On the basis of results of the two years experiment, it may be concluded that the using 60 kg P2O5 ha-1and 40 kg S ha-1 with two time irrigation one each at pre-flowering and grain filling
It is I
LLEGAL t
o cop
y, pri
nt or
save
any c
onten
t of th
is PDF,
in pa
rt or in
full,
on an
y retr
ieval
syste
m,
withou
t the E
XPRESS WRITTEN PERMISSIO
N of th
e cop
yrigh
t-hold
er

National Conference on Climate Change and Agricultural Production: Adapting Crops to Climate Variability and Uncertainty, 6th–8th April, 2017
[428]
would be suitable for the highest seed production and oil content percent as this combination was much cost effective to other treatments.
REFERENCES [1] Punia B S, Porwal B L and Gaur B L 1993.Response of mustard to phosphorus on vertisols of Rajasthan. Indian Journal of Agronomy, 38
(1): 142-143. [2] Singh S B and Thenua O V S 2016. Effect of phosphorus and sulphur fertilization on yield and NPS uptake by mustard (Brassica
junceaL.).Progressive Research an International Journal11(1): 80-83. [3] Tripathi M K, Chaturvedi S, Shukla D K and Mahapatra B S 2010. Yield performance and quality in Indian mustard (Brassicajuncea L.) as
affected by integrated nutrient management. Indian Journal of Agronomy55 (2): 138-142.
Table 1: Growth and Yield Attributes and Economics of Mustard as Influenced by Irrigation Schedules and Nutrient Levels (Mean of Two Years Data)
Treatments Plant Height (cm)
No. of Branches/ Plant
Dry Weight
(g/ Plant)
No. of Siliquae/
Plant
No. of Seeds/ Siliquae
Test Weight
(g)
Seed Yield (q/ha)
Oil Content
(%)
Net Income (Rs/ha)
Benefit: Cost Ratio
Primary Secondary Irrigation Schedules
I0 86.33 5.33 7.53 24.36 185.04 8.82 3.55 7.41 37.59 15778 0.94 I1 137.70 5.86 10.28 26.69 208.75 10.53 4.00 9.04 38.69 31451 1.84 I2 161.10 6.97 11.34 28.96 230.58 11.80 4.21 10.50 39.07 37087 2.10 I3 177.91 7.07 12.39 32.09 261.16 13.27 4.66 11.64 40.10 39803 2.18
CD (P=0.05) 4.18 0.18 0.23 0.54 6.13 0.37 0.10 0.39 0.08 -- -- Phosphorus Levels
P0 136.82 5.89 9.61 27.25 207.16 10.54 3.84 8.83 38.83 27689 1.63 P30 140.61 6.32 10.65 28.08 220.51 11.06 4.10 9.72 38.86 30836 1.76 P60 144.84 6.73 10.90 28.75 236.48 11.71 4.38 10.40 38.89 34564 1.91
CD (P=0.05) 3.32 0.16 0.22 0.51 5.05 0.35 0.10 0.38 NS -- -- Sulphur Levels
S0 137.16 6.06 10.19 27.51 211.86 10.72 3.91 8.90 38.59 27654 1.60 S20 141.53 6.40 10.43 28.16 222.70 11.18 4.16 9.85 38.98 31840 1.81 S40 143.59 6.48 10.54 28.41 229.58 11.41 4.25 10.18 39.02 33596 1.88
CD (P=0.05) 3.32 0.16 0.22 0.54 5.05 0.35 0.10 0.38 0.08 -- --
Effect of High Density Planting System (HDPS) and Varieties on Growth and Yield of Desi Cotton
Pradeep Kumar1,2*, A.S. Karle1, Deshraj Singh1, Keteku Agbesi Kwadzo1 and Lalita Verma1 1Department of Agronomy, College of Agriculture, VNMKV, Parbhani–431402, India
2Department of Agronomy, CCS Haryana Agricultural Universit, Haryana–125004, India E-mail: *[email protected]
Keywords: Desi cotton, Growth, HDPS, Varieties, Yield
INTRODUCTION
Cotton (Gossypium spp.) also called as “The white gold” is one of the most important fibre and cash crop of global importance and being cultivated in tropical and subtropical regions of almost 80 countries of the world. It is one of the most important cash crops next to food grains that play a vital role in Indian national economy (Patel et al., 2016). Cotton production in India is considered to have a wide reaching impact not only on the livelihood of farmers and economy of the country but also on international trade. The desi cotton are known to have survive vagaries of nature for millions of year and thus tolerant and resistant to diseases,
It is I
LLEGAL t
o cop
y, pri
nt or
save
any c
onten
t of th
is PDF,
in pa
rt or in
full,
on an
y retr
ieval
syste
m,
withou
t the E
XPRESS WRITTEN PERMISSIO
N of th
e cop
yrigh
t-hold
er

National Conference on Climate Change and Agricultural Production: Adapting Crops to Climate Variability and Uncertainty, 6th–8th April, 2017
[429]
pests and adverse environmental condition compared to American cotton varieties which is more susceptible to insect pests and diseases and because of high cost of cultivation they are also considered as major cause of farmer’s suicide. To conquer this concern, the maximum exploitation of recently released new desi cotton genotype viz., PA 08, PA 528 by VNMKV, Parbhani can be achieved only after determining their optimum planting densities in comparison to recommended cotton varieties. By keeping in view of above facts, present research work carried out with the objective to find out the effect of High Density Planting System (HDPS) and varieties on growth and yield of desi cotton.
MATERIALS AND METHODS
A field experiment was conducted at Cotton Research Scheme, VNMKV, Parbhani during Kharif season of 2014–15. The topography of experimental field was fairly uniform, leveled and with a good drainage. The soil was clayey in texture with 157.51 kg/ha available nitrogen, 9.68 kg//ha available phosphorus and 466.86 kg/ha available potassium. The soil pH, organic carbon and electrical conductivity were 7.86, 0.70% and 0.48 dS/m, respectively. Geographically Parbhani is situated at 19o16’ North latitude and 76o47’ East longitude and at 409 altitude above sea level in Marathwada division encompassed by 17o35’ to 24o40’ North latitude and 74o49’ to 78o15’ East longitude geographical boundaries. The experiment was laid out in split plot design with four levels of plant densities i.e. 45 x 15, 45 x 22.5, 45 x 30 and 60 x 10 cm2 in main plots and three levels of desi cotton varieties i.e. PA 08, PA 528 and PA 255 in sub plots. The fertilizers were applied as per treatments. Half dose of nitrogen and complete dose of P2O5 and K2O was applied through urea and 10:26:26 fertilizer as basal application. Top dressing of remaining half dose of nitrogen was given after 30 days after sowing through urea by ring method. Biometric observations were recorded as per the standard procedure.
RESULTS AND DISCUSSION
Data on growth and yield of desi cotton as influenced by various treatments are presented in Table 1. At all growth stages, dry matter accumulation, sympodial branches, number of picked bolls and seed cotton yield per plant was considerably higher under wider plant spacing of 45 x 30 cm2 due to better development of individual plant in wider plant spaced crop. The widely spaced plant received optimum microclimate and the beneficial influence on plant development. However, at 60 DAS the influence of different plant densities on number of sympodial branches per plant were not obtained significant (Table 1). Simultaneously, the mean boll weight was not considerably influenced by different plant densities (Fig. 1) as reported by Moola and Giri, 2006. The seed cotton yield (2085 kg/ha) was highest in 45 x 15 cm2 plant spacing compared to wider spacing due to more number of picked bolls per unit area. These above results are in accordance with those obtained by Narayana and Aparna, 2011. At The desi cotton variety PA 528 produced significantly more dry matter accumulation, number of sympodial branches, picked bolls, seed cotton yield per plant and seed cotton yield (kg/ha) at 60 DAS, 90 DAS and harvesting stage as compared to PA 08 and PA 255 (Fig. 1). This was due to high genetic vigour and better utilization of space, light and other inputs.
REFERENCES [1] Moola R and Giri A N 2006.Response of newly released cotton (Goggypium hirsutum) varieties to plant densities and fertilizer levels.Journal of
Cotton Research and Development 20(1):85-86. [2] Narayana E and Aparna D 2011. Performance of cotton varieties (Gossypium arboreum L.) under different spacings and nitrogen levels in black
cotton soils of coastal Andhra Pradesh. Journal ofCotton Research and Development25 (1): 59-62. [3] Patel P, Patel J C, Vyas K G and Salvi D 2016.Effect of hybrids and varying planting time on growth and productivity in cotton (Gossypium
hirsutum L.).The Bioscan, 11(1): 289-291 (Supplement on Agronomy).
It is I
LLEGAL t
o cop
y, pri
nt or
save
any c
onten
t of th
is PDF,
in pa
rt or in
full,
on an
y retr
ieval
syste
m,
withou
t the E
XPRESS WRITTEN PERMISSIO
N of th
e cop
yrigh
t-hold
er

National Conference on Climate Change and Agricultural Production: Adapting Crops to Climate Variability and Uncertainty, 6th–8th April, 2017
[430]
Fig. 1: Yield Contributing Characters of Desi Cotton as Influenced by Different Plant Density and Varieties
Effect of Different Crop Establishment Methods on Performance of Wheat in Rice-Wheat Cropping System
Mona Nagargade*, A. Sen, V. Tyagi and Ekta Kumari Department of Agronomy
Institute of Agricultural Sciences, Banaras Hindu University, Varanasi–221005, India E-mail: *[email protected]
Keywords: Conservation Agriculture, Crop Establishment, Resource Conservation Technologies
INTRODUCTION
In India rice-wheat is the most commonly employed cropping system on around 13.5 million ha of land extending across the Indo-Gangetic Plain (IGP). The major challenge facing the rice-wheat cropping system is to sustain long- term productivity. The area under the RW system is static and the productivity and sustainability of the system are threatened because of the inefficiency of current production practices, shortage of resources such as water and labour, and socio-economic changes (Ladha et al., 2009). Resource-conserving technologies (RCTs) such as ZT, reduced tillage (RT) and unpuddled transplanting have been found to be beneficial in terms of improving soil health, water use, crop productivity and farmers’ income (Singh et al., 2009). Keeping these facts in view an experiment was conducted to investigate the effects of different crop establishment methods on crop performance, and yield of wheat in a rice–wheat system.
MATERIALS AND METHODS
The field experiment was conducted during the kharif and rabi seasons of 2013–2014 at the Institute of Agriculture Sciences, Banaras Hindu University, Varanasi, Uttar Pradesh (India).The experiment was laid out in a randomized complete block design consisting of 8 treatments; Conventional tilled rice (puddled transplanted- Twenty five days old seedling) in kharif―Conventional tilled wheat (broadcasted-tilled) (CE1), Conventional tilled rice (puddled transplanted) in kharif―Reduced till wheat (sown by seed cum fertilizer drill after two tillage by cultivator followed by planking) in rabi (CE2), Conventional till rice (Puddled transplanted) in kharif―Zero-till wheat (sown by single pass of tractor attached with zero till and seed cum fertilizer drill) in
0
5
10
15
20
25
30
45 x 15 45 x 22.5 45 x 30 60 x 10 PA 08 PA 528 PA 255
Seed cotton yield per plant (g) Picked bolls per plant
Boll weight (g)
It is I
LLEGAL t
o cop
y, pri
nt or
save
any c
onten
t of th
is PDF,
in pa
rt or in
full,
on an
y retr
ieval
syste
m,
withou
t the E
XPRESS WRITTEN PERMISSIO
N of th
e cop
yrigh
t-hold
er

National Conference on Climate Change and Agricultural Production: Adapting Crops to Climate Variability and Uncertainty, 6th–8th April, 2017
[431]
rabi (CE3), Reduced till direct seeded rice (sowing was done by Zero-till-drill machine after two tillage operation by cultivator) in kharif―Reduced till wheat in rabi (CE4), Reduced till direct seeded rice in kharif―Zero-till wheat in rabi (CE5), Zero-till direct seeded rice (primary tillage is completely avoided and sowing was done by zero-till- seed cum-fertilizer drill) in kharif―Reduced till wheat in rabi (CE6), Zero-till direct seeded rice in kharif―Zero-till wheat (without residue) in rabi (CE7), Zero-till direct seeded rice in kharif―Zero-till wheat (with residue) in rabi (CE8). Rice was harvested manually after leaving 30 cm anchored crop stubbles in all plots except treatment (CE7), Wheat sowing was done in standing rice stubbles. The number of tillers was counted from one meter square area at three places in each plot and average of it is expressed in terms of number of tillers per meter square area. After shed drying plant samples were put in oven at killing temperature (105 oC for 1 hour), after that temperature of oven was maintained at 65oC until the weight of plant became constant. The mean weight was calculated and expressed as dry matter per square meter (g).
RESULTS AND DISCUSSION
Among different crop establishment methods zero till wheat after conventional tilled puddle transplanted rice recorded maximum number of tillers and dry weight followed by zero till wheat after reduced till DSR. The reason for higher value of growth parameters might be due to early seed emergence, better root growth and more availability of nutrient. Marked variation in the yield of wheat was observed due to different crop establishment methods. The highest grain yield (36.47 q ha-1) was recorded in zero till drill sown wheat after conventional tilled puddle transplanted rice (CE3).The lowest grain yield (28.95q ha-1) was observed in zero till wheat (without residue) after zero till DSR (CE7). CE3 registered 25.98% higher grain yield over CE7.Based on above study it can be concluded that sowing of wheat by zero till drill in puddle transplanted rice field is better in terms of crop growth and yield among different crop establishment methods.
REFERENCES [1] Ladha, J K, Kuma Alam, M M Sharma, S Gathala, M Chandan, P Saharawat, and Balasubramanian, V. 2009. Integrating crop and resource
management technologies for enhanced productivity, profitability and sustainability of the rice-wheat systems in South Asia. In: Integrated crop and resource management in rice-wheat system of south Asia. [Ladha J.K., Singh, Y., Erenstein, O. and Hardy, B. (Eds.). International Rice Research Institute, Los Banos, Philippines, pp.69-108.
[2] Singh, U P, Singh, Y, Kumar, V and Ladha, J K 2009. Evaluation and promotion of resource conserving tillage and crop establishment technique in rice-wheat system of eastern India. In: Integrated crop and resource management in rice-wheat system of south Asia.[Ladha J.K., Singh, Y. Erenstein, O. and Hardy, B. (Eds.)]. International Rice Research Institute, Los Banos, Philippines, pp. 151-176.
Influence of Date of Planting and Varieties on Growth, Yield and Productivity of Potato
C.K. Patel1, S.K. Chongtham2*, R.N. Patel2, J.K. Patel2 and D.M. Zapadiya2 1Potato Research Station, S.D.A.U., Deesa–385535
2Pulse Research Station, S.D.A.U., S.K. Nagar–385506 E-mail: *[email protected]
INTRODUCTION
Potato (Solanum tuberosum L.) has been referred to as “Food Crop of the Future” by Food and Agriculture Organization due to its incredible potential of yielding highest food, energy and protein per unit area and time. Potato, as a cool season crop may be negatively influenced by climate change due to shortening of winter season, especially in sub-tropical regions like India. To mitigate such harmful effect of climate change, shifting of planting date along with suitable varieties may be followed. Keeping above points under
It is I
LLEGAL t
o cop
y, pri
nt or
save
any c
onten
t of th
is PDF,
in pa
rt or in
full,
on an
y retr
ieval
syste
m,
withou
t the E
XPRESS WRITTEN PERMISSIO
N of th
e cop
yrigh
t-hold
er

National Conference on Climate Change and Agricultural Production: Adapting Crops to Climate Variability and Uncertainty, 6th–8th April, 2017
[432]
consideration, the present experiment was planned to study the response of different varieties of potato under different planting times on growth, yield, water use efficiency and economics.
MATERIALS AND METHODS
A field study was conducted at Potato Research Station, SDAU, Deesa (Gujarat) in rabi season for three years (2009–12) to the response of different varieties of potato under different planting times. The experimental site had loamy sand soil with low organic carbon (0.33%), available nitrogen (178.12 kg/ha), medium in available phosphorus (15.20 kg P/ha) and available potassium (235.11 kg K2O/ha). Treatments consisted of twenty combinations of five planting dates namely 20 days earlier, 10 days earlier, optimum planting date, 10 days later and 20 days later along with four potato varieties viz., Kufri Badshah, Kufri Pukhraj, Kufri Chipsona-3 and Kufri Surya, which were laid out in factorial randomized block design and replicated four times. Well sprouted seed tubers of potato at the rate of 3000 kg/ha were planted at different dates as per treatment with spacing of 50 cm x 20 cm, during all years of experimentation. Recommended package of practices were followed for management of potato crop. Grade-wise (0–25 g, 25–50 g, 50–75 g and >75 g grade) tuber yields and total tuber yield per plot were recorded and then converted in terms of t/ha. Net return, water use efficiency and crop productivity were estimated. Three years data were pooled and then subjected to statistical analysis using the software OPSTAT developed by CCSHAU, Hisar.
RESULTS AND DISCUSSION
Tuber yield of potato was significantly influenced by different date of planting (Table 1). Tuber yield of 0-25 g grade increased with delay planting of potato, maximum value being recorded at 20 days later than recommended date. However, in case of tuber yield of grade higher than 25 g, recommended date of planting had higher tuber yield, which was markedly higher than that of 20 days earlier planting. Similar trend was also observed for total tuber yield, in which recommended date of planting registered maximum value which was significantly better than rest of date of planting, except 10 days later treatment. These might be attributed to better plant emergence and growth of potato under recommended and 10 days delay planting.Similar findings were reported by Chun-ling et al. (2014). Maximum values of net return, BCR and net return per day were noted under recommended date of planting, which was statistically at par with 10 days later than recommended date (Table 2). Similar trend was also observed in case of water use efficiency and crop productivity. These could be ascribed to better growth of potato under these treatments, which ultimately resulted in higher tuber yield, net return and efficient utilisation of water.
Among different genotypes, Kufri Pukhraj recorded highest tuber yield of grades 0-25, 25-50 and 50-75 g which was significantly better than rest of genotypes, except Kufri Chipsona 3 which was statistically at par in case of 25-50 g grade tuber yield (Table 1). With regard to >75 g grade and total tuber yield, Kufri Badshah registered highest value which was statistically at par with Kufri Pukhraj but it was significantly better than rest of genotypes. These findings were in line with that of Darabad et al. (2014). Kufri Pukhraj recorded highest net return, BCR and net return per day among different genotypes, which was statistically at par with Kufri Badshah. Similarly, water use efficiency and crop productivity were highest under Kufri Pukhraj, which were significantly better than rest of genotypes, except Kufri Badshah.
So, it can be concluded that at present situation recommended date of planting can be followed for achieving growth, tuber yield and productivity. Also, planting of potato can be delayed by 10 days safely without adversely affecting yield and productivity of potato. Kufri Pukhraj and Kufri Badshah are suitable for this region. So, either Kufri Pukhraj or Kufri Badshah can be grown in this region for better yield and remuneration.
REFERENCES [1] Chung-ling Wang, Shuang-he Shen, Shu-yu Zhang, Qiao-zhen Li, Yu-bi Yao 2014. Adaptation of potato production to climate change by
optimizing sowing date in the Loess Plateau of Central Gansu, China. Journal of Integrative Agriculture 14 (2): 398-409. [2] Darabad, Ghasem Rahimi 2014. Study the relationships between yield and yield components of potato varieties using correlation analysis and
regression analysis and causality. International Journal of Plant, Animal and Environmental Sciences 4 (2): 584-589.
It is I
LLEGAL t
o cop
y, pri
nt or
save
any c
onten
t of th
is PDF,
in pa
rt or in
full,
on an
y retr
ieval
syste
m,
withou
t the E
XPRESS WRITTEN PERMISSIO
N of th
e cop
yrigh
t-hold
er

National Conference on Climate Change and Agricultural Production: Adapting Crops to Climate Variability and Uncertainty, 6th–8th April, 2017
[433]
Table 1: Yields, Net Return, Water Use Efficiency and Crop Productivity of Potato as Affected by Date of Planting and Genotypes
Treatment Tuber Yield (t/ha) Net Return (` x 104)
Water Use Efficiency (kg/ha/mm)
Crop Productivity (kg/ha/day) 0–25 g 25–50 g 50–75 g >75 g Total
20 days earlier 1.46 3.40 5.04 5.32 18.05 1.60 25.79 196.25 10 days earlier 1.51 3.04 6.39 17.21 26.47 6.09 37.81 287.70 Recommended date 1.85 5.70 11.28 18.42 36.09 11.22 51.56 392.29 10 days later 1.88 3.96 11.98 18.23 36.04 11.19 51.49 391.77 20 days later 2.13 4.59 10.64 11.54 28.90 7.38 41.28 314.08 C.D. (P=0.05) 1.46 3.40 5.04 5.32 18.05 2.11 5.65 42.96 Varieites Kufri Badshah 1.71 3.95 9.27 16.16 31.09 8.55 44.04 337.88 Kufri Pukhraj 2.37 4.84 10.59 14.80 32.59 9.35 46.56 354.26 Kufri Chipsona 3 1.74 4.36 9.02 13.90 29.01 7.44 41.45 315.34 Kufri Surya 1.24 3.40 7.39 11.73 23.75 4.64 33.93 258.20 C.D. (P=0.05) 0.34 0.75 1.40 2.23 3.53 1.89 5.05 38.42
Productivity and Economic Feasibility of Rice (Oryza sativa L.)-Wheat (Triticum aestivum L.) Cropping System under Different Rice Establishment Methods and Nutrient Management Practices
A.L. Jat1*, V.K. Srivastava2, S.K. Chongtham3 and S.K. Choudhary4
1Castor, Mustard Research Station, 3Potato Research Station 1,3Sardarkrushinagar Dantiwada Agricultural University, Sardarkrushinagar, Gujarat–385506
2Institute of Agricultural Sciences, Banaras Hindu University, Varanasi–221005 4Bihar Agricultural University, Sabour, Bihar
E-mail: *[email protected]
Keywords: Crop Establishment Methods, Rice Equivalent Yield, System Productivity
INTRODUCTION
Rice (Oryzasativa L.)-wheat (Triticumaestivum L.) cropping system (RWS) is one of the pre-dominant agricultural production systems in the world, occupying 13.5 million hectares of cultivated land in the Indo-Gangetic Plains (IGP) in South Asia. This provides food, income, and employment to ensure livelihood security for millions of rural and urban producers and consumers. An opportunity for area expansion is limited due to finite and often over-exploited natural resources (Timsina and Connor 2001). Accordingly suitable water management to grow more rice is urgently needed to search for alternate methods to reduce water requirement of rice without adversely affecting the yield. However, an exciting approach has been developed called the System of Rice Intensification (SRI) which not only reduces the use of irrigation water, but also increases yields significantly. The optimization of nutrient supply to the crop depends on manures applied to the individual preceding crop and their carry-over effect on the succeeding crop, which is generally ignored while recommending dose of manures or fertilizers to be applied to the next crop. Organic manures play a vital role in sustaining higher productivity in intensive agriculture. Complementary use of organic and biological source of plant nutrient along with chemical fertilizer is of great importance for the maintenance of soil health and productivity. Considering the potential value of organic manure along with fertilizer in rice based cropping systems, an attempt was made to study the productivity and economic feasibility of rice (Oryzasativa L.) – wheat (Triticumaestivum L.) cropping system under different rice establishment methods
It is I
LLEGAL t
o cop
y, pri
nt or
save
any c
onten
t of th
is PDF,
in pa
rt or in
full,
on an
y retr
ieval
syste
m,
withou
t the E
XPRESS WRITTEN PERMISSIO
N of th
e cop
yrigh
t-hold
er
National Conference on Climate Change and Agricultural Production: Adapting Crops to Climate Variability and Uncertainty, 6th–8th April, 2017
[434]
and nutrient management practices with due emphasis on rice-wheat system yield, system productivity and profitability of rice-wheat sequence in northern Gangetic Alluvial plains.
MATERIALS AND METHODS
The field experiment was carried out during kharif and rabi season of 2012–13 and 2013–14 at Agricultural Research Farm of Institute of Agricultural Sciences, Banaras Hindu University, The soil of experimental field have organic carbon, (205.20 and 213.21 kg/ha) available nitrogen, (25.30 and 25.86 kg/ha) phosphorus and (215.60 and 219.80 kg/ha) available potassium before the transplanting of rice during 2012 and 2013, respectively. The treatments consisted of two crop establishment methods (CE1: Normal transplanting and CE2: System of rice intensification) with two hybrids (H1: PHB-71 and H2: Arize-6444) as assigned to main plots. Each main plot were further divided into six sub-plot to accommodate six integrated nitrogen management practices viz., N1: 100% RDF, N2: 125% RDN, N3: 50% RDN + 50% N through FYM, N4: 50% RDN + 50% N through FYM + Azospirillum, N5: 100% N through FYM and N6: Control/No fertilizer were tested in split plot design allocating two crop establishment methods and two hybrids in main plot and six integrated nitrogen management in sub-plot. Treatments were replicated thrice.
RESULTS AND DISCUSSION
Application of 50% RDN + 50% N through FYM + Azospirillum recorded significantly higher grain yield (6942 kg/ha) as compared to rest of the treatments. The magnitude of grain yield increase by 60.20% over control. However, the incorporation of 125% RDN, 100% RDN and 50% RDN + 50% N through FYM were found statistically on par to each other in increasing grain yield over control, respectively. This is might be due to combined application of inorganic fertilizers and organic manure with biofertilizer might have supplied adequate amount of nutrients during reproductive phase bringing about better yield attributing traits and finally higher grain yield of rice. The similar results were also reported by Banayo et al. (2012). System productivity (44.8 and 37.2 kg/ha/day) and profitability (423 and 348 /ha/day) were found significantly higher with SRI planted rice followed by wheat grown as with and without fertilized crop as compared to normal transplanted rice-wheat system. Application of 50% RDN + 50% N through FYM + Azospirillum significantly recorded higher system productivity (48.2 and 40.2 kg/ha/day) and profitability (453 and 374 /ha/day) in terms of rice equivalent yield over rest of nitrogen management treatments. This might be due to more amount of FYM required under sole organically treated plots to supply respective quantity of nitrogen which increased the cost of cultivation. These results were supported by Ranjitha et al. (2013).
REFERENCES [1] Banayo N P M, Cruz P CS, Aguilar E A, Badayos R B and Haefele S M 2012. Evaluation of biofertilizers in irrigated rice: Effects on grain yield at
different fertilizer rates. Agriculture 2: 73-86. [2] Ranjitha P S, Kumar R M and Jayasree G 2013. Evaluation of rice (OryzasativaL.) varieties and hybrids in relation to different nutrient
management practices for yield, nutrient uptake and economics in SRI. Annals of Biological Research4(10): 25-28. [3] Timsina J and Connor D J 2001. Productivity and management of rice-wheat cropping system: issues and challenges. Field Crop
Research 69: 93-132.
It is I
LLEGAL t
o cop
y, pri
nt or
save
any c
onten
t of th
is PDF,
in pa
rt or in
full,
on an
y retr
ieval
syste
m,
withou
t the E
XPRESS WRITTEN PERMISSIO
N of th
e cop
yrigh
t-hold
er

National Conference on Climate Change and Agricultural Production: Adapting Crops to Climate Variability and Uncertainty, 6th–8th April, 2017
[435]
Weed Management of Dry Seeded Rice under Different Crop Establishment Methods
S.K. Chongtham*, R.P. Singh, R.K. Singh, A.L. Jat, J. Lhungdim and S.K. Choudhary Department of Agronomy, Institute of Agricultural Sciences, BHU, Varanasi–221005, India
E-mail: *[email protected]
INTRODUCTION
Globally, rice is the most important crop as it feeds about 70 per cent of the world’s population. However, more than 90 per cent of rice is consumed in Asia, where it is a staple food for a majority of the population (Chauhan, 2012). Transition in crop establishment method of rice from traditional method of transplanting to dry seeding of rice (DSR) has been observed especially in Asian countries as it saves both labour and water that are becoming scarce day by day. Although, establishment of rice by resource conserving techniques like zero till (ZT) and bed planting have the potential to reduce costs and sustain yield, evaluation of their performance across various rice growing regions is necessary in order to check its viability and sustainability. Weeds are the main cause for low productivity in DSR as weeds emerge out simultaneously with rice seedlings under aerobic soil conditions and reportedly reduce yield even up to 100% due to huge weed infestation. Although herbicides are effective yet economical method for weed management, their heavy reliance will cause environmental pollution and development of herbicide resistant weeds. So, it becomes imperative to identify and integrate weed management practices that can minimize the menace of weeds economically under different crop establishment methods. Keeping these points in view, the investigation was carried out to find out the suitable weed management practice and crop establishment method for DSR.
MATERIALS AND METHODS
The present study was carried out during kharif season of 2011 and 2012 at Agricultural Research Farm, Institute of Agricultural Sciences, Banaras Hindu University, Varanasi (U.P.). The experiment was laid out in split-plot design keeping three crop establishment methods viz., conventional planting (thorough ploughing followed by line seeding with kudal), bed planting (thorough land preparation followed by bed preparation of 37 cm width with 30 cm width furrow between two beds and 22 cm height and two lines of rice were sown on each bed by kudal) of and no-till planting (pre-planting glyphosate spray@ 1 kg/ha followed by line seeding of rice) in the main plot and eight weed management practices viz., pendimethalin (pre-emergence) 1 kg/ha, bispyribac-sodium (early post-emergence) 0.025 kg/ha, brown manuring (Sesbania knock down by 2,4-D 0.50 kg/ha at 25 DAS), pendimethalin followed by (fb) brown manuring, pendimethalin fb bispyribac-sodium, pendimethalin fb bispyribac-sodium fb brown manuring, weed free and weedy check in sub-plots during both the years. Rice variety “Sarjoo 52” was sown at the rate of 30 kg/ha on 25th June maintaining 20 cm row-to-row spacing during both the years. For brown manuring, Sesbania was sown in between rows of rice at the rate of 15 kg/ha. Recommended package of practices were followed. Weed parameters at 90 DAS, yield and its attributes and benefit-cost ratio (BCR) were recorded for two years.
RESULTS AND DISCUSSION
Results indicated that bed planting had significantly lowest weed dry weight of all weed species–grasses, sedges and broad leaf weeds among crop establishment methods. Also, no-till method registered markedly lower weed dry matter at 90 DAS than conventional planted DSR. Bed planting of DSR had markedly highest total spikelets/ panicle with higher spikelet sterility % (Table 1). However, influence of crop establishment methods on grain yield was non-significant among various crop establishment methods.
It is I
LLEGAL t
o cop
y, pri
nt or
save
any c
onten
t of th
is PDF,
in pa
rt or in
full,
on an
y retr
ieval
syste
m,
withou
t the E
XPRESS WRITTEN PERMISSIO
N of th
e cop
yrigh
t-hold
er

National Conference on Climate Change and Agricultural Production: Adapting Crops to Climate Variability and Uncertainty, 6th–8th April, 2017
[436]
Choudhury and Singh (2007) observed similar findings. However, no-till method gave highest BCR among crop establishment methods (Table 1) owing to saving in labour, power and capital which reduced overall cost of production, thus leading to maximum net return and BCR.
In general, integrated weed management practices, i.e; application of pendimethalin with either brown manuring/ and bispyribac were more effective in suppression of all weed species at 90 DAS than other weed management practices (Table 1). Highest grassy weed control efficiency was recorded under application of pendimethalin fb brown manuring followed by application of pendimethalin fb bispyribac fb brown manuring. However, significantly lowest dry weight of sedges and BLW were observed under application of pendimethalin fb bispyribac fb brown manuring thus resulting in highest control efficiency of sedges and BLW, which was followed by application of pendimethalin fb brown manuring. Combined application of pendimethalin with either brown manuring or bispyribac and brown manuring significantly enhanced not only total spikelets/ panicle but also higher spikelet sterility % than other weed management practices. Application of pendimethalin fb bispyribac-sodium fb brown manuring had maximum value of grain yield, which was significantly higher than other weed management practices, except pendimethalin fb brown manuring. These results are in accordance with findings of Ravisankar et al. (2008). Higher BCR was recorded under application of pendimethalin fb brown manuring than other weed management practices (Table 1). Also, this treatment gave higher BCR than application of pendimethalin fb bispyribac fb brown manuring due to extra cost of application of bispyribac incurred in the latter treatment. So, it may be concluded that no-till method of crop establishment by application of pre-planting herbicide glyphosate 1 kg/ha for control of perennial and other annual weeds and weed management by pre-emergence application of pendimethalin 1 kg/ha along with brown manuring of Sesbania at 25 DAS by spraying 2,4-D 0.5 kg/ha could be adopted for achieving higher yield and benefit-cost ratio for DSR.
REFERENCES [1] Chauhan Bhagirath S 2012. Weed Ecology and Weed Management Strategies for Dry-Seeded Rice in Asia. Weed Technology26: 1-13. [2] Choudhury B V and Singh A K 2007. Performance of rice (Oryza sativa) planted on raised bed under different soil moisture tensions. Indian
Journal of Agronomy52: 305-310. [3] Ravisankar N, Chandrasekaran, B, Raja, R, Din M. and Chaudhuri S G2008. Influence of integrated weed management practices on
productivity and profitability of wet seeded rice (Oryza sativa). Indian Journal of Agronomy53: 57–61.
Impact of Long-term Intensive Cropping and Fertility Levels on Yield of Crops under Rice-wheat-sorghum Rotation
N.Y. Azmi1*, Seema2, M. Kumar3, R. Kumari4 and M.D. Ojha5 1Department of Soil Science, 2Department of Botany & Plant Physiology
3Department of Ag. Engineering, 4Department of Plant Breeding & Geneticsa 5Department of Horticulture
1,2,3,4,5NCOH, Noorsarai, Nalanda–803113, India E-mail: *[email protected]
Keywords: Intensive Cropping, Fertility Levels, Superimposition, Long-term Experiment
INTRODUCTION
Introduction of high yielding crop varieties in mid-sixties brought a stirring green revolution that remarkably enhanced the agricultural production and made the country self-sufficient in food grain production. With lapses of time, intensive cultivation under exploitive agriculture making use of high analysis NPK fertilizers
It is I
LLEGAL t
o cop
y, pri
nt or
save
any c
onten
t of th
is PDF,
in pa
rt or in
full,
on an
y retr
ieval
syste
m,
withou
t the E
XPRESS WRITTEN PERMISSIO
N of th
e cop
yrigh
t-hold
er

National Conference on Climate Change and Agricultural Production: Adapting Crops to Climate Variability and Uncertainty, 6th–8th April, 2017
[437]
like urea, diammonium phosphate, murate of potash has resulted in nutrientimbalance, deterioration in soil fertility and ultimately declining food grain production for most of the crops. Intensively cultivated soils at various fertility levels in the long run may alter the extent of sulphur status of soil in variable quantity resulting in imbalance in sulphur nutrition of crops (Paliwal and Dixit 1989). The result of long term experiment carried out by AICRP on micro and secondary nutrient and pollutant element in soils and plant, R.A.U., Pusa centre suggested that increasing fertility levels increased the crop yield and with lapses of time the yields are decreasing since inception of experiment (kharif 1985). Keeping these facts in view, the present investigation was carried out with the objective to see long-term effect of intensive cropping and fertility levels on yield of crops under Rice-Wheat-Sorghum Rotation.
MATERIALS AND METHODS
A long–term experiment is being conducted since Kharif 1985 in department of soil science, RAU, Pusa. Initial soil of the experimental plot have pH 8.75, E.C 0.20 dSm-1, organic carbon 0.66 %, available N, P2O5 and K2O205,10.3 and 215.0 Kg ha-1, respectively. Four fertility levels consisting of control, low fertility (50% of the recommended NPK), medium fertility (100% of the recommended NPK), high fertility (150% of the recommended NPK) were replicated six times in a Randomized Block design for rice cv. Rajshree-wheat cv. HP 1102-sorghum cv. Local, along with one dummy replication. The sources of NPK were urea, SSP and murate of potash respectively. The recommended N: P2O5: K2O for rice / wheat and sorghum were 100: 50: 50 and 60: 50: 30 respectively. After 10 complete cycles of rotations i.e. 30th crop, all treatments under different replications were superimposed with sub treatments like R1 (10 Kg Zn ha-1), R2 ( 10 Kg Zn + 2 Kg B + 40 Kg S ha-1), R3 ( 100 q FYM ha-1 ), R4 ( ( 100 q FYM + 10 Kg Zn + 2 Kg B + 40 Kg S ha-1 ) and R5 and R6 were kept as such. Yield of crops of 13th cycle of rotation in sequence was recorded under present investigation.
RESULTS AND DISCUSSION
Increasing fertility levels significantly increased grain and straw yield of rice from 12 to 45 and 18 to 72 q ha-, respectively. In case of wheat also, increasing fertility levels significantly increased grain and straw yield from 5 to 22 and 16 to 49 q ha-1, respectively. 39th crop sorghum also produced similar trend with increasing fertility levels where dry forage yield increased continuously from 19 to 66 q ha-1. Increasing fertility level significantly influenced the yield of all the crops and the highest yield was recorded at high fertility level i.e. 150% of the recommended NPK dose. The grain and straw yields as influenced by different treatment combinations varied from 11 to 50 and 15 to 76 q ha-1, respectively for 37th crop rice and 5-26 and 14 to 51 q ha-1 respectively for 38th crop wheat. Similarly the dry matter yield of 39th crop sorghum ranged between 16-71 q ha-1.The yield response in case of rice increased continuously with increasing fertility levels, where straw produced higher magnitude of yield response as compared to grain at all fertility levels. Yield response was more for straw as compared to grain for wheat also. Yield response of sorghum due to varying fertility levels was comparable with that of wheat straw, however, rice straw produced higher yield response as compared to wheat and sorghum. The residual effect of superimposed treatments did not have much impact on the yield of 37th crop rice, however, a slight increase in yield due to organic matter + Zn application was recorded. The effect of these treatments was more marked at highest fertility level. In case of wheat, although, the overall effect of superimposed treatments were not apparent, however, at highest fertility, organic matter + Zn application increased the yield to the extent of 4 q ha-1. The annual report of micronutrient scheme Sakal et al., 1995-97) suggested from the same experiment that with lapses of time there was decrease in yield of crops at all fertility levels which could be maintained with superimposition of treatments like Zn alone or along with organic manure. Kundu and Pillai (1992) reported that the annual use of 10-15 t ha-1 FYM in combination with recommended dose of chemical fertilizers considerably increased the production of rice based cropping system without any marked change in nutrient balance.
It is I
LLEGAL t
o cop
y, pri
nt or
save
any c
onten
t of th
is PDF,
in pa
rt or in
full,
on an
y retr
ieval
syste
m,
withou
t the E
XPRESS WRITTEN PERMISSIO
N of th
e cop
yrigh
t-hold
er

National Conference on Climate Change and Agricultural Production: Adapting Crops to Climate Variability and Uncertainty, 6th–8th April, 2017
[438]
REFERENCES [1] Kundu D K and Pillai K G 1992. Integrated nutrient supply system in rice and rice-based cropping systems. Fertilizer News37:35-41. [2] Paliwal A K and Dixit P R 1989. P and S availability and their uptake as influenced by N and S application. Oryza24:105-111. [3] Sakal R, Singh A P, Sinha R B and Bhogal N S 1995-97. Annual Progress report on “All India Coordinated Scheme of Micro and Secondary
Nutrient and Pollutant element in soil and plants (ICAR )”, RAU, Pusa.
Enhancement of Production and Economic efficiency Through Intercropping of Winter Vegetables in Mango Mother
Orchard under Changing Climate
Sangeeta Kumari*, Shivnath Das, Ruby Saha and R.N. Singh Agricultural Research Institute, Lohiya Nagar, Patna, India
E-mail: *[email protected]
Keywords: Intercropping, Vegetables, Mango Mother Orchard, Production and Economic-efficiency
INTRODUCTION
Pruned mango trees make the orchard space open with greater availability of sunlight. Intercropping of winter vegetables in mango mother orchard act as an insurance against failure of crops under adverse condition and gives additional income, reduced soil run off, utilize resources efficiently and maintain the soil fertility and nutrient uptake from different layer of soils depending upon the root growth of different crops (Swain,2016). Selection of suitable intercrops in mother orchard is essential to increase production from main crop by grafting as well as from the intercrops by production. However, no proper study is made on the production and economic efficiency of intercropping in mango mother orchard of agro-climate Zone IIIB of Bihar. Thus, present study entitled “Enhancement of production and economic efficiency through intercropping of winter vegetables in mango mother orchard” has been carried out.
MATERIALS AND METHODS
A field experiment was conducted on30 years old mango mother orchard in clay loamy soil during rabi 2014-15 and 2015-16 at at Agricultural Research Institute, Patna which enjoy sub-tropical climatic condition. The experiment was comprising of eight treatments (table 1)with three replications in randomized block design. The intercrop vegetables were planted during October–November in the interspaces of four mango plants leaving 3 metre away from each tree and the plot size being 3x3 square metre. Uniform cultural operations were adopted (table 1).
Table 1: Agrotechniques Adopted for Intercropped Vegetables in Mango Mother Orchard Treatments Crop Spacing (cm) Seed Rate (kg/ ha) Crop Duration (Days) NPK (Kg/ha)
T1 Garlic(local variety) 15×10 400 120 120:80:80 T2 Pea(Azad P-1) 30×10 45 120 40:60:60 T3 Carrot(PusaKesar) 25×10 1.50 120 120:60:60 T4 Palak(All Green) 30×10 08 90 80:40:40 T5 Coriander(Pant Haritima) 30×20 10 90 120:80:80 T6 Onion(Patna Red) 15×10 08 120 60:20:20 T7 Radish(Snow White) 25×10 08 80 120:80:80 T8 French bean(p-44) 30×15 80 120 150:60:80
RESULTS AND DISCUSSION
Production efficiency indicates per day productivity of the crop under a particular treatment. Among different treatments (Table 2), intercropping of palak in mango mother orchard reflected highest crop yield (199.33
It is I
LLEGAL t
o cop
y, pri
nt or
save
any c
onten
t of th
is PDF,
in pa
rt or in
full,
on an
y retr
ieval
syste
m,
withou
t the E
XPRESS WRITTEN PERMISSIO
N of th
e cop
yrigh
t-hold
er

National Conference on Climate Change and Agricultural Production: Adapting Crops to Climate Variability and Uncertainty, 6th–8th April, 2017
[439]
q/ha) due to larger and more number of leaf. But intercropping of radish registered maximum production efficiency (235.00 kg/ha/day) owing to shorter crop duration period. However, garlic equivalent yield was highest (161.05 q/ha) when onion was intercropped in mother orchard. This might be due to better conducive soil and micro climatic environment as a result of least competition stress for moisture, nutrients, space and solar radiation faced by onion intercropping in mango mother orchard. Similarly, intercropping of onion had appreciably higher net return and economic efficiency (306484 Rs ha-1 and 2554.03 Rs. ha-1day-1) as compared to rest of the treatments. This was due to higher equivalent yield of onion as intercrop than other winter vegetables. Among all the treatments (Table 2), intercropping of onion reflected higher partial factor Productivity of N (319.06 kg yield/kg N applied)because of lower requirement of nitrogen and higher yield of crop. However, lower PFP of N was observed under treatments where French bean was intercropped in mother orchard (33.70 kg yield/kg N applied). This was due to higher requirement of nitrogen and lower yield of crop. Based on two years experimentation it may be concluded that intercropping of onion (CV Patna red) in mango mother orchard is suitable for higher production and economic efficiency along with maximum nutrient use efficiency in agro-climate Zone IIIB of Bihar.
Table 2: Production and Economic Efficiency as Influenced by Intercropping of Winter Vegetables Inmango Mother Orchard
Treatments Yield of Component Crop (q/ha)
Garlic Equivalent Yield (q/ha)
Production Efficiency (kg/
ha/day)
Net Income (Rs/ha)
Economic Efficiency
(Rs/ha/Day)
Partial Factor Productivity of Nitrogen (kg Yield/kg N Applied)
T1 65.33 65.33 54.44 179924 1499.36 54.44 T2 55.67 100.12 46.39 76604 638.36 139.17 T3 62.33 111.99 51.94 124814 1040.11 51.94 T4 199.33 115.16 221.47 142408 1582.31 249.16 T5 49.22 102.24 54.68 92757 1030.63 41.01 T6 191.44 161.05 159.53 306484 2554.03 319.06 T7 188.00 112.33 235.00 61435 767.93 156.66 T8 50.56 128.53 42.13 148383 1236.52 33.70 SEm(±) 1.73 - - - - - CD (5%) 5.80 - - - - -
REFERENCE [1] Swain S, Das S, Nayak K and Mallikarjun. 2016. Evaluating Performance of Root Vegetables and Spices in Association with Banana (Musa
Spp.) under Coastal Plain Zone of Odisha. International Journal of Research in Agriculture and Forestry.3 (3): 8-12
Pre-Treatments Maintain the Quality of Banana Flakes
Md. Shamsher Ahmad1*, M.W. Siddiqui1, J.P. Singh1, M.A. Aftab1 and Md. Abu Nayyer2 1Department of Food Science and Postharvest Technology 2Department of Horticulture, (Fruit and Fruit Technology)
1,2BAC, Sabour–813210, India E-mail: *[email protected], [email protected]
Keywords: Pre Treatments, Banana Flakes, Non Enzymatic Browning
INTRODUCTION
Drying and dehydration is the easiest way to preserve the quality and reduce postharvest losses. Drying banana into chips requires suitable varieties and sophisticated equipments with technical knowhow. However, drying banana into flakes is easy and also requires less equipment. Non enzymatic browning is a major problem in preparation of dehydrated products including banana flakes. Pre-treatments before drying have been reported by many workers to reduce browning during drying and storage. Pre-treatments with
It is I
LLEGAL t
o cop
y, pri
nt or
save
any c
onten
t of th
is PDF,
in pa
rt or in
full,
on an
y retr
ieval
syste
m,
withou
t the E
XPRESS WRITTEN PERMISSIO
N of th
e cop
yrigh
t-hold
er

National Conference on Climate Change and Agricultural Production: Adapting Crops to Climate Variability and Uncertainty, 6th–8th April, 2017
[440]
ascorbic acid and citric acid have been well studied as anti browning agents (Zhu, Pan, & McHugh, 2007). Pre treatments of banana chips before drying have been studied (Ayimet al. 2012). However, there is no or very little work has been studied on pre-treatments of banana flakes before drying. The objective of this study is to investigate the effects of pre treatments as anti browning agent for preparation of quality banana flakes.
MATERIALS AND METHODS
The study was conducted at Bihar Agricultural University, Sabour during 2013-14. Banana flakes were prepared from different cooking and table banana cultivars like G-9, Kothiya, Alpan and Harichal and were subjected to different pre-treatments with citric acid, potassium meta bisulphite, salt and turmeric powder. Approximately 1 kg of banana flakes was taken for each treatment and treated in aqueous solution using distilled water. Treated samples were kept on a stainless steel (ss) wire mess for 8-10 minutes to drain out excess water before putting inside the dehydrator for drying at 64±20C. The experiment was designed in a complete randomized design (CRD) with 3 replicates for each treatment. Analysis of variance (ANOVA) and the test of mean comparison were calculated according to Tukey’s test with the level of significance of 0.05. The statistical software, SAS System for windows, version 9.0 (SAS institute, Cary, NC), was used for the analysis. Descriptive statistics was done on sensory attributes and the means were compared using the Tukey’s test (P<0.05).
RESULTS AND DISCUSSION
The flakes were evaluated for moisture content, non enzymatic browning and sensory (color, texture and flavour) quality attributes during storage. Pre treatments prior to drying decreased the incidence of browning of finished products as compared to control. Pre treatments such as T2 (citric acid 1% + 0.5% haldi +1% salt) and T3 (citric acid 1% + KMS 0.5%) were the most effective to reduce browning and resulted high quality banana flakes. This might be due to anti browning activity and anti oxidant activity of KMS and Citric acid. Sulfite is widely used as a food preservative to inhibit oxidation either by oxygen (in air) or enzymes (Isaac et al., 2006). The best quality flakes were obtained against the treatment T2 (CA 1% + 0.5% haldi +1% salt). The overall acceptance score for the bananas from the treatment T2 was significantly higher than that of other treatments and control fruits but at par with T3 (CA 1% + KMS 0.5%). From the results, it is suggested that quality banana flakes could be prepared from all the varieties using theses pre-treatments (T2 and T3).
REFERENCES [1] Ayim I, Amankwah E A and Dzisi K A 2012.Effect of pretreatment and temperature on the air drying of French and False horn plantain
slices.Journal of Animal & Plant Sciences13 (2) : 1771-1780. [2] Isaac A, Livingstone C,Wain A J,Compton R G and Davis J 2006.Electroanalytical methods for the determination of sulfite in food and
beverages.Trends Analytical Chemistry25: 589–598. [3] Zhu Y, Pan Zand McHugh T H 2007.Effect of dipping treatments on color stabilization and texture of apple cubes.Journal of Food Processing
and Preservation31: 632-648.
It is I
LLEGAL t
o cop
y, pri
nt or
save
any c
onten
t of th
is PDF,
in pa
rt or in
full,
on an
y retr
ieval
syste
m,
withou
t the E
XPRESS WRITTEN PERMISSIO
N of th
e cop
yrigh
t-hold
er

National Conference on Climate Change and Agricultural Production: Adapting Crops to Climate Variability and Uncertainty, 6th–8th April, 2017
[441]
Spatial Distribution of Prosopis juliflora Using the Fusion of Hyperspectral and Landsat OLI Imagery
M. Vigneshkumar and Kiran Yarrakula Vellore Institute of Technology, VIT University, Vellore–632014, India
E-mail: *[email protected]
Keywords: Landsat-8 OLI, Hyperion, Principle Components Spectral Sharpening, Prosopis Juliflora
INTRODUCTION
Prosopis juliflora is a shrub or small tree in the family Fabaceae and it is very dangerous to environment. It affects the growth of neighborhood vegetation, absorbs groundwater, surface water and wetness of air, affecting the human, animals health and etc. In the present research, Hyperion and Landsat OLI have been taken for analysis. Ottapidaram block of Tuticorin district of Tamilnadu is selected to identify Prosopis juliflora. The spectral reflectance of the tree leaf is characterized using ASD spectroradiometer. The chemical composition of the leaf particles are identified using the scanning electron microscope (SEM) with EDXS method. In both imageries visible and VNIR bands are taken to classify the tree precisely. The objectives of the study is to identify the chemical composition of Prosopis luliflora using SEM and EDXS instrument, to obtain the field spectrum of Prosopis juliflora using ASD spectroradiometer. and to extract the Prosopis Juliflora using spectral angle mapper (SAM) classification.
MATERIALS AND METHODS
In the Ottapidaram area Prosopis juliflora samples are collected using GPS. The oxygen absorption capacity and the structure of the leaf are identified using the SEM and EDXS instrument. Prosopis Juliflora field spectrum characterized using ASD Spectroradiometer. The Landsat OLI (Jan, 2017) and Hyperion (Dec, 2016) imagery are downloaded from USGS. The radiance of both imageries is carried out in BIL format. The absolute reflectance of both imageries is calculated using FLAASH atmospheric correction module. The fusion of both imageries is performed using the PC spectral sharpening. The dimensional reduction techniques of fusion imagery are carried out using Minimum Noise Fraction (MNF) and Pixel Purity index (PPI). The end members are selected using the methods of SAM, SFF and BE. Finally Prosopis Juliflora in the fusion image is classified using SAM classification method.
RESULTS AND DISCUSSION
In the P.juliflora leaf structure gives huge reflectance in the wavelength region of visible and VNIR region and chemical composition is identified using SEM and these are O-91.3%, Cl-4.16%, and K-4.51%. The classified results showed good correlation between field spectra and end members of Prosopis Juliflora. The present study concluded that hyperspectral data is a powerful tool to extract different vegetative species and it can be used to monitor crop scenario.
It is I
LLEGAL t
o cop
y, pri
nt or
save
any c
onten
t of th
is PDF,
in pa
rt or in
full,
on an
y retr
ieval
syste
m,
withou
t the E
XPRESS WRITTEN PERMISSIO
N of th
e cop
yrigh
t-hold
er

National Conference on Climate Change and Agricultural Production: Adapting Crops to Climate Variability and Uncertainty, 6th–8th April, 2017
[442]
Fig. 1: SEM and EDXS analysis of Prosopis juliflora
Fig. 2: Spectral Reflectance of Prosopis juliflora and SAM Classification Result of juliflora
It is I
LLEGAL t
o cop
y, pri
nt or
save
any c
onten
t of th
is PDF,
in pa
rt or in
full,
on an
y retr
ieval
syste
m,
withou
t the E
XPRESS WRITTEN PERMISSIO
N of th
e cop
yrigh
t-hold
er

National Conference on Climate Change and Agricultural Production: Adapting Crops to Climate Variability and Uncertainty, 6th–8th April, 2017
[443]
Enhancing Production of Bio Potato through Low Cost Tuberlet Technology in Changing Climatic Scenario of Bihar
Sima Sinha1*, Anand Kumar1, Kumari Rajani2 and Shambhu Kumar3 1Department of Plant Breeding and Genetics, 2Dept. of Seed Science and Technology
1,2Bihar Agricultural University, Sabour, Bhagalpur–813210, India 3Central Potato Research Station, Patna–801506, India
E-mail: *[email protected]
INTRODUCTION
Increasing climate variability with the change in climate is recognized globally. With the changing climate patterns and cropping systems, host, pathogen and favorable environment interactions are leading to diseases epidemics in cereals, horticultural and pulse crops. Bihar with a geographical area of about 94.2 thousand square km is divided into four different agro climatic zones based on soil characterization, rainfall, temperature and different climatic scenario. There is need to introduce some new technologies in this area which can sustain this changing climatic scenario. Potato (Solanum tuberosum L.) being a highly productive crop can play a significant role in ensuring food security as well as sustaining in the changing climatic condition, as it produces more dry matter per unit area and time than the major cereal crops. TPS technology, the main aim of the research was to popularize this technology among the farmers by conducting on-farm trial and making aware to farmers with this technology.
MATERIALS AND METHODS
The trial was conducted in the 2012 at Supaul, 2013 at Madhepura and 2014 at Banka districts of Bihar through Krishi Vigyan Kendra under the jurisdiction of Bihar Agricultural University, Sabour, Bhagalpur with a broad objective to create awareness and to popularize the bio potato as well as low cost TPS technology among farmers. Three technology interventions were introduced in the adopted village. Seed of tubers and tuberlet were equally distributed among ten farmers as three technology interventions at every location. Each farmer planted tuber of HYV, tuberlet and tuber of local races as farmer’s variety in 0.10 ha area. Four villages from the block were selected on the basis of maximum area under potato. A sample of 10 potato growers were identified by applying random sampling techniques in each selected village. Thus the total study sample selected was 80 farmers. Seed treatment was ensured with Bavistin (fungicide) @2g/kg seed for half an hour prior to sowing.
RESULTS AND DISCUSSION
Out of three technology interventions, adoption of TPS (Tuberlet) intervention was superior over other two technology interventions. Potato crop from TPS (tuberlet) was cheaper than the crop grown with tuber crop. The crop raised from the transplanted seedling was the cheapest but it required a lot of labour and skill for raising the crop. However, did not require additional manpower or special skill in case of tuberlet. Therefore, it could be easily adopted by farmer as low cost technology. In addition to that, the seed tubers are fresh, heavy, bulky and expensive to transport over long distances. The fresh tubers get destroyed easily, sprout too early thereby leading to losses or they may sprout poorly, leading to low yields; as a result, quality seed tubers are not available or the price is too high. This technology has immediate relevance in areas where
It is I
LLEGAL t
o cop
y, pri
nt or
save
any c
onten
t of th
is PDF,
in pa
rt or in
full,
on an
y retr
ieval
syste
m,
withou
t the E
XPRESS WRITTEN PERMISSIO
N of th
e cop
yrigh
t-hold
er

National Conference on Climate Change and Agricultural Production: Adapting Crops to Climate Variability and Uncertainty, 6th–8th April, 2017
[444]
good quality seed is either not available and where seed degeneration is fast and hence needs frequent replacement. It is suggested that in every adopted area some progressive growers may be identified to produce and sell tuberlets for potato production. The technology has immense relevance in areas where good quality seed is either not available and where seed degeneration is fast and hence needs frequent replacement. As Bio potato is disease free, tuberlet may be a low cost alternative for potato production in different agro climatic conditions of Bihar.
Table 1: Performance of Tuberlet, HYV and Local Check of Potato for Yield Attributing Characters Observations Supaul (2012) Madhepura(2013) Banka(2014)
1 2 3 1 2 3 1 2 3 Germination % 97.6 92.9 81.2 94.2 90.5 79.8 96.7 89 80.3 Late Blight incidence % 5 22 80 5 25 82 3 20 75 No. of tuber per plant 13 11 8 12 11 8 13 10 9 Wt. of tuber per plant 344 321 202 326 308 215 336 317 182 Yield per hectare 285.4 276.3 211 288 272.4 206 282.6 275.6 204.2 BC Ratio 4.9 3.36 2.57 4.570 3.25 2.43 4.3 3.21 2.35 CD(p=0.05) 1.80 2.22 2.15
Where 1-Tuberlet, 2-High Yielding Varieties (Kufri Kanchan) 3-Local check
REFERENCES [1] Gopal J, Kumar V and Thakurl SS 2004. Hybrid and open-pollinated true potato seed production: some considerations, Potato Journal31 (1-2):
13-20. [2] Thakur K C, Upadhaya and MS Kadian 1988. Potato Production from TPS tuberlets in Hooghly districts of west Bengal. Journal of Indian
Potato Association15:131-133.
Demonstration of TPS (True Potato Seed) Technology for Standardization and Popularization among Farmers of Bihar
S.K. Varshney1, Birender Singh2*, R.N. Singh3 and S.K. Gupta4
1Dr. Rajendra Prasad Central Agricultural University, Pusa, Samastipur–848125, India 2Department of Plant Breeding & Genetics, 3Directorate of Extension Education
4Department of Agronomy 2,3,4Bihar Agricultural University, Sabour–813210, India
E-mail: *[email protected]
Keywords: TPS, Potato, Suitable–Technology, Tuber Lets, Demonstration
INTRODUCTION
Bihar is the major potato producing state after UP and West Bengal. Though the conditions of state are conducive for potato cultivation, the productivity of potato in Bihar is very low compared to other state like UP and West Bengal, because of non-availability of good quality seeds at affordable price (Gopal et al. 2001) and cultivation with low input under alkaline saline soils. Potato is traditionally grown vegetative through seed tuber, generally through own saved seed potato by the farmers. This resulted in accumulation of various tuber bore diseases in seed tubers and consequents reduction in tuber yields (Khurana, 1999). Alternate technology of potato production through TPS has been found suitable for adoption in most potato growing areas of the country including Bihar (Gupta et al. 2004 and Kumar and Eradasappa, 2010). Keeping in view
It is I
LLEGAL t
o cop
y, pri
nt or
save
any c
onten
t of th
is PDF,
in pa
rt or in
full,
on an
y retr
ieval
syste
m,
withou
t the E
XPRESS WRITTEN PERMISSIO
N of th
e cop
yrigh
t-hold
er

National Conference on Climate Change and Agricultural Production: Adapting Crops to Climate Variability and Uncertainty, 6th–8th April, 2017
[445]
the advantage of TPS (True Potato Seed Technology) technology the experiments were conducted on farmers’ fields and experimental plot to find out its suitability and its popularization among farmers.
MATERIAL AND METHODS
Four experiments were conducted with the use of selected TPS varieties at Tirhut College of Agriculture, Dholi (RAU Pusa, Bihar), Research farm and farmers’ fields. The main objective of first experiment was to find out suitable date of transplanting with varieties TPS C–3 and HPS 1/13, second to find out requirement of nutrients for TPS transplanted crops with variety 92-PT-27, third experiments was conducted with the different TPS seedling tubers of the above three varieties to find out the suitable seedling tuber size and the fourth experiment was conducted in farmers field. The TPS seed of 92-PT–27 was given to farmers of different villages of Bihar for conducting the demonstration to standardize and popularized the cultivations through TPS varieties. All experiments were conducted in RBD.
RESULTS AND DISCUSSION
The experiments were conducted on experimental research plot and farmer’s field with selected TPS population to popularize and standardize the TPS technology during 2000-01 to 2003-04. The seedling survival at harvest in farmer’s field varied from 50.00 per cent to 63.00 per cent. Total tuber yield (q/ha) varied from 90.50 to 128.00 q/ha. Early transplanting by second week of November was found most suitable for superior TPS transplanting. Application of N-100kg, K2O-100kg and Mustard Cake 10 q per ha in seedling transplanted crop was found most profitable. The seedling tuber size of 10-20 gram gave equal tuber yield as compared to normal seed potato size (30-40 g). As the tuber yield from TPS seedling transplanted crop is poor in alkaline-saline soils of North Bihar, farmers are very much interested to transplant TPS seedling in small area to get good quality seedling tubers potato for ware production in next year. Therefore, this may bridge the gap of availability of good quality seed tubers in the Bihar.
REFERENCES [1] Gopal Jai, Vinod Kumar and Thakur, S S 2001. Evaluation of potato Germplasm for their important in true potato seed product. Journal of
Indian Potato Association. 28:11-12. [2] Gupta V K, Thakur K C, Shambhu Kumar, Pandey S K and Sah, Uma 2004. True Potato Seed–An alternative technology for potato production
in North Eastern Hill Region. Technical Bulletin No.64. Central Potato Research Institute, Shimla. PP 16-18. [3] Kumar S and Eradasappa E 2010. Production & distribution of true potato seed of hybrids 92-PT-27. In: National conference of production of
quality seed & planting material health management in horticulture crops. Abstracts.11-14 March 2010, NARS Complex, New Delhi PP48.
It is I
LLEGAL t
o cop
y, pri
nt or
save
any c
onten
t of th
is PDF,
in pa
rt or in
full,
on an
y retr
ieval
syste
m,
withou
t the E
XPRESS WRITTEN PERMISSIO
N of th
e cop
yrigh
t-hold
er

National Conference on Climate Change and Agricultural Production: Adapting Crops to Climate Variability and Uncertainty, 6th–8th April, 2017
[446]
Effect of Various Growing Media on Seed Germination and Seedling Growth of Khayasenegalensis (Desr.) A. Juss.
R.L. Sondarva*, V.M. Prajapati, N.D. Mehta, J.B. Bhusara and B.K. Bhatt ASPEE College of Horticulture & Forestry,
Navsari Agricultural University, Navsari–396450, India E-mail: *[email protected]
Keywords: African Mahogany, Germination, Growing Media, Growth, Seedling
INTRODUCTION
Khayasenegalensis is a medium sized tree which can grow between 15 and 30 meters in height and 1 meter in diameter. Presently the tree is used more locally and is planted ornamentally as a roadside tree. K. galensis was exported from West Africa (Gambia) to Europe since the first half of the 19th century and has been exploited heavily for its timber. This tree is found suitable for salty and saline soil, however, for this,we have to develop suitable nursery techniques for raising seedlings and test the performance of the seedlings in the field. Therefore, the present study was done with objective to find out suitable growing media for seedling growth of African mahogany.
MATERIALS AND METHODS
The present investigation was carried out in the green house complex, ASPEE College of Horticulture and Forestry, Navsari Agricultural University Navsari, Gujarat July to October 2013.Tentreatments combinations viz.,T1-Coco peat + Red Soil (1:1), T2-Rice husk + Red Soil (1:1), T3-Perlite + Red Soil (1:1), T4-Vermiculite + Red Soil (1:1), T5-Sand + Red soil + FYM (1:1:1), T6-Castor Cake + Red Soil (1:1), T7-Neem Cake +Red Soil (1:1), T8-Sugarcane press mud + Red Soil (1:1), T9-Vermicompost + Red Soil (1:1), T10-Red Soil (Control) were used to investigate the germination and growth of African mahogany. The data generated were subjected to statistical analysis using variance technique.
RESULTS AND DISCUSSION
Among all growing media, significantly maximum shoot length (56.42 cm), seedling survival (83.09 %), collar diameter (1.13 cm), root length (23.40 cm), dry weight of plant (8.95 g), dry weight of shoot (6.77 g), dry weight of root (2.13 g) was recorded maximum growing media Vermicompost + Red Soil (1:1) followed by Sand + Red Soil + FYM (1:1:1).These results are in line with earlier findings of Daldoum et al. (2013) in Acacia nilotica, Acacia seyal, Acacia senegal and Acacia tortilis. The findings, it is concluded that, among various growing media seeds grown in Vermicompost + Red Soil @ 1:1 performed better. From the above findings, it can be concluded that, among various growing media seeds grown in Vermicompost + Red Soil @ 1:1 performed better with respect to shoot length, collar diameter, number of leaves and seedling survival at monthly interval, root length, fresh and dry weight of shoot, root and plant with earlier germination.
It is I
LLEGAL t
o cop
y, pri
nt or
save
any c
onten
t of th
is PDF,
in pa
rt or in
full,
on an
y retr
ieval
syste
m,
withou
t the E
XPRESS WRITTEN PERMISSIO
N of th
e cop
yrigh
t-hold
er

National Conference on Climate Change and Agricultural Production: Adapting Crops to Climate Variability and Uncertainty, 6th–8th April, 2017
[447]
Table 1: Influence of Various Growing Media Ongermination and Growth of Khayasenegalensis (African mahogany)
Treatments Days Taken to Germination
Growth Performance (4 Months DAS) Shoot Length
(cm) Seedling
Survival (%) Collar Diameter
(cm) Root Length
(cm) Dry Weight of
Plant (g) T 1 10 . 17 50.58 55.86 0.84 20.10 4.83 T 2 12 . 33 48.59 51.84 0.74 18.13 3.63 T 3 10 . 67 50.08 55.98 0.77 20.03 4.43 T 4 11 . 34 49.64 64.77 0.69 19.03 3.96 T 5 7 .6 7 53.11 81.05 0.93 21.43 7.53 T 6 9 .5 0 51.87 67.30 0.88 20.67 6.20 T 7 8 .6 7 52.71 72.85 0.91 21.23 6.60 T 8 10 . 00 50.47 70.69 0.86 20.27 5.73 T 9 7 .5 8 56.42 83.09 1.13 23.40 8.95 T 1 0 13 . 33 47.33 59.49 0.62 16.13 3.08 CD( p= 0. 05) 0 .8 7 1.83 3.53 0 .0 8 2 .1 3 0 .1 2
T1: Coco peat + Red Soil (1:1); T2 :Rice husk + Red Soil (1:1); T3 :Perlite + Red Soil (1:1); T4 :Vermiculite + Red Soil (1:1); T5 :Sand + Red Soil + FYM (1:1:1); T6 :Castor Cake + Red Soil (1:1); T7 :Neem Cake + Red Soil (1:1); T8 :Sugarcane pressmud + Red Soil (1:1); T9 :Vermicompost + Red Soil (1:1); T10 :Red Soil (Control)
REFERENCE [1] Daldoum M A, Daldoum and Hakim AA 2013. Growth performance of four acacia tree seedlings raised in silt soil amended with compost.
Jonares1:23-28.
Impact of Nutrient Management Technologies, Soil Biomass and Enzymatic Activities in Transplanted Rice (Oryza sativa L.) under
Irrigated Domains of Eastern Plain Zone in India
Ajay Babu, Y.V. Singh, Maneesh Verma, Akhila Nand Dubey* and S.S.S. Yadav Department of Soil Science and Agricultural Chemistry
Banaras Hindu University Varanais–221005, India E-mail: *[email protected]
Keywords: Soil Test Crop Response, Yield Response, Net Return, SMBC, SMBP
INTRODUCTION
Rice is an important staple food that provides 60-70% of body calorie intake of the consumers. To assess food security in rice consuming country of the world, rice production should be increased by 50% in this country by 2025. Nutrients available in soil are rarely present in adequate amount and in balanced proportion to meet the nutrient requirement of the crops. Soil test provides the actual information about the amounts of nutrients available in the soil and their imbalance, while fertilizer recommendation aims at correcting the imbalances of nutrients according to crop requirement. Soil microbial population are the driving force behind regulating soil processes such as organic matter decomposition and nutrient cycling, it is imperative to have a better understanding of the factors that regulate its size, activity, and structure (Masto et al., 2006).
Soil microorganisms play a crucial role in ecosystem functions such as organic matter decomposition, nutrient cycling, transformation, mineralization etc. Soil microbial biomass is an important ecological indicator and acts as a source and sink of available nutrient for plant growth. It is supposed to be an integral part of
It is I
LLEGAL t
o cop
y, pri
nt or
save
any c
onten
t of th
is PDF,
in pa
rt or in
full,
on an
y retr
ieval
syste
m,
withou
t the E
XPRESS WRITTEN PERMISSIO
N of th
e cop
yrigh
t-hold
er

National Conference on Climate Change and Agricultural Production: Adapting Crops to Climate Variability and Uncertainty, 6th–8th April, 2017
[448]
decomposer subsystem. It also provides information regarding the organic matter decomposition, nutrient cycling, soil fertility restoration and development of ecosystem function in tropical abandoned agro ecosystems. Little change in soil microbial biomass affects directly on ecosystem stability and fertility of soil. In addition, the soil microbial biomass in soil system responds more quickly to management practices than organic matter and is often used as an indicator of soil quality and health (Ge et al., 2010).
MATERIALS AND METHODS
The experiment was conducted during kharif season of 2016 in farmer field at location Raimalpur-Village, Varanasi-District. The trial was laid out in Randomized Complete BlockDesign (RCBD) with seven treatments and three replication at farmer’s field (520 m2) location during the study period. Initial soil samples were collected from each location and analyzed for pH was determined in1:2.5soil-water suspension by potentiometer method. Electrical conductivity was determined extract using Conductivity Bridge and expressed as dSm-1, organic carbon, alkalineKMnO4-N, Olsen-P, NH4OAc-K, Soil biomass C, N, P Fumigation method, Urease activity Colorimeter method, Alkaline Phosphatase activity Colorimeter method and Dehydrogenase activity Colorimeter method.
RESULTS AND DISCUSSION
The uptake of nutrients in rice crop was found maximum in treatment T7 (122.09kg ha-1) and minimum in treatment T1 (37.76 kg ha-1). The treatment T1 was found to be significantly inferior to overall treatments. The increment in nitrogen uptake was probably due to improvement in soil condition due to application of FYM, make it easy to absorb nutrient by root. Good soil condition encouraged the proliferation of roots and improved synchrony between supply and plant demand, which in turn draw more nutrients from larger area and greater depth (Singh et al., 2014). It was concluded from the present investigation that the percent achievement of the targeted yield of all the two verification trials was within ±5% variation proving the validity of the equations for prescribing integrated fertilizer doses forrice.
The grain yield of rice from the two verification trials indicated that STCR-INM 40 and 50q ha-1 (target yield) was found significantly higher grain yield over all other treatments, whereas blanket fertilizer recommendation (farmer practice) recorded significantly lower yield. Among the treatments, STCR-INM recorded relatively higher benefit: cost ratio 3.87, 3.94 and 38.70, 37.79 percent achievement than other treatments respectively. The results of this study confirmed that application of organic and inorganic fertilizers alter rice productivity and soil biological properties. The combined application of chemical fertilizer and FYM was the most effective for increasing rice productivity and soil nutrient balance than sole chemical fertilizer or compost amendment. Fertilization had a significantly beneficial impact on soil microbial properties. Farm yard manure and along with chemical fertilizers application significantly improved soil microbial and enzymatic activity in soil.
REFERENCES [1] Ge, G., Li, Z., Fan, F., Chu, G., Hou, Z. and Liang, Y. (2010).Soil biological activity and their seasonal variations in response to long-term
application of organic and inorganic fertilizers. Plant and Soil, 326: 31-44. [2] Masto,R. E., Chhonkar, P. K., Singh, D. and Patra, A. K. (2006) Changes in soil biological and biochemical characteristics in a long-term field
trial on a sub-tropical inceptisol. Soil Biology and Biochemistry, 38: 1577-1582. [3] Singh, Y.V. and Singh, S.K. (2014) Fertilizer prescription for targated yield of rice (Oryza sativa L. Var. Saryu-52) in an Inceptisol of Varanasi.
Indian Journal Ecology, 42(2): 282-285.
It is I
LLEGAL t
o cop
y, pri
nt or
save
any c
onten
t of th
is PDF,
in pa
rt or in
full,
on an
y retr
ieval
syste
m,
withou
t the E
XPRESS WRITTEN PERMISSIO
N of th
e cop
yrigh
t-hold
er

National Conference on Climate Change and Agricultural Production: Adapting Crops to Climate Variability and Uncertainty, 6th–8th April, 2017
[449]
Germination and Biochemical Parameters of Mulberry Seedlings under Different Seed Rates
M. Younus Wani1*, M.R. Mir1, M.F. Baqual1, M.A. Malik1, Showket A. Dar2, M.R. Dar3 and S. Rasool1
1Temperate Sericulture Research Institute, 2Mirgund, Department of Entomology 3Department of Plant Pathology,
1,2,3SKUAST-K–190025, India E-mail: *[email protected]
Keywords: Chlorophyll, Germination, Mulberry, Seedling, Seed Rate
INTRODUCTION
Mulberry (Morussp.) is the sole food for the silkworm (Bombyxmori L.) and contributes 38.20 per cent towards the success of a cocoon crop. Under temperate conditions of Kashmir, the seeds are extracted from freshly collected ripe fruits in June and are sown immediately to get seedlings. Although the propagation of mulberry through grafting is resorted to heavily yet the germination percentage of seed sown and the number of seedlings raised continue to be far less than expected. Moreover, the seedlings raised are not healthy and thus succumb to both biotic and abiotic stress which greatly tells upon the cost of production of mulberry plants to be supplied to field for plantation. Like all others crops, various factors affect the germination of seed and biochemical parameters of mulberry seedlings. Since, biochemical composition is important for the plants to tolerate various biotic stresses (Dar et al., 2014; Dar et al., 2015). Amongst these the seed rate play a very important role. Seed rate is the quantity of seed sown per unit area (Pinter et al., 1994). Keeping the above facts in view, the present study was undertaken, to find the optimum seed rate with respect to germination and biochemical parameters of mulberry seedlings under Kashmir conditions
MATERIALS AND METHODS
The experiment was carried out at Temperate Sericulture Research Institute Mirgund (SKUAST-K) in the year 2015. The seeds were pre-soaked for 24 hours before sowing in polytubes having an exposed area of one square foot. The design used was CRD with eight treatments (20,24,28,32,36,40,44,48 seeds/sq.ft.).
Germination percentage = No. of seeds germinated
× 100 No. of seeds sown
Germination rate= ∑n/∑Dn
Where, R= germination rate, n= number of seeds germinated, D= number of days
Total proteins were measured using Folin-phenol reagent 450mg of dry leaf powder was homogenized in 80% ethanol using mortar and pestle and homogenate was centrifuged at 5000rpm for 20 minutes. Supernatant was discarded and pellet was suspended in 10ml of 10% trichloro acetic acid (TCA). Protein precipitate was then dissolved in 1N sodium hydroxide. Extracted proteins in 1N NaOH were diluted 10 times with distilled water. 1ml of protein sample was taken in a test tube, 5ml of alkaline copper reagent was added. 0.5ml of folin-phenol reagent was rapidly added and mixed. After 30 minutes’ absorbency was measured at 750nm. Protein content was calculated by preparing standard curve with bovine serum albumin.
The leaf chlorophyll content was recorded by dimethyl sulfoxide (DMSO) method.
It is I
LLEGAL t
o cop
y, pri
nt or
save
any c
onten
t of th
is PDF,
in pa
rt or in
full,
on an
y retr
ieval
syste
m,
withou
t the E
XPRESS WRITTEN PERMISSIO
N of th
e cop
yrigh
t-hold
er

National Conference on Climate Change and Agricultural Production: Adapting Crops to Climate Variability and Uncertainty, 6th–8th April, 2017
[450]
Total chlorophyll a + b = {(8.02+A663) +(20.2+A654)} x V
W x 1000
The data collected was analysed statistically using SPSS and R software.
RESULTS AND DISCUSSION
The germination rate was maximum (0.085) in T1 (20 seeds per sq. ft.) which was statistically at par with (0.083) T2 (24 seeds per sq. ft.) and T3 (28 seeds per sq. ft.). Germination percentage was maximum (85%) in T1(20 seeds per sq. ft.) and was statistically at par with T2 (24 seeds per sq. ft.) and T3 where the germination percentage was 84.60 and 83.30% respectively. The decrease in germination rate and percentage may probably be due to an increase in carbon dioxide concentration which in turn decreases oxygen level. Another possible reason can be that at high seed density much mortality occurs because high seed rate is more susceptible to attack by soil pathogens and hence becomes a constraint for seed germination. The protein content of leaves was maximum (4.42%) in T3 (28 seeds per sq. ft.) which was statistically at par with (4.30%) T1 (20 seeds per sq. ft.) and (4.16) T2 (24 seeds per sq. ft.). Decrease in protein contents with increase in seed rate have also been reported by Ayub et al. (1999) in maize. The chlorophyll “a” content of leaves was maximum (1.727 mg g-1) in T3 (28 seeds per sq. ft.) which was statistically at par with T1 (20 seeds per sq. ft.) and (1.600 mg g-1) T2 (24 seeds per sq. ft.) and significantly different from T4, T5, T6, T7 and T8. The chlorophyll “b” content of leaves was maximum (0.779 mg g-1) in T3 (28 seeds per sq. ft.) which was statistically at par with T1 (20 seeds per sq. ft.) and (0.633 mg g-1) in T2 (24 seeds per sq. ft.).
REFERENCES [1] Ayub M, Nadeem M A, Sharar M S and MahmoodN 2002.Response of maize (Zea mays L.) fodder to different levels of nitrogen and
phosphorus. Asian Journal Plant Science1(4): 352-354. [2] Dar S A, Wani A R and Padder S A 2015.Relationship between incidence of Leucinodes orbonalis and chlorophyll content in leaves of
Brinjal.Journal of Applied and Natural Science7(2): 574-578. [3] Ellis R A and Roberts E H 1980.Improved equations for the prediction of seed longevity. Annals of Botany 45: 13-30. [4] Pinter L, Elfoldi Z, Burues Z and Paldi E 1994. Feed value of forage maize hybrids varying in tolerance to plant density. Agronomy Journal
86:799-804.
Effect of Plant Growth Regulators on Growth and Flowering Characters of China aster (Callistephuschinensis L. Nees) cv. Ostrich Feather
Sonu Kumar1*, A.K. Singh1, Archana Singh2 and Amar Singh3
1Department of Floriculture and Landscape, N.D.U.A. & T., Kumarganj, Faizabad–224229, India 2KVK, Masodha–24133, Faizabad, India
3Department of Horticulture, C.S.A.U.A. & T., Kanpur–208002, India *E-mail:[email protected]
Keywords: Plant Growth Regulators, China aster, NAA
INTRODUCTION
China aster (Callistephuschinensis L. Nees) is one of the most popular valuable seasonal flower belongs to family Asteraceae (Compositeae). The commercial importance of china aster increasing day by day in India specially in Karnataka, Tamil Nadu, West Bengal and Maharashtra. Its cultivation has been found to be a profitable enterprise for eastern Uttar Pradesh. In periurban surroundings of Bangalore (Karnataka) and Pune
It is I
LLEGAL t
o cop
y, pri
nt or
save
any c
onten
t of th
is PDF,
in pa
rt or in
full,
on an
y retr
ieval
syste
m,
withou
t the E
XPRESS WRITTEN PERMISSIO
N of th
e cop
yrigh
t-hold
er

National Conference on Climate Change and Agricultural Production: Adapting Crops to Climate Variability and Uncertainty, 6th–8th April, 2017
[451]
(Maharashtra) alone, it is being grown in an area of 500 and 400 ha, respectively. Production of improved quality flower depends greatly on the use of plant growth regulators at commercial level. Auxin group of growth regulators such as NAA (Naphthalene acetic acid) increases the growth of plant both by cell division and cell elongation, apical dominance, regulation of flowering in a large number of plants. The apical dominance might be under control of auxin produced at the terminal bud. NAA is applied to regulate the flowering in desired season. The growth and flowering of China aster are greatly influenced by judicious application of PGRs therefore it is imperative to find out optimum doses PGRs, for quality flower production. The present study is therefore, undertaken to investigate the possibilities of improving production and quality of China aster by application PGRs. Auxin is probably the investigated plant hormone and involve in virtually every aspect of plant growth and development.
MATERIALS AND METHODS
The present investigation was carried out at Main Experiment Station, Horticulture, NDUA&T, Faizabad with Randomized Block Design (RBD) replicated three times keeping 10 treatments. The treatments comprising of three levels of GA3 (100, 200 and 300 ppm), three levels of NAA (50, 100, 150 ppm), three levels of Ethrel (100,200,and 300 ppm)and aControl (water spray). The different concentration of plant growth regulators weresprayedatone month after transplanting. The observations gathered with respect to plant height, plant spread, number of leaves per plant, number of primary branches per plant were recorded at the time of flower bud initiation in each tagged plant. Days taken for the opening of first flower was recorded from the date of transplanting of seedling to the days taken for opening of first flower and the duration of flowering (days) was noted by counting the date of first flowering to the last flowering. Total number of flowers per plant was recorded by adding all the harvest stage and flower weight (g) was recorded as twenty five fully matured flowers were plucked randomly from each plot and weighted and average was worked out.
RESULTS AND DISCUSSION
The different attributes observed during the experiment significantly varies with plant growth hormones. The maximumplant height (52.27 cm), plant spread (33.60 cm), number of leaves per plant (90), number of branches per plant (10.07), minimum days taken for opening of first flower (58.27 days), maximum duration of flowering (42.34 days), and flower weight (11.20 g)was recorded with the application of GA3 300ppm followed by GA3 200ppm. However, the maximum (12.74) numbers of flowers were recorded with the application of GA3 200 ppm followed by GA3 300 ppm and NAA 50 ppm which was found at par with Ethrel 300 ppm, NAA 100 ppm. The promotive effect of gibbrellins on growth may be due to increasing auxin level of tissues or enhance the conversion of tryptophan to IAA which causes the cell division and cell elongation. Similar results were also reported by Kumar et al. (2006) in tuberose using GA3 200ppm. The GA3 resulted hyper elongation of internodal length caused extension in plant height while increase in total count of main axis consequently increased number of dormant buds from where primary branches originated which resulting optimum spread of plant (Gautam et al. 2006). These findings are in close conformity with result of Dutta et al. (1998) in chrysanthemum with GA3 150ppm.Kadam et al. (2002) reported that GA3 at 200 ppm resulted in tall plants, high number of leaves, high branch number and the maximum flower yield of China aster. The maximum duration of flowering with GA3 300 ppm might be due to advanced stage of flowering in China aster. Early flowering owing to GA3 may be due to gibbrellins reduces juvenile period and termination of juvenile phase the shoot apical meristem instead of producing vegetative growth start producing flower. Dahiya and Rana (2001) reported earlier flowering in chrysanthemum with GA3 150ppm and Mohariya et al. (2003) observed earlier flowering in chrysanthemum with GA3 150ppm. The enhancement in number of flower per plant with 200 ppm GA3 might be due to the production of large number of laterals at early stage of growth which had sufficient time to accumulate carbohydrate for proper flower bud differentiation due to enhanced reproductive efficiency and photosynthesis restricted plant type. The above findings showed that
It is I
LLEGAL t
o cop
y, pri
nt or
save
any c
onten
t of th
is PDF,
in pa
rt or in
full,
on an
y retr
ieval
syste
m,
withou
t the E
XPRESS WRITTEN PERMISSIO
N of th
e cop
yrigh
t-hold
er

National Conference on Climate Change and Agricultural Production: Adapting Crops to Climate Variability and Uncertainty, 6th–8th April, 2017
[452]
foliar application of GA3 300 ppm one month after transplanting was proved most effective in increasing the growth and flowering characters of China aster.
REFERENCES [1] Dahiya D S and Rana G S 2001. Regulation of flowering in chrysanthemum as influenced by GA and shade house of different intensities. South
Indian Horticulture49: 313-314. [2] Dutta J P, Seemanthini R and Ramdas S 1998. Growth and flowering response of chrysanthemum to growth regulators treatments. Orissa
Journal Horticulture 26(1): 70-75. [3] Gautam S K, Sen N L, Jain M C and Dahora L K 2006. Effect of plant regulator on growth flowering and yield of chrysanthemum
(Chrysanthemum morifolium Ram.) cv. Nilima. The Orissa Journal of Horticulture34(1): 36-40. [4] Kadam R E, Bankar G J, Bhosale A M, Rathod N G and Dhengle R P 2002. Effect of growth regulators on growth and flower yield of China
aster (Callistephuschinensis (L.) Nees).Annals of Plant Physiology16(1): 44-47. [5] Kumar J, Singh P and Pal K 2006. Effect of growth substances on flowering and bulb production in tuberose (Polianthestuberosa L.) cv. Pearl
Double. Journal of Ornamental Horticulture9(3): 227-228. [6] Mohariya A D, Patil B N, Wankhede S G, Band P E and Kartikeyan R 2003. Effect of GA3 and TIBA on growth, flowering and yield of different
varieties of Chrysanthemum. Advancesin Plant Sciences16(1):143-146.
Synergistic Effect of Iron and Phytohormones Application on Enzyme Activity, Chlorophyll, and Grain Yield of Maize in Iron-Deficient Soil
Kavita1* and Vipin Kumar2 1Department of Botany & Plant Physiology, 2Department of Soil Science
1,2Dr. Rajendra Prasad Central Agricultural University, Pusa–848215, India E-mail: *[email protected]
Keywords: Iron, Phytohormones, Antioxidants, Enzymes, Maize
INTRODUCTION
Iron (Fe) deficiency is a widespread agricultural problem in many crops including maize grown in alkaline, calcareous soils. Phytohormones are involved in regulation of nutrient availability. Conversely, mineral nutrients influence hormone biosynthesis, suggesting a relationship between hormones and nutritional homeostasis (Guo et al., 2015). Exogenous application of phytohormones may alleviate Fe deficiency stress. There are also several investigations indicating that GA is involved in Fe nutrition in plants (Sekimoto et al., 2001). Cytokinins control the root iron uptake machinery through a root growth dependent pathway in order to adapt nutrient uptake to the demand of the plant (Séguéla, 2008). Reactive oxygen species (ROS) such as anion radical (O2
-), singlet oxygen (1O2), hydrogen peroxide (H2O2) and hydroxide radical (OH) are formed at higher rates under several stress condition including inadequate mineral nutrition. Such conditions lead to impairment of various physiological and biochemical processes, damaging many cellular components including protein, membrane lipids, nucleic acids etc. Hence, we conducted field experiment during Rabi 2012-13 with contrasting cultivars of maize to study their interaction in plants as evident by their effect on different enzyme system, leaf chlorophyll and grain yield.
MATERIALS AND METHODS
Experiment was laid out in 3-factor completely randomized design in Fe-deficient soil. The factors were: i) Fe-efficient (Suwan) vs. inefficient cultivar (Shaktiman-3); ii) ‘control’ (no Fe-spray) vs. one soil application (20 kg/ha) + two foliar spray of Fe as 0.5% ferrous sulphate at pre-flowering and 7-days after flowering; and iii) foliar application of phytohormones viz., GA3 @10 and 20 ppm; cytokinin @10 and 20 ppm and their combinations.
It is I
LLEGAL t
o cop
y, pri
nt or
save
any c
onten
t of th
is PDF,
in pa
rt or in
full,
on an
y retr
ieval
syste
m,
withou
t the E
XPRESS WRITTEN PERMISSIO
N of th
e cop
yrigh
t-hold
er

National Conference on Climate Change and Agricultural Production: Adapting Crops to Climate Variability and Uncertainty, 6th–8th April, 2017
[453]
RESULTS AND DISCUSSION
The results revealed that the application of Fe and phytohormones significantly increased enzymes activity like catalase, peroxidase, amylase and invertase but decreased superoxide dismutase (SOD). The highest activity was observed with combined application of cytokinin + GA3 @10 ppm. For example, the value of catalase increased from 196.0 to 217.0 µmol/min/g fresh protein, and peroxidase from 90.0 to 103.0 Units/ mg fresh protein. There were significant increases in chlorophyll content of leaves, and grain yield with combined application of cytokinin + GA3 @10 ppm. The maximum chlorophyll content was recorded in ‘Suwan’ (32.7 SPAD value) having treatment Fe application plus GA3 + cytokinin @10 ppm each. Grain yield increased significantly from 58.6 to 64.6 q/ha in ‘Suwan’ provided with Fe application and GA3+ cytokinin @10 ppm each, compared to control (50.3 q/ha). Results indicated that phytohormones were involved in regulation of nutrient availability and conversely mineral nutrients influenced hormone biosynthesis suggesting a relationship between hormones and nutritional homeostasis. The studies confirmed the hypothesis that exogenous application of phytohormones could alleviate Fe deficiency stresses in maize and application of Fe and phytohormones acted synergistically. Hence, application of GA3 + cytokinin @ 10 ppm may be done to alleviate Fe stress and to improve grain yield of maize.
REFERENCES [1] Guo Y, Zhu C, Gan L, Ng Dand Xia K 2015. Effects of exogenous gibberellic acid3 on iron and manganese plaque amounts and iron and
manganese uptake in rice. PLoS ONE, 10(2): e0118177. [2] Séguéla M, Briat J F, Vert G and Curie C 2008. Cytokinins negatively regulate the root iron uptake machinery in Arabidopsis through a growth-
dependent pathway. Plant Journal55(2): 289-300. [3] Sekimoto H, Kato A, Nomura T and Yokota T 2001. Chlorosis induced by iron deficiency is more severe in gibberellin-deficient dwarf plants. In:
Plant Nutrition, W.J. Horst, M.K. Schenk, A. Bürkert, N. Claassen and H. Flessa et al. (Eds.), Netherlands: Springer, pp: 150-151.
Optimisation of Nitrogen Level and Cutting Interval for Growth and Yield of Ipomoea reptans
Satish Kr. Subba*, Reva Mondal, Umesh Thapa and Deepsil Gurung Department of Vegetable Crops, Bidhan Chandra Krishi Viswavidyalaya, Mohanpur, Nadia, India
E-mail: *[email protected]
Keywords: Cutting, Growth, Ipomoea, Nitrogen, Yield
INTRODUCTION
Ipomoea reptans poir (syn. I. aquatica) commonly known as swamp cabbage is a very important cultivated crop in all the south Asian countries of high nutritional value. Cutting of stems significantly effects branching and enhances flowering in most of the crops (Ahmed and Oladiaran, 2012). Since in most of the leafy vegetables several cuttings are possible, they require a good amount of fertilizer for quick growth. Increased addition of nitrogen usually results in increased yield of plant. Information regarding this crops and about its management practices in India is meagre. Under such situations it is necessary to determine the fertilizer requirement and cuttings effect before going for large scale production. With this view mind, the present work has, therefore, been designed with the objective to determine the nitrogenous fertilizer requirement and cutting effect of gimakalmi.
It is I
LLEGAL t
o cop
y, pri
nt or
save
any c
onten
t of th
is PDF,
in pa
rt or in
full,
on an
y retr
ieval
syste
m,
withou
t the E
XPRESS WRITTEN PERMISSIO
N of th
e cop
yrigh
t-hold
er

National Conference on Climate Change and Agricultural Production: Adapting Crops to Climate Variability and Uncertainty, 6th–8th April, 2017
[454]
MATERIALS AND METHODS
The experiment was conducted at Bidhan Chandra Krishi Viswavidyalaya, Mondouri, Nadia, West Bengal during summer season of 2015. The treatments comprising of four levels of nitrogen (60, 80, 100, 120 kg/ha) and two cutting treatments (20 days and 30 days intervals). First harvesting was taken at 30 days after sowing and then accordance to treatments. The treatments were arranged in factorial randomized design with three replications.
RESULTS AND DISCUSSION
Highest plant height 47.87 cm was obtained under 120 kg/ha nitrogen with 30 days interval of cutting condition. While lowest plant height 30.97 cm was recorded under 60 kg/ha nitrogen with 20 days interval of cutting condition. Number of vines and number of leaves per plant were highest with 120 kg/ha nitrogen coupled with 30 days interval of cutting (Table 1) i.e. 12.20 and 191.3, respectively. Highest weight of leaves and weight of stems per plant were recorded 116 g and 56.13g, respectively under 120 kg/ha nitrogen application with 30 days cutting interval. The leaf stem ratio was obtained highest in 120 kg/ha nitrogen applications with 30 days cutting interval (2.07). The highest total fresh yield (52.46 ton/ha) was obtained at 120 kg/ha nitrogen application with 20 days interval of cutting. It was 11.15% more than the total yield obtained at 30 days interval. This was due to one more cutting was taken at 20 days interval of cutting. Guan et al. (2006) studied the growth, yield formation and absorption of nitrogen in Malabar spinach (Basella sp.) and reported that nitrogen has a direct effect on yield of the crop. It can be concluded that, the 120 kg N/ha has shown best result when cuttings were taken at 20 days interval regarding yield. But in case of growth characters, best results have been observed when cuttings were taken at 30 days interval and 120 kg/ha of nitrogen were applied. So, from economic return of point, the combination of treatment (120 kg/ha nitrogen along with 20 days cutting interval) can be suggested to the farmers.
Table 1: Effect of Different Nitrogen Levels and Cutting Intervals on the Growth and Yield Attributes of Ipomoea reptans.
Treatments Plant Height (cm)
No. of Vines/ Plant
No. of Leaves/ Plant
Leaf Weight/ Plant (g)
Stem Weight Plant (g)
Leaf-stem Ratio
Total Fresh Yield (Ton/ha)
N1C1 30.97 6.27 71.8 45.80 25.17 1.82 43.23 N1C2 40.33 9.00 124.4 76.67 39.27 1.95 38.66 N2C1 33.07 7.40 83.6 49.67 27.47 1.81 45.19 N2C2 41.87 10.13 143.5 86.27 45.00 1.92 41.53 N3C1 35.20 7.87 94.5 57.07 31.13 1 83 51.07 N3C2 45.80 11.13 162.0 95.87 49.80 1.93 45.23 N4C1 37.07 8.33 103.8 64.13 34.17 1.86 52.46 N4C2 47.87 12.20 191.3 116.00 56.13 2.07 47.20 C.D. at 5% 1.309 0.484 3.529 3.953 2.356 0.075 0.596 SEm(±) 0.655 0.242 1.764 1.976 1.178 0.037 0.122
NS = Not Significant; N1C1= 60 kg/ha Nitrogen+ 20 days cutting interval; N1C2= 60 kg/ha Nitrogen+ 30 days cutting interval; N2C1= 80 kg/ha Nitrogen+ 20 days cutting interval; N2C2= 80 kg/ha Nitrogen+ 30 days cutting interval; N3C1= 100 kg/ha Nitrogen+ 20 days cutting interval; N3C2= 100 kg/ha Nitrogen+ 30 days cutting interval; N4C1= 120 kg/ha Nitrogen+ 20 days cutting interval; N4C2= 120 kg/ha Nitrogen+ 30 days cutting interval
REFERENCES [1] Ahmed M and Oladiaran JA 2012. Effect of stem cutting and variety on shoot development and seed yield of jute mallow (Corchorus olitorious
L.). Experimental Agriculture and Horticulture12(3): 21-29. [2] Guan P, Liu H and Luo G 2006. Studies on growth yield formation and absorption of nitrogen, phosphorus and potassium in Malabar spinach.
Research Report on China Inst. Vegetable and Flowers9: 19-22.
It is I
LLEGAL t
o cop
y, pri
nt or
save
any c
onten
t of th
is PDF,
in pa
rt or in
full,
on an
y retr
ieval
syste
m,
withou
t the E
XPRESS WRITTEN PERMISSIO
N of th
e cop
yrigh
t-hold
er

National Conference on Climate Change and Agricultural Production: Adapting Crops to Climate Variability and Uncertainty, 6th–8th April, 2017
[455]
Assessment of Status and Indigenous uses of some Economically Important Medicinal Plants in District Kullu of Himachal Pradesh,
Northwestern Himalaya
Shalu Devi Thakur1*, K.S. Kapoor2 and S.S. Samant3 1Faculty of Forestry, Sher-e-Kashmir University of Agricultural Sciences and Technology,
Kashmir, Benhama, India 2Department of Ecology and Biodiversity Conservation,
Himalayan Forest Research Institute, Panthaghati, Shimla, India 3G.B. Pant Institute of Himalayan Environment and Development, Mohal, Kullu, India
E-mail: *[email protected]
Keywords: Diversity, Distribution, Threatened Plants, Therapeutic uses, Kullu District
INTRODUCTION
The plants have been the important source of medicines used by man from prehistoric times for relieving suffering and curing ailments. The need for the integration of local indigenous knowledge for a sustainable management and conservation of natural resources received more and more recognition (Posey, 1992). The quest for documentation of traditional knowledge has been concentrated especially around traditional health practices. In India, many indigenous plants are used in herbal medicine to cure diseases and heal injuries. If this information is to be collected systematically and comprehensively and maintained in databases in a manner they would help in protecting their knowledge. The objective of this study is to document the medicinal plants used by the local peoples, their status in the study area which will act as a data base for the formulation of the conservation strategy so that the plants can be saved from being extinct.
MATERIALS AND METHODS
The paper is the outcome of the study done during 2008-2010 which was carried out in District Kullu of Himachal Pradesh. It lies between 31º58´00” north latitude and 77º06’04” east longitude. The total area of the district is 5503 sq. kms.. During the study extensive field surveys of the entire area were carried out and information pertaining to the traditional knowledge, local uses of the plants, information about the local name of the plants, plant parts and the purpose for which these are used, mode of administration and curative properties were recorded through intensive interviews and discussions with the elderly people, herbal healers, local vaids and rural women of the area and the same have been documented and are depicted in the results
RESULTS AND DISCUSSION
Total 528 economically important plant species (Angiosperms: 477; Gymnosperms: 09 and Pteridophytes: 42) belonging to 103 families and 294 genera were recorded. Asteraceae (48 spp.); Poaceae (35 Spp.) followed by Rosaceae (28 spp.) were the dominant families. Amongst genera, Impatiens (11 spp.); Carexand Lonicera (8 spp. each) were the dominant. Alangiaceae, Podophyllaceae, Sapindaceae, Schisandraceae, Taxaceae and Vitaceae were among the monotypic families. Amongst 528 economically important species, 223 species were used as medicine, 85 species were found to be as wild edible/food, 175 species having
It is I
LLEGAL t
o cop
y, pri
nt or
save
any c
onten
t of th
is PDF,
in pa
rt or in
full,
on an
y retr
ieval
syste
m,
withou
t the E
XPRESS WRITTEN PERMISSIO
N of th
e cop
yrigh
t-hold
er

National Conference on Climate Change and Agricultural Production: Adapting Crops to Climate Variability and Uncertainty, 6th–8th April, 2017
[456]
fodder value, 49 species providing fuel and 11 species of timber importance in the study area.The occurrence of 223 species of medicinal plants in the area indicates the presence of diverse habitats and large altitudinal range and favourable environmental conditions. The altitudinal range, 2100-2800m identified the richest zone for the medicinal plants. This zone is inhabited by a large number of villages and villagers utilize them for curing various diseases/ailments. Habitat degradation and over exploitation of these species may lead to their early extinction in the area. The over exploitation of medicinal plants parts such as roots, rhizomes, tubers, inflorescences, fruits, oils, seeds, etc. may lead to poor regeneration and extinction of these species in near future. An area specific threat categorization of species is most important for short or long term management planning. Cultivation of economically important medicinal plants in the surrounding villages and other private lands may reduce the pressure on wild population. Regular populations and habitats monitoring of native, endemic and threatened medicinal plants using ecological methods and notification of key areas as medicinal plants conservation areas (MPCAs) for in situ conservation, with the involvement of the State Forest Department and inhabitants of the area have been suggested. The present study shows that investigations of various aspects of people-nature relationships need to be conducted before arriving at conclusions for prioritizing species for conservation. It also reveals the importance of such studies in setting conservation priorities, which need to develop around location specific considerations. Proper education and awareness programs need to be developed to address the issue of conservation of prioritized species. Development of cultivation packages of such species and providing them to the villagers, besides practicing other regulatory measures can reduce the pressure on natural populations.
REFERENCES [1] Posey D1992. Traditional Knowledge, Conservation and the Rain Forest Harvest. In: Sustainable Herbest and Marketing of Rain Forest
Products, Plotkin, M. and L. Famolare (Eds.). Island Press, Washington DC, pp: 46-50. [2] Samant S S, Joshi H C, Arya S C and Pant S 2002. Studies on the structure, composition and changes of vegetation in Nanda Devi Biosphere
Reserve of west Himalaya. Final Technical Report, Ministry of Environment and Forests, New Delhi. [3] Samant S S and Pant S 2006. Diversity, distribution pattern and conservation status of plants used in liver disease/ailments in Indian Himalayan
Region. Journal of Mountain Science 3(1): 28-47.
Response of Drip Fertigation on Nutrient Distribution in Soil of High Density Apple (Malusdomestica) Orchard
Syed Midhat Fazil, Rohitashw Kumar, Mehlath Shah, Anaum Chishti, Syed Nuzhat Fazil and Latief Ahmad*
Sher-e-Kashmir University of Agricultural Sciences and Technology of Kashmir, Srinagar–190025, India
E-mail: *[email protected]
Keywords: Drip Irrigation, Fertigation, High Density Apple
INTRODUCTION
The sustainability of any production system requires optimum utilization of resources be it water, fertilizer or soil. Drip irrigation with fertigation offers a vast potential for optimum utilization of water and fertilizers. Application of fertilizers through an efficient irrigation system, known as fertigation, results in more accurate and timely crop nutrition, thus, leading to increased yield besides considerable savings in fertilizers. Apple
It is I
LLEGAL t
o cop
y, pri
nt or
save
any c
onten
t of th
is PDF,
in pa
rt or in
full,
on an
y retr
ieval
syste
m,
withou
t the E
XPRESS WRITTEN PERMISSIO
N of th
e cop
yrigh
t-hold
er

National Conference on Climate Change and Agricultural Production: Adapting Crops to Climate Variability and Uncertainty, 6th–8th April, 2017
[457]
(Malusdomestica) is one of the most important and highly remunerative fruit crops of northern region of India. It is cultivated worldwide as a fruit tree, and is the most widely grown species in the genus Malus. The tree originated in Central Asia, where its wild ancestor, Malussieversii, is still found today. The field experiment was carried out on high density Apple (Malusdomestica) orchard to determine the nutrient movement within the soil profile.
MATERIALS AND METHODS
The experiment was carried out on 3 year old apple plants (var. Gala Red Lum) having plant-to-plant and row-to-row spacing of 3m x 1.5m, at Experimental Farm (34.145° N latitude and 74.87° E longitude and 1606m above mean sea level) of SKUAST-Kashmir, Shalimar during June to August, 2016.Drip irrigation was installed in the experimental farm using 4lph drippers and the system comprises of operating pressure at 1.0 kg/cm2.Nitrogen was applied in the drip irrigated plots as urea mixture, with different treatment rates through the fertigation tanks. The experiment consisted of three treatments with 50%, 75% and 100% RDF (recommended dose fertilizer) in fortnightly intervals. Soil samples were collected from the experimental orchard from depths of 0-15 cm and 15-30 cm below the soil surface. The collected soil samples were analyzed for nitrate-nitrogen.
RESULTS AND DISCUSSION
The analysis of variance of the data pertaining to nitrate content at various depths revealed that there was a significant decrease in NO3-N content at various depths from 195.86 to 123.11mg kg-1 also their interaction effect was also found to be significant. The highest concentration of219.33mg kg-1 was obtained in treatment T3at depth 0-15cm which was found to be much higher than the NO3-N content obtained in T1 treatment i.e. 109 mg kg-1 with depth 15-30cm.The NO3-N content under drip fertigation was higher in the upper soil layers, and was found to be lower below the drippers (Raina et al., 2011).During the crop development stage, a higher percentage of N fertilizer was absorbed by the plant due to development of root system and the resultant decrease in NO3-N content (Kumar et al., 2016).
REFRENCES [1] Kumar M, Rajput Kumar R and Patel N 2016. Water and nitrate dynamics in baby corn (Zea mays L.) under different fertigation frequencies and
operating pressures in semi-arid region of India. Agricultural Water Management. 163: 263–274. [2] Raina J N, Tarika S and Shashi S 2011. Effect of drip fertigation with different fertilizers on nutrient distribution in soil, leaf nutrient content and
yield of apricot (Prunusaremeniaca L.). Journal of Indian Society of Soil Science59(3): 268-277.
It is I
LLEGAL t
o cop
y, pri
nt or
save
any c
onten
t of th
is PDF,
in pa
rt or in
full,
on an
y retr
ieval
syste
m,
withou
t the E
XPRESS WRITTEN PERMISSIO
N of th
e cop
yrigh
t-hold
er

National Conference on Climate Change and Agricultural Production: Adapting Crops to Climate Variability and Uncertainty, 6th–8th April, 2017
[458]
Influence of Different Tillage and Fertilizer Management Practices on Periodic Dry Matter Accumulation of Maize
Todar Mal* and S.S. Walia Department of Agronomy, Punjab Agricultural University,
Ludhiana–141004, India E-mail: *[email protected]
Keywords: Fertilizer, Maize, Mulch, Tillage
INTRODUCTION
Maize is the third most important cereal grain crop after wheat and rice, produced worldwide for its food, feed and other industrial purposes. Among different agro-techniques, tillage and fertilizer management are important that affect the growth and yield of crops. In intensive tillage, high soil strength and low porosity of subsurface compact layer restricts crop roots in the top layer and reduces the volume of soil to be explored by the plants for nutrients and water (Lipiec et al., 2003). Hence alternate tillage and crop establishment practices like conservation agriculture play an important role in achieving the sustainability in crop productivity. Integration of inorganic fertilizers with organic manures not only sustains the crop production but also be effective in improving the soil health (Bajpai et al., 2006). Keeping this view in consideration, the present investigation was planned to study the effect of tillage and fertilizer management practices on periodic dry matter accumulation by maize under different cropping systems.
MATERIALS AND METHODS
The present study entitled ‘periodic dry matter accumulation by maize crop under different tillage and fertilizer management practices’ was conducted at the Students’ Research Farm, Department of Agronomy, Punjab Agricultural University, Ludhiana, during 2015-16. The experiment was laid out in split-plot design with four replications. The main plot treatments consist of combination of tillage viz. minimum tillage (MT) and conventional tillage (CT) and cropping systems viz. rice-wheat, maize-vegetable pea-spring maize, maize-toria-spring maize, maize-potato-spring maize, whereas, sub plots consist of combination of fertilizer and mulch viz. 100% recommended dose of fertilizers (100% RDF), 75 % RDF + 25 % N through FYM, 100% RDF plus mulch and75 % RDF + 25 % N through FYM plus mulch. The soil of experimental site was loamy sand in texture, medium in organic carbon (0.42%), poor in available N (225.9 kg/ha) and available potassium (128.8 kg/ha) and high in available phosphorus (23.6 kg/ha). The dry matter accumulation per plant was recorded at 30 days interval.
RESULTS AND DISCUSSION
The dry matter accumulation is an important index reflecting the growth and metabolic efficiency of the plant which ultimately influence the yield of crop. The dry matter increase progressively with the advancement of the age of the crop as presented in Table 1. The results showed that minimum tillage resulted in significantly higher dry matter accumulation at 60 and at harvest, but at par with conventional tillage at 30 DAS. Less subsoil compaction in minimum resulted in better root development which helped in more soil and nutrient extraction and maintained plant vigour. Fertilizer management practices also influenced the dry matter accumulation significantly at 60 and 90 DAS. However, at 30 DAS no significant influence was recorded. Application of 75% RDF + 25% N through FYM plus mulch resulted in significantly higher dry matter accumulation per plant at 60 DAS and at harvest as compared to 100% RDF and 75% RDF + 25% N
It is I
LLEGAL t
o cop
y, pri
nt or
save
any c
onten
t of th
is PDF,
in pa
rt or in
full,
on an
y retr
ieval
syste
m,
withou
t the E
XPRESS WRITTEN PERMISSIO
N of th
e cop
yrigh
t-hold
er

National Conference on Climate Change and Agricultural Production: Adapting Crops to Climate Variability and Uncertainty, 6th–8th April, 2017
[459]
through FYM. Integration of inorganic fertilizers and organic manure (75% RDF + 25% N through FYM) resulted in numerically more dry matter accumulation per plant as compared to 100% RDF, but significantly at par at different growth periods. The interaction effect was non-significant among tillage and fertilizer management practices. Kumar (2015) also reported that application of mulch resulted in higher growth attributes of maize as compared to no mulch treatments. It was concluded from the study that integration of organic manure and inorganic fertilizers along with mulch resulted in better crop growth as compared to chemical fertilizers alone. Minimum tillage also has the potential to increase the growth of maize.
Table 1: Effect of Tillageandfertilizer Management Practices on Dry Matter Accumulation of Maize under Different Cropping Systems
Treatment DMA (g/plant) 30 DAS 60 DAS At harvest
Tillage 2014 2015 2014 2015 2014 2015 Minimum tillage 14.0 14.7 135.7 137.4 204.3 207.8 Conventional tillage 13.2 13.7 129.8 130.5 197.4 196.0 CD (p=0.05) NS NS 5.5 4.0 5.1 4.6 Cropping Systems Maize-Vegetable pea-Spring maize 13.8 14.5 135.2 135.2 202.5 204.4 Maize-Toria-Spring maize 13.4 14.2 130.0 133.1 199.4 199.5 Maize-Potato-Spring maize 13.6 13.9 130.9 133.5 200.6 201.7 CD (p=0.05) NS NS NS NS NS NS Fertilizer × mulch 100% RDF 13.1 13.7 129.0 129.1 196.7 196.0 75% RDF +25% N FYM 13.2 13.9 130.3 132.4 198.1 198.3 100% RDF + Mulch 13.6 14.4 134.5 135.8 202.7 204.8 75% RDF+25% N FYM+Mulch 14.3 14.7 137.2 138.5 205.7 208.3 CD (p=0.05) NS NS 5.2 6.1 5.4 8.0 Interaction NS NS NS NS NS NS
REFERENCES [1] Bajpai R K, Chitale S, Upadhyay SK and Urkurkar JS 2006.Long-term studies on soil Physico-chemical properties and Productivity of Rice-
wheat System as influenced by Integrated Nutrient Management in Inceptisol of Chhattisgarh. Journal of Indian Society of Soil Science54(1): 24-29.
[2] Kumar R 2015.Productivity, profitability and nutrient uptake of maize (Zea mays) as influenced by management practices in North-East India. Indian Journal of Agronomy 60 (2): 273-278.
[3] Lipiec J, Medvedev VV, Birkas M, Dumitru E, Lyndina T E, Rousseva S and Fulajtar E 2003. Effect of soil compaction on root growth and crop yield in Central and Eastern Europe. International Agrophysics17: 61-69.
Assessing the Effect of Conservation Tillage and Fertilizer Management on Soil Biodiversity under Different Cropping Systems
Todar Mal*, S.S. Walia and S.K. Gosal Department of Agronomy, Punjab Agricultural University, Ludhiana–141004, Punjab
E-mail: *[email protected]
Keywords: Cropping Systems, Microbial Population, Mulch, Tillage
INTRODUCTION
Soil health is a dynamic and complex system, the functions of which are mainly mediated by agricultural management practices. Soil with better health and quality will be able to produce higher crop yield under favourable as well as extreme climatic conditions and soil health acts as a critical component for adaptation
It is I
LLEGAL t
o cop
y, pri
nt or
save
any c
onten
t of th
is PDF,
in pa
rt or in
full,
on an
y retr
ieval
syste
m,
withou
t the E
XPRESS WRITTEN PERMISSIO
N of th
e cop
yrigh
t-hold
er

National Conference on Climate Change and Agricultural Production: Adapting Crops to Climate Variability and Uncertainty, 6th–8th April, 2017
[460]
and mitigation of climate change effects by the crops. Crop management practices like tillage methods and cropping systems can affect soil health and microbial community composition. In some research, no tillage practice has proven to increase the microbial biomass and abundance of fungi (Govaerts et al 2007), while in others, no tillage had either no difference or relative decrease in the relative abundance of fungi compared to conventional tillage (Helgason et al 2009). Under conservation tillage diversified crop rotations can change the microbial composition of soil as compared to rice-wheat cropping system. Keeping these views in consideration, present study was conducted to study the effect of tillage and fertilizer management practices on microbial composition under different cropping systems.
MATERIALS AND METHODS
The present study entitled “Conservation tillage and fertilizer management effects on soil biodiversity under different cropping systems” was conducted at Students’ Research Farm, Department of Agronomy, Punjab Agricultural University, Ludhiana, during 2014-15. The experiment was laid out in split plot design keeping eight combination of tillage (minimum tillage and conventional tillage) and cropping systems (rice-wheat, maize-vegetable pea-spring maize, maize-toria-spring maize, maize-potato-spring maize) in main plots and four fertilizer management practices viz.100% recommended dose of fertilizers (100% RDF), 75% RDF + 25% N through FYM, 100% RDF + mulch and 75% RDF + 25% N through FYM + mulch in split plot design with four replications. Soil samples analysed after completion of crop cycle. Enumeration of bacteria, fungi and actinomycetes was done on Nutrient Agar medium, Glucose Yeast Extract medium and Kenknight’s medium respectively, using serial dilution spread plate technique. The numbers of colonies appearing on dilution plates were counted to find the number of cells per gram of soil sample:
cfu g-1 soil = Number (average of three replicates) of colonies × Dilution factor
Where, Dilution factor = Reciprocal of the dilution
RESULTS AND DISCUSSION
Different tillage treatments influence the microbial population significantly. Minimum tillage resulted in significantly higher bacterial growth (42.3 x 10⁶ cfu g-1 soil), fungal population (14.5 x 10³ cfu g-1 soil) and actinomycetes count (23.6 x 10⁴ cfu g-1 soil) as compared to conventional tillage. Bacterial and fungal population was significantly higher in maize-vegetable pea spring maize, maize-potato-spring maize and maize-toria-spring maize as compared to rice-wheat cropping system. Actinomycetes population under rice-wheat cropping system was significantly lower than maize-vegetable pea-spring maize and maize-potato-spring maize, but at par with maize-toria-spring maize. Population of bacteria, fungi and actinomycetes influenced significantly among different fertilizer and mulch treatments. Application of 75% RDF + 25% N through FYM resulted in higher bacteria (40.7x 10⁶ cfu g-1 soil), fungi (14.2x 10³ cfu g-1 soil) and actinomycetes count (21.5x 10⁴ cfu g-1 soil) as compared to 100% RDF. Higher microbial population in 75% RDF + 25% N through FYM may be attributed to the addition of organic carbon which act as source of energy for microbes and improved soil conditions which favour more growth of microbes in soil. Application of mulch along with fertilizer resulted in significantly higher microbial count as compared to respective fertilizer treatments. Sharma et al.,(2010) reported similar results in north-west India under different cropping systems. It was concluded that maize-based cropping systems resulted in higher microbial count under minimum tillage as compared to rice-wheat cropping system. Combined application of organic manures and inorganic fertilizers improve the soil quality.
It is I
LLEGAL t
o cop
y, pri
nt or
save
any c
onten
t of th
is PDF,
in pa
rt or in
full,
on an
y retr
ieval
syste
m,
withou
t the E
XPRESS WRITTEN PERMISSIO
N of th
e cop
yrigh
t-hold
er

National Conference on Climate Change and Agricultural Production: Adapting Crops to Climate Variability and Uncertainty, 6th–8th April, 2017
[461]
REFERENCES [1] Govaerts B, Mezzalama M, Unno Y, Sayre KD, Luna-Guido M, Vanherck K, Dendooven L and Deckers J 2007. Influence of tillage, residue
management, and crop rotation on soil microbial biomass and catabolic diversity. Applied Soil Ecology37(1-2):18–30. [2] Helgason BL, Walley F Land Germida J J 2009. Fungal and bacterial abundance in long-term no-till and intensive-till soils of the Northern
Great Plains. Soil Science Society of America Journal,73(1): 120–127. [3] Sharma S N, Prasad R, Dwivedi M K, Kumar S, Davari M R and Shukla L 2010.Crop diversification and residueincorporation for making rice–
wheatcropping systems sustainable. Journal of Sustainable Agriculture34(4): 342-64.
Subsoil Nutrient Pool and Fertilizer Recommendation— Is there any Relevance?
Mumtaz A. Ganie1*, M.A. Malik2, Aabid H. Lone2, J.A. Sofi3, Anil Sharma1, D.B. Singh4 and S. Sheraz Mahdi5
1Division of Soil Science, 4Division of Fruit Science 1,4ICAR-CITH, Rangreth Srinagar–190007, India
2Division of Soil Science, 3RCRQA, SKUAST-K, Shalimar, Srinagar–190025, India 5Department of Agronomy, Bihar Agricultural University, Sabour–813210, Bhagalpur, Bihar
E-mail: *[email protected]
Keywords: Biopore, Drilosphere, NUE, Rhizosphere, Subsoil Nutrient Dynamics
Subsoil refers to the soil beneath the tilled soil horizon. Soil fertility and plant nutrition studies have widely neglected nutrient uptake by plants from the subsoil. So the fertilizer dose for the arable crops is based on nutrient study of the top soil only thus leading to more or less a faulty recommendation practice. Generally the atmosphere of subsoil is not considered conducive for good plant growth. Actually properties of subsoil are responsible for reduction in nutrient mobility and root growth in subsoil. Reduced nutrient mobility along with little root surface area is obviously adverse for nutrient acquisition and subsequent uptake. However, many experimental evidences indicate that subsoil can contribute about 35-67 % of the plant nutrition of N, P and K, especially when the topsoil is dry or nutrient-depleted (Kautzet al., 2013). Nutrient availability of subsoil is low but there are some hotspots in the subsoil like drilosphere and rhizosphere where nutrient availability is very high compared to the bulk (Kutschera et al., 2009). Previously it was known that roots of field crops grow only few centimeters deep but now there is strong evidence that roots grow beyond 2m deep in to the soil and derive nutrients and water from the subsoil (White and Kirkegaard, 2010). Subsoil properties can be improved by deep mechanical loosening and promotion of biopore formation for enhancing the access of crop roots to subsoil resources in arable soils. Thus in an nutshell, proper assessment of nutrients delivered from the subsoil and incorporation of the same data into fertilizer recommendation equations may help reduce fertilizer input and increase in nutrient use efficiency (NUE) (Kanter et al., 2016). Enhancement of NUE particularly with respect to nitrogen is highly helpful in reducing nitrous oxide gas emission to atmosphere which is an important greenhouse gas.
It is I
LLEGAL t
o cop
y, pri
nt or
save
any c
onten
t of th
is PDF,
in pa
rt or in
full,
on an
y retr
ieval
syste
m,
withou
t the E
XPRESS WRITTEN PERMISSIO
N of th
e cop
yrigh
t-hold
er

National Conference on Climate Change and Agricultural Production: Adapting Crops to Climate Variability and Uncertainty, 6th–8th April, 2017
[462]
REFERENCES [1] Kanter D R, Zhang X, Mauzerall D L, Malyshev S and Shevliakova E 2016. The importance of climate change and nitrogen use ef�ciency
forfuture nitrous oxide emissions fromagriculture. Environmental Research Letters 11: 1-9. [2] Kautz T, Amelung W, Ewert F, Gaiser T, Horn R, Jahn R, Javaux M, Kmna A, Kuzyakov Y, Munch J, Patzold S, Peth S, Scherer H W, Scholter
M, Schneider H, Vanderborght J, Vetterlein D, Walter A, Wiesenberg G L B and Kopke U 2013. Nutrient acquisition from arable subsoils in temperate climates: A review. Soil Biology & Biochemistry 57: 1003-1022.
[3] Kutschera L, Lichtenegger E, Sobotik M, 2009. Wurzelatlas der Kulturp�anzengemäßigterGebietemitArten des Feldgemüsebaues.DLG, Frankfurt/Main.
[4] White R G and Kirkegaard J A 2010. The distribution and abundance of wheat roots in a dense, structured subsoil: implications for water uptake. Plant, Cell and Environment33: 133-148.
Floristic Diversity and Life Form Spectrum of Vegetation in Betula Dominant Tree Stands along the available Altitudinal Gradient in North
Western Himalayas of Kashmir
Naseer A. Mir* and T.H. Masood Faculty of Forestry, Sher-e-Kashmir University of Agricultural Sciences and Technology of Kashmir,
Srinagar–190025, India E-mail: *[email protected]
Keywords: Floristic Diversity, Betula, Grasses and Herbs
INTRODUCTION
The floral diversity of Himalayan zone is documented to have distinct biological communities with high level of endemism due to their topography (Gairola et al., 2008). The distribution of vegetation in this zone is strongly influenced by various parameters such as temperature, precipitation, wind, isolation, topography, soils, and several development which rapidly change along the elevational gradient (Krauchi et al., 2000). The microclimate, topography and altitude are the most significant attributes in determining the structure and function of plant communities along these timberlines. Betulautilis D. Don (Himalayan birch, Bhurja) a tree line species normally grows between an elevation of 2500 to 3600 m (Stainton, 1972). The massive deforestation and over-exploitation of Betulautilis trees for various purposes has caused loss/reduction of habitat in many of its native groves in the entire Himalayan range (Cuirong and Mark, 1998). Himalayan birch in Kashmir has been assigned the status of critically endangered trees by ENVIS Centre on Conservation of Medicinal Plants, FRLHT, Bangalore.
MATERIALS AND METHODS
A stratified random sampling method (Greig-smith, 1983) was employed and vegetation analysis on each altitude and aspect was replicated by laying quadrates on almost constant slope. The study areas were divided into three altitudinal gradients of 3,000-3,200 m, 3,200-3,400 and 3400-3,600m amsl. The trees were recorded in 10 × 10 m quadrant across the selected sites. The 10 × 10 m quadrates were further divided into two sub-quadrates of 5 × 5 m size for recording shrubs. Further, the sub-quadrates were again divided in 1 × 1 m quadrates for recording ground flora (Shrestha et al., 2007). A Global Positioning System (GPS) was trailed to aid in location of quadrates along the altitudinal gradient at each site. Significant taxonomic reservoirs (Willis, 1970) were used for identification of plant herbaria collected from the study sites.
It is I
LLEGAL t
o cop
y, pri
nt or
save
any c
onten
t of th
is PDF,
in pa
rt or in
full,
on an
y retr
ieval
syste
m,
withou
t the E
XPRESS WRITTEN PERMISSIO
N of th
e cop
yrigh
t-hold
er

National Conference on Climate Change and Agricultural Production: Adapting Crops to Climate Variability and Uncertainty, 6th–8th April, 2017
[463]
RESULTS AND DISCUSSION
The holistic view of the vegetation data envisages that in all 59 plant species recorded from the three altitudinal gradients in Betula dominated stands of Sonamarg (Sindh Forest Division) belonged to 54 genera represented by 30 families. Similarly, Betulautilisdominant stands in Gulmarg Forest Division comprised 28 number of families which represented 48 genera and 54 species. While Poaceae was a dominant family with 7 number of species in Sonamarg (Sindh Forest Division), Asteraceae was the principal family at Gulmarg with representation of 7 species. The co-dominant families in Sonamarg (Sindh Forest Division) included Asteraceae, Rosaceae and Lamiaceae with representation of 6, 5 and 3 number of species. Similarly the co-dominant families in Gulmarg Forest Division included Poaceae, Lamiaceae and Violaceae with representation of 5, 4 and 3 number of species. Further out of the total 59 species recorded in Sonamarg (Sindh Forest Division), 5 were trees, 7 were shrubs and 47 were herbs. Similarly Betula stands at Gulmarg comprised 3 trees, 7 shrubs and 44 herb species. Paul (2008) reported the identical trend from temperate broadleaved Rhododendron forest of Western Arunachal Pradesh, but with higher representation of trees (26), shrubs (40) and grasses and herbs (56). The species composition of the plant community on both the study sites followed a similar trend of herbs >shrubs > trees as reported by Dar (2011) in Branwar temperate coniferous forests.Betula was found growing in association with species like Abiespindrow, Pinuswallichiana, Acer caesium and Piceasmithiana. The overall pattern of species composition exhibited inverse relationship and decreased with increasing altitude. The species composition at lower, middle and upper altitudes in Betula forests was 43, 36 and 35 in Sindh and 37, 40, and 39 in Gulmarg forest divisions respectively. Gairolaet al. (2008) have also recorded a similar pattern of decreasing species composition along an altitudinal gradient in temperate and alpine zones of Central and Western Himalayas respectively. Several other workers have also reported decreasing trend in species composition and its regulation by altitude and aspect (Sharma et al., 2009; Ghimire et al., 2008).The study sites host a remarkable floristic richness with majority of taxa at both the sites belonging to family Asteraceae followed by Poaceae and Rosaceae. The other prominent botanical families represented in study area were: Crassulaceae, Ericaceae, Lamiaceae, Poaceae, Polygonaceae, Ranunculaceae and Rosaceae, Pinaceae, Balsaminaceae, Salicaceae and Violaceae.
REFERENCES [1] Cuirong L and Mark E 1998. Sediments of time: environment and society in Chinese history. Cambridge, UK: Cambridge University Press.
pp: 65. [2] Dar I Y 2011.Edaphic factors and plant community organization in Branwar forest of Kashmir Himalaya. M. Sc Thesis Submitted to University
of Kashmir Srinagar. pp: 30-36. [3] Gairola S, Rawal R S and Todaria N P 2008. Forest vegetation patterns along an altitudinal gradient in sub-alpine zone of west Himalaya, India.
African Journal of Plant Science 2(6): 42-48. [4] Ghimire B K,Lekhak H D,Chaudhary R P and Vetaas O R 2008.Vegetation analysis along an altitudinal gradient of Juniperusindica forest in
Southern Manang Valley, Nepal.International Journal of Ecology22(3): 224-227. [5] Greig-Smith P 1983. Quantitative Plant Ecology.University of California Press, Berkeley, California. pp: 359. [6] Krauchi N, Brang P and Schonenberger W 2000. Forests of mountainous regions: Gaps in knowledge and research needs. Forest Ecology and
Management132: 73-82. [7] Paul A 2008. Studies on diversity and regeneration ecology of Rhododendrons in Arunachal Pradesh.Ph.D. thesis, Assam University, Silchar,
Assam, India. pp: 189. [8] Sharma C M, Suyal S, Gairola S and Ghildiyal S K 2009. Species richness and diversity along an altitudinal gradient in moist temperate forest of
Garhwal Himalaya.The Journal of American Science 5(5): 119-128. [9] Shrestha B B, Ghimire B, Lekhak H D and Jha P K 2007. Regeneration of Treeline Birch (Betulautilis D. Don) Forest in a Trans-Himalayan dry
valley in central Nepal. Mountain Research and Development 27(3): 259-267. [10] Stainton J D A 1972. Forests of Nepal. John Murray, London. pp: 97. [11] Willis J H 1970. A Handbook to Plants in Victoria.Vol. I. 2ndEdn. (Melbourne Univ. Press: Melbourne.) Specimens examined: Jammu &
Kashmir: Ladakh, 11000ft., July, 1905, A. Meebold 3315 (CAL); Suru Valley, 14500 ft., 27.6.1928. B.B. Osmaston204 (K).
It is I
LLEGAL t
o cop
y, pri
nt or
save
any c
onten
t of th
is PDF,
in pa
rt or in
full,
on an
y retr
ieval
syste
m,
withou
t the E
XPRESS WRITTEN PERMISSIO
N of th
e cop
yrigh
t-hold
er

National Conference on Climate Change and Agricultural Production: Adapting Crops to Climate Variability and Uncertainty, 6th–8th April, 2017
[464]
Standardization of Optimum Sieve Size for Grading Cockscomb (Celosia cristata L.) Seeds
M. Govindaraj1*, K. Sundarlingam2, S. Sathish3 and R. Prabhu4 1Department of Seed Science and Technology,
2Seed Centre, Agriculture College and Research Institute, 4Department of Oilseeds CPBG, Tamil Nadu Agricultural University, Coimbatore–641003, India
3Agricultural College and Research Institute, Kudumiyanmalai, India E-mail: *[email protected]
Keywords: Cockscomb, Seed Recovery, Loose Flowers
INTRODUCTION
Celosia cristata L. commonly called as cockscomb is a member of Amaranthaceae family. Since the flower looks like the head of a rooster (cock) it is also called as wool flower. It is called as “KoliKondai” in Tamil. Cockscomb is a decorative flower, grown annually in warm countries, mainly in the tropical and subtropical region. It is one of the most versatile annual herbaceous dicotyledonous plant with different colours, ranging from shades of red, purple, gold, orange and yellow including multicoloured flower head (Okusanya, 1980). Inflorescence shape ranges from enlarged spikes to fascinated, crested and convoluted combs. Cockscombs are grown for ‘loose flowers’ used in garland making. Though not fragrant, the flowers are popular due to their attractive colour, less weight and shelf life.
Grading of seed based upon their size is a common practice in a majority of plant species as it has been found to regulate the germination and subsequent seedling growth in many species (Ahirwar, 2012). The importance of seed size on seed quality has been reported for several crops such as in tomato (Pandita and Randhawa, 1995), in carrot (Sundaralingam, 1995 and Ramesh, 1996), in phlox (Sathyanarayanan, 2000), in amaranthus (Menaka and Balamurugan, 2005) and grain amaranthus (Manikandan, 2008). Hence, an attempt has been made to analyze the effect of size of cockscomb seed on seed germination for better sowing of quality seeds.
MATERIALS AND METHODS
The size grading studies in cockscomb were undertaken at Department of Seed Science and Technology, Tamil Nadu Agricultural University, Coimbatore during 2010-2012. Bulk seed material of one kilogram were weighed in a weighing balance and were size graded with BSS 16 × 16, 18 × 18 and 20 × 20 square wire mesh sieves. The seeds retained on each of the sieves were weighed in an electronic balance and the seed recovery of respective sieve was calculated using following formulae and expressed as percentage.
Seed recovery (%)= Quantity of seeds retained (g)
Quantity of seeds taken (g) ×100
The seed quality parameters were studied from the graded seeds and compared with bulk seeds which served as control. Eight replications of 100 seeds each were counted and weight of 100 seeds were recorded with the help of an electronic balance and expressed in gram. Immediately after grading of seeds, the germination test was conducted by roll towel method in four replicates of 100 seeds each and placed in germination room maintained at 25 ± 2 °C temperature and 95 ± 2 % relative humidity in the presence of continuous light. After 14 days, normal seedlings were counted and expressed in percentage. Ten normal seedlings per replicate were taken at random from the test sample at the end of germination test period. The distance
It is I
LLEGAL t
o cop
y, pri
nt or
save
any c
onten
t of th
is PDF,
in pa
rt or in
full,
on an
y retr
ieval
syste
m,
withou
t the E
XPRESS WRITTEN PERMISSIO
N of th
e cop
yrigh
t-hold
er

National Conference on Climate Change and Agricultural Production: Adapting Crops to Climate Variability and Uncertainty, 6th–8th April, 2017
[465]
between the collar region and tip of primary root was measured and the mean value was expressed as root length in centimetre. The distance between the collar region and tip of primary shoot was measured and the mean value was expressed as shoot length in centimetre (ISTA, 1999). The seedlings used for root and shoot length measurement in each of the replications were dried under shade and kept in a hot air oven maintained at 85 ± 1°C for 24h. Then the seedlings were cooled in a desiccator for 30 min, weighed and the mean was expressed in milligram. Vigour index was calculated using the formulae as detailed below (Abdul-Baki and Anderson, 1973) and expressed in whole number. Vigour index = Germination percentage x [mean root length (cm) + mean shoot length (cm)]. The data obtained were analysed as described by Panse and Sukhatme (1985). Wherever necessary, the per cent values were made angular transformation before analysis. The critical differences (CD) were calculated at 5 per cent probability level.
RESULTS AND DISCUSSION
There are various factors which influence seed yield and other economic characters. Seed size is one of the most important factors besides varietal response. In the present investigation, seeds retained by BSS 18 × 18 sieve recorded higher recovery (47.2%) than those seeds retained by BSS 16 × 16 and BSS 20 × 20 sieves. The recovery of seeds comprising the size grades of BSS 16 × 16 and BSS 18 × 18 alone was about 87.7 per cent. The 100 seed weight differed due to seed size, which increased correspondingly with increase in seed size. The seeds retained by sieves of BSS 16 × 16 and BSS 18 × 18 recorded higher weights than by BSS 20 × 20 retained and passed and ungraded ones. Chakravarthy (2004) in palak and Manimohan (2008) in kalmegh reported a positive association between size and weight of seeds. The germination increased progressively with increase in seed size. The larger seeds retained by 16 × 16 recorded higher germination (92 %) followed by the seeds retained by 18 × 18. This is in conformity with the research findings of Adirai (1999) in pumpkin, Menaka (2000) and Manikandan (2008) in grain amaranth. The higher germination in large seeds may be due to the higher amount of food reserves and increased activity of redox-enzyme in the seeds helping in breaking down the complex materials into simple soluble sugars (Selvakumari, 2005). The other quality parameters like root length, shoot length and vigour index as measured through germination and seedling length showed the superiority of large size seeds retained by sieves BSS 16 × 16 and BSS 18 × 18. This could be ascribed to the more mature embryo containing adequate nutrient reserves both contributing its physiological stamina or vigour factors residing in it (Pollack and Roos, 1972). Similarly Vakeswaran (1998) in peas, Eevera (2000) in black gram and Rajasekaran (2001) in niger observed that seedling vigour characteristics were positively correlated with seed size and seed weight. From the present work it can be concluded that the larger seeds retained by BSS 16 × 16 and BSS 18 × 18 sieves showed greater seed germination and vigour than smaller ones of BSS 20 × 20 retained and passed.
REFERENCE [1] Abdul-Baki A A and Anderson J D 1973. Relationship between decarboxylation of glutamic acid and vigour in soybean seed.Crop Science13:
227-232.
It is I
LLEGAL t
o cop
y, pri
nt or
save
any c
onten
t of th
is PDF,
in pa
rt or in
full,
on an
y retr
ieval
syste
m,
withou
t the E
XPRESS WRITTEN PERMISSIO
N of th
e cop
yrigh
t-hold
er

National Conference on Climate Change and Agricultural Production: Adapting Crops to Climate Variability and Uncertainty, 6th–8th April, 2017
[466]
Improvement of Quality and Shelf Life of Osmotic Dehydrated Product of Guava Slices
Minakshi Kumari* and Vijay Bahadur Department of Horticulture, Sam Hingginbottom Institute of Agriculture,
Technology & Sciences, Allahabad–211008, (U.P.) E-mail: *[email protected]
INTRODUCTION
Guava is a rich source of ascorbic acid and pectin. Excellent salad and pudding are prepared from the shell of the ripe fruit. It can be preserved by canning as halves or quarters, with or without seed core. Drying and dehydration is the removal of majority of water contained in the fruits or vegetables and is the primary stage in the preparation of dehydrated fruits and vegetables. In osmotic dehydration, the fruits are subjected to osmosis by dipping or spreading them in concentrated sugar syrup under specific condition, so that the water from the fruits migrates to sugar syrup. Major dehydration of the fruits takes place in this process step, the final dehydration of guava slices to make it suitable for marketing is carried out by cabinet drying.
METHODS AND MATERIALS
The experiment was carried out in the Department of Horticulture, Sam Higginbottom Institute of Agriculture, Technology and Sciences, Allahabad during 2013 in the Completely Randomized Design (CRD) with 16 treatments and 3 replications and stored for 90 days under ambient temperature. the treatment details T1: Dipping in 600Brix sucrose without blanching, T2 : Dipping in 700 Brix sucrose without blanching, T3: Dipping in 300 Brix honey without blanching, T4: Dipping in 400 Brix honey without blanching,T5 : Blanching in 0.5% KMS for 3 min. followed by dipping in 600 Brix sucrose for 12 hours, T6 : Blanching in 0.5% KMS for 3 min. followed by dipping in 700Brix sucrose for 12 hours, T7: Blanching in 0.5% KMS for 3 min. followed by dipping in 300 Brix honey for 12 hours, T8: Blanching in 0.5% KMS for 3 min. followed by dipping in 400 Brix honey for 12 hours, T9: Blanching in 0.5% ascorbic acid for 3 min. followed by dipping in 600 Brix sucrose for 12 hours, T10: Blanching in 0.5% ascorbic acid for 3 min. followed by dipping in 700 Brix sucrose for 12 hours, T11 : Blanching in 0.5% ascorbic acid for 3 min. followed by dipping in 300 Brix honey for 12 hours, T12 : Blanching in 0.5% ascorbic acid for 3 min. followed by dipping in 400 Brix honey for 12 hours,T13 : Blanching in 1% citric acid for 3 min. followed by dipping in600 Brix sucrose for 12 hours, T14 : Blanching in 1% citric acid for 3 min. followed by dipping in 700 Brix sucrose for 12 hours, T15 : Blanching in 1% citric acid for 3 min. followed by dipping in 300 Brix honey for 12 hours, T16: Blanching in 1% citric acid for 3 min. followed by dipping in 400 Brix honey for 12 hours. The samples were subjected to pre-treatments i.e. blanching with 0.5% KMS/0.5% Ascorbic acid/1% citric acid for 3 min. followed by dipping in 600/700Brix sucrose/300/400 honey for 12 hours. The sensory evaluation for assigning scores for the samples were conducted by a panel of five judges and the product was rated on a 9-point Hedonic scale (Amerine et.al, 1965).
It is I
LLEGAL t
o cop
y, pri
nt or
save
any c
onten
t of th
is PDF,
in pa
rt or in
full,
on an
y retr
ieval
syste
m,
withou
t the E
XPRESS WRITTEN PERMISSIO
N of th
e cop
yrigh
t-hold
er
National Conference on Climate Change and Agricultural Production: Adapting Crops to Climate Variability and Uncertainty, 6th–8th April, 2017
[467]
RESULT AND DISCUSSION
The moisture content of dehydrated guava slices samples showed a gradually increased trend. This may be concluded to a simple fact that the dehydrated guava slices also went through the natural physiological process of respiration which has forced the slices to absorb moisture in the storage period (Khurdiya and Roy, 1986) related to guava powder. The increased acidity in dehydrated guava slices in storage period may be the combined effect of physiological reactions and storage duration. The experimental result was found significant and it may be concluded that Blanching in 0.5% KMS followed by dipping in 700 Brix sucrose) gave the best result in total soluble solids (23.530 Brix), acidity (0.34%), non-reducing sugar (5.82%) and also excellent in organoleptic quality while Dipping in 300 Brix honey without blanching emerged as best treatment in terms of highest benefit cost ratio (1.85). The recovery percentage of dehydrated guava slices compared to honey and sucrose treated slices significantly differed among each other. If compared among all the treatments, the highest recovery percentage (35.90%) was with the treatment Blanching in 1% citric acid for 3 min. followed by dipping in 700 Brix sucrose for 12 hours, followed by blanching in 0.5% ascorbic acid for 3 min. followed by dipping in 700 Brix sucrose for 12 hours (34.91%), blanching in 1% citric acid for 3 min. followed by dipping in600 Brix sucrose for 12 hours, however, the lowest recovery percentage (24.91%) was with the treatment of blanching in 1% citric acid for 3 min. followed by dipping in 300 Brix honey for 12 hours This clearly showed that among all the treatments prepared here, the sucrose treated samples were with higher recovery percentage as compared to honey treated samples.
REFERENCES [1] Amerine, M. A., R. M. Pangborn, E. B. Roessler. 1965. Principles of sensory evaluation of food. J. Food Science and Technology Monographs.
pp. 338-339. Academic Press, New York. [2] Khurdiya, D.S. and Roy, S.K. (1986) Studies on canning of mango slices in covering syrup containing mango pulp.Indian Food Pack.40:50-54
Effect of Micronutrients Foliar Application to Direct Seeded Basmati Rice on Micronutrients Status in Soil
Jagjot Singh Gill1* and Sohan Singh Walia2
1Farm Advisory Service Centre, Ferozepur–152002, (Punjab), India 2Department of Agronomy, Punjab Agricultural University, Ludhiana–141004, (Punjab), India
E-mail: *[email protected]
INTRODUCTION
Increasing scarcity of resources and emerging energy crisis are major threats to productivity and sustainability of rice in North West India. Direct seeded rice is an alternative method with advantages like less labour, water and energy requirements. Micronutrients like Fe, Mn and Zn are essential for growth and development of the living plants (Hall and Williams 2003). However, application of micronutrients fertilizers to the soil may not meet the crop requirements at different stages of growth and development. Foliar application of these micronutrients is an alternative effective approach. Application of micronutrients fertilizers in the cultivation may not meet the crop requirement for growth and nutrient use, thus the alternative effective approach is to apply these micronutrients as a foliar spray (Arif et al. 2006). Keeping all these points in view, the present
It is I
LLEGAL t
o cop
y, pri
nt or
save
any c
onten
t of th
is PDF,
in pa
rt or in
full,
on an
y retr
ieval
syste
m,
withou
t the E
XPRESS WRITTEN PERMISSIO
N of th
e cop
yrigh
t-hold
er

National Conference on Climate Change and Agricultural Production: Adapting Crops to Climate Variability and Uncertainty, 6th–8th April, 2017
[468]
investigation was planned to study the effect of micronutrients foliar application todirect seeded basmati rice on micronutrients status in soil.
Fig. 1: Effect of Foliar Feeding of Micronutrients on Zn, Mn and Fe Status of Soil (Pooled Data of two Years)
The present study entitled, “Effect of micronutrients foliar application todirect seeded basmati rice on micronutrients status in soil” was conducted at the Student's Research Farm, Department of Agronomy, Punjab Agricultural University, Ludhiana during kharif season 2010 and 2011.The soil of the experimental field was categorized as sandy loam with normal soil reaction and electrical conductivity, low in organic carbon and available nitrogen (N), medium in available phosphorus (P) and potassium (K).Field experiment was conducted in Randomized Block Design with 13 treatments viz; Control (No spray), (Zn1) ZnSO4 0.5% one spray at 70 DAS, (Zn2) ZnSO4 0.5% two sprays at 60 and 70 DAS, (Zn3) ZnSO4 0.5% three sprays at 50, 60 and 70 DAS, (Zn4) ZnSO4 0.5% four sprays at 40, 50, 60 and 70 DAS, (Mn1) MnSO4 0.5% one spray at 70 DAS, (Mn2) MnSO4 0.5% two sprays at 60 and 70 DAS, (Mn3) MnSO4 0.5% three sprays at 50, 60 and 70 DAS, (Mn4) MnSO4 0.5% four sprays at 40, 50, 60 and 70 DAS, (Fe1) FeSO4 1.0% one spray at 70 DAS, (Fe2) FeSO4 1.0 % two sprays at 60 and 70 DAS, (Fe3) FeSO4 1.0 % three sprays at 50, 60 and 70 DAS, (Fe4) FeSO4 1.0 % four sprays at 40, 50, 60 and 70 DAS. The sources of Zn, Mn and Fe were ZnSO4.H2O (ZnSO4 0.5%), MnSO4.H2O (MnSO4 0.5%) and FeSO4.7H2O (FeSO4 1.0%) with nutrient content 33% Zn,
3.8
3.9
3.9
3.8
3.9
3.8
3.9
3.9
3.8
3.8
3.9
3.9
3.8
3.3
11
.4
11
.5
11
.4
11
.4
11
.3
11
.4
11
.4
11
.4
11
.4
11
.4
11
.4
11
.5
11
.4
9.4
21.2
21.2
21.2
21.2
21.2
21.2
21.2
21.2
21.2
21.2
21.2
21.2
21.2
20.4
0
5
10
15
20
25
Cont
rol
Zn1
Zn2
Zn3
Zn4
Mn1
Mn2
Mn3
Mn4 Fe
1
Fe2
Fe3
Fe4
Initi
al va
lues
(Val
ues p
pm)
Treatments
Zn (ppm) Mn (ppm) Fe (ppm)
It is I
LLEGAL t
o cop
y, pri
nt or
save
any c
onten
t of th
is PDF,
in pa
rt or in
full,
on an
y retr
ieval
syste
m,
withou
t the E
XPRESS WRITTEN PERMISSIO
N of th
e cop
yrigh
t-hold
er

National Conference on Climate Change and Agricultural Production: Adapting Crops to Climate Variability and Uncertainty, 6th–8th April, 2017
[469]
30% Mn and 19% Fe. Micronutrients were sprayed through ZnSO4.H2O (ZnSO4 0.5%), MnSO4.H2O (MnSO4 0.5%) and FeSO4.7H2O (FeSO4 1.0%). Basmati rice variety Punjab Mehak 1 was used as test variety.
Pooled data of two years on nutrient status in soil was recorded before sowing and after harvest of direct seeded basmati rice shown in Fiure1. The results showed that DTPA-extractable Zn, Mn and Fe contents of soil did not influenced significantly by foliar applications of micronutrients ZnSO4 0.5%, MnSO4 0.5% and FeSO4 1.0%.
REFERENCES [1] Arif, M., Khan, M.A., Akbar H. and Ali, S. 2006. Prospects of wheat as a dual purpose crop and its impact on weeds. Pak. J. Weed Sci. Res., 12:
13-17. [2] Hall, J.L. and Williams, L.E. 2003.Transition metal transporters in plants. J. Exp. Bot., 54: 2601-2613.
Standardization of Time and Technique of Grafting for Quality Production of Nursery Plants of Amrapali Mango (Mangifera indica L.)
Syed Sami Ullah1*, Sunil Malik2, Satya Prakash2, Ranjeet Kumar2 and Sohanveer2 1Division of Fruit Science, Sher-e-Kashmir University of Agricultural Sciences and
Technology of Kashmir, Shalimar, Srinagar–190025, India 2Department of Horticulture, Sardar Vallabhbhai Patel University of Agriculture and
Technology, Meerut–250110, India E-mail: *[email protected]
Keywords: Amrapali, Veneer Grafting, Mango, Softwood Grafting, Epicotyl Grafting
INTRODUCTION
Mango (Mangifera indica L.) belonging to the family Anacardiaceae is one of the most important fruit crops grown in India and is acknowledged as the “King of Fruits” of this country. Mango is cross pollinated crop and is heterozygous in nature, therefore, plants raised by seeds leads to enormous variability and are never true to type. The plants raised through seed are tall and spreading type which causes lot of hazards in performing various cultural operations and also plants take long time to come into bearing. Therefore, vegetative methods are adopted to get true to type plants Singh (2009). Thus, a study was conducted with the core objective of standardization of time and technique of grafting for quality production of nursery plants.
MATERIALS AND METHODS
The research was conducted at Horticultural Research Centre (HRC) of Sardar Vallabhbhai Patel University of Agriculture and Technology, Meerut, Uttar Pradesh, during 2013–14. The rootstocks for grafting were raised from mango stones of unknown commercial cultivars. Epicotyl grafting was performed on 10 day old seedlings grown in black poly bags filledwith soil, sand and FYM in the ratio of 1:1:1 while as veneer and softwood grafting were performed on one year old seedlings. Amrapali, the prominent cultivars of mango were used as scion for grafting.
It is I
LLEGAL t
o cop
y, pri
nt or
save
any c
onten
t of th
is PDF,
in pa
rt or in
full,
on an
y retr
ieval
syste
m,
withou
t the E
XPRESS WRITTEN PERMISSIO
N of th
e cop
yrigh
t-hold
er

National Conference on Climate Change and Agricultural Production: Adapting Crops to Climate Variability and Uncertainty, 6th–8th April, 2017
[470]
RESULTS AND DISCUSSION
The maximum per cent success was observed when grafting was performed on 10th August followed by 25th July and 25th August after six months of grafting (Table 1). Among the treatments, veneer grafted grafts recorded the maximum per cent success followed by softwood and epicotyl grafted grafts. The interaction effect of time and technique of grafting indicated that the maximum per cent success was observed in veneer grafting when performed on 10th August (79.60%) and minimum per cent success was observed in epicotyl grafting when performed on 25th August (58.06%). The findings of the current study are in accordance with the findings obtained by Nayak and Sen (2000). They observed that the per cent success was higher when grafting was done in July-August as compared with grafting done in January-March. While investigating the effect of epicotyl grafting, Pandey and Singh (2001) recorded the earliest sprouting and highest survival percentage in August. In the present study, the grafts made on 10th August exhibited more per cent success closely followed by the grafts made on 25th July and 25th August. This might be due to favourable environment conditions for cambium growth of scion and rootstock. This fact became clear when the correlation with meteorological observations were worked out. Therefore, veneer grafting should be preferred over softwood and epicotyl grafting in order to get better survival and over all sprout growth for commercial propagation of quality plants of Amrapali mango in poly bags under climatic conditions.
REFERENCES [2] Nayak G and Sen S K 2000. Seasonal influence of veneer grafting of mango (Mangifera indica L.). Environment and Ecology 18(1):
156-158. [3] Pandey V and Singh Y N 2001. Effect of meteorological factors and inter-relationship of quality parameters in stone grafting of mango.
Orissa Journal of Horticulture 29(2): 58-60. [4] Singh R N 2009. Establishing the orchard in mango. Indian Council of Agricultural Research, New Delhi.
Organic Farming Practices: A Way for Sustainable Agriculture
Dr. V. Sakthirama1* and Dr. S.D. Sivakumar2 1Post-Doctoral Fellow, Department of Agricultural and Rural Management, TNAU, Coimbatore-641003
2Professor, Department of Social Sciences, ADAC&RI, Trichy E-mail: *[email protected]
Keywords: organic farming, sustainable agriculture, farmers’ attitude.
INTRODUCTION
The last two decades has witnessed a growth in the organic farming in which food products produced with naturally derived organic inputs. The organic farming is consisting integrated farming practices which help to healthy eco system in the farm. In addition, organic farming helps to sustainable agriculture which is defined as the production of food, fiber, or other plant or animal products using farming techniques that protect the environment, public health, human communities, and animal welfare. In this study, we analyze the farmers’ attitude and various organic farming practices with healthy farm eco system used in Tamilnadu.
MATERIAL AND METHODS
The study was conducted in four districts of Tamilnadu, Coimbatore, Erode, Salem and Dharmapuri. In each district 60 respondents were selected from the registered farmers’ list of Tamilnadu Organic Certification Department. Totally 240 farmers were surveyed with the help of well-structured interview schedule (2015-
It is I
LLEGAL t
o cop
y, pri
nt or
save
any c
onten
t of th
is PDF,
in pa
rt or in
full,
on an
y retr
ieval
syste
m,
withou
t the E
XPRESS WRITTEN PERMISSIO
N of th
e cop
yrigh
t-hold
er

National Conference on Climate Change and Agricultural Production: Adapting Crops to Climate Variability and Uncertainty, 6th–8th April, 2017
[471]
2016). In addition, the secondary data were collected from different published sources like research articles and department publications. Attitude scale was developed and used for this study with five point likert scale. The SPSS 20 package was used for this study to analyze the variables.
RESULTS AND DISCUSSION
Based on the analysis of survey data, the most of organic farmers were having medium (42.5 percent) (2-5 hectares) and small (35.42) (less than/equal to 2 hectares) category land holding sizes. While considering sources of farm input, 75 per cent of respondents were prepared farmer inputs by their own with maintenance of different farm eco systems. In the organic farm eco system, 98.3 per cent of farmers were used cow for farming practices. Especially 76.7 percent of respondent used indigenous cows (Figure 1). The majority of respondents (97 per cent) having positive attitude that organic farming system helps to maintain sustainable agriculture.
Fig. 1: The Organic Farm Eco System
REFERENCES [1] D Rigby and D Caceres 2001.Organic farming and the sustainability of agricultural systems.Agricultural Systems 68: 21- 40.
98.3
76.773.3
28.3
65.4
21.7
85.080.4 81.7
11.3
0.0
20.0
40.0
60.0
80.0
100.0
120.0
It is I
LLEGAL t
o cop
y, pri
nt or
save
any c
onten
t of th
is PDF,
in pa
rt or in
full,
on an
y retr
ieval
syste
m,
withou
t the E
XPRESS WRITTEN PERMISSIO
N of th
e cop
yrigh
t-hold
er

National Conference on Climate Change and Agricultural Production: Adapting Crops to Climate Variability and Uncertainty, 6th–8th April, 2017
[472]
Effect of Chitosan Based Superabsorbent on Water Retention Behaviour of Soil and Seedling Growth of Alfalfa (Medicago Sativa)
Priyal Pandey1* and Nirmal De2 1Research Scholar, Department of Soil Science & Agricultural Chemistry, Institute of Agricultural
Sciences, Banaras Hindu University, Varanasi, India–221005 2Professor, Department of Soil Science & Agricultural Chemistry, Institute of Agricultural Sciences,
Banaras Hindu University, Varanasi, India–221005 E-mail: *[email protected]
Keywords: Rainfed agriculture, Chitosan, Superabsorbent, Hydrogel, Moisture retention.
INTRODUCTION
Inadequate use of rain & irrigation water by crops is most crucial problem in agriculture. Application of water-saving super absorbent polymers (SAP) in to the soil could be an effective way to increase both water and nutrient use efficiency in crops. Superabsorbant addition in soil improved water retention capacity of soil and delays permanent wilting percentage under intense evaporation , thus significantly reduce irrigation requirement of many crops (Taylor and Halfcre, 1986).But superabsorbent hydrogels available in the market are mostly acrylate-based products, thus not biodegradable. So concerning environmental issue a biodegradable and ecofriendly superabsorbent need to be used (Cannazza et al., 2014).The objective of present study was to Synthesize an innovative ecofriendly chitosan-based superabsorbent and determine its effect on water retention behaviour of two soil and seedling growth response of alfalfa in soil amended with superabsorbent.
MATERIAL AND METHODS
Ecofriendly Chitosan based superabsorbent was synthesized in laboratory by polymerization reaction in Department of soil science and agricultural chemistry , Institute of Agricultural Sciences, Banaras hindu university in march 2016.Red and alluvial soil were amended with Superabsorbant power (40-60 mesh size) to evaluate the moisture retention properties of red and alluvial soil in presence of superabsorbent with respect to unamended soil and seed germination and seedling growth of alfalfa plant was also evaluated in presence of superabsorbent .
RESULT AND CONCLUSION
The soil amendment with 0.1 % of superabsorbent hydrogel enhanced the moisture retention significantly at field capacity in both red and alluvial soil as compared to the untreated soil. Besides, seed germination and seedling growth of Alfalfa was found to be notably improved with the application of chitosan based superabsorbent hydrogel. A delay in wilting of seedlings by 6-10 days was observed for chitosan based hydrogel amended soil, thereby improving alfalfa plant growth and establishment. The adoption of the chitosan based hydrogel in cultivations could thus represent a promising solution for the rationalization of water resources, especially in rainfed areas. Use of superabsorbent in rain fed and drought prone area can improve seed establishment and plant growth and chitosan based superabsorbent may prove as ecofriendly substitute to commercially available acryl ate based superabsorbent.
REFERENCES [1] Taylor K C, and Halfacre RG 1986 .The effect of hydrophilic polymer on media water retention and nutrient availability to Ligustrum.
Hort. Sci. 21:1159-1161. [2] Cannazza G , Cataldo A, De Benedetto E, Demitri C, Madaghiele M and Sannino A 2014.Experimental assessment of the use of a novel
superabsorbent polymer (SAP) for the optimization of water consumption in agricultural irrigation process.Water6(7): 2056-2069.
It is I
LLEGAL t
o cop
y, pri
nt or
save
any c
onten
t of th
is PDF,
in pa
rt or in
full,
on an
y retr
ieval
syste
m,
withou
t the E
XPRESS WRITTEN PERMISSIO
N of th
e cop
yrigh
t-hold
er

National Conference on Climate Change and Agricultural Production: Adapting Crops to Climate Variability and Uncertainty, 6th–8th April, 2017
[473]
Response of Wheat to Wastewater Irrigation and NPK Levels under Flat and Raised Bed Planting
Rajender Kumar*, D.S. Gurjar, Rajendra Singh, Neeta Dwivedi and Ravinder Kaur Water Technology Centre, Indian Agricultural Research Institute, New Delhi–110012
E-mail: *[email protected]
Keywords: Flat and raised bed, ground water, irrigation, nutrients, wastewater, wheat
INTRODUCTION
Under present scenario of squeezing water share for agriculture sector while increasing demands of other sectors for fresh water, there is an urgent need to explore non-conventional sources of irrigation to sustain the food production. Appropriate utilization of wastewater generated especially from urban and peri-urban areas offers enough scope for irrigation purposes with suitable and matching production techniques. There is huge gap between wastewater generation and its treatment i.e. only 31 % due to financial and other constraints as per estimates of CPCB (2009). Further, higher concentration of nutrients in wastewater also improves the productivity while reducing the dependency on chemical fertilizers. About 1.5 million hectares of land area in India can be irrigated annually using sewage water that has a potential to contribute about one million tonnes of nutrients. In addition, wastewater use as irrigation also offers a reliable and inexpensive way of wastewater disposal (Feigin et al., 1991).
MATERIALS AND METHODS
A field experiment was conducted to study the response of wheat to wastewater irrigation with varying levels of NPK under different land configuration at WTC Farm of IARI, New Delhi during rabi season 2015-16. The experiment comprised of two sources of irrigation water (Ground water and Municipal wastewater) and three levels of NPK (Control/Zero NPK, Recommended NPK and Recommended NPK-NPK supplied by irrigation waters) under flat and raised bed planting of wheat (variety ‘HD 2967’) was conducted in split plot design with three replications.
RESULTS AND DISCUSSION
Wastewater irrigation recorded 6.5 % higher wheat grain yield compared to that of ground water irrigation but the difference was statistically non-significant. Application of recommended dose of NPK (120:60:40 NPK kg/ha) and adjusted NPK produced significantly higher wheat grain yield as compared to control. Interaction effect showed that application of recommended NPK dose under wastewater irrigation produced significantly higher wheat grain yield than that of recommended NPK with ground water irrigation. Further, it was also observed that wastewater irrigated along with adjusted NPK dose produced similar yield (48.0 q/ha) to that of recommended NPK with ground water irrigation (48.9 q/ha) there by indicated 56, 23 and 100 % saving of NPK respectively.
REFERENCES [1] CPCB. 2009. Status of water supply and wastewater generation and treatment in Class-I cities and Class-II towns of India. Control of Urban
Pollution Series: CUPS/70/2009-10. Ministry of Environment and Forests, Govt. of India, Parivesh Bhawan, East Arjun Nagar, Delhi 110032. [2] Feigin, A.; Ravina, I. & Shalhevet, J. (1991).Irrigation with treated sewage effluent- Management for Environmental Protection. Advanced Series
in Agricultural Sciences,17, pp 224, Springer-Verla.
It is I
LLEGAL t
o cop
y, pri
nt or
save
any c
onten
t of th
is PDF,
in pa
rt or in
full,
on an
y retr
ieval
syste
m,
withou
t the E
XPRESS WRITTEN PERMISSIO
N of th
e cop
yrigh
t-hold
er

National Conference on Climate Change and Agricultural Production: Adapting Crops to Climate Variability and Uncertainty, 6th–8th April, 2017
[474]
Cultivation of Mushrooms as an Option for Mitigating Climate Risks
Durga Prasad1, V.B. Patel2*, Shridhar Patil3 and A.B. Patel4 1Department of Plant Pathology, 2Department of Horticulture
3Department of Extension Education, 4Senior Research Fellow 1,2Bihar Agricultural College, Bihar Agricultural University, Sabour–813210, Bihar, India
E-mail: *[email protected], [email protected]
Keywords: Agaricus bisporus, Pleurotus florida, Calocybe indica, mushroom, Volvariella volvacea
The National food and nutritional security of growing population is a great challenge, which looks for new crop as source of food and nutrition. In this context, mushrooms find a favor which can be grown even by landless people, that too on waste material and could be a source for proteineous food. India has tremendous potential for mushroom production and all commercial edible and medicinal mushrooms can be grown. Raising of mushroom has shown potential to counteract climate risks by the resource poor farmers. As per climatic conditions, the mushrooms grown in India are categorized in three groups’ viz., temperate, sub-tropical and tropical mushrooms (Manjit et al., 2011). The temperate mushrooms grown at about 200C are winter white button mushroom (Agaricus bisporus), oyster mushrooms (Pleurotus ostreatus, P. florida- winter strain, P.fossulatus- Kabul dhingri and P. eryngii- King oyster),shiitake (Lentinula edodes) and Flammulina velutipes (fruiting at 10-140C). The subtropical mushrooms grown at about 250C are summer white button mushroom (Agaricus.bitorquis), oyster mushroom (Pleurotus sajor-caju), P. flordia, P. flabellatus, P. eous, shiitake (Lentinula edodes), black ear mushroom (Auricularia polytricha), and black poplar mushroom (Agrocybe aegerita). The tropical mushrooms which can be grown at about 300C are paddy straw mushroom (Volvariella volvacea), milky mushroom (Calocybe indica) andReishi mushroom (Ganoderma lucidum). Four mushrooms species viz., winter white button mushroom, oyster mushroom (Pleurotus florida), paddy-straw mushroom and milky mushroom are being cultivated in Bihar. The winter white button mushroom can be cultivated from mid November to mid March. The optimum temperature for vegetative growth is 22-25°C and that for fruit body formation is 14-18°C. This mushroom also needs a high percentage (>85%) of relative humidity. The substrate for cultivation of this mushroom is specially prepared compost. Oyster mushroom grows naturally on dead and decaying cellulosic materials. Oyster mushroom can grow at moderate temperature ranging from 20 to 300 C and humidity >60%. The paddy straw mushroom is also known as tropical or warm mushroom and it can be grown at a wide range of temperature (28-48°C) but the optimum temperature for well growth is 30-35 °C.Milky Mushroom can be easily grown in the temperature range of 25-35 0C (Doshi A and Sharma S S, 1995). These mushrooms are cultivating successfully in rural areas of Bihar under farmer FIRST project, for enhancing the income of resource poor farmers.
REFERENCES [1] Manjit S, Bhuvnesh V, Shwet K and Wakchaure G C 2011.Mushrooms cultivation, marketing and consumption. Directorate of Mushroom
Research (ICAR), pp. 266 [2] Doshi A and Sharma S S 1995. Production technology of specialty mushrooms In: Advances in horticulture Chadha K L and Sharma S R
Sharma Eds. 13: 135-154
It is I
LLEGAL t
o cop
y, pri
nt or
save
any c
onten
t of th
is PDF,
in pa
rt or in
full,
on an
y retr
ieval
syste
m,
withou
t the E
XPRESS WRITTEN PERMISSIO
N of th
e cop
yrigh
t-hold
er

National Conference on Climate Change and Agricultural Production: Adapting Crops to Climate Variability and Uncertainty, 6th–8th April, 2017
[1]
THEME 4 Crop Weather Pest Dynamics and Innovative
Agronomic and Breeding Practices
It is I
LLEGAL t
o cop
y, pri
nt or
save
any c
onten
t of th
is PDF,
in pa
rt or in
full,
on an
y retr
ieval
syste
m,
withou
t the E
XPRESS WRITTEN PERMISSIO
N of th
e cop
yrigh
t-hold
er

It is I
LLEGAL t
o cop
y, pri
nt or
save
any c
onten
t of th
is PDF,
in pa
rt or in
full,
on an
y retr
ieval
syste
m,
withou
t the E
XPRESS WRITTEN PERMISSIO
N of th
e cop
yrigh
t-hold
er

National Conference on Climate Change and Agricultural Production: Adapting Crops to Climate Variability and Uncertainty, 6th–8th April, 2017
[477]
Seasonal Incidence of Pigeonpea Pod Fly, Melanagromyza obtusa Mall
M.P. Pathade* and S.L. Borkar Department of Agricultural Entomology, Dr. PDKV,
Krishinagar, Akola–444104, India E-mail: *[email protected]
Keywords: Melanagromyza obtusa, Pigeonpea, Seasonal Incidence
INTRODUCTION
Pigeonpea, Cajanus cajan (L.) Millsp., is one of the major pulse crops of the tropics and subtropics. Melanagromyza obtusa (Mall.) (Diptera: Agromyzidae) is a serious pest of pigeonpea in Northern Madhya Pradesh, Uttar Pradesh, Bihar, Delhi, Maharashtra, Gujarat, Orissa and Haryana. The focus on the impact of various meterological factors (temperature, relative humidity, rain, sunshine and wind speed) revealed on the population of Pigeonpea pod fly maggot in variety PKV Tara. We analyzed the population of larvae of M. obtuse increased from mid October to the end of November.
MATERIALS AND METHODS
The study was conducted on the field of Department of Entomology, Dr. PDKV, Akola for year 2010–2011 during kharif season. Weekly pest incidence of pod fly was recorded from pod initiation to maturity stage of plant based on 50 pods per plant picked from five randomly selected plants. The data regarding maximum and minimum temperature, relative humidity and rainfall recorded at Meterological observatory, Dr. PDKV, Akola in different meterological weeks during the course of field experiment. Quantitative relationship between the Average population/ 50 pods and the weather parameters viz., ambient temperature (both maximum and minimum), relative humidity and rainfall were worked out by using the method of correlation and expressed in the form of mathematical equations.
RESULTS AND DISCUSSION
The mean population of M. obtusa, in general, was found to increase from 3.0 to maximum 18.0 maggots/50 pods during the period between November and January beginning, when the average maximum temperature (23.6 to 31.2°C), minimum temperature (7.5 to 21.1°C), morning relative humidity (80 to 92%), evening relative humidity (22 to 49%) and rainfall (0.0 to 2.1) mm (Table 1). The data presented in table-1 indicates that the pupal population of pod fly was found to increase from 1.0 to 23.0 pupa/50 pods during November to January, when the mean maximum temperature, minimum temperature, morning relative humidity, evening relative humidity and rainfall ranged from 23.6 to 31.2°C, 7.5 to 18.4°C, 66 to 90%, 22 to 43% and 0.0 mm, respectively. Correlation coefficient values worked out between M. obtusa of Pigeonpea and weather parameter revealed that none of the parameters had significant effect on the occurrence of M. obtusa (Akhauri et al., 1997). Significant negative correlation existed between M. obtusa maggot and pupa in pods and maximum temperature, minimum temperature, relative humidity (morning), relative humidity (evening) and rainfall. This was in accordance with earlier report of Kumar and Nath (2004) who established negative correlation between M. obtusa population and weather parameters. The information generated can be utilized in management strategy of M. obtusa in Pigeonpea.
It is I
LLEGAL t
o cop
y, pri
nt or
save
any c
onten
t of th
is PDF,
in pa
rt or in
full,
on an
y retr
ieval
syste
m,
withou
t the E
XPRESS WRITTEN PERMISSIO
N of th
e cop
yrigh
t-hold
er
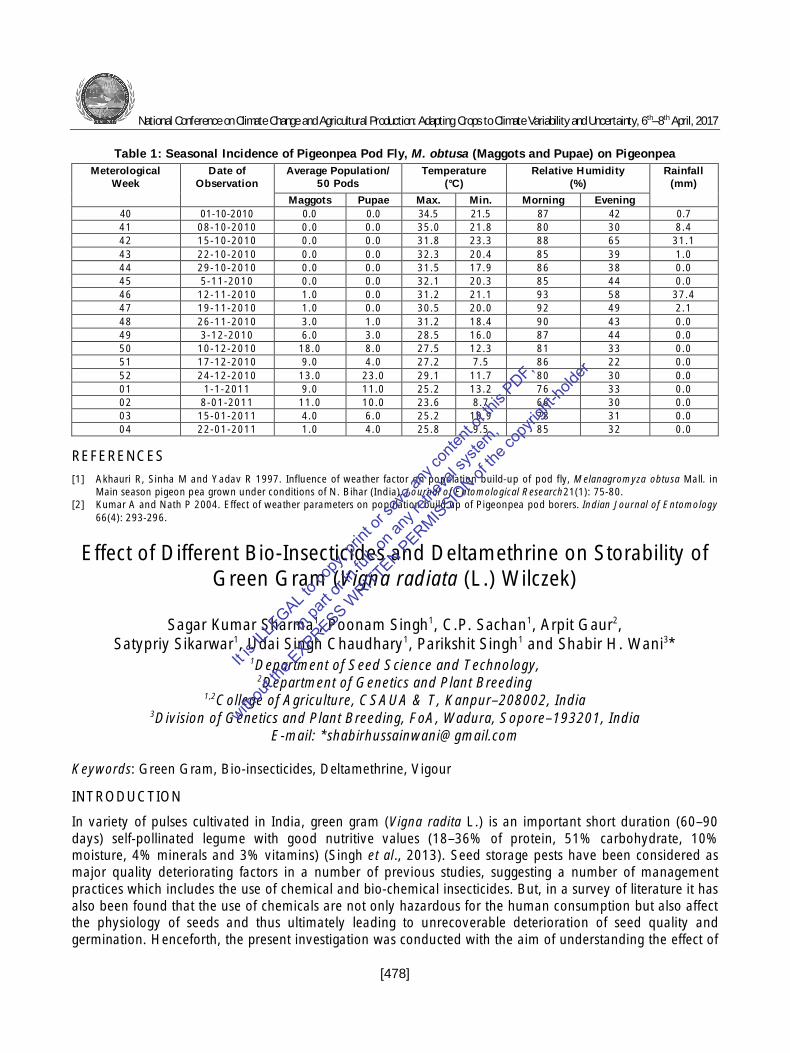
National Conference on Climate Change and Agricultural Production: Adapting Crops to Climate Variability and Uncertainty, 6th–8th April, 2017
[478]
Table 1: Seasonal Incidence of Pigeonpea Pod Fly, M. obtusa (Maggots and Pupae) on Pigeonpea Meterological
Week Date of
Observation Average Population/
50 Pods Temperature
(°C) Relative Humidity
(%) Rainfall
(mm)
Maggots Pupae Max. Min. Morning Evening 40 01-10-2010 0.0 0.0 34.5 21.5 87 42 0.7 41 08-10-2010 0.0 0.0 35.0 21.8 80 30 8.4 42 15-10-2010 0.0 0.0 31.8 23.3 88 65 31.1 43 22-10-2010 0.0 0.0 32.3 20.4 85 39 1.0 44 29-10-2010 0.0 0.0 31.5 17.9 86 38 0.0 45 5-11-2010 0.0 0.0 32.1 20.3 85 44 0.0 46 12-11-2010 1.0 0.0 31.2 21.1 93 58 37.4 47 19-11-2010 1.0 0.0 30.5 20.0 92 49 2.1 48 26-11-2010 3.0 1.0 31.2 18.4 90 43 0.0 49 3-12-2010 6.0 3.0 28.5 16.0 87 44 0.0 50 10-12-2010 18.0 8.0 27.5 12.3 81 33 0.0 51 17-12-2010 9.0 4.0 27.2 7.5 86 22 0.0 52 24-12-2010 13.0 23.0 29.1 11.7 80 30 0.0 01 1-1-2011 9.0 11.0 25.2 13.2 76 33 0.0 02 8-01-2011 11.0 10.0 23.6 8.7 66 30 0.0 03 15-01-2011 4.0 6.0 25.2 10.9 78 31 0.0 04 22-01-2011 1.0 4.0 25.8 9.5 85 32 0.0
REFERENCES [1] Akhauri R, Sinha M and Yadav R 1997. Influence of weather factor on population build-up of pod fly, Melanagromyza obtusa Mall. in
Main season pigeon pea grown under conditions of N. Bihar (India). Journal of Entomological Research21(1): 75-80. [2] Kumar A and Nath P 2004. Effect of weather parameters on population build up of Pigeonpea pod borers. Indian Journal of Entomology
66(4): 293-296.
Effect of Different Bio-Insecticides and Deltamethrine on Storability of Green Gram (Vigna radiata (L.) Wilczek)
Sagar Kumar Sharma1, Poonam Singh1, C.P. Sachan1, Arpit Gaur2, Satypriy Sikarwar1, Udai Singh Chaudhary1, Parikshit Singh1 and Shabir H. Wani3*
1Department of Seed Science and Technology, 2Department of Genetics and Plant Breeding
1,2College of Agriculture, CSAUA & T, Kanpur–208002, India 3Division of Genetics and Plant Breeding, FoA, Wadura, Sopore–193201, India
E-mail: *[email protected]
Keywords: Green Gram, Bio-insecticides, Deltamethrine, Vigour
INTRODUCTION
In variety of pulses cultivated in India, green gram (Vigna radita L.) is an important short duration (60–90 days) self-pollinated legume with good nutritive values (18–36% of protein, 51% carbohydrate, 10% moisture, 4% minerals and 3% vitamins) (Singh et al., 2013). Seed storage pests have been considered as major quality deteriorating factors in a number of previous studies, suggesting a number of management practices which includes the use of chemical and bio-chemical insecticides. But, in a survey of literature it has also been found that the use of chemicals are not only hazardous for the human consumption but also affect the physiology of seeds and thus ultimately leading to unrecoverable deterioration of seed quality and germination. Henceforth, the present investigation was conducted with the aim of understanding the effect of
It is I
LLEGAL t
o cop
y, pri
nt or
save
any c
onten
t of th
is PDF,
in pa
rt or in
full,
on an
y retr
ieval
syste
m,
withou
t the E
XPRESS WRITTEN PERMISSIO
N of th
e cop
yrigh
t-hold
er
National Conference on Climate Change and Agricultural Production: Adapting Crops to Climate Variability and Uncertainty, 6th–8th April, 2017
[479]
various bio and chemical insecticides on the storability of green gram seeds for a durable time period in addition of identification of a better bio-insecticide in order to reduce or replace the present chemical insecticide, in use.
MATERIALS AND METHODS
The present investigation was carried on the seeds of green gram var. PDM-139 (Samrat) at the seed testing laboratory of CSAUA&T-Kanpur (U.P). The whole experiment was conducted in factorial completely randomized design (FCRD) (for laboratory tests) and randomized block design (RBD) (for field emergence test). After taking the observations for seed germination and vigour traits at initial stage, the seeds from each treatment were bagged in three replicates and stored for eight months in seed warehouse. The observations for seed germination and other vigour traits were recorded with a frequency of a month up to the April 2015, apparently the temperature (oC) and relative humidity (%) were also recorded each time. The seed testing during the experiment was done as per the guidelines of ISTA Rules, 2007.
RESULTS AND DISCUSSION
A significant increase in seed quality parameters were recorded with insecticide over control. Significantly higher germination (85.65%), seedling length (19.51 cm), dry weight of seedling (0.192gm), seed vigour index-I (1880.96), seed vigour index-II (21.62), test weight (37.35 gm), seed volume (4.17cc), seed density (1.10g/cc), field emergence (81.63%), and lowest hard seeds (0.96%) were recorded when seeds were treated with deltamethrine @ 0.08 ml/kg (T2). Lowest EC value (0.07 dSm-1) was recorded when seeds were treated with deltamethrine @0.04 ml/kg (T1) after 8 months of storage. For maintaining highest germination, vigour and field emergence of green gram seeds var.PDM-139, it is advisable to give seed treatment with chemical insecticide deltamethrine @ 0.04 ml/kg & 0.08 ml/kg. However, on the basis of our experimental findings we recommends the use of bio-insecticide nemazol @ 5 ml/kg seed over the deltamethrine as both showed significantly at par performance for all the studied parameters, when stored for eight months in packaging of cloth bag under ambient storage conditions of Kanpur (U.P.), as the use of bio-insecticides is not only eco-friendly but also safer for the human lives. Beside above insecticides, eucalyptus oil @ 5ml/kg seed can also be used for maintaining germination and field emergence. Furthermore, we strongly supports, advises and encourage the use of bio-insecticides over chemo-pesticides for the sake of abetment of the hazardous effects of chemo-pesticides on both human as well as environment.
REFERENCES [1] International Seed Testing Association (ISTA) 2007. The germination test. International Rules for Seed Testing. Bassersdorf, Germany:
International Seed Testing Association. [2] Singh N, Singh H and Nagarajan P 2013. Development of SSR markers in mung bean, Vigna radiata (L.)Wilczek using in silico methods.
Journal of Crop Weed9: 69–74.
It is I
LLEGAL t
o cop
y, pri
nt or
save
any c
onten
t of th
is PDF,
in pa
rt or in
full,
on an
y retr
ieval
syste
m,
withou
t the E
XPRESS WRITTEN PERMISSIO
N of th
e cop
yrigh
t-hold
er
National Conference on Climate Change and Agricultural Production: Adapting Crops to Climate Variability and Uncertainty, 6th–8th April, 2017
[480]
A Reproducible Regeneration Protocol for Brassica carinata Cultivar PC-05
Javeed A. Lone1, Shabir H. Wani1*, S.K. Gupta1 and Manmohan Sharma2 1Division of Genetics and Plant Breeding, FoA, Wadura, Sopore–193201, India
2Division of Genetics and Plant Breeding, Sher-e-Kashmir University of Agricultural Sciences and Technology,
Chatha, Jammu–180009, India E-mail: *[email protected]
Keywords: Brassica carinata, CIF, MS Medium, Plant Regeneration, Regeneration Frequency
INTRODUCTION
Brassica carinata A. Braun, also known as Ethiopian mustard is an amphi-diploid species that belong to the family of Brassicaceae. Development of cultivars resistant to biotic ad aiotc stress in the present context of climate change is the need of hour. Transgenic approach is one of the novel tools for development of climate resilient crops. In vitro regeneration is one of a key factor in developing an efficient transformation method in plants. In Brassica spp. in vitro regeneration is highly genotype-dependent for B. napus, B. rapaand B. oleracea (Sparrow et al., 2006). In addition, 6 species of the genus Brassica were compared for callus growth and plant regeneration and reported a high influence of the genotype in the in vitro culture. However, the available information on the genotype and explant variability for in vitro culture and shoot regeneration in B. carinata is limited to a small number of genotypes, thus a limiting factor for the application of genetic engineering to a wide number of genotypes. For that reason, it is important to identify highly regenerating genotypes that can be used in genetic transformation via Agrobacterium tumefaciens. But there are a several studies reported on the direct regeneration to increase the regeneration frequency of Brassica spp. and remarkable progress has been achieved. Hence, the main objective of this study was to establish an in vitro regeneration and propagation protocol for the Brassica carinata cultivar PC-05 using hypocotyl and cotyledon explants which is a prerequisite for development of climate resilient crop varieties through advanced transformation techniques.
MATERIALS AND METHODS
The certified seeds of mustard (Brassica carinata Var. PC-05) were procured from Division of Genetics and plant Breeding Sher-e-Kashmir University of Agricultural Sciences and Technology, Faculty of Agriculture, Chatha, Jammu. An efficient protocol for surface sterilization of seeds was standardized. For callus induction and plant regeneration, the MS medium was supplemented with (3% sucrose and 2,4-D) at different concentrations of 0.5, 1.0, 1.5, 2.0 and 2.5 mg/L. To optimize the culture medium for shoot regeneration, the calli were cut into small pieces and cultured on modified MS medium supplemented with various combinations and concentration of growth regulators viz. BAP, NAA and 2,4-D. The relative response for callus and regeneration was observed as per the formulae given by Moghaieb et al. 2006.
RESULTS AND DISCUSSION
The maximum survival of seed culture and seedlings was record when surface sterilized with HgCl2 (0.1%) for three minutes duration after one and four weeks. The number of explants inducing callus were supplemented with MS media at different concentrations of 2,4-D and NAA of (0.5,1.0, 1.5, 2.0 and 2.5 mg/l). The results revealed that the cultivar of Brassica carinata responded to callus at more than 1.5 mg/l 2,4-D, The response gradually increased with the increasing concentration of 2,4-D. Callus initiated from hypocotyls cut ends of
It is I
LLEGAL t
o cop
y, pri
nt or
save
any c
onten
t of th
is PDF,
in pa
rt or in
full,
on an
y retr
ieval
syste
m,
withou
t the E
XPRESS WRITTEN PERMISSIO
N of th
e cop
yrigh
t-hold
er

National Conference on Climate Change and Agricultural Production: Adapting Crops to Climate Variability and Uncertainty, 6th–8th April, 2017
[481]
Brassica carinata cultivar PC 05 within two weeks of incubation. High callus induction frequency (CIF) of 90.48 per cent followed by 76.19 and 66.67 per cent were observed at 2.5, 2.0 and 1.5 mg/l 2,4-D as shown in Table 1, respectively. However no callus was induced at lower 2,4-D concentrations of 0.5 and 1.0 mg/l. Cotyledon explants derived calli with respect to regeneration media containing various concentrations of growth regulators. i.e (MS+2,4-D (0.5mg/l) +BAP with varying concentrations of 1, 2, 3, 4 and 5 mg/l. Table 2 showed higher regeneration frequency (RF) was 100 per cent followed by 88.89, 66.67 and 33.33 per cent at 0.5mg/l 2,4-D +5.0 mg/l BAP, 0.5mg/l 2,4-D +4.0 mg/l BAP, 0.5 mg/l 2,4-D +3.0 mg/l BAP and 0.5mg/l 2,4-D +2.0 mg/l BAP, respectively. While no regeneration was observed in the media containing 0.5mg/l 2,4-D +1.0 mg/l BAP.
Table 1: Effect of Different Combinations of Growth Regulators on Callus Induction Frequency of Brassica carinata
Genotype Concentration of MS+ 2,4-D(mg/l) No. of Cultured Explants
Callus Inducing Explants
CIF (%)
PC 05 0.5 14 0.00 0.00 (1.00)
1.0 14 0.00 0.00 (1.00)
1.5 14 9.33 66.67 (8.21)
2.0 14 10.67 76.19 (8.77)
2.5 14 12.66 90.48 (9.56)
CD (p=0.05) 0.83 CV 7.87
Figures in parenthesis represent square root transformed value
REFERENCES [1] Moghaieb R E A, El-Awady M A, Mergawy R G E, Youssef S S and El-Sharkawy A M 2006. A reproducible protocol for regeneration and
transformation in canola (Brassica napus L.).African Journal of Biotechnology5(2): 143-148. [2] Sparrow P A C, Townsend T, Arthur A E, Morgan C L, Dale P J, Irwin J A 2004. Genetic analysis of in vitro shoot regeneration from
cotyledonary leaves of Brassica oleracea. Theorory and Applications in Genetics 108: 1249-1255
Diversity and Abundance of Insect Visitors and Pollinators on Pumpkin, Cucurbita moschata (Duch.ex Lam)
Lalita* and Yogesh Kumar Department of Entomology, CCS Haryana Agricultural University, Hisar–125004, India
E-mail: *[email protected]
Keywords: Pumpkin, Honey Bee Species, Pollination
INTRODUCTION
Cucurbita moschata is monoecius in nature with unisexual flowers i.e., male and female flowers are borne at different position on the same plants. The flowers are acuminate in the buds, actinomorphic with a pentamerous perianth. Bright colorful flowers have extremely short life span and may open for as short a time as one day. The floral size and architecture of C. moschata i.e. large size petals with campanulate shape provide suitable landing platform for bees. The insect pollinators of pumpkins include bees, butterflies, ants and even beetles which while damaging the flower parts, incidentally, caused pollination. Out of all the
It is I
LLEGAL t
o cop
y, pri
nt or
save
any c
onten
t of th
is PDF,
in pa
rt or in
full,
on an
y retr
ieval
syste
m,
withou
t the E
XPRESS WRITTEN PERMISSIO
N of th
e cop
yrigh
t-hold
er

National Conference on Climate Change and Agricultural Production: Adapting Crops to Climate Variability and Uncertainty, 6th–8th April, 2017
[482]
insects, honey bees were the main contributor for the pollination in Cucurbita moschata. The density of blossom visitors depends on several factors like flower shape, size, colour, availability of floral reward and weather condition (Mevetty et al., 1989). Insect pollinator’s activity increase sharply after sunshine decrease gradually throughout the day and ceases before the sunset.
MATERIALS AND METHODS
Experiment was carried out at Research farm and Apiculture Laboratory of the Department of Entomology, Chaudhary Charan Singh Haryana Agricultural University, Hisar during the year 2013. To determine the diversity, flower visitor insects /pollinators were collected by a cone type hand net of 30cm ring. For this purpose, sweeps were made throughout the blooming period of the crop from morning to the evening. The collected insects were preserved as dry specimen and were got identified from Identification Service, Divison of Entomology, Indian Agricultural Research Institute, New Delhi. Count of major insect visitors or pollinators (Apis dorsata, Apis mellifera, Apis cerana and A. florea) were made on flowers of C. moschata per 5 flowers per 5 minutes using a hand tally counter at hourly interval starting from 0530 h am till 1030 from 5 random selections (per 5 flowers per 5 minutes) at each sampling time. Observations on abundance of insect pollinators were recorded at 10 per cent flowering initiation stage in the crop, at peak flowering period and before the cessation of flowering in the crop.
RESULTS AND DISCUSSION
Forty two insect species belonging to twenty four families under seven orders were observed visiting the flowers of pumpkin under agro-ecological conditions of Hisar. However, hymenopterans were the most abundant pollinators followed by dipterans. Among these, A. dorsata, A. mellifera, A. cerana and A. florea were the most frequent insect pollinators. The pollinators started visiting flowers early in the morning (0530 hr) and remained active until the closing of flowers (1030 hr). The abundance was low during early morning (0530–0630 hr) and the highest during 0730–0830 hr. Irrespective of the flowering stage abundance (bees/5flowers/5minutes) of A. dorsata was the highest (4.85), followed by A. mellifera (4.10), A. cerana (3.17) and A. florea (2.62). Abundance of four honey bee species was low at the initiation of flowering stage of the crop. It was maximum at peak flowering period of the crop and again was low at the cessation of flowering stage of the crop. These differences seem to be related with flower density in the crop. At peak flowering stage, A. dorsata constituted (34.72%), A. mellifera (31.10%) and A. cerana (18.69%) and A. florea (15.39%). Deyto and Cervancia (2009) stated that Trigona spp., Halictus sp. and lepidopterans were the most frequent visitors with five mean daily visits among the different insect pollinators on M. charantia flowers in Philippines. Pateel and Sattagi (2007) recorded that A. florea; A. cerana and A. dorsata were the most frequent insect pollinators visiting the Rabi cucumber flowers in Karnataka with abundance of 8.03, 6.03 and 3.43 bees/m2/5 minutes, respectively.
Table 1: Diurnal Abundance of Four Honey Bee Species (Irrespective of the Flowering Stage) on Pumpkin Cultivar (C-1106) during August-September, 2013
Honey Bee Species Number of Honey Bees/ 5 Flowers/ 5 Minutes during Different Day Hours 0530–0630 0630–0730 0730–0830 0830–0930 0930–1030 Mean
Apis dorsata 0.94 (1.38)
4.17 (2.25)
4.85 (2.39)
3.74 (2.16)
2.07 (1.74)
3.15 (1.98)
Apis mellifera 0.40 (1.18)
3.81 (2.16)
4.10 (2.23)
3.61 (2.12)
1.90 (1.69)
2.76 (1.87)
Apis cerana 0.32 (1.13)
2.80 (1.84)
3.17 (1.88)
2.33 (1.72)
1.79 (1.61)
2.08 (1.64)
A. florae 0.29 (1.08)
2.47 (1.66)
2.62 (1.73)
1.98 (1.68)
1.62 (1.45)
1.80 (1.52)
Mean 0.49 (1.19)
3.31 (1.97)
3.69 (2.05)
2.92 (1.92)
1.85 (1.62)
CD (p=0.05) - Bee species-(0.08); Day hours-(0.09) and Bee species x day hours- (0.19) Figures in parentheses are √ (n+1) transformed value; Each value represent a mean of 5 observations
It is I
LLEGAL t
o cop
y, pri
nt or
save
any c
onten
t of th
is PDF,
in pa
rt or in
full,
on an
y retr
ieval
syste
m,
withou
t the E
XPRESS WRITTEN PERMISSIO
N of th
e cop
yrigh
t-hold
er

National Conference on Climate Change and Agricultural Production: Adapting Crops to Climate Variability and Uncertainty, 6th–8th April, 2017
[483]
REFERENCES [1] Deyto R C and Cervancia C R 2009. Floral biology and pollination of Ampalaya (Momordicacharantia L.).The Philippine Agricultural
Scientist92(1): 8-18. [2] Pateel M C and Sattagi H N 2007.Abundance of different Insect pollinators visiting cucumber (Cucumis sativus L.) in Rabi
season.Karnataka Journal of Agricultural Science 20(4): 853-854.
Genetic Variation for Protein Content and Yield Related Traits in Recombinant Inbred Lines (RILs) Population of Bread Wheat
(Triticum aestivum L. Em. Thell) in Normal and Late Sown Environments
Pinki* and Vikram Singh Department of Genetics and Plant Breeding,
CCS Haryana Agricultural University, Hisar–125004, India E-mail: *[email protected]
Keywords: Yield, Protein Content, Heritability, Genetic Advance
INTRODUCTION
Wheat (Triticum aestivum L.Em. Thell) is the second most important cereal in India after rice. Proteins are the most important components of wheat grains governing end–use quality. Variation in both protein content and composition significantly modify flour quality for bread-making. Grain yield, a main economic trait, is the sum total of the component characters. Thus the selection based on grain yield is usually not very successful but the one based on its component characters could be very effective. The knowledge of heritability helps in predicting the behavior of the succeeding generation and making desirable selections. Therefore, there is enough scope to increase genetic gain in yield through suitable changes in harvest index, coupled to an increase in total biomass.
MATERIALS AND METHODS
103 (F12) RIL lines descended from a cross between HUW- 510/ WH-730 of bread wheat genotypes along with parents were sown in Randomized Block Design with 3 replications at the wheat research area of Dept. Genetics and Plant Breeding, CCS, HAU, Hisar, during Rabi season of 2013 on two dates of sowing i.e. (1st week of Novembr) and (1st week of December). Each plot consists of 2 rows of 2 meter length with a spacing of 20 cm between the rows. All the recommended cultural practices were adopted to raise a good crop. Data was recorded on five randomly selected plants in each replication on characters like days to 50% heading, plant height (cm), peduncle length (cm), flag leaf area (cm2), harvest index (%), 1000 grain weight (g) and grain protein content (%) except biological yield and grain yield which were measured on the basis of 50cm row length.
RESULTS AND DISCUSSION
A comparison of component of variance revealed that genotypic variance in general was substantially higher than environmental variance for all the traits particularly for days to 50% flowering, flag leaf area, harvest index, 1000 grain weight and protein content. This implied that these yield related traits and protein content were not substantially affected by the environmental factors whereas, the traits biological yield, grain yield
It is I
LLEGAL t
o cop
y, pri
nt or
save
any c
onten
t of th
is PDF,
in pa
rt or in
full,
on an
y retr
ieval
syste
m,
withou
t the E
XPRESS WRITTEN PERMISSIO
N of th
e cop
yrigh
t-hold
er

National Conference on Climate Change and Agricultural Production: Adapting Crops to Climate Variability and Uncertainty, 6th–8th April, 2017
[484]
and plant height were substantially affected by the environmental factors. Mean and range also varies across the two environments. This is also reflected in high level of broad sense heritability (h2b) for flag leaf area (0.97), days to 50% flowering (0.96) and 1000 grain weight (0.92). Phenotypic coefficient of variance was higher than genotypic coefficient of variance for all the traits. The phenotypic coefficient of variation was high for grain yield and flag leaf area followed by biological yield, but low for 1000 grain weight and days to 50% flowering. High genetic advance was observed for flag leaf area (45.81), grain yield (39.69) and biological yield (32.37) and low genetic advance for days to 50% flowering (17.20) and 1000 grain weight (18.69). The remaining traits had intermediate level of genetic advance ranging from 23.47 (plant height) to 28.24 (peduncle length). Almost similar findings were reported by Fellahi et al. (2013) and Tahmasebi et al. (2013). Highly significant genotypic differences existed for all traits and protein content in both the environments. A large number of transgressive segregants were observed for all yield related traits. Hence these RILs may be used as a potential donor parent for genetic improvement of the respective morpho-physiological traits in wheat breeding programme.
REFERENCES [1] Fellahi Z, Hannachi A, Bouzerzour A and Boutekrabt A 2013. Study of interrelationship among yield and yield related attributes by using
various statistical methods in bread wheat (Triticum aestivum L.). International Journal of Agronomy and Plant Production4(6): 1256-1266.
[2] Tahmasebi G, Heydarnezhadian J and Aboughadareh A P 2013.Evaluation of yield and yield components in some of promising wheat lines.International Journal of Agriculture and Crop Sciences 5(20): 2379-2384.
Pollinator Diversity and Relative Abundance of Insect Visitors on Apple (Malus domestica Borkh) in Kashmir Valley
Tahmina Mushtaq1, Sheikh Bilal2, M.A. Aziz3 and Tahir Mushtaq1
1Department of Forestry, 2Dean, 2,3Division of Soil Science 1,2,3SKUAST, Kashmir–190025
E-mail: *[email protected]
Keywords: Apple, Insect Visitors, Pollinator Diversity, Relative Abundance
INTRODUCTION
Apple (Malus domestica Borkh.) is an important fruit crop of Jammu and Kashmir State and plays an important role in its economy. Since, the area under the apple cultivation is increasing each year but some management problems have inevitably arisen from the last few years which has dragged down the production. A major problem has been found to be in pollination. In general, Apple has a gametophytically self incompatible (SI) system, which prevents inbreeding and promotes outcrossing (Stern et al., 2001). Cross pollination is brought by insect pollinators that visit flowers for the nectar and/or pollen collection. A little is known about the abundance and efficacy of different insect visitors in Apple orchard ecosystems in Kashmir valley. Therefore, present investigation was conducted to collect various insect visitors and work out their relative abundance in different apple orchards located at three major districts of Kashmir valley.
MATERIALS AND METHODS
The present investigation was carried out at SKUAST-Kashmir during two consecutive years 2011–12. Measurements were made at three sites viz., Anantnag, Srinagar, and Baramulla during 2011 and 2012, in three apple orchards of one hectare each. Ten (10) appletrees of uniform size, age and vigor were selected
It is I
LLEGAL t
o cop
y, pri
nt or
save
any c
onten
t of th
is PDF,
in pa
rt or in
full,
on an
y retr
ieval
syste
m,
withou
t the E
XPRESS WRITTEN PERMISSIO
N of th
e cop
yrigh
t-hold
er

National Conference on Climate Change and Agricultural Production: Adapting Crops to Climate Variability and Uncertainty, 6th–8th April, 2017
[485]
for the present investigation. Various insect pollinators visiting apple blossoms were collected by using cone type insect collecting nets. Collected insects were sorted out in the laboratory and got identified at insect Identification laboratory, Division of Entomology, IARI, New Delhi.
RESULTS AND DISCUSSION
During the present investigation, a total of 59 insect visitors belonging to 5 orders and 28 families of class insect were recorded from apple bloom from three districts of Kashmir valley. Out of these, 27 insect visitors belonged to Hymenoptera, 24 to Diptera, 3 to Lepidoptera, 3 to Coleopteran and 2 to odonata. It was observed that among 27 Hymenopteran visitors 19 were identified upto species and 8 insects were identified upto genera Out of 24 Dipteran insects, 13 were identified upto species and 11 were identified upto genera. Moreover, 3 species of Lepidoptera, 3 species of Coleopteran and 2 species of odonata were also reported as visitors of apple bloom. The present findings draw the support from the observations of Raj et al. (2012) who reported that apple flowers in Solan (H.P) were visited by 46 species of insects belonging to 5 orders and 17 families of class Insecta Verma and Chauhan (1985) also reported 44 species visiting apple flowers of which 16 species belonged to Hymenopterans, 11 to Dipterans, 9 to Lepidopterans, 7 to Coleopterans and 1 to Hemiptera.
REFERENCES [1] Raj H, Mattu V K and Thakur M L 2012. Pollinator diversity and relative abundance of insect visitors on apple crop in shimla hills of
western himalaya, India. International Journal of Science and Nature 3(3): 507-513. [2] Stern R A, Eisikowitch D and Dag A 2001.Sequential introduction of honeybee colonies and doubling their density increases cross-
pollination, fruit-set and yield in ‘Red Delicious’ apple. Journal of Horticultural Science and Biotechnology 76(1): 17-23 [3] Verma L R and Chauhan P 1985.Distribution, abundance and diversity of insect pollinators in apple orchards of Shimla hills. Indian
Journal of Ecology 12(2): 286-292
Characterization of Okra Germplasm through Leafy Characteristics Utilization in Breeding Programme
Sunil Kumar*, Archana Brar and S.K. Dhankhar Department of Vegetable Science, CCS Haryana Agricultural University, Hisar–125004, India
E-mail: *[email protected]
Keywords: Okra, Leaf Length, Petiole Length, Vein Color
INTRODUCTION
Okra varieties have been developed by public and private sectors, which are released and notified since long. Some of the varieties are having common parentage that lead to their similar morphological traits, which create confusion in identification of genotypes for morphological characters at the field level and at seed level in the laboratory. No systematic characterization has been made in the past. The descriptor guide lines were prepared by Protection of Plant Varieties and Farmer’s Right Authority (PPV &FRA) for characterization of the accessions of different vegetable crops. Keeping in view the above facts, the present study was planned with the objective to develop schematic key for okra cultivar identification based on morphological and laboratory parameters to find out key characteristics identification of okra for genotypes.
It is I
LLEGAL t
o cop
y, pri
nt or
save
any c
onten
t of th
is PDF,
in pa
rt or in
full,
on an
y retr
ieval
syste
m,
withou
t the E
XPRESS WRITTEN PERMISSIO
N of th
e cop
yrigh
t-hold
er
National Conference on Climate Change and Agricultural Production: Adapting Crops to Climate Variability and Uncertainty, 6th–8th April, 2017
[486]
MATERIALS AND METHODS
The present research experiment for recording the morphological characters was carried out at CCS Haryana Agricultural University, Hisar during rainy season of 2012. Observations of laboratory parameters (seed characters) were carried out in seed quality laboratory in department of seed science and technology, CCS Haryana Agricultural University, Hisar in winter season, 2012. Seeds of twenty okra genotypes were sown at spacing of 60 cm between row to row and 30 cm between plant to plant in randomized block design with three replications. Each genotype was grown in a plot of four rows accommodating thirty plants per replication. Two to three seeds per hill were sown and later thinned to retain one plant per hill. The recommended package and practices of the crop was followed to raise healthy crop.
RESULTS AND DISCUSSION
With respect to serration of leaf blade margin, five genotypes showed strong serration of leaf blade margin, whereas five genotypes exhibited medium weak serration. Out of which, genotypes were with shallow, medium and deep depth of lobbing. The dark colour between veins was more prevalent than light and medium colour. Out of twenty genotypes, genotypes had medium and dark intensity of colour between veins. Length of leaf blade ranged from 3.60 cm to 12.66 cm. Saifullah and Rabbani (2009). The maximum length of leaf blade was in BB-1 and minimum in HBT-6. Petiole length ranged from 12.70 cm to 27.30 cm with mean of 20.67 cm. Out of twenty genotypes, maximum petiole length was in HBT-51-1-1 (27.10 cm) followed by HBT-49-1 (26.60 cm). Minimum petiole length was recorded in genotype HBT-1-1 (12.70 cm) followed by HBT-42.
REFERENCE [1] Saifullah M and Rabbani M G 2009.Evaluation and characterization of okra (Abelmoschus esculentus (L.)Moench.)genotypes. SAARC
Journal of Agriculture7(1): 91-98.
Functional and Pasting Characteristics of Flour of Different Pearl Millet Varieties of Haryana
Isha Kaushik* and Raj Bala Grewal Centre of Food Science and Technology, CCSHAU, Hisar–125004, India
E-mail: *[email protected]
Keywords: Functional, Pasting, Pearl Millet, Varieties
INTRODUCTION
Pearl millet is an important coarse grain cereal and forage crop of the arid and semi-arid tropics of Indian subcontinent and several African regions. In Haryana, area of pearl millet is 6.410 lakh ha and production is 11.20 lakh tonnes (Haryana Stat 2016). It’s a good source of carbohydrates, dietary protein, fat, vitamins and minerals. Besides, good nutritional composition of pearl millet flour, its flour exhibit various functional properties including water absorption capacity, oil absorption capacity, swelling capacity, solubility, etc., and pasting characteristics. These properties are the fundamental physico-chemical properties that reflect the complex interaction between the composition, structure, molecular conformation and physico-chemical properties of food components and help in deciding the blends of different flours for various products. Keeping in view the increasing utilization of pearl millet flour in composite flours for the formulation in various new food products the present study was planned to evaluate the functional and pasting properties of flour of different varieties of pearl millet.
It is I
LLEGAL t
o cop
y, pri
nt or
save
any c
onten
t of th
is PDF,
in pa
rt or in
full,
on an
y retr
ieval
syste
m,
withou
t the E
XPRESS WRITTEN PERMISSIO
N of th
e cop
yrigh
t-hold
er

National Conference on Climate Change and Agricultural Production: Adapting Crops to Climate Variability and Uncertainty, 6th–8th April, 2017
[487]
MATERIALS AND METHODS
Local 8 different varieties of pearl millet such as composite/desi varieties (HC-10 and HC-20), improved or released hybrids (HHB-67, HHB-146 and HHB-272), white seeded varieties (WHC-901-445 and HMP-802) and hybrid in pipeline (HHB-265) were selected for present study and were procured from the Department of Genetics and Plant Breeding, CCS HAU, Hisar, Haryana. The present study work was carried out at Centre of Food Science and Technology, CCS HAU, Hisar, Haryana (2013–2016). Water absorption capacity (WAC) was determined by the method of Singh and Singh (1991), oil absorption capacity (OAC) by Rosario and Flores (1981) method with minor modification by Iyer and Singh (1997), gel consistency by the method of Chandrashekar and Kirleis (1988) with slight modification. Flour solubility and swelling power were assessed by Subramanian et al. (1986). Pasting characteristics was determined by the RVA instrument.
RESULTS AND DISCUSSION
Water absorption capacity of pearl millet flour of different varieties varied from 1.51 to 1.80 ml/g. HMP-802 white seeded variety of pearl millet showed highest water absorption capacity and lowest water absorption capacity for HHB-272 released hybrid of pearl millet. The sequence was noticed for WAC among pearl millet varieties was in order of white seeded improved/released hybrid>composite/desi>hybrid in pipeline. Perusals of data indicated that flour of white seeded and improved released hybrid varieties of pearl millet can be suitable for preparation of comminuted products and to improve handling characteristics of bread dough. Oil absorption capacity of pearl millet flour of different varieties ranged from 1.07 to 1.35 ml/g. This OAC among pearl millet varieties in increasing order was with white seeded>composite/desi>improved released/hybrid>hybrid in pipeline. Swelling power and flour solubility of pearl millet flour of different varieties ranged 6.07 to 6.62 g/g and 8.93 to 12.67 %, respectively. Gel consistency of flour of different pearl millet varieties ranged from 49.3 to 77.7 mm. Peak viscosity (cP), trough viscosity (cP), breakdown viscosity (cP), final viscosity (cP), setback viscosity (cP), pasting time (min.) and temperature (C) of flour of pearl millet of different varieties ranged from 641.3 to 1961 cP, 412 to 1437 cP, 229 to 618 cP, 868 to 3400 cP, 455.7 to 1963 cP, 5.0 to 6.1 min and 77.5 to 86.2 C, respectively. Gelatinization temperature of flour of different pearl millet varieties varied from 95.0 to 95.2 C and no significant difference among varieties was witnessed. Significant variation existed in functional and pasting characteristics of flour among pearl millet varieties might be due to use of different genotypes, agronomic practices and climatic conditions that might prevail during the growing of all the selected varieties. Different pearl millet varieties exhibited significant variation for the functional properties and pasting characteristics. Flour from different pearl millet varieties could be utilized to unusual extent in preparation of new products.
REFERENCES [1] Del Rosario R and Flores D 1981. Functional properties of four types of mung bean flour. Journal of the Science of Food and
Agriculture32(2): 175-180. [2] Subramanian V, Jambunathan R and Ramaiah C 1986.Physical and Chemical Characteristics of Pearl Millet Grains and Their
Relationship to Roti Quality.Journal of Food Science51(4): 1005-1008.
It is I
LLEGAL t
o cop
y, pri
nt or
save
any c
onten
t of th
is PDF,
in pa
rt or in
full,
on an
y retr
ieval
syste
m,
withou
t the E
XPRESS WRITTEN PERMISSIO
N of th
e cop
yrigh
t-hold
er

National Conference on Climate Change and Agricultural Production: Adapting Crops to Climate Variability and Uncertainty, 6th–8th April, 2017
[488]
Integrated Management of Colletotrichum capsici Incitant of Dieback and Fruit Rot of Chilli under Temperate Conditions of Kashmir, India
Ali Anwar, Mudasir Bhat*, Lubna Masoodi, Najeeb Mughal, Mir G. Hassan and V.K. Ambardar
Division of Plant Pathology SKUAST-K, Shalimar, Srinagar–190025, India E-mail: *[email protected]
Keywords: Chilli, Colletotrichum capsici, Dieback, Fruit Rot, Integrated Management
INTRODUCTION
In Kashmir, chilli is known as ‘Marchangun’ and cultivated over an area of 3200 hectares (Anonymous, 2014). Of the various fungal diseases, dieback and fruit rot caused by Colletotrichum capsici has noticed and recorded the status of major disease in Kashmir (Lubna et al., 2012). The frequent and prevalent epiphytotics of the disease in valley witnessed during past few years and extent of the damage in form of quality and quantity of fruits has thus prompted us to employ the innovative integrated management of the disease in the nursery and in the transplanted field.
MATERIALS AND METHODS
Experiments were conducted during the cropping seasons 2010 and 2011 at Shalimar campus Sher-e-Kashmir University of Agricultural Sciences and Technology of Kashmir. Treatments were laid out in the plots (2.4 × 3.6 m2) arranged in a randomized block design (RBD). Thirty days old seedlings of variety Kashmiri Long were planted into the field plots in rows with row/plant spacing of 35 × 45 cm with a total population of 64 plants per plot. After transplantation in the biological and chemical module, the crop was treated with one spray of mancozeb 75 WP @ 0.3 % 50 WP, Copper-oxychloride 50 WP @ 0.3%, carbendazim 50 WP @ 1%, difenoconazole 25 EC @ 0.03%, propiconazole 25 EC @ 0.01%. Fungicidal sprays were given at three phonological stages viz., pre-flowering, fruit set and maturity. Data on disease intensity and yield parameters was recorded 15 days after last spray adopting the formula of Mckinney (1923).
RESULTS AND DISCUSSION
Under due consideration of etiology and nature of pathogen, the disease was targeted to mitigate its profound loss in nursery and in standing crop, the integrated management strategy was hence tried. The two efficient nursery treatments comprised with thiram 50 WP @ 2g/kg seed + FYM @10 q/ha and thiram 50 WP @ 2g/kg seed + vermicompost @7 q/ha were found significantly most effective impeding the disease severity by 26.16 and 27.63 %, respectively and healthy and stout seedlings of these treatments were transplanted wherein spray of propiconazole 25 EC @ 0.1% was found (6.10 and 8.40 %) to be at par when crop was sprayed at three phenological stages with mancozeb 50 WP @ 0.3%by tremendous control of dieback and fruit rot and secured least dieback and fruit rot intensity of 6.72 and 9.55%, respectively. Whereas, spray of propiconazole 25 EC @ 0.1% over the crop which was already treated with thiram 50 WP @ 2g/kg seed + vermicompost @7 q/ha in nursery preponderated the disease which was recorded as 7.90 and 10.13 % dieback and fruit rot, respectively. Various treatments in nursery as well as in transplanted crop implied with fungicides belonging to protectants and systemic group that were used in vivofor their effect on the disease development were toxic to the fungus and helpful in checking the disease. In case of foliar spray in field it was observed that the systemic group of fungicides proved better in controlling the disease than protectants, hence are recommended for managing the disease in the field.
It is I
LLEGAL t
o cop
y, pri
nt or
save
any c
onten
t of th
is PDF,
in pa
rt or in
full,
on an
y retr
ieval
syste
m,
withou
t the E
XPRESS WRITTEN PERMISSIO
N of th
e cop
yrigh
t-hold
er

National Conference on Climate Change and Agricultural Production: Adapting Crops to Climate Variability and Uncertainty, 6th–8th April, 2017
[489]
REFERENCES [1] Lubna M, Ali A, Shahzad A and SofiT A 2012.Cultural, Morphological and Pathogenic Variability in Colletotrichum capsicicausing
Dieback and Fruit Rot of Chilli.Asian Journal of Plant Pathology7: 29-41. [2] McKinney H 1923. Influence of soil temperature and moisture on infection of wheat seedlings by Helminthosporium sativum. Journal of
Agricultural Research26: 195-217.
Studies on Genetic Divergence in Potato (Solanum tuberosum L.)
Sunidhi Mishra*, Jitendra Singh and Versha Kumari
Department of Vegetable Science, Indira Gandhi Krishi Vishwavidyalaya, Raipur–492012, India E-mail: *[email protected]
Keywords: Potato, Genetic Divergence, D2 Analysis
INTRODUCTION
Potato (Solanum tuberosum) is an important cash and food crop in the world and has a significant role in combating food insecurity. Maintaining a high level of heterozygosity is crucial in potato as severe inbreeding depression results from selfing. The attainment of heterozygosity can be achieved by crossing the more diverse genotypes so as to result in marked hybrid vigour. The current study was designed to assess the nature and magnitude of diversity among the 25 potato genotypes. The findings will further identify superior traits contained by each cluster (group), resulting in breeding programs to improve productivity of the crop. Thus, the objective of the study was to evaluate the potato genotypes for the presence of genetic divergence using various morphological attributes and identification of promising parents on the basis of divergence data.
MATERIALS AND METHODS
The present experiment was conducted at Indira Gandhi Krishi Viswavidayalaya (IGKV), Raipur during Rabi season of 2015–16 in order to evaluate the performance of twenty five genotypes of potato with three replications. Each plot measuring 2.4×2.4 meter had four rows spaced at 60 cm apart with intra-row spacing of 20 cm. The study was carried out for different growth and yield parameters. The genotypes, on the basis of data obtained on various characters were grouped into different clusters by Tocher’s method and the most divergent ones were selected using the Mahalanobis D2 statistics.
RESULTS AND DISCUSSION
Based on the D2 analysis, all the twenty five genotypes were grouped into four clusters. The maximum numbers of eight genotypes were included both in cluster-IV and cluster-I. The maximum inter-cluster distance was observed between the clusters I and II (5.243) and the minimum between the cluster-I and cluster-IV as shown in Table 1 and 2. The intra cluster D2 values ranged from 2.226 to 2.610. The highest intra cluster distance was observed in cluster IV (2.610) followed by cluster I (2.585), cluster III (2.466) and lowest in cluster II (2.226). However, the inter-cluster D2 values varied from 3.000 to 5.243. The maximum inter-cluster divergence was observed between the clusters I and II (5.243) followed by cluster I and III (4.521), cluster III and IV (4.327), cluster II and IV (4.136), cluster II and III (3.711) and the minimum inter-cluster distance was observed in between cluster I and IV (3.000). Above finding indicated that high inter-cluster distance were the main causes of diversity in composition of cluster and therefore can be exploited in hybridization programme.
It is I
LLEGAL t
o cop
y, pri
nt or
save
any c
onten
t of th
is PDF,
in pa
rt or in
full,
on an
y retr
ieval
syste
m,
withou
t the E
XPRESS WRITTEN PERMISSIO
N of th
e cop
yrigh
t-hold
er

National Conference on Climate Change and Agricultural Production: Adapting Crops to Climate Variability and Uncertainty, 6th–8th April, 2017
[490]
Table 1: Clustering Pattern of Different Genotypes of Potato Cluster Number
Number of Genotype Included
Name of Genotypes
I 8 AICRP-P-6, AICRP-P-20, AICRP-C-14, AICRP-C-16, AICRP-C-6, Kufri Garima, AICRP-P-23, AICRP-P-14
II 4 AICRP-C-15, AICRP-P-24, AICRP-C-1, AICRP-C-8 III 5 Kufri Surya, Kufri Khyati, Kufri Sindhuri, Kufri Lalit, AICRP-PH-3 IV 8 Kufri Jyoti, Kufri Bahar, Kufri Badshah, Kufri Pushkar, Kufri Pukhraj, Kufri Lauvkar, Kufri Himsona, Kufri
Shailja
Table 2: Inter and Intra Cluster Distances Cluster Number I II III IV
I 2.585 5.243 4.521 3.000 II 2.226 3.711 4.136 III 2.466 4.327 IV 2.610
*Diagonal bold values indicate intra cluster distances
REFERENCE [1] Mondal M.A.A, Hossain M M, Rasul M G and Shalim U M 2007.Genetic diversity in potato (Solanum tuberosum L.). Bangladesh Journal
of Botany36(2): 121-125
Genotypic Reaction towards Brinjal Fruit and Shoot Borer Incidence in Hot Summer Season under Bihar Conditions
Nisha Rani1, Rashmi Kumari1*, Shirin Akhtar1, S.S. Solankey1, Aakanksha1, Randhir Kumar1 and Sangeeta Kumari2
1Department of Horticulture (Vegetable & Floriculture), Bihar Agricultural College, Bihar Agricultural University, Sabour–813210, India 2Agricultural Research Institute, Patna–800020, India
E-mail: *[email protected]
Keywords: Brinjal, Fruit and Shoot Borer, Resistance and Tolerance
INTRODUCTION
Brinjal is one of the most popular and economically important vegetables among small scale farmers and low income consumers of Bihar, especially during hot-wet summers when other vegetables are in little supply. During the past two decades this crop has been increasingly wasted by the monophagous insect, brinjal fruit and shoot borer (BFSB), particularly in the summer and rainy season (Mannan et al., 2015). Farmers have resorted to frequent sprays of pesticides to kill the larva before it enters the fruit. Such extensive use of pesticides cuts into profitability of production, poses health hazards, and causes environmental pollution and resource degradation. Host plant resistance would be useful either as a complete control measure or as a part of the integrated pest management programme with limited dependence on pesticides. Hence, the present study was initiated to find out resistant or tolerant brinjal genotypes against fruit and shoot borer in order to mitigate the effect of climate change due to continuous of use of harmful pesticides.
MATERIALS AND METHODS
Thirty six genotypes were planted in the summer-rainy season of 2015–16 in a randomized block design with three replications at the Vegetable Research Farm of Department of Horticulture (Vegetable and Floriculture),
It is I
LLEGAL t
o cop
y, pri
nt or
save
any c
onten
t of th
is PDF,
in pa
rt or in
full,
on an
y retr
ieval
syste
m,
withou
t the E
XPRESS WRITTEN PERMISSIO
N of th
e cop
yrigh
t-hold
er

National Conference on Climate Change and Agricultural Production: Adapting Crops to Climate Variability and Uncertainty, 6th–8th April, 2017
[491]
with sixteen plants per replication planted at a spacing of 60cm × 60cm. The incidence of borer on shoots was recorded at 60, 90, 120 and 150 DAT and average noted. Fruit borer incidence was recorded at each harvest both by infected fruit number and fruit weight and averaged.
RESULTS AND DISCUSSION
Among the 36 genotypes none was found to be immune to brinjal fruit and shoot borer. The shoot borer incidence varied from 10.43% to 32.46%. The least shoot borer infestation was found in the genotype Pusa Purple Cluster (10.43%) followed by BRBR-01 (13.67%). The highest shoot infestation was found in the genotype EC 382524 (32.46%). The percent fruit borer infestation varied significantly both on number and weight basis. The data indicated the infestation on fruits in the range of 29.63 % to 52.04 % on number basis, while on weight basis the range was 28.40% to 53.67%. The genotype BRBL -01 was found to be least infested by fruit borer on number (29.63%) and weight (28.40%) basis followed by Pusa Purple Cluster (31.58% on number basis and 32.71% on weight basis). Maximum marketable yield was obtained in BRBL-01 (208.11 q/ha) followed by Pusa Purple Long (185.75 q/ha) and BRBL-02 (171.65 q/ha).Pusa Purple Long (38.19% on number basis and 39.21% on weight basis) and BRBL-02 (37.94% on number basis and 38.84% on weight basis) also exhibited lower incidence of fruit borer. The presence of more number of primary branches, more spines, high trichome density, smaller fruit diameter, fruit girth, length and weight may be responsible for lower infestation. These varieties which are high yielders and lesser infested with fruit and shoot borer can be recommended for cultivation over wide range locations in Bihar.
REFERENCE [1] Mannan M A, Islam K S and Jahan M 2015. Brinjal shoot and fruit borer infestation in relationto plant age and season. Bangladesh
Journal of Agricultural Research 40(3): 399-407.
Ecology of Yellow Stem Borer, Scirpophaga incertulas and Leaf Folder, Cnaphalocrocis medinalis of Rice in Northern India
Ingle Dipak Shyamrao, M. Raghuraman* and Santeshwari Department of Entomology and Agricultural Zoology, Institute of Agricultural Sciences
Banaras Hindu University, Varanasi–221005, India E-mail: *[email protected]
Keywords: Leaf Folder, Rice, Seasonal Incidence, Yellow Stem Borer
INTRODUCTION
Rice is life and princess among the cereals, the staple food of 65% of the total population in India. India is the largest rice growing country, while China is the largest producer of rice. Around 15 to 20 insect species are known to be the pests of paramount importance and are regularly noticed in tropical Asia (Majid et al., 2009). Yellow stem borer, Scirpophaga incertulas Walker) is one of the most destructive pests of this crop (Atwal and Dhaliwal, 2008). Both the yellow stem borer and leaf folder are the major pests cause severe damage to rice production. Hence the present investigation was taken up to study the incidence of yellow stem borer and leaf folder of rice in eastern Uttar Pradesh region.
It is I
LLEGAL t
o cop
y, pri
nt or
save
any c
onten
t of th
is PDF,
in pa
rt or in
full,
on an
y retr
ieval
syste
m,
withou
t the E
XPRESS WRITTEN PERMISSIO
N of th
e cop
yrigh
t-hold
er

National Conference on Climate Change and Agricultural Production: Adapting Crops to Climate Variability and Uncertainty, 6th–8th April, 2017
[492]
MATERIALS AND METHODS
An experiment was carried out at Agriculture Research Farm, Institute of Agricultural Science, Banaras Hindu University, Varanasi, India during the kharif season of 2015–16. A bulk plot of 100 m2 was raised adjacent to the main experiment plot so as to study the population build-up of the pests under study. Incidence of yellow stem borer and leaf folder were recorded in unprotected plot at seven days interval from the occurrence of pest and was continued up to maturity. Pest population was correlated with the prevailing climatic factors and simple correlation was worked out.
RESULTS AND DISCUSSION
The Seasonal incidence of yellow stem borer, Scirpophaga incertulas (Walker) was recorded as per cent dead hearts and white ear incidence of yellow stem borer ranged from 0.5 to 8.05 per cent and 3.12 to 8.51 per cent respectively during the course of study. The maximum dead hearts (8.05 %) and white ear incidence (8.50 %) was noticed in 41th standard week of October and 46th standard week of November and minimum during 31st standard week of July and 41th standard week of October, respectively which may be due to variation in the maximum, minimum temperature, relative humidity and rainfall during the study period. The Seasonal incidence of leaf folder, Cnaphalocrocis medinalis (Guen)maximum (15 larvae/10 hills) and minimum (1 larva/10 hills) incidence were noticed in 40th SW of October and 32th standard week of August, respectively. So far as weather parameters was concerned, maximum (15 larvae/10 hills) incidence was recorded with the corresponding weather parameters.
REFERENCES [1] Atwal A S and Dhaliwal G S 2008.Agricultural Pests of South Asia and their Management.Kalyani Publishers, New Delhi.pp. 242. [2] Majid A, Makhdoomi M A and Dar I A 2009.Occurrence and control of white-backed plant hopper in the Punjab of Pakistan. International
Rice Research Notes4(I): 17.
Studies on Heterosis Involving Diverse Cytoplasmic Male Sterility Systems in Pearl Millet
A. Kumar*, R. Kumar, Dev Vart, A.K. Dehinwal and S. Yadav Department of Genetics & Plant Breeding,
CCS Haryana Agricultural University, Hisar–125004, India E-mail: *[email protected]
Keywords: Pearl Millet, Heterosis, Diverse Cytoplasmic Sources
INTRODUCTION
Pearl Millet (Pennisetum glaucum L.) is an important cereal crop grown in tropical semi-arid regions of the world primarily in Africa and Asia. It is a highly nutritious cereal crop with wide agroecological adaptation primarily grown for grain production, but also valued for its fodder (both stover and green forage). It is a highly cross pollinated crop, and single-cross hybrids generally give 20–30% more yield than open pollinated varieties (Rai et al., 2006). Hybrid cultivar development in pearl millet became possible with the discovery of cytoplasmic-genic male-sterility. The use of CMS (cytoplasmic-genic male sterility) in pearl millet paved the way for grain yield augmentation with the development and release of first grain hybrid HB-I (Tift 23 A x BIL-3B). Several other sources of male-sterility inducing cytoplasms besides A1 such as A2, A3, PT732A, ex-Bornu (Gero), violaceum, A4 and A5 have been reported in pearl millet. Since then, large number of
It is I
LLEGAL t
o cop
y, pri
nt or
save
any c
onten
t of th
is PDF,
in pa
rt or in
full,
on an
y retr
ieval
syste
m,
withou
t the E
XPRESS WRITTEN PERMISSIO
N of th
e cop
yrigh
t-hold
er

National Conference on Climate Change and Agricultural Production: Adapting Crops to Climate Variability and Uncertainty, 6th–8th April, 2017
[493]
hybrids have been developed and commercialized in India, largely based on the A1 CMS system except two (GHB 316 on A3, HHB 216 on A4 CMS system) hybrids. It has been shown that the A4 and A5 CMS systems are good alternative to the A1 system in terms of the agronomic performance of pearl millet hybrids (Rai et al., 2009). The isonuclear lines have also been established in the background of several diverse CMS sources, which provides an opportunity for studying cytoplasmic effects on the expression of different characters. In any hybrid breeding programme based on several CMS sources, the information on relative magnitude of heterosis in cytoplasmically diverse hybrids helpful in determining relative chance and quantifying the magnitude and direction of heterosis in hybrids carrying different cytoplasm in pearl millet. Studies have indicated that cytoplasm exhibits pronounced effect on heterosis and combining ability (Young and Virmani, 1990). Commercial exploitation of hybrid vigour in pearl millet has resulted in a substantial improvement in the productivity in the country as a whole and in a few states in particular but there is still a need to improve the grain yield to make this crop more economically viable. Therefore, the present investigation was conducted to study the extent of hybrid vigour in F1 for grain yield and its components involving alloplasmic isonuclear lines of pearl millet.
MATERIALS AND METHODS
The material for present study consisted of three CMS lines (A-lines), their corresponding maintainers (B-lines) and eight restorers. Three male sterile lines and their corresponding three maintainer lines were crossed with eight restorers in line x tester fashion at ICRISAT, Hyderabad, during off season crop (January-April 2013). The forty eight pearl millet hybrids, thus, produced and their parents along with the standard check HHB-197 were grown in two environments (two dates of sowing) E1 -Planting 15th July (Normal sowing) and E2 Planting 24th July (Late sowing) during kharif 2013. The experiment was raised in a Randomized Block Design with three replications in each of the environments at CCSHAU, Hisar with a plot size of 2row x 4 m x 0.5 m with 10-12 cm intra- row spacing. All the recommended agronomic practices were followed to raise a good crop.
RESULTS AND DISCUSSION
Investigation was undertaken to quantify the magnitude of heterosis of alloplasmic isonuclear lines of pearl millet in two environments (normal and late sown crop). Three alloplasmic isonuclear pearl millet lines (81A1, 81A4, 81A5 and their corresponding maintainer lines) were crossed with eight diverse pollinators in a line x tester design to study the nature and magnitude of heterosis for grain yield and its eight component traits. The extent of heterosis varied in each cross for all the characters studied. The high magnitude of heterosis was not observed for any of the trait; medium level of heterosis was exhibited for grain yield per plant, dry fodder yield per plant, harvest index and effective tillers per plant. Among 48 crosses, eight (Environment 1) and seven (Environment 2) hybrids exhibited significant and positive heterosis over standard check (HHB-197) for grain yield. The direction and magnitude of heterosis varied from cross to cross in two different environments. This indicates environmental influence on the expression of hybrid vigour. The hybrid combination 3×11 (81A5×ERC) expressed significant positive heterosis for grain yield, effective tillers, panicle girth, harvest index in one or both the environments. The hybrids namely 1×13 (81A1×99HS141) for days to 50% flowering, 1000-grain weight, panicle girth and 4×12 (81B1×H77/833-2) for dry fodder yield, effective tillers, panicle length expressed high heterosis for these productivity traits. The other crosses namely 1×10 (81A1×MRC) exhibited desirable heterosis for grain yield, effective tillers, panicle girth, panicle length and harvest index; 3×14 (81A5×HTP 92/80) for grain yield, 1000- grain weight and harvest index. These crosses involved the 81A1 and 81A5 cytoplasmic sources. This indicated the superiority of these two cytoplasmic sources to produce heterotic hybrids.
It is I
LLEGAL t
o cop
y, pri
nt or
save
any c
onten
t of th
is PDF,
in pa
rt or in
full,
on an
y retr
ieval
syste
m,
withou
t the E
XPRESS WRITTEN PERMISSIO
N of th
e cop
yrigh
t-hold
er

National Conference on Climate Change and Agricultural Production: Adapting Crops to Climate Variability and Uncertainty, 6th–8th April, 2017
[494]
REFERENCES [1] Rai K N, Khairwal I S, Dangaria C J, Singh A K and Rao AS 2009. Seed parent breeding efficiency of three diverse cytoplasmic-nuclear
male-sterility systems in pearl millet. Euphytica 165: 495–507. [2] Rai K N, Kulkarni V N, Thakur R P, Haussmann B I G and Mgonja M A2006. Pearl millet hybrid parents research: approaches and
achievements. In: Hybrid parents research at ICRISAT (Gowda CLL, Rai KN, Reddy BVS and Saxena KB, eds.). Patancheru, Andhra Pradesh, India: International Crops Research Institute for the Semi-Arid Tropics pp: 11–73
[3] Young J B and Virmani S S 1990.Effects of cytoplasm on heterosis and combining ability for agronomic traits in rice (Oryza sativa L.).Euphytica48: 177-188.
Phenotyping of F2 Population of Wheat
Satender Yadav1*, Y.P.S. Solanki1, Vikram Singh, Shikha1, Yashveer2 and Anil Kumar1 1Department of Genetics and Plant Breeding, 2Department of Molecular Biology
1,2Biotechnology and Bioinformatics, CCS Haryana Agricultural University, Hisar–125004, India E-mail: *[email protected]
Keywords: Hydroponic, Net House, Hybridization
INTRODUCTION
Wheat (Triticum aestivum) is one of the most important cereal crops in the world. It is the second largest grain crop consumed after rice, domesticated from 9000 BC and is now grown in almost all parts of the world. Urbanization is forcing agriculture towards drier or more marginal lands, to supplement the global food requirement which is estimated to show a hike by approximately 70% by 2050. Moreover, soil salinity and water limitations are likely to increase in this century. Hence there is an urgent need to supplement agricultural productivity with less land and water resources. Seed germination, seedling establishment and plant growth are important and vulnerable stage in the life cycle of crops. Despite the importance of seed germination under salt stress, the mechanism of salt tolerance is not well understood. There are different screening mechanisms for evaluation of genotypes under salinity which include hydroponic, sand culture, pot culture, saline raised beds, lysimeters, and field-based screening (Munns et al., 2006). Field screening results may be misleading as salinity intermingles with drought and water logging. Salinity appears in patches in fields also pH, temperature, nutrients, and moisture content varies from region to region and even within and between fields. The pot method seems to be appropriate as homogeneity of experiment is maintained and evaluation of can be done easily. With a view that a significant intraspecific or intervarietal variation has been reported by many researchers for salinity tolerance in wheat the present study was conducted to carry out phenotyping of F2 population of wheat cultivars i.e. Kharchia 65 x HD 2851.
MATERIALS AND METHODS
The seeds of Kharchia 65×HD2851 F1 procured from Wheat and Barley section, Department of Genetics and Plant breeding, CCS Haryana Agricultural University, Hisar formed the basic material for the present study. The seeds were sown in pots in net house during Rabi season 2013–14 with four treatments of 8dS/m EC i.e. two at the time of sowing and two at 20–30 days after sowing such that the final EC of the soil at maturity be 12 dS/m. Hoagland nutrient medium obtained from Sigma chemicals Co., USA were applied to pot growing plants 10 days after sowing. Observations for various morphological traits such as plant height, number of tillers per plant, ear length, number of grains per earhead, number of grains per spikelets, grain yield per plant, 1000-grain weight etc were recorded and were analyzed to determine the variability. Salt tolerance index (STI) was estimated as the mean of salt tolerance trait indices (STTIs). STI was used to differentiate the 172 genotypes into different classes.
It is I
LLEGAL t
o cop
y, pri
nt or
save
any c
onten
t of th
is PDF,
in pa
rt or in
full,
on an
y retr
ieval
syste
m,
withou
t the E
XPRESS WRITTEN PERMISSIO
N of th
e cop
yrigh
t-hold
er

National Conference on Climate Change and Agricultural Production: Adapting Crops to Climate Variability and Uncertainty, 6th–8th April, 2017
[495]
RESULTS AND DISCUSSION
Net house evaluation data showed enormous variation among Kharchia 65×HD 2851F2 plants for characters plant height (cm), number of tillers per plant, ear length (cm), number of grains per earhead, number of spikelets per spike, number of grains per spikelet, grain yield per plant (g), 1000-grain weight (g), biological yield per plant (g), harvest index (%). The phenotypic coefficient of variation (PCV) was higher than respective genotypic coefficient of variation (GCV) for all the traits under study indicating negligible influence of the environment on the characters. Hence, this may be attributed to large genetic variance and less environmental variance. Ear length, number of grains per earhead, 1000-grain weight, grain yield per plant and biological yield per plant were having a higher value of heritability (bs) with corresponding high value of genetic advance. Characters having high heritability values could be improved directly through selection since these characters are less influenced by environment and there would be greater correspondence between phenotypic and breeding values. The high heritability estimates would be helpful for breeding superior genotypes on the basis of phenotypic performance of quantitative characters. The correlation coefficient studies were made to find out association at genotype and phenotypic levels between various traits. In most of the cases the magnitude of correlation coefficient at genotypic level was higher than the corresponding phenotypic level, this indicating a good extent of strong inherent association between different traits. Correlation between traits could be due to linkage or pleiotropy. Correlation due to linkages can be modified through recombination, but correlation due to pleiotropy or developmental causes may not be easy to overcome. Genotypic and phenotypic correlations were observed for grain yield and its components. The results revealed that the traits viz. plant height, ear length, number of spkilets per spike, number of grains per spikelets, number of grains per earhead, 1000-grain weight, biological yield and harvest index had significant and positive correlation with plant yield and also positive correlations among themselves. Hence, the results obtained from the present study can help in further selection of genotypes for hybridization and improvement of wheat varieties for salinity tolerance.
REFERENCE [1] Munns R, Richard AJ and Lauchli A 2006.Approaches to increasing the salt tolerance of wheat and other cereals. Journal of Experimental
Botany57(5): 1025-1043.
Genetic Variability for Seed Yield and Protein Content in Lentil
Umakant Banjare1*, H.C. Nanda2, Chitralekha Shyam2, Upendra Sahu2, Mallesh Parsagoni2 and Arun Patel3
1Department of Genetics and Plant Breeding, Institute of Agricultural Sciences, 3Department of Botany, Institute of Sciences
1,3Banaras Hindu University, Varanasi–221005, India 2Department of Genetics and Plant Breeding, College of Agriculture,
Indira Gandhi Krishi Viswavidyala, Raipur–492012, India E-mail: *[email protected]
Keywords: Lentil, Genetic Variability, Protein Content
INTRODUCTION
Pulses have played a vital role in the improvement of agricultural economy of the country, occupying 68.32 million hectares area under cultivation and contribute 57.57 million tones to the world’s food basket (http://dacnet.nic.in). India is the largest pulse producing country, growing a variety of pulse crops with 33
It is I
LLEGAL t
o cop
y, pri
nt or
save
any c
onten
t of th
is PDF,
in pa
rt or in
full,
on an
y retr
ieval
syste
m,
withou
t the E
XPRESS WRITTEN PERMISSIO
N of th
e cop
yrigh
t-hold
er

National Conference on Climate Change and Agricultural Production: Adapting Crops to Climate Variability and Uncertainty, 6th–8th April, 2017
[496]
percent world’s area and 24 percent of production (Shah and Agrawal, 2009). Lentil is one of the orphanlegume which is highly proteinaceous in nature and research towards this crop needs an attention in order to improve production of the pulses. The knowledge of genetic control of character under improvement and genetic variability of the parents will help in developing high yielding genotype possessing resistance or tolerance against abiotic or biotic stresses.
MATERIALS AND METHODS
The experimental material for the present investigation consisted of six divergent parents and their 15 hybrids. The experiment was laid out in a Randomized Complete Block Design (RBD) with three replications. The data were recorded on days to flower initiation, days to 50% flowering, days to maturity, plant height, number of branches plant-1, number of secondary branches plant-1,number of pods plant-1, number of seeds pod-1, number of seeds plant-1, 100 seed weight, Protein content (%), biological yield plant-1, seed yield plant-1, harvest index (%), Wilt incidence score (%) and Dal Recovery (%). Analysis of variance, genotypic and phenotypic coefficients of variation, heritability and genetic advance were calculated.
RESULTS AND DISCUSSION
The analysis of variance showed significant differences among genotypes for all the 16 characters studied which provides an opportunity for selecting suitable genotypes with better performance for the traits. The estimates of phenotypic coefficient of variation (PCV) in general, were higher than the estimates of genotypic coefficient of variation (GCV) for all the characters, which suggested that the apparent variation is not only due to the genotypes but also due to the influence of environment.GCV was noted high only for one trait i.e. wilt incidence score and moderate for the traits i.e. days to 50% flowering, number of primary branches plant-1, number of pods plant-1, number of seeds plant-1, biological yield plant-1 and harvest index. The phenotypic coefficient of variation was moderate for days to flower initiation, days to 50% flowering, plant height, number of primary branches plant-1, number of pods plant-1, number of seeds pod-1, number of seeds plant-1, biological yield plant-1, seed yield plant-1, harvest index. The phenotypic coefficient of variation was high for two traits i.e. number of secondary branches plant-1 (28.39%) and wilt incidence score (35.42%). The estimates of phenotypic coefficient of variation in general, were higher than the estimates of genotypic coefficient of variation. This suggested that the apparent variation is not only due to the genotypes but also due to the influence of environment. The characters with high phenotypic coefficient of variation indicated more influence of environmental factors. Therefore, caution has to be exercised during the selection program because the environmental variations are unpredictable in nature and mislead the results.
REFERENCE [1] Shah K and Agarwal A 2009. Indian agriculture review: Ghana 2009-10 outlook, http//.wwwstockmarketsreviewcom.
It is I
LLEGAL t
o cop
y, pri
nt or
save
any c
onten
t of th
is PDF,
in pa
rt or in
full,
on an
y retr
ieval
syste
m,
withou
t the E
XPRESS WRITTEN PERMISSIO
N of th
e cop
yrigh
t-hold
er

National Conference on Climate Change and Agricultural Production: Adapting Crops to Climate Variability and Uncertainty, 6th–8th April, 2017
[497]
Seasonal Incidence of Sesame Leaf Webber and Capsule Borer, Antigastra catalaunalis (Duponchel) on Sesame and
its Correlation with Weather Parameters
Shalini Pandey*, R.S. Jaglan and Sunita Yadav Department of Entomology, CCS HAU, Hisar–125004
E-mail: *[email protected]
Keywords: Insect Pest, Seasonal Incidence, Weather Parameters
INTRODUCTION
Sesame (Sesamum indicum L.) commonly known as Til, is one of the most important edible oilseed cultivated in India. Low yield of sesame is majorly caused by damage of the insect Antigastra catalaunalis (Kumar et al., 2010). The leaf webber and capsule borer attacks all parts of sesame plant except root. It feeds on the tender foliage by webbing top leaves and also bores into the shoots and capsules. The objective of this study to correlate the population dynamics of this insect pest with weather parameters because the incidence of this pest is very much variable perhaps due to fluctuation in the weather parameters.
MATERIALS AND METHODS
A field experiment was conducted at CCS HAU, Hisar during kharif, 2016. The two varieties of sesame viz., HT-1and HT-2 were sown in 2nd week of July in Randomized Block Design having plot size (2.4 x 1.5m2), 30 cm distance between row to row with three replications. Recommended agronomical practices were adopted for a better crop growth except insecticide applications. Observations on infestation of A. catalaunalis were recorded in five randomly selected plants/ plot at weekly intervals from vegetative to harvesting stage of the crop. Meteorological data were obtained during crop period from the Department of Meteorology, College of Agriculture. Coefficient of correlation was worked out between the pest population (average no. of larvae per plant) and weather parameters.
RESULTS AND DISCUSSION
Number of larvae per plant was observed on sesame variety HT-1 and HT-2 in each meteorological week from germination to harvest. The pest incidence was started from 2nd week of August (32nd standard meteorological week) and continued up to the harvest in both HT-1 and HT-2 variety. The highest incidence was 1.8 larvae per plant in HT-2 while in HT-2, highest incidence was 1.13 larvae per plant. In both the varieties, highest incidence was observed in 37th standard meteorological week. Incidence of Antigastra was found to be non significant positively correlated with maximum temperature while non significant negatively correlated with minimum temperature, morning and evening relative humidity and rainfall in both HT-1 and HT-2 (Table1). Based on this study it can be concluded that incidence of the sesame leaf webber and capsule borer A. catalaunalis on HT-1 and HT-2 was non significantly correlated with maximum and minimum temperature, relative humidity and rainfall.
Table1: Correlation of Sesame Leaf Webber and Capsule Borer, A. catalaunalis with Weather Parameters Standard Meteorological
Week Temperature (°C) Relative Humidity (%) Rainfall (mm)
Maximum Minimum Morning Evening HT-1 0.493497 -0.10936 -0.38005 -0.40683 -0.31759 HT-2 0.445682 -0.21703 -0.46111 -0.44964 -0.34887
It is I
LLEGAL t
o cop
y, pri
nt or
save
any c
onten
t of th
is PDF,
in pa
rt or in
full,
on an
y retr
ieval
syste
m,
withou
t the E
XPRESS WRITTEN PERMISSIO
N of th
e cop
yrigh
t-hold
er

National Conference on Climate Change and Agricultural Production: Adapting Crops to Climate Variability and Uncertainty, 6th–8th April, 2017
[498]
REFERENCE [1] Kumar R, Ali S and Chandra U 2010.Seasonal incidence of sap feeders on sesame (Sesamum indicum L.) and correlation with abiotic
factors. Annals of Plant Protection Sciences18(1): 41-48.
Phenotypic Screening of Segregating Population for Salinity Tolerance at Seedling Stage in Rice (Oryza sativa L.)
Patil Srihari Reddy1*, S. Thirumeni2, K. Paramasivam2, J. Karthick2, Geddam Satyadevi2 and N. Selvarajeswari3
1Department of Genetics and Plant Breeding, Institute of Agricultural Sciences, Banaras Hindu University, Varanasi–221005 India
2Pandit Jawarharlal Nehru College of Agriculture and Research Institute, Karaikal, Puducherry–609603, India
3College of Agriculture, VC Farm, Mandya, University of Agricultural Sciences, Mandya–571405 India
E-mail: *[email protected]
Keywords: Rice, Salinity Tolerance, Seedling Stage, Inheritance
INTRODUCTION
Abiotic stresses are becoming the major limiting factors for crop production especially under globally changing climatic conditions. Salinity ranks second next to drought which hampers the rice production and productivity. In India an area of 8.6 million ha is salt-affected area and this includes 3.4 million ha of sodic soils (Sahi et al., 2006). Developing a salinity tolerant variety is better option to combat menace and gives a permanent solution for the problem. Hence prior to improvement, the inheritance pattern of the trait should be studied. So the present investigation was carried out with objective to study the inheritance of the salinity tolerance at seedling stage in rice.
MATERIALS AND METHODS
The present investigation was conducted at Pandit Jawaharlal Nehru College of Agriculture and Research Institute, Puducherry during the year 2012–2014. ADT 45 a popular rice variety of Tamil Nadu as female parent and Nona Bokra a salt tolerant land race of West Bengal as male parent were used to develop mapping population. F1, F2 and F3 progenies generated from the above cross, Pokkali (tolerant check) and IR29 (susceptible check) formed the materials of the study. Fourteen day old seedlings were subjected to salinity stress in glasshouse. F1, F2 and F3 generations were evaluated for seedling stage tolerance in hydroponics culture at EC 12 dSm-1 in glass house. Data on SES score and four physiological traits were recorded.
RESULTS AND DISCUSSION
The mean salinity score of F1 plants varied between 1 and 4.69 on eighth and fifteen day of salinization respectively. The level of tolerance of F1 is moderate, comparable totolerant parent and check variety (2.66). A total of 1156 F2 population, evaluated for seedling stage salt tolerance in hydroponics culture at EC 12 dSm-1 and based on screening 131 tolerant F2 individuals were identified. The salinity score was normally distributed indicating polygenic nature of the trait. The 131 tolerant F2 individuals were forwarded to F3 generation. The 82 survived individuals were grown in row to progeny subjected to salinity screening and showed segregation indicating that trait is controlled by the non-additive gene action. Selection differential
It is I
LLEGAL t
o cop
y, pri
nt or
save
any c
onten
t of th
is PDF,
in pa
rt or in
full,
on an
y retr
ieval
syste
m,
withou
t the E
XPRESS WRITTEN PERMISSIO
N of th
e cop
yrigh
t-hold
er

National Conference on Climate Change and Agricultural Production: Adapting Crops to Climate Variability and Uncertainty, 6th–8th April, 2017
[499]
(D) of 4.11 and selection response (R) of 1.05 was observed in this study, resulted in the low realized heritability of 0.26 for the trait. For traits with moderate to low realized heritability MAS is more efficient than phenotypic selection for crop improvement (Collard and Mackill, 2008). The normal distribution of salinity score indicates that salinity is quantitative trait and suggesting it is governed by the additive gene action. So for improving salt tolerance in rice, Marker Assisted Selection combined with conventional breeding will yield fruitful results.
Table 1: Salinity Score Mean and Range of Parents, F1 and F2 Progenies Generation/ Genotype
Mean ± S.E (Range) 8 DAS 9 DAS 10 DAS 11 DAS 12 DAS 13 DAS 14 DAS 15 DAS
P1 (ADT45) 3.00 ± 0.00 5.66 ± 0.57 6.60 ± 0.50 6.80 ± 0.50 7.00 ± 0.57 9.00 ± 0.00 9.00 ± 0.00 9.00 ± 0.00 (3) (3 -5) (5 - 7) (7 - 9) (7 - 9) (9) (9) (9) P2 (Nona Bokra) 1.00 ± 0.00 1.00 ± 0.00 1.00 ± 0.00 1.00 ± 0.00 1.66 ± 0.42 2.33 ± 0.42 2.66 ± 0.33 2.66 ± 0.33 (1) (1) (1) (1) (1- 3) (1- 3) (1- 3) (1- 3) Pokkali 1.00 ± 0.00 1.00 ± 0.00 1.00 ± 0.00 1.00 ± 0.00 1.33 ± 0.33 2.33 ± 0.42 2.33 ± 0.42 2.66 ± 0.33 (Tol. Check) (1) (1) (1) (1) (1-3) (1-3) (1-3) (1-3) IR29 6.75 ± 0.22 7.00 ± 0.00 8.60 ± 0.00 8.90 ± 0.24 9.00 ± 0.00 9.00 ± 0.00 9.00 ± 0.00 9.00 ± 0.00 (Sus. Check) (5-7) (7) (7 -9) (7 -9) (9) (9) (9) (9) F1 1.00 ± 0.00 1.60 ± 0.28 2.70 ± 0.15 3.15 ± 0.15 3.15 ± 0.15 3.30 ± 0.20 3.92 ± 0.28 4.69 ± 0.46 (1) (1 -3) (3- 5) (3 -5) (3- 5) (3- 5) (3- 5) (3 -7) F2 1.64 ± 0.05 2.27 ± 0.06 3.08 ± 0.06 3.33 ± 0.07 3.52 ± 0.08 3.77 ± 0.08 4.22 ± 0.08 5.11 ± 0.09 (1 -9) (1 -9) (1 -9) (1 -9) (1 -9) (1- 9) (1 -9) (1 -9)
*DAS: Days after Stalinization *The values in the parenthesis indicates the salinity score range DAS
REFERENCES [1] Collard B C Y and Mackill D J 2008. Marker assisted selection: an approach for precision plant breeding in the twenty-first century.
Philosophical Transactions Royal Society London B363: 557-572. [2] Sahi C, Singh A, Kumar K, Blumwald E and Grover A 2006. Salt stress response in rice: genetics, molecular biology and comparative
genomics. Functional & Integrative Genomics 6: 263-284.
Impression of Elevated CO2 on the Herbivory of Tomato Fruit Borer (Helicoverpa armigera, Hubner)
Kalpana Bisht1* and Vijay Kumar Mishra2 1Department of Entomology, 2Agricultural Zoology, Institute of Agricultural Sciences
1,2Banaras Hindu University, Varanasi–221005, India E-mail: *[email protected]
Keywords: CO2 Concentration, Tomato, Helicoverpa armigera
INTRODUCTION
The mass balance analysis shows that net global carbon uptake has increased significantly by 0.05 billion tonnes of carbon per year and global carbon uptake doubled, from 2.4±0.8 to 5.0±0.9 billion tones per year, between 1970 to 2010 and is anticipated to reach 550 ppm by 2050 (Ballantyne et al., 2012). Elevation in CO2 increases the carbon to nitrogen (C:N) ratio and reduces the N content in the tissue of plants, it alters the synthesis of phenols, terpenes and other secondary metabolites. Such changes in C:N ratio and secondary metabolites alter the nutritional quality and palatability of host plant for herbivorous insects. Tomato plants grown under elevated CO2 concentration have greater total root length, root surface area, root diameter, root volume and number of lateral roots than those under ambient CO2 (Wang et al., 2013).
It is I
LLEGAL t
o cop
y, pri
nt or
save
any c
onten
t of th
is PDF,
in pa
rt or in
full,
on an
y retr
ieval
syste
m,
withou
t the E
XPRESS WRITTEN PERMISSIO
N of th
e cop
yrigh
t-hold
er

National Conference on Climate Change and Agricultural Production: Adapting Crops to Climate Variability and Uncertainty, 6th–8th April, 2017
[500]
MATERIALS AND METHODS
Under laboratory conditions studies were made to observe the influence of elevated CO2 concentrations i.e. 700 ppm on host (Tomato, Lycopersicon esculentum) and its insect herbivore (Tomato Fruit Borer, Helicoverpa armigera, Hubner) in relation to ambient CO2 i.e. 398 ppm concentration.
RESULTS AND DISCUSSION
Biochemical analysis of tomato leaves under elevated CO2 revealed low nitrogen and high carbon content with increased C:N ratio but no change in phenol content. Due to the alteration in food quality growth parameters of H. armigera increased, in form of gain in larval weight because of heavy feeding and more fecal matter production. Life-span of larva increased by 6.54, 8.00 and 11.62 per cent and larval survival rate decreased by 8.25, 10.00 and 12.24 per cent in first, second and third generations respectively, under elevated CO2 compared with ambient CO2. Further, fecundity also decreased to 565 eggs/ female from ambient situation i.e. 610 eggs/ female. Studies conclude that increased CO2 concentrations has the negative effect on the growth and development of H. armigera.
REFERENCES [1] Ballantyne A P, Alden C B, Miller J B, Tans P P and White J W C 2012. Increase in observed net carbon dioxide uptake by land and
oceans during the last 50 years. Nature488:70-72 [2] Wang H, Xiao W, Niu Y, Jin C, Chai R, Tang C and Zhang Y 2013. Nitric oxide enhances development of lateral roots in tomato
(Solanum lycopersicum L.) under elevated carbon dioxide. Planta 237:137-144
Comparative Toxicity of Conventional and Novel Acaricides against the Vegetable Mite Tetranychus neocaledonicus Andre on Brinjal Crop
Pushpa Singh1* and R.N. Singh2 1Department of Entomology and Agricultural Zoology,
Dr. Rajendra Prasad Central Agricultural University, Pusa–848125, India 2Department of Entomology & Agricultural Zoology,
Institute of Agricultural Sciences, Banaras Hindu University, Varanasi–221005, India E-mail: *[email protected]
Keywords: Acaricides, Relative Toxicity, Regression Equation, T. neocaledonicus
INTRODUCTION
Farmers in general use various pesticides for management of mites so it is very important to make comparative study of both conventional and novel acaricides before recommendation to farmers. Six acaricides were screened by leaf dip method and their LC50 value was determined and relative toxicity was worked out by taking the LC50 of dicofol as standard check. The mortality count was recorded and corrected mortality was calculated as per Abbott (1925). The experiment was carried out in Acarology Laboratory, Department of Entomology and Agricultural Zoology, Institute of Agricultural Sciences, Banaras Hindu University, Varanasi to test the relative toxicity of seven pesticides propargite 57EC, clofentazine 50SC, cyflumetofen 20EC, fenpyroximate 5EC, dicofol 18.5EC, azadirachtin 0.03EC and water as control against mites in laboratory conditions The experiment was conducted with objective to test the efficacy of acarides in laboratory condition.
It is I
LLEGAL t
o cop
y, pri
nt or
save
any c
onten
t of th
is PDF,
in pa
rt or in
full,
on an
y retr
ieval
syste
m,
withou
t the E
XPRESS WRITTEN PERMISSIO
N of th
e cop
yrigh
t-hold
er

National Conference on Climate Change and Agricultural Production: Adapting Crops to Climate Variability and Uncertainty, 6th–8th April, 2017
[501]
MATERIALS AND METHODS
Leaf disc bioassay were used to estimate the LC50 (the lethal concentrations that kill 50% the population) of a particular acaricide. Using a fine brush (10/0), thirty adult T. neocaledonicus females of the same age were placed on a brinjal leaf disc (2 cm diameter) on water-saturated cotton (4 cm x 4 cm) in a petri dish (6 cm diameter). Leaf discs were placed on a single petri dish. Water saturated cotton was pushed up against the perimeter of the leaf disc, in order to create a barrier and prevent mites from walking off the disk, since mite walk-off is sometimes observed in these tests. Each bioassay consisted of acaricide concentrations with 4 replicate discs per tested concentration.
RESULTS AND DISCUSSION
The experiment result on comparative toxicity in laboratory conditions showed that fenpyroximate 5EC was most toxic with lowest LC50 value, followed by dicofol 18.5 EC, cyflumetofen 20SC, clofentazine 50SC, propargite 57 EC and least was azadirachtin 0.03 EC. Relative toxicities of fenpyroximate 5EC, cyflumetofen 20SC, clofentazine 50SC, propargite57 EC, azadirachtin 0.03 EC and dicofol 18.5 EC was 2.955, 0.930, 0.240, 0.193, 0.065 and 1.00 respectively. Akashe et al. (2004) evaluated miticides for their toxicity against T. urticae under laboratory conditions and from his findings it was evident that abamectin was more toxic causing 100 per cent mortality followed by clofentazine and amitraz and least effective miticide was sulphur.
Table 1: Relative Toxicity of Acaricides against T. neocaledonicus by Leaf Dip Method Chemicals No of Mites
Exposed χ2
p=0.05 Regression
Equation (Slope) LC50 ppm Fiducial Limit (95%) Relative
Toxicity LL UL Proporgite 57 EC 30 0.36 1.32 + 2.68 108.62 94.24 139.86 0.193 Clofentazine 50 SC 30 0.237 1.19 + 2.36 87.207 67.16 99.90 0.240 Cyflumetofen 20 SC 30 2.169 0.27 + 0.37 22.53 11.614 53.320 0.930 Fenproximate 5 EC 30 0.692 0.19 + 0.14 7.095 3.771 22.718 2.955 Dicofol 18.5 EC 30 0.948 0.17 + 0.22 20.971 12.425 51.385 1.000 Azadirachtin 0.03 EC 30 0.678 0.19 + 0.43 319.354 183.283 888.626 0.065
REFERENCES [1] Abbott W S 1925. A method of computing the effectiveness of insecticide, Journal of EconomicEntomology18: 265-267. [2] Akashe V B 2004. Toxicity of some newer miticides against Tetranychus urticae (Koch) on roses irrespective of resistance development,
Journal of Maharashtra Agricultural Universities 29(1): 94-95.
Genetic Variability and Correlation Studies in Cluster Bean
A.M. Apturkar* and P.S. Umbarkar Department of Horticulture,
Dr. Panjabrao Deshmukh Krishi Vidyapeeth, Akola–441001, India E-mail: *[email protected]
Keywords: Variability, Correlation, Cluster bean
INTRODUCTION
Cluster bean (Cyamopsis tetragonoloba) belongs to family Leguminosae. India is considered to be the centre of origin for cluster bean. The production of cluster bean is very low because of lower attention was given for its cultivation, and lower adaptability. Also there is lack of varieties for particular purposes like vegetables, fodder, guar gum and seed purposes. Hence present experiment carried out with the objectives to investigate
It is I
LLEGAL t
o cop
y, pri
nt or
save
any c
onten
t of th
is PDF,
in pa
rt or in
full,
on an
y retr
ieval
syste
m,
withou
t the E
XPRESS WRITTEN PERMISSIO
N of th
e cop
yrigh
t-hold
er
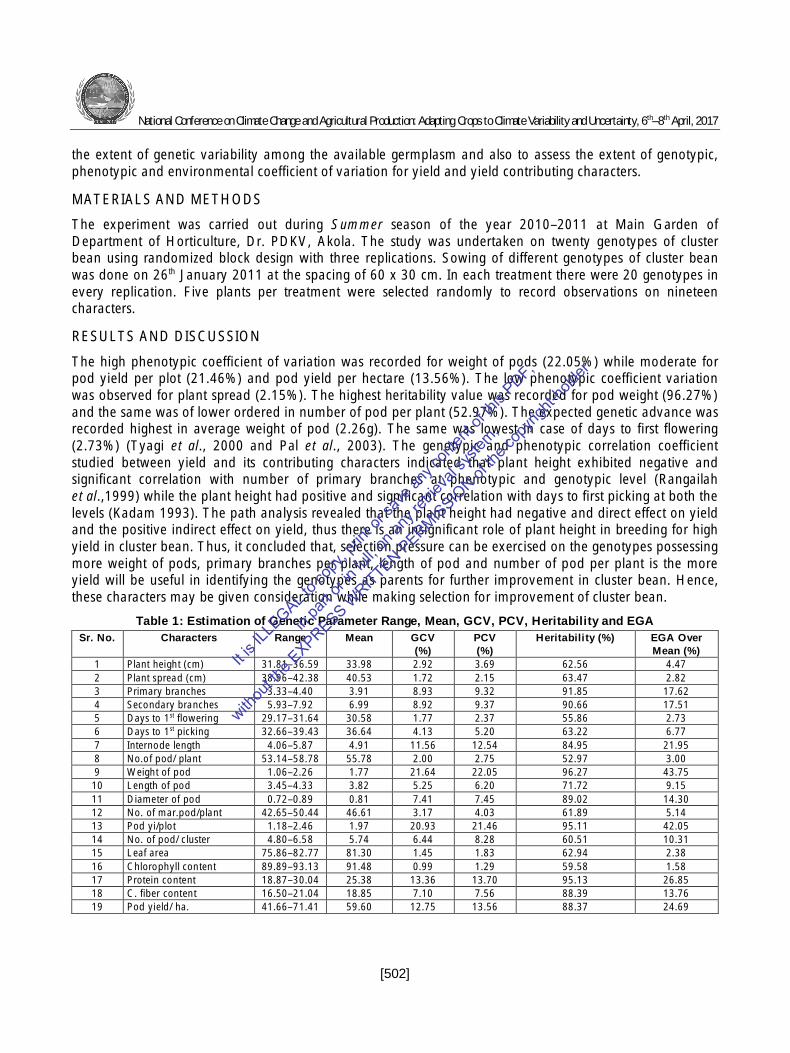
National Conference on Climate Change and Agricultural Production: Adapting Crops to Climate Variability and Uncertainty, 6th–8th April, 2017
[502]
the extent of genetic variability among the available germplasm and also to assess the extent of genotypic, phenotypic and environmental coefficient of variation for yield and yield contributing characters.
MATERIALS AND METHODS
The experiment was carried out during Summer season of the year 2010–2011 at Main Garden of Department of Horticulture, Dr. PDKV, Akola. The study was undertaken on twenty genotypes of cluster bean using randomized block design with three replications. Sowing of different genotypes of cluster bean was done on 26th January 2011 at the spacing of 60 x 30 cm. In each treatment there were 20 genotypes in every replication. Five plants per treatment were selected randomly to record observations on nineteen characters.
RESULTS AND DISCUSSION
The high phenotypic coefficient of variation was recorded for weight of pods (22.05%) while moderate for pod yield per plot (21.46%) and pod yield per hectare (13.56%). The low phenotypic coefficient variation was observed for plant spread (2.15%). The highest heritability value was recorded for pod weight (96.27%) and the same was of lower ordered in number of pod per plant (52.97%). The expected genetic advance was recorded highest in average weight of pod (2.26g). The same was lowest in case of days to first flowering (2.73%) (Tyagi et al., 2000 and Pal et al., 2003). The genotypic and phenotypic correlation coefficient studied between yield and its contributing characters indicated that plant height exhibited negative and significant correlation with number of primary branches at phenotypic and genotypic level (Rangailah et al.,1999) while the plant height had positive and significant correlation with days to first picking at both the levels (Kadam 1993). The path analysis revealed that the plant height had negative and direct effect on yield and the positive indirect effect on yield, thus there is an insignificant role of plant height in breeding for high yield in cluster bean. Thus, it concluded that, selection pressure can be exercised on the genotypes possessing more weight of pods, primary branches per plant, length of pod and number of pod per plant is the more yield will be useful in identifying the genotypes as parents for further improvement in cluster bean. Hence, these characters may be given consideration while making selection for improvement of cluster bean.
Table 1: Estimation of Genetic Parameter Range, Mean, GCV, PCV, Heritability and EGA Sr. No. Characters Range Mean GCV
(%) PCV (%)
Heritability (%) EGA Over Mean (%)
1 Plant height (cm) 31.81–36.59 33.98 2.92 3.69 62.56 4.47 2 Plant spread (cm) 38.96–42.38 40.53 1.72 2.15 63.47 2.82 3 Primary branches 3.33–4.40 3.91 8.93 9.32 91.85 17.62 4 Secondary branches 5.93–7.92 6.99 8.92 9.37 90.66 17.51 5 Days to 1st flowering 29.17–31.64 30.58 1.77 2.37 55.86 2.73 6 Days to 1st picking 32.66–39.43 36.64 4.13 5.20 63.22 6.77 7 Internode length 4.06–5.87 4.91 11.56 12.54 84.95 21.95 8 No.of pod/ plant 53.14–58.78 55.78 2.00 2.75 52.97 3.00 9 Weight of pod 1.06–2.26 1.77 21.64 22.05 96.27 43.75 10 Length of pod 3.45–4.33 3.82 5.25 6.20 71.72 9.15 11 Diameter of pod 0.72–0.89 0.81 7.41 7.45 89.02 14.30 12 No. of mar.pod/plant 42.65–50.44 46.61 3.17 4.03 61.89 5.14 13 Pod yi/plot 1.18–2.46 1.97 20.93 21.46 95.11 42.05 14 No. of pod/ cluster 4.80–6.58 5.74 6.44 8.28 60.51 10.31 15 Leaf area 75.86–82.77 81.30 1.45 1.83 62.94 2.38 16 Chlorophyll content 89.89–93.13 91.48 0.99 1.29 59.58 1.58 17 Protein content 18.87–30.04 25.38 13.36 13.70 95.13 26.85 18 C. fiber content 16.50–21.04 18.85 7.10 7.56 88.39 13.76 19 Pod yield/ ha. 41.66–71.41 59.60 12.75 13.56 88.37 24.69
It is I
LLEGAL t
o cop
y, pri
nt or
save
any c
onten
t of th
is PDF,
in pa
rt or in
full,
on an
y retr
ieval
syste
m,
withou
t the E
XPRESS WRITTEN PERMISSIO
N of th
e cop
yrigh
t-hold
er

National Conference on Climate Change and Agricultural Production: Adapting Crops to Climate Variability and Uncertainty, 6th–8th April, 2017
[503]
REFERENCES [1] Kadam A.A. 1993. Genetic parameters of yield structure and biomoss partitioning traits in Cowpea (Vigna unguiculata sub sp. Cylindrica
L. Walp.) and Asparagus Bean ( Vigna unguiculata sub sp. Srsquipedalis L. Fruw.) Msc. (Agri.). Thesis submitted to Dr. B.S.K.K.V., Dapoli Unpublished.
[2] Pal AK, Maurya A N, Singh B, Ram D and Kumar S 2003. Genetic variability, heritability and genetic advance in Cowpea (Vigna unguiculata L. Walp.).The Orissa Journal of Horticulture 31(1): 94-97.
[3] Rangaiah S, Nehru S D and Mahadeva P 1999. Genetic studies in two cross derivatives of cowpea. Mysore Journal of Agricultural Sciences 33(1): 125-129.
[4] Tyagi P C, Kumar N, Agrawal M C and Kumar M 2000. Genetic variability and association of component characters for seed yield in cowpea (Vigna unguiculata L. Walp.). Legume Research 23(2): 92-96.
Evaluation of Drought Tolerance Indices for Screening Some of Rice Genotypes
Himanshu Shekhar Garg*, Chandan Bhattacharya1, Rajesh Kumar2, Sudeshna Panja1 and Akhilesh Kumar Singh2
1Department of Genetics and Plant Breeding, Bidhan Chandra Krishi Viswavidyalaya Mohanpur, Nadia–741252, India
2Department of Plant Breeding & Genetics, Dr. Rajendra Prasad Central Agricultural University, Pusa–848125, India
E-mail: *[email protected]
Keywords: Rice, Drought Stress, Seed Yield, Tolerant, Sensitive Indices
INTRODUCTION
Drought is the most severe abiotic stress reducing rice yield in rainfed drought prone ecosystems. Variation in intensity and severity of drought from season to season and place to place requires cultivation of rice varieties with different level of drought tolerance in different areas. Multi environment evaluation of breeding lines helps breeder to identify appropriate genotypes for areas prone to similar level of drought stress. Thirty eight elite rice genotypes varying in their yield performance and drought tolerance were evaluated to examine differences for some drought tolerance characters and to determine relationship between these characters. Genotypes differed in their response for grain yield, days to heading, excised-leaf water loss and relative water content under both conditions over years. Under irrigated conditions differences in the genotypes for water retention traits were not clear.
MATERIAL AND METHOD
Experiment was conducted in a randomized block design with three replications under water stress and non-stress condition in kharif season, 2015. Before the initiation of any breeding programme or mapping experiments, drought-tolerant donors were identified through screening of germplasm material. In order to evaluate the effect of drought stress on grain yield of confectionery rice, an experiment was carried out in the experimental field of Bidhan Chandra Krishi Viswa-Vidyalaya Mohanpur, Nadia at Jaguli Instructional Farm (Gangetic Alluvial Zone) and Regional Research Station (Red & Laterite Zone) Jhargram, Paschim Medinipur, West Bengal. In order to evaluation of 38 rice genotypes in different irrigation treatments based on sensitive and tolerance indices, Five drought tolerance indices include drought susceptible index (DSI), tolerance index (TOL), stress tolerance index (STI), yield stability index (YSI) and yield index (YI) were applied on the basis of seed yield in non-stress and drought stress conditions were measured.
It is I
LLEGAL t
o cop
y, pri
nt or
save
any c
onten
t of th
is PDF,
in pa
rt or in
full,
on an
y retr
ieval
syste
m,
withou
t the E
XPRESS WRITTEN PERMISSIO
N of th
e cop
yrigh
t-hold
er

National Conference on Climate Change and Agricultural Production: Adapting Crops to Climate Variability and Uncertainty, 6th–8th April, 2017
[504]
RESULT AND DISCUSSION
RAU-1428-6-7-3-6, RAU-1397-2-5-8-1-2-5-5, RAU-1415-3-5-7-6-9-5-3and RAU-1421-1-2-1-7-4-3-3 recorded the highest yield stability index (YSI) and are identified as the best drought-tolerant lines. The proposed YSI provides a more effective assessment as it is calculated after accounting for a significant genotype x stress-level interaction across environments. For rainfed areas with variable frequency of drought occurrence, Mean yield index (MYI) along with deviation in performance of genotypes from currently cultivated popular varieties in all situations helps to select genotypes with a superior performance across irrigated, moderate and severe reproductive-stage drought situations. RAU-1397-2-5-8-1-2-5-5 and RAU-1428-6-7-3-6 are the two genotypes identified to have shown a superior performance under all situations.
REFERENCES [1] Mitra J 2001.Genetics and genetic improvement of drought resistance in crop plants. Current Science India 80:758-762 [2] Passioura J B 2007. The drought environment: physical, biological and agricultural perspectives The Journal of Experimental Botany
58(2): 113-117.
Genetic Diversity in Maize (Zea Mays L.) Inbred Lines under Heat Stress Condition
Neha Rani, R.B.P. Nirala*, Anand Kumar, Sweta Kumari and P.K. Singh Department of Plant Breeding and Genetics,
Bihar Agricultural University, Sabour–813210, India E-mail: *[email protected]
Keywords: Maize, Inbred Line, Cluster Analysis, Genetic Diversity, Heat Stress, D2 Statistics
INTRODUCTION
With the progress of climate change, the global mean temperature and variance are expected to increase in the future. Temperature is one of the most important environmental stress affecting the yield of maize crop. The heat tolerance of plant is a complex trait, most probably controlled by multiple genes (Zhang et al., 2005) so the primary aim of maize breeding must be develop heat stress tolerant maize hybrids. Temperature stress in maize can reduce quality and yield; and further rise in temperature reduce its pollen viability and silk receptivity, resulting in poor seed set and reduced grain yield (Khodarahmpour, 2012). In Bihar, spring season maize crop suffers from high temperature (≥35°C) at the reproductive stage which results in high yield losses. Study of genetic diversity of inbred lines will play an important role for identification of heat tolerance inbred lines for development of heat tolerance hybrids for spring season. Therefore, an attempt was made to assess of genetic diversity among inbred lines in normal and heat stress conditions.
MATERIALS AND METHODS
The experimental material comprised of 29 CIMMYT inbreds of maize of diverse origin were evaluated at Bihar Agricultural University, Sabour during the year 2015 in Randomized Block Design with three replications having row to row distance 60cm and plant to plant distance 20 cm. Inbreds were planted at two dates: 30th January, 2015 as normal planting to avoid high temperature during pollination and grain filling period and 03rd March, 2015 to coincide heat stress with pollination and grain filling period.
It is I
LLEGAL t
o cop
y, pri
nt or
save
any c
onten
t of th
is PDF,
in pa
rt or in
full,
on an
y retr
ieval
syste
m,
withou
t the E
XPRESS WRITTEN PERMISSIO
N of th
e cop
yrigh
t-hold
er

National Conference on Climate Change and Agricultural Production: Adapting Crops to Climate Variability and Uncertainty, 6th–8th April, 2017
[505]
RESULTS AND DISCUSSION
Analysis of genetic diversity revealed considerable amount of diversity among the genotypes. In normal condition, D2 statistics displayed that cluster I, being the largest group, comprises 28 maize inbreds indicating overall genetic similarity among them followed by cluster II having mono-genotype cluster (Table 1a) while, under heat stress condition, all the inbreds were grouped into four clusters (Table 1b), with cluster I containing the maximum of 19 inbreds followed by 5 inbreds in cluster III, 4 inbreds in cluster II and one inbreds in cluster IV. In normal condition, the maximum intra-cluster distance was obtained for cluster I (51.49) (Table 2a) and inter-cluster distance was recorded 168.26. Under heat stress condition the intra- cluster distance was maximum in cluster III (96.7) followed by cluster I (79.33) and cluster II (48.63) (Table 2b) indicating wide genetic variability within clusters. The highest inter cluster distance was observed between cluster III and IV (461.97) followed by cluster II and III (339.63), cluster I and II (163.35) which indicated maximum diversity between inbreds of these clusters. Therefore, it is suggested that if the diverse inbreds from these groups along with the desirable heat tolerant traits are used in the heterosis breeding, it is expected to get better hybrids for high grain yield with heat stress tolerance due to non allelic interaction. The promising inbreds for grain yield per plant, grains per plant, shelling percentage, plant height, physiological maturity, 500-seed weight were identified from cluster IV and II on the basis of mean values which could be utilized for hybridization for the development of high yielding maize hybrids under heat stress condition, while in normal condition the promising genotypes for yield and yield attributing traits which had high mean value were identified from cluster I and cluster II, could be utilized for hybridization for the development of high yielding maize hybrids in normal condition (Khodarahmpour and Choukan, 2011). Among the thirteen traits studied, maximum contribution was made by 500-seed weight (23.65%) followed by plant height (21.45%) and shelling percentage (15.52%). Therefore, these characters may be given due importance during hybridization.
Table 1a: Distribution of Twenty Nine Inbred Lines of Maize Under Normal Condition Clusters No. of Inbred Lines Name of Genotypes Included Cluster I 28 CML 27, CML 73, CML 474, CML451, CML 70, CML28, CML172, CML471, CML139, CML18,
CML308, CML161, CML189, CML328, CML162, CML474, CML25, CML116, CML50, CML305, CML306, CML304, CML411, CML19, CML118, CML33, CML164, CML307
Cluster II 01 CML130
Table 1b: Distribution of Twenty Nine Inbred Lines of Maize under Heat Stress Condition Clusters No. of Inbred Lines Name of Genotypes Included Cluster I 19 CML 27, CML 73, CML 474, CML451, CML 70, CML28, CML172, CML471, CML139, CML18,
CML308, CML161, CML189, CML328, CML162, CML474, CML25, CML116, CML50 Cluster II 04 CML305, CML306, CML304, CML411 Cluster III 05 CML19, CML118, CML33, CML130, CML164 Cluster IV 01 CML307
Table 2a: Average Intra (Bold Values) and Inter Cluster Distance among Two Clusters for Twenty Nine Inbred Lines of Maize under Normal Condition
Clusters Cluster I Cluster II Cluster I 51.49 168.26 Cluster II 0.00
Table 2b: Average Intra (Bold Values) and Inter Cluster Distance among Four Clusters for Twenty Nine Inbred of Maize Under Heat Stress Condition
Clusters Cluster I Cluster II Cluster III Cluster IV Cluster I 79.33 163.35 131.66 296.05 Cluster II 48.63 339.63 164.70 Cluster III 96.7 461.97 Cluster IV 0.00
It is I
LLEGAL t
o cop
y, pri
nt or
save
any c
onten
t of th
is PDF,
in pa
rt or in
full,
on an
y retr
ieval
syste
m,
withou
t the E
XPRESS WRITTEN PERMISSIO
N of th
e cop
yrigh
t-hold
er

National Conference on Climate Change and Agricultural Production: Adapting Crops to Climate Variability and Uncertainty, 6th–8th April, 2017
[506]
REFERENCES [1] Khodarahmpour Z 2012.Morphological classification of maize (Zea mays L.) genotypes in heat stress condition. Journal of Agricultural
Science 4 (5): 31-40. [2] Khodarahmpour Z and Choukan R 2011. Study of genetic variation of maize (Zea mays L.) inbred lines in heat stress condition using
cluster analysis. Seed and Plant Journal 4: 1-27.
Effect of Abiotic Factors on Population Dynamics of Important Insect and Gastropod Pest in Makhana Crop under Field Conditions
Paras Nath*, Anil Kumar, Rajesh Kumar, M. Udaya Kumar and Shambhu Nath B.P.S. Agricultural College, Bihar Agricultural University, Purnea–854302, India
E-mail: *[email protected]
Keywords: Abiotic Factors, Population Dynamics, Pest, Makhana
INTRODUCTION
Makhana (Euryale ferox Salisb.) is an important aquatic fruit crop of India. In India this crop is grown in an area of 20,000 ha approximately, out of which 80% area is in Bihar. The average production and productivity of makhana crop in Bihar is 3,18,750 q and 21.25 qha-1 respectively (Minten et al., 2014). Makhana crop is grown in rice field conditions besides the traditional cultivation in pond system. At present, 40–45% of makhana crop is cultivated in rice field condition and rest is under the pond system. Due to adoption of this crop from pond to land system, the insect pest and gastropods assumed the status of pest causing significant economic loss to the crop. So keeping in view, the changing pattern of cropping system of Makhana crop and losses caused by the pests, the present study was undertaken to ascertain the role of weather parameters in population dynamics of important insect and gastropod pest during entire crop growth period in Makhana.
MATERIALS AND METHODS
The present investigation was conducted at Makhana research unit of BPSAC, Purnea to ascertain the role of weather parameters in population dynamics of important insect and gastropod pest during entire crop growth period in crop season 2015 and 2016. Five plants were randomly selected at weekly intervals and from each plant three leaves (one each of old, fully matured and newly emereged leaves) were selected for counting the case worms (E. depuntalis & E. crisonalis), Rib borer or blood worm (Chironomous Spp.), Aphid (R. nymphaeae) and gastropods. A correlation was drawn against insect pest and the abiotic factors like maximum temperature and minimum temperature and relative humidity (RH) during the entire crop season 2015 and 2016.
RESULTS AND DISCUSSION
The data revealed that both the case worms (E. depunctalis & E. crisonalis) are showing positively correlated with correlation coefficients (0.18 and 0.28), respectively with maximum temperatures and negatively correlated with minimum temperature (-0.46 and -0.29) and relative humidity (-0.97 and -0.94) respectively, where as the Rib borer or blood worm (Chironomous Spp.) and gastropods showed a positive correlation with all abiotic factors (Table I). But the aphids are the only pest showing negatively correlation with all abiotic factors. The peak activity of Aphid (R. nymphaeae) was from February to March and it sharply declined and disappeared in the month of April. Both case worms (E. depuntalis & E. crisonalis) appeared in February on the crop with peak activity from march to June and their population declined in July (Fig. 1).
It is I
LLEGAL t
o cop
y, pri
nt or
save
any c
onten
t of th
is PDF,
in pa
rt or in
full,
on an
y retr
ieval
syste
m,
withou
t the E
XPRESS WRITTEN PERMISSIO
N of th
e cop
yrigh
t-hold
er
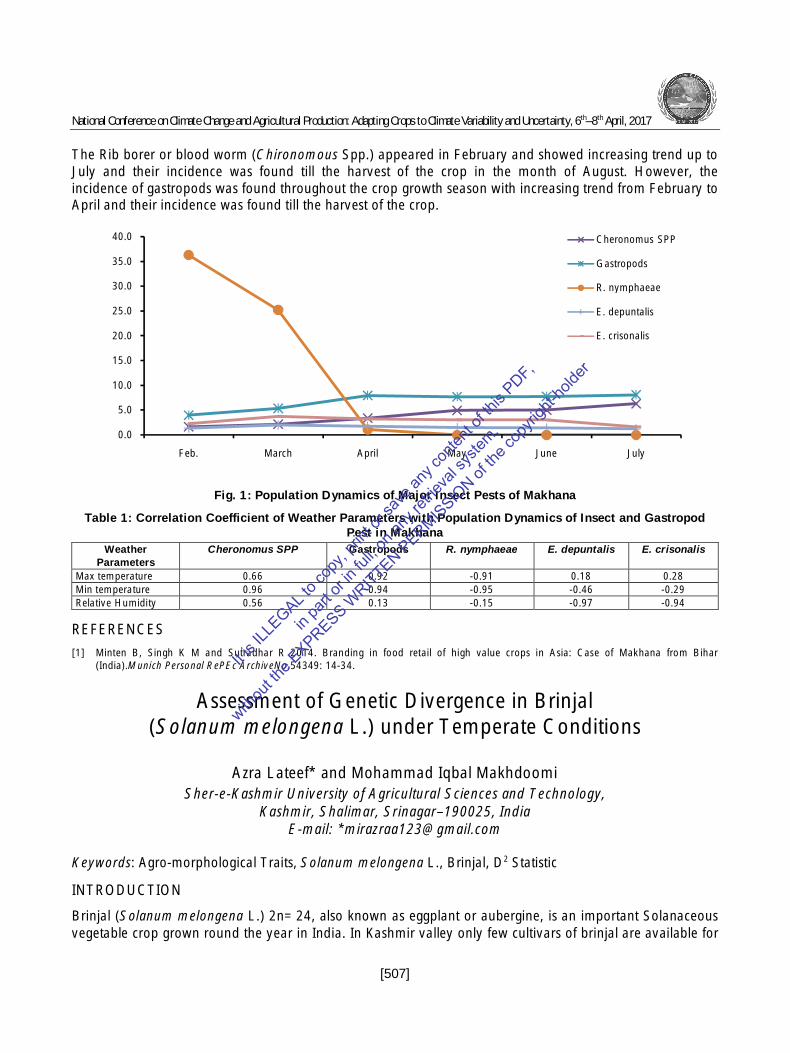
National Conference on Climate Change and Agricultural Production: Adapting Crops to Climate Variability and Uncertainty, 6th–8th April, 2017
[507]
The Rib borer or blood worm (Chironomous Spp.) appeared in February and showed increasing trend up to July and their incidence was found till the harvest of the crop in the month of August. However, the incidence of gastropods was found throughout the crop growth season with increasing trend from February to April and their incidence was found till the harvest of the crop.
Fig. 1: Population Dynamics of Major Insect Pests of Makhana
Table 1: Correlation Coefficient of Weather Parameters with Population Dynamics of Insect and Gastropod Pest in Makhana
Weather Parameters
Cheronomus SPP Gastropods R. nymphaeae E. depuntalis E. crisonalis
Max temperature 0.66 0.92 -0.91 0.18 0.28 Min temperature 0.96 0.94 -0.95 -0.46 -0.29 Relative Humidity 0.56 0.13 -0.15 -0.97 -0.94
REFERENCES [1] Minten B, Singh K M and Sutradhar R 2014. Branding in food retail of high value crops in Asia: Case of Makhana from Bihar
(India).Munich Personal RePEc ArchiveNo.54349: 14-34.
Assessment of Genetic Divergence in Brinjal (Solanum melongena L.) under Temperate Conditions
Azra Lateef* and Mohammad Iqbal Makhdoomi Sher-e-Kashmir University of Agricultural Sciences and Technology,
Kashmir, Shalimar, Srinagar–190025, India E-mail: *[email protected]
Keywords: Agro-morphological Traits, Solanum melongena L., Brinjal, D2 Statistic
INTRODUCTION
Brinjal (Solanum melongena L.) 2n=24, also known as eggplant or aubergine, is an important Solanaceous vegetable crop grown round the year in India. In Kashmir valley only few cultivars of brinjal are available for
0.0
5.0
10.0
15.0
20.0
25.0
30.0
35.0
40.0
Feb. March April May June July
Cheronomus SPP
Gastropods
R. nymphaeae
E. depuntalis
E. crisonalis
It is I
LLEGAL t
o cop
y, pri
nt or
save
any c
onten
t of th
is PDF,
in pa
rt or in
full,
on an
y retr
ieval
syste
m,
withou
t the E
XPRESS WRITTEN PERMISSIO
N of th
e cop
yrigh
t-hold
er

National Conference on Climate Change and Agricultural Production: Adapting Crops to Climate Variability and Uncertainty, 6th–8th April, 2017
[508]
commercial cultivation which are either poor yielders and/or susceptible to various biotic and abiotic stresses. In the face of increasing population, there is a need for increased production and productivity levels of Brinjal. In view of high local preferences for color, shape, taste, it is not possible to have one common cultivar to suit different localities of a region and local preferences. As an initial step to develop high yielding and superior quality brinjal varieties for cultivation under temperate conditions of Kashmir valley, it is imperative to evaluate a large number of existing genotypes. Genetic divergence analysis among genotypes is helpful to screen the genetically diverse parents that are likely to produce high heterotic effects among crosses and also generate large spectrum of variability during segregation and recombination of genes at heterozygous polygenic blocks.
MATERIALS AND METHODS
In the present investigation, fifty diverse lines/genotypes of Brinjal, maintained by the Division of Vegetable Science, SKUAST-K Shalimar Srinagar. The Genotypes were evaluated for various yield and yield attributing traits at the Experimental fields of the Division of Vegetable science, during kharif 2015. The experiment was laid in Random Complete Block Design with three replications. The plots of size 2.4 x 1.8 m (4.32 m2), consisted of 3 rows of each genotype in each replication at spacing of 45 x 45 cm. Observations were recorded on five randomly selected plants for each entry per replication. The genetic divergence was calculated using multivariate technique Mahalanobis (1928) D2 statistics by employing Tocher’s method (Rao, 1952).
RESULTS AND DISCUSSION
Analysis of variance revealed significant variation among all the genotypes for all the sixteen characters under study. Mean sum of squares due to genotypes for all the characters were found highly significant. Based on D2 analysis all the fifty genotypes were grouped into eleven clusters. Cluster I had the highest number of genotypes (32) followed by cluster IV (9), while the remaining nine clusters i.e. clusters II, III,V, VI, VII, VIII contained one genotype each. Intracluster distance (D2) was maximum in cluster IV (670.61), followed by the cluster I (542.72). The intercluster distance (D2) was maximum between the cluster VII and VIII (4073.68) followed by cluster VIII and XI (3797.06), clusters III and VIII (3420.37), cluster VI and XI (3115.55) and cluster IX and XI (3009.83). The maximum intra cluster distance (D2) (cluster IV) indicated high heterogeneity in genetic constitution of genotypes in that cluster. The highest value of intercluster distance (cluster VII and VIII) indicated also more heterogeneous genetic constitution of genotypes included in both clusters. The per cent contribution of traits towards the total genetic divergence. revealed that the fruit yield was the main factor contributing to divergence in the present study, accounting for about 32.67 per cent contribution, followed by plant height (24.50%), plant spread (13.07%), dry matter (6.12), Anthocyanin content (4.65%), fruit length (4.57), average fruit weight (3.59), vitamin C content (3.26), number of pickings plant-1 (2.69), number of branches plant-1 (2.22%), days to first fruit picking (1.47), days to first fruit flower (0.57), number of fruits plant-1 (0.41), and fruit diameter, days to first fruit set and TSS (0.08%) each. Thus from present study, crosses between the genotypes of cluster VII with VIII and VIII with cluster XI are likely to exhibit high heterosis and produce recombinants with desired traits.
It is I
LLEGAL t
o cop
y, pri
nt or
save
any c
onten
t of th
is PDF,
in pa
rt or in
full,
on an
y retr
ieval
syste
m,
withou
t the E
XPRESS WRITTEN PERMISSIO
N of th
e cop
yrigh
t-hold
er

National Conference on Climate Change and Agricultural Production: Adapting Crops to Climate Variability and Uncertainty, 6th–8th April, 2017
[509]
Fig. 1: Mahlanobis Euclean Distance (not to the Scale)
REFERENCES [1] Mahalanobis P C 1928. A statistical study of Chinese head measurement. Man in India 8: 32-64. [2] Rao C R 1952. Advanced Statistical Methods in Biometrical Research. Wiley and Sons, New York.
Phytophthora Leaf Rot and Anthracnose Leaf Spot Severity in Magahi Panas Influenced by Weather Conditions
*Prabhat Kumar, Shivnath Das and Ajit Kumar Pandey Betelvine Research Centre, Islampur, Nalanda–801303,
Bihar Agricultural University, Sabour, Bhagalpur–813210, India E-mail: *[email protected]
Keywords: Phytophthora Leaf Rot, Anthracnose Leaf Spot, Betelvine, Magahi Pan
INTRODUCTION
Magahi pan cultivar of betelvine is very popular among betel quid consumers due to its taste, texture and aroma. However, this cultivar is vulnerable to attacks of many diseases like Phytophthora foot rot & leaf rot, Anthracnose leaf spot, bacterial leaf spot and sclerotium wilt etc. Among the various diseases of betelvine, Phytophthora leaf rot and Anthracnose leaf spot are most severe which affect the production of leaf as well as its quality. An attempt was made to study the severity of these two diseases in different periods of its occurrence and correlated with weather conditions (rainfall temperature and relative humidity).
MATERIALS AND METHODS
A field experiment on disease severity of Phytophthora leaf rot and anthracnose leaf spot in Magahi pan cultivar of Betelvine (Piper betle L.) as influenced by weather conditions was conducted during during three
It is I
LLEGAL t
o cop
y, pri
nt or
save
any c
onten
t of th
is PDF,
in pa
rt or in
full,
on an
y retr
ieval
syste
m,
withou
t the E
XPRESS WRITTEN PERMISSIO
N of th
e cop
yrigh
t-hold
er

National Conference on Climate Change and Agricultural Production: Adapting Crops to Climate Variability and Uncertainty, 6th–8th April, 2017
[510]
consecutive years (2013-14, 2014-15 & 2015-16) at Betelvine Research Centre, Islampur (Nalanda). The field experiment was laid out in a randomized block design with three replications. The disease severity of Phytophthora leaf rot and Anthracnose leaf spot were recorded using 0-5 scoring scale from 100 randomly collected leaves as described by Goswami et al. (2002). The Percent Disease Index was computed based on the formula;
PDI =Sum of numerical values
No. of plant parts observed ×100
Maximum disease rating
Disease data were correlated with the meteorological data to find out the critical weather condition for the epidemiology of the disease. Meteorological data were collected from the nearest Meteorological Centre (ICAR complex, Patna).
RESULTS AND DISCUSSION
From the pooled data of three consecutive years (2013–14 to 2015–16) indicate that Phytophthora leaf rot severity was maximum (40.4%) during August. This might be due to high rainfall (311.0 mm) during this month as compared to other month of disease severity period. The anthracnose leaf spot severity was (28.0%) during December because of low temperature (10.6 C) and high relative humidity (92.0%). as compared to other d. Based on three years observations and analysis it could be concluded that protection measure against phytophthora leaf rot and anthracnose leaf spot ahould be taken before August and December month, respectively to minimising the losses of betel leaf of Magahi pan production
REFERENCE [1] Goswami B K, Kader K A, Rahman M. L, Islam M R. and Malaker P K 2002.Development of leaf spot of betelvine caused by
Colletotrichum capsici.Bangladesh Journal of Plant Pathology 18 (1&2): 39-42.
Effect of Gamma Radiations on Yield and Yield Attributing Characters of Cultivars of Dolichos Bean (Lablab purpureus L.) in M2 Generation
Harish Kumar*, Shivaputra, Manohar Lal Meghwal and S.M. Ghawade Chilli and Vegetable Research Unit, Department of Horticulture,
Dr. Panjabrao Deshmukh Krishi Vidyapeeth, Krishinagar, Akola–444104, India E-mail: *[email protected]
Keywords: Lablab Bean, Dolichos Bean, Gamma Radiation
INTRODUCTION
Dolichos bean (Lablab purpureus L.) belongs to the family Fabaceae. It is also known as Indian bean, hyacinth bean. Lablab bean is believed to have originated in India. Dolichos bean is mainly grown for its green pods, while the dry seeds are used in various vegetable preparations. It is a perennial herbaceous plant often grown as an annual. It is a highly self pollinated crop and naturally variability percentage is very low. Gamma rays have tremendous capacity to create variability (Chakraborthy and Parthasarathy, 2003). Hence, this experiment is frame out to create the variability in dolichos bean.
MATERIALS AND METHODS
The present investigation was carried out during 2015-16 at Chilli and Vegetable Research Unit, Dr. P.D.K.V., Akola and the gamma radiation treatment on seeds of both cultivars was done at Bhabha Atomic
It is I
LLEGAL t
o cop
y, pri
nt or
save
any c
onten
t of th
is PDF,
in pa
rt or in
full,
on an
y retr
ieval
syste
m,
withou
t the E
XPRESS WRITTEN PERMISSIO
N of th
e cop
yrigh
t-hold
er

National Conference on Climate Change and Agricultural Production: Adapting Crops to Climate Variability and Uncertainty, 6th–8th April, 2017
[511]
Research Centre (BARC), Trombay, Mumbai. In the present investigation the seeds collected from M1 generation of dolichos bean were sown in progeny rows to raise the M2 generation according to the treatments (viz., 25 kR, 35 kR, 45 kR and 55 kR) of both cultivars Deepali and Konkan Bhushan along with control treatments to evaluate the effect of gamma radiation on yield and other yield attributing characters.
RESULTS AND DISCUSSION
The results of present investigation indicated that, all the treatments of both cultivars with gamma radiations registered significant reduction in germination, vine length, survival, yield contributing characters viz., number of green pods per plant, green pod weight, green pod yield per plant, number of seeds per pod, seed yield per plant with increase in radiation doses. However, the significant increase in branches per vine and delayed first flowering, 50 % flowering and first pod set were observed with enhanced dose of radiation. Higher doses of gamma radiation had shown maximum variants among the population than lower doses, which ultimately results in maximum frequency of mutation. Both the varieties of dolichos bean highly affected by the application of gamma radiation. The variety Konkan Bhushan had shown gradual earliness with 25 kR and 35 kR treatment. The present investigation revealed that the isolation of early maturing variety with high yield component characters is possible in 25 kr and 35kR treatment of gamma rays.
Table 1: Effect of Gamma Radiation on Yield and Yield Attributing Characters of cv. Deepali of Dolichos Bean
Cha
ract
ers
Dos
es o
f G
amm
a R
ays
Ger
min
atio
n (%
)
Vin
e Le
ngth
(c
m)
Bra
nche
s/
Pla
nt
Day
s R
equi
red
for
Firs
t Fl
ower
ing
Day
s R
equi
red
for
50
%
Flow
erin
g D
ays
Req
uire
d fo
r Fi
rst
Pod
Set
Gre
en P
ods
Per
Pla
nt
Gre
en P
od
Wei
ght
(g)
Gre
en P
od
Yie
ld P
er
Pla
nt (
g)
See
ds P
er
Pod
See
d Y
ield
P
er P
lant
(g
)
Mor
tali
ty
(%)
T1 – 25 kR 87.33 614.03* 5.50 144.70** 152.00 147.70* 109.35** 14.27** 1560.80**
5.00 141.30* 24.14
T2 – 35 kR 90.00 605.00**
5.80 144.80* 153.65 149.75** 106.40** 13.97 1493.90**
4.80* 135.25**
14.44
T3 – 45 kR 89.33 599.40**
6.55* 147.70** 155.70 151.35** 102.90** 12.99** 1410.10**
4.67** 129.80**
15.73
T4 – 55 kR 88.33 474.75**
6.80* 152.35** 158.30 155.70** 94.05** 12.74** 1291.20**
4.04** 116.45**
18.39
T5 – Control 98.67 626.67 5.73 141.67 146.33 146.00 116.30 14.03 1631.97 5.10 146.83 2.04
Table 2: Effect of Gamma Radiation on Yield and Yield Attributing Characters of cv. Konkan Bhushan of Dolichos Bean
Cha
ract
ers
Dos
es o
f G
amm
a R
ays
Ger
min
atio
n (%
)
Vin
e Le
ngth
(c
m)
Num
ber
of
Bra
nche
s P
er P
lant
Day
s R
equi
red
for
Firs
t Fl
ower
ing
Day
s R
equi
red
for
50
%
Flow
erin
g D
ays
Req
uire
d fo
r Fi
rst
Pod
Set
Num
ber
of
Gre
en P
ods
Per
Pla
nt
Gre
en P
od
Wei
ght
(g)
Gre
en P
od
Yie
ld P
er
Pla
nt (
g)
Num
ber
of
See
ds P
er
Pod
S
eed
Yie
ld
Per
Pla
nt
(g)
Mor
tali
ty
(%)
T1 – 25 kR 94.33 217.85 6.15 140.35** 146.30 145.10** 181.70 4.76 866.15**
4.11 97.55**
6.38
T2 – 35 kR 92.67 200.75* 6.45 139.65** 148.00 143.60** 178.40* 4.57* 839.70**
4.02 92.50**
8.89
T3 – 45 kR 87.33 171.20** 6.90 140.30** 148.10 146.85** 172.35** 4.38** 808.90**
3.79** 82.60**
29.89
T4 – 55 kR 86.67 165.75** 7.45 143.3** 150.35 147.15** 168.85** 3.95** 785.85**
3.55** 79.95**
32.94
T5 – Control 98.00 216.67 6.12 113.00 118.7 116.33 185.23 4.83 891.07 4.18 102.73 3.09
REFERENCE [1] Chakraborthy A K and ParthasarathyV A 2003. Vegetable crops. Naya udhyog, Kolkata. 2: 263-272.
It is I
LLEGAL t
o cop
y, pri
nt or
save
any c
onten
t of th
is PDF,
in pa
rt or in
full,
on an
y retr
ieval
syste
m,
withou
t the E
XPRESS WRITTEN PERMISSIO
N of th
e cop
yrigh
t-hold
er

National Conference on Climate Change and Agricultural Production: Adapting Crops to Climate Variability and Uncertainty, 6th–8th April, 2017
[512]
Efficacy Evaluation of Phytotherapeutic Substances against Root-knot Nematode Meloidogyne incognita cucumerinum Affecting Cucumber in
Polyhouse under Protected Cultivation
Jaydeep Patil*, Anil Kumar and S.R. Goel Department of Nematology, College of Agriculture, CCS HAU, Hisar–125004, India
E-mail: *[email protected]
Keywords: Meloidogyne incognita, Fusarium oxysporum
INTRODUCTION
Root-knot nematodes are cosmopolitan in distribution, occur in soil and are rarely seen. Control of these nematodes is not well developed.Plant species and parts antagonistic to Meloidogyne spp. are leaves and flowers of marigold (Tagetes sp.), leaves, roots and seeds of neem (Azadirachta indica), and leaves and seeds of chinaberry (Melia azadirach) (Rather et al., 2007). The present study was carried out to evaluate the nematicidal efficacy of leaves of these antagonistic plants as soil amendments against root-knot nematode (Meloidogyne incognita) at various dosages.
MATERIALS AND METHODS
A pot experiment under polyhouse conditions was carried out to manage the root knot nematode, Meloidogyne incognita by using different botanicals, viz., neem, aak, castor leaves and neem seed kernel powder @ 20 and 30 g/kg soil along with chemical as well as untreated checks. Soil was autoclaved and infested with root-knot nematode (1000j2/kg soil). Chopped leaves of these phytotherapeutic substances were incorporated to the potted soil treatment wise and a waiting period of ten days was given before sowing of cucumber seeds.
RESULTS AND DISCUSSION
The results revealed that all plant growth parameters of cucumber improved while the nematode reproduction factors were suppressed significantly in case of all phytotherapeutic substances and chemical checks as compare to untreated inoculated check. However, higher dose (30 g/kg) was significantly more effective as compared to the lower dose (20 g/kg soil). Among phytotherapeutic substances, A. indica seed kernel powder were found to be most effective in suppressing galling (44), number of egg masses per root (40) and final population in soil (143) followed by neem, castor and aak leaves as compare to untreated inoculated check (Table 1).
It is I
LLEGAL t
o cop
y, pri
nt or
save
any c
onten
t of th
is PDF,
in pa
rt or in
full,
on an
y retr
ieval
syste
m,
withou
t the E
XPRESS WRITTEN PERMISSIO
N of th
e cop
yrigh
t-hold
er

National Conference on Climate Change and Agricultural Production: Adapting Crops to Climate Variability and Uncertainty, 6th–8th April, 2017
[513]
Table 1: Effect of Different Phototherapeutics on Nematode Infestation in Cucumber Treatments Shoot
Length (cm) Dry Shoot Weight (g)
Dry Root Weight (g)
Number of Galls Per Root
Number of Egg Masses Per Root
Final Nematode Population
T1: Neem leaves@ 20 g/pot 135.4 15.5 3.8 56 (7.3)
54 (7.5)
162 (12.7)
T2: Neem leaves@ 30 g/pot 143.3 20.0 5.5 48 (6.5)
43 (6.9)
149 (12.2)
T3: Aak leaves @ 20 g/pot 133.6 14.6 3.4 58 (7.5)
56 (7.6)
164 (12.8)
T4: Aak leaves @ 30 g/pot 141.8 19.3 5.2 50 (6.8)
45 (7.1)
156 (12.5)
T5: Castor leaves @ 20 g/pot 129.0 13.5 3.3 60 (7.6)
57 (7.7)
167 (12.9)
T6: Castor leaves @ 30 g/pot 139.8 18.3 4.8 53 (6.9)
48 (7.3)
158 (12.5)
T7: Soil treatment with NSKP @ 20g/pot
140.6 17.3 4.5 55 (7.2)
52 (7.4)
160 (12.6)
T8: Soil treatment with NSKP @ 30g/pot
154.0 23.0 6.0 44 (7.3)
40 (6.6)
143 (12.0)
T9: Carbofuran @ 0.1 g/ pot 186.7 25.5 8.8 36 (6.2)
38 (6.0)
123 (11.0)
T10: Drenching with Bavistin @ 2 g/l water
126.3 10.3 3.6 82 (7.4)
55 (9.0)
223 (14.9)
T11: untreated check (inoculated)
83.7 5.6 1.7 453 (16.2)
263 (21.3)
828 (28.7)
T12: untreated check (uninoculated)
110.2 13.9 2.9 0 (1.0)
0 (1.0)
0 (1.0)
CD (p=0.05) 2.5 1.5 0.6 0.1 0.1 0.1
REFERENCE [1] Rather M A, Ahmad F and Siddiqui M A 2007. Bio-efficacy of some botanical extracts for the management of root-knot nematode
Meloidogyne incognita in Lycopersicum esculentum. National Journal of Life Science 4: 101-104.
Efficacy Evaluation of Neem (Azadirachta indica) against Root-Knot Nematodes (Meloidogyne incognita) in Tomato
Saroj Yadav*, Jaydeep Patil and Anil Kumar Department of Nematology, College of Agriculture, CCS HAU, Hisar–125004, India
E-mail: *[email protected]
Keywords: Meloidogyne Incognita, Azadiracta Indica
INTRODUCTION
Several plants, belonging to different botanical families, contain principles possessing nematicidal or nematostatic properties (Gommers, 1981). Investigations on extracts from various indigenous plants and neem (Azadirachta indica) products have revealed that some of them are effective against insects and nematodes (Sharma, 2000. Therefore, investigations were undertaken to evaluate the efficacy of the plant leaves on root gall index and final nematode density of the root-knot nematode in tomato.
MATERIALS AND METHODS
The study was conducted in screen house conditions to see efficacy of the antagonistic plants for the control of nematodes is a very attractive alternative. In the present study, nematicidal efficacy Azadirachta indica was ascertained for the control of M. incognita. Leaf amendment of neem at different dosages @ 5, 10, 20 and
It is I
LLEGAL t
o cop
y, pri
nt or
save
any c
onten
t of th
is PDF,
in pa
rt or in
full,
on an
y retr
ieval
syste
m,
withou
t the E
XPRESS WRITTEN PERMISSIO
N of th
e cop
yrigh
t-hold
er

National Conference on Climate Change and Agricultural Production: Adapting Crops to Climate Variability and Uncertainty, 6th–8th April, 2017
[514]
40 g/ kg soil and untreated check also maintained. Chopped leaves of neem were incorporated to the potted soil treatment wise and a waiting period of 7 days was given before transplanting of tomato seedling.
RESULTS AND DISCUSSION
The results revealed that all doses of neem leaves significantly improved the plant growth parameters and reduced root-knot infections compared with the untreated control. A. indica @ 30 g/ kg soil significantly increase plant growth parameter viz., shoot length (30cm), Dry shoot weight (119.5 g), dry root weight (8.2 g) maximum in reductions in number of galls (38), egg masses per egg (270) and final population in soil (170) (Table 1)
Table 1: Effect of Neem (Azadirachta indica) on Root-knot Nematode Infestation in Tomato Treatments Shoot
Length Dry Shoot
Weight Dry Root Weight
Number of Galls Per Root
Number of Eggs Per Egg Masses
Final Nematode Population
Neem leaves @ 5 gm/ kg soil 25.5 13.5 5.8 47 (6.9)
277 (16.5)
184 (13.5)
Neem leaves @ 10 gm/ kg soil 26.5 15.5 7.5 43 (6.5)
274 (16.5)
177 (13.3)
Neem leaves @ 20 gm/ kg soil 28.5 17.3 7.5 41 (6.4)
273 (16.5)
172 (13.1)
Neem leaves @ 30 gm/ kg soil 34.5 19.5 8.2 38 (6.2)
270 (16.4)
170 (13.0)
Carbofuran @ 0.1 gm/ a.i. kg soil 39.5 25.8 9.7 35 (5.9)
268 (16.3)
118 (10.9)
Untreated inoculated check 10.5 5.6 2.2 84 (9.2)
285 (16.8)
723 (26.9)
Untreated uninoculated check 13.5 6.0 2.8 0 (1.0)
0 (1.0)
0
CD (p=0.05) 1.9 2.0 1.2 0.2 0.05 0.1
REFERENCES [1] Gommers F J 1981. Biochemical interactions between nematodes and plants and their relevance to control. Helminthological Abstracts,
Series B, Plant Nematology 50: 9-24. [2] Sharma G.C. 2000. Efficacy of neem based formulations against the root knot nematode Meloidogyne incognita. Pesticide Research
Journal 12: 183-187.
Prevalence and Evaluation of Fungitoxicants against Noxious Marsoninajuglandis Causing Anthracnose Disease of Walnut
(Juglansregia L.) in Kashmir
Mudasir Hassan, Khurshid Ahmad, N.A. Khan*, Mudasir Bhat and Imran Bashir Department of Plant Pathology,
Sher-e-Kashmir University of Agricultural Sciences and Technology of Kashmir–190025, India E-mail: *[email protected]
Keywords: Anthracnose, Walnut, Fungitoxicants, Mycelial growth, Spore germination
INTRODUCTION
Jammu and Kashmir State has attained special place in the international trade of walnuts contributing about 98% of total production in India (Sharma, 2012). Although the agro-climatic conditions of Kashmir are congenial for cultivation of walnut, yet its productivity has been relatively low owing to anthracnose (Marssonina juglandis) disease. The disease causes premature defoliation, slows down plant growth and
It is I
LLEGAL t
o cop
y, pri
nt or
save
any c
onten
t of th
is PDF,
in pa
rt or in
full,
on an
y retr
ieval
syste
m,
withou
t the E
XPRESS WRITTEN PERMISSIO
N of th
e cop
yrigh
t-hold
er

National Conference on Climate Change and Agricultural Production: Adapting Crops to Climate Variability and Uncertainty, 6th–8th April, 2017
[515]
reduces quantity and quality of nuts, resulting in huge economic loss in walnut industry. Chemical method is most effective way of controlling M. juglandis. The present study was therefore undertaken to evaluate the efficacy of different fungitoxicants against the disease.
MATERIALS AND METHODS
Survey of main walnut growing areas in the districts of Kupwara, Anantnag and Budgam of Kashmir was carried out during the second fortnight of August, 2013to record incidence and intensity. In all 54 plants were observed at nine locations. Randomly 100 leaves and 100 current twigs from each plant at each site were collected to record the observations. The following six systemic viz, Carbendazim 50WP, Thiophanate methyl 70WP, Flusilazole 40EC, Difenoconazole 25EC, Tebuconazole 25EC, Metiram + Pyraclostrobin 60WG @ 0.005%, 0.001%, 0.015%, 0.02% and non-systemic fungitoxicantsviz, Copper oxy chloride 50WP, Mancozeb 75WP, Propineb 70WP, Chlorothalonil 75WP, Captan 50WP, Ziram 80WP @ 0.025%, 0.05%, 0.1%, 0.15% were evaluated on active ingredient basis for their efficacy against the pathogen.
RESULTS AND DISCUSSION
Perusal of data reveals that during the course of survey, significantly highest incidence of 97.94 and 74.66% and intensity of 55.76 and 22.77 per cent was recorded on leaves and twigs, respectively in district Anantnag. It was followed by district Budgam with corresponding incidence of (97.83 and 72.27%) and intensity (50.11 and 20.58%), respectively. Significantly least disease incidence (96.22 and 68.41%) as well as intensity (49.03 and 15.32%) on leaves and twigs respectively, was observed in district Kupwara. Highest disease at some locations of districts could be attributed to higher plant density leading to higher relative humidity in the microclimate of the plants, higher temperature during the growing season, besides non disposal of fallen diseased leaves. These observations are supported by the findings of Pschedit and Ocamb (2014). Data revealed that all the six systemic fungitoxicants at all the test concentrations inhibited spore germination. Among the systemic fungitoxicants tested, metiram + pyraclostrobin 60WG proved to be most effective as it provided 98.84% spore germination inhibition over check followed by tebuconazole 25EC and flusilazole 40EC, exhibiting 93.16 and 89.50% spore germination inhibition, respectively. Difenconazole 25EC proved to be least effective with only 67.16% germination inhibition. The evaluated fungitoxicants revealed that all the test fungitoxicants inhibited spore germination and mycelial growth of M. juglandis at various concentrations. Various workers have also reported the efficacy of metiram + pyraclostrobin, tebuconazole, flusilazole, carbendazim, mancozeb, captan, copper oxychloride for management of walnut anthracnose caused by M. juglandis (Zamaniet al., 2011). The systemic fungicides proved better in inhibiting the spore germination and mycelial growth than non-systemic ones, hence systemic fungicides are recommended for controlling the disease in the field.
Table 1: Incidence and Intensity of Anthracnose Disease of Walnut at Various Locations in the Kashmir Valley District Location Per cent Disease Incidence Per cent Disease Intensity
Leaves Twigs Leaves Twigs Anantnag Larnoo 97.52 71.60 55.54 16.92
Saller 98.75 85.00 56.87 35.00 Uttersoo 98.00 66.00 54.89 16.39 Mean 97.94a 74.66a 55.76a 22.77a
Kupwara Dragmulla 97.66 69.50 50.55 15.33 Langate 96.50 70.50 52.02 15.82 Sogam 94.50 65.23 44.51 14.81 Mean 96.22c 68.41c 49.03c 15.32c
Budgam Sarai 97.50 66.66 47.80 17.97 Magam 97.50 66.16 48.48 15.93 Chadoora 98.50 84.30 55.05 29.90 Mean 97.83ab 72.27b 50.11b 20.58b
Overall Mean 97.34 71.78 51.66 19.56 CV 1.42 1.43 3.10 3.95
It is I
LLEGAL t
o cop
y, pri
nt or
save
any c
onten
t of th
is PDF,
in pa
rt or in
full,
on an
y retr
ieval
syste
m,
withou
t the E
XPRESS WRITTEN PERMISSIO
N of th
e cop
yrigh
t-hold
er

National Conference on Climate Change and Agricultural Production: Adapting Crops to Climate Variability and Uncertainty, 6th–8th April, 2017
[516]
REFERENCES [1] Sharma R 2012.Area and production database of fruit crops. Directorate of Horticulture, State Department of Horticulture, Jammu and
Kashmir Government, India. pp. 1-2. [2] Zamani A R, Imami A, Mirza M A, and Mohammadi R 2011.A study and comparison of control methods of anthracnose disease in walnut
trees of Roodbar region. International Journal of Nuts and Related Sciences2: 75-81.
Genetic Studies on Divergence in Recombinant Inbred Lines of Rice (Oryza Sativa L.)
Akanksha Singh1*, D.K. Dwivedi1, Anurag Verma1, Gaurav Kumar1, Sarita Devi Gupta2, Manjri3, Kunvar Gyanendra1, Chhavi1, Vikas Dubey1, Avinash Singh1,
Divya Prakash Singh1 and K.N. Singh1
1Department of Plant Molecular Biology and Genetic Engineering, 2Department of Crop Physiology, 3Department of Biochemistry, 4Department of Genetics and Plant Breeding
1,2,3,4N.D. University of Agriculture & Technology, Kumarganj, Faizabad–224229, India E-mail: *[email protected]
Keywords: Genetic Divergence, Cluster, Rice
INTRODUCTION
Rice is a cereal foodstuff which forms an important part of the diet of more than three billion people around the world. The present study was initiated with the objective to observe variability and select rice genotypes on the basis of quantitative traits and performance. The divergence or genetic distances was studied by a biometrical technique called D2 statistics developed by Mahalanobis (1936). This is the most effective method of quantifying the degree of genetic divergence among the genotypes taken for the study. In the investigation 23 introgression lines along with two checks CSR-27 and MI-48 were evaluated under salt and control conditions.
MATERIALS AND METHODS
The material for this study consisted of 25 RILs developed by crossing of CSR-27 × MI-48 produced from the Department of Genetics and plant breeding, N.D.U.A. & T. Kumarganj, Faizabad. The seeds of rice varieties were sown on 1 June, 2010 in nursery bed. The data were recorded on following characters: days to 50% flowering, Plant height Panicle bearing tillers per plants, Spikelet per plant, Grains per panicle, Spikelet fertility, Test weight, Biological yield, Harvest index, Grain yield per plant, Na+/K+/ratio in both condition but Na+/K+/ratio not occur in controlled condition. The genetic distance between the individual accessions were worked out using D2 statistics.
RESULTS AND DISCUSSION
D2 statistics was performed after ascertaining the presence of significant amount of variability among the accessions. As the critical D2 values increases, number clusters decreases and vice versa. Upon increasing the critical D2 value, number of cluster also decreases. Based on the relative magnitude of D2 values, 25 genotypes were grouped into 6 non-overlapping clusters under salt condition and under control condition. Maximum number of genotypes were included in cluster I (Nine) under salt condition and cluster IV (Thirteen) under control condition. Cluster IV had eight genotypes while cluster IV, V, III, VI had four, two, one and one respectively under salt condition. Clusters III had five genotype while cluster II, I, V and VI had
It is I
LLEGAL t
o cop
y, pri
nt or
save
any c
onten
t of th
is PDF,
in pa
rt or in
full,
on an
y retr
ieval
syste
m,
withou
t the E
XPRESS WRITTEN PERMISSIO
N of th
e cop
yrigh
t-hold
er

National Conference on Climate Change and Agricultural Production: Adapting Crops to Climate Variability and Uncertainty, 6th–8th April, 2017
[517]
three, two, one and one respectively under control condition. Further, the overall composition of the clustering pattern showed that genotypes collected from the same geographical origin were distributed in different clusters. In the present study, fifty three rice genotypes consisting of high yielding rice varieties/ cultures and IRRI germplasm lines were raised at Rice Research Station, Tirur during Sornavari, 2009 to identify diverse genotypes. They were evaluated for eight yield and yield attributing characters using D2 analysis, to study the diversity pattern among the genotypes (Banumathi et al., 2010).
Table: Clustering Pattern of 25 Rice Genotype on the Basis on D2 Analysis for 11 Character under Salt Conditions
Cluster No. No. of Genotypes Genotype I 9 2,12,20,4,5,11,15,17,25 II 4 21,22,8,18 III 1 3 IV 8 6,14,9,19,13,23,7,1 V 2 10,24 VI 1 16
REFERENCES [1] Banumathi S, Thiyagarajan K. and Vaidyanathan P 2010. Study on magnitude of heterosis of rice hybrids for yield and its components.
Crop Research 25(2):287-293. [2] Mahalanobis 1936. D2 and metroglyph analysis in mid duration genotypes of rice. AgriculturalScience Journal56 (3) : 151-156.
Evaluation of Rice (Oryza sativa) Genotypes for Drought Tolerance
Vikas Dubey*, D.K. Dwivedi, Gaurav Kumar, Akanksha Singh, Chhavi, Avinash Singh, Rajesh Maurya and Divya Prakash Singh
Department of Plant Molecular Biology and Genetic Engineering, N.D. University of Agriculture & Technology, Kumarganj, Faizabad
E-mail: *[email protected]
Keywords: Rice, Heritibility, Correlation Coefficient, Drought Tolerance, Path Coefficient
INTRODUCTION
Rice is the principle food crop for more than half of the world‘s population and also important food crop drastically affected by drought in lowland rice ecosystem. Drought has been the single largest factor limiting the rice yield in rainfed areas. Developing rice cultivars with drought tolerance is the most effective way to solve this problem. Because of genetic complexity and physiology of drought tolerance in rice it is probably the most difficult trait to improve through conventional breeding. To study genetic variability in the present investigation thirty rice genotype were evaluated under drought and control condition.
MATERIALS AND METHODS
The experiment was carried out in the field of Student Instructional Farm of N.D.University of Agriculture and Technology, Kumarganj, Faizabad during Kharif season of 2015–2016. The material for this study consisted of thirty rice genotypes. Observations were recorded on randomly selected five plants from each entry line in each replication at maturity. The data were recorded on seedling vigour, days to 50% flowering, plant height, leaf rolling, relative water content, panicle bearing tillers per plant, number of spikelets per panicle, number of grains per panicle, spikelet fertility (%), test weight/ plant (g), biological yield/ plant (g), harvest index (%), grain yield/ plant (g).
It is I
LLEGAL t
o cop
y, pri
nt or
save
any c
onten
t of th
is PDF,
in pa
rt or in
full,
on an
y retr
ieval
syste
m,
withou
t the E
XPRESS WRITTEN PERMISSIO
N of th
e cop
yrigh
t-hold
er

National Conference on Climate Change and Agricultural Production: Adapting Crops to Climate Variability and Uncertainty, 6th–8th April, 2017
[518]
RESULTS AND DISCUSSION
Analysis of variance for the design of experiment indicated that only two characters were significant and other characters were highly significant differences among treatments under drought condition. All characters exhibited highly significant differences among treatments under control conditions. In general, the phenotypic coefficient of variability was higher than genotypic coefficient of variability for all the characters, which indicated that environment influenced considerably in expression of these traits. The high PCV and GCV under drought conditions were observed for panicle bearing tiller/ plant, spikelet/ panicle and test weight. Under control conditions the maximum PCV and GCV were observed for panicle bearing tiller/ plant, grains/ panicle and spikelet/ panicle. The high magnitude of heritability coupled with high genetic advance in per cent of mean indicated that these characters are likely to provide good response to selection. Genotypic correlation of Grain yield was positively and highly significantly correlated with harvest index, biological yield and seedling height under both conditions. Biological exerted very high positive indirect effect on grain yield at phenotypic and genotypic level under control conditions via plant height. Genetic, molecular, proteomic study are the best tool for screening of germplasm or breeding material for stress environment.
REFERENCES [1] Bostein D, White R L, Skolnick and Davis M R W 1980. Construction of gene linkage map in man using restriction fragment length
polymorphism. American Journal of Human Genetics 32(5):314-331. [2] Lafitte H R, Price A H and Courtois B 2004. Yield response to water deficit in an upland rice maping population: associations among
traits and genetic markers. Theoritical and Applied Genetics 109: 1237-1246.
Genetic Variation Delineation among Fodder Pearl Millet [Pennisetum glaucum (L.)] Accessions and Napier Grass
Germplasm using SSR Markers
Santosh Kumar*, C. Babu, S. Revathi and P. Sumathi Centre of Plant Breeding and Genetics, TNAU, Coimbatore–641003, India
E-mail: *[email protected]
Keywords: PIC, Jaccard’s Dissimilarity Matrix, Dendrogram, Pearl Millet, Napier Grass
INTRODUCTION
Pearl millet Napier hybrid, an inter-specific hybrid between pearl millet (Pennisetum glaucum) and Napier grass (P. purpureum) is a perennial grass and has high yield, nutritive value, digestibility, palatability and survivability for longer periods. Several workers have reported the potential for improvement in yield and quality of pearl millet Napier hybrids over Napier grass. The parental materials of both fodder pearl millet and Napier are being improved worldwide, making it possible to develop better hybrids in terms of quality and yield. Therefore, the present research work was attempted to study the diversity in the pearl millet and Napier grass using SSR marker so as to evolve high biomass yielding pearl millet Napier hybrids.
MATERIALS AND METHODS
The experimental material under this study, conducted during kharif, 2015-16 at CPBG, TNAU, Coimbatore, included 54 pearl millet accessions and 56 Napier grass germplasm in which molecular diversity was studied using 32 SSR primers. DNA was isolated from the 15 days young leaves using CTAB method and amplified in thermocycler using following conditions: a denaturation step of 3 min at 94°C followed by 32 cycles each
It is I
LLEGAL t
o cop
y, pri
nt or
save
any c
onten
t of th
is PDF,
in pa
rt or in
full,
on an
y retr
ieval
syste
m,
withou
t the E
XPRESS WRITTEN PERMISSIO
N of th
e cop
yrigh
t-hold
er
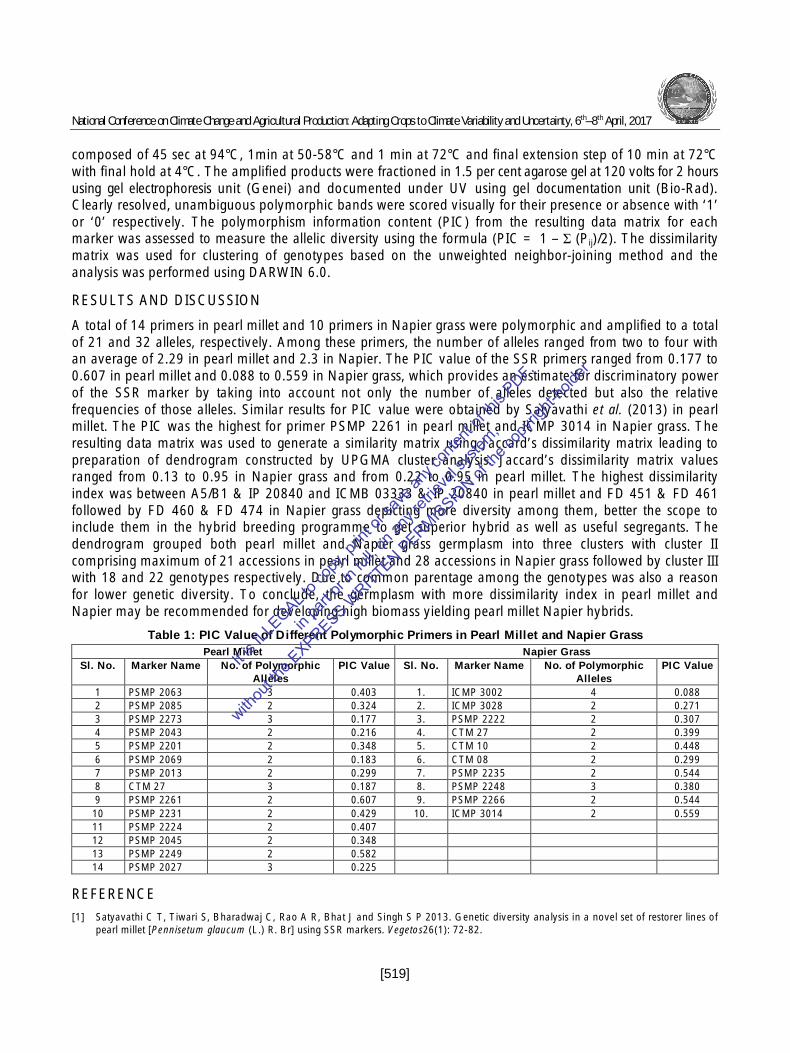
National Conference on Climate Change and Agricultural Production: Adapting Crops to Climate Variability and Uncertainty, 6th–8th April, 2017
[519]
composed of 45 sec at 94°C, 1min at 50-58°C and 1 min at 72°C and final extension step of 10 min at 72°C with final hold at 4°C. The amplified products were fractioned in 1.5 per cent agarose gel at 120 volts for 2 hours using gel electrophoresis unit (Genei) and documented under UV using gel documentation unit (Bio-Rad). Clearly resolved, unambiguous polymorphic bands were scored visually for their presence or absence with ‘1’ or ‘0’ respectively. The polymorphism information content (PIC) from the resulting data matrix for each marker was assessed to measure the allelic diversity using the formula (PIC = 1 – Σ (Pij)/2). The dissimilarity matrix was used for clustering of genotypes based on the unweighted neighbor-joining method and the analysis was performed using DARWIN 6.0.
RESULTS AND DISCUSSION
A total of 14 primers in pearl millet and 10 primers in Napier grass were polymorphic and amplified to a total of 21 and 32 alleles, respectively. Among these primers, the number of alleles ranged from two to four with an average of 2.29 in pearl millet and 2.3 in Napier. The PIC value of the SSR primers ranged from 0.177 to 0.607 in pearl millet and 0.088 to 0.559 in Napier grass, which provides an estimate for discriminatory power of the SSR marker by taking into account not only the number of alleles detected but also the relative frequencies of those alleles. Similar results for PIC value were obtained by Satyavathi et al. (2013) in pearl millet. The PIC was the highest for primer PSMP 2261 in pearl millet and ICMP 3014 in Napier grass. The resulting data matrix was used to generate a similarity matrix using Jaccard’s dissimilarity matrix leading to preparation of dendrogram constructed by UPGMA cluster analysis. Jaccard’s dissimilarity matrix values ranged from 0.13 to 0.95 in Napier grass and from 0.22 to 0.95 in pearl millet. The highest dissimilarity index was between A5/B1 & IP 20840 and ICMB 03333 & IP 20840 in pearl millet and FD 451 & FD 461 followed by FD 460 & FD 474 in Napier grass depicting more diversity among them, better the scope to include them in the hybrid breeding programme to get superior hybrid as well as useful segregants. The dendrogram grouped both pearl millet and Napier grass germplasm into three clusters with cluster II comprising maximum of 21 accessions in pearl millet and 28 accessions in Napier grass followed by cluster III with 18 and 22 genotypes respectively. Due to common parentage among the genotypes was also a reason for lower genetic diversity. To conclude, the germplasm with more dissimilarity index in pearl millet and Napier may be recommended for developing high biomass yielding pearl millet Napier hybrids.
Table 1: PIC Value of Different Polymorphic Primers in Pearl Millet and Napier Grass Pearl Millet Napier Grass
Sl. No. Marker Name No. of Polymorphic Alleles
PIC Value Sl. No. Marker Name No. of Polymorphic Alleles
PIC Value
1 PSMP 2063 3 0.403 1. ICMP 3002 4 0.088 2 PSMP 2085 2 0.324 2. ICMP 3028 2 0.271 3 PSMP 2273 3 0.177 3. PSMP 2222 2 0.307 4 PSMP 2043 2 0.216 4. CTM 27 2 0.399 5 PSMP 2201 2 0.348 5. CTM 10 2 0.448 6 PSMP 2069 2 0.183 6. CTM 08 2 0.299 7 PSMP 2013 2 0.299 7. PSMP 2235 2 0.544 8 CTM 27 3 0.187 8. PSMP 2248 3 0.380 9 PSMP 2261 2 0.607 9. PSMP 2266 2 0.544 10 PSMP 2231 2 0.429 10. ICMP 3014 2 0.559 11 PSMP 2224 2 0.407 12 PSMP 2045 2 0.348 13 PSMP 2249 2 0.582 14 PSMP 2027 3 0.225
REFERENCE [1] Satyavathi C T, Tiwari S, Bharadwaj C, Rao A R, Bhat J and Singh S P 2013. Genetic diversity analysis in a novel set of restorer lines of
pearl millet [Pennisetum glaucum (L.) R. Br] using SSR markers. Vegetos26(1): 72-82.
It is I
LLEGAL t
o cop
y, pri
nt or
save
any c
onten
t of th
is PDF,
in pa
rt or in
full,
on an
y retr
ieval
syste
m,
withou
t the E
XPRESS WRITTEN PERMISSIO
N of th
e cop
yrigh
t-hold
er

National Conference on Climate Change and Agricultural Production: Adapting Crops to Climate Variability and Uncertainty, 6th–8th April, 2017
[520]
Evaluation of Fungi Toxicants against Diplodiaseriata Causing Smoky Canker of Pear in Jammu and Kashmir, India
Arif Hussain Bhat1*, Nisar Ahmad Khan1, Mudasir Bhat1 and Hilal Ahmad2 1Division of Plant Pathology, SKUAS-K, Shalimar, Srinagar–190025, India
2Central Institute of Temperate Horticulture, Srinagar–190007, India E-mail: *[email protected]
Keywords: Diplodiaseriata, Fungi Toxicants, Smoky Canker, Mycelial Growth Inhibition
INTRODUCTION
Like other plant diseases, cankers have also been effectively managed by logically integrating various management strategies. Emphasis has been given on the need for avoidance of mechanical injuries, protecting plants from high and low temperature injuries and judicious pruning and training practices to reduce the incidence of cankers. However, management by using fungi toxicants has been so far the most effective strategy and various chemical fungicides have proved to be quite effective in restricting the canker formation. In the present study some of the systemic and non systemic fungicides have been evaluated against Diplodiaseriata the most prevalent canker causing pathogen.
MATERIALS AND METHODS
The study was carried out in the year 2012 at the Division of Plant Pathology, SKUAST-K, Shalimar. Ten fungi toxicants each at five different concentrations were screened for their comparative effectiveness in inhibiting the radial mycelial growth of Diplodiaseriata following the poisoned food technique. Stock solutions of double strength of the fungi toxicants were prepared and were then added aseptically to sterilized double strength potato dextrose agar medium so as to have the required concentrations. Each petriplate containing solidified medium was inoculated with 5 mm mycelial disc taken from the periphery of an actively growing 7 days old culture of the fungus. The inoculated petri plates were incubated at 25 ± 1ºC and average colony diameter was recorded.
RESULTS AND DISCUSSION
An insight into the data revealed that all the fungi toxicants significantly inhibited mycelial growth of Diplodiaseriata at all the concentrations tested. Carbendazim and copper oxy-chloride proved significantly superior to all other fungi toxicants exhibiting 99.41 and 98.45 per cent mycelial growth inhibition while as chlorothalonil proved least effective chemical with mycelial growth inhibition of only 45.27 per cent. The data further revealed a significant interaction between the fungi toxicant and the concentrations. The non-systemic fungi toxicants showed complete inhibition of mycelial growth at 1500 ppm concentration except propineb and chlorothalonil which exhibited 91.83 and 88.26 per cent inhibition respectively. Among the systemic fungi toxicants, complete inhibition was observed at 250 ppm concentration in respect of carbendazim, hexaconazole and flusilazole except dodine and bitertanol which exhibited 90.70 and 88.93 per cent inhibition. However, the carbendazim and copper oxy-chloride were most effective fungicides in inhibiting the vegetative growth of the fungus, exhibiting 100 per cent inhibition at 100 and 1000 ppm concentration, respectively followed by hexaconazole, flusilazole, captan and mancozeb. Similar results were recorded by Pitt et al (2012).
It is I
LLEGAL t
o cop
y, pri
nt or
save
any c
onten
t of th
is PDF,
in pa
rt or in
full,
on an
y retr
ieval
syste
m,
withou
t the E
XPRESS WRITTEN PERMISSIO
N of th
e cop
yrigh
t-hold
er

National Conference on Climate Change and Agricultural Production: Adapting Crops to Climate Variability and Uncertainty, 6th–8th April, 2017
[521]
Table 1: In vitro Efficacy of Non-systemic Fungi Toxicants in Inhibiting the Radial Mycelial Growth of Diplodiaseriata
Fungitoxicant Percent Growth Inhibition at Different Concentrations (ppm)* Mean 100 250 500 1000 1500
Mancozeb 75WP 75.29 (8.73) 79.12 (8.92) 84.43 (9.24) 92.06 (9.64) 100.00 (10.04) 86.18 (9.31)c Captan 50WP 79.44 (8.96) 83.65 (9.20) 89.63 (9.52) 96.47 (9.87) 100.00 (10.04) 89.83 (9.52)b Copper oxy-chloride 50WP 95.46 (9.82) 98.39 (9.97) 98.44 (9.97) 100.00 (10.04) 100.00 (10.04) 98.45 (9.97)a Propineb 70WP 20.49 (4.63) 55.82 (7.53) 78.30 (8.90) 82.08 (9.11) 91.83 (9.61) 65.70 (7.84)d Chlorothalonil 75WP 15.92 (4.11) 23.15 (4.91) 38.31 (6.27) 60.75 (7.92) 88.26 (9.44) 45.27 (6.89)e Mean 57.32 (7.25)E 68.02 (8.12)D 77.82 (8.78)C 86.27 (9.33)B 96.01 (9.82)A CD(p = 0.05)
Fungitoxicant = 0.055 Concentration = 0.055 F × C = 0.124
* Mean of four replications; Figures in parenthesis are square root transformed value
REFERENCE [1] Pitt W M, Sosnowski M R, Huang R and Christopher Y Q 2012.Evaluation of fungicides for the management of Botryosphaeriacanker of
Grapevines.Plant Disease96: 1303-1308.
Heterosis Studies in Vegetable Cowpea [Vigna unguiculata (L.) Walp.] for Yield and Quality Attributes
Risha Varan1, Y.V. Singh1, Vikas Kumar Jain2* and Prashant Bisen2 1College of Agriculture, G.B.P.U.A. & T., Pantnagar–263145
2Institute of Agricultural Sciences, Banaras Hindu University, Varanasi–221005, India E-mail: *[email protected]
Keywords: Heterosis, Heterobeltiosis, Economic Heterosis, Seed Yield, Micronutrients, Cow Pea
INTRODUCTION
Cowpea [Vigna unguiculata (L.) Walp.] is one of the important legume crops around the globe. Both grain and leaves are edible products of cowpea that are rich and cheap source of high quality protein. The average productivity of cowpea is low as compared to other vegetable crops, due to the lack of availability of genotypes and susceptibility of the genotypes to major biotic stresses such as cowpea mosaic virus. Commercial exploitation of heterosis in self-pollinated crops like cowpea is directly not possible due to technical difficulties encountered in hybrid seed production. Therefore, an early identification of superior crosses is quite necessary to handle the material in advanced generations effectively and gainfully (Meena et al., 2009).
MATERIALS AND METHODS
Twenty-four single-cross hybrids developed (in kharif 2014) using Line × Tester mating design, involving diverse genotypes of cow pea, viz., three popular varieties Pant Lobia 1, Pant Lobia 3, PGCP-14 and eight genotypes viz., PGCP-13, PGCP-28, PGCP-29, PGCP-52, PGCP-61, PGCP-62, PGCP-6 and Pusa Sukomal along with Pant Lobia 1 as a standard check, were evaluated in randomized block design with two replications for fourteen quantitative and two qualitative traits during rabi-2014, to identify the heterotic superiority of the new cross combinations over the best check. Analysis of micronutrients were done by AAS.
It is I
LLEGAL t
o cop
y, pri
nt or
save
any c
onten
t of th
is PDF,
in pa
rt or in
full,
on an
y retr
ieval
syste
m,
withou
t the E
XPRESS WRITTEN PERMISSIO
N of th
e cop
yrigh
t-hold
er

National Conference on Climate Change and Agricultural Production: Adapting Crops to Climate Variability and Uncertainty, 6th–8th April, 2017
[522]
RESULTS AND DISCUSSION
Out of 24 crosses, 11 crosses over mid parent, 6 crosses over better parent and 18 crosses over standard check, were significant for seed yield per plant. Hybrid Pant Lobia 3x Pusa Sukomal showed highest per se performance for seed yield per plant, dry pod weight per plant and also showed good mean value for number of pods per plant, zinc content (27 mg/kg of seed), iron content (47.35 mg/kg of seed), with maximum positive significant economic heterosis (68.46%) for seed yield per plant, also having lowest incidence of cowpea mosaic virus. Hybrid Pant Lobia-1 × PGCP13 showed highest per se (36.85) performance along with maximum positive significant economic heterosis for zinc content. Hence these hybrids appear to be very promising combination for actual exploitation.
REFERENCE [1] Meena R, Pithi MS, Sayalya JJ and Pansuriya AG 2009. Heterosis in vegetable cow pea [Vigna unguiculata (L.) Walp.]. Crop
Improvement 36(1): 1-5.
Field Performance of Some Nutritional Practices on the Incidence of Major Insect and Disease Pests in Rice-Mustard Cropping System
Debashis Roy1*, Sukamal Sarkar2, Somnath Sardar2 and Kajal Sengupta2
1Department of Agricultural Entomology, 2Department of Agronomy 1,2Bidhan Chandra Krishi Viswavidyalaya, Mohanpur, Nadia–741252, India
E-mail: *[email protected]
Keywords: Rice, Mustard, Cropping System, Insect Pests, Diseases, Nutritional Manipulation, Humic Acid
INTRODUCTION
Rice-mustard cropping system is one of the most popular practices in the farming community during kharif followed by rabi season under Gangetic alluvial plain of West Bengal. Due to climate change, monsoon has been coming in late season for last few years resulting late transplantation of rice which automatically delayed the sowing of mustard on the same field. This particular reason is very much responsible to coincide the susceptible crop growth stages with the incidence of different chewing and mainly sucking pests and fungal diseases, leads to economic yield loss (Lastuvka, 2009). Keeping these in backdrop, the present study was undertaken to evaluate different treatment schedules in the form of nutritional manipulation with special reference to micro-nutrients and humic acid against major insect and disease pests of rice followed by mustard vis.-a-vis. their yield potentiality in rice-mustard cropping system.
MATERIALS AND METHODS
Experiment was carried out at B.C.K.V., Mohanpur, Nadia in CRD with ten treatments viz. T1: RDF (N80P40K40) + Humic acid @15 l ha-1 (30 ml/plot) with compost (10 t ha-1); T2: RDF = N80P40K40 [Control-1]; T3: 1/2RDF ((N40P20K20) + Humic acid @7.5 l ha-1 (15 ml/plot) with compost (10 t ha-1); T4: 3/4 RDF (N60P30K30) + Humic acid @7.5 l ha-1 (15 ml/plot) with compost (10 t ha-1); T5: RDF (N80P40K40) + Humic acid @7.5 l ha-1 (15 ml/plot) with compost (10 t ha-1); T6: RDF (N80P40K40) + ZnSO4 20 kg ha-1 + Borax 10 kg ha-1; T7: RDF (N80P40K40) + ZnSO4 20 kg ha-1 + Borax 10 kg ha-1 + Humic acid @7.5 l ha-1 (15 ml/plot) with compost (10 t ha-1); T8: RDF (N80P40K40) + Humic acid Foliar Spray @ 1 ml litre-1; T9: RDF (N80P40K40) + Humic acid @7.5 l ha-1 (15 ml/plot) with compost (10 t ha-1) + Humic acid Foliar Spray one time @ 1 ml litre-1; T10: RDF (N80P40K40) + Compost [Control-2] which were replicated thrice during kharif, 2014 to rabi,
It is I
LLEGAL t
o cop
y, pri
nt or
save
any c
onten
t of th
is PDF,
in pa
rt or in
full,
on an
y retr
ieval
syste
m,
withou
t the E
XPRESS WRITTEN PERMISSIO
N of th
e cop
yrigh
t-hold
er

National Conference on Climate Change and Agricultural Production: Adapting Crops to Climate Variability and Uncertainty, 6th–8th April, 2017
[523]
2016.Rice (cv. Shatabdi) followed by mustard (cv. B-9) were cultivated by following recommended agronomic practices. Insect pests and diseases incidences were recorded at weekly interval after the crop establishment in the main field, whereas yield during the harvest for both the rice and mustard.
RESULTS AND DISCUSSION
Table 1 revealed that lowest yellow stem borer infestation of rice in the form of mean percent dead heart and white head were in T7 (6.55 and 9.91%) followed by T9 (8.18 and 11.36%) respectively. Similarly, T7 also registered lowest number of brown plant hopper population (13.21 per 3 hills) followed by T3 and T8. Mean percent leaf blast and neck blast were lowest in T7 (4.63 and 7.31%) followed by T9 (5.05 and 7.88%), proved statistically at par with T5 and T6. Yield potentiality of rice grain was highest in T7 followed by T9, T6 and T1 with 4.84, 4.69, 4.55 and 4.36 t/ ha respectively. Similar trend of effectiveness were also encountered in case of mustard where, mean number of aphid population was 19.15 and 21.58 in case of T7 and T9 respectively as compared to untreated control plots (38.18 in T10 and 55.12 in T2). Alternaria blight infection was also found very low in case of T7 (10.37% and 6.12% leaf infection and number of spots per siliqua respectively) whereas, T6 and T9 found statistically at par. T7 was also found to be significantly superior in the seed (1.23 t/ ha) and stover (2.66 t/ ha) yield potentiality of mustard followed by T9 and T5 respectively. Hence it can be concluded that application of zinc and boron in accompanied with humic acid and compost can be an effective nutritional manipulation by fixing the recommended dose of fertilizers to successfully reduce the pest and disease incidence in rice-mustard cropping system under the adverse situation of climate change.
Table 1: Effects of Different Nutrient Schedules on Insect Pests and Disease Incidence vis.-a-vis. Yield Parameters in Rice-mustard Cropping System during kharif, 2014–rabi, 2016
Treatments Relative Effects on the Incidence of Major Insect Pests, Disease and Yield Parameters of Rice (Pulled Data)
Relative Effects on the Incidence of Major Insect Pest, Disease and Yield Parameters of Mustard
(Pulled Data) Yellow Stem
Borer Brown Plant
Hopper (Mean
Number/ 3 Hills)
Blast Disease Grain Yield (t/ ha)
Straw Yield (t/ ha)
Mustard Aphid (Mean
Number/ 10 cm Apical Shoot)
Alternaria Blight Seed Yield (t/ ha)
Stover Yield (t/ ha) Mean %
Dead Heart
Mean %
White Head
Mean % Leaf Blast
Mean %
Neck Blast
Mean % Leaf Area Diseased
Mean Number of Spots/ Siliqua
T1 13.19 18.62 15.28 7.28 9.29 4.36 4.99 28.24 16.58 11.55 1.04 2.03 T2 18.75 27.59 32.81 10.03 19.56 3.16 4.32 55.12 29.54 20.28 0.71 1.33 T3 15.25 16.87 13.46 7.11 10.15 4.05 4.52 32.44 22.61 15.87 0.93 1.59 T4 14.44 19.28 16.88 7.65 11.21 4.15 5.38 32.19 23.77 15.76 0.84 1.53 T5 12.96 13.54 16.20 5.38 8.12 4.18 5.28 29.61 15.62 12.25 1.11 2.15 T6 10.67 13.20 14.92 5.46 8.06 4.55 5.41 25.06 13.29 10.11 1.09 2.16 T7 6.55 9.91 13.21 4.63 7.31 4.84 6.54 19.15 10.37 6.12 1.23 2.66 T8 13.22 17.85 13.97 6.74 10.75 4.31 4.95 37.04 19.21 13.10 1.11 1.97 T9 8.18 11.36 14.80 5.05 7.88 4.69 6.28 21.58 14.18 8.96 1.20 2.28 T10 16.19 22.82 23.55 8.23 14.22 3.67 4.40 38.18 21.20 11.89 0.92 1.80 SEm(±) 0.63 0.29 0.11 0.46 0.20 0.33 0.32 0.78 0.49 0.70 0.05 0.10 CD at 5% 1.52 1.10 0.57 1.23 0.80 0.95 0.94 2.05 1.58 1.66 0.13 0.28
REFERENCE [1] Lastuvka Z 2009. Climate change and its possible influence on the occurrence and importance of insect pests. Plant Protection Science
45: 53-62.
It is I
LLEGAL t
o cop
y, pri
nt or
save
any c
onten
t of th
is PDF,
in pa
rt or in
full,
on an
y retr
ieval
syste
m,
withou
t the E
XPRESS WRITTEN PERMISSIO
N of th
e cop
yrigh
t-hold
er

National Conference on Climate Change and Agricultural Production: Adapting Crops to Climate Variability and Uncertainty, 6th–8th April, 2017
[524]
Temperature and Salinity Tolerant Trichoderma Isolates with Antagonistic Activities against Soil Borne Pathogens
M.A. Anwer1*, Kundan Singh1 and Bishun Deo Prasad2 1Department of Plant Pathology, 2Department of Plant Breeding and Genetics
1,2Bihar Agricultural University, Sabour–813210, India E-mail: *[email protected]
Keywords: Trichoderma, Thermotolerance, Saline Tolerance, Bio Agent, Soil Borne Pathogens
INTRODUCTION
Abiotic environmental parameters may have negative influence on the bio-control efficacy of Trichoderma strains, therefore it is very important to generate information about the effects of environmental factors such as high temperature, pH and high salinity on the different activities of Trichoderma strains with respect to bio-control. Some of the mechanism used by Trichoderma to alter the drought response includes drought tolerance through physiological and biochemical adaptations, and enhanced drought recovery. The root colonization by Trichoderma increases the growth of roots and of the entire plant, thereby increasing plant productivity and the yields of reproductive organs. Recently, antagonists of phytopathogenic fungi have been used to control plant diseases, and 90 percent of such applications have been carried out with different strains of the fungus Trichoderma. Keeping the importance of Trichodermain mind this study has been formulated with the objective; isolation of Trichodermafrom different fields of agroecological zone IIIA of Bihar and screening of isolated indigenous Trichoderma isolates for abiotic stresses like heat and salt tolerance, pH tolerance and in vitro antagonistic potential against soil borne pathogens and to evaluate the most efficient isolate against Sclerotium rolfsii with lentil in pot trial.
MATERIALS AND METHODS
The dual culture technique described by Dennis and Webster (1971) was used to test the antagonistic ability of Trichoderma isolates against soil borne pathogen viz., Sclerotium rolfsii, Fusarium oxysporum f.sp. lentils and Rhizoctonia solani. The pathogen and Trichoderma was grown on PDA for four days at (25±1⁰C), (30±1⁰C) and (35±1oC) in BOD incubator separately. Small block of the target fungi cut from the periphery was transferred to the Petri dish previously poured with PDA. At the same time pathogen and Trichoderma isolate were transferred aseptically in the same plate of opposite end and incubated at different temperature 25±1⁰C, 30±1⁰C and 35±1⁰C for five days and radial growth was observed. The medium inoculated with Trichoderma and pathogen alone and incubated at 28±1⁰C was served as control. The experiment was replicated thrice and percent growth inhibition was calculated by the formula.
I = (C-T)/C * 100
Where C is mycelial growth in control plate, T is mycelial growth in treated plate, and I is percent inhibition of mycelial growth.
RESULTS AND DISCUSSION
In all in vitro tests, isolate Tvb1 was found to be the most efficient tolerating high temperature of 45°C for four days, 2000 mM salt concentration, pH up to 11 and 89.2 percent antagonist for Sclerotium rolfsii, 90.2 percent against Rhizoctonia solani and 92.3 perecnt against Fusarium oxysporum f.sp. lentis at 30°C temperature. At increased temperature of 35°C, isolate Tvb1 also efficiently suppressed the S. rolfsii by 40.43
It is I
LLEGAL t
o cop
y, pri
nt or
save
any c
onten
t of th
is PDF,
in pa
rt or in
full,
on an
y retr
ieval
syste
m,
withou
t the E
XPRESS WRITTEN PERMISSIO
N of th
e cop
yrigh
t-hold
er

National Conference on Climate Change and Agricultural Production: Adapting Crops to Climate Variability and Uncertainty, 6th–8th April, 2017
[525]
percent, R. solani by 40.82 percent and F. oxysporum f.sp. lentis by 42.12 percent followed by Thg1. The most efficient Trichoderma isolate Tvb1and Thg1 were molecularly characterizes as Trichoderma asperellum. The most efficient two antagonists, T. asperellum Tvb1 and Thg1 were evaluated in pot culture against S. rolfsii with lentil. Application of Tvb1 in pathogen inoculated plant significantly (P≤0.05) increased the number of pods par plant by 37.97 percent (from 19.33 to 26.67 pods/ plant), number of seed par plant by 54.13 percent (from 32.66 to 50.34 seeds/ plant) and weight of seeds par plant by 55.56 percent (from 0.90g to 1.40g) in comparison to pathogen inoculated plants, followed by Thg1 and TC (Trichodermaviride, isolated from commercial formulation). Tvb1 also delayed the incidence of wilting in lentil plants by twelve days compare to inoculated plants with pathogen (S. rolfsii). Tvb1 also efficiently (P≤0.05) enhanced the growth (shoot, root and dry wt.) and yield (number of pods/ plants by 40 percent) of lentil plants in comparison to un-inoculated untreated plants. Thus, the study identified a potential thermotolerant and saline tolerant strain of Trichoderma, Tvb1 that could be used as potential biocontrol agent in stressed soils.
REFERENCE [1] Dennis C and Webster J 1972. Antagonistic properties of species-groups of Trichoderma. Transactions of the British Mycological
Society84:41-48.
Integrated Management of Major Fungal Diseases of Tomato in Kashmir Valley
Mudasir Bhat*, Ali Anwar, Mohmmad Najeeb Mughal, G. Hassan Mir and V.K. Ambardar Division of Plant Pathology, Sher-e-Kashmir University of Agricultural Sciences and
Technology of Kashmir, Shalimar, Srinagar–190025, India E-mail: *[email protected]
Keywords: Tomato, IDM, Trichoderma, Pseudomonas, Mulches, Fungicides
INTRODUCTION
Tomato (Lycopersicum esculentum) is the popular vegetable of Kashmir because of its taste, colour and high nutritive value and also for its diversified use. In Kashmir Valley, the crop is grown over an area of 1500 hectares with an average yield of 400–500 q/ha. Tomato is attacked by variety of pathogens; predominant being the fungal fruit rots (Taskeen-un-Nisa et al., 2011). These fungal rots are responsible for causing serious production problems and become menace for successful cultivation of tomatoes in valley. The present study has been undertaken to develop an eco-friendly management practices against major fungal diseases of tomato.
MATERIALS AND METHODS
A field trial was laid at experimental farm of SKUAST-K. The tomato seedlings cv. SH-1 was transplanted in plotsof 2.0 x 1.5 m2 withspacing of 40 x 30 cm. The treatments comprised of sheep manure @ 3 kg/m2, mulching by mustard straw @ 4 kg/m2; seedling dip in Trichoderma harzianum, Pseudomonas fluorescence each @ 4 g/L water and carbendazim 50 WP @ 1 g/L water) and 2 foliar sprays of mancozeb 75 WP @ 0.2% followed by carbendazim 50 WP @ 0.05% 20 days after the onset of disease. Data on disease severity was recorded using standard procedure.
It is I
LLEGAL t
o cop
y, pri
nt or
save
any c
onten
t of th
is PDF,
in pa
rt or in
full,
on an
y retr
ieval
syste
m,
withou
t the E
XPRESS WRITTEN PERMISSIO
N of th
e cop
yrigh
t-hold
er

National Conference on Climate Change and Agricultural Production: Adapting Crops to Climate Variability and Uncertainty, 6th–8th April, 2017
[526]
RESULTS AND DISCUSSION
Among the various diseases septoria leaf spot disease and buckeye rot were more severe than other diseases. All the treatments significantly reduced severity of both the diseases (Septoria leaf spot and buckeye rot). The removal of basal infected leaves and foliar sprays with mancozeb 75 WP or carbendazim 50 WP proved best in controlling both the diseases and exhibited a minimum disease severity of 6.5 percent in case of Septoria leaf spot and a minimum disease severity of 1.6 percent in case of Alternaria loaf spot. The control plot showed Septoria and Alternaria leaf spot severities of 30.2 and 9.6 percent, respectively. Stacking was next best treatment, while seedlings root dip in carbendazim 50 WP was least effective against both the diseases. Minimum rotted fruits (0.03 kg/plot) was observed in mancozeb 75 WP @ 2 g/L water followed by carbendazim 50 WP @ 0.5 g/L water, whereas, T. harzianum (root dip @ 4 g/L water) resulted highest rotted fruits (0.28 kg/plot). Further, Sprays of mancozeb 75 WP @ 2 g/L water followed by carbendazim 50 WP @ 0.5 g/L water also showed superiority on other treatments in respect of producing highest healthy fruits yield of 2.9 kg/pot with an increase of 61.7 percent fruit yield over check. Minimum rotted fruits (1q/ha) was in spray of mancozeb 75 WP followed by carbendazim 50 WP and removal of basal leaves.
REFERENCE [1] Taskeen-un-Nisa, Wani AH, Bhat M Y, Pala S A and Mir R A 2011. In vitro inhibitory effect of fungicides and botanicals on mycelia
growth and spore germination of Fusarium oxysporum. Journal of Biopesticides 4(1): 53-56.
Influence of Weather Factors on Development of Marssonina Leaf Blotch of Apple caused by Marssonina coronaria
[(Ell. & J.J. Davis) J.J. Davis] in Kashmir Valley, India
S.A. Rather, M.A. Bhat, N.A. Khan, Z.A. Bhat and F.A. Mohiddin Division of Plant Pathology SKUAST-K, Shalimar, Srinaga–190025, India
E-mail: *[email protected]
Keywords: Apple Blotch, Marssonina coronaria, Meteorological Parameters
INTRODUCTION
Apple (Malus × domestica Borkh.) is the most important fruit crop ofthe J&K and cultivated over an area of 157.2 thousand hectares. Marssonina leaf blotch (MLB) is nowadays wide spread foliar disease of Malus spp. and is emerging as the most destructive disease wherever apple is grown and causes premature defoliation (Kumar et al., 2014). The classical disease triangle recognises the role of climate in disease development. So far, meagre research has been conducted in our country to find out the peak disease appearance in correlation with macro-climatic conditions on MLB disease development and this necessitated carrying out the present study under temperate region of the country. The present study will also indicate the role of weather factors on the disease development of Marssonina leaf blotch of apple.
MATERIALS AND METHODS
The studies were conducted in the experimental orchards of SKUAST-K, Srinagar and Krishi Vigyan Kendra-Ganderbal to carry out the influence of weather parameters on disease intensity during the year 2014. Five apple trees cv. Red delicious were randomly selected and tagged in the month of June 2014. Tagged plants were examined regularly for first appearance of disease and observations were recorded weekly. Weather
It is I
LLEGAL t
o cop
y, pri
nt or
save
any c
onten
t of th
is PDF,
in pa
rt or in
full,
on an
y retr
ieval
syste
m,
withou
t the E
XPRESS WRITTEN PERMISSIO
N of th
e cop
yrigh
t-hold
er

National Conference on Climate Change and Agricultural Production: Adapting Crops to Climate Variability and Uncertainty, 6th–8th April, 2017
[527]
data was procured from meteorological observatory of SKUAST-K and Indian Meteorological Department. Disease intensity and infection rate was calculated by adopting method given by Yin et al. (2013).
RESULTS AND DISCUSSION
The maximum infection rate of 0.198 and 0.156 unit/day was observed during 3rd and 4th week of July in district Srinagar and in Ganderbal respectively, under the natural epiphytotic conditions. The percent disease intensity showed the positive correlation with the maximum and minimum relative humidity and rainfall. However, negative correlation was established with the maximum and minimum temperature in both the districts. The positive correlation of weather factors with the disease intensity may be attributed to the high relative humidity and better rainfall and optimum temperature during the period essential for disease initiation and development. The multiple regression analysis showed that the weather factors accounted for 95.9 and 88.2 per cent variation in disease development in district Srinagar and Ganderbal, respectively. The correlation analysis of various metereological factors revealed that the disease intensity is positively correlated with maximum and minimum relative humidity and rainfall and negatively correlated with maximum and minimum temperature in both the districts viz. Srinagar and Ganderbal. The multiple regression analysis showed that weather factors influenced the disease intensity to the extent of 95.9 per cent in district Srinagar and 88.2 per cent in district Ganderbal.
Table 1: Influence of Weather Parameters on Development of Marssonina Blotch of Apple in Srinagar Date of Observation Disease
Intensity (%)
Infection Rate (r)
Average Temperature (oC)*
Average Relative Humidity*
Av. Rainfall (mm)* Month Week Max. Min. Max. Min.
July July July August August August August September September September September October
II III IV I II III IV I II III IV I
0.0 4.0 9.2 11.8 18.2 26.0 42.6 55.6 67.2 79.0 86.2 92.2
0.00 0.198 0.118 0.035 0.062 0.049 0.069 0.039 0.026 0.023 0.013 0.009
28.9 33.0 32.1 31.4 28.0 29.3 25.07 17.6 25.1 28.1 26.6 28.2
16.2 19.5 17.3 16.3 15.5 13.0 12.8 12.7 14.6 11.1 9.9 10.7
78.8 81.7 77.0 77.7 80.1 79.5 85.1 95.7 89.5 82.0 84.0 91.1
59.4 44.8 44.1 51.1 54.0 52.4 64.0 88.4 57.4 51.0 54.4 49.1
1.94 0.20 0.16 0.00 6.50 1.05 5.90 24.6 0.61 0.00 0.94 0.00
Correlation coefficient -0.495 -0.875 0.671 0.183 0.065 *Mean of seven days
Table 2: Influence of Weather Parameters on Development of Marssonina Blotch of Apple in Ganderbal Date of Observation Disease
Intensity (%)
Infection Rate (r)
Average Temperature (oC)*
Average Relative Humidity*
Av. Rainfall (mm)* Month Week Max. Min. Max. Min.
July July August August August August September September September September October October
III IV I II III IV I II III IV I II
0.0 3.0 8.2 12.8 23.4 32.2 40.0 49.2 66.8 77.2 85.0 91.0
0.00 0.156 0.143 0.063 0.086 0.045 0.031 0.029 0.043 0.020 0.013 0.009
31.5 32.3 31.8 31.5 28.1 26.5 21.1 22.8 27.1 27.1 28.3 24.6
19.2 21.3 19.3 18.9 15.8 14.8 14.8 14.9 13.3 12.7 13.3 12.4
72.0 73.0 75.0 75.0 76.0 80.0 90.0 94.0 85.0 81.0 77.0 80.0
46.0 53.0 55.0 46.0 47.0 63.0 82.0 70.0 51.0 46.0 51.0 55.0
1.6 1.3 0.1 0.0 7.3 2.5 19.7 5.8 0.1 0.8 0.0 4.1
Correlation coefficient -0.582 -0.922 0.450 0.065 0.003 *Mean of seven days
It is I
LLEGAL t
o cop
y, pri
nt or
save
any c
onten
t of th
is PDF,
in pa
rt or in
full,
on an
y retr
ieval
syste
m,
withou
t the E
XPRESS WRITTEN PERMISSIO
N of th
e cop
yrigh
t-hold
er

National Conference on Climate Change and Agricultural Production: Adapting Crops to Climate Variability and Uncertainty, 6th–8th April, 2017
[528]
Multiple regression equation indicating the relationship of meteorological factors with disease intensityin Srinagar: Y= 178.94 – 5.38 (X1) – 6.30 (X2) + 2.70 (X3) – 2.20 (X4) -0.66 (X5)
Coffeicient of determination R2= 0.95
Multiple regression equation indicating the relationship of meteorological factors with disease intensity in Ganderbal: Y= 241.37 -0.0557 (X1) – 10.34(X2) – 0.37 (X3) + 0.25 (X4) – 1.42 (X5)
Coffeicient of determination R2= 0.88
Where,
Y= Disease intensity, X1= Average maximum temperature, X2= Average minimum temperature, X3= Average maximum R.H, X4= Average minimum R.H, X5= Average rainfall.
REFERENCES [1] Kumar A and Sharma J N 2014. Host plant cultivar, leafpositions and nutrition affect the expression of Marssonina blotch resistance in
apple. Plant Disease Research29: 1-5. [2] Yin L, Li M, Ke X, Li C, Zou Y, Liang D and Ma F 2013. Evaluation of Malus germplasm resistance to Marssonina apple blotch. European
Journal of Plant Pathology136: 597-602.
Myco-diversity of Freshly Harvested Seed in Maize Growing Zone-III
Shrvan Kumar*, Asha Sinha, Shakshi Singh and Shrishti Lingwal Mycology and Plant Pathology, IAS, Banaras Hindu University, Varanasi–221005, India
E-mail: *[email protected]
Keywords: Aspergillus flavus, Zea mays, Shannon-Weaver Index of Diversity
INTRODUCTION
Maize is known as “Queen of cereals” crops because reflected third most important cereal crops in the world. It is susceptible to a numerous fungal species that cause ear and kernel rots including, Aspergillus, Fusarium verticillioides, F. proliferatum, F. subglutinans, Gibberellazeae, Penicillium, Macrophomina phaseolina, Diplodia, Nigrospora, Botryosphaeria, Cladosporium, Trichoderma, Rhizoctonia and Rhizopus. In subtropical and tropical regions temperature, drought, and insect injury would increase, an increase of Aspergillus and Fusarium species, which are causal agents of maize ear rot and produce dangerous mycotoxin which can be harmful for human health and animals (Peter and Andreas, 2013, Kumar et al., 2016). The present study was aimed at myco-diversity measurement of Seed mycoflora contamination of freshly harvested in maize growing zone-III (Varanasi and Begusarai).
MATERIALS AND METHODS
Myco-flora detected on maize seed by Agar plate method and Blotter plate method. Ten seeds were placed in each Petri plates (90 mm dia.) with two layers of blotting papers moistened at equidistantly (pattern-1-3-6). The Petri plates will be incubated at 25 ± 1°C for five days and the seeds were be examined regularly for the presence of different fungi. There were be two replications each having 50 seeds and incubated seeds will be examined visually and under stereo-zoom microscope for the associated myco-flora. The associated fungi were isolated on PDA for further identification. Same method applied in Agar plate method also. Based on the individuals fungi recorded in the distinct seed samples were analysed for density, frequency, abundance, RD, RF, RA, IVI, D, H and E.
It is I
LLEGAL t
o cop
y, pri
nt or
save
any c
onten
t of th
is PDF,
in pa
rt or in
full,
on an
y retr
ieval
syste
m,
withou
t the E
XPRESS WRITTEN PERMISSIO
N of th
e cop
yrigh
t-hold
er

National Conference on Climate Change and Agricultural Production: Adapting Crops to Climate Variability and Uncertainty, 6th–8th April, 2017
[529]
RESULTS AND DISCUSSION
In Agar plate method, highest density, frequency and abundance of A. niger OS (5.100, 100.000, 0.418), A. flavus PDS (Dn-5.350, F-100.000), A. niger (Ab-0.455) and P. expensum DS (Dn-5.167), R. stolonifer (F-100.000, Ab- 0.404) were recorded. Highest relative density, frequency, abundance by A. flavus OS (38.546, 24.390, 41.803), A. flavus PDS (RD-47.299, RF-25.641), A. niger (RA-45.532) and P. expensum DS (RD-30.452), R. stolonifer (RF-24.390, RA- 32.069) were observed. Highest Important value index (IVI), Simpson index of dominance (D), Shannon-Weaver index of diversity (H) and evenness (E) of A. niger OS (104.740%, 0.1219, 0.367, 0.228), PDS (99.906%, 0.1109, 0.366, 0.228) and R. stolonifer DS (83.866%, 0.0784, 0.356, 0.221) were contributed. In Blotter plate mathod, highest density, frequency and abundance were recorded A. flavus OS (6.650, 100.000, 0.489), PDS (6.950, 100.000, 0.523), DS (6.700, 100.000, 0.496). Per cent maximum relative density, frequency and abundance values A. flavus OS (39.583, 20.408, 48.897), PDS (41.431, 22.222, 52.256) and DS (44.395, 22.727, 49.630) were intended. Maximum IVI, Simpson index of dominance, Shannon-Weaver index of diversity and evenness contributed A. flavus OS (108.889%, 0.1317, 0.368, 0.229), PDS (115.909%, 0.1493, 0.367, 0.228) and DS (116.752%, 0.1515, 0.367, 0.228), respectively. On the basis of present study Aspergilusflavus A. niger and R. stolonifer were recorded dominant mycoflora
REFERENCES [1] Kumar Shrvan, Bhutia D D, Sinha A L, Dikho Chajiio and Kundu S 2016. FPB 34-Biosensor: A vigilant device for Myco-toxins in Food
processing industry. In: Recent Advances in Food Processing and Biotechnology, 5-6 April, BHU, Varanasi p.159 [2] Peter J and Andreas V T 2013 Climatic changes and the potential future importance of maize diseases: a short review. Journal of Plant
Diseases and Protection120(2): 49–56.
Characterization of Chilli Leaf Curl Virus
Asif Ahmed1, Abhishek Sharma2, Syed Berjes Zehra3* and S.S. Kang4 1Department of Plant Pathology, Sher-e-Kashmir University of Agricultural Sciences and
Technology of Kashmir, Shalimar–190025, India 2Department of Vegetable Sciences, Punjab Agricultural University, Ludhana, Punjab–141001 3Department of Vegetable Ssciences, Sher-e-Kashmir University of Agricultural Sciences and
Technology of Kashmir, Shalimar–190025, India 4Department of Plant Pathology, Punjab Agricultural University, Ludhana, Punjab–141001
E-mail: *[email protected]
Keywords: Begomoviruses, Chilli Leaf Curl Virus, Characterization, Phylogenetic Analysis
INTRODUCTION
Chilli is known to be affected by forty-five viruses. Twenty-four of them occur naturally and rest can infect on artificial inoculation. Among the twenty-four viruses reported to occur naturally on chilli, eleven viruses have been reported from India. Among all, the chilli leaf curl virus is the most destructive virus in terms of incidence and yield loss. In severe cases 100 percent, losses of marketable fruit have been reported. Chilli leaf curl disease is caused by a complex consisting of the monopartite chilli leaf curl virus and a DNA-β satellite component (Chattopadhyay et al. 2008).
It is I
LLEGAL t
o cop
y, pri
nt or
save
any c
onten
t of th
is PDF,
in pa
rt or in
full,
on an
y retr
ieval
syste
m,
withou
t the E
XPRESS WRITTEN PERMISSIO
N of th
e cop
yrigh
t-hold
er

National Conference on Climate Change and Agricultural Production: Adapting Crops to Climate Variability and Uncertainty, 6th–8th April, 2017
[530]
MATERIALS AND METHODS
Twelve symptomatic chilli samples showing variable leaf curl symptoms resembling to those caused by begomovirus were collected from chilli fields of Vegetable Research Farm, Department of Vegetable Sciences, PAU, Ludhiana. Type of symptoms exhibited by these samples were recorded. To prove the association of begomovirus with these samples, PCR based detection method used. Total Nucleic acid from the young symptomatic leaves of chilli was isolated using the cetyl trimethyl ammonium bromide (CTAB) method (Lodhi et al., 1994). Virus presence was confirmed using AV494/AC1048 primers for begomovirus detection.
RESULTS AND DISCUSSION
The symptom variability of all the samples was recorded. All the 12 symptomatic samples showed association of begomoviruses confirmed with PCR using universal degenerate AV494/AC1048 primersas an expected size amplicon of ~575 bp observed in all the samples. The samples which were not amplified by universal degenerated primers as well as species specific primers were subjected to RCA (Rolling circle amplification) followed by PCR using begomovirus specific AV494/AC1048 primers for partial characterization. In samples where the plants were exhibiting cupping of leaves, thickening of veins and slight puckering kind of symptoms, mixed infection of two virus species i.e ToLCPV and ToLCNDV were present. In six samples viz., C2, C8 and C11 ToLCKV and in sample viz., C7, C10 and C12, ToLCPV along with beta satellite molecules were associated. Similarly, in sample C6 a bipartite ToLCNDV with beta satellite was detected. In sample, C5 ToLCPV alone was detected. In both chilli samples, the expected size amplicon (~575 bp) from core CP region was observed, eluted and cloned in plasmid vector pTZ57R/T vector. The recombinant plasmids were checked for the presence of insert using M13 F and M13 R primers. An expected size amplicon of ~800 bp was observed in positive clones. Phylogenetic analysis, based on partial genomic DNA sequences, revealed that the two viruses clustered within different clades. Chilli clone1.1 shares a close common ancestor with papaya leaf crumple virus, forming a subclade that is distantly related to other begomoviruses used for analysis. Similarly, chilli clone 4.1 shared a close common ancestor with recently described tomato leaf curl Joydebpur virus and forms a separate subclade. Further attempts were made to clone the full-length genome of both the samples C1 and C4.The results were further confirmed with AV494/AC1048 primers showing amplification of 575bp fragment from same clone. Symptom variability is quite versatile in case of chilli leaf curl virus. Even though different strains of virus cause some characteristic symptoms but in case of mixed infection, the symptom variability is so large that it is difficult to delineate the symptoms. Association of beta virus along with these bipartite viruses needs to be fully illustrated. Phylogenetic analysis, based on partial genomic DNA sequences, revealed that the tomato leaf curl Joydebpur virus was most dominating strain in Punjab. Association of papaya leaf crumple virus with chilli is a new finding and further research is needed in this direction.
REFERENCES [1] Chattopadhyay B, Singh A K, Yadav T, Fauquet C M, Sarin, N B and Chakraborty S 2008.Infectivity of the cloned components of a
begomovirus: DNA beta complex causing chilli leaf curl disease in India. Archives of Virology 153 :533-539. [2] Lodhi M A, Ye G N, Weeden N F and Reisch B A 1994. Simple and efficient method for DNA extraction from grapevine cultivars and
Vitis species. Plant Molecular Biology Reports12: 6-13.
It is I
LLEGAL t
o cop
y, pri
nt or
save
any c
onten
t of th
is PDF,
in pa
rt or in
full,
on an
y retr
ieval
syste
m,
withou
t the E
XPRESS WRITTEN PERMISSIO
N of th
e cop
yrigh
t-hold
er

National Conference on Climate Change and Agricultural Production: Adapting Crops to Climate Variability and Uncertainty, 6th–8th April, 2017
[531]
Evaluation of Pollinator’s Diversity and Activity on Guava
S.N. Ray1, Tamoghna Saha1*, Chandan Kumar1, Shyam Babu Sha1 and A.P. Bhagat2 1Department of Entomology, 2Department of Plant Pathology
1,2Bihar Agricultural University, Sabour–813210, Bhagalpur, India E-mail: *[email protected]
Keywords: Abundance, Diversity, Pollinators, Guava
INTRODUCTION
The role of pollinators in cross pollination of important agro-horticultural crops is well documented (Singh et al., 2010). Among insect pollinators, the members of the super-family Apoidea (Hymenoptera) are the most significant pollinators. Out of 95 per cent cross pollinated flowers, 85 per cent depend on insect pollination (Singh et al., 2010), bees are responsible for almost 80 per cent of pollination and their role in enhancing crop yields is well recognized. In a report from Hawaii, the diversified agricultural system has greatly been benefited from honeybee pollination of guava, registering ten folds increase in production. Considering the above background information in view, the present investigation was carried out to record the diversity and activity of pollinators on guava.
MATERIALS AND METHODS
The experiment was conducted during March to October 2015 at Bihar Agricultural University, Sabour, Bhagalpur, Bihar. The abundance of various insect visitors on guava crops was observed during peak blooming period. For data recording of visiting pollinators, four panicles from three guava trees each were randomly selected from all direction and observation were taken at 0700, 1000 and 1500 hr for a period of five minutes. After 5 minutes total time duration spent by the pollinators has been calculated and data recorded for the given period.
RESULTS AND DISCUSSION
A total of four species of Apis were observed pollinating the guava flower namely Little bee (Apis florea) Rock bee (A. dorsata), Italian bee, A. mellifera, Indian bee, A. cerena indica. In addition, coccinellid and hover fly (Syrphus spp) were also observed in the flowers of guava. A. mellifera was the most abundant (5.56 ± 1.42 insect visitors/4 panicle/ plant) pollinator of guava flowers based on the number of visit observed (Table 1). This is followed by Apis dorsata (4.69 ± 2.21 insect visitors/4 panicle/plant) and Coccinellids. The maximum (6.49 ± 2.10 insect visitors/4 panicle/plant) pollinator’s activity (Table 1) was during 0700 hr followed by 1000 hr (3.14 ± 1.44 insect visitors/4 panicle/plant).
Table 1: Diversity of Insect Pollinators Visiting Guava, Psidium guajava and their Intensity at Different Hours of the Day
Insect Visitor No. of Different Insect Visitors/ 4 Panicles/ Plant at Different Hours of Day 0700 hr 1000 hr 1500 hr Mean ± S.E
Apis mellifera 8.92 ± 1.85 6.08 ± 1.66 1.69 ± 0.75 5.56 ± 1.42 Apis dorsata 8.08 ± 2.93 3.77 ± 1.92 2.23 ± 1.79 4.69 ± 2.21 Apis cerena indiaca 5.00 ± 2.20 1.77 ± 0.93 1.46 ± 1.13 2.74 ±1.42 Apis florae 3.69 ± 1.32 1.31 ± 0.85 1.15 ± 0.90 2.05 ± 1.11 Coccinellids 7.77 ± 1.30 3.46± 1.39 2.38 ± 0.87 4.53 ± 1.18 Hover fly 5.46 ± 3.02 2.46 ± 1.77 1.77 ± 1.42 3.23 ± 2.07 μ ± S.E* 6.49 ± 2.10 3.14 ± 1.44 1.78 ± 1.14 3.80 ± 1.56
REFERENCE [1] Sungh H, Swaminathan R and Hussain T 2010. Influence of certain plant products on the insect pollinators of coriander. Journal of
Biopesticides 3(1):208-211.
It is I
LLEGAL t
o cop
y, pri
nt or
save
any c
onten
t of th
is PDF,
in pa
rt or in
full,
on an
y retr
ieval
syste
m,
withou
t the E
XPRESS WRITTEN PERMISSIO
N of th
e cop
yrigh
t-hold
er

National Conference on Climate Change and Agricultural Production: Adapting Crops to Climate Variability and Uncertainty, 6th–8th April, 2017
[532]
Grey Weevil (Mylocerus discolour) New Pest of Jute from Bihar, India
M.K. Singh Bihar Agricultural University, Sabour, Jute Research Station, Katihar–854105, India
E-mail: [email protected]
Keywords: Greyweevil, Mylocerusdiscolors, Jute, Corchorus sp
INTRODUCTION
Two species of the jute is in commercial production namely Chorchoruscapsularis ‘sada paat’ and Chorchorusolitorius ‘sona paat’ and the area under the crop are in ratio of 10:90. India having about one million hectare area under jute with annual production of 1.5 million tons fibre (11.57 million Bales) and provides livelihood of more than 12 million small and marginal farm families (Karmakar, 2013). Moreover hundreds of thousands people are engaged in processing industry and trade of raw fibres. Jute is non toxic, bio-degradable, renewable and eco-friendly since its production in field to disposal of waste. So, importance of this crop is high in socio-economic value in South East Asian countries for the conservation of global environment and to alleviate current energy crisis preponderance of natural fibre like jute over the synthetic fibres in various industries is essential. Jute is affected with a lot of organism during its various stages of growth but only few get pest status because of its faster growth habit. Grey we evil (Mylocerusdiscolour Boehemam) (also called as ace weevil) is emerging as new pest. This is one of the minor pest in some of the jute growing area and it was completely absent in this region. But now we are observing it since last few years with its increasing population trend.
MATERIALS AND METHODS
The survey of jute crop pest was done at three locations within the Katihar district (Bihar) in different blocks and one on JRS farm. In each block three locations were selected where crop area was at least 0.40 ha and sown in the last week of April. Three samples were selected in each plot where observations were recorded. The observation was recorded from mid May 2012 and 2013 at ten days interval till harvest of the crop (last week of August). The sample size was 2x2 metre square where only adult grey we evil (Mylocerusdiscolour Boehemam) population were recorded by visual counting The sample location was at least two metre inside from the bund because at most locations the plant nearby bund was partially damaged.
RESULTS AND DISCUSSION
In the year 2012, maximum weevil population was observed on 13th June 2012 while minimum on 12th May 2012. In the year 2013, maximum weevil population on 9th June while minimum on the 10th May. This is similar trend like observed in previous year. On the location specific basis, population was more in Manshahi block and JRS farm where Hasanganj and Korha again recorded lower weevil population as previous year trend. This species is present in West Bengal but not recorded as major pest (Satpathy et al., 2013). The emergence of gray weevil in jute as pest may be attributed to changing climatic situation. The rain fall of the region is decreasing day by day and reduced almost to fifty percent level in the last two decades.
It is I
LLEGAL t
o cop
y, pri
nt or
save
any c
onten
t of th
is PDF,
in pa
rt or in
full,
on an
y retr
ieval
syste
m,
withou
t the E
XPRESS WRITTEN PERMISSIO
N of th
e cop
yrigh
t-hold
er

National Conference on Climate Change and Agricultural Production: Adapting Crops to Climate Variability and Uncertainty, 6th–8th April, 2017
[533]
Table 1: Population of Grey We Evil in Different Locations [Katihar] Observations Korha Hasanganj Manshahi JRS Farm Average
2012 12-May 0.33 0.50 0.44 0.67 0.49 22-May-12 0.47 0.61 0.61 0.83 0.63 3-June-12 0.61 0.78 0.75 0.81 0.74 13-Jun-12 1.11 1.17 1.17 0.94 1.10 23-Jun-12 0.89 0.89 1.06 1.22 1.02 04-July-12 0.67 0.81 1.17 0.89 0.89 Average 0.68 0.79 0.87 0.89
2013 Observations Korha Hasanganj Manshahi JRS Farm Average 10-May 0.44 0.56 0.56 0.56 0.53 20-May-13 0.53 0.67 0.67 0.86 0.68 30-May-13 0.56 0.75 0.81 0.72 0.71 09-Jun-13 1.00 1.22 1.22 1.03 1.12 19-Jun-13 0.83 0.83 1.08 1.14 0.97 29-Jun-13 0.78 0.81 1.22 0.86 0.92 Average 0.69 0.81 0.93 0.86
REFERENCES [1] Karmakar PG 2013. Status and Prospects of Improvements of Jute and Allied fibres. Training Manual of Advances in Improved
Production Technology and Fibre Quality Assessment of Jute and Allied fibres. PP. 1-10. [2] Satpathy S, Selvaraj K, Gawande S P, De R K, Gotyal B S, Sarkar S K and Biswas C 2013. Integrated Pests and Disease Management in
Jute and Allied Fibres. Training Manual of Advances in Improved Production Technology and Fibre Quality Assessment of Jute and Allied fibre Crops. PP. 41-56.
Residue Dynamics and Dissipation Kinetics of Hexythiazox on Apple in Kashmir, India
Abid Showkat1, Sheikh Bilal1, Malik Mukhtar2 and Mudasir Bhat2* 1Division of Entomology, 2Research Centre for Residue, Quality Analysis
1,2Division of Plant Pathology SKUAST-K, Shalimar J&K–190025 E-mail: *[email protected]
Keywords: Residue, Dissipation, Half-life, Apple, Hexythiazox
INTRODUCTION
Apple (Malus domestica) has been cultivated from times immemorial in Kashmir. Inspite of unique climatic conditions of Kashmir being quite conducive, apple productivity per unit area is still low owing to many biotic factors. Keeping in view loss caused by insect pests, a large number of pesticides are being sprayed on apple trees to manage the pests. The increasing public concern about possible health risk due to pesticide residues in the diet has necessitated that pesticide residues associated with different food commodities be monitored regularly. Therefore study of dissipation pattern of Hexythiazox on apple was undertaken in Kashmir.
MATERIALS AND METHODS
Authenticity of the procedure was tested by the recovery of pesticides. Hexythiazox was determined by fortifying 15 g of apple samples individually with 0.10, 0.20 and 0.30 ppm of hexythiazox. After a period of 4 hours, the samples were extracted, cleaned up and assayed for each pesticide by the procedure already described. To determine the dissipation behaviour of Hexythiazox in Red Delicious apples, a 17-year old
It is I
LLEGAL t
o cop
y, pri
nt or
save
any c
onten
t of th
is PDF,
in pa
rt or in
full,
on an
y retr
ieval
syste
m,
withou
t the E
XPRESS WRITTEN PERMISSIO
N of th
e cop
yrigh
t-hold
er

National Conference on Climate Change and Agricultural Production: Adapting Crops to Climate Variability and Uncertainty, 6th–8th April, 2017
[534]
commercial orchard at Lousdenew (Shiopian) was selected. Hexythiazox (5.45 EC) at 0.002 per cent (recommended concentration of SKUAST-K), 0.004 per cent (double the recommended) on active ingredient basis, on Red Delicious apple trees were sprayed separately. Samples were collected at the intervals of 0, 1, 3, 7, 10, 15 and 30 days after spray. Zero day samples were collected within 1 hour of spraying after the spray solution had properly dried up. Hexythiazox residues were extracted and cleaned up by the technique developed by Anastassiades (2002).
RESULTS AND DISCUSSION
The Hexthiazox (5.45 EC) @ 0.002 per cent left an initial deposit of 0.67 ppm on the apple fruits at zero day after application (Table 1). The residue decreased slowly and reduced to 0.54, 0.32, 0.19, 0.047 and 0.0018 ppm in 1, 3, 7, 10 and 15 days after treatment, respectively. The residues dissipated gradually recording 19.40, 52.23, 71.64, 92.98 and 99.73 per cent after 1, 3, 7, 10 and 15 days, respectively. The residues could not be detected at 30th day after the pesticide application which indicates that either the pesticide fell below the detection limit or had dissipated to 100% in 30 days (i.e. at harvest time of the apple). The residues dissipated with a T1/2 value of 1.88days. On the basis of MRL of 0.2 ppm for hexythiazox on apple, a Ttol value of 4.37 days was worked out. All the apple samples were contaminated with pesticide residues which is a matter of great concern for human as well as the environmental health even if their values ranked below the prescribed MRL values prescribed by Codex Alimentarious Commission (Agnihotri, 1999).
Table 1: Dissipation (Mean±SD) of Hexythiazox in Apple Fruit cv. Red Delicious at Recommended Concentration of 0.002%
Days after Treatment Average Residues (mg/kg) Dissipation Per cent Dissipation 0 0.670±0.019 - - 1 0.540±0.015 0.130 19.402 3 0.320±0.011 0.350 52.238 7 0.190±0.007 0.480 71.641
10 0.047±0.005 0.623 92.985 15 0.0018±0.002 0.668 99.731
30 (At harvest) BDL 100 Mean 0.294
T1/2 1.88 days Ttol= 4.37 days p-value = 0.001 Correlation coefficient ‘r’ = -0.96 MRL = 0.2 mg/kg BDL = Below Detection Level
REFERENCES [1] Agnihotri N P 1999. Pesticide Safety Evaluation and Monitoring. All India Coordinated Research Project on Pesticide Residues IARI, New
Delhi pp 1-173. [2] Anastassiades M, Loheay S J, Stajnbaher D, and Schenck F J 2002. Quick, Easy, Cheap, Effective, Rugged and Safe approach.
Determination of pesticide residues. Journal of Applicable Chemistry International 86(2):31-412.
It is I
LLEGAL t
o cop
y, pri
nt or
save
any c
onten
t of th
is PDF,
in pa
rt or in
full,
on an
y retr
ieval
syste
m,
withou
t the E
XPRESS WRITTEN PERMISSIO
N of th
e cop
yrigh
t-hold
er

National Conference on Climate Change and Agricultural Production: Adapting Crops to Climate Variability and Uncertainty, 6th–8th April, 2017
[535]
Crossability Studies of Inter-specific Hybridization among Vigna species
A. Nishant Bhanu*, M.N. Singh, K. Srivastava and Y. Gokidi Department of Genetics and Plant Breeding, Institute of Agricultural Sciences,
Banaras Hindu University, Varanasi–221005, India E-mail: *[email protected]
Keywords: Interspecific Hybridization, Crossability, Vignaradiata, Vigna mungo, Vigna umbellata
INTRODUCTION
Among biotic factors, Mungbean yellow mosaic virus (MYMV) transmitted through whitefly Bemesiatabaci is a major constraint to the cultivation of grain legumes in India, particularly green gramand black gram. The weather parameters play a vital role in survival and multiplication of white fly and influence MYMV outbreak during monsoon season. Management of this disease is only possible by the way of reducing the whitefly population using insecticides which are ineffective under severe infestations making complete destruction due to virus. Therefore, development and use of virus resistant cultivars turns out to be the most effective and economical strategy against MYMV (Karthikeyan et al., 2012). Basic reason for limited success had been due to the limited variability prevailed among the green gram and black gram genotypes used for hybridization in most of the studies. Interspecific hybridization plays a significant role in alien gene introgression and thereby improving the crop concerned. Successful hybridization primarily depends on the intercrossing potential/ crossability of the parents involved as well as development of the hybrid embryos including fertility of the F1 hybrids and their derivatives. Keeping this in view, the present piece of investigation was carried out to study the crossability relationship among three Vignaspecies viz. V. radiate (green gram), V. mungo (black gram) and V. umbellate (ricebean).
MATERIALS AND METHODS
For the present experiment, a total of six diverse genotypes/varieties of each of green gramviz.Pusa 0672, ML 1464, SML 1455, HUM 12, KM 2241, TM 96-2; ricebean namely RBL 1, RBL 6, RBL 9, RBL 33, RBL 140, RBL 141 and black gramviz. Mash 338, Mash 114, CO5, Palampur 93, Shekhar 2 and T 9 were selected. The experimental material was planted in crossing block in cemented pots at two different dates of sowing August 10 and 20, 2014 at Agricultural Research Farm, Banaras Hindu University Varanasi during Kharif season, Hybridization technique using hand emasculation and pollination was followed as per Boiling et al. (1961). A total of 80 interspecific crosses i.e. 36 each of V. radiata x V. umbellate and V. mungo x V. umbellataand08 crosses of V. radiata x V. mungo were accomplished. Observations were recorded on the number of buds emasculated, pollinated, pod initiated and harvested. Percent pod setting and ovule fertility was calculated Meteorological observations were taken from the Meteorological Unit, Department of Agronomy, Institute of Agricultural Sciences, Banaras Hindu University, Varanasi.
RESULTS AND DISCUSSION
The per cent crossability among different sets of crosses varies from species to species. In V. radiata x V. umbellata, it was the highest of 16.27 percent in hybrid, HUM 12 x RBL 9 whereas, in V. mungo x V. umbellata, the maximum crossabilty of 11.36% was noticed in cross, Mash 338 x RBL 9. However, in V. radiata x V. mungo, the highest crossability was visualized in hybrid, ML 1464 x Mash 338 (37.5%). The differences in pod setting among different set of crosses might be because of wide variation in their genetic architecture leading to differences in cross compatibility. Out of the six ricebean genotypes used, RBL 1 and RBL 9 showed substantially high percent of crossability with different cultivars of green gramand black gram
It is I
LLEGAL t
o cop
y, pri
nt or
save
any c
onten
t of th
is PDF,
in pa
rt or in
full,
on an
y retr
ieval
syste
m,
withou
t the E
XPRESS WRITTEN PERMISSIO
N of th
e cop
yrigh
t-hold
er

National Conference on Climate Change and Agricultural Production: Adapting Crops to Climate Variability and Uncertainty, 6th–8th April, 2017
[536]
suggesting that these two genotypes may be utilized for genetic improvement of green gramand black gram crops. Novel genes and alleles from exotic germplasm and non-plant species must be exploited and accordingly hybridization should be utilized to create a wide genetic variation for breeding programs in the Vigna species.
REFERENCES [1] Boiling M, Sander D A and Matlock RS 1961. Mungbean hybridization technique. Agronomy Journal 53: 54-55. [2] Karthikeyan A, Sudha M, SenthilN, Pandiyan M, Raveendran M and NagarajanP2012. Screening and identification of RAPD markers
linked to MYMV resistance in mungbean (Vignaradiata (L) Wilczek). Archives of Phytopathology and Plant Protection 45(6): 712-716.
Varietal Evaluation of Radish (Raphanus sativus L.) under Valley Conditions of Kashmir
K. Mallikarjunarao*, Ranjit Kumar Das, Aashish Vivek Vaidya and Ashutosh Kumar Division of Vegetable Science, SKUAST, Kashmir, Srinagar–190025, India
E-mail: *[email protected]
Keywords: Radish, Root Weight, Varieties, Quality
INTRODUCTION
Radish (Raphanus sativus L.) belongs to the family Brassicaceae. It is a popular root vegetable in both tropical and temperate regions. It can be cultivated under cover for early production but large scale production in field is more common in India. Different varieties have different soil and climatic requirements for their optimum performance. The present investigation was taken with the objectives to find out the most suitable radish varieties for various quantitative and qualitative traits of radish under Kashmir valley conditions.
MATERIALS AND METHODS
The present investigations were carried out at, SKUAST-K, Srinagar during Rabi 2011–12. The experiment was laid out in randomized block design with three replications. Each genotype was planted in two rows and spacing between rows and plants were maintained at 30 and 10 cm, respectively. Standard package and practices were used for raising a healthy crop. The observations for morphological quantitative and qualitative characters were recorded on five randomly selected competitive plants from each row in each replication for all traits.
RESULTS AND DISCUSSION
An overall performance of the 24 genotypes revealed that CO-1, Kalyani White, IIVR-1, HK-111 and Chinese Pink genotypes besides being high yielders also exhibited superior performance for other important traits namely CO-1 for leaf number, leaf width, leaf weight, root diameter, root weight, yield per plant and shoot to root ratio, Kalyani White for leaf number, leaf length, leaf weight, root diameter, root weight, yield per plant, total dry matter of roots and vitamin C content, IIVR-1 for leaf length, leaf width, leaf weight, yield per plant and total dry matter of roots, HK-111 for leaf number, leaf length and root length, Chinese Pink for root length, yield per plant and vitamin C content. The genotype Pusa Mridula was found to be high value for quality trait (vitamin C content) along with lesser root weight. Since, no single genotypes could be identified to have superior performance for all the characters taken under study, the genotypes with diverse characteristics could be involved in a well planned hybridisation programme to select superior performing
It is I
LLEGAL t
o cop
y, pri
nt or
save
any c
onten
t of th
is PDF,
in pa
rt or in
full,
on an
y retr
ieval
syste
m,
withou
t the E
XPRESS WRITTEN PERMISSIO
N of th
e cop
yrigh
t-hold
er

National Conference on Climate Change and Agricultural Production: Adapting Crops to Climate Variability and Uncertainty, 6th–8th April, 2017
[537]
genotypes in the segregating generations for the root weight contributing characters. Wide range of variation for different quantitative and qualitative characters in different genotypes of radish have been reported by Kumar and Sharma (2011) and Thorat et al. (2013). The estimates of mean values revealed that no single genotype was superior for all the traits under stidied under investigation. Generally for different characters different genotypes were superior. However genotypes CO-1, Kalayani White, IIVR-1, HK-111, Chinese Pink, White Round, Punjab Safed and IIVR-2 showed better performance with respect to root weight and root weight attributing traits.
REFERENCES [1] Kumar R and Sharma R 2011. Quality assessment of newly introduced genotypes of european radish (Raphanus Sativus L). Journal of
Farm Sciences 1(1): 9-13. [2] Thorat A R, Kadam A S, and Sarvade S A 2013. Performance of some improved and local varieties of radish (Raphanus sativus
L.).International Journal of Research in Agricultural Sciences 1(1-2): 17-21.
Biology and Morphometry of Earias vittella (Fabricius) (Lepidoptera: Noctuidae) on Okra
G. Srasvan Kumar * and S.V.S. Raju Department of Entomology and Agricultural Zoology, Banaras Hindu University, Varanasi–221005, India
E-mail: *[email protected]
Keywords: Earias vittella, Okra, Biology, Morphometry
INTRODUCTION
Eariasvittella (Fabricius) (Lepidoptera: Noctuidae), commonly known as the shoot- and fruit-borer on okra causes enormous losses in India and other countries in Asia (Gupta et al., 2005). Of the several insect pests, the spotted boll worm, Earias vittella (Fab.) is most destructive, causing direct as well as indirect damage to the crop at vegetative and fruiting stages. The avoidable loss in yield and fruit damage due to the pest have been estimated up from 36–90 percent (Misra et al., 2002) hence it is essential to control this pest at right stage for this biology is a pre-requisite.
MATERIALS AND METHODS
To maintain culture in the laboratory different stages of E. vittella larvae collected from okra field and confined them in glass jars then fresh okra fruits provided daily as a food and decay/rotten fruits were removed. After pupation, the pupae were collected and placed separately in rearing glass and after adult emergence from pupae, male and female adults were kept in separate glass jars for mass mating. Eggs laid on tender fruits and muslin cloth were removed carefully then observations recorded on parameters like incubation period, hatching percentage, Total larval, pupal, total developmental period, sex ratio, pre-oviposition, fecundity, post-oviposition, male, female longevity and measurements of different life stages of E. vittella.
RESULTS AND DISCUSSION
The present study was conducted during October- November, 2015 and observations were recorded on the parameters viz., Incubation period, Hatching per centage, first, second, third and fourth instar duration, total larval period, pupal period, total development, sex ratio (M:F), pre-oviposition, oviposition, fecundity, post-
It is I
LLEGAL t
o cop
y, pri
nt or
save
any c
onten
t of th
is PDF,
in pa
rt or in
full,
on an
y retr
ieval
syste
m,
withou
t the E
XPRESS WRITTEN PERMISSIO
N of th
e cop
yrigh
t-hold
er

National Conference on Climate Change and Agricultural Production: Adapting Crops to Climate Variability and Uncertainty, 6th–8th April, 2017
[538]
oviposition, female and male longevity were recorded as 3.60, 78.6 %, 4, 2.26, 2.45, 2.76, 11.46, 9.72, 24.78, 1:1.4, 3.04, 5.91, 196.51 (number of eggs/female), 3.85, 12.80 and 10.33 days respectively. The average length and breadth of different life stages of E. vitella (F.) viz., first, second, third, fourth instar and pupae were recorded as 1.73, 3.07, 6.86, 12.81 and 10.83 respectively and 0.37, 1.17, 1.81, 3.23 and 3.31 respectively. Egg diameter observed as 0.52 ± 0.02 mm. Female and male length recorded as 10.92 and 9.89 mm respectively. Female and male wing span observed as 22.16 mm and 21.30, respectively.
REFERENCES [1] Gupta G P, RaniS, Birah A and Raghuraman M 2005. Mass rearing of the spotted bollworm, Earias vittella (Lepidoptera: Noctuidae) on
an artificial diet.International Journal of Tropical Insect Science 25(2): 134-137. [2] Misra H P, D D Dash and D Mahapatra 2002. Efficacy of some insecticides against okra fruit borer and leaf roller. Annals of Plant
Protection Sciences10: 51-54.
Inter Relationship between Yield and Yield Attributing Traits in Eggplant for Future Breeding Programme
Neetu Nand, Randhir Kumar, Shirin Akhtar and Anupam Adarsh* Department of Horticulture (Vegetable and Floriculture)
Bihar Agricultural University, Sabour–813210, Bhagalpur, India E-mail: *[email protected]
Keywords: Eggplant, Breeding, Yield
INTRODUCTION
Climate change shown that earth temperature will be increased by 0.74°C due to emission of greenhouse gases which exert impacts on global ecosystems (Agrawal, 2008). Eggplant (Solanum melongena) is annual herbaceous vegetable crop in the tropical and subtropical region of the globe (Kumar et al., 2016). The change in temperature and rainfall affects flowering, fruiting, and yield of brinjal. It is important to improve the productivity of the crop per unit area by identification of climate resilient variety or cultivar of the crop. Wide diversity of eggplant, exists in their related species and wild types for morphological, physiological and biochemical properties (Collonier et al., 2001) which can be used in breeding programmes. So, the present investigation was done to assess the inter relationship between different yield and yield attributing traits in eggplant.
MATERIALS AND METHODS
Thirty diverse lines of eggplant are collected from IIVR, NBPGR, IIHR and BAU. All the lines are differing in morphological features as well as yield attributing characters. All the recommended cultural package and practices were followed. Observations were recorded plant height(cm), plant spread (cm), number of primary branches, fruit set percentage, days to first flowering, days to 50% flowering, fruit length (cm), fruit girth (cm), fruit weight (gm), test weight (gm), petiole length (cm), fruit yield per plant (Kg) and quality parameters like leaf blade colour, leaf pubescence, presence of prickles on upper leaf, calyx colour, corolla colour, plant growth habit, fruit pedicel prickles, calyx spininess, fruit shape, fruit colour, seediness and seed colour.
RESULTS AND DISCUSSION
The genotypes included in the study were genetically diverse and showed considerable amount of variability among the varieties for all the characters. Hence there is ample scope for inclusion of promising genotypes in
It is I
LLEGAL t
o cop
y, pri
nt or
save
any c
onten
t of th
is PDF,
in pa
rt or in
full,
on an
y retr
ieval
syste
m,
withou
t the E
XPRESS WRITTEN PERMISSIO
N of th
e cop
yrigh
t-hold
er

National Conference on Climate Change and Agricultural Production: Adapting Crops to Climate Variability and Uncertainty, 6th–8th April, 2017
[539]
breeding programme for yield and its component traits. The high estimates of GCV and PCV was observed for fruit weight, fruit length, fruit girth, fruit yield per plant and number of fruits per plant. Based on direct and indirect effects of different yield components on yield, it appears that weight of fruit had high GCV, PCV, high heritability with genetic advance and high direct contribution towards yield at both genotypic and phenotypic levels (Table 1). Path coefficient analysis at genotypic level revealed that fruit weight, fruit set percentage and number of primary branches expressed direct positive influences on yield but plant spread, petiole length and number of fruits per plant had direct negative effect on yield. These results are in conformity with Nayak and Nagre (2013), Shende et al. (2014).It may be concluded that weight of fruit, fruit length, fruit girth and number of fruits per plant can be put to direct selection pressure to augment yield in eggplant because these characters had high GCV, PCV, heritability, genetic advance as percent of mean and having direct effect on yield.
Table 1: Estimates of Heritability and Genetic Advance Characters h2 GA GA as % of Mean
Plant height (cm) 0.83 18.48 27.57 Plant spread (cm) 0.85 17.30 24.35 No. of primary branches 0.81 1.02 22.60 Fruit set % 0.87 14.39 31.74 Days to 1st flowering 0.84 10.15 23.11 Days to 50 % flowering 0.74 9.18 16.83 Petiole length (cm) 0.86 0.93 31.52 Days to 1st harvest 0.59 11.99 12.08 Fruit length (cm) 0.96 10.87 69.35 Fruit girth (cm) 0.94 6.70 42.76 No. of fruits/ plant 0.85 4.11 35.72 Fruit weight (g) 0.96 90.38 69.55 Test weight (g) 0.85 1.16 23.31 Fruit yield/ plant (Kg) 0.86 0.80 53.68
REFERENCES [1] Agrawal P K 2008.Global climate change and Indian agriculture: Impacts, adaptation and mitigation. Indian Journal of Agricultural
Sciences 78(10): 911-919. [2] Kumar S R, Arumugam T and Ulanganathan V 2016. Genetc Diversity in eggplant germplasm by principal component analysis. SABRAO
Journal of Breeding and Genetics 48 (2):162-17. [3] Collonier C, Fock I, Kashyap V, Rotino G L, Daunay M C, Lian Y, Mariska I K, Rajam M V, Ducreuk G and Sihachkr D 2001. Application
of biotechnology in eggplant. Plant Cell Tissue Organ Culture 65(2): 91-107. [4] Nayak R B and Nagre P K 2013. Genetic variability and correlation studies in brinjal (Solanum melongena). International journal of
Applied Biology and Pharmaceutical technology 4(4): 211-215. [5] Shende R A, Desai S S and Dalvi V V 2014. Character association and path analysis in brinjal (Solanum melongena L.) International
Journal of Agricultural Sciences 10(2):631-633.
It is I
LLEGAL t
o cop
y, pri
nt or
save
any c
onten
t of th
is PDF,
in pa
rt or in
full,
on an
y retr
ieval
syste
m,
withou
t the E
XPRESS WRITTEN PERMISSIO
N of th
e cop
yrigh
t-hold
er

National Conference on Climate Change and Agricultural Production: Adapting Crops to Climate Variability and Uncertainty, 6th–8th April, 2017
[540]
Study of Pollen Fertility in CGMS based Pigeonpea [Cajanus cajan (L.) Millspaugh] Hybrids
Akhouri Nishant Bhanu, Yugandhar Gokidi*, Pankaj Kumar Pandey and Prof. M.N. Singh Department of Genetics and Plant Breeding, Institute of Agricultural Sciences,
Banaras Hindu University, Varanasi–221005, India E-mail: *[email protected]
Keywords: CMS, Restorer, Hybrids, Pollen-fertility, Pigeonpea
INTRODUCTION
Pigeonpea [Cajanus cajan (L.) Millspaugh] (2n=2x=22) is a food legume crop belongs to the family Fabaceae and is invariably cultivated as an annual crop. The availability of diverse male-sterile lines and their fertility restoration have played an important role in exploiting hybrid vigour at commercial scale. The fertility restoration of CMS-based hybrids is an integral part of breeding hybrids. With the above consideration, the present investigation was undertaken to study the pollen fertility/ sterility system of A, B, R lines and its hybrids on the basis of morphological as well as molecular studies.
MATERIALS AND METHODS
The present study consisted of three CMS lines (MA CMS 25 A, GT-33 A and ICPA 2043), three corresponding B lines (CMS 25 B, GT 33 B and ICPB 2043), two restorer lines (ICP 2506 and ICP 9174) and two hybrids (ICPA 2043 x ICP 2506 and ICPA 2043 x ICP 9174). These ten genotypes were used to study the pollen fertility/sterility studies at temperature (330 C) in the February/March 2015, to record observations on morphological and quantitative traits and also to validate the CMS lines and their hybrids using SSR marker.
RESULTS AND DISCUSSION
In the present study, the restorer plants recorded pollen fertility ranging from 96.55 to 100 per cent. Among the three CMS lines, ICPA 2043 showed maximum pollen sterility (100%) followed by GT 33A (98.76%) and MA CMS 25A (69.26%). The F1 hybrids evaluated on the pollen fertility restoration and pod setting rate were considered main criteria, in which, the F1 hybrid (ICPA 2043 A x ICP 2506) recorded 91.75% pollen fertility with more pod setting rate than the other hybrid (ICPA 2043 A x ICP 9174) showing 82.025% pollen fertility with low pod setting rate. These results showed that hybrid with good pollen fertility are needed along with the other yield contributing traits for fully exploitation of heterosis. Similar results reported by Wanjari et al. (2007). Out of three CMS lines only MA CMS 25 A and B had reddish yellow flower with semi-compact plant type whereas other two lines had yellow flower with semi-spreading/spreading plant type that may be used as a marker trait for isolating the MA CMS 25 A and B (Table 1). The hybrid, ICPA 2043 A x ICP 2506 gave the highest yield (15.93 g), followed by ICPB 2043 (13.57 g). The study of SSR markers revealed that the differences were present between different A and B lines but they were failed to distinguish between corresponding A and B line and the hybrids produced. Similarly, the cluster analysis showed diversity among pigeonpea genotypes however, the two iso-genic lines (MA CMS 25 A and B) were placed in the same cluster.
It is I
LLEGAL t
o cop
y, pri
nt or
save
any c
onten
t of th
is PDF,
in pa
rt or in
full,
on an
y retr
ieval
syste
m,
withou
t the E
XPRESS WRITTEN PERMISSIO
N of th
e cop
yrigh
t-hold
er

National Conference on Climate Change and Agricultural Production: Adapting Crops to Climate Variability and Uncertainty, 6th–8th April, 2017
[541]
Table 1: List of Morphological Characters of CMS, Restorers and their Hybrids Lines Plant Type Pod Colour Flower Colour Anther Colour Leaf Colour
MA CMS 25 B Semi compact Striped Green Reddish Yellow Powdery Yellow Dark Green MA CMS 25 A Semi compact Striped Green Reddish Yellow Translucent White Dark Green GT-33 B Semi spreading Striped Green Yellow Yellow Dark Green GT-33 A Semi spreading Striped Green Yellow Translucent White Dark Green ICPB 2043 Semi spreading Green Yellow Powdery Yellow Dark Green ICPA 2043 Semi spreading Green Yellow Translucent White Dark Green ICP 9174 Semi spreading Striped Green Yellow with purple petal
veins Powdery Yellow Green
ICPA 2043 A X ICP 9174
Semi spreading Striped Green Yellow Powdery Yellow Green
ICP 2506 Compact Purple Fully Yellow Powdery Yellow Green ICPA 2043 A X ICP 2506
Semi spreading Purple Yellow Powdery Yellow Green
REFERENCES [1] Wanjari K B, Bhongle S A and Sable N H 2007. Evaluation of heterosis in CMS based hybrids in pigeonpea. Journal of Food Legumes
20: 107-108. [2] Saxena K B, Sultana R, Saxena R K, Kumar R V, Sandhu J S, Rathore A, Kishor P B K and Varshney R K 2011. Genetics of fertility
restoration in A4-based, diverse maturing hybrids of pigeonpea [Cajanus cajan (L.) Millsp.]. Crop Sciences 51: 574-587.
Assessment of Morphological and Molecular Genetic Diversity of Staminate Pointed Gourd (Trichosanthes dioica Roxb.)
Pankaj Kumar1, Anupam Adarsh2, Bishun Deo Prasad1*, R.B. Verma2, Sangita Sahni3, Chandan Kishore1 and Randhir Kumar2 1Department of Molecular Biology and Genetics Engineering
2Dept. of Horticulture (Vegetable & Floriculture), Bihar Agricultural University, Sabour–813210, India 3Department of Plant Pathology, T.C.A, Dholi–834121
Dr. Rajendra Prasad Central Agricultural University, Pusa, Samastipur–848150, India
Keywords: Gourd, Genetic diversity, RAPD
INTRODUCTION
Pointed gourd, a perennial vegetable crop, is cultivated widely in West Bengal, Bihar and Eastern Uttar Pradesh (Komal, 2011). In order to overcome the adverse effect of various abiotic stresses on production and productivity of pointed gourd, its breeding programme has been initiated to develop new varieties. As the pointed guard is mostly propagated by vine, the identification and characterization of staminate pointed gourd has not been done carefully which is prerequisite to initiate any breeding programme (Yang et al., 2005). Therefore, in present investigation an attempt was made to collect and characterize staminate pointed gourd using morphological and RAPD (Random Amplified Polymorphic DNA) markers.
MATERIALS AND METHODS
The experimental material consisted of 7 staminate pointed gourds. These genotypes were collected from different region of Bihar and Uttar Pradesh. Genotypes were characterized morphologically for quantitative traits like node number to 1st flowering, days to 1st staminate flower anthesis, leaf length, leaf width, while qualitative traits like leaf colour, leaf type, leaf margin. Further, genomic DNA was extracted from young immature leaves of staminate pointed gourd using CTAB method. Twenty RAPD markers were used for
It is I
LLEGAL t
o cop
y, pri
nt or
save
any c
onten
t of th
is PDF,
in pa
rt or in
full,
on an
y retr
ieval
syste
m,
withou
t the E
XPRESS WRITTEN PERMISSIO
N of th
e cop
yrigh
t-hold
er

National Conference on Climate Change and Agricultural Production: Adapting Crops to Climate Variability and Uncertainty, 6th–8th April, 2017
[542]
characterization of all the collected staminate pointed gourds. The data were analyzed using simqual- sub-program of software NTSYS-pc version 2.1 (Rohlf 2000).
RESULTS AND DISCUSSION
The analysis of variance revealed significant differences among the accessions for all the characters studied. A wide range of variation was observed for morphological traits like node no. to 1st staminate flower anthesis (9.6–17.3), days to 1st staminate flower anthesis (206.7–219.3), leaf length (7.5–9.0) and leaf width (4.9–7.8). Among these genotypes the earliest flowering was observed in BRPG-513 (206.7) which is a favorable trait for development of hybrids for earliness. All genotypes showed a considerable level of variability for qualitative traits such as leaf colour (green to dark green), leaf type(pointed),leaf margin(entire/slightly serrated, undulated). As morphological traits might be influenced by various environmental conditions, the collected staminate parents were characterized using twenty RAPD markers. The dendrogram showed that staminate parents collected from Bihar are distinct from that of Uttar Pradesh. Also the variations were observed within the genotypes collected from the different regions of Bihar and Uttar Pradesh. However, no difference was observed in two genotypes namely BRPGM2613 and BRPGM113. The diverse staminate pointed gourd identified though present investigation could be used in future breeding programme.
REFERENCES [1] Komal R 2011. Effect of BAP and IAA on callus formation and plant regeneration in pointed gourd.Biotechnology Bioinformatics and
Bioengineering 1(1):59-62. [2] Yang H, Gan S, Yin G and Xu H 2005. Identification of random amplified polymorphic DNA markers linked to sex determination in
Calamus simplicifolius C. F. Wei. Acta Botanica Sinica47: 1249-1253.
Study on the per Se Performance of Parental Lines and their Hybrid for Disease Resistance and Yield in Brinjal (Solanummelongena L.)
Ravi Kumar*, Randhir Kumar, Amit Kumar and Sangeeta Shree Department of Horticulture, Bihar Agricultural University, Sabour–813210, Bhagalpur, India
E-mail: *[email protected]
Keywords: Disease Resistance, Hybrid, Fruit Borer, Solanummelongena, Brinjal
INTRODUCTION
Brinjal is an important warm season solanaceous vegetable and can be grown throughout the year in south India. It occupies an area of 0.71 mha with an annual production and productivity of 13.56 mt and 19.10 t/ha, respectively. In Bihar it cover an area of 0.058 mha with an annual production and productivity of 1.24 mt and 21.60 t/ha respectively (NHB, 2014). Growth and productivity of brinjal crop is largely hampered by the incidence of fruit borer (Lucinodesorbonalis) and bacterial wilt (Pseudomonas solanacearum). Therefore, it is necessary to have the security of crop through inbuilt resistance. Keeping this view, a trial has been conducted to investigate performance of genotypes against fruit borer and bacterial wilt under natural condition.
MATERIAL AND METHODS
The present investigation was carried out at Bihar Agricultural College, Sabour using six parental line and thirty F1 hybrids. The parental lines namely SBRB-6/12, SBRB-1/12, KS-224, SBRB-2/12, Swarna Mani, and SBRB-3/12 were of different morphological features and yield attributing characters obtained from different
It is I
LLEGAL t
o cop
y, pri
nt or
save
any c
onten
t of th
is PDF,
in pa
rt or in
full,
on an
y retr
ieval
syste
m,
withou
t the E
XPRESS WRITTEN PERMISSIO
N of th
e cop
yrigh
t-hold
er

National Conference on Climate Change and Agricultural Production: Adapting Crops to Climate Variability and Uncertainty, 6th–8th April, 2017
[543]
places. These lines were crossed in diallel fashion (including reciprocal) to made thirty hybrids. For hybridization, the floral buds of the female parents (lines) were emasculated a day before their opening between 1500 to 1700 hours and bagged to prevent cross pollination. On the same evening following emasculation or following morning pollen grains were collected from freshly opened flowers of the required male parent, gently applied to the stigma of the emasculated flowers, then crossed flowers were tagged for easy identification and were bagged for two to three days. The experiment with 6 parents and 30 F1hybrids were laid out in a randomized complete block design with 3 replications. Observation twere recorded on days taken to 1st flower, days taken to 50% flowering, average length of fruit (cm), fruit diameter (cm), fruit weight, number of primary branches per plant, plant height (cm), average number of fruits per plant, average yield per plant (g), incidence of bacterial wilt and incidence of fruit borer.
RESULTS AND DISCUSSION
Mean squares due to parents and hybrids were significant for all the characters except number of primary branches and fruit borer incidence. However, for parents vs. hybrid only five characters viz; fruit length, No. of primary branches, plant height and per cent incidence of bacterial wilt were significant and indicating, significant differences among these sources of variations with respect to the traits under study. Days to first flowering ranges from 71.33 to 83.33 days for parents and 72.67 to 86.33 days for F1 hybrids. Parent (SBRB-2/12) showed earliest flower (71.33 days) among the parents which was followed by SBRB-6/12) and KS-224 while, parent Swarna Mani had taken maximum days (83.33 days) for first flower. The best F1 hybrid in respect to early flowering was SBRB-6/12 x Swarna Mani andSBRB-2/12 x SBRB-1/12 (72.67 days). The average fruit weight at picking stage varied from 148.35 to 225.01 g for parents and 121.62 to 256.24 g for F1 hybrids. The mean value over the parental lines and F1 hybrids were 185.23 g and 203.95 g, respectively. The parental line SBRB-1/12 showed highest fruit weight (225.01 g) followed by KS-224 () and Swarna Mani. Minimum incidence of bacterial wilt was in parent SBRB-6/12 (2.94%) followed by SBRB-2/12 and Swarna Mani. Among the hybrids, minimum incidence of bacterial wilt was observed in SBRB-6/12 x KS-224 (2.72%), which was followed by SBRB-6/12 x SBRB-2/12 and KS-224 x SBRB-6/12. Minimum incidence of fruit borer was recorded in parent KS-224 (17.05%) followed by Swarna Mani and SBRB-6/12. The hybrids showed minimum incidence of fruit borer was observed in Swarna Mani x SBRB-1/12 (13.12%), which was followed by Swarna Mani x SBRB-3/12 and KS-224 x SBRB-2/12. The maximum yield per plant was with SBRB-2/12 (1.57 kg) followed by SBRB-6/12 and SBRB-1/12 and was due to least fruit borer incidence (17.05%), highest number of fruits/ plant (12.77). Line KS-224 and SBRB-6/12 showed least incidence of fruit borer and bacterial wilt (Praneethaet al., 2013).
REFERENCES [1] Anonymous 2014. National Horticulture Board, Gurgaon [2] Praneetha S, Sarasvathy T, Veeraragavathatham D and Pugalendhi L 2013.Per se performance and heterosis for shoot and Fruit borer
(Leucinodesorbonalis) resistance and yield in brinjal (Solanummelongena L.) Electronic Journalof Plant Breeding4(1):1061-1066.
It is I
LLEGAL t
o cop
y, pri
nt or
save
any c
onten
t of th
is PDF,
in pa
rt or in
full,
on an
y retr
ieval
syste
m,
withou
t the E
XPRESS WRITTEN PERMISSIO
N of th
e cop
yrigh
t-hold
er

National Conference on Climate Change and Agricultural Production: Adapting Crops to Climate Variability and Uncertainty, 6th–8th April, 2017
[544]
Predatory Potential of Neoseiulus longispinosus (Evans) (Acari: Phytoseiidae) on the Two Spotted Spider Mite,
Tetranychus urticae Koch (Acari: Tetranychidae)
K. Sankara Rao*, R. Vishnupriya and K. Ramaraju Department of Agricultural Entomology,
Tamil Nadu Agricultural University, Coimbatore–641003 E-mail: *[email protected]
Keywords: Neoseiulus longispinosus, Tetranychus urticae, Prey Stage Preference
INTRODUCTION
The two spotted spider mite, Tetranychus urticae is one of the important pests of crops in green houses and fields worldwide. Continuous use of pesticides for controlling this pest resulted in resurgence, resistance and environmental pollution over several years. Predatory mites belong to the family Phytoseiidae constitute a sizeable proportion and effective biological control agents that are commercially used in integrated pest management programs (Gerson and Weintraub, 2012). In India, Neoseiulus longispinosus was commonly found species, but there were few reports on exploitation of this species as biological control agent. Hence, the present study was conducted to determine the predatory potential of N. longispinosus on T. urticae under laboratory conditions.
MATERIALS AND METHODS
The present study was conducted in insectary, department of entomology, Tamil Nadu Agricultural University, Coimbatore during 2015. Stock culture of T. urticae and N. longispinosus was maintained at 27± 2 oC and 75±10% RH and utilized for conducting laboratory experiments. To determine the predatory potential and prey stage preference, thirty number of each life stage of T. urticae wasoffered on the okra leaf bits of 2 cm2 placed individually on rearing cells (5×4×3 cm) contained with rubber foam layered with moist absorbent cotton. The number of eggs, larva, nymphs and adults consumed by each stage of predatory mite were countedafter 24 hours using binocular stereo zoom microscope. Functional response of gravid adult female, N. longispinosus was also studied on six different densities of nymphs of T. urticae at 20, 25, 30, 35 oC in an incubator. The number of prey consumed by single predator was counted for every 24 h. Experiments were repeated for 5 days with eight replications for each prey density.
RESULTS AND DISCUSSION
The predatory mite stages preferred larvae of T. urticae followed by nymphal and egg stages (Table 1). Adult stage was least preferred by predatory mite stages. There was gradual increase in prey consumption as the stage advances from protonymph to adult stage. Adult female was voracious feeder compared to other stages of predatory mite. It fed 13.12 eggs, 20.04 larvae, and 17.87 protonymphs 12.25 deutonymphs, 5.12 adults of T. urticae per day. The results shown in Figure 1. indicated that there was a gradual increase in predation with change in prey density. Higher rate of predation was observed at prey density of 40 nymphs per leaf bit. Temperature has significant role in predation rate, and it increased with rise in temperature. Higher rate of predation was observed at 30 and 35 oC compared to the temperatures at 20 and 25 oC. Maximum predation was observed at 35 oC i.e. 14.86 when prey density was 30 nymphs per experimental cell. N. longispinosus was able to survive and feed at lower prey densities and shown higher predation rates at temperatures of
It is I
LLEGAL t
o cop
y, pri
nt or
save
any c
onten
t of th
is PDF,
in pa
rt or in
full,
on an
y retr
ieval
syste
m,
withou
t the E
XPRESS WRITTEN PERMISSIO
N of th
e cop
yrigh
t-hold
er

National Conference on Climate Change and Agricultural Production: Adapting Crops to Climate Variability and Uncertainty, 6th–8th April, 2017
[545]
more than 30 oC. Preference towards the younger stages of pest indicates the potential of predator in preventing population build-up of T. urticae when released at early stages of infestation. Hence there is a need to focus on successful mass rearing techniques and field level efficacy studies of N. longispinosus for utilising this species in integrated mite management programmes.
Table 1: Mean Prey Consumption of N. longispinosus on Different Stages of T. urticae at 27± 2 oC(Number Per Day)
Prey Stage Predatory Stage* Protonymph Deutonymph Adult male Adult female
Egg 4.87 ± 0.44c 6.00 ± 0.46d 4.25 ± 0.31b 13.12 ± 0.54c Larva 13.62 ± 0.86a 14.50 ± 0.82a 11.25 ± 0.64a 20.04 ± 0.75a Protonymph 5.75 ± 0.45b 12.37 ± 0.37b 11.50 ± 0.59a 17.87 ± 0.61b Deutonymph 8.12 ± 0.51b 10.50 ± 0.56c 11.12 ± 0.66a 12.25 ± 0.45c Adult 2.37 ± 0.32d 3.12 ± 0.29e 1.62 ± 0.18c 5.12 ± 0.39d
*Mean of eight replications in each treatment
REFERENCE [1] Gerson U and Weintraub P G 2012. Mites (Acari) as a factor in greenhouse management. Annual Review of Entomology 7: 229-247.
Climatic Change and its Impacts on Agriculture Productivity in India
S. Avinash1*, S. Monoj1, L. Dalpat1 and K. Nirupa2 1Department of Plant Biotechnology, University of Agricultural Sciences, Bengaluru–560065, India
2Department of Botany, Patna University, Patna–800001, India E-mail: *[email protected]
Keywords: Temperature, Carbon Dioxide, Water, Ozone
ABSTRACTS
The nature of agriculture and farming practices are strongly dependent on weather or climate. Climate impacts on agriculture economy, farm profitability, prices supply, demand trade and regional comparative advantages. The variation in climatic factors like water, temperature, sunlight, green house gases, C/N ratio and ozone are effects on agriculture system and others parameters like soil characteristics, seed genetics, pest & diseases and agronomic practices also do impact crop yields. These factors are reaches untimely on biosphere and impacts on agriculture. A change in temperature due to current ambient temperature that impacts on land use pattern, availability of irrigation water, critical stages of crop development, flowering stage of crops and availability of energy. The mean temperature of India will increase by 0.4–2.0 oC during Kharif and to 1.1–4.5 oC in Rabi by 2070. Similarly, mean rainfall increases to 10% during Kharif and Rabi by 2070. This will increases climate parameters such as the timing of onset of monsoon, intensities and frequencies of drought and floods. These temperature significantly impacts on agricultural yields, farm incomes and food security. The mild heat wave was 2–3oC above normal temperatures in early spring at reproductive stage, caused 28% reduction in the grain yield of wheat in Ludhiana Province of India. Higher night temperatures during 2003, the respiration over ruled the photosynthesis causing reduction in net gain and Rice grain yield declined 10% for each 1oC increase in minimum temperature. Water is very prominent to crop development but changes in water production due to global climate change may affect the precipitation, surface soil moisture, increased plant water stress, several agronomic management practices and agricultural yields. Carbon dioxide is indispensable factor for crop metabolism. The atmospheric CO2 concentrations are increased by climate change that directly affect physiological processes of photosynthesis,
It is I
LLEGAL t
o cop
y, pri
nt or
save
any c
onten
t of th
is PDF,
in pa
rt or in
full,
on an
y retr
ieval
syste
m,
withou
t the E
XPRESS WRITTEN PERMISSIO
N of th
e cop
yrigh
t-hold
er

National Conference on Climate Change and Agricultural Production: Adapting Crops to Climate Variability and Uncertainty, 6th–8th April, 2017
[546]
transpiration, slow down the adaptation of crops and agricultural yields. The CO2 levels 350ppm & 700ppm and temperature raise from 1 to 4oC with 1oC increment then it impacts on phenology, growth and yield of CERES-maize, CERES-sorghum and WOFOST-pigeon pea. Ozone reduces photosynthetic rates and accelerates leaf senescence that finally impacts on agricultural yields. The National Crop Loss Assessment Network results indicate a reduced annual soybean yield of 10% and a reduced cotton yield of 12% for seasonal mean ozone levels greater than 50ppb. This paper is focused on climate change and its impacts on agriculture productivity in India. Further, the effective tool is needed that may reducing uncertainty in the evaluation results of the effects of climate change on agriculture.
Characterization and Similarity of Rice (Oryza sativa L.) Germplasm Lines through SSR Markers
Mankesh Kumar*, Nitu Kumari, Satyendra, Anand Kumar, S.P. Singh and P.K. Singh Department of Plant Breeding and Genetics,
Bihar Agricultural University, Sabour–813210, Bhagalpur, India E-mail: *[email protected]
Keywords: Rice, Gerplasm, SSR Marker
INTRODUCTION
Characterization of genotypes is essential to understand the available genetic variability and its potential use in modern breeding program. The morphological traits are important markers in crops but they have limitations of low polymorphism, low heritability, late expression and vulnerability to environmental influences (Muthusamy et al., 2008). DNA based molecular markers are extensively used for the study of genetic variability because these are not affected by environmental factors (Sharma et al. 2007). The present study deals with morphological characterization of 226 rice germplasm lines which were collected from different sources and being maintained at Bihar Agricultural University, Sabour.
MATERIALS AND METHODS
Morphological observations of five randomly selected plants were taken on plant height, number of tillers per plant, flag leaf length, panicle length, grain length (L), grain breadth (B) and L/B ratio. Morphological data were classified and converted into 0, 1 matrix and similarity coefficient between the lines was calculated through UPGMA (unweighted pair group method with arithmetic averages) method. DNA isolated from the accessions and molecular profiling was done through thirty three SSR (Simple Sequence Repeat) markers during PCR. Construction of a rooted phylogenetic tree and Jaccard’s similarity was performed using NTSYSpc version 2.1.
RESULTS AND DISCUSSION
Morphological data revealed that all the accessions of Tiloundha were tall and late maturing whereas the collection from Patna and Sabour were semi-dwarf to tall with medium to late maturity. The panicle length was medium to long in Tiloundha accessions whereas it was short to medium in both Patna and Sabour accessions. Based on the grain length and L/B ratio, the grains of Tiloundha collections fall into short to medium slender category whereas Patna and Sabour accessions had long, medium and short slender grained accessions. Fory-four different combinations of 45 entries in Tiloundha, 9 combinations of 16 entries in Patna and 14 combinations of 17 entries in Sabour collection, had more than 65% similarity on the morphological
It is I
LLEGAL t
o cop
y, pri
nt or
save
any c
onten
t of th
is PDF,
in pa
rt or in
full,
on an
y retr
ieval
syste
m,
withou
t the E
XPRESS WRITTEN PERMISSIO
N of th
e cop
yrigh
t-hold
er

National Conference on Climate Change and Agricultural Production: Adapting Crops to Climate Variability and Uncertainty, 6th–8th April, 2017
[547]
traits. The molecular diversity analyzed through the scoring of amplified products, showed 56,63 and 61 alleles in Tiloundha, Patna and 61 a Sabour germplasm collections, respectively. The highest PIC value of SSR markers was 0.449 in Tiloundha and 0.500 in Patna and Sabour germplasm accessions. The dendrogram showed, six clusters in Tiloundha and five clusters in Sabour and Patna collections at 0.5 Nei distance. In molecular similarity, new combinations of 20, 2 and 3 accessions showed 90% similarity in Tiloundha, Patna and Sabour germplasm collection, respectively. The 60 and 90 percent at morphological similarity between Til69/Til71 and Sab6/Sab7, respectively at molecular level which indicated duplications of these accessions. Hence SSR markers based molecular fingerprinting could identify genetically distant genotypes and sort-out the duplications in morphologically close accessions.
REFERENCES [1] Muthusamy S, Kanagarajan S and Ponnusamy S 2008. Efficiency of RAPD and ISSR markers system in accessing genetic variation of rice
bean (Vigna umbellata) landraces. Electronic Journal of Biotechnology 11 (3): 1-10. [2] Sharma RC, Chaudhary NK, Ojha B, Yadav L, Pandey MP and Shrestha SM 2007. Variation in rice landraces adapted to the lowlands
and hills in Nepal. Plant Genet Resources: Character 5(3):120-127.
Molecular Diversity Analysis of Maize (Zea maize L.) Inbreeds using SSR Markers
S.K. Sathua, J.P. Shahi, P. Kumar, A. Mahato and Varsha Gayatonde* Department of Genetics and Plant Breeding, IASc, BHU, Varanasi–221005, India
E-mail: *[email protected]
Keywords: Maize, SSR Markers, Molecular Diversity, UPGMA
INTRODUCTION
Maize is the third most important and known as queen of the cereals. Inbreds are the widely used parental material in the hybridization program. Many of these accessions have specific features, but only a few of them have been utilized in maize improvement programs (Prasanna and Sharma 2005). There is an important role of understanding the genetic diversity among and within inbred lines at the molecular level for maize improvement.
MATERIALS AND METHODS
The present investigation consists of 25 maize inbreds collected from the All India Co-ordinated Maize Improvement Project, Department of Genetics and Plant Breeding, IASc, BHU, Varanasi, were analysed for diversity using a total of 40 SSR markers during rabi 2015–16. Dendrogram was constructed based on UPGMA from the Jaccard’s similarity coefficient and the inbreds were subjected to cluster analysis.
RESULTS AND DISCUSSION
Among the 40 SSR markers used only 20 were informative (polymorphic) with total 70 alleles, provide a reference for determining the Simple sequence repeats (SSR) alleles number in genetic relationship analysis of maize inbred line and other crop germplasm. The PIC value ranged from 0.286 (umc226) to 0.966 (csu308) with an average PIC of 0.736. The first three PCs contributed 23.70, 7.63 and 6.73% respectively, with a cumulative variation of first 3PCs was 38.07%. The cluster analysis indicates inbred HUZM 252 and HUZM 265 are highly diverse. The present study has indicated the need for evaluating the component lines derived from each cluster. Cluster analysis indicates there is an enough diversity found between the inbreds
It is I
LLEGAL t
o cop
y, pri
nt or
save
any c
onten
t of th
is PDF,
in pa
rt or in
full,
on an
y retr
ieval
syste
m,
withou
t the E
XPRESS WRITTEN PERMISSIO
N of th
e cop
yrigh
t-hold
er

National Conference on Climate Change and Agricultural Production: Adapting Crops to Climate Variability and Uncertainty, 6th–8th April, 2017
[548]
tested and the information on diversity of inbred lines generated in this study would be much useful in developing heterotic hybrids.
REFERENCE [1] Prasanna B M and Sharma L 2005. The landraces of maize (Zea mays L.) diversity and utility. Indian Journal of Plant Genetic Resources
18: 155–68.
Understanding Genetic Diversity of Rice Genotypes Tested under Complete Flash Flood Environment of Zone IIIA of Bihar State
Rahul Singh, Mankesh Kumar, S.P. Singh, Anand Kumar, P.K. Singh and Satyendra* Department of Plant Breeding and Genetics,
Bihar Agricultural University, Sabour–81320, Bhagalpur, India E-mail: *[email protected]
Keywords: Rice, Submergence, Genetic Diversity, Flood Environment
INTRODUCTION
Flash floods are one of the most common threats to the world rice production. In India, Bihar is one of the most commonly and most widely affected state by one or more kind of the flood stress in the season when rice is grown. It is very big hurdle for state’s economy and affects a very large area spread over 45% of the total rice cultivation in the state. This area is under rainfed shallow lowlands and rainfed lowlands. The scenario of climate change has made the situation worst as unequal and uncertain distribution of rainfall has been observed during last few years. Therefore, pre-breeding and breeding for this type of natural hazards is the need of time and necessary for achieving breeding goals in the future.
MATERIALS AND METHODS
Twenty eight rice genotypes including locally adapted varieties, improved indigenous and exotic lines, and cultivars developed and released for semi-deep water situation were grown under normal and complete flash flood conditions simultaneously at Research Farm of the Rice Section, Bihar Agricultural College, Bihar Agricultural University, Sabour (Bhagalpur) during Kharif 2015–16 in order to assess the extent of genetic divergence among the genotypes based on morphological traits. All the situations required for artificial screening for complete flash flood submergence were provided to the experiment under submergence as per the protocols available. The experiment was completely submerged for 18 days starting from 30th day of transplanting. Popular variety Swarna was used as susceptible while Swarna Sub-1 was used as tolerant check for submergence. Morphological data was recorded for important yield and yield contributing traits in both of the experiments whereas survival percentage was recorded under submergence after 21 days of de-submergence of the experiment. Data was subjected to D2 analysis for estimating genetic divergence.
RESULTS AND DISCUSSION
The analysis of variance showed significant differences among the genotypes for all the traits under study. Although, on the basis of morphological data taken commonly, total six clusters were formed for both control and submergence, genotypes grouped into clusters were entirely different. Overall, the clustering pattern reflected the presence of considerable amount of genetic diversity in the genetic material under study. Most of the IRRI genotypes were grouped into the same but different clusters in both the situation. In control, Swarna Sub1 and Swarna were very close. It was because they were NILs and Swarna Sub1 was having back ground
It is I
LLEGAL t
o cop
y, pri
nt or
save
any c
onten
t of th
is PDF,
in pa
rt or in
full,
on an
y retr
ieval
syste
m,
withou
t the E
XPRESS WRITTEN PERMISSIO
N of th
e cop
yrigh
t-hold
er

National Conference on Climate Change and Agricultural Production: Adapting Crops to Climate Variability and Uncertainty, 6th–8th April, 2017
[549]
of Swarna. Similarly, genotypes of similar phenotype in regard of plant height and plant type were also grouped in the same cluster. The highest inter-cluster distances respectively under control and submergence, were observed between cluster 2 and 6 (2837.661) and between cluster 4 and 6 (1869.445) indicating wider genetic diversity among the genotypes between these groups. Genotypes from these clusters could be utilized for selection of parental material for breeding programmes through hybridization owing to their higher mean performance within group. Highest contribution in manifestation of genetic divergence under control condition was exhibited by Days to 50% Flowering (54.5%) whereas in case of submergence, grain yield (kg/ha) (25.40), filled grain/ panicle (24.60) were found to be contributing more towards genetic divergence. Highest survival percentage was recorded for RYC 743 followed by IR 96321-315-402-B-1, Swarna Sub-1, IR 96321-678-271-B-1-1, RYC 250 and Rajendra Sweta. Percent yield reduction from control to the submergence was least for IR 96321-315-402-B-1 (11%) followed by RYC 250 Swarna Sub-1, RYC 743 and IR 96321-678-271-B-1-1 whereas highest for Sabour Deep (90%) followed by Vaidehi, Sabour Surbhit, Swarna and Rajendra Mahsuri-1. Conclusively it can be said that most of the yield contributing traits are drastically affected in complete flash flood submergence. Genotypes having medium plant height and no elongation ability during submergence show a better and balanced assimilation and consumption of carbohydrates.
REFERENCES
[1] Senapati B K and Kumar A 2015. Genetic assessment of some phenotypic variants of rice (Oryza spp.) for some quantitative characters
under the Gangetic plains of West Bengal. African Journal of Biotechnology 14 (3): 187-201. [2] Kodihall B and Dushyanthakumar B M 2014. Genetic diversity for grain yield and its components in local rice (Oryza sativa L.) genotypes
under submergence.Electronic Journal of Plant Breeding 5 (1): 67-70.
Genetic Variation and Association among Some Morpho-Physiological Traits for Rice Improvement under Submergence Condition
Rajesh Kumar1, Nilmani Prakash2* and Vinay Kumar3 1Department of Plant Breeding and Genetics,
2Department of Agricultural Biotechnology and Molecular Biology 1,2Dr. Rajendra Prasad Central Agricultural University, Pusa–848125, Samastipur, India
3Division of Agronomy, Indian Agricultural Research Institute, Regional Station, Pusa–848125, Samastipur, India
E-mail: *[email protected]
Keywords: Heritability, Land Races, Rice, Selection Criteria, Submergence, Stress, Variability
INTRODUCTION
Rice, Oryza sativa L. (2n = 24) belongs to the family Poaceae and subfamily Oryzoideae. It is the staple food for half of the world’s population. About 32.4% of India’s total rice area, i.e., 15 m ha is under rainfed lowlands. Rainfed lowlands constitute highly fragile ecosystems, always prone to flash-floods (submergence). Among the 42 biotic and abiotic stresses affecting rice production, submergence has been identified as the third most important constraint for higher rice productivity (Sarkar et al. 2006). Scientists have estimated that 4 million tonnes of rice is being lost every year because of flooding (IRRI, 2008). According to an estimate of National Bureau of Soil Survey and Land Use Planning nearly 3.3 M ha of land is affected by flood of varying degree. Germplasm survey revealed the existence of limited amount of genetic variation for submergence tolerance. Rice is often the only cereal that can be grown in flood prone ecosystem. Yield and submergence tolerance, both are quantitative and very complex in nature.
It is I
LLEGAL t
o cop
y, pri
nt or
save
any c
onten
t of th
is PDF,
in pa
rt or in
full,
on an
y retr
ieval
syste
m,
withou
t the E
XPRESS WRITTEN PERMISSIO
N of th
e cop
yrigh
t-hold
er

National Conference on Climate Change and Agricultural Production: Adapting Crops to Climate Variability and Uncertainty, 6th–8th April, 2017
[550]
MATERIALS AND METHODS
The present investigation was conducted with 184 land races of rice collected from different countries including four checks i.e. Swarna sub-1, Rajendra Mahsuri Sub-1, FR-13A and FR-13B to access the variability parameters based on 10 quantitative traits including grain yield and stress indices. The experiment was conducted at Crop Research Farm of RAU, Pusa, which is situated in district Samastipur of North Bihar, India. Field experiment was performed in Augmented Design (AD-II) during two years i.e. Kharif 2013–14. Each genotype was sown in four rows in plot of 5 m length with 20 cm inter-row and 15 cm intra-row (inter-plant) spacing in water tank for submergence screening.
Percent plant survival (PPS) =
Total shoot elongation (TSE) = Height of shoot after de-submergence–Height of shoot before de-submergence.
Relative shoot elongation (RSE) = Elongation growth under submergence 100
Elongation growth under non-submergence conditions
Tolerance score (TS) = Scored on the basis of percent plant survival (PPS).
RESULTS AND DISCUSSION
The analysis of variance showed significant differences (P < 0.01) among the entries for the yield and yield attributing traits, indicating the presence of exploitable extent of variability in population. The high estimates of GCV and PCV (>20%) was exhibited by plant height, number of tillers per hill, survival percentage, total shoot elongation, relative shoot elongation, tolerance score and grain yield per hill, whereas rest traits showed moderate values except number of productive tillers per hill.The positive significant relationship of total shoot elongation was found with relative shoot elongation and tolerance score, indicated the rapid growth of shoot elongation may enhance the tolerance capacity. Besides the yield parameters, the stress parameters viz., TSE was found predominant and may used in breeding programme for screening of submergence tolerance genotypes.
Table 1: Genetic Parameters on Various Yield Components and Stress Indices in Rice (Pooled of Two Years) GP/ Trait Days to
50 Per cent
Flowering
Plant Height (cm)
Tillers Per Hill
Fertile Tillers
Per Hill
Panicle Length (cm)
Survival (%)
Total Shoot Elongation
(cm)
Relative Shoot
Elongation (cm)
Tolerance Score
Grain Yield Per Plot (g)
Range 56.90–177 31.12–226
0.21–17.10
0.20–17.08
-2.35–16.90
34.94–102.94
0.90–57.30 16.82–1730.71
1–10 35.95–621.08
Mean 128 144.5 8.20 7.81 24.20 79.98 20.60 152.53 1.00 239.89 GCV (%) 16.74 21.12 31.26 26.68 10.76 20.03 49.50 69.40 60.44 38.52 PCV (%) 17.06 21.86 35.27 30.53 12.89 20.90 54.36 71.48 61.45 45.32 h2bs (%) 96.20 93.40 22.26 76.4 14.35 91.90 82.90 81.80 89.98 72.20 GAM (0.05)
33.82 42.05 16.74 48.04 31.81 39.54 92.87 92.76 93.10 67.43
*= (P<0.01), **= (P<0.05); GP= Genetic parameters, VG= Genotypic variance, VP= Phenotypic variance, GCV= Genetic coefficient of variation, PCV= Phenotypic coefficient of variation, h2bs= Heritability in broad sense, GAM= Genetic advance as % of mean
REFERENCES [1] Devi B, Singh CM, Lal G M, Yadav P 2012. Genetic architecture, interrelationship and path analysis f or yield improvement in exotic rice.
International Journal of Agriculture, Environment and Biotechnology 5: 387-392. [2] Singh C M, Suresh B G, Kumar B, Mehandi S 2013. Analysis of quantitative variation and selection criteria for yield improvement in
exotic germplasm of upland rice (Oryza sativa L.). The Bioscan 8 (2):485-492. [3] Toojinda T, Siangliw M, Tragoonrung S, Vanavichit A 2003. Molecular genetics of submergence tolerance in rice: Analysis of key traits.
Annals of Botany 91 (2): 243-253.
It is I
LLEGAL t
o cop
y, pri
nt or
save
any c
onten
t of th
is PDF,
in pa
rt or in
full,
on an
y retr
ieval
syste
m,
withou
t the E
XPRESS WRITTEN PERMISSIO
N of th
e cop
yrigh
t-hold
er

National Conference on Climate Change and Agricultural Production: Adapting Crops to Climate Variability and Uncertainty, 6th–8th April, 2017
[551]
Chickpea Wilt Disease Development Influenced by Different Dates of Planting under Changing Climate
Sangita Sahni*, Devendra Singh and Birendra Kumar Tirhut College of Agriculture, Dholi, Muzaffarpur,
Dr. Rajendra Prasad Central Agricultural University, Pusa–800020, India E-mail: *[email protected]
Keywords: Chickpea, Fusarium oxysporumf. sp. ciceri, Wilt, Sowing Date, Host Cultivar
INTRODUCTION
Chickpea (Cicer arietinum L.) is an important pulse crop growing all over the country in Rabi season. Low yield of chickpea is attributed to its susceptibility to several fungal, bacterial and viral diseases. Among the diseases, chickpea wilt caused by Fusarium oxysporum f. sp. ciceri is one of the major yield limiting factors to chickpea and causes 10% of annual loss in yield (Mina and Dubey, 2010). The disease can appear at any stage of plant growth. Symptoms in a highly susceptible cultivar can develop within 25 days after sowing and as late as podding stage. Climate change is cause of concern for agriculture as it not only affect plants but also affects the pathogens, insect pests and weeds that reduces crop yield (Anderson et al.,2004). The classic disease triangle recognizes the role of climate in disease development on crops, as no virulent pathogen can induce disease on a highly susceptible host if climatic conditions are not favourable (Agrios 2005; Ziska and Runion 2007). Wilt incidence in chickpea also depends on climatic conditions of the region. In present investigation an attempt was made to access the effect of different date of planting on chickpea wilt disease incidence and how this disease management practice may be influenced by cultivar susceptibility.
MATERIALS AND METHODS
An microplots experiment was conducted during winter (rabi) season in field to assess influence of different sowing date and host cultivar on chickpea wilt. The treatments comprised of five host cultivars viz., Pusa 256, BG 372, C235, JG 315 and JG 62 and four dates of sowing viz., 1st week of November, mid November, last week of November & 1st week of December, and each treatment was replicated thrice. Host cultivars were sown in 4 x 1.5 m2 plots with row to row spacing of 30 cm. The plots were periodically observed for number of wilted plants and per cent incidence was calculated.
RESULTS AND DISCUSSION
Late sowing (1st week of December) minimizes wilt incidence in all the cultivars. Lowest wilt incidence (9.04%) were in the cultivar Pusa 256 followed by JG 315, sown on 1st week of December. Similar trend was observed in BG 372, C235 and JG 62 whereas 1st week of November sown cultivars showed highest wilt incidence (17.48–99.17%). Different date of sowing can affect the relative resistance response of certain chickpea cultivars against F. oxysporium f. sp. ciceris under field conditions. This demonstrates the importance of choosing sowing dates for the management of Fusarium wilt of chickpea. Thus, for chickpea crops, advancing the sowing date from early November to early December can slow down the Fusarium wilt incidence. This study will substantially accelerate the on-going efforts to understand the host × pathogen × environment interactions in chickpea under the changing scenario of climate.
It is I
LLEGAL t
o cop
y, pri
nt or
save
any c
onten
t of th
is PDF,
in pa
rt or in
full,
on an
y retr
ieval
syste
m,
withou
t the E
XPRESS WRITTEN PERMISSIO
N of th
e cop
yrigh
t-hold
er

National Conference on Climate Change and Agricultural Production: Adapting Crops to Climate Variability and Uncertainty, 6th–8th April, 2017
[552]
REFERENCES [1] Agrios G N 2005.Environmental effects on the development of the infectious disease. (in) Plant Pathology, (5th edition), George N Agrios
(Ed.). Elesvier Academic Press. Burlington, Mass, USA., pp: 251–62. [2] Anderson P K, Cunningham A A, Patel N G, Morales F J, Epstein P R and Daszak P 2004. Emerging infectious diseases of plants:
Pathogen pollution, climate change and agrotechnology drivers. Trends in Ecology and Evolution 19: 535–44. [3] Mina U and Dubey SC2010. Effect of environmental variables on development of Fusarium wilt in chickpea (Cicer arietinum) cultivars.
Indian Journal of Agricultural Sciences 80 (3): 231–234. [4] Ziska L H and Runion G B 2007. Future weed, pest and disease problems for plants. In:Agroecosystems in a Changing Climate, Newton P
C D, Carran R A, Edwards G R, Niklaus P A (Eds). Boca Raton, FL CRC Press. pp: 261–87.
Exploration of Sclerotium rolfsii Adapting High Temperature Regime in Successive Generation
Ritesh Kumar, Abhijeet Ghatak* and Arun P. Bhagat Department of Plant Pathology,
Bihar Agricultural University, Sabour–813210, India E-mail: *[email protected]
Keywords: Adaptation, Climate Change, Sclerotium rolfsii, Temperature
INTRODUCTION
Sclerotium rolfsii is a soil borne fungal pathogen that causes collar rot disease with a wide host range of agricultural and horticultural crops. The fungus is distributed in tropical and subtropical regions of the world. Temperature, not only influence the development and spread of fungal disease but also greatly influences the growth and sporulation of pathogens (Khan and Quazi, 2010). Adaptation of increased temperature of a pathogen indicates high risk to future agriculture under changing climate (Savary et al., 2011). Therefore, we conducted this study to examine the degree of adaptability of S. rolfsii towards increased temperature.
MATERIALS AND METHODS
Fungal pathogen Sclerotium rolfsii, sampled from infected cucurbit roots, used in this study to explore the effect of temperature on growth of this pathogen. The same isolate subjected to grow under two different incubation conditions i.e. 25°C and 35°C. A disc of actively growing mycelium placed at the center of Petri plate and cultivated for 120 h (at 25°C) when the mycelium touched the periphery of the plate (Muthukumar and Venkatesh, 2013). Five replicates for each temperature regime in a generation were adjusted following a complete randomized design. The comparison of fungal growth rate was made between 25°C and 35°C.
RESULTS AND DISCUSSION
At both incubation temperatures, no visible mycelium was recognised on 24 h after inoculation (hai). The growth pattern of pathogen in successive generations differs at a given temperature (Table 1). Among the two temperatures, 25°C was more conducive for the mycelial growth of S. rolfsii. Significantly reduced fungal growth was observed in the high temperature. A reverse trend reflected in this experiment for the two different incubation temperatures. Delay in mycelium extension was recognized for incubation temperature at 35°C; the mycelium appeared on 96 hai day after inoculation. This could be interpreted that the exposure of S. rolfsii to higher temperature (35°C) is detrimental to the growth of S. rolfsii. Interestingly, reduction in radial growth of S. rolfsii initiated on 8th sub-culturing at 25°C, however, an increase in the fungal growth was observed on 5th sub-culturing for incubation at 35°C. It is due to adaptation of the fungus at higher
It is I
LLEGAL t
o cop
y, pri
nt or
save
any c
onten
t of th
is PDF,
in pa
rt or in
full,
on an
y retr
ieval
syste
m,
withou
t the E
XPRESS WRITTEN PERMISSIO
N of th
e cop
yrigh
t-hold
er

National Conference on Climate Change and Agricultural Production: Adapting Crops to Climate Variability and Uncertainty, 6th–8th April, 2017
[553]
temperature for its survival. The genetic constituent of the pathogen, responsible for pathogenicity and mycelial growth may alter in response to the temperature for its survival. Therefore, the cardinal temperature is switching to 35°C from 25°C in response to the change in temperature. Each pathogen has got its own cardinal temperature and understanding the temperature requirement of the pathogen will help to standardize the management practices in the arena of climate change and global warming. Our study envisaged the understanding of temperature that play important role in growth and reproduction of S. rolfsii, which causes detrimental losses to various crops.
Table 1: Mycelial Growth (mm) of S. rolfsii in 15 Generations at Different 25°C and 35°C Generation Radial Growth (mm) at 120 hai
25°C 35°C 1st 90.0 21.0 2nd 90.0 21.0 3rd 90.0 21.0 4th 90.0 21.0 5th 90.0 21.5 6th 90.0 21.5 7th 90.0 21.6 8th 89.5 21.6 9th 89.5 21.8 10th 89.0 22.0 11th 89.0 22.0 12th 89.0 22.0 13th 88.5 22.2 14th 88.0 22.4 15th 87.0 22.6
Average value 89.3 21.7
REFERENCES [1] Khan S M and Quazi S M 2010. Influence of temperature and culture media on the growth of Colletotrichum capsici. Life Science Bulletin
7(1): 43-44. [2] Muthukumar A and Venkatesh A 2013. Physiological studies on Sclerotium rolfsii Sacc. causing collar rot of peppermint. African Journal
of Biotechnology 12 (49): 6837-6872. [3] Savary S, Nelson A, Sparks A H, Willocquet L, Duveiller E, Mahuku G, Forbes G, Garrett K A, Hodson D, Padgham J, Pande S, Sharma
M,Yuen J, and Djurle A 2011. International agricultural research tackling the effects of global and climate changes on plant diseases in the developing world. Plant Disease 95 (10): 1204-1216.
It is I
LLEGAL t
o cop
y, pri
nt or
save
any c
onten
t of th
is PDF,
in pa
rt or in
full,
on an
y retr
ieval
syste
m,
withou
t the E
XPRESS WRITTEN PERMISSIO
N of th
e cop
yrigh
t-hold
er
National Conference on Climate Change and Agricultural Production: Adapting Crops to Climate Variability and Uncertainty, 6th–8th April, 2017
[554]
Transmission and Temporal Response of Groundnut bud necrosis virus Infecting Potato Crop in Diverse Ecology
Mohammad Ansar1*, Ashok Kumar Meena2 and V.S. Pundhir1 1Department of Plant Pathology,
GB Pant University of Agriculture and Technology, Pantnagar–263145, India 2Agricutural Research Station, Kota–324001 India
E-mail: *[email protected]
Keywords: GBNV, Necrosis, NP Gene, Thrips and Tospovirus
INTRODUCTION
Stem necrosis disease is a serious issue in several parts of central and western India particularly plateau region with more than 90% incidence. Necrotic symptom appears on stem and leaves which resembles with late blight fungal disease. The virus sap transmitted to cowpea plant causing localized lesion on primary leaves. The virus also transmitted through viruliferous Thrips palmi from infected potato plants and induce typical symptom. The stem necrosis disease first reported in India as Groundnut bud necrosis virus based on molecular analysis of NP gene (Jain et al., 2009). The present study focused on virus diagnosis, transmission efficiency of thrips and their response in various cultivars, and trend of disease development in diverse ecology.
MATERIALS AND METHODS
Presence of virus was confirmed through RT-PCR using kit (QIAGEN). Specific primer pair were used that target NP gene of GBNV. The magnitude of virus transmission in various potato cultivars tested artificially under protected condition. The present study was undertaken for establishing the relationship between thrips and necrosis by field experiments. Six cultivars were planted in randomized block design, with three replications. Disease was scored along with thrips by assessing their population. For the assessment of temporal response of necrosis, two ecologically distinct locations like Agricultural Research Station, Kota (Rajasthan) and NEB Crop Research Centre, Pantnagar (Uttarakhand) were selected. Two set of field experiment with staggered planting like extra early, early, normal, late, and long late during middle October to November were conducted.
RESULTS AND DISCUSSION
Primarily the virus was detected through reverse RT-PCR using specific primer, nucleocapsid protein (NP) gene of GBNV yielded a single band of ~800bp. The diagnostic approach clarified the absence of Phytophthora infestans causing late blight infection in collected samples. In artificial transmission experiment, Thrips palmi successfully inoculated the virus with 11.1-33.3 percent symptom expression in commercial potato cultivars (Table 1). The virus-vector relationship reveals, negative interactions in between thrips population and stem necrorsis incidence in Tarai region of Uttarakahnd and semi arid ecology of Rajasthan. The maximum appearance of stem necrosis documented at both locations in early grown potato crop. Semi arid avow support the longer association of thrips with crop and producing higher disease. Emergence of early plant at both locations looks to harmonize with the infestation of migrant thrips. Higher disease in early planted potato may be endorsed to mass shifting of thrips from adjoining tomato and other pulse crops. Lowering down in disease in delayed planting may be due to cool and dry weather affecting the dispersal activity. Observations recorded by Sanger (1996),mid November found best for minimizing average disease
It is I
LLEGAL t
o cop
y, pri
nt or
save
any c
onten
t of th
is PDF,
in pa
rt or in
full,
on an
y retr
ieval
syste
m,
withou
t the E
XPRESS WRITTEN PERMISSIO
N of th
e cop
yrigh
t-hold
er

National Conference on Climate Change and Agricultural Production: Adapting Crops to Climate Variability and Uncertainty, 6th–8th April, 2017
[555]
incidence. The results demonstrated under the study, can be used to recognize the dynamics of disease, refine models of epidemiology of virus and infection it causes.
Table 1: Transmission of stemnecrosisvirus through Thripspalmi on Different Potato Cultivars Cultivars No of Plants
Infected/ Inoculateda Per cent
Transmission Symptom Appearanceb Symptomatic
Variationc Kufri Bahar 6/18 33.3 16 SN, VN, WT Kufri Jawahar 4/18 22.2 19 SN,CR Kufri Badshah 3/18 16.6 15 SN,VN Kufri Sutlej 4/18 22.2 18 SN Kufri Pukhraj 5/18 27.7 15 SN, VN Kufri Jyoti 2/18 11.1 21 CR. VN
a Aquisition feeding period (AFP) 48 and Inoculation feeding period (IFP) 72 hrs b Expression days (approximate) after thrips release cSypmtom: S N- stem necrosis, VN- venial necrosis, CR- concentric ring, WT- wilting
REFERENCES [1] Jain R K, Khurana S M P, Bhat A I and Chaudhary V 2009. Nucleocapsid protein gene sequence studies confirm that potato stem
necrosis is caused by a strain of groundnut bud necrosis virus. Indian Phytopathology57: 169-73. [2] Sanger R B S 1996. Studies on the management of potato stem necrosis disease in the northern hill region of Chattisgharh, Madhya
Pradesh. Indian Journal of Virology12:65-67.
Studies on Life-Tables and Key Mortality Factors of Aproaerema Modicella Deventer on Sole Soybean and Soybean
Intercropped with Pigeonpea
S.V. Phatak1 and Dr. V.K. Bhamare2 1Department of Agricultural Entomology, College of Agriculture, Latur–413152, India
2Vasantrao Naik Marathwada Krishi Vidyapeeth, Parbhani–431401, India E-mail: *[email protected]
Keywords: Soybean, Pigeonpea, Intercropping, Life-tables, Key mortality, Aproaeremamodicella
INTRODUCTION
Soybean [Glycine max (L.) Merrill], a wonder crop of the twentieth century belongs to family Leguminaceae is attacked by dozen of insect-pests in India. Recent concept of insect-pests management strategies revealed that intercropping system based on the companion cropping pattern may be helpful in ecological manoeuvring resulting in escape or less infestation by insect-pests. Moreover, a detailed understanding of such type of manipulation may be helpful in forecasting of pest outbreak on one hand and development of integrated crop management practices on the other (Singh and Singh, 1978). Field life-tables and key mortality factors of many insect-pests are not well studied with respect to cultivars and cropping system of soybean. In this context, the present research work was conducted to investigate field life-tables and key mortality factors of leaf miner on sole soybean and soybean intercropped with pigeonpea.
MATERIALS AND METHODS
A non replicated field experiment was conducted at V.N.M.K.V., College of Agriculture Latur (MS) during Kharif 2015. On germination of crop, frequent field visits were made in order to record the first incidence of leaf miner on sole soybean as well as soybean intercropped pigeonpea. The known numbers of leaf miner
It is I
LLEGAL t
o cop
y, pri
nt or
save
any c
onten
t of th
is PDF,
in pa
rt or in
full,
on an
y retr
ieval
syste
m,
withou
t the E
XPRESS WRITTEN PERMISSIO
N of th
e cop
yrigh
t-hold
er

National Conference on Climate Change and Agricultural Production: Adapting Crops to Climate Variability and Uncertainty, 6th–8th April, 2017
[556]
larvae were collected along with the plant parts and reared in Petri plates individually on tender leaves till the cessation of pest population in the field as a start of first regular generation. This laboratory culture was used as a check culture for deciding the number of regular generations of pests in the field conditions. The sampling of early and late instar larvae of leaf miner was done on the basis of development of pest in laboratory reared culture. At each observation five plots (quadrats of 2.70 × 2.00 m) were carefully examined twice in a week for number of larvae of target pests. The field collected larvae were brought to the laboratory and reared on soybean leaves till adult emergence. The observations were made on the larval and pupal parasitism and unknown reasons in early instars, late instars and pupal stage as well. The life-table was constructed based on the studies of Morris and Miller (1954). However, the method developed by Varley and Gradwell (1963) was used for analysis of key mortality factors.
RESULTS AND DISCUSSION
In sole soybean, the mortality of early instar larvae was 4.20, 2.10 and 1.48 per cent due to Apanteles sp. during first, second and third generation, respectively. The unknown reasons caused the mortality to the tune of 0.84, 4.81 and 7.91 per cent in first, second and third generation, respectively. Late instar larvae of a. Modicellawere died to the extent of 7.98, 5.42 and 6.92 per cent due to apanteles sp. during first, second and third generation, respectively. While unknown reasons caused the mortality of late instar larvae to the tune of 9.73, 6.92 and 9.90 per cent in first, second and third generation, respectively. Unknown reasons also caused pupal mortality of A. modicellato the extent of 11.76, 10.24 and 9.90 per cent in first, second and third generation, respectively. The maximum contribution towards generation mortality of A. Modicellawas from late instar larvae in all three generations (K = 0.0870, 0.0619 and 0.0892). The total K for first, second and third generation was 0.4805, 0.4530 and 0.4957, respectively. While in soybean intercropped with pigeonpea, early instar larvae of S. Modicellathere was mortality 6.09, 1.39 and 4.21 per cent due toApanteles sp. during first, second and third generation, respectively. While unknown reasons caused the mortality of early instar larvae of a. Modicellato by 7.10, 5.59 and 8.42 per cent in these three generations, respectively. Late instar larvae of mortality due Apanteles was 11.16, 9.44 and 3.15 per cent during three generation, respectively. In late instar larvae the mortality was also recorded due to Goniozus sp. (4.15 per cent) during third generation. The unknown reasons caused the mortality of late instar larvae by 12.18, 8.04 and 7.36 per cent in first, second and third generations, respectively. Unknown reasons also caused pupal mortality of m. Modicella to the extent of 9.64, 5.94 and 10.38 per cent in three generation, respectively. The maximum contribution towards generation mortality was from late instar larvae in all three the generations (K = 0.1361, 0.0904 and 0.0799). The total K for first, second and third generation was 0.5700, 0.4585 and 0.5065, respectively.Thus, it can be concluded that the population of A. Modicella was significantly reduced when soybean intercropped with pigeonpea in comparison with sole soybean. Moreover, soybean intercropped with pigeonpea exerts significant positive effect on parasitisation of A. Modicella pests.
REFERENCES [1] Morris R F and Miller C A 1954. Development of life-tables for the spruce budworm. Canadian Journal of Zoology 32: 283-301. [2] Singh R N and Singh K M 1978. Influence of intercropping on succession and population building of insect-pests in early variety of red
gram, Cajanuscajan (L.) Millsp.Indian Journal of Entomology 40: 361-375. [3] Varley G C and Gradwell G R 1963. The investigation of insect population changes. Proc. XII. Ceylon Association Advance Sciences 18:
142-156.
It is I
LLEGAL t
o cop
y, pri
nt or
save
any c
onten
t of th
is PDF,
in pa
rt or in
full,
on an
y retr
ieval
syste
m,
withou
t the E
XPRESS WRITTEN PERMISSIO
N of th
e cop
yrigh
t-hold
er

National Conference on Climate Change and Agricultural Production: Adapting Crops to Climate Variability and Uncertainty, 6th–8th April, 2017
[557]
Morpho-biochemical Properties of Momordica charantia against Fruit Fly Infestation in Kharif Season of Bihar
Preeti Kumari1, R.B. Verma1, S.S. Solankey1, Randhir Kumar1, Wasim Siddiqui2, Satyendra3 and Ravi Kumar1
1Department of Horticulture (Vegetables & Floriculture) 2Department of Division of Food Science and Postharvest Technology
3Department of Plant Breeding and Genetics 1,2,3Bihar Agricultural University, Sabour–813210, Bhagalpur, India
E-mail: *[email protected]
Keywords: Bitter Gourd, Fruit Fly, Resistance, Genotypes
INTRODUCTION
The impact of global climate change on vegetable crops has recently become a subject of increasing importance. The temperature distribution has undergone a significant shift in addition to an overall increase in temperature. The perception of climate change is shaped mainly by the associated impact of changed climatic conditions on the pest and disease of vegetable crop. New pathological threats and insect have been seen in the last few years on vegetable crop under changing climate condition. Fruit fly, Bactrocera cucurbitae (Coq.) is one of the most important biotic constrains for reaping optimum yield potential of cucurbitaceous crop. The infestation of fruit fly on bitter gourd was found to be at peak during Kharif season with minimum or no infestation in summer season. Due to its peculiar life history and mode of damage it is very much difficult to manage the pest by implementing conventional tactics. Thus, it is important to search for plant characteristics that are associated with survivability and development of the pest. Plant resistance is an important component of integrated management of melon fruit fly, various biophysical traits play important role for providing fruit fly resistance in bitter gourd. Keeping the facts in to consideration an experiment was designed to explore the possibility for lowering down the infestation of fruit fly.
MATERIALS AND METHODS
The present study was conducted in a Randomized Block design with three replications during Kharif 2015 at, Bihar agricultural University, Sabour, Bhagalpur on twelve diverse bitter gourd genotype. The observations regarding Fruit length and diameter were measured form five randomly selected fruits, Fruit fly incident (%) was determined by dividing total number of infested fruits by total number of fruits and multiplying by 100, however, the Total phenol was estimated by spectrophotometrically using Folin–Ciocalteau reagent (FCR) at 765 nm and calculated as
× × × × ×
RESULTS AND DISCUSSION
The fruit length, fruit diameter, total phenol content, flavonoid content and fruit fly infestation of various genotypes of bitter gourd showed varied in the range of 3.13–22.76 cm, 2.8–4.80 cm, 82.116–345.77 mg/100g FW, 10.05–74.74 mg/100 gm FW and 16.33-44 percent, respectively. Variety Green Star Bold exhibited significantly lowest value of fruit length (3.13cm) and fruit diameter (3.20cm) and maximum value of total phenol (345.77 mg/100g FW) and flavonoid content (74.74) and showed maximum resistance
It is I
LLEGAL t
o cop
y, pri
nt or
save
any c
onten
t of th
is PDF,
in pa
rt or in
full,
on an
y retr
ieval
syste
m,
withou
t the E
XPRESS WRITTEN PERMISSIO
N of th
e cop
yrigh
t-hold
er

National Conference on Climate Change and Agricultural Production: Adapting Crops to Climate Variability and Uncertainty, 6th–8th April, 2017
[558]
against fruit fly by recording its minimum infestation, vis a versa a long fruited variety Narendra Baramasi (22.77cm length and 4.2cm width) recorded lesser value of total phenol (144.00 mg/100g FW) and flavonoid (38.46 mg/100 gm FW) contents and maximum infestation (44.01%) and showed susceptibility against fruit fly. Similar result for morphological traits for fruit fly resistance was also reported by Gogi et al. (2010) in bitter gourd and Shravan et al. (2013) in musk melon. Therefore, the results of the present study revealed that small fruited variety contains higher amount of flavonoid and phenol contents in fruits showed higher resistance, while big size fruited variety containing lesser amount of total phenol and flavonoid showed susceptibility to fruit fly infestation.
REFERENCES [1] Gogi M D, Ashfaq M D, Muhammad J A and Khan M A 2010. Bio-physical bases of antixenotic mechanism of resistance in bitter-gourd
(Momordica charantia L., cucurbitacae) against melon fruit fly, Bactrocera cucurbitae (Coquillett) (Diptera: Tephritidae). Pakistan Journal of Botany 42(2): 1251 – 1266.
[2] Shrawan M, Haldhar, Bhargava R, Choudhary B R, Pal G and Kuma S 2013. Allelochemical resistance traits of muskmelon (Cucumis melo) against the fruit fly (Bactrocera cucurbitae) in a hot arid region of India. Phytoparasitica 41: 473 – 481.
Effect of Environment against Stem Rot of Chickpea Caused by Sclerotinia sclerotiorum
Seethiya Mahajan*, Shazia Paswal, Varsha Bharti and Richa Sharma Sher-e-Kashmir University of Agricultural Science and Technology of Jammu,
Jammu–180009, India E-mail: *[email protected]
Keywords: Chickpea, Severity, Status
INTRODUCTION
Legumes are important food crops in most tropical and subtropical countries of the world and are next to cereals as a food source for humans and animals (Graham and Vance, 2003) due to its high protein content. Its cultivation has been associated with a positive impact on agro-ecosystem such as nitrogen fixation, added value in weed, insect and pathogen control, improving soil stability and increasing soil organic matter in farming systems (Uebersax, 2006).The area of chickpea in the world is 11.9 M ha with a production of 10.89 MT. The crop is also extensively grown in Bangladesh, Myanmar, Iran, Nepal, Pakistan, Syria and urkey in Asia. In Jammu and Kashmir, pulses occupy an area of about 30 ha with the production of 139 quintals and average yield of 4.63q/ha in which chickpea has a major share (Singh, 2012).Therefore, keeping in view the economic importance of the disease, socio-economic status of the crop caused by Sclerotinia stem rot, various management strategies to suppress their losses
MATERIALS AND METHODS
Major chickpea growing areas of Jammu sub-tropics (Jammu, Samba and Kathua) were surveyed during February and March 2013 to ascertain the status of disease incidence. Three fields in each location were selected for estimation of disease incidence. Five randomly selected spots of 2m × 2 m per field were randomly selected for disease incidence and the average of the 5 spots was presented as incidence per cent per field. The percent disease incidence was computed.
It is I
LLEGAL t
o cop
y, pri
nt or
save
any c
onten
t of th
is PDF,
in pa
rt or in
full,
on an
y retr
ieval
syste
m,
withou
t the E
XPRESS WRITTEN PERMISSIO
N of th
e cop
yrigh
t-hold
er

National Conference on Climate Change and Agricultural Production: Adapting Crops to Climate Variability and Uncertainty, 6th–8th April, 2017
[559]
RESULTS AND DISCUSSION
In order to determine the status of sclerotinia stem rot of chickpea a systematic survey was conducted in the three districts (Jammu, Samba and Kathua) of Jammu division during the months of February and March 2013 The disease incidence varied from 12.50-19.63 per cent in the month of February and 21.66-23.88 in the month of March in Marh block, 15.56-20.12 in the month of February and 19.12-24.50per cent in the month of March in Satwari block and 19.36-24.22 in the month of February and 25.56-27.54 per cent in the month of March in Khour block. In Jammu district, maximum disease incidence (27.54%) was recorded in laam village of Khour block and the minimum (19.12%) in Bhor camp of satwari block. The disease incidence varied from 21.88-29.99 in the month of February and 29.68-33.66 in the month of March in Vijaypur block, 23.33-29.68 in the month of February and 25.30-33.21 in the month of March in Samba block, 9.87-13.54 in the month of February and 17.66-19.52 in the month of March in Ghagwal block. In Samba district, maximum disease incidence (33.66%) was recorded from village Chhanni of vijaypur block and the minimum (14.88%) in Raguchak village of Ghagwal block. The disease incidence varied from 13.44-16.76 in the month of February and 19.88-23.33 in the month of March in Hiranagar block, 11.23-24.66 in the month of February and 19.13-28.11 in the month of March in Barnoti block, 13.35-17.56 in the month of February and 13.55-21.64 in the month of March in Kathua block. In Kathua district maximum disease incidence (28.11%) was recorded from Budhi village of Barnoti block and the minimum (11.15%) in rajbagh village of Kathua block. The overall mean disease incidence recorded in three districts (Jammu, Samba and Kathua) was 19.75 in the month of February and 23.35 in the month of March. The overall range of disease incidence for three districts was 9.87-30.83 for the month of February and 13.55-33.66 in the month of March. Maximum disease development was observed during the month of February. Survey conducted in different chickpea growing areas of Jammu, Samba and Kathua registered the prevalence of stem rot in all the locations and disease incidence varied from 09.87-30.83 per cent and 13.55 to 33.66 per cent in month of February and March respectively, thereby indicating seriousness of the problem.
REFERENCES [1] GrahamPHand Vance CP 2003. Legumes: Importance and Constraints to Greater Use. Plant Physiology131: 872-877. [2] Singh N P 2012. Project coordinated report. All India Coordinated Research Project on Chickpea 2012. G. B. Pant University of Agriculture and
Technology, Pantnagar, pp: 1-4. [3] Uebersax MA 2006. Dry Edible Beans: Indigenous Staple and Healthy Cuisine.
Genetic Diversity Analysis in Indian Mustard [Brassica juncea (L.)] for Salinity Tolerance using Microsatellite SSR Markers
Rekha Patel1*, Ram Avtar2, Geeta D. Boken1, Sumit Jangra1, Disha Kamboj1, Baldeep Singh1, Monika1, Neelam R. Yadav1 and R.C. Yadav1
1Department of Molecular Biology, Biotechnology and Bioinformatics 2Department of Genetics and Plant Breeding,
1,2CCS Haryana Agricultural University, Hissar–125001, India E-mail: *[email protected]
Keywords: Brassica, Salinity, Abiotic Stress, SSR Markers
INTRODUCTION
Indian mustard [Brassica juncea (L.) Czern & Coss.] is the major economically important oilseed crop contributing about 80% of the total rapeseed-mustard in India. India is the second largest rapeseed mustard growing country after China, occupying 20.23% area and contributing 11.7% share to the global production
It is I
LLEGAL t
o cop
y, pri
nt or
save
any c
onten
t of th
is PDF,
in pa
rt or in
full,
on an
y retr
ieval
syste
m,
withou
t the E
XPRESS WRITTEN PERMISSIO
N of th
e cop
yrigh
t-hold
er

National Conference on Climate Change and Agricultural Production: Adapting Crops to Climate Variability and Uncertainty, 6th–8th April, 2017
[560]
(Kumar, 2014). The overall production and productivity of mustard are reduced due to various biotic and abiotic stresses. Salinity is a common abiotic factor that seriously affects crop productivity by 20% (Ashraf et al., 2008). The present research was carried out using SSR markers to evaluate genetic diversity in Indian mustard genotypes for salinity tolerance.
MATERIALS AND METHODS
The parental lines (CS 52 and RH 30) and F2 progeny lines of Brassica juncea were procured from the Oilseeds Section, Department of Genetics & Plant Breeding, CCS HAU, Hisar, India. Genomic DNA was isolated from young leaves using CTAB method. Purity and concentration was checked by running DNA samples on 0.8% agarose gel electrophoresis. A total of 358 SSR markers were used for evaluating genetic variability among the Indian mustard genotypes. Data was analyzed in the form of binary data matrix and used to calculate genetic distance using NTSYS–pc software.
RESULTS AND DISCUSSION
In the present research work, genetic diversity was assessed among F2 plants of the cross RH 30× CS 52 along with both the parents in Indian mustard (Brassica juncea). Out of 358 SSR markers,41 were found polymorphic and 154 were monomorphic. A total of 225 alleles were amplified. The UPGMA based dendrogram was constructed and the F2 population was grouped in 2 major clusters and 37 sub-clusters at a similarity coefficient of 0.58 (Fig.1). The PIC (Polymorphic Information Content) value ranged from 0.427-0.730. The allelic information indicated that the genotypes used in the present study have distinct genetic patterns.It was concluded that SSR markers are the stronger tools in discriminating Brassicajuncea genotypes based on pedigree and origin.
Fig. 1: Dendrogram (NTSYS-pc) Displaying Diversity among 156 F2 Population (RH 30 × CS 52) and
Parental Genotypes using Allelic Diversity Data at 41 SSR Loci
REFERENCES [1] Kumar A 2014. Challenge of edible oils: Can Brassicas deliver? Journal of Oilseed Brassica 5: 83-86. [2] Ashraf M, Athar H R, Harris P J C and Kwon T R 2008. Some prospective strategies for improving crop salt tolerance. Advances in
Agronomy97: 45-110.
Coefficient0.51 0.58 0.66 0.73 0.81
CS52 35 69 17 34 152 110 116 14 95 15 21 90 91 118 124 40 111 78 139 84 105 123 143 144 88 148 89 4 122 113 30 48 56 67 104 136 47 70 2 3 7 24 13 25 99 65 77 38 64 106 76 98 130 121 150 5 92 8 58 126 133 142 12 120 27 75 39 46 83 32 33 96 141 100 101 102 107 59 147 108 155 119 9 132 23 71 26 153 85 129 154 10 36 11 52 53 57 87 97 149 16 31 51 61 109 146 44 135 82 134 20 151 140 22 72 41 131 50 125 43 62 63 73 74 6 138 55 60 93 68 127 137 RH30 145 81 37 115 49 86 66 103 29 54 94 114 156 79 80 128 1 42 28 112 18 45 19 117
It is I
LLEGAL t
o cop
y, pri
nt or
save
any c
onten
t of th
is PDF,
in pa
rt or in
full,
on an
y retr
ieval
syste
m,
withou
t the E
XPRESS WRITTEN PERMISSIO
N of th
e cop
yrigh
t-hold
er

National Conference on Climate Change and Agricultural Production: Adapting Crops to Climate Variability and Uncertainty, 6th–8th April, 2017
[561]
Climatic, Pathogenic and Host Conditions for Successful Induction of Ustilaginoidea virens Causing False Smut of Rice
Durga Prasad1* and R.N. Singh2
1Department of Plant Pathology, 2Directorate of Extension Education 1,2Bihar Agricultural University, Sabour–813210, India
E-mail: *[email protected]
Keywords: False Smut, Host Conditions, Rice, Ustilaginoidea virens
INTRODUCTION
A plant disease is the result of interaction between a susceptible host plant, virulent pathogen, and the environment. Changes in environmental conditions are strongly associated with differences in the level of losses caused by a disease. False smut of rice was regarded as a minor disease, occurring sporadically in certain regions, but now epidemics of the disease are also being reported. In recent years, its outbreak might be possibly due to high input cultivation, increased use of hybrid varieties, and climate change (Lu et al, 2009). The literature revealed that research on false smut has been negligible in India because of its minor importance and problem in the artificial culturing and inoculation of the pathogen (Mathew and Sharma, 2015). So, the research programme was formulated to determine the climatic, pathogenic and host conditions successful induction of false smut in rice.
MATERIALS AND METHODS
Highly susceptible genotype RH-10 grown in poly-house was inoculated at boot leaf and 50% flowering stages by smut spore (conidia) suspension (106/ml) prepared from previous, current season’s rice smut balls and pure culture. At booting stage, the spore suspension (2ml) was injected into boot leaf enclosing the young panicle during the evening hours, while at 50% flowering stage, the spore suspension was sprayed when the spikelets were open (9.30 AM-11.30AM). The inoculated plants either incubated at 16±1°C for 48 hrs prior to transfer in polyhouse or transferred directly in the polyhouse without incubation. The pot experiment was laid out in Completely Randomized Design (CRD) with four replications. Appropriate checks were maintained. High humidity (>90% during night hrs) and moderate temperature (24-28°C) were maintained during the entire period of the experiment.
RESULTS AND DISCUSSION
On the basis of two years experimental results, it was observed that among the applied methods for induction of false smut, injecting pure culture suspension in boot leaf increased the smut incidence significantly. First appearance of symptoms of smut ball was noticed after 15-20 days of inoculation. Maximum smut incidence (9 smut balls/panicle and 24 balls/hill) was obtained by injecting 2 ml pure culture suspension in boot leaf enclosing the young panicle followed by incubation at 16±1°C for 48 hrs and then maintaining under high humid (>90% during night hrs) condition up to 20-25 days at 24-28°C in poly-house. Spray of pure culture suspension at 50% flowering stage didn’t increase the smut incidence significantly. Inoculation of plants by injecting or spray of spore suspension prepared from current season’s smut balls was also not increase the smut incidence significantly. Injecting or spray of spore suspension prepared from previous season’s smut balls didn’t produce symptoms. The findings of the present investigation are revealed that injecting pure culture suspension in boot leaf enclosing the young panicle followed by incubation at low temperature and
It is I
LLEGAL t
o cop
y, pri
nt or
save
any c
onten
t of th
is PDF,
in pa
rt or in
full,
on an
y retr
ieval
syste
m,
withou
t the E
XPRESS WRITTEN PERMISSIO
N of th
e cop
yrigh
t-hold
er

National Conference on Climate Change and Agricultural Production: Adapting Crops to Climate Variability and Uncertainty, 6th–8th April, 2017
[562]
then maintaining under high humid condition up to 3-4 weeks are required for successful induction of Ustilaginoidea virens in rice.
REFERENCES [1] Lu D H, Yang X Q, Mao J H, Ye H L, Wang P, Chen Y P, He Z Q and Chen F 2009. Characterizing the pathogenicity diversity of U. virens in
hybrid rice in China. Journal of Plant Pathology 91: 443-451. [2] Mathew S B and Sharma R K 2015. Isolation technique and culture conditions of false smut pathogen (Ustilaginoidea virens) on rice. Indian
Phytopathology 68(1): 50-55.
Character Association and Component Analysis in Rice (Oryza sativa L.)
Suman Yadav1*, Pankaj Kumar2 and B.G. Suresh1 1Department of Genetics and Plant Breeding,
Sam Higginbottom Institute of Agriculture, Technology and Sciences, Allahabad–211007, India 2Department of Agricultural Biotechnology and Molecular Biology,
Dr. PCAU Pusa, Samastipur–800020, India E-mail: *[email protected]
Keywords: Rice, Genetic Variability, Correlation Coefficient, Path Analysis
INTRODUCTION
Agriculture is the lynchpin of the Indian economy and rice (Oryza sativa L.) constitute a principal source of calories for the urban and rural poor. However, self-sufficiency in rice production is declining as demand increases. Hence, there is a need of the hour that pragmatic approaches need to be taken for a quantum jump in production of the rice in India in order to meet up with higher demand. Therefore, the objective of this work is to evaluate 16 rice genotypes with the view of the selecting those traits that have better yield attributes for incorporation into hybridization programme.
MATERIALS AND METHODS
The experiment was laid out in a Randomized Block Design (RBD) with three replications in Kharif-2015 at the Department of Genetics and Plant Breeding, Allahabad school of agriculture, Sam Higginbottom Institute of Agriculture, Technology and Sciences, Allahabad, Uttar Pradesh, India. Analysis of variance to test the significance for each character. PCV, GCV, heritability, genetic advance, correlation coefficient and path analysis by Dewey and Lu (1959).
RESULTS AND DISCUSSION
The analyses of variances indicated the existence of significant differences among the genotypes studied revealing that sufficient variability is present for the different characters and selection would be rewarding (Table 1). Genotypic and Phenotypic coefficient of variation ranged from 3.91 to 28.13 among various parameters studied. High estimate of heritability were exhibited by harvest index (100%), followed by seed yield per plant (99.9%), number of spikelets per panicle (99.3%) and number of tillers per plant (86.00%). A comparison of heritability and genetic advance as percent of mean of following traits harvest index (100% & 54.50%), seed yield per plant (99.9% & 57.93%) and number of spikelets per panicle (99.3% & 52.09%) suggesting that preponderance of additive gene-action in the expression of these characters. The genotypic correlation was higher than the corresponding phenotypic correlation. Seed yield per plant exhibited
It is I
LLEGAL t
o cop
y, pri
nt or
save
any c
onten
t of th
is PDF,
in pa
rt or in
full,
on an
y retr
ieval
syste
m,
withou
t the E
XPRESS WRITTEN PERMISSIO
N of th
e cop
yrigh
t-hold
er

National Conference on Climate Change and Agricultural Production: Adapting Crops to Climate Variability and Uncertainty, 6th–8th April, 2017
[563]
significant positive association with harvest index (0.93 & 0.93), biological yield (0.56 & 0.56) and number of tillers per plant (0.39 & 0.35). Path coefficient revealed that harvest index (1.02) had highest positive direct effect on seed yield per plant, followed by biological yield per plant (0.36), panicles per plant (0.24), number of spikelets per plant (0.17), plant height (0.11) and number of tillers per plant (0.08). This may indicate that direct selection for number of spikelets per panicle, panicles per plant, biological yield per plant and harvest index would likely to be effective in increasing seed yield.
Table 1: Analysis of Variance for 13 Different Quantitative Characters in Rice Sl. No. Characters Mean Squares
Replication (d.f = 2) Treatments (d.f =14) Error (d.f = 28) 1 Days to 50% flowering 0.011 79.743** 1.075 2 Plant height 0.024 168.295** 0.969 3 Flag leaf length 0.075 297.145** 0.674 4 Flag leaf width 0.006 0.283** 0.032 5 Numbers of tillers per plant 0.184 13.310** 0.686 6 Number of panicles per plant 0.130 8.648** 0.299 7 Panicle length 0.020 5.78** 0.283 8 Number of spikelets per panicle 1.392 3669.31** 8.355 9 Days to maturity 0.888 69.367** 4.038
10 Biological yield per plant 0.024 18.835** 0.028 11 Harvest index 0.003 437.801** 0.006 12 Test weight 0.006 110.712** 0.095 13 Seed yield per plant 0.005 50.084** 0.008
** Significant at 1% probability level.
REFERENCES [1] Dewey J R and Lu K H 1959. A correlation and path coefficient analysis of components of crested wheat seed production. Agronomy Journal
51: 515-518.
Assessment of Genetic Variability, Heritability and Genetic Advance for Growth, Yield and Quality Characters in Chilli (Capsicum annuum L.)
Ashish Kumar Maurya1*, M.L. Kushwaha2, S.K. Maurya2, Santosh Kumar3 and Vikas Kumar Jain1
1Department of Horticulture, 3Department of Genetics and Plant Breeding 1,3Institute of Agricultural Sciences, BHU, Varanasi–221005, India 2Department of Vegetable Science, GBPUA&T, Pantnagar, India
E-mail: *[email protected]
Keywords: Chilli, Geneic Variability, Heritability
INTRODUCTION
Chilli (Capsicum annuum L.) one of the most commonly used commercial vegetable cum spice crops at the global level, which are sold in local market or supplied to distant places either in the form of green chilli or in the form of dried chilli as cash crop fetching a good return to the farmers. It has culinary and medicinal applications also. It is used for its pungency, colour and its spicy taste and flavour. Development of high yielding varieties requires the knowledge of existing genetic variability in the genotypes. The large spectrum of genetic variability in segregating population depends on the amount of the genetic variability among genotypes and offer better scope for selection. Assessment of variability for yield and its component characters becomes absolutely essential before planning for an appropriate breeding strategy for genetic improvement. Genetic parameters such as genotypic
It is I
LLEGAL t
o cop
y, pri
nt or
save
any c
onten
t of th
is PDF,
in pa
rt or in
full,
on an
y retr
ieval
syste
m,
withou
t the E
XPRESS WRITTEN PERMISSIO
N of th
e cop
yrigh
t-hold
er

National Conference on Climate Change and Agricultural Production: Adapting Crops to Climate Variability and Uncertainty, 6th–8th April, 2017
[564]
coefficient of variation (GCV) and phenotypic coefficient of variation (PCV) are useful in detecting the amount of variability present in the germplasm. Heritability coupled with high genetic advance would be more useful tool in predicting the resultant effect in selection of the best genotypes for yield and its attributing traits. It helps in determining the influence of environment on the expression of the genotypic and reliability of characters. With the above background information the present investigation was undertaken to study the genetic parameters among the forty eight linseed genotypes.
MATERIALS AND METHODS
The present experiment was carried out during spring summer season of the year 2014 at Vegetable Research Centre of G.B. Pant University of Agriculture and Technology, Pantnagar (Uttarakhand) with 30 genotypes of chilli in randomized block design with 3 replications. The five plants in each replication were randomly selected to recording the observation on various quantitative characters viz. number of primary branches, stem diameter, number of petals, fruit periferi width, pericarp thickness, days to 50% flowering, average fruit weight, fruit yield per plant, fruit yield per hectare, number of seed per fruit, weight of seed per fruit, weight of seed per plant, 100 seed weight, seed husk ratio, dry matter percentage and oleoresin content. The parameter of variability viz. general mean, range of variation, phenotypic coefficient of variation (PCV), genotypic coefficient of variation (GCV), heritability in broad sense and genetic advance as percentage of mean were statistically worked out to facilitate selection for various traits. Genotypic and phenotypic coefficient of variability were estimated according to the Burton and Devane (1953). The heritability in broad sense and expected genetic advance as percent of mean was worked out by the formula given by Hanson et al. (1956) and Johnson et al. (1955) respectively.
RESULTS AND DISCUSSION
Analysis of variance revealed significant difference among the genotypes for all the traits taken under study showed presence of genetic variability among all the genotypes which can be exploited through selection. The phenotypic coefficient of variation (PCV) were slightly higher than corresponding genotypic coefficient of variation (GCV) for most of the characters and the difference between GCV and PCV was narrow which indicated the presence of less environmental effect upon the characters. Higher value of genotypic coefficient of variation (GCV) and phenotypic coefficient of variation (PCV) were found for oleoresin content, seed husk ration, fruit yield, weight of seed and number of seed per fruit indication the existence of high range of genetic variability for these characters among different genotypes. This also indicates broad genetic base, less environmental influence and these traits are under the control of additive gene effects and hence, there is a good scope for further improvement of these characters through simple selection. High heritability for different traits indicated that large proportion of phenotypic variance has been attributed to genotypic variance and therefore, reliable selection could be made for these traits on the basis of phenotypic expression. High values of heritability coupled with high genetic advance (GA) as percentage of mean were obtained for oleoresin content, seed husk ratio, fruit yield per plant as well as per hectare, weight of seed per plant, number of seed per fruit, dry matter percentage, number of primary branches, pericarp thickness, fruit periferi width and 100 seed weight indicating the selection for these characters would give better response from the genotypes. High values of PCV, GCV and high heritability coupled with high genetic advance as per cent of mean suggesting predominance of additive gene action and lower influence of environmental factors in the expression of these traits with possibility for improvement through selection.
REFERENCES [1] Burton G W and Devane E H 1952. Estimating heritability in tall fescue (Festuca arundinaceae) from replicated clonal material. Agronomy
Journal 45: 478-481. [2] Hanson C H, Robinson H R and Comstock R S 1956. Biochemical studies of yield in segregating population of Korean Lespedeza. Agronomy
Journal 48: 268-272. [3] Johnson H W, Robinson H F and Comstock R E 1955. Estimates of genetic and environmental variability in soybeans. Agronomy Journal
47(7): 314-318.
It is I
LLEGAL t
o cop
y, pri
nt or
save
any c
onten
t of th
is PDF,
in pa
rt or in
full,
on an
y retr
ieval
syste
m,
withou
t the E
XPRESS WRITTEN PERMISSIO
N of th
e cop
yrigh
t-hold
er

National Conference on Climate Change and Agricultural Production: Adapting Crops to Climate Variability and Uncertainty, 6th–8th April, 2017
[565]
Population Dynamics, Crop Loss Assessment and Acaricidal Management of Yellow Mite, Polyphagotarsonemus latus (Banks)
(Acari: Tarsonemidae) Infesting Mungbean under Gangetic Basin of West Bengal
Sagarika Bhowmik*, Suvadip Saha, Choyang Sherpa and Krishna Karmakar
Department of Agricultural Entomology, Bidhan Chandra Krishi Viswavidyalaya, Mohanpur–741252, Nadia, l, India
E-mail: *[email protected]
Keywords: Mung Bean, Polyphagotarsonemus Latus, Acaricidal Management
INTRODUCTION
Mung bean (Vigna radiate (L.) Wilczek), also known as green gram, is one of the most important pulse crops grown in West Bengal. Though, the crop is grown both at pre-kharif and post-kharif seasons under Gangetic Basinof West Bengal, it is mostly grown during pre-kharif season. Being attacked by number of insect and non-insect pests, the present experiment was done to observe the population dynamics of yellow mite, to assess the crop loss due to mite infestation and to record the acaricide showing more efficacies in controlling the mite. The yellow mite, Polyphagotarsonemous latus (Banks), a severe pest of mung bean is extremely polyphagous, and is found on more than 60 plant families (Gerson, 1992).
MATERIALS AND METHODS
A field experiment was conducted to study the population dynamics of yellow mite on mungbean variety IPM-2-3, planted in a piece of land measuring 100 sq.m at District Seed Farm of Bidhan Chandra Krishi Viswavidyalaya, Kalyani, Nadia, West Bengal. The crop was sown on 7th March 2015 and the mite population was recorded at an interval of 7 days, commencing from 15DAS (days after sowing). The population per square centimeter leaf area was considered for estimating the mite population. A mean population of 30 observations has been recorded in and correlation co-efficient with abiotic parameters have been worked out. To estimate the crop loss caused due to mite infestation a pair plot technique was followed. Six plots were sprayed with diafenthiouron @ 1g/lit of water to keep the plot free from mite infestation whereas, other six plots were remain untreated. Two rounds of spray were done and then the yield was compared & the loss was estimated in respect of untreated plots yield. To determine the bio-efficacy of new acaricide molecule, against yellow mite seven acaricides were sprayed with an untreated check to work out their efficacy against yellow mite.
RESULTS AND DISCUSSION
The maximum population of broad mite was encountered in the second week of April. The mite population was recorded during the initial budding stage of the crop and declined thereafter at the end of flowering stage. It was also observed that the peak mite population significantly coincided with the pre-flowering to flowering period of the plant. The mite population is negatively but non-significantly correlated with the bright sunshine hours (r =-0.230). These findings are in general agreement with the findings of Srinivasulu et al., 2002. By comparing controlled plot with respect to uncontrolled plot, we have estimated 56.25% yield loss. It was observed that population of yellow mite in the treated plots of dicofol, diafenthiouron and spiromesifen was very low and registered 90% mite mortality. As the yellow mite is a regular and major pest
It is I
LLEGAL t
o cop
y, pri
nt or
save
any c
onten
t of th
is PDF,
in pa
rt or in
full,
on an
y retr
ieval
syste
m,
withou
t the E
XPRESS WRITTEN PERMISSIO
N of th
e cop
yrigh
t-hold
er

National Conference on Climate Change and Agricultural Production: Adapting Crops to Climate Variability and Uncertainty, 6th–8th April, 2017
[566]
of mung bean, it can be manage successfully by application of two successive round of acaricides like diafenthiouron or dicofol at 10 days interval during early reproductive stage of the crop that ensure the flowering and fruit setting of the crop giving satisfactory yield.
Fig. 1: Population Dynamics of Polyphagotarsonemus Latus (Banks) and its Relationship with the Abiotic Factors during Kharif 2015 at DSF, BCKV, Kalyani
REFERENCES [1] Gerson U 1992. Biology and control of the broad mite, Polyphagotarsollelllus latus (Banks) (Acari: Tarsonemidae). Experimental and Applied
Acarology13: 163-178. [2] Srinivasulu P, Naidu V G and Rao N V 2002. Seasonal occurance of chilli mite, Polyphagotarsonemus latus (Banks) with reference to biotic and
abiotic factors. Journal of Applied Zoological Researches13: 142-144.
Impact of Climate Change on Incidence of Insect Pests of Tomato Plant
Sudeepa Kumari Jha* and Manoj Kumar Department of Entomology,
Dr. Rajendra Prasad Central Agricultural University, Pusa, Samastipur–848125, India E-mail: *[email protected]
Keywords: Tomato, Whitefly, Leaf Curl Virus
INTRODUCTION
Tomato is an important vegetable crop and grown in warm season but extensively grown in cold season also. Tomato plant and their associated pests both are directly and indirectly influenced by climate change. The plant is attacked by a number of insect pest. Whitefly, Bemisia tabaci was earlier minor pest but now become major pest in Bihar. Both nymph and adult cause damage by sucking cell sap, normal photosynthesis is infected due to sooty mould on the honeydew and it also transmit number of viral diseases including leaf curl virus (Atwal and Dhaliwal, 2005). The study was focused on the incidence of insect pests in tomato plant under changing climate.
MATERIALS AND METHODS
The field experiments were conducted at the vegetable research farm of Dr. Rajendra Prasad Central Agricultural University during the rabi season of 2016-17 with recommended agronomical practices on tomato popular variety Avinash 2. The seedlings were transplanted in the main field in the last week of September. Whitefly population count would be taken in five randomly selected plants by observing three leaves (upper, middle and lower) randomly in each plant at five days intervals starting from 30 days after transplanting during morning hour with the help of a hand lens of 10X magnification.
0
20
40
60
80
100
20th Mar
27th Mar
30th Mar
3rd Apr 7th Apr 11th Apr
14th Apr
18th Apr
21st Apr
25th Apr
29th Apr
2nd May
5th May
9th May
16th May
mites
temp
humidity
bsh
It is I
LLEGAL t
o cop
y, pri
nt or
save
any c
onten
t of th
is PDF,
in pa
rt or in
full,
on an
y retr
ieval
syste
m,
withou
t the E
XPRESS WRITTEN PERMISSIO
N of th
e cop
yrigh
t-hold
er

National Conference on Climate Change and Agricultural Production: Adapting Crops to Climate Variability and Uncertainty, 6th–8th April, 2017
[567]
RESULTS AND DISCUSSION
Number of insect pest were observed in the experimental plot i.e. Tomato fruit borer (Helicoverpa armigera), Whitefly (Bemisia tabaci) and Serpentine leaf miner (Liriomyza trifolii). Among these insect pest populations, whitefly (Bemisia tabaci) was recorded maximum and responsible for causing heavy loss in the field condition. If the effective measurement practices were not taken when it crosses Economic Threshold Level (ETL) then loss may be more than 85%. The population was observed at about 30 days after transplanting and then the number increased gradually in the early season, reached up peak in the mid season and it maintain upto the certain interval after that population decreased continuously. At the end of cropping season very few B. tabaci observed but it remains in the field till harvesting. It was observed that the incidence of Bemisia tabaci depends on the abiotic factors i.e. temperature (max and min), rainfall (mm) and relative humidity (%). Simultaneously, weather parameters would be recorded and the data so obtained would be statically analysed.
REFERENCE [1] Atwal A S and Dhaliwal G S 2005. Agricultural Pest of South Asia and Their Management. Kalyani Publishers, Ludhiana. Pp. 216.
Incidence of Major Sucking Insect Pests of Okra, Abelmoschus esculentus (L) Moench in Relation to Weather Parameters in New
Alluvial Zone of West Bengal
S. Saha*, S. Bhowmik, A.K. Senapati and L. Laishana Devi Department of Agricultural Entomology,
Bidhan Chandra Krishi Viswavidyalaya, Mohanpur, Nadia–741252, India E-mail: *[email protected]
Keywords: Okra, Sucking Insect Pests, Correlation
INTRODUCTION
Among various vegetables, okra, Abelmoschus esculentus (L) Moench belonging is the most commonly and extensively cultivated vegetable crop in West Bengal. Several studies have been carried out on various aspects of the insect pests on okra but very poor literature was present about their incidence in new alluvial zone of West Bengal. So, the present experiment was done to records the incidence of different insect pests and their correlation with abiotic factors in okra, so that sustainable management practices can be develop to combat the pest problems.
MATERIALS AND METHODS
The field experiments were conducted at Jaguli Instructional Farm of Bidhan Chandra Krishi Viswavidyalaya, Mohanpur, West Bengal in pre-kharif and rabi seasons for two consecutive years during 2012-13 to 2013-14. Observations were made at weekly intervals for the following pests: a) leafhopper (no. /3 leaves), b) aphid (no. /3 leaves), c) whitefly (no. /3 leaves) and d) natural enemies (no. of coccinellids and Chrysoperla carnea /plant). Observations were recorded from five randomly selected plant of each plot and from each plant-top, middle and bottom leaves were considered for taking observation. Thus, observations were recorded from 15 leaves of each plot. No insecticidal application was done during the entire period and the plants were subjected to natural infestation. The data on the pest incidence were statistically analyzed for the seasonal
It is I
LLEGAL t
o cop
y, pri
nt or
save
any c
onten
t of th
is PDF,
in pa
rt or in
full,
on an
y retr
ieval
syste
m,
withou
t the E
XPRESS WRITTEN PERMISSIO
N of th
e cop
yrigh
t-hold
er

National Conference on Climate Change and Agricultural Production: Adapting Crops to Climate Variability and Uncertainty, 6th–8th April, 2017
[568]
incidence and then computed with correlation co-efficient studies to see the effect of different abiotic factors on the population of different insect pests.
RESULTS AND DISCUSSION
Studies on the incidence of major sucking insect pests of okra revealed that the leafhopper on okra population attained peak during the 3rd week of July (29th SW), aphids population attained peak during 4th week of June (25th SW) to 1st week of July (27th SW) while whitefly peak period recorded during the month of June for both the seasons. Natural enemies like coccinellids and Chrysoperla population appeared on okra during March. The simple correlation matrix of sucking pests population with weather factors like maximum and minimum temperature, morning and evening relative humidity, rainfall and sunshine hours showed same sorts of inconsistency. Leafhopper population on okra showed positive and significant correlation with minimum temperature, morning and evening relative humidity. From the present investigation, aphid incidence on okra revealed that only minimum temperature showed positive significant (r) while the rest parameters had little significant impact on the aphid population. Interaction studies between weather parameters and whiteflies population on okra showed positive significant correlation with maximum and minimum temperature.
Study of Genetic Variability and Heritability in Litchi (Litchi Chinensis Sonn.) Hybrids
Abha Kumari1*, Abhay Mankar2, Hidayatullah Mir3, Bishun Deo Prasad4 and Km Lalita5 1,2,3Department of Horticulture, (Fruit & Fruit Technology) 4Department of Molecular Biology & Genetic Engineering
1,2,3,4Bihar Agricultural University, Sabour–813210, Bhagalpur, India 5Department of Applied Plant Science, (Horticulture),
Babasaheb Bhimrao Ambedkar University, Lucknow, India E-mail: *[email protected]
Keywords: Litchi, Genetic Variation, GCV, PCV, Heritability
INTRODUCTION
Litchi is very fastidious in its climatic requirements. Litchi cultivars vary greatly in vegetative flushing pattern, flush colour, and flowering ability. There has been also wide range of confusion in the names of cultivars due to varying agro-climatic conditions, growth behaviour, fruit colour, shape and size. In India and abroad, litchi cultivar nomenclature is confusing with presence of homonyms and synonyms. Thus, the same cultivar sometimes called by different names at different locations. The confusion emanates due to derivation by translation from Cantonese and Mandarin to English. This has been identified as one of the main bottlenecks for germplasm exchange among different producing countries and germplasm collections made worldwide and its management in the species (Madhou et al. 2013). The environment profoundly influenced cultivar characteristics and this may explain why a large number of cultivars are available. There are different characteristics, which are used to identify the cultivars. The size and shape of litchi fruit are main characteristics for different cultivars. The differences in leaf size, shape, length and colour also exist. Literature indicates that different cultivars of litchi differ in their morphological characteristics depending upon the location and climatic conditions. Therefore, the present investigation was initiated to study genetic variability and heritabilityin various morphological characteristics of different litchi hybrids developed at BAU, Sabour. This study has potential to identify the litchi hybrid for the commercial cultivation in the Bihar.
It is I
LLEGAL t
o cop
y, pri
nt or
save
any c
onten
t of th
is PDF,
in pa
rt or in
full,
on an
y retr
ieval
syste
m,
withou
t the E
XPRESS WRITTEN PERMISSIO
N of th
e cop
yrigh
t-hold
er

National Conference on Climate Change and Agricultural Production: Adapting Crops to Climate Variability and Uncertainty, 6th–8th April, 2017
[569]
MATERIALS AND METHODS
Litchi (Litchi chinensis Sonn.) hybrids were evaluated to study genetic variability and heritability among the different traits using a randomized complete block design during 2015/16 at BAU, Sabour, Bihar. The mean monthly minimum and maximum temperature varied between 18.0-24.0oC and 30.0–35.0oC, respectively during the cropping season. Observations were recorded according to NBPGR descriptor. The data collected was subjected to analysis the Genotypic Coefficient of Variation (GCV) and Phenotypic Coefficient of Variation (PCV) as suggested by Burton and Devane (1953). Heritability in broad sense (h2 bs) were computed by the method suggested by Lush (1940). Genetic advance (GA) and genetic advance as percentage over mean was estimated by the method described by Lush (1949) and Johnson et al. (1955).
RESULTS AND DISCUSSION
Analysis of variance revealed highly significant variation among litchi hybrids for all the characters studied It was observed that the Genotypic Coefficient of Variation (GCV) and Phenotypic Coefficient of Variation (PCV) was of high magnitude for TSS/acid ratio. For other traits GCV was followed by leaf-blade width, aril weight and seed weight and PCV was followed by acidity, leaf-blade width and peel weight (Table 1). The magnitude of PCV was higher than GCV for all the traits, suggesting the role of environmental variance. The characters viz., fruits diameter, fruits length and fruit length width ratio exhibited very low GCV and PCV estimates suggesting the narrow range of variation for these traits. The highest estimate of heritability (b) was accompanied for leaf-blade width and high genetic advance and genetic advancement as percentage of mean for TSS/acid ratio indicating the presence of additive gene action in the expression of these traits. This suggests that such traits can be improved by direct selection.
Table 1: GCV, PCV, Heritability, Genetic Advance and Genetic Advancement as Percentage of Mean for Morphological Characters
Characters GCV PCV h² GA GA % of Mean Fruit weight 11.41 21.76 0.73 5.53 32.51 Aril weight 15.28 26.31 0.66 3.89 35.90 Seed weight 11.81 25.20 0.78 1.04 40.50 Peel weight 13.60 32.91 0.83 1.75 56.20 Fruit length 3.59 8.62 0.83 4.86 14.68 Fruit diameter 4.24 7.52 0.68 3.19 10.56 Aril% 7.49 10.63 0.50 7.00 11.00 Seed% 18.82 22.63 0.31 2.18 14.39 Peel% 13.35 24.90 0.71 6.71 36.55 Aril/Seed ratio 18.32 31.13 0.65 1.56 41.91 Fruit length/width ratio 4.21 8.13 0.73 0.13 12.24 Inflorescence length 13.17 23.72 0.69 6.96 33.81 Inflorescence width 14.41 29.83 0.77 6.44 47.11 Leaf-blade length 8.99 28.73 0.90 6.69 53.39 Leaf-blade width 9.04 34.66 0.93 2.51 66.54 Leaf length width ratio 8.22 25.88 0.90 1.67 47.94 Leaflets per leaf 15.97 13.87 0.33 0.66 9.31 TSS 6.92 10.38 0.55 2.26 11.86 Acidity 17.48 36.56 0.77 0.32 58.10 TSS/Acid ratio 16.40 43.37 0.86 32.06 76.57
REFERENCE [1] Madhou M, Normand F, Bahorun T and Hormaza J I 2013. Fingerprinting and analysis of genetic diversity of litchi (Litchichinensis Sonn.)
accessions from different germplasm collections using microsatellite markers. Tree Genetics Genomes 9(2): 387–96.
It is I
LLEGAL t
o cop
y, pri
nt or
save
any c
onten
t of th
is PDF,
in pa
rt or in
full,
on an
y retr
ieval
syste
m,
withou
t the E
XPRESS WRITTEN PERMISSIO
N of th
e cop
yrigh
t-hold
er

National Conference on Climate Change and Agricultural Production: Adapting Crops to Climate Variability and Uncertainty, 6th–8th April, 2017
[570]
Evaluation of Sesame (Sesamum indicum L.) Genotypes to the Shaded Uplands of Southern Region
Abhijatha A.1, Kuduka M.2* and Arya K.3 1,3Dept. of Plant Breeding & Genetics, College of Agriculture, Vellayani, Trivandrum, India
2Dept. of Genetics & Plant Breeding, Inst. of Agricultural Sciences, BHU, Varanasi–22100, India E-mail: *[email protected]
Keywords: Sesame, Shade tolerance, Variability, GCV, Correlation analysis
INTRODUCTION
Sesame (Sesamum indicum L., 2n=2x=26) commonly known as gingelly, til, and tila in Sanskrit, is a member of the order Tubiflorae and family Pedaliaceae. Sesame is highly valued for its cooking quality, medicinal value of its oil, high seed oil content (50-60%), protein (18-25%), calcium, phosphorous, oxalic acid and excellent qualities of the seed oil and oil cake. It is grown on residual soil moisture with low inputs, and is a good crop for rotations with an extensive tap root system. In India, sesame is cultivated in an area of 1.94 m ha with 0.755 m ton production (Gayathri, 2011). However, the average productivity of sesame in India (453 kg ha-1) is far below the average productivity in China (1127 kg ha-1) and Egypt (1211 kg ha-1). This highlights the need to enhance the productivity of the crop by developing high yielding genotypes. A thorough screening of the available germplasm for genetic variability for yield and its component traits will help in identifying elite genotypes.
MATERIALS AND METHODS
The experiment was conducted in the field of Instructional Farm, College of Agriculture, Vellayani, during rabi season, 2012-13 in a Randomized Block Design in a coconut garden. A spacing of 30 cm×15 cm between plants was adopted. The material for study comprised of thirty three genotypes of sesame collected from various research stations including the varieties from Kerala Agricultural University. Observations were recorded on five random competitive plants in each replication for following traits viz., days to 50 per cent flowering, plant height, days to maturity, number of capsules per unit length, number of primary branches per plant, number of capsules per plant, length of the capsule, number of seeds per capsule, seed yield per plant, 1000-seed weight, root length and oil content. The data recorded was processed using the appropriate statistical procedures.
RESULTS AND DISCUSSION
The analysis of variance revealed highly significant differences among the thirty three genotypes for all the traits studied except for 1000-seed weight. High GCV was shown by characters number of capsules per unit length, number of primary branches, seed yield per plant, root length and number of capsules per plant, clearly indicating that selection will be rewarding. The estimates of PCV and GCV were high for the characters number of primary branches per plant, number of capsules per plant and seed yield per plant. Low estimates of GCV for days to 50 per cent flowering, days to maturity, number of seeds per capsule, oil content and 1000-seed weight indicated limited scope for improvement of these characters through selection due to low magnitude of heritable variation. The genotypes exhibited significant variation for oil content. The highest oil content noticed was 50.16 per cent and the lowest was 45.52 per cent with a mean of 48.59 per cent. High heritability combined with high genetic advance (as per cent of mean) was observed for number of capsules per unit length, seed yield per plant, number of primary branches, plant height, root length and
It is I
LLEGAL t
o cop
y, pri
nt or
save
any c
onten
t of th
is PDF,
in pa
rt or in
full,
on an
y retr
ieval
syste
m,
withou
t the E
XPRESS WRITTEN PERMISSIO
N of th
e cop
yrigh
t-hold
er

National Conference on Climate Change and Agricultural Production: Adapting Crops to Climate Variability and Uncertainty, 6th–8th April, 2017
[571]
number of capsules per plant indicating these characters were controlled by additive gene effects and phenotypic selection for these characters is likely to be effective. Significant and positive phenotypic and genotypic correlation was recorded between seed yield and days to maturity, number of capsules per plant, length of capsule, plant height, number of primary branches per plant and number of seeds per capsule. 1000-seed weight showed significantly negative association with seed yield per plant. he path analysis revealed that seed yield per plant was positively and directly affected by the number of capsules per plant followed by number of seeds per capsule. All these had positive genotypic correlations with seed yield. The greater influence of these traits reflects their importance as seed yield components.
REFERENCE [1] Gayathri G 2011. Heterosis breeding in sesame (Sesamum indicum L.). PhD(Ag) thesis, Kerala Agricultural University, Thrissur pp: 180.
Correlation and Path Analysis of Different Parameters with Yield in Elite Genotypes of Tomato (Lycopersicon esculentum Mill.)
Pradeep Kumar Jatav1*, V.P.S. Panghal2, Bharath Kumar M.V.3, Sachin S. Chikkeri4, Harshita Singh5 and Hemant Gemeray6
1,5Division of Vegetable Science, Indian Agricultural Research Institute, New Delhi–110102, India 2,3,4,6Department of Vegetable, CCS Haryana Agricultural University, Hisar–125004, India
*E-mail: [email protected]
Keywords: Elite Genotype, Correlation, Path Coefficient, Path Analysis
INTRODUCTION
Tomato (Lycopersiconesculentum Mill.), a member of Solanaceae family, is one of the most popular vegetable crops grown widely all over the world. In fact, tomato tops the list of processed vegetables and occupies a distinct place in the realm of vegetables because of its large-scale utilization and high nutritive value, as it supplies lycopene, ascorbic acid and β-carotene (potent antioxidants), and add colour and flavour, therefore, in many countries, it is considered as poor man’s orange (Singh et al., 2004). The correlation study helps measuring the strength of a linear relationship between two characters to make the selection of superior genotypes most efficient, whereas, the path coefficient technique helps in estimating direct and indirect contribution of various components in building up the total correlation towards yield. Based on these studies, the quantum importance of individual characters is marked to facilitate the selection programme for better gains. Generally, the genetically diverse plants are expected to give high hybrid vigour. Hence, it necessitates the study of genetic divergence among the existing varieties and germplasm for the identification of parents for hybridization programme.
MATERIAL AND METHODS
An investigation entitled “Genetic variability studies in elite genotypes of tomato (Lycopersiconesculentum Mill.)” was carried out at Research Farm and Laboratory of the Department of Vegetable Science, CCS Haryana Agricultural University, Hisar during spring-summer of the year 2014-15. The twenty three genotypes studied for various traits, were planted in well prepared field with following 60x45cm spacing (row x plant) in three replications. The randomized block design (RBD) was adopted for analysis of obtained data.
It is I
LLEGAL t
o cop
y, pri
nt or
save
any c
onten
t of th
is PDF,
in pa
rt or in
full,
on an
y retr
ieval
syste
m,
withou
t the E
XPRESS WRITTEN PERMISSIO
N of th
e cop
yrigh
t-hold
er

National Conference on Climate Change and Agricultural Production: Adapting Crops to Climate Variability and Uncertainty, 6th–8th April, 2017
[572]
RESULTS AND DISCUSSION
The genotypic correlation was higher than the phenotypic correlations in the present study, indicating high heritable nature of the characters. In present study, the yield and yield contributing components were investigated and their relationship with fruit yield per plant as well as among themselves was determined using correlation analysis. The character number of fruits per plant, number of fruits per truss and number of flowers per cluster had highly significant and positive correlation with fruit yield per plant at both genotypic and phenotypic level. Therefore, selection for any of these highly associated characters with fruit yield per plant will indirectly help in the selection of plants with high yield. Hence, it is worthwhile to have genotypes with higher number of fruits per plant, number of fruits per truss and number flowers per cluster to get higher yield. Similar results were reported by Premalakshmi et al. (2014) and Meitei et al. (2014). The path coefficient analysis facilitates the partitioning of correlation coefficients into direct and indirect contribution of various characters to yield. The characters, which had positive direct effect on fruit yield, were number of branches, number of flowers per cluster, number of fruits per plant, equatorial diameter of fruit, number of locules per fruit and days to ripening, whereas, the characters, had negative direct effect on fruit yield, were plant height, days to 50% flowering, number of trusses per plant, number of fruits per truss, average fruit weight, polar diameter, total soluble solids, acidity and ascorbic acid content. The similar results were obtained by Joshi and Singh (2003).From the obtained results, it can be concluded that the genotypes studied in the present investigation exhibited a wide range of positive correlation, direct and indirect path analysis for various traits observed, which suggested ample scope of improvement those traits through selection, and inclusion of yield and quality characteristics of tomato.
REFERENCES [1] Singh J K, Singh J P, Jain S K and Joshi A 2004. Correlation and path coefficient analysis in tomato. Progressive Horticulture 36(1): 82-86. [2] Premalakshmi V S, Kumar R and Arumugam T 2014. Evaluation and genetic studies in tomato genotypes. Trends in Biosciences 7(13): 1407-
1410. [3] Meitei K M, Bora G C, Singh J and Sinha A K 2014. Morphology based genetic variability analysis and identification of important characters for
tomato. American-Eurasian Journal Agriculture and Environment Science 14(10): 1105-1111. [4] Joshi A and Singh J P 2003. Studies on genetic variability in tomato. Progressive Horticulture 2: 179-182.
Establishment of the Relationship among the Three Morphotypes of Cape Gooseberry (Physalisperuviana L.)
K.M. Lalita1*, D.H. Dwivedi2, A. Kumari3, S.K. Mauriya4 and H. Mir5
1,2Department of Applied Plant Science, (Horticulture), Babasaheb Bhimrao Ambedkar University Lucknow, India 3,5Department of Horticulture (Fruit and Fruit Technology),
Bihar Agricultural University Sabour–813210, India 4Department of Horticulture, Institute of Agricultural Sciences,
Banaras Hindu University, Varanasi–221005, India E-mail: *[email protected]
Keywords: Cape Gooseberry, Morph Types, Molecular Characterization, SDS-PAGE
INTRODUCTION
Cape gooseberry (Physalisperuviana L.) is an under exploited fruit crop, belongs to family Solanaceae and is a potential underutilized fruit crop which is grown in tropical (as perennial) and subtropical (as annual) regions of the world. Cape gooseberry is rich source of bioactive compounds therefore, it is considered as functional food.
It is I
LLEGAL t
o cop
y, pri
nt or
save
any c
onten
t of th
is PDF,
in pa
rt or in
full,
on an
y retr
ieval
syste
m,
withou
t the E
XPRESS WRITTEN PERMISSIO
N of th
e cop
yrigh
t-hold
er

National Conference on Climate Change and Agricultural Production: Adapting Crops to Climate Variability and Uncertainty, 6th–8th April, 2017
[573]
However, there are no reports related to establishing variability among variants of Cape gooseberry at the molecular level by electrophoresis separation of macro molecule of Cape gooseberry till date. Therefore the study was conducted to analyze the variability among three morphotypes of Cape gooseberry at the molecular level followed by sodium dodecyl sulfate-polyacrylamide gel electrophoresis process.
MATERIALS AND METHODS
The study was conducted in the Horticulture research laboratory of the Department of Applied Plant Science (Horticulture) at Baba Saheb Bhimrao Ambedker University, (A Central University), Vidya Vihar, Rae Bareli Road, Lucknow during 2015-16. The leaves were collected at 5th node from the cape gooseberry plants selected randomly at fruiting stage and leaf protein sample was prepared by liquid nitrogen method. The SDS PAGE (Sodium dodecyl sulfate polyacrylamide gel electrophoresis) was followed by using the chemicals like acrylamide, sodium dodecyl sulfate etc. The glass sandwich was filled with the composition of two types of gel, the separating gel and stacking gel. Analysis of the gel was done by using the two applications i.e. Adobe photoshop and Image J software.
RESULTS AND DISCUSSION
Separating gel of 12.5% and stacking gel of 4% composition was prepared and the protein samples in different concentrations were loaded on the gel. This was resolved at 50 mA during the stacking gel and 100 mA during the separating gel. The protein pattern of the three variants (Morphotype1, Morphotype2, Morphotype3) when studied under electrophoresis resulted different kDa, the density of bands was found different. It indicates that at particular molecular weight the level of a particular protein of a morphotype may increases or decreases which is indirectly governed by the activity of m-RNA. The variation also revealed that at different doses of protein the level of protein among three morph types were found different.
Table 1: Density of Bands at 20 and 40 µg of Protein Sample Extracted from Cape Gooseberry (PhysalisperuvianaL.) in Quantitative Densitometer Recorded at different kDa (Kilodalton) At 20 µg At 40 µg
Molecular Weight Morphotype 1 Morphotype 2 Morphotype 3 Morphotype 1 Morphotype 2 Morphotype 3 72kDa=72000g/mole 48046.158 43427.016 37106.673 41354.238, 30560.388 23894.945 42kDa=42000g/mole 47458.664 40293.137 34391.380 39429.723 42465.673 51031.815 31kDa=31000g/mole 53533.007 23260.359 34852.593 42273.258 41414.451 41145.128 24kDa=24000g/mole 57374.421 38003.744 54465.401 51421.116 55418.338 49714.158
REFERENCE [1] ZukasA A and Breksa III A P 2005.Extraction methods for analysis of Citrus leaf proteins by two-dimensional gel electrophoresis. USA Journal of
Chromatography1078: 201–205.
Impact of Climate Change on Pest and Disease Free Vegetable Cultivation in Bihar
Shyam Babu Sah1*, J.N. Srivastwa1, T. Saha2, R.N. Gupta2, S.N. Ray2 and Rajesh Kumar1
1Bhola Paswan Shastri Agricultural College, Purnea–854302, India 2Bihar Agricultural College, BAU, Sabour–813210, India
E-mail: *[email protected]
INTRODUCTION
India is second largest producer of vegetables in world after China. It produced about 167million tonnes vegetable from about 9.5 million ha of land during the year 2014–15. Bihar ranks third among all the states
It is I
LLEGAL t
o cop
y, pri
nt or
save
any c
onten
t of th
is PDF,
in pa
rt or in
full,
on an
y retr
ieval
syste
m,
withou
t the E
XPRESS WRITTEN PERMISSIO
N of th
e cop
yrigh
t-hold
er

National Conference on Climate Change and Agricultural Production: Adapting Crops to Climate Variability and Uncertainty, 6th–8th April, 2017
[574]
in terms of vegetable production in India, which produces about 15.63 million tonnes of vegetables from 0.87 million ha land. Agriculture has a two way relationship with climate change. One, where the activities related to agriculture adds Green House Gases (GHG’ in the atmosphere) and other where climatic variations impact the agriculture sector tremendously. Climate change is supposed to bring changes in availability of natural resources like Scarcity of water, rise in temperature, increase in co2,erraticrainfall etc which may affect vegetable production by emerging a new pest. Climate change will also have an impact on pest and pathogens, and may increase exposure to abiotic stresses such as drought and heat also. Plant diseases are malfunctions caused by plant pathogenic organisms and those caused by other factors (the so called non infectious diseases) are termed disorder (Mehrotra, 2003). The malfunction result in adverse changes in the form, function, or integrity of the plant and may lead to partial impairment or death of plant parts or of the entire plant (Agrios, 2005). Three basic elements are required for the development of an infectious disease: a susceptible host, a virulent pathogen and favorable weather conditions for infection, host colonization and propagule production. If any of the three factors are altered, the progress of any one disease can change. Although interactions among the three factors must be matched, weather is an important variable due to its dynamic behavior. The Intergovernmental Panel on Climate Change (IPCC), which was jointly established by the World Meteorological Organization (WMO) and the United Nations Environment Program (UNEP) in 1988, has responsibility for assessing information relevant to climate change and summarizing this information for policy makers and the public. As described in the report of the Intergovernmental Panel on Climate Change (IPCC, 2007), overwhelming scientific evidence suggests that the planet is experiencing climate change. This is a singular problem of global importance. The greatest effects of climate change may be observed over long periods of time and involve complex interactions between natural (ecological and climatic facts), social, economical and political processes. In the past 150 years, the average surface temperature has increased by 0.76°C (IPCC, 2007) and could increase from 2.4 to 6.4°C in the period of 2090-2099 relative to 1980 to 1999. High atmospheric CO2 concentrations, temperatures and changes in precipitation patterns as well as the frequency of extreme weather phenomena will significantly affect crop grow and production, and therefore the presence of diseases will be altered under these conditions. Climate change will affect each region differently, and its impacts will be observed gradually. Understanding the potential effects of changes in agriculture, pests and diseases on plants is an important issue. Several analyses on the effects of climate change on agriculture have been conducted at the regional and global level. The direct effects of climate change on individual plants and plant communities may occur in the absence of pathogens, but may also bring about changes in plants that will affect their interactions with pathogens. Changes in plant architecture may affect microclimate and thus risks of infection. In general, increased plant density will tend to increase leaf surface wetness and leaf surface wetness duration, and so make infection by foliar pathogens more likely. But, of course, how abiotic stress factors interact to affect plants will be key to understanding climate change effects on plants; abiotic stress such as heat and drought may contribute to plant susceptibility to pathogens or it may induce general defense pathways which increase resistance.Sometimes due to changes of climate minor pests become major pests and causes damage to vegetables. It is therefore important that plant breeder should identify the most important constrains on production on particular crop and region. The challenges in many area of the state will be to produce more vegetables with limited quantity of water. Vegetables are most vulnerable to climate change due to their exact climatic requirement for various physiological processes and short time duration crop. Due to high temperature physiological disorder will be more pronounced. To sustain the productivity, modification of present cultural practices and greater use of greenhouse technology are some of the solutions to minimize the effect of climatic change. Development of new cultivars of tolerant to high temperature, resistant to pest and diseases, short duration and producing good yield under stress conditions, as well as adoption of hi–tech horticulture and judicious management of natural resources will be the main strategies to meet this challenge.
REFERENCES [1] Agrios, GN 2005. Plant Pathology. 5th Ed. Elsevier, USA. pp: 922 [2] IPCC. 2007. Climate change 2007: Synthesis Report. Contribution of Working Group I, II and III to the Fourth Assessment Report of the
Intergovernmental Panel on Climate Change. Pachauri RK, Reisinger A, (Eds) IPCC, Geneva, Switzerland [3] Mehrotra, RS, Aggarwal, A 2003. Plant Pathology. Tata McGraw-Hill Publishing Company. New Delhi. Second Edition.
It is I
LLEGAL t
o cop
y, pri
nt or
save
any c
onten
t of th
is PDF,
in pa
rt or in
full,
on an
y retr
ieval
syste
m,
withou
t the E
XPRESS WRITTEN PERMISSIO
N of th
e cop
yrigh
t-hold
er

National Conference on Climate Change and Agricultural Production: Adapting Crops to Climate Variability and Uncertainty, 6th–8th April, 2017
[575]
Impact of Climate Change on Virus-vector Relationships
Monika Karn*, Mohammad Ansar and A. Srinivasaraghavan Department of Plant Pathology, Bihar Agricultural University, Sabour–813210, India
E-mail: *[email protected]
Keywords: Climate Change, Virus-vector Relationship, Aphid, Whitefly
INTRODUCTION
Climate and weather can substantially influence the development and distribution of insects. Anthropogenically induced climatic change arising from increasing levels of atmospheric greenhouse gases would, likely to have a significant impact on agricultural insect pests. Virus diseases that have emerged in the past two decades causing losses worldwide and range from minor effects to complete failure and devastation. Plant infecting viruses operate in intimate association with their hosts and vectors. In the context of climate change, temperature directly affects insects and CO2(Carbon dioxide) affects them through host plants thereby affecting the spread of plant viruses (Prasannakumar et al. 2012). In case of virus infection, the efficiency of aphid transmission to host plants was influenced by temperature, both in terms of acquisition of the virus and establishment of the infection. The phloem-sucking aphid and whitefly insects had species-specific responses to elevated CO2 because of complex interactions that occur in the phloem sieve elements in the plants. Some aphid species, such as cotton aphid (Aphis gossypii) and wheat aphid (Sitobion avenae) were consider to represent the only feeding guild to respond positively to elevated CO2 conditions. Although whitefly (Bemisia tabaci) a major vector of Tomato Yellow Leaf Curl Virus, had neutral response to elevated CO2, the plants become less vulnerable to the virus infection under elevated CO2 (Sun et al. 2011). Moreover, small alteration in average temperatures shifts in the distribution and abundance of arthropods vector. Aphid vector of virus react strongly to small changes in mean temperature. An additional five generation of aphids/year is predicted in temperate zones from a warming of 2oC (Yamamura et al. 1998). The risk of serious epidemics of aphid-transmitted viruses therefore increases as their populations and activities increases. Even it happens in case of whitefly, for that 25-28oC is optimal for development and much shorter adult to adult generation times occur at high (31–33oC) than low (17oC) temperatures. Thus, it will increase the risk of damaging epidemics of viruses transmitted by whitefly in formerly cooler regions. Increased mean temperature can also increase thrips vector populations by hastening their development rates, leading to more generations/year (Jones & Barbetti, 2012). Similarly rising temperatures (24-30oC) are likely favour occurrence of severe epidemics of hopper transmitted viruses in areas previously unaffected by them whereas 24oC is threshold for their development (Reynaud et al. 2008). An increasing frequency of heavy rainfall would wash insect vectors such as aphids, thrips and whiteflies off foliage, thereby slowing virus epidemics by diminishing vector populations. Hence, relationships with rainfall and relative humidity were less consistent. Thus, a contigent planning for the effective control of vectors in areas where, such viruses transmitted by vectors not reported earlier is necessary.
REFERENCES [1] Jones R A C and Barbetti M J 2012. Influence of climate change on plant disease infections and epidemics caused by viruses and bacteria. Plant
Sciences 73-83. [2] Prasannakumar N R, Chander S and Madanpal M 2012. Assesment of impact of climate change with reference to elevated CO2 on rice brown
planthopper, Nilparvata lugens (Stal.) and crop yield. Current Sciences103(10): 1201-1205. [3] Reynaud B, Delatte H, Peterschmitt M, and Fargette D 2009. Effects of temperature increase on the epidemiology of three major vector-borne
viruses. European Journal of Plant Pathology123: 269-80. [4] Sun Y, Yin J, Chen F, Wu G and Ge F 2011. How does atmospheric elevated CO2 affect crop pests and their natural enemies? Case history
from China. Insect Science 18(4): 393-400. [5] Yamamura K and Kiritani K 1998. A simple method to estimate the potential increase in the number of generations under global warming in
temperate zones. Applied Entomology and Zoology 33: 289-98.
It is I
LLEGAL t
o cop
y, pri
nt or
save
any c
onten
t of th
is PDF,
in pa
rt or in
full,
on an
y retr
ieval
syste
m,
withou
t the E
XPRESS WRITTEN PERMISSIO
N of th
e cop
yrigh
t-hold
er

National Conference on Climate Change and Agricultural Production: Adapting Crops to Climate Variability and Uncertainty, 6th–8th April, 2017
[576]
Ovipositional Behaviour of Pod Sucking Bug, Clavigralla Gibbosa Spinolaon Pigeonpea
Chitralekha1*, Roshan Lal1, Tarun Verma1 and Prince2 1Department of Entomology, 2Department of Horticulture
1,2CCS Haryana Agricultural University, Hisar–125004, India E-mail: *[email protected]
Keywords: Clavigralla Gibbosa, Ovipositional Behaviour, Pigeonpea
INTRODUCTION
Pigeonpea or red gram [Cajanus cajan (L.) Millsp.] commonly known as arhar is an important multi-use shrub legume of the tropics and subtropics. It is grown in 50 countries in Asia, Africa and the Caribbean for food, fodder, fuel, rearing of lac insects, hedges, soil conservation and green manuring (Sharma, et al 2003). After Chickpea, arhar is the second most important pulse crop grown in the country. Gram pod borer (Helicoverpa armigera), arhar plume moth (Exelastis atomosa), arhar pod fly (Melanagromyza obtusa), spotted pod borer (Maruca vitrata), tur pod bug (Clavigralla gibbosa) and blister beetle (Mylabris spp.) are one of the most important constraints for low productivity of pigeonpea in India. Among the sucking bugs, tur pod bug is the most important in India (Basu and Mitra, 1978). The pod bug damage in pigeonpea was recorded from 25 to 40% (Adati et al. 2007). Both the nymphs and adults of the pest suck the cell sap from the developing grains of the green pods. In case of heavy infestations of the tender pods, they get shrivelled. Damaged seeds are dark, shrivelled, do not germinate and are not acceptable as human food.
MATERIALS AND METHODS
The studies on the ovipositional behaviour of tur pod bug were carried on pigeonpea under screen house at College of Agriculture, CCS Haryana Agricultural University from mid October 2013 to January 2014. Total six pairs of adults (one pair on each plant) were released on each variety, at flowering stage representing one replication, were placed in a screen house making six replication and their egg laying behaviour was studied. Total number of eggs laid on leaves, flower buds, flower and pods were recorded till the end of season. Newly formed pods were tagged with dates and those pods on which eggs were laid, were also tagged again with date. On the basis of number of eggs hatched, hatching per cent fertilized and unfertilized eggs were calculated. For egg laying pattern, the number of eggs laid in cluster were counted. Time of egg laying was also recorded throughout the crop season. One pair of adult were released on each plant per replication.
RESULTS AND DISCUSSION
Ovipositional behaviour of C. gibbosa on different varieties of pigeonpea: Number of eggs laid on pods in test varieties ranged from 39.33 to 67.33. Significantly maximum number of eggs were laid on variety Paras (67.33 eggs/plant) and it was statistically on par with variety Manak (64.16 eggs) and these were significantly superior and preferred by C. gibbosa than H03-41 (39.33) and UPAS 120 (57.00). The remaining two varieties were statistically on par with each other. Number of eggs on leaves ranged from 8.83 to10.00, there was no significant difference among varieties, however, maximum number of eggs were observed on the leaves of Paras and Manak (10.00 eggs) and minimum eggs were counted on H03-41 and UPAS 120 (8.83 eggs). The number of eggs laid on flowers ranged from 4.50 to 6.16, there was no significant difference in test varieties. However, the maximum eggs were observed on UPAS 120 and minimum on H03-41. In case of stem, eggs laying was zero in all varieties. The correlation studies between egg laying of C. gibbosa and pod length, flower length and leaf area (Table 1) indicates there was a positive correlation between number
It is I
LLEGAL t
o cop
y, pri
nt or
save
any c
onten
t of th
is PDF,
in pa
rt or in
full,
on an
y retr
ieval
syste
m,
withou
t the E
XPRESS WRITTEN PERMISSIO
N of th
e cop
yrigh
t-hold
er

National Conference on Climate Change and Agricultural Production: Adapting Crops to Climate Variability and Uncertainty, 6th–8th April, 2017
[577]
of eggs laid and length of pods (r = 0.0872)* in each variety while, it was negatively correlated with leaf area (r =-0.09)** as well as flower length (r =-0.034)**One pair of adults (male and female) was released per plant on each variety to record the egg laying behaviour of test insect. Most preferred part for egg laying was pod followed by leaves and flowers and no eggs were laid on stem. Most of eggs laid by female were in group. The female deposited the eggs one by one making flat group on pods.
Egg laying on different Plant Parts: Number of eggs laid on pods in test varieties ranged from 39.33 to 67.33. Significantly maximum eggs were laid on variety Paras (67.33 eggs/plant), whereas minimum in H03-41 (39.33). In case of number of eggs on leaves, it ranged from 8.83 to 10.00 and there was non significant difference in varieties, however maximum number of eggs was observed on the leaves of Paras and Manak (10.00) and minimum eggs were observed in H03-41 and UPAS 120 (8.83). The number of eggs laid on flowers ranged from 4.50 to 6.16, however the maximum eggs were observed in UPAS 120 and minimum observed on H 03-41. In case of stem, eggs laying was zero in all varieties.
Table 1: Ovipositional Behaviour of C. Gibbosa on Different Varieties of Pigeonpea Egg Laying on Different Parts of the Plant
Variety Pods Leaves Flowers Stem Paras 67.33
(8.22) 10.00 (3.31)
5.00 (2.41)
0.00 (1.00)
Manak 64.16 (7.99)
10.00 (3.31)
5.83 (2.61)
0.00 (1.00)
H03-41 39.33 (6.24)
8.83 (3.13)
4.50 (2.33)
0.00 (1.00)
UPAS 120 57.00 (7.58)
8.83 (3.13)
6.16 (2.67)
0.00 (1.00)
r value at 5% (0.872)* (-0.09)** (-0.034)** (N.S.) SEm (±) (0.43) (0.20) (0.40) C.D. (P=0.05) (1.29) (N.S.) (N.S.)
Figures in parentheses are square root transformed values * Correlation at 5%, ** Correlation at 1 %
Climate Change and Plant Disease: Positive Side of the Story
Sujata Kumari*, A Srinivasaraghavan and Mohammad Ansar Department of Plant Pathology, Bihar Agricultural University, Sabour–813210, India
E-mail: *[email protected]
INTRODUCTION
Increasing climate variability with the change in climate is recognized unequivocally. With the changing climate patterns and cropping systems, host, pathogen and favorable environment interactions are leading to diseases epidemics in a range of crops. Three essential components are required simultaneously for a disease to occur: a virulent pathogen, a susceptible host and favorable environment. The climate change phenomena will have huge impact on plant disease dynamics (Garrett et al., 2006). The impact may be positive or negative. Looking at the negative impact will differently provide an insight for contingent planning. But, several examples suggest that, climate change phenomena might also have a potential positive impact on pathogen, understanding these implications on the pathogen biology will give hints for the disease management (Grulke, 2011). The host pathogen interaction under climate change scenario will give an important phenomenon to be understood. The tobacco plants grown at increased CO2 concentrations showed the markedly decreased spread of virus. It appears that CO2 rise in the air may have some positive effects, which may likely offset the negative effects on virus infection. The impact of rising CO2 level on some fungal pathosystems is that, the delay in initial establishment of pathogen because of modifications in
It is I
LLEGAL t
o cop
y, pri
nt or
save
any c
onten
t of th
is PDF,
in pa
rt or in
full,
on an
y retr
ieval
syste
m,
withou
t the E
XPRESS WRITTEN PERMISSIO
N of th
e cop
yrigh
t-hold
er

National Conference on Climate Change and Agricultural Production: Adapting Crops to Climate Variability and Uncertainty, 6th–8th April, 2017
[578]
pathogen aggressiveness and/ or host susceptibility. E.g. reduction in the rate of primary penetration of Erysiphe graminis on barley and a lengthening of latent period in Maravalia cryptostegiae due to decrease in stomatal density increases resistance to pathogens that penetrates through stomata. In root crops such as carrot, sugar beet and radish if more carbon is stored in roots, looses from soil-borne disease of root crops may be reduced under climate change.Bacteria such as Erwinia amylovora on apple, overwinters on infected host tissue; Pseudomonas syringae pv.phaseolicola survives on host debris; vector-borne bacterial pathogens such as Erwinia stewartii, in these pathogens the primary source of inoculum and spread to their host plants in next season mainly by rain splash and insects. Therefore, the warmer drier summers expected with climate change should limit the spread of bacterial diseases. The climate scenarios in all research aimed at developing new tools and tactics for the effective management of plant disease. Disease risk analyses based on host–pathogen interactions should be performed, and research on host response and adaptation should be conducted to understand how an imminent change in the climate could affect plant diseases.
REFERENCES [1] Garrett K A, Nita M, Dewolf E D, Gomez L, and Sparks A H 2009. Plant pathogensas indicators of climate change:Observed Impacts on Planet
Earth. Elsevier, Dordrecht pp: 425-437. [2] Grulke N E 2011. The nexus of host and pathogen phenology:understanding the disease triangle with climate change. New Phytology
189: 8-11.
Variability and Character Association Analysis in Rice (Oryza sativa L.) Genotypes for Grain Yield and Yield Attributing Traits under
Agro-climatic Conditions of Allahabad
Banashri Roy1* and G.M. Lal2
1Sam Higginbottom Institute of Agriculture, Technology and Sciences, Allahabad–211007, India 2Department of Genetics and Plant Breeding, Allahabad School of Agriculture, Allahabad, India
E-mail: *[email protected]
Keywords: Correlation, GCV, PCV, Rice
INTRODUCTION
Climatological changes are predicted to have a general negative effect on plant growth leading to loss of crop productivity and thus, causing threat to future agricultural production and global food security. Therefore, it becomes important to explore the genetic variability and study the correlation of grain yield and its component traits in crops so that an effective breeding programme can be started for increased grain yield to ensure surplus food grain production. We studied 30 rice genotypes for understanding the relationship of grain yield and yield attributes.
MATERIALS AND METHODS
The study was conducted at Field Experimentation Centre of Sam Higginbottom Institute of Agriculture, Technology and Sciences (formerly known as AAIDU). 30 rice genotypes were analysed during kharif 2014 in randomized block design with three replications to study the performance, genetic variability and degree of association between grain yield and yield attributing traits in under the agro-climatic conditions of Allahabad. Data was recorded for thirteen quantitative characters and was analysed for ANOVA, coefficients of variation, heritability in broad sense, genetic advance and correlation coefficients.
It is I
LLEGAL t
o cop
y, pri
nt or
save
any c
onten
t of th
is PDF,
in pa
rt or in
full,
on an
y retr
ieval
syste
m,
withou
t the E
XPRESS WRITTEN PERMISSIO
N of th
e cop
yrigh
t-hold
er

National Conference on Climate Change and Agricultural Production: Adapting Crops to Climate Variability and Uncertainty, 6th–8th April, 2017
[579]
RESULTS AND DISCUSSION
The ANOVA indicated significant amount of differences present between the evaluated genotypes for all the characters studied. Highest GCV and PCV were observed for grain yield/hill (25.65, 27.0). Slight differences between GCV and PCV for all characters indicated little influence of environment in the expression of the characters. The heritability in broad sense and genetic advance as percent of mean were high for many traits like grain yield/hill (90.3%, 50.21%), biological yield/hill (98.3 %, 46.66%), no. of spikelets/panicle (98.9%, 43.65%), no. of panicles/hill (85.7%, 45.04%) and no. of tillers/hill (84.3%, 38.79%). indicating preponderance of additive gene action. The results of genetic variability parameters are summarised in Table1. Grain yield/hill was positively significantly associated with traits like biological yield/hill, days to 50% flowering, days to maturity, harvest index, no. of panicles/hill and no. of tillers/hill indicating that selection for these traits are effective for yield improvement (Fathelrahman et al., 2015).
Table 1: Estimates of Genetic Variability Parameters of 13 Quantitative Characters in 30 Rice Genotypes S. No. Characters Variance GCV PCV h2(bs) GA GA as % of mean
σ2g σ2p σ2e 1 Days to 50 % flowering 60.56 67.67 7.12 8.68 9.17 0.895 15.16 16.91 2 Plant height 280.97 364.36 83.39 15.45 17.59 0.771 30.32 27.94 3 Flag leaf length 38.31 42.64 4.33 19.21 20.26 0.898 12.09 37.50 4 Flag leaf width 0.04 0.06 0.01 14.08 16.15 0.760 0.37 25.23 5 No. of tillers/hill 7.81 9.26 1.46 20.51 22.34 0.843 5.28 38.79 6 No. of panicles/hill 6.67 7.78 1.11 23.61 25.50 0.857 4.93 45.04 7 Panicle length 7.59 9.39 1.80 10.89 12.11 0.808 5.10 20.17 8 No. of spikelets/panicle 1115.05 1127.68 12.63 21.31 21.43 0.989 68.40 43.65 9 Days to maturity 48.60 52.73 4.12 5.78 6.02 0.922 13.79 11.43 10 Biological yield/hill 230.25 234.17 3.92 22.84 23.03 0.983 30.99 46.66 11 Harvest index 40.74 54.33 13.60 16.86 19.47 0.750 11.38 30.07 12 Test weight 3.94 4.82 0.88 8.78 9.71 0.817 3.69 16.35 13 Grain yield/hill 40.47 44.83 4.36 25.65 27.0 0.903 12.45 50.21
σ2e = Environmental variance, σ2g = Genotypic variance, σ2p = Phenotypic variance, GCV= Genotypic Coefficient of Variation, PCV = Phenotypic Coefficient of Variation, h2(bs) = Heritability in broad sense, GA = Genetic Advance.
REFERENCE [1] Fathelrahman S A, Alsadig A I, and Dagash Y I 2015. Genetic Variability in Rice Genotypes (Oryza sativa L.) in Yield and Yield Component
under Semi-Arid Zone (Sudan). Journal of Forest Products & Industries 4(2): 21-32.
Seasonal Incidence and Distribution Pattern of Leaf Webber (Orthaga exvinacea Hamp.) on Mango
N. Kasar*, J.C. Marak, U.K. Das and S. Jha Department of Agricultural Entomology,
Bidhan Chandra Krishi Viswavidyalaya, Mohanpur, Nadia–714252, India E-mail: *[email protected]
Keywords: Seasonal Incidence, Distribution Pattern, Leaf Webber, Mango
INTRODUCTION
Among the caterpillar pest attacking mango crop, mango leaf webber is a major, serious and regular pest in intensively cropped areas causing extensive damage to the mango (Kavitha et al., 2005). Orthaga exvinacea Hampson has been recorded as pest of mango from West Bengal by Jha and Paul (2002). The infected trees are conspicuous with numerous webbed leaves and dry apical shoots. Such an attack in most cases prevents
It is I
LLEGAL t
o cop
y, pri
nt or
save
any c
onten
t of th
is PDF,
in pa
rt or in
full,
on an
y retr
ieval
syste
m,
withou
t the E
XPRESS WRITTEN PERMISSIO
N of th
e cop
yrigh
t-hold
er

National Conference on Climate Change and Agricultural Production: Adapting Crops to Climate Variability and Uncertainty, 6th–8th April, 2017
[580]
flower formation and fruit setting. Keeping this in mind, study on seasonal incidence and distribution pattern of leaf webber on mango had been taken up from 2012-14 for two consecutive years.
MATERIALS AND METHODS
Investigation was carried out at the mango orchard of Bidhan Chandra Krishi Viswavidyalaya, West Bengal during the period of April 2012 to April 2014 on mango cv. Amrapali. Observations were taken from 5 plants. Number of webs in all the 4 directions viz. North, South, West, and East were counted and recorded at weekly interval. The distribution pattern of leaf webber in different directions of the tree canopy was plotted in randomized block design (RBD). Weekly meteorological data were collected from the Department of Agrometeorology and Physics, BCKV. Correlation was done following statistical computer programme.
RESULTS AND DISCUSSION
Occurrence of leaf webber was first noticed from 32nd SMW i.e. second week of August (0.6 webs/tree and 0.45 webs/tree in 2012-13 and 2013-14 respectively) (Fig. 1). Thereafter, the population gradually started increasing and the peak incidence was observed on 52nd SMW i.e. last week of December (8.3 webs/tree and 9 webs/tree in 2012-13 and 2013-14 respectively). From then on population started declining steadily and no new web formation could be seen from April to July. More number of webs was present in West direction followed by South and lower number of webs in North and East directions. The differences between different directions of tree canopy were statistically significant. Correlation studies indicated that maximum and minimum temperature had negative and significant effect on the leaf webber population. However, relationship of morning relative humidity was significant and positive and evening relative humidity had negative correlation and non significant influence. Total rainfall had negative and significant influence on leaf webber population.
Fig. 1: Seasonal Incidence of Mango Leaf Webber during the Study of 2012–13 and 2013–14
REFERENCES [1] Kavitha K, Lakshmi K V and Anitha V 2005. Mango leaf webber, Orthaga euadrusalis Walker (Pyrallidae: Lepidoptera) in Andhara Pradesh.
Insect Environment 11(1): 39-40. [2] Jha S and Paul S K 2002. Lepidopteran pests infesting mango in West Bengal. Insect Environment 8(4): 159-160.
0
1
2
3
4
5
6
7
8
9
10
1st w
eek
2nd
wee
k 3r
d w
eek
4th
wee
k1s
t wee
k2n
d w
eek
3rd
wee
k4t
h w
eek
1st w
eek
2nd
wee
k 3r
d w
eek
4th
wee
k1s
t wee
k2n
d w
eek
3rd
wee
k4t
h w
eek
1st w
eek
2nd
wee
k 3r
d w
eek
4th
wee
k1s
t wee
k2n
d w
eek
3rd
wee
k4t
h w
eek
1st w
eek
2nd
wee
k 3r
d w
eek
4th
wee
k1s
t wee
k2n
d w
eek
3rd
wee
k4t
h w
eek
1st w
eek
2nd
wee
k 3r
d w
eek
4th
wee
k1s
t wee
k2n
d w
eek
3rd
wee
k4t
h w
eek
1st w
eek
2nd
wee
k 3r
d w
eek
4th
wee
k1s
t wee
k2n
d w
eek
3rd
wee
k4t
h w
eek
1st w
eek
2nd
wee
k 3r
d w
eek
4th
wee
k
May June July August September October November December January February March April May
Mea
n L
eaf
web
ber
pop
ula
tion
/tre
e
Standard Meteological Week
2012-13
2013-14
It is I
LLEGAL t
o cop
y, pri
nt or
save
any c
onten
t of th
is PDF,
in pa
rt or in
full,
on an
y retr
ieval
syste
m,
withou
t the E
XPRESS WRITTEN PERMISSIO
N of th
e cop
yrigh
t-hold
er

National Conference on Climate Change and Agricultural Production: Adapting Crops to Climate Variability and Uncertainty, 6th–8th April, 2017
[581]
Studies on Population Dynamics of Diamond Back Moth Plutella xylostella (L.) and Bio-Effectiveness Insecticide Chemistries and
Bio-Pesticides in Cabbage Ecosystem of West Bengal
L. Maity*, G. Padhi, A. Samanta and P.K. Sarkar Department of Agricultural Entomology,
Bidhan Chandra Krishi Viswavidyalaya, Mohanpur, Nadia–741252, India E-mail: *[email protected]
Keywords: Cabbage, DBM, Novel Insecticides, Bio-pesticides
INTRODUCTION
Cabbage, Brassica oleracea var. capitata an herbaceous plant of Family Brassicacea, is a widely cultivated vegetable throughout the world as a longstanding dietary supplement. It has numerous health benefits that have increased its popularity all over the world. In India, cabbage is cultivated over 0.245 M with an average production of 5.6 M mt and a productivity of 22.9 mt/ha out of which West Bengal contributes to about 1.9 M mt of cabbage from over 65 k ha. However, the set back to optimum cabbage production is the attack of insect pests, the most important of which is the diamond back moth (DBM), Plutella xylostella which has become a single limiting factor in the production of quality heads (Grzywaez et al., 2010). Adding to the woes is the fact that this moth has developed multifold resistance to almost all the recommended insecticides in many parts of the world and becoming increasingly difficult to control. So the time has come to relook over the bio-ecology of the pest and revise the available management options to set the best package of practices for successful management of this pest. Keeping in view the above factors the present study is based on the population dynamics of DBM and its management using novel insecticides and bio-pesticides to find the best fit in IPM package of practices.
MATERIALS AND METHODS
The field experiment to test the efficacy of novel insecticides and bio-pesticides against DBM was laid out in Randomised Block Design (RBD) with three replications for each treatment during 2013-2014 and 2014-2015. Two rounds of sprays at an interval of 15 days were imposed on coinciding with the ETL (3larvae/plant). The data on population of pest was taken as number of DBM larvae from 5 randomly selected plants from each plot. Pre-treatment count was taken 1 day before spraying which was followed by observations on pest incidence at 5th and 10th days after spraying (DAS). The population count of important predators like Coccinella septempunctata and Coccinella transversalis; and parasitized DBM larvae by Cotesia plutellae were recorded from same plants on respective dates of observation. Important larval parasitoids, Cotesiaplutellae were taken at 1 day before treatment and 7 days after treatment. Yield of cabbage was recorded from all the plots. The data thus collected were subjected to analysis of variance after necessary transformation where ever required. Population of DBM was recorded from 10 randomly selected plants of untreated plot along with meteorological data for further analysis.
RESULTS AND DISCUSSION
The incidence pattern of DBM in different standard weeks revealed that the interaction between DBM x Temp (Max), DBM x Temp (min), DBM x BSSH (hour) were all positively correlated. However, RH and total rainfall (mm) were negatively correlated. In the field, overall best performance was found in case of rynaxypyr in
It is I
LLEGAL t
o cop
y, pri
nt or
save
any c
onten
t of th
is PDF,
in pa
rt or in
full,
on an
y retr
ieval
syste
m,
withou
t the E
XPRESS WRITTEN PERMISSIO
N of th
e cop
yrigh
t-hold
er

National Conference on Climate Change and Agricultural Production: Adapting Crops to Climate Variability and Uncertainty, 6th–8th April, 2017
[582]
reducing the larval population followed by flubendiamide, spinetoram, mixed formulation of indoxacarb and novaluron, indoxacrb, novaluron, Bacillus thuringiensis and Beauveria bassiana. All the test chemistries were found to be soft on prevailing natural enemies. This information regarding population dynamics can be used to set the time of sowing so that the severity of pest attack can be avoided to some extent.
REFERENCE [1] Grzywaez B, Bunsong N, Satthaporn K, Phithamma S and Doungsa C 2010. Hymenopterans Parasitoids of Diamondback moth (Lepidoptera:
Ypeunomutidae) in Northern Thailand. Journal of Economic Entomology 98(2): 449-456.
Population Dynamics of Whitefly (Bemisia tabacci Genn) in Chilli and Screening of Chilli Genotypes against Chilli Leaf Curl Virus
Gayatri Kumari Padhi*, Labani Maity, Arup Chattopadhyay and Arunava Samanta Department of Agricultural Entomology,
Bidhan Chandra Krishi Viswavidyalaya, Mohanpur, Nadia–741252, India E-mail: *[email protected]
Keywords: Chilli, Whitefly, Chilli Leaf Curl Virus
INTRODUCTION
Chilli is considered as one of the commercial spice crop. It is the most widely used as anuniversal spice, named as wonder spice. Different varieties are cultivated for various uses like vegetable, pickles, spice and condiments. Chilli (Capsicum annuum L.), also called red pepper belongs to the genus capsicum, under the solanaceae family. It is believed to have originated in South America. About five species of Chilli have been domesticated in India. They are annuum, frutescens, chinense, baccatum and pubescens. Pungency in chilli is due to the alkaloid “capsaicin” contained in the pericarp and placenta of fruits. World Area and Production: Chilli is raised over an area of 1832 thousand hectares in the World, with a production of 2959 thousand tons. The pest profile of chilli is complex with more than 293 insect and mite species debilitating the crop in the field as well as in storage (Anon, 1987). Chilli crop is infested by many insect pests, among which, sucking pest complex viz., thrips, Scirtothrips dorsalis and mites, Polyphagotarsonemus latus and pod borers, viz, Helicoverpa armigera and Spodoptera litura are prominent (Reddy and Puttaswamy, 1989). Chilli crop is attacked by a large number of pathogens but heavy losses sre caused due to viruses.several viral diseases attack this crop and induce mild to severe mosaic, mosaic mottle,leaf curl,leaf roll,bushy stunt and necrosis symptoms. The leaf curl disease of chilli is caused by chilli leaf curl virus transmitted by viruliferous White fly (Bemisia tabacci Genn.). In India,Senanayake et al. (2006) have reported first time chilli leaf curl virus on chilli crop.The incidence of whitefly in Chilli and the role of the abiotic factors influencing the population dynamics of the same is to be studied which will give us a vivid idea.The susceptibility of the genotype of chilli towards Chilli leaf curl virus which is transmitted by Whitefly is an important study for the further breeding approaches to be carried forward.
MATERIALS AND METHODS
A field experiment was carried out in 2015-2016, at B.C.K.V., Kalyani, Nadia which included two parts-i) Studies on population dynamics of Whitefly in Chilli(Var-Bullet) in relation to the weather parameters-Chilli plots of 4 m X 3m was laid out with spacing of 60cm X 45cm and 25 days old seedlings were transplanted in the month of November. Observations on incidence of whitefly was recorded from five randomly selected and tagged plants in an interval of seven days. The correlation was worked out between incidence of whitefly and abiotic factors. ii) Screening of Chilli genotypes against Chilli Leaf Curl Virus -The experiment was laid
It is I
LLEGAL t
o cop
y, pri
nt or
save
any c
onten
t of th
is PDF,
in pa
rt or in
full,
on an
y retr
ieval
syste
m,
withou
t the E
XPRESS WRITTEN PERMISSIO
N of th
e cop
yrigh
t-hold
er

National Conference on Climate Change and Agricultural Production: Adapting Crops to Climate Variability and Uncertainty, 6th–8th April, 2017
[583]
down in RBD with plot size 4m X 3m with spacing of 60cm x 45cm. Percent disease index (PDI) of leaf curl virus was determined for all genotypes at 30days interval from transplanting up to 120 days after planting on the basis of following disease scoring scale (0–9) given by Bhutia et al. (2015) (Table 1).
Table 1: Percent Disease Index (PDI) of Leaf Curl Viruson the basis of Disease Scoring Scale (0–9) Grade Description Category
0 Leaf curl symptoms absent Immune 1 Very mild curling of 1–10% leaves Resistant 3 Curling, puckering symptoms on nearly11–25% leaves Moderately resistant 5 Curling, puckering symptoms on nearly26–50% leaves Moderately susceptible 7 Severe curling, puckering symptoms on nearly 51–75% leaves with stunting of the plants and small leaves Susceptible 9 All leaves of the plant >75% showing severe symptoms, severe stunting of plants, bushy appearance and
pronounced small leaves Highly susceptible
Final PDI (%) was calculated at 120 days after planting with the following formula:
Numerical ratings PDI = × 100
Highest grade of rating × total number of plants examined
RESULTS AND DISCUSSION
The results revealed that the incidence of Whitefly started from 46th SMW and continued upto 7th SMW with its peak in the 48th SMW and 3rd SMW and then gradually declines in the subsequent weeks. The incidence of B. tabaci was negatively correlated with rainfall and sunshine hours(rRF =-0.915 and rSS=-0.042). The PDI calculated for observed genotypes cited upon 13/CHVar-4 to have the lowest PDI followed by 13/CHVar-2
REFERENCES [1] Anonymous 1987. Progress Report. (1987). Asian Vegetable Research and Development Centre, Taiwan, pp: 77-79. [2] Bhutia N D, Seth T, Shende V D, Dutta S and Chattopadhyay A 2015. Estimation of Heterosis, dominance effect and genetic control of
freshfruit yield, quality and leaf curl disease severity traits of chilli pepper(Capsicum annuum L.) Scientia Horticulturae 182: 47-55. [3] Reddy DN Rand Puttaswamy 1983. Pest infesting chilli (Capsicum annuumL.)-in the nursery. Mysore Journal of Agricultural Sciences 17:
246-251. [4] Senanayake D M J B, Mandal B, Lodha S and Varma A 2007. First report of Chilli leaf curl virus affecting chilli in India. Plant Pathology
56: 343.
Association and Heritability Studies for Drought Tolerance at Reproductive Stage under Varied Hydrological Regimes in Rice
(Oryza Sativa L.) in Red & Lateritic Zone of West Bengal
Sudeshna Panja*, H.S. Garg, K.K. Sarkar, A. Roy Ainch, V. Mandi and C. Bhattacharya Department of Genetics & Plant Breeding,
Bidhan Chandra Krishi Viswavidyalaya, Mohanpur, Nadia–741252, India E-mail: *[email protected]
Keywords: Correlation, Stress Susceptibility Index, Drought Tolerance Efficiency
INTRODUCTION
Rice is considered the main staple food for more than 50% of the world’s population. The recent scenario of global climate change and unpredictable rainfall patterns lead to severe drought spells in rain-fed areas causing high yield decline in rainfed rice growing areas. To ensure the food security a major challenge in rice production now is to achieve the dual goal of increasing food production and saving water.
It is I
LLEGAL t
o cop
y, pri
nt or
save
any c
onten
t of th
is PDF,
in pa
rt or in
full,
on an
y retr
ieval
syste
m,
withou
t the E
XPRESS WRITTEN PERMISSIO
N of th
e cop
yrigh
t-hold
er

National Conference on Climate Change and Agricultural Production: Adapting Crops to Climate Variability and Uncertainty, 6th–8th April, 2017
[584]
MATERIALS AND METHOD
Twelve rice genotypes were planted in kharif season in the year 2013 in randomized block design (RBD) with three replications in plot size of 1m x 1m with spacing 25 x 20 cm under optimum irrigation and drought stress conditions at Red and Laterritic Zone in the district of Paschim Medinipur of West Bengal, India. The recommended agronomic practices were followed up to reproductive stage. At 50% flowering stage irrigation was withheld for 10 days in one set of experiment to impose artificial drought. Thirteen morphological characters were recorded in both hydrological regimes.
RESULTS AND DISCUSSION
The traits panicle length, panicle weight, number of filled grains per panicle, biomass yield and test weight exhibited high heritability under both control and stress conditions. Furthermore, the lowest and highest expected genetic advance in percent of mean were evaluated for spikelet fertility percentage and number of filled grains per panicle under both hydrological regimes, respectively. Under both hydrological conditions number of primary branches per panicle, number of secondary branches per panicle, spikelet fertility, number of filled grains/panicle and harvest index were found to be highly correlated with grain yield per plant consistently. The positive correlation between grain yield and filled grains per panicle, spikelet fertility percentage, test weight, biomass yield and harvest index has been also emphasized previously by many researchers (Lanceras et al., 2004; Berneir et al., 2007; Vikram et al., 2011). Higher DSI values observed for genotypes Seetabhog and IR-64 indicated that these genotypes were more prone to drought. Highest drought tolerant efficiency (DTE) with lowest DSI was observed for genotypes Dular, Jaldi Dhan 13, Heera and Kalinga III. Genotypes Dular, Jaldi Dhan 13, Heera and Kalinga III that are capable of maintaining high spikelet fertility, more filled grains per panicle and root length can be considered as suitable for improving the grain yield in rice breeding programs targeting drought.
Table 1: Genetic Variability Parameters for Twelve Differnt Characters of Twelve Rice Genotypes for Two Hydrological Regimes
Characters Mean + SE GCV PCV Heritability (Broad Sense) Genetic Advance Genetic Advance as % of Mean PW NS 2.41 + 0.04 20.71 20.82 98.95 1.02 42.44
S 2.31 + 0.03 22.11 22.16 99.58 1.05 45.45 PL NS 24.33 + 0.48 12.67 12.89 96.49 6.24 25.63
S 23.71 + 0.31 10.92 11.04 97.85 5.28 22.26 NPB NS 12.06 + 0.76 7.23 10.56 46.89 1.23 10.20
S 11.31 + 0.76 7.54 11.20 45.35 1.18 10.47 NSB NS 33.50 + 1.81 18.91 20.04 89.05 12.31 36.76
S 32.22 + 0.95 17.90 18.26 96.07 11.64 36.13 FG NS 99.64 + 4.06 28.66 29.09 97.05 57.94 58.15
S 86.31 + 2.52 31.27 31.48 98.71 55.24 64.01 UG NS 36.58 + 1.90 52.27 52.65 98.54 39.10 106.88
S 43.69 + 2.19 51.80 52.16 98.61 46.30 105.97 SF NS 73.89 + 1.34 7.39 7.72 91.62 10.76 14.57
S 67.33 + 1.33 9.45 9.76 93.81 12.69 18.85 TW NS 23.00 + 0.34 9.09 9.27 95.98 4.22 18.34
S 22.68 + 0.38 10.89 11.08 96.59 5.00 22.05 SW NS 36.97 + 0.98 23.59 23.80 98.18 17.80 48.14
S 35.95 + 0.81 21.47 21.65 98.39 15.77 43.88 BY NS 54.90 + 1.03 16.07 16.23 98.00 17.99 32.76
S 49.67 + 1.06 16.50 16.70 97.57 16.67 33.56 HI NS 0.33 + 0.01 15.32 15.88 93.07 0.10 30.45
S 0.28 + 0.01 14.82 15.84 87.63 0.08 28.58 YP NS 17.92 + 0.62 11.47 12.23 87.89 3.97 22.15
S 13.72 + 0.81 12.99 14.84 76.60 3.21 23.42
PW: Plant Weight (g) PL: Panicle Length (cm) NPB: Primary Branches NSB: Secondary Branches FG: Filled Grains/Panicle UG: Unfilled Grains/Panicle SF: Spikelet Fertility % TW: Test Weight SW: Straw Weight (g) BY: Biomass Yield (g) HI: Harvest Index YP: Yield/Plant (g)
REFERENCE [1] Bernier J, Kumar A, Venuprasad R, Spaner D and Atlin GN 2007. A large-effect QTL forgrain yield under reproductive-stage drought stress in
upland rice. Crop Science 47:507-516.
It is I
LLEGAL t
o cop
y, pri
nt or
save
any c
onten
t of th
is PDF,
in pa
rt or in
full,
on an
y retr
ieval
syste
m,
withou
t the E
XPRESS WRITTEN PERMISSIO
N of th
e cop
yrigh
t-hold
er

National Conference on Climate Change and Agricultural Production: Adapting Crops to Climate Variability and Uncertainty, 6th–8th April, 2017
[585]
Management of Sheath Blight of Rice through Integrated Application of Bio-agents, Organics and Resistance Inducing Chemicals
Durga Prasad
Department of Plant Pathology, Bihar Agricultural University, Sabour–813210, India E-mail: [email protected]
Keywords: Bio-agents, Organics, Resistance Inducing Chemicals, Rhizoctonia Solani, Sheath Blight
INTRODUCTION
Sheath blight of rice caused by Rhizoctonia solani Kuhn is a potential threat to rice cultivation causing extensive damage to the crop. Host resistance against sheath blight has not been found sofar. Fungicide application is effective, but their use is being discouraged because it is known to cause serious threat to environment, imbalance in the ecosystem and human health hazards. Eco-friendly approaches have attained importance in modern agriculture to curtail the hazards of extensive use of toxic chemicals for disease control. Soil types, pH, nutritional levels and organic amendments influence the efficacy of bio-agents for managing to sheath blight of rice (Ashraf and Sinha, 2005). Application of nutrients increased the quantity of phenols with decreased the sheath blight severity (Prasad et al., 2010). So, a field experiment was conducted to assess the effect of integrated application of bio-agents, farm yard manure, vermi-compost and resistance inducing chemicals against sheath blight of rice.
MATERIALS AND METHODS
The experiment was carried out at Bihar Agricultural University during the year 2013-14. Total 9 treatments viz., T1-basal application of combination of Trichoderma harzianum (Th) + Pseudomonas fluorescens (Pf) + Farm Yard Manure (FYM), T2-basal application of Th + Pf + vermi-compost, T3-two foliar sprays with ZnSO4 + Lime @ 0.5% at maximum tillering (MTS) and boot leaf stages (BLS), T4-two foliar sprays with Borax @ 0.2 % at MTS & BLS, T5-soil application of Th + Pf + FYM followed by foliar spray of ZnSO4 + Lime @ 0.5% at MTS, T6-soil application of Th + Pf + FYM followed by foliar spray of borax @ 0.2% at MTS, T7-two foliar sprays of Validamycin 3L @ 0.2% at MTS& BLS, T8-two foliar sprays of Tricyclazole @ 0.06% at MTS & BLS and T9-untreated control; replicated thrice with RBD were assessed against sheath blight using Pusa Basmati-1 as a test variety under natural epiphytotic during Kharif, 2013 and 2014. The observations recorded in the experiment were disease incidence, disease severity, number of tillers per hill, ten ears weight (g), 1000 grain weight (g) and yield (q/ha).
RESULTS AND DISCUSSION
On the basis of two years experimental results, it was observed that among the applied eco-friendly approaches;soil application of Th + Pf + FYM followed by foliar spray of ZnSO4 (0.5%) + Lime (0.25%) at MTS gave the highest yield (30.27 q/ha) with lowest incidence (23.83%) and severity (51.85%) of sheath blight. However, under fungicidal approach in which Validamycin 3L was sprayed twice at MTS and BLS, the yield was 31.56 q/ha with 18.50% incidence and 39.25% severity of sheath blight. The lowest yield (23.99 q/ha) with highest incidence (53.50%) and severity (96.29%) of sheath blight was observed in untreated control. Yield parameters (ten ears weight, average number of seeds per panicle and 1000 grain weight) except number of tillers/hill showed positive correlation with grain yield. More number of tillers/hill observed in treatments in which combination of bio-agents + FYM or vermi-compost applied in soil prior to transplanting comparatively treatments with no application of combination of bio-agents + FYM or vermi-
It is I
LLEGAL t
o cop
y, pri
nt or
save
any c
onten
t of th
is PDF,
in pa
rt or in
full,
on an
y retr
ieval
syste
m,
withou
t the E
XPRESS WRITTEN PERMISSIO
N of th
e cop
yrigh
t-hold
er

National Conference on Climate Change and Agricultural Production: Adapting Crops to Climate Variability and Uncertainty, 6th–8th April, 2017
[586]
compost in soil. The eco-friendly approach i.e. soil application of Trichoderma harzianum + Pseudomonas fluorescens + Farm Yard Manure prior to transplanting followed by foliar spray of ZnSO4 (0.5%) + lime (0.25%) at maximum tillering stage, can manage the sheath blight of rice significantly without hazards to health or environment.
REFERENCES [1] Ashraf A K and Sinha A P 2005. Influence of soil and nutritional factors on the effectivity of Trichoderma harzianum against sheath blight
of rice. Indian Phytopathology 58: 276-281 [2] Prasad D, Singh R, and Singh A 2010. Management of sheath blight of rice with integrated nutrients. Indian Phytopathology 63:11–15.
Effect of Weed Management and Nitrogen on Weed Dynamics and Yield of Rice under Aerobic Condition
Neha Nandan and D.K. Roy* Dr. Rajendra Prasad Central Agricultural University, Pusa–848125, India
E-mail: *[email protected]
Keywords: Aerobic Rice, Weed Management, Nitrogen Management
INTRODUCTION
In Bihar, Rice is cultivated on 3.29 million ha area with the production of 4.99 million ton and the productivity is 14.86 q/ha (Agricultural statistics at a glance, 2014). Transplanted rice requires a large amount of water and labour. Puddling also effects soil health due to dispersion of soil particles and also makes soil compact, making tillage operation difficult for succeeding crop. So, alternative to transplanting could be Aerobic rice because it requires less water, less labour and capital. Aerobic rice system is subject to much higher weed pressure than conventional puddled transplanted system (Rao et al., 2007) in which weeds are suppressed by standing water. Weeds are the most severe constraints and timely weed management is crucial for increasing the productivity of rice under aerobic condition. Nitrogen is one of the yield limiting nutrients affecting growth and quality in rice systems. Thus N and weeds are the two important factors that influence the productivity of rice under aerobic condition.
MATERIALS AND METHODS
A field experiment was conducted duringkharif (2016) to evaluate the effect of weed management and nitrogen on weed dynamics and yield of rice under aerobic condition at crop research centre, Dr. Rajendra Prasad Central Agricultural Univesity, Pusa in Split plot Design replicated thrice during Kharif season of 2016. The variety used was Abhishek. The soil of the experimental plot was sandy loam having pH 8.4, organic carbon 0.43%, Low in available nitrogen (209 kg/ha), phosphorus (20.8 kg P2O5/ha) and potassium (116.4 kg K2O/ha). The recommended dose of fertilizers was 120-60-40 kg N-P2O5-K2O/ha. However, the nitrogen was applied as per treatment. The half of Nitrogen and full dose of Phosphorus and Potassium were applied as basal and remaining dose of Nitrogen was applied in two equal splits at active tillering and panicle initiation stages respectively. Herbicides were applied with the help of Knapsack sprayer fitted with flat fan nozzle. Data were recorded on weeds, yield and economics of rice crop.
RESULTS AND DISCUSSION
The results revealed that the lowest weed population (11.12 /m2) and weed dry weight (24.91 g/m2) were recorded in 160 kg N/ha which were significantly superior over rest of the treatments in main plots and the
It is I
LLEGAL t
o cop
y, pri
nt or
save
any c
onten
t of th
is PDF,
in pa
rt or in
full,
on an
y retr
ieval
syste
m,
withou
t the E
XPRESS WRITTEN PERMISSIO
N of th
e cop
yrigh
t-hold
er

National Conference on Climate Change and Agricultural Production: Adapting Crops to Climate Variability and Uncertainty, 6th–8th April, 2017
[587]
lowest weed population (7.89 /m2) and weed dry weight (18.25 g/m2) were recorded in weed free treatment (3 hand weedings at 20, 40,60 DAS) which were significantly superior over rest of the treatments in sub plots. Among the different herbicide treatments, the lowest weed population (8.90 /m2) and weed dry weight (21.18 g/m2) were recorded in Pendimethalin 1000 g/ ha (PE) + Pyrazosulfuron 25 g + Bispyribac-sodium 25g (tank mix) (20 DAS) which were significantly superior over rest of the treatments in sub plots. The highest grain yield of rice (3.62 t/ha) was recorded by the treatment 160 kg N/ha which was statistically at par with 140 kg N/ha (3.40 t/ha) in main plots and the highest grain yield of rice (3.91 t/ha) was recorded by weed free treatment (3 hand weedings at 20, 40,60 DAS) which was significantly superior over rest of the treatments except Pendimethalin 1000 g/ ha (PE ) + Pyrazosulfuron 25 g + Bispyribac-sodium 25g (tank mix) (20 DAS) treatment (3.75 t/ha) which was statistically at par with weed free treatment. The highest weed control efficiency (70.81 %) was recorded under the weed free treatment which was closely followed by Pendimethalin 1000 g/ ha (PE ) + Pyrazosulfuron 25 g + Bispyribac-sodium 25g (tank mix) (20 DAS) (66.13%). There were not any phytotoxic effects on rice crop. The highest gross return (Rs 60,672/ha) was obtained by 160 kg N/ha which was statistically at par with 140 kg N/ha (Rs 56,719/ha) in main plots and the highest gross return (Rs 65,277/ha) was obtained by weed free treatment which was significantly superior over rest of the treatments and found statistically at par with Pendimethalin 1000 g/ ha (PE ) + Pyrazosulfuron 25 g + Bispyribac-sodium 25g (tank mix) (20 DAS) treatment (Rs 62,621/ha) in sub plot treatments. The highest net return (Rs 31,644/ha) was recorded by the treatment 160 kg N/ha which was statistically at par with 140 kg N/ha (Rs 27,989/ha) in main plots. However, the highest net return (Rs 34,338/ha) was recorded by the treatment Pendimethalin 1000 g / ha (PE ) + Pyrazosulfuron 25 g + Bispyribac-sodium 25g (tank mix) (20 DAS) which was statistically at par with Pyrazosulfuron 25 g + Bispyribac-sodium 25g (tank mix) (20 DAS) (Rs 34,058/ha) and Bispyribac-sodium 25 g/ha ( 20 DAS ) (Rs 32,445/ha The highest B:C ratio (2.12) was also recorded by 160 kg N/ha treatment which was statistically at par with 140 kg N/ha (2.00) in main plots. in sub plots, the highest B:C ratio (2.27) was recorded by Pyrazosulfuron 25 g + Bispyribac-sodium 25g (tank mix) (20 DAS) which was statistically at par with Bispyribac-sodium 25 g/ha ( 20 DAS ) (2.25) and Pendimethalin 1000 g / ha (PE ) + Pyrazosulfuron 25 g + Bispyribac-sodium 25g (tank mix) (20 DAS) (2.21) in sub plot treatments.
REFERENCES [1] Agricultural Statistics at a Glance 2014. (4th advanced estimate) [2] Rao A N, Jounshon D E, Prasad B, Ladha J K and Mortimer A M 2007. Weed management in direct seeded rice Advance in Agronomy
93:153-255.
Cultural and Physiological Characters of Curvularia lunata Causal Agent of Leaf Spot in Maize
Kotramma C. Adaangadi1*, S.I. Harlapur2, and Basamma R. Hadimani2 1Regional Research Station, S.D. Agricultural University, Bhachau–370140, India
2Department of Plant Pathology, University of Agricultural Sciences, Dharwad–580006 E-mail: *[email protected]
Keywords: Curvularia Lunata, Maize, Media, Temperature, pH
INTRODUCTION
Maize (Zea mays L.) is one of the important cereal crops in the world agricultural economy as food, feed and energy source grown in more than 160 countries in tropical, sub-tropical and temperate regions. Maize is
It is I
LLEGAL t
o cop
y, pri
nt or
save
any c
onten
t of th
is PDF,
in pa
rt or in
full,
on an
y retr
ieval
syste
m,
withou
t the E
XPRESS WRITTEN PERMISSIO
N of th
e cop
yrigh
t-hold
er

National Conference on Climate Change and Agricultural Production: Adapting Crops to Climate Variability and Uncertainty, 6th–8th April, 2017
[588]
being plagued by an array of diseases which include the leaf spot of maize caused by Curvularia lunata. This causes significant damage to maize up to 60% due to great loss of photosynthetic area of the crop. Keeping in view of the destructive nature of the disease, it is necessary knowing the impact of change in temperature, pH and suitable media required for the growth and sporulation of the fungus, hence the present investigation was under taken.
MATERIALS AND METHODS
The study was conducted at department of Plant Pathology, University of Agricultural Sciences, Dharwad, Karnataka, during the year 2014-2015.
Cultural Studies: The first experiment was conducted on growth phase to ascertain the number of days required for maximum growth of the fungus by monitoring the dry mycelial weight. Studies were carried out at 3, 5, 7, 9, 11, 13, 15, 17, 19, 21, 23, 25, 27, 29 and 31 days after inoculation. Cultural studies were carried outon nine different solid and liquid media. The composition and preparation of the different media were obtained from Ainsworth and Bisby’s Dictionary of the fungi (Hawksworth et al., 1983). Then cultural characters such as colony diameter, colony color, type of margin and sporulation were also recorded.
Physiological Studies: Effect of different temperature and pH levels were studied. The growth of C. lunata was tested at 10, 15, 20, 25, 30, 35, 40 and 45C by using the best media which is obtained through cultural studies. Curvularia lunata was grown on 30 ml potato dextrose broth with selected pH range of 5.0, 5.5, 6.0, 6.5, 7.0, 7.5 8.0, 8.5 and 9. The pH levels were adjusted by adding 0.1 N alkali (NaOH) or acid (HCl).
RESULTS AND DISCUSSION
The maximum dry mycelial weight of 268.74 mg was recorded on the seventeenth day and it was considered as the optimum period for growth of the fungus. Studies on growth of the fungus on different solid media tested revealed that, potato dextrose agar and Richards agar (90.00 mm) were found to be the best. The least growth (27.00 mm) was observed on V-8 juice agar. The excellent sporulation was found in corn meal agar and potato dextrose agar. Among the different liquid media tested potato dextrose medium recorded the maximum dry mycelial weight (289.00 mg) and least was in V-8 juice medium (168.33 mg). Among the different temperatures tested on potato dextrose agar, maximum colony diameter of the fungus was recorded at 25C and 30C (90.00 mm) while no growth was observed at 45C. On the potato dextrose broth maximum dry mycelial weight was recorded at 30C. No growth of the fungus was observed at 40C and beyond. Among the different pH tested, C. lunata grew well at 6.0 and 5.5 pH (recorded the highest dry mycelial weight) and least was at pH 8 and 8.5. From the studies it can be concluded that for better growth with maximum sporulation of C. lunata potato dextrose agar can be used. The temperature range of 25C to 30C and soil pH ranged from 5.5–6.0 were found suitable for growth of the fungus, these favorable conditions can cause the maximum disease severity.
REFERENCE [1] Hawksworth D L, Sutton B S and Ainsworth G C 1983 Ainsworth and Bisby’s dictionary of fungi, VII Eds. Commonwealth Mycological
Institution, Kew, Surrey, England pp: 445.
It is I
LLEGAL t
o cop
y, pri
nt or
save
any c
onten
t of th
is PDF,
in pa
rt or in
full,
on an
y retr
ieval
syste
m,
withou
t the E
XPRESS WRITTEN PERMISSIO
N of th
e cop
yrigh
t-hold
er

National Conference on Climate Change and Agricultural Production: Adapting Crops to Climate Variability and Uncertainty, 6th–8th April, 2017
[589]
Gamma Irradiation Enhances Tolerance to Biotic Stresses in Rice (Oryza sativa L.)
Bishun Deo Prasad1*, Pankaj Kumar2, Abhijeet Ghatak2, Sangita Sahni2, Sonam Kumari1, Awadhesh Kumar Pal1 and P.K. Singh1
1Department of Molecular Biology and Genetic Engineering, 2Department of Plant Pathology 1,2Bihar Agricultural University, Sabour, Bhagalpur–813210, India
3Department of Plant Pathology, Tirhut College of Agriculture, Dholi–843121, India E-mail: *[email protected]
Keywords: Biotic Stress, Rice, Gamma Irradiation
INTRODUCTION
A large fraction of loss in rice occurs due to diseases and insect-pests contributing up to 18% damage and therefore imposes additional pressure on rice production (Mahlein et al. 2012). The continuous breeding for developing new varieties for specific trait(s) led narrow genetic bases in rice. Moreover, genetically engineered crops need to pass through biosafety regulation for their commercial cultivation. Induced mutations have been successfully used to induce variability to create biotic stress tolerance in different crops including rice. The current study has been carried out with gamma irradiation as mutagen to evaluate the effect of different doses of gamma-ray exposure on response of diseases and insect-pests in a lowland rice variety Rajendra Mahsuri-1.
MATERIALS AND METHODS
One hundred (100 g) gram seeds of Rajendra Mahsuri-1, a mega rice variety of Bihar, India, were subjected to gamma irradiation (60Co radiation sources) doses 350Gy and 450Gy. The irradiation was undertaken at the Bhabha Atomic Research Centre (BARC), Trombe, Mumbai, India. Non irradiated seeds were used as controls. The M2 rice lines were evaluated for occurrence of disease and insect injury under field condition in the farm of Bihar Agricultural College, Sabour, Bhagalpur, Bihar, India. Observations were made for three fungal diseases (blast: leaf blast and panicle blast, false smut and brown spot), one bacterial disease (bacterial leaf blight) and one insect problem (yellow stem borer). Both for leaf blast and brown spot, when apparent disease severities varied between the younger and the older leaves, the disease was quantified as the % diseased leaf area (DLA) on flag, flag-1, and flag-2. Disease index (Dinx) of various diseases was calculated according to formula give below:
where Ni = number of panicles under different classes, Vi = class value, Vmax = maximum class.
Susceptible varieties to stem borer and different diseases considered in this investigation and the non irradiated Rajendra Mahsuri-1 (control) were planted separately to understand presence of active stem borer and infective propagule in the experimental area.
Dinx =
× 10 Σ(Ni×Vi)
ΣNi×Vmax
It is I
LLEGAL t
o cop
y, pri
nt or
save
any c
onten
t of th
is PDF,
in pa
rt or in
full,
on an
y retr
ieval
syste
m,
withou
t the E
XPRESS WRITTEN PERMISSIO
N of th
e cop
yrigh
t-hold
er
National Conference on Climate Change and Agricultural Production: Adapting Crops to Climate Variability and Uncertainty, 6th–8th April, 2017
[590]
RESULTS AND DISCUSSION
In the present investigation, bacterial leaf blight incidence was found approx. 1.8 times higher in 450Gy-compared with 350Gy-treated mutant lines. A wide variation in intensity of bacterial leaf blight disease was recorded in the entries tested. In early maturing plants Dinx was significantly higher (P< 0.01) in 450Gy for leaf blast. However, leaf blast infection in plants with fine grains was recorded only in 450Gy. Limited leaf blast intensity was observed on some of the mutant lines, clearly demonstrating that irradiation made the rest entries resistance to leaf blast. Thus it is evident that levels of irradiation may influence the disease resistance and could be utilized for development of rice variety resistant to leaf blast. None of the early maturing plants were infected by panicle blast whereas the fine grain entries treated with 450Gy were found infected by panicle blast. Brown spot disease was severe in both 350Gy (20.2 %) but 450Gy (22.9 %), and varied insignificantly (P> 0.01). False smut had higher Dinx; however, the difference was not significant between the radiation levels (P> 0.01). Significantly higher (P< 0.01) insect injury index was accomplished in 350Gy irradiated entries. The overall impression of disease was measured on susceptible entries and compared to that of the test entry. The observation of foliar diseases taken for disease incidence and Dinx revealed close association with the radiation levels (350Gy: R2=0.99 and 450Gy: R2=0.96). M2 mutants producing fine grain had higher biotic stress (except for bacterial leaf blight) at higher dose of gamma rays. The information generated could be useful in breeding programme for rice improvement.
REFERENCE [1] Mahlein A K, Oerke E C, Steiner U and Dehne HW 2012. Recent advances in sensing plant diseases for precision crop protection. European
Journal of Plant Pathology 133(1): 197–209.
Studies on Somatic Embryogenesis from Stem Internodes in Lentil (Lens culinaris Medik)
Abhilasha Sinha1, Nishi Kumari1, Shahnishan Tabassum1, Amrita Singh1, A.K. Pal1*, B.D. Prasad2, R.S. Singh1and P.K. Singh1
1Department of Plant Breeding and Genetics 2Department of Molecular Biology and Genetics Engineering
1,2Bihar Agricultural University, Sabour, Bhagalpur–813210, India E-mail: *[email protected]
Keywords: BAP, Embryogenesis, Lentil, Stem Internodes, TIBA
INTRODUCTION
Lentil (Lens culinaris Medik.) is the most important protein rich rabi pulse, grown in eastern Gangetic plain, which can eradicate the protein related malnutrition. Terminal heat along with drought during flower emergence drastically decreases the yield. Thus understanding the functional mechanism of various genes/TFsdirectly related to heat/drought tolerance would be of great importance for improvement of lentil. Function studies of genes/TFs are possible by over-expressing or silencing the identified genes/TFs in transgenic lentil plants. In the current study, method for somatic embryogenesis was standardized in lentil (cv. Noori and Hul 57), which can be converted into potential transgenic plants for gene function study.
It is I
LLEGAL t
o cop
y, pri
nt or
save
any c
onten
t of th
is PDF,
in pa
rt or in
full,
on an
y retr
ieval
syste
m,
withou
t the E
XPRESS WRITTEN PERMISSIO
N of th
e cop
yrigh
t-hold
er
National Conference on Climate Change and Agricultural Production: Adapting Crops to Climate Variability and Uncertainty, 6th–8th April, 2017
[591]
MATERIALS AND METHODS
Three experiments were conducted for standardizing the plant hormone and its concentration for enhanced somatic embryogenesis from stem internodes. Stem internodes (2nd-3rd position from apex) were considered for each experiment. For best plant hormone, different concentrations of BAP, KIN, TDZ and ZEA were evaluated. On the basis of the results of the first experiment, different concentrations of BAP along with different concentrations of TIBA an anti auxin was analysed. In the third experiment, the effect of different lengths of internodal explants (5 mm, 15 mm and 25 mm) were tested for somatic embryogenesis potential. The media used for in this experiment was the best combination of BAP and TIBA i.e. TIBA (2.50 mg/l) + BAP (3.00 mg/l).
RESULTS AND DISCUSSION
Very few studies have been performed in lentil for shoot regeneration (Suxena et al., 1987; Sarkar et al., 2003). No studies have been performed till date in lentil using stem internodes, although the same has been performed in Lathyrus (Roy et al., 1993) and chickpea (Roy et al., 2001). In the current study swelling in the stem internodes was maximum (8.0 mm, Noori and 8.1 mm, Hul57) in 5.0 mg/l 2,4-D. The callus of friable nature was present throughout the internodal explants, whereas diameter of cut end was more (5.2 mm in Noori and 4.7 mm in Hul57) in 0.25 mg/l TDZ followed by 1.5 mg/l TDZ and 3.0 mg/l TDZ. Somatic embryogenesis was recorded higher (more than 10 %) in BAP containing media as compared to media without BAP (less than 3 %) for the initial 25 d. After transfer to TIBA containing media, there was significant increase in somatic embryogenesis. Conclusively, a pre-treatment of 0.4 mg/l BAP for 25 d and thereafter another 25 d in 2.5 mg/l TIBA proves to be better in terms of enhanced swelling (5.7 mm) and somatic embryogenesis (35 %) and decreased necrosis (30 %) in stem internodes. The media containing 2.5 mg/l TIBA and 3.0 mg/l BAP showed highest amount of somatic embryogenesis of 11, 21 and 29 % in 5, 15 and 25 mm internodes, respectively. Somatic embryogenesis was significantly higher in 25 mm internodes in all the media combinations tested. The best media for somatic embryogenesis was 2.5 mg/l TIBA with 3 mg/l BAP producing nodular callus while, 1.25 mg/l TIBA with 1.25 mg/l zeatin was suitable for friable callus development. Conclusively, the 25 mm internodes were highly responsive for all the parameter analyzed. The best media for somatic embryogenesis was 2.5 mg/l TIBA with 3 mg/l BAP producing nodular callus while, 1.25 mg/l TIBA with 1.25 mg/l zeatin was suitable for friable callus development
REFERENCES [1] Roy P K, All K, Gupta A, Barat G K and Mehta S L 1993. β-N-Oxalyl-L-α, β-diaminopropionic Acid in Somaclones Derived from Internode
Explants of Lathyrussativus. Journal of Plant Biochemistry and Biotechnology2(1):9-13 [2] Roy P K, Lodha M L and Mehta S L 2001. In vitro regeneration from internodal explants and somaclonal variation in chickpea
(CicerarietinumL.). Journal of Plant Biochemistry and Biotechnology 10:107-112 [3] Sarker R H, Mustafa B M, Biswas A, Mahbub S, Nahar M, Hashem R and HoqueM I 2003. In vitro regeneration in lentil (Lens culinarisMedik.).
Plant Tissue Culture 13(2):155-163. [4] Saxena P K and King J 1987. Morphogenesis in lentil plant regeneration from callus cultures of Lens culinarisMedik. via somatic embryogenesis.
Plant Science52: 223‐227.
It is I
LLEGAL t
o cop
y, pri
nt or
save
any c
onten
t of th
is PDF,
in pa
rt or in
full,
on an
y retr
ieval
syste
m,
withou
t the E
XPRESS WRITTEN PERMISSIO
N of th
e cop
yrigh
t-hold
er

National Conference on Climate Change and Agricultural Production: Adapting Crops to Climate Variability and Uncertainty, 6th–8th April, 2017
[592]
Effect of High Temperature on Pseudo Seeds Development in Wheat (Triticum aestivum L.)
Shahnishan Tabassum1, Nishi Kumari1, Abhilasha Sinha1, Amrita Singh, A.K. Pal1*, Bishun Deo Prasad2, Ravi Shankar Singh1 and P.K. Singh1
1Department of Plant Breeding and Genetics 2Department of Molecular Biology and Genetic Engineering,
1,2Bihar Agricultural University, Sabour, Bhagalpur–813210, India E-mail: *[email protected]
Keywords: Doubled Haploid, Embryo, Pseudo Seeds, Wheat
INTRODUCTION
Wheat is one of the world’s most important food crops, contributing about one fifth of human caloric intake (Shiferaw et al., 2013). Grain yield is reduced severely by biotic (rusts, smuts, blight etc.) and abiotic (terminal heat, moisture stress etc.) factors. The use of doubled haploid (DH) technology enables homozygosity of wheat lines to be reached in a single generation, making it a useful technique for both wheat breeding and genetical studies. Pseudo seeds and haploid embryos development which is one of the critical steps for DHs generation is critically affected by high temperature. The present study was conducted to analyze the level of harshness of high temperature and to find out any alternate measure to overcome its affect enhance pseudo seeds and haploid embryos development.
MATERIALS AND METHOD
F2 wheat seeds of five different parental combinations were sown in pots on regular interval of five days. Maize seeds were also sown in polyhouses at 30/20°C on regular interval of five days, in synchronization with the wheat plants, so that the their flowering coincides with that of the wheat plants. Three day/night temperatures viz. 25/10°C, 28/15°C and 35/20°C were tested for pseudo seeds production and embryo development in wheat. These temperatures were obtained at different time of the year, starting from January to April. 2,4-D (100 ppm) treatment was given continuously for 3 days after 24 hour of pollination. Embryo rescue was performed on Gamborg B5 media, pH 5.75, supplemented with 2.0% sucrose and 0.8% agar. Five spikes with twenty florets each were considered for every treatment.
RESULTS AND DISCUSSION
The maximum number of pseudo seeds were produced at 28/15°C day/night temperature (37–59%) followed by 25/10°C (32–43%). Day/night temperature of 35/23°C showed least pseudo seeds production of 18-26%. The range of haploid embryo development at 25/10, 28/15 and 35/23°C were 33–48, 49–63 and 5–9%, respectively. There was drastic decline in pseudo seeds and haploid embryo development from a 7 and 8°C increase in day and night temperature, respectively. Among the various combinations tested, HI 1556 X DBW 39 evinced maximum pseudo seeds formation (59%) and embryos (63%) at 28/15°C. The DBW 39 X EIGN 57 parental combinations showed least pseudo seeds production of 18% and haploid embryo production of 5%. This proves that genotypes sense the temperature stress differently and thus there is variation in pseudo seeds and haploid embryo production potential. Our results accord with that of Amrani et al. (1993) and Campbell et al. (1998) who reported 25/15°C and 22/17°C day/ night temperature suitable for pseudo seeds and haploid embryo development, respectively. In conclusion, the results of our experiments clearly demonstrate that high temperature has a marked influence on wheat haploid
It is I
LLEGAL t
o cop
y, pri
nt or
save
any c
onten
t of th
is PDF,
in pa
rt or in
full,
on an
y retr
ieval
syste
m,
withou
t the E
XPRESS WRITTEN PERMISSIO
N of th
e cop
yrigh
t-hold
er
National Conference on Climate Change and Agricultural Production: Adapting Crops to Climate Variability and Uncertainty, 6th–8th April, 2017
[593]
development. Our study indicates that seasons of the year with high temperatures are to be avoided in wheat doubled haploid programme using the wheat x maize method. A greater understanding of the physiology underlying these results will enable manipulation of environmental conditions for enhancing the overall efficiency of such systems.
REFERENCES [1] Amrani M, Sarrafi A and Alibert G 1993. Genetic variability for haploid production in crosses between tetraploid and hexaploid wheat with
maize. Plant Breeding 110:123-128 [2] Campbell A W, Griffin W B, Conner A J, Rowarth J S and Burritt D J 1998. The Effects of Temperature and Light Intensity on Embryo
Numbers in Wheat Doubled Haploid Production through Wheat¬Maize Crosses. Annals of Botany 82: 29-33. [3] Shiferaw B, Smale B, Braun H-J, Duveiller E, Reynolds M and Muricho G 2013. Crops that feed the world 10. Past successes and future
challenges to the role played by wheat in global food security. Food Science 5(3):291-317
Rapid and Eefficient Method for Pre-Field Screening of Mutants for Salt Tolerance in Rice
Pankaj Kumar1, Bishun Deo Prasad1*, Sonam Kumari1, Sangita Sahni2, Awadhesh Kumar Pal1, Neha Kumari1 and P.K. Singh1
1Dept. of Molecular Biology and Genetic Engineering, Bihar Agricultural University, Sabour, Bhagalpur, Bihar–81321, India
2Dept. of Plant Pathology, Tirhut College of Agriculture, Dholi–843121, India E-mail: *[email protected]
Keywords: Salinity Stress, Gamma Radiation, Mutation, Rice
INTRODUCTION
Salinity stress is one of the most complex stress tolerances to breed for, as the type, timing in relation to plant growth stage and intensity of the stress can all vary considerably (Witcombe et al. 2008). Salinity tolerance screening under field conditions is difficult due to spatial and stress heterogeneity of soil chemical-related stresses, and the significant impact of environmental factors such as relative humidity, temperature, and solar radiation. Numerous studies showed that rice is tolerant during germination, becomes very sensitive during early seedling stage (2–3 leaf stage), gains tolerance during vegetative growth stage, becomes sensitive during pollination and fertilization, and then becomes increasingly more tolerant at maturity. Hence, a rapid and efficient method is the prerequisite to screen a large number of rice mutants at early seedling stage. Therefore, in present investigation a rapid and efficient method for pre-field screening of Mutants for salt tolerance in rice has been developed and discussed.
MATERIALS AND METHODS
Gamma irradiated mutant rice was screened for salinity stress in hydrophobic system developed at Department of Molecular Biology and Genetic Engineering, Bihar Agricultural University, Sabour in year 2015-16. For making apparatus for screening mutant rice for salinity stress, 40 rectangular holes (3 cm diameter in a rows of 8) were made using surgical blade in a rectangular plastic sheet (3 mm thick). Then nylon net was stitched with nylon thread at one side of the rectangular plastic sheet. This plastic sheet was floated on 1X Hoagland solution kept in a rectangular plastic tray of 12-L capacity having dimension of 50-x-42-x-16-cm. The sterile seeds (30–40 seeds) of rice mutants and Rajendra Mahsuri-1 as check genotype were placed on the net for germination for 15 days. Then, seedlings were given salt stress by replacing the 1X Hoagland solutions with 1X Hoagland solution with 150 mM NaCl for 15 days.
It is I
LLEGAL t
o cop
y, pri
nt or
save
any c
onten
t of th
is PDF,
in pa
rt or in
full,
on an
y retr
ieval
syste
m,
withou
t the E
XPRESS WRITTEN PERMISSIO
N of th
e cop
yrigh
t-hold
er

National Conference on Climate Change and Agricultural Production: Adapting Crops to Climate Variability and Uncertainty, 6th–8th April, 2017
[594]
RESULTS AND DISCUSSION
Rice is very sensitive to salinity at seedling stage. Salinity stress at early seedling stage manifest on the first leaf, followed by the second, and finally on the growing leaf. Salinity suppresses leaf elongation and emergence of new leaves. Photosynthetic function and chlorophyll content were inversely proportional to salinity level (Ota and Yasue 1962). The screening technique developed is based on the ability of seedlings to grow in salinized nutrient solution. In present investigation, 10 mutant M2 mutant rice lines along with its parent Rajendra Mahsuri-1 were used for salt stress tolerance. The 150 mM of NaCl treatment for 15 days was found most effective as check variety (Rajendra Mahsuri-1) showed 100% mortality. Different mutant lines behaved differently on salt stress. Different mutant lines showed up to 40% survival on 150 mM of NaCl treatment for 15 days. The developed apparatus is robust, low cost and easy to make. This apparatus can be effectively used in screening rice mutants for salt stress tolerance.
REFERENCES [1] Ota K and Yasue T 1962. Studies on the salt injury in crops. XIV. The effect of NaCl solution upon photosynthesis of paddy. In: Research
Bulletin, Faculty of Agriculture, Gifu University. 16: 1-6. [2] Witcombe JR, Hollington PA, Howarth CJ, Reader S and Steele KA 2008. Breeding for abiotic stresses for sustainable agriculture. Philosophical
Transactions of the Royal Society B 363: 703–716.
Genetic Diversity Analysis in Peach (Prunus Persica L.) Cultivars using RAPD Markers
Hidayatullah Mir1*, D.S. Dahiya2 and S.K. Sherawat3 and Shashi Kala4 1Department of Horticulture (F&FT), 4Department of Food Science & Postharvest Technology
1,4Bihar Agricultural University, Sabour, Bhagalpur–813210, India 2,3Department of Horticulture, CCS Haryana Agricultural University, Hisar–125004, India
E-mail: *[email protected]
Keywords: Peach, RAPD, Genetic Diversity, Molecular Markers
INTRODUCTION
Peach is one of the most economically and socially important deciduous fruit tree. Therefore, precise cultivar identification and genetic diversity is essential for improving and securing peach cultivation in the world. The relatively narrow range of morphological traits and limited number of polymorphic isozyme systems are not adequate to discriminate all the cultivars of any given species. Furthermore, many phenotypic traits are developmentally regulated or influenced by the genotype environment interaction. According to Lima et al. (2011), knowledge about the genetic diversity of the species are an essential prerequisite for their preservation and the success of breeding programs. Molecular markers are valuable tools in the characterization and evaluation of genetic diversity among different species and population. It has been reported that different markers revealed different classes of variation (Ahmed et al., 2009). Random Amplified Polymorphic DNA (RAPD) does not need any prior knowledge of DNA sequence, however, still reveals a high level of polymorphism. RAPD is currently used as a tool for the assessment of genetic variability among genotypes in different breeding programmes. Keeping in view the importance of RAPD markers in different breeding programmes, the present study was initiated to determine the genetic diversity analysis among different peach cultivars for future breeding.
MATERIALS AND METHODS
A total of seven cultivars were selected for this study. Out of these four cultivars Partap, Shane-e-Punjab, Early Grande, and Flordaprince were collected from PAU, Ludhiana and the remaining three cultivars
It is I
LLEGAL t
o cop
y, pri
nt or
save
any c
onten
t of th
is PDF,
in pa
rt or in
full,
on an
y retr
ieval
syste
m,
withou
t the E
XPRESS WRITTEN PERMISSIO
N of th
e cop
yrigh
t-hold
er

National Conference on Climate Change and Agricultural Production: Adapting Crops to Climate Variability and Uncertainty, 6th–8th April, 2017
[595]
namely Flordasun, Prabhat and Sharbati were collected from HAU, Hisar. The study was conducted at Haryana Agricultural University, Hisar during year 2009–10. Fresh leaves of these cultivars were used for DNA extraction. A total ofthirty five random decamer primers, obtained from Operon Technologies™, USA, were used for RAPD analysis.
RESULTS AND DISCUSSION
In this study, out of 35 primers used to assess genetic diversity among the seven cultivars of peach, only 29 were found to be reproducible, while rest of the primers resulted in either no amplification or smeared profiles. These 29 primers yielded 234 bands/ fragments. The number of amplified fragments ranged from 3 (OPB-04, OPB-05) to 12 (OPBA-09) for various primers with an average of 8.07 bands per primer. The hierarchical cluster analysis based on similarity indices values identified two major clusters at a similarity coefficient of 0.62. First cluster comprised of Partap and Shan-e-Punjab, where as the remaining five cultivars fell in second cluster. RAPD analysis clearly showed significant genetic diversity exists among these seven peach cultivars. Hence, these cultivars are to be preserved as valuable genetic resources for breeding. The high genetic diversity present among these cultivars strongly suggest that they must have originated from genetically divergent parents or have a long history of adaptation to their respective micro-climatic regions.
REFERENCES [1] Ahmed I, Islam M, Mannan A, Naeem R and Mirza B 2009. Optimization of conditions for assessment of genetic diversity in barley (Hordeum
vulgare L.) using microsatellite markers. Barley Genet. Newslett 39: 5-12. [2] Lima A T B, Souza V A B, Gomes R L F and Lima P S C 2011. Molecular characterization of cajá, Spondias mombin (Anacardiaceae), by
RAPD markers. Genetics and Molecular Research 10: 2893-2904.
Initial Screening of Rice Germplasm for Germination and Early Growth in Anaerobic Conditions Caused by Flooding
Satyendra*, Mankesh Kumar, S.P. Singh, Anand Kumar, Rahul Singh and P.K. Singh Department of Plant Breeding and Genetics,
Bihar Agriculture University, Sabour–813210, Bhagalpur, India E-mail: *[email protected])
Keywords: Rice, Anaerobic Germination, DSR, Submergence
INTRODUCTION
In the context of the climate change, Direct Seeded Rice (DSR) offers several advantages against the traditional cultivation through puddling including significant savings in the water and labor. But at the same time there are several hurdles which limit its actual benefits. Anerobic germination is one of them. If DSR encounters with the flooding just after sowing of seeds due to unexpected rains, the problem of anaerobic germination comes. Rice is extremely sensitive to anaerobic conditions during germination and early growth of the embryo. Rice seed can germinate under hypoxic and even in anoxic conditions but cannot develop roots and leaves. In this situation, varieties that can germinate in flooded soils could be beneficial especially for DSR. Modern rice varieties are sensitive to flooding during germination and early growth, a problem commonly encountered in rainfed areas, but few landraces capable of germination under these conditions have recently been identified, enabling research into tolerance mechanisms. Major QTLs were also identified, and are being targeted for molecular breeding and for cloning. Nevertheless, limited progress has been made in identifying regulatory processes for traits that are unique to tolerant genotypes, including faster germination and coleoptile elongation, formation of roots and leaves under hypoxia, ability to catabolize starch into simple sugars for subsequent use in glycolysis and fermentative pathways to generate energy.
It is I
LLEGAL t
o cop
y, pri
nt or
save
any c
onten
t of th
is PDF,
in pa
rt or in
full,
on an
y retr
ieval
syste
m,
withou
t the E
XPRESS WRITTEN PERMISSIO
N of th
e cop
yrigh
t-hold
er

National Conference on Climate Change and Agricultural Production: Adapting Crops to Climate Variability and Uncertainty, 6th–8th April, 2017
[596]
MATERIALS AND METHODS
A total of 512 genotypes were screened at Bihar Agricultural College, Sabour farm during Kharif 2015 for anaerobic germination and early stage submergence tolerance in view to identify new genes/ QTLs for these important traits. The screened genotypes were very diverse in nature including early to late maturity and scented to non-scented genotypes. Five seed of each entry were sown in three replications in pluck trays. These trays were then kept in submergence tank made in the Rain-out Shelter. Trays were submerged in water with a depth of 15 centimeter. Temperature of floodwater and rain-out shelter was monitored daily along with other floodwater conditions like dissolved O2 and pH. The material was de-submerged after 15 days of continued submergence through the drain pipe situated at the bottom of the tank. Scoring was done on several bases.
RESULT AND DISCUSSION
Number of surviving seedlings was recorded at 3-day intervals starting at 9th days after sowing. It was continued up to day 21 of flooding (submergence). Survival percentage was then calculated by dividing number of seedlings survived to the number of seed sown per entry. Out of 512 genotypes, 89 entries were able to germinate in anoxia condition in one or more replications. However, 12 genotypes namely RP 5215-52-19-8-6-3-2-B, OR 2163-14, NPG-209, MTU 1158 (MTU PLA 106-1-2-1-1-1), RP 5224-11-6-2-1 (IR 83876-B-F3 BULK), NDR 8002, RYC 278, IIRONK14R1P102, CSISATPRMEK14E20, GxEK14P12, GxEK14P32 and one landrace named Burmabhusi were able to grow well after anaerobic germination in more than one replications. Characterization and screening of contrasting genotypes would help in elucidating the genetic and biochemical regulatory and signalling mechanisms associated with tolerance to anaerobic germination. This could facilitate breeding rice varieties suitable for direct seeding systems and guide efforts for improving water-logging tolerance.
REFERENCES [1] Miro B and Ismail A M 2013. Tolerance of anaerobic conditions caused by flooding during germination and early growth in rice
(Oryza sativa L.). (Review Article) Frontiers of Plant Sciences 4:1-18. [2] Magneschi L and Perata P 2008. Rice germination and seedling growth in the absence of oxygen. Annals of Botany103: 181–196, 2009.
Genetic Transformation of Indica Rice with Plant Nuclear Factor Y (NF-Y) B2 Subfactor Gene for Enhanced Drought Tolerance
Vinod Kumar1*, Nimmy M.S.2, Sweta Sinha1, Ravi Ranjan Kumar1 and Dharamsheela1 1Department of Molecular Biology and Genetic Engineering,
Bihar Agricultural College, Sabour–813120, India 2National Research Centre on Plant Biotechnology,
Indian Agricultural Research Institute, New Delhi–110012 E-mail: *[email protected]
Keywords: Drought Stress, ZmNF-YB2 Gene, Transgenic Rice, Transcription Factors
INTRODUCTION
Plant growth and productivity is adversely affected by abiotic stresses such as salinity, drought, temperature extremes (Chinnusamy et al., 2005) and rice is particularly sensitive to abiotic stresses. TFs from different plants have been shown to play key roles in various abiotic stress responses. The eukaryotic CCAAT-box binding nuclear factor Y (NF-Y) consists of three different subunits, A, B, and C. NUCLEAR FACTOR-Y, subunit B (NF-YB) comprises a multigene family in plants (Edwards et al., 1998) and has been shown to play
It is I
LLEGAL t
o cop
y, pri
nt or
save
any c
onten
t of th
is PDF,
in pa
rt or in
full,
on an
y retr
ieval
syste
m,
withou
t the E
XPRESS WRITTEN PERMISSIO
N of th
e cop
yrigh
t-hold
er
National Conference on Climate Change and Agricultural Production: Adapting Crops to Climate Variability and Uncertainty, 6th–8th April, 2017
[597]
important roles in growth, development, and response to environmental stress. In rice and wheat, there are at least 10 NF-YB genes (Stephenson et al., 2007). The objective of the present study was to develop transgenic rice plants tolerant to drought stress. We report here Agrobacterium mediated transformation of indica rice cv. IR64 employing a binary vector pCAMBIA2300 harbouring abiotic stress inducible ZmNFYB2 gene from Zea mays.
MATERIALS AND METHODS
The study was conducted at National Research Centre on Plant Biotechnology during the year 2014. For PCR, genomic DNA was isolated from the young leaves collected from putative of T0 and T1 transgenic plants at the hardening stage following CTAB method. The PCR was performed in a total volume of 25 μl, taking 2.5 μl of 10X PCR buffer, 0.5 μl of 10 mM dNTPs, 1μl of 25 mM MgCl2, 100 ng forward and 100 ng reverse primer, 0.25 μl of Taq polymerase, 1 μl of 100 ng genomic DNA from T0 and T1 transgenic rice plants and rest of sterile water. The PCR programme comprised of initial denaturation at 94C for 4 min, denaturation at 94C for 1 min, annealing at 55C for 1 min and extension at 72C for 1 min in a thermo cycler. Lastly, an additional final extension step was performed for 10 min at 72. For amplification, selection marker specific primer nptII (5’AGGCGATAGAAGG CGATGCGCTGCG-3’) and 5’CAATCGGC TGCTCTGATGCCGCCGT-3’) were used.
RESULTS AND DISCUSSION
Of 45 independent T0 transgenic plants generated on kanamycin selection media, 11 were positive transformants as detected by PCR of selection marker gene. The 694bp fragment, specific to the nptII gene was amplified in all the 11 transformants. Out of 11 independent events three events selected for T1 progeny generation. Every T1 plant used in this work was checked again by kanamycin selection and PCR before physiological assays to ensure the presence of the transgene. For the segregation analysis of progeny plants (T1), twelve seeds of each T1 line were germinated and grown for 10 days on MS media containing kanamycin for selection of stable inheritance of ZmNF-YB2 transgene for segregation analysis. Most of the lines exhibited kanamycin resistance and exhibited Mendelian ratio as 3:1 (Table 1). In our study transgenic rice plants showed much delayed leaf-rolling compared with the wild type plants under drought stress. Maintenance of high plant water status, as expressed in high relative water content is an indication of plant drought tolerance. The WT plants showed symptoms of drought stress around 8 days after withholding water; whereas, transgenics developed no stress symptoms till day 12. This was clearly explained by the maintenance of higher leaf relative water content (RWC).Under non-stress conditions, there were no obvious differences in the leaf RWC between WT and the transgenic plants, however, approximately 20% higher RWC than WT was noticed in transgenic plants under water stress. Similar findings were reported in rice (Manavalan et al., 2012 and maize (Zhang et al., 2010). These data further suggest that over-expression of ZmNF-YB2 resulting in greater water uptake at low soil water content during water deficit stress. In conclusion, we developed transgenic rice plants expressing ZmNF-YB2 under the control of a stress inducible promoter. The transgenic rice plants had normal phenotype and growth habit when grown under normal conditions. Taken together these results indicate that transgenic overexpression of ZmNF-YB2 in rice positively correlates with drought stress tolerance.
Table 1: Segregation Analysis of Kanamycin Resistance in T1 Progeny of ZmNF-YB2 Transgenic Rice Plants T1
Lines No. of Seeds Inoculated
No. of Germinated Seeds Transferred to Kanamycin
No. of Seedlings Resistant to Kanamycin
No. of Seedlings Sensitive to Kanamycin
Segregation Ratio
T1–1 12 12 9 3 3:1 T1–2 12 12 9 3 3:1 T1–3 12 12 9 3 3:1
It is I
LLEGAL t
o cop
y, pri
nt or
save
any c
onten
t of th
is PDF,
in pa
rt or in
full,
on an
y retr
ieval
syste
m,
withou
t the E
XPRESS WRITTEN PERMISSIO
N of th
e cop
yrigh
t-hold
er

National Conference on Climate Change and Agricultural Production: Adapting Crops to Climate Variability and Uncertainty, 6th–8th April, 2017
[598]
REFERENCES [1] Manavalan L P, Chen X, Clarke J, Salmeron J and Nguyen H T 2012. RNAi-mediated disruption of squalene synthase improves drought
tolerance and yield in rice. Journal of Experimental Botany 63(1): 163–175. [2] Stephenson T, McIntyre C, Collet C and Xue G P 2007. Genome-wide identification and expression analysis of the NF-Y family of transcription
factors in Triticum aestivum. Plant Molecular Biology 65: 77–92. [3] Zhang S, Li N, Gao F, Yang A and Zhang J 2010. Over-expression of TsCBF1 gene confers improved drought tolerance in transgenic maize.
Molecular Breeding 26: 455–46.
Genome-wide Analysis of Multidrug and Toxic Compound Extrusion (MATE) Gene Family in Chickpea (Cicer arietinum L.)
Nimmy M.S.1, Vinod Kumar 2, Jain P.K.1 and R. Srinivasan1 1National Research Centre on Plant Biotechnology
Indian Agricultural Research Institute, New Delhi–110012, India 2Department of Molecular Biology and Genetic Engineering,
Bihar Agricultural College, Sabour–813210, India E-mail: *[email protected]
Keywords: Abiotic Stress, Salinity, MATE, Phylogenetic Analysis, Chickpea
INTRODUCTION
Chickpea (Cicer arietinum L.) is second most important food legume crop grown globally over 13.5Mha with the production of 13.1Mt in 2013 (FAOSTAT2013). The productivity of chickpea has been limited by different biotic and abiotic factors and among them salinity is an increasing abiotic stress in many of the chickpea growing areas (Flowers et al., 2010). Salt responsive genes belonging to MATE efflux proteins reportedly play a significant role imparting salt tolerance to plants. Multidrug and toxic compound extrusion (MATE) family genes function in protecting cells against oxidative stress and bile salts and may be part of the SOS system. Despite the importance of MATE family genes in regulating stress tolerance, very limited studies on understanding the role MATEs in biotic and abiotic stresses were reported in chickpea. The availability of whole genome and transcriptome sequence of chickpea would facilitate genome-wide analysis to identify the complete set of MATE family genes in chickpea. The objective of the present study was to identify chickpea MATE family genes using genome-wide analysis and to characterize their phylogeny and chromosomal distribution. By comparing the sequences of chickpea MATE family with the known MATE transporters from other plant species, the possible roles of chickpea MATE transporters could be proposed and help us to further test their function.
MATERIALS AND METHODS
The studies have been conducted to identify the MATE gene family members in chickpea, to know their chromosomal distribution and evolution. For the identification of putative MATE transporters in chickpea, a total of 57 MATE (Pfam: PF01554) genes in Arabidopsis were identified from TAIR as well as Phytozome. Chickpea putative MATE genes were identified by BLASTP search at NCBI using A. thaliana MATE protein sequences as queries. These putative MATE sequences were filtered by the presence of conserved MATE domain (Pfam: PF01554) using the Pfam (http://pfam.xfam.org/). The full protein sequences of 50 chickpea MATE and 33 previously reported MATE from other plant species were used for multiple sequence alignments by ClustalW in MEGA 6.0. The unrooted phylogenetic tree was then constructed by MEGA 6.0 using the Maximum Likelihood (ML) algorithm with 1000 bootstraps,
It is I
LLEGAL t
o cop
y, pri
nt or
save
any c
onten
t of th
is PDF,
in pa
rt or in
full,
on an
y retr
ieval
syste
m,
withou
t the E
XPRESS WRITTEN PERMISSIO
N of th
e cop
yrigh
t-hold
er

National Conference on Climate Change and Agricultural Production: Adapting Crops to Climate Variability and Uncertainty, 6th–8th April, 2017
[599]
RESULTS AND DISCUSSION
This study presents the results of the identification and genome-wide survey of the MATE family genes in chickpea. We identified 50 MATE genes encoding MATE transporters from the chickpea whole genome which were denominated as CarMATE1-CarMATE50 based on their physical locations. The chickpea MATE genes were found on all of the chickpea chromosomes with a maximum of 11 genes on chromosome four and a minimum of two on chromosome 5. The chickpea MATE proteins consist of 146–619 amino acids 3 to 12 transmembrane helices whereas in Arabidopsis, the lengths of MATE proteins range from 400 to 700 amino acids and most with 12 TMs indicating there are more variations within the chickpea MATE family compared with Arabidopsis. The predicted molecular weights (MW) of chickpea MATE proteins range from 19.40 to 66.51 kDa, and the predicted pI values are between 5.33 and 9.77. (ExPASy). Their predicted subcellular locations include plasma membrane, chloroplast and cytoplasm with 76.47% (39 out of 50) located in the plasma membrane,15.68% (8 out of 50) located in chloroplast, and 3.92% are located in cytoplasm (2 out of 50) respectively. Using the full-length protein sequences of the 83 MATE transporters, including the 33 previously reported plant MATE proteins and 50 chickpea MATE proteins, we constructed a maximum likelihood (ML) tree. These MATE proteins could be classified into four primary clades (subfamilies) comprising 12 smaller subgroups. The functions of chickpea MATE proteins could be inferred from the known MATE transporters according to their phylogenetic relationships.
Fig. 1: The Phylogenetic Tree of Chickpea MATE Family
REFERENCE [1] Flowers T J, Gaur P M, Gowda C L L, Krishnamurthy L, Samineni S and Siddique K H M 2010.Salt sensitivity in chickpea. Plant Cell and
Environment 33: 490–509.
It is I
LLEGAL t
o cop
y, pri
nt or
save
any c
onten
t of th
is PDF,
in pa
rt or in
full,
on an
y retr
ieval
syste
m,
withou
t the E
XPRESS WRITTEN PERMISSIO
N of th
e cop
yrigh
t-hold
er

National Conference on Climate Change and Agricultural Production: Adapting Crops to Climate Variability and Uncertainty, 6th–8th April, 2017
[600]
Studies on Genetic Divergence in Bitter Gourd (Momordica charantia L.)
Nidhi Tyagi*, V.B. Singh and Vishal Tripathi Department of Vegetable Science,
N.D. University of Agriculture and Technology, Kumarganj, Faizabad–224229, India E-mail: *[email protected]
Keywords: Bitter Gourd, Genetic Divergence, D2 Statistics
INTRODUCTION
Bitter gourd (Momordica charantia L.) is an important cucurbitaceous vegetable. Diverse morphological characters of M. charantia provide a relatively broad phenotypic species-variation. Of the several methods available, Mahalanobis’s D2 statistics is a powerful tool for determining degree of divergence between populations, and relative contribution of different components to the total divergence, in isolation of suitable parents. This technique provides a basis for selection of genetically divergent parents in a hybridization programme. Therefore, the present investigation was carried out to examine the nature and magnitude of genetic divergence in 31 bitter gourd genotypes with different geographical origins and distribution.
MATERIALS AND METHODS
Thirty one genotypes (including Pusa Vishes and Pusa Do Mausami as check varieties) of bitter gourd having diverse origin were evaluated at Main Experimental Station of Vegetable Science, Narendra Deva University of Agriculture & Technology, Kumarganj, Faizabad (U.P.), during spring summer season, 2015. The experiment was laid out in RBD (Randomized Block Design) with three replications in individual plot size (3m x 2m). The distance maintained between row to row and plant to plant was 2m and 0.50m, respectively. Five plants were selected randomly from each plot to record observations on 12 characters. Genetic divergence was estimated using D2 statistics of Mahalanobis (1928) and the populations were grouped into clusters as per Rao (1952).
RESULTS AND DISCUSSION
Based on D2 values all the thirty one genotypes of bitter gourd were grouped by torcher’s method into six cluster. The result showed that cluster IV had maximum number of genotypes (7) followed by Cluster V (6). Cluster II and VI comprised 5 whereas cluster I and III comprised 4 genotypes each. Intra and inter cluster distance are an index of genetic diversity among clusters. The inter-cluster distance was greater than intra cluster distance, revealing a considerable amount of genetic diversity among the genotypes. The highest intra-cluster distance was recorded in cluster I (18.42) and lower in cluster III (11.70). The highest inter cluster distance was observed between cluster III and VI (58.37) followed by cluster II and VI (56.22) which indicating that genotypes of these two clusters are genetically very diverse to each other and are suggested to provide a broad spectrum of variability in segregating generation. Therefore, selection of genotypes for hybridization should be based on genetic diversity. Among 12 characters studied, vine length contributed maximum (34.41%) towards genetic divergence followed by fruit diameter (33.98%) and average fruit weight (15.27%) in bitter gourd. Cluster means of 31 genotypes showed that mean values of clusters varied in magnitude for all the 12 characters studied. As regards cluster means, Clusters-III and II performed better for most of the biometric characters studied. Among the clusters studied, Clusters-III consisted of four genotypes, with high in number of fruit per vine and fruit yield per vine while cluster II consisted of five genotypes which showed earliness in anthesis of first female flower, fruit harvest as well as highest in fruit diameter. Therefore, cluster-III and cluster II would be would be a good candidate and effective for selection to attain maximum yield with highest number of fruits from an early crop.
It is I
LLEGAL t
o cop
y, pri
nt or
save
any c
onten
t of th
is PDF,
in pa
rt or in
full,
on an
y retr
ieval
syste
m,
withou
t the E
XPRESS WRITTEN PERMISSIO
N of th
e cop
yrigh
t-hold
er
National Conference on Climate Change and Agricultural Production: Adapting Crops to Climate Variability and Uncertainty, 6th–8th April, 2017
[601]
REFERENCES [1] Devmore JP, Dhonukshe BL, Apte U B and Jadhav B B 2007. Genetic divergence in bitter gourd (Momordica charantia L.). South Indian
Horticulture 55: 20-23. [2] Dey S S, Behera T K, Munshi A D and Sirohi P S 2007. Studies on genetic divergence in bitter gourd (Momordica charantia L.). Indian Journal
of Horticulture 64: 53-57. [3] Pandit M K, Saha A K and Bhattacharya S 2012. Multivariate analysis for genetic divergence in snake gourd (Trichosanthes anguina L.)
genotypes. Acta Horticulturae 958: 157-161. [4] Quamruzzaman A K M, Ahmad S, Moniruzzaman M, Chowdhury M A Z and Mollah M A H 2011. Genetic diversity analysis of sponge gourd
(Luffa cylindrica L.) in Bangladesh. SAARC Journal of Agriculture 9(2): 45-51.
PerSe Performance of Parents and Hybrids of Cowpea (Vigna unguiculata)
A.K. Verma1*, A.K. Naidu1, A.K. Mehta2 and R.P. Singh1 1Department of Horticulture, 2Department of Plant Breeding & Genetics
1,2Jawaharlal Nehru Krishi Vishwavidyalay, Adhartal, Jabalpur–482004, India E-mail: *[email protected]
Keywords: Cowpea, Hybrids, Per se Performance, Vigna Unguiculata
INTRODUCTION
Per se performance is still the most simple and effective way to get first hand information on the genotypes. Crosses between parents with good per se performance are expected to yield desirable recombinants in the segregating generations and the potentialities of such genotypes will also reflect in the performance of hybrids. The selected genotypes can be further utilized to exploit recombination breeding or heterosis (Valarmathi & Surendran, 2007). Exploitation of genetic potential of wild and close relatives of cowpea for enhancing cowpea productivity had not been well documented. With this objective in view, ten parents and their resultant hybrids were evaluated based on mean per se performance. The average productivity of cowpea is low as compared to other pulse crops due to the lack of availability of high yielding genotypes and also susceptibility of the genotypes to major biotic stresses. Hence, there is a paramount importance to improve the yield potential along with improving the resistance/tolerance to pest and diseases.
MATERIAL AND METHODS
Ten diverse genotypes which included six lines viz., 2012/COPBR/2012-2, 2012/COPBR/2012-3, 2012/COPBR/2012-5, 2014/COPBR/2012-4, 2014/COPBR/2012-5, 2014/COPBR/2012-6 and four testers viz., Gomti, Pusa Komal, Kashi Kanchan and Arka Garima were crossed in a L x T fashion during kharif 2014 and evaluated in kharif 2015. Thus line x tester mating was carried out between these six lines and four testers and the experimental materials, Lines (6), Testers (4) and their crosses (24) were grown in a randomized block design with three replications at Horticulture research Farm, Department of Horticulture, JNKVV, Jabalpur, Madhya Pradesh. Observations were recorded on ten randomly chosen plants in each replication both for parents (10) and hybrids (24) for the various growth and yield attributes. The data were analysed for variances to assess the treatments difference for the various characters.
RESULTS AND DISCUSSION
Analysis of variance details for the sixteen characters revealed significant variability among parents and hybrids for all the sixteen characters studied. These results are similar with the findings of Nkouannessi (2005), Sarutayophat et al. (2007), Stoilova and Berova (2009) and Lingaraj (2009) in cowpea. This is an
It is I
LLEGAL t
o cop
y, pri
nt or
save
any c
onten
t of th
is PDF,
in pa
rt or in
full,
on an
y retr
ieval
syste
m,
withou
t the E
XPRESS WRITTEN PERMISSIO
N of th
e cop
yrigh
t-hold
er

National Conference on Climate Change and Agricultural Production: Adapting Crops to Climate Variability and Uncertainty, 6th–8th April, 2017
[602]
essential pre requisite for further study of the genotypes. The highest yield per plant was recorded by 2014/COPBVAR-6 followed by 2014/COPBVAR-5 among female parents and Gomti followed by Kashi Kanchan among male parents. The variation in these characters may be due to genotypic ability of plant itself and varied response to environmental conditions (Stoilova and Pereira, 2013). The crosses mean value for marketable green pod yield per plant ranged from 128.42 g (2012/COPBVAR-5 x A. Garima) to 256.47 g (2014/COPBVAR-6 x P. Komal) which was followed by ICP-42/ Indira Hari (250.18 g), ICP-54/ Arka Garima (246.38 g) and ICP-42/ Pusa Komal (240.56 g) and (232.68 g) with an overall cross mean of 195.11 g. Maximum green pod yield per plant was observed in most of the crosses when line 2014/COPBVAR-6 was used as female parent. The best parents and their crosses identified may be used for further study of heterosis and combining ability and based on that new varieties/hybrids could be released.
REFERENCES [1] Lingaraj C H 2009. Assessment of genetic diversity in cowpea [Vigna unguiculata (L.) Walp] germplasm. M.Sc. (Agri) Thesis, Univ. of Agric. Sci.,
Dharwad, India. [2] Nkouannessi Magloire 2005. The genetic, morphological and physiological evaluation of African cowpea genotypes. M.Sc. (Agri) Thesis, Univ.
of Free State, Bioemrontein, South Africa. [3] Stoilova T and Berova M 2009. Morphological and agrobiological study on local germplasm of common beans (Phaseolus vulgaris L.) and
cowpea (V. unguiculata L.). XI Anniversary Scientific Conference, Special Edition. pp. 385-388. [4] Valarmathi G and Surendran C 2007. Per se performance of parents and hybrids in sub species of cultigen cowpea (Vigna unguiculata).
Legume Research 30 (2): 86-91.
Impact of Stunt Disease on Yield and Yield Attributing Characters on Different Sowing Dates of Chickpea
Sourabh Kumar1, R.N. Gupta1*, G. Chand1, C. Azad1, S.K. Gupta2, A. Ghatak1 and S.B. Sah3
1Department of Plant Pathology, 2Department of Agronomy 3Department of Entomology, BPSCA, Purnea
1,2,3Bihar Agricultural University, Sabour–813210, India E-mail: *[email protected]
Keywords: Chickpea, Stunt Disease, Yield
INTRODUCTION
Chickpea is an important self pollinated Rabi pulse crop of India. The area under chickpea is gradually declining day by day due to biotic and abiotic stresses prevalent in different parts of the country. About 67 fungi, 3 bacteria, 22 viruses and 80 nematodes are reported which may adversely affect the growth and productivity of the crop (Singh et al., 1999). Chickpea Stunt disease (bean (pea) leaf roll virus) caused a reduction of yield and its attributing characters like plant height 40.05–57.98% and 78.05–88.32% in plant yield.
MATERIALS AND METHODS
A field experiment was conducted at Research farm of Bihar Agricultural College, sabour, Bhagalpur during 2014–15 and 15–16 The crop was sown in three different dates, 1st November (early sown), 15th November (mid sown) and 30th November (late sown) with row to row 50 cm and plant to plant spacing 10 cm. The plot size of 12.5 m2 was maintained in randomized block design. All the recommended package of practices was followed.
It is I
LLEGAL t
o cop
y, pri
nt or
save
any c
onten
t of th
is PDF,
in pa
rt or in
full,
on an
y retr
ieval
syste
m,
withou
t the E
XPRESS WRITTEN PERMISSIO
N of th
e cop
yrigh
t-hold
er

National Conference on Climate Change and Agricultural Production: Adapting Crops to Climate Variability and Uncertainty, 6th–8th April, 2017
[603]
RESULTS AND DISCUSSION
The response of stunt disease against all seven cultivars on different parameters in each date of sowing was assessed.Reduction in yield per plant due to CpSd infection was recorded 78.05-88.32%. It was observed maximum reduction in variety JG315 (88.32%) and minimum in GCP105 (78.05%). Jayalakshmiet al. (2003) also observed the effect of stunt disease (bean pea leaf roll virus) on variety Annigeri and found maximum reduction in plant height (63.62%).
Table 1: Impact of Chickpea Stunt Disease on Yield/ Plant (g) Variety Healthy Plant Diseased Plant Reduction %
BG256 5.63 0.74 86.85 JG62 6.70 0.94 85.97 GCP105 7.70 1.69 78.05 PG186 4.23 0.86 79.66 JG315 3.77 0.44 88.32 JG14 7.67 1.04 86.44 BG372 4.43 0.90 79.68 CD at 5% 0.79 0.45 CV (%) 7.77 27.21
REFERENCE [1] Jayalakshmi S K, Mahalinga D M, Gangadhar G C and Sreeramulu K 2003. Effect of stunt disease on yield and yield attributing characters in
chickpea. Plant Disease Research 18(1): 68-69.
Analysis of Genetic Variability and Correalation of Seed Yield and Morpho-physiological Traits in Mungbean (Vigna radiata (L.) Wilczek)
Under Irrigated Condition
Sunayana*, M.S. Punia and Rajesh Yadav Department of Genetics and Plant Breeding
CCS Haryana Agricultural University, Hisar–125004 E-mail: *[email protected]
INTRODUCTION
Mungbean (Vigna radiata (L.) Wilczek) is an important pulse crop in Asia and is suitable for cultivation under different farming situations. Mungbean seed contains 22–28% protein, 60–65% carbohydrates, 1–1.5% fat and 3.5–4.5% fibres. However, currently both potential and actual yields are leveling off in mungbean because genetic gains in yield are becoming harder to achieve, partly due to the lack of appropriate genetic variability. To accumulate optimum contribution of yield and yield contributing characters, it is essential to know the association of various characters. The present study was undertaken to examine the nature and magnitude of genetic variability and association among characters in mungbean.
MATERIALS AND METHODS
Sixty mungbean genotypes were sown in randomized block design (RBD) with three replications having a plot size of 2 rows x 2m at CCS Haryana Agricultural University, Hisar and the crop was sown in April, 2013. Observations were recorded on five randomly selected plants from each genotype in each replication for ninteen characters. The data for different characters were statistically analyzed to work outgenotypic and phenotypic coefficients of variation (Burton and Devane, 1953) based on the estimate of genotypic and phenotypic variance.
It is I
LLEGAL t
o cop
y, pri
nt or
save
any c
onten
t of th
is PDF,
in pa
rt or in
full,
on an
y retr
ieval
syste
m,
withou
t the E
XPRESS WRITTEN PERMISSIO
N of th
e cop
yrigh
t-hold
er

National Conference on Climate Change and Agricultural Production: Adapting Crops to Climate Variability and Uncertainty, 6th–8th April, 2017
[604]
Heritability in broad sense was calculated as per the formula suggested by Hanson et al. (1956) and expected genetic gain as suggested by Johnson et al. (1955). Correlation coefficients at phenotypic and genotypic level were calculated as per procedure given by Al-Jibouri et al. (1958).
RESULTS AND DISCUSSION
The information about nature and magnitude of genetic variability existing in the available genotypes of a crop is essential for selection of diverse parents which upon hybridization may provide a wide spectrum of gene recombination of quantitatively inherited traits. High estimates of heritability and high genetic advance observed for most of the characters whereas Flower retention, No. of pods/plant, No. of seeds/pod, biomass, pod weight/plant, seed weight/plant, harvest index, canopy temperature difference, photochemical efficiency, membrane stability index, total chlorophyll content showed positive and significant correlation with seed yield. It is concluded that these characters are the most important contributing factors to seed yield and should be used as selection criteria for yield improvement in mungbean.
REFERENCES [1] Al-Jibouri H A, Miller P A and Robinson H F 1958. Genotypic and environmental variances and co-variances in upland cotton crosses of
interspecific origin. Agronomy Journal 50: 633-637. [2] Burton G W and Devane E H 1953. Genetic variability and heritability in soybean. Agronomy Journal 45: 478-481. [3] Hanson C F, Robinson H F and Comstock R E 1956. Biometrical studies on yield in segregating population of Korean Lespedesa. Agronomy
Journal 48: 248-272. [4] Johnson H F, Robinson H F and Comstock R E 1955. Estimates of genetic and environmental variability in soybean. Agronomy Journal 47:
314-318.
Table 1: Estimates for Grand Mean, C.V., Heritability, Genetic Advance and Genetic Advance as Percent of Mean for Twenty Characters in Mungbean
Characters Mean PCV (%) GCV (%) Heritability (h2) (%) Genetic Advance Genetic Advance as % of Mean
Days to first flowering 42.767 4.906 4.400 80.434 3.476 8.129 Days to first pod 46.267 4.924 4.247 74.384 3.491 7.546 Flower retention (%) 84.209 10.218 8.697 72.433 12.839 15.247 Plant height (cm) 49.440 17.041 16.261 91.052 15.803 31.963 No. of pods/plant 19.234 20.230 4.011 39.30 4.671 24.285 No. of branches/plant 3.304 20.841 17.414 69.812 0.990 29.972 No. of seeds/pod 9.994 10.990 10.053 83.673 1.893 18.943 Days to maturity 63.194 4.448 4.312 93.973 5.441 8.610 Biomass (g) 631.049 16.933 15.537 84.192 185.327 29.368 Total pod weight/plant (g) 11.664 16.018 14.743 84.713 3.261 27.953 Seed dry weight/plant (g) 9.953 13.114 12.286 87.765 2.360 23.710 Grain yield/plot (g) 148.899 15.345 11.271 53.950 25.393 17.054 Harvest index (%) 24.04 18.108 13.835 58.375 0.052 21.776 100 seed weight (g) 5.196 11.477 10.228 79.427 0.976 18.778 Canopy temp. difference (°C) -4.550 24.373 15.397 39.907 0.912 20.037 Photochemical efficiency 0.580 9.699 9.651 99.005 0.115 19.782 Membrane stability index (%) 53.036 20.425 19.618 92.225 20.587 38.817 Total chlorophyll content 48.026 15.207 14.172 86.851 13.066 27.207 Necrosis 1.483 82.419 49.945 36.723 0.925 62.349 Mungbean Yellow Mosaic Virus 1.189 42.269 12.671 8.986 0.093 7.824
It is I
LLEGAL t
o cop
y, pri
nt or
save
any c
onten
t of th
is PDF,
in pa
rt or in
full,
on an
y retr
ieval
syste
m,
withou
t the E
XPRESS WRITTEN PERMISSIO
N of th
e cop
yrigh
t-hold
er

National Conference on Climate Change and Agricultural Production: Adapting Crops to Climate Variability and Uncertainty, 6th–8th April, 2017
[605]
Genetic Variability Analysis for Plant Selection in Custard Apple (Annona squamosa L.)
J.L. Nag1*, S.N. Dikshit 2, N. Mehta3, O.P. Kashyap4, Neeraj Shukla5, R.R. Saxena6 and P. Singh7
1,2,5,7Department of Horticulture, 3,4Department of Genetics and Plant Breeding 6Department of Agricultural Statistics
1,2,3,4,5,6,7CoA, IGKV, Raipur–492012, India E-mail: *[email protected]
Keywords: GCV, PCV, Variability, Heritability, Genetic Advance, Custard Apple
INTRODUCTION
Custard apple (Annona squamosa L.), also known as Sitaphal or Sharifa is an important The heritability estimates and genetic advance proved to be the important parameters for isolating the desirable genotypes. Heritability provides information on contribution of genotypic variance to the corresponding phenotypic variance while, genetic advance reflects genetic architecture of any population. High genetic advance associated with high heritability gives an idea of true heritable traits for better plant selection during breeding programme.
MATERIALS AND METHODS
An experiment comprised of 60 genotype accessions was conducted at 10 years In-situ plantation at Northern Bastar, Research cum Instructional Farm College of Agriculture & Research Station, Singarbhat, Kanker, Indira Gandhi Krishi Vishwavidyalaya, Raipur (Chhattisgarh) during Kharif 2013-14. The experiment was laid out in Randomized Complete Block Design (RCBD) with four replications recommended package of practices were applied to raise the normal crop. Observations were recorded on one randomly selected competitive plants from each genotype, in each replication on 20 characters. The statistical analysis for genetic variability was done as per the method given by Burton (1952).
RESULTS AND DISCUSSION
Genotypic and Phenotypic Coefficient of Variation: The highest (GCV 52.16%) and PCV 52.46) was observed for pulp weight, which is followed by areole weight (51.47% and 51.80), fruit weight (44.70% and 45.10), length of pedicel (30.67 % and 31.27%), pedicel thickness (29.61% and 30.16%), weight of pericarp (29.60% and 30.22%), length of pericarp (29.29% and 29.61%), total number of fruits per plant (23.08% and 24.35) and fruit width (20.19% and 21.07%). The moderate GCV and PCV were observed for fruit yield per plant (16.13% and 17.04%) which is followed by number of flower per branches (10.71% and 12.31%), length of leaf (10.59% and 14.88%) and seed length (10.37% and 20.08%). Rest of the traits exhibited low GCV and PCV estimates.
Heritability and Genetic Advance: Heritability for Fruit Yield and its Components: In present investigation, the highest heritability estimate was recorded for the character pulp weight (99.00%), areole weight (99.00%), fruit weight (98.00%), length of pericarp (98.00%), weight of pericarp (96.00%), length of pedicel (96.00%), pedicel thickness (96.00%), fruit width (92.00%), total number of fruits per plant (90.00%), fruit yield per plant (90.00%), fruit length (88.00%), number of flowers per branch (76.00%) and seed length (76.00%).
It is I
LLEGAL t
o cop
y, pri
nt or
save
any c
onten
t of th
is PDF,
in pa
rt or in
full,
on an
y retr
ieval
syste
m,
withou
t the E
XPRESS WRITTEN PERMISSIO
N of th
e cop
yrigh
t-hold
er

National Conference on Climate Change and Agricultural Production: Adapting Crops to Climate Variability and Uncertainty, 6th–8th April, 2017
[606]
Genetic Advance: The highest genetic advance was observed for fruit weight (212.64) followed by pulp weight (122.27), areole weight (82.55), number of fruits per tree (34.84), fruit yield per plant (35.81) and number of alternate leaf (24.58).
Genetic Advance as Percentage of Mean: Among 20 characters studied, the highest genetic advance as percentage of mean was observed for pulp weight (106.82), followed by areole weight (105.35), fruit weight (91.25), length of pedicel (61.95), pedicel thickness (59.87), weight of pericarp (59.71) and length of pericarp (59.69).
REFERENCE [1] Hanson W D, Robinson H F and Comstock R E 1956. Biometrical studies of yield in segregating population Korean Lespandeza. Agronomy
Journal 4(8): 268-272.
Novel Approach in Screening Pea Genotype for Brassinosteriod (Brassinolide)
Tannu Priya* and A. Hemantranjan Department of Plant Physiology, Institute of Agricultural Sciences,
Banaras Hindu University, Varanasi–221005, India E-mail: *[email protected]
Keywords: Brassinosteriods, Pea Genotype, Seedling Growth
INTRODUCTION
Pea (Pisum sativum L.) is one of the six major pulse crops cultivated globally including India and is the second highest yielding legume in the world after common bean (Phaseolus vulgaris L.). Among all pea producing states of India, Uttar Pradesh has the largest area and maximum production and alone contributes to more than 50 per cent of total pea production in the country (FAO 2010). However, the productivity level is much lower than the potential of existing genotypes of pea in Uttar Pradesh. Growth and productivity of crops is directly related to germination percentage, root and shoot growth, and brassinosteriods induce significant improvement in these attributes. Therefore, the work has been selected to explore the potential use of brassinolide as positive or stimulatory effect on seed germination and seedling growth of pea.
MATERIALS AND METHODS
For screening, 6 petri-dishes each containing 10 seeds of each genotype were allowed to germinate separately, at 0.010, 0.025, 0.050, 0.075 and 0.100 mM concentrations of brassinolide against control (distilled water). The treatments were replicated three times and placed in growth chamber at 20oC. For the measurement of growth attribute viz., dry weight of plant, the surface sterilized seed were inoculated with specific Rhizobium and treated ten seeds of each selected pea genotype ‘HUP-2’ and ‘HUDP-15’ at 0.010, 0.025, 0.050, 0.075 and 0.100 mM concentrations of brassinolide against control were sown in plastic pots (size: 20 cm x 20 cm and 10 seeds in each pot), filled with sandy loam soil and farmyard manure (mixed in the ratio of 6:1). The pots were arranged in a completely randomized block design in a net house under environmental conditions during winter (Rabi) season of 2015-2016. Germination percentage [total number of seeds germinated × 100/total number of seeds taken], relative seed germination [number of seeds germinated in the treatment × 100/number of seeds germinated in the control], seedling growth [total seedling growth in cm/number of germinated seeds], vigour index [germination percentage × seedling length], were measured 10 days after brassinolide treatment, and dry weight of plant was measured 30 days after sowing.
It is I
LLEGAL t
o cop
y, pri
nt or
save
any c
onten
t of th
is PDF,
in pa
rt or in
full,
on an
y retr
ieval
syste
m,
withou
t the E
XPRESS WRITTEN PERMISSIO
N of th
e cop
yrigh
t-hold
er

National Conference on Climate Change and Agricultural Production: Adapting Crops to Climate Variability and Uncertainty, 6th–8th April, 2017
[607]
RESULTS AND DISCUSSION
The application of lower brassinolide concentration of 0.050 mM induced highly efficacious effect than its higher concentrations of 0.075 and 0.100 mM in terms of high germination percentage i.e. 90% in ‘HUP-2’ and 89% in ‘HUDP-15’ as compared to control (80%), and the concentration of brassinolide 0.050 mM remained statistically at par to the concentration of brassinolide 0.025 mM, but proved significantly superior to all other treatments (Table 1). The germination percentage decreases when the concentration of BL increased which shows that higher concentration inhibited germination. These were in agreement with the findings of Talaat and Abdallah (2010). The brassinolide concentration of 0.050 mM maintained significantly higher relative seed germination values i.e. 123.8% in ‘HUP-2’ and 125% in ‘HUDP-15’ as compared to all treatments, it remained at par to the concentration of 0.025 mM. Similar trends were also observed in case of seedling growth and vigour index of pea. It can also be noticed that pea genotype ‘HUDP-15’ exceeded significantly ‘HUP-2’ in all seed germination parameters viz., germination percentage, relative germination percentage, seedling growth and vigour index. The effect of brassinolide concentrations on the dry weight of pea genotypes seedlings 30 days after sowing showed a gradual increase in the response of the dry weight of seedling with the increase of brassinolide level up to 0.050 mM and however, thereafter increases brassinolide level appeared to reduce it. Hence, the seed soaking with 0.050 mM brassinolide was the best supporter of pea seedling dry weight in both genotypes and was significantly superior to all treatments. Therefore, it may be concluded that brassinolide application at the threshold concentration of 0.050 mM showed optimum seedling growth of the pea genotype ‘HUDP-15’as compared to ‘HUP-2’.
Table 1: Effect of different Concentrations of Brassinolide on Seed Germination and Growth Parameters of Pea Genotypes
Concentration of BL in mM
Germination % Relative Seed Germination %
Seedling Growth (cm)
Vigour Index Dry Weight of Plant-
1 (g) Genotype (G) Genotype (G) Genotype (G) Genotype (G) Genotype (G)
HUP-2 HUDP-15
HUP-2 HUDP-15
HUP-2 HUDP-15
HUP-2 HUDP-15
HUP-2 HUDP-15
Control (DW) 80 80 100.0 100.0 7.50 8.75 480.0 560.0 1.25 1.32 0.010 93 94 116.3 117.5 9.14 9.34 790.5 799.0 1.32 1.42 0.025 96 97 120.0 121.3 9.38 9.79 864.0 921.5 1.40 1.45 0.050 99 100 123.8 125.0 9.60 10.00 940.5 1000.0 1.45 1.52 0.075 94 95 117.5 118.8 9.26 10.00 817.8 902.5 1.35 1.50 0.100 90 89 112.5 111.3 8.89 9.55 720.0 756.5 1.35 1.40
CD 5% CD 5% CD 5% CD 5% CD 5% Genotype (G) 3.07 3.63 0.26 87.4 0.18 Treatment (T) 4.26 5.48 0.39 118.1 0.27 G X T NS* 5.79 NS 137.3 NS
REFERENCES [1] FAO 2010. Food and Agriculture Organization (FAO) Database 2010. http://www.faostat.fao.org. [2] Talaat Naveen Bahaa and Abdallah Amany M 2010. Effect of 28-homobrassinolide and 24-epibrassinolide on the growth, productivity and
nutritional value of two faba bean (Vicia faba L.) cultivars. Archives of Agronomy and Soil Science56:649-669
It is I
LLEGAL t
o cop
y, pri
nt or
save
any c
onten
t of th
is PDF,
in pa
rt or in
full,
on an
y retr
ieval
syste
m,
withou
t the E
XPRESS WRITTEN PERMISSIO
N of th
e cop
yrigh
t-hold
er

National Conference on Climate Change and Agricultural Production: Adapting Crops to Climate Variability and Uncertainty, 6th–8th April, 2017
[608]
Studies on Evaluation of Turmeric (Curcuma Longa L). Cultivars against Leaf Blotch (Taphrina maculens Butler) and Shoot Borer
(Conogethes punctiferalis Guen.)
Siddalingayya Salimath*, Y.K. Kotikal, Revanna Ravannavar and J. Venkatesh University of Horticultural Sciences, Bagalkot, India-57103
E-mail: *[email protected]
Keywords: Cultivars, Curcuma longa L., Leaf blotch, Shoot borer
INTRODUCTION
Turmeric (Curcuma domestica L.), one of the most important major dye spice crops in India, it suffers from important foliar diseases caused by Taphrina maculans Butler (Rao, 1995). Although fungicides were found to be effective in the management of the diseases (Srivastava, 1977), residue problem is likely to be major hindrance in the export of produce. However, for developing such improved cultivars, there should be known source of resistance available in the different entries stock, which can be utilized in the breeding programme for developing resistant cultivars. In turmeric (Curcuma longa L) several insect pests has been reported from India (Koya et al., 1991 and Kotikal, 2000). Among these, shoot borer (Conogethes punctiferalis Guen.) infests the crop and causes ‘dead heart’ symptoms affecting the crop production. In this regard experiments were carried out to evaluate the turmeric cultivars against turmeric leaf blotch (Taphrina maculens Butler) and shoot borer (C. punctiferalis).
MATERIALS AND METHODS
The field experiment was carried out at the farm field of the division of Plantation, Spices, Medicinal and Aromatic Crops, College of Horticulture, Mysore, during 2012-13. The College of Horticulture, Mysore is situated in southern dry zone of Karnataka situated at 120 30΄ North latitude, 760 42΄ East longitude and at an altitude of 763 meters above from mean sea level.
Scoring of Pest and Disease Incidence: Scoring for leaf blotch disease incidence recorded by natural condition at different stages of crop growth (90, 120, 150 DAP). The scoring was done using the scale 1 to 5.0-0-Leaves free from infection, 1-1-5 per cent leaf area affected, 2-6-20 per cent leaf area affected, 3-21-40 per cent leaf area affected, 4-41–70 per cent leaf area affected, 5-71 per cent and above leaf.
RESULTS AND DISCUSSION
The incidence of shoot borer and leaf blotch disease was noticed during August and September. The data on disease and pest incidence was recorded under natural conditions at different stages of crop growth (90, 120, 150 DAP) and are presented in Table 1. Higher leaf blotch disease incidence was observed in Cuddapah (22.97 %, 27.50 % and 28.33 %) at 90, 120 and 150 DAP, respectively, while the minimum disease incidence was noticed in the cultivars PTS-24 (13.97 %, 15.93 % and 17.00 %) which was on par with Rajapuri (12.73 %, 20.60 % and 17.67 %) at 60, 120 and 150 DAP, respectively. Singh (2011) also screened 22 turmeric entries/ genotypes against Taphrina leaf blotch and found genotype ACC-584and TCP-1 found resistant and rest were moderately resistant in Chhattisgarh state.In the present study maximum incidence of shoot borer (23.42 %, 24.17 % and 24.42 %) in cultivar Cuddapah, which was on par with Belgaum Local (25.00 %, 22.25 %, and 24.42 %), while the minimum incidence was in PTS-24 (5.33 %,
It is I
LLEGAL t
o cop
y, pri
nt or
save
any c
onten
t of th
is PDF,
in pa
rt or in
full,
on an
y retr
ieval
syste
m,
withou
t the E
XPRESS WRITTEN PERMISSIO
N of th
e cop
yrigh
t-hold
er

National Conference on Climate Change and Agricultural Production: Adapting Crops to Climate Variability and Uncertainty, 6th–8th April, 2017
[609]
10.92 % and 12.50 %) and Bidar-1 (10.17 %, 12.17 % and 14.25 %) at 90, 120 and 150 DAP, respectively at different stages of crop growth. None of the accessions was rated as resistant, whereas, 49, 2S1, 130 and 62 accessions were rated as moderately resistant, moderately 'susceptible, susceptible and highly susceptible, respectively, to the pest. Khalko et al. (2011) obtained that leaf blotch susceptibility and tolerance to pest and diseases of cultivars could be attributed to the genetic constituents of the particular cultivars and their reaction to agro-climatic condition in which they are cultivated.
Table 1: Leaf Blotch & Shoot Borer Incidence Recorded in Turmeric Cultivars during 2013 Sl. No.
Cultivars Leaf Blotch Incidence(%) Mean Shoot Borer Incidence (%) 90
DAP 120 DAP
150 DAP
90 DAP
120 DAP
150 DAP
Mean
1 2 3 4 5 6 7 8 9
10 11 12 13 14 15 16
Co-1 Salem Prabha Krishna Rajapuri Prathibha PTS-24 Cuddapah Alleppey Bidar-1 Bidar-4 CLI-327 CLI-14 CLT-325 BelgaumLocall Erode Local
15.73 14.60 15.07 15.97 12.73 14.07 13.97 22.97 15.67 20.07 15.30 13.87 14.97 14.42 15.63 16.57
27.83 23.87 15.23 24.13 20.60 24.17 15.93 27.50 26.03 27.77 28.63 25.70 26.73 27.93 29.03 26.50
17.30 18.00 23.33 22.00 17.67 21.33 17.00 28.33 23.00 26.33 18.67 19.67 19.33 18.00 26.33 24.00
20.28 18.82 17.87 20.92 16.99 19.85 15.62 25.23 21.55 24.72 20.86 19.72 20.33 20.11 23.67 22.35
17.92 18.58 12.67 18.92 20.50 17.58 5.33 23.42 16.92 10.17 24.25 12.50 13.17 18.67 25.00 20.08
18.42 22.50 14.92 19.92 20.50 18.17 10.92 24.17 22.00 12.17 23.58 18.58 14.50 18.58 22.25 19.75
19.50 24.50 13.17 19.92 21.25 21.00 12.50 24.42 23.33 14.25 22.83 19.92 15.17 18.08 24.42 22.25
18.64 21.84 13.60 19.59 20.75 18.90 9.583 24.01 20.74 12.19 23.53 16.99 14.44 18.33 23.90 20.67
S Em ± CD (p=0.05) CV (%)
0.752.1712.0 1.11 3.21 11.44
1.22 3.5 7.61
1.20 3.47 8.30
1.24 3.59 7.74
0.87 2.51 9.94
*DAP-days after plantings
REFERENCES
[1] Khalko S and Chowdhury A K 2011.Varietal reaction of ginger and turmeric against major fungal disease. Crop Research. (Hissar) 42: (1/2/3) 348-350.
[2] Kotikal Y K and Kulkarni K A 2000. Incidence of insect pest of turmeric (Curcuma longa L.) in northern Karnataka.India. Journal of Spices and Aromatic Crops 9 (1): 51-54.
[3] Koya K M A, Devashayam S and Premkumar T 1991. Insect pests of ginger (Zingiberofficinale Rose.) and turmeric (Curcuma longa L.) in India a review. Journal of Plantation Crops19: 1-13
[4] Rao V T 1995. Curing and processing of turmeric in Andhra Pradesh with special reference to Duggirala. Spices Bulletein 4 (1): 91-95. [5] Singh A K 2011.Effect of weather parameters, varietal resistance and fungicides against Taphrinaleaf blotch of Turmeric. Annals of Plant
Protection Sciences 19 (1): 203-260. [6] Srivastva V P and Gupta J H 1977. Fungicidal control of turmeric leaf spot incited by Taphrinamaculans. Indian Journal of Mycology and Plant
Pathology 7 : 76-77
It is I
LLEGAL t
o cop
y, pri
nt or
save
any c
onten
t of th
is PDF,
in pa
rt or in
full,
on an
y retr
ieval
syste
m,
withou
t the E
XPRESS WRITTEN PERMISSIO
N of th
e cop
yrigh
t-hold
er

National Conference on Climate Change and Agricultural Production: Adapting Crops to Climate Variability and Uncertainty, 6th–8th April, 2017
[610]
Screening of Core Rice Germplasm Accession for Resistance to the Brown Plant Hopper, Nilaparvata lugens (STAL)
Atul Kumar Pachauri*, S. Bhandarkar, Deepak Sharma, D.K. Rana and A.K. Sarawgi Department of Genetics and Plant Breeding
Indira Gandhi Agricultural University, Raipur–492012, India E-mail: *[email protected]
Keywords: BPH, Honey Dew Excretion, Nymphal Survival
INTRODUCTION
An approximate 52% of the global production of rice is lost annually owing to the damage caused by various biotic factors, of which ~21% is attributed to the attack of insect pests (Brookes and Barfoot, 2003). Rice is infested by more than hundred species of insects and about twenty of them are considered serious pests as they cause significant damage to rice crop. Among them brown plant hopper (BPH), Nilaparvata lugens (Homoptera: Delphacidae) is one of the most destructive insect pest causing significant yield loss in most of the rice cultivars of Asia.
MATERIALS AND METHODS
The present investigation, ‘Mechanism of resistant in rice genotypes against brown plant hopper, Nilaparvata lugens (Stal) for evaluation of resistance donor’ was conducted under glass house
Plant Material: The experimental material consisted of 600 diverse rice genotypes used for screen against BPH where as TN1 and PTB33 were used as susceptible and resistant check, respectively. The genotypes ranging from land race to improved lines
Standard Seed Box Screening Technique: The experiment was conducted at a temperature of 28 to 30°C and relative humidity of 70 to 80%. The seeds were presoaked and sown in rows in 60 x 45 x 10 cm seed boxes along with resistant and susceptible checks. 25 to 30 seedlings per row were main-tained per genotype. Ten (10) day old seedlings were infested with first instar nymphs at the rate of eight to 10 per seedling.
Honeydew Excretion Test: Filter papers (10 cm diameter) were dipped in a solution of bromocresol green (2mg/ml ethanol) indicator and allowed to dry in sunlight thereby filter paper turned to yellowish orange colour as suggested by (Pathak and Heinrichs, 1982).
Nymphal Survival: The well germinated seeds of selected rice genotypes were sown in 500 ml earthen pots filled with fertilizer enriched puddle soil. After 30 days, the plants were covered by the Mylar tube with ventilating windows.
RESULTS AND DISCUSSION
In all six hundred diverse rice genotypes were used to screening for the identification of resistant source against BPH in the seed box screen test varying moderately resistance to highly susceptible. The results indicated that four lines viz IC454377, IC301732, IC301734, and IC301736 were no damage to the infestation of this insect and categorized as highly resistance on the basis of 0 to 9 scale. In case of honeydew excretion test, all the selected resistant genotypes exhibited average honeydew excretion values varied from 16.23 to 29.54 mm2 per two female in 24 hrs, which was significantly lower than the susceptible check TN1 (65.67). Resistant check PTB33 showed honeydew excretion value of 18.00 mm2 which was lower than all
It is I
LLEGAL t
o cop
y, pri
nt or
save
any c
onten
t of th
is PDF,
in pa
rt or in
full,
on an
y retr
ieval
syste
m,
withou
t the E
XPRESS WRITTEN PERMISSIO
N of th
e cop
yrigh
t-hold
er
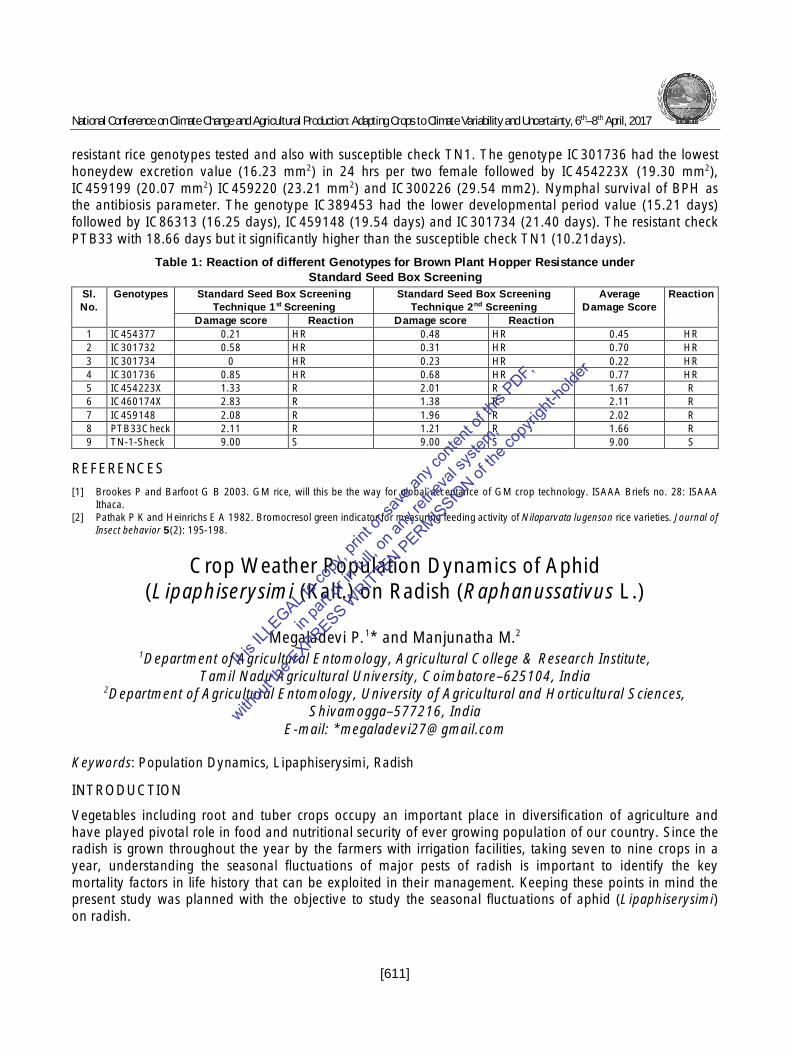
National Conference on Climate Change and Agricultural Production: Adapting Crops to Climate Variability and Uncertainty, 6th–8th April, 2017
[611]
resistant rice genotypes tested and also with susceptible check TN1. The genotype IC301736 had the lowest honeydew excretion value (16.23 mm2) in 24 hrs per two female followed by IC454223X (19.30 mm2), IC459199 (20.07 mm2) IC459220 (23.21 mm2) and IC300226 (29.54 mm2). Nymphal survival of BPH as the antibiosis parameter. The genotype IC389453 had the lower developmental period value (15.21 days) followed by IC86313 (16.25 days), IC459148 (19.54 days) and IC301734 (21.40 days). The resistant check PTB33 with 18.66 days but it significantly higher than the susceptible check TN1 (10.21days).
Table 1: Reaction of different Genotypes for Brown Plant Hopper Resistance under Standard Seed Box Screening
Sl. No.
Genotypes Standard Seed Box Screening Technique 1st Screening
Standard Seed Box Screening Technique 2nd Screening
Average Damage Score
Reaction
Damage score Reaction Damage score Reaction 1 IC454377 0.21 HR 0.48 HR 0.45 HR 2 IC301732 0.58 HR 0.31 HR 0.70 HR 3 IC301734 0 HR 0.23 HR 0.22 HR 4 IC301736 0.85 HR 0.68 HR 0.77 HR 5 IC454223X 1.33 R 2.01 R 1.67 R 6 IC460174X 2.83 R 1.38 R 2.11 R 7 IC459148 2.08 R 1.96 R 2.02 R 8 PTB33Check 2.11 R 1.21 R 1.66 R 9 TN-1-Sheck 9.00 S 9.00 S 9.00 S
REFERENCES [1] Brookes P and Barfoot G B 2003. GM rice, will this be the way for global acceptance of GM crop technology. ISAAA Briefs no. 28: ISAAA
Ithaca. [2] Pathak P K and Heinrichs E A 1982. Bromocresol green indicator for measuring feeding activity of Nilaparvata lugenson rice varieties. Journal of
Insect behavior 5(2): 195-198.
Crop Weather Population Dynamics of Aphid (Lipaphiserysimi (Kalt.) on Radish (Raphanussativus L.)
Megaladevi P.1* and Manjunatha M.2 1Department of Agricultural Entomology, Agricultural College & Research Institute,
Tamil Nadu Agricultural University, Coimbatore–625104, India 2Department of Agricultural Entomology, University of Agricultural and Horticultural Sciences,
Shivamogga–577216, India E-mail: *[email protected]
Keywords: Population Dynamics, Lipaphiserysimi, Radish
INTRODUCTION
Vegetables including root and tuber crops occupy an important place in diversification of agriculture and have played pivotal role in food and nutritional security of ever growing population of our country. Since the radish is grown throughout the year by the farmers with irrigation facilities, taking seven to nine crops in a year, understanding the seasonal fluctuations of major pests of radish is important to identify the key mortality factors in life history that can be exploited in their management. Keeping these points in mind the present study was planned with the objective to study the seasonal fluctuations of aphid (Lipaphiserysimi) on radish.
It is I
LLEGAL t
o cop
y, pri
nt or
save
any c
onten
t of th
is PDF,
in pa
rt or in
full,
on an
y retr
ieval
syste
m,
withou
t the E
XPRESS WRITTEN PERMISSIO
N of th
e cop
yrigh
t-hold
er

National Conference on Climate Change and Agricultural Production: Adapting Crops to Climate Variability and Uncertainty, 6th–8th April, 2017
[612]
MATERIALS AND METHODS
A field experiment was conducted at College of Agriculture, Shivamogga during the year 2014-15. Monitoring was done throughout the year on monthly sown radish crop (var. Arka Nishant) from sowing to harvesting at weekly interval. In the experiment plot, 10 plants were selected at random in zig-zag manner and the "three-leaf method" was used for sampling at weekly interval. Average number of aphids (both nymphs and adults) per plant were calculated using the formula n = 1/N (r1 Σ xl + r2 Σ x2 + r3 Σ x3) where, N = number of plants sampled; r1, r2, r3 = average number of upper, middle and lower leaves per plant, respectively and x1, x2, x3 = number of counted aphid per upper, middle and lower leaf, respectively. Correlation and regression analysis were performed to know the relationship between weather factors and aphid population.
RESULTS AND DISCUSSION
The incidence of aphids was more in winter followed by summer and the decline of L. erysimipopulation at high temperature was also observed which is in agreement with the results of Ghosh and Mitra (1983). The lowest incidence of aphid was recorded during rainy season, which may be probably as result of mortality of aphids due to heavy rains. The aphids on crop had significant positive correlation with maximum temperature and bright sunshine hours [(r= 0.35) and (r= 0.38), respectively] and negative correlation with rainfall, minimum temperature, morning humidity and afternoon humidity [(r=-0.39), (r=-0.38), (r=-0.44) and (r=-0.50), respectively] (Table 1). These weather factors may cause 41 percent changes in the population density of aphids by affecting their reproduction, migration and mortality (Figure 1). Therefore, the above study depicts that the population density of the radish aphid fluctuates widely in the course of investigation with high aphid population during first week of December to last week of April. Hence, it is suggested that farmers should be aware of aphid infestation during these months and plan for its effective management.
Fig. 1: Seasonal Incidence of Aphid (Lipaphiserysimi) on Radish
Table 1: Correlation and Regression between Weather Parameters and the Population of Lipaphiserysimi on Radish#
Pest Population
Rainfall (mm)
Temperature Relative Humidity Sunshine Hours Coefficient of Determination (R2) Max.
ᴼC Min. ᴼC
RH1% (Morning)
RH2 % (Evening)
Lipaphiserysimi -0.39* 0.35* -0.38* -0.44* -0.50* 0.38* 0.41 #N= 30; Table t value @ p=0.05 is 0.34; *significant @ p=0.05
REFERENCE [1] Ghosh M R and Mitra A 1983. Incidence Pattern and population composition of Lipaphiserysimi (Kaltenbach) on mustard and radish. Pranikee4: 43-51.
It is I
LLEGAL t
o cop
y, pri
nt or
save
any c
onten
t of th
is PDF,
in pa
rt or in
full,
on an
y retr
ieval
syste
m,
withou
t the E
XPRESS WRITTEN PERMISSIO
N of th
e cop
yrigh
t-hold
er

National Conference on Climate Change and Agricultural Production: Adapting Crops to Climate Variability and Uncertainty, 6th–8th April, 2017
[613]
Screening of Different Macrophomina phaseolina Isolates on Susceptible (RMG-62) Variety of Mungbean
Paritosh Kumar*, V.K. Gaur and Anand Kumar Meena Department of Plant Pathology,
S.K. Rajasthan Agricultural University, Bikaner–334006, India E-mail: *[email protected]
Keywords: Macrophomina Phaseolina, Dry Root Rot
INTRODUCTION
Dry root rot caused by Macrophomina phaseolina is of wide occurrence in sandy soil of Rajasthan where climatic conditions are dry and temperature remains high. Dry root rot is the most devastating disease in all the mungbean growing districts of Rajasthan particularly in Bikaner, Jaipur, Bhilwara, Bharatpur, Sri Ganganagar, Jodhpur, Kota and Udaipur.
MATERIALS AND METHODS
Dry root rot infected mungbean samples were collected from different field locations, viz. Bikaner, Sawaimadhopur, Churu, Hisar, Delhi, Sri Ganganagar, IARI-5143, Jalana (Maharastra)-5156, Junagarh-6486 and Narnaul. The root samples of diseased plants were used for isolation. Earthen pots (25 cm diameter) were filled with sterilized soil collected from mungbean cultivated areas of Agronomy Farm, College of Agriculture, Bikaner. Sand maize flour medium (10 g maize flour, 90 g sand and 20 ml distilled water in each flask) was autoclaved in 250 ml Erlenmeyer’s flasks. Each flask was inoculated with pure culture isolate of M. phaseolina separately and incubated at 28 ± 1C for 15 days. Fungus infested sand maize flour medium was mixed in soil of each pot with a ratio of 1: 200. The pots were watered regularly and kept moist for two days. Similarly, the pots filled with unsterilized soil were also made sick for testing the pathogenicity. The susceptible mungbean variety RMG-62 was used for testing pathogenicity.
RESULTS AND DISCUSSION
Ten isolates of M. phaseolina tested for their pathogenic nature, using susceptible RMG-62 variety of mungbean were found virulent in sterilized as well as unsterilized soil. Koch’s postulates were proven for isolates. The dry root rot incidence (%) in sterilized soil and unsterilized soil varied from 33.33 to 100 and 26.67 to 83.33, respectively. Isolate Bikaner was most virulent followed by Churu, Hisar, Sri Ganganagar, Junagarh-6486, IARI-5156, Sawaimadhopur, Delhi, Jalana-5156 and Narnaul. Bikaner isolate showed 83.33 per cent disease incidence in unsterilized soil which was less than sterilized soil i.e 100 per cent. In general the mortality of plant in unsterilized soil was reduced over sterilized soil. Similarly Umer and Tariq (2014) isolated 65 isolates of M. phaseolina from Punjab and Khyber Pakhtunkhwa provinces of Pakistan and found variation in their pathogenic nature, thereby confirming the present findings.
It is I
LLEGAL t
o cop
y, pri
nt or
save
any c
onten
t of th
is PDF,
in pa
rt or in
full,
on an
y retr
ieval
syste
m,
withou
t the E
XPRESS WRITTEN PERMISSIO
N of th
e cop
yrigh
t-hold
er

National Conference on Climate Change and Agricultural Production: Adapting Crops to Climate Variability and Uncertainty, 6th–8th April, 2017
[614]
Table 1: Pathogenicity of Ten Isolates of M. phaseolina on RMG-62 Variety of Mungbean in Sterilized and Unsterilized Soil
Isolate Sterilized Unsterilized Average Bikaner 100.00
(90) 83.33
(66.14) 91.67
(78.07) Churu 80.00
(63.43) 66.67
(54.78) 73.34
(59.11) Delhi 56.67
(48.85) 53.33
(46.92) 55.00
(47.89) Hisar 73.33
(59) 63.33
(52.78) 68.33
(55.89) IARI-5143 60.00
(50.77) 56.67
(48.85) 58.34
(49.81) Jalana-5156 50.00
(45) 43.33
(41.15) 46.67
(43.08) Junagarh-6486 63.33
(52.78) 53.33
(46.92) 58.33
(49.85) Narnaul 33.33
(35.22) 26.67
(30.79) 30.00
(33.01) Sawaimadhopur 60.00
(50.85) 46.67
(43.08) 53.34. (46.97)
Sri Ganganagar 70.00 (57)
66.67 (54.78)
68.34 (55.89)
Average 64.67 (55.29)
56.00 (48.62)
60.33 (51.95)
CD (P=0.05) CD (P=0.01) Isolates 5.00 6.66 Soil types 2.23 2.98 Isolates x Soil types 7.07 9.42 CV (%) 8.29
Figures in parentheses are angular transformation values.
REFERENCE [1] Umer I and Tariq M. 2014. Morphological and Pathogenic Variability among Macrophomina phaseolina Isolates Associated with Mungbean
(Vigna radiate L.) Wilczek from Pakistan.The Scientific World Journal 2014:1-9.
Forecasting Model for Mango (Mangifera indica) Malformation in New Delhi and Lucknow
Srinivasa Reddy1* and K. Usha2
1Agricultural College, Aswaraopet, Khammam–507301, India 2Indian Agricultural Research Institute, New Delhi–110012, India
E-mail: *[email protected]
Keywords: Mango, Malformation, Forecasting, Weather Variables
INTRODUCTION
Malformation of mango (Mangifera indica L.) induced by Fusarium mangiferae (Fusarium moniliformae var. subglutinans) is considered as plant disease of international importance. Maksoud and Haggag suggested prediction models to estimate percentage malformation in mango trees and prediction equation was proposed by regression analysis. Relative humidity and temperature may influence malformation incidence in mango, which have direct relationship with fruit-set and yield and lower temperature usually favour the
It is I
LLEGAL t
o cop
y, pri
nt or
save
any c
onten
t of th
is PDF,
in pa
rt or in
full,
on an
y retr
ieval
syste
m,
withou
t the E
XPRESS WRITTEN PERMISSIO
N of th
e cop
yrigh
t-hold
er

National Conference on Climate Change and Agricultural Production: Adapting Crops to Climate Variability and Uncertainty, 6th–8th April, 2017
[615]
development of malformed panicle. Very little is known about the epidemiology of the disease because of the lack of uniformity in its occurrence and variation in the severity of disease from season to season. However no information is available regarding malformation intensity with different weather variables at FBD and flowering stages. Hence the studies were undertaken to know the correlation between mango malformation and different weather variables, and obtaining the forecasting models for New Delhi and Lucknow.
MATERIALS AND METHODS
The experiment was conducted at Division of Fruits and Horticulture technology, IARI, New Delhi during 2004–2007. Historical weather data of fourteen years from 1993 to 2006 for the New Delhi and Lucknow are collected, which were used for correlation and multiple linear regression analysis (MLR). Intensity of mango malformation disease data of New Delhi and Lucknow for fourteen years (1993–2006) were collected from secondary sources and used for analysis. The relationship between weather variables and mango malformation disease intensity per cent were analyzed by using the correlation analysis for their degree of association in development of disease for both flower bud differentiation (FBD) and flowering stages. If the resultant correlation matrix is less than 0.1 means no relation between malformation intensity with that particular weather variable and was excluded in further multiple linear regression analysis. However for FBD stage also used the same malformation disease intensity per cent i.e. flowering period malformation intensity for both correlation and MLR analysis.
RESULTS AND DISCUSSION
The correlation analysis between weather variables and the mango malformation during the FBD stage revealed that the weather variables significantly differed with mango malformation intensity. The bright sunshine hours (-0.43), evaporation (-0.06) and rainfall (-0.03) had showed negative association with mango malformation intensity in ascending order. These are presented in Table 1. The wind speed, RH2, minimum and maximum temperatures were positively correlated with mango malformation. The highest degree of association was noticed with wind speed (0.47) and bright sunshine hours (-0.43). The lower bright sunshine hours, low evaporation demand and less rainfall led to cloudy weather with low light intensity, which led to an increase in RH2 values and minimum temperature. These conditions favoured the disease development. High wind speed during this period helped in spread of mango malformation. The correlation analysis between the weather variables and mango malformation during the flowering stage showed that except rainfall and evaporation, all other variables had significant with mango malformation intensity. The wind speed (0.57) and RH1 (0.12) are positively correlated, which is presented in Table 1. Among the negatively correlated variables highest degree of association was observed with minimum temperature (-0.56) followed by maximum temperature (-0.54). The correlation analysis between the weather variables and mango malformation during the flowering stage showed that high wind speed, RH1 values along with lower temperatures and sunshine hours increased the disease intensity. Multiple regression model developed between the weather variables and mango malformation intensity for Delhi was further used for prediction of disease intensity of mango malformation from 2001–2006. The model developed for predicting the mango malformation at FBD stage showed a per cent deviation range from 6.0 to 17.9, whereas these values for flowering stage ranged from 13.2 to 27.1. Multiple regression model developed between the weather variables and mango malformation for Lucknow was further used for prediction of disease intensity of mango malformation from 2001–2006. The model developed for predicting the mango malformation at FBD stage showed a per cent deviation range from 1.3 to 20.3, whereas deviations for flowering stage ranged from 0.9 to 27.0. Multiple regression models developed between the weather variables and mango malformation at FBD stage under predicted the disease intensity at New Delhi and Lucknow. At flowering stage the disease was over predicted at Lucknow whereas for New Delhi the model under predicted the incidence of malformation.
It is I
LLEGAL t
o cop
y, pri
nt or
save
any c
onten
t of th
is PDF,
in pa
rt or in
full,
on an
y retr
ieval
syste
m,
withou
t the E
XPRESS WRITTEN PERMISSIO
N of th
e cop
yrigh
t-hold
er

National Conference on Climate Change and Agricultural Production: Adapting Crops to Climate Variability and Uncertainty, 6th–8th April, 2017
[616]
Table 1: Correlation Matrix of Mango Malformation Intensity and Weather Variables for New Delhi and Lucknow at Flower Bud Differentiation and Flowering Stages from 1993–2000
Period Location T. max T.min RH1 RH2 WS RF SSH EVP Flower bud differentiation
Delhi 0.25 0.18 0.12 0.21 0.47 -0.03* -0.43 -0.06 Lucknow 0.199 -0.255 0.294 0.179 0.357 0.525 -0.065* 0.054
Flowering Delhi -0.54 -0.56 0.12 -0.32 0.57 -0.03* -0.43 -0.08* Lucknow 0.522 0.610 0.073* -0.267 0.184 0.567 0.226 0.207
*Correlation matrix less than 0.1 are considered as no relation with mango malformation intensity and were excluded for further multiple linear regression analysis
REFERENCE [1] Maksoud M A and Haggag L F. 1995. Prediction models and parameter estimation to evaluate the percentage of mango malformation
phenomenon. I. by determination of some mineral nutrients. Egyptian Journal of Horticulture 22: 89-95.
Biology and Morphometry of Brinjal Shoot and Fruit Borer, Leucinodes orbonalis (Guenee) on Brinjal (Solanum melongena mill.)
Under Laboratory Condition
M.A. Laichattiwar* and R.S. Meena Department of Entomology and Agricultural Zoology, Institute of Agricultural Sciences,
Banaras Hindu University, Varanasi–221005, India E-mail: *[email protected]
Keywords: Biology, Brinjal, Shoot and fruit Borer, Leucinodes Orbonalis
INTRODUCTION
Brinjal (Solanum melongena L.) also known as eggplant is an important solanaceous vegetable crop, which is grown all over the world. The productivity of brinjal is still below the expected due to various constraints of which insect and non-insect pests, considered to be major one. Brinjal fruit and shoot borer, Leucinodes orbonalis (Guenee) (Lepidoptera: Pyralidae) is reported most destructive (Srinivasan, 2008) as the pest species may cause fruit damage as high as 95% and losses up to 70% in commercial plantings (ISAAA, 2007). The study of biology of an insect provides the growth rate statistics, which can be used as a predictive basis of pest control.
MATERIALS AND METHODS
The biology of shoot and fruit borer was studied in the laboratory of department of entomology, BHU, Varanasi, U.P., India. After adult emergence the adult was provided with honey solution fortified with multivitamins and a twig of brinjal plant inside glass jar and moist absorbent sponge was kept over muslin cloth in each jar to maintain humidity and for better egg laying. The rearing larvae will be carried out individually in petriplates and observations pertaining to, larval period and pupal duration and total development will be recorded. For calculating male and female longevity, oviposition duration, fecundity, the male and female adult will be kept in glass jars. The length and breadth of eggs, different instars of larvae, pupae and adult will be measured by using a zoom microscope.
RESULTS AND DISCUSSION
Biology of brinjal shoot and fruit borer, Leucinodes orbonalis Guenee, a major pest of brinjal studied in the year 2015-2016 in the laboratory. The egg incubation period was 4.15±0.88 days. Length and breadth were
It is I
LLEGAL t
o cop
y, pri
nt or
save
any c
onten
t of th
is PDF,
in pa
rt or in
full,
on an
y retr
ieval
syste
m,
withou
t the E
XPRESS WRITTEN PERMISSIO
N of th
e cop
yrigh
t-hold
er
National Conference on Climate Change and Agricultural Production: Adapting Crops to Climate Variability and Uncertainty, 6th–8th April, 2017
[617]
0.64±0.04 and 0.35±0.02 mm, respectively. The duration of 1st, 2nd, 3rd, 4th and 5th larval instar was 1.34±0.29, 2.98±0.36, 3.48±0.33, 3.75±0.35 and 5.04±0.80 days, respectively. The total larval duration was 16.59±2.13, prepupal period 1.44±0.50 days and the pupal period 8.7±0.80 days. The full grown larvae measured 14.09±1.01 mm in length and 3.34±0.21 mm in breadth. The adult longevity of the male was 3.04±0.51 days and of female 5.21±0.73 days and the pre-oviposition, oviposition and post oviposition periods were 1.18±0.13, 2.55±0.51 and 2.63±0.65 days, respectively. Body length of male and female was 8.54±0.90 and 11.01±0.71 mm, respectively. The average fecundity was 160.2±32.42 eggs per female.
REFERENCES [1] ISAAA 2008 http://www.isaaa.org/kc. Bt brinjal in India. Pocket k. No. 35. S.E. Asia Centre, IRRI, DAPO Box 7777, Metro Manila, Philippines. [2] Srinivasan R 2008. Integrated Pest Management for eggplant fruit and shoot borer (Leucinodes orbonalis) in south and southeast Asia: Past,
Present and Future. Journal of Biopesticides 1: 105-112.
Study of Character Association and Path Analysis in Newly Developed Single Crosses of Maize (Zea mays.L)
Mukesh kumar1, Ajay Kumar1, Himanshu Shekhar Garg2, Nitesh Kumar2*and Papia Biswas3
1Department of Plant Breeding & Genetics, Dr. Rajendra Prasad Central Agricultural University, Pusa, Samastipur–848125, India
2Department of Genetics and Plant Breeding, Bidhan Chandra Krishi Viswavidyalaya Mohanpur Nadia–741252, India
3Department of Agronomy, Banaras Hindu University, Varanasi–221005, India E-mail: *[email protected]
Keywords: Correlation, Path analysis, Maize, Single Cross, Yield
INTRODUCTION
Maize is one of the third major cereal crops of importance with high rank in world trade and economy as a food, feed and industrial raw material. The path analysis reveals whether the association of the characters with yield is due to their direct effect on yield or is a consequence of their indirect effects via other component characters. The correlation coefficient indicated the relationship existing between pair of characters. In the present study, an attempt was made to understand the association and path analysis of component characters for grain yield in maize.
MATERIALS AND METHODS
The present investigation comprised of 8 inbred lines of quality protein maize procured from AICRP on maize, TCA, Dholi, Dr. Rajendra Prasad Central Agricultural University, Pusa, Bihar, during kharif 2012. The evaluation trial was conducted with 28 F1’s, 08 parents and 02 checks in complete randomized block design with three replications. The inbred lines were crossed in all possible cross combinations without reciprocal. Observations recorded for traits, namely, plant height, ear height, ear length, ear girth, days to 50 per cent silk, days to 50 per cent tasseling, number of kernel rows per ear and grain yield.
RESULTS AND DISCUSSION
Correlation coefficient of different characters showed that the traits chlorophyll content, ear length, ear girth, kernel rows per ear and 1000 kernel weight had significant association with grain yield as well as among
It is I
LLEGAL t
o cop
y, pri
nt or
save
any c
onten
t of th
is PDF,
in pa
rt or in
full,
on an
y retr
ieval
syste
m,
withou
t the E
XPRESS WRITTEN PERMISSIO
N of th
e cop
yrigh
t-hold
er

National Conference on Climate Change and Agricultural Production: Adapting Crops to Climate Variability and Uncertainty, 6th–8th April, 2017
[618]
themselves. So selection should be exercised considering these characters in breeding programme.Path analysis showed that high direct effect was exhibited by 1000 kernel weight, whereas moderate positive direct effect was recorded by kernel row per ear and ear girth on grain yield. Number of kernel rows per ear showed highly significant and positive correlation with 1000-kernel weight and its correlation with grain yield was significant and positive.So these traits may be directly subjected for improvement in maize breeding programme. All the traits viz., chlorophyll content, ear girth, kernel rows per ear, ear length, plant height, ear height, days to 50 per cent silking and days to 50 per cent tasseling exhibited high indirect effect through 1000 kernel weight on grain yield. Thus, it implicated from above discussion that the trait 1000 kernel weight have to be given importance in selection process along with ear girth and kernel row per ear for improvement in yield, since they had positive correlation with grain yield, positive inter correlation among themselves and moderate to high direct effect towards grain yield.
Table 1: Phenotypic Correlation Coefficient Betweenpairs of Quantitative Characters Sl. No. Characters Days to
50% Tesseling
Days to 50%
Silking
Plant Height (cm)
Ear Height (cm)
Chlorophyll Content
Ear Length (cm)
Ear Girth (cm)
Kernel Rows/ Ear
1000 Kernel
Wt.(cm) 1 Days to 50% Tesseling 1 2 Days to 50% Silking 0.830** 1 3 Plant Height (cm) 0.493** 0.429** 1 4 Ear Height (cm) 0.431** 0.386** 0.890** 1 5 Chlorophyll Content 0.357** 0.407** 0.370** 0.294** 1 6 Ear Length(cm) 0.249** 0.210* 0.326** 0.304** 0.336** 1 7 Ear Girth(cm) 0.481** 0.472** 0.497** 0.432** 0.641** 0.510** 1 8 Kernel Rows/ Ear 0.429** 0.433** 0.524** 0.461** 0.628** 0.431** 0.645** 1 9 1000 Kernel Wt.(cm) 0.536** 0.522** 0.563** 0.502** 0.703** 0.417** 0.696** 0.824** 1
10 Grain Yield (kg/ha) 0.555** 0.539** 0.581** 0.509** 0.640** 0.435** 0.720** 0.819** 0.934** * and **: Significant at 5 % and 1 % level of significance respectively.
REFERENCES [1] Beiragi M A, Ebrahimi M, Mostafavi K, Golbashy M and Khorasani S K 2011. A studyof morphological basis of corn (Zea mays L.) yield under
drought stress condition using correlation and path coefficient analysis. Journal of Cereals and oilseeds2(2): 32-37 [2] Bello B O, Abdulmaliq Y, Afolabi S M, Igend A S 2010. Correlation and path coefficient analysis of yield and agronomic characters among open
pollinated maize varities and their F1 hybrids in a diallel cross. African Journal of Biotechnology 9(18): 2633-2639
Screening for Drought Tolerance in Eggplant (Solanum melongena L.) Genotypes Using Polyethylene Glycol (PEG-6000)
Gobu R.1*, Harish Babu B.N.2, Shankar M.1 and Kailash Chandra1
1Department of Genetics and Plant Breeding, Institute of Agricultural Sciences, Banaras Hindu University, Varanasi–221005, India
2College of Horticulture, Hiriyur, University of Agricultural and Horticultural Sciences, Shivamogga, Karnataka–577598, India
E-mail: *[email protected]
Keywords: Egg Plant, Brinjal, PEG-6000, Drought Tolerance, in vitro
INTRODUCTION
Eggplant or brinjal is grown in all the eight vegetable growing zones of India. Vegetables being an uncompromised part in everyday diet, is given much less emphasis for drought tolerance research. India
It is I
LLEGAL t
o cop
y, pri
nt or
save
any c
onten
t of th
is PDF,
in pa
rt or in
full,
on an
y retr
ieval
syste
m,
withou
t the E
XPRESS WRITTEN PERMISSIO
N of th
e cop
yrigh
t-hold
er

National Conference on Climate Change and Agricultural Production: Adapting Crops to Climate Variability and Uncertainty, 6th–8th April, 2017
[619]
being the center of origin of brinjal has a vast germplasm collection. Screening for such a large collection in field condition is tedious, erroneous, laborious and requires more land. The study of the influence of drought stress using osmotic solutions in germinalphase is one of the alternative methods for drought tolerance screening. Hence, preliminary screening to identify potential drought tolerant cultivars/donors was carried out using Polyethylene Glycol (PEG-6000) under in vitro conditions.
MATERIALS AND METHODS
Seventy three genotypes were screened for their tolerance to moisture stress during 2015, in College of Horticulture, Hiriyurusing PEG-6000 at 12 % (equivalent to–0.7 MPa, as described by Michel and Kaufmann, 1973) and also at 0% PEG-6000 (as control). The observations on germination per cent, root length, shoot length, seedling length, seed vigour, root to shoot ratio, root length stress tolerance index, plant height stress tolerance index, fresh weight of seedlings and total dry matter were recorded on tenth day after incubation. The statistical analysis of the data was carried out on the mean values of ten random plants and analyzed by using Windostat software.
RESULTS AND CONCLUSION
To know the effects ofinduced osmotic stress on various traits, per cent change in mean of each trait under stress condition compared with normal condition (Control) was computed and found that germination percent, root length, shoot length, seedling length, seed vigour and fresh weight was reduced by 42.13, 15.80, 62.87, 36.24, 51.49 and 52.01 percent respectively, whereas, dry weight and root to shoot ratio was increased by 1.13 and 112.41 percent respectively. Even under the osmotic stress induced by 12% PEG-6000, six genotypes recorded 100 per cent germination andsix genotypesshowed superior performance by producing more than 8.00 cm root length under stress condition. The maximum root to shoot ratio (more than 8) was recorded in five genotypes. Ten genotypes showed good performance by producing more than 6 mg of dry weight per seedling. Eleven genotypes showed superior performance for Root length stress tolerance index and plant height stress tolerance index. Among the 73 genotypes, the genotypes R-2591, R-2594, L-3268, Pusa Purple Long, Co-2, Malapur Local, Jawahar Brinjal–69, Bhagyamati, IVBL–9, Punjab Barsati, IC49358, Jawahar Brinjal–8, IC397557, LalGulab and Arka Kranti performed well showing their better tolerance capacity. So, it’s concluded that, these better drought tolerantcultivars can be suggested for cultivation in rainfed/water scare areas or can be effectively utilized in developing drought tolerant cultivars.
Table 1: Overall Mean Performance of 73 Eggplant Genotypes under Induced Osmotic Stress (12 % PEG-6000) and Normal Condition (0 % PEG-6000) in in vitro Experiment
Characters PEG-6000 Concentrations Changes in Mean Value under Stress Conditions Compared to Non-stress
Conditions
Change in Per Cent Mean under Moisture Stress Conditions
Compared to Non-stress Conditions
0 % (Control) 12 %
Germination percent (%) 80.37 46.51 -33.86 -42.13 Root length (cm) 4.81 4.05 -0.76 -15.80 Shoot length (cm) 3.69 1.37 -2.30 -62.87 Seedling length (cm) 8.50 5.42 -3.08 -36.24 Seed vigour 718.8 348.72 -370.08 -51.49 Root to shoot ratio 1.45 3.08 + 1.63 + 112.41 Fresh weight (mg) 28.32 13.59 -14.73 -52.01 Dry weight (mg) 3.54 3.58 + 0.04 + 1.13
+ Sign indicates increase in mean value of the concerned trait in stress condition over non-stressed condition,-Sign indicates decrease in mean value of the concerned trait in stress condition over non-stressed condition
REFERENCE [1] Michel B E and Kaufmann M R 1973. The Osmotic Potential of Polyethylene Glycol 6000. Plant Physiology 51: 914-916.
It is I
LLEGAL t
o cop
y, pri
nt or
save
any c
onten
t of th
is PDF,
in pa
rt or in
full,
on an
y retr
ieval
syste
m,
withou
t the E
XPRESS WRITTEN PERMISSIO
N of th
e cop
yrigh
t-hold
er

National Conference on Climate Change and Agricultural Production: Adapting Crops to Climate Variability and Uncertainty, 6th–8th April, 2017
[620]
Effect of Trichoderma Strains IRRI BMP on Growth, Nodulation and Yield of Lentil under Lowland Rainfed Ecology
Mandhata Singh*, Deokaran, Santosh Kumar, U.R. Sangle, J.S. Mishra and B.P. Bhatt ICAR Research Complex for Eastern Region, Patna, Krish Vigyan Kendra, Buxar–802103, India
E-mail: *[email protected]
Keywords: Economics, Nodulation, Seed Treatment, Trichoderma, Yield
INTRODUCTION
Seed treatment with microbial strains can enhance the root growth which helps in absorbing water from deeper layer of the soil and maintain proper crop growth during moisture stress condition. Some Trichoderma rhizosphere-competent strains have shown effects on plants, increasing their growth potential and nutrient uptake, fertilizer use efficiency, percentage and rate of seed germination, and stimulation of plant defenses against biotic and abiotic damage (Shoresh et al., 2010). Productivity of rainfed ecology is very low and lentil crop faced the problem of fungal disease. Keeping these facts an experiment was planned to evaluate the performance of lentil crop with microbial strain of S1 and S3 coupled with IRRI BMP (Best Management Practices) in rainfed lowland ecology.
MATERIALS AND METHODS
A field experiment was conducted during winter season 2013-14 and 2015-16, at the Research farm (25˚34’6.33”N, 83˚59’0.18” E and 63 m above sea level) of KrishiVigyan Kendra (ICAR Research Complex for Eastern Region), Buxar and farmers field of Buxar district. Treatment comprised viz., T1-S1 @ 10g/kg seed+IRRI BMP (Best Management Practices),T2-S3 @ 10g/kg seed+IRRI BMP,T3-Thiram 2.5 g/kg+IRRI BMP and, T4-Farmers’ practice (control). Lentil variety HUL-57 used for test crop. Crop was sown on first week of December in each year. All the cultural practices were followed as per package of practice. The data on various growth and yield attributes, nodule, seed and straws were recorded under various treatments.
RESULTS AND DISCUSSION
The number of branches/plant in seed treatment with S1+ IRRI BMP and S3+IRRI BMP were similar (6), and significantly higher than other two treatments. Number of pods/plant (59.6) was highest with seed treatment with S3+IRRI BMP followed by S1+IRRI BMP and Thiram+IRRI BMP. However, farmers’ practice recorded lowest value of all these traits. Seed treatment with S3+IRRI BMP recorded highest 100-grain weight (2.60 g) followed by seed treatment with S1+ IRRI BMP and Thiram+IRRIBMP, whereas minimum (2.41g) was recorded with farmers’ practice. Highest number of nodules/plant (15.80) and dry matter of nodules, (37.12 mg/plant) were observed under seed treatment with S3+IRRI BMP followed by S1+IRRI BMP and Thiram+IRRIBMP in orderand significantly superior over rest of the treatments (Hermosa et al., 2012). Root length at maturity, root dry weight and seed yield was influenced by different seed treatment practices. Seed treatment with S3+IRRI BMP recorded highest root length (25.2 cm), root dry weight (0.90 g/plant) and seed yield (13.33 q/ha) followed by seed treatment with S1+IRRI BMP and Thiram+IRRIBMP in order (Sharma et al., 2012). Economic analysis of data showed that maximum net return (Rs 23489/ha) and cost-benefit ratio (2.42) was recorded under seed treatment with strain S3+IRRI BMP followed by seed treatment with S1+IRRI BMP and Thiram+IRRI BMP. However, minimum economic return was recorded with farmers’ practice.On the basis of above results lentil seed treatment with Trichodermaharzianum strain S3+BMP was found suitable for enhancing the crop growth, nodulation, root growth and produced the higher seed yield. Net return and cost-benefit ratio were also higher under seed treatment with strain S3+BMP.
It is I
LLEGAL t
o cop
y, pri
nt or
save
any c
onten
t of th
is PDF,
in pa
rt or in
full,
on an
y retr
ieval
syste
m,
withou
t the E
XPRESS WRITTEN PERMISSIO
N of th
e cop
yrigh
t-hold
er

National Conference on Climate Change and Agricultural Production: Adapting Crops to Climate Variability and Uncertainty, 6th–8th April, 2017
[621]
REFERENCES [1] Hermosa R, Viterbo A, Chet I, and Monte E 2012.Plant-beneficial effects of Trichoderma and of its genes.Microbiology 158:17-25. [2] Sharma P, Patel A N, Saini M K and Deep S2012. Field demonstration of Trichoderma harzianum as a plant growth promoter in wheat
(Triticumaestivum L.).Journal of Agricultural Science 4(8): 65-73. [3] Shoresh M, Harman G E and Mastouri F 2010. Induced systemic resistance and plant responses to fungal biocontrol agents.Annual Review of
Phytopathology 48: 21-43.
Population Dynamics and Foraging Pattern of Different Honeybees on Toria (Brassica compestris)
B.B. Singh1*, Manish Kumar2 and H.Chand3 1Deptartment of Entomology, 2Department of Ag. Engineering
1,2NCOH, Noorsarai–803113, India 3Department of Entomology, SRI, DRPCAU, Pusa–848125, India
E-mail: *[email protected] Keywords: Foraging, Population, Apis spp.
INTRODUCTION
Brassica campestris var toria is an important rabi oilseed crop of India. It is highly cross-pollinated crop and it attracts many insects, particularly honey-bees. It provides or secrets copious nectar flow. Honeybees have been recognized as important pollinators of toria while foraging for nectar or pollen. Honeybees and flowers seemed to have evolved together. Therefore, It was of great interest to study the Population Dynamics and foraging pattern of different species of honeybees on cultivar or toria flowers.
MATERIALS AND METHODS
The experiment was conducted at university apiary, Rajendra Agricultural university, Pusa (Bihar) in rabi season to assess the Population Dynamics and foraging pattern of Different species of honeybees on cultivars of Brassica compertris var toria. Toria varieties viz RAUTS-17 was sown of 15 october 2006 in the premises of University Apiary, RAU, Pusa (Bihar) following the recommended agronomical practices. The crop came into bloom after 35 days of sowing. The foraging activity of Apis mellifera, Apis cerana indica, Apis dorsata and Apis florae were observed on toria flowers. These bees foraged for nectar, pollen or both at different hours of the day were recorded at weakly interval from 26 November to 17 December, 2006. The observation on initiation was recorded in the morning hours at the entrance gate of the beehive to know the starting time of foraging and also observed during evening hours the cessation time of the bees activity.
RESULTS AND DISCUSSION
Among the Apis spp, A. Mellifera dominated over all the other species of honey bees on 3 December (15.50) followed by A. florea (13.08), A. dorsata (11.66), while the lowest population was for A. c. indica (8.25) The population of Apis spp, showed significant variations on different hours of the days was highest (16.50) on 3 December at 1300h followed by 26 November (15.66) and the lowest population was (4.91) on 17 December. The population of Apis mellifera was highest (22.00) on 3 December at other spp. of honeybees the same trend was recorded on the same date and time. The abundance of Apis spp, on toria was recorded when maximum temperature was (20.00 C) and low humidity (60.75%) and a minimum temperature (15.25C) and high humidity (84.33%) Apis mellifera were the dominant visitors among all the Apis spp. the bees under study invariably irrespective of species visited more and more number of flower per minute during morning and evening i.e. 1030 hrs and 1530 hrs. There two peaks of honey bees activity i.e. 1100h
It is I
LLEGAL t
o cop
y, pri
nt or
save
any c
onten
t of th
is PDF,
in pa
rt or in
full,
on an
y retr
ieval
syste
m,
withou
t the E
XPRESS WRITTEN PERMISSIO
N of th
e cop
yrigh
t-hold
er

National Conference on Climate Change and Agricultural Production: Adapting Crops to Climate Variability and Uncertainty, 6th–8th April, 2017
[622]
and 1300h. the maximum peaks of honey of activates were at 1300 hour on 3 December and 26 November The lowest activities were at 1500 h on 17 Similar results were obtained by Sinha and Atwal that the Apis mellifera was most abundant among all the four species of honeybees.Foraging activity of honeybees observed on toria reveals that A. Mellifera started foraging earlier (0835h) on all the dates followed by A dorsata (0839h), A. c. Indica (0860h) and late initiation by A.florea (0893h) while foraging ceased earlier by A. florea(1588h) followed by A c indica (1594h), A. dorsata (1610h) and latter ceased by A. mellifera (1615h), the maximum foraging period was by A. mellifera (7.39h) followed by A. dorsata (7.31h) and A.c. indica (7.04h), while A. florea had minimum foraging period (6.76h), Initiation-ceasstion of Apis spp depends upon temperature and relative humidity. Chand, Singh and Hameed.reported that Apis mellifera initiated foraging earlier and ceased foraging an hour earlier than other Apis spp. when the atmospheric temperature and light intensity were high and the relative humidity was low.
REFERENCES [1] Sinha S N and Atwal S S 1996. Pollination requirement in sunflower hybrid seed production. Seed Research 24 : 110-115 [2] Chand H, Singh R and Hameed S F 1994. Population dynamics and insect pollination in Indian mustard (Brassica juncea L.). Journal of
Entomological Research 18:233-239
Assessment of Quantitative Differences among Diverse Genotypes of French Bean (Phaseolus vulgaris L.) for Yield and
Yield Attributing Traits
Vaibhav Singh1, Anand Kumar Singh1, Durga Prasad Moharana1*, Bhagat Singh1 Deepak Kumar Jaiswal2 and Dhirendra Kumar Singh3
1Department of Horticulture, 2Department of Entomology and Agricultural Zoology 1,2I. Ag. Sc., BHU, Varanasi–221005, India
3Department of Genetics and Plant Breeding, I. Ag. Sc., BHU, Varanasi–221005, India E-mail: *[email protected]
Keywords: French Bean, Component Traits, Genetic Variability, Inheritance
INTRODUCTION
Frenchbean (Phaseolusvulgaris L.) is a legume crop belonging to the family Leguminosae with the chromosome number of 2n=2x=22 and originated in Central and South America. Phenotypic expression of the plant is mainly governed by the genetic makeup of the plant and environment effect. Hence, the study of genetic variability for yield and yield contributing characters of available genotypes are essential. To exploit the existing genetic variability in French bean, the breeder would need the basic information regarding the inheritance of grain yield and its closely related components for devising an efficient selection programme.
MATERIALS AND METHODS
The present experiment was carried out during Rabi season of 2012–13 at Vegetable Research Farm, Department of Horticulture, Institute of Agricultural Sciences, Banaras Hindu University, Varanasi, U.P. (India). The experiment was laid out in Randomized Complete Block Design (RBD) with 21 genotypes of french bean and replicated thrice. The mean values of the genotypes were used for analysis of variance.
It is I
LLEGAL t
o cop
y, pri
nt or
save
any c
onten
t of th
is PDF,
in pa
rt or in
full,
on an
y retr
ieval
syste
m,
withou
t the E
XPRESS WRITTEN PERMISSIO
N of th
e cop
yrigh
t-hold
er

National Conference on Climate Change and Agricultural Production: Adapting Crops to Climate Variability and Uncertainty, 6th–8th April, 2017
[623]
RESULTS AND DISCUSSION
The present investigation was carried out on 21 diverse genotypes of french bean in order to assess the quantitative difference among the genotypes of french bean for yield and yield attributing characters under agro-climatic conditions of Varanasi (Uttar Pradesh), India. The population was found to be significant for traits namely,days to first flowering, days to first picking, number of pods per plant, plant height, primary branches per plant, pod yield per plant and pod yield per hectare. The critical analysis of the findings of the present investigation indicates that the genotype differed among themselves in their growth, flowering, fruit characters and yield related traits. The pod yield per hectare is the main trait which plays an important role in yield of the crop. The pod yield per hectare ranged from 87.93 (RLFB-58) to 138.88 (HOR-137). The highest pod yield per hectare was recorded by 138.88 (HOR-137), followed by PDR-14 (138.56) and EC-592938 (138.35 g). On the basis of results of this experiment it can be concluded that earliness behavior of the genotypes was not good for high yield while most of the high yielding genotypes were showed late maturity. In the present experiment, LVFB-2, RLFB-58 and RCFB-64 were found early maturing genotypes which may be used for the development of short duration cultivars.
REFERENCE [1] RaiN, Singh P K, Verma P K, and Choubey T 2010. Hierarchical analysis for genetic variability in pole type french bean. Indian Journal of
Horticulture (Special issue) 67(12), 150-153.
Efficacy of Acetamiprid against Brown Plant Hoppers (Nilaparvatalugens Stal) in Rice
Raju K. Panse1*, A.P. Bhandarkar2, Atul Shrivastava3 S.K. Rajak4 and D.M. Kadam5 1,2Department of Entomology, 3Department of Agronomy
4Department of Agricultural Economics, 5Department of Farm Power and Machinery 1,2,3,4,5Agriculture College, Waraseoni–481331, India
E-mail: *rkpanseentogmail.com
Keywords: Neonicotinoid, Brown Plant Hopper, Acetamiprid
INTRODUCTION
Rice constitutes 52 per cent of total food grain production and 55 per cent of total cereal production in India. The insect pests are a major constraint in rice production. Yield loss due to insect pests of rice ranges from 25 to 51 per cent (Panda and Rath, 2003). Brown plant hopper damages growing plants by sucking sap directly and the affected plants become chlorotic and the leaves dry up gradually, resulting in the death of plants. Currently, chemical control is still a major method for suppressing N. lugens. Therefore, the present study was conducted to assess the relative toxicity of Acetamiprid under different doses against brown plant hopper population.
MATERIALS AND METHODS
Field experiment on the evaluation of Acetamiprid 20% SP for BPH was conducted at experimental field, college of Agriculture, Waraseoni, Balaghat, M.P. during kharif, 2015 with seven treatments replicated thrice following randomized block design. Seven treatments contained five different doses of Acetamiprid 20% SP at 10, 20, 30, 40 and 80 g ai./ha, imidacloprid 17.85 SL 25 ml a.i./ha along with control. Two successive sprays of selected insecticides were conducted at 15 days interval. Observation was taken at one day before and on one, five, seven and 15 days after each spray.
It is I
LLEGAL t
o cop
y, pri
nt or
save
any c
onten
t of th
is PDF,
in pa
rt or in
full,
on an
y retr
ieval
syste
m,
withou
t the E
XPRESS WRITTEN PERMISSIO
N of th
e cop
yrigh
t-hold
er

National Conference on Climate Change and Agricultural Production: Adapting Crops to Climate Variability and Uncertainty, 6th–8th April, 2017
[624]
RESULTS AND DISCUSSION
In our overall findings, we found that acetamiprid performed very good spectrum of action throughout the seasons against BPH population than the imidacloprid. Acetamiprid showed quick knock down in action and restrained to build up the population of BPH up to harvesting stage. Neonicotinoid insecticides belong to a new insecticide class which act as competitive inhibitor of nicotinic acetylcholine receptors in the central nervous system. Their systemic property and long residual activity make them ideal insecticides against sucking pests. In the present study, acetamiprid was found to be quite safe to Wolf spider. In all observations favorable ratio of BPH and Wolf spider was noted after acetamiprid treatments which indicated that these insecticides were safe to the population of Wolf spider. Spider population did not exhibit appreciable differences among the treatments in the experiment (Vijayaraghavan and Regupathy, 2006).
REFERENCES [1] Panda B M and Rath L K 2003.Efficacy of certain newer formulation of insecticides for the control of Sogatella furcifera (Horvath) in rice. Indian
Journal of Plant Protection 31(2):28-30. [2] Vijayaraghavan C and Regupathy A 2006.Impact of thiomethoxam on spiders in sugarcane ecosystem. Journal of Plant Protection and
Environment 3(1):36-39.
Table 1: Relative Efficacy of Different Treatment of Acetamiprid 20% SP against BPH Treatment (ml or g/ha)
ADBS (BPH/hill)
Over all Mean BPH/hill Reduction Over Control
(%)
Spider/ Hill
Yield (q/ha)
B.C. Ratio
T1-Acetamiprid 20% SP 10 14.30
5.38 (2.42)
61.56 3.33
34.02 1:2.23
T2-Acetamiprid 20% SP 20 11.10
4.18 (2.16)
74.98 3.00
37.42 1:4.26
T3-Acetamiprid 20% SP 30 12.57
6.19 (2.59)
71.54 3.00
36.58 1:3.98
T4-Acetamiprid 20% SP 40 14.10
5.55 (2.46)
69.60 2.67
34.89 1:2.82
T5-Acetamiprid 20% Sp 80 11.83
6.88 (2.72)
68.71 3.00
33.00 1:1.01
T6--Imidacloprid 17.8 Sl 25 12.00
8.30 (2.97)
55.51 3.67
34.20 1:2.16
T7-Control - 12.17
18.02 (4.30)
- 3.67
32.15 1:0.89
CD (p=0.05) NS (1.17) - - - ADBS= A day before spray, BPH= Brown plant hopper, Data in parentheses are square root x+0.5 transformed values.
Combining Ability Analysis in Maize (Zea mays L.) over Multi Environment
Birender Singh1*, R.S. Rai2 and A.K. Singh3
1Dept. of Plant Breeding & Genetics, Bihar Agricultural University, Sabour–813210, Bhagalpur 2Dept. of Plant Breeding & Genetics, Tirhut College of Agriculture, Dholi, Muzaffarpur–843121, India
3Vice Chancellor, Bihar Agricultural University, Sabour–813210, Bhagalpur, India E-mail: *[email protected]
Keywords: Diallel, Combining Ability, Crosses, Hybrid, Zea Mays
INTRODUCTION
Bihar is one of the largest maize growing state and the crop was grown primarily as a subsistence crop to meet feed and food needs in state. Thirteen lakh farmers in state are producing ten per cent of nation maize
It is I
LLEGAL t
o cop
y, pri
nt or
save
any c
onten
t of th
is PDF,
in pa
rt or in
full,
on an
y retr
ieval
syste
m,
withou
t the E
XPRESS WRITTEN PERMISSIO
N of th
e cop
yrigh
t-hold
er

National Conference on Climate Change and Agricultural Production: Adapting Crops to Climate Variability and Uncertainty, 6th–8th April, 2017
[625]
production on 7 lakh hectares. To meet the rising demand of maize for food, feeds and industrial, there is a vital need for sustainable intensification of maize system. Many parts of North Bihar is generally affected by flood. Whereas, repeated drought and scanty rainfall during kharif season forced farmers to select new crop which needed less water requirement in comparison to rice crop. Consequently, farmers switch over to maize instead of paddy in kharif season. Short duration maize varieties which are available in the market are generally low yielder. Maize breeders are interested in identifying parental lines possessing high and stable specific combining ability in their hybrid combination that can produce useful hybrids. The knowledge of combining ability of the parental lines and their crosses is an initial step towards achieving the GCA of hybrid development. The economical and combination of vigorous hybrids largely depends on the high yielding suitable combination of vigorous inbred lines. Since, combining ability helps to study nature and magnitude of genotypic variability and to facilitate correct choice of parents in hybrid programme. The present investigation has been, therefore undertaken to obtain information on consistent combining ability of parents and crosses over environment.
MATERIALS AND METHODS
Ten inbred lines of maize of diverse origin were sown in the breeding nursery during Rabi season and they were crossed in a diallel fashion excluding reciprocals. The Parents were also sibbed for their maintenance. In the following Kharif season forty five F1’s, ten parental inbred lines and two checks were evaluated in the three environments (three different dates of sowing) in randomized complete block design with three replication at Dholi Farm of Tirhut College of Agriculture, Dholi, Muzaffarpur, (RAU, Pusa), Bihar. The diallel analysis based on Model-1, Method-ll of Griffing (17) and combining ability over several environments were followed in the present investigation.
RESULTS AND DISCUSSION
The pooled analysis of variance for combining ability showed significant difference due to GCA and SCA for all the characters under study. This indicated the presence of considerable variability for additive and non-additive gene effects. Themagnitude of component of variances indicated importance of non-additive genetic variance and its interaction with the environments for eleven traits whereas; it indicated importance of additive genetic variance for the traits 500 kernel weight. The parent CM 601was identified as the best general combiner for grain yield and its component traits. Although, it was average combiner for early maturity and best combiner for ear length, girth and number of kernel rows. Similarly, the parents CML-3, POP 49 and CML-107 were also identified as good general combiner for grain yield and yield attributing traits. The cross combination {(M9 x CM601) X CML 3} was found to be best specific combination for grain yield and yield attributing traits followed by (CML-83 x CML-14), (Pop 34 x CML-14) and (CM601 x Pop 34) and these crosses were found to be promising for desirable traits. These parents may be exploited in the development of hybrid maize for higher and stable yield.
REFERENCES [1] Griffin B 1956. Concept of general and specific combining ability in relation to diallel crossing systems. Australian Journal of Biological
Sciences9: 463-493. [2] Singh D. 1973. Diallel analysis for combining ability over several environments. Indian Journal of Genetics 33(3): 469-481.
It is I
LLEGAL t
o cop
y, pri
nt or
save
any c
onten
t of th
is PDF,
in pa
rt or in
full,
on an
y retr
ieval
syste
m,
withou
t the E
XPRESS WRITTEN PERMISSIO
N of th
e cop
yrigh
t-hold
er

National Conference on Climate Change and Agricultural Production: Adapting Crops to Climate Variability and Uncertainty, 6th–8th April, 2017
[626]
Graphical Analysis for Yield and Yield Attributing Traits in Brinjal (Solanum melongena L.)
K. Hussain, S.H. Khan, B. Afroza, S.B. Zehra*, F. Mushtaq, M.I. Mukhdoomi and S. Muftiand G. Nazir
Sher-e-Kashmir University of Agricultural Sciences and Technology of Kashmir, Shalimar–190025, India
E-mail: *[email protected]
Keywords: Solanum melongena L., Diallel, Graphical Analysis
INTRODUCTION
Diallel analysis helps in understanding the genetic control of the trait, which guides the breeder to advance and select segregating populations (Cruz and Regazzi, 1994). For carrying out the combining ability analysis and genetic component analysis, it is assumed that an additive dominance model with additive environmental effects and independence of genes (absence of epistasis) exists while making the diallel set of crosses. The Wr, Vr statistic provides an estimate of the relative number of dominance to recessive genes present in the common arrays of the parents. The position of the regression line in the graph indicates the degree of dominance and we can construct parabola limits in this graph. The interpretation of the results of this analysis is easy and straight forward if the main assumptions of the diallel analysis are fulfilled.
MATERIALS AND METHODS
The experimental materials for the present investigation consisted of ten diverse parental lines viz., Pusa Purple Cluster (P1), ArkaNidhi (P2), PusaKranti (P3), SBPL-27 (P4), ArkaKusumakar (P5), SBW-11 (P6), GBL-1 (P7), GOB-1(P8), Pusa Purple Long (P9) and Local Long (P10) crossed in a diallel fashion during Kharif 2011 and 45 cross combinations were generated as per method II and Model-I (Griffing 4 & 5). The parents and F1 crosses were evaluated during at each of the three different locations/ environments in Kashmir The observations were recorded on days to first flowering, days to first fruit set, days to first fruit picking, plant height (cm), plant spread (cm), number of branches plant-1, fruit length (cm), fruit diameter (cm), number of fruits plant-1, average fruit weight (g), fruit yield plant-1 (kg), fruit yield (q ha-1). The data thus generated, was subjected to standard statistical procedures to generate the results.
RESULTS AND DISCUSSION
A lot of diversity was present with respect to all the traits as depicted by scattered positions of parental arrays in the Wr-Vr graphs. The regression line intersecting the Wr axis below the origin for all the traits indicated over dominance. Position of the parental arrays on the graphs indicated the importance of both dominant and recessive alleles for different traits under study The position of parental arrays in the graph were scattered suggesting genetic diversity among the parents for fruit yield/ plant. The graphical analysis revealed that the regression line was intersecting the Wr axis below the point of origin in E1 and E2 suggesting over dominance for this trait (Fig. 1). The position of parents on the graph indicated importance of both dominance and recessive alleles for the inheritance of this trait. Parents showing more of the dominant alleles were observed for Pusa Purple Cluster, ArkaNidhi, PusaKranti, SBPL-27, ArkaKusumakar, SBW-11 and Pusa Purple Cluster whereas parents GBL-1 and Pusa Purple Long revealed more of the recessive alleles. None of the parents revealed equal importance of both dominant and recessive alleles.
It is I
LLEGAL t
o cop
y, pri
nt or
save
any c
onten
t of th
is PDF,
in pa
rt or in
full,
on an
y retr
ieval
syste
m,
withou
t the E
XPRESS WRITTEN PERMISSIO
N of th
e cop
yrigh
t-hold
er

National Conference on Climate Change and Agricultural Production: Adapting Crops to Climate Variability and Uncertainty, 6th–8th April, 2017
[627]
Fig. 1: Fruit Yield/Plant
REFERENCE
[1] Cruz., C D and Regazzi A J 1994. Modelos biometrics aplicado saomelhoramento genetic. Vicosa: UFV, pp 390.
Insect Community in Agro Forestry: Role of Weather Parameters on Population Dynamics
Md. Ruhul Amin Department of Entomology, Bangabandhu Sheikh Mujibur Rahman Agricultural University, Gazipur
E-mail: [email protected]
Keywords: Agroforestry, Citrus, Mango, Pineapple, Pest, Predator, Pollinator, Seasonal Dynamics
INTRODUCTION
Agroforsetry is an agricultural system which constitutes with the diversity of plants, and provides habitat for pests, predators and pollinators, which are linked to crop productivity (Donald 2004). Seasonal variations of the temperature, humidity, rainfall and sunshine play vital role in multiplication, growth, development and distribution of insects, and influence on their population dynamics. This study was designed to clarify the pest, predator, and pollinator insects associated with citrus, mango and pineapple crops grown in an agroforestry in Bangladesh, and to know the insect abundance, richness and diversity; and the impacts of climatic conditions on their population dynamics.
MATERIALS AND METHODS
The study was conducted in theagroforestry area of Bangabandhu Sheikh Mujibur Rahman Agricultural University, Gazipur, Bangladesh during 2015–2016. Fortnightly sweeping was done by sweep net in order to collect insects. During collecting leaf, flower and fruit of citrus, mango and pineapple were checked and their infestation levels (%) caused by different insects were assessed. The collected insects were categorized as pest, predator, pollinator and other group. Mean daily temperature, light intensity, relative humidity and rainfall data were collected from the university weather station. Data were analyzed by using IBM SPSS 21.0.
RESULTS AND DISCUSSION
In total 2936 collected insects, Hemiptera were most abundant, and categorically pest, predator, pollinator and other group ranged from 63.2 to 10.6%. The pests associated with mango were significantly higher
It is I
LLEGAL t
o cop
y, pri
nt or
save
any c
onten
t of th
is PDF,
in pa
rt or in
full,
on an
y retr
ieval
syste
m,
withou
t the E
XPRESS WRITTEN PERMISSIO
N of th
e cop
yrigh
t-hold
er

National Conference on Climate Change and Agricultural Production: Adapting Crops to Climate Variability and Uncertainty, 6th–8th April, 2017
[628]
followed by citrus and pineapple, and mango hopper was most abundant. The relative abundance of different pests on citrus, mango and pineapple varied from 2.39 to 13.39, 0.50 to 82.62 and 12.24 to 44.89%, respectively. In total 25 species in 6 orders and 19 families as pest of citrus, 15 species in 6 orders and 13 families as pest of mango, 4 species in 3 orders and 4 families as pest of pineapple, 20 species in 6 orders and 13 families as predator, and 19 species belonged to 4 orders and 12 families were found as pollinator. The ants and honeybees were most abundant as predators and pollinators, respectively. The abundance of insect was highest in the month of May. The abundance of total insect species showed significant positive correlation with temperature, and insignificant positive correlation with relative humidity and rainfall, while insignificant negative correlation with light intensity. Multiple linear regression equation based on weather parameters revealed 53.8% role on population build up of total insect species.Temperature was found to be the most important effect which individually contributed 25.0% on total population abundance. The findings of this study provide information on the abundance, diversity and seasonal dynamics of insects in an agroforestry and indicated the importance of conservation of natural enemies and pollinators.
Table 1: Insect Community in the Agroforestry of Bangladesh and Role of Weather Parameters on their Abundance
Community Study Characteristics and Weather Parameters % Abundance Significant Difference Insect taxonomic order Dictyoptera 0.62 Orthoptera 12.92 Odonata 2.43 Isoptera 1.09 Thysanoptera 1.06 Hemiptera 50.17 Coleoptera 6.22 Lepidoptera 10.05 Hymenoptera 5.67 Diptera 9.23 Neuroptera 0.89 χ2 = 234.1, df = 11, p < 0.001 Insect category Pest 63.20 Predator 12.40 Pollinator 13.80 Other 10.60 χ2 = 85.4, df = 3, p < 0.001 Crop Citrus 22.60 Mango 74.80 Pineapple 2.60 χ2 = 82.0, df = 2, p < 0.001 Month July 9.26 August 7.86 September 7.86 October 6.29 November 5.43 December 5.81 January 7.45 February 8.0 March 8.71 April 10.66 May 12.24 F11, 12 = 8.4, p ˂ 0.001 June 10.43 Weather parameters Temperature 25.0 F1,22= 7.3, p < 0.05 Light intensity 27.4 F2,21= 11.5, p < 0.001 Relative humidity 1.2 F3,20= 7.7, p < 0.01 Rainfall 0.2 F4,19= 5.5, p < 0.05 Total 53.8 -
REFERENCE [1] Donald P F 2004. Biodiversity Impacts of Some Agricultural Commodity Production Systems. Conservation Biology 18: 17-37
It is I
LLEGAL t
o cop
y, pri
nt or
save
any c
onten
t of th
is PDF,
in pa
rt or in
full,
on an
y retr
ieval
syste
m,
withou
t the E
XPRESS WRITTEN PERMISSIO
N of th
e cop
yrigh
t-hold
er

National Conference on Climate Change and Agricultural Production: Adapting Crops to Climate Variability and Uncertainty, 6th–8th April, 2017
[629]
Bioefficacy of Certain Newer Insecticides on Mortality of Brown Plant Hopper (Nilaparvata lugens Stal.) and Gundhi Bug (Leptocorisa acuta
Thunberg) in Rice (Oryza sativa L.) Ecosystem
M. Raghuraman, Santeshwari* and Ingle Dipak Shyamrao Department of Entomology and Agricultural Zoology, Institute of Agricultural Sciences,
Banaras Hindu University, Varanasi–221005, India E-mail: *[email protected]
Keywords: Bioefficacy, Brown Plant Hopper, Gundhi Bug, Insecticides, Rice
INTRODUCTION
Rice, classified primarily as a tropical and subtropical crop, is grown in over 100 countries today, on every continent except Antarctica, extending from 50–530N to 400S and from sea level to an altitude of 3000 m. Rice crop is prone to severe yield losses by both abiotic and biotic stresses to an extent of 46.4 per cent out of which 26.7 per cent is due to insect pests (Jayaraj, 1996). It is subjected to attack by more than 100 species of insects, 20 of them can cause economic damage. Together they infest all parts of the plant at all growth stages, and a few transmit viral diseases (Pathak and Khan, 1994). Nilaparvata lugens (Stal.) and Leptocorisa acuta (Thunberg) had caused serious outbreaks in several countries like China, Bangladesh, Nepal, Pakistan, Taiwan, Vietnam and also in India (Hu et al., 2011). Keeping these losses in view present study has done, which is focused on bio-efficacy of newer insecticides against these insect pest of rice.
MATERIALS AND METHODS
The experiment was laid out in a randomized block design with eight treatments each replicated in thrice. The seeds of rice (var.-Malviya Dhan-36) were sown in the nursery field during kharif, 2015–16. There were eight treatments including control (untreated), viz., difentiuron 50 SC, imidacloprid 17.8 SL, fipronil 200 SC, acetamiprid 20 SP, fipronil 0.6 gr, lamda cyhalothrin 4.9 CS and carbofuran 3g. The observations on the brown plant hopper and gundhi bug populations were recorded into two phase i.e. before spray and after spray. In case of brown plant hopper the observations were recorded at randomly selected 10 hills and gundhi bug, the observations were recorded by sweeping insect net collecting five times across each treatment and the number of bugs was counted in each treatment plot. Observation was taken one day prior and 1st, 3rd, 7th and 14th days after application. The field bio-efficacy of test insecticides against BPH and GB in rice
RESULTS AND DISCUSSION
Among seven, treatments acetamiprid 20 SP and imidacloprid 17.8 SL have provided the best efficacy against brown plant hopper. After first spray, the acetamiprid 20 SP was recorded lowest (3.60 nymphs & adults/10 hills) population of whereas imidacloprid 17.8 SL was also recorded lowest (4.40 nymphs and adults/10 hills) population of BPH at 7th DAS, respectively which ultimately resulted in maximum reduction of pest population over control 52.02 per cent and 48.55 per cent after first spray, respectively. For gundhi bug, imidacloprid 17.8 SL @ 50 g a.i./ha was recorded lowest (3.47 adults & nymphs/5 sweep net) population of gundhi bug at 7th DAS. Maximum reduction of pest population over control was 63.15 per cent. This was closely followed by acetamiprid 20 SP @ 40 g a.i./ha was lowest (4.90 adults &nymphs/5 sweep net) population at 7th DAS with 63.15 per cent reduction in gundhi bug population over control imidacloprid and acetamiprid showed reduction in the population after 1, 3, 7 and 10 days after spraying as 8.63, 6.43, 3.47 and 4.57 and 9.07, 7.13, 3.90 and 4.90 adults and nymphs per five sweep nets respectively after spray, respectively.
It is I
LLEGAL t
o cop
y, pri
nt or
save
any c
onten
t of th
is PDF,
in pa
rt or in
full,
on an
y retr
ieval
syste
m,
withou
t the E
XPRESS WRITTEN PERMISSIO
N of th
e cop
yrigh
t-hold
er

National Conference on Climate Change and Agricultural Production: Adapting Crops to Climate Variability and Uncertainty, 6th–8th April, 2017
[630]
REFERENCES [1] Hu G, Cheng X N, Qi G J, Wang F Y, Lu F, Zhang X and Zhai B P 2011. Rice planting systems, global warming and outbreaks of Nilaparvata
lugens (Stal). Bull. Entomological Research 101(2): 187-199. [2] Jayaraj S 1996. Pesticide pollution in India: Some policy issues to minimize health hazards. In: Workshop on“Pesticides and the immune
systems: The public health risks”.M.S. Swaminathan Research Foundation, Madras, India. pp: 1-18. [3] Pathak M D and Khan Z R 1994. Insect Pests of Rrice. IRRI, Philippines. pp: 89.
Behavioural Responses of the Melon Fly, Bactrocera cucurbitae (Diptera: Tephritidae) to Colour Pheromone Traps
Sajad Hussain Mir*, Showket Ahmad Dar and Ghulam Mohammad Mir
Department of Entomology, Sher-e-Kashmir University of Agricultural Sciences and Technology, Shalimar Campus–190025, India E-mail: *[email protected]
Keywords: B. Cucurbitae, Behavioral Responses, Colour Traps, Attraction
INTRODUCTION
Melon fruit flies (Diptera: Tephritidae) are among the world’s most devastating agricultural pests and are geographically distributed throughout the tropics and subtropics of the world (Drew, 1992). The devastating effects that melon fruit flies inflict to the horticultural industry worldwide, and the transboundary nature of the problem, have placed them on top of the world’s list of key insect pests (Enkerlin, 2003). The colour traps have high specificity, low cost and are environmentally quite safe (Suresh Babu and Viraktamath, 2003). Since adult fruit flies use visual and olifactory stimuli to locate hosts, traps that combine visual and olifactory cues proved to be most effective for capturing fruit flies (Epsky and Heath, 1998). At the same time, they display remarkable ecological and behavioural characteristics, which have served as models in the development of attractants for detection, monitoring and control. Hence, the present studies were made on the responses of melon fruit flies to different colour sphere traps in cucumber field to improve control strategies.
MATERIALS AND METHODS
The study was conducted from 1st week of July to 4th week of October during 2012 and 2013 in cucumber field at Central Institute of Temperate Horticulture, Srinagar, Jammu and Kashmir, India. The traps consisted of a plywood dispenser immersed in a solution of cue-lure (1ml) and malathion 50 EC (0.5ml). The dispenser was suspended vertically inside the trap and charged with the parapheromone solution at weekly intervals. The experiment was conducted in a randomized block design (RBD) with four treatments, replicated thrice.
RESULTS AND DISCUSSION
Pooled means showed that the yellow traps captured highest number of flies (43.6 flies/ trap/ month), followed by green trap (32.6 flies/ trap/ month) and blue trap (17.7 flies/ trap/ month). The orange traps nevertheless were found least effective attracting significantly lower number of fruit flies (7.7 trap/ month). Month wise pooled data showed highest catches during August (40.0 flies/ trap) and lowest in October (15.5 flies/trap). Colour of traps and months together had significant influence in attracting fruit flies with highest catch in yellow (70.0/ flies/ trap) during August and lowest in orange trap (4.6/ flies/ trap) during October. Jalaluddin et al. (1998) revealed that orange and yellow coloured traps attracted more Bactrocera species in Tamil Nadu. Liburd et al. (1998) observed that baited green, red, yellow or blue spheres were more attractive to blue berry maggot, R. mendax (Walsh) than baited yellow board traps. In another study conducted in
It is I
LLEGAL t
o cop
y, pri
nt or
save
any c
onten
t of th
is PDF,
in pa
rt or in
full,
on an
y retr
ieval
syste
m,
withou
t the E
XPRESS WRITTEN PERMISSIO
N of th
e cop
yrigh
t-hold
er

National Conference on Climate Change and Agricultural Production: Adapting Crops to Climate Variability and Uncertainty, 6th–8th April, 2017
[631]
Bangalore, Madhura (2001) found that deep yellow colour traps attracted maximum number of Bactrocera species. Whereas, Sarada et al. (2001) observed that significantly more number of B. dorsalis, B. correcta and B. zonata were attracted to white and yellow coloured traps followed by green, orange, red and blue, respectively. Present study clearly indicates that B. cucurbitae males respond to different shapes of the traps. The yellow, green and blue traps are more effective for the management of B. cucurbitae in cucumber.
REFERENCES [1] Drew R A I 1992. Overview of fruit flies. International Training Course Fruit Flies. MARDI, Kuala Lumpur. 4th-15th May 1992. [2] Enkerlin W 2003. Economics of area-wide SIT control programs. In: Recent Trends on Sterile Insect Technique and Area-Wide Integrated Pest
Management-Economic Feasibility, Control Projects, Farmer Organization and Bactrocera dorsalis Complex Control Study. Research Institute for Subtropics, Naha, Japan, pp. 1-10.
[3] Epsky N D and Heath R R 1998. Exploiting the interaction of chemical and visual cues in behavioral control measures for pest tephritid fruit flies. Florida Entomologist81: 273-282.
[4] Jalaluddin S M, Natarajan K, Sadakathulla S and Rajukkannu K 1998. Effect of colour, height and dispenser on catches of guava fruit fly. In: Proceedings of National Symposium on Pest Management in Horticulture Crops, Bangalore, pp. 34-39.
[5] Liburd O E, Alm S R, Casagrande R A and Polavarapu S 1998. Effect of trap colour, bait, shape and orientation in attraction of blueberry maggot (Diptera: Tephritidae) flies. Journal of Economic Entomology 91: 243-249.
[6] Madhura H S 2001. Management of fruit flies (Diptera: Tephritidae) using physical and chemical attractants. M.Sc. (Agri.) Thesis, University of Agricultural Sciences, Bangalore, pp: 80.
[7] Sarada G, Maheswari T U and Purushotham K 2001. Effect of trap colour, height and placement around trees in capture of mango fruit flies. Journal of Applied Zoology Research12: 108-110.
[8] Suresh Babu K and Viraktamath S 2003. Species diversity and population dynamics of fruit flies (Diptera: Tephritidae) on mango in Northern Karnataka. Pest Management and Economic Zoology 11:103-110.
Nesting Behaviour of Andrena cineraria Linnaeus (Hymenoptera: Andrenidae) in Temperate Areas of India
Showket Ahmad Dar*, Sajad Hussain Mir and Gh. Mohmmad Mir Department of Entomology, Sher-e-Kashmir University of Agricultural Sciences and Technology,
Srinagar–190025, India E-mail: *[email protected]
Keywords: Nest, Pollination, Behaviour, Andrena, Temperate Region
INTRODUCTION
The term nesting behaviour is broad one and the first, possibly the largest topic in behaviour is nest arrangement and nesting biology. The detailed study describing the different nest behavioral pattern of rear Andrenidae bees at and inside the nesting burrow are quite unique, but important as pollination point of view. The species Anthophora pueblo were found to dig nest in hard sandstones (Michael et al., 2016); while as, in Carder bees, nest wall is lined with intricate organic matrix (Parker et al., 2016), or organic lining (Roche et al., 2014). The nest architecture of Andrena species consists of single, vertical main shaft and several horizontal laterals, each terminating into the single vertical cell. The nests usually varied in their depths even at same location (Miliczky, 2016). According to University of Minnesota Extension USA, the bee after locating a suitable hole, begin to build little “cells” which are usually placed linearly along a tunnel, each one filled by pollen ball and one egg (Parker et al., 2016). In Kashmir region, the Andrena cineraria, A. barbilirbis and A. patella were efficient fruit pollinators and were observed to reside in plan to sloppy fallow lands near the fruit orchards constructing the deep nests, with cavity guarded by tumulus, therefore at present we studied the nesting behaviour of important Andrenidae species in landscapes of Valley.
It is I
LLEGAL t
o cop
y, pri
nt or
save
any c
onten
t of th
is PDF,
in pa
rt or in
full,
on an
y retr
ieval
syste
m,
withou
t the E
XPRESS WRITTEN PERMISSIO
N of th
e cop
yrigh
t-hold
er

National Conference on Climate Change and Agricultural Production: Adapting Crops to Climate Variability and Uncertainty, 6th–8th April, 2017
[632]
MATERIALS AND METHODS
We studied nesting aggregations from three experimental areas of Kashmir valley, located at the altitude of 1517 (Srinager), 1538 (Pulwama) and 1900 (Budgam) m ASL on South-West of Valley. The bee populations were studied from May to end July, for consecutive four years from 2013 to 2016. In Budgam, the nest aggregations covered an area of 3km; while as, in Srinagar and Pulwamathe areas chosen are 0.75 and 1.35 km, respectively. The survey was conducted on the different landscapes of valley and more preferably the bee populations were situated on the level ground along a dirt road and small paths near apple and stone fruit orchards. We excavated the nests in early June and again in end July, and observed the nest burrows and cells, till the last point of nest depth. For variation across the experimental locations, the Principle Component Analyses were performed to estimate the statistical significance.
RESULTS AND DISCUSSION
The nests formed dense aggregations within the range of about 10 m in length, between the paths and the adjoining grassy grounds with clay loam soil. The nests of some Halictidae bees Lasioglossumm arginatum were found in and around sites. At certain depth, the female constructs the first cell at the end of the burrow. The cell is oval in shape inside, and on an average, 4 to 5 cells were prepared for each burrow. The upper nest burrow is vertical and lower is oblique, but the two aspects are not always distinct. The nest entrance is generally hidden under the tumulus, but soon exposed by disappearance of the loose soil or by wind movement. In the depth of average 12 inch, each cell directly open to main burrow either alternately or unilaterally. The cells are oval, symmetrical or asymmetrical, elongated and concentrated around the main burrow. Laterally, the cells are flatter and with convex lower end. The cell wall is fine, very thin, waxy inner layer, and polished and cemented from outer side. The nest cells number and diameter, and length varied with the depth. The significance of the studies on wild bees is important for the melittologists, as it will help in the conservation of bee fauna. The study is also important in using the bees for pollination purpose and might help us to detect and understand the possible pre-adaptation of species in temperate region of Kashmir valley. Student’s T-test showed that nest cell parameters were statistically significant across different depths.
Table 1: Nesting Characters of Andrenacineraria Behaviour Study years (2013, 2014, 2015, 2016) Flight season End-May-1stweek Aug. Nest site observed Flat ground Nest type Allodalous Cell wall Polished, 2 layers Shape of cell Oval to flattened Orientation of cell Horizontal to 40-43o Nest density (nest/m2) 11.09-12.44 Diameter of entrance (mm) 1.92-2.87 Diameter of burrow (mm) 2.05-2.66 Depth of nest bottom (cm) 60.50-67.05 Depth of cell (cm) 29-36 Cell diameter (mm) Cell Length (mm)
2.62-2.70 9.03-10.18
Chi-squaredistribution F-test Significance (N=15)
0.65001 0.5790
p≤0.0198 (i.e. ≤0.05)
REFERENCES [1] Michael C O, Griswold T, Pitts J P and Parker F D 2016.A new bee species that excavates sandstone nests. Current Biology 26: 792-793. [2] Parker J F, Hopley P and Kuhn B F 2016.Fossil Carder Bee’s nest from the Hominin locality of Taung, South Africa. PLoS One.11: 9. [3] Miliczk E 2016. Observations on the Nesting Biology of Three Species of Panurgine Bees (Hymenoptera: Andrenidae). Journal of the Kansas
Entomological Society. 64(1): 80-87. [4] Paxton R J, Giovanetti M and Andrietti F S 2016. Mating in a communal bee, Andrena agilissima (Hymenoptera Andrenidae). Ethology
Ecology and Evolution 11:371-383.
It is I
LLEGAL t
o cop
y, pri
nt or
save
any c
onten
t of th
is PDF,
in pa
rt or in
full,
on an
y retr
ieval
syste
m,
withou
t the E
XPRESS WRITTEN PERMISSIO
N of th
e cop
yrigh
t-hold
er

National Conference on Climate Change and Agricultural Production: Adapting Crops to Climate Variability and Uncertainty, 6th–8th April, 2017
[633]
Physiological and Biochemical Assessment of Genotypic Variation in Soybean (Glycine max L.) [Merrill] Genotypes
Devendra Vasht*, Dr. S.K. Dwivedi and Dr. Ompal Singh
Department of Plant Physiology, Jawaharlal Nehru Krishi Vishwa Vidyalaya, Jabalpur, MP E-mail: *[email protected]
Keywords: Biochemical Estimation, Yield Attributes
INTRODUCTION
Soybean (Glycine max (L.) Merrill] one of nature’s mostversatile crops, is increasingly becoming an important food and cash crop in the tropics due to its high nutrient quality and adaptability to various growing environments (McKevith, 2005). Madhya Pradesh is the soybean bowl of India, contributing 65–70 per cent of country’s soybean production. Crop improvement seeks to increase productivity both through the manipulation of germplasm by breeding it to maximize genetic potential and through the manipulation of the production environment using agronomic management to minimize constraints and for maximum expression of their potential or screening the genotypes possesses the physiological superiority. The role of physiological approach is to provide an understanding of the physiological basis of genotypic and environmental components of plant response and the interaction between the two (Lawn, 1988). The soybean cultivars have variability for physiological and morphological attributes of growth and productivity. The latter is determined by the photosynthesis and its net accumulation in the economic sink. The genotypic response of a cultivar is related to its physiological functional components, adaptation to the environmental extremes and partitioning of photo-assimilates. In spite of the best efforts to improve the soybean varieties, the yield of this crop remains low.
MATERIALS AND METHODS
The studies were conducted during Kharif season of the year 2015 at Department of Plant Breeding and Genetics, JNKVV, Jabalpur (M.P.) using Randomized complete Block Design withten genotypes in four replication. The nitrogen content was estimated by micro kjeldhal method (A.O.A.C., 1965) as per method suggested by Gopalan et al. (1985) and protein percent in the sample was estimated multiplying nitrogen percent of sample by factor 6.25. Total carbohydrates in the sample were estimated by the hydrolysis method as described in AOAC (1984) and the fat content by pelican equipment socs plus based on principle of Soxhlet’s extraction method as described in AOAC (1980). Yield and yield attributing traits were also recorded at different maturity time.
RESULTS AND DISCUSSION
Maximum seed protein content was estimated in JS 21-03 (43.26%), JS 21-07 (41.29%) and JS 21-01(40.38%) and moderately in JS 21-05 (39.41%). While maximum seed oil was extracted by JS 21-03(22.35%), JS 20-29 (19.51%) and JS 21-05(21.39%) and carbohydrate content was higher in JS 21-02 (21.13%), JS 21-04 (20.8 %) and JS 21-08 (20.01%). The crude fiber and ash content were noted maximum in JS 21-04 (4.56%, 4.63%), JS 21-06 (4.28%, 5.41%) and minimum seed fiber were obtained in JS 21-01(3.49%) and JS 21-05 (3.85).Improvement in structural yield attributing components resulted in maximum realisation of productivity potential of soybean genotypes. The significant variation was noted among soybean genotypes with respect to their components of yield with biological and seed yield. Maximum plant height was noted in JS 21-02 (54.90 cm) and JS 21-01(54.59) and number of branches in
It is I
LLEGAL t
o cop
y, pri
nt or
save
any c
onten
t of th
is PDF,
in pa
rt or in
full,
on an
y retr
ieval
syste
m,
withou
t the E
XPRESS WRITTEN PERMISSIO
N of th
e cop
yrigh
t-hold
er

National Conference on Climate Change and Agricultural Production: Adapting Crops to Climate Variability and Uncertainty, 6th–8th April, 2017
[634]
JS 21-05 (4.66), JS 21-06 (4.58) and JS 21-01(4.37). Number of pod per plant and seed per pod were counted maximum in JS 21-05 (94.75, 3.19), JS 21-07(84.75, 2.94) and JS 21-06 (79.75, 2.88). While pod length, pod width and pod girth were more in JS 21-03 (44.91, 8.06, 4.58) and JS 21-05 (40.25, 7.62, 4.30). The pod weight was higher in JS 21-03 (7.45 gm/plant), JS 21-06 (7.39 gm/plant) and JS 21-08 (7.16 gm/plant). The biological yield was maximum in JS 21-05(58.61 gm/plant, 10182.20kg/hac), JS 21-06 (51.02gm/plant, 7864.80kg/hac) and JS 21-07(56.85gm/plant, 8461.33kg/hac) on per plant as well as per hectare bases showed their highest production efficiency. While JS 21-05, JS 21-4 and JS 21-07 showed maximum partitioning efficiency of photoassimilates from source to the economic sink. The higher seed yield per plant and per hectare were registered in JS 21-05 (23.75gm/plant, 4140.62kg/hac), JS 21-06 (17.84gm/plant, 2109.37kg/hac), JS 21-07(17.56gm/plant, 2968.75kg/hac) and JS 21-04(12.89gm/plant, 2226.56kg/hac).
REFERENCES [1] Lawn R J, Byth D E and Mungomery V E 1988. Response of soybeans to planting date in Southeastern Queensland. Agronomic and
physiological response of cultivars to planting arrangements. Australian Journal of Agricultural Research 28: 63-79. [2] McKevith B 2005. Nutritional aspects of oil seeds. Nutrient Bulletin 30: 1326. [3] AOAC 1980. Official Methods of Analysis, 13th edition. Association of Official Analytical Chemists, Washington D.C. pp: 376-384. [4] AOAC 1984. Official Methods of Analysis, 14th edition. Association of Official. Agricultural Chemists. Washington DC. [5] Gopalan C, Rama Sastri BV and Balasubramanian SC 1985. Nutritive value of Indian foods (revised and updated by B.S. Narasinga Rao, Y.G.
Deosthale, & K.C. Pant). National Institute of Nutrition, Hyderabad, India.
Ecological and Economic Aspect of Integrated Pest Management (IPM) in Paddy (Oryza sativa L.) Ecosystem
R. Sudha1*, M. Chandrasekaran2 and A. Rohini3 1Department of Agricultural Economics, Tamil Nadu Agricultural University, Coimbatore–641003 2Directorate of Planning & Monitoring, Tamil Nadu Agricultural University, Coimbatore–641003
3Department of Agricultural Rural Management, Tamil Nadu Agricultural University, Coimbatore–641003
E-mail: *[email protected]
Keywords: Integrated Pest Management, Paddy, Pesticide use, Resource use, Production Function, Environment Quotient Method
INTRODUCTION
Pesticides, besides being poisonous in nature to the targeted pests, although the environmental costs and human health hazards are associated with the use of pesticides. Lack of knowledge about the hazards of insecticides adds to the problem. Pesticides use has increased pushing up the cost of production besides aggravating environmental pollution. Integrated Pest Management approach is method of to reduce the extent of use of pesticides. We analyse the awareness & adoption level of IPM technology in paddy, to analyse the economics of pesticide use and its efficiency in paddy and the environmental damage potential of pesticide use in paddy.
DATA AND METHODOLOGY
The primary data were collected through personal contact with pre-tested interview schedule. Stratified random sampling technique used to quantified the variables. Sample size of 60 farmers of which, two blocks were selected based on total cultivated area. Of each 30 samples farmers of IPM and non-IPM adopters in
It is I
LLEGAL t
o cop
y, pri
nt or
save
any c
onten
t of th
is PDF,
in pa
rt or in
full,
on an
y retr
ieval
syste
m,
withou
t the E
XPRESS WRITTEN PERMISSIO
N of th
e cop
yrigh
t-hold
er

National Conference on Climate Change and Agricultural Production: Adapting Crops to Climate Variability and Uncertainty, 6th–8th April, 2017
[635]
Erode district of Tamil Nadu. Production functions were to estimate by Cobb-Douglas method. Environmental Impact Quotient (EIQ) was used to determining the individual pesticides capturing the effects on farm worker, consumer and ecology. Garrett’s technique was used to study the constraints in adopting IPM and reason for non-adoption of IPM in paddy.
RESULTS AND CONCLUSION/ DISCUSSION
Farmers’ use of fertilizers, pesticides and labour was more in IPM paddy sample farmers compared to Non-IPM paddy sample farmers resulting in higher net returns. Pesticides like Carbofuran was used 1.598 kg ha-1 in IPM and 3.131kg ha-1 in non-IPM farms. Highly hazardous chemical like phorate was used only in non-IPM of 2.59 kg ha-1. Average cost of pesticides in IPM was only ₹. 212.42 and ₹. 769.48 ha-1 in non-IPM. Bio-control agents like Azardirctin was applied only in IPM paddy sample farms. The number of pesticides used and the application rate was less in IPM compared to Non-IPM sample farms (Table1). In IPM Paddy, the independent variables like labour and the dummy for damage by rainfall significantly affected yield at ***P<0.001.In Non-IPM Paddy, The independent variables namely, seeds and the dummy for damage by rainfall-influenced yield significant at ***P<0.001(Table 2). Environmental Impact Quotient (EIQ) value of usage of chemicals in IPM was less at 28.40 compared with non-IPM at 40.26 (Table 3). Constraints in IPM adoption sample farmers were high wage labour; non-availability of labour, lack of IPM inputs and lack of extension follow-up. In Non-IPM paddy sample growers expressed lack of confidence in IPM measures. The strategies should be highlighting the ill effects like environmental hazards of over use of plant protection chemicals and toxicity of the chemicals, besides being an economical. The farmers have to be educated about the IPM technologies and encouraged to adopt Integrated Pest Management practices.
Table 1: Pesticides usage in Sample Farm Households S. No. Pesticides Application Rate kg/ha
IPM Paddy Non-IPM Paddy 1 2 3 4 5 6 7 8 9 10
Alachlor* Carbendazim** Carbofuran*** Chloropyiriphos** Endosulfan** Monocrotophos*** Quinolphos** Triazole* Phorate*** Azartirictin* Average cost of pesticides/ha (in .)
1.235 -
1.598 -
1.933 1.833
- 0.247
- 1.235
212.42
- 0.632 3.131 1.390 2.200 2.064 2.279 0.547 2.598
- 769.4
High risk ***, Medium risk**, Low risk* based Risk Assessment Guidelines of United States EPA (Environmental Protection Agency).
Table 2: Results of Production Function analysis of IPM Paddy in Sample Farmers Variables IPM Farmers Non-IPM Farmers
Constant 5.593*** 8.071*** Seeds (kg) 0.021 -0.325*** Organic manure (tone) 0.006 0.008** Nitrogen (kg) 0.175 0.161** Phosphorous (kg) 0.039** 0.021 Potassium (kg) 0.015** -0.005 Labour (Man day) 0.165*** 0.033 Plant protection cost ( .) 0.008 -0.011 Dummy to account for damage by rainfall (score) 0.206*** 0.272*** R2 0.75 0.83 Adjusted R2 0.65 0.76 ‘F’ Statistic 7.688 13.069 Number of observations 30 30
*** Significant at P<0.001. ** Significant at P<0.01
It is I
LLEGAL t
o cop
y, pri
nt or
save
any c
onten
t of th
is PDF,
in pa
rt or in
full,
on an
y retr
ieval
syste
m,
withou
t the E
XPRESS WRITTEN PERMISSIO
N of th
e cop
yrigh
t-hold
er

National Conference on Climate Change and Agricultural Production: Adapting Crops to Climate Variability and Uncertainty, 6th–8th April, 2017
[636]
Table 3: EIQ Values of Chemicals used in IPM and Non-IPM Sample Farms Sl. No. Crop EIQ Values for
IPM Non-IPM 1 Paddy 28.40 40.26
REFERENCE [1] Gururaj Katti, C. Pasalu, P.R.M. Rao, N.R.G. Varma, K. Krishnaiah. M.M Escalade and K.L. Heong 2004.Farmers Perception, Knowledge and
Practices Related to Integrated Pest Management in High Production Systems of Rice in South India-A Case Study. Indian Journal of Plant Protection, 32(2): 11-16.
The Immunity System in Plants—A Mechanism
Hilal A. Bhat1*, Rayees A. Ahanger1, Mumtaz A. Ganie2, Sajad Hassan Wani3, Aarif H. Bhat1 and J.I. Mir3
1Division of Plant Pathology, SKUAST-K, Shalimar, Srinagar, J&K–190025, India 2Division of Soil Science, ICAR-CITH, Rangreth Srinagar J&K–191132, India
3Division of Biotechnology, ICAR-CITH, Rangreth Srinagar J&K–191132, India E-mail: *[email protected]
Keywords: Defense, Effectors, Immunity and Pathogens
INTRODUCTION
Plants are engaged in a continuous co-evolutionary struggle for dominance with their pathogens. The outcomes of these interactions are of particular importance to human activities, as they can have dramatic effects on agricultural systems. The recent convergence of molecular studies of plant immunity and pathogen infection strategies is revealing an integrated picture of the plant–pathogen interaction from the perspective of both organisms. Plants have an amazing capacity to recognize pathogens through strategies involving both conserved and variable pathogen elicitors, and pathogens manipulate the defence response through secretion of virulence effector molecules. These insights suggest novel biotechnological approaches to crop protection. Many plant-associated microbes are pathogens that impair plant growth and reproduction (Peter et al., 2010). Plants respond to infection using a two-branched innate immune system. The first branch recognizes and responds to molecules common to many classes of microbes, including non-pathogens. The second responds to pathogen virulence factors, either directly or through their effects on host targets. These plant immune systems, and the pathogen molecules to which they respond, provide extraordinary insights into molecular recognition, cell biology and evolution across biological kingdoms (Jonathan et al., 2006).
REFERENCES [1] Jonathan, D. G., Jones, L. and Jeffery, L. D. 2006. The plant immune system. Nature. 444:323-329. [2] Peter, N., Dodds, M. and John, R.P. 2010. Plant immunity: towards an integrated view of plant–pathogen interactions. Genetics11: 539-548.
It is I
LLEGAL t
o cop
y, pri
nt or
save
any c
onten
t of th
is PDF,
in pa
rt or in
full,
on an
y retr
ieval
syste
m,
withou
t the E
XPRESS WRITTEN PERMISSIO
N of th
e cop
yrigh
t-hold
er

National Conference on Climate Change and Agricultural Production: Adapting Crops to Climate Variability and Uncertainty, 6th–8th April, 2017
[637]
Identification of Drought Tolerant Rice (Oryza sativa L.) Genotypes Carrying the Drought QTL under Stressed and Non-stressed Natural
Field Conditions
S.P. Singh1*, Anand Kumar1, Satyendra1, Mankesh Kumar1, Santosh Kumar2 and P.K. Singh1 1Department of Plant Breeding and Genetics, Bihar Agricultural University,
Sabour, Bhagalpur–813210, India 2Divisions of Crop Research, ICAR Research Complex for Eastern Region,
Patna–800014, Bihar, India E-mail: *[email protected]
Keywords: Rice, Drought Stress, Drought Tolerance, Grain Yield
INTRODUCTION
Rice crop is highly sensitive to soil moisture deficit and high/low temperature stresses at reproductive stage. Losses due to reproductive-stage drought stress are most severe in the Chhattisgarh, Orissa, Jharkhand, Bihar, and eastern Uttar Pradesh which are key rice-producing states of eastern India. Most of the traditional as well as high yielding varieties cultivated in the eastern region are highly susceptible to drought, particularly reproductive stage drought. The higher frequency and intensity of drought spells necessitates development of rice cultivars, which are able to survive under water deficit stress at reproductive stage and quickly recover after the drought spells, by rapid growth upon improved availability of soil moisture (Kamoshita et al., 2008). Mean yield and relative yield performance under stressed and controlled environments are the most widely used criteria for selecting genotypes for stress prone environments. In this context, the present study was undertaken to identify rice genotypes having high yield potential and stability under drought stress conditions, particularly at reproductive stage under rain fed condition of eastern India.
MATERIAL AND METHODS
The field experiments were carried out at Rice research farm, Bihar Agricultural University, Sabour (Bhagalpur) India (latitude 25.15 0N, longitude 87.2 0E) during Kharif 2015-16. The rice genotypes used in the present study were obtained from International Rice Research Institute (IRRI), Philippines under STRASA (Stress-Tolerant Rice for Africa and South Asia) (STRASA) project. The field experiments were conducted under stress (reproductive stage drought) and non-stress (control) condition with sixteen medium to long maturity duration rice genotypes carrying QTLs for drought tolerance including two checks namely Swarna and Swarna Sub-1 at rice research farm of Bihar Agricultural University, Sabour, (Bihar), India during Kharif, 2015. Experiments were laid out in Randomized Block Design with three replications. Twenty-two days old seedlings were transplanted at 20 x 15 cm spacing. The reproductive stage drought stress experiment was irrigated like the non-stress (control) experiments by keeping standing water up to 43 days after transplanting. Thereafter, the field was drained to allow them dry and for stress to develop. The drought stress experiments were not provided any supplementary irrigation after drainage. During the reproductive stage stress period soil moisture content was monitored through periodical soil sampling at 15 and 30 cm soil depth after suspension of irrigation. Water table depth was also monitored during the stress period. Observations of yield and yield contributing traits were recorded on five randomly selected plants per genotype per replication. The relative yield (yield potential) under drought stress was calculated as the yield of specific genotypes under drought divided by that of the highest yielding genotype in the sample.
It is I
LLEGAL t
o cop
y, pri
nt or
save
any c
onten
t of th
is PDF,
in pa
rt or in
full,
on an
y retr
ieval
syste
m,
withou
t the E
XPRESS WRITTEN PERMISSIO
N of th
e cop
yrigh
t-hold
er

National Conference on Climate Change and Agricultural Production: Adapting Crops to Climate Variability and Uncertainty, 6th–8th April, 2017
[638]
RESULTS AND DISCUSSION
The analysis of variance revealed significant differences among the genotypes for yield and yield attributing characters. Rice genotypes grown under water stress condition produced significantly lower grain yields than flooded rice. Yield decline was observed in almost all the rice genotypes grown under drought stress condition. The reduction in yield between stress and control condition ranged between 37.39 to 56.62%. The difference in grain yield between drought stress and non-stress treatment was 49.54 % in IR 96321-558-563-B-2-1-3, 52.17% in IR 96322-34-260-B-5-1-1and 51.25 % in IR 96321-315-323-B-3-1-1whereas it was 56.42 % in Swarna Sub-1 and 56.62% in Swarna. Under non-stress condition, maximum grain yield was observed in IR 96321-558-563-B-2-1-3 (9464 kg/ ha) followed by IR 96322-34-260-B-5-1-1(9167 kg/ha).However, under reproductive stress conditions, the genotype IR 96321-558-563-B-2-1-3 (4791 kg/ha) and IR 96321-558-209-B-6-1-1 (4538 kg/ha) were found to be significantly superior to the best check Swarna and Swarna Sub-1 for grain yield. Significant decrease in plant height was also observed in rice genotypes grown under drought stress condition. Rice grown in drought stress condition produced significantly less total biomass than irrigated rice. Drought tolerant genotypes viz., the genotype IR 96321-558-563-B-2-1-3 (4791 kg/ha) and IR 96321-558-209-B-6-1-1 (4538 kg/ha) had lesser leaf rolling, leaf drying and better stress recovery as well as delayed leaf rolling and drying. Based on results related to yield attributes of rice genotypes and desired physiological traits under drought stress, rice genotypes IR 96321-558-563-B-2-1-3 and IR 96321-558-209-B-6-1-1 showed low SSI and TOL and high DTE and STI values were identified as drought tolerant genotypes.
REFERENCES [1] Beena R, Thandapani, Chandrababu R 2012. Physio-morphological and biochemical characterization of selected recombinant inbred lines of
rice for drought resistance. Indian Journal of Plant Physiology 17(2): 189-193. [2] Kumar S, Dwivedi SK, Singh S S, Jha SK, Lekshmy S, Elanchezhian R, Singh, ON and Bhatt BP 2014. Identification of drought tolerant rice
genotypes by analyzing drought tolerance indices and morpho-physiological traits. SABRAO Journal of Plant Breeding and Genetics 46(2): 217-230.
It is I
LLEGAL t
o cop
y, pri
nt or
save
any c
onten
t of th
is PDF,
in pa
rt or in
full,
on an
y retr
ieval
syste
m,
withou
t the E
XPRESS WRITTEN PERMISSIO
N of th
e cop
yrigh
t-hold
er

National Conference on Climate Change and Agricultural Production: Adapting Crops to Climate Variability and Uncertainty, 6th–8th April, 2017
[1]
THEME 5 Climate Change and Livestock, Fisheries and Poultry
It is I
LLEGAL t
o cop
y, pri
nt or
save
any c
onten
t of th
is PDF,
in pa
rt or in
full,
on an
y retr
ieval
syste
m,
withou
t the E
XPRESS WRITTEN PERMISSIO
N of th
e cop
yrigh
t-hold
er

It is I
LLEGAL t
o cop
y, pri
nt or
save
any c
onten
t of th
is PDF,
in pa
rt or in
full,
on an
y retr
ieval
syste
m,
withou
t the E
XPRESS WRITTEN PERMISSIO
N of th
e cop
yrigh
t-hold
er

National Conference on Climate Change and Agricultural Production: Adapting Crops to Climate Variability and Uncertainty, 6th–8th April, 2017
[641]
Seasonal Variation and its Adaptation in Pigs in Northeast India
Y. Vashi1, S. Naskar1,2*, T. Chutia1, S. Banik1, J. Goswami3 and V.P. Bhadana2 1ICAR-National Research Centre on Pig, Guwahati–781131, India
2ICAR-Indian Institute of Agricultural Biotechnology, Ranchi–834010, India 3College of Veterinary Science (AAU), Guwahati–781022, India
E-mail: *[email protected]
Keywords: Cortisol, HSP70, LDH, THI
INTRODUCTION
Climate change including seasonal variation adds another layer of uncertainty to already dynamic animal production system. Thermal stress is a major factor affecting production, health and welfare of livestock. Piggery in India contributes substantially to livelihood and nutritional security of resource-poor and socio-economically disadvantaged farmers, specially in northeastern India. This sector is vulnerable to environmental stress because of the backwardness of the production system. The present study was conducted to ascertain the influence of seasonal variation on marker enzyme Lactate dehydrogenase (LDH), hormone cortisol and expression of gene HSP70 related to stress.
MATERIALS AND METHODS
Blood samples of different genetic (native, crossbreed and exotic) and age (grower, finisher, sow and boar) groups of pigs were collected round the year (March, 2014–February, 2015) from organized farms and farmers’ field from Kamrup District of Assam, India. Records of ambient temperature and relative humidity (RH) were collected on daily basis (spanning eight synoptic hours) for base-years (2014-15), and Temperature-Humidity Index (THI) was calculated. Cortisol and LDH was estimated using ELISA and relative expression HSP70 gene was studied through qPCR.
RESULTS AND DISCUSSION
Based on THI, seasons were classified as I (November–February; mean THI 65.76), II (March-June; mean THI 76.96) and III (July-October; mean THI 80.92).It indicated that THIwas largely unfavourable during Season III followed by Season II. Hormone cortisol was found to be influenced by season (P<0.01), genetics of the animal (P<0.05) (Parkunan et al., 2017) and age of (re)productive life (P<0.05). Level of LDH was not influenced by either of these factors. Abundance of HSP70 mRNA was observed in exotic boar and sows and crossbred boar compared to indigenous pigs during Season II which was specially pronounced in exotic boar. During Season III, expression of HSP70 was higher in exotic pigs except for finisher group with significantly higher expression in exotic sows. Similar trend was observed in grower and finisher crossbred pigs compared to corresponding age group of indigenous pigs. It may be concluded that cortisol level and expression of HSP70 gene is significantly influenced during Season II and III with high THI (Parkunan et al., 2017). Thus, seasonal variation in interplay with genetics and stage of (re)productive life is likely to affect production and productivity in extensive system of pig production.
REFERENCE
[1] Parkunan T, Das AK, Banerjee D, Mohanty N, Paul A, Nanda PK, Biswas TK, Naskar S, Bag S, Sarkar M, Mohan NH, DasB C 2017. Changes in expression of monocarboxylate transporters, heat shock proteins and meat quality of Large White Yorkshire and Ghungroo pigs during hot summer period. Asian-Australasian Journal of Animal Sciences (AJAS) 30(2):246-253.
It is I
LLEGAL t
o cop
y, pri
nt or
save
any c
onten
t of th
is PDF,
in pa
rt or in
full,
on an
y retr
ieval
syste
m,
withou
t the E
XPRESS WRITTEN PERMISSIO
N of th
e cop
yrigh
t-hold
er

National Conference on Climate Change and Agricultural Production: Adapting Crops to Climate Variability and Uncertainty, 6th–8th April, 2017
[642]
Studies on Physico-Chemical and Sensory Characteristics of Orange (Citrus reticulate) based Whey Beverage
H.V. Wadatkar*, S.D. Chavan, R.R. Shelke and P.A. Kahate Department of Animal Husbandry and Dairy Science,
Dr. Panjabrao Deshmukh Krishi Vidyapeeth, Akola–444104 E-mail: *[email protected]
Keywords: Paneer Whey, Orange Juice, Beverage
INTRODUCTION
Whey is the largest and highly nutritious important by product of the dairy industry, it is obtained during the manufacture of casein, cheese, paneer, channa and shrikhand. Whey protein comprises of four major protein fractions and six minor protein fractions. Major protein fractions include beta-lactoglobulin (65%), alpha-lactalbumin (25%), bovine serum albumin (8%) and immunoglobulins (2%). The current world production of whey is estimated at about 165 million tonnes, of which cheese whey contributes about 95 percent. whey contains 45–50 per cent of total milk solids, 70 per cent of milk sugars, and 20 per cent of milk proteins, 70–90 per cent of milk minerals and almost all water soluble vitamins present in milk. It is one of the major problematic disposals for dairy industry because of high Biological Oxygen Demand (BOD) value ranging from 39,000 to 48,000 ppm (Divya and Kumari, 2009) and its stringent environmental regulatory acts. Pollution due to whey is a big problem thus utilization of whey for the production of beverages, soft drinks and wines are some of the solutions to minimize the intensity of pollution problem, with following objectives i.e. to standardized the process of preparation of paneer whey beverage using orange juice, to study the sensory quality of paneer whey beverage prepared by using orange juice, to study the chemical composition of prepared beverage.
MATERIALS AND METHODS
Good quality fresh buffalo milk was procured and then strained through muslin cloth. The fat content in milk ranged from 6 per cent. The milk was transferred to stainless steel vessel and heated to about 80oC. The vessel was then removed from the fire and cooled to 72oC. The coagulant i.e. citric acid solution @ 1.5 per cent was added slowly till complete coagulation of milk. Then the mass was poured over stretched piece of clean muslin cloth over another vessel to drain the whey. The clear drained whey was collected in the vessel. The yellowish green whey was then used for the preparation of whey beverage. The paneer whey beverage was prepared at various combinations T1 (90:10), T2 (85:15) T3 (80:20), T4 (75:25) and T5 (70:30) with 8 per cent sugar. The products were filled in sterilized bottles and then cooled and stored in refrigerator at 5–7oC.
RESULTS AND DISCUSSION
The mean score for overall acceptability for treatments T1, T2, T3, T4 and T5 were 8.10,8.31, 8.59, 8.85 and 7.85, respectively. The average score for treatments T1, T2, T3 and T4 were more than T5. The overall acceptability of paneerwhey beverage was significantly affected by addition of orange juice in whey beverage preparation. Paneer whey beverage with 25 per cent orange juice in treatment T4 was significantly superior in respect of acceptability of overall treatments. It indicates that blending of beverage with orange juice more than 25 per cent (T4) level decreases the score of overall acceptability which might be due to high intensity of flavour, dark colour and consistency. Similar results were reported by Chatterjee et al. (2015) formulated
It is I
LLEGAL t
o cop
y, pri
nt or
save
any c
onten
t of th
is PDF,
in pa
rt or in
full,
on an
y retr
ieval
syste
m,
withou
t the E
XPRESS WRITTEN PERMISSIO
N of th
e cop
yrigh
t-hold
er

National Conference on Climate Change and Agricultural Production: Adapting Crops to Climate Variability and Uncertainty, 6th–8th April, 2017
[643]
ready to drink whey based orange beverage and its storage stability. The incorporation of orange juice in blends of paneer whey up to 25% proportion was found acceptable without affecting the sensory characteristics significantly. Whey a byproduct generated during manufacturing of paneer can be efficiently utilized for the preparation of whey beverage products. The technology standardized by this study provides pace for household and commercialization at industrial level.
Table 1: Sensory Evaluation of Paneer Whey Beverage with Orange Juice Treatments Sensory Attribute
Score Flavour Colour and Appearance Consistency Overall Acceptability
T1 8.06 8.04 88.21 8.10 T2 8.28 8.33 88.35 8.31 T3 8.51 8.62 8.66 8.59 T4 8.75 8.91 88.84 8.85 T5 7.88 7.70 87.98 7.85 C.D. (p=0.05) 0.21 0.28 0.16 0.13
REFERENCES [1] Chatterjee G J, De N, Dutta A and Das S 2015. Formulation and statistical evaluation of a ready-to-drink whey based orange beverage
and its storage stability. Revista Mexicana de Ingenieria Quimica 14(2): 253-264. [2] Divya and Kumari A 2009. Effect of different temperatures, timings and storage periods on the physico-chemical and nutritional
characteristics of whey-guava beverage. World Journal of Dairy and Food Science 4(2): 118-122.
Genomic Selection of Livestock in the Context of Climate Change— An Overview
Rajkumar Sah1* and Dr. S.P. Dixit2 1National Dairy Research Institute, Karnal–132001, India
2National Bureau of Animal Genetics Resources, Karnal–132001, India E-mail: *[email protected]
Keywords: Genomic Selection, Adaptation, Climate Change, SNP, Genomic Tools
Characterization of breeds and individuals with modern genomic tools should be applied to identify breeds that have genetically adapted to marginal conditions and to get critical information for breeding and conservation programme. Thus for mitigation of the effect of climate changes, it is needed to develop genetic strategy for adaptation, gathering of information & maintaining the genetic diversity pertaining to adaptive traits as well as to develop modern tools for analysis. Dense whole genome SNP chips and Next Generation Sequencing (NGS) applications such as whole genome and RNA sequencing, analysis of regulatory (miRNAs) elements and DNA methylation profiles for epigenetic analysis can be used to investigate genetic background of adaptation in livestock breeds and species. SNP are informative and relatively easy to identify, study on model species have shown that insertion-deletion polymorphism also play an important role in genome evolution and adaptation. Within breed, broad genetic diversity will clearly allow for greater opportunities for selection for adaptation. Feng-Hua LV et al. (2014) also showed spatial distribution of some variants that are candidates to underpin adaptive variation. Porto-Neto (2014) pointed as the several important genes that have large effect on adaptation that could be introduce into more temperate cattle without detrimental effects on productivity. Animal genomic and improvement laboratory project report (2015) also claimed to identify two novel mutation related to thermo-tolerance and suggested as introduction of adaptive genetic variation is one way to increase sustainable production. Casu et al. (2015) genotyped the
It is I
LLEGAL t
o cop
y, pri
nt or
save
any c
onten
t of th
is PDF,
in pa
rt or in
full,
on an
y retr
ieval
syste
m,
withou
t the E
XPRESS WRITTEN PERMISSIO
N of th
e cop
yrigh
t-hold
er

National Conference on Climate Change and Agricultural Production: Adapting Crops to Climate Variability and Uncertainty, 6th–8th April, 2017
[644]
cattle breed population using Illumina Bovine SNP 50 K Bead chip and found that breeds are clearly differentiated according to geography & climate which suggested the evidence of genetic adaptation to different climatic pressure of the breeds. Chan.E.K et al (2010) found 14 regions with significant different allele frequencies between Zebu & Taurine and after functional analysis found discrimination between temperate & tropically adapted cattle. Kumar Rakesh et al (2016) identified SNPS in targeted regions(exon 3) of HSP90AA1 gene and analyzed their association with heat tolerance traits in Kara Fries cows and found cows with GG genotypes favored for heat tolerance trait and can be used as aid to selection for thermo-tolerance. Heat tolerance capacity can be improved to introduce a gene for slick hair coat, responsible for heat stress and tick & tick transmitted diseases resistance into temperate climate breeds (Berman., 2011). With advancement in statistical and bioinformatic tools, we can now identify selection signatures of adaptation to challenging environment conditions. Here in this paper we aim how to quantify thermo-tolerance capacity of animals, and to associate it with genomic information so as to develop breeding strategy for pending climate change.
REFERENCES
[1] Berman A2011. Are adaptations present to support dairy cattle productivity in warm climates? https://www.ncbi.nlm.nih.gov/pubmed/udi-21524505
[2] Casu S, Cimpolini R, Mastrangelo S and Flori L 2015. Adaptation of Mediterranean bovine livestock to climate constraints. Genetic diversity and breeding systems. http://csa2015.cirad.fr/var
[3] Chan EK., Nagaraj SH and Reverter A2010. The evolution of tropical adaptation: comparing taurine and zebu cattle. https://www.ncbi.nlm.nih.gov/pubmed/udi-20477791
[4] Feng-Hua Lv, Saif Agha, Juha kantanen, Licia Colli, Sylvie Stucki 2014. Adaptation to climate-mediated selective pressures in sheep. Doi:10.1093/molbev/msu264.
[5] Kumar R, Gupta I D, Verma, A2016. Novel SNP identification in exon 3 of HSP90AA1 gene and their association with heat tolerance traits in Karan Fries cows under tropical climatic condition Tropical Animal Health Production 48(4):735–740
[6] Porto-Neto LR, Reverter A, Prayaga KC, Chan EKF, Johnston DJ2014.The genetic architecture of climatic adaptation of tropical cattle. PLoS ONE 9(11): e 113284, doi: 1371/journal. pone.
Livestock Production with Changing Climate in Bihar
Bibha Kumari1*, Ranveer Kumar Sinha2 and Rakesh Kumar3
1Veterinary Science & A.H., KVK, Arwal, 2Department of Veterinary Medicine, BVC, Patna, 3KVK, Arwal, Bihar Agricultural University, Sabour, Bhagalpur-813210,India
E-mail: *[email protected]
Keywords: Heat Stress, Climate Change, Livestock and Cross Breed
Animal husbandry and livestock production is important sectors to improve the economy of rural household in Bihar since majority of the farmers are small and marginal. Climate change has profound effect on livestock production. The direct effects are high temperature and changes in rainfall patterns, translating in an increased spread of existing vector born diseases and macro parasites of animals as well as the emergences and spread of new diseases. A network of Krishi Vigyan Kendra (KVKs) disseminates animal agricultural technologies and innovations to the farmers. The different practices have been emphasized in this report for improving livestock production in changing climate. Methods use to mitigate the environmental changes focus on heat stress. Recently, Silanikove and Koluman (2015) forecasted the severity of heat stress as an increasing problem in near future because of global warming progression. Heat stress suppresses appetite, feed intake and increased water intake. This requires alleviating heat stress diet including low fibre and low protein to minimize diet induced thermogenesis. Increase the nutrient concentration in the feed to compensate lower intake. Addition of feed vitamins and mineral supplementation helps in increasing feed
It is I
LLEGAL t
o cop
y, pri
nt or
save
any c
onten
t of th
is PDF,
in pa
rt or in
full,
on an
y retr
ieval
syste
m,
withou
t the E
XPRESS WRITTEN PERMISSIO
N of th
e cop
yrigh
t-hold
er

National Conference on Climate Change and Agricultural Production: Adapting Crops to Climate Variability and Uncertainty, 6th–8th April, 2017
[645]
intake, modify gut microbial population and gut integrity. Sprinkling of cool water over the animals at regular interval during the hot period reduce the heat stress. Collier et al., (2006) have also documented the beneficial use of water spray, with or without fans, on dairy cows to enhance production during period of heat stress. Crossbreds are more vulnerable to heat stress as compared to indigenous one. Indiscriminate cross breeding should be avoided. Gradual improvement of existing indigenous breed, removal of useless stock and replacement with heat tolerant animals are required the most attention. Appropriate actions include: shade, sprinkling, air movement, acting cooling, nutritive diet, improvement of indigenous breed, discriminate cross breeding.
REFERENCES [1] Collier RJ, Dahl GE, Van Baale M J 2006. Major advances associated with environmental effects on dairy cattle. Journal of Dairy Science
89:1244-1253. [2] Silanikove N and Koluman N D 2015. Impact of climate change on the dairy industry in temperate zones: Predication on the overall
negative impact and on the positive role of dairy goats in adaptation to earth warming. Small Ruminant Research 123:27-34.
Study on Effect of Climatic Variables on Growth Rate and Egg Production Performance Layer Birds (BV-300)
Amit Kumar*, Rajesh Kumar and M.Z. Hoda Bihar Agricultural University, Sabour, Bhagalpur–813210, India
E-mail: *[email protected]
Keywords: Climatic Variables, Growth Rate, Egg Production, Temperature, Best Linear Unbiased Estimator (BLUE)
INTRODUCTION
Poultry industry is one of the fastest growing segments of the agricultural sector in India. Poultry is the cheapest source of protein available for human consumption, but it cannot tolerate a wide range of climatic variations which affects the growth rate and egg production performance of birds. Climate variation is one of the major threats to poultry production. Birds of different breeds/strains and of different age, sex, stage of production, and reproduction respond differently to climatic variations [1?]. Climate change and animal production always are complementary to each other and its effect on livestock and poultry production is witnessed all over the world [2?]. India is more vulnerable due to demographic pressure on natural resources and poor coping up mechanisms. Each individual phenotype is the result of an interaction between the specific genotype and a particular environment. Therefore, genotype × environment interaction is used to describe the situation where, different genotypes (breeds, lines, strains) respond differently to different environments [3?]. Temperature, solar radiation, rainfall, atmospheric pressure, etc., are related with growth rate and laying capacity of birds. The levels of performance of poultry, does not depend only on inherited capacity but, also to a great extent upon the environment [4?].
MATERIALS AND METHODS
The present study was designed to assess the effect of climatic variables on growth rate and egg production performance of layer birds (BV-300). The experiment was conducted for a period of three years with 500 layer birds under cage battery system of housing at Poultry unit, BAC Farm, Sabour. A hatch of 550 day old layer chicks was brought under the study. The growth rate was recorded at weekly interval and egg production were recorded 20 weeks onwards to 70 weeks of age with environmental variables like
It is I
LLEGAL t
o cop
y, pri
nt or
save
any c
onten
t of th
is PDF,
in pa
rt or in
full,
on an
y retr
ieval
syste
m,
withou
t the E
XPRESS WRITTEN PERMISSIO
N of th
e cop
yrigh
t-hold
er

National Conference on Climate Change and Agricultural Production: Adapting Crops to Climate Variability and Uncertainty, 6th–8th April, 2017
[646]
temperature, humidity, sunshine and rainfall. Initially the data were subjected to brooding effect and sire effect corrections through best linear unbiased estimator (BLUE) method and the multiple linear regressions of environmental variables on each trait were applied.
RESULTS AND DISCUSSION
Based on analysis of experimental results overall regression was significant (p<0.01) in both the traits the normal R2 value was found between 0.18-0.90 for both the traits. The regression coefficient values (b values) for maximum and minimum temperatures were significant (p<0.05) on 8th week age body weight females. The almost all the b values were significant (p<0.05) for egg production up to 70 weeks of age. The environmental variables under study were temperature, rainfall, humidity and sunshine hours. Based on analysis of variance and regression coefficient it was revealed that the various environmental variables play a significant role in body weight gain (growth rate) and egg production performance.
Table 1: Values (Ranges) of Climatic Variables for Different Ages of Layer Birds at Weekly Intervals Age Groups
0–8 Weeks 0–20 Weeks 0–40 Week 20–70 Week Mean morning RH (%) 81-87 76-85 75-88 74-88 Mean maximum temperature (°C) 34.2-36.3 33.2-37.4 27.2-34.4 23.1-34.1 Mean minimum temperature (°C) 12.7-22.7 13.7-25.2 14.7-26.2 16-25.8 Mean evaporation (mm) 3.6-8.4 2.6-8.4 2-8.4 1.9-5 Mean afternoon RH (%) 33-61 31-78 30-87 34-91 Weekly total rainfall (mm) 0-24.6 0-91.7 0-113.6 0-215.3 Total rainy days 7 28 45 29 Mean wind velocity (km/h) 1.3-7.4 2.1-8.2 2.0-12.2 2.1-7 Total bright sunshine (hours) 254.2 842.3 959.4 1245.6
Table 2: Least Squares Means±sem of Body Weight and Egg Production of Layer Birds at Various Ages 0–8 Weeks 0–20 Weeks 20–40 Week 40–70 Week Body weight (gms) 943.32±3.10* 1489.64±8.21 1248.32±6.43 1232.52±5.11 Egg Production (Numbers) - - 121±2.54* 168±1.10**
*Significance at P<0.05, ** Significance at P<0.01
REFERENCES [1] Alade O A and Ademola A O 2013. Perceived effect of climate variation on poultry production in Oke Ogun area of Oyo State. Journal of
Agricultural Sciences 5(10): 176-182. [2] Menquesha M 2011. Climate change and the performance of rearing poultry for the demand of protein foods. Asian Journal of Poultry
Sciences 5: 135-143. [3] Okere I A 2013. Growth traits, breast meat yield and quality of broiler genotypes under hot conditions. Iranian Journal of Applied Animal
Sciences 4(1): 159-164. [4] Babinszky L, Halas V and Verstegen M WA 2011. Impacts of climate change on animal production and quality of animal food products.
In: Blanco, J. and Kheradm and, H., editors. Climate Change–Socio-Economic Effects. In: Tech, Croatia. pp. 165-190.
It is I
LLEGAL t
o cop
y, pri
nt or
save
any c
onten
t of th
is PDF,
in pa
rt or in
full,
on an
y retr
ieval
syste
m,
withou
t the E
XPRESS WRITTEN PERMISSIO
N of th
e cop
yrigh
t-hold
er

National Conference on Climate Change and Agricultural Production: Adapting Crops to Climate Variability and Uncertainty, 6th–8th April, 2017
[647]
Goat Husbandry Practices under Changing Climate Scenario in Banka District, Bihar
Dharmendra Kumar1*, Asit Chakrabarti1, Sanjiv Kumar2 and Kumari Sharda3 1Krishi Vigyan Kendra, Banka–813102, India
2ICAR, Complex Eastern Region, Palandu, Ranchi–832010, India 3ICAR-NAARM, Rajendranagar, Hyderabad–500030, India
E-mail: *[email protected]
Keywords: Climate Change, Goat Husbandry, Feed Availability, Goat Diseases, Kid Mortality
INTRODUCTION
The role of goat farming in the upliftment of small, marginal farmers including landless agricultural labours in India is well recognized (Kumar et al., 2014).India’s goat husbandry depends largely on the monsoon grasses and bushes as changing rainfall pattern would cause scarcity of grazing resources. The contribution of goat to total milk production of India was 3.82 percent wereas; it is 69.35 percent in case of meat production (GOI, 2006) and Bihar possesses the third largest goat population in the country. India’s total livestock and goat population has decreased by about 3.33 and 3.82 percent but in Bihar increased by 8.56 and 19.54 percent. Given the importance of climate change affecting livestock productivity, this study collates and synthesizes literature on effect of changing climate on goat farming in Banka district of Bihar.
MATERIALS AND METHODS
The study area had mixed farming, comprised of crop, livestock including goat and other domesticated animals. Banka district is located in between latitude 24.7757° N and longitude 86.8220° E at an altitude of 85-247 meters above Sea level (MSL) having annual average rainfall of 1200 mm and area 3,019 km². Total 100 farmers of Banka district were randomly identified and interviewed personally using standard procedure with pre-module questionnaires. Data were collected from November 2015 to October 2016.
RESULTS AND DISCUSSION
The analysis of data collected on goat husbandry practices under climate change scenario revealed that there was a significant impact on goat husbandry as there were changes in breed composition, goat population, feed and fodder scarcity, shrinkage of grazing land, spread of diseases, reproductive disorders, productive performances, consumer demand etc. The area of grazing land has declined by 26 to 63 percent during last 3 decades mainly due to large-scale privatization. With declining and erratic distribution of rain fodder production declined 40–50 percent of normal production which was 2–3q/ha of dry fodder yield under normal rainfall condition. Age at first conception and calving in goats increased by 2.0 and 2.5 months, respectively. Average kid production per goat decreased in number kids delivered in one time decreased. Last age of kidding reduced to 4.5 years. The kids mortality increased by 45 percent due to poor milk yield and also cost on treatment increased by 20 percent. Growth performances and milk production also reduced by 15 and 20 percent, respectively. Heat stress and related diseases, stress on animals, extreme weather conditions and change in weather in short interval, erratic rain leads to increase of incidences and emergence of Peste des petits ruminants (PPR), haemorrhagic septicemia enterotoxaemia, contagious ecthyma etc diseases. Poor availability of green grass, other than monsoon season increases the incidence of metabolic
It is I
LLEGAL t
o cop
y, pri
nt or
save
any c
onten
t of th
is PDF,
in pa
rt or in
full,
on an
y retr
ieval
syste
m,
withou
t the E
XPRESS WRITTEN PERMISSIO
N of th
e cop
yrigh
t-hold
er

National Conference on Climate Change and Agricultural Production: Adapting Crops to Climate Variability and Uncertainty, 6th–8th April, 2017
[648]
disease, corneal opacity and night blindness associated with vitamin A deficiency and early disposal of goat for mutton purposes. Less number of farmers were interested in rearing of castrated male goat. The availability of safe drinking water was declining rapidly. Rich farmers sold their goats at 8.5 month of age weighing 15 kg body weight where as poor farmers sold at an age of 4.5 months when they hardly attain body weight of 5.5 kg due to scarcity of feed and fodder. Climate change causes extreme weather and erratic rain condition affecting the feed and fodder availability and emergence of diseases. These affect the productivity of goat and causes economic losses of framers.
REFERENCE [1] Kumar U, Reader ML, Singh R, Balwada G and Chaturvedi D 2014. Economics of goat farming under traditional low input production
system in Bikaner District. Asian Journal of Animal Science 9(2): 160-163.
Study on Willingness to Adoption of Mitigation Measures of Greenhouse Gases Emission in Dairy Farming
Pampi Paul*, B.S. Meena, Mukesh Kumar and Mahesh B. Tengli Dairy Extension Division, ICAR-National Dairy Research Institute, Karnal–132001, India
E-mail: *[email protected]
Keywords: Green House Gases, Dairy Farming
INTRODUCTION
Dairy farming is a well known anthropogenic source of greenhouse gases (GHGs). Methane (CH4), carbon di–oxide (CO2) and nitrous oxide (N2O) are three main GHGs used to emit from dairy farming. Globally, milk production generates 2.7 percent of GHG emission (Gerber et al., 2010). Enteric fermentation, manure management, energy utilization pattern in farm etc. are different practices responsible for it. Nevertheless, to be optimistic there are many mitigation measures available to adopt and follow to mitigate the emission of greenhouse gases from dairy farming. So, in this perspective this study was conducted to assess the willingness to adoption of different mitigation measures available at farm level.
MATERIALS AND METHOD
This study was conducted in three districts of Haryana; the state has divided into two zones i.e. east and west; from eastern zone Karnal and Yamunanagar districts and from western zone Hisar were selected for this study. Those commercial dairy farms were taken in to consideration where from last 5 years farmers were actively associated with dairy farming commercially and have good hard size (>30 animals).in present From each district 10 commercial dairy farms/farmers were taken and total 30 dairy farmers were interviewed personally with structured, pretested, reliable interview schedule and the responses for willingness to adoption of mitigation measures has taken in two ways i.e. yes or no.
RESULTS AND DISCUSSION
Especially at the farm level knowing the willingness to adoption of any technology is necessary before formulating any particular strategy. Though the dairy farming is a recognized source of GHGs but to be
It is I
LLEGAL t
o cop
y, pri
nt or
save
any c
onten
t of th
is PDF,
in pa
rt or in
full,
on an
y retr
ieval
syste
m,
withou
t the E
XPRESS WRITTEN PERMISSIO
N of th
e cop
yrigh
t-hold
er

National Conference on Climate Change and Agricultural Production: Adapting Crops to Climate Variability and Uncertainty, 6th–8th April, 2017
[649]
optimistic there are some mitigation measures available; this paper analyses the willingness to adoption of mitigation measures by the commercial dairy farm owners in possible two ways either yes or no; and for each mitigation practices calculation of frequency and percentage carried out. The results show that 100 percent commercial dairy farms owners were willing to adopt the practices like best farm management plan and feeding practices for dairy animals, increase forage quality (Table 1) to reduce the methane (CH4) emission. Even 93.33 percent of respondents were ready to minimize the grazing period of the dairy animals while in the other hand, 86.66 percent of respondents were unwilling to use of silage preservative and digestion of manure for dairy animals, yet 100 percent farms owner were not willing to adopt anaerobic digesters for manure management. At the same time some practices were most acceptable to most of the farmers such as minimizing the grazing time for dairy animals, removal of manure from floor regularly etc. The practices which are easy and affordable were easily acceptable to the respondents, at the same time the practices which were complicated to some extent were not understandable to the farmers. In this perspective, we need to identify more location specific mitigation strategies which are resource oriented; less cost associated and easily can be use at the small and marginal farm level. So to make the dairy farming eco-friendly need to develop and popularize more suitable environment friendly practices which are useful at farmers’ level.
Table 1: Willingness to Adoption of Mitigation Measures for Reduction of Greenhouse Gases Emission in Dairy Farming
Sl. No. Mitigation Practices Willingness to Adoption YES NO
Frequency Percentage Frequency Percentage 1 Best farm management plan 30 100.00 0 0.00 2 Improve the feeding practices 30 100.00 0 0.00 3 Use feed additives 9 30.00 21 70.00 4 Increase the forage quality 30 100.00 0 0.00 5 Proper management practices 26 86.66 4 13.33 6 Anaerobic digesters that can improve energy efficiency from manure 0 0.00 30 100.00 7 Willing to manage indoor storage of manure 20 66.67 10 33.33 8 Improving soil management practices 8 26.66 22 73.33 9 Digestion of manure 4 13.33 26 86.66
10 Avoid excess nitrogen in the diet for animals 21 70.00 8 26.66 11 Increasing the manure storage time 17 56.66 13 43.33 12 Follow covered manure storage structures 15 50.00 15 50.00 13 Ready to minimize the grazing period for your dairy animals 28 93.33 2 6.66 14 Follow more frequent removal of manure from housing floors of the farm 27 90.00 3 10.00 15 Willing to change housing systems after years of interval 13 43.33 17 56.66 16 Willing to increase the level of concentrate in diet for your animals 14 46.66 16 53.33 17 Use silage preservatives 4 13.33 26 86.66 18 Harvesting the forage at early stage 13 43.33 17 56.66
REFERENCE [1] Gerber P, Vellinga T, Dietze K., Falcucci A, Gianni G and Mounsey J 2010. Greenhouse gas emissions from the dairy sector: A life cycle
assessment. Food and Agriculture Organization of the United Nations, Animal Production and Health Division, Rome, Italy
It is I
LLEGAL t
o cop
y, pri
nt or
save
any c
onten
t of th
is PDF,
in pa
rt or in
full,
on an
y retr
ieval
syste
m,
withou
t the E
XPRESS WRITTEN PERMISSIO
N of th
e cop
yrigh
t-hold
er

National Conference on Climate Change and Agricultural Production: Adapting Crops to Climate Variability and Uncertainty, 6th–8th April, 2017
[650]
Ameliorative Effect of Chromium and its Correlation with Heat Stress Markers in Tropical Buffaloes
G.M. Vidyalakshmi1, M.C. Patak1, M.R. Verma2, K. Narayanan3 and Gyanendra Singh1 1Division of Physiology and Climatology, ICAR-IVRI, Izatnagar, Barielly–243122, India
2Livestock Economic, Statistics and Information Technology, ICAR-IVRI, Izatnagar, Barielly–243122, India
3Animal Reproduction Division, ICAR-IVRI, Izatnagar, Barielly–243122, India
Keywords: Buffaloes, Heat Stress, Chromium, Stress Marker
INTRODUCTION
The optimum thermal-humidity-index (THI) for buffalo is 67–72 (Kadzere et al., 2002) as THI increases animals try to maintain homeostasis in a narrow thermal comfort zone by dissipating excess heat load. If all such means fails, alternation in physiological variable occurs along with modification in expression profile of large group of chaperons called heat shock proteins (HSPs). HSPs allow cells to adapt to changing environment so they play crucial roles during stress adaptation. An experiment was conducted to know the relationship between THI, Physiological responses, HSPs (HSP70, 90 and 110) and HSF1 (heat shock factor1) with each other and with varying serum chromium concentration.
MATERIALS AND METHODS
Male buffaloes were randomly allotted into three groups (n=6): 1. NHS (ambient control: THI-68.09), 2. HS (heat stressed: THI-89) and 3. HSC (heat stressed + Chromium picolinate (CrPiC3) supplementation @1.5mg/KG DMI: THI-89). Cardinal physiological responses rectal temperature (RT), respiratory rate (RR) and pulse rate (PR) and blood samples for, gene expression and serum Cr concentration estimation were taken on day 0, 5, 10, 15, 20 and 28 (recovery). Physiological parameters were taken using standardized methods, gene expression done by standard lab protocol and serum Cr was estimated by atomic absorbance spectrophotometer. Pearson correlation was applied for statistical analysis.
RESULTS AND DISCUSSION
The optimum thermal-humidity-index has a highly significant (P<0.0001) positive correlation with RT, RR, PR and relative mRNA expression of HSP70 (Table 1). Moreover, except HSP90 and RT all have a highly significant (P<0.0001) positive correlation with serum Cr concentration. But no correlation was noticed between HSP90 and HSP70 and similarly between HSP90 and PR. On counter to stress multiple cellular mechanisms like, transcriptional activity of numerous protein gets damage results in their accumulation. HSPs act as chaperon by up-regulating in their expression and prevent protein misfolding hence accumulation. Alteration in physiological parameter along with up-regulation of HSPs and HSF1 act as the potential indicator of buffalo’s adaptation to harsh environmental stress (Dangi et al. 2012). So to maintain narrow homeostasis animals need energy in the form of glucose. Cr has a potent role in uptake of glucose by cell through increasing insulin receptor sensitivity, so supplementation of Cr during heat stress has significant ameliorative effect in buffaloes.
It is I
LLEGAL t
o cop
y, pri
nt or
save
any c
onten
t of th
is PDF,
in pa
rt or in
full,
on an
y retr
ieval
syste
m,
withou
t the E
XPRESS WRITTEN PERMISSIO
N of th
e cop
yrigh
t-hold
er

National Conference on Climate Change and Agricultural Production: Adapting Crops to Climate Variability and Uncertainty, 6th–8th April, 2017
[651]
Table 1: Correlation Coefficient among Physiological Parameters, THI, Serum Cr Concentration and Relative mRNA Expression of HSPs
Pearson Correlation Coefficients THI Cr RT RR PR HSP70 HSP90 HSP110 HSF1
THI Cr 0.689*** RT 0.429*** 0.284** RR 0.505*** 0.454*** 0.695*** PR 0.437*** 0.541*** 0.485*** 0.646*** HSP70 0.579*** 0.556*** 0.456*** 0.617*** 0.701*** HSP90 0.268** 0.252** 0.22494* 0.239** 0.150 0.350*** HSP110 0.276* 0.494*** 0.233** 0.491*** 0.561*** 0.687*** 0.166 HSF1 0.317** 0.453*** 0.352*** 0.461*** 0.579*** 0.699*** 0.185* 0.561***
*P<0.05; **P<0.01;***P<0.0001
REFERENCES [1] Dangi S S, Gupta M, Maurya D, Yadav V P, Panda R P, Singh G, Mohan N H, Bhure S K, Das B C, Bag S, Mahapatra R K, Sharma G T and Sarkar M.
2012. Expression Profile of HSP Genes during Different Seasons in Goats (Capra hircus). Tropical Animal Health Production 44(8): 1905-1912. [2] Kadzere C T, Murphy M R, Silanikove W and Maltz I 2002. Heat stress in lactating dairy cows: A review. Livestock Production Science 77(1): 59–91.
Combating Negative Effects of Climate Change through Improved Management Practices for Animals
Madhu Shelly Punjab Agricultural University, Ludhiana–141004, India
E-mail: [email protected]
Keywords: Temperature Stress, Humidity Stress, Management Tools
INTRODUCTION
IPCC predicted an annual mean surface temperature rise by 2.5 to 4.0°C up to the end of century, with more pronounced warming in the northern parts of India, which would cause a drastic decline in livestock productivity. Temperature and humidity interact to cause stress in animals causing reduction in the animal’s ability to produce milk, gain weight and reproduce. This leads to increasing production costs as a result of reductions in performance associated with lower feed intake and increased requirements for energy to maintain healthy livestock. Besides death of livestock associated with extreme weather events are also reported. Three basic management tools/ schemes for reducing the effect of thermal stress have been suggested (Kumar et al; 2009): (a) Physical modification of the environment; (b) Development of genetically less sensitive breeds and (c) Improved nutritional and management practices. There is a need to sensitize and inform the farming community so as to garner their support in this endeavor.
MATERIALS AND METHODS
In Muktsar district, 55 farmers in total were identified from 8 different villages, with a herd size ranging from 4–15 animals. They were identified from among the trainees of “Commercial dairy farming” and “Goat farming” trainings being conducted by Krishi Vigyan Kendra, Muktsar, and Punjab. Data were collected personally through a structural interview schedule that were pre-tested and adjusted prior to the objectives of the study. Data were collected from January 2013 to March 2014.
It is I
LLEGAL t
o cop
y, pri
nt or
save
any c
onten
t of th
is PDF,
in pa
rt or in
full,
on an
y retr
ieval
syste
m,
withou
t the E
XPRESS WRITTEN PERMISSIO
N of th
e cop
yrigh
t-hold
er

National Conference on Climate Change and Agricultural Production: Adapting Crops to Climate Variability and Uncertainty, 6th–8th April, 2017
[652]
RESULTS AND DISCUSSION
Ninety percent dairy farmers but only thirty percent goat farmers were aware regarding the effects of climate change on animal productivity. While eighty percent dairy farmers were concerned regarding the availability of feed and fodder for cattle, only 32 percent goat farmers seemed to be bothered for the same. Effect of climate change on summer season milk production was also a cause of major concern. Only forty eight percent dairy farmers knew about the potential adverse impact of climate change on long term milk production and reproduction capacity. Deleterious effect on occurrence of estrus with cases of silent estrus, short estrus and decline in reproduction efficiency in buffaloes is quite evident. Further only fifty six percent knew that heat stress decreases dry matter ingested and decrease the rate of weight gain whereas animals exposed to cold weather require more energy to maintain their body reserves and to maintain their body temperature. On the whole it was found that awareness as well as the willingness to counter the effects of climate change was more with dairy farmers than with goat farmers.
Table 1: Awareness Level among Dairy and Goat Farmers Regarding Climate Change Effects of Climate Change Dairy Farmers (%) Goat Farmers (%)
1. Availability of feed and fodder 80 32 2. Summer season milk production 92 26 3. long term milk production and reproduction capacity 68 36 4. occurrence of estrus with cases of silent estrus, short estrus 72 -- 5. heat stress decreases dry matter ingested and decrease the rate of weight gain 56 29
REFERENCES [1] Kumar P, Singh S V and Upadhyay R C 2009. Consultancy Project Report on measures to Alleviate Heat Stress in Cattle and Buffaloes
Submitted to: M/S Space Cool Systems Pvt. Ltd., New Delhi. [2] IPCC 2007. Summary for Policymakers. Climate Change 2007: Impacts, Adaptation and Vulnerability, A report of Working Group II of
the IPCC, Geneva, IPCC.
Effects of Climate Change on Poultry Production in Rohtas District of Bihar
Alok Bharti*, Ajay Kumar and Ram Pal Krishi Vigyan Kendra, Rohtas, Bikramganj, India
E-mail: *[email protected]
Keywords: Climate Change, Backyard Poultry, Egg Production, Meat Production
INTRODUCTION
Poultry plays an important economic, nutritional and socio-cultural role in the livelihood of poor rural households in many developing countries, including India. Backyard Poultry are birds that are developed to withstand the harsh local conditions. They render not only economic services but contribute significantly to human food as a primary supplier of meat & egg, source of income and employment to people compared to other domestic animals (Demeke, 2004). Poultry are efficient converters of feed to egg and meat within a short period of time. In terms of nutritive value, poultry egg rank second to cow milk. Keeping in view the above idea an attempt was made to observe the climate change effect on poultry production.
MATERIALS AND METHODS
For this study, simple random sampling technique was used to a total of 65 poultry farmers with at least having 4 poultry each. A well structured interview questionnaire was used as primary source of data collection from the sampled poultry farmers. Data analysis was done using descriptive statistics such as
It is I
LLEGAL t
o cop
y, pri
nt or
save
any c
onten
t of th
is PDF,
in pa
rt or in
full,
on an
y retr
ieval
syste
m,
withou
t the E
XPRESS WRITTEN PERMISSIO
N of th
e cop
yrigh
t-hold
er

National Conference on Climate Change and Agricultural Production: Adapting Crops to Climate Variability and Uncertainty, 6th–8th April, 2017
[653]
frequencies distribution, and percentages to determine the perception of the respondents on effects of climate change on poultry production in the study area. The study assesses the effects of climate change on backyard poultry production in Rohtas district of Bihar.
RESULTS AND DISCUSSION
Findings revealed that majority (91.2%) of the respondents are aware of climate change, 74, 96.4 and 82 percent of the respondents agreed that temperature fluctuation, increased in sunshine intensity and global warming has a negative effects on backyard poultry production, 72 percent of the respondents agreed that prices of feed grains are usually high in hot and dry seasons which may affect cost of backyard poultry production and number of farmers to rear backyard poultry, 75.8 percent of the respondents agreed that climate change has effect on feed grain availability, this implies that high temperature and low rainfall are climatic factors that affect general grain harvest, their supply to the market and ultimately cost of backyard poultry production. It is recommended that extension agents and other development agencies need to educate the poultry farmers more about the effects posed by climate change on poultry production and intensify awareness campaign to poultry farmers on how to reduce the effects of climate change on backyard poultry production.
REFERENCES [1] Adesiji G B, Baba S T and Tyabo I S 2014. Effects of climate change on poultry production in Ondo state, Nigeria. Russian Journal of
Agricultural and Socio-Economic Sciences 2(14): 55-60. [2] Demeke S 2004. Egg Production and Performance of local white leghorn hens under intensive and rural household conditions in
Ethiopia. Livestock Research for Rural Development 16(2): 2004.
Disease Incidences in Pigs Due to o Seasonal Variation and Climatic Effect in an Organized Farm
Asit Chakrabarti1* and Dharmendra Kumar2 1Pig Research Unit, ICAR Research Complex for Eastern Region, Ranchi–834010, India
2Krishi Vigyan Kendra, Banka–831102, India E-mail: *[email protected]
Keywords: Disease, Pig, Season, Climate
INTRODUCTION
Diseases in pig are very common where unhygienic management and proper health care is not adopted. But, in an organized farm where pigs are maintained with proper care and attention the incidences of disease is very concerning. In unattended cases, the animals lost its production potential and often died (Patra et al., 2014). Cargill and Davies (1999) opined that a variety of diseases, parasites and disorders affect skin of pigs that resulted in economic losses through sub-optimal growth rates. Considering the above facts the present study was carried out to find out the incidences of different diseases in different seasons and climatic variation in pigs in an organized farm.
MATERIALS AND METHODS
In total One hundred and sixty seven (Male 64, Female 103) crossbred pigs (Tamworth x Deshi) of both sexes were undertaken for study for two years period from January 2015 to December 2016 at ICAR RC ER, Ranchi Pig Research Unit. Uniform standard managemental practices were adopted throughout the year.
It is I
LLEGAL t
o cop
y, pri
nt or
save
any c
onten
t of th
is PDF,
in pa
rt or in
full,
on an
y retr
ieval
syste
m,
withou
t the E
XPRESS WRITTEN PERMISSIO
N of th
e cop
yrigh
t-hold
er

National Conference on Climate Change and Agricultural Production: Adapting Crops to Climate Variability and Uncertainty, 6th–8th April, 2017
[654]
Routine vaccination and deworming was done periodically. The animals were housed in a cemented floor with 3 feet high side wall and under GI sheet along with see-through plastic sheet. Washing of floor was done daily at 9.00 AM and excreta were removed twice daily both at morning and evening. During the one year study period incidences of different diseases that occurred in the institute farm were recorded in male, female, young, adult, seasonal variation and climatic effect was observed.
RESULTS AND DISCUSSION
In total 182 incidences of different diseases were recorded in the farm during two year period. Highest incidence was observed in wound (37.91%), followed by diarrhoea or scour (9.34%), mange mites (7.14%), self inflicted injury (6.59%), lameness ( 6.04%), anaemia (4.40%), vices-abnormal behaviour-ear biting, tail biting (3.85%), arthritis (3.85%), congenital tremor-shaking piglet (3.30%), vulva haematoma (2.75%), abscesses (2.75%), pneumonia (2.20%), leg weakness-osteochondrosis (2.20%), bush foot/ foot rot (1.65%), haematoma except vulva (1.65%), colitis, metritis and teat necrosis 1.10% each. Least incidence was observed in fracture and shoulder sores (0.55% each). Singh and Singh (2016) reported maximum number of maggot wound in hooves in dairy animals. Chakrabarti (2016) also observed maximum number of wound followed by maggot infestation in pigs. Highest incidence of wound may be due to contact with rough surfaces of concrete floor and rubbing of body with concrete wall. Ear is also a sensitive area and continuous rubbing of ear in side wall may inflicted wound in ear. No incidences of Anthrax, Swine fever, FMD etc observed during two years period may be due to timely vaccination against respective diseases. In total seven number of adult mortality were observed during the study period. Maximum number of animals died due to diarrhoea or scour. However, piglet mortality including still birth, crushing by sow was recorded 17. Out of 64 male animals 27 were affected with different diseases and female were affected 155 times out of 103 animals. Adults were more affected (34.73%) than young animals (12.57%). The incidences of seasonal variation was more prominent in Monsoon (June, July, August) season (75.00%), followed by post monsoon (72.73%) (September, October, November) and Pre-monsoon (52.44%) (March, April, May). Lowest incidences were observed in winter months (47.89%) (December, January, February). The maximum infestation in monsoon may be due to increase number of vector proliferation. Moreover in monsoon season humidity remains very high (> 95%) in this reason and gradually declines with less rainfall. Singh and Singh (2016) also found maximum number of maggot infestation in dairy animals in monsoon months. The incidences of disease in domestic animals decline after or before rainy season. There may be a direct co-relation between rainfall, humidity and increased pathogenic organism in rainy season. The infected wounds were treated with herbal drug and all the wounds healed up properly without any untoward incident and without any mortality of pig. Proper control of pathogen, vector and good management practices may reduce the incidences of disease in pigs.
REFERENCES [1] Cargill C and Davies P 1999. External Parasites. In: Diseases of Swine. EditorsStraw B, Mengeling W, D'Allaire S and Taylor D. Ames,
Iowa State University Press, pp: 669-683. [2] Chakrabarti A 2016. Incidence of maggot wound in crossbred pig in an organized farm. Paper presented in The International Conference
on Integrating climate, crop, ecology-the emerging areas of agriculture, horticulture, livestock, fishery, forestry, biodiversity and policy issues at Jawaharlal Nehru University, New Delhi on 4th June, 2016.
[3] Patra M, John R and Das R K 2013.Does folded skin predispose to maggot infestation in Ghungroo pig? International Journal of Livestock Research 4(1): 58-62.
[4] Singh A and Singh D 2016.A study on the incidence of myiasis among dairy animals in the State of Punjab, India. 9(1): 30-34.Snedecor G W and Cochran W G. (1995). Statistical Methods. 8th edn. Oxford, IBH Publication Company, New Delhi.
It is I
LLEGAL t
o cop
y, pri
nt or
save
any c
onten
t of th
is PDF,
in pa
rt or in
full,
on an
y retr
ieval
syste
m,
withou
t the E
XPRESS WRITTEN PERMISSIO
N of th
e cop
yrigh
t-hold
er

National Conference on Climate Change and Agricultural Production: Adapting Crops to Climate Variability and Uncertainty, 6th–8th April, 2017
[655]
Production Potential and Feasibility of Different Forage Based Cropping System in Bihar
Sanjeev Kumar Gupta*, G.S. Panwar, Rajesh Kumar, Amit Kumar, Mainak Ghosh, S. Sheraz Mahdi and Sunil Kumar
Department of Agronomy, Bihar Agricultural University, Sabour–813210, Bhagalpur, India E-mail: *[email protected]
Keywords: Forage, Guinea Grass, Berseem
INTRODUCTION
Livestock production is an integral and indispensable component of farming system in India. Fodder plays great role in decreasing the cost of milk production. Both quality and quantity of fodder are influenced due to plant species, stage of growth and agronomic practices particularly fodder based cropping system, intensive fodder production and continuous availability of quality fodder. With the intercropping of cereal and legume as fodder, improvement in forage yield and protein content has been reported (Iqbal et al., 2012). Bihar state owns 19798.75 thousands cattle and buffalo livestock in which 12231.52 thousands are cattle's and 7567.23 thousand buffaloes (DAHDF-2014). Only large farmers (< 5%) grow any fodder, small and a marginal farmer (90%) depends on crop residues and poor quality fodder for feeding the livestock. Keeping in view of deficit and shrinkage of cultivable land for agriculture, an experiment had been conducted with different cropping system for land utilization extensively in sustainable manner for round the year quality fodder production.
MATERIALS AND METHODS
A field experiment was conducted during 2012 to 2015 at Research Farm of Bihar Agricultural University Sabour to identify the suitable forage based cropping system for quality fodder in round the year. The experiment is comprising of seven treatments in randomized block design (RBD) and replicated thrice. The treatments comprising of T1 (NB hybrid + cowpea–Barseem-cowpea), T2 (Guinea grass + cowpea-Barseem–summer bajra), T3 (Guinea grass + Multicut. sorghum-Barseem-Ricebean), T4 (Multicut Sorghum-Barseem–Maize+ cowpea), T5 (Sorghum-Barseem-Maize + cowpea), T6 (Maize + cowpea-Oat-summer bajra+ Ricebean) and T7 (Sorghum + cowpea–Oat–Summer bajra + Rice bean). Management of crops in different treatments was done as per recommended package and practices. Harvesting of all component crops at their physiological maturity or at optimum stage for quality and maximum green forage biomass stages in each season and year. Planting of perennial grasses at 1x1 m distance and other crops are accommodated as per their recommended package and practices. The plant samples of each crop were oven-dried for estimation of dry matter and other parameters. Economics of different crops was calculated on the basis of prevailing market rate of green fodder and other inputs.
RESULT AND DISCUSSION
The results revealed that system of Multicut Sorghum–Berseem.–Maize + cowpea produced significantly higher mean green fodder yield (119.6 t/ha) over other cropping systems. However, inclusion of perennial grasses with annual grasses provides continuous supply of green fodder round the year. Among the perennial grasses Hybrid. Napiar was found higher yielder and better adaptability in terms of growth and fodder yield
It is I
LLEGAL t
o cop
y, pri
nt or
save
any c
onten
t of th
is PDF,
in pa
rt or in
full,
on an
y retr
ieval
syste
m,
withou
t the E
XPRESS WRITTEN PERMISSIO
N of th
e cop
yrigh
t-hold
er

National Conference on Climate Change and Agricultural Production: Adapting Crops to Climate Variability and Uncertainty, 6th–8th April, 2017
[656]
and produced higher green fodder yield as compared to Guenia grass based system. Similarly, Multicut Sorghum–Berseem.–Maize + Cowpea system followed by sorghum–Berseem.–Maize + Cowpea system produced significantly higher green forage biomass yield and proved their profitability for green fodder in round the year production system.
REFERENCE [1] Iqbal A, Akbar N, Khan H Z, Abbas R N and Ahmad J 2012. Productivity of summer legume forages intercropped with maize as affected
by mixed cropping in different sowing techniques. Journal of Animal and Plant Science 22:758-763.
Green Technologies and Utilities in Dairy and Food Industries for Sustainability in Rural India: A Review
Jahangir Badshah*, Rakesh Kumar and A.K. Jha Sanjay Gandhi Institute of Dairy Technology, Patna, India
E-mail: *[email protected]
Keywords: Green Technologies, Biodegradable, Biomethanation, Membrane Processing, Nano Technology
Ours is an agricultural country and about 70 per cent of population lives in rural India and majority of them depend upon agriculture and dairying to become sustainable. Still very low post harvest scientific processing of perishable commodities like milk, fruits, vegetables, fish and crops produces are being done at farm/village level due to poor infrastructures like roads, transports, electricity, lack of awareness for non-conventional energy resources and less energy intensive and minimal heat damaged technologies/ non-thermal technologies. Singh and Badshah (2008) proposed a new concept of augmentation of milk production and processing under rural management system. In fact there has been a concept thought by IDMC and other agricultural organizations to bring the plants near the produce instead of transferring the perishable raw produces such as milk, fruits, vegetables etc. to the plants situated at long distance to save the losses and uneconomical transportation costs. It would help the village self sufficient and self dependents and will avoid the migration of rural people from rural India to urban areas. The various constraints and problems for value addition at rural level with eco friendly and economical technologies and utilities/energy resources commonly referred as green technologies and utilities are necessary to review for the growth of rural areas and producing finished products with quality and safety of foods as per international standards without affecting the environment as well. There is a growing environmental concern in dairy and food industries due to generation of substantial amounts of by-products, bio-wastes, green house gases and effluents and also due to resource intensive conventional technologies and utilities/services employed in dairy and food industries. The production of products and services for consumers generate high carbon foot-print and low values of carbon credits in carbon trading during whole life cycle assessment from production of raw produce to consumption of finished products and thereby generation of wastes. Technologies which are ecofriendly such as Membrane processing, nanotechnology, High pressure processing, ohmic heating, pulse electric field, intelligent, active and biodegradable packaging etc causing reduced environmental impacts are discussed as green technologies in this article. In regards of green utilities for reducing carbon foot print and green house gases (GHGs), the application of renewable energy sources, biomethanation for biodegradable waste/effluent treatment, biomass energy, biofuels, plant automation, instrumentations, water and energy conservation
It is I
LLEGAL t
o cop
y, pri
nt or
save
any c
onten
t of th
is PDF,
in pa
rt or in
full,
on an
y retr
ieval
syste
m,
withou
t the E
XPRESS WRITTEN PERMISSIO
N of th
e cop
yrigh
t-hold
er

National Conference on Climate Change and Agricultural Production: Adapting Crops to Climate Variability and Uncertainty, 6th–8th April, 2017
[657]
methods are discussed to make the dairy and food plants environmentally and economically sustainable. A major strategic policies and interventions have to be planned under Jeevika and Dairy Cooperative Societies (DCS) at rural level to adopt entrepreneurs of dairy farming, dairy product processing by adopting green technologies and green/ecofriendly energy generation systems such as bio-fuels, solar energy and biogas energy. It will help farmers and small holders to establish small entrepreneurs at rural level to make the rural India sustainable by processing their produces at village level itself. Technologies and utilities which are environment friendly i.e have reduced environmental impacts and minimal degradation to the constituents of raw produces during processing without affecting the environments causing the increase in carbon foot prints are said to be Green Technologies and utilities. Green technologies feasible to rural areas are microwave (Tang et. al., 2006) for drying, pasteurization and sterilization etc.; Membrane technologies (Patterson, 2205) can be used for separation, concentration, cold sterilization of skim m ilk, fruit juices etc. and ohmic heating and pulsed electric field etc can be used for blanching, thawing, microbial inactivation, aseptic processing of raw produces with zero GHGs emission. How to overcome the constraints of energy resources apart from feasible non-thermal technologies are discussed for rural areas as under. Developments of small scale liquid milk and indigenous dairy and food products plants have already been discussed by many workers for industrialization of rural India (Badshah and Singh, 2008; Sawhney, 2007 and Badshah and Kohli, 2007). Only green utilities and technologies should be given further preference in research, investigation and installation & commissioning biogas is a conducive in maintaining proper sanitation and healthy environment. In fact, biogas system has become a very interesting energy system of rural areas of all developing countries of the world including India. The biogas being the result of anaerobic digestion of a number of agricultural and animal wastes & residues is seen as a solution for two most serious problems faced in rural areas, i.e. shortage of energy as well as high cost of fertilizers and increased carbon foot print load by emission of GHGs in dairying profession. To this effect, biogas is a renewable source of energy that provides the much needed fuel for cooking, lighting, pumping irrigation water, running small agro-business units, drinking water supply etc without increasing carbon foot print i.e. no environmental problem. The digested slurry is used as fertilizer, which will improve the agricultural productivity (Agarwal and Jogdanand, 2010).
REFERENCES [1] Agarwal A K and Jogdand S V 2010. Energy from Biogas. Indian Dairyman 62(4): 36-41. [2] Badshah J and Sing J 2008. Constraints of energy resources and utility services in rural dairy plants. In Souvenir of National Seminar on
Dairy Engineering for the cause of rural India at IGKV Raipur on 28-29 June, 2008, pp: 32-35. [3] Kadam R V and Saxena G S 1996. Managing a Dairy Effluent Treatment Plant. Indian Dairyman 48 (2):117-121. [4] Patterson C A 2005. Membrane Processing: State of the art technology. Technology Watch 2(2):1-2. [5] Ramaswamy R, Balasubramaniam V M and Shastry S K 2005. Ohmic heating of foods. Extension fact sheet, Ohio State University,
Columbus, OH. pp:1. [6] Sawhney I K 2007. Equipments for traditional Indian dairy foods-NDRI Experience. In Souvenir abstracts of International Conference on
tradional dairy foods. Nov. 14-17, 2007, NDRI, Karnal, India: 10. [7] Swadas B P 1996. Emerging trend in waste treatment. Indian Dairyman 48(2): 111-112. [8] Tang J, Hao F and Lao M 2006. Microwave heating in food processing. Department of Biological system Engineering. Washington State
University. pp: 26.
It is I
LLEGAL t
o cop
y, pri
nt or
save
any c
onten
t of th
is PDF,
in pa
rt or in
full,
on an
y retr
ieval
syste
m,
withou
t the E
XPRESS WRITTEN PERMISSIO
N of th
e cop
yrigh
t-hold
er

National Conference on Climate Change and Agricultural Production: Adapting Crops to Climate Variability and Uncertainty, 6th–8th April, 2017
[658]
Effect of Climate Change on Indian Fisheries Sector: Adaptation Strategies
Brajendu Kumar* and Satendra Kumar Krishi Vigyan Kendra, Khagaria, India
E-mail: *[email protected]
Keywords: Fisheries, Climate Change, Biotic Ctress, Abiotic Ctress, Adaptation Ctrategies
Fisheries is an important sector of agriculture in India, providing employment, food and nutritional security particularly to the rural poor and better access to protein rich food for all (Sathiadhas et al., 2014). It is also contributing handsomely to the agricultural exports and engaging more than fifteen million people at primary and secondary level. Increase in atmospheric and aquatic temperature of rich potential fisheries resources of India due to climate change is going to have wider implications on their production and productivity. Biotic effects on the culture fisheries resources consisting of ponds and tanks are reduced dissolved oxygen (DO) level, reduced growth and reproductive success of fishes, increased susceptibility of fishes to diseases, alteration of their physiological functions such as thermal tolerance, growth, metabolism, food consumption, reproductive success and the ability to maintain internal homeostasis, increased biological oxygen demand (BOD), increased toxicity of pollutants, etc. (Ficke et al., 2007). In the culture based and capture fisheries resources consisting of rivers and canals, floodplain lakes, reservoirs and brackish water-bodies, biotic effects of climate change are manifested by habitat loss, shift in the species composition, alteration of biodiversity, enhancement of primary productivity and eutrophication, etc. (Ficke et al., 2007; Yazdi and Shakouri 2010; Das 2013; Sharma et al., 2015; Anyanwu et al., 2015; De Silva and Soto 2009). The abiotic stresses are increased stratification of lakes and reservoirs, inundation of aquatic systems, alteration in flow regime of rivers, salinity changes etc (Hasnain 2002; IFAD 2014; Sharma et al., 2015). Operational cost of aquaculture and other associated activities will also be influenced (Pfaff et al., 1999; Yazdi and Shakouri 2010; Das 2013). Hence, the impact of the climate change on communities directly or indirectly associated with the resources is difficult to ignore. Adaptation strategies to the climate change should involve introduction of low oxygen tolerant species, selection of fish species that require short culture periods, provision of continuous supply of fish seed, integration of aquaculture with other farming practices, promoting culture based fisheries, enhancing provisions for breeding and recruitment, better weather surveillance and forecasting systems, capacity building to increase the resilience of fishing communities, promotion of fuel efficiency, conservation and sustainable use of resources in an equitable way etc (Vas et al., 2009; Mohanty et al., 2010; Handisyde et al., 2006; Yazdi and Shakouri 2010; Shelton 2014).
REFERENCES [1] Anyanwu C N, Amadi-Eke A S, Nwaka D E, Ezeafulukwe C F, Adaka G S 2015. Climate Change, Effects and Mitigation Strategies on
Aquaculture: A Review. Agriculture, Forestry and Fisheries 4(3-1): 70-72. [2] Broad K, Pfaff A S P, Glantz M H 1999. Climate information and conflicting goals: El Niño 1997–98 and the Peruvian fishery. Public
philosophy, environment and social justice, New York, USA, Carnegie Council of Ethics and International Affairs. [3] Das M K 2013. Impacts, vulnerability and adaptation of inland fisheries to climate change in India pp.181-209 In: T. Bhattacharyya, D.K.
Pal, D. Sarkar, S.P. Wani (eds ) Climate change and Agriculture. Stadium Press (India) Pvt. Ltd. New Delhi, India. [4] De Silva S.S. and Soto D. 2009. Climate change and aquaculture: potential impacts, adaptation and mitigation. In: Climate change
implications for fisheries and aquaculture: overview of current scientific knowledge (Cochrane, K., Young, C., De Soto D. & Bahri T. eds.). FAO Fisheries and Aquaculture Technical Paper. No. 530. Rome, FAO pp: 151-212.
[5] Ficke A D, Christopher A M, Lara E and Hansen J 2007. Potential impacts of global climate change on freshwater fisheries. Review Fish Biology Fisheries 17:581–613.
[6] Handisyde N T, Ross L G, Badjeck M C and Allison E H 2006. The effects of climate change on world aquaculture: a global perspective.
It is I
LLEGAL t
o cop
y, pri
nt or
save
any c
onten
t of th
is PDF,
in pa
rt or in
full,
on an
y retr
ieval
syste
m,
withou
t the E
XPRESS WRITTEN PERMISSIO
N of th
e cop
yrigh
t-hold
er

National Conference on Climate Change and Agricultural Production: Adapting Crops to Climate Variability and Uncertainty, 6th–8th April, 2017
[659]
[7] Hasnain S I 2002. Himalayan glaciers meltdown: impact on south Asian rivers. FRIEND 2002—Regional Hydrolog}': Bridging the Gap between Research and Practice (Proceedings of the Fourth International FRIEND Conference held at Cape Town. South Africa. March 2002). IAI IS I'ubl. no. 274.
[8] IFAID 2014. Guidelines for Integrating Climate Change Adaptation into Fisheries and Aquaculture Projects. [9] Mohanty B P, Mohanty S, Sahoo J K, Sharma A P 2010. Climate change: impact on fisheries and aquaculture. Climate Change and
Variability 7: 120-130. [10] Sathiadhas R,Katiha Pradeep K, Shyam S S and Narayanakumar R 2014. Indian Fisheries: The Setting. In: Livelihood Status of Fishers in
India. Central Marine Fisheries Research Institute, Kochi, 3-16. [11] Sharma A P, Joshi K D, Naskar M and Das M K 2015. Inland Fisheries and Climate Change: Vulnerability and Adaptation Options. ICAR-
CIFRI Special Publication ISSN 0970-616X Policy Paper No.: NICRA/Policy/2015-16/1. [12] Shelton C 2014. Climate Change Adaptation In Fisheries And Aquaculture Compilation of initial examples. FAO Fisheries and
Aquaculture Circular No. 1088 FIPI/C1088 (En). [13] Vass K K, Das M K, Srivastava P K and Dey S 2009. Assessing the impact of climate change on inland fisheries in River Ganga and its
plains in India. Aquatic Ecosystem Health & Management 12(2):138–151. [14] Yazdi S K and Shakouri B 2010. The Effects of Climate Change on Aquaculture. International Journal of Environmental Science and
Development 1(5).
Impact of Long Term Heat Stress Exposure on Feed and Water Intake of Tharparkar Cattle (Bos indicus)
Jaya, Mihir Sarkar and Puneet Kumar* Physiology and Climatology Division, Indian Veterinary Research Institute, Izatnagar, Bareilly, India
E-mail: *[email protected]
Keywords: Heat Stress, DMI, Tharparkar Cattle, Bos indicus
INTRODUCTION
Heat stress declines the reproduction, immunity and all metabolic activities in bovine and other species, thus causing huge economical loss to animal husbandry. Tharparkar cattle (Bos indicus), known to possess useful genetic traits for adaptation to tropical climate also, outside their zone of thermal comfort undergo stress. There is unequivocal evidence that hyperthermia is deleterious to any form of productivity, regardless of breed, and stage of adaptation. Therefore our study was planned to study the impact of long term heat stress on dry matter intake and water intake of Tharparkar cattle.
MATERIALS AND METHODS
Six male Tharparkar cattle aged 2.5-3 years were selected for the study. After acclimation in psychrometric chamber at thermo neutral zone for 15 days, they were exposed to 42⁰C temperature (10:00 h to 16:00 h) in thermostatically controlled psychrometric chamber for 23 days followed by 12 days recovery period at ambient temperature. Feed and water intake were recorded during control and heat challenge period on day 1, 12 and 23. Statistical analyses were done by using SPSS 17.0
RESULTS AND DISCUSSION
The feed intake in terms of dry matter intake was 2.42±0.12 Kg/100 Kg Body Weight before exposure which decreased significantly on day 23 of heat stress exposure (2.01±0.08Kg/100 Kg Body Weight).C.D. value for feed intake is 0.33. Decrease in feed intake was possibly due to an adaptive response to heat stress as increased environmental temperature under field conditions, reduces the gut motility, rumination, ruminal contractions and
It is I
LLEGAL t
o cop
y, pri
nt or
save
any c
onten
t of th
is PDF,
in pa
rt or in
full,
on an
y retr
ieval
syste
m,
withou
t the E
XPRESS WRITTEN PERMISSIO
N of th
e cop
yrigh
t-hold
er

National Conference on Climate Change and Agricultural Production: Adapting Crops to Climate Variability and Uncertainty, 6th–8th April, 2017
[660]
depresses appetite in ruminants (Yadav et al., 2013). Water intake initially was 19.50±1.38 litres/day which increased significantly from 28.50±1.7 litres/day on day 1 of heat exposure and to 38.00±1.97litres/day on day 23 of heat exposure, C.D. value for water intake is 4.83. Increase in water intake is due to an increased sweating and panting, resulting into osmoconcentration of the extracellular fluid which activates hypothalamic thirst center leading to higher water intake in the acclimating cattle to heat stress (Wankar et al., 2014). Exposure of the animal to high environmental temperature during long term heat stress stimulates the peripheral and core receptors to transmit nerve impulses to the specific centers in the hypothalamus, to help in preventing the rise in body temperature. The specific centres in the hypothalamus are the defensive evaporative and non-evaporative cooling systems, appetite center and the adaptive mechanisms that cause such reactions. Thus, less substrates become available for enzymatic activities, hormone synthesis and heat production, which help in cooling the body during long term heat stress (Perez., 2000).
Table 1: Dry Matter Intake (DMI) and Water Intake of Tharparkar Cattle Exposed to 42ºC in Psychrometric Chamber
Heat Stress Exposure Period DMI (Kg/100 Kg Body Weight) Water Intake (Liters/ Day ) Control 2.42b 19.50a
Day 1 2.38b 28.50b
Day 12 2.26ab 33.33bc
Day 23 2.01a 38.00c
Different small letter superscripts within column denote significantly (P<0.05) different means.
REFERENCES [1] Perez J H 2000. Parameters for the determination and evaluation of heat stress in dairy cattle in south Africa. Journal of Veterinary
Research 67(4): 263-271. [2] Wankar A K, Singh G and Yadav B 2014. Thermoregulatory And adaptive responses of adult buffaloes (Bubalus bubalis) during
hyperthermia: Physiological, behavioral and metabolic approach. Veterinary World 7(10): 825-830. [3] Yadav B, Singh G, Verma A K, Dutta N and Sejian V 2013. Impact of heat stress on rumen functions. Veterinary World 6(12): 992-996.
Training Needs of Small Holder Dairy Farmers Regarding Efficient Feeding Practices for Ecologically Sustainable Milk Yield in Muktsar
Madhu Shelly Punjab Agricultural University, Ludhiana–141004, Punjab
E-mail: [email protected]
Keywords: Small Holder Dairy, Sustainable Livelihood, Low Milk Yield, Balanced Feed Formulation
INTRODUCTION
India surpassed the United States in 1998 to become the number one milk producing country in the world and in 2005, Indian milk production represented 14.6 percent of world. Indian milk production sector is characterized by a very large number of smallholders with small herds. Feed for their dairy animals consist mainly of crop residues and byproducts with limited forage and feed grain. As a result per animal milk yield is quite low. Feeding and nutrition has repeatedly been highlighted as the major constraint in animal production systems in South Asia (Devendra et al., 2000). Inadequate land and size of operation further prove suffocating for a small holder. Hence, knowledge of the availability of the totality of feeds along with correct ecological assessmentof surpluses, deficits and then developing strategies to cope, are the prerequisites for a successful dairy operation.
It is I
LLEGAL t
o cop
y, pri
nt or
save
any c
onten
t of th
is PDF,
in pa
rt or in
full,
on an
y retr
ieval
syste
m,
withou
t the E
XPRESS WRITTEN PERMISSIO
N of th
e cop
yrigh
t-hold
er

National Conference on Climate Change and Agricultural Production: Adapting Crops to Climate Variability and Uncertainty, 6th–8th April, 2017
[661]
MATERIALS AND METHODS
In Muktsar District of Punjab, fifty six farmers with small herd size (4–8 animals) were identified from six villages (khirkianwala, doda, chatteana, bhagsar, mahanbaddar, gandhar) through field visits and front line demonstrations conducted by KrishiVigyan Kendra, Muktsar from March 2013 to March 2015. Data related with feed associated factors and practices were collected through a structured questionnaire which was standardized through inputs from animal nutrition specialists. Simple frequency analyses have been used to interpret the data.
RESULTS AND DISCUSSION
Majority of the farmers did not follow the recommended feeding practices. Limited feed resources available at the household level were fed to the animals as 73.21 percent of the farmers surveyed were unaware about the composition of balanced feed. Though the farmers knew that cereal grains and oilseed cakes were the main sources of energy, however their proper combination to ensure correct energy to protein ratio was never adhered to. Importance of using preserved fodder like silage and hay during lean period was known to many, however the required technical knowhow for preparing it was lacking with 69.64 percent farmers. Majority of farmers (60.71 percent) did not follow a judicious combination of concentrates and green fodder. These findings were similar to those of Quddus, 2012. It is observed that small holder dairy farmers in India are by and large illiterate, resource poor and low risk bearers. They often exhibit a low level of farming innovation, mostly they are either non adapters or late adopters of modern feeding technologies like use of bypass nutrients, feed additives, area specific mineral mixture.
Table 1: Awareness Level of Dairy Farmers Regarding Nutrition and Feed Management Practices for Dairy Animals
Sr. No. Feed and Nutrition Parameter Farmers Unaware No. of Farmers Percentage of Farmers
1 2 3 4 5 6 7 8 9
10
Balanced compounded feed formulation Proper proportion of fodder and concentrate Technical know how about preservation of fodder Use of mineral mixture Inclusion of bypass nutrients in feed Use of urea molasses mineral blocks Inclusion of proven feed additives Nutrient needs of animal during dry period Nutritional requirements of young calves Restricting urea in ration of calves below 6 months of age
41 34 39 35 48 31 42 34 41 45
73.21 60.71 69.64 62.50 85.71 55.36 75.00 60.71 73.21 80.36
REFERENCES [1] Devendra C 2000.Asian-Australian Journal Animal Science 13 Supplement B pp: 51-58. [2] Quddus M A 2012. Bangladesh Journal of Animal Science 41(2): 124-135.
It is I
LLEGAL t
o cop
y, pri
nt or
save
any c
onten
t of th
is PDF,
in pa
rt or in
full,
on an
y retr
ieval
syste
m,
withou
t the E
XPRESS WRITTEN PERMISSIO
N of th
e cop
yrigh
t-hold
er

National Conference on Climate Change and Agricultural Production: Adapting Crops to Climate Variability and Uncertainty, 6th–8th April, 2017
[662]
Chlorpyrifos Toxicity in Broilers under Subtropical Environmental Conditions
Henna Wani1* and Shafiqur Rahman2 1Department of Veterinary Pathology, Sher-e-Kashmir University of Agricultural Sciences and
Technology of Kashmir, Shuhama–190006, Indian 2Department of Veterinary Pathology, Sher-e-Kashmir University of Agricultural Sciences and
Technology of Jammu, Jammu–181102, India E-mail: *[email protected]
INTRODUCTION
Chlorpyrifos (Organophosphate pesticide) is pervasive in the environment. Humans and animals are widely exposed through occupational use, contact with treated surfaces, ingestion or inhalation of contaminated dust, breathing air in treated buildings or near treated fields or orchards, contact with flea collars on pets, and residues in food and drinking water. It is a widespread contaminant of fruit and vegetables, but is also found in grains, beans, dairy products, meat, fish, tea, and soft drinks. It is even found in processed products. It is a common residue in the dust of rural houses and farm worker vehicles.The present study was undertaken to investigate the general performance, clinical signs, mortality pattern, haemato-biochemical changes, role of free radicals in inducing tissue damage in the liver, kidneys and brain and patho-morphological alterations in various organs due to chlorpyrifos in broilers.
MATERIAL AND METHODS
The Seventy two broiler chilli of 3 weeks age of either sex were divided into four groups of 18 birds each receiving different levels of chlorpyrifos in corn oil via oral gavage, i.e. group I (control), II (3.2mg/kg), III (1.6mg/kg) and IV (0.64 mg/kg) for 6 weeks. The birds were humanely sacrificed at the end of experimental trail. The experiment protocol used in this study was approved by Animal Ethical Committee (IAEC-862/ac/04/CPCSEA-16-12-2004).
RESULT AND DISCUSSION
Clinical signs were observed included in appetence, weakness, depression, decrease in feed intake and body weight, change in behavior, disinclination to move, muscle contractions and staggering, the severity of which was dose and duration dependent. Significant haematobiochemical observations included anaemia, leucopenia, lymphocytopenia, hypoproteinemia, hypoalbuminemia with decrease albumin: globulin and red blood cell acetyl cholinesterase and pseudo cholinesterase concentration and increased serum alanine amino transferase and aspartate amino transferase levels. Simple changes have been reported by Alavanja et al., 2013 as well. Significant increase in lipid-peroxidase activity and decrease in levels of superoxide dismutase and catalase activity in liver, kidneys and brain indicated cell injury in chlorpyrifos toxicity due to free radical induced oxidative stress have been reported by Kavatha et al., 2013. Chlorpyrifos caused marked gross and histopathological changes in liver, kidneys, lung, heart, spleen, bursa of Fabricius, thymus and brain which were well marked at the end of experiment in dose and duration dependent manner. Lymphocytolysis in spleen, bursa of Fabricius and thymus and decrease in globulin concentration suggested immunotoxic effects of chlorpyrifos. Thet Chlorpyrifos had adverse effect on general performance, haemato-biochemical, oxidative stress and patho-morphological alteration in various visceral and immune organs of birds.
REFERENCES [1] Alavanja M C, Ross, M K and Bonner M R. 2013. Increased cancer burden among pesticide applicators and others due to pesticide
exposure. CA: Cancer Journal for Clinicians, 63(2): 120-142. [2] Kavatha K, Kala Kumar B. and Gopala Reddy, A. 2013. Alleviation of chlorpyrifos-induced delayed neurotoxicity with vitamin e and
phenytoin in hens. International Journal of Pharma and Bio Sciences, 4(1): 207-220.
It is I
LLEGAL t
o cop
y, pri
nt or
save
any c
onten
t of th
is PDF,
in pa
rt or in
full,
on an
y retr
ieval
syste
m,
withou
t the E
XPRESS WRITTEN PERMISSIO
N of th
e cop
yrigh
t-hold
er

National Conference on Climate Change and Agricultural Production: Adapting Crops to Climate Variability and Uncertainty, 6th–8th April, 2017
[1]
CIMMYT SPECIAL SESSION Sustainable Intensification and Climate Smart
Agriculture for Smallholders
It is I
LLEGAL t
o cop
y, pri
nt or
save
any c
onten
t of th
is PDF,
in pa
rt or in
full,
on an
y retr
ieval
syste
m,
withou
t the E
XPRESS WRITTEN PERMISSIO
N of th
e cop
yrigh
t-hold
er

It is I
LLEGAL t
o cop
y, pri
nt or
save
any c
onten
t of th
is PDF,
in pa
rt or in
full,
on an
y retr
ieval
syste
m,
withou
t the E
XPRESS WRITTEN PERMISSIO
N of th
e cop
yrigh
t-hold
er

National Conference on Climate Change and Agricultural Production: Adapting Crops to Climate Variability and Uncertainty, 6th–8th April, 2017
[665]
Climate Smart Agriculture in Intensive Cereal Based Systems: Scalable Evidence from Indo-Gangetic Plains of South Asia
M.L. Jat International Maize and Wheat Improvement Center (CIMMYT),
NASC Complex, New Delhi–110012, India E-mail: [email protected]; www.cimmyt.org
INTRODUCTION
South Asia, home to about 1.5 billion people, over 30 per cent of whom are still living in poverty, faces a major challenge in achieving rapid economic growth to reduce poverty and attaining other Millennium Development Goals under emerging challenges of natural resource degradation, energy crisis, volatile markets and risks associated with global climate change (Jat et al., 2016; Lal., 2016). During past half century (1965–2015); in process of achieving multi-fold increase in crop production in the region, inefficient use and inappropriate management of non-climate production resources (water, energy, agro-chemicals) have vastly impacted the quality of the natural resources and also contributed to climatic variability affecting farming adversely. The natural resources in South Asia specially in Indo-Gangetic plains (IGP) are 3-5 times more stressed due to population, economic and political pressures compared to the rest of the world and can potentially add to adversity of climatic risks, making a large number of people in the region vulnerable to climate change. Increasing climatic variability affects most of the biological, physical and chemical processes that drive productivity of agricultural systems including livestock and fisheries (Easterling et al., 2007).
With no scope left for horizontal expansion of farming; we need to produce 70% more food to feed the projected world population of 9.7 billion by 2050. Nonetheless, having high risks of climate change induced extreme weather events, the crop yields in the region are predicted to decrease from 10 to 40% by 2050 with risks of crop failure in several highly vulnerable areas. Increase in mean temperature, increased variability both in temperature and rainfall patterns, changes in water availability, shift in growing season, rising frequency of extreme events such as terminal heat, floods, storms, droughts, sea level rise, salinization and perturbations in ecosystems have already affected the livelihood of millions of people. Studies (Sivakumar and Stefanski., 2011) show that there would be at least 10% increase in irrigation water demand in arid and semi-arid region of Asia with a 1oC rise in temperature. Thus, climate change could result in the increased demand for irrigation water, further aggravating resource scarcity. Moreover, climate change on the one hand, can intensify the degradation process of natural resources which are central to meet the increased food demand, while on the other hand, changing land use pattern, natural resource degradation (especially land and water), urbanization and increasing pollution could affect the ecosystem in this region directly and also indirectly through their impacts on climatic variables (Lal., 2016). For example, about 51% of the Indo-Gangetic Plains may become unsuitable for wheat crop, a major food security crop of region, due to increased heat-stress by 2050 (Lobell et al., 2012; Ortiz et al., 2008). Therefore, adaptation to climate change is no longer an option, but a compulsion to minimize the loss due to adverse impacts of climate change and reduce vulnerability (IPCC., 2014).Moreover, while maintaining a steady pace of development, the region would also need to reduce its environmental footprint from agriculture.
Considering these multiple challenges, agricultural technologies that promote sustainable intensification and adapting to emerging climatic variability yet mitigating GHG emissions (climate smart agriculture practices; CSAPs) are scientific research and development priorities in the region. There are a wide range of agricultural practices that have the potential to increase adaptive capacity of production system, reduce emissions or
It is I
LLEGAL t
o cop
y, pri
nt or
save
any c
onten
t of th
is PDF,
in pa
rt or in
full,
on an
y retr
ieval
syste
m,
withou
t the E
XPRESS WRITTEN PERMISSIO
N of th
e cop
yrigh
t-hold
er

National Conference on Climate Change and Agricultural Production: Adapting Crops to Climate Variability and Uncertainty, 6th–8th April, 2017
[666]
enhance carbon storage yet increasing food production. In this paper, I provide scalable evidence on climate smart agriculture practices (CSAPs) in intensive cereal based systems of South Asia.
Under the aegis of CGIAR research program on Climate Change, Agriculture and Food Security (CCAFS); WHEAT; MAIZE and other related projects, CIMMYT and other organizations in collaboration with range of partnerships including ICAR, SAUs, CGIAR Institutions (IRRI, IFPRI etc), ARIs, NGOs, development departments, farmer organizations, service provider and community based organizations have been engaged in mainstreaming CSAPs through generating science backed scalable hard evidence across the range of farm typologies in the Indo-Gangetic plains (CIMMYT-CCAFS, 2014). Climate-Smart Villages (CSVs) are the sites where researchers from national and international organizations, farmers’ cooperatives, local government leaders, private sector organizations and key policy planners come together to identify which CSAPs are most appropriate to tackle the climate and agriculture challenges in the village. In CSVs, a portfolio of CSAPs adapted to local farming system is adopted by the community for multiple benefits of increased productivity, income and resilience to climatic variability. The idea is to integrate climate-smart agriculture into village development plans, using local knowledge and expertise and supported by local institutions. We piloted over 65 CSVs across Indo-Gangetic plains and the evidence from these community participatory pilots have been generated. Across various CSV sites, we evaluated and demonstrated the performance of individual CSAPs over conventional practices and generated evidence on various indicators. In various CSVs; the sites of participatory learning on CSA, we generated hard evidence on “portfolios of climate smart agriculture interventions” through participatory strategic research in intensive rice-wheat system so as to demonstrate what combination of practices (portfolio) have synergistic and multiplier effects on various indicators.
Analysis of data from large number of field trials for their response to key climate smart indicators (yield, income, water, energy, NUE, GHG emission) were performed to generate evidence across IGP. The results of a review revealed that conservation agriculture (CA) based management (zero tillage, residue retention, direct seeded rice),precision water and nutrient management and laser land leveling practices qualifies as CSAPs (Jat et al., 2015). CA based management practices reduces production cost, increase yields and economic benefits. Analysis of forty farmers’ participatory field trials conducted for three consecutive years in Haryana demonstrated that the total cost of wheat production in zero tillage using turbo happy seeder technology (Sidhu et al., 2015) was on an average, 23% less than that of conventional tillage (CT) whereas the net income was significantly higher in CA. Similarly, through long-term trial on tillage and crop establishment methods in rice-wheat system of eastern IGP, we found that the productivity of rice-wheat was higher under CA-based system (ZT rice-ZT wheat with and without residue retention) as compared to CT systems irrespective of the climate risks. The results from the another set of participatory trials in eastern IGP also showed the complementarity of various practices, for example layering of no-till maize-wheat rotation with residue recycling, inclusion of legume and site-specific nutrient management enhances yield (2.35 t ha-1 yr-1) and income (USD 941) along with resource conservation benefits. However, higher yields and income does not provide the evidence of technology to be called as climate smart. We therefore, evaluated these practices for their role in adapting to climate risks as well as their mitigation potential to identify their multiple wins and verify as climate smart practices.
We evaluated the role of CA and other sustainable intensification practices for their adaptive capacity to reduce climate risksin the intensive cereal based systems in IGP. Our studies on CA in rice-wheat system in western IGP (Sapkota et al., 2015), showed that retention of rice residue on soil surface lowered the canopy temperature in wheat by 1–2oC at grain filling period (between 138-153 days after sowing). Surface retention of crop residues (no-till systems) is strategically located at soil-atmosphere interface and offers profound water conserving effect by reducing run-off and evaporative losses which buffers the abiotic stresses. Adoption of ZT in cereal cropping system in IGP has also been reported to advance the planting time thereby increasing the thermal window for wheat and thus escaping from terminal heat effect specially in eastern IGP. We
It is I
LLEGAL t
o cop
y, pri
nt or
save
any c
onten
t of th
is PDF,
in pa
rt or in
full,
on an
y retr
ieval
syste
m,
withou
t the E
XPRESS WRITTEN PERMISSIO
N of th
e cop
yrigh
t-hold
er

National Conference on Climate Change and Agricultural Production: Adapting Crops to Climate Variability and Uncertainty, 6th–8th April, 2017
[667]
analyzed the data from 208 farmers in Haryana for the 2 contrasting wheat seasons; 2013–14 (a period with normal rainfall i.e., normal year) and 2014–15 (a period with untimely excess rainfall i.e., bad year). Our analysis shows that whilst average wheat yield was greater under CA than CT during both bad and normal years, the difference was two-fold greater during the bad year (16% vs. 8%). This provides new hard evidence that CA can cope better with the climatic extremes, in this case untimely excess rainfall, compared to CT. Absolute yield of the CA and CT was 10% and 16% lower in the bad year compared to the normal year, respectively. The Govt had to pay huge compensation to farmers for this yield loss in wheat during 2014-15. Whereas our study revealed that if, as targeted by the Haryana government in 2011, one million ha of wheat was brought under CA, the state would have produced an additional 0.66 million tonnes of wheat in 2014-15, equivalent to US$ 153 million (Aryal et al., 2016).
These practices not only help in adaptation to climate risks but also contribute to reduction in environmental foot prints. Reduced power and energy requirements in CA translates into less fuel consumption, lower working time and slower depreciation rates of equipment, all leading to mitigation from farm operations as well as from the machinery manufacturing processes. On an average, by adopting of ZT in rice-wheat system of IGP, farmers could save 36-liter diesel ha-1 equivalent to a reduction in 93 kg CO2 emission ha-1 yr-1. Through our continuous monitoring of GHGs by using static chamber method in a rice-wheat production system of western IGP, we found much higher emission of CH4 from rice production in puddled transplanted field with continuous flooding (50-250 mg CH4 m-2 day-1) compared to direct seeded rice (DSR) production system (<50 mg CH4 m-2 day-1). In this study, total cumulative GHGs emission (soil flux of CO2, N2O and CH4) in terms of CO2-equivalent was about 27% higher in the conventional tillage than in CA-based rice-wheat system. Through life-cycle analysis (using Cool Farm Tool) of wheat production in western IGP, we found that global warming potential of conventional till wheat with ad-hoc nutrient management was significantly higher than in ZT-with precision nutrient management (Sapkota et al., 2014).
Above results provides the evidence on food security (yield, income), adaptive capacity and mitigation; the 3 key components of CSA but in isolation. However, our results from synthesis of the participatory strategic research on portfolio of CSAPs in intensive rice-wheat rotation of western IGP indicates that system yield, net income, water use, energy use efficiency & GHGs mitigation varies greatly with layering (portfolio) of various CSAPs. Results revealed that improved management with low intensity practices (residue incorporation) does not lead to immediate gains (yield, income, water, energy) over business as usual (residue burning) except marginal (7%) reduction in GHGs. However, CSA practices with varying degree of intensity (layering of various practices) have led to progressive gains in yield (5-9%); income (15-25%), water savings (21-28%), energy efficiency (3.6-5.7%) with 13-28% lower environmental foot prints.
These evidence from our research have led to stakeholder buy-in for mainstreaming CSAPs and scaling through CSV approach. The CSV model demonstrates strong scalability through unique and interrelated elements of CSA-led business models, innovation platforms, knowledge networks, ICTs, gender and youth empowerment; thereby facilitates convergence of AR4D programs to fill in a bigger umbrella of National Action Plan on Climate Change (NAPCC).
REFERENCES [1] Aryal, JP., Sapkota, TB., Stirling, CM., Jat, ML., Jat, HS., Rai, M., Mittal, S., and Sutaliya, JM. 2016. Conservation agriculture-based
wheat production better copes with extreme climate events than conventional tillage-based systems: A case of untimely excess rainfall in Haryana, India. Agriculture, Ecosystems and Environment 233: 325–335.
[2] Easterling, W., Aggarwal, P., Batima, P., Brander, K., Erda, L., Howden, S., Kirilenko, A., Morton, J., Soussana JF, Schmidhuber J, T.F., 2007. Food, fibre and forest products. Climate Change 2007: impacts, adaptation and vulnerability, in: Parry, M., Canziani, O., Palutikof, J. (Eds.), Contribution of Working Group II to the Fourth Assessment Report of the Intergovernmental Panel on Climate Change. Cambridge University Press, Cambridge, pp. 273–313.
[3] IPCC. 2014. Climate change 2014, synthesis report. 151 pp. WMO, Geneva, Switzerland.
It is I
LLEGAL t
o cop
y, pri
nt or
save
any c
onten
t of th
is PDF,
in pa
rt or in
full,
on an
y retr
ieval
syste
m,
withou
t the E
XPRESS WRITTEN PERMISSIO
N of th
e cop
yrigh
t-hold
er

National Conference on Climate Change and Agricultural Production: Adapting Crops to Climate Variability and Uncertainty, 6th–8th April, 2017
[668]
[4] Jat, ML., Yadvinder-Singh., Gill, G., Sidhu, HS., Aryal, JP., Stirling, C. and Gerard, B. 2015. Laser-Assisted Precision Land Leveling Impacts in Irrigated Intensive Production Systems of South Asia. Advances in Soil Science, Soil Specific Farming: Precision Agriculture, Vol: 22, eds R Lal and BA Stewart, CRC Press. Pp 323-352. doi/pdf/10.1201/b18759-14
[5] Jat, ML; Dagar, JC; Sapkota, TB; Yadvinder-Singh, Govaerts, B; Ridaura, SL;Saharawat, YS; Sharma, RK; Tetarwal, JP; Hobbs, H and Stirling, C. 2016. Climate Change and Agriculture: Adaptation Strategies and Mitigation Opportunities for Food Security in South Asia and Latin America. Advances in Agronomy, 137: 127-236
[6] Lal, R. 2016. Feeding 11 billion on 0.5 billion hectare of area under cereal crops. Food and Energy Security, 5(4): 239–251 [7] Lobell, D.B., Sibley, A., and Ivan Ortiz-Monasterio, J., 2012. Extreme heat effects on wheat senescence in India. Nature Climate Change.
2, 186–189. doi:10.1038/nclimate1356 [8] Ortiz, R., Sayre, KD., Govaerts, B., Gupta, R., Subbarao, GV, Ban, T., Hodson, D., Dixon, JM., Iván Ortiz-Monasterio, J., and Reynolds,
M., 2008. Climate change: Can wheat beat the heat? Agriculture, Ecosystems and Environment. 126, 46–58. [9] Sapkota, TB; Jat, ML; Aryal, JP; Jat, RK and Arun, KC. 2015. Climate change adaptation, greenhouse gas mitigation and economic
profitability of conservation agriculture: Some examples from cereal systems of Indo-Gangetic Plains. Journal of Integrative Agriculture, 14 (8): 1524–1533
[10] Sapkota, TB; Majumdar, K; Jat, ML; Kumar, A; Bishnoi, DK; McDonald, AJ and Pampolino, M. 2014. Precision nutrient management in conservation agriculture based wheat production of Northwest India: Profitability, nutrient use efficiency and environmental footprint. Field Crops Research 155:233-244.
[11] Sidhu, HS; Singh, M; Yadvinder-Singh, Blackwell, J; Lohan, SK; Humphreys, E; Jat, ML; Singh, V. and Sarabjeet-Singh. 2014. Development and evaluation of Turbo Happy Seeder to enable efficient sowing of wheat into heavy crop rice residue in rice-wheat rotation in the IGP of NW India. Field Crops Research, 184: 201-212.
[12] CIMMYT-CCAFS. 2014. Climate Smart Villages in Haryana. International Maize and Wheat Improvement Center (CIMMYT), CGIAR Research Program on Climate Change, Agriculture & Food Security (CCAFS), CIMMYT India, NASC Complex, Pusa New Delhi, India, p. 12.
Sustainable and Resilient Farming Systems Intensification (SRFSI) in Eastern IGP: An Evidence from India, Nepal and Bangladesh
Akbar Hossain2, Anup Ghosh6, Apurba Chowdhury1, Arunva Ghosh1, A.S.M. Rahman Khan2, Atiquer Rahman2, Bedanad Choudhary3, Biplab Mitra1, Dinesh Thapa3, Hari Krishna Shrestha3,
Illias Hossain2, Kalyan Kanti Das1, Kaushik Pradhan1, K.K. Rao4, Mamunur Rashid6, Mazharul Anwar2, Nur-E-A Siddque2, Pawan Srivastawa5, Prakash Paneru3,
Prateek M. Bhattacharya1, Ram Datt5, Ramesh K. Saphi3, Ranvir Kumar5, Rashadul Islam6, Renuka Shrestha3, Saiful Islam7, Samim Hossain2, Sanjay Kumar5, Sarita Manandhar3,
Shakhawat Hossain2, Surya Prasad Adhikari3, Swaraj Dutta5, Tapamay Dhar1, Thakur P. Tiwari7, Ujjwal Kumar4, Umesh Archarya3 and Mahesh K. Gathala7*
1Uttar Banga Krishi Viswavidyalaya, Pundibari, Coochbehar, Bengal 2Bangladesh Agricultural Research Institute, Joydepur, Gazipur, Bangladesh
3Nepal Agricultural Research Council, Kathmandu, Nepal 4Research Complex for Eastern Region-ICAR, Patna, Bihar
5Bihar Agricultural University, Sabour, Bihar 6RDRS, Bangladesh
7International Maize and Wheat Improvement Center, Bangladesh E-mail: *[email protected]
The Eastern Gangetic Plains (EGP) of Bangladesh, India and Nepal, home to 300 million people, with the world’s highest concentration of rural poverty and a strong dependence on agriculture for food security and livelihoods. The EGP has the potential to become a major contributor to South Asian regional food security, but rice and wheat productivity remain low and diversification is limited because of poorly developed markets, sparse agricultural knowledge and service networks, and inadequate development of available water resources and sustainable production practices. Labour shortages are becoming more acute. These factors
It is I
LLEGAL t
o cop
y, pri
nt or
save
any c
onten
t of th
is PDF,
in pa
rt or in
full,
on an
y retr
ieval
syste
m,
withou
t the E
XPRESS WRITTEN PERMISSIO
N of th
e cop
yrigh
t-hold
er

National Conference on Climate Change and Agricultural Production: Adapting Crops to Climate Variability and Uncertainty, 6th–8th April, 2017
[669]
lead to smallholder vulnerability to climate and market risks that limit farmer and private sector investments in productivity-enhancing technologies. However, there is variation across the EGP: in NW Bangladesh water policy and agricultural technologies have increased crop yields, although the sustainability of present rates of groundwater use is a concern.
The SRFSI addresses two research questions: would farm management practices based on the principles of conservation agriculture (CA) and the efficient use of water resources provide a foundation for increasing smallholder crop productivity and resilience; and would institutional innovations that strengthen adaptive capacity and link farmers to markets and support services enable both women and men farmers to continue to innovate in the face of climate and economic change. The research targets rice-based systems in eight districts across the three countries of the EGP.
These efforts are supported by ACIAR-DFAT Australia with the overall aim of the project is to reduce poverty in the EGP by improving the productivity, profitability and sustainability of smallholder agriculture while safeguarding the environment and gender mainstreaming.
Over 20 partners representing research, development and educational sectors are engaged (NARES, Australian universities, CSIRO, CG Centers, NGOs and Private sectors) to answer two key questions: (i) can farm management practices based on the principles of conservation agriculture (CA) and the efficient use of water resources provide a foundation for increasing smallholder crop productivity and resilience thereby reducing poverty, and (ii) can institutional innovations that strengthen adaptive capacity and link farmers to markets and support services for both women and men farmers accelerate change processes? Considerable efforts have been made to build teams representing different institutions and disciplines thereby creating a common vision and understanding through participatory multi-stakeholder consultations.
Two districts each of the Indian state of Bihar (Purnea, Madhubani) and West Bengal (Coochbehar and Malda), Northwest Bangladesh (Rajshahi, Rangpur) and Eastern Terai Plains of Nepal (Dhanusha, Sunsari) have been selected as the project locations. In order to improve productivity, profitability, and sustainability of small and marginal farmers, which are vulnerable to food security, the SRFSI began intervention in those districts. In each selected district, there are five communities/nodes where SRFSI work with farmers, extension and local entrepreneurs to undertake the farmers’ participatory trials focusing conservation agriculture (CA) based trails in permanent plot with the commitment of 4 year time period. More than 350 farms trails were setup in 40 communities of 8 districts in rice-wheat, rice-maize and rice-lentil cropping systems to address the regional cross boundaries technology adaptation assessment. Similarly, over 600 cropping systems optimization and opportunity trials were established for exploring the efficient crop diversification options and additional income generation alternate ways to address the issues at district and community level by advancing the planting, supplementary irrigation, introduction of short cultivars and new innovative intercropping options.
A total of 40 multi-stakeholders’/innovation systems have been established across locations to enabling conducive environment for CASI technologies validation and dissemination, capacity building of farmers, LSPs, gender mainstreaming, and create micro-entrepreneurship etc.
Conservation agriculture (CA) based sustainable intensification (CASI)-particularly Zero till wheat and maize in India and Nepal, and Strip till maize and wheat in Bangladesh are consistently showing higher yield performance with reduced production costs (labour, water and energy savings), because of reduction in tillage operations and/or mechanization thereby creating a huge interest among stakeholders including participating farmers and their fellow neighbours. This has generated interest among farmers and accelerated SRFSI validated/demonstrated technologies adoption that will eventually help in changing the face of agriculture in project locations through variety change (new seeds), systems intensification and diversification,
It is I
LLEGAL t
o cop
y, pri
nt or
save
any c
onten
t of th
is PDF,
in pa
rt or in
full,
on an
y retr
ieval
syste
m,
withou
t the E
XPRESS WRITTEN PERMISSIO
N of th
e cop
yrigh
t-hold
er

National Conference on Climate Change and Agricultural Production: Adapting Crops to Climate Variability and Uncertainty, 6th–8th April, 2017
[670]
introduction of new crops like maize, wheat, mungbean, etc. in certain geographical locations and could reach to over 34000 households.
FIELD EVIDENCES ON PROFITABILITY AND LABOUR, WATER AND ENERGY SAVINGS BASED ON MULTI-CRITERIA SYSTEMS ANALYSIS
The CASI technologies particularly Zero (ZT)/Strip (ST) wheat, maize and lentil in India, Nepal and Bangladesh consistently showing higher yield performance and with reduced labour, energy and water use. Results from long-term core trials showed, system profitability using CASI technologies (UPTPR/DRS in rice, ZT/ST in wheat, maize and lentil) over the traditional Rice-Rice (puddled) system is higher with rice–lentil (155%) followed by rice–maize (122%) and rice-wheat (21%) systems
Similarly, the profitability of ZT wheat was 45% higher than that of CT wheat. Labour, energy and water savings of ZT technology on wheat were 39.3%, 16% and 16.6%, respectively. The profitability of ZT maize was 21% higher than that of CT maize. Labour, energy and water savings of ZT technology on maize were 44.4%, 9.9% and 10.6%, respectively. The profitability of ZT lentil was 21% higher than that of CT lentil. Labour, energy and water savings of ZT technology on lentil were 23.2%, 8.2% and 8.6%, respectively.
Gender mainstreaming in order to participate in decision process and reduce gender gaps to improve adoption of technologies and innovations is a key effort of SRFSI. Of the total beneficiaries (34,658) including convergence (10,447)-since the inception of the project, female farmers’ participation was 31.9%, which considering the socio-political and cultural settings of the region, this level of participation is quite encouraging. Additionally, the SRFSI is not only focusing numbers, it is rather working to offer more benefit to female farmers by enhancing their skills to participate in decision making process, which beside reducing drudgery, to some extent-will increase the productivity of their efforts thereby empowering them.
Developing Sustainable and Climate Resilient Future Cropping Systems for Eastern IGP
Raj Kumar Jat1*, Deepak Bijarnia2, Mahesh K. Gathala3 and M.L. Jat2
1Borlaug Institute of South Asia (BISA), CIMMYT, Pusa, Samastipur, Bihar-848125, India 2International Maize and Wheat Improvement Centre (CIMMYT), NASC Complex,
New Delhi–110012, India 3International Maize and Wheat Improvement Centre (CIMMYT), Bangladesh
E-mail: *[email protected]
INTRODUCTION
Water, energy and labour scarcity, increasing cost of production, diminishing farm profits and uncertain weather events are major challenges faced by the farmers under intensive tillage based conventional rice–wheat (RW) production system of eastern Indo-Gangetic Plains (IGP) in South Asia. In this rain dependent agro-ecology, the conventional system of rice wheat system is intensively dry and wet tillage on unprecise leveled land followed by transplanting of 25–40 days old seedlings and most of the time farmers are not able to transplant rice seedlings in time which leads to reduced rice yield. Moreover, the conventional rice planting system increases production costs and delays the seeding of succeeding wheat crop. Also the repeated wet tillage operations in rice are not only labour, water, time, energy and carbon inefficient but also destroy soil quality and lead to 8–9% reduction in wheat yield compared to wheat grown after dry direct seeded rice (Jat et al., 2014). To address these challenges and keeping the future threatin mind, a long-term trial was
It is I
LLEGAL t
o cop
y, pri
nt or
save
any c
onten
t of th
is PDF,
in pa
rt or in
full,
on an
y retr
ieval
syste
m,
withou
t the E
XPRESS WRITTEN PERMISSIO
N of th
e cop
yrigh
t-hold
er
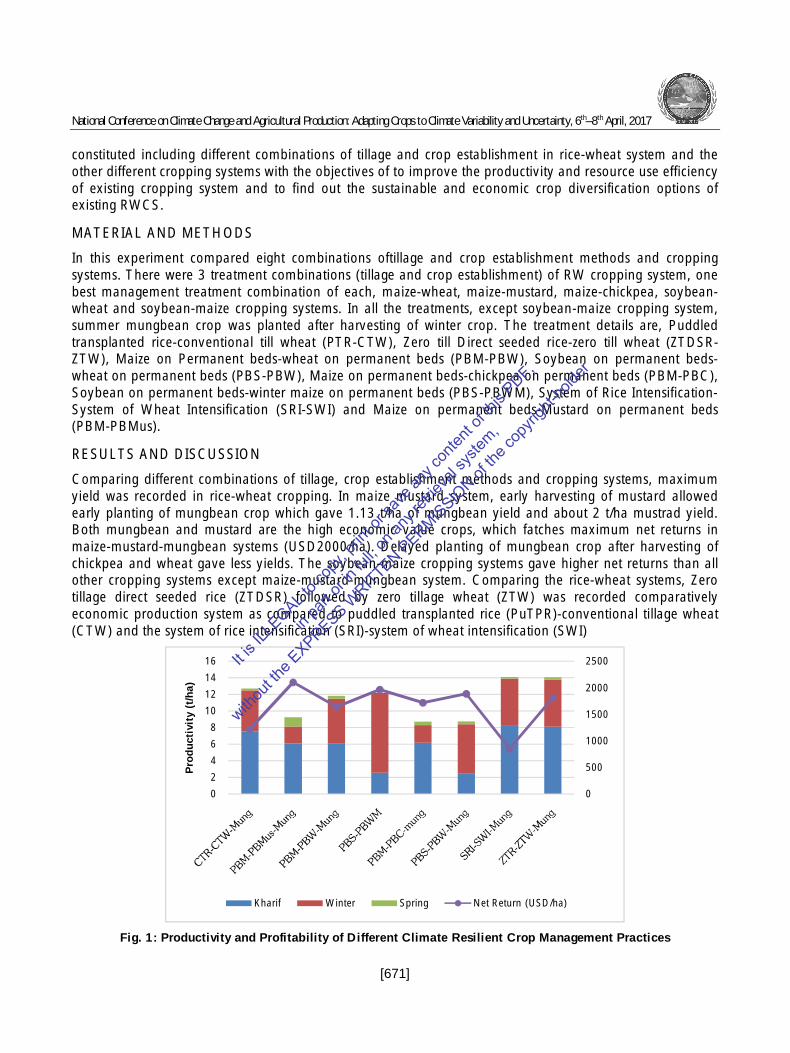
National Conference on Climate Change and Agricultural Production: Adapting Crops to Climate Variability and Uncertainty, 6th–8th April, 2017
[671]
constituted including different combinations of tillage and crop establishment in rice-wheat system and the other different cropping systems with the objectives of to improve the productivity and resource use efficiency of existing cropping system and to find out the sustainable and economic crop diversification options of existing RWCS.
MATERIAL AND METHODS
In this experiment compared eight combinations oftillage and crop establishment methods and cropping systems. There were 3 treatment combinations (tillage and crop establishment) of RW cropping system, one best management treatment combination of each, maize-wheat, maize-mustard, maize-chickpea, soybean-wheat and soybean-maize cropping systems. In all the treatments, except soybean-maize cropping system, summer mungbean crop was planted after harvesting of winter crop. The treatment details are, Puddled transplanted rice-conventional till wheat (PTR-CTW), Zero till Direct seeded rice-zero till wheat (ZTDSR-ZTW), Maize on Permanent beds-wheat on permanent beds (PBM-PBW), Soybean on permanent beds-wheat on permanent beds (PBS-PBW), Maize on permanent beds-chickpea on permanent beds (PBM-PBC), Soybean on permanent beds-winter maize on permanent beds (PBS-PBWM), System of Rice Intensification-System of Wheat Intensification (SRI-SWI) and Maize on permanent beds-Mustard on permanent beds (PBM-PBMus).
RESULTS AND DISCUSSION
Comparing different combinations of tillage, crop establishment methods and cropping systems, maximum yield was recorded in rice-wheat cropping. In maize mustard system, early harvesting of mustard allowed early planting of mungbean crop which gave 1.13 t/ha of mungbean yield and about 2 t/ha mustrad yield. Both mungbean and mustard are the high economic value crops, which fatches maximum net returns in maize-mustard-mungbean systems (USD2000/ha). Delayed planting of mungbean crop after harvesting of chickpea and wheat gave less yields. The soybean-maize cropping systems gave higher net returns than all other cropping systems except maize-mustard-mungbean system. Comparing the rice-wheat systems, Zero tillage direct seeded rice (ZTDSR) followed by zero tillage wheat (ZTW) was recorded comparatively economic production system as compared to puddled transplanted rice (PuTPR)-conventional tillage wheat (CTW) and the system of rice intensification (SRI)-system of wheat intensification (SWI)
Fig. 1: Productivity and Profitability of Different Climate Resilient Crop Management Practices
0
500
1000
1500
2000
2500
0
2
4
6
8
10
12
14
16
Pro
duct
ivit
y (t
/ha)
Kharif Winter Spring Net Return (USD/ha)
It is I
LLEGAL t
o cop
y, pri
nt or
save
any c
onten
t of th
is PDF,
in pa
rt or in
full,
on an
y retr
ieval
syste
m,
withou
t the E
XPRESS WRITTEN PERMISSIO
N of th
e cop
yrigh
t-hold
er

National Conference on Climate Change and Agricultural Production: Adapting Crops to Climate Variability and Uncertainty, 6th–8th April, 2017
[672]
REFERENCE [1] Jat R.K., Sapkota T.B., Singh R.G., Jat M.L., Kumar M. and Gupta R.K., 2014, Seven years of conservation agriculture in a rice-wheat
rotation of Eastern Gangetic Plains of South Asia: Yield trends and economic profitability, Field Crops Research, Elsevier B.V., 164 (1), 199–210.
Innovation Systems for Sustainable Intensification and Resilient Farming Systems in Eastern IGP
Ram Datt1, Ranvir Kumar1, Sanjay Kumar1, Mahesh K. Gathala2 and T.P. Tiwari2 1Bihar Agricultural University Sabour, Bhagalpur–813210, India
2CIMMYT, Bangladesh
Eastern Gangetic Plains (EGP) of South Asia is one of the densely populated and most vulnerable regions, with the highest poverty. The majority of farming communities are marginal and small-holders and are vulnerable to climate change-related issues like drought, flood, erratic rainfall, rising temperature, etc. consequently affecting their food security and livelihoods. Keeping such issues in view a project entitled ‘Sustainable and Resilient Farming System Intensification for eastern gangetic plains (SRFSI) was framed and is running in three countries-India, Nepal and Bangladesh. This SRFSI is fundamentally working with farmers and validating and scaling out Conservation Agriculture based Sustainable Intensification (CASI) technologies and practices. In the process of scaling out of CASI technologies many system bottlenecks were coming in the way. Under this project at five nodes of Purnea district of Bihar we developed local innovation platforms. Keeping in view the nature of work action research methodology was employed. After analyzing the data of Focus Group Discussions (FGDs) it was realised that marketing linkages, post-harvest processing (e.g. drying of maize grain), labour shortage and availability of quality inputs were prime bottlenecks for scaling out CASI technologies. At the same time migration rate of these areas are very high, therefore mostly women farmers are making decision and managing their farm. However, women are facing some gender specific inequalities issues like access of credit from financial institutions, access of machineries, water for irrigation purpose, etc. As an innovation platform ‘Aranyak’ agri-producer company has been formed by Zeevika with technical support of Techno-Serve, which is exclusively working for poor women. The main objective of this platform is to link farmers with market for their produce and provide them quality inputs. A total of 27 Producer Groups (PGs) have been formed so far and members in each PG vary from 40-120. After formation of Aranyak a number of social and economic transformations have been observed: The members of PG are saving about 5-6 kg per quintal charged by vendors. In addition to that they are getting additional profit of their products as bonus. They are earning additional INR 50/qt approximately. Before this company, they were not receiving their payments on time but through this arrangement they are paid within a week. This company also created competitive market. Local vendors also purchased electronic weighing machine. And some time vendors also increase the rate of loading and unloading. Another interesting change is observed that members of PG have developed “we feeling” for the company. These shows that togetherness is important to harness incentives from the government and non-government sectors in order to maximize benefit.
It is I
LLEGAL t
o cop
y, pri
nt or
save
any c
onten
t of th
is PDF,
in pa
rt or in
full,
on an
y retr
ieval
syste
m,
withou
t the E
XPRESS WRITTEN PERMISSIO
N of th
e cop
yrigh
t-hold
er

National Conference on Climate Change and Agricultural Production: Adapting Crops to Climate Variability and Uncertainty, 6th–8th April, 2017
[673]
Conservation Agriculture based Sustainable Intensification and Cereal Systems Implications on Soil Health
H.S. Jat1*, Ashim Datta2, A.K. Yadav2, Madhu Choudhary2, P.C. Sharma2, M.K. Gathala3 and M.L. Jat1
1International Maize and Wheat Improvement Centre (CIMMYT), New Delhi, India 2ICAR-Central Soil Salinity Research Institute (CSSRI), Karnal, India
3International Maize and Wheat Improvement Centre (CIMMYT), Dhaka, Bangladesh E-mail: *[email protected]
In western Indo-Gangetic plains (IGP) of India, intensive tillage coupled with crop residue burning in rice-wheat cropping system caused soil degradation, depletion of ground water and environment pollution. Conservation agriculture (CA) based sustainable intensification using varied indicators such as zero tillage, crop establishment, water, nutrient and residue management as an alternative to conventional (business as usual) practices, have shown potential for sustained and improved productivity of cereal based system while addressing the issues of energy, labour and water. Soil organic carbon (SOC) is one of the best indicators to judge the soil quality under any CA based system intensification management scenarios. SOC was increased by 82 and 67% with full CA-based rice-wheat-mungbean (RWM) and maize-wheat-mungbean (MWM) system, respectively compared to farmer’s practice (0.49%) after 6 years of continuous cultivation. Total organic carbons (TOC) was increased by 145 and 86% with full CA-based RWM and MWM system, respectively compared to farmer’s practice (13.68 Mg C ha-1) after 6 years. However, higher active and passive carbon pool was recorded with RWM and MWM system by 135 and 81%, respectively compared to farmer’s practice (7.03 Mg C ha-1 and 6.66 Mg C ha-1). CA-based MWM and RWM system recorded 116 and 84% higher POC and 10 and 229% higher silt +clay associated carbon compared to business as usual (0.47 and 0.70%), respectively. The availability of primary macro nutrients such as N, P and K varied under different CA based practices. The N, P and K content in soil was increased by 61, 41 and 37% in full CA-based RWM system and by 34, 23 and 63% in MWM system compared to farmers practice (rice-wheat system) respectively. The pH was come down to 7.55 from the initial of 8.20. Soil Quality index of 1.79 and 1.51 was reported with CA-based RWM and MWM system, respectively compared to farmer’s practice (0.30) after 6 years of cultivation. Micronutrient content (Zn, Fe, Cu, Mn) in soil was also improved with CA-based crop management practices in cereal based systems. Higher species richness fungi and lower Shannon diversity index of bacteria was found associated with CA-based cereal systems. CA based sustainable intensification approaches found effective in sequestering higher organic carbon in soil with subsequent improvement in soil quality and performing ecosystem functions in the western IGP of India.
It is I
LLEGAL t
o cop
y, pri
nt or
save
any c
onten
t of th
is PDF,
in pa
rt or in
full,
on an
y retr
ieval
syste
m,
withou
t the E
XPRESS WRITTEN PERMISSIO
N of th
e cop
yrigh
t-hold
er

National Conference on Climate Change and Agricultural Production: Adapting Crops to Climate Variability and Uncertainty, 6th–8th April, 2017
[674]
Role of Micro-entrepreneurship in Sustainable and Resilient Farming Systems Intensification for Smallholders
P.M. Bhattacharya1, K.K. Das1, A.K. Chowdhury1, T. Dhar1, A.K. Sinha1, A. Ghosh1, B. Mitra1, M. Gathala2and T.P. Tiwari2
1Uttar Banga Krishi Viswavidyalaya, Pundibari, Coochbehar, 736165 2CIMMYT, Dhaka, Bangladesh
Indian farm economy is experiencing a significant transformation in the recent past. Ever rising pressure on farm (CAGR for population 2.2% per annum) coupled with rather sluggish agricultural growth (<2% per annum) further aggravates the situation. Subsistence farm economy paved the way for tilting towards agri-business avocation. But, continual decline in average size of holding (West Bengal: 0.90 ha in 1990-91 to 0.77 ha in 2010-11) presents a resistance towards development of agro-based business units. Fragmentation leads to marginalize the investment capacity and infrastructure facility in the communities. So, attempts for formation of community based business models were felt as a necessity by the farming folk and subsequently, farmers’ association started emerging with relevant common interests. These associations act as an interface between the policy executers (Scientists and extension personnel) and the farmers. It also has potential to increase the bargaining power both in the forward and backward market linkages.
As a case study, in Coochbehar District of west Bengal a six fold increase in number of these association have been recorded, but significantly, increase in active/ functional ones recorded a jump with 16 folds (from 20 farmers clubs to 325 farmers clubs) in last five years. These small scale entrepreneurs are trying to come up with progressive and innovative business concepts for sustainable economic growth and livelihood security. Functional and social aspects of a few selected successful micro entrepreneurs were studied for last three years in different nodes under SRFSI. One of such association deals with quality seed production and other two deals with providing service in the communities with improved technologies in close cohesion with Department of Agriculture, Government of West Bengal and Univeristy. These successes have encouraged other such organizations to come out from the mere welfare mode to prospective business modes in the coming future.
It is I
LLEGAL t
o cop
y, pri
nt or
save
any c
onten
t of th
is PDF,
in pa
rt or in
full,
on an
y retr
ieval
syste
m,
withou
t the E
XPRESS WRITTEN PERMISSIO
N of th
e cop
yrigh
t-hold
er

National Conference on Climate Change and Agricultural Production: Adapting Crops to Climate Variability and Uncertainty, 6th–8th April, 2017
[1]
IRRI SPECIAL SESSION Abiotic Stress Tolerant Rice for Adaptation to a Climate Change
It is I
LLEGAL t
o cop
y, pri
nt or
save
any c
onten
t of th
is PDF,
in pa
rt or in
full,
on an
y retr
ieval
syste
m,
withou
t the E
XPRESS WRITTEN PERMISSIO
N of th
e cop
yrigh
t-hold
er

It is I
LLEGAL t
o cop
y, pri
nt or
save
any c
onten
t of th
is PDF,
in pa
rt or in
full,
on an
y retr
ieval
syste
m,
withou
t the E
XPRESS WRITTEN PERMISSIO
N of th
e cop
yrigh
t-hold
er

National Conference on Climate Change and Agricultural Production: Adapting Crops to Climate Variability and Uncertainty, 6th–8th April, 2017
[677]
Weed Management in Direct Seeded Rice under Rainfed Ecology
G.S. Panwar1*, Suborna1, Roy Choudhary1, Amarendra Kumar1, Sanjay Kumar1, Sudhanshu Singh2, Ashok Yadav3 and Virendar Kumar4
1Bihar Agricultural University, Sabour-Bhagalpur–813210, Bihar, India 2IRRI-India Office, New Delhi–110008, India
3IRRI-CSISA-Hub, Bhubaneswar, Odisha–751003, India 4IRRI-IRRAS Project, Patna, Bihar–800013, India
E-mail: *[email protected]
Keywords: Direct Seeded Rice, Rainfed Ecology
INTRODUCTION
Rainfed ecosystem with about 38% of total rice area and 21% of rice production, is crucial for ensuring global food security. In India, out of the total 20.7 million ha of rainfed rice, more than 78% is lying in eastern Indian states comprising Bihar, West Bengal, Eastern Uttar Pradesh, Odisha, Assam etc. with an average low productivity of 2.5 t ha-1 which also needs focused attention. Bihar, one of the agricultural dominant economy state in eastern India, bestowed with good alluvial soils, has a rice area of about 3.6 million ha, of which 47% area is under rainfed ecology with a low average productivity of 1.53 t ha-1. Yields are low mainly due to lack of quality seed, particularly of stress tolerant varieties, precedence of frequent spells of floods and drought (about 1/3 of the total rice area is flood prone, about 1/3 is drought prone) and wide knowledge gap with regard to recent technical knowhow. It is speculated that rice yields in the state can be doubled by adopting stress tolerant varieties coupled with best management practices in perspective of climate change. However, further research efforts are required to evaluate the performance of these stress tolerant cultivars under alternate crop establishment methods such as, direct seeding and/or mechanical transplanting under non-puddled situations, because traditional manual transplanted rice in puddled soils is being frequently questioned for decline in water table, increased energy use and pumping cost, labour availability and high cost, breakdown of soil aggregates/ macrospores with seriously deteriorated soil health, decline in the yield of succeeding crops, mainly due to soil compaction, and greenhouse gas (GHG) emission. Among different yield improving strategies, besides proper time and method of sowing/transplanting of suitable varieties, nutrient and weed management also need prompt attention and follow up action. Weed management still stands at the top, which tends to be more challenging in direct seeded rice (DSR) due to absence of seedling size advantage and stagnating water. Therefore, usually more diversified and intensive weed flora in DSR warrants developing more effective and integrated weed management strategies.
RESULTS AND DISCUSSION
Results revealed that application of pendimethalin 1.0 kg ai/ha PRE is necessary to restrict the germination of weeds with and after germination of crop. Early management of weed is the best way to reduce weed infestation and minimize crop weed completion. However, Application of post emergence herbicide is also necessary to control of remaining weeds through post emergence herbicides. Application of pendimethalin 1.0 kg ai/ha PRE fb bispyribac-sodium 25 g.ai/ha POE fb one HW proved to be the best yielder treatment among weed management practices in rainfed condition. Application of pendimethalin fb bispyribac-sodium with one hand weeding recorded lowest weed count, weed dry matter and higher weed control efficiency followed by penoxulam + cyhalofop. Application of penoxsulam + cyhalofop (RM) @ 150 g ai/ha as POE
It is I
LLEGAL t
o cop
y, pri
nt or
save
any c
onten
t of th
is PDF,
in pa
rt or in
full,
on an
y retr
ieval
syste
m,
withou
t the E
XPRESS WRITTEN PERMISSIO
N of th
e cop
yrigh
t-hold
er

National Conference on Climate Change and Agricultural Production: Adapting Crops to Climate Variability and Uncertainty, 6th–8th April, 2017
[678]
gave the highest B-C ratio. But in outreach programme and demonstration results, application of pre emergence herbicide followed by post emergence herbicide (Bispyribac with pyrazosulfuron) proved good option for control of complex weed flora in rainfed condition with need based hand weeding.
REFERENCES [1] Fuhrer J. 2003. Agroecosystem responses to combinations of elevated CO3, ozone, and global climate change. Agriculture, Ecosystems,
and Environment 97: 1–20.
Fighting a Lethal Combination of Submergence, Drought and Salinity in Rainfed Lowland through Stress-tolerant Rice Varieties and Climate
Smart Agronomy
A.K. Srivastava, Sudhanshu Singh and U.S. Singh International Rice Research Institute, India Office, New Delhi, India
Keywords: Rainfed Lowland, Stress-tolerant Rice Varieties, Submergence, Drought, Salinity
INTRODUCTION
Rice is cultivated in about 43.5 million hectares (m ha) land of India. About 16 m ha area is stress-pronerainfed lowland, inhabited by 40 million people. Rainfed lowlands are characterized by low and fragile productivity, marginal and small land holdings, poor farmers, little use of inputs, more dependence on traditional varieties, poor seed replacement, limited availability of quality inputs, weak extension network and slow adoption and diffusion of new technologies. It faces various biophysical stresses (submergence, drought, salinity/sodicity), ultimately producing an average yield of about 2 t ha-1 in comparison to 5 t ha-1 of input intensive irrigated systems. However, it offers substantial potential for increased productivity.
DEVELOPMENT OF STRESS-TOLERANT RICE VARIETIES (STRVS)
STRVs for drought, submergence, and salinity have been developed by the International Rice Research Institute through conventional and molecular breeding with the help of NARES partners, and are being disseminated in Southeast Asia through STRASA and its associated projects. CSR30, CSR36, CSR43, Usar dhan1, Usar dhan2 and Usar dhan3 for inland salinity, and CR dhan405 (Luna Sankhi), CR dhan406 (Luna Barial), DRR39 and Canning7 for coastal salinity, have been released in recent past. Shorter duration drought-resistant rice varieties such as, Sahbhagi dhan, Shusk Samrat, CR dhan40, DRR42 (IR 64-Drt1), and DRR44, that can withstand up to 2 week exposure to dry spells, are now available in India for cultivation. Swarna-Sub1 (as BRRI dhan51 in Bangladesh), Samba Mahsuri-Sub1 (as BINA dhan12), IR64-Sub1, Ciherang-Sub1 (as BINA dhan11 in India, Nepal and Bangladesh), BR11-Sub1 (as BRRI dhan52) are a few popular submergence tolerant rice varieties available in Southeast Asia for cultivation. The advantages of these varieties include 1 to 1.5 t ha-1 higher yields when grown under stress, better fertilizer responsiveness, and lower disease susceptibility.
CONFORMING MANAGEMENT PRACTICES
Blanket management recommendations cannot help explore the full productivity potential of these STRVs. Studies conducted to fine-tune management options for these varieties revealed that proper seedbed management with appropriate seed rate and the combination of different macro-and micro-nutrients and farmyard manure as a source of organic fertilizer, produced healthier and more vigorous seedlings.
It is I
LLEGAL t
o cop
y, pri
nt or
save
any c
onten
t of th
is PDF,
in pa
rt or in
full,
on an
y retr
ieval
syste
m,
withou
t the E
XPRESS WRITTEN PERMISSIO
N of th
e cop
yrigh
t-hold
er

National Conference on Climate Change and Agricultural Production: Adapting Crops to Climate Variability and Uncertainty, 6th–8th April, 2017
[679]
Transplanting of appropriately aged seedlings ensures lower mortality under stress as they have the capacity to recover faster from the transplanting shock, especially in sodic soils and drought-prone ecology, and show better survival and more rapid post-stress recovery and growth. Pre-and post-stress nutrient management in main field also help ensure good plant establishment, proper growth and higher yields for STRVs. These cost-effective management approaches in the nursery, as well as mainfield when combined with STRVs, provided a yield advantage of upto 1 t ha-1over the STRVs alone without conforming best management in stress-prone rainfed areas. Suitable rabi crop pairing with long and short duration kharif rice varieties further provides an option for better cropping intensity of underutilized rainfed lowlands.
CONCLUSION
Such cost-effective management options are very beneficial for smallholder rainfed farmers. Besides improving farmers’ livelihood, it can also contribute substantially to the rice production increment to compensate for high population growth rates, loss of farmlands and to withstand the ill-effects of climate change on rice productivity in the rainfed lowland of Southeast Asia
Raising Productivity of Rice based Cropping Systems in Drought Prone Rainfed Upland Environment
Virendar Kumar1, Sudhanshu Singh1, A.K. Srivastava1, J.S. Mishra2, G.S. Panwar3, S. Kumar2, A. Kohli3 and S.K. Dwivedi2
1International Rice Research Institute, India Office, New Delhi 2Indian Council of Agricultural Research-Research Complex for Eastern Region, Patna, Bihar
3Bihar Agriculture University, Sabour, Bhagalpur, Bihar
Keywords: Drought, Rice-based System, Upland, Rainfed Ecology
INTRODUCTION
The burgeoning world population, climate change and paucity of water for irrigation world over call for increasing grain production from rainfed arable lands. Depending on agro-ecological zones and the available crop production technologies, there is still sufficient space to increase the average yield of crops in rainfed systems. Rice is critical for food security in most of the Asian countries, but the availability of water limits the rice productivity. Therefore, to improve the productivity and the production of drought-prone systems, a blend of improved varieties and conforming crop management technologies need to be adopted.
METHODS AND MATERIALS
The results of the drought management studies presented and discussed in this paper are the outcome of different experiments conducted at Bihar Agricultural University (BAU), Sabour and Indian Council of Agricultural Research-Research Complex for Eastern Region (ICAR-RCER) Patna in drought condition under Improved Rice based Rainfed Agriculture System (IRRAS) project during 2012-2016.
RESULTS AND DISCUSSION
Drought tolerant, short duration varieties like Sahbhagi Dhan, DRR42 (IR64-Drt1), Sushk Samrat, Abhishek and CR Dhan40 are better options for rainfed areas that pave the way for the timely sowing of the subsequent winter crop making the best use of conserved moisture, thus improving the system productivity (unpublished data). Moreover, new improved varieties of dry season crops, mainly pulses, enable more
It is I
LLEGAL t
o cop
y, pri
nt or
save
any c
onten
t of th
is PDF,
in pa
rt or in
full,
on an
y retr
ieval
syste
m,
withou
t the E
XPRESS WRITTEN PERMISSIO
N of th
e cop
yrigh
t-hold
er

National Conference on Climate Change and Agricultural Production: Adapting Crops to Climate Variability and Uncertainty, 6th–8th April, 2017
[680]
options for dry season cropping. Lentil varieties ‘PusaVaibhav’ and ‘Mallika’ matched well with ‘SahbhagiDhan’ under rice-lentil system in drought-prone ecology of Bihar. Both lentil varieties are of medium duration and suitable for rice-fallow areas of eastern India.
Dry direct seeding (DSR) of rice is another technique that can substantially reduce water requirements for land preparation and crop establishment. It permits earlier establishment as compared to transplanting and enables efficient utilization of early season rains by reducing deep percolation and evaporation losses. The greater root proliferation due to better soil condition under DSR help in withstanding drought conditions. Moreover, early maturing of rice under DSR help in timely sowing of the subsequent pulse crop at better moisture regime. Besides this, non-puddled transplanting of rice results into improved soil physical condition congenial for the subsequent rainfed crops. Zero-till sowing of lentil and rice residue retention are found beneficial for lentil, lathyrus and chickpea crops sown after rice (unpublished data).
Nutrient management is an essential element of rice-based cropping system. Often lower soil fertility in rainfed environments is an important factor limiting crop yields, which is rarely considered as an option to alleviate the drought. The better root growth resulting from better nutrition will lead to a better canopy cover which in turn increases transpiration and reduces evaporation. The results of the study at ICAR-RCER, Patna have shown that application of potassium (K) as basal or 1.0% K as foliar supplementation was superior in terms of yield gain and profitability. Under drought, grain yield and benefit/cost ratio were maximum with 20 kg K2O/habasal application + 1.0% K foliar spray at panicle initiation stage (3.92 t/ha and 1.43) as compared to no K application (3.25 t/ha and 1.22). Foliar application of K significantly affected the chlorophyll content, relative water content, photosynthetic rate and total soluble sugars and significantly increased the total K concentration in straw and grain of rice (unpublished data).
CONCLUSION
The selection of short duration, drought tolerant variety in the wet season, followed by suitable pulse crops and varieties, layered with conforming best management practices can help to withstand short to medium duration drought in the rice-based system. Direct seeding of rice, potassium management in rice, residue retention, and zero tillage sowing of succeeding rabi crops have resulted in higher system productivity.
Use of Microbes for Abiotic Stress Management in Rice under Stress Prone Ecologies
Najam Waris Zaidi, Uma Shankar Singh and Sudhanshu Singh International Rice Research Institute, IRRI, India Office, CG Block, 1st Floor,
NASC Complex, DPS Marg, New Delhi–110012 E-mail: [email protected]
Keywords: Abiotic Stress, Rice, Trichoderma harzianum, Best Management Practices, Farmer’s Practice
An aggravation in prevalence, magnitude and duration of environmental stresses has posed a serious threat to global food security. Among the major food crops, rice serves as the staple food for more than half of the world’s population, and two third of Indians depend on rice for their survival (Huang et al., 2014). However, the production of this crop is increasingly limited by various environmental stresses affecting about 30% of the 700 million poor population in rainfed lowlands of Asia alone (Dar et al., 2014). Drought, submergence and the sequential events (drought followed by submergence and vice-versa) are the major constraints for rice production in such areas. Thus, the global food demand necessitates redesigning agricultural systems for
It is I
LLEGAL t
o cop
y, pri
nt or
save
any c
onten
t of th
is PDF,
in pa
rt or in
full,
on an
y retr
ieval
syste
m,
withou
t the E
XPRESS WRITTEN PERMISSIO
N of th
e cop
yrigh
t-hold
er

National Conference on Climate Change and Agricultural Production: Adapting Crops to Climate Variability and Uncertainty, 6th–8th April, 2017
[681]
major food crops, especially in the areas highly prone to various types of environmental stresses (Singh et al., 2013).
Although, stress tolerant rice varieties have the potential to increase and stabilize rice productivity in rainfed lowlands, they cannot furnish the absolute resistance. There is always the scope of improving it further by manipulating the management practices especially under multiple stress conditions. Exploitation of microbial organisms has been accounted to play an important role in extenuating stresses and thereby enhancing yields in rice.
Trichoderma is one of the most widely researched microbes and is primarily famous for its mycoparasitic activities (Mukharjee et al., 2013). Root colonization of Trichoderma helps in mitigating stresses through morphological, physiological and biochemical adaptations (Doni et al., 2014). It helps in enhancing root growth, improves seedling vigour, promotes plant development, improves yield parameters, assists in absorption of nutrients and inhibits the growth of deleterious root microflora (Pandey et al., 2016). Trichoderma aids in nutrient solubilisation and releases a variety of compounds that induce resistance responses against abiotic stresses (Mastouri et al. 2012).
The reports regarding exploitation of microbes for abiotic stress management are not scanty, but most of these studies are confined to controlled conditions. Therefore, a need was felt to evaluate microbes along with host tolerance under field conditions in stress prone ecologies.
We evaluated several microbes along with host tolerance under field conditions in stress prone ecologies of Bihar. Application of Trichoderma harzianum strain S2 along with IRRI (International Rice Research Institute) improved BMP (best management practices) was most effective for enhancing the yield and yield attributes of stress tolerant rice varieties thereby advocating for an effective use of microbes along with host tolerance and best management practices, to alleviate stresses under field conditions in stress prone rainfed ecologies of Bihar.
REFERENCES [1] Dar, M.H., de Janvry, A., Emerick, K.,Raitzer, D., Sadoulet, E., 2014. Flood-tolerant rice reduces yield variability and raises expected
yield, differentially benefitting socially disadvantaged groups. Sci. Rep. 3, 3315. [2] Doni, F., Isahak, A., Zain, C.R.C.M., Ariffin, S.M., Mohamad, W.N.W., Yusoff, W.M.W., 2014.Formulation of Trichoderma sp. SL2
inoculants using different carriers for soil treatment in rice seedling growth.Springerplus 3, 532. [3] Huang, J.Z., Guo, E.Z., Zhang, H.L., Shu, Q.Y., 2014. Workable male sterility systems for hybrid rice: genetics, biochemistry, molecular
biology and utilization. Rice 7:1–14. [4] Mastouri, F., Bjorkman, T., Harman, G.E., 2012. Trichoderma harzianum enhances antioxidant defence of tomato seedlings and
resistance to water deficit. Mol. Plant Microbe Interact. 25, 1264-1271. [5] Mukherjee, P.K., Horwitz, B.A., Herrera-Estrella, A., Schmoll, M., Kenerley, C.M., 2013.Trichoderma research in the genome era. Annu.
Rev. Phytopathol. 51, 105–129. [6] Pandey, V., Ansari, M.W., Tula, S., Yadav, S., Sahoo, R.K., Shukla, N., Bains, G., Badal, S., Chandra, S., Gaur, A.K., Kumar, A., Shukla,
A., Kumar, J., Tuteja, N., 2016.Dose-dependent response of Trichoderma harzianum in improving drought tolerance in rice genotypes. Planta 243, 1251–1264.
[7] Singh, U.S., Dar, M.H., Singh, S., Zaidi, N.W., Bari, M.A., Mackill, D.J., Collard, B.C.Y., Singh, V.N., Singh, J.P., Reddy, J.N., Singh, R.K., Ismail, A.M., 2013.Field performance, dissemination, impact and tracking of submergence tolerant (Sub1) rice varieties in South Asia. SABRAO J. Breed. Genet. 45(1), 112–131.
It is I
LLEGAL t
o cop
y, pri
nt or
save
any c
onten
t of th
is PDF,
in pa
rt or in
full,
on an
y retr
ieval
syste
m,
withou
t the E
XPRESS WRITTEN PERMISSIO
N of th
e cop
yrigh
t-hold
er

National Conference on Climate Change and Agricultural Production: Adapting Crops to Climate Variability and Uncertainty, 6th–8th April, 2017
[682]
Precision Nutrient Management for Rainfed Condition: Pivotal to Mitigate Risk of Climate Change
Amit Mishra* and Sheetal Sharma International Rice Research Institute, New Delhi, India
E-mail: *[email protected]
It is evident from most of scientific studies that there is increase in greenhouse gases (GHG) namely CO2, CFCs, CH4 and N2O. These changes in GHG concentrations are expected to lead to a general rise in global temperature and a modification in weather patterns (IPCC, 2014). Agriculture is the most sensitive to these climate changes.
The impact of climate change is more extraverted in rainfed conditions where most of the cultivation practices depend upon the monsoon. Farmers are resource poor and having small to marginal land holding. Also in rainfed ecology, suboptimal use of nutrients is observed. Further they could not afford to retain residue due to its economic value, which is adversely affecting fertility of soil. Therefore, there is need to closely watch and precisely monitor the changes in climate and its impact on crop and soil management. A review of the best available information suggests that the average recovery efficiency of nitrogen (REN) for fields managed by farmers ranged from 20 to 30% under rainfed conditions and from 30 to 40% under irrigated conditions (Bijay Singh and Yadvinder-Singh 2008). Lower nitrogen-use-efficiency is attributed to the overuse of chemical N fertilizer, ignorance of the contribution of N from the environment and the soil, poor synchrony between crop N demand and N supply, failure to bring crop yield potential into full play, and an inability to effectively inhibit N losses. This, on one hand, leads to increase in cost of cultivation and reduced efficiencies in crop production, while on the other hand leads to increased environmental issues due to nutrient losses as GHGs and leaching to water bodies and soil degradation. Moreover, the application of fertilizer at full maintenance mainly P, K and micronutrients can result in financial loss when the crop does not respond to the added nutrient. Failure to apply K or P, on the other hand, can result in nutrient depletion and eventual loss in yield, which could take a number of seasons before detection (Abdulrachman et al. 2006). Innovative approaches based on a quantitative understanding of the relationship between nutrient uptake and yield, and the correspondence between nutrient supply and crop demand, are an important step in developing precision nutrient management approaches (Buresh et al., 2010; Dobermann et al., 2003a, Witt et al., 1999).
Precision nutrient management (PNM) supported by real time weather management could be one of the option of balanced fertilizer management that have potential to mitigate climate change, improve input use efficiency, soil fertility and crop productivity. Among the components of PNM, site specific fertilizer recommendations approach manages the field to field variations in soil nutrient supply and crop responses to added nutrients (Buresh and Witt, 2007). SSNM was a general concept for optimizing the supply and demand of nutrients according to their variation in time and space. However, for scaling SSNM approach, new ways need to be identified and developed.
IRRI in partnership with CIMMYT and NARES has developed a web-and mobile phone based application/software’ Crop Manager’, which uses SSNM principles, to calculate a field specific nutrient management recommendation based on information provided through a farmer’s interview about field and crop management. The tool is being tailored to specific local conditions. The tool includes both web-based and mobile Android application with a simple, user-friendly interface providing personalized fertilizer guidance for small-scale farmers and extension workers. The farmer has to provide information about their
It is I
LLEGAL t
o cop
y, pri
nt or
save
any c
onten
t of th
is PDF,
in pa
rt or in
full,
on an
y retr
ieval
syste
m,
withou
t the E
XPRESS WRITTEN PERMISSIO
N of th
e cop
yrigh
t-hold
er

National Conference on Climate Change and Agricultural Production: Adapting Crops to Climate Variability and Uncertainty, 6th–8th April, 2017
[683]
fields by responding to a set of 12–15 brief questions about field location, planting method, seed variety, irrigation facility, typical yields, choice of fertilizer, method of harvesting and other factors. The Crop Manager was adapted, evaluated, and verified for cereal based systems in Bihar, Eastern Uttar Pradesh (EUP) and Odisha through support from the Cereal Systems Initiative for South Asia (CSISA), funded by the Bill and Melinda Gates Foundation and the U.S. Agency for International Development during 2012 to 2015. Till date a number of nutrient omission plot technique (NOPT) trials and RCM evaluation trials have been conducted in several districts of the states. The data is being used to update SSNM-based approach and algorithms to enable rapid development of field-specific nutrient (NPKZn) management recommendations (Buresh et al. 2010). Initial results have shown comparative advantage of using Rice Crop Manager as a tool for providing site-specific nutrient and crop management advisory to the farmers. Initial field trials conducted across seasons and crop in South Asia indicated that the field-and farmer-specific management recommendations generated through the developed ‘Crop Manager’ tools can increase yields about 0.4 t ha-1 for wheat and up to 1.0 t ha-1 for rice, while increasing income by US$ 97 ha-1 for wheat and by US$ 188 ha-1 for rice. In some cases where farmers already use high levels of fertilizer, cost savings and yield enhancements can be achieved while reducing overall applications rates of fertilizer and rebalancing what is applied to better match crop requirements. Based on research finding both under irrigated and rain fed and farmer’s perception Crop manager for Rice based systems Bihar and Odisha has been lunched while EUP version is still under refinement and evaluation phase.
Weather and climate related real time information plays major role in decision on crop management practices mainly in selection of cultivars, sowing timing and other nutrient, irrigation, weed and insect pest management. These information make sure the efficient use of inputs. Therefore, in current climate change situation, site specific fertilizer dose needs to be adjusted according to real time weather condition. The agro advisory services provided by the agriculture institution need to include with SSNM and other management practices and make ensure its implication by farmers. However, appropriate strategies are required for development of package of PNM and further scaling up to the farmers.
REFERENCES [1] Abdulrachman S, Witt C, Buresh RJ (2006).The need for potassium fertilization in rice and experiences from a long term experiment in
Indonesia. e-ifc no. 10, International Potash Institute. www.ipipotash.org/eifc/2006/10/6. Accessed 25 January 2010 [2] Bijay-Singh and Yadvinder-Singh (2008). Reactive nitrogen in Indian agriculture: inputs, use efficiency and leakages. Current Science 94:
1382-1393. [3] Buresh R.J. and Witt C. (2007).Site-specific nutrient management: Proceedings of the IFA international workshop on fertilizer best
management practices, 7–9 March 2007, Brussels, Belgium. International Fertilizer Industry Association, Paris, pp 47–55. [4] Buresh, R.J.; Pampolino, M. F.; Witt, C. (2010).Field-specific potassium and phosphorus balances and fertilizer requirements for irrigated
rice-based cropping systems. Plant Soil 335(1/2): 35-64. [5] Dobermann, A.; Witt, C; Abdulrachman, S.; Gines, H. C.; Nagarrajan, R.; Son, T. T.; Tan, P.S.; Wang, G. H.; Chien, N.V.; Thoa, V.T. K.;
Phung, C.V.; Stalin, P; Muthukrishnan, P.; Ravi, V.; Babu, M; Simbahan, G. C.; Adviento, M.A.A. (2003a) Soil fertility and indigenous nutrient supply in irrigated rice domains of Asia. Agronomy Journal 95(4): 913-923.
[6] IPCC-Intergovernmental Panel on Climate Change, 2014 Syenthesisreport Available at online http://www.ipcc.ch/pdf/assessment-report/ar5/syr/SYR_AR5_FINAL_full_wcover.pdf.
[7] Witt C, Dobermann A, Abdulrachman S, Gines HC, Wang G, Nagarajan R, Satawatananont S, Son TT, Tan PS, Tiem LV, Simbahan GC, Olk DC (1999) Internal nutrient efficiencies of irrigated lowland rice in tropical and subtropical Asia. Field Crops Res. 63:113–138.
It is I
LLEGAL t
o cop
y, pri
nt or
save
any c
onten
t of th
is PDF,
in pa
rt or in
full,
on an
y retr
ieval
syste
m,
withou
t the E
XPRESS WRITTEN PERMISSIO
N of th
e cop
yrigh
t-hold
er

National Conference on Climate Change and Agricultural Production: Adapting Crops to Climate Variability and Uncertainty, 6th–8th April, 2017
[684]
Zinc Fertilization for Rice-wheat Cropping System and Transformation in Soil in a Calciorthent
Ranjan Laik*, Santosh Kumar Singh, Vipin Kumar, S.P. Singh and R.C. Yadav Department of Soil Science, Dr. Rajendra Prasad Central Agricultural University,
Pusa, Samastipur–848125, Bihar, India E-mail: *[email protected]
Keywords: Zn Fertilization, Rice-wheat Rotation, Zn Concentration, Zn Fraction, DTPA-Zn
INTRODUCTION
Zinc is one of the most important micronutrient essential for plant growth especially for rice grown under submerged condition. Zinc deficiency is prevalent worldwide in temperate and tropical climates. Zn deficiency is the most widespread micronutrient disorder in rice. Its occurrence has increased with the introduction of modern varieties, crop intensification, and increased Zn removal. Rice is the stable food for more than half of the world population and it provides 21% and 15% per capita of dietary energy and protein. Zinc (Zn) fertilization is important for Zn bio-fortification of crops as well as improving grain and straw yields, and thus proper Zn recommendation of soil application is needed for Zn deficient soils.
METHODS AND MATERIALS
The effectiveness of Zn applications in different rates (2.5, 5.0, 7.5 and 10.0 kg ha-1 per year) and in different frequencies (initial, alternate and every year) applied to rice in rice (Orizasativa L.)–wheat (Triticumaestivum L.) cropping system in a Zn-deficient calcareous soil were studied in the fourth year to find out the suitable Zn recommendation. Sequential extraction was done to estimate exchangeable-Zn (Ex-Zn), weakly bound to organic matter (Wbo-Zn), carbonate bound Zn (Carb-Zn), manganese oxide bound Zn (MnO-Zn) and strongly bound to organic matter (Sbo-Zn) in soil after wheat harvest.
RESULTS AND DISCUSSION
In rice, Zn applications at 7.5 and 10 kg ha-1 in the initial year, 5.0 to 10 kg ha-1 in the alternate year and all the rates of every year had highest yields, significantly higher than the Zn-control. In wheat, 7.5 and 10 kg Zn ha-1 in alternate year and 5.0 to 10 kg Zn ha-1 of every year applications out-yielded the Zn-control. Most of the Zn treatments had significant enrichment of grains except the initial rate of 2.5 kg Zn ha-1 in rice and 2.5 to 5.0 kg Znha-1 in wheat. Alternate and every year Zn applications had significant improvement in total Zn uptake in most of the treatments. The percent range of different fractions to total sequentially extractable Zn were: Wbo-Zn (41.1%–56.7%), Carb-Zn (23.7%–32.50%), MnO-Zn (5.0%–9.8%), Sbo-Zn (6.6%–10.0%) and Ex-Zn (4.8%–9.6%).The DTPA-Zn concentrations at which highest grain yields of rice and wheat were obtained were 1.26 and 1.31 mg kg-1 respectively whereas for Zn uptake were 1.38 and 1.44 mg kg-1 respectively. Zn fertilization at suitable rate and frequency can increase rice and wheat yield and achieve Zn biofortification of both the crops.
It is I
LLEGAL t
o cop
y, pri
nt or
save
any c
onten
t of th
is PDF,
in pa
rt or in
full,
on an
y retr
ieval
syste
m,
withou
t the E
XPRESS WRITTEN PERMISSIO
N of th
e cop
yrigh
t-hold
er

National Conference on Climate Change, Agricultural Production: Adapting Crops to Climate Variability, Uncertainty, 6th–8th April, 2017
[685]
Author Index
Aakanksha, 490 Abhijatha, A., 570 Abhilash, 48, 149, 157 Acharya, S.K., 162 Acharya, S.S., 76, 78 Acharya, Shivasankar, 72 Adaangadi, Kotramma C., 587 Adamala, Sirisha, 159 Adarsh, Anupam, 336, 538, 541 Adhikari, Surya Prasad, 668 Adhikary, Samrat, 194
Afroza, B., 626 Aftab, M.A., 439 Agrawal, Tejashwini, 69
Ahanger, Rayees A., 26, 636 Ahmad, Feza, 113, 384, 400, 414 Ahmad, Fiza, 402 Ahmad, Hilal, 520
Ahmad, Khurshid, 514 Ahmad, Latief, 46, 154, 165, 168, 169, 172, 456 Ahmad, M. Feza, 307, 314, 325, 415 Ahmad, Md. Feza, 294 Ahmad, Md. Shamsher, 439 Ahmad, Mir Ikhlaq, 172 Ahmad, Mushtaq, 230 Ahmed, Asif, 529 Ahmed, F., 141 Ahmed, Nazeer, 6 Ahsan, MD Jafri, 126 Ainch, A. Roy, 583 Akhtar, Shirin, 65, 67, 490, 538 Akhter, Javed, 41 Akhter, S., 141 Alam, Md. Sarware, 52, 321, 413 Ali, Md. Naiyar, 51, 191 Amardeep, 62 Ambardar, V.K., 488, 525 Amin, Md. Ruhul, 627 Anand, R.C., 206 Anandhi, A., 31 Anitha, M., 59
Ansar, Mohammad, 554, 575, 577 Ansari, Mohammad Aslam, 62 Anuradha, 308
Anwar, Ali, 488, 525 Anwar, Mazharul, 668 Anwer, M.A., 524 Apturkar, A.M., 501 Aravinda, M., 410 Archarya, Umesh, 668 Arora, Ajay, 36 Arthi, T., 133 Arya, K., 570
Ashok, 367
Avinash, S., 545 Avtar, Ram, 559 Azad, C., 403, 602 Azad, C.S., 406 Azam, Khushboo, 390 Aziz, M.A., 185, 484 Azmi, N.Y., 124, 436
Babli, 179 Babu, Ajay, 447 Babu, C., 518 Babu, Harish B.N., 618 Badshah, Jahangir, 656 Bahadur, Indra, 300 Bahadur, Raj, 254 Bahadur, Shiv, 244, 284 Bahadur, Vijay, 466 Bairwa, S.L., 50 Bal, S.K., 8, 25, 98 Bama, K. Sathiya, 91 Bangarwa, K.S., 52, 182, 183, 210, 224, 245, 252 Bangroo, S.A., 259 Banik, Mahamaya, 103 Banik, S., 641 Banjara, Tej Ram, 269, 376 Banjare, Umakant, 495 Baqual, M.F., 449 Bardhan, Kirti, 333 Barman, Kalyan, 325 Bashir, Imran, 514 Batra, V.K., 274 Baxla, A.K., 9 Behera, S.K., 151 Behera, Subrat Keshori, 45
It is I
LLEGAL t
o cop
y, pri
nt or
save
any c
onten
t of th
is PDF,
in pa
rt or in
full,
on an
y retr
ieval
syste
m,
withou
t the E
XPRESS WRITTEN PERMISSIO
N of th
e cop
yrigh
t-hold
er

National Conference on Climate Change, Agricultural Production: Adapting Crops to Climate Variability, Uncertainty, 6th–8th April, 2017
[686]
Bende, M.J., 223 Beniwal, Vivek, 370 Beura, K., 297 Bhadana, V.P., 641
Bhagat, A.P., 531
Bhagat, Arun P., 552 Bhagyawathi, 412 Bhamare, V.K., 555
Bhamini, Kanchan, 113 Bhandarkar, A.P., 623 Bhandarkar, S., 610 Bhanu, Akhouri Nishant, 535, 540 Bharati, D.K., 306, 307 Bharati, Divakar Kumar, 415 Bhardwaj, Ajay, 110 Bhardwaj, K.K., 180, 224, 246 Bharti, Alok, 311, 652 Bharti, Jyoti, 50 Bharti, Varsha, 313, 324, 558 Bhat, Aarif H., 26, 636 Bhat, Amir Farooq, 139 Bhat, Arif Hussain, 520 Bhat, G.M., 137 Bhat, Hilal A., 26, 636 Bhat, M.A., 526 Bhat, M.I., 259 Bhat, Mohammad Amin, 321, 413 Bhat, Mudasir Ahmad, 68 Bhat, Mudasir, 488, 514, 520, 525, 533
Bhat, S.J.A., 137 Bhat, Z.A., 526 Bhatia, A.K., 274 Bhatia, Jitender Kumar, 219 Bhatt, B.K., 446 Bhatt, B.P., 407, 620 Bhattacharya, Chandan, 503, 583 Bhattacharya, Prateek M., 668, 674 Bhowmik, Sagarika, 565, 567 Bhusara, J.B., 333, 446 Bihari, Bipin, 194 Bijarnia, Deepak, 670 Bilal, Sheikh, 484, 533 Bisen, Prashant, 216, 521 Bishnoi, Dalip, 219 Bisht, Kalpana, 499 Bisht, Vinita, 180, 183, 246, 252, 52 Biswas, J.C., 141
Biswas, Papia, 617
Biswasi, S., 55 Bodkhe, N.K., 211 Boken, Geeta D., 559 Borkar, S.L., 477 Brajendra, 208 Brar, Archana, 485
Chakrabarti, Asit, 647, 653 Chand, Gireesh, 250, 406, 602 Chand, H., 621
Chander, Subhash, 19 Chandra, Kailash, 618
Chandrakar, P.K., 119 Chandrasekaran, M., 634 Chatterjee, Nitin, 329 Chattopadhayay, N., 150 Chattopadhyay, Arup, 582 Chaudhary, Anand, 303 Chaudhary, O.P., 318 Chaudhary, Pratima, 299 Chaudhary, S.K., 117, 255, 336 Chaudhary, Udai Singh, 478 Chaudhary, V.K., 380 Chaudhury, S.R., 356 Chauhan, R.S., 381 Chauhan, S.K., 25 Chaurasiya, Asheesh, 231 Chavan, S.B., 180, 224
Chavan, S.D., 642 Chavhan, K.R., 211 Chhavi, 516, 517 Chikkeri, Sachin S., 571 Chinnusamy, Viswanathan, 240 Chishti, Anaum, 168, 172, 456 Chitralekha, 576 Chongtham, S.K., 431, 433, 435 Choudhary, Bedanad, 668 Choudhary, C.D., 150, 158 Choudhary, C.N., 289 Choudhary, G.L., 92 Choudhary, Madhu, 673 Choudhary, R.R., 101 Choudhary, Roy, 353, 677 Choudhary, S.K., 248, 301, 309, 433, 435, 78 Choudhary, Saurabh Kumar, 80, 190 Choudhury, A.K., 141
It is I
LLEGAL t
o cop
y, pri
nt or
save
any c
onten
t of th
is PDF,
in pa
rt or in
full,
on an
y retr
ieval
syste
m,
withou
t the E
XPRESS WRITTEN PERMISSIO
N of th
e cop
yrigh
t-hold
er

National Conference on Climate Change, Agricultural Production: Adapting Crops to Climate Variability, Uncertainty, 6th–8th April, 2017
[687]
Choudhury, Suborna Roy, 95, 156
Chowdhury, A. Roy, 78 Chowdhury, A.K., 674 Chowdhury, Apurba, 668 Chowdhury, Arnab Roy, 72, 76, 282
Chowdhury, Md Riton, 228 Churasiya, Asheesh, 72 Chutia, T., 641
Dagar, Chander Shekhar, 48 Dahiya, Anjali, 263, 326, 366 Dahiya, D.S., 308, 370, 594 Dahiya, Seema, 337 Dahiya, Sucheta, 265 Dalal, V., 224 Dalpat, L., 545 Dar, M.R., 449 Dar, M.S., 230 Dar, S.R., 363
Dar, Showket Ahmad, 499, 630, 631 Das, Anupam, 95 Das, B.K., 19 Das, B.S., 130
Das, Kalyan Kanti, 668, 674 Das, Lalu, 12, 41
Das, Ranjit Kumar, 536 Das, Shivnath, 220, 438, 509 Das, U.K., 579 Datt, Ram, 668, 672 Datta, Ashim, 673 Datta, Samar Chandra, 28 David, Arun A., 321
De, Nirmal, 472
Dehinwal, A.K., 492 Deokaran, 407, 620 Deol, J.S., 76
Deshmane, A.D., 211 Deswal, Sumit, 104 Devi, L. Laishana, 567 Devi, Meenakshi, 47 Dhakar, Tulsi Ram, 216 Dhankhar, S.K., 485 Dhanpal, Chavan, 144 Dhanya, M.K., 31 Dhar, Tapamay, 668, 674 Dharamsheela, 596
Dharminder, 238
Dhawan, A.K., 16, 25 Dhawan, Vikrant, 16, 258, 334, 422 Dheebakaran, Ga., 103 Dhekale, B.S., 174 Dhillon, Ashok, 219 Dhillon, R.S., 180, 182, 210, 224, 246, 252 Dikshit, S.N., 605 Dixit, S.P., 643
Dixit, Sreenath, 59 Dubey, Akhila Nand, 447 Dubey, S.K., 301, 322, 336 Dubey, Vikas, 516, 517 Dutta, Debasmita, 128 Dutta, S.K., 72, 88, 297 Dutta, Swaraj Kumar, 156, 286, 668 Dwivedi, D.H., 572 Dwivedi, D.K., 516, 517 Dwivedi, Neeta, 473 Dwivedi, S.K., 633, 679
Faisal, Shahzad, 168 Fazil, Syed Midhat, 168, 456 Fazil, Syed Nuzhat, 456
Gangwar, Anshu, 241 Gangwar, O.P., 122
Ganie, Mumtaz A., 26, 461, 636 Garg, Himanshu Shekhar, 299, 503, 583, 617 Gathala, M., 674 Gathala, Mahesh K., 668, 670, 672, 673 Gaur, Arpit, 478 Gaur, V.K., 613 Gautam, Ambuj, 288 Gayatonde, Varsha, 547 Gehlot, Virendra Singh, 372 Gemeray, Hemant, 571
George, P.J., 231 Gera, Rajesh, 58 Ghanbahadur, M.R., 211 Ghanshyam, 201 Ghatak, Abhijeet, 552, 589, 602 Ghawade, S.M., 510 Ghiyal, Vikram, 274 Ghosh, A., 674 Ghosh, Anup, 668 Ghosh, Arunva, 668 Ghosh, D.K., 397
It is I
LLEGAL t
o cop
y, pri
nt or
save
any c
onten
t of th
is PDF,
in pa
rt or in
full,
on an
y retr
ieval
syste
m,
withou
t the E
XPRESS WRITTEN PERMISSIO
N of th
e cop
yrigh
t-hold
er

National Conference on Climate Change, Agricultural Production: Adapting Crops to Climate Variability, Uncertainty, 6th–8th April, 2017
[688]
Ghosh, Goutam Kumar, 329 Ghosh, Mainak, 76, 78, 88, 194, 202, 282, 286,
316, 340, 409, 655 Gill, Jagjot Singh, 467 Gite, R.V., 225, 227 Gobu, R., 618 Godara, R.K., 267 Goel, S.R., 512 Gokhale, D.N., 225, 227 Gokidi, Yugandhar, 535, 540 Gond, Manoj Kumar, 117 Gontia, A.S., 403 Gosal, S.K., 459 Goswami, Gargi, 296, 303 Goswami, J., 641 Goswami, Suneha, 240 Govindaraj, M., 464 Gowda, Manjunath, 59 Gowda, S.J.A., 31 Grewal, Raj Bala, 486 Gudge, A., 8 Gunaga, R.P., 332, 344 Gupta, Anil Kumar, 424 Gupta, Ankita, 20 Gupta, Anshul, 404 Gupta, R.K., 251 Gupta, R.N., 262, 406, 573, 602 Gupta, S.K., 78, 80, 156, 262, 444, 480, 602 Gupta, S.M., 94 Gupta, Sandeep, 326 Gupta, Sanjeev Kumar, 282, 340, 409, 655 Gupta, Sarita Devi, 64, 214, 516 Gupta, T., 222 Gurjar, D.S., 473 Gurung, Deepsil, 453 Gyanendra, Kunvar, 516
Hadimani, Basamma R., 587
Haque, M., 205, 376 Haque, M.M., 141 Haque, Mizanul, 156, 202, 286 Harlapur, S.I., 587 Hassan, Mir G., 488 Hassan, Mudasir, 514 Hegde, H.T., 381 Hemanta, 206 Hemantranjan, A., 606
Hoda, M.Z., 645 Hossain, Akbar, 668 Hossain, B., 141 Hossain, Illias, 668 Hossain, Md. Farid, 18 Hossain, Samim, 668 Hossain, Shakhawat, 668 Hussain, K., 6, 626 Ibrahim, Shahida, 313, 412 Imtiyaz, Mohd, 126
Islam, Rashadul, 668 Islam, Saiful, 668 Islam, Syed Razaul, 314 Islam, Tajamul, 185
Itoo, H., 363 Izhar, Tajwar, 191
Jaglan, R.S., 497 Jain, Anand Kumar, 340 Jain, P.K., 598 Jain, Sunita, 326, 366
Jain, Vikas Kumar, 521, 563
Jaiswal, Deepak Kumar, 266, 622 Jaiswal, U.S., 294 Jalali, S.K., 20 Jangi, Chetan Kumar, 285 Jangra, Sumit, 559 Jat, A.L., 433, 435 Jat, H.S., 673 Jat, M.L., 665, 670, 673
Jat, Raj Kumar, 670 Jatav, Pradeep Kumar, 347, 571 Jaya, 659 Jeganathan, C., 15 Jha, A.K., 74, 656
Jha, Arun Kumar, 32 Jha, C.K., 272, 273 Jha, S., 579 Jha, S.K., 381
Jha, Shantanu, 22 Jha, Sudeepa Kumari, 566 Jilariya, D.J., 344 Johar, Vishal, 180, 245, 246, 252 Joshi, U.N., 263
Kabir, Jahangir, 419 Kadam, D.M., 623
It is I
LLEGAL t
o cop
y, pri
nt or
save
any c
onten
t of th
is PDF,
in pa
rt or in
full,
on an
y retr
ieval
syste
m,
withou
t the E
XPRESS WRITTEN PERMISSIO
N of th
e cop
yrigh
t-hold
er

National Conference on Climate Change, Agricultural Production: Adapting Crops to Climate Variability, Uncertainty, 6th–8th April, 2017
[689]
Kahate, P.A., 642 Kajla, Subhash, 391 Kakraliya, S.K., 209, 265 Kala, Shashi, 391, 594
Kalita, Prasanta, 388 Kalra, Naveen, 8, 141 Kamboj, Disha, 559 Kang, S.S., 529
Kant, Kamal, 291 Kanth, R.H., 46, 154, 165, 169
Kapoor, K.S., 455 Karabhantanal, S.S., 410 Karle, A.S., 225, 227, 428 Karmakar, Krishna, 565 Karn, Monika, 575 Karthick, J., 498 Kasar, N., 579 Kashyap, O.P., 605 Kaur, Harshpreet, 58 Kaur, Ravinder, 473 Kausar, Shaheen, 313 Kaushik, H.D., 199, 318
Kaushik, Isha, 486 Kavita, 452 Khan, A.H., 254
Khan, A.S.M. Rahman, 668 Khan, J.N., 165, 169, 172 Khan, N.A., 514, 526 Khan, Nisar Ahmad, 520 Khan, S.H., 626 Khan, Shahroon, 267 Khandare, R.N., 223 Khazi, G.S., 223, 225, 227 Khedwal, Rajbir Singh, 337 Khichar, M.L., 149, 157, 217 Khobragade, C.N., 144
Kishore, Chandan, 541 Kohli, A., 679 Kohli, Anshuman, 150, 194, 340, 409 Kotikal, Y.K., 608 Kour, Satvinder, 151 Krishna, P.R. Anjitha, 167 Kritika, 75 Kuduka, M., 570 Kujur, A.B., 191
Kuma, Virendar R., 353
Kumar, A., 128, 155, 406, 492
Kumar, Abhay, 57, 310 Kumar, Abhinav, 192 Kumar, Ajay, 100, 311, 617, 652 Kumar, Ajeet, 277 Kumar, Akhilesh, 271
Kumar, Alok, 338 Kumar, Amarendra, 353, 677 Kumar, Amarjeet, 51, 194, 208
Kumar, Amit, 356, 542, 645, 655 Kumar, Amrendra, 293 Kumar, Anand, 44, 69, 71, 109, 120, 443, 504, 546,
548, 595, 637 Kumar, Anil, 69, 71, 109, 127, 152, 364, 494, 506,
512, 513 Kumar, Anjani, 130 Kumar, Arun, 103
Kumar, Ashok, 131, 262, 330, 375, 388 Kumar, Ashutosh, 233, 536 Kumar, Avinash, 106 Kumar, B., 297 Kumar, Bharath M.V., 347, 571 Kumar, Birendra, 112, 202, 205, 551 Kumar, Brajendu, 658 Kumar, Chandan, 531 Kumar, Deo, 262 Kumar, Dhananjay, 201 Kumar, Dharmendra, 647, 653
Kumar, Dinesh, 271, 332 Kumar, G. Srasvan, 537 Kumar, Gaurav, 516, 517 Kumar, Gopal, 23 Kumar, Harini, 412 Kumar, Harish, 510 Kumar, Harsh, 320 Kumar, Jeetendra, 394, 396 Kumar, Jitendra, 375 Kumar, Kranti, 271 Kumar, M. Udaya, 506 Kumar, M. Vignesh, 441 Kumar, M., 98, 124, 436 Kumar, Manish, 34, 621 Kumar, Mankesh, 120, 546, 548, 595, 637 Kumar, Manoj, 45, 566 Kumar, Mukesh, 131, 333, 393, 617, 648 Kumar, Mukul, 188 Kumar, N.S. Praveen, 61 Kumar, Naveen, 206, 209
It is I
LLEGAL t
o cop
y, pri
nt or
save
any c
onten
t of th
is PDF,
in pa
rt or in
full,
on an
y retr
ieval
syste
m,
withou
t the E
XPRESS WRITTEN PERMISSIO
N of th
e cop
yrigh
t-hold
er

National Conference on Climate Change, Agricultural Production: Adapting Crops to Climate Variability, Uncertainty, 6th–8th April, 2017
[690]
Kumar, Neeraj, 376, 418 Kumar, Nikhil, 376 Kumar, Nitesh, 617 Kumar, P. Arun, 82
Kumar, P. Suresh, 98 Kumar, P., 547 Kumar, Pankaj, 39, 186, 320, 541, 562, 589, 593 Kumar, Paritosh, 613 Kumar, Parveen, 364 Kumar, Pawan, 179, 255
Kumar, Prabhat, 220, 509 Kumar, Pradeep, 428 Kumar, Pranay, 397 Kumar, Prasann, 188, 189, 190
Kumar, Prashant, 286, 297, 301 Kumar, Praveen, 15 Kumar, Pravendra, 161 Kumar, Pravesh, 80, 117 Kumar, Prince, 286 Kumar, Puneet, 659 Kumar, R., 492 Kumar, R.R., 240 Kumar, Rajender, 473 Kumar, Rajesh, 106, 250, 503, 506, 549, 573, 645,
655 Kumar, Rajkishore, 150, 158, 278, 383 Kumar, Rakesh, 80, 150, 278, 289, 297, 644, 656 Kumar, Randhir, 65, 67, 110, 118, 490, 538, 541,
542, 557
Kumar, Ranjeet, 268, 275, 286, 469 Kumar, Ranvir, 668, 672 Kumar, Ratan, 289 Kumar, Ravi Ranjan, 44, 69, 71, 109, 120, 596 Kumar, Ravi, 113, 118, 307, 384, 542, 557
Kumar, Ravindra, 314, 390 Kumar, Ritesh, 552 Kumar, Rohitashw, 456 Kumar, S. Naresh, 171 Kumar, S., 403, 679 Kumar, Sagar, 48, 149, 152, 157 Kumar, Sandeep, 351 Kumar, Sanjay, 54, 69, 71, 80, 88, 109, 205, 286,
297, 316, 353, 356, 668, 672, 677 Kumar, Sanjiv, 647 Kumar, Sanoj, 330, 375, 388 Kumar, Santosh, 106, 296, 303, 376, 379, 383, 518,
563, 620, 637
Kumar, Satendra, 658 Kumar, Satish, 330, 338, 375, 388 Kumar, Shailesh, 36 Kumar, Shambhu, 443
Kumar, Shrvan, 528 Kumar, Sonu, 450 Kumar, Sourabh, 602 Kumar, Sumant, 321 Kumar, Sunil, 54, 76, 78, 80, 88, 113, 117, 150,
156, 201, 277, 278, 297, 297, 340, 485, 655
Kumar, Surendra, 187 Kumar, Suresh, 209 Kumar, Tarun, 180, 245, 246 Kumar, Uday, 340 Kumar, Ujjwal, 668 Kumar, Vimal, 233, 82 Kumar, Vinay, 150, 399, 549
Kumar, Vinod, 112, 131, 286, 301, 315, 316, 596, 598
Kumar, Vipin, 272, 273, 304, 452, 684 Kumar, Virendar, 677, 679 Kumar, Yogesh, 152, 157, 481 Kumari, Abha, 400, 568, 572 Kumari, Amrita, 380, 402 Kumari, Anita, 315 Kumari, Anjali, 71, 109 Kumari, Bibha, 644 Kumari, Bimlendra, 245 Kumari, Ekta, 430 Kumari, Hemlata, 376 Kumari, Jyoti, 314, 415 Kumari, Meenakshi, 67 Kumari, Meenu, 187 Kumari, Meera, 50 Kumari, Minakshi, 466 Kumari, Neha, 593 Kumari, Niru, 373 Kumari, Nishi, 590, 592 Kumari, Nitu, 546 Kumari, Pooja, 237 Kumari, Preeti, 557 Kumari, Pushpa, 325 Kumari, R., 124, 436 Kumari, Ragni, 150 Kumari, Ranju, 116 Kumari, Rashmi, 65, 102, 490
It is I
LLEGAL t
o cop
y, pri
nt or
save
any c
onten
t of th
is PDF,
in pa
rt or in
full,
on an
y retr
ieval
syste
m,
withou
t the E
XPRESS WRITTEN PERMISSIO
N of th
e cop
yrigh
t-hold
er

National Conference on Climate Change, Agricultural Production: Adapting Crops to Climate Variability, Uncertainty, 6th–8th April, 2017
[691]
Kumari, Rima, 320 Kumari, Sangeeta, 438, 490
Kumari, Shalini, 292, 383, 409 Kumari, Shweta, 102 Kumari, Shyama, 187 Kumari, Smita, 273 Kumari, Sonam, 589, 593 Kumari, Sujata, 577 Kumari, Sushil, 224 Kumari, Sweta, 504 Kumari, Varsha, 215, 489 Kundu, K.K., 260 Kureel, R.S., 322 Kushwah, Sunita, 83 Kushwaha, M.L., 369, 563 Kwadzo, Keteku Agbesi, 428
Laichattiwar, M.A., 616 Laik, Ranjan, 304, 684 Lakshman, Koneru, 92, 340 Lakshmanan, A., 82 Lal, G.M., 578
Lal, Manohar, 72 Lal, Raj Kishori, 424 Lal, Rattan, 3 Lal, Roshan, 576 Lalita, 481 Lalita, K.M., 568572 Lalitha, R., 167
Lateef, Azra, 507 Latha, K.R., 91 Lhungdim, J., 435 Lingwal, Shrishti, 528 Loganandhan, N., 59 Lone, Aabid H., 461 Lone, F.A., 6 Lone, Javeed A., 480
Madhumita, 87 Mahadi, S.S., 202 Mahajan, Seethiya, 313, 324, 558 Mahato, A., 547 Mahdi, S. Sheraz, 3, 46, 80, 88, 95, 123, 154, 156, 174, 205, 461, 655 Mahdi, S.S., 78, 165, 185, 259
Mainak, Ghosh, 72 Maity, Labani, 581, 582 Maity, Swapan Kumar, 282
Maji, Sutanu, 372 Majumder, Debjyoti, 41 Makhdoomi, Mohammad Iqbal, 507 Mal, Todar, 458, 459 Malik, Arvind, 370 Malik, Kamla, 206 Malik, Karmal, 107 Malik, M.A., 449, 461 Malik, M.S., 57 Malik, Priti, 107 Malik, R.S., 267
Malik, Sunil, 469 Mallikarjuna, B.O., 59 Mallikarjunarao, K., 536 Manandhar, Sarita, 668 Manchegowda, Kodihally, 412 Mandal, Ajit Kumar, 103 Mandal, Devendra, 311 Mandal, Jajati, 150 Mandal, Joydip, 421 Mandal, Nintu, 28 Mandal, Sanjay Kumar, 97 Mandi, V., 583 Maniram, 254 Maniruzzaman, M, 141 Manjri, 214, 516 Manjri, Pratibha Singh, 64 Manjunatha, M., 611
Mankar, Abhay, 568 Marak, J.C., 579 Marsonia, P.J., 383 Masood, T.H., 462 Masoodi, Lubna, 488 Masoodi, T.H., 137 Mauriya, S.K., 572 Mauriya, Sandeep Kumar, 372 Maurya, Ashish Kumar, 369, 376, 563 Maurya, Avinash Chandra, 296 Maurya, Bihari Ram, 300 Maurya, R.N., 284 Maurya, Rajesh, 517 Maurya, S.K., 369, 563 Meena, Anand Kumar, 613 Meena, Ashok Kumar, 554 Meena, B.S., 648 Meena, Balram, 234, 242, 281
Meena, Bharat, 203
It is I
LLEGAL t
o cop
y, pri
nt or
save
any c
onten
t of th
is PDF,
in pa
rt or in
full,
on an
y retr
ieval
syste
m,
withou
t the E
XPRESS WRITTEN PERMISSIO
N of th
e cop
yrigh
t-hold
er

National Conference on Climate Change, Agricultural Production: Adapting Crops to Climate Variability, Uncertainty, 6th–8th April, 2017
[692]
Meena, Kunj Bihari, 413 Meena, Kusum, 372
Meena, L.K., 50
Meena, R.S., 616 Megaladevi, P., 611 Meghwal, Manohar Lal, 510 Mehraj, Iqra, 165, 169, 172 Mehta, A.K., 601 Mehta, N., 605 Mehta, N.D., 446 Mehta, Shikha, 58, 206 Mehta, V.P., 260 Midhat, Syed, 172 Mir, G. Hassan, 525 Mir, Ghulam Mohammad, 630, 631 Mir, H., 102, 415, 572
Mir, Hidayatullah, 363, 384, 390, 391, 400, 414, 568, 594
Mir, J.I., 26, 636
Mir, M.R., 449 Mir, Naseer A., 462 Mir, Sajad Hussain, 630, 631 Mishr, J.S., 407 Mishra, A.K., 413 Mishra, Amit, 682 Mishra, Ashutosh, 281 Mishra, B.B., 27 Mishra, J.S., 620, 679 Mishra, N., 55 Mishra, O.P., 215 Mishra, Ritu, 424 Mishra, Sunidhi, 489 Mishra, Sweta, 36
Mishra, Vidyanand, 208 Mishra, Vijay Kumar, 499
Misra, A.K., 13 Mitra, B., 674 Mitra, Biplab, 668 Mitra, Surajit, 417 Mohan, B., 59 Mohanta, Smaranika, 421
Moharana, Durga Prasad, 327, 622 Mohiddin, F.A., 526 Mondal, Hemanta Kumar, 58 Mondal, Reva, 222, 346, 453 Monika, 559 Monoj, S., 545
More, N.S., 8 Mufti, S., 626 Mughal, Mohmmad Najeeb, 525 Mughal, Najeeb, 488 Mukhdoomi, M.I., 626 Mukherjee, S., 155 Mukhopadhyay, S.K., 205
Mukhtar, Malik, 533 Mula, Myer G., 316 Murugan, M., 31 Mushtaq, F., 626 Mushtaq, Tahir, 185, 484
Mushtaq, Tahmina, 185, 484
Nabi, Asha, 230 Nabi, Samreen, 165, 169, 172 Nag, J.L., 605 Nagarajan, K., 133 Nagargade, Mona, 430 Nahakpam, Sareeta, 86 Naher, U.A., 141 Naidu, A.K., 601 Namrata, 216 Nand, Neetu, 538 Nanda, H.C., 495 Nandal, D.P., 195 Nandal, T.R., 355 Nandan, Neha, 586 Nandan, Ravi, 90 Nandi, S., 346 Nangare, D.D., 98 Narayanan, K., 650 Narkhede, W.N., 223 Naskar, S., 641 Nath, Paras, 506 Nath, Shambhu, 506 Nath, Vishal, 23 Nayak, A.K., 128, 130 Nayak, M.K., 127, 152 Nayak, T.R., 241 Nayyer, Md. Abu, 439
Naz, Shaheen, 90 Nazir, G., 626 Neeraj, 183 Neha, Pallavi, 67 Nilanjaya, 106 Nimmy, M.S., 596, 598
It is I
LLEGAL t
o cop
y, pri
nt or
save
any c
onten
t of th
is PDF,
in pa
rt or in
full,
on an
y retr
ieval
syste
m,
withou
t the E
XPRESS WRITTEN PERMISSIO
N of th
e cop
yrigh
t-hold
er

National Conference on Climate Change, Agricultural Production: Adapting Crops to Climate Variability, Uncertainty, 6th–8th April, 2017
[693]
Nirala, R.B.P., 120, 504, 78 Nirupa, K., 545
Nityanand, 348, 367 Niwas, Ram, 149, 157, 217
Ojha, M.D., 436
Oroan, P.R., 57, 310
Pachauri, Atul Kumar, 610 Padbhushan, Rajeev, 150, 194, 409 Padder, B.A., 230 Padhan, Dhaneshwar, 342 Padhi, G., 581 Padhi, Gayatri Kumari, 22, 582 Pal, A.K., 403, 590, 592 Pal, Awadhesh Kumar, 72, 589, 593 Pal, Ram, 100, 311, 652 Pali, G.P., 269 Panda, C.K., 74, 389 Pandey, Ajit Kumar, 220, 509 Pandey, Alok, 288 Pandey, Amit Kumar, 303, 379, 387 Pandey, Amit, 266 Pandey, I.B., 34, 228
Pandey, J.S., 14 Pandey, P.C., 42, 114, 191 Pandey, Pankaj Kumar, 540 Pandey, Priyal, 472 Pandey, S.D., 293 Pandey, S.K., 117, 231 Pandey, Shalini, 497 Pandey, Vyas, 13 Pandiaraj, T., 155 Paneru, Prakash, 668 Panghal, V.P.S., 571 Panja, Payel, 417, 419, 421 Panja, Sudeshna, 503, 583 Panneerselvam, S., 82 Pannu, R.K., 393 Panse, Raju K., 623 Panwar, A.S., 142 Panwar, G.S., 275, 297, 306, 307, 348, 353, 356,
367, 655, 677, 679, 88 Panwar, Gurusharan, 316 Paramasivam, K., 498 Parsagoni, Mallesh, 495 Partap, Tej, 309, 336 Parvaze, Sabah, 46, 154, 165, 169, 172
Parvaze, Saqib, 46, 154, 165 Parwez, Arif, 407
Paswal, Shazia, 313, 324, 558 Paswan, Diwakar, 373 Patak, M.C., 650 Patel, A.B., 474
Patel, Arun, 495
Patel, Atul, 372 Patel, C.K., 431 Patel, Himanshu, 208 Patel, J.K., 431 Patel, R.N., 431 Patel, Rajkamal, 208 Patel, Rekha, 559 Patel, V.B., 102, 306, 474 Pathade, M.P., 477 Pathania, Ranu, 358 Patidar, Dharmendra Kumar, 234, 236, 242 Patil, Jaydeep, 512, 513 Patil, Shridhar, 474 Patro, H., 55 Paul, K.S.R., 61
Paul, Pampi, 648 Paul, S.C., 201, 301 Paul, Sankar Ch., 277 Phatak, S.V., 555 Pinki, 483 Poddar, S., 385 Pongener, Alemwati, 293 Pooja, 351 Prabhu, R., 464
Pradhan, Amit Kumar, 201, 277 Pradhan, Kaushik, 668 Pradhan, Swati S., 351 Pradhan, U.K., 151
Prajapat, Om Prakash, 236
Prajapati, Sunil, 254 Prajapati, V.M., 446 Prakash, Nilmani, 549 Prakash, Niraj, 123, 361 Prakash, S., 250 Prakash, Satya, 268, 469 Pramanik, K., 385 Prasad, B.D., 590 Prasad, Bishun Deo, 390, 400, 524, 541, 568, 589,
592, 593 Prasad, Durga, 474, 561, 585
It is I
LLEGAL t
o cop
y, pri
nt or
save
any c
onten
t of th
is PDF,
in pa
rt or in
full,
on an
y retr
ieval
syste
m,
withou
t the E
XPRESS WRITTEN PERMISSIO
N of th
e cop
yrigh
t-hold
er

National Conference on Climate Change, Agricultural Production: Adapting Crops to Climate Variability, Uncertainty, 6th–8th April, 2017
[694]
Prasad, J., 379, 387 Prasad, K.K., 340
Prasad, Muneshwar, 325, 414 Prasad, P.H., 346 Prasad, R.K., 304 Prasad, Reema, 407 Prasad, Shambhu, 112 Prasad, V.M., 266, 291 Pratap, Tej, 322 Praveen, Shelly, 240
Preeti, 299 Premdeep, 48, 149, 217 Premdeep, Amit Singh, 157 Prince, 370, 576
Priya, R. Sathya, 91 Priya, Tannu, 606 Pundhir, V.S., 554
Punia, Darshan, 212 Punia, M.S., 603 Punia, S.S., 195, 265 Puran, Asha, 57 Purbey, S.K., 293
Qaisar, Khwaja Naved, 139 Qasba, Shazmeen, 137, 139 Qayoom, Sameera, 172
Qureshi, A., 114
Radha, Y., 61 Raghu, B.R., 122 Raghuraman, M., 491, 629 Raghuvanshi, Krishna, 231 Raghuvanshi, Rupan, 62 Raghuveer, M., 296 Rahaman, S.M., 50 Rahman, Atiquer, 668 Rahman, F.H., 38 Rahman, Shafiqur, 662
Rai, G.K., 240 Rai, R.S., 624 Rai, S.K., 145 Raj, Amit, 414 Raj, Tilak, 85 Raja, N. Asoka, 233 Rajak, S.K., 623 Rajangam, R., 31 Rajani, Kumari, 443 Raju, S.V.S., 537
Rakshit, Amitava, 27 Rakshit, Rajiv, 28, 275, 277 Raktagandha, C.V., 187 Ramaraju, K., 544 Ramasamy, K., 135
Ramesh, K., 142, 248 Ramesh, R., 31 Ramkewal, 407 Rana, D.K., 610 Rana, G.S., 370 Rane, J., 98 Rani, Mamta, 212 Rani, Neha, 504 Rani, Nisha, 490, 65 Rani, Pooja, 359 Rani, Ruby, 102, 113, 400 Rani, Rupa, 373
Rani, Sarita, 364 Rani, Shobha, 394, 396 Rani, Sonia, 359 Ranjan, Manish, 228 Ranjan, R.D., 403, 406
Ranjan, Sumitap, 158 Rao, Ch. Srinivasa, 7 Rao, K. Sankara, 544 Rao, K.K., 668 Rao, O.P., 183 Rashid, Mamunur, 668 Rasool, Faisul Ur., 259 Rasool, S., 449
Rastogi, Arpita, 171
Rather, S.A., 526 Ratilal, Solanki Dharmik, 292 Rausch, Kent, 388
Ravannavar, Revanna, 608 Ravi, R., 31 Ravisankar, N., 142 Ray, M., 55 Ray, Pankaj Kumar, 303 Ray, S., 155 Ray, S.N., 531, 573 Reddy, D.V. Srinivasa, 59 Reddy, Patil Srihari, 498 Reddy, Srinivasa, 614 Regar, Champa Lal, 402 Revathi, S., 518 Rinku, 318
It is I
LLEGAL t
o cop
y, pri
nt or
save
any c
onten
t of th
is PDF,
in pa
rt or in
full,
on an
y retr
ieval
syste
m,
withou
t the E
XPRESS WRITTEN PERMISSIO
N of th
e cop
yrigh
t-hold
er

National Conference on Climate Change, Agricultural Production: Adapting Crops to Climate Variability, Uncertainty, 6th–8th April, 2017
[695]
Rohini, A., 634
Roy, Banashri, 578 Roy, D.K., 90, 237, 238, 586 Roy, Debashis, 522 Roy, K., 19 Roy, S.K., 38 Roy, Sankhyashree, 162
Sachan, C.P., 478 Sadashiva, A.T., 347 Sagar, Abhishek, 231 Sah, Akhilesh, 51, 191, 194 Sah, Rajkumar, 643 Sah, S.B., 602
Sah, Shyam Babu, 250, 573 Saha, A.K., 123 Saha, Ruby, 100, 311, 438 Saha, S., 567 Saha, Suvadip, 565 Saha, T., 573 Saha, Tamoghna, 531 Sahay, Sanjay, 314 Sahni, Sangita, 541, 551, 589, 593 Sahoo, K.C., 55
Sahu, Gayatri, 329 Sahu, Raghubar, 97 Sahu, Upendra, 495 Sain, Veer, 260 Saini, Harnek Singh, 326, 366 Saini, J.P., 358 Saini, Ritu, 263, 326, 366 Saini, Sumit, 199 Sajwan, Paramjeet, 343
Sakthirama, V., 470 Salimath, Siddalingayya, 608 Samant, S.S., 455
Samanta, A., 581 Samanta, Arunava, 582 Sangle, U.R., 620 Sankanur, M.S., 381 Sankanur, Mahantappa, 377 Santeshwari, 491, 629 Saphi, Ramesh K., 668 Sar, Koushik, 286, 301
Sarawgi, A.K., 119, 610 Sardar, Somnath, 522 Saresh, N.V., 377
Sarkar, K.K., 583 Sarkar, Mihir, 659 Sarkar, P.K., 581 Sarkar, Sukamal, 522 Sarkar, U.K., 19 Sarkhel, Subhashish, 187 Sarthi, P. Parth, 77 Sathish, S., 464 Sathua, S.K., 547 Satyadevi, Geddam, 498 Satyendra, 120, 546, 548, 557, 595, 637 Saxena, R.R., 605 Seema, 42, 124, 436 Sehrawat, S.K., 308 Selvaperumal, A., 135 Selvaraj, K., 20 Selvarajeswari, N., 498
Sen, A., 430 Senapati, A.K., 567 Sengupta, Kajal, 522
Sewhag, Meena, 107 Sha, Shyam Babu, 531 Shah, M.D., 230 Shah, Mehlath, 168, 172, 456 Shahi, J.P., 547 Shahid, Mohammad, 128 Shajan, K., 31
Shambhavi, Shweta, 278 Shambhawi, Sweta, 150 Shamim, M., 142, 618 Sharda, Kumari, 83, 97, 647
Sharma, Abhijeet, 217 Sharma, Abhishek, 529 Sharma, Anil, 461 Sharma, Arun, 421 Sharma, Deepak, 610 Sharma, Hemlata, 216 Sharma, Jitendra, 285 Sharma, Madhvi, 412 Sharma, Manmohan, 480
Sharma, Manoj Kumar, 359 Sharma, Neha, 192
Sharma, O.P., 404 Sharma, P.C., 673 Sharma, R.N., 119 Sharma, R.P., 72, 83, 95 Sharma, Richa, 324, 558
It is I
LLEGAL t
o cop
y, pri
nt or
save
any c
onten
t of th
is PDF,
in pa
rt or in
full,
on an
y retr
ieval
syste
m,
withou
t the E
XPRESS WRITTEN PERMISSIO
N of th
e cop
yrigh
t-hold
er

National Conference on Climate Change, Agricultural Production: Adapting Crops to Climate Variability, Uncertainty, 6th–8th April, 2017
[696]
Sharma, Sagar Kumar, 478 Sharma, Saurav, 355, 358 Sharma, Savitri, 94, 101 Sharma, Sheetal, 340, 682 Sharma, Suneel, 391 Sharma, V.K., 320 Sheeba, S., 59 Shefali, 251 Shekhar, Jayant, 300 Shekhawat, B.S., 94, 101 Shelke, R.R., 642 Shelly, Madhu, 651, 660 Sherawat, S.K., 594 Sherpa, Choyang, 565 Shikha, 494 Shivaputra, 510 Shivay, Y.S., 425
Shori, Abhishek, 269, 376
Showkat, Abid, 533 Shree, S., 380 Shree, Sangeeta, 402, 542 Shrestha, Hari Krishna, 668 Shrestha, Renuka, 668 Shrivastava, Atul, 623 Shukla, Neeraj, 605 Shyam, Chitralekha, 495 Shyamrao, Ingle Dipak, 491, 629 Siddiqui, M.W., 439 Siddiqui, Wasim, 557 Siddque, Nur-E-A, 668 Sidhu, S.S., 85
Sidhu, Sukhpreet Kaur, 85 Sihag, Sweety, 263 Sikarwar, Satypriy, 478 Singh, A.B., 142 Singh, A.K., 3, 116, 117, 214, 255, 394, 396, 450,
624
Singh, Ajay, 195 Singh, Ajoy Kumar, 28
Singh, Akanksha, 64, 214, 516, 517 Singh, Akhilesh Kumar, 503
Singh, Amar, 450
Singh, Amrita, 590, 592 Singh, Anand Kumar, 327, 622 Singh, Archana, 450 Singh, Ashok K., 418
Singh, Ashutosh, 241, 303, 379, 387
Singh, Avinash, 516, 517 Singh, B.B., 621 Singh, Baldeep, 559 Singh, Balwinder, 265
Singh, Beerendra, 340 Singh, Bhagat, 337, 393, 622 Singh, Bhaskar Pratap, 161 Singh, Birender, 444 Singh, Birender, 624 Singh, C.S., 373 Singh, D.B., 363, 461 Singh, D.K., 42, 114 Singh, D.P., 285 Singh, Deepti, 110 Singh, Deshraj, 428 Singh, Devendra, 551 Singh, Devi, 291 Singh, Dhara, 281 Singh, Dhirendra Kumar, 622
Singh, Divya Prakash, 309, 336, 516, 517 Singh, Diwan, 127 Singh, Durgesh, 72, 231 Singh, G.P., 155 Singh, Ghanshyam, 150 Singh, Gyanendra, 650
Singh, Harshita, 571 Singh, Hemant Kumar, 123, 361 Singh, Inderpal, 413 Singh, Indra, 310 Singh, J., 155 Singh, J.K., 350, 351 Singh, J.P., 439 Singh, Jagdev, 265, 337 Singh, Jitendra, 203, 281, 489 Singh, K.K., 9, 171 Singh, K.M., 123, 361 Singh, K.N., 516
Singh, K.P., 289 Singh, Kanwar Pal, 187 Singh, Kundan, 524 Singh, M.K., 112, 131, 255, 532, 54 Singh, M.N., 535, 540 Singh, Mahender, 127 Singh, Mahendra, 275, 277 Singh, Mandhata, 407, 620 Singh, Manoj Kumar, 268 Singh, Mohinder, 209
It is I
LLEGAL t
o cop
y, pri
nt or
save
any c
onten
t of th
is PDF,
in pa
rt or in
full,
on an
y retr
ieval
syste
m,
withou
t the E
XPRESS WRITTEN PERMISSIO
N of th
e cop
yrigh
t-hold
er

National Conference on Climate Change, Agricultural Production: Adapting Crops to Climate Variability, Uncertainty, 6th–8th April, 2017
[697]
Singh, N.B., 377 Singh, N.K., 106 Singh, N.P., 8, 98 Singh, Naveen Prakash, 309, 336 Singh, Ompal, 254, 633
Singh, P., 605
Singh, P.K., 9, 24, 65, 71, 109, 116, 120, 145, 255, 504, 546, 548, 589, 590, 592, 593, 595, 637
Singh, Paramveer, 110 Singh, Parikshit, 478 Singh, Poonam, 478 Singh, Pradyuman, 52, 183, 252, 321, 413
Singh, Prateek, 266 Singh, Pravin, 234, 236, 242 Singh, Priyanka, 9, 171 Singh, Pushpa, 500 Singh, R.A., 192 Singh, R.K., 198, 248., 279, 435 Singh, R.M., 241, 271 Singh, R.N., 438, 444, 500, 561
Singh, R.P., 435, 601
Singh, R.R., 113, 415 Singh, R.S., 24, 590 Singh, Rahul, 548, 595 Singh, Raj, 127, 152, 48 Singh, Rajeev, 348, 367 Singh, Rajendra, 473 Singh, Rama Kant, 39, 186 Singh, Ramesh Kumar, 117 Singh, Ravi Gopal, 297, 356
Singh, Ravi Shankar, 44, 592 Singh, Rawati Raman, 414 Singh, S.B., 39, 186 Singh, S.K., 39, 186, 304 Singh, S.P., 120, 546, 548, 595, 637, 684 Singh, S.R., 74, 83, 389 Singh, Santosh Kumar, 684 Singh, Sardar Sunil, 338
Singh, Satybhan, 427 Singh, Shakshi, 528 Singh, Sudhanshu, 348, 353, 356, 367, 677, 678,
679, 680 Singh, Sukhjinder, 355, 358 Singh, Surendra, 101 Singh, U.P., 351, 678 Singh, Uma Shankar, 680 Singh, Umesh, 379, 387
Singh, V.B., 600 Singh, V.K., 306, 307, 380 Singh, V.P., 36 Singh, Vaibhav, 622 Singh, Ved Prakash, 309
Singh, Vijay Kumar, 161
Singh, Vikram, 483, 494 Singh, Virendra, 425 Singh, Y., 98 Singh, Y.K., 150, 340 Singh, Y.V., 447, 521 Singh, Yanendra Kumar, 194, 409 Singh, Yogeshwar, 8 Singhdoha, Amit, 210 Sinha, A.K., 155, 674 Sinha, Abhilasha, 590, 592 Sinha, Asha, 528 Sinha, Rajni, 294 Sinha, Ranveer Kumar, 644 Sinha, S.K., 39, 186, 272, 273, 306, 307 Sinha, Sima, 44, 443 Sinha, Suparna, 415 Sinha, Sweta, 596 Sirohi, Chhavi, 182 Sivakumar, S.D., 470
Sofi, J.A., 461 Sofi, M. Nayeem, 196 Sofi, P.A., 137 Sohane, R.K., 3, 156, 289, 340, 361, 384, 394, 396
Sohanveer, 268, 469
Solai, M.A., 31 Solankey, S.S., 65, 67, 490, 557 Solanki, R.B., 404 Solanki, Y.P.S., 494 Somasundaram, E., 91 Sondarva, R.L., 446 Soni, Jeetendra Kumar, 82, 233 Sonkar, A.K., 350 Sreechanth, S., 163 Srinivasan, R., 598
Srinivasaraghavan, A., 575, 577 Srivastava, A.K., 678, 679 Srivastava, Ankur, 159
Srivastava, Ashutosh, 85 Srivastava, K., 535 Srivastava, Tripti, 161 Srivastava, V. K., 288, 433
It is I
LLEGAL t
o cop
y, pri
nt or
save
any c
onten
t of th
is PDF,
in pa
rt or in
full,
on an
y retr
ieval
syste
m,
withou
t the E
XPRESS WRITTEN PERMISSIO
N of th
e cop
yrigh
t-hold
er

National Conference on Climate Change, Agricultural Production: Adapting Crops to Climate Variability, Uncertainty, 6th–8th April, 2017
[698]
Srivastawa, Pawan, 668 Srivastwa, J.N., 573 Subba, S. Kr., 346 Subba, Satish Kr., 453 Suborna, 353, 677 Sudha, R., 634 Sujitha, E., 173 Suman, S., 297 Suman, Shruti, 301, 316 Sumathi, P., 518 Sunayana, 75, 603 Sundaram, Shanmuga K., 173
Sundararaj, R., 20
Sundarlingam, K., 464 Suresh, B.G., 562
Sushant, 301 Swain, Dillip Kumar, 15 Swami, Sanjay, 196 Syamal, M.M., 327
Tabassum, Shahnishan, 590, 592 Tarafdar, Jayanta, 417
Tehlan, S.K., 104 Tejpratap, 202 Tengli, Mahesh B., 648 Thakur, Dinesh S., 415 Thakur, N.S., 332, 333, 344, 381 Thakur, Pran Krishna, 417, 419 Thakur, S.K., 272, 273 Thakur, Sanjeev, 377 Thakur, Shalu Devi, 455 Thapa, Dinesh, 668 Thapa, Umesh, 222, 346, 453 Thenua, O.V.S., 425, 427 Thirumeni, S., 498 Thomas, Tarence, 413 Tiwari, Ajay, 119 Tiwari, Anjali, 254 Tiwari, T.P., 672, 674
Tiwari, Thakur P., 668 Tomar, J.B., 67 Tripathi, Anjali, 343 Tripathi, Vishal, 74, 600 Tyagi, Nidhi, 600 Tyagi, Shashank, 54, 80, 117, 301 Tyagi, Vishal, 198, 430
Udikeri, S.S., 410 Ullah, Syed Sami, 268, 469 Umbarkar, P.S., 501 Uniyal, Shweta, 343 Upadhyay, Pravin Kumar, 248 Usha, K., 614
Vadde, Anoosha, 199 Vaidya, Aashish Vivek, 536 Vaishnav, P.R., 151 Vani, V. Manju, 266 Varan, Risha, 521 Varshney, S.K., 444 Vart, Dev, 492 Vashi, Y., 641 Vasht, Devendra, 633 Venkatesan, T., 20 Venkatesh, J., 608 Venketeswarlu, B., 5 Verma, A.K., 601 Verma, Anurag, 516 Verma, Archana, 377
Verma, Lalita, 428
Verma, M.R., 650 Verma, Maneesh, 447 Verma, R.B., 118, 306, 307, 541, 557 Verma, Tarun, 576 Verma, V.K., 322, 288 Verma, Vinita, 256 Vidyalakshmi, G.M., 650 Vimal, Binod Kumar, 150, 158 Vishnupriya, R., 544 Vishwajith, K.P., 174
Vivek, 286
Wadatkar, H.V., 642 Wadhwa, Neha, 263 Walia, Sohan Singh, 16, 25, 258, 334, 422, 458,
459, 467
Wani, Henna, 662 Wani, M. Younus, 449 Wani, Nasir Rashid, 139 Wani, Sajad Hassan, 26, 636 Wani, Shabir H., 478, 480
It is I
LLEGAL t
o cop
y, pri
nt or
save
any c
onten
t of th
is PDF,
in pa
rt or in
full,
on an
y retr
ieval
syste
m,
withou
t the E
XPRESS WRITTEN PERMISSIO
N of th
e cop
yrigh
t-hold
er

National Conference on Climate Change, Agricultural Production: Adapting Crops to Climate Variability, Uncertainty, 6th–8th April, 2017
[699]
Yadav, A.C., 284 Yadav, A.K., 322, 673 Yadav, Ashok, 348, 353, 356, 677 Yadav, Avaneesh Kumar, 336 Yadav, G.S., 47 Yadav, H.L., 94 Yadav, Indira, 203 Yadav, Manish, 219 Yadav, Neelam R., 559 Yadav, Preeti, 104 Yadav, R.A., 284
Yadav, R.B., 399 Yadav, R.C., 559, 684 Yadav, Rajesh, 75, 603 Yadav, Ram P., 369
Yadav, Ramjeet, 383 Yadav, S., 492 Yadav, S.B., 13 Yadav, S.K., 255 Yadav, S.S.S., 447 Yadav, Saroj, 513 Yadav, Satender, 494 Yadav, Shashidhar, 399 Yadav, Suman, 562 Yadav, Sunita, 199, 497 Yarrakula, Kiran, 163, 441 Yashveer, 494
Zaidi, Najam Waris, 680 Zapadiya, D.M., 431
Zehra, Syed Berjes, 529, 626
It is I
LLEGAL t
o cop
y, pri
nt or
save
any c
onten
t of th
is PDF,
in pa
rt or in
full,
on an
y retr
ieval
syste
m,
withou
t the E
XPRESS WRITTEN PERMISSIO
N of th
e cop
yrigh
t-hold
er
9 789386 256737