MEMS Piezoelectric Accelerometer for Vibration Sensing in ...
Upload
independentCategory
view
1download
0
Comparison of the TriTrac-R3D accelerometer and a self-report activitydiary with heart-rate monitoring for the assessment of energy
expenditure in children
G. Rodriguez1, L. Beghin2,3, L. Michaud2, L. A. Moreno4, D. Turck2 and F. Gottrand2*1Departamento de Pediatrıa. HCU ‘Lozano Blesa’, Zaragoza, Spain
2Unite de Gastroenterologie, Hepatologie et Nutrition, Clinique de Pediatrie, Hopital Jeanne de Flandre, and Faculte de
Medecine, Lille, France3Centre d’Investigation Clinique CIC-9301-INSERM-CHU, Hopital Cardiologique, Lille, France
4EU Ciencias de la Salud, Universidad de Zaragoza, Zaragoza, Spain
(Received 8 January 2001 – Revised 26 November 2001 – Accepted 19 January 2002)
Determining total energy expenditure (EE) in children under free-living conditions has becomeof increasingly clinical interest. The aim of this study was to compare three different methods toassess EE triaxial accelerometry (TriTrac-R3D; Professional Products, Division of ReiningInternational, Madison, WI, USA), activity diary and heart-rate (HR) monitoring combinedwith indirect calorimetry (IC). Twenty non-obese children and adolescents, aged 5.5 to 16.0years, participated in this study. Results from the three methods were collected simultaneouslyunder free-living conditions during the same 24 h schoolday period. Neither activity diary (5904(SD 1756) kJ) nor the TriTrac-R3D (6389 (SD 979) kJ) showed statistical differences in 24 htotal EE compared with HR monitoring (5965 (SD 1911) kJ). When considering different physi-cal activity (PA) periods, compared with HR monitoring, activity diary underestimates total EEduring sedentary periods (P,0·001) and overestimates total EE and PA-EE during PA periods(P,0·001) because of the high energy cost equivalence of activity levels. The TriTrac-R3D,compared with HR monitoring, shows good agreement for assessing PA-EE during PA periods(mean difference +0·25 (SD 1·9) kJ/min; 95 % CI for the bias 20·08, 0·58), but underestimatesPA-EE and it does not show good precision during sedentary periods (20·87 (SD 1·4) kJ/min,P,0·001). Correlation between the vector magnitude generated by the TriTrac-R3D acceler-ometer and EE of activities derived from HR monitoring is high. When compared with theHR method, the TriTrac-R3D and activity diary are not systematically accurate and must becarefully used for the assessment of children’s EE depending on the purpose of each study.
Energy expenditure: Accelerometry: Activity diary: Heart-rate monitoring: Physicalactivity
Energy balance problems occur frequently in patientsreferred to a children’s hospital. Failure to thrive, under-nutrition and obesity are pathologies which need a correctevaluation at diagnosis and posterior controls. Theoretic-ally, under free-living conditions, a combination ofenergy intake and energy expenditure (EE) could allowan estimate of energy balance in each subject. Total dailyEE in children and adolescents is made up of resting(EE), diet-induced thermogenesis, physical activity (PA)and growth (Durnin, 1991). Resting EE is 60–70 % totaldaily except in those children who are involved in
high-energy aerobic competitive sports (World HealthOrganization, 1985) or, in contrast, in children with adisease which increases resting EE such as cystic fibrosis(Turck & Michaud, 1998). Diet-induced thermogenesisconstitutes 5–10 % total daily EE, PA is 25–30 % totaldaily EE, and growth on a daily basis is too small tomeasure except in rapidly growing infants.
The measurement of total EE has been a research pro-cedure under laboratory conditions involving the use ofcumulative heart-rate (HR) monitoring and indirect calori-metry (IC; ventilated hood system or whole-body method
* Corresponding author: Professor F. Gottrand, fax +33 3 20 44 59 63, email [email protected]
Abbreviations: EE, energy expenditure; HR, heart-rate; IC, indirect calorimetry; MET, metabolic equivalent tasks; PA, physical activity.
British Journal of Nutrition (2002), 87, 623–631 DOI: 10.1079/BJN2002571q The Authors 2002

in a chamber) (Schutz & Deurenberg, 1996). Nowadays,the development of computerized indirect calorimeters,min-by-min HR monitoring, doubly-labelled water(2H2
18O) and accelerometry techniques have made themeasurement of total EE under free-living conditions andas a clinical tool possible (Gottrand, 1998). The 2H2
18Omethod, which is accurate during long-term EE deter-minations under free-living conditions, has two main dis-advantages: (1) the high cost of the isotope 18O and ofanalysis by spectrometry; (2) it gives a mean value oftotal daily EE for a period of 1–2 weeks, but it is notpossible to measure EE during short-term PA periods orto analyse PA behaviours (Schutz & Deurenberg, 1996;Gottrand, 1998).
HR monitoring is a non-invasive, socially acceptable andaccurate method in groups of children (Livingstone et al.1992). It is based on the observation that when O2 con-sumption increases is also associated with an increase inHR. This relationship varies among different individuals,so that individual calibration curves must be generatedfor each subject by calorimetry and HR monitoring, reflect-ing different intensities of exercise during free-livingconditions (Livingstone et al. 1992; Bitar et al. 1995).Accelerometry techniques, especially triaxial acceler-ometers, were developed to detect body acceleration inthe three planes of a space and it has been shown that itis an objective method to distinguish differences in activitylevels between and within individuals (Welk & Corbin,1995; Westerterp, 1999), but has low sensitivity for seden-tary activities in adults (Bouten et al. 1997).
The objective of the present study was to comparemeasurements of EE in children under free-living con-ditions, obtained by three different method: (1) triaxialaccelerometry; (2) activity diary; (3) HR monitoring withindividual EE regression equations performed by IC.
Methods
Subjects
Twenty non-obese children, seven girls and thirteen boys,aged 5.5 to 16.0 years, all volunteers, participated in thecurrent study after the purpose and the objectives werecarefully explained (Table 1). All subjects passed athorough physical and medical examination and were con-sidered not to have any acute conditions (such as infection)known to interfere with EE. Written informed consent wasobtained from children and parents, and the study wasapproved by the Lille University Research Ethical Com-mittee (Comite Consultatif de Protection des Personnesdans la Recherche Biomedicale).
Protocol
Subjects arrived by car at the Clinical Investigation Centreof Lille University Hospital, Lille, France (CIC-9301-INSERM-CHU) at 08.00 hours after a 12 h fast. Weightand height were first measured. Resting EE, postprandialEE and EE during PA were measured by IC with an adap-tation period of 15 min under the ventilated canopy systembefore each measurement period. Resting EE was obtainedfor 30 min and postprandial EE after having breakfast.Breakfast provided approximately 20 % daily energyrequirements for each child (World Health Organization,1985) and was made up of milk, sugar, fruit juice, butter,jam and bread. EE was determined 2 hours after havingbreakfast during PA (described later). HR monitoringwas obtained during all measurement periods. Resultsfrom the morning session were used to perform the individ-ual regressions of HR v. EE. After this ‘laboratory valid-ation period’, on the same day measurement of 24 h totalEE under free-living conditions began. At the same time,
Table 1. Physical characteristics of subjects
Subjects Sex Age (years) Height (m) Weight (kg) BMI (kg/m2)
1 M 5·50 1·120 17·9 14·22 F 5·50 1·069 19·4 16·93 M 6·25 1·261 24·0 15·04 M 6·32 1·278 27·2 16·65 M 6·50 1·220 21·2 14·26 M 6·72 1·204 23·5 16·27 M 8·00 1·253 25·0 15·98 M 9·75 1·430 30·9 15·19 M 11·50 1·421 34·2 16·910 F 12·00 1·400 30·1 15·311 F 13·35 1·435 35·2 17·012 M 14·00 1·442 39·5 18·913 F 14·00 1·540 41·2 17·314 M 14·16 1·500 42·3 18·815 M 14·32 1·485 41·3 18·716 M 14·32 1·574 48·0 19·317 F 14·90 1·460 36·6 17·118 F 15·00 1·584 55·0 21·919 M 15·00 1·520 40·2 17·320 F 16·00 1·701 63·7 22·0Mean (SD) 11·15 (3·8) 1·394 (0·166) 34·8 (12·0) 17·2 (2·2)
M, male; F, Female.
G. Rodriguez et al.624
each child wore the triaxial accelerometer (TriTrac-R3D;Professional Products, Division of Reining International,Madison, WI, USA) and a HR recorder Holter 24–48 hrecorder (synesis, ELA medical, Montrouge, France) fora 24 h period, carefully writing down each different activityand its duration in the activity diary. The free-livingmeasurement day was chosen to be a usual school day.
Resting energy expenditure and postprandial energyexpenditure by indirect calorimetry
EE was measured by an indirect open-circuit ventilated hoodsystem, Deltatrac II (Datex Instrumentation Corporation,Helsinki, Finland). The RER was calibrated by alcohol-burning tests every 6 months according to the calorimeter’smanufacturers (Datex Instrumentation Corporation). Thecalorimeter’s manufacturer’s certified a CV ,2 % foreach measurement of VCO2
, VO2flows and the RER.
Before each measurement, gas analysers were calibratedwith a reference gas mixture (CO2–O2, 5:95 v/v, DatexInstrumentation Corporation), and the flow transducerwas tested by injecting a known standard volume repeat-edly (Matarese, 1997). Expired CO2 (VCO2
) and inspiredO2 (VO2
) flows were recorded as well as the RER. EEwas calculated min-by-min from O2 consumption (VO2
,ml/min) and CO2 production (VCO2
ml/min) using theWeir (1949) formula without protein correction: EE ðkJÞ ¼ð3·9 £ VO2
þ 1·1 £ VCO2£ 6·02Þ: After an adaptation
period of 15 min, continuous respiratory exchangemeasurements were initiated. During resting EE and post-prandial EE measurements, children rested quietly in abed watching videotapes. Only steady-state values weretaken into account for analysis (data with a CV , 10%for both VO2
and dilution air flow, and ,5 % for RER).
Energy expenditure during physical activity period byindirect calorimetry
EE during PA was determined by IC for consecutive levelsof calibrated physical exercise consisting of cycling on acycloergometer (CARE 910, Bobigny, France), beginningat 0 W and increasing the braking force ever 30 s, 2·5 Wfor children aged ,12 years and 5 W for children aged.12 years, in order to obtain maximal HR close to thetheoretical maximal heart frequency (220 2 age (years)).The seat height, handlebars and pedal crank of the cyclerg-ometer were adjusted to the child’s size. The pedalling ratewas imposed by the cyclergometer screen at 50 rotations/min.
Heart-rate monitoring
The heart-rate recorder (ELH medical) had two channels ofelectrocardiographic data. This recorder has an eventmarker and a continuous digital time display that wereused to note the different times of the study and to synchro-nize HR and EE data. HR values defined as the mean of theHR recorded ever min over the specific time periods werecalculated with the SYNETEC software (version 1.1; ELAmedical).
Individual regression equations of heart-rate v. energyexpenditure and measurement of total energy expenditure
by heart-rate monitoring
Results for HR and EE, recorded simultaneously duringlaboratory periods (at rest and during postprandial andPA periods), were used to calculate individual polynomialthird-order non-linear regression equations (HR v. EE) asdescribed by Bitar et al. (1995). EE and HR were recordedby techniques explained earlier.
Total EE measured by heart-rate monitoring (totalEEHR) under free-living conditions was derived from themin-by-min recorded HR by reference to the subject’sregression equation for EE v. HR. PA-EE by HR monitor-ing (PA-EEHR) was calculated with the formula:
PA–EEHRðkJ=minÞ ¼ total EEHRðkJ=minÞ
2 resting EEðkJ=minÞ;
where resting EE value is obtained by IC. During the night,HR is often lower than in resting periods and HR–EEequations overestimate night-time EE compared with IC.We therefore used the formula resting EE 2 resting EE/10 to compute night-time EE in children (Beghin et al.2000).
Total energy expenditure by accelerometry
Total EE measured by triaxial accelerometry (total EET)under free–living conditions was obtained with the Tri-Trac–R3D (Professional Products, Madison, WI, USA).The device weighs 170 g and measures 12 £ 6·5 £ 2·2 cm:It measures acceleration in three individual planes and inte-grates acceleration to yield one value called ‘vector magni-tude’ (square root of the sum squared of activity counts ineach vector). The formula used to convert the ‘vector mag-nitude’ to EE from PA is a proprietary formula which willnot be released by the manufacturer. Total EET (kJ/min) iscalculated at 1 min intervals by TriTrac-R3D software withthe ‘vector magnitude’ and subject’s age, sex, height andweight (Hemokinetics Inc, 1993; Westerterp, 1999). TheTriTrac-R3D was worm firmly attached to the anteriortorso of the subject at the level of the waist, perpendicularto the mid-line of the anterior thigh.
Total energy expenditure by activity diary
Children and participating parents were instructed to keepdetailed self-reports on the types of behaviours and thetimes at which these active behaviours began and endedduring the 24 h period when accelerometer and HR moni-toring equipment were worn. Upon return of the self-report sheets, they were reviewed by a trained staffmember and discrepancies were resolved with the parentand child. Only activities recorded for duration of 10 minor more were considered in the comparsion analysesbetween methods. Activity was converted to multiples ofresting metabolic rate in kJ/kg per h using metabolicequivalent tasks (MET) using values from a compendiumof PA (Ainsworth et al. 1993). The questionnaire wasscored for the activity categories of sedentary (1·0–2·0
TriTrac-R3D and heart-rate monitoring 625
MET), light–moderate PA (2·5–5·0 MET) and hard PA(.5 MET). PA-EE by activity diary (PA–EEAD) was cal-culated with the formula:
PA–EEADðkJ=minÞ ¼ total EEAD ðkJ=minÞ
2 resting EEADðkJ=minÞ;
where resting EEAD is the resting metabolic rate with a cor-responding MET value of 1.
Statistical analysis
Since duration of different measurement periods varied,with resting periods usually longer than PA periods,mean EE values were expressed in kJ/min to avoid theinfluence of period duration and to allow comparison ofresults. Results are expressed as mean values and standarddeviations. Paired t tests were used to compare meandifferences between the TriTrac–R3D self–reportedactivity and HR monitoring EE during measuring periods.A linear regression analysis was used to examine therelationship between EE derived from the TriTrac–R3D,self-reported activity and HR monitoring measurements.Agreement between methods for determining EE wasassessed using the Bland & Altman (1986) method. Thelack of agreement between methods can be evaluated bycalculating the bias estimated by the mean difference,standard deviation of the difference and CI for the bias.Correlations were tested using the Spearman test with sig-nificance set at P,0·05 Statistical analyses were per-formed using SPSS (version 7.0 for Windows, SPSS,Chicago, IL, USA).
Results
Total EEHR under 24 h free-living conditions in this groupof children was 5965 (SD 1911) kJ/d. There were no
statistical differences between total EEHR and total EET
(6389 (SD 979) kJ/d, r 2 0·73) but the mean differencetotal EEHR 2 total EET was 2424 (SD 1184) kJ/d(Fig. 1(a)), 95 % CI for the bias was 2978, 130 and the95 % CI for the lower and upper limit of agreement were23753, 21833 and 984, 2905 respectively. These inter-vals are wide, reflecting the small sample size and thegreat variations of differences. Between total EEHR andtotal EEAD (5904 (SD 1756) kJ/d, r 2 0·72) there were nostatistically significant differences, but the mean differencetotal EEHR 2 total EEAD was 58 (SD 1013) kJ/d (Fig. 1(a)),95 % CI for the bias was 2414, 534 and the 95 % CI forthe lower and upper limit of agreement were 22788,21145 and 1265, 2908 respectively. These intervals areas wide as those reported in the Fig. 1(a).
Using an activity diary, 402 different periods could bedistinguished according to the level of activity, summar-izing all twenty subjects’ 24 h period data (122 periodsof PA, 258 periods of sedentary activity and twenty sleep-ing periods). The results of correlation and statisticaldifference analysis are shown in Table 2. Comparing theactivity diary with HR monitoring, total EEAD was signifi-cantly higher than total EEHR during PA periods, but lowerduring sedentary periods; when analysing PA-EE, resultsremained significantly higher during PA periods. In con-trast, during sedentary activity periods there were no stat-istical differences between activity diary and HRmonitoring results even though correlation between thesetwo methods remained low (r 2 0·38). When comparingtotal EEHR and total EET there were only statistical differ-ences during PA and sleeping periods and the TriTrac-R3Doverestimated total EE during these periods. When analys-ing PA-EE by HR monitoring and the TriTrac-R3D, therewere no differences during PA periods, although significantdifferences were observed during sedentary periods.
In general, compared with EE measurements by HRmonitoring, TriTrac-R3D differences were smaller thanactivity diary differences (Table 2). We can summarize
Table 2. Energy expenditure measured by heart-rate monitoring, activity diary and a triaxial accelerometer (TriTrac-R3D‡) §
(Mean values and standard deviations for twenty children and adolescents)
Measurement method. . .HR monitoring
(kJ/min) Activity diary (kJ/min) TriTrac-R3D (kJ/min)
n Mean SD Mean SD r 2k Mean SD r 2k
Total EE all periods 402 5·01 2·5 5·35* 3·2 0·84 5·09† 1·8 0·93Total EE physical activity periods 122 5·76 2·9 7·81*** 4·5 0·68 6·22* 2·3 0·83
Total EE light–moderate physical activity 102 5·47 2·8 6·22*** 2·3 0·83 5·93* 2·1 0·82Total EE hard physical activity 20 7·35 7·6 16·0*** 4·0 0·73 7·81† 3·0 0·88
Total EE sedentary periods 258 4·80 2·1 4·43*** 1·5 0·80 4·68† 1·1 0·91Total EE sleeping periods 20 2·96 0·6 2·38*** 1·0 0·66 3·67*** 0·5 0·87PA-EE all periods 402 2·30 2·3 3·21*** 3·1 0·36 1·58*** 1·7 0·51PA-EE physical activity periods 122 3·05 2·7 5·76*** 4·3 0·54 2·80† 2·2 0·71
PA-EE light–moderate physical activity 102 2·67 2·4 4·01*** 1·6 0·62 2·46† 1·9 0·66PA-EE hard physical activity 20 4·76 3·3 14·0*** 3·9 0·63 4·43† 2·9 0·80
PA-EE sedentary periods 258 1·92 1·8 1·92† 0·8 0·38 1·00*** 0·9 0·54
EE, energy expenditure; HR, heart-rate; PA, physical activity.Mean values were significantly different from those measured by HR monitoring (t test): *P,0·05, ***P,0·001.Mean values were not significantly different from those measured by HR monitoring (t test): †P.0·05.‡ Professional Products, Division of Reining International, Madison, WI, USA.§ For details of subjects and procedures, see Table 1 and p. 624.k r 2 from linear regressions of EE measured by HR monitoring, v. EE measured by activity diary or TriTrac-R3D.
G. Rodriguez et al.626

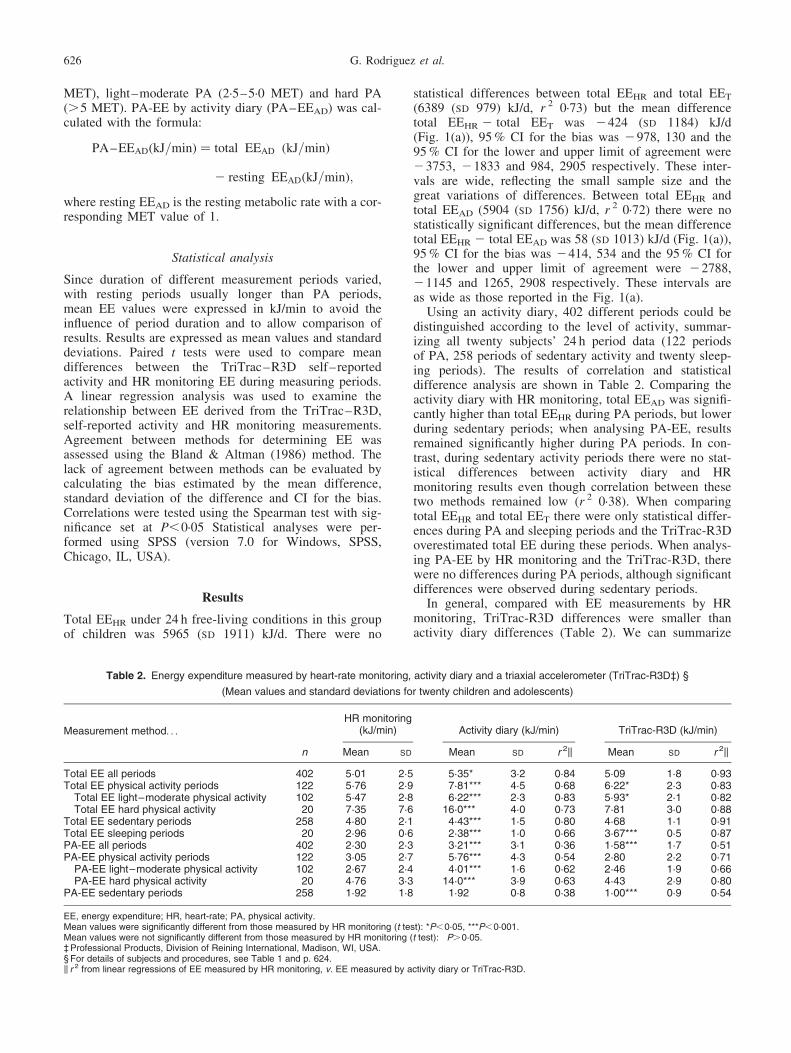
the lack of agreement between TriTrac-R3D and HR moni-toring PA-EE measurements by calculating the bias, esti-mated by mean difference and the standard deviation ofdifferences (Table 3). During sedentary periods, PA-EEmean difference was very large (20·87 (SD 1·4) kJ/min;95 % CI 0·66, 1·04). In a Bland–Altman plot, the differ-ence between TriTrac-R3D and HR monitoring againstmean PA-EE during all measurement periods is repre-sented in Fig. 2. The scatter of the differences increasesas mean PA-EE increases and then, agreement would bewider apart than necessary for small PA-EE. In contrast,when a logarithmic transformation was used to avoid apossible relation between the differences and the meanPA-EE, results showed better agreement for the highermean values (Fig. 3). In addition, we found the best agree-ment between PA-EE data during PA periods with a mean
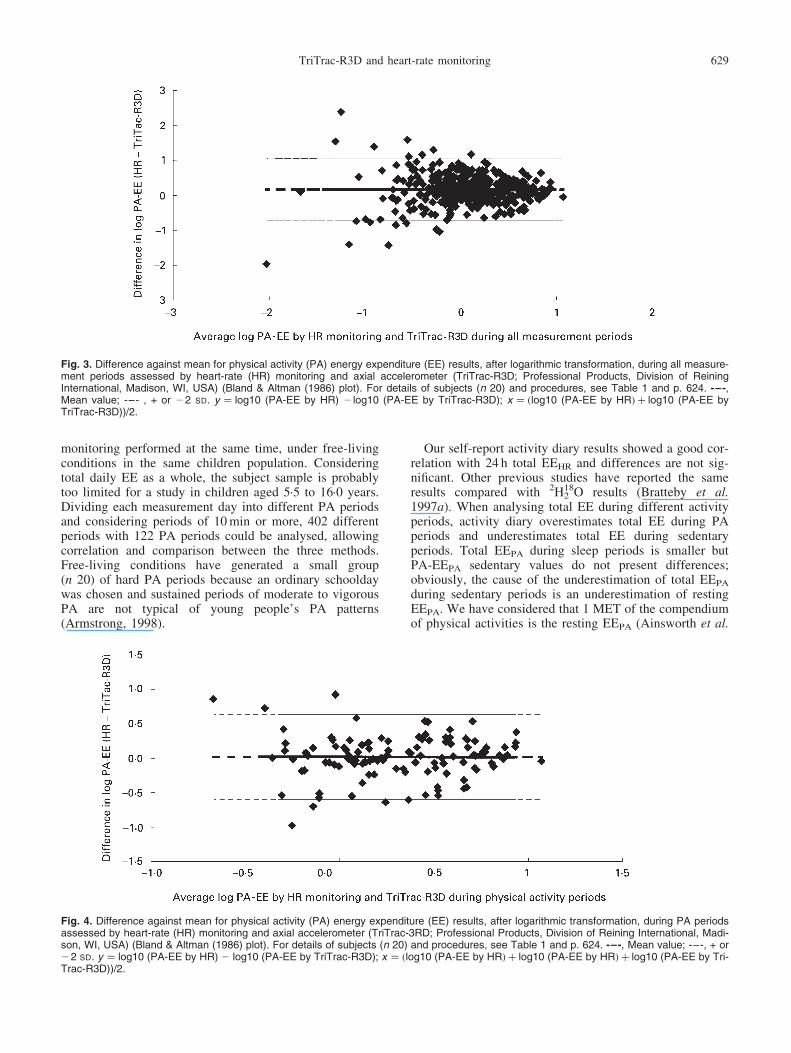
difference PA-EEHR 2 PA-EET of 0·25 (SD 1·9) kJ/min,the 95 % CI for the bias was 20·08, 0·58 and the 95 %CI for the lower and upper limit of agreement were24·3, 23·1 and 3·6, 4·8 respectively (Fig. 4). Correlationbetween the vector magnitude generated by the TriTrac-R3D accelerometer and PA-EE of all activities derivedfrom HR in each children is high: r 2 ranged from 0·51to 0·90 (P,0·001, Spearman correlation).
Discussion
Assessment of EE in human subjects under free-living con-ditions is limited to very few practical methods. The 2H2
18Omethod is considered accurate for long-term EE deter-minations but it is expensive and total EE componentscannot be measured (Schutz & Deurenberg, 1996;
Fig. 1. Difference against mean for 24 h total energy expenditure (EE) results assessed by (a) heart-rate (HR) monitoring and axial acceler-ometer (TriTrac-R3D; Professional Products, Division of Reining International, Madison, WI, USA), (b) HR monitoring and activity diary (Bland& Altman (1986) plots). For details of subjects (n 20) and procedures, see Table 1 and p. 624. -–-, Mean value; -–-, + or 22 SD.
TriTrac-R3D and heart-rate monitoring 627

Gottrand, 1998). In contrast, HR monitoring allows a closeestimation of total EE and its components when an individ-ual regression equation of HR v. EE is determined pre-viously. This method is inexpensive, objective, simpleand popular with subjects. HR monitoring is appropriateand accurate for predicting group estimates of habitualtotal EE and levels of PA in free-living adults and children(Livingstone et al. 1992; McCrory et al. 1997). For calcu-lation of individual prediction equations of EE from HR,we have used in the present study a single third-order poly-nomial relationship which has shown the best fit in children(Bitar et al. 1995; Beghin et al. 2000).
Because of the disadvantages of the reference methodsin the assessment of total EE or PA-EE, especially inyoung children, other less accurate methods are usedunder free-living conditions (Schutz & Deurenberg, 1996;Gottrand, 1998). Self-report activity diaries have beenfound to provide close estimation of total EE in adolescentsand children compared with the results of 2H2
18O orphysical working capacity by HR (Bouchard et al. 1983;Bratteby et al. 1997a), and it has also been used to
compare EE and daily levels of PA between differentgroups of population (Sallis, 1991; Bratteby et al.1997b). As well as the activity diary, a new research instru-ment, the TriTrac-R3D activity monitor (Professional pro-ducts), has recently been developed and has already shownvery high correlation with HR monitoring during free-playsituations in children (Welk & Corbin, 1995). The TriTrac-R3D can be used to distinguish differences in activitylevels between and within individuals (Westerterp, 1999),but it has limitations in quantifying EE (Jakicic et al.1999). The reliability of estimates of EE using the Tri-Trac-R3D has also been tested in adults using indirectcalorimetry as reference (Jakicic et al. 1999; Nicholset al. 1999). Inter-instrument and intra-instrumentreliability studies show a significant correlation (rangingfrom 0·73 to 0·92) and differences were not significantduring various modes and intensities of exercise (Nicholset al. 1999).
Our present study shows total EE and PA-EE resultsduring different level periods of PA, measured usingthe TriTrac-R3D, self-reporting activity diary and HR
Fig. 2. Difference against mean for physical activity (PA) energy expenditure (EE) results during all measurement periods assessed by heart-rate (HR) monitoring and axial accelerometer (TriTrac-R3D; Professional Products, Division of Reining International, Madison, WI, USA)(Bland & Altman (1986) plot). For details of subjects (n 20) and procedures, see Table 1 and p. 624. -–-, Mean value; -–-, + or 22 SD.
Table 3. Physical activity energy expenditure bias of the triaxial accelerometer (TriTrac-R3D*) compared with heart-rate monitoring†
Mean difference, HRmonitoring 2 TriTrac-R3D
(kJ/min)‡95 % CI for thebias (kJ/min)‡n Mean SD
PA-EE all periods 402 0·66 1·7 0·45, 0·83PA-EE physical activity periods 122 0·25 1·9 20·08, 0·58
PA-EE light–moderate physical activity 102 0·25 1·9 20·12, 2·42PA-EE hard physical activity 20 0·33 2·3 20·75, 1·42
PA-EE sedentary periods 258 0·87 1·4 0·66, 1·04
PA, physical activity; EE, energy expenditure.* Professional Products, Division of Reining International, Madison, WI, USA.† For details of subjects and procedures, see Table 1 and p. 624.‡ Mean difference and SD for PA-EE results and 95 % CI for the bias as described by Bland & Altman (1986).
G. Rodriguez et al.628
monitoring performed at the same time, under free-livingconditions in the same children population. Consideringtotal daily EE as a whole, the subject sample is probablytoo limited for a study in children aged 5·5 to 16·0 years.Dividing each measurement day into different PA periodsand considering periods of 10 min or more, 402 differentperiods with 122 PA periods could be analysed, allowingcorrelation and comparison between the three methods.Free-living conditions have generated a small group(n 20) of hard PA periods because an ordinary schooldaywas chosen and sustained periods of moderate to vigorousPA are not typical of young people’s PA patterns(Armstrong, 1998).
Our self-report activity diary results showed a good cor-relation with 24 h total EEHR and differences are not sig-nificant. Other previous studies have reported the sameresults compared with 2H2
18O results (Bratteby et al.1997a). When analysing total EE during different activityperiods, activity diary overestimates total EE during PAperiods and underestimates total EE during sedentaryperiods. Total EEPA during sleep periods is smaller butPA-EEPA sedentary values do not present differences;obviously, the cause of the underestimation of total EEPA
during sedentary periods is an underestimation of restingEEPA. We have considered that 1 MET of the compendiumof physical activities is the resting EEPA (Ainsworth et al.
Fig. 3. Difference against mean for physical activity (PA) energy expenditure (EE) results, after logarithmic transformation, during all measure-ment periods assessed by heart-rate (HR) monitoring and axial accelerometer (TriTrac-R3D; Professional Products, Division of ReiningInternational, Madison, WI, USA) (Bland & Altman (1986) plot). For details of subjects (n 20) and procedures, see Table 1 and p. 624. -–-,Mean value; -–- , + or 22 SD. y ¼ log10 (PA-EE by HR) 2 log10 (PA-EE by TriTrac-R3D); x ¼ ðlog10 (PA-EE by HRÞ þ log10 (PA-EE byTriTrac-R3D))/2.
Fig. 4. Difference against mean for physical activity (PA) energy expenditure (EE) results, after logarithmic transformation, during PA periodsassessed by heart-rate (HR) monitoring and axial accelerometer (TriTrac-3RD; Professional Products, Division of Reining International, Madi-son, WI, USA) (Bland & Altman (1986) plot). For details of subjects (n 20) and procedures, see Table 1 and p. 624. -–-, Mean value; -–-, + or22 SD. y ¼ log10 (PA-EE by HR) 2 log10 (PA-EE by TriTrac-R3D); x ¼ ðlog10 (PA-EE by HRÞ þ log10 (PA-EE by HRÞ þ log10 (PA-EE by Tri-Trac-R3D))/2.
TriTrac-R3D and heart-rate monitoring 629
1993). Similarly, Bouchard et al. (1983) used the sameequivalence and the energy cost of resting in bed or sleep-ing was 1 MET. Bratteby et al. (1997a ) improved thislatter method with a new denomination: PA ratios (ormultiples of resting EE); in that study, resting EE was cal-culated with a children prediction formula, which avoidedresting EEPA underestimation, but maintained categoricalactivity levels similar to Bouchard’s classification: restingin bed is 0·95 PA ratio or 0·95 resting EE value, walkingoutdoors represents 3·3 PA ratio, work of moderate inten-sity as dancing or cycling (17–20 km/h) represent 6·5 PAratio and running (10 km/h) or playing tennis 10 PAratio. There are at least two factors that could explain theoverestimation observed when total EEAD and PA-EEAD
are compared with HR monitoring results: (1) under free-living conditions, more than 80 % of children failed todemonstrate a single 10 min sustained period with HR$140 beats/min (Atkins et al. 1997); (2) on revising ourtotal EE data by calorimetry, when children were cyclingclose to the theoretical maximal heart beat rate, the maxi-mal total EE: resting EE ratio was 4·7 (SD 1·4) PA ratio.This suggests that MET given in the compendium are notwell adapted to activities usually accounted in free-livingconditions in children. Therefore, an activity diary can beused to compare the time spent at the different categoriesof PA in population groups and for estimating daily totalEE in epidemiological studies (Pols et al. 1997), but notfor measuring total EE or PA-EE during specific PAperiods.
The accelerometer utilizes the ‘vector magnitude’ move-ment count to calculate PA-EE for each min and providesan estimate of resting EE using formulas that were devel-oped for healthy adults. These equations overestimate rest-ing EE by 7 % in children (Bray et al. 1992; Epstein et al.1996) and the formula used to convert the vector magni-tude to EE from PA is a proprietary formula which willnot be released by the manufacturer. It is difficult toaccept the presentation of results which are based on ‘mys-terious’ calculations that cannot be a matter of discussion.This meant that we have studied in depth, on the one hand,the agreement between the TriTrac-R3D and HR monitor-ing in the assessment of PA-EE and, on the other hand, thecorrelation between the real movement variable generatedby the accelerometer (vector magnitude) and EE of activi-ties derived from HR monitoring. The results show a goodagreement between the two methods in relation with PA-EE measurements only during PA periods and high corre-lation in all subjects between vector magnitude and PA-EEfrom HR monitoring.
As shown in Tables 2 and 3, TriTrac-R3D significantlyunderestimates PA-EE during sedentary periods. This dis-crepancy has already been observed in adults, TriTrac-R3D underestimates EE compared with the calorimetrymethod (Jakicic et al. 1999). Shortcomings of this tech-nique are its low sensitivity to sedentary activities andthe inability to register static exercise (Bouten et al.1994, 1997). Another factor that could explain under-estimation of EE by the TriTrac-R3D is that diet-inducedthermogenesis is not considered with this technique.Diet-induced thermogenesis in children ranges from 5 to10 % total EE (Durnin, 1991) and during sedentary periods
from 16 almost 100 % PA-EE (Bouten et al. 1994). Calori-metry methods can consider diet-induced thermogenesiswhen individual regression equations of HR v. EE areperformed, but the accelerometer technique would need adiet-induced thermogenesis correction factor. This wouldbe possible for 24 h total EE measurements but difficultfor different PA period EE measurements in childrenunder free-living conditions.
In summary, there are no statistical differences between24 h total EE measured by HR monitoring and activitydiary under free-living conditions in children but, whendifferent periods of PA are considered, activity diaryunderestimates total EE during sedentary periods and over-estimates total EE and PA-EE during PA periods becauseof the high energy cost equivalence of activity levels.Otherwise, although agreement and correlation betweenTriTrac-R3D and HR monitoring are good during PAperiods, TriTrac-R3D cannot be considered as a validmethod for the assessment of total EE or PA-EE in childrenuntil adapted formulas are developed in further studies. Forthe assessment of children’s EE under free-living con-ditions, when compared with the HR method, TriTrac-R3D and the activity diary are not systematically accurateand must be used carefully depending on the purpose ofeach study.
Acknowledgements
This study was carried out in the Clinical InvestigationCentre of Lille University Hospital (CIC-9301-INSERM-CHU) and was supported by a grant of the French Ministryof Health (Programme Hospitalier de Recherche Clinique1997, no. 1901).
References
Ainsworth BE, Haskell WL, Leon AS, Jacobs DR Jr, MontoyeHJ, Sallis JF & Ptaffenberger RS Jr (1993) Compendium ofphysical activities: classification of energy costs of humanphysical activities. Medicine and Science in Sports andExercise 25, 71–80.
Armstrong N (1998) Young people’s physical activity patterns asassessed by heart-rate monitoring. Journal of Sports Sciences16, S9–S16.
Atkins S, Stratton G, Dugdill L & Reilly T (1997) The free livingphysical activity of schoolchildren: A longitudinal study. InChildren and Exercise XIX: Promoting Health and Well-Being, pp. 145–150 [N Armstrong, BJ Kirby and JR Welsman,editors]. London: E & FN Spon.
Beghin L, Budniok T, Vaksman G, Boussard-Delbecque L,Michaud L, Turck D & Gottrand F (2000) Simplification ofthe method of assessing daily and nightly energy expenditurein children, using heart-rate monitoring calibrated againstopen circuit indirect calorimetry. Clinical Nutrition 19, 425–435.
Bitar AM, Vermorel M, Fellmann N & Coudert J (1995) Twenty-four-hour energy expenditure and its components in prepubertalchildren as determined by whole-body indirect calorimetry andcompared with young adults. American Journal of ClinicalNutrition 62, 308–315.
Bland JM & Altman DG (1986) Statistical methods for assessingagreement between two methods of clinical measurement.Lancet 1, 307–310.
G. Rodriguez et al.630
Bouchard C, Tremblay A, Leblanc C, Lortie G, Savard R &Therinault G (1983) A method to assess energy expenditurein children and adults. American Journal of Clinical Nutrition37, 461–467.
Bouten CV, Koekkoek KTM, Verduin M, Kodde R & Janssen JD(1997) A triaxial accelerometer and portable data processingunit for the assessment of daily physical activity. IEEE Trans-actions on Biomedical Engineering 44, 136–147.
Bouten CV, Westerterp KR, Verduin M & Janssen JD (1994)Assessment of energy expenditure for physical activity usinga triaxial accelerometer. Medicine and Science in Sports andExercise 26, 1516–1523.
Bratteby LE, Sandhagen B, Fan H & Samuelson G (1997a) A 7-day activity diary for assessment of daily energy expenditurevalidated by the doubly labelled water method in adolescents.European Journal of Clinical Nutrition 51, 585–591.
Bratteby LE, Sandhagen B, Lotborn M & Samuelson G (1997b)Daily energy expenditure and physical activity assessed by anactivity diary in 374 randomly selected 15-year-old adoles-cents. European Journal of Clinical Nutrition 51, 592–600.
Bray MS, Morrow JR, Pivarnik JM & Bricker JT (1992) Caltracvalidity for estimating caloric expenditure with children.Pediatric Exercise Science 4, 166–179.
Durnin JVGA (1991) Practical estimates of energy requirements.Journal of Nutrition 121, 1907–1913.
Epstein LH, Paluch RA, Coleman KJ, Dominica V & Anderson K(1996) Determinants of physical activity in obese childrenassessed by accelerometer and self-report. Medicine andScience in Sports and Exercise 28, 1157–1164.
Gottrand F (1998) Mesure de la depense energetique dans les con-ditions habituelles de vie chez l’enfant (Energy expenditureassessment in children in free living conditions). Archievesde Pediatrie 5, 1020–1022.
Hemokinetics, Inc. (1993) TriTrac-R3D Research ErgometerOperations. Madison, WI: Hemokinetics, Inc.
Jakicic JM, Winters C, Lagally K, Ho J, Robertson RJ & WingRR (1999) The accuracy of the TriTrac-R3D accelerometerto estimate energy expenditure. Medicine and Science inSports and Exercise 31, 747–754.
Livingstone MBE, Coward WA, Prenctice AM, Davies PSW,Strain JJ, McKenna PG, Mahoney CA, White JA, Stewart
CM & Kerr MJJ (1992) Daily energy expenditure in free-living children: comparison of heart-rate monitoring with the(2H2
18O) doubly labelled water method. American Journal ofClinical Nutrition 56, 343–352.
McCrory MA, Mole PA, Nommsen-Rivers LA & Dewey KG(1997) Between-day and within-day variability in the relationbetween heart-rate and oxygen consumption: effect on the esti-mation of energy expenditure by heart-rate monitoring. AmericanJournal of Clinical Nutrition 66, 18–25.
Matarese LE (1997) Indirect calorimetry: Technical aspects.Journal of the American Dietetic Association 97, Suppl. 2,S154–S160.
Nichols JF, Morgan CG, Sarkin JA, Sallis JF & Calfas KJ (1999)Validity, reliability, and calibration of the TriTrac acceler-ometer as a measure of physical activity. Medicine and Sciencein Sports and Exercise 31, 908–912.
Pols MA, Peeters PHM, Ocke MC, Bueno-de-Mesquita HB,Slimani N, Kemper HCG & Collette HJA (1997) Relative val-idity and repeatability of a new questionnaire on physicalactivity. Preventive Medicine 26, 37–43.
Sallis JF (1991) Self-report measures of children’s physicalactivity. Journal of School Health 61, 215–219.
Schutz Y & Deurenberg P (1996) Energy metabolism: overviewof recent methods used in human studies. Annals of Nutritionand Metabolism 40, 183–193.
Turck D & Michaud L (1998) Cystic fibrosis: nutritional conse-quences and management. Baillere’s Clinical Gastroenterology12, 805–822.
Weir JB (1949) New methods for calculating metabolic rate withspecial reference to protein metabolism. Journal of Physiology109, 1–9.
Welk GJ & Corbin CB (1995) The validity of the TriTrac-R3Dactivity monitor for the assessment of physical activity inchildren. Research Quarterly for Exercise and Sport 66,1–8.
Westerterp KR (1999) Physical activity assessment with acceler-ometers. International Journal of Obesity 23, Suppl. 3,S45–S49.
World Health Organization (1985) Energy and Protein Require-ments. Report of a Joint FAO/WHO/UNU Expert Consultation.Technical Report Series no. 724 Geneva: WHO.
TriTrac-R3D and heart-rate monitoring 631
Copyright © 2022 FDOKUMEN