CNS Wound Healing Is Severely Depressed in Metallothionein I- and II-Deficient Mice
Upload
universityofmontrealCategory
view
2download
0
METABOLIC SYNDROMEDIABETOLOGY &
Turcot et al. Diabetology & Metabolic Syndrome 2013, 5:4http://www.dmsjournal.com/content/5/1/4
RESEARCH Open Access
Comparison of the dipeptidyl peptidase-4 genemethylation levels between severely obesesubjects with and without the metabolicsyndromeValérie Turcot1,2,3, André Tchernof2,3, Yves Deshaies4,5, Louis Pérusse1,6, Alexandre Bélisle7, Picard Marceau5,8,Frédéric-Simon Hould5,8, Stéfane Lebel5,8 and Marie-Claude Vohl1,2,3*
Abstract
Background: The dipeptidyl peptidase-4 (DPP4) enzyme is a novel adipokine potentially involved in thedevelopment of the metabolic syndrome (MetS). Previous observations demonstrated higher visceral adipose tissue(VAT) DPP4 gene expression in non-diabetic severely obese men with (MetS+) vs. without (MetS−) MetS. DPP4mRNA abundance in VAT correlated also with CpG site methylation levels (%Meth) localized within and near itsexon 2 (CpG94 to CpG102) in non-diabetic severely obese women, regardless of their MetS status. The actual studytested whether DPP4 %Meth levels in VAT are different between MetS− and MetS+ non-diabetic severely obesesubjects, whether variable metabolic and plasma lipid profiles are observed between DPP4 %Meth quartiles, andwhether correlation exists in DPP4 %Meth levels between VAT and white blood cells (WBCs).
Methods: DNA was extracted from the VAT of 26 men (MetS−: n=12, MetS+: n=14) and 79 women (MetS−: n=60;MetS+: n=19), as well as from WBCs in a sub-sample of 17 women (MetS−: n=9; MetS+: n=8). The %Meth levels ofCpG94 to CpG102 were assessed by pyrosequencing of sodium bisulfite-treated DNA. ANOVA analyses were used tocompare the %Meth of CpGs between MetS− and MetS+ groups, and to compare the metabolic phenotype andplasma lipid levels between methylation quartiles. Pearson correlation coefficient analyses were computed to testthe relationship between VAT and WBCs CpG94-102 %Meth levels.
Results: No difference was observed in CpG94-102 %Meth levels between MetS− and MetS+ subjects in VAT(P=0.67), but individuals categorized into CpG94-102 %Meth quartiles had variable plasma total-cholesterolconcentrations (P=0.04). The %Meth levels of four CpGs in VAT were significantly correlated with those observed inWBCs (r=0.55−0.59, P≤0.03).
Conclusions: This study demonstrated that %Meth of CpGs localized within and near the exon 2 of the DPP4 genein VAT are not associated with MetS status. The actual study also revealed an association between the %Meth ofthis locus with plasma total-cholesterol in severe obesity, which suggests a link between the DPP4 gene andplasma lipid levels.
Keywords: DNA methylation, Epigenetics, DPP4 gene, Visceral adipose tissue, White blood cells, Plasma cholesterol
* Correspondence: [email protected] of Nutraceuticals and Functional Foods (INAF), Pavillon desServices, Université Laval, 2440 Hochelaga Blvd, Québec G1V 0A6, Canada2Molecular Endocrinology and Genomics, CHUL Research Center, Québec,CanadaFull list of author information is available at the end of the article
© 2013 Turcot et al.; licensee BioMed Central Ltd. This is an Open Access article distributed under the terms of the CreativeCommons Attribution License (http://creativecommons.org/licenses/by/2.0), which permits unrestricted use, distribution, andreproduction in any medium, provided the original work is properly cited.

Turcot et al. Diabetology & Metabolic Syndrome 2013, 5:4 Page 2 of 10http://www.dmsjournal.com/content/5/1/4
BackgroundDeposition of fat preferentially in the abdominal com-partment is associated with metabolic and inflammatoryalterations often referred to as the metabolic syndrome(MetS) which considerably increases the risk of type 2diabetes and cardiovascular disease (CVD) [1]. Both un-healthy lifestyle and genetic predisposition may influencelipid storage and adipose tissue metabolism, as well astheir underlying metabolic abnormalities [2]. In a searchaimed at discovering novel candidate genes for MetS, agene expression profiling of visceral adipose tissue (VAT)of non-diabetic severely obese men revealed ~1.85 foldhigher expression of the dipeptidyl peptidase-4 (DPP4)gene in men MetS+ compared to MetS− [3,4].The DPP4 (or CD26) glycoprotein is a transmembrane
exoprotease expressed on epithelial cells, importantly inkidney, intestine and liver, as well as on endothelial cells,fibroblasts and lymphocytes (i.e. stimulated T-cells, B-cells and natural killer cells) [5-7]. Since DPP4 isknown to inactivate incretin hormones involved inglucose-dependent insulin secretion, pharmacologicalDPP4-inhibitors have been developed to improve thetreatment of type 2 diabetes [8]. Recently, Lamers et al.showed that DPP4 can be released from human differ-entiated adipocytes and can exert autocrine and para-crine effects by impairing insulin signalling [9]. Therate of DPP4 release from adipose tissue explants andsoluble DPP4 plasma levels were both higher in se-verely obese subjects MetS+ as compared to subjectsMetS−. The rate of DPP4 release was also significantlycorrelated with MetS phenotypes, such as waist circumfer-ence, insulin resistance, high-density lipoprotein (HDL)-cholesterol and triglycerides. The authors suggested thatDPP4 may be a novel biomarker linking obesity to MetS[9]. It is thus meaningful to consider the DPP4 gene as agood candidate for MetS development.A detailed genetic investigation previously conducted
at the DPP4 locus in severely obese individuals revealedthat DPP4 single nucleotide polymorphisms were incon-sistently associated with plasma triglycerides and total-cholesterol levels [4]. These polymorphisms were notsignificantly associated with DPP4 mRNA abundance inVAT of non-diabetic severely obese women [4]. How-ever, DPP4 expression levels were negatively correlatedwith cytosine methylation levels of CpG sites (CpGs)within and near the second exon of the DPP4 gene innon-diabetic severely obese women [10]. Percentage ofmethylation (%Meth) levels of the targeted CpGs werealso positively correlated with plasma HDL-cholesterollevels in women [10]. In view of these observations, wehypothesized that the %Meth levels of CpGs within andnear the second exon of the DPP4 gene in VAT are asso-ciated with MetS susceptibility in non-diabetic severelyobese subjects, which would then suggests its utility as a
potential biomarker of MetS. We also hypothesized thatDPP4 methylation levels may be associated with plasmacholesterol levels, as opposed to DPP4 polymorphisms[4], and that its methylation in peripheral white bloodcells (WBCs) may serve as a surrogate measure of VATmethylation at the DPP4 locus.This study was thus undertaken to test whether the
%Meth levels of the targeted CpGs at the DPP4 locus inVAT are different between MetS− and MetS+ severelyobese men and women and to verify whether the quar-tiles of %Meth are associated with metabolic and plasmalipid profiles. Correlations between DPP4 %Meth levelsin VAT and WBCs were tested in a sub-sample of se-verely obese women.
Material and methodsPatient selectionThe study subjects were severely obese Caucasian menand women undergoing a biliopancreatic diversion withsleeve gastrectomy to treat obesity at the Centre deRecherche de l’Institut Universitaire de Cardiologie et dePneumologie de Québec (Québec City, Québec, Canada)from June 2000 to June 2009. The diagnosis of type 2diabetes mellitus was made prior to surgery [11]. Bodyweight, height, waist circumference, resting systolic anddiastolic blood pressure were measured using standar-dized procedures [12]. The day of surgery, fasting bloodsamples were drawn into EDTA-containing tubes andcentrifuged for WBCs DNA extraction and for plasmalipid and glucose concentration measurements [12].VAT from the greater omentum was sampled during thesurgery according to a standardized protocol, as previ-ously reported [13,14]. All subjects provided a writteninformed consent to participate in this study whichreceived the approval of the Université Laval EthicsCommittee.Non-diabetic subjects not using any medication to
treat MetS components who were fulfilling minimal(MetS−: one to two MetS criteria) or maximal (MetS+:five MetS criteria) MetS criteria were selected. Based onthe criteria from the International Diabetes Federationdefinition (IDF) [15], the selected MetS− subjectswere centrally obese (waist circumference ≥88 cm forwomen and ≥102 cm for men; USA cutoff values[16]) with no more than one additional MetS criter-ion defined hereafter. On the opposite, the selectedMetS+ subjects had to meet the five MetS criteria:waist circumference ≥88 cm for women and ≥102 cmfor men, fasting plasma glucose ≥5.6 mmol/L, HDL-cholesterol <1.29 mmol/L for women and <1.03 mmol/Lfor men, triglycerides ≥1.7 mmol/L, systolic blood pres-sure (SBP) ≥130 mmHg or diastolic blood pressure(DBP) ≥85 mmHg. Postmenopausal women were excludedfrom this study in order to avoid potential confounding

Turcot et al. Diabetology & Metabolic Syndrome 2013, 5:4 Page 3 of 10http://www.dmsjournal.com/content/5/1/4
factors on DPP4 gene expression and %Meth levels.Since there were fewer men meeting the five MetS cri-teria for the MetS+ group, the selection was extendedto centrally obese men meeting at least three additionalMetS criteria (i.e. total of four to five MetS criteria formen). To avoid significant differences between groups,MetS− vs. MetS+ men were matched for age, waist cir-cumference and smoking. Thus, 28 men and 83 womenwere selected for this study. Considering the availabilityof VAT samples, we ended up with a total of 26 men(MetS−: n=12; MetS+: n=14) and 79 women (MetS−:n=60; MetS+: n=19) for the “VAT experiment”. Relativeto the “WBCs experiment”, 28 non-smoking womenwere selected from the 79 women and matched for ageand waist circumference between MetS− and MetS+groups. Considering the availability of WBCs, we endedup with a sub-sample of 17 women (MetS−: n=9; MetS+:n=8) for whom VAT biopsies and WBCs were both avail-able. Men were not considered for the “WBCs experi-ment” because of low WBCs availability.
Analysis of DPP4 CpG methylation in VAT and peripheralWBCsDNA was extracted from VAT using the DNeasy Blood& Tissue kit (QIAGEN, Mississauga, Ontario, Canada)and from peripheral WBCs using the GenElute™ Blood
DPP4 gene (RefSeq NM_001935.3)
TSS
5′′′′UTR
−561
CpG island (1275 b
−582
5′
…ACTCCCACCTGCAAATCCTGCTGCCTC+391
a
b
GAAACTGGGGCCACACGCTTCCCTCTAAT94
GACACCGTGGAAGGTTCTTCTGGGACTG96 97
ACCATCATCACCGTGCCCGTGGTTCTGC
AACATTTGAAAAAGATAGGACAGTTGGAG 10100199
ACGCTAAGGGAAACGAGGGATTTTGCGTG
GTAGCTGAGAAGGCTTCCCAGTTGTTG…+724
Figure 1 Location of the 9 CpGs analyzed for their%Meth levels at ththe DPP4 locus were determined relatively to the first adenine (+1) from the AThe DPP4 promoter CpG island was localized using the NCBI Map Viewer puband surrounding the 9 CpG sites is located between the 391 and 724 bases achr2: 162929768-162930101 on the minus DNA strand as obtained using theBold bases represent the exon 2 of the DPP4 gene and arrows are the designReference Sequence.
Genomic DNA kit (Sigma, St Louis, MO, USA), asrecommended by the manufacturers. DNA extracts werestored at −80ºC until quantitative methylation analysisusing pyrosequencing technology from QIAGEN [17],which was performed by the McGill University and Gen-ome Quebec Innovation Center (MUGQIC) GenotypingPlatform team (Montréal, Québec, Canada). Treatmentof DNA with sodium bisulfite, PCR amplifications andthe pyrosequencing process were performed as previ-ously described [10]. Primers designed by the MUGQICGenotyping Platform team were used to amplify the endof the DPP4 promoter CpG island (Figure 1a and 1b)which covered the nine CpGs that have previously beenassociated with DPP4 gene expression in VAT as well aswith plasma HDL-cholesterol levels in severely obesewomen [10]. The targeted region was amplified in twofragments using the following primer sequences: firstfragment; forward, 50-Biotin-AAT TGG GAA GTT TTTTTA GTT A-30, reverse, 50-TAC TAA ATA CTA CTACCC TTA TCA CCA TCA TCA C-30, sequencing, 50-AAT AAA ACA ATT AAA ACT CAA ATC A; secondfragment; forward, 50-AAG AAG GAG TTT GAT TTGAGT TTT AAT TG-30, reverse, 50-Biotin-TCC CACCTA CAA ATC CTA CTA CC-30, sequencing, 50- TGTTTT AAA TTT ATT GTT TTT GTT TAG-30. PCRconditions may be obtained upon request. The mean%
+495
p; 102 CpGs)
+583 +693
3′
CpG94 to CpG102
TGGAGCAGCCCCGACCCTCCTACG
TGGACTTGATCTGCTCGGCTTGCA95
CTGGGTGCTGCTGCGCTTGTC
TGAACAAAGGCAGTAAGTTTGA98
CTCAGGTCAGGCTCCGTCTTACC201
GGGTTGGACCAGTGCCCCGAAGT
e DPP4 locus. (a) Delimitation of the 50UTR, exons and CpG island atTG translation start site (TSS) based on the DPP4 transcript NM_001935.3.lic database in a previous study [10]. (b) The DNA sequence displayedfter the TSS of the DPP4 gene. The chromosomal location corresponds toHuman Build 37.3 (http://www.ncbi.nlm.nih.gov/genome/guide/human/).ed sequencing primers along with the sequencing direction. RefSeq,

Turcot et al. Diabetology & Metabolic Syndrome 2013, 5:4 Page 4 of 10http://www.dmsjournal.com/content/5/1/4
Meth for combined CpG94 to CpG102 (CpG94-102) inVAT and WBCs was calculated for each subject and usedin the analyses along with individual CpG %Meth levels.Additionally, DPP4 mRNA abundance in VAT was mea-
sured in the study subjects. Total RNA was extracted fromVAT to generate the cDNA [3] and used for the quantita-tive real-time reverse transcriptase polymerase chain reac-tion (qRT-PCR) analysis, as previously described [18].Amplification efficiencies were validated and normalizedto ribosomal 18S and quantities of target gene were calcu-lated according to a standard curve. Primers and TaqManprobes overlapping exons 23 and 24 of the DPP4 gene(transcript NM_001935) and those for the ribosomal18S were obtained from Applied Biosystems (DPP4:Hs00897398_m1; r18S: Hs99999901_s1). NormalizedDPP4 gene expression levels were available for 104 sub-jects (one excluded outlier; a MetS− woman).
Statistical analysisNon-normally distributed phenotypes, %Meth levels ofindividual CpGs and CpG94-102, as well as DPP4 mRNAabundance in the 105 subjects selected for the “VAT ex-periment” were log10- or negative inverse-transformed.The normality of the distribution of all these variableswas also verified independently in the sub-sample of 17women selected for the “WBCs experiment” and theywere transformed when needed. The general linear model(GLM) and the type III sum of squares in SAS were usedto perform ANOVA analyses to compare the phenotypelevels, the %Meth of individual CpGs and CpG94-102, andDPP4 mRNA abundance between MetS− and MetS+
Table 1 Characteristics of the subjects for DPP4%Meth analys
VAT experimen
Phenotypes MetS−
Number of men/women (n) 12/60
Number of MetS criteria (n) 1-2
Smokers (n) 13 (18.1%)
Age (years) 35.3±8.8
BMI (kg/m2) 49.7±8.4
Waist circumference (cm) 131.3±18.7
Fasting glucose (mmol/L) 4.87±0.36**
Triglycerides (mmol/L) 1.12±0.32**
HDL-cholesterol (mmol/L) 1.50±0.27**
LDL-cholesterol (mmol/L) 2.80±0.77
Total-cholesterol (mmol/L) 4.81±0.84
SBP (mmHg) 127.3±13.2**
DBP (mmHg) 76.9±6.0**
Mean±SD or n are presented in the table.All the study subjects were non-diabetic and were not using any medication to treaNon-normally distributed phenotypes were transformed for the comparison of meaindex (BMI) (−1/(X)), fasting glucose (−1/(X)), triglycerides (−1/(1+X)) and DBP (−1/(X**P < 0.01.
groups while including sex in the model (adjustment forthe sex effect). Associations between DPP4 %Meth levelsand metabolic profile, as well as with plasma lipid levelswere tested by dividing the study subjects into quartilesbased on their CpG94-102 %Meth levels and by comparingmean phenotype levels between quartiles using ANOVAanalyses as described above while including potentialconfounding factors in the model (see the Results sec-tion for more details about adjustments). When a signifi-cant effect of CpG94-102%Meth quartiles on phenotypeswas noted, least square means were used to identifyquartiles which are significantly discordant in the cor-responding phenotype. For the MetS status, logisticregression analysis was performed to compare MetS−and MetS+ frequencies between CpG94-102 %Methquartiles. Finally, a Pearson correlation coefficient wascomputed to test the relationship between VAT andWBCs CpG94-102 %Meth levels in the sub-sample of 17women selected for the “WBCs experiment”. The statis-tically significant P-value was set at 0.05. Statistical ana-lyses were performed using SAS software version 9.2(SAS Institute, Cary, NC).
ResultsCharacteristics of the study subjects in MetS− and MetS+groupsThe characteristics of the subjects are presented inTable 1 for each type of experiment (VAT and WBCs).As expected, no significant difference was observedregarding smoking habit, age and anthropometric valuesbetween MetS groups, as well as with total- and low-
is in VAT and WBCs
t WBCs experiment
MetS+ MetS− MetS+
14/19 0/9 0/8
4-5 1-2 5
5 (16.1%) 0 0
35.4±7.5 35.6±8.4 36.1±8.5
53.6±13.2 47.6±5.6 47.4±5.4
145.0±22.0 132.3±10.5 125.6±10.3
6.23±0.71** 4.90±0.38** 6.05±0.43**
2.73±1.50** 1.19±0.34** 3.19±2.14**
1.02±0.16** 1.48±0.30** 0.99±0.19**
3.03±0.90 2.70±0.64 2.74±1.06
5.17±0.89 4.72±0.72 4.93±1.03
149.5±15.6** 138.8±17.0 145.4±9.0
93.1±9.6** 78.9±5.8** 95.9±6.7**
t MetS components.n phenotype levels between MetS groups; for the VAT experiment: body mass)); for the WBCs experiment: triglycerides (log10X) and HDL-cholesterol (log10X).
Turcot et al. Diabetology & Metabolic Syndrome 2013, 5:4 Page 5 of 10http://www.dmsjournal.com/content/5/1/4
density lipoprotein (LDL)-cholesterol levels. In contrastand by design, all other MetS-related phenotypes (i.e.fasting glucose, triglycerides, HDL-cholesterol, SBP andDBP) differed between MetS− and MetS+ groups whensex was included in the model (P < 0.01), except for SBPlevel in the “WBCs experiment” which was not signifi-cantly different between MetS groups (P = 0.34).
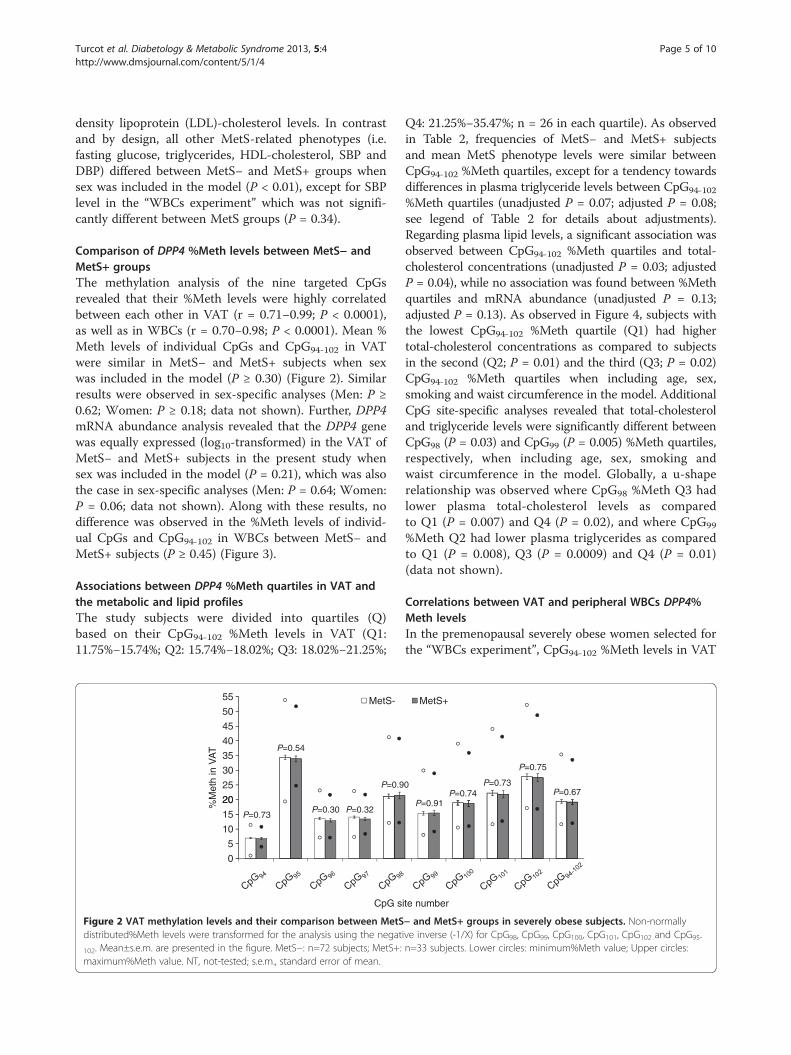
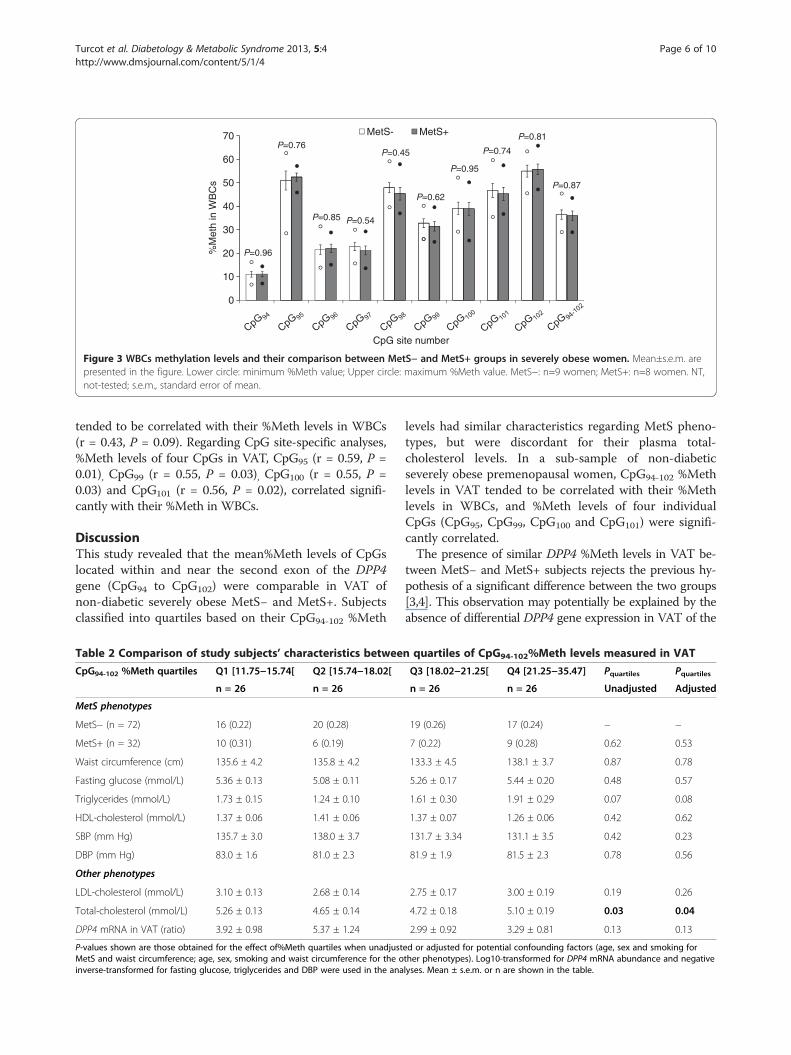
Comparison of DPP4 %Meth levels between MetS− andMetS+ groupsThe methylation analysis of the nine targeted CpGsrevealed that their %Meth levels were highly correlatedbetween each other in VAT (r = 0.71−0.99; P < 0.0001),as well as in WBCs (r = 0.70−0.98; P < 0.0001). Mean %Meth levels of individual CpGs and CpG94-102 in VATwere similar in MetS− and MetS+ subjects when sexwas included in the model (P ≥ 0.30) (Figure 2). Similarresults were observed in sex-specific analyses (Men: P ≥0.62; Women: P ≥ 0.18; data not shown). Further, DPP4mRNA abundance analysis revealed that the DPP4 genewas equally expressed (log10-transformed) in the VAT ofMetS− and MetS+ subjects in the present study whensex was included in the model (P = 0.21), which was alsothe case in sex-specific analyses (Men: P = 0.64; Women:P = 0.06; data not shown). Along with these results, nodifference was observed in the %Meth levels of individ-ual CpGs and CpG94-102 in WBCs between MetS− andMetS+ subjects (P ≥ 0.45) (Figure 3).
Associations between DPP4 %Meth quartiles in VAT andthe metabolic and lipid profilesThe study subjects were divided into quartiles (Q)based on their CpG94-102 %Meth levels in VAT (Q1:11.75%−15.74%; Q2: 15.74%−18.02%; Q3: 18.02%−21.25%;
20
25
30
35
40
45
50
55
%M
eth
in V
AT
MetS-
P=0.54
P=0.9
0
5
10
15
20
CpG s
P=0.73P=0.30 P=0.32
Figure 2 VAT methylation levels and their comparison between MetSdistributed%Meth levels were transformed for the analysis using the negat
102. Mean±s.e.m. are presented in the figure. MetS−: n=72 subjects; MetS+:maximum%Meth value. NT, not-tested; s.e.m., standard error of mean.
Q4: 21.25%−35.47%; n = 26 in each quartile). As observedin Table 2, frequencies of MetS− and MetS+ subjectsand mean MetS phenotype levels were similar betweenCpG94-102 %Meth quartiles, except for a tendency towardsdifferences in plasma triglyceride levels between CpG94-102
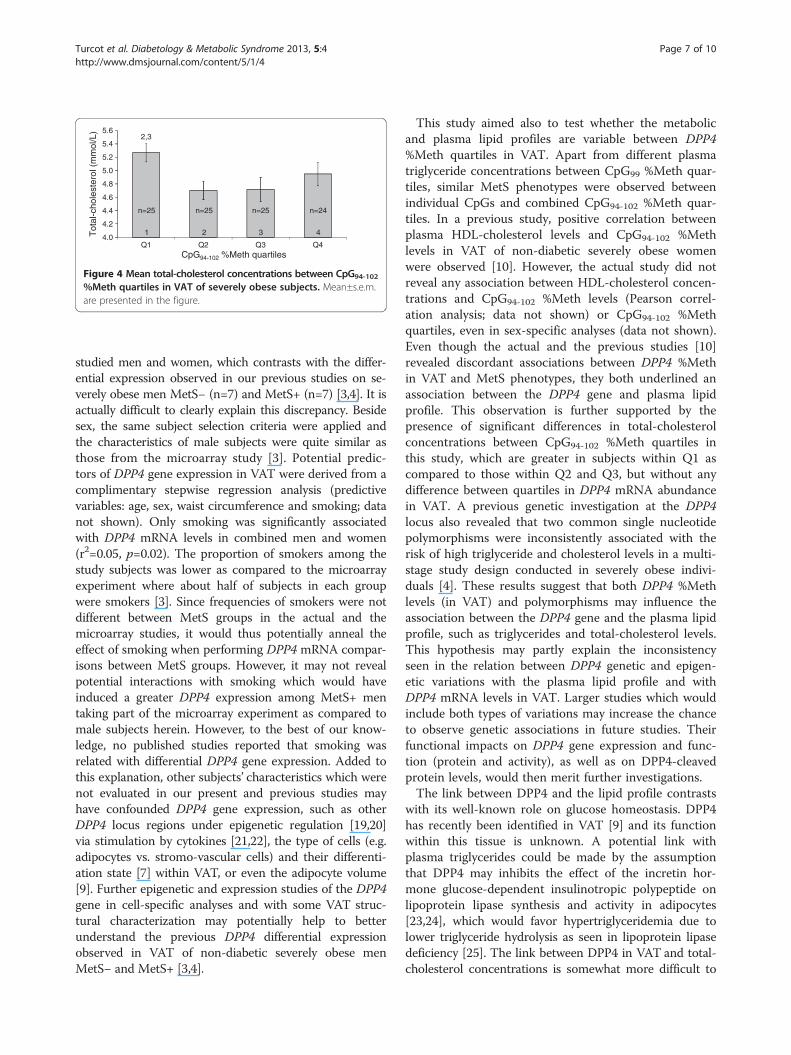
%Meth quartiles (unadjusted P = 0.07; adjusted P = 0.08;see legend of Table 2 for details about adjustments).Regarding plasma lipid levels, a significant association wasobserved between CpG94-102 %Meth quartiles and total-cholesterol concentrations (unadjusted P = 0.03; adjustedP = 0.04), while no association was found between %Methquartiles and mRNA abundance (unadjusted P = 0.13;adjusted P = 0.13). As observed in Figure 4, subjects withthe lowest CpG94-102 %Meth quartile (Q1) had highertotal-cholesterol concentrations as compared to subjectsin the second (Q2; P = 0.01) and the third (Q3; P = 0.02)CpG94-102 %Meth quartiles when including age, sex,smoking and waist circumference in the model. AdditionalCpG site-specific analyses revealed that total-cholesteroland triglyceride levels were significantly different betweenCpG98 (P = 0.03) and CpG99 (P = 0.005) %Meth quartiles,respectively, when including age, sex, smoking andwaist circumference in the model. Globally, a u-shaperelationship was observed where CpG98 %Meth Q3 hadlower plasma total-cholesterol levels as comparedto Q1 (P = 0.007) and Q4 (P = 0.02), and where CpG99
%Meth Q2 had lower plasma triglycerides as comparedto Q1 (P = 0.008), Q3 (P = 0.0009) and Q4 (P = 0.01)(data not shown).
Correlations between VAT and peripheral WBCs DPP4%Meth levelsIn the premenopausal severely obese women selected forthe “WBCs experiment”, CpG94-102 %Meth levels in VAT
MetS+
0
P=0.91P=0.74
P=0.73
P=0.75
P=0.67
ite number
− and MetS+ groups in severely obese subjects. Non-normallyive inverse (-1/X) for CpG98, CpG99, CpG100, CpG101, CpG102 and CpG95-
n=33 subjects. Lower circles: minimum%Meth value; Upper circles:
30
40
50
60
70
%M
eth
in W
BC
s
MetS- MetS+P=0.76
P=0.85 P=0.54
P=0.45
P=0.62
P=0.95
P=0.74
P=0.81
P=0.87
0
10
20
CpG site number
P=0.96
Figure 3 WBCs methylation levels and their comparison between MetS− and MetS+ groups in severely obese women. Mean±s.e.m. arepresented in the figure. Lower circle: minimum %Meth value; Upper circle: maximum %Meth value. MetS−: n=9 women; MetS+: n=8 women. NT,not-tested; s.e.m., standard error of mean.
Turcot et al. Diabetology & Metabolic Syndrome 2013, 5:4 Page 6 of 10http://www.dmsjournal.com/content/5/1/4
tended to be correlated with their %Meth levels in WBCs(r = 0.43, P = 0.09). Regarding CpG site-specific analyses,%Meth levels of four CpGs in VAT, CpG95 (r = 0.59, P =0.01), CpG99 (r = 0.55, P = 0.03), CpG100 (r = 0.55, P =0.03) and CpG101 (r = 0.56, P = 0.02), correlated signifi-cantly with their %Meth in WBCs.
DiscussionThis study revealed that the mean%Meth levels of CpGslocated within and near the second exon of the DPP4gene (CpG94 to CpG102) were comparable in VAT ofnon-diabetic severely obese MetS− and MetS+. Subjectsclassified into quartiles based on their CpG94-102 %Meth
Table 2 Comparison of study subjects’ characteristics betwee
CpG94-102 %Meth quartiles Q1 [11.75−15.74[ Q2 [15.74−18.02[
n = 26 n = 26
MetS phenotypes
MetS− (n = 72) 16 (0.22) 20 (0.28)
MetS+ (n = 32) 10 (0.31) 6 (0.19)
Waist circumference (cm) 135.6 ± 4.2 135.8 ± 4.2
Fasting glucose (mmol/L) 5.36 ± 0.13 5.08 ± 0.11
Triglycerides (mmol/L) 1.73 ± 0.15 1.24 ± 0.10
HDL-cholesterol (mmol/L) 1.37 ± 0.06 1.41 ± 0.06
SBP (mm Hg) 135.7 ± 3.0 138.0 ± 3.7
DBP (mm Hg) 83.0 ± 1.6 81.0 ± 2.3
Other phenotypes
LDL-cholesterol (mmol/L) 3.10 ± 0.13 2.68 ± 0.14
Total-cholesterol (mmol/L) 5.26 ± 0.13 4.65 ± 0.14
DPP4 mRNA in VAT (ratio) 3.92 ± 0.98 5.37 ± 1.24
P-values shown are those obtained for the effect of%Meth quartiles when unadjustMetS and waist circumference; age, sex, smoking and waist circumference for the oinverse-transformed for fasting glucose, triglycerides and DBP were used in the ana
levels had similar characteristics regarding MetS pheno-types, but were discordant for their plasma total-cholesterol levels. In a sub-sample of non-diabeticseverely obese premenopausal women, CpG94-102 %Methlevels in VAT tended to be correlated with their %Methlevels in WBCs, and %Meth levels of four individualCpGs (CpG95, CpG99, CpG100 and CpG101) were signifi-cantly correlated.The presence of similar DPP4 %Meth levels in VAT be-
tween MetS− and MetS+ subjects rejects the previous hy-pothesis of a significant difference between the two groups[3,4]. This observation may potentially be explained by theabsence of differential DPP4 gene expression in VAT of the
n quartiles of CpG94-102%Meth levels measured in VAT
Q3 [18.02−21.25[ Q4 [21.25−35.47] Pquartiles Pquartiles
n = 26 n = 26 Unadjusted Adjusted
19 (0.26) 17 (0.24) − −
7 (0.22) 9 (0.28) 0.62 0.53
133.3 ± 4.5 138.1 ± 3.7 0.87 0.78
5.26 ± 0.17 5.44 ± 0.20 0.48 0.57
1.61 ± 0.30 1.91 ± 0.29 0.07 0.08
1.37 ± 0.07 1.26 ± 0.06 0.42 0.62
131.7 ± 3.34 131.1 ± 3.5 0.42 0.23
81.9 ± 1.9 81.5 ± 2.3 0.78 0.56
2.75 ± 0.17 3.00 ± 0.19 0.19 0.26
4.72 ± 0.18 5.10 ± 0.19 0.03 0.04
2.99 ± 0.92 3.29 ± 0.81 0.13 0.13
ed or adjusted for potential confounding factors (age, sex and smoking forther phenotypes). Log10-transformed for DPP4 mRNA abundance and negativelyses. Mean ± s.e.m. or n are shown in the table.
5.6
5.4
5.2
5.0
4.8
2,3
Q1 Q2 Q3 Q4
Tot
al-c
hole
ster
ol (
mm
ol/L
)
CpG94-102 %Meth quartiles
4.6
4.4
4.2
4.0
n=25 n=25 n=25 n=24
1 2 3 4
Figure 4 Mean total-cholesterol concentrations between CpG94-102
%Meth quartiles in VAT of severely obese subjects. Mean±s.e.m.are presented in the figure.
Turcot et al. Diabetology & Metabolic Syndrome 2013, 5:4 Page 7 of 10http://www.dmsjournal.com/content/5/1/4
studied men and women, which contrasts with the differ-ential expression observed in our previous studies on se-verely obese men MetS− (n=7) and MetS+ (n=7) [3,4]. It isactually difficult to clearly explain this discrepancy. Besidesex, the same subject selection criteria were applied andthe characteristics of male subjects were quite similar asthose from the microarray study [3]. Potential predic-tors of DPP4 gene expression in VAT were derived from acomplimentary stepwise regression analysis (predictivevariables: age, sex, waist circumference and smoking; datanot shown). Only smoking was significantly associatedwith DPP4 mRNA levels in combined men and women(r2=0.05, p=0.02). The proportion of smokers among thestudy subjects was lower as compared to the microarrayexperiment where about half of subjects in each groupwere smokers [3]. Since frequencies of smokers were notdifferent between MetS groups in the actual and themicroarray studies, it would thus potentially anneal theeffect of smoking when performing DPP4 mRNA compar-isons between MetS groups. However, it may not revealpotential interactions with smoking which would haveinduced a greater DPP4 expression among MetS+ mentaking part of the microarray experiment as compared tomale subjects herein. However, to the best of our know-ledge, no published studies reported that smoking wasrelated with differential DPP4 gene expression. Added tothis explanation, other subjects’ characteristics which werenot evaluated in our present and previous studies mayhave confounded DPP4 gene expression, such as otherDPP4 locus regions under epigenetic regulation [19,20]via stimulation by cytokines [21,22], the type of cells (e.g.adipocytes vs. stromo-vascular cells) and their differenti-ation state [7] within VAT, or even the adipocyte volume[9]. Further epigenetic and expression studies of the DPP4gene in cell-specific analyses and with some VAT struc-tural characterization may potentially help to betterunderstand the previous DPP4 differential expressionobserved in VAT of non-diabetic severely obese menMetS− and MetS+ [3,4].
This study aimed also to test whether the metabolicand plasma lipid profiles are variable between DPP4%Meth quartiles in VAT. Apart from different plasmatriglyceride concentrations between CpG99 %Meth quar-tiles, similar MetS phenotypes were observed betweenindividual CpGs and combined CpG94-102 %Meth quar-tiles. In a previous study, positive correlation betweenplasma HDL-cholesterol levels and CpG94-102 %Methlevels in VAT of non-diabetic severely obese womenwere observed [10]. However, the actual study did notreveal any association between HDL-cholesterol concen-trations and CpG94-102 %Meth levels (Pearson correl-ation analysis; data not shown) or CpG94-102 %Methquartiles, even in sex-specific analyses (data not shown).Even though the actual and the previous studies [10]revealed discordant associations between DPP4 %Methin VAT and MetS phenotypes, they both underlined anassociation between the DPP4 gene and plasma lipidprofile. This observation is further supported by thepresence of significant differences in total-cholesterolconcentrations between CpG94-102 %Meth quartiles inthis study, which are greater in subjects within Q1 ascompared to those within Q2 and Q3, but without anydifference between quartiles in DPP4 mRNA abundancein VAT. A previous genetic investigation at the DPP4locus also revealed that two common single nucleotidepolymorphisms were inconsistently associated with therisk of high triglyceride and cholesterol levels in a multi-stage study design conducted in severely obese indivi-duals [4]. These results suggest that both DPP4 %Methlevels (in VAT) and polymorphisms may influence theassociation between the DPP4 gene and the plasma lipidprofile, such as triglycerides and total-cholesterol levels.This hypothesis may partly explain the inconsistencyseen in the relation between DPP4 genetic and epigen-etic variations with the plasma lipid profile and withDPP4 mRNA levels in VAT. Larger studies which wouldinclude both types of variations may increase the chanceto observe genetic associations in future studies. Theirfunctional impacts on DPP4 gene expression and func-tion (protein and activity), as well as on DPP4-cleavedprotein levels, would then merit further investigations.The link between DPP4 and the lipid profile contrasts
with its well-known role on glucose homeostasis. DPP4has recently been identified in VAT [9] and its functionwithin this tissue is unknown. A potential link withplasma triglycerides could be made by the assumptionthat DPP4 may inhibits the effect of the incretin hor-mone glucose-dependent insulinotropic polypeptide onlipoprotein lipase synthesis and activity in adipocytes[23,24], which would favor hypertriglyceridemia due tolower triglyceride hydrolysis as seen in lipoprotein lipasedeficiency [25]. The link between DPP4 in VAT and total-cholesterol concentrations is somewhat more difficult to

Turcot et al. Diabetology & Metabolic Syndrome 2013, 5:4 Page 8 of 10http://www.dmsjournal.com/content/5/1/4
delineate, but some assumptions could be made whenconsidering DPP4 action within other tissues and plasma.Inhibition of DPP4 with vitaglipin has shown to increasethe active form of glucagon-like peptide-1 along with a re-duction in cholesterol content of chylomicrons after a fat-rich diet in type 2 diabetic subjects [26], which suggestsan indirect link between DPP4 function and cholesterolabsorption. Tahara et al. have also recently observed adose response relationship between DPP4 protein levelsand plasma total-cholesterol concentrations. However, ina multiple stepwise regression analysis HDL-cholesterol,but not total-cholesterol, was independently associatedwith DPP4 plasma levels in a Japanese population [27].DPP4 is also recognized as a potential peptidase involvedin the truncation of the neuropeptide Y (NPY), whichwould modulate its receptor preference [6]. The commonSNP Leu(7)-to-Pro(7) (T1128C) in the NPY gene has pre-viously been associated with higher synthesis and secre-tion of NPY [28], and also with higher total- and LDL-cholesterol concentrations in serum of obese Finnish andDutch subjects [29]. It is unknown how NPY may berelated with serum total-cholesterol concentrations in thisstudy [29], but these results suggest that an indirect linkbetween DPP4 and total-cholesterol may exist via themodulation of NPY function. Furthermore, a recent studyconducted by Zhang et al. also demonstrated an associ-ation between DPP4 expression and protein levels of twoenzymes involved in cholesterol biosynthesis in melanomacells [30], but it is unknown if this relation could beobserved in other tissues, such as in the liver. Hence, theseobservations demonstrate few evidences relating theDPP4 enzyme with the lipid profile, which may be furtherclarified in other independent studies.Currently, there is concern as to whether less-
invasively obtainable human samples (i.e. blood and sal-iva) would be good surrogates for disease-associated epi-genetic biomarkers, such concerns being raised becauseof the tissue specificity of both epigenetic patterns[31,32] and disease-associated epigenetic variations [33].In the actual study, correlations were observed betweenthe %Meth levels of some targeted CpGs in VAT andWBCs of a sub-sample of severely obese women. Al-though cell types expressing DPP4 mRNA in VAT andWBCs were not investigated in this study, lymphocytesare suspected to be a common link between the twocompartments because they are DPP4-expressing cells(i.e. stimulated T-cells, B-cells and natural killer cells)[5-7] and they are present in both obese VAT [34-36]and peripheral WBCs. This hypothesis may thus partlyexplain the relationship seen between WBCs and VAT%Meth levels.One study limitation needs to be outlined, which
regards the heterogeneity of MetS definition to categorizesubjects as being affected or not by obesity-related
metabolic complications. To overcome this issue, theselection of non-diabetic individuals in the extremes ofthe MetS definition has been attempted in this study.However, it may not take into account other metabolic (e.g.insulin resistance) and VAT physiological (e.g. adipocytesize, immune cell infiltration) parameters that may betterdiscriminate those expressing DPP4 at greater levels in theirVAT [3,4]. As previously underlined, further epigenetic andexpression studies at the DPP4 locus would be neededto clarify what controls VAT DPP4 expression andwhether its methylation levels influence gene expres-sion in a cell-specific fashion.In conclusion, this study demonstrated that %Meth of
CpGs localized within and near the exon 2 of the DPP4gene in VAT are not associated with MetS status. Theactual study also revealed an association between theDPP4 %Meth with plasma total-cholesterol levels insevere obesity, which suggests a link between the DPP4gene and plasma lipid metabolism. Finally, since the %Meth levels of some of the targeted DPP4 CpGs in VATcorrelated with those observed in WBCs, peripheralWBCs may potentially be used as a surrogate measurefor DPP4 methylation analysis in further epidemiologicalstudies in relation with the plasma lipid profile.
AbbreviationsCpG: Cytosine-phosphate-guanine; CVD: Cardiovascular disease;DPP4: Dipeptidyl peptidase-4; GLM: General linear model; HDL: High-densitylipoprotein; IDF: International Diabetes Federation; LDL: Low-densitylipoprotein; MetS: Metabolic syndrome; MetS−: without metabolic syndrome;MetS+: with metabolic syndrome; NPY: Neuropeptide Y; %Meth: percentageof methylation; qRT-PCR: quantitative real-time reverse transcriptasepolymerase chain reaction; SBP: Systolic blood pressure; DBP: Diastolic bloodpressure; VAT: Visceral adipose tissue; WBCs: White blood cells.
Competing interestsThe authors declare that they have no competing interests.
Authors’ contributionsVT participated to the study design, performed the statistical analyses,interpreted the data and drafted the manuscript. AT, YD, and LP participatedto the elaboration of the study design. AB was in charge of the methylationanalysis. PM, FSH and SL sampled blood and adipose tissue from the studysubjects. MCV conceived and designed the study. All authors read andapproved the final manuscript.
AcknowledgmentsThis study was supported by a grant from the Canadian Institutes of HealthResearch (CIHR: MOP-209380). The severely obese cohort was supported,over the years, by the Université Laval Research Chair in Obesity. We expressour gratitude to surgeons Simon Marceau, Simon Biron, Odette Lescelleurand Laurent Biertho of the Institut Universitaire de Cardiologie et dePneumologie de Québec who have sampled adipose tissues for this project,as well as Paule Marceau for patients’ database management. Many thanksare also expressed to Fanny Therrien and Caroline Nadeau for their help inadipose tissue banking management, as well as to Alain Houde andCatherine Raymond for DNA banking management and laboratory analysessupport. Valérie Turcot received studentship awards from the CanadianInstitutes of Health Research and the Fonds de la Recherche en Santé duQuébec. André Tchernof is a research scholar from the Fonds de laRecherche en Santé du Québec and holder of a Research Chair in Bariatricand Metabolic Surgery. Marie-Claude Vohl holds a Tier 1 Canada ResearchChair in Genomics Applied to Nutrition and Health.
Turcot et al. Diabetology & Metabolic Syndrome 2013, 5:4 Page 9 of 10http://www.dmsjournal.com/content/5/1/4
Author details1Institute of Nutraceuticals and Functional Foods (INAF), Pavillon desServices, Université Laval, 2440 Hochelaga Blvd, Québec G1V 0A6, Canada.2Molecular Endocrinology and Genomics, CHUL Research Center, Québec,Canada. 3Department of Food Sciences and Nutrition, Université Laval,Québec, Canada. 4Department of Medicine, Université Laval, Québec,Canada. 5Centre de Recherche de l’Institut Universitaire de Cardiologie et dePneumologie de Québec, Québec, Canada. 6Department of Social andPreventive Medicine, Université Laval, Québec, Canada. 7Genotyping PlatformTeam, McGill University and Genome Quebec Innovation Center, Montréal,Canada. 8Department of Surgery, Université Laval, Québec, Canada.
Received: 29 November 2012 Accepted: 29 January 2013Published: 4 February 2013
References1. Mathieu P, Lemieux I, Despres JPMathieu P, Lemieux I, Despres JP: Obesity,
inflammation, and cardiovascular risk. Clin Pharmacol Ther 2010,87:407–416.
2. Teran-Garcia M, Bouchard CTeran-Garcia M, Bouchard C: Genetics of themetabolic syndrome. Appl Physiol Nutr Metab 2007, 32:89–114.
3. Bouchard L, Tchernof A, Deshaies Y, Marceau S, Lescelleur O, Biron S, VohlMCBouchard L, Tchernof A, Deshaies Y, Marceau S, Lescelleur O, Biron S,Vohl MC: ZFP36: a promising candidate gene for obesity-relatedmetabolic complications identified by converging genomics. Obes Surg2007, 17:372–382.
4. Bouchard L, Faucher G, Tchernof A, Deshaies Y, Lebel S, Hould FS, MarceauP, Vohl MCBouchard L, Faucher G, Tchernof A, Deshaies Y, Lebel S, HouldFS, Marceau P, Vohl MC: Comprehensive genetic analysis of thedipeptidyl peptidase-4 gene and cardiovascular disease risk factors inobese individuals. Acta Diabetol 2009, 46:13–21.
5. Abbott CA, Baker E, Sutherland GR, McCaughan GWAbbott CA, Baker E,Sutherland GR, McCaughan GW: Genomic organization, exact localization,and tissue expression of the human CD26 (dipeptidyl peptidase IV)gene. Immunogenetics 1994, 40:331–338.
6. Cordero OJ, Salgado FJ, Nogueira MCordero OJ, Salgado FJ, Nogueira M: Onthe origin of serum CD26 and its altered concentration in cancerpatients. Cancer Immunol Immunother 2009, 58:1723–1747.
7. Lambeir AM, Durinx C, Scharpe S, De Meester ILambeir AM, Durinx C,Scharpe S, De Meester I: Dipeptidyl-peptidase IV from bench to bedside:an update on structural properties, functions, and clinical aspects of theenzyme DPP IV. Crit Rev Clin Lab Sci 2003, 40:209–294.
8. Monami M, Iacomelli I, Marchionni N, Mannucci EMonami M, Iacomelli I,Marchionni N, Mannucci E: Dipeptydil peptidase-4 inhibitors in type 2diabetes: a meta-analysis of randomized clinical trials. Nutr MetabCardiovasc Dis 2010, 20:224–235.
9. Lamers D, Famulla S, Wronkowitz N, Hartwig S, Lehr S, Ouwens DM, EckardtK, Kaufman JM, Ryden M, Muller S, Hanisch FG, Ruige J, Arner P, Sell H, EckelJLamers D, Famulla S, Wronkowitz N, Hartwig S, Lehr S, Ouwens DM,Eckardt K, Kaufman JM, Ryden M, Muller S, Hanisch FG, Ruige J, Arner P, SellH, Eckel J: Dipeptidyl peptidase 4 is a novel adipokine potentially linkingobesity to the metabolic syndrome. Diabetes 2011, 60:1917–1925.
10. Turcot V, Bouchard L, Faucher G, Tchernof A, Deshaies Y, Perusse L, BelisleA, Marceau S, Biron S, Lescelleur O, Biertho L, Vohl MCTurcot V, Bouchard L,Faucher G, Tchernof A, Deshaies Y, Perusse L, Belisle A, Marceau S, Biron S,Lescelleur O, Biertho L, Vohl MC: DPP4 gene DNA methylation in theomentum is associated with its gene expression and plasma lipid profilein severe obesity. Obesity (Silver Spring) 2011, 19:388–395.
11. The Expert Committee on the Diagnosis and Classification of DiabetesMellitusThe Expert Committee on the Diagnosis and Classification ofDiabetes Mellitus: Report of the expert committee on the diagnosis andclassification of diabetes mellitus. Diabetes Care 2003, 26(Suppl 1):S5–20.
12. Vohl MC, Houde A, Lebel S, Hould FS, Marceau PVohl MC, Houde A, Lebel S,Hould FS, Marceau P: Effects of the peroxisome proliferator-activatedreceptor-gamma co-activator-1 Gly482Ser variant on features of themetabolic syndrome. Mol Genet Metab 2005, 86:300–306.
13. Marceau P, Hould FS, Simard S, Lebel S, Bourque RA, Potvin M, BironSMarceau P, Hould FS, Simard S, Lebel S, Bourque RA, Potvin M, Biron S:Biliopancreatic diversion with duodenal switch. World J Surg 1998,22:947–954.
14. Vohl MC, Sladek R, Robitaille J, Gurd S, Marceau P, Richard D, Hudson TJ,Tchernof AVohl MC, Sladek R, Robitaille J, Gurd S, Marceau P, Richard D,Hudson TJ, Tchernof A: A survey of genes differentially expressed insubcutaneous and visceral adipose tissue in men. Obes Res 2004,12:1217–1222.
15. Alberti KG, Zimmet P, Shaw JAlberti KG, Zimmet P, Shaw J: Metabolicsyndrome--a new world-wide definition. A consensus statement fromthe international diabetes federation. Diabet Med 2006, 23:469–480.
16. Expert Panel on Detection EaToHBCiAExpert Panel on Detection EaToHBCiA:Executive summary of the third report of the national cholesteroleducation program (NCEP) expert panel on detection, evaluation, andtreatment of high blood cholesterol in adults (adult treatment panel III).JAMA 2001, 285:2486–2497.
17. England R, Pettersson MEngland R, Pettersson M: Pyro Q-CpG: quantitativeanalysis of methylation in multiple CpG sites by Pyrosequencing.Nature Methods 2005, 2. doi:10.1038.
18. Turcot V, Bouchard L, Faucher G, Tchernof A, Deshaies Y, Perusse L, MarceauP, Hould FS, Lebel S, Vohl MCTurcot V, Bouchard L, Faucher G, Tchernof A,Deshaies Y, Perusse L, Marceau P, Hould FS, Lebel S, Vohl MC: Apolymorphism of the interferon-gamma-inducible protein 30 gene isassociated with hyperglycemia in severely obese individuals. Hum Genet2012, 131:57–66.
19. McGuinness C, Wesley UVMcGuinness C, Wesley UV: Dipeptidyl peptidaseIV (DPPIV), a candidate tumor suppressor gene in melanomas is silencedby promoter methylation. Front Biosci 2008, 13:2435–2443.
20. Tsuji T, Sugahara K, Tsuruda K, Uemura A, Harasawa H, Hasegawa H,Hamaguchi Y, Tomonaga M, Yamada Y, Kamihira STsuji T, Sugahara K,Tsuruda K, Uemura A, Harasawa H, Hasegawa H, Hamaguchi Y, TomonagaM, Yamada Y, Kamihira S: Clinical and oncologic implications inepigenetic down-regulation of CD26/dipeptidyl peptidase IV in adult T-cell leukemia cells. Int J Hematol 2004, 80:254–260.
21. Stefanovic V, Ardaillou N, Vlahovic P, Placier S, Ronco P, ArdaillouRStefanovic V, Ardaillou N, Vlahovic P, Placier S, Ronco P, Ardaillou R:Interferon-gamma induces dipeptidylpeptidase IV expression in humanglomerular epithelial cells. Immunology 1993, 80:465–470.
22. Yamabe T, Takakura K, Sugie K, Kitaoka Y, Takeda S, Okubo Y, Teshigawara K,Yodoi J, Hori TYamabe T, Takakura K, Sugie K, Kitaoka Y, Takeda S, Okubo Y,Teshigawara K, Yodoi J, Hori T: Induction of the 2B9 antigen/dipeptidylpeptidase IV/CD26 on human natural killer cells by IL-2, IL-12 or IL-15.Immunology 1997, 91:151–158.
23. Knapper JM, Puddicombe SM, Morgan LM, Fletcher JMKnapper JM,Puddicombe SM, Morgan LM, Fletcher JM: Investigations into the actionsof glucose-dependent insulinotropic polypeptide and glucagon-likepeptide-1(7-36)amide on lipoprotein lipase activity in explants of ratadipose tissue. J Nutr 1995, 125:183–188.
24. Yip RG, Wolfe MMYip RG, Wolfe MM: GIP biology and fat metabolism.Life Sci 2000, 66:91–103.
25. Mead JR, Irvine SA, Ramji DPMead JR, Irvine SA, Ramji DP: Lipoproteinlipase: structure, function, regulation, and role in disease. J Mol Med (Berl)2002, 80:753–769.
26. Matikainen N, Manttari S, Schweizer A, Ulvestad A, Mills D, Dunning BE,Foley JE, Taskinen MRMatikainen N, Manttari S, Schweizer A, Ulvestad A,Mills D, Dunning BE, Foley JE, Taskinen MR: Vildagliptin therapy reducespostprandial intestinal triglyceride-rich lipoprotein particles in patientswith type 2 diabetes. Diabetologia 2006, 49:2049–2057.
27. Tahara N, Yamagishi SI, Takeuchi M, Tahara A, Kaifu K, Ueda S, Okuda S,Imaizumi TTahara N, Yamagishi SI, Takeuchi M, Tahara A, Kaifu K, Ueda S,Okuda S, Imaizumi T: Serum levels of advanced glycation end products(AGEs) are independently correlated with circulating levels of dipeptidylpeptidase-4 (DPP-4) in humans. Clin Biochem 2012, doi:10.1016/j.clinbiochem.2012.11.023. in press.
28. Mitchell GC, Wang Q, Ramamoorthy P, Whim MDMitchell GC, Wang Q,Ramamoorthy P, Whim MD: A common single nucleotide polymorphismalters the synthesis and secretion of neuropeptide Y. J Neurosci 2008,28:14428–14434.
29. Karvonen MK, Pesonen U, Koulu M, Niskanen L, Laakso M, Rissanen A,Dekker JM, Hart LM, Valve R, Uusitupa MIKarvonen MK, Pesonen U, Koulu M,Niskanen L, Laakso M, Rissanen A, Dekker JM, Hart LM, Valve R, Uusitupa MI:Association of a leucine(7)-to-proline(7) polymorphism in the signalpeptide of neuropeptide Y with high serum cholesterol and LDLcholesterol levels. Nat Med 1998, 4:1434–1437.
Turcot et al. Diabetology & Metabolic Syndrome 2013, 5:4 Page 10 of 10http://www.dmsjournal.com/content/5/1/4
30. Zhang F, Dai X, Wang YZhang F, Dai X, Wang Y: 5-Aza-20-deoxycytidineinduced growth inhibition of leukemia cells through modulatingendogenous cholesterol biosynthesis. Mol Cell Proteomics 2012, 11:M111.
31. Irizarry RA, Ladd-Acosta C, Wen B, Wu Z, Montano C, Onyango P, Cui H,Gabo K, Rongione M, Webster M, Ji H, Potash JB, Sabunciyan S, FeinbergAPIrizarry RA, Ladd-Acosta C, Wen B, Wu Z, Montano C, Onyango P, Cui H,Gabo K, Rongione M, Webster M, Ji H, Potash JB, Sabunciyan S, Feinberg AP:The human colon cancer methylome shows similar hypo- andhypermethylation at conserved tissue-specific CpG island shores.Nat Genet 2009, 41:178–186.
32. Rakyan VK, Down TA, Thorne NP, Flicek P, Kulesha E, Graf S, Tomazou EM,Backdahl L, Johnson N, Herberth M, Howe KL, Jackson DK, Miretti MM,Fiegler H, Marioni JC, Birney E, Hubbard TJ, Carter NP, Tavare S, BeckSRakyan VK, Down TA, Thorne NP, Flicek P, Kulesha E, Graf S, Tomazou EM,Backdahl L, Johnson N, Herberth M, et al: An integrated resource forgenome-wide identification and analysis of human tissue-specificdifferentially methylated regions (tDMRs). Genome Res 2008,18:1518–1529.
33. Rakyan VK, Down TA, Balding DJ, Beck SRakyan VK, Down TA, Balding DJ,Beck S: Epigenome-wide association studies for common humandiseases. Nat Rev Genet 2011, 12:529–541.
34. O’Rourke RW, Metcalf MD, White AE, Madala A, Winters BR, Maizlin II, JobeBA, Roberts CT Jr, Slifka MK, Marks DLO’Rourke RW, Metcalf MD, White AE,Madala A, Winters BR, Maizlin II, Jobe BA, Roberts CT Jr, Slifka MK, Marks DL:Depot-specific differences in inflammatory mediators and a role for NKcells and IFN-gamma in inflammation in human adipose tissue. Int J Obes(Lond) 2009, 33:978–990.
35. Winer DA, Winer S, Shen L, Wadia PP, Yantha J, Paltser G, Tsui H, Wu P,Davidson MG, Alonso MN, Leong HX, Glassford A, Caimol M, Kenkel JA,Tedder TF, McLaughlin T, Miklos DB, Dosch HM, Winer DA, Engleman EG,Winer S, Shen L, Wadia PP, Yantha J, Paltser G, Tsui H, Wu P, Davidson MG,Alonso MN, Leong HX, Glassford A, Caimol M, Kenkel JA, et al: B cellspromote insulin resistance through modulation of T cells andproduction of pathogenic IgG antibodies. Nat Med 2011, 17:610–617.
36. Winer S, Chan Y, Paltser G, Truong D, Tsui H, Bahrami J, Dorfman R, Wang Y,Zielenski J, Mastronardi F, Maezawa Y, Drucker DJ, Engleman E, Winer D,Dosch HMWiner S, Chan Y, Paltser G, Truong D, Tsui H, Bahrami J, DorfmanR, Wang Y, Zielenski J, Mastronardi F, Maezawa Y, Drucker DJ, Engleman E,Winer D, Dosch HM: Normalization of obesity-associated insulinresistance through immunotherapy. Nat Med 2009, 15:921–929.
doi:10.1186/1758-5996-5-4Cite this article as: Turcot et al.: Comparison of the dipeptidylpeptidase-4 gene methylation levels between severely obese subjectswith and without the metabolic syndrome. Diabetology & MetabolicSyndrome 2013 5:4.
Submit your next manuscript to BioMed Centraland take full advantage of:
• Convenient online submission
• Thorough peer review
• No space constraints or color figure charges
• Immediate publication on acceptance
• Inclusion in PubMed, CAS, Scopus and Google Scholar
• Research which is freely available for redistribution
Submit your manuscript at www.biomedcentral.com/submit
Copyright © 2022 FDOKUMEN