Comparison of the 1-Year Visual and Anatomical ... - MDPI
11
pharmaceuticals Article Comparison of the 1-Year Visual and Anatomical Outcomes between Subthreshold Red (670 nm) and Yellow (577 nm) Micro-Pulse Laser Treatment for Diabetic Macular Edema Wataru Kikushima *, Taiyo Shijo, Yukiko Furuhata, Yoichi Sakurada and Kenji Kashiwagi Citation: Kikushima, W.; Shijo, T.; Furuhata, Y.; Sakurada, Y.; Kashiwagi, K. Comparison of the 1-Year Visual and Anatomical Outcomes between Subthreshold Red (670 nm) and Yellow (577 nm) Micro-Pulse Laser Treatment for Diabetic Macular Edema. Pharmaceuticals 2021, 14, 1100. https://doi.org/10.3390/ph14111100 Academic Editor: Réjean Couture Received: 23 September 2021 Accepted: 27 October 2021 Published: 28 October 2021 Publisher’s Note: MDPI stays neutral with regard to jurisdictional claims in published maps and institutional affil- iations. Copyright: © 2021 by the authors. Licensee MDPI, Basel, Switzerland. This article is an open access article distributed under the terms and conditions of the Creative Commons Attribution (CC BY) license (https:// creativecommons.org/licenses/by/ 4.0/). Department of Ophthalmology, University of Yamanashi, Chuo 409-3898, Yamanashi, Japan; [email protected] (T.S.); [email protected] (Y.F.); [email protected] (Y.S.); [email protected] (K.K.) * Correspondence: [email protected]; Tel.: +81-55-273-9657 Abstract: We investigated the efficacy and safety of red (670 nm) subthreshold micropulse laser (SMPL) treatment for diabetic macular edema (DME) and compared the 1-year treatment outcomes of red and yellow (577 nm) SMPL for DME. A medical chart review was performed in 43 consecutive eyes of 35 patients who underwent red or yellow SMPL treatment for DME and were followed up for 12 months. There were 26 and 17 eyes in the yellow and red SMPL groups, respectively. The mean best-corrected visual acuity (BCVA) was maintained throughout the follow-up period of 12 months in the yellow and red SMPL groups (p = 0.39, p = 0.70, respectively). The central retinal thickness (CRT) measured by spectral-domain optical coherence tomography (SD-OCT) was significantly decreased at 12 months from baseline in the yellow and red SMPL groups (p = 0.047, p = 0.03, respectively). Although the amount of CRT reduction in the red SMPL group was significantly greater than that in the yellow SMPL group at 8 months from baseline (p = 0.02), the significance disappeared at the final follow-up period (p = 0.44). The red SMPL maintained the BCVA in patients with center- involving DME. The mean CRT in the red SMPL group significantly decreased, and the amount of CRT reduction was equivalent to that in the yellow SMPL group. Keywords: diabetic macular edema; subthreshold red micropulse laser treatment; subthreshold yellow micropulse laser treatment; diabetic retinopathy 1. Introduction Diabetic macular edema (DME) is a complicated pathology that can appear even in the early stage of diabetic retinopathy and can cause a mild to moderate reduction in the visual acuity of the patients [1]. Several treatment options have been reported in past studies to handle DME, including partial photocoagulation [2], sub-Tenon’s/intravitreral triamcinolone acetonide injection [3], intravitreal anti-vascular endothelial growth factor (VEGF) agent injection [4,5], vitrectomy [6,7], intravitreal dexamethasone implant [8,9], and combinations of these treatment protocols [10]. Subthreshold micropulse laser treat- ment (SMPL) was first reported by Friberg and Karatza as a non-invasive laser treatment directly targeting the macular area with a wavelength of 810 nm (infrared SMPL) for DME [11]. Many studies have reported favorable results of infrared SMPL for treating DME, both functionally and anatomically [12–20]. Yellow SMPL with a wavelength of 577 nm is another option of SMPL and has been compared with infrared SMPL in several studies [21–26]. Few studies reported the comparison of the effects of SMPL and other treat- ment options for DME. Wu et al. reported that the combination of intravitreal anti-VEGF therapy and conventional laser photocoagulation therapy was more effective than infrared SMPL monotherapy in improving the vision of patients with DME [27]. On another front, Akkaya et al. reported that yellow SMPL treatment was superior to intravitreal anti-VEGF therapy in DME patients with relatively better BCVA for increasing visual acuity and de- creasing central retinal thickness (CRT) for 12 months [28]. However, there is no consensus Pharmaceuticals 2021, 14, 1100. https://doi.org/10.3390/ph14111100 https://www.mdpi.com/journal/pharmaceuticals
-
Upload
khangminh22 -
Category
Documents
-
view
0 -
download
0
Transcript of Comparison of the 1-Year Visual and Anatomical ... - MDPI

pharmaceuticals
Article
Comparison of the 1-Year Visual and Anatomical Outcomesbetween Subthreshold Red (670 nm) and Yellow (577 nm)Micro-Pulse Laser Treatment for Diabetic Macular Edema
Wataru Kikushima *, Taiyo Shijo, Yukiko Furuhata, Yoichi Sakurada and Kenji Kashiwagi
�����������������
Citation: Kikushima, W.; Shijo, T.;
Furuhata, Y.; Sakurada, Y.; Kashiwagi,
K. Comparison of the 1-Year Visual
and Anatomical Outcomes between
Subthreshold Red (670 nm) and
Yellow (577 nm) Micro-Pulse Laser
Treatment for Diabetic Macular
Edema. Pharmaceuticals 2021, 14, 1100.
https://doi.org/10.3390/ph14111100
Academic Editor: Réjean Couture
Received: 23 September 2021
Accepted: 27 October 2021
Published: 28 October 2021
Publisher’s Note: MDPI stays neutral
with regard to jurisdictional claims in
published maps and institutional affil-
iations.
Copyright: © 2021 by the authors.
Licensee MDPI, Basel, Switzerland.
This article is an open access article
distributed under the terms and
conditions of the Creative Commons
Attribution (CC BY) license (https://
creativecommons.org/licenses/by/
4.0/).
Department of Ophthalmology, University of Yamanashi, Chuo 409-3898, Yamanashi, Japan;[email protected] (T.S.); [email protected] (Y.F.); [email protected] (Y.S.);[email protected] (K.K.)* Correspondence: [email protected]; Tel.: +81-55-273-9657
Abstract: We investigated the efficacy and safety of red (670 nm) subthreshold micropulse laser(SMPL) treatment for diabetic macular edema (DME) and compared the 1-year treatment outcomesof red and yellow (577 nm) SMPL for DME. A medical chart review was performed in 43 consecutiveeyes of 35 patients who underwent red or yellow SMPL treatment for DME and were followed up for12 months. There were 26 and 17 eyes in the yellow and red SMPL groups, respectively. The meanbest-corrected visual acuity (BCVA) was maintained throughout the follow-up period of 12 months inthe yellow and red SMPL groups (p = 0.39, p = 0.70, respectively). The central retinal thickness (CRT)measured by spectral-domain optical coherence tomography (SD-OCT) was significantly decreasedat 12 months from baseline in the yellow and red SMPL groups (p = 0.047, p = 0.03, respectively).Although the amount of CRT reduction in the red SMPL group was significantly greater than thatin the yellow SMPL group at 8 months from baseline (p = 0.02), the significance disappeared atthe final follow-up period (p = 0.44). The red SMPL maintained the BCVA in patients with center-involving DME. The mean CRT in the red SMPL group significantly decreased, and the amount ofCRT reduction was equivalent to that in the yellow SMPL group.
Keywords: diabetic macular edema; subthreshold red micropulse laser treatment; subthresholdyellow micropulse laser treatment; diabetic retinopathy
1. Introduction
Diabetic macular edema (DME) is a complicated pathology that can appear even inthe early stage of diabetic retinopathy and can cause a mild to moderate reduction in thevisual acuity of the patients [1]. Several treatment options have been reported in paststudies to handle DME, including partial photocoagulation [2], sub-Tenon’s/intravitreraltriamcinolone acetonide injection [3], intravitreal anti-vascular endothelial growth factor(VEGF) agent injection [4,5], vitrectomy [6,7], intravitreal dexamethasone implant [8,9],and combinations of these treatment protocols [10]. Subthreshold micropulse laser treat-ment (SMPL) was first reported by Friberg and Karatza as a non-invasive laser treatmentdirectly targeting the macular area with a wavelength of 810 nm (infrared SMPL) forDME [11]. Many studies have reported favorable results of infrared SMPL for treatingDME, both functionally and anatomically [12–20]. Yellow SMPL with a wavelength of577 nm is another option of SMPL and has been compared with infrared SMPL in severalstudies [21–26]. Few studies reported the comparison of the effects of SMPL and other treat-ment options for DME. Wu et al. reported that the combination of intravitreal anti-VEGFtherapy and conventional laser photocoagulation therapy was more effective than infraredSMPL monotherapy in improving the vision of patients with DME [27]. On another front,Akkaya et al. reported that yellow SMPL treatment was superior to intravitreal anti-VEGFtherapy in DME patients with relatively better BCVA for increasing visual acuity and de-creasing central retinal thickness (CRT) for 12 months [28]. However, there is no consensus
Pharmaceuticals 2021, 14, 1100. https://doi.org/10.3390/ph14111100 https://www.mdpi.com/journal/pharmaceuticals

Pharmaceuticals 2021, 14, 1100 2 of 11
regarding the optimal wavelength of SMPL for DME. This study aimed to investigate theefficacy and safety of a novel treatment protocol of SMPL with a wavelength of 670 nm(red SMPL) for DME and compare the visual and anatomical outcomes of red and yellowSMPL for DME.
2. Results2.1. Changes in logMAR BCVA
A total of 43 eyes of 35 patients were included in this study. Table 1 shows the baselinecharacteristics of the patients and a comparison of those in the yellow and red SMPL groups.There were 26 eyes in the yellow SMPL group and 17 eyes in the red SMPL group. There wasno significant difference in the baseline characteristics between the two groups. Figure 1shows a representative case of DME treated with red SMPL. Figure 2 shows the changein the mean logarithm of the minimal angle resolution (logMAR) best-corrected visualacuity (BCVA) in all patients. The mean BCVA in all patients was 0.38 ± 0.29 at baseline,maintained throughout the follow-up period, and was 0.40 ± 0.33 at 12 months (p = 0.55).Figure 3 shows the change in the mean logMAR BCVA between the two groups. In theyellow SMPL group, the mean BCVA was 0.40 ± 0.33 at baseline, which was maintainedat 12 months from baseline, resulting in a mean BCVA of 0.45 ± 0.35 (p = 0.39). In the redSMPL group, the mean BCVA was 0.35 ± 0.22 at baseline and was maintained throughoutthe follow-up period, resulting in 0.33 ± 0.28 at 12 months from baseline (p = 0.70).
We performed a multivariate linear regression analysis to investigate the visual prog-nostic factors associated with BCVA at 12 months. As a result, only baseline logMAR BCVAwas associated with the final BCVA at 12 months (shown in Table 2).
Table 1. Baseline characteristics of the patients and a comparison of those in the yellow and red SMPL groups.
All Patients(n = 43)
Yellow SMPL(n = 26)
Red SMPL(n = 17)
p Value(Yellow vs. Red)
Age 66.0 ± 10.1 65.3 ± 11.4 67.1 ± 7.9 0.97Gender Male (%) 29(67.4%) 18(69.2%) 11(64.7%) 0.76
Duration of DM (months) 121 ± 100 134 ± 106 100 ± 90 0.28Hb A1c (%) 7.0 ± 1.2 7.0 ± 1.4 6.9 ± 0.8 0.82Mean BCVA 0.38 ± 0.29 0.40 ± 0.33 0.35 ± 0.22 0.96Mean CRT 475 ± 171 449 ± 169 515 ± 171 0.19
Treatment-naïve eye (%) 14(32.6%) 8(30.8%) 6(35.3%) 0.76
BCVA: best-corrected visual acuity, CRT: central retinal thickness, DM: diabetes mellitus, Hb A1c: hemoglobin A1c, SMPL: subthresholdmicropulse laser.
Table 2. Multivariate linear regression analysis of factors associated with mean BCVA at 12 months.
Variables β-Coefficient p-Value
Age −1.3 × 10⁻⁴ 0.98
Male gender −0.04 0.64
Baseline logMAR BCVA 0.77 1.0 × 10⁻⁵
Baseline CRT −8.6 × 10⁻⁵ 0.73
HbA1c 0.067 0.055
Duration of DM 1.4 × 10⁻⁵ 0.97
Past treatment history for DME 0.02 0.78
SMPL (yellow: 0, red: 1) −0.07 0.42
BCVA: best-corrected visual acuity, CRT: central retinal thickness, DM: diabetes mellitus, DME: diabetic macular edema, logMAR: logarithmof the minimal angle resolution, SMPL: subthreshold micropulse laser.

Pharmaceuticals 2021, 14, 1100 3 of 11Pharmaceuticals 2021, 14, x FOR PEER REVIEW 3 of 11
Figure 1. A representative case of a 57-year-old male with diabetic macular edema (DME) treated by red subthreshold micropulse laser (SMPL). (A) Color fundus photography of the left eye at base-line reveals center-involving DME. His left visual acuity was 0.7 on the decimal scale. (B) Color fundus photography of the left eye at 12 months from baseline reveals complete resolution of DME. No visible laser spot is detectable. His left vision improved to 1.0 on the decimal scale. (C) A spectral-domain optical coherence tomography (SD-OCT) image of the left macula at baseline demonstrates the cystoid macular edema (CME) with a disrupted ellipsoid zone. Central retinal thickness (CRT) was 673 µm. (D) An SD-OCT image of the left macula at 12 months from baseline demonstrates complete resolution of CME and improved integrity of the ellipsoid zone. CRT drastically decreased to 237 µm. (E) Fundus autofluorescence of the left macula at 12 months from baseline shows no visible laser spot. Dark spots around the fovea represent retinal hemorrhages shown in the color fundus photograph (B).
Figure 2. Changes in the mean logarithm of the minimal angle resolution (logMAR) best-corrected visual acuity (BCVA) in all patients. The mean BCVA in all patients was 0.38 ± 0.29 at baseline and was 0.42 ± 0.31, 0.41 ± 0.29, 0.40 ± 0.30, 0.40 ± 0.33, and 0.40 ± 0.33 at 2, 4, 6, 8, 10, and 12 months, respectively. The mean logMAR BCVA was consistent at 12 months from baseline (p = 0.55).
Figure 1. A representative case of a 57-year-old male with diabetic macular edema (DME) treated byred subthreshold micropulse laser (SMPL). (A) Color fundus photography of the left eye at baselinereveals center-involving DME. His left visual acuity was 0.7 on the decimal scale. (B) Color fundusphotography of the left eye at 12 months from baseline reveals complete resolution of DME. Novisible laser spot is detectable. His left vision improved to 1.0 on the decimal scale. (C) A spectral-domain optical coherence tomography (SD-OCT) image of the left macula at baseline demonstratesthe cystoid macular edema (CME) with a disrupted ellipsoid zone. Central retinal thickness (CRT)was 673 µm. (D) An SD-OCT image of the left macula at 12 months from baseline demonstratescomplete resolution of CME and improved integrity of the ellipsoid zone. CRT drastically decreasedto 237 µm. (E) Fundus autofluorescence of the left macula at 12 months from baseline shows novisible laser spot. Dark spots around the fovea represent retinal hemorrhages shown in the colorfundus photograph (B).
Pharmaceuticals 2021, 14, x FOR PEER REVIEW 3 of 11
Figure 1. A representative case of a 57-year-old male with diabetic macular edema (DME) treated by red subthreshold micropulse laser (SMPL). (A) Color fundus photography of the left eye at base-line reveals center-involving DME. His left visual acuity was 0.7 on the decimal scale. (B) Color fundus photography of the left eye at 12 months from baseline reveals complete resolution of DME. No visible laser spot is detectable. His left vision improved to 1.0 on the decimal scale. (C) A spectral-domain optical coherence tomography (SD-OCT) image of the left macula at baseline demonstrates the cystoid macular edema (CME) with a disrupted ellipsoid zone. Central retinal thickness (CRT) was 673 µm. (D) An SD-OCT image of the left macula at 12 months from baseline demonstrates complete resolution of CME and improved integrity of the ellipsoid zone. CRT drastically decreased to 237 µm. (E) Fundus autofluorescence of the left macula at 12 months from baseline shows no visible laser spot. Dark spots around the fovea represent retinal hemorrhages shown in the color fundus photograph (B).
Figure 2. Changes in the mean logarithm of the minimal angle resolution (logMAR) best-corrected visual acuity (BCVA) in all patients. The mean BCVA in all patients was 0.38 ± 0.29 at baseline and was 0.42 ± 0.31, 0.41 ± 0.29, 0.40 ± 0.30, 0.40 ± 0.33, and 0.40 ± 0.33 at 2, 4, 6, 8, 10, and 12 months, respectively. The mean logMAR BCVA was consistent at 12 months from baseline (p = 0.55).
Figure 2. Changes in the mean logarithm of the minimal angle resolution (logMAR) best-correctedvisual acuity (BCVA) in all patients. The mean BCVA in all patients was 0.38 ± 0.29 at baseline andwas 0.42 ± 0.31, 0.41 ± 0.29, 0.40 ± 0.30, 0.40 ± 0.33, and 0.40 ± 0.33 at 2, 4, 6, 8, 10, and 12 months,respectively. The mean logMAR BCVA was consistent at 12 months from baseline (p = 0.55).

Pharmaceuticals 2021, 14, 1100 4 of 11Pharmaceuticals 2021, 14, x FOR PEER REVIEW 4 of 11
Figure 3. Changes in the mean logarithm of the minimal angle resolution (logMAR) best-corrected visual acuity (BCVA) in the yellow and red subthreshold micropulse laser (SMPL) groups. In the yellow SMPL group, the mean BCVA was 0.40 ± 0.33 at baseline and was 0.45 ± 0.33, 0.45 ± 0.33, 0.44 ± 0.32, 0.43 ± 0.32, 0.43 ± 0.35, and 0.45 ± 0.35 at 2, 4, 6, 8, 10, and 12 months, respectively. There was no significant difference between the mean BCVA at baseline and each follow-up period other than 2 months (p = 0.015, 0.069, 0.34, 0.39, 0.53, and 0.39, respectively). In the red SMPL group, the mean BCVA was 0.35 ± 0.22 at baseline and was 0.38 ± 0.27, 0.35 ± 0.21, 0.35 ± 0.27, 0.36 ± 0.27, 0.35 ± 0.32, and 0.33 ± 0.28 at 2, 4, 6, 8, 10, and 12 months, respectively. There was no significant difference between the mean BCVA at baseline and each follow-up period (p = 0.42, 1.00, 0.93, 0.78, 0.91, and 0.70, respectively).
2.2. Changes in CRT on SD-OCT Figure 4 demonstrates the change in the mean central retinal thickness (CRT) on spec-
tral-domain optical coherence tomography (SD-OCT) in all patients. The mean CRT on SD-OCT in all patients was 475 ± 171 µm at baseline and significantly decreased to 443 ± 157 µm at 4 months from baseline (p = 0.04). The significant reduction in CRT remained consistent until 12 months from baseline (399 ± 173 µm, p = 0.003).
Figure 5 shows the change in the mean CRT in the yellow and red SMPL groups. The mean CRT in the yellow SMPL group was 449 ± 169 µm at baseline and remained con-sistent from baseline until 10 months (429 ± 208 µm, p = 0.55). At the final visit after 12 months, the mean CRT in the yellow SMPL group significantly reduced to 389 ± 159 µm (p = 0.047).
The mean CRT in the red SMPL group showed a clinical course similar to that of the yellow SMPL group. The mean CRT was 515 ± 171 µm at baseline and significantly re-duced to 404 ± 178 µm at 6 months (p = 0.004). Thereafter, the significant reduction in CRT in the red SMPL group remained consistent for 12 months (415 ± 196 µm, p = 0.03, shown in Figure 5).
Figure 3. Changes in the mean logarithm of the minimal angle resolution (logMAR) best-correctedvisual acuity (BCVA) in the yellow and red subthreshold micropulse laser (SMPL) groups. In theyellow SMPL group, the mean BCVA was 0.40 ± 0.33 at baseline and was 0.45 ± 0.33, 0.45 ± 0.33,0.44 ± 0.32, 0.43 ± 0.32, 0.43 ± 0.35, and 0.45 ± 0.35 at 2, 4, 6, 8, 10, and 12 months, respectively.There was no significant difference between the mean BCVA at baseline and each follow-up periodother than 2 months (p = 0.015, 0.069, 0.34, 0.39, 0.53, and 0.39, respectively). In the red SMPL group,the mean BCVA was 0.35 ± 0.22 at baseline and was 0.38 ± 0.27, 0.35 ± 0.21, 0.35 ± 0.27, 0.36 ± 0.27,0.35 ± 0.32, and 0.33 ± 0.28 at 2, 4, 6, 8, 10, and 12 months, respectively. There was no significantdifference between the mean BCVA at baseline and each follow-up period (p = 0.42, 1.00, 0.93, 0.78,0.91, and 0.70, respectively).
2.2. Changes in CRT on SD-OCT
Figure 4 demonstrates the change in the mean central retinal thickness (CRT) onspectral-domain optical coherence tomography (SD-OCT) in all patients. The mean CRTon SD-OCT in all patients was 475 ± 171 µm at baseline and significantly decreased to443 ± 157 µm at 4 months from baseline (p = 0.04). The significant reduction in CRTremained consistent until 12 months from baseline (399 ± 173 µm, p = 0.003).
Figure 5 shows the change in the mean CRT in the yellow and red SMPL groups.The mean CRT in the yellow SMPL group was 449 ± 169 µm at baseline and remainedconsistent from baseline until 10 months (429 ± 208 µm, p = 0.55). At the final visit after12 months, the mean CRT in the yellow SMPL group significantly reduced to 389 ± 159 µm(p = 0.047).
The mean CRT in the red SMPL group showed a clinical course similar to that ofthe yellow SMPL group. The mean CRT was 515 ± 171 µm at baseline and significantlyreduced to 404 ± 178 µm at 6 months (p = 0.004). Thereafter, the significant reduction inCRT in the red SMPL group remained consistent for 12 months (415 ± 196 µm, p = 0.03,shown in Figure 5).

Pharmaceuticals 2021, 14, 1100 5 of 11Pharmaceuticals 2021, 14, x FOR PEER REVIEW 5 of 11
Figure 4. Changes in the mean central retinal thickness (CRT) measured with spectral-domain opti-cal coherence tomography in all patients. The mean CRT in all patients was 475 ± 171 µm at baseline and was 462 ± 149, 443 ± 157, 410 ± 162, 426 ± 174, 421 ± 193, and 399 ± 173 µm at 2, 4, 6, 8, 10, and 12 months, respectively. The mean CRT in all patients significantly decreased at 4 months from base-line, and the significant reduction was maintained throughout the 12 months of the follow-up pe-riod (p = 0.41, 0.04, 0.003, 0.02, 0.03, and 0.003, respectively).
Figure 5. Changes of in the mean central retinal thickness (CRT) in the yellow and red subthreshold micropulse laser (SMPL) groups. The mean CRT in the yellow SMPL group was 449 ± 169 µm at baseline and was 423 ± 133, 426 ± 153, 414 ± 155, 434 ± 169, 429 ± 208, and 389 ± 159 µm at 2, 4, 6, 8, 10, and 12 months from baseline. In the yellow SMPL group, the mean CRT remained consistent from baseline to 10 months, and significantly reduced at 12 months (p = 0.30, 0.23, 0.17, 0.54, 0.55, and 0.047, respectively). The mean CRT in the red SMPL group was 515 ± 171 µm at baseline and was 522 ± 157, 468 ± 165, 404 ± 178, 412 ± 187, 409 ± 172, and 415 ± 196 µm at 2, 4, 6, 8, 10, and 12 months from baseline. A significant reduction in CRT in the red SMPL group was observed at 6 months and remained consistent for 12 months from baseline (p = 0.63, 0.11, 0.004, 0.01, 0.005, and 0.03, respectively).
Figure 4. Changes in the mean central retinal thickness (CRT) measured with spectral-domain opticalcoherence tomography in all patients. The mean CRT in all patients was 475 ± 171 µm at baselineand was 462 ± 149, 443 ± 157, 410 ± 162, 426 ± 174, 421 ± 193, and 399 ± 173 µm at 2, 4, 6, 8, 10,and 12 months, respectively. The mean CRT in all patients significantly decreased at 4 months frombaseline, and the significant reduction was maintained throughout the 12 months of the follow-upperiod (p = 0.41, 0.04, 0.003, 0.02, 0.03, and 0.003, respectively).
Pharmaceuticals 2021, 14, x FOR PEER REVIEW 5 of 11
Figure 4. Changes in the mean central retinal thickness (CRT) measured with spectral-domain opti-cal coherence tomography in all patients. The mean CRT in all patients was 475 ± 171 µm at baseline and was 462 ± 149, 443 ± 157, 410 ± 162, 426 ± 174, 421 ± 193, and 399 ± 173 µm at 2, 4, 6, 8, 10, and 12 months, respectively. The mean CRT in all patients significantly decreased at 4 months from base-line, and the significant reduction was maintained throughout the 12 months of the follow-up pe-riod (p = 0.41, 0.04, 0.003, 0.02, 0.03, and 0.003, respectively).
Figure 5. Changes of in the mean central retinal thickness (CRT) in the yellow and red subthreshold micropulse laser (SMPL) groups. The mean CRT in the yellow SMPL group was 449 ± 169 µm at baseline and was 423 ± 133, 426 ± 153, 414 ± 155, 434 ± 169, 429 ± 208, and 389 ± 159 µm at 2, 4, 6, 8, 10, and 12 months from baseline. In the yellow SMPL group, the mean CRT remained consistent from baseline to 10 months, and significantly reduced at 12 months (p = 0.30, 0.23, 0.17, 0.54, 0.55, and 0.047, respectively). The mean CRT in the red SMPL group was 515 ± 171 µm at baseline and was 522 ± 157, 468 ± 165, 404 ± 178, 412 ± 187, 409 ± 172, and 415 ± 196 µm at 2, 4, 6, 8, 10, and 12 months from baseline. A significant reduction in CRT in the red SMPL group was observed at 6 months and remained consistent for 12 months from baseline (p = 0.63, 0.11, 0.004, 0.01, 0.005, and 0.03, respectively).
Figure 5. Changes of in the mean central retinal thickness (CRT) in the yellow and red subthresholdmicropulse laser (SMPL) groups. The mean CRT in the yellow SMPL group was 449 ± 169 µm atbaseline and was 423 ± 133, 426 ± 153, 414 ± 155, 434 ± 169, 429 ± 208, and 389 ± 159 µm at 2, 4, 6,8, 10, and 12 months from baseline. In the yellow SMPL group, the mean CRT remained consistentfrom baseline to 10 months, and significantly reduced at 12 months (p = 0.30, 0.23, 0.17, 0.54, 0.55,and 0.047, respectively). The mean CRT in the red SMPL group was 515 ± 171 µm at baseline andwas 522 ± 157, 468 ± 165, 404 ± 178, 412 ± 187, 409 ± 172, and 415 ± 196 µm at 2, 4, 6, 8, 10, and12 months from baseline. A significant reduction in CRT in the red SMPL group was observed at6 months and remained consistent for 12 months from baseline (p = 0.63, 0.11, 0.004, 0.01, 0.005, and0.03, respectively).

Pharmaceuticals 2021, 14, 1100 6 of 11
Among the patients, four eyes (15.4%) in the yellow SMPL group and six eyes (35.3%)in the red SMPL group showed complete resolution of DME at 12 months. There was nosignificant difference between the proportion of the patients with complete resolution ofDME at 12 months in the yellow and red SMPL groups (p = 0.13, chi-square test).
To investigate the difference in the treatment effect of CRT reduction for DME betweenthe yellow and red SMPL groups, we compared the mean CRT reduction in the two groups.As a result, there was no significant difference in the mean CRT reduction between theyellow and red SMPL groups throughout the 12 months of the follow-up period, except at8 months from baseline, when the mean CRT reduction in the red SMPL group was greaterthan that in the yellow SMPL group (p = 0.02, shown in Figure 6).
Pharmaceuticals 2021, 14, x FOR PEER REVIEW 6 of 11
Among the patients, four eyes (15.4%) in the yellow SMPL group and six eyes (35.3%) in the red SMPL group showed complete resolution of DME at 12 months. There was nosignificant difference between the proportion of the patients with complete resolution of DME at 12 months in the yellow and red SMPL groups (p = 0.13, chi-square test).
To investigate the difference in the treatment effect of CRT reduction for DME be-tween the yellow and red SMPL groups, we compared the mean CRT reduction in the two groups. As a result, there was no significant difference in the mean CRT reduction be-tween the yellow and red SMPL groups throughout the 12 months of the follow-up pe-riod, except at 8 months from baseline, when the mean CRT reduction in the red SMPL group was greater than that in the yellow SMPL group (p = 0.02, shown in Figure 6).
To investigate the factors associated with CRT at 12 months, we conducted a multi-variate linear regression analysis. As a result, only baseline CRT was associated with final CRT at 12 months (shown in Table 3).
Table 3. Multivariate linear regression analysis of factors associated with mean CRT at 12 months.
Variables β-coefficient p-value Age −0.39 0.88
Male gender −20.5 0.70Baseline logMAR BCVA 154.1 0.10
Baseline CRT 0.47 3.4 × 10⁻³HbA1c −1.4 0.94
Duration of DM −0.13 0.62Past treatment history for DME 51.9 0.33
SMPL (yellow: 0, red: 1) 1.0 0.98BCVA: best-corrected visual acuity, CRT: central retinal thickness, DM: diabetes mellitus, DME: diabetic macular edema, logMAR: logarithm of the minimal angle resolution, SMPL: subthreshold micropulse laser.
Figure 6. Comparison of the mean central retinal thickness (CRT) reduction in the two groups. There was no significant difference in the mean CRT reduction between the yellow and red subthresholdmicropulse laser (SMPL) groups throughout the 12 months of the follow-up period except at 8 months from baseline, when the mean CRT reduction in the red SMPL group was greater than thatin the yellow SMPL group (p = 0.58, 0.65, 0.09, 0.02, 0.10, and 0.44 at 2, 4, 6, 8, 10, and 12 months from baseline).
Figure 6. Comparison of the mean central retinal thickness (CRT) reduction in the two groups. Therewas no significant difference in the mean CRT reduction between the yellow and red subthresholdmicropulse laser (SMPL) groups throughout the 12 months of the follow-up period except at 8 monthsfrom baseline, when the mean CRT reduction in the red SMPL group was greater than that inthe yellow SMPL group (p = 0.58, 0.65, 0.09, 0.02, 0.10, and 0.44 at 2, 4, 6, 8, 10, and 12 monthsfrom baseline).
To investigate the factors associated with CRT at 12 months, we conducted a multi-variate linear regression analysis. As a result, only baseline CRT was associated with finalCRT at 12 months (shown in Table 3).
Table 3. Multivariate linear regression analysis of factors associated with mean CRT at 12 months.
Variables β-Coefficient p-Value
Age −0.39 0.88
Male gender −20.5 0.70
Baseline logMAR BCVA 154.1 0.10
Baseline CRT 0.47 3.4 × 10⁻³
HbA1c −1.4 0.94
Duration of DM −0.13 0.62
Past treatment history for DME 51.9 0.33
SMPL (yellow: 0, red: 1) 1.0 0.98BCVA: best-corrected visual acuity, CRT: central retinal thickness, DM: diabetes mellitus, DME: diabetic macularedema, logMAR: logarithm of the minimal angle resolution, SMPL: subthreshold micropulse laser.
Pharmaceuticals 2021, 14, 1100 7 of 11
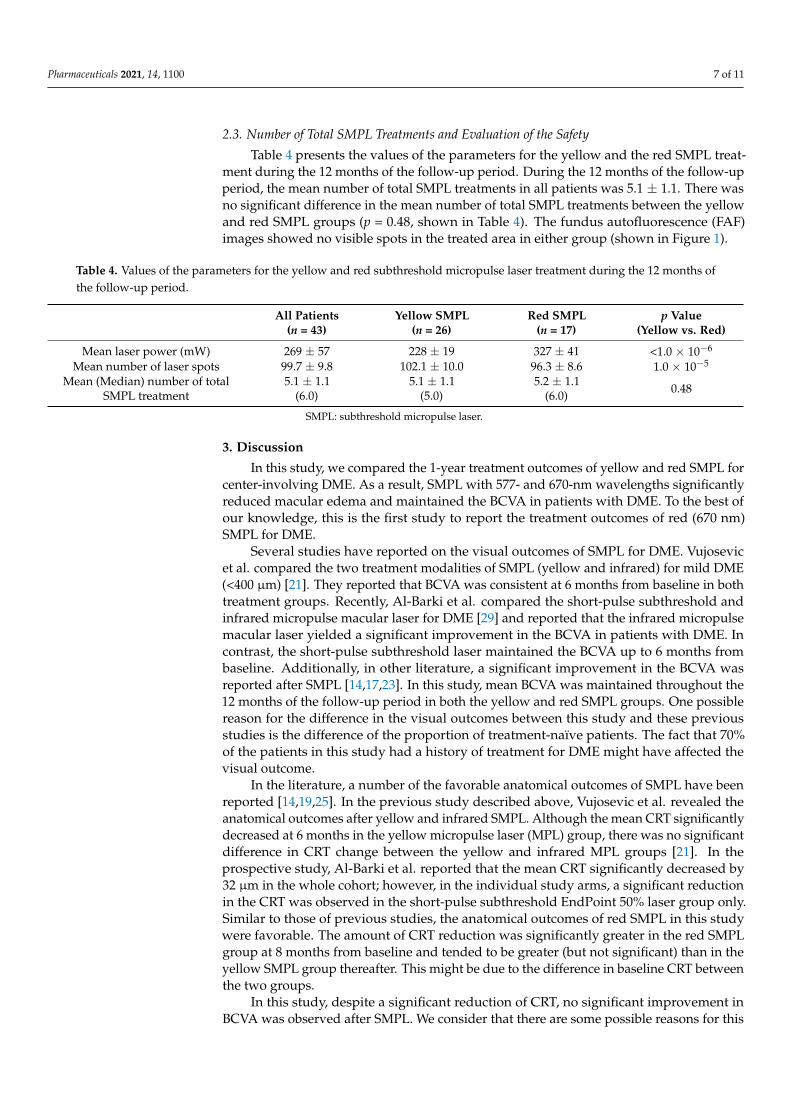
2.3. Number of Total SMPL Treatments and Evaluation of the Safety
Table 4 presents the values of the parameters for the yellow and the red SMPL treat-ment during the 12 months of the follow-up period. During the 12 months of the follow-upperiod, the mean number of total SMPL treatments in all patients was 5.1 ± 1.1. There wasno significant difference in the mean number of total SMPL treatments between the yellowand red SMPL groups (p = 0.48, shown in Table 4). The fundus autofluorescence (FAF)images showed no visible spots in the treated area in either group (shown in Figure 1).
Table 4. Values of the parameters for the yellow and red subthreshold micropulse laser treatment during the 12 months ofthe follow-up period.
All Patients(n = 43)
Yellow SMPL(n = 26)
Red SMPL(n = 17)
p Value(Yellow vs. Red)
Mean laser power (mW) 269 ± 57 228 ± 19 327 ± 41 <1.0 × 10⁻⁶
Mean number of laser spots 99.7 ± 9.8 102.1 ± 10.0 96.3 ± 8.6 1.0 × 10⁻⁵
Mean (Median) number of totalSMPL treatment
5.1 ± 1.1(6.0)
5.1 ± 1.1(5.0)
5.2 ± 1.1(6.0) 0.48
SMPL: subthreshold micropulse laser.
3. Discussion
In this study, we compared the 1-year treatment outcomes of yellow and red SMPL forcenter-involving DME. As a result, SMPL with 577- and 670-nm wavelengths significantlyreduced macular edema and maintained the BCVA in patients with DME. To the best ofour knowledge, this is the first study to report the treatment outcomes of red (670 nm)SMPL for DME.
Several studies have reported on the visual outcomes of SMPL for DME. Vujosevicet al. compared the two treatment modalities of SMPL (yellow and infrared) for mild DME(<400 µm) [21]. They reported that BCVA was consistent at 6 months from baseline in bothtreatment groups. Recently, Al-Barki et al. compared the short-pulse subthreshold andinfrared micropulse macular laser for DME [29] and reported that the infrared micropulsemacular laser yielded a significant improvement in the BCVA in patients with DME. Incontrast, the short-pulse subthreshold laser maintained the BCVA up to 6 months frombaseline. Additionally, in other literature, a significant improvement in the BCVA wasreported after SMPL [14,17,23]. In this study, mean BCVA was maintained throughout the12 months of the follow-up period in both the yellow and red SMPL groups. One possiblereason for the difference in the visual outcomes between this study and these previousstudies is the difference of the proportion of treatment-naïve patients. The fact that 70%of the patients in this study had a history of treatment for DME might have affected thevisual outcome.
In the literature, a number of the favorable anatomical outcomes of SMPL have beenreported [14,19,25]. In the previous study described above, Vujosevic et al. revealed theanatomical outcomes after yellow and infrared SMPL. Although the mean CRT significantlydecreased at 6 months in the yellow micropulse laser (MPL) group, there was no significantdifference in CRT change between the yellow and infrared MPL groups [21]. In theprospective study, Al-Barki et al. reported that the mean CRT significantly decreased by32 µm in the whole cohort; however, in the individual study arms, a significant reductionin the CRT was observed in the short-pulse subthreshold EndPoint 50% laser group only.Similar to those of previous studies, the anatomical outcomes of red SMPL in this studywere favorable. The amount of CRT reduction was significantly greater in the red SMPLgroup at 8 months from baseline and tended to be greater (but not significant) than in theyellow SMPL group thereafter. This might be due to the difference in baseline CRT betweenthe two groups.
In this study, despite a significant reduction of CRT, no significant improvement inBCVA was observed after SMPL. We consider that there are some possible reasons for this

Pharmaceuticals 2021, 14, 1100 8 of 11
discrepancy. One possible reason is the high proportion of patients with past treatmenthistory for DME. Valera-Cornejo et al. recently reported the short-term treatment outcomesof yellow MPL in eyes with either treatment-naïve or refractory DME [30]. They revealedno significant change in the BCVA at 3 months in both groups and a significant reduction inthe CMT at 3 months was observed in the treatment-naïve group only. In accordance withthe previous study, the visual and anatomical outcomes between eyes with treatment-naïveand past-treated DME in our study cohort were equivalent (data not presented). However,the cumulative damage of photoreceptors caused by persistent DME might have restrictedthe visual recovery. Another possible reason is the difference in the range of baselineCRT between the patients in previous studies and those in this study. In our study cohort,patients with mild to severe DME (range of CRT: 207–796 µm) were included in the analysis,and despite the relatively thicker CRT, a significant reduction in CRT was achieved in bothSMPL groups. However, the wide range of baseline CRT in this study might have confusedthe visual outcome.
In the present study, the mean number of total SMPL treatment was around 5 inboth groups during the follow-up period. This means that most of the patients receivedadditional SMPL at every follow-up visit, whereas many previous reports showed similartreatment outcomes of SMPL with fewer number of total treatments. In the previous study,Vujosevic et al. reported that most of the patients received yellow or infrared SMPL twiceduring 6 months [21]. Furthermore, in most of the published studies, only one or twoSMPLs were performed [17,19,20,25]. We consider that the possible reason for the relativelylarge number of additional treatments in this study was the small number of laser spots perone SMPL (99.7 ± 9.8, Table 4). The number of laser spots per one SMPL varies dependingon the studies, ranging approximately from 150–500. The smaller number of laser spots inthis study might have encompassed the insufficient treatment efficacy.
We consider that the advantages of red SMPL over yellow SMPL are better penetrationand less scattering, enabling better delivery to the target tissue. In addition, the 670-nmlaser is not absorbed by xanthophyll or hemoglobin, resulting in minimal adverse effectson the neurosensory retina [31–33]. However, the multivariate linear regression analysesrevealed that the difference in the treatment modality (yellow or red SMPL) was notassociated with the final BCVA or CRT at 12 months. In this study, the safety of red SMPLwas confirmed by the FAF images of the macular area treated by several repeated SMPLs.Therefore, we consider that this novel treatment modality for SMPL is a promising optionfor center-involving DME, especially with a good initial BCVA.
Our study has some limitations. The first limitation was the retrospective nature of theanalysis. The second limitation was the relatively small sample size. The third limitationwas the proportion of treatment-naïve patients, as aforementioned. Further prospectivestudies with a larger study population are necessary to confirm the efficacy and safety ofred SMPL.
4. Materials and Methods4.1. Participants
A retrospective medical chart review was conducted for the eyes of patients whoreceived either red or yellow SMPL for DME and were followed up for at least 12 months.This study was approved by the Institutional Review Board of the University of Yamanashi(protocol code: 2089 and the date of approval: 26 July 2019) and was conducted followingthe tenets of the Declaration of Helsinki. Written informed consent was obtained from allparticipants during the study period.
The inclusion criteria were as follows: (1) eyes with treatment-naïve DME or DMEnot treated within the last 4 months to allow for a sufficient wash-out period; (2) center-involving DME with a CRT >200 µm measured by vertical or horizontal images of SD-OCT;and (3) BCVA >0.05 on a decimal scale. The exclusion criteria were as follows: (1) eyes withany treatment history for DME within the last 4 months; (2) eyes with a previous historyof vitrectomy; (3) eyes with macular edema caused by other retinal pathologies (branch

Pharmaceuticals 2021, 14, 1100 9 of 11
retinal vein occlusion, central retinal vein occlusion, age-related macular degeneration,or macular telangiectasia); (4) other ocular abnormalities that affect the central visualfield, including glaucoma, optic neuritis, macular hole, epiretinal membrane, or severecataract; and (5) systemic disorders that affect CRT, including renal failure, heart failure,or hemodialysis.
At baseline, all of the participants underwent comprehensive ophthalmic examina-tions including measurement of BCVA using Landolt chart, intraocular pressure, dilatedfundus examination with slit-lamp biomicroscopy, color fundus photography, fluoresceinangiography (FA), and SD-OCT examination (OCT-HS100, Cannon Lifecare Solutions,Kanagawa, Japan).
4.2. SMPL Treatment Protocol
Patients received SMPL with a wavelength of either 577 (yellow SMPL) or 670 nm(red SMPL) once and followed up bimonthly. All SMPLs were performed by three retinalspecialists (WK, TS, and YF) using a TruScan Laser (LIGHTMED, San Clemente, CA,USA). The Mainster Focal/Grid contact lens (Ocular Instruments, Bellevue, WA, USA) wasapplied to the cornea of the patients after pupillary dilation and topical anesthesia. Inboth protocols, the subthreshold laser power was determined by titrating the burn to abarely visible spot with a continuous laser and then the titrated value was set with SMPLmode. Yellow SMPL treatment was performed with the following settings: a wavelengthof 577 nm, 200 µm spot size on the slit lamp (magnified to 210 µm on the retina), 10% dutycycle of 0.2 s, 120–350 mW power (lower than the titrated laser power making barely visiblespot), 80–120 spots to cover the macular area and varying according to the extension ofDME. Red SMPL treatment was performed with the following settings: a wavelength of670 nm, 200 µm spot size on the slit lamp (magnified to 210 µm on the retina), 10% dutycycle of 0.2 s, 120–350 mW power (lower than the titrated laser power making the barelyvisible spot), 80–120 spots to cover the macular area and varying according to the extensionof DME. In both protocols, the laser was applied repeatedly and continuously to cover theentire area of DME (spacing at 0).
Yellow or red SMPL treatment was chosen depending on the time period. YellowSMPL was performed as the initial treatment (yellow SMPL group) from September 2017to July 2019, and red SMPL was performed as the initial treatment (red SMPL group) fromAugust 2019 to February 2020.
After receiving the initial SMPL treatment, all patients were followed up bimonthly.Retreatment of SMPL with the same treatment protocol as that of initial SMPL was per-formed if the CRT was ≥400 µm, the reduction of the CRT was <50% from baseline, orthere was no improvement in the BCVA. In addition, to evaluate the safety of the SMPLtreatment, all patients underwent FAF examination at 6 and 12 months from baseline.
4.3. Statistical Analysis
The primary outcome measures included BVCA improvement and CRT reduction at12 months after baseline. BCVA was measured on a decimal scale and converted into alogMAR. All statistical analyses were conducted using the Statflex 7 software (Artec Co.,Ltd., Osaka, Japan). The differences in categorical and continuous variables between theyellow and red SMPL groups were analyzed using the chi-square test, Mann–WhitneyU test, or Kruskal–Wallis test. In addition, the paired t-test was used to compare thesignificance of the differences between the values before and after treatment. A p-value of<0.05 was considered as statistically significant.
5. Conclusions
The red SMPL with a wavelength of 670 nm maintained the BCVA of patients withcenter-involving DME. The mean CRT in the red SMPL group significantly decreased, andthe amount of CRT reduction was equivalent to that in the yellow SMPL group.

Pharmaceuticals 2021, 14, 1100 10 of 11
Author Contributions: Conceptualization, W.K.; Methodology, W.K.; Validation, W.K., T.S. and Y.F.;Investigation, W.K.; Resources, W.K., T.S. and Y.F.; Data Curation, T.S. and Y.F.; Writing—OriginalDraft Preparation, W.K.; Writing—Review and Editing, T.S., Y.F. and Y.S.; Supervision, K.K. Allauthors have read and agreed to the published version of the manuscript.
Funding: This research received no external funding.
Institutional Review Board Statement: The study was conducted according to the guidelines of theDeclaration of Helsinki, and approved by the Institutional Review Board of University of Yamanashi(protocol code: 2089 and date of approval: 26 July 2019).
Informed Consent Statement: Informed consent was obtained from all subjects involved in the study.
Data Availability Statement: The data presented in this study are available on request from thecorresponding author. The data are not publicly available due to their containing information thatcould compromise the privacy of research participants.
Conflicts of Interest: The authors declare no conflict of interest.
References1. Cheung, N.; Mitchell, P.; Wong, T.Y. Diabetic retinopathy. Lancet 2010, 376, 124–136. [CrossRef]2. Photocoagulation for diabetic macular edema. Early treatment diabetic retinopathy study report number 1. Early treatment
diabetic retinopathy study research group. Arch. Ophthalmol. 1985, 103, 1796–1806. [CrossRef]3. Qi, H.-P.; Bi, S.; Wei, S.-Q.; Cui, H.; Zhao, J.-B. Intravitreal versus subtenon triamcinolone acetonide injection for diabetic macular
edema: A systematic review and meta-analysis. Curr. Eye Res. 2012, 37, 1136–1147. [CrossRef] [PubMed]4. Boyer, D.S.; Nguyen, Q.D.; Brown, D.M.; Basu, K.; Ehrlich, J.S.; Ride and Rise Research Group. Outcomes with as-needed
ranibizumab after initial monthly therapy: Long-Term outcomes of the phase III RIDE and RISE trials. Ophthalmology 2015, 122,2504–2513.e1. [CrossRef] [PubMed]
5. Korobelnik, J.-F.; Do, D.V.; Schmidt-Erfurth, U.; Boyer, D.S.; Holz, F.G.; Heier, J.S.; Midena, E.; Kaiser, P.; Terasaki, H.; Marcus,D.M.; et al. Intravitreal aflibercept for diabetic macular edema. Ophthalmology 2014, 121, 2247–2254. [CrossRef]
6. Jackson, T.L.; Nicod, E.; Angelis, A.; Grimaccia, F.; Pringle, E.; Kanavos, P. Pars plana vitrectomy for diabetic macular edema: Asystematic review, meta-analysis, and synthesis of safety literature. Retina 2017, 37, 886–895. [CrossRef] [PubMed]
7. Hagenau, F.; Vogt, D.; Ziada, J.; Guenther, S.R.; Haritoglou, C.; Wolf, A.; Priglinger, S.G.; Schumann, R.G. Vitrectomy for diabeticmacular edema: Optical coherence tomography criteria and pathology of the vitreomacular interface. Am. J. Ophthalmol. 2019,200, 34–46. [CrossRef]
8. Boyer, D.S.; Yoon, Y.H.; Belfort, R.; Bandello, F.; Maturi, R.K.; Augustin, A.J.; Li, X.-Y.; Cui, H.; Hashad, Y.; Whitcup, S.M.Three-Year, randomized, sham-controlled trial of dexamethasone intravitreal implant in patients with diabetic macular edema.Ophthalmology 2014, 121, 1904–1914. [CrossRef]
9. Rosenblatt, A.; Udaondo, P.; Cunha-Vaz, J.; Sivaprasad, S.; Bandello, F.; Lanzetta, P.; Kodjikian, L.; Goldstein, M.; Habot-Wilner, Z.;Loewenstein, A. A collaborative retrospective study on the efficacy and safety of intravitreal dexamethasone implant (Ozurdex)in patients with diabetic macular edema: The european dme registry study. Ophthalmology 2020, 127, 377–393. [CrossRef]
10. Bressler, S.B.; Glassman, A.R.; Almukhtar, T.; Bressler, N.M.; Ferris, F.; Googe, J.M.; Gupta, S.K.; Jampol, L.M.; Melia, M.; Wells,J.A. Five-Year outcomes of ranibizumab with prompt or deferred laser versus laser or triamcinolone plus deferred ranibizumabfor diabetic macular edema. Am. J. Ophthalmol. 2016, 164, 57–68. [CrossRef]
11. Friberg, T.R.; Karatza, E.C. The treatment of macular disease using a micropulsed and continuous wave 810-nm diode laser.Ophthalmology 1997, 104, 2030–2038. [CrossRef]
12. Dorin, G. Evolution of retinal laser therapy: Minimum intensity photocoagulation (MIP). Can the laser heal the retina withoutharming it? Semin. Ophthalmol. 2004, 19, 62–68. [CrossRef] [PubMed]
13. Laursen, M.L.; Moeller, F.; Sander, B.; Sjoelie, A.K. Subthreshold micropulse diode laser treatment in diabetic macular oedema. Br.J. Ophthalmol. 2004, 88, 1173–1179. [CrossRef]
14. Luttrull, J.K.; Musch, D.; Mainster, M.A. Subthreshold diode micropulse photocoagulation for the treatment of clinically significantdiabetic macular oedema. Br. J. Ophthalmol. 2005, 89, 74–80. [CrossRef] [PubMed]
15. Vujosevic, S.; Bottega, E.; Casciano, M.; Pilotto, E.; Convento, E.; Midena, E. Microperimetry and fundus autofluorescence indiabetic macular edema: Subthreshold micropulse diode laser versus modified early treatment diabetic retinopathy study laserphotocoagulation. Retina 2010, 30, 908–916. [CrossRef] [PubMed]
16. Luttrull, J.K.; Dorin, G. Subthreshold diode micropulse laser photocoagulation (SDM) as invisible retinal phototherapy fordiabetic macular edema: A review. Curr. Diabetes Rev. 2012, 8, 274–284. [CrossRef]
17. Luttrull, J.K.; Sinclair, S.H. Safety of transfoveal subthreshold diode micropulse laser for fovea-involving diabetic macular edemain eyes with good visual acuity. Retina 2014, 34, 2010–2020. [CrossRef] [PubMed]
18. Moisseiev, E.; Abbassi, S.; Thinda, S.; Yoon, J.; Yiu, G.; Morse, L.S. Subthreshold micropulse laser reduces anti-VEGF injectionburden in patients with diabetic macular edema. Eur. J. Ophthalmol. 2017, 28, 68–73. [CrossRef]

Pharmaceuticals 2021, 14, 1100 11 of 11
19. Ohkoshi, K.; Yamaguchi, T. Subthreshold micropulse diode laser photocoagulation for diabetic macular edema in Japanesepatients. Am. J. Ophthalmol. 2010, 149, 133–139.e1. [CrossRef]
20. Takatsuna, Y.; Yamamoto, S.; Nakamura, Y.; Tatsumi, T.; Arai, M.; Mitamura, Y. Long-Term therapeutic efficacy of the subthresholdmicropulse diode laser photocoagulation for diabetic macular edema. Jpn. J. Ophthalmol. 2011, 55, 365–369. [CrossRef]
21. Vujosevic, S.; Martini, F.; Longhin, E.; Convento, E.; Cavarzeran, F.; Midena, E. Subthreshold micropulse yellow laser versussubthreshold micropulse infrared laser in center-involving diabetic macular edema: Morphologic and functional safety. Retina2015, 35, 1594–1603. [CrossRef]
22. Chang, D.B.; Luttrull, J.K. Comparison of subthreshold 577 and 810 nm micropulse laser effects on heat-shock protein activationkinetics: Implications for treatment efficacy and safety. Transl. Vis. Sci. Technol. 2020, 9, 23. [CrossRef]
23. Vujosevic, S.; Frizziero, L.; Martini, F.; Bini, S.; Convento, E.; Cavarzeran, F.; Midena, E. Single retinal layer changes aftersubthreshold micropulse yellow laser in diabetic macular edema. Ophthalmic Surg. Lasers Imaging Retin. 2018, 49, e218–e225.[CrossRef]
24. Vujosevic, S.; Gatti, V.; Muraca, A.; Brambilla, M.; Villani, E.; Nucci, P.; Rossetti, L.; De Cilla’, S. Optical coherence tomographyangiography changes after subthreshold micropulse yellow laser in diabetic macular edema. Retina 2020, 40, 312–321. [CrossRef][PubMed]
25. Inagaki, K.; Ohkoshi, K.; Ohde, S.; Deshpande, G.A.; Ebihara, N.; Murakami, A. Comparative efficacy of pure yellow (577-nm)and 810-nm subthreshold micropulse laser photocoagulation combined with yellow (561–577-nm) direct photocoagulation fordiabetic macular edema. Jpn. J. Ophthalmol. 2014, 59, 21–28. [CrossRef] [PubMed]
26. Gawecki, M. Micropulse laser treatment of retinal diseases. J. Clin. Med. 2019, 8, 242. [CrossRef]27. Wu, Y.; Ai, P.; Ai, Z.; Xu, G. Subthreshold diode micropulse laser versus conventional laser photocoagulation monotherapy or
combined with anti-VEGF therapy for diabetic macular edema: A Bayesian network meta-analysis. Biomed. Pharmacother. 2018,97, 293–299. [CrossRef]
28. Akkaya, S.; Acikalin, B.; Dogan, Y.E.; Coban, F. Subthreshold micropulse laser versus intravitreal anti-VEGF for diabetic macularedema patients with relatively better visual acuity. Int. J. Ophthalmol. 2020, 13, 1606–1611. [CrossRef] [PubMed]
29. Al-Barki, A.; Al-Hijji, L.; High, R.; Schatz, P.; Do, D.; Nguyen, Q.D.; Luttrull, J.K.; Kozak, I. Comparison of short-pulse subthreshold(532 nm) and infrared micropulse (810 nm) macular laser for diabetic macular edema. Sci. Rep. 2021, 11, 14. [CrossRef]
30. Valera-Cornejo, D.A.; García-Roa, M.; Quiroz-Mendoza, J.; Arias-Gómez, A.; Ramírez-Neria, P.; Villalpando-Gómez, Y.; Romero-Morales, V.; García-Franco, R. Micropulse laser in patients with refractory and treatment-naïve center–involved diabetic macularedema: Short terms visual and anatomic outcomes. Ther. Adv. Ophthalmol. 2021, 13, 2515841420979112. [CrossRef] [PubMed]
31. Trempe, C.L.; Mainster, M.A.; Pomerantzeff, O.; Avila, M.P.; Jalkh, A.E.; Weiter, J.J.; McMeel, J.W.; Schepens, C.L. Macularphotocoagulation. Optimal wavelength selection. Ophthalmology 1982, 89, 721–728. [CrossRef]
32. Mainster, M.A. Wavelength selection in macular photocoagulation. Ophthalmology 1986, 93, 952–958. [CrossRef]33. Singh, A.D. Ocular phototherapy. Eye 2013, 27, 190–198. [CrossRef] [PubMed]