
Comparison of SSR polymorphisms using automated capillary sequencers, and polyacrylamide and agarose...
7
Comparison of SSR polymorphisms using automated capillary sequencers, and polyacrylamide and agarose gel electrophoresis: Implications for the assessment of genetic diversity and relatedness in almond R. Sa ´nchez-Pe ´rez a , J. Ballester b , F. Dicenta a , P. Aru ´s b , P. Martı ´nez-Go ´mez a, * a Departamento de Mejora Vegetal, CEBAS-CSIC, P.O. Box 164, E-30100 Espinardo, Murcia, Spain b Departament de Gene `tica Vegetal, IRTA, Laboratori de Gene `tica Molecular Vegetal, CSIC-IRTA, Crta, Cabrils s/n, 08348 Cabrils, Barcelona, Spain Received 18 July 2005; received in revised form 10 January 2006; accepted 2 February 2006 Abstract In this work we have performed a comparative study of the utilization of three electrophoresis separation methods for the analysis of peach SSR polymorphism in almond and its implications in the assessment of genetic diversity and relatedness. Automated SSR detection and polyacrylamide gel electrophoresis were the most efficient methods and would be able to resolve allelic variation at a finer scale than the electrophoresis in MetaPhor 1 agarose. Moreover, automated electrophoresis detection is much more expensive in terms of cost of equipment and cost of the analysis. In addition, SSR detection using polyacrylamide gel electrophoresis showed similar results than automated sequencing, although it is more time- consuming and toxic than electrophoresis in agarose gels. Discrepancies among polyacrylamide and automated capillary, and MetaPhor 1 were observed when differences in SSR polymorphisms were between 1 and 5 bp. While the use of MetaPhor 1 agarose appears less indicated for genotype characterization, this technique may be the most convenient in other applications, i.e. mapping of population, due to its lower cost and easier routine application. The utilization MetaPhor 1 agarose produced a slightly different clustering of genotypes in spite of the big differences observed in the DNA fingerprinting. However, bootstrap values using MetaPhor 1 agarose were lower indicating a lower accuracy of this SSR polymorphism analysis method. # 2006 Elsevier B.V. All rights reserved. Keywords: Prunus; Molecular markers; Genetic relationships; Germplasm 1. Introduction Simple sequence repeat sequences (i.e. microsatellites, SSR markers) are good molecular markers for genetic diversity studies in a wide range of plants. Because of their high polymorphism, abundance, and codominant inheritance, they are well suited for the assessment of genetic diversity within crop species (Gupta et al., 1996; Wu ¨ nsch and Hormaza, 2002a). In the case of Prunus species, primer pairs flanking SSRs have been cloned and sequenced in different species including peach, apricot, cherry, and almond (Wu ¨nsch and Hormaza, 2002a; Aranzana et al., 2003; Martı ´nez-Go ´mez et al., 2003a). SSR markers have been used in Prunus species for the molecular characterization and identification of cultivars (Cipriani et al., 1999; Testolin et al., 2000; Hormaza, 2002; Wu ¨nsch and Hormaza, 2002b; Martı ´nez-Go ´ mez et al., 2003b; Ahmad et al., 2004; Sa ´nchez-Pe ´rez et al., 2005) and rootstocks (Serrano et al., 2002), and the elaboration of genetic linkage maps (Aranzana et al., 2003). In these assays, different methods for the separation and detection of the DNA amplified fragments have been used. Polyacrylamide gel electrophoresis with radioactive and silver staining was the first method used in the analysis of the PCR amplified fragment of DNA (Cipriani et al., 1999). MetaPhor 1 agarose gel electrophoresis is a method used as alternative to the polyacrylamide due to its cheaper cost and easier application to routine (Morgante et al., 2001). More recently, new methods for the PCR analysis of SSR polymorphisms have been developed based on the utilization of automated sequencer capillary electrophoresis (Aranzana et al., 2003; Ahmad et al., 2004). However, to date a comparison of the efficiency of these methods for the separation and analysis of the DNA fragments and the implications in the assessment of genetic diversity and relatedness have been not performed. www.elsevier.com/locate/scihorti Scientia Horticulturae 108 (2006) 310–316 * Corresponding author. Tel.: +34 968 396 200; fax: +34 968 396 213. E-mail address: [email protected] (P. Martı ´nez-Go ´mez). 0304-4238/$ – see front matter # 2006 Elsevier B.V. All rights reserved. doi:10.1016/j.scienta.2006.02.004
-
Upload
independent -
Category
Documents
-
view
4 -
download
0
Transcript of Comparison of SSR polymorphisms using automated capillary sequencers, and polyacrylamide and agarose...
Comparison of SSR polymorphisms using automated capillary sequencers,
and polyacrylamide and agarose gel electrophoresis: Implications for the
assessment of genetic diversity and relatedness in almond
R. Sanchez-Perez a, J. Ballester b, F. Dicenta a, P. Arus b, P. Martınez-Gomez a,*a Departamento de Mejora Vegetal, CEBAS-CSIC, P.O. Box 164, E-30100 Espinardo, Murcia, Spain
b Departament de Genetica Vegetal, IRTA, Laboratori de Genetica Molecular Vegetal, CSIC-IRTA, Crta, Cabrils s/n, 08348 Cabrils, Barcelona, Spain
Received 18 July 2005; received in revised form 10 January 2006; accepted 2 February 2006
Abstract
In this work we have performed a comparative study of the utilization of three electrophoresis separation methods for the analysis of peach SSR
polymorphism in almond and its implications in the assessment of genetic diversity and relatedness. Automated SSR detection and polyacrylamide
gel electrophoresis were the most efficient methods and would be able to resolve allelic variation at a finer scale than the electrophoresis in
MetaPhor1 agarose. Moreover, automated electrophoresis detection is much more expensive in terms of cost of equipment and cost of the analysis.
In addition, SSR detection using polyacrylamide gel electrophoresis showed similar results than automated sequencing, although it is more time-
consuming and toxic than electrophoresis in agarose gels. Discrepancies among polyacrylamide and automated capillary, and MetaPhor1 were
observed when differences in SSR polymorphisms were between 1 and 5 bp. While the use of MetaPhor1 agarose appears less indicated for
genotype characterization, this technique may be the most convenient in other applications, i.e. mapping of population, due to its lower cost and
easier routine application. The utilization MetaPhor1 agarose produced a slightly different clustering of genotypes in spite of the big differences
observed in the DNA fingerprinting. However, bootstrap values using MetaPhor1 agarose were lower indicating a lower accuracy of this SSR
polymorphism analysis method.
# 2006 Elsevier B.V. All rights reserved.
Keywords: Prunus; Molecular markers; Genetic relationships; Germplasm
www.elsevier.com/locate/scihorti
Scientia Horticulturae 108 (2006) 310–316
1. Introduction
Simple sequence repeat sequences (i.e. microsatellites, SSR
markers) are good molecular markers for genetic diversity
studies in a wide range of plants. Because of their high
polymorphism, abundance, and codominant inheritance, they
are well suited for the assessment of genetic diversity within
crop species (Gupta et al., 1996; Wunsch and Hormaza, 2002a).
In the case of Prunus species, primer pairs flanking SSRs have
been cloned and sequenced in different species including
peach, apricot, cherry, and almond (Wunsch and Hormaza,
2002a; Aranzana et al., 2003; Martınez-Gomez et al., 2003a).
SSR markers have been used in Prunus species for the
molecular characterization and identification of cultivars
(Cipriani et al., 1999; Testolin et al., 2000; Hormaza, 2002;
* Corresponding author. Tel.: +34 968 396 200; fax: +34 968 396 213.
E-mail address: [email protected] (P. Martınez-Gomez).
0304-4238/$ – see front matter # 2006 Elsevier B.V. All rights reserved.
doi:10.1016/j.scienta.2006.02.004
Wunsch and Hormaza, 2002b; Martınez-Gomez et al., 2003b;
Ahmad et al., 2004; Sanchez-Perez et al., 2005) and rootstocks
(Serrano et al., 2002), and the elaboration of genetic linkage
maps (Aranzana et al., 2003). In these assays, different
methods for the separation and detection of the DNA amplified
fragments have been used. Polyacrylamide gel electrophoresis
with radioactive and silver staining was the first method used
in the analysis of the PCR amplified fragment of DNA
(Cipriani et al., 1999). MetaPhor1 agarose gel electrophoresis
is a method used as alternative to the polyacrylamide due to
its cheaper cost and easier application to routine (Morgante
et al., 2001). More recently, new methods for the PCR analysis
of SSR polymorphisms have been developed based on the
utilization of automated sequencer capillary electrophoresis
(Aranzana et al., 2003; Ahmad et al., 2004). However, to date a
comparison of the efficiency of these methods for the
separation and analysis of the DNA fragments and the
implications in the assessment of genetic diversity and
relatedness have been not performed.
R. Sanchez-Perez et al. / Scientia Horticulturae 108 (2006) 310–316 311
The objective of this work was to compare the relative
efficiency of automated sequencer capillary electrophoresis,
and polyacrylamide and MetaPhor1 agarose gel electrophor-
esis for the analysis of peach SSR polymorphism in almond
and its implications in the assessment of genetic diversity and
relatedness.
2. Material and methods
2.1. Plant material and DNA isolation
The plant material assayed included 21 almond (Prunus
dulcis (Mill.) D.A. Webb) cultivars from different origins
(Table 1). Total genomic DNA was isolated using the
procedure described by Doyle and Doyle (1987). Approxi-
mately 50 mg of young leaves were ground in a 1.5 ml
Eppendorf tube with 750 ml of CTAB extraction buffer
(100 mM Tris–HCl, 1.4 M NaCl, 20 mM EDTA, 2% CTAB,
1% PVP, 0.2% mercaptoethanol, 0.1% NaHSO3). Samples
were incubated at 65 8C for 20 min, mixed with an equal
volume of 24:1 chloroform–isoamyl alcohol, and centri-
fuged at 6000 � g (20 min). The upper phase was recovered
and mixed with an equal volume of isopropanol at �20 8C.
The nucleic acid pellet was washed in 400 ml of 10 mM
NH4Ac in 76% ethanol, dried, resuspended in 50 ml of
TE (10 mM Tris–HCl, 0.1 mM EDTA, pH 8.0), and
incubated with 0.5 mg of RNase-A at 37 8C for 30 min, to
digest RNA.
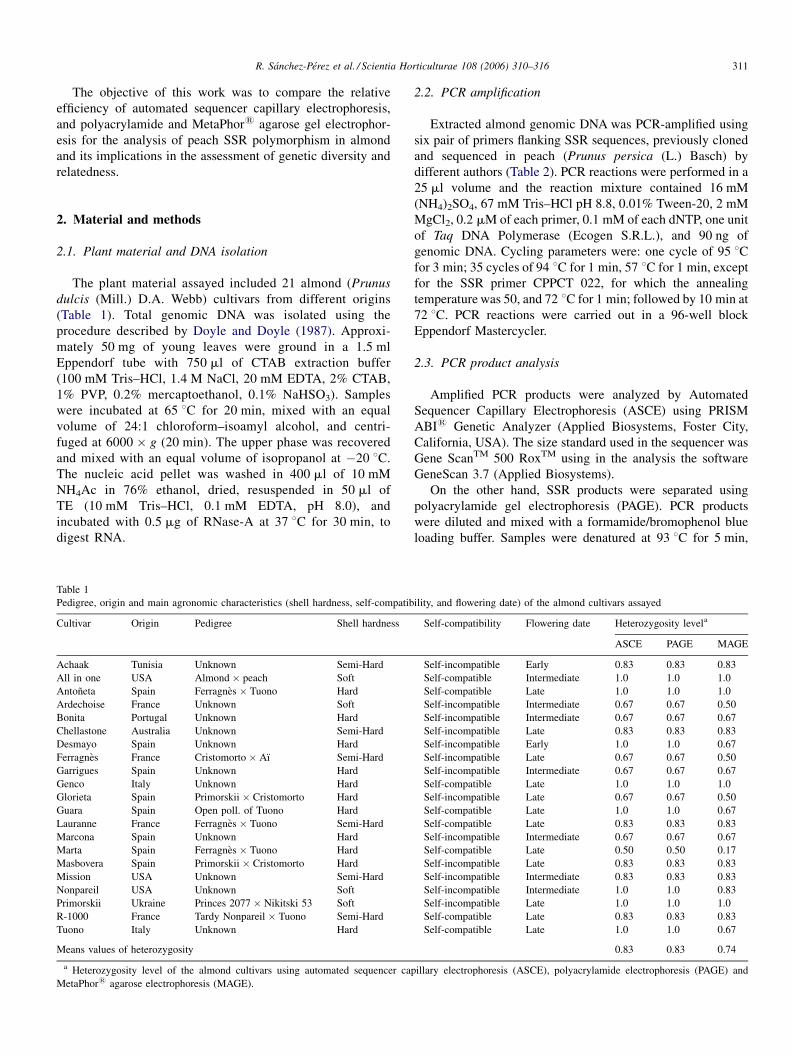
Table 1
Pedigree, origin and main agronomic characteristics (shell hardness, self-compatib
Cultivar Origin Pedigree Shell hardness
Achaak Tunisia Unknown Semi-Hard
All in one USA Almond � peach Soft
Antoneta Spain Ferragnes � Tuono Hard
Ardechoise France Unknown Soft
Bonita Portugal Unknown Hard
Chellastone Australia Unknown Semi-Hard
Desmayo Spain Unknown Hard
Ferragnes France Cristomorto � Aı Semi-Hard
Garrigues Spain Unknown Hard
Genco Italy Unknown Hard
Glorieta Spain Primorskii � Cristomorto Hard
Guara Spain Open poll. of Tuono Hard
Lauranne France Ferragnes � Tuono Semi-Hard
Marcona Spain Unknown Hard
Marta Spain Ferragnes � Tuono Hard
Masbovera Spain Primorskii � Cristomorto Hard
Mission USA Unknown Semi-Hard
Nonpareil USA Unknown Soft
Primorskii Ukraine Princes 2077 � Nikitski 53 Soft
R-1000 France Tardy Nonpareil � Tuono Semi-Hard
Tuono Italy Unknown Hard
Means values of heterozygosity
a Heterozygosity level of the almond cultivars using automated sequencer cap
MetaPhor1 agarose electrophoresis (MAGE).
2.2. PCR amplification
Extracted almond genomic DNA was PCR-amplified using
six pair of primers flanking SSR sequences, previously cloned
and sequenced in peach (Prunus persica (L.) Basch) by
different authors (Table 2). PCR reactions were performed in a
25 ml volume and the reaction mixture contained 16 mM
(NH4)2SO4, 67 mM Tris–HCl pH 8.8, 0.01% Tween-20, 2 mM
MgCl2, 0.2 mM of each primer, 0.1 mM of each dNTP, one unit
of Taq DNA Polymerase (Ecogen S.R.L.), and 90 ng of
genomic DNA. Cycling parameters were: one cycle of 95 8Cfor 3 min; 35 cycles of 94 8C for 1 min, 57 8C for 1 min, except
for the SSR primer CPPCT 022, for which the annealing
temperature was 50, and 72 8C for 1 min; followed by 10 min at
72 8C. PCR reactions were carried out in a 96-well block
Eppendorf Mastercycler.
2.3. PCR product analysis
Amplified PCR products were analyzed by Automated
Sequencer Capillary Electrophoresis (ASCE) using PRISM
ABI1 Genetic Analyzer (Applied Biosystems, Foster City,
California, USA). The size standard used in the sequencer was
Gene ScanTM 500 RoxTM using in the analysis the software
GeneScan 3.7 (Applied Biosystems).
On the other hand, SSR products were separated using
polyacrylamide gel electrophoresis (PAGE). PCR products
were diluted and mixed with a formamide/bromophenol blue
loading buffer. Samples were denatured at 93 8C for 5 min,
ility, and flowering date) of the almond cultivars assayed
Self-compatibility Flowering date Heterozygosity levela
ASCE PAGE MAGE
Self-incompatible Early 0.83 0.83 0.83
Self-compatible Intermediate 1.0 1.0 1.0
Self-compatible Late 1.0 1.0 1.0
Self-incompatible Intermediate 0.67 0.67 0.50
Self-incompatible Intermediate 0.67 0.67 0.67
Self-incompatible Late 0.83 0.83 0.83
Self-incompatible Early 1.0 1.0 0.67
Self-incompatible Late 0.67 0.67 0.50
Self-incompatible Intermediate 0.67 0.67 0.67
Self-compatible Late 1.0 1.0 1.0
Self-incompatible Late 0.67 0.67 0.50
Self-compatible Late 1.0 1.0 0.67
Self-compatible Late 0.83 0.83 0.83
Self-incompatible Intermediate 0.67 0.67 0.67
Self-compatible Late 0.50 0.50 0.17
Self-incompatible Late 0.83 0.83 0.83
Self-incompatible Intermediate 0.83 0.83 0.83
Self-incompatible Intermediate 1.0 1.0 0.83
Self-incompatible Late 1.0 1.0 1.0
Self-compatible Late 0.83 0.83 0.83
Self-compatible Late 1.0 1.0 0.67
0.83 0.83 0.74
illary electrophoresis (ASCE), polyacrylamide electrophoresis (PAGE) and
R. Sanchez-Perez et al. / Scientia Horticulturae 108 (2006) 310–316312
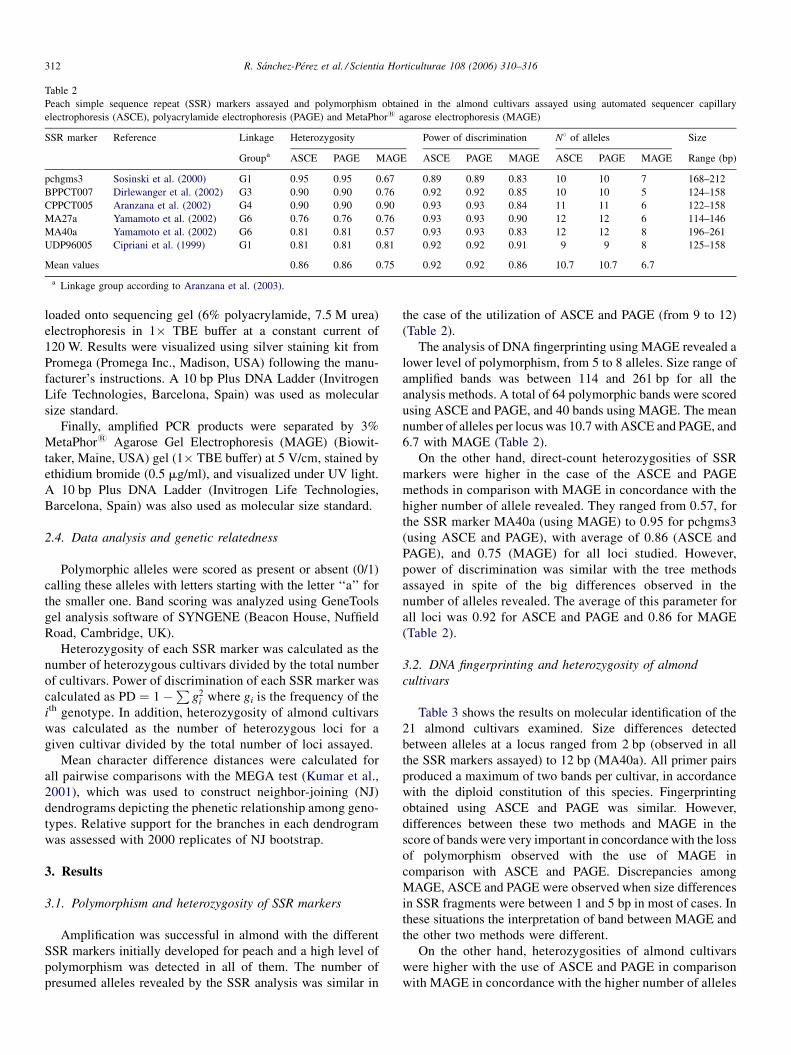
Table 2
Peach simple sequence repeat (SSR) markers assayed and polymorphism obtained in the almond cultivars assayed using automated sequencer capillary
electrophoresis (ASCE), polyacrylamide electrophoresis (PAGE) and MetaPhor1 agarose electrophoresis (MAGE)
SSR marker Reference Linkage Heterozygosity Power of discrimination N8 of alleles Size
Groupa ASCE PAGE MAGE ASCE PAGE MAGE ASCE PAGE MAGE Range (bp)
pchgms3 Sosinski et al. (2000) G1 0.95 0.95 0.67 0.89 0.89 0.83 10 10 7 168–212
BPPCT007 Dirlewanger et al. (2002) G3 0.90 0.90 0.76 0.92 0.92 0.85 10 10 5 124–158
CPPCT005 Aranzana et al. (2002) G4 0.90 0.90 0.90 0.93 0.93 0.84 11 11 6 122–158
MA27a Yamamoto et al. (2002) G6 0.76 0.76 0.76 0.93 0.93 0.90 12 12 6 114–146
MA40a Yamamoto et al. (2002) G6 0.81 0.81 0.57 0.93 0.93 0.83 12 12 8 196–261
UDP96005 Cipriani et al. (1999) G1 0.81 0.81 0.81 0.92 0.92 0.91 9 9 8 125–158
Mean values 0.86 0.86 0.75 0.92 0.92 0.86 10.7 10.7 6.7
a Linkage group according to Aranzana et al. (2003).
loaded onto sequencing gel (6% polyacrylamide, 7.5 M urea)
electrophoresis in 1� TBE buffer at a constant current of
120 W. Results were visualized using silver staining kit from
Promega (Promega Inc., Madison, USA) following the manu-
facturer’s instructions. A 10 bp Plus DNA Ladder (Invitrogen
Life Technologies, Barcelona, Spain) was used as molecular
size standard.
Finally, amplified PCR products were separated by 3%
MetaPhor1 Agarose Gel Electrophoresis (MAGE) (Biowit-
taker, Maine, USA) gel (1� TBE buffer) at 5 V/cm, stained by
ethidium bromide (0.5 mg/ml), and visualized under UV light.
A 10 bp Plus DNA Ladder (Invitrogen Life Technologies,
Barcelona, Spain) was also used as molecular size standard.
2.4. Data analysis and genetic relatedness
Polymorphic alleles were scored as present or absent (0/1)
calling these alleles with letters starting with the letter ‘‘a’’ for
the smaller one. Band scoring was analyzed using GeneTools
gel analysis software of SYNGENE (Beacon House, Nuffield
Road, Cambridge, UK).
Heterozygosity of each SSR marker was calculated as the
number of heterozygous cultivars divided by the total number
of cultivars. Power of discrimination of each SSR marker was
calculated as PD ¼ 1�P
g2i where gi is the frequency of the
ith genotype. In addition, heterozygosity of almond cultivars
was calculated as the number of heterozygous loci for a
given cultivar divided by the total number of loci assayed.
Mean character difference distances were calculated for
all pairwise comparisons with the MEGA test (Kumar et al.,
2001), which was used to construct neighbor-joining (NJ)
dendrograms depicting the phenetic relationship among geno-
types. Relative support for the branches in each dendrogram
was assessed with 2000 replicates of NJ bootstrap.
3. Results
3.1. Polymorphism and heterozygosity of SSR markers
Amplification was successful in almond with the different
SSR markers initially developed for peach and a high level of
polymorphism was detected in all of them. The number of
presumed alleles revealed by the SSR analysis was similar in
the case of the utilization of ASCE and PAGE (from 9 to 12)
(Table 2).
The analysis of DNA fingerprinting using MAGE revealed a
lower level of polymorphism, from 5 to 8 alleles. Size range of
amplified bands was between 114 and 261 bp for all the
analysis methods. A total of 64 polymorphic bands were scored
using ASCE and PAGE, and 40 bands using MAGE. The mean
number of alleles per locus was 10.7 with ASCE and PAGE, and
6.7 with MAGE (Table 2).
On the other hand, direct-count heterozygosities of SSR
markers were higher in the case of the ASCE and PAGE
methods in comparison with MAGE in concordance with the
higher number of allele revealed. They ranged from 0.57, for
the SSR marker MA40a (using MAGE) to 0.95 for pchgms3
(using ASCE and PAGE), with average of 0.86 (ASCE and
PAGE), and 0.75 (MAGE) for all loci studied. However,
power of discrimination was similar with the tree methods
assayed in spite of the big differences observed in the
number of alleles revealed. The average of this parameter for
all loci was 0.92 for ASCE and PAGE and 0.86 for MAGE
(Table 2).
3.2. DNA fingerprinting and heterozygosity of almond
cultivars
Table 3 shows the results on molecular identification of the
21 almond cultivars examined. Size differences detected
between alleles at a locus ranged from 2 bp (observed in all
the SSR markers assayed) to 12 bp (MA40a). All primer pairs
produced a maximum of two bands per cultivar, in accordance
with the diploid constitution of this species. Fingerprinting
obtained using ASCE and PAGE was similar. However,
differences between these two methods and MAGE in the
score of bands were very important in concordance with the loss
of polymorphism observed with the use of MAGE in
comparison with ASCE and PAGE. Discrepancies among
MAGE, ASCE and PAGE were observed when size differences
in SSR fragments were between 1 and 5 bp in most of cases. In
these situations the interpretation of band between MAGE and
the other two methods were different.
On the other hand, heterozygosities of almond cultivars
were higher with the use of ASCE and PAGE in comparison
with MAGE in concordance with the higher number of alleles
R.
Sa
nch
ez-Perez
eta
l./Scien
tiaH
orticu
ltura
e1
08
(20
06
)3
10
–3
16
31
3
Table 3
Comparison between the DNA fingerprinting obtained in each almond cultivars using the peach simple sequence repeat (SSR) sequences and analyzing the DNA polymorphisms using automated sequencer capillary
electrophoresis (ASCE), polyacrylamide electrophoresis (PAGE) and MetaPhor1 agarose electrophoresis (MAGE)
Almond cultivars pchgms3 BPPCT007 CPPCT005 MA27a MA40a UDP96005
ASCE PAGE MAGE ASCE PAGE MAGE ASCE PAGE MAGE ASCE PAGE MAGE ASCE PAGE MAGE ASCE PAGE MAGE
Achaak 212 jj gg 124/145 ae ac 142/152 eh ce 122/138 di be 226/234 fi de 127/158 bi ag
All in one 176/188 eg ce 145/153 ei cd 122/130 ab ab 128/140 fj ce 212/228 bg bd 130/140 ce bd
Antonieta 170/174 bd ab 124/149 ag ad 122/154 ai ae 118/134 bh bd 226/246 fj df 135/140 de cd
Ardechoise 174/176 de bb 143 dd cc 130/138 bc bc 114/118 ab ab 222 ee cc 127/155 bh ag
Bonita 168/196 ah ae 124 aa aa 130/142 be bc 118/126 be ac 230 hh dd 125/140 ae ad
Chellastone 172/204 ci af 132/158 bj be 130/138 bc bc 114 aa aa 214/220 cd bc 147/158 gi fh
Desmayo 170/174 bd ab 143/145 de cc 142/152 eh ce 138/146 il ef 228/230 gh dd 125/140 ae ad
Ferragnes 174 dd bb 149/151 gh dd 122/138 ac ac 120 cc bb 226/246 fj df 140/155 eh dg
Garrigues 174/184 df bd 143/145 de cc 130/142 be bc 126 ee cc 222/258 ek cg 125 aa aa
Genco 174/188 dg cd 134/153 ci bd 122/154 ai ae 128/132 fg cd 212/230 bh bd 130/143 cf be
Glorieta 174 dd bb 143/151 dh cd 122/156 aj af 140 jj ee 226/228 fg dd 127/155 bh ag
Guara 170/172 bc aa 124/149 ag ad 138/154 ci ce 134/140 hj de 226/230 fh dd 135/155 dh cg
Lauranne 170/174 bd ab 124/151 ah ad 138 cc cc 118/132 bg bd 226/246 fj df 135/140 de cd
Marcona 170/174 bd ab 132/147 bf bc 130/158 bk bf 118/126 be bc 261 ll hh 140 ee dd
Marta 172/174 cd bb 124/151 ah ad 138 cc cc 140 jj ee 226/230 fh dd 155 hh gg
Masbovera 174 dd bb 143/151 dh cd 122/150 ag ae 140/144 jk ef 196/226 af ad 127/155 bh ag
Mission 168/188 ag ae 132/149 bg bd 130/140 bd bc 140/144 jk ef 228 gg dd 143/158 fi eh
Nonpareil 168/170 ab aa 132/149 bg bd 144/154 fi de 114/120 ac ab 212/258 bk bg 155/158 hi gh
Primorskii 174/188 dg cd 143/149 dg cd 150/156 gj ef 140/144 jk ef 196/228 ag ad 127/158 bi ah
R-1000 168/172 ac ab 124/132 ab ab 144/154 fi de 120/134 ch bd 212/226 bf bd 155 hh gg
Tuono 170/172 bc bb 124/149 ag ad 138/154 ci ce 134/140 hj de 226/230 fh dd 135/155 dh cg
Allele Size (pb)a a = 168, b = 170, c = 172,
d = 174, e = 176, f = 184,
g = 188, h = 196, i = 204;
j = 212
a = 124, b = 132, c = 134,
d = 143, e = 145, f = 147,
g = 149, h = 151, i = 153,
j = 158
a = 122, b = 130, c = 138,
d = 140, e = 142, f = 144,
g = 150, h = 152, i = 154,
j = 156, k = 158
a = 114, b = 118, c = 120,
d = 122, e = 126, f = 128,
g = 132, h = 134, i = 138,
j = 140, k = 144, l = 146
a = 196, b = 212, c = 214,
d = 220, e = 222, f = 226,
g = 228, h = 230, i = 234,
j = 246, k = 258, l = 261
a = 125, b = 127, c = 130,
d = 135, e = 140, f = 143,
g = 147, h = 155, i = 158
a Calculated using PRISM ABI1 genetic analyzer.
R. Sanchez-Perez et al. / Scientia Horticulturae 108 (2006) 310–316314
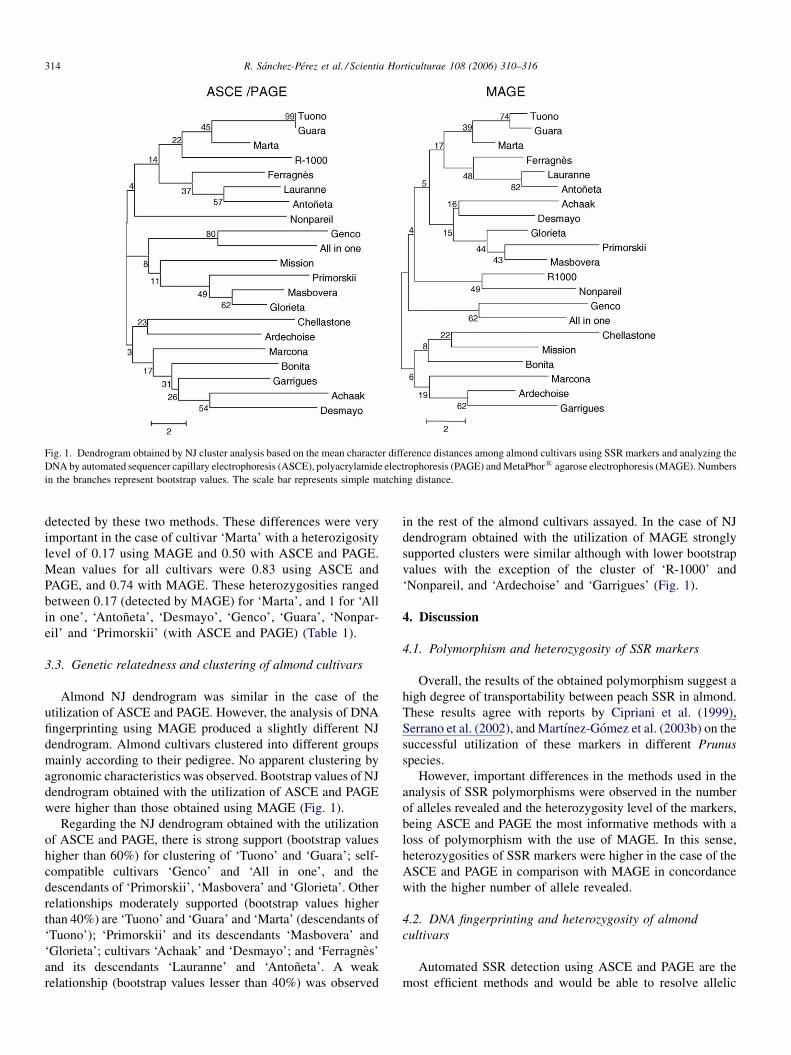
Fig. 1. Dendrogram obtained by NJ cluster analysis based on the mean character difference distances among almond cultivars using SSR markers and analyzing the
DNA by automated sequencer capillary electrophoresis (ASCE), polyacrylamide electrophoresis (PAGE) and MetaPhor1 agarose electrophoresis (MAGE). Numbers
in the branches represent bootstrap values. The scale bar represents simple matching distance.
detected by these two methods. These differences were very
important in the case of cultivar ‘Marta’ with a heterozigosity
level of 0.17 using MAGE and 0.50 with ASCE and PAGE.
Mean values for all cultivars were 0.83 using ASCE and
PAGE, and 0.74 with MAGE. These heterozygosities ranged
between 0.17 (detected by MAGE) for ‘Marta’, and 1 for ‘All
in one’, ‘Antoneta’, ‘Desmayo’, ‘Genco’, ‘Guara’, ‘Nonpar-
eil’ and ‘Primorskii’ (with ASCE and PAGE) (Table 1).
3.3. Genetic relatedness and clustering of almond cultivars
Almond NJ dendrogram was similar in the case of the
utilization of ASCE and PAGE. However, the analysis of DNA
fingerprinting using MAGE produced a slightly different NJ
dendrogram. Almond cultivars clustered into different groups
mainly according to their pedigree. No apparent clustering by
agronomic characteristics was observed. Bootstrap values of NJ
dendrogram obtained with the utilization of ASCE and PAGE
were higher than those obtained using MAGE (Fig. 1).
Regarding the NJ dendrogram obtained with the utilization
of ASCE and PAGE, there is strong support (bootstrap values
higher than 60%) for clustering of ‘Tuono’ and ‘Guara’; self-
compatible cultivars ‘Genco’ and ‘All in one’, and the
descendants of ‘Primorskii’, ‘Masbovera’ and ‘Glorieta’. Other
relationships moderately supported (bootstrap values higher
than 40%) are ‘Tuono’ and ‘Guara’ and ‘Marta’ (descendants of
‘Tuono’); ‘Primorskii’ and its descendants ‘Masbovera’ and
‘Glorieta’; cultivars ‘Achaak’ and ‘Desmayo’; and ‘Ferragnes’
and its descendants ‘Lauranne’ and ‘Antoneta’. A weak
relationship (bootstrap values lesser than 40%) was observed
in the rest of the almond cultivars assayed. In the case of NJ
dendrogram obtained with the utilization of MAGE strongly
supported clusters were similar although with lower bootstrap
values with the exception of the cluster of ‘R-1000’ and
‘Nonpareil, and ‘Ardechoise’ and ‘Garrigues’ (Fig. 1).
4. Discussion
4.1. Polymorphism and heterozygosity of SSR markers
Overall, the results of the obtained polymorphism suggest a
high degree of transportability between peach SSR in almond.
These results agree with reports by Cipriani et al. (1999),
Serrano et al. (2002), and Martınez-Gomez et al. (2003b) on the
successful utilization of these markers in different Prunus
species.
However, important differences in the methods used in the
analysis of SSR polymorphisms were observed in the number
of alleles revealed and the heterozygosity level of the markers,
being ASCE and PAGE the most informative methods with a
loss of polymorphism with the use of MAGE. In this sense,
heterozygosities of SSR markers were higher in the case of the
ASCE and PAGE in comparison with MAGE in concordance
with the higher number of allele revealed.
4.2. DNA fingerprinting and heterozygosity of almond
cultivars
Automated SSR detection using ASCE and PAGE are the
most efficient methods and would be able to resolve allelic
R. Sanchez-Perez et al. / Scientia Horticulturae 108 (2006) 310–316 315
variation among the almond cultivars at a finer scale in
comparison with MAGE. Moreover, ASCE detection is much
more expensive than the other two methods in term of cost
of equipment and cost of the analysis. In addition, PAGE is
more time-consuming and toxic than MAGE. On the other
hand, SSR detection using ASCE and PAGE can complicates
the identification of microsatellite alleles, mainly due to the
presence of ladder-like stutter patterns (Wunsch and Hormaza,
2002b).
SSR analysis using ASCE and MAGE, enable to detect a
higher number of SSR alleles, gave a higher heterozygosity
level in the almond cultivars assayed. In accordance with these
results, level of SSR heterozygosity described by Martınez-
Gomez et al. (2003b) in a wide range of almond cultivars using
the same MetaPhor1 agarose was 0.56, on average, for all
the cultivars studied. Results showed a higher level of
heterozygosity in almond cultivars (0.74 on average using
MAGE) in comparison with the results obtained with a simi-
lar set of peach SSR markers in peach cultivars (0.22) using
the same MetaPhor1 agarose by Martınez-Gomez et al.
(2003b). These results confirm the narrow genetic base
observed in peach when compared to the great diversity
observed in the almond cultivars probably due to mating-
system differences: selfing in peach and out crossing in
almond, as already found studying isoenzyme systems (Byrne,
1990).
4.3. Genetic relatedness and clustering of almond cultivars
DNA fingerprinting originated a phylogenetic dendrogram
similar in the case of ASCE and PAGE, while the analysis with
MAGE produced a slightly different NJ dendrogram.
However, the big differences observed in the DNA finger-
printing did not affect strongly the relationships observed in
both dendograms.
In general, relationships strongly and moderately supported
were similar in both cases, although bootstrap values of NJ
dendrogram obtained with the utilization of ASCE and PAGE
were higher than those obtained using MAGE, indicating the
larger number of observed bands with a higher polymorphism.
These results also indicate a higher accuracy of these SSR
polymorphism analysis methods (ASCE and PAGE) in
comparison with MAGE in the studies of genetic relatedness
in almond.
5. Conclusions
Results establish the value of SSR markers for identifica-
tion and distinguishing different genetic lineages and chara-
cterize a large gene pool available for almond breeding
programmes, because of their high polymorphism, abundance,
and codominant inheritance. In these studies, the analysis
of amplified PCR products by MetaPhor1 Agarose Gel
Electrophoresis (MAGE) has to be completed by the auto-
mated sequencer capillary electrophoresis (ASCE) or the
polyacrylamide gel electrophoresis (PAGE) analysis due to its
lower level of accuracy.
The DNA fingerprinting obtained by ASCE or PAGE could
be of great importance for a certification programme to protect
the new releases, particularly in the cases of species such as
fruit crops that involve vegetative propagation. For routine
SSR genotype analysis, for example in mapping of popula-
tions, MAGE is the most convenient method when DNA
amplified fragments differed in 5 bp or more, due to its lower
cost and easier routine application. Finally, the application of
SSRs for Marker Assisted Selection was described by Testolin
(2003), who indicated the possibility of finding SSR markers
near the encoding genome sequences. However, further
studies of SSR markers in progenies segregating for
agronomic traits have to be performed for the development
of genetic maps and markers associated with genes or QTLs
involved in the inheritance of agronomic traits.
Acknowledgements
This work has been financed by the project AGL2001-1054-
C03-01 (‘‘Mejora Genetica del Almendro’’) from the Spanish
Ministry of Science and Technology.
References
Ahmad, R., Potter, D., Southwick, S.M., 2004. Identification and characteriza-
tion of plum and plumcot cultivars by microsatellite markers. J. Hort. Sci.
Biotechnol. 79, 164–169.
Aranzana, M.J., Garcia-Mas, J., Carbo, J., Arus, P., 2002. Development and
variability of microsatellite markers in peach. Plant Breeding 121, 87–92.
Aranzana, M.J., Cosson, P., Dirlewanger, E., Ascasibar, J., Cipriani, G., Arus, P.,
Testolin, R., Abbott, A., King, G.J., Iezzoni, A.F., 2003. A set of simple-
sequence repeat (SSR) markers covering the Prunus genome. Theor. Appl.
Genet. 106, 819–825.
Byrne, D.H., 1990. Isozyme variability in 4 diploid stone fruits compared with
other woody perennial plants. J. Hered. 81, 68–71.
Cipriani, G., Lot, G., Huang, H.G., Marrazzo, M.T., Peterlunger, E., Testolin,
R., 1999. AC/GT and AG/CT microsatellite repeats in peach (Prunus
persica (L.) Basch): isolation, characterization and cross-species amplifica-
tion in Prunus. Theor. Appl. Genet. 99, 65–72.
Dirlewanger, E., Crosson, A., Tavaud, P., Aranzana, M.J., Poizat, C., Zanetto,
A., Arus, P., Laigret, L., 2002. Development of microsatellite markers in
peach and their use in genetic diversity analysis in peach and sweet cherry.
Theor. Appl. Genet. 105, 127–138.
Doyle, J.J., Doyle, J.L., 1987. A rapid isolation procedure for small quantities of
fresh leaf tissue. Phytoch. Bull. 19, 11–15.
Gupta, P.K., Balyan, H.S., Sharma, P.C., Ramesh, B., 1996. Microsatellites in
plants: a new class of molecular markers. Curr. Sci. 70, 45–54.
Hormaza, J.I., 2002. Molecular characterization and similarity relationships
among apricot genotypes using simple sequence repeats. Theor. Appl.
Genet. 104, 321–328.
Kumar, S., Tamura, K., Jakobsen, I.B., Nei, M., 2001. Molecular Evolutionary
Genetics Analysis, MEGA (http://www.megasoftware.net).
Martınez-Gomez, P., Sozzi, G.O., Sanchez-Perez, R., Rubio, M., Gradziel,
T.M., 2003a. New approaches to Prunus tree crop breeding. J. Food Agric.
Environ. 1, 52–63.
Martınez-Gomez, P., Arulsekar, S., Potter, D., Gradziel, T.M., 2003b. An
extended interspecific gene pool available to peach and almond breeding
as characterized using simple sequence repeat (SSR) markers. Euphytica
131, 313–322.
Morgante, M., Pfeiffer, A., Jurman, I., Paglia, G., Olivieri, A.M., 2001. PCR
analysis of SSR polymorphisms in plant using agarose gels. In: Karp, A.,
Isaac, P.G., Ingram, D.S. (Eds.), Molecular Tools for Screening Biodiver-
sity. Kluwer Academic Publishers, The Netherlands, pp. 206–207.

R. Sanchez-Perez et al. / Scientia Horticulturae 108 (2006) 310–316316
Sanchez-Perez, R., Ruiz, D., Dicenta, F., Egea, J., Martınez-Gomez, P., 2005.
Application of simple sequence repeat (SSR) markers in apricot breeding:
molecular characterization, protection, and genetic relationships. Scientia
Horticulturae 103, 305–315.
Serrano, B., Gomez-Aparisi, J., Hormaza, J.I., 2002. Molecular fingerprinting
of Prunus rootstock using SSRs. J. Hort. Sci. Biotech. 77, 368–372.
Sosinski, B., Gannavarapu, M., Hager, L.E., Beck, L.E., King, G.J., Ryder,
C.D., Rajapakse, S., Baird, W.V., Ballard, R.E., Abbott, A.G., 2000.
Characterization of microsatellite markers in peach (Prunus persica (L.)
Basch) Theor. Appl. Genet. 101, 421–428.
Testolin, R., 2003. Marker assisted selection (MAS) in stone fruits. XXVI
International Horticultural Congress, Toronto, Canada. Acta Hort. 633,
163–176.
Testolin, R., Marrazo, T., Cipriani, G., Quarta, R., Verde, I., Dettori, T.,
Pancaldi, M., Sansavini, S., 2000. Microsatellite DNA in peach (Prunus
persica L.) batsch and it use in fingerprinting and testing the genetic origin
of cultivars. Genome 43, 512–520.
Wunsch, A., Hormaza, J.I., 2002a. Cultivar identification and genetic finger-
printing of temperate fruit tree species using DNA markers. Euphytica 125,
56–67.
Wunsch, A., Hormaza, J.I., 2002b. Molecular characterisation of sweet cherry
(Prunus avium L.) genotypes using peach (Prunus persica L.) SSR
sequences. Heredity 89, 56–63.
Yamamoto, T., Mochida, K., Imai, T., Shi, Y.Z., Ogiwara, I., Hayashi, T., 2002.
Microsatellite markers in peach [Prunus persica (L.) Batsch] derived from
an enriched genomic and cDNA libraries. Mol. Ecol. Notes 2, 298–301.


![Effect of different electrolytes on the swelling properties of calyx[4]pyrrole-containing polyacrylamide membranes](https://static.fdokumen.com/doc/165x107/631f4fc8d10f1687490fbd44/effect-of-different-electrolytes-on-the-swelling-properties-of-calyx4pyrrole-containing.jpg)

