Measuring Author Research Relatedness: A Comparison of Word-based, Topic-based and Author Cocitation...
32
1 This is the accepted version of the following article: Lu, K., & Wolfram, D. (2012). Measuring author research relatedness: A comparison of word‐based, topic‐based, and author cocitation approaches. Journal of the American Society for Information Science and Technology, 63(10), 1973-1986. DOI: 10.1002/asi.22628 which has been published in final form at: http://onlinelibrary.wiley.com/doi/10.1002/asi.22628/full. Measuring Author Research Relatedness: A Comparison of Word-based, Topic-based and Author Cocitation Approaches Kun Lu & Dietmar Wolfram School of Information Studies, University of Wisconsin-Milwaukee P.O. Box 413, Milwaukee, WI 53201 E-mail: [email protected] , [email protected] Keywords: Author relatedness; Science maps; Multidimensional scaling; Topic model; Co-word analysis Abstract Relationships between authors based on characteristics of published literature have been studied for decades. Author cocitation analysis using mapping techniques has been most frequently used to study how closely two authors are thought to be in intellectual space based on how members of the research community co-cite their works. Other approaches exist to study author relatedness based more directly on the text of their published works. In this study we present static and dynamic word-based approaches using vector space modeling, as well as a topic-based approach based on Latent Dirichlet Allocation for mapping author research relatedness. Vector space modeling is used to define an author space consisting of works by a given author. Outcomes for the two word-based approaches and a topic-based approach for 50 prolific authors in library and information science are compared with more traditional author cocitation analysis using multidimensional scaling and hierarchical cluster analysis. The two word-based approaches produced similar outcomes except where two authors were frequent co-authors for the majority of their articles. The topic-based approach produced the most distinctive map.
Transcript of Measuring Author Research Relatedness: A Comparison of Word-based, Topic-based and Author Cocitation...

1
This is the accepted version of the following article: Lu, K., & Wolfram, D. (2012). Measuring author research
relatedness: A comparison of word‐based, topic‐based, and author cocitation approaches. Journal of the American
Society for Information Science and Technology, 63(10), 1973-1986. DOI: 10.1002/asi.22628
which has been published in final form at: http://onlinelibrary.wiley.com/doi/10.1002/asi.22628/full.
Measuring Author Research Relatedness: A Comparison of Word-based,
Topic-based and Author Cocitation Approaches
Kun Lu & Dietmar Wolfram
School of Information Studies, University of Wisconsin-Milwaukee
P.O. Box 413, Milwaukee, WI 53201
E-mail: [email protected], [email protected]
Keywords: Author relatedness; Science maps; Multidimensional scaling; Topic model; Co-word analysis
Abstract
Relationships between authors based on characteristics of published literature have been studied for
decades. Author cocitation analysis using mapping techniques has been most frequently used to study
how closely two authors are thought to be in intellectual space based on how members of the research
community co-cite their works. Other approaches exist to study author relatedness based more directly on
the text of their published works. In this study we present static and dynamic word-based approaches
using vector space modeling, as well as a topic-based approach based on Latent Dirichlet Allocation for
mapping author research relatedness. Vector space modeling is used to define an author space consisting
of works by a given author. Outcomes for the two word-based approaches and a topic-based approach for
50 prolific authors in library and information science are compared with more traditional author cocitation
analysis using multidimensional scaling and hierarchical cluster analysis. The two word-based approaches
produced similar outcomes except where two authors were frequent co-authors for the majority of their
articles. The topic-based approach produced the most distinctive map.

2
Introduction
The study of scientific production measured through publications has a long history. To better understand
patterns and relationships in scientific production, various tools have been developed. Science mapping is
one of the most useful tools to visualize scientific structure. It helps to identify scientific themes, and
discover new knowledge. The unit of interest for mapping may include authors, articles, and journals. The
essence of a science map is the measure of relatedness among the units. To date, five approaches have
been used to measure the relatedness between authors, where the nature of the relationship studied is
based on the data used: direct citation, cocitation analysis, co-authorship analysis, bibliographic coupling
analysis and co-word analysis (discussed below). All have been successfully applied to visualize scientific
structure and to describe author relatedness. Recently, more sophisticated hybrid methods (i.e. using
textual content and citations) have been applied to the mapping of articles (Cao & Gao, 2005; Ahlgren &
Colliander, 2009; Boyack & Klavans, 2010) and journals (Liu et al., 2010). To the best of our knowledge
the uses of textual content and, more specifically, a topic model (e.g. Deerwester et al., 1990) to
determine the relatedness of authors have not been studied yet.
In this study we propose new textual feature-based approaches based on co-occurring words that apply
vector space modeling to measure the relatedness of authors’ research. A topic-based approach using
Latent Dirichlet Allocation (LDA) modeling is also applied to capture the latent topical features from the
occurrence and the co-occurrence of words within a document and across documents created by authors.
Two authors will be similar to each other if they write similar content and topics. These new approaches
can be used as complementary techniques to those currently used to generate author maps.
More specifically, the purpose of the present research is to:
1. Propose three new methods, two word-based, one topic-based, to measure author research relatedness
based on the content of their publications.

3
2. Compare multidimensional scaling (MDS) and hierarchical clustering outcomes of the proposed word-
based models, the topic-based model and the widely used author cocitation analysis (ACA) for a group of
authors.
As an initial investigation of these topics, our focus will be on authors whose publications appear in the
highest impact library and information science journals.
Related Work
The literature review section covers two parts. The first section reviews existing techniques used for
mapping bibliometric units. The second section briefly reviews the relevant models used in the study. It
includes an introduction to the essential ideas of the vector space model, how it applies to the current
study, and provides a short introduction to the LDA or topic model.
Bibliometric Relatedness Measures
Many bibliometric studies have formulated quantitative measures to map scientific structure at different
levels of granularity including authors, articles and journals. In reviewing visualization studies for
knowledge domains, Börner, Chen and Boyack (2005) categorized relatedness measures into two broad
categories: citation linkages and co-occurrence similarities. Within the relatedness measures, five basic
approaches were identified: direct citation, cocitation analysis, co-authorship analysis, bibliographic
coupling and co-word analysis.
Direct citation
Direct citation accounts for the relatedness between a citing work and a cited work based on citing
behavior. This measure is usually asymmetric. Shibata et al. (2008) explored citation networks for two
research domains and divided the networks into clusters in order to identify research fronts. Direct
citation has not attracted wide attention. One possible reason may be its requirement for a very long time
window to obtain a sufficient linking signal for clustering (Boyack & Klavans, 2010).

4
Bibliographic coupling
The idea that two articles that share the same references are related, referred to as bibliographic coupling,
was outlined by Kessler (1963). The more references two articles have in common, the more closely
related they are thought to be. Note that this list is static over time because references within articles do
not change. With the interrelation of this link, scientific products can be ordered into groups. Weinberg
(1974) reviewed the theory and practical applications of bibliographic coupling and granted the
usefulness of the method. More recently, Zhao and Strotmann (2008) aggregated bibliographic coupling
at an author’s oeuvre (body of work) level, which they called Author Bibliographic-Coupling Analysis
(ABCA). They found ABCA can provide an effective picture of current active research in a field.
Cocitation analysis
Cocitation analysis, introduced by Small (1973), is probably the most influential approach for assessing
relatedness measures. If two articles are cited by the same third article, these two articles are co-cited. The
assumption is that the appearance of two articles in the same reference list indicates a semantic
association between the articles. Unlike traditional bibliographic coupling, cocitation is a dynamic
relationship based on the citing authors. New citing authors can change the cocitation relationship. This
feature is important because science is developing continuously. Relationships among scientific units
being studied should be able to incorporate this dynamic change.
White and Griffith (1981) first applied cocitation techniques to authors, called author cocitation analysis
or ACA. The essential transformation is to consider “Author” as a body of writings by a person (i.e. an
oeuvre). So the cocitation of authors applies to any work by any author being co-cited with any work by
another author. Multidimensional scaling and factor analysis have been employed to describe the
scientific structure of information science authors. Since then, a number of studies have been conducted
using variations of the ACA method, including normalization (Ahlgren, Jarneving & Rousseau, 2003;
White, 2003; Leydesdorff & Vaughan, 2006; van Eck & Waltman, 2009), author counts (Zhao &

5
Strotmann, 2011) and last author ACA (Zhao & Strotmann, 2010). One disadvantage of cocitation
analysis is the lack of cognitive interpretation of the relatedness of the co-cited units. Without enough
domain knowledge, one can hardly interpret the cocitation map. Leydesdorff (1987) argued that cocitation
maps only partially represent the structure of science. One possible solution to this problem is to interpret
the ACA map with word analysis. Toward this end, Braam et al. (1991) combined cocitation and word
analysis. Word-profile analysis was used to examine the cognitive relatedness of documents within the
same cocitation cluster.
Co-authorship analysis
A co-authorship relationship is established when authors co-publish a paper. Glänzel (2001) studied
international co-authorship links to reveal the structures in international collaborations. Liu et al. (2005)
constructed a network with co-authorship relations in the field of digital libraries. Ding (2011b) studied
scientific collaborations and citation patterns of researchers and combined the results with a topic model
approach to examine collaborations among researchers who share similar and different research interests.
Although co-authorship has been considered one measure of author relatedness, it reflects a stronger
social tie among the collaborating authors than any other relatedness measure. It is this feature of co-
authorship that makes co-authorship analysis more revealing of a social network rather than a scientific
structure.
Co-word analysis
Co-word analysis collects evidence of relatedness from co-occurring keywords from different articles.
Compared with the approaches introduced earlier, co-word analysis directly uses actual contents to
measure relatedness whereas the others find indirect evidence through citation and co-author relations. An
obvious advantage of co-word analysis is that relatedness can be interpreted directly according to
document contents.

6
Coulter et al. (1998) mapped the discipline of software engineering with co-word analysis. Indexing terms
from the ACM computing Classification System were used as the unit of analysis. Ding et al. (2001)
conducted a co-word analysis on a sample of 2,012 articles from the Web of Science (WoS) to reveal
themes of information retrieval research. Both professionally assigned keywords and keywords from titles
and abstracts were extracted. Standardization was applied to map the keywords to a controlled vocabulary.
The study demonstrated the feasibility of co-word analysis as a method to extract patterns from a text
corpus. In these co-word analysis works, the co-occurrences of keywords in articles were used as an
indication of their association strengths to map the relatedness of the keywords. In the present study,
words will be used to determine higher level relatedness: the relatedness of authors. Two authors are
similar to each other if they have written similar content.
Like other approaches, co-word analysis has its own weaknesses. Leydesdorff (1997) noted that the
meaning of words change from position to position and from one text to another. He also suggested this
change will destabilize the science map produced by co-word analysis. Another disadvantage of using
indexer assigned keywords as the source for co-word analysis is the “indexer effect” (Law & Whittaker,
1992), which creates bias through factors such as the artificiality of an indexing language, delays in
changes to the indexing language to reflect the current state of a discipline, and subjectivity in the
assignment of index terms.
Background Information on Relevant Models to be Used
In the current study, the vector space model, applied widely in information retrieval research, serves as
the framework to determine author relatedness for two word-based approaches. LDA topic modeling is
used to determine author relatedness for the topic-based approach. The following sections provide a brief
review of the relevant models.

7
Vector Space Modeling
The vector space model is one of the most influential models in information retrieval (Salton and McGill,
1983). In this model, each document is represented as a vector and the elements of the vector consist of
words appearing in the collection. The document vectors in a collection constitute a document term
matrix. The value of each element represents the term significance in the document. By virtue of the
vector space model, documents are transformed into vectors. Traditional measures like angle (e.g. based
on a cosine measure) and distance (e.g. Euclidean distance) can be used to measure the similarity between
documents. In the vector space, a number of documents constitute a document space. The centroid of the
document space is a summarization of the characteristics of the space. It represents the average vector for
a group of documents.
In the current study, all of the articles in our data collection will constitute a collection space. Each author
will be viewed as a document space consisting of the articles he/she has written. This space is a subspace
of the collection space, named the author space. The centroid of the author space will be used to represent
the author. The relatedness between authors will be measured through the similarity between the centroids
of their author spaces.
Topic Model- Latent Dirichlet Allocation
The vector space model assumes independence among the words in the documents. However, in the real
world, this assumption is rarely valid because the terms are associated with each other due to their
semantics. The topic model is an improvement over the basic vector space model in terms of relieving the
independence assumption and capturing the term associations. Instead of assuming independence among
terms, the topic model assumes exchangeability among terms in documents, which is a much looser
assumption. Early works on the topic model include Latent Semantic Indexing (LSI) by Deerwester et al.
(1990) and the probabilistic LSI (pLSI) by Hofmann (1999). LDA is a more recent technique proposed by

8
Blei et al. (2003). It has an advantage over LSI in explicitly modeling the latent topics, and over pLSI in
solving the over-fitting problem (i.e. a model with too many parameters).
The LDA model treats a document as a mixture of topics and a topic as a mixture of terms. Each
document (i.e. a mixture of topics θ) is generated from a latent Dirichlet distribution with a prior of α, and
each topic (i.e. a mixture of terms φk) is generated from a Dirichlet distribution with a prior of β. The
generation process entails first, sampling a document θd from Dir(α). At each position of a word in a
document, a topic z is selected according to θd, and a word w is selected according to z and φk. Figure 1
plots the plate notation of the generating process:
FIG. 1. Graphic model representation of LDA.
In the above figure, white circles indicate latent variables and gray circles indicate observed variables.
Arrows indicate conditional dependencies between variables. Plates indicate repeated sampling and the
number in the lower right of the plate indicates the number of repetitions. So k is the number of topics, Nd
is the length of a document, and M is the number of documents in the collection. In the model, α and β are
hyperparameters that define the nature of the priors on θ and φ.
Rosen-Zvi et al. (2010) extended the original LDA model to include authors and proposed the author-
topic model (Figure 2).

9
FIG. 2. Graphic model representation of author-topic model.
This model includes authorship information in the generative process. Each document has a number of
authors ad . Each author is considered as a distribution of topics drawn from a Dirichlet distribution with a
prior of α. For each word in a document, an author x is randomly drawn from ad and the topic distribution
associated with this author is θx. Then a topic z is selected the same way as in a LDA model to generate
the observed word w. The advantage of this author-topic model is that it adds authorship information to
the model, so that the topics are learned and assigned to documents accordingly. In the output of this
model, each author is a distribution of different topics; each topic is a distribution of terms. As the
purpose of the current study is to measure the relatedness of authors, the author-topic model will be
appropriate to produce author similarities based on their topics. Gibbs sampling (Griffiths & Steyvers,
2004) is used to estimate the parameters in the model.

10
Method
Data Collection
Journals with the highest impact factor in the category of “information science & library science” (LIS)
appearing in the Journal Citation Report 2009 Social Sciences Edition were identified. Journals
associated with allied subject areas such as Management Information Systems and Medical Informatics,
were excluded. Table 1 lists the eight journals selected for inclusion in the study. Although ARIST
(Annual Review of Information Science and Technology) publishes reviews and not research articles,
these publications still represent topical areas of expertise of the authors. Bibliographic records for
documents published in these journals between 2000 and 2010 were downloaded. Records downloaded
were further limited to three document types: articles, proceedings papers and reviews. The other
document types were less likely to represent research contributions by the authors.
TABLE 1. Selected journals.
Journal Title Impact Factor
# of records retrieved before refinement
document types
# of records downloaded
Journal of Informetrics 3.379 172 162
Annual Review of Information Science and
Technology
2.929 135 118
Journal of the American Society for Information
Science and Technology (covering the years 2001-2010)
2.3 1897 1451
Scientometrics 2.167 1485 1390
Information Processing & Management 1.783 881 749
Journal of Information Science 1.706 548 495
Online Information Review 1.423 1053 482
Journal of Documentation 1.405 844 380
Total 7015 5227
In total, 5,227 records were downloaded from WoS. The raw WoS records were processed, and only three
fields were kept: the article title (i.e. “TI” field), the Keywords Plus (i.e. “ID” field), and the abstract (i.e.

11
“AB” field). The records then were indexed with the widely used Lemur information retrieval toolkit
(http://www.lemurproject.org/). Stop words were removed and stemming was applied.
Author Selection
From the 5,227 records downloaded, we were able to identify 6,282 different author names using string
matching. Because it is impractical to map all of the authors in our collection, we selected the 50 most
prolific authors according to the WoS “analyze results” function. A larger number of authors could be
selected, but would result in a more densely populated map that would be more difficult to interpret when
all of the names are superimposed. We selected the most prolific authors because the more an author
writes, the better the algorithm used “understands” her/his interests, and thus the more accurate our
assessment will be.
Author Space
With the 5,227 records, we identified the authorship relation between each of the top authors using the
articles they wrote. For each author in our author list we then generated an author space which consists of
all the articles he/she wrote. TF*IDF term weighting was employed to assign term significance in the
space. Terms that were single characters or only consisted of digits (e.g. “2001”) were filtered out. We
believe that these terms add noise into the space rather than meaning. The relatedness between authors is
measured through the cosine between the centroids of the author spaces.
Static author space vs. dynamic author space
Using the content of publications to determine the strength of the relationship between authors introduces
a potentially confounding factor. The similarity between co-authors may be high because the text of the
publications they have co-written will be used to determine the strength of their relationships. One could
argue that this creates a biased assessment of the strength of the relationship because there is an exact
match for the text of the co-authored publications that creates a stronger bond than for two authors who
have published in a common area but did not collaborate. On the other hand, the simple fact that the

12
collaboration has resulted in one or more co-authored documents should be acknowledged as a strong tie
between the authors. The strength of the relationship can be assessed both ways, where the common
publications are included or excluded. Accordingly, we propose a static author space and dynamic author
space to fulfill this goal. In a static space, each author has her/his own space which consists of her/his
articles. This space does not change when measuring author relatedness. In the static author space, the co-
authorship is not controlled. The relatedness of authors will include the similarity arising from the
strength of the co-authorships. Conversely, in the dynamic author space, the author spaces depend on a
pair of authors. Co-authored articles by the pair of authors are excluded. In this case, each author may
have a different author space when measured with different authors. Within the dynamic space the co-
authorship similarity is controlled because the co-authored articles are filtered out before the similarity is
calculated. It is of interest to understand how two authors are related with or without their collaborative
works.
Measure of Relatedness
The vector space model provides a number of readily available measures of relatedness. The most popular
is the cosine measure, which measures the cosine of the angle formed by two vectors in the space. It
basically measures the term weight distribution between two vectors. The more similar the distribution is,
the higher the cosine value is expected to be. Therefore, the cosine similarity measure is adopted in our
study to measure the relatedness between the centroids of two author spaces.
Topic Model Training
Gibbs sampling (Griffiths & Steyvers, 2004) was used to estimate the parameters in the author-topic
model. We set the number of iterations to 1,000. The hyperparameter α was set to 50/K where K is the
number of topics and hyper β is set to 0.01. We tested different K, or numbers of topic, values and
decided to report the results from K=20 because it produced the most reasonable outcome by our
judgment. Too few topics do not allow authors to be distinguished, whereas too many may cause

13
relationships to be weaker. Perplexity analysis could have been applied to decide the number of topics
(Blei, Ng & Jordan, 2003). However, perplexity measures the generalization ability of a trained model
which does not have much meaningful interpretation in our study because we are interested in identifying
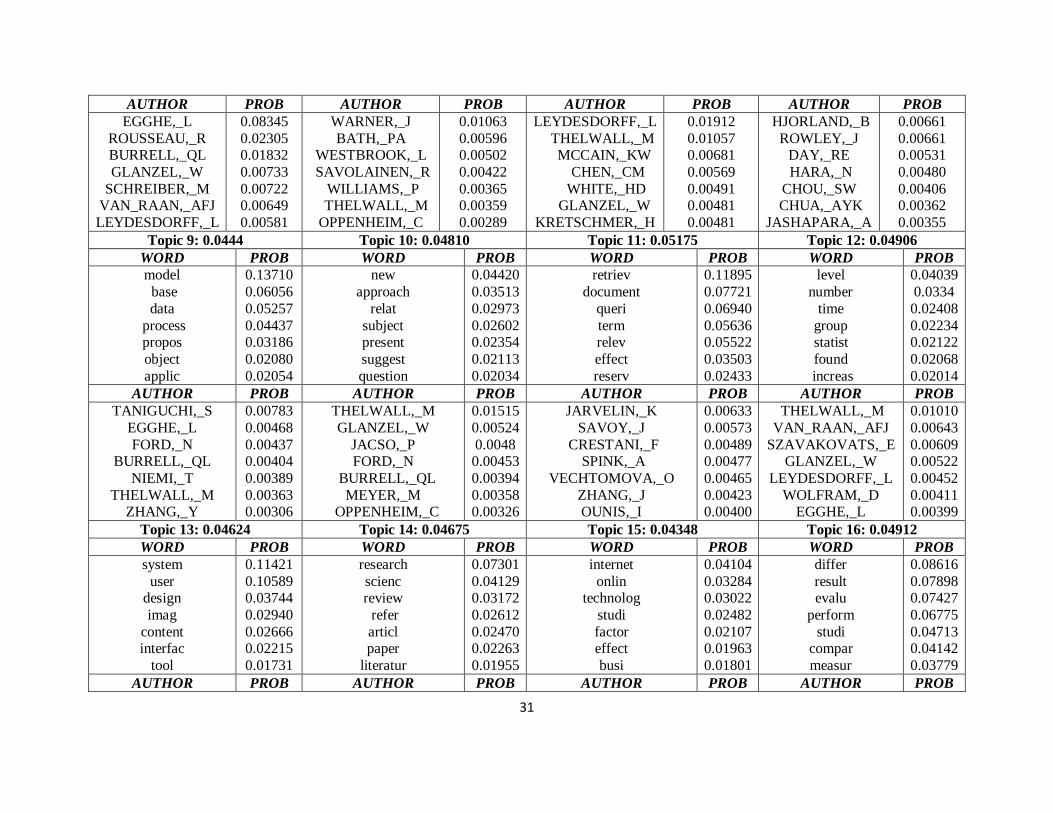
author relatedness based on our data. The topic model toolbox was employed to perform the learning
process (http://psiexp.ss.uci.edu/research/programs_data/toolbox.htm). The result from the topic model
training is provided in the appendix. The table includes the top words and authors for each topic as well as
their probabilities.
Mapping and Comparison with Cocitation Outcome
An author-topic LDA model (Rosen-Zvi et al., 2010) was trained on our collection and a pair-wise cosine
similarity measure comparison of the 50 authors was conducted, resulting in a symmetric matrix of
similarity values based on the LDA modeling. Similarity matrices were also calculated for both the static
and dynamic author spaces. Multidimensional scaling was used to visualize the relationships among the
authors. A more traditional cocitation matrix for the 50 authors was also generated to permit a subjective
comparison between the static and dynamic word-based, LDA, and author cocitation outcomes. The
cocitation counts were extracted from the cited reference (i.e. “CR” field) of our data, so only the first
author cocitation was tallied. Because the data represent a type of similarity measure, SPSS PROXSCAL
was used to construct the map, as recommended by Leydesdorff and Vaughan (2006). To provide
additional insights into the grouping of the authors, hierarchical cluster analysis (complete linkage method)
was used in SPSS to superimpose groups of authors on the MDS maps to provide an additional means to
assess the coherence in the resulting proximities between authors. MDS map outcomes could also be
interpreted without these generated clusters.

14
Results
Basic Collection Statistics
Table 2 includes some basic statistics for the collection we used to generate the author maps. After
tokenization of the field contents 916,383 tokens, or individual words, were identified; the number of
unique tokens, or distinct words, was 12,537. The average document length was 175.32 tokens.
TABLE 2. Basic collection statistics.
# of authors # of documents # of tokens # of unique tokens Avg. doc length
6228 5227 916,383 12,537 175.32
Author Similarities
An obvious advantage of the text-based similarity is that the link between authors is interpretable. When
we computed pair-wise similarities for the authors, we also calculated the top contributing terms (or
topics for the LDA) so that we could better understand the reason why two authors are similar. To provide
a sense of how these top terms help us to understand the links, we list a number of author similarities
from the static author map in Table 3. The outcome for the dynamic map has the same format. For the
LDA map, the terms are replaced with topics.
According to Table 3 “Thelwall, M” and “Glanzel, W” have a similarity of 0.39 in the static map, in
which “citation” contributes the 12% of the similarity, “link” 6%, followed by “impact” 4%, “science”
3% and “subject” 2%. With the information provided by the top terms, one can see how the two authors
are related. To help read the similarity values, basic descriptive statistics of the values of the pair-wise
similarity for static author map, dynamic author map and LDA map are provided in Table 4. For the top
50 authors, there are 1,225 pairs of similarity values in total for each map.

15
TABLE 3. A demonstration of author similarities and the top contributing terms.
Author 1 Author 2 Similarity Top contributing terms
THELWALL_M GLANZEL_W 0.39 citat:12% link:6% impact:4% scienc:3% subject:2%
SPINK_A JANSEN_BJ 0.83 search:26% queri:11% web:10% engin:9% session:5%
BAR-ILAN_J WOLFRAM_D 0.40 page:14% search:11% web:8% tag:5% engin:4%
EGGHE_L BURRELL_QL 0.47 informetr:12% distribut:7% index:7% curv:5%
concentr:4%
CHEN_HC YANG_CC 0.39 chines:8% web:6% search:6% english:5% user:4%
NICHOLAS_D HUNTINGTON_P 0.99 log:14% kiosk:5% behaviour:5% site:4% health:4%
BORNMANN_L DANIEL_HD 0.97 fellowship:8% manuscript:7% review:7%
reject:5% peer:5%
JANSEN_BJ BURRELL_QL 0.08 model:5% time:4% process:3% investig:3%
approxim:3%
WOLFRAM_D VAKKARI_P 0.29 search:17% queri:7% term:6% session:5% ir:3%
GLANZEL_W MOED_HF 0.55 citat:15% journal:12% impact:6% bibliometr:5% indic:3%
TABLE 4. Descriptive statistics of similarity values in three maps (N=1225).
Mean Median Std. Deviation Minimum Maximum
Static author map 0.2352 0.2100 0.1122 0.05 0.99
Dynamic author map 0.2276 0.2100 0.0949 0.00 0.65
LDA map 0.4106 0.3500 0.2430 0.03 0.97

16
The average similarity value for the LDA map is much higher than the two word-based maps. This may
be due to the effect of the topic model. As a topic consists of a mixture of terms, to measure topical
similarity it is possible that two different terms (e.g. “car” and “vehicle”) will be considered topically
similar and will then contribute to the similarity. This is helpful for identifying relatedness arising from
mismatched terminology.
Map Comparison
Four author similarity maps were generated: a static author map, a dynamic author map, a LDA author map, and an
author cocitation map. The static author map and dynamic author map were constructed from the similarities
between the author spaces. The difference is that the former map includes the similarities for co-authored works,
whereas the latter excludes these similarities when calculating the pair-wise similarity. The LDA map is built on
topical similarity. The cocitation map serves as a comparison here. An examination of the pair-wise correlation of
these author relatedness measures reveals significant and moderate level correlations between the word-based, topic-
based and author cocitation measures (Table 5). It is not surprising that the static author map has a high correlation
with the dynamic author map (Kendall’s tau b=0.971). Similarly, the correlations among the three content-based
approaches are generally higher than their correlations with the cocitation approach. This provides preliminary
evidence that they measure different types of relationships.
Outcomes from the hierarchical cluster analysis were superimposed on the maps. Labels for the author
groups were assigned by us according to the themes inherent in the top-weighted terms in each cluster.
The number of clusters selected was based on the joining distance at which clusters were combined in the
cluster dendrogram. A large distance between clusters before being joined provides an indication of the
distinctiveness of the clusters. Two to four clusters are displayed on each map based on a large clustering
distance. The same number of clusters could have been selected for all the maps, but the linking distances
between some agglomerations was so small that the groups would not have been as distinctive. In all
cases, the largest singular group consists of authors who work with different aspects of metrics-based

17
studies, which is labeled as “Informetrics” in general in the two word-based maps and “Scientific impact
evaluation” in the other two maps. This labeling indicates that the metrics-related topics have been a
frequently investigated theme by the prolific authors in the selected journals during the first decade of
twenty-first century. It is also noteworthy that the topic groupings of each of the maps largely aligns along
the horizontal or vertical axis, with one side representing information retrieval (system and behavior) and
web studies, with the other side corresponding to metrics-based or scientific evaluation studies.
TABLE 5. Correlations between Different Measures (N=1225).
Static Author Map Dynamic Author Map LDA Author Cocitation
Map
Static Author Map 1.00 0.971** 0.487** 0.433**
Dynamic Author Map 0.971** 1.00 0.476** 0.432**
LDA 0.487** 0.476** 1.00 0.401**
Author Cocitation
Map
0.433** 0.432** 0.401** 1.00
(Values in cells are Kendall’s tau-b correlation, ** indicates significant at the 0.01 level with 2-tailed test)
Static author map and dynamic author map comparison
As is shown from the maps, the static map (Figure 3) and dynamic map (Figure 4) are generally
consistent in terms of the location of the authors which indicates that the exclusion of similarities
resulting from collaborations does not affect the overall layout. However, drastic changes may happen to
individuals who have collaborated frequently with another author. One notable change is for
“Bornmann_L” and “Daniel_HD” who were co-authors in a large portion of their works included in this
study. They have a similarity of 0.97 in the static map. After removing the collaborative works their
similarity becomes 0.12 which indicates that their non-collaborative works are not as similar. In the case
of “Jansen_BJ” and “Spink_A”, who have collaborated frequently with each other and have each written
in similar areas separately, they are close to each other in both maps. This indicates that they are similar

18
to each other irrespective of whether collaborative works are included or not. In an extreme case where
“Huntington_P” co-authored with “Nicholas_D” on every article in our data collection, we treated their
similarity as a missing value in the dynamic map. Both the static map and dynamic map have the most
distinctive cluster separations when the hierarchical clustering is viewed from the two cluster level. In
both maps, the left half consists of researchers from information retrieval and the right half represents the
authors who contributed to the informetrics area. Several authors are close to the cluster boundary and
one switches between the two clusters (“Ding_Y”), indicating that their research interests could overlap
both areas. Given the high correlation between the static and dynamic author maps, it is expected that the
overall layouts will be very similar in both maps. This observation may not be generalized to other data
collections. Which map to explore depends on whether one wishes to have the co-authorship relation
embedded or not. However, it should be noted that the static author map is more computationally efficient
than the dynamic author map because less processing is needed.
FIG. 3. Map for static author space (Normalized raw stress 0.03839).

19
FIG. 4. Map for dynamic author space (Normalized raw stress value 0.04232).
Cocitation map and LDA author map comparison
Three distinct clusters emerge from the hierarchical cluster analysis based on cocitations (Figure 5). It can
be seen from Figure 5 that the overall layout of the clusters is not as distinctive as the other content-based
maps. One cluster (containing “Ho_YS”, “Thelwall_M” and “Ding_Y”), dealing primarily with
bibliometrics and webometrics, is situated roughly between the clusters for scientific impact evaluation
and information retrieval. The clustering outcome does not provide a very coherent map of authors based
on their proximities. For example, “Wilson_CS” and “Kretschmer_H” are included in the “Webometrics”
group. Based on their publications used in the study they would be more appropriately categorized with
the “Scientific impact evaluation” group. The lower right cluster, which contains authors who deal with
the topic of information retrieval and search engine log analysis, is well defined. Some authors are
positioned near the edge of the cocitation map (“Jamali_HR”, “Foo_S”, “Thijs_B”) because they have

20
received fewer citations. Their locations do not necessarily reflect their topical relatedness with the other
authors in this case. The overall layout of the MDS map seems to be more central-peripheral rather than
having distinctive regions. Much of the space on lower left and upper right is empty. For an exploratory
purpose, one may not obtain as much information as from content-based maps. A notably low normalized
raw stress value (0.0228) of the cocitation map, however, indicates that the map reflects a good fit with
the cocitation relationship.
FIG. 5. Cocitation map (Normalized raw stress 0.02280).
At the four-cluster agglomeration, the LDA map (Figure 6) provides the most coherent representation of
the author map in relation to the generated clusters. At the two-cluster agglomeration, the clusters are
neatly divided along the vertical axis, with metrics-related research represented on the left, and Web and
information retrieval-related themes on the right. Although the group membership of some individuals is

21
still debatable, such as “Ingwersen_P” in the “Scientific impact evaluation” group given that he has also
published in information retrieval and webometrics, the overall layout of the LDA map does provide
semantically meaningful relationships.
FIG. 6. Map for LDA 20 topics (Normalized raw stress 0.02856).
Word-based maps and LDA map comparison
Both word-based maps (i.e. static author map and dynamic author map) and the LDA map collect
evidence of relatedness from the content of the publications. The difference between them is that the LDA
map is generated based on topical similarities. When comparing the resulting maps, some notable
differences can be found. First, the overall layout of the clusters in the LDA map is more distinctive than
the word-based maps. The four themes are well positioned into the four quadrants of the LDA map while
for the word-based maps only two themes can be distinctively identified based on the hierarchical

22
clustering distance. In fact, at the two-cluster agglomeration, the two themes in the LDA map align well
with those in the word-based maps. A lower normalized raw stress value for the LDA map also indicates
a better fit with the data. Another notable difference is that “Yu_G” is located nearer to “Burrell_QL”
than “Rousseau_R” in both word-based maps but not in the LDA map. However, checking their pair-
wise similarity values, “Burrell_QL” and “Rousseau_R” always have a higher similarity (0.43 for both
word-based maps and 0.95 for the LDA map) than “Burrell_QL” and “Yu_G” (0.17 for both word-based
maps and 0.21 for the LDA map). It is incorrectly reflected in the word-based maps due to the loss in the
MDS projection. But the sharp difference of the similarity values between the two pairs in the LDA map
help to retain the more accurate relationship. A further examination of their topical relatedness shows that
90% of the topical similarity between “Burrell_QL” and “Rousseau_R” is contributed by topic 5 (see
appendix) which can be described as “Informetric laws”, and the topical similarity between “Burrell_QL”
and “Yu_G” mostly comes from topic 3 (56%) which can be described as “Scientific impact evaluation.”
Our judgment agrees with this outcome after reviewing their profiles on record. Although all three authors
have conducted research on scientific impact evaluation in areas such as impact factors and the h-index,
“Rousseau_R” and “Burrell_QL” have more research in common by having investigated general
informetric laws such as the power law model and the Lorenz/Leimkuhler function.
Discussion
Of the five author relatedness methods discussed earlier, only co-authorship provides a direct connection
between authors. The other methods establish relationships based on derived similarities. These
similarities are assessed based on proxies for relatedness. Cocitations are contributed by third parties.
Direct citations reflect an author’s assessment of relatedness to a cited author or work but are still based
on perception or the subjectivity inherent in citer motivation (Bornmann & Daniel, 2008). This is also the
case for bibliographic coupling, where the strength of the relationship is assessed by the overlap of
23
references selected by two authors. Co-word or topic-based studies can be argued to be the least
influenced by citing behavior because they rely solely on the words developed by the authors themselves.
The use of multidimensional scaling and hierarchical cluster analysis are recognized as exploratory
methods that may shed light on relationships among objects of interest that could otherwise be missed in
a list of numbers. Clearly, the comparative measures used to construct the maps will influence the
outcomes, so there is no single correct approach. Comparisons based on author cocitation analysis have
been widely used for decades, but the word-based approaches that use similarity measures more
commonly used in vector space information retrieval show some promise as well. However, as we have
noted, how one includes or excludes data, such as collaborations, can affect outcomes for authors who
frequently collaborate with one another.
The newly proposed content-based approaches overcome several limitations of the more traditional
cocitation approach. In addition to avoiding citer subjectivity inherent in citation-based data, the links
between authors will be more interpretable compared with the cocitation maps. The top terms/topics will
be identifiable to help interpret the links between authors. The content-based methods do not require an
author to be cited in order to be included in the map. As long as the author has some publication record,
her/his relatedness with other authors can be identified. This provides the opportunity for researchers who
have not been widely cited to be included in the author map. Furthermore, cocitation analysis outcomes
may be affected by limited numbers of citations that do not reflect the true strength of the relationship
between authors. This can be seen when comparing the cocitation outcomes with the topic-based
outcomes, where several authors with low citation counts, and therefore low cocitation counts, end up at
the periphery of the map. For the LDA outcome, these authors are more centrally situated among authors
with similar topic areas.
The word-based and topic-based methods can be considered to be an extension of co-word analysis,
where words are used to determine the relatedness of authors. The advantage of introducing the vector

24
space model is that it provides more tools to formalize the relatedness measure for longer texts such as
abstracts or even the full text of documents. In fact, other information retrieval models, such as language
modeling (Ponte & Croft, 1998), can be easily substituted here for the vector space model. The
application of the topic model appears to be helpful in our case. Topical similarity helps to uncover some
relationship otherwise hidden due to terminology mismatch, and in turn produces more sensible results, at
least for library and information science. Interestingly, some other applications of topic model to author
studies, such as ranking the authors (Ding, 2011a), show promise as well.
Several limitations of the research must be acknowledged. First, words are not precisely designed
semantic units. Synonyms and polysemy may damage the link built based on words. Second, the LDA
method does not work well for authors with limited publication records. As is the case in any other
probabilistic model, an insufficient sample may lead to inferior results. However, the same would be true
of cocitation analysis. Third, there are no definitive rules for identifying the number of topics to be
generated in the LDA model. There will be trade-offs between an optimal level of distinctiveness and
computational overhead. Next, the cluster names applied to the hierarchical cluster outcomes represent
convenient labels to identify the groups generated. Although not definitive proof of outcomes, they
provide evidence of potentially hidden relationships. The maps could also be interpreted without the
superimposed clusters. The clusters simply provide a basis by which members of the map may be grouped.
The validity of such maps has been debated for decades. In Healey, Rothman and Hoch (1986), a paradox
is introduced: if a map represents a field that is already known to experts, then it is useless because it does
not reveal anything new; if the map deviates from the expectation of the experts, then its outcome is
questionable. This does not diminish the application of a method for exploratory purposes, particularly if
topic areas or groups of authors have not been studied, or if a method has been found to be effective for
known areas. Finally, one could debate whether maps based on author cocitations and content-based
approaches measure the same types of relationships among authors. If the purpose of an investigation is to

25
compare author relatedness based on the topics they undertake, we would propose that the content-based
methods presented here provide a closer approximation toward this end.
Conclusion
In this paper we have proposed three new methods for identifying author relatedness based on the content
of their work: two word-based models and one topic-based. This initial investigation, which compares
prolific authors from LIS, demonstrates: (1) the potential for more topically meaningful outcomes from
the new methods when compared to more traditional cocitation analysis; (2) the topic-based method using
LDA for the data used in this study produces more distinctive clusters and reasonable results than the two
word-based approaches. Based on the existing data, this finding cannot be generalized to other topic areas.
Additional investigation is required. Advantages and disadvantages of the methods have been discussed.
As an exploratory tool, author mapping doesn’t currently have a gold standard evaluation measure.
Subjective assessments must be made in assessing the validity of outcomes. Different methods have
different perspectives and properties. The word and topic-based approaches for assessing the relatedness
of research topics undertaken by authors are not intended to serve as a replacement for more established
techniques like author cocitation analysis, but as additional tools for this purpose. The findings for prolific
library and information science authors were particularly encouraging for the topic-based method. Future
research may examine a broader range of fields.
Acknowledgements
We are grateful for the constructive comments and helpful suggestions from the anonymous reviewers.
Reference
Ahlgren, P., & Colliander, C. (2009). Document-document similarity approaches and science mapping:
Experimental comparison of five approaches. Journal of Informetrics, 3(1), 49-63.

26
Ahlgren, P., Jarneving, B., & Rousseau, R. (2003). Requirements for a cocitation similarity measure, with
special reference to Pearson's correlation coefficient. Journal of the American Society for
Information Science and Technology, 54(6), 550-560.
Blei, D. M., Ng, A. Y., & Jordan, M. J. (2003). Latent Dirichlet allocation. Journal of Machine Learning
Research, 3, 993-1022.
Börner, K., Chen, C., & Boyack, K. W. (2005). Visualizing knowledge domains. Annual Review of
Information Science and Technology, 37(1), 179-255.
Boyack, K. W., & Klavans, R. (2010). Cocitation analysis, bibliographic coupling, and direct citation:
Which citation approach represents the research front most accurately? Journal of the American
Society for Information Science and Technology, 61(12), 2389-2404.
Bornmann, L., & Daniel, H-D. (2008). What do citation counts measure? A review of studies on citing
behavior. Journal of Documentation, 64(1), 45-80.
Braam, R. R., Moed, H. F., & van Raan, A. F. J. (1991). Mapping of science by combined cocitation and
word analysis. I. Structural Aspects. Journal of the American Society for Information Science,
42(4), 233-251.
Cao, M. D., & Gao, X. (2005). Combining contents and citations for scientific document classification.
Lecture Notes in Computer Science, 3809, 143-152.
Coulter, N., Monarch, I., & Konda, S. (1998). Software engineering as seen through its research literature:
A study in co-word analysis. Journal of the American Society for Information Science, 49(13),
1206-1223.
Deerwester, S., Dumais, S. T., Furnas, G. W., Landauer, T. K., & Harshman, R. (1990). Indexing by
latent semantic analysis. Journal of the American Society for Information Science, 41(6), 391-407.
Ding, Y. (2011a). Topic-based PageRank on author cocitation networks. Journal of the American Society
for Information Science and Technology, 62(3), 449-466.

27
Ding, Y. (2011b). Scientific collaboration and endorsement: Network analysis of coauthorship and
citation networks. Journal of Informetrics, 5(1), 187-203.
Ding, Y., Chowdhury, G. G., & Foo, S. (2001). Bibliometric cartography of information retrieval research
by using co-word analysis. Information Processing & Management, 37(6), 817-842.
Glänzel, W. (2001). National characteristics in international scientific co-authorship relations.
Scientometrics, 51(1), 69-115.
Griffiths, T. L., & Steyvers, M. (2004). Finding scientific topics. In Proceedings of the National Academy
of Sciences of the United States of America, 101, 5228-5235.
Healey, P., Rothman, H., & Hoch, P.K. (1986). An experiment in science mapping for research planning.
Research Policy, 15(5), 233-251.
Hofmann, T. (1999). Probabilistic latent semantic indexing. In Proceedings of the 22nd
Annual
International ACM SIGIR Conference on Research and Development in Information Retrieval
(ACM SIGIR’1999) (pp. 50-57). Berkeley, California, USA: ACM.
Kessler, M. M. (1963). Bibliographic coupling between scientific papers. American Documentation, 14(1),
10-25.
Law, J., & Whittaker, J. (1992). Mapping acidification research: A test of the co-word method.
Scientometrics, 23(3), 417-461.
Leydesdorff, L. (1987). Various methods for the mapping of science. Scientometrics, 11(5-6), 295-324.
Leydesdorff, L. (1997). Why words and co-words cannot map the development of the sciences. Journal of
the American Society for Information Science, 48(5), 418-427.
Leydesdorff, L., & Vaughan, L. (2006). Co-occurrence matrices and their applications in information
science: Extending ACA to the Web environment. Journal of the American Society for
Information Science and Technology, 57(12), 1616-1628.
Liu, X., Bollen, J., Nelson, M. L., & Van de Sompel, H. (2005). Co-authorship networks in the digital
library research community. Information Processing & Management, 41(6), 1462-1480.

28
Liu, X., Yu, S., Janssens, F., Glänzel, W., Moreau, Y., & Moor, B. D. (2010). Weighted hybrid clustering
by combining text mining and bibliometrics on a large-scale journal database. Journal of the
American Society for Information Science and Technology, 61(6), 1105-1119.
Ponte, J., & Croft, W. B. (1998). A language modeling approach to information retrieval. In Proceedings
of the 21st Annual International ACM SIGIR Conference on Research and Development in
Information Retrieval (ACM SIGIR’1998) (pp. 275-281). Melbourne, Australia : ACM.
Rosen-Zvi, M., Chemudugunta, C., Griffiths, T., Smyth, P., & Steyvers, M. (2010). Learning Author-
Topic models from text corpora. ACM Transactions on Information Systems, 28(1), 1-38.
Salton, G., & McGill, M. J. (1983). Introduction to modern information retrieval. New York: McGraw-
Hill.
Shibata, N., Kajikawa, Y., Takeda, Y., & Matsushima, K. (2008). Detecting emerging research fronts
based on topological measures in citation networks of scientific publications. Technovation,
28(11), 758-775.
Small, H. (1973). Cocitation in the scientific literature: A new measure of the relationship between two
documents. Journal of the American Society for Information Science, 24(4), 265-269.
van Eck, N. J., & Waltman, L. (2009). How to normalize cooccurrence data? An analysis of some well-
known similarity measures. Journal of the American Society for Information Science and
Technology, 60(8), 1635-1651.
Weinberg, B. H. (1974). Bibliographic coupling: A review. Information Storage and Retrieval, 10(5-6),
189-196.
White, H. D., & Griffith, B. C. (1981). Author cocitation: A literature measure of intellectual structure.
Journal of the American Society for Information Science, 32(3), 163-171.
White, H. D. (2003). Author cocitation analysis and Pearson's r. Journal of the American Society for
Information Science and Technology, 54(13), 1250-1259.

29
Zhao, D., & Strotmann, A. (2008). Evolution of research activities and intellectual influences in
Information Science 1996-2005: Introducing author bibliographic-coupling analysis. Journal of
the American Society for Information Science and Technology, 59(13), 2070-2086.
Zhao, D., & Strotmann, A. (2010). Mapping the highly collaborative Stem Cell research field: Adding
last-author-based analysis to author cocitation analysis family. In Proceedings of the American
Society for Information Science and Technology, Pittsburgh, PA, USA: ASI.
Zhao, D., & Strotmann, A. (2011). Counting first, last, or all authors in citation analysis: A
comprehensive comparison in the highly collaborative stem cell research field. Journal of the
American Society for Information Science and Technology, 62(4), 654-676.

30
Appendix
LDA topics and representative authors
Topic 1: 0.04661 Topic 2: 0.05690 Topic 3: 0.07078 Topic 4: 0.04752
WORD PROB WORD PROB WORD PROB WORD PROB
method
cluster
structur map
based
propos
similar
0.06436
0.03788
0.03422 0.03409
0.02608
0.02596
0.02445
research
countri
patent public
product
technolog
collabor
0.06049
0.03796
0.03689 0.03459
0.03003
0.02979
0.02390
citat
journal
scienc impact
author
public
indic
0.10980
0.10174
0.06333 0.05422
0.03844
0.03568
0.03552
text
languag
classif word
document
semant
method
0.04916
0.03907
0.03144 0.03128
0.02606
0.02366
0.02231
AUTHOR PROB AUTHOR PROB AUTHOR PROB AUTHOR PROB
LEYDESDORFF,_L
AOE,_J ZHANG,_J
JARNEVING,_B
SCHNEIDER,_JW BOYACK,_KW
FUKETA,_M
0.00641
0.00504 0.00357
0.00355
0.00352 0.00330
0.00322
GUAN,_JC
MEYER,_M DEBACKERE,_K
GLANZEL,_W
LEYDESDORFF,_L POURIS,_A
INGWERSEN,_P
0.01137
0.00986 0.00670
0.00653
0.00633 0.00622
0.00582
LEYDESDORFF,_L
GLANZEL,_W JACSO,_P
MOED,_HF
ROUSSEAU,_R DANIEL,_HD
TSAY,_MY
0.01710
0.01177 0.00885
0.00867
0.00861 0.00833
0.00819
LI,_KW
YANG,_CC SEO,_J
THELWALL,_M
CHOI,_KS LIU,_RL
LEE,_GG
0.00693
0.00624 0.00555
0.00535
0.00498 0.00437
0.00412
Topic 5: 0.05416 Topic 6: 0.04352 Topic 7: 0.04825 Topic 8: 0.04774
WORD PROB WORD PROB WORD PROB WORD PROB
index
distribut
measur
paper number
function
law
0.06295
0.03617
0.02721
0.02080 0.01737
0.01499
0.01390
inform
make
need
health human
medic
specif
0.26837
0.02318
0.02013
0.01760 0.01534
0.01277
0.01054
analysi
network
social
commun research
co
field
0.08323
0.06563
0.05258
0.04358 0.03647
0.02959
0.02936
knowledg
manag
concept
develop organ
practice
theori
0.09184
0.04389
0.02963
0.02483 0.02125
0.02077
0.01954
31
AUTHOR PROB AUTHOR PROB AUTHOR PROB AUTHOR PROB
EGGHE,_L
ROUSSEAU,_R BURRELL,_QL
GLANZEL,_W
SCHREIBER,_M VAN_RAAN,_AFJ
LEYDESDORFF,_L
0.08345
0.02305 0.01832
0.00733
0.00722 0.00649
0.00581
WARNER,_J
BATH,_PA WESTBROOK,_L
SAVOLAINEN,_R
WILLIAMS,_P THELWALL,_M
OPPENHEIM,_C
0.01063
0.00596 0.00502
0.00422
0.00365 0.00359
0.00289
LEYDESDORFF,_L
THELWALL,_M MCCAIN,_KW
CHEN,_CM
WHITE,_HD GLANZEL,_W
KRETSCHMER,_H
0.01912
0.01057 0.00681
0.00569
0.00491 0.00481
0.00481
HJORLAND,_B
ROWLEY,_J DAY,_RE
HARA,_N
CHOU,_SW CHUA,_AYK
JASHAPARA,_A
0.00661
0.00661 0.00531
0.00480
0.00406 0.00362
0.00355
Topic 9: 0.0444 Topic 10: 0.04810 Topic 11: 0.05175 Topic 12: 0.04906
WORD PROB WORD PROB WORD PROB WORD PROB
model
base
data
process propos
object
applic
0.13710
0.06056
0.05257
0.04437 0.03186
0.02080
0.02054
new
approach
relat
subject present
suggest
question
0.04420
0.03513
0.02973
0.02602 0.02354
0.02113
0.02034
retriev
document
queri
term relev
effect
reserv
0.11895
0.07721
0.06940
0.05636 0.05522
0.03503
0.02433
level
number
time
group statist
found
increas
0.04039
0.0334
0.02408
0.02234 0.02122
0.02068
0.02014
AUTHOR PROB AUTHOR PROB AUTHOR PROB AUTHOR PROB
TANIGUCHI,_S
EGGHE,_L
FORD,_N BURRELL,_QL
NIEMI,_T
THELWALL,_M ZHANG,_Y
0.00783
0.00468
0.00437 0.00404
0.00389
0.00363 0.00306
THELWALL,_M
GLANZEL,_W
JACSO,_P FORD,_N
BURRELL,_QL
MEYER,_M OPPENHEIM,_C
0.01515
0.00524
0.0048 0.00453
0.00394
0.00358 0.00326
JARVELIN,_K
SAVOY,_J
CRESTANI,_F SPINK,_A
VECHTOMOVA,_O
ZHANG,_J OUNIS,_I
0.00633
0.00573
0.00489 0.00477
0.00465
0.00423 0.00400
THELWALL,_M
VAN_RAAN,_AFJ
SZAVAKOVATS,_E GLANZEL,_W
LEYDESDORFF,_L
WOLFRAM,_D EGGHE,_L
0.01010
0.00643
0.00609 0.00522
0.00452
0.00411 0.00399
Topic 13: 0.04624 Topic 14: 0.04675 Topic 15: 0.04348 Topic 16: 0.04912
WORD PROB WORD PROB WORD PROB WORD PROB
system
user design
imag
content interfac
tool
0.11421
0.10589 0.03744
0.02940
0.02666 0.02215
0.01731
research
scienc review
refer
articl paper
literatur
0.07301
0.04129 0.03172
0.02612
0.02470 0.02263
0.01955
internet
onlin technolog
studi
factor effect
busi
0.04104
0.03284 0.03022
0.02482
0.02107 0.01963
0.01801
differ
result evalu
perform
studi compar
measur
0.08616
0.07898 0.07427
0.06775
0.04713 0.04142
0.03779
AUTHOR PROB AUTHOR PROB AUTHOR PROB AUTHOR PROB

32
SHIRI,_A
JACSO,_P CHEN,_HC
RORISSA,_A
MARCHIONINI,_G
FOO,_S SHAPIRA,_B
0.00702
0.00477 0.00392
0.00387
0.00364
0.00354 0.00339
BORNMANN,_L
DANIEL,_HD THELWALL,_M
OPPENHEIM,_C
HARTLEY,_J
SZAVAKOVATS,_E JACSO,_P
0.02017
0.01517 0.00583
0.00496
0.00396
0.00386 0.00344
SMITH,_AD
LEE,_MC GANDIA,_JL
FLAVIAN,_C
LEE,_MKO
CASTANEDA,_JA CHEN,_HC
0.01076
0.00547 0.00409
0.00365
0.00365
0.00360 0.00354
HARTLEY,_J
LEYDESDORFF,_L JACSO,_P
EGGHE,_L
THELWALL,_M
SAVOY,_J GLANZEL,_W
0.00498
0.00435 0.00404
0.00394
0.00387
0.00327 0.00319
Topic 17: 0.04594 Topic 18: 0.05422 Topic 19: 0.05005 Topic 20: 0.05544
WORD PROB WORD PROB WORD PROB WORD PROB
articl databas
research
univers rank
qualiti
assess
0.06456 0.05543
0.04805
0.02687 0.02646
0.02076
0.01907
web search
engin
site page
link
result
0.14779 0.11097
0.04466
0.03651 0.02661
0.02647
0.02217
librari digit
servic
access paper
resourc
valu
0.07206 0.03815
0.03065
0.03001 0.02985
0.02978
0.02849
inform studi
seek
behavior task
interact
search
0.0903 0.0458
0.03793
0.03632 0.03424
0.02251
0.02032
AUTHOR PROB AUTHOR PROB AUTHOR PROB AUTHOR PROB
JACSO,_P
THELWALL,_M
BAR-ILAN,_J
KOUSHA,_K MOED,_HF
KOSTOFF,_RN
WILSON,_CS
0.01888
0.01875
0.00868
0.00712 0.00589
0.00521
0.00511
THELWALL,_M
JANSEN,_BJ
SPINK,_A
BAR-ILAN,_J HUNTINGTON,_P
VAUGHAN,_L
JACSO,_P
0.04176
0.02041
0.01962
0.01814 0.01217
0.01095
0.00866
JACSO,_P
OPPENHEIM,_C
CHOWDHURY,_GG
HUNTINGTON,_P NICHOLAS,_D
LIEW,_CL
MORRIS,_A
0.01023
0.01014
0.00425
0.00394 0.00382
0.00382
0.00378
SPINK,_A
FORD,_N
BILAL,_D
SAVOLAINEN,_R VAKKARI,_P
ZHANG,_Y
COLE,_C
0.01373
0.00985
0.00961
0.00847 0.00804
0.00666
0.00512