Comparison of SSR and SNP Markers in Estimation of Genetic Diversity and Population Structure of...
14
Comparison of SSR and SNP Markers in Estimation of Genetic Diversity and Population Structure of Indian Rice Varieties Nivedita Singh 1☯ , Debjani Roy Choudhury 1☯ , Amit Kumar Singh 1 , Sundeep Kumar 1 , Kalyani Srinivasan 2 , R. K. Tyagi 2 , N. K. Singh 3 , Rakesh Singh 1* 1 Division of Genomic Resources, National Bureau of Plant Genetic Resources, New Delhi, Delhi, India, 2 Germplasm Conservation Division, National Bureau of Plant Genetic Resources, New Delhi, Delhi, India, 3 National Research Centre on Plant Biotechnology, Indian Agricultural Research Institute, New Delhi, Delhi, India Abstract Simple sequence repeat (SSR) and Single Nucleotide Polymorphic (SNP), the two most robust markers for identifying rice varieties were compared for assessment of genetic diversity and population structure. Total 375 varieties of rice from various regions of India archived at the Indian National GeneBank, NBPGR, New Delhi, were analyzed using thirty six genetic markers, each of hypervariable SSR (HvSSR) and SNP which were distributed across 12 rice chromosomes. A total of 80 alleles were amplified with the SSR markers with an average of 2.22 alleles per locus whereas, 72 alleles were amplified with SNP markers. Polymorphic information content (PIC) values for HvSSR ranged from 0.04 to 0.5 with an average of 0.25. In the case of SNP markers, PIC values ranged from 0.03 to 0.37 with an average of 0.23. Genetic relatedness among the varieties was studied; utilizing an unrooted tree all the genotypes were grouped into three major clusters with both SSR and SNP markers. Analysis of molecular variance (AMOVA) indicated that maximum diversity was partitioned between and within individual level but not between populations. Principal coordinate analysis (PCoA) with SSR markers showed that genotypes were uniformly distributed across the two axes with 13.33% of cumulative variation whereas, in case of SNP markers varieties were grouped into three broad groups across two axes with 45.20% of cumulative variation. Population structure were tested using K values from 1 to 20, but there was no clear population structure, therefore Ln(PD) derived Δk was plotted against the K to determine the number of populations. In case of SSR maximum Δk was at K=5 whereas, in case of SNP maximum Δk was found at K=15, suggesting that resolution of population was higher with SNP markers, but SSR were more efficient for diversity analysis. Citation: Singh N, Choudhury DR, Singh AK, Kumar S, Srinivasan K, et al. (2013) Comparison of SSR and SNP Markers in Estimation of Genetic Diversity and Population Structure of Indian Rice Varieties. PLoS ONE 8(12): e84136. doi:10.1371/journal.pone.0084136 Editor: I. King Jordan, Georgia Institute of Technology, United States of America Received August 6, 2013; Accepted November 12, 2013; Published December 19, 2013 Copyright: © 2013 Singh et al. This is an open-access article distributed under the terms of the Creative Commons Attribution License, which permits unrestricted use, distribution, and reproduction in any medium, provided the original author and source are credited. Funding: Financial support granted by Indian Council of Agricultural Research, New Delhi, India, under the NPTC project, is also gratefully acknowledged. The funders had no role in study design, data collection and analysis, decision to publish, or preparation of the manuscript. Competing interests: The authors have declared that no competing interests exist. * E-mail: [email protected] ☯ These authors contributed equally to this work. Introduction Rice (Oryza sativa L.) is a staple food crop in the world and accounts for 21, 14 and 2% of global energy, protein and fat supply, respectively [1]. It serves as a model plant for genetic breeding and genomics research. Rice is rich in genetic diversity at both interspecific and intraspecific levels. Three subspecies; indica, japonica and javanica constitute a large reservoir of rice germplasm including a variety of local landraces and cultivars [2,3]. Knowledge regarding the extent of genetic variation and genetic relationships between genotypes are important considerations for designing effective breeding and conservation programmes. Molecular markers allow precise and rapid varietal identification, which has been proved to be an efficient tool for crop germplasm characterization, collection and management. Earlier RAPD, ISSR and AFLP have been used very frequently for fingerprinting and characterization of varieties and germplasm accessions of different crop species. Since these markers can be utilized without prior genomic information on the target crop for analysis, they were generally used as markers of choice. But after year 2000 the locus specific markers such as Simple Sequence Repeat (SSR) got its PLOS ONE | www.plosone.org 1 December 2013 | Volume 8 | Issue 12 | e84136
Transcript of Comparison of SSR and SNP Markers in Estimation of Genetic Diversity and Population Structure of...

Comparison of SSR and SNP Markers in Estimation ofGenetic Diversity and Population Structure of Indian RiceVarietiesNivedita Singh1☯, Debjani Roy Choudhury1☯, Amit Kumar Singh1, Sundeep Kumar1, Kalyani Srinivasan2,R. K. Tyagi2, N. K. Singh3, Rakesh Singh1*
1 Division of Genomic Resources, National Bureau of Plant Genetic Resources, New Delhi, Delhi, India, 2 Germplasm Conservation Division, National Bureauof Plant Genetic Resources, New Delhi, Delhi, India, 3 National Research Centre on Plant Biotechnology, Indian Agricultural Research Institute, New Delhi,Delhi, India
Abstract
Simple sequence repeat (SSR) and Single Nucleotide Polymorphic (SNP), the two most robust markers foridentifying rice varieties were compared for assessment of genetic diversity and population structure. Total 375varieties of rice from various regions of India archived at the Indian National GeneBank, NBPGR, New Delhi, wereanalyzed using thirty six genetic markers, each of hypervariable SSR (HvSSR) and SNP which were distributedacross 12 rice chromosomes. A total of 80 alleles were amplified with the SSR markers with an average of 2.22alleles per locus whereas, 72 alleles were amplified with SNP markers. Polymorphic information content (PIC) valuesfor HvSSR ranged from 0.04 to 0.5 with an average of 0.25. In the case of SNP markers, PIC values ranged from0.03 to 0.37 with an average of 0.23. Genetic relatedness among the varieties was studied; utilizing an unrooted treeall the genotypes were grouped into three major clusters with both SSR and SNP markers. Analysis of molecularvariance (AMOVA) indicated that maximum diversity was partitioned between and within individual level but notbetween populations. Principal coordinate analysis (PCoA) with SSR markers showed that genotypes were uniformlydistributed across the two axes with 13.33% of cumulative variation whereas, in case of SNP markers varieties weregrouped into three broad groups across two axes with 45.20% of cumulative variation. Population structure weretested using K values from 1 to 20, but there was no clear population structure, therefore Ln(PD) derived Δk wasplotted against the K to determine the number of populations. In case of SSR maximum Δk was at K=5 whereas, incase of SNP maximum Δk was found at K=15, suggesting that resolution of population was higher with SNP markers,but SSR were more efficient for diversity analysis.
Citation: Singh N, Choudhury DR, Singh AK, Kumar S, Srinivasan K, et al. (2013) Comparison of SSR and SNP Markers in Estimation of Genetic Diversityand Population Structure of Indian Rice Varieties. PLoS ONE 8(12): e84136. doi:10.1371/journal.pone.0084136
Editor: I. King Jordan, Georgia Institute of Technology, United States of America
Received August 6, 2013; Accepted November 12, 2013; Published December 19, 2013
Copyright: © 2013 Singh et al. This is an open-access article distributed under the terms of the Creative Commons Attribution License, which permitsunrestricted use, distribution, and reproduction in any medium, provided the original author and source are credited.
Funding: Financial support granted by Indian Council of Agricultural Research, New Delhi, India, under the NPTC project, is also gratefully acknowledged.The funders had no role in study design, data collection and analysis, decision to publish, or preparation of the manuscript.
Competing interests: The authors have declared that no competing interests exist.
* E-mail: [email protected]
☯ These authors contributed equally to this work.
Introduction
Rice (Oryza sativa L.) is a staple food crop in the world andaccounts for 21, 14 and 2% of global energy, protein and fatsupply, respectively [1]. It serves as a model plant for geneticbreeding and genomics research. Rice is rich in geneticdiversity at both interspecific and intraspecific levels. Threesubspecies; indica, japonica and javanica constitute a largereservoir of rice germplasm including a variety of locallandraces and cultivars [2,3]. Knowledge regarding the extentof genetic variation and genetic relationships between
genotypes are important considerations for designing effectivebreeding and conservation programmes.
Molecular markers allow precise and rapid varietalidentification, which has been proved to be an efficient tool forcrop germplasm characterization, collection and management.Earlier RAPD, ISSR and AFLP have been used very frequentlyfor fingerprinting and characterization of varieties andgermplasm accessions of different crop species. Since thesemarkers can be utilized without prior genomic information onthe target crop for analysis, they were generally used asmarkers of choice. But after year 2000 the locus specificmarkers such as Simple Sequence Repeat (SSR) got its
PLOS ONE | www.plosone.org 1 December 2013 | Volume 8 | Issue 12 | e84136

preferential application in cultivar identification in many crops,such as grape [4], potato [5], rape [6], rice [7], almond [8],apple [9] and wheat [10]. With the sequencing of severalgenomes and the possibility of revealing single nucleotidepolymorphism (SNP) markers en masse, SNPs are gainingimportance in diversity studies [11,12]. The primary advantagesof these markers are that they occur in genomes at a muchhigher frequency than SSRs, with close to one SNP beingobserved per 140 bp in rice [13], and that they can begenotyped in high throughput systems with a high multiplexratio. The polymorphisms of SSR and SNP are generated viadifferent mechanisms (replication slippage for SSRs vs. pointmutation for SNPs) and the two marker types can thereforeprovide different views of the structure of a given population.Single nucleotide polymorphisms are valuable markers for theconstruction of high-resolution genetic maps, for the study ofpopulation structure, and for the discovery of marker–traitrelationships in association-mapping experiments. Applicationof SNP markers on plant cultivar identification have beenreported, in grape [14], grapevine [15], melon [16] and rice [17].
The present study was conducted to compare the two mostimportant and preferred genetic markers, SSRs and SNPs forassessment of genetic variability and population structureamong 375 rice varieties tested under distinct, uniform andstable (DUS-tested) system/ released and notified varieties(RV) by Indian system.
Materials and Methods
Plant MaterialsSeed samples of 231 DUS-tested, 130 DUS-tested/released
varieties and 14 released varieties of rice from different parts ofIndia were received from Indian National Genebank, NationalBureau of Plant Genetic Resources (NBPGR), New Delhi. Thedetails of each variety along with passport data (national ID i.e.Indigenous Collection (IC) number, State, local name,pedigree, regions), status (DUS/RV) and important traits aregiven in Table S1.
DNA Extraction from Rice SeedSix (6) to nine (9) seeds of each variety were dehusked and
used for DNA isolation using QIAGEN DNeasy plant mini kit(Hilden, Germany). Kernels were ground into fine powder usingtissue lyser (Tissue lyser II Retsch, Germany) with a tissuelyser adapter set (QIAGENq). DNA extraction procedure wasas per manufacturer’s protocol.
Genotyping of Rice Varieties using SSR MarkersOne hundred and twenty highly variable SSR (HvSSR)
marker loci with repeat lengths of 51-70bp located across alltwelve chromosomes of rice [18] were selected for initialscreening. Ten markers located on long and short arm of eachrice chromosome were selected so that total genome can becovered effectively.
Gradient PCR was set for each primer with selected ricesamples to standardize the temperature of amplification (Ta).
Out of 120 HvSSR primers, 36 primers which were showinggood amplification were selected for final study.
Genomic DNA of all the 375 varieties was diluted to prepareworking stocks of 10 ng/µl. PCR reaction was set in a totalvolume of 10µl containing 2µl genomic DNA (10ng/µl), 1µl of10X buffer, 0.8 µl of 25 mM MgCl2, 0.2µl of 10mM dNTPs, 0.2µl of each primer (10nmol), 0.2 µl of Taq DNA polymerase(Fermentas, Life Sciences, USA) and 5.6 µl distilled water.Amplification was performed in a thermocycler using followingprogram; Initial denaturation at 94°C for 4 min followed by 36cycles of 94°C for 30s, Ta for 45s, 72°C for 1 min and finalextension at 72°C for 10 min. The amplified products wereanalyzed on 4% Metaphor agarose gel for 4 hrs at constantsupply of 120V. Gel pictures were recorded using GelDocumentation System (Alpha Imager®, USA).
Genotyping of Rice Varieties using SNP MarkersThe Sequenom Mass ARRAY system (Sequenom Inc., San
Diego, CA, USA) uses matrix assisted laser desorptionionization-time of flight (MALDI-TOF) mass spectrometer foraccurate detection of SNPs in a high-throughput manner (www.sequenom.com). Sequenom Mass ARRAY multiplex assayswere designed for 36 SNPs (iPLEX gold chemistry),representing conserved single-copy rice genes [19], takingthree genes per rice chromosome. The 36-plex assays weredesigned and validated by Sequenom Corporation (SanDiego). The 30-mer pre-amplification primers and variablelength genotyping primers generated by the Assay Design 3.1software were procured and used for the validation of SNPsaccording to the Sequenom user manual.
Statistical AnalysesThe SSR profiles were scored based on the size (bp) of
fragments amplified across all the 375 varieties. The weak gelbands of negligible intensity and smeared bands wereexcluded from the final data analysis. In case of SNP, the MassARRAY Typer 3.4 Software was used for the visualization ofSNPs and allele calling. The major allele frequency, genediversity, heterozygosity and PIC for each locus werecalculated for both SSR and SNP markers using Power Marker3.5 [20]. In addition, genetic distances [21] across thegenotypes and neighbor-joining (NJ) tree were calculated usingPower Marker 3.5 [20]. The dissimilarity matrix generated byPower Marker was used to construct un-weighted neighbourjoining tree using DARwin software 5.0.158 [22].
Principle Coordinate Analysis (PCoA) and Analysis ofMolecular Variance (AMOVA) were performed using softwareGenAlEx V6.5 [23]. In case of SNP data, the bases werenumerically coded as follows: A=1, C=2, G=3, T=4 and missingdata was coded as 0 as suggested in GenAlEx V6.5 usermanual [23]. Software STRUCTURE V2.3.1 was applied toinfer historical lineages that show clusters of similar genotypes[24]. The membership of each genotype was run for range ofgenetic clusters from value of K= 1 to 20 with the admixturemodel and correlated allele frequency. For each K it wasreplicated 3 times. Each run was implemented with a burn-inperiod of 100,000 steps followed by 100,000 Monte CarloMarkov Chain replicates [24]. Ln(PD) derived for each K and
Genetic Diversity and Population Structure of Rice
PLOS ONE | www.plosone.org 2 December 2013 | Volume 8 | Issue 12 | e84136

then plotted to find the plateau of the ΔK values [25]. Onlineavailable programme “structure harvester” was used (http://taylor0. biology.ucla.edu) to calculate final population structure.The proportion of the genome of an individual that belongs toeach inferred population (admixture) was also estimated.
Results
The present study was conducted on 375 indica rice varietieswhich included DUS tested as well as released and notifiedvarieties from eighteen major rice growing states of India andvarieties released and notified by Central Varietal Release andNotification Committee (CVRC) of India. These 375 varietiesincludes 5 landrace 369 modern varieties and one hybridvariety (KRH-2)representing five regions of India where rice isgrown as a major crop (Table S1). For comparing the efficiencyof SSR and SNP markers in assessing genetic diversity andpopulation structure, equal number of locus (thirty-six primerseach) of SSR and SNP have been used and compared at thestatistical, genetic relatedness and population structure level.
Statistical Comparison of HvSSR and SNP MarkersTemperature of amplification (Ta) for 36 HvSSR primers
ranged from 51.9°C to 61.3°C, and used for generatingamplification profiles of rice varieties. The number of allelesamplified per SSR primers varied from 2 to 4 (Table 1).Maximum numbers of alleles were amplified by primerHvSSR12-39 (4 alleles). A total of 80 alleles were amplifiedwith an average of 2.22 alleles per locus in 375 varieties. PICvalue for HvSSR primers ranged from 0.04 for HvSSR06-16 to0.5 for HvSSR05-09 with an average of 0.25. The genediversity ranged from 0.05 to 0.58 with an average of 0.3.Heterozygosity was also calculated and for five lociheterozygosity was zero (HvSSR05-30, HvSSR06-16,HvSSR08-14, HvSSR09-26 and HvSSR10-03). Maximumheterozygosity was present at HvSSR09-55 loci (0.73) andaverage heterozygosity across all 36 loci was 0.12. The majorallele frequency was also calculated for all 36 markers whichranged from 0.49 to 0.97 with an average of 0.78 (Figure 1a,Table 1).
The unlinked SNP markers located on the short arm,centromeric region and long arm of all 12 rice chromosomeswere developed and used for diversity analysis. Thechromosome number, primer ID and their physical position onrice chromosome are given in Table 2. SNP is bi-allelic innature therefore; total 72 alleles were amplified with anaverage of 2 alleles per locus in all tested rice varieties and themajor allele frequency ranged from 0.56 to 0.98 with anaverage of 0.80 (Figure 1b, Table 2). Alleles were scored aswild, heterozygous and alternate alleles across all the 375 ricevarieties and the percent allele was calculated for all 36 loci(Table 2). Highest heterozygous alleles (58.6%) were foundwith marker 11-1849 located on chromosome 11. The PICvalue was highest for primers 08-4218-5_C_129 and1011927_C_178 (0.37) and lowest for primer01-3916-1_C_156 (0.03) with an average PIC value of 0.23.The gene diversity also ranged from 0.03 to 0.49 with average
gene diversity 0.28. Heterozygosity across the 36 loci rangedfrom 0.02 to 0.64 with mean value of 0.19.
Comparison of HvSSR and SNP Markers in GeneticRelatedness Study
All the HvSSR amplicons generated across 375 varietieswere assessed for genetic distance and the dissimilarity matrixwas used for cluster development using the neighbour joining(NJ) method. In the Unrooted tree (Figure 2a) and Phylogram(Fig. not shown) rice genotypes were grouped into three majorclusters. Further cluster1 was sub-grouped into cluster1a whichcontains 66 varieties, cluster1b with 13 varieties and cluster1cwith 14 varieties. Similarly, cluster2 was sub-grouped into fourclusters; cluster2a, cluster2b, cluster2c and cluster2d with 37,29, 56 and 12 varieties respectively. Cluster3 was the largestcontaining 52 varieties in cluster3a, 87 varieties in cluster3band 9 varieties in cluster3c. Grouping of the rice varietieslabeled with different colours to represent different regionswere getting represented in all the major clusters and even inthe sub clusters. Further, traits of some of these varieties asrecorded in the passport data and their grouping into differentclusters was analyzed to find trait based grouping (if any).Interestingly in the cluster1c and 2d varieties having resistanceto blast disease were grouped (Table S2).
Similarly all 36 SNP loci were scored across all the testedrice varieties. Genetic distance was calculated and NJ tree wasconstructed using dissimilarity matrix. Unrooted tree (Figure2a) as well as Phylogram (Fig. not shown) was generated tofind genetic relationships among the rice varieties. All varietieswere grouped into three major clusters. Cluster2 which was themajor cluster further subdivided in to three sub clusters2a, 2band 2c, respectively (Figure 2b). In the cluster2a 127 varieties,cluster2b 76 varieties cluster 2c 43 varieties were groupedwhereas, in cluster1 and cluster3, 75 and 54 varieties grouped,respectively. Grouping pattern of the rice varieties using SNPmarkers were found similar to SSRs. However, in cluster 2a outof 127 varieties 24 varieties were from Kerala which could be anotable observation regarding geographical isolation. Nosignificant grouping was observed for trait on the basis ofinformation available as passport data.
Analysis of Molecular Variance (AMOVA) with HvSSRshowed that among regions only 1% diversity existed whereasat population level it was 4%. Maximum diversity has beenobserved at individual’s level (70 %) and within individual(25%) level (Table 3, Figure 3a). In case of SNP maskersamong regions, no diversity exists whereas at population level1% diversity existed (Table 3, Figure 3b) and maximumdiversity was partitioned between individual level (67 %) andwithin individuals (32%).
Principal Coordinate Analysis (PCoA) with SSR markersshowed that large diversity existed in Indian rice varieties.Varieties exhibited uniform distribution across the two axes(Figure 4a). The first three axes explained 13.33% ofcumulative variation (Table 4). In PCoA all varieties werelabeled with different colours based on their different regions toindicate their region specificity (Figure 4a), the intermixing ofcolour across the coordinates further, support the unrooted treethat there is no location-specific grouping of the samples
Genetic Diversity and Population Structure of Rice
PLOS ONE | www.plosone.org 3 December 2013 | Volume 8 | Issue 12 | e84136

Table 1. List of HvSSR primers used for genotyping of 375 rice accessions along with their chromosomal position, productsize, No of alleles amplified, Temperature of Amplification (Ta), Gene diversity, Heterozygosity and PIC value.
Chr.No. Primer ID
Size(bp) Forward primer Reverse primer
No ofallelesamp.
Ann.temp(°C)
GeneDiv. Heterozygosity PIC
MajorAllelefreq.
1 HvSSR01-32 250 AAACTGGAGATGAACTCGAA GTAACGAACTAGAGCATGGG 2 55.6 0.13 0.02 0.12 0.93
HvSSR01-41 348 TGAGTGAGACTTGACAGTGC AGTTAACACCAATGCTGACC 2 59 0.34 0.005 0.28 0.78
HvSSR01-53 274 TGTCGTCCACGTAGTAGGAG ACACTCCTCCTCTGTTCTCA 2 51.9 0.35 0.006 0.29 0.77
2 HvSSR02-01 312 AAGAGATGAGAAGAGCAATGA CAACTTAGAGGAAGAAGGAGG 2 60 0.41 0.18 0.32 0.72
HvSSR02-33 355 TAATGCACGCACAACTTTAC TATAGAATGCTGACTGGGCT 2 60.1 0.24 0.03 0.21 0.87
HvSSR02-50 195 TTTCAGGAATCTGATGCTTT TTAATCAAAGCCCTAACAGC 2 52 0.45 0.31 0.35 0.64
3 HvSSR03-02 228 TAGCGGAGTTGGAATAACAC CTGCACTGCATACCTCATAA 2 55 0.45 0.008 0.35 0.68
HvSSR03-10 280 GTACACAACGTCACAACAGC ACTGTGGCATATGTTCGATT 2 55 0.45 0.26 0.35 0.66
HvSSR03-19 230 AATTCAGTTCACGCATTCTT AGCTGTTCGTCTGCATAGTT 2 61 0.17 0.06 0.15 0.91
HvSSR03-37 386 GGAAATCGTCAAGAACGTC TAATTGTATACCACTCCGCC 2 59 0.47 0.09 0.36 0.59
HvSSR03-54 352 GCCTATCAGGCTATCATCAC GTGATCGACATTGAGGAGTT 2 59 0.40 0.006 0.32 0.71
4 HvSSR04-19 265 TCGTGGAGTATCCTGTATCC TTATAACTTGGAGCTCAGGC 2 56 0.24 0.19 0.21 0.86
HvSSR04-27 318 ATGGATTTAGGCTTGTTTGA ATACTGCGAAGGTGAAGAGA 2 58 0.37 0.28 0.30 0.75
HvSSR04-46 179 GGCGCGCTTATATATGTACT CGATTGCGTGGTGTAACTAT 2 61.2 0.49 0.03 0.37 0.55
5 HvSSR05-09 335 CTCTCCATCTTGCAATCTTC TGCATGACTCTATCAACCAG 3 61 0.58 0.12 0.50 0.50
HvSSR05-15 275 CCATGTCAAACGGTTACTTT GGGAGAAGTGAGAAAGAGGT 2 60.5 0.07 0.01 0.07 0.97
HvSSR05-30 353 TACGACGGACGATTAAAGTT GCTAACTCATTCATCTCGCT 2 60.5 0.38 0.0 0.31 0.74
6 HvSSR06-03 212 CTAGGGAATCAGCGGTTAG GCTCTCTTGTCCTTCTTCTTC 2 57.8 0.08 0.01 0.08 0.96
HvSSR06-16 368 TCTGAAATGCTGTCATCAAG GAGCAGAGTAGGACATGAGC 2 55.2 0.05 0.0 0.04 0.97
HvSSR06-40 385 CTCTTCCGTGGTTAAAGAAA CACTGGTATGATCTCCGACT 3 61 0.52 0.39 0.41 0.49
7 HvSSR07-18 343 GGTGTGTTGTCGAATCTCTC ATGCCATTGTCCTTACATTC 3 61.3 0.39 0.23 0.36 0.76
HvSSR07-51 341 CGAGCATGTCTGTCAAGTAA GTTCGAATGTAATGTTGGCT 3 56.3 0.22 0.04 0.21 0.87
8 HvSSR08-14 295 TCCACTTTACATCGTCACAA CTACCTCTTAACCGCACATT 2 59.3 0.30 0.0 0.26 0.81
HvSSR08-19 221 CATCTCTTGAGAAATCTGCC TGTGCATTTCGTCTTTCATA 2 55.6 0.27 0.06 0.24 0.84
9 HvSSR09-11 366 TGCAGAATTTCTTCCTTCAT ACCAGAATCTCCCAAATGTA 3 61 0.36 0.01 0.33 0.78
HvSSR09-26 331 TGGGCATCTGGTACTATCTT AGCTCATTCCACAGGTTAGA 2 60 0.11 0.0 0.11 0.93
HvSSR09-55 382 TTACTCCGCATATATCCATGT ATTTGACACCAAGTTGATCC 2 61 0.48 0.73 0.37 0.59
10 HvSSR10-03 289 TCTTTCCCAAATTCCAGATA CATTAGTTGTTTGTGGCAGA 2 56.3 0.07 0.0 0.08 0.96
HvSSR10-13 169 CAGGGAATCAACATCAAAGT AGCAAGGCAAGTCATCTCTA 2 59.4 0.49 0.52 0.37 0.51
HvSSR10-34 202 TAGACCGAGGAATTGAAAGA TTTGGGCTTATTGTCAGTTT 2 50.8 0.14 0.07 0.13 0.93
11 HvSSR11-13 285 TGAAACCACAATGAGTCAAA GCCCTAAACCCAAATAGAAG 2 54.1 0.46 0.13 0.35 0.65
HvSSR11-21 291 TACGCTATAACCATGAAGCA CTCCCGTTATTGTCCTTACA 3 61 0.19 0.08 0.18 0.89
HvSSR11-58 371 ACTGAATCCTTACTGGAGCA GGAGATAAGCATTTGGAAGA 2 54.1 0.32 0.19 0.27 0.79
12 HvSSR12-01 271 GATTTGCAACACGTACGATA GATCATCCACTCTGAGCAAT 2 52.6 0.07 0.04 0.07 0.96
HvSSR12-13 388 ACCTTAGGGCTGAGTTCTTT TTAGGCTTGTCTCTTCCTCA 2 60 0.10 0.03 0.10 0.95
HvSSR12-39 289 ATCTAACAACAACAATCCCG CATCTTCATCCCTCGTGTAT 4 60.5 0.27 0.13 0.26 0.85
Mean 0.30 0.12 0.25 0.78
doi: 10.1371/journal.pone.0084136.t001
Genetic Diversity and Population Structure of Rice
PLOS ONE | www.plosone.org 4 December 2013 | Volume 8 | Issue 12 | e84136

because all varieties were intermixed across the coordinateswhereas, in case of SNP markers varieties were gettinggrouped into three broad groups across the first two axes(Figure 4b). The first three axes of SNP explained 45.20% ofcumulative variation (Table 4). In PCoA, the intermixing ofcolour across the coordinates, further support the unrooted treewith SNP marker that, there is no location-specific grouping.
In present study 29 Autumn rice varieties, also known as'Aus' in West Bengal were compared with indicasubpopulations and based on AMOVA, 1% variation (TableS3a, and Figure S1a) with Fst value 0.009 (Table S3b) wasfound between the two subpopulations based on SSR markersbut no such population difference was observed with SNPmarkers (Table S4a & S4b, Figure S1b).
Figure 1. Major allele frequency spectrum for (a) 36 SSR and (b) 36 SNPs in 375 rice varieties. doi: 10.1371/journal.pone.0084136.g001
Genetic Diversity and Population Structure of Rice
PLOS ONE | www.plosone.org 5 December 2013 | Volume 8 | Issue 12 | e84136

Tabl
e 2.
Lis
t of S
NP
prim
ers
used
for g
enot
ypin
g of
382
rice
acc
essi
ons
alon
g w
ith b
ase
call,
gen
e di
vers
ity, h
eter
ozyg
osity
and
PIC
.
Chr
.N
o.Pr
imer
IDPh
ysic
alpo
sitio
nA
mpl
ifica
tion
prim
er1
Am
plifi
catio
n pr
imer
2A
llele
per
cent
age
Gen
eD
iver
sity
Het
eroz
ygos
ityPI
C
Maj
orA
llele
freq
.
W
ildH
etA
ltern
ate
101
-391
6-1_
C_1
5625
3816
54AC
GTT
GG
ATG
GG
GTT
TGC
ATG
TTAA
TAG
GG
ACG
TTG
GAT
GC
CG
AATC
TCTA
TCAA
GG
AAG
873
0.0
0.03
0.03
0.03
0.98
01
-608
-4_C
_375
3421
011
ACG
TTG
GAT
GAG
GAC
CAT
CTT
CTT
GC
ACTG
ACG
TTG
GAT
GC
CAT
TTG
CAA
GG
CC
CAT
TTC
4233
.021
0.47
0.34
0.36
0.61
01
-635
1-1_
C_2
0240
9142
92AC
GTT
GG
ATG
GTT
GG
AAC
ACAT
GAT
TTC
ACAC
GTT
GG
ATG
ATC
TCTT
TGG
ACAG
AGTC
CC
727
30.
140.
080.
130.
92
202
-267
1570
149
ACG
TTG
GAT
GG
TCAA
TCTT
GC
AGG
AGTT
GG
ACG
TTG
GAT
GTG
GC
TCC
TCTT
CTC
CG
GTC
T68
177
0.27
0.18
0.24
0.84
02
-302
9-1_
C_4
7418
8211
56AC
GTT
GG
ATG
TGTC
TGC
AATA
ACTT
GTG
CC
ACG
TTG
GAT
GAA
ATC
AGC
TGC
AGC
ATTA
CC
3826
210.
470.
300.
360.
60
02
-433
3-1_
C_2
9328
6888
19AC
GTT
GG
ATG
GG
AATG
TTTA
GTT
TTG
AGG
ACG
TTG
GAT
GTG
TAG
GTG
CTA
CTT
GC
TTC
C53
105
0.25
0.14
0.22
0.85
303
-169
1-1_
C_3
7310
8495
12AC
GTT
GG
ATG
AAC
AAC
GC
CAG
GAA
CAT
CAC
ACG
TTG
GAT
GAA
GC
GG
CTC
AAG
GTA
CAA
TC58
136.
00.
260.
160.
230.
84
03
-347
8-1_
C_2
0622
8154
22AC
GTT
GG
ATG
CC
TGC
AGC
AAAC
GC
CAA
TTT
ACG
TTG
GAT
GTC
AGG
TAAC
CG
ATC
GAT
TTG
6.0
4031
0.44
0.51
0.35
0.66
03
-466
0-1_
C_3
5531
0203
66AC
GTT
GG
ATG
CTC
CC
ATC
CTA
GTA
TCC
ATC
ACG
TTG
GAT
GTG
CC
TTC
TCTT
ACAG
GTT
CC
4014
170.
450.
190.
350.
67
404
-180
1-20
_C_4
2811
8598
36AC
GTT
GG
ATG
CC
CTC
AAAA
AAAA
GTT
GTA
AGAC
GTT
GG
ATG
CAG
TAAA
TTTC
CAG
GG
AGAT
A75
230.
00.
210.
230.
180.
88
04
-19-
4_C
_240
2258
38AC
GTT
GG
ATG
TCTA
CAC
ATTA
GC
TCG
CTG
GAC
GTT
GG
ATG
ACAG
TAAC
CAC
AATA
TGC
CG
85.
028
.00.
390.
120.
310.
73
04
-378
7-3_
C_3
5825
2118
00AC
GTT
GG
ATG
TTAT
CTC
TGC
TTG
CTC
GC
TCAC
GTT
GG
ATG
AAG
TATC
TGC
CC
CAA
GTG
AC43
333
0.37
0.41
0.30
0.75
505
-269
2-1_
C_1
0918
7834
26AC
GTT
GG
ATG
GAA
CTT
TAC
TCTC
AGTA
CA
ACG
TTG
GAT
GTG
GTT
TGAT
GAG
TCG
TTTG
C31
278
0.43
0.41
0.34
0.68
05
-419
2-1_
C_2
8028
0657
69AC
GTT
GG
ATG
AGTT
TGTT
GAC
AGC
AGAA
CC
ACG
TTG
GAT
GTA
GC
TTAC
TAG
TTC
ATG
TG28
911
.00.
440.
190.
340.
67
05
-48-
1_C
_279
2873
62AC
GTT
GG
ATG
CAG
AGAT
GTC
TGTT
GTT
AGC
ACG
TTG
GAT
GC
AAC
CAG
GG
ATAC
AATA
TGAC
3411
.07
0.37
0.21
0.30
0.76
606
-125
6-1_
C_1
4775
7397
9AC
GTT
GG
ATG
CAC
GTG
CC
TATG
ATTA
GC
AGAC
GTT
GG
ATG
GAT
CG
TTTA
CTT
CTT
TGC
CC
856
40.
140.
060.
130.
92
06
-177
6-1_
C_5
0111
0937
72AC
GTT
GG
ATG
GG
GC
CAA
TTTG
CTT
AGTG
CAC
GTT
GG
ATG
AGC
ATAA
GG
TATT
AAAG
TC62
22
0.08
0.03
0.08
0.96
06
-250
9-1_
C_4
9715
7373
87AC
GTT
GG
ATG
CC
TTC
GC
GC
TTG
CAA
TTTG
GAC
GTT
GG
ATG
AAAT
CAG
CAC
GC
GTC
AAC
AC49
32
0.14
0.06
0.13
0.92
707
-290
4-39
_C_2
9919
1602
55AC
GTT
GG
ATG
AATG
GTG
GTG
TATC
TTG
AGC
ACG
TTG
GAT
GG
GTG
TGAC
TTC
TCAT
GAC
AG65
203
0.26
0.22
0.23
0.85
07
-293
-12_
C_3
6818
5960
3AC
GTT
GG
ATG
CAC
TAAT
TCTT
GG
TATT
ATG
GAC
GTT
GG
ATG
TCAA
TGTG
TTC
TCAC
AGAC
C27
12
0.12
0.02
0.11
0.94
808
-276
5-2_
C_3
6018
0848
51AC
GTT
GG
ATG
TCC
CTC
CAT
GTT
GTG
AGTT
CAC
GTT
GG
ATG
CTT
GC
AAG
AGAC
ATC
CAA
GA
940
00.
120.
030.
110.
94
08
-421
8-5_
C_1
2927
6924
70AC
GTT
GG
ATG
GG
TGG
ACAA
AGAT
AAG
GAA
GAC
GTT
GG
ATG
GAC
TGG
AAAT
ATAC
TCC
CTC
251
10.
490.
260.
370.
57
08
-847
-6_C
_113
5399
913
ACG
TTG
GAT
GC
CC
AAC
GTA
TTAA
TGG
CAA
CAC
GTT
GG
ATG
GC
TGTG
TAG
TAAT
TTG
CC
TG18
1112
0.42
0.05
0.33
0.69
909
-209
1297
966
ACG
TTG
GAT
GG
AGG
CAA
AAG
GC
AAAC
CG
ACAC
GTT
GG
ATG
GAC
TTG
AGC
GAG
TCG
ATG
TC23
210
0.23
0.22
0.20
0.87
09
-210
7-5_
C_1
4513
7054
87AC
GTT
GG
ATG
TGAC
CAC
ACC
ACAC
AAAC
ACAC
GTT
GG
ATG
GG
GAT
TTG
CG
GTT
TTTG
GAC
6620
20.
200.
190.
180.
88
09
-271
6-4_
C_4
5719
5413
36AC
GTT
GG
ATG
TGAG
CC
ACAG
ATTC
CC
TTTC
ACG
TTG
GAT
GC
TCG
AGTA
ATTC
AAAA
CC
AC67
172
0.19
0.07
0.17
0.89
1010
-119
2-7_
C_1
7881
2263
5AC
GTT
GG
ATG
CTT
TGC
TAC
GG
ATAA
AATG
ACG
TTG
GAT
GTC
ATG
CAA
ATAC
AGAC
ATG
G61
55
0.49
0.36
0.37
0.57
10
-188
-112
1821
5AC
GTT
GG
ATG
GC
GC
CAG
TGTA
TGG
AAAA
AGAC
GTT
GG
ATG
GTC
CAT
AAC
ATC
ATG
GAC
TC22
2114
0.28
0.27
0.23
0.83
10
-272
320
6969
70AC
GTT
GG
ATG
CC
CAC
AATG
AGAT
GC
AGAT
GAC
GTT
GG
ATG
AGAC
AAAA
TGC
AAC
ACTC
CG
5321
20.
120.
130.
110.
94
Genetic Diversity and Population Structure of Rice
PLOS ONE | www.plosone.org 6 December 2013 | Volume 8 | Issue 12 | e84136

Tabl
e 2
(con
tinue
d).
Chr
.N
o.Pr
imer
IDPh
ysic
alpo
sitio
nA
mpl
ifica
tion
prim
er1
Am
plifi
catio
n pr
imer
2A
llele
per
cent
age
Gen
eD
iver
sity
Het
eroz
ygos
ityPI
C
Maj
orA
llele
freq
.
W
ildH
etA
ltern
ate
1111
-184
911
9747
90AC
GTT
GG
ATG
CG
CC
ACTC
TTC
CTG
ATTT
AGAC
GTT
GG
ATG
ACAG
ATAC
GG
GAG
GC
ATTT
C67
100
0.45
0.64
0.35
0.65
11
-393
528
4346
79AC
GTT
GG
ATG
ATC
CC
TGAG
ACTT
TGG
ATG
GAC
GTT
GG
ATG
CC
AAC
TTG
AATG
TCC
ATTC
C31
592
0.07
0.03
0.07
0.96
11
-522
-1_C
_214
3033
366
ACG
TTG
GAT
GC
TAC
ATG
GTA
TCAG
ATAC
CG
ACG
TTG
GAT
GAG
AAG
CG
AAC
GC
GG
AAAA
AG79
32
0.38
0.23
0.31
0.74
1212
-179
411
2159
46AC
GTT
GG
ATG
GTG
AGC
CC
CAA
AAG
TTG
GTG
ACG
TTG
GAT
GTA
AGG
TCC
AGTT
TGC
TTG
GT
5420
120.
260.
110.
220.
85
12
-320
0-2_
C_3
8921
3961
81AC
GTT
GG
ATG
GC
TCAA
ACC
TAG
CAA
TAAC
TGAC
GTT
GG
ATG
CC
TCC
TTC
CTA
CAA
GTT
TAA
7711
90.
110.
020.
100.
94
12
-400
2160
546
ACG
TTG
GAT
GC
CAA
TAG
AGTC
CAT
CTC
AGC
ACG
TTG
GAT
GG
CAC
GAG
GAT
TTAA
GAC
AGC
251
10.
290.
330.
250.
82
Mea
n50
261
0.28
0.19
0.23
0.81
doi:
10.1
371/
jour
nal.p
one.
0084
136.
t002
Genetic Diversity and Population Structure of Rice
PLOS ONE | www.plosone.org 7 December 2013 | Volume 8 | Issue 12 | e84136

Comparison of HvSSR and SNP Markers in PopulationStructure Study
To study the population structure, a model based programmeSTRUCTURE was used to determine genetic relationshipamong individual rice varieties. This model assumes that thenumber of populations was k and the loci were independentand at Hardy–Weinberg equilibrium. In the case of SSR, K=1 toK=20 population were tested, Ln(PD) kept on increasing withincreasing population number but there was no clearpopulation structure, therefore Ln(PD) derived Δk was plottedagainst the K to determine the number of populations using asoftware “Structure harvester” available online. At K=5maximum Δk was found (Figure 5a) and this was consideredas number of population for 375 Indian rice varieties. Inpopulation1 79 varieties, population2 63 varieties, population3
93 varieties, population4 57 varieties and in population5 83varieties were grouped. Further, using structure analysis(Figure 6a) varieties under different populations werecategorised as pure or admixture and for categorisationpurpose varieties with more than 0.80 score were consideredas pure and less than 0.80 as admixture. In population1 39pure and 40 admix, population2 29 pure and 34 admixturepopulation3 42 pure and 51 admixture, in population4 19 pureand 38 admixture and in population5 31pure and 52 admixturewere present and in total 215 pure and 160 admixture wereidentified (Figure 6a).
Similarly in case of SNP markers Δk values were plottedagainst the K to determine the number of populations and atK=15maximum Δk was found (Figure 5b) Further, K=15number was closer to number actual number of Indian states
Figure 2. NJ tree constructed for (a) SSR and (b) SNP data based on regions south (red), north-east (sky blue), east(blue), north (green), west (pink) and CVR (orange). doi: 10.1371/journal.pone.0084136.g002
Table 3. Summary AMOVA for SSR and SNP markers.
Source AMOVA for SSR AMOVA for SNP
df SS MS Est. Var. % SS MS Est. Var. %Among Regions 5 171.207 34.241 0.035 1% 90.579 18.116 0.003 0%
Among Populations 12 297.559 24.797 0.335 4% 198.662 16.555 0.073 1%
Among Individual 357 4600.038 12.885 5.474 70% 4979.079 13.947 5.643 67%
Within Individual 375 726.500 1.937 1.937 25% 998.000 2.661 2.661 32%
Total 749 5795.304 7.781 100% 6266.320 8.381 100%doi: 10.1371/journal.pone.0084136.t003
Genetic Diversity and Population Structure of Rice
PLOS ONE | www.plosone.org 8 December 2013 | Volume 8 | Issue 12 | e84136

considered for the present study. Pure and Admixture in twopopulations were decided as above in case of SSR markers. Inpopulation K=15, 66 pure and 309 admix were present (Figure6b). Observation of only 66 pure individuals in the K=15population is further supported by the pedigree because onlyfew varieties were developed using local material whereas
majority for modern varieties were bred using genetic materialintroduced from different locations (Table S1).
The grouping of Aus and Indica subpopulation was alsoanalysed with both SSR and SNP markers but no specificgrouping of Aus was observed from indica subpopulation(Figure 6a & 6b).
Figure 3. Analysis of Molecular variance (AMOVA) of 375 rice varieties based on (a) SSR data and (b) SNP data. doi: 10.1371/journal.pone.0084136.g003
Figure 4. Principal Coordinate Analysis (PCoA) of 375 rice varieties based on (a) SSR data and (b) SNP data. doi: 10.1371/journal.pone.0084136.g004
Genetic Diversity and Population Structure of Rice
PLOS ONE | www.plosone.org 9 December 2013 | Volume 8 | Issue 12 | e84136

Discussion
Molecular basis of polymorphism and their distribution acrossthe genome is quite different for SNP and SSR markers.Hence, the utility of SSR/ SNP marker in crop improvement willdepend on the quality of information they provide with respectto parameters for genetic diversity and population structure.This is the first such study where SSR and SNP marker systemwere assessed for their efficiency in assessing genetic diversityand population structure in the large collection of Indian ricevarieties. This study is also important on the account that Indiais the centre of origin for rice and varieties released forcultivation in five major regions are expected to be diversebecause they are released by different states according to theirsuitability to respective agro-climatic conditions. Acomprehensive analysis of SSR and SNP markers in such adiverse set of varieties may assist rice breeders in decidingwhich one of the two is appropriate for the rice germplasmcharacterization and designing breeding strategies.
The SSR vs SNP comparison in Indian rice collection forstatistical parameters, such as number of alleles amplified perprimers (2.2/2.0 allele per primer), gene diversity (0.30/0.28),heterozygosity (0.12/0.19) and PIC value (0.25/0.23), revealedthat both marker systems generated almost similar informationwhen equal number of locus (36 locus each) were studied.Earlier reports say that more SNP loci should be studied whencomparing diversity generated by SSR [26]. Further,
Table 4. Percentage of variation explained by the first 3axes using SSR and SNP markers in Principal Coordinateanalysis.
SSR Markers SNP Markers
Axis 1 2 3 1 2 3% 4.72 4.52 4.08 27.07 9.40 8.73
Cum % 4.72 9.25 13.33 27.07 36.47 45.20doi: 10.1371/journal.pone.0084136.t004
comparison of our findings with previous studies in rice usingboth SSR and SNP markers, showed mixed results in numberof cases; low numbers of alleles were reported for SSRmarkers. The low number of alleles recorded in this study maybe mainly due to the resolution effectiveness of the metaphoragarose used for separation of amplified products. Variousstudies in rice using agarose/ PAGE gels have reported lowernumbers of alleles [27-29]. Another reason for reduced numberof alleles may be the exclusion of monomorphic and spuriousbands from analysis. The low average PIC value (0.25)observed with SSR markers indicates lower genetic diversityamong the rice varieties considered for our study. The highaverage PIC value for SSRs have been mainly reported withdiverse germplasm lines because they are genetically morediverse compared to varieties. PIC depends upon many factorssuch as breeding behavior of the species, genetic diversity inthe collection, size of the collection, sensitivity of genotypingmethod and location of primers in the genome used for study.Low PIC value with SSR markers was found in other ricecollection studies [29,30]. For the SNP markers PIC valuesranged from 0.03 to 0.37 with an average PIC value 0.23. PICvalue in the similar range was reported for SNP markers in acollection of rice varieties by Chen et al [31]. Moreover, due tobi-allelic nature of SNPs, their PIC values can range from 0 to0.5. Whereas for SSR markers which are mutli-allelic PIC valuegoes above 0.5 and it can go up to 1.0. Therefore, in our study,SNP markers with mean PIC value 0.23 were more informativethan SSR markers with mean value of just 0.25.
Furthermore, efficiency of both the markers was compared inassessing genetic relatedness among the varieties on the basisof their clustering pattern in the unrooted tree. Although theunrooted trees constructed using either SSR or SNP markers,grouped varieties into three major clusters, the numbers ofvarieties grouped into the clusters were different for both thetrees. These findings were not surprising as broad pattern ofgrouping is expected to be more or less similar irrespective oftype of markers used for genetic relatedness study. Similar,findings were also reported in European rice collection byCourtois et al. [17]. Traits available in passport data were
Figure 5. Estimation of population using LnP(D) derived Δk for k from 1 to20, (a) SSRs and (b) SNPs. doi: 10.1371/journal.pone.0084136.g005
Genetic Diversity and Population Structure of Rice
PLOS ONE | www.plosone.org 10 December 2013 | Volume 8 | Issue 12 | e84136
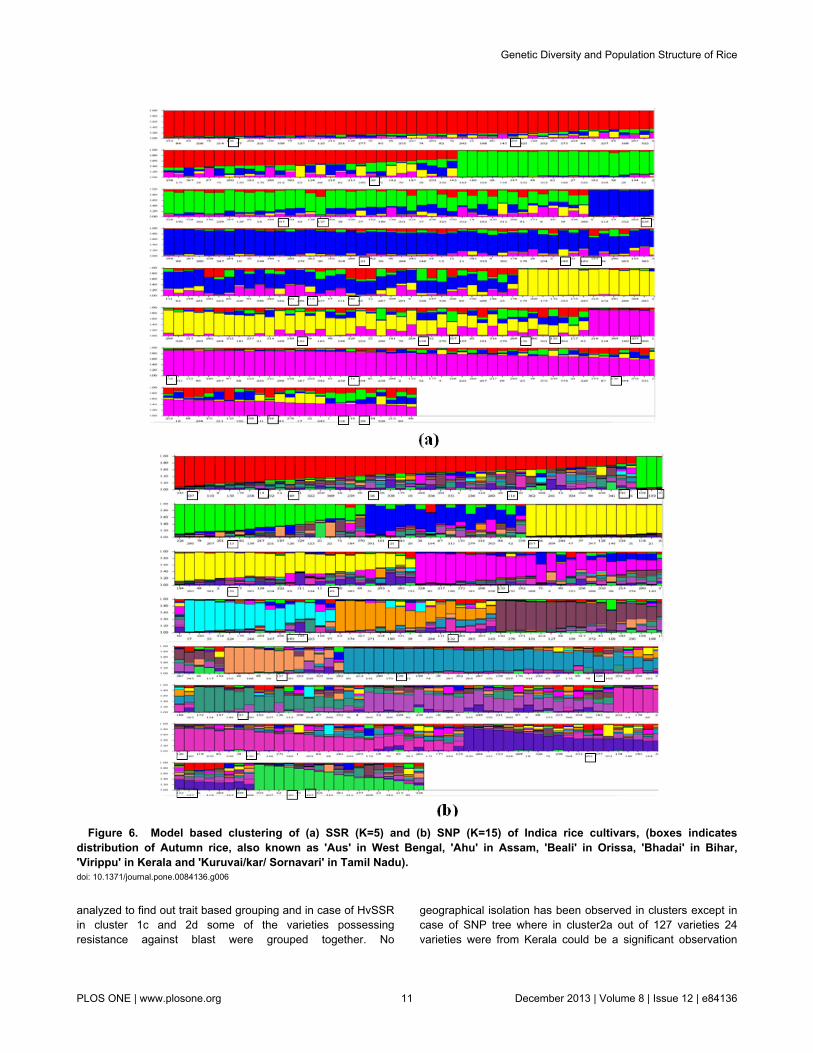
analyzed to find out trait based grouping and in case of HvSSRin cluster 1c and 2d some of the varieties possessingresistance against blast were grouped together. No
geographical isolation has been observed in clusters except incase of SNP tree where in cluster2a out of 127 varieties 24varieties were from Kerala could be a significant observation
Figure 6. Model based clustering of (a) SSR (K=5) and (b) SNP (K=15) of Indica rice cultivars, (boxes indicatesdistribution of Autumn rice, also known as 'Aus' in West Bengal, 'Ahu' in Assam, 'Beali' in Orissa, 'Bhadai' in Bihar,'Virippu' in Kerala and 'Kuruvai/kar/ Sornavari' in Tamil Nadu). doi: 10.1371/journal.pone.0084136.g006
Genetic Diversity and Population Structure of Rice
PLOS ONE | www.plosone.org 11 December 2013 | Volume 8 | Issue 12 | e84136

regarding geographical isolation. Lack of geographical isolationobserved in the present study was mainly due to frequentintroduction of genetic material from different locations fordevelopment of modern rice varieties. AMOVA analysis alsoindicated that at regions only 1% diversity exists whereasamong population level 4% diversity exists in HvSSR and 1%at population level in SNP with the both the markers maximumdiversity is getting portioned at individual’s level (70 % in caseof SSR and 67% in case of SNP) and within individual (25% inSSR and 32% in SNP) level. AMOVA study shows that HvSSRmarker has explained better partitioning of variation than SNPmarkers. Similar partitioning of variation at population and subpopulation level has been reported in case of rice [32]. ThePCoA plot analysis of rice varieties using SSR vs SNPgenerated interesting results. Though, the broad pattern ofdistribution of varieties in the PCoA plots was similar with boththe markers, but a closer look revealed three major clusters forrice varieties in case of SNP markers, such grouping was notfound in case of SSR markers. Similar observation has beenreported in case of wheat with SNP markers [33]. Theproportion of variance explained by first three coordinates incase of SNP (45.20%) was higher than the SSR (13.33%)which in accordance with finding in maize [34] and Wheat [33].Overall at the genetic relatedness level SSR markers are moreinformative as compared to SNP markers. Therefore, it may beconcluded on the basis of this study that for genetic diversityanalysis HvSSR markers were more effective. SSR marker ingenetic diversity analyses have been a powerful tool becausethese markers are neutral, multi-allelic and co-dominant innature (Lapitan et al. 2007)[27].
Based on SSR and SNP markers study Indica rice has beensubdivided into two subpopulations Aus and Indica [3,35,36]. Inthe present study SSR markers support the grouping but withSNP marker no such clear distinction between the twosubpopulations was observed. There are three seasons forgrowing rice in India viz.- autumn, winter and summer. Autumnrice is known as 'Aus' in West Bengal, 'Ahu' in Assam, 'Beali' inOrissa, 'Bhadai' in Bihar, 'Virippu' in Kerala and 'Kuruvai/kar/Sornavari' in Tamil Nadu. The pedigree of modern varietiesalso shows that autumn rice has been frequently used as oneof the parent in the development of modern varieties, such asRatna, Manoharsali and Annada (Table S1) has been used fordevelopment of Shanti, Himalaya-2, Nagarjuna, Chandan,Kapilee and Luit. This may be another reason for lessdistinction between the two subpopulations. Similar trend wasobserved with population structure where Aus did not showdistinct grouping from indica subpopulation (Figure 6a & 6b).
At population level, no clear population structure for the ricevarieties was observed either with SSR or SNP markers whichmay be due to large genetic variation or frequent intermixing ofrice varieties in rice crossing programme across the regions.Therefore ad hoc population was determined using Δk anddifferent populations numbers were found with SSR (K=5) andSNP (K=15) markers. The genetic structures of populationshave been previously reported in rice [37-41]. The populationobserved in these studies ranged from K=3 (Zhao et al. 2009)to K=7 (Jin et al. 2010). The higher value (K = 7) is primarilydue to the higher number and diverse set of germplasm [41].
The present study generated a population structure with fiveclusters using SSR, and fifteen clusters using SNP. Fifteenpopulation cluster and large number of admixture varieties withSNP indicated that population structure can be better explainedwith SNP markers, because in released varieties of Indian riceto create variation large number of diverse parents has beenused. Since admixture is the representation of diverse parents,which themselves have diverse ancestry in breeding historyand domestication, may be main reason for variation present inthe population [42]. Since, in the SNP based populationstructure rice varieties appeared subdivided in more clustersthan SSR, indicated ability of SNP marker system indelineating population structure at fine level in crops.
In conclusion, though SSR/SNP are multi-allelic/bi-allelicnature and have different distribution pattern over genomeeven then in the present study equal number of locus (thirty-sixeach) amplified almost equal number of alleles in case of SSR(80) and SNP (72) markers. However, the unique features ofSNP markers such as, abundance in the genome, ability togenerate polymorphism due to variation at single base leveland their development from the conserved single-copy ricegenes [19], enabled these markers to present different diversityspectrum as well as the population structure in Indian ricevarieties as compared to the SSR markers. At the populationstructure level SNP markers showed better genetic relatednesswith more population number whereas at the diversity levelSSR showed better grouping samples even at trait level. Forthis reason, SNP markers should be preferably used fordetermination of population structure in crops. Moreover, SNPmarkers are mostly derived from genes, as a result geneticdiversity assessed using these markers reveals functionalvariations and may be potentially exploited for the marker traitassociation studies. Additionally, SNP markers in the presentstudy were derived from the genomic region of rice havingsynteny with wheat genome and therefore may be equallyuseful for assessing genetic diversity, population structure andother marker based studies in wheat.
Supporting Information
Table S1. List of rice varieties genotyped using SSR andSNP markers.(DOCX)
Table S2. Details of rice samples showed trait basedgrouping with SSR markers.(DOCX)
Table S3. a. AOMVA analysis between Indica rice population(345 varieties) and aus rice population (29 varieties) afterremoving hybrid rice (1 variety) sample based on SSR marker.b. F-statistics analysis between Indica rice population (345varieties) and aus rice population (29 varieties) after removinghybrid rice (1 variety) sample based on SSR marker.(DOCX)
Genetic Diversity and Population Structure of Rice
PLOS ONE | www.plosone.org 12 December 2013 | Volume 8 | Issue 12 | e84136

Table S4. a. AOMVA analysis between Indica rice population(345 varieties) and aus rice population (29 varieties) afterremoving hybrid rice (1 variety) sample based on SNP marker.b. F-statistics analysis between Indica rice population (345varieties) and aus rice population (29 varieties) after removinghybrid rice (1 variety) sample based on SNP marker.(DOCX)
Figure S1. Analysis of Molecular variance (AMOVA)between Indica rice population (345 varieties) and aus ricepopulation (29 varieties) after removing hybrid rice (1variety) based on (a) SSR data and (b) SNP data.(DOCX)
Acknowledgements
We are grateful to Dr Jonathan K Stiles, Professor, MorehouseSchool of Medicine, Atlanta Ga 30310 for manuscript editingand anonymous reviewers for their critical inputs to improve themanuscript. We are thankful to the Director, NBPGR, NewDelhi, who provided facilities for this work.
Author Contributions
Conceived and designed the experiments: RS NKS. Performedthe experiments: NS DRC. Analyzed the data: RS SK AKS.Contributed reagents/materials/analysis tools: NS DRC KSRKT. Wrote the manuscript: RS AKS NKS.
References
1. Kennedy G, Burlingame B (2003) Analysis of food composition data onrice from a plant genetic resources perspective. Food Chem 80: 589–596. doi:10.1016/S0308-8146(02)00507-1.
2. Lu H, Redus MA, Coburn JR, Rutger JN, Mc Couch SR et al. (2005)Population structure and breeding patterns of 145 U.S. rice cultivarsbased on SSR marker analysis. Crop Sci 45: 66-76. doi:10.2135/cropsci2005.0066.
3. Garris AJ, Tai TH, Coburn J, Kresovich S, McCouch SR (2005) Geneticstructure and diversity in Oryza sativa L. Genetics 169: 1631-1638.PubMed: 15654106.
4. Dangi GS, Mendum ML, Prins BH, Walker MA, Meredith CP et al.(2001) Simple sequence repeat analysis of a clonally propagatedspecies: a tool for managing a grape germplasm collection. Genome44: 432-438. doi:10.1139/g01-026. PubMed: 11444702.
5. Coombs JJ, Frank LM, Souches DS (2004) An applied fingerprintingsystem for cultivated potato using simple sequence repeats. Am J ofPotato Res 81: 243-250. doi:10.1007/BF02871765.
6. Louarn S, Torp AM, Holme IB, Andersen SB, Jensen BD (2007)Database derived microsatellite markers (SSRs) for cultivardifferentiation in Brassica oleracea. Genet Resour Crop Evol 54:1717-1725. doi:10.1007/s10722-006-9181-6.
7. Rahman ML, Jiang W, Chu SH, Qiao Y, Ham TH, et al. (2009) High-resolution mapping of two rice brown plant hopper resistance genes,Bph20(t) and Bph21(t), originating from Oryza minuta. Theor ApplGenet 119: 1237–1246
8. Dangl GS, Yang J, Golino DA, Gradziel T (2009) A practical method foralmond cultivar identification and parental analysis using simplesequence repeat markers. Euphytica 168: 41-48. doi:10.1007/s10681-008-9877-0.
9. Moriya S, Iwanami H, Okada K, Yamamoto T, Abe K (2011) A practicalmethod for apple cultivar identification and parent- offspring analysisusing simple sequence repeat markers. Euphytica177: 135–150. doi:10.1007/s10681-010-0295-8.
10. Zhu Y, Hu J, Han R, Wang Y, Zhu S (2011) Fingerprinting andidentification of closely related wheat (Triticum aestivum L.) cultivarsusing ISSR and fluorescence-labeled TP-M13-SSR markers. AJCS 5:846-850.
11. McNally KL, Childs KL, Bohnert R, Davidson RM, Zhao K et al. (2009)Genome-wide SNP variation reveals relationships among landracesand modern varieties of rice. Proc Natl Acad Sci U S A 106: 12273–12278. doi:10.1073/pnas.0900992106. PubMed: 19597147.
12. Zhao K, Tung CW, Eizenga GC, Wright MH, Ali ML et al. (2011)Genome-wide association mapping reveals a rich genetic architectureof complex traits in Oryza sativa. Nat Commun 2: 467-476. doi:10.1038/ncomms1467. PubMed: 21915109.
13. IRGSP (2005) The map-based sequence of the rice genome.Nature 436: 793-800. doi:10.1038/nature03895. PubMed: 16100779.
14. Emanuelli F, Lorenz S, Grzeskowiak L, Catalano V, Stefanini M et al.(2013) Genetic diversity and population structure assessed by SSR andSNP markers in a large germplasm collection of grape. BMC Plant Biol13: 1-17. doi:10.1186/1471-2229-13-1. PubMed: 23280064.
15. Cabezas JA, Ibanez J, Lijavetzky D, Velez D, Bravo G et al. (2011) A48 SNP set for grapevine cultivar identification. BMC Plant Biol 11:1-12. doi:10.1186/1471-2229-11-1. PubMed: 21205309.
16. Esteras C, Formisano G, Roig C, Díaz A, Blanca J et al. (2013) SNPgenotyping in melons: genetic variation, population structure, and
linkage disequilibrium. Theor Appl Genet 126: 1285-1303. doi:10.1007/s00122-013-2053-5. PubMed: 23381808.
17. Courtois B, Frouin J, Greco R, Bruschi G, Droc G et al. (2012) Geneticdiversity and population structure in a European collection of rice. CropSci 52: 1663–1675. doi:10.2135/cropsci2011.11.0588.
18. Singh H, Deshmukh RK, Singh A, Singh AK, Gaikwad K et al. (2009)Highly variable SSR markers suitable for Rice genotyping usingAgarose gels. Mol Breed 25: 359-364.
19. Singh NK, Dalal V, Batra K, Singh BK, Chitra G et al. (2007) Single-copy genes define a conserved order between rice and wheat forunderstanding differences caused by duplication,deletion, andtransposition of genes. Funct Integr Genomics 7: 17–35. PubMed:16865332.
20. Liu K, Muse SV (2005) Power Marker: an integrated analysisenvironment for genetic marker analysis. Bioinformatics 21: 2128–2129. doi:10.1093/bioinformatics/bti282. PubMed: 15705655.
21. Nei M, Tajima F, Tateno Y (1983) Accuracy of estimated phylogenetictrees from molecular data. II. Gene frequency data. Journal of Mol Evol19: 153–170. doi:10.1007/BF02300753.
22. Perrier X, Jacquemoud-Collet JP (2006) DARwin software. Available:http://darwin.cirad.fr/darwin.
23. Peakall R, Smouse P (2012) GenAlEx 6.5: Genetic analysis in Excel.Population genetic software for teaching and research - an update.Bioinformatics 28: 2537-2539.
24. Pritchard JK, Stephens M, Donnelly P (2000) Inference of populationstructure using multilocus genotype data. Genetics 155: 945–959.PubMed: 10835412.
25. Evanno G, Regnaut S, Goudet J (2005) Detecting the number ofclusters of individuals using the software STRUCTURE: a simulationstudy. Mol Ecol 14: 2611–2620. doi:10.1111/j.1365-294X.2005.02553.x. PubMed: 15969739.
26. Hamblin MT, Warburton ML, Buckler ES (2007) Empirical comparisonof simple sequence repeats and single nucleotide polymorphisms inassessment of maize diversity and relatedness. PLOS ONE 2: e1367.doi:10.1371/journal.pone.0001367. PubMed: 18159250.
27. Lapitan VC, Brar DS, Abe T, Redona ED (2007) Assessment of geneticdiversity of Philippine rice carrying good quality traits using SSRmarkers. Breeding Sci 57: 263-270. doi:10.1270/jsbbs.57.263.
28. Wang Q, Sang X, Ling Y, Zhao F, Yang Z et al. (2009) Genetic analysisand molecular mapping of a novel gene for zebra mutation in rice(Oryza sativa L.). J Genet Genomics 36: 679-684. doi:10.1016/S1673-8527(08)60160-5. PubMed: 19932464.
29. Shah SM, Naveed SA, Arif M (2013) Genetic diversity in Basmati andnon- Basmati rice varieties based on microsatellite markers. Pak J Bot45: 423-431.
30. Pachauri V, Taneja N, Vikram P, Singh NK, Singh S (2013) Molecularand morphological characterisation of Indian farmers rice varieties(Oryza sativa L.) AJCS 7: 923-932.
31. Chen H, He H, Zou Y, Chen W, Yu R, et al. (2011) Development andapplication of a set of breeder friendly SNP markers for geneticanalyses and molecular breeding of rice (Oryza sativa L.). Theor ApplGenet 123: 869-879.
32. Yamasaki M, Ideta O (2013) Population structure in Japanese ricepopulation breeding. Science 63: 49-57.
33. Würschum T, Langer SM, Longin CF, Korzun V, Akhunov E et al.(2013) Population structure, genetic diversity and linkage disequilibrium
Genetic Diversity and Population Structure of Rice
PLOS ONE | www.plosone.org 13 December 2013 | Volume 8 | Issue 12 | e84136

in elite winter wheat assessed with SNP and SSR markers. Theor ApplGenet 126: 1477-1486. doi:10.1007/s00122-013-2065-1. PubMed:23429904.
34. Van Inghelandt D, Melchinger AE, Lebreton C, Stich B (2010)Population structure and genetic diversity in a commercial maizebreeding program assessed with SSR and SNP markers. Theor ApplGenet 120: 1289-1299. doi:10.1007/s00122-009-1256-2. PubMed:20063144.
35. Caicedo AL, Williamson SH, Hernandez RD, Boyko A, Fledel-Alon A etal. (2007) Genome-wide patterns of nucleotide polymorphism indomesticated rice. PLoS Genet 3: e163. doi:10.1371/journal.pgen.0030163. PubMed: 17907810.
36. Kovach MJ, McCouch SR (2008) Leveraging natural diversity: backthrough the bottleneck. Curr Opin Plant Biol 11: 193–200. doi:10.1016/j.pbi.2007.12.006. PubMed: 18313975.
37. Agrama HA, Eizenga GC, Yan W (2007) Association mapping of yieldand its components in rice cultivars. Mol Breed 19: 341–356. doi:10.1007/s11032-006-9066-6.
38. Agrama HA, Eizenga GC (2008) Molecular diversity and genome-widelinkage disequilibrium patterns in a worldwide collection of Oryza sativaand its wild relatives. Euphytica 160: 339–355. doi:10.1007/s10681-007-9535-y.
39. Huang M, Xie F, Chen N, Zhao X, Jojee L et al. (2010) Comparativeanalyses of genetic diversity and structure in rice using ILP and SSRmarkers. Rice Sci 17: 257-268. doi:10.1016/S1672-6308(09)60025-1.
40. Zhao WG, Chung JW, Ma KH, Kim TS, Kim SM et al. (2009) Analysesof genetic diversity and population structure of rice cultivars fromKorea, China and Japan using SSR markers. Gene Genome 31:283-292. doi:10.1007/BF03191201.
41. Jin L, Lu Y, Xiao P, Sun M, Corke H (2010) Genetic diversity andpopulation structure of a diverse set of rice germplasm for associationmapping. Theor Appl Genet 121: 475–487. doi:10.1007/s00122-010-1324-7. PubMed: 20364375.
42. Garris A, McCouch SR, Kresovich S (2003) Population structure and itseffect on haplotype diversity and linkage disequilibrium surrounding thexa5 locus of rice (Oryza sativa L.). Genetics 165: 759–769.
Genetic Diversity and Population Structure of Rice
PLOS ONE | www.plosone.org 14 December 2013 | Volume 8 | Issue 12 | e84136