2 016 17 fic tio n cre a tive n o n fic tio n p o e try visu a l a rt
Upload
independentCategory
view
3download
0
Article No. mb982149 J. Mol. Biol. (1998) 284, 363±384
Comparative Kinetic Analysis of FLP and CreRecombinases: Mathematical Models for DNA Bindingand Recombination
Leonie Ringrose1, Valere Lounnas2, Lutz Ehrlich3, Frank Buchholz4
Rebecca Wade3 and A. Francis Stewart1*
1Gene Expression ProgrammeEMBL, Meyerhofstr. 169117, Heidelberg, Germany2Karolinska InstituteDepartment of Biosciences atNovum, Centre for StructuralBiochemistry, S-14157Huddinge, Sweden3Structures and BiocomputingProgramme, EMBL,Meyerhofstr. 1, Heidelberg69117, Germany4UCSF, Hooper Fnd.HSW 1501, 513 ParnassusAve, San FranciscoCA 94143-0552, USA
E-mail address of the [email protected]
Abbreviations used: Taps, (N-[Trmethyl]-3-aminopropane-sulfonic aSm, substrate with one monomer; Stwo monomers; M, recombinase mopolyethylene glycol; BSA, bovine se
0022±2836/98/470363±22 $30.00/0
The integrase class site speci®c recombinases FLP from Saccharomyces cer-evisiae, and Cre from bacteriophage P1, have been extensively used todirect DNA rearrangements in heterologous organisms. Although theirreaction mechanisms have been relatively well characterised, little com-parative analysis of the two enzymes has been published. We present acomparative kinetic analysis of FLP and Cre, which identi®es importantdifferences. Gel mobility shift assays show that Cre has a higher af®nityfor its target, loxP (7.4 � 1010 Mÿ1), than FLP for its target, FRT(8.92 � 108 Mÿ1). We show that both recombinases bind the two halvesof their target sites cooperatively, and that Cre shows approximatelythreefold higher cooperativity than FLP. Using a mathematical modeldescribing the sequential binding of recombinase monomers to DNA, wehave determined values for the association and dissociation rate con-stants for FLP and Cre.
FLP and Cre also showed different characteristics in in vitro recombina-tion assays. In particular, approximately tenfold more active FLP wasrequired than Cre to optimally recombine a given quantity of excisionsubstrate. FLP was able to reach maximum excision levels approaching100%, whilst Cre-mediated excision did not exceed 75%. To investigatepossible reasons for these differences a mathematical model describingthe excision recombination reaction was established. Using measuredDNA binding parameters for FLP and Cre in the model, and comparingsimulated and experimental recombination data, the values of theremaining unknown parameters were determined. This analysis indicatesthat the synaptic complex is more stable for Cre than for FLP.
# 1998 Academic Press
Keywords: FLP; Cre; DNA binding; recombination; kinetic
*Corresponding authorIntroduction
Site speci®c recombinases of the integrase familyreversibly catalyse conservative DNA rearrange-ments at precise target sites. Two members of thisfamily, FLP from the yeast Saccharomyces cerevisiae,and Cre from bacteriophage P1, have been exten-sively used for in vivo genomic manipulation in awide range of organisms (for reviews, see Kilby
ing author:
is-(hydroxymethyl)-cid; S, free substrate;m2, substrate withnomers; PEG,rum albumen.
et al., 1993; Barinaga, 1994; Rossant & Nagy, 1995;Rajewsky et al., 1996). Much of the work to datehas been concerned with establishing and optimis-ing experiments in which one or other recombinaseis used alone, and little has been done to comparethe properties of the two recombinases in similarexperiments. However, there is emerging evidencethat FLP and Cre have inherent differences, whichare important for their optimal application toin vivo strategies. For example, Cre is more thermo-stable than FLP, both in vivo and in vitro (Buchholzet al., 1996).
The reaction mechanism of FLP and Cre is rela-tively well characterised. Recombination takesplace between two target sites, each consisting of a34 base-pair (bp) inverted repeat (FRT and loxP for
# 1998 Academic Press

Figure 1. Steps in FLP and Creexcision recombination reaction.Inverted repeat target sites areshown as open arrows. Recombi-nase monomers are shown as ®lledcircles. Each step in the reaction isreversible and has a forward and abackward rate, indicated by smallarrows. The forward and backwardrate constants for each step areindicated on the Figure beside thearrows (small kn or kÿn). The equili-brium constant for the conversionof one complex to another is givenby the quotient of the backwardand forward rate constants. Equili-brium constants are indicated (Kn).Names of species used for math-ematical modelling are shownbeside each complex. For a full listof species used in the model, seeMaterials and Methods.
364 Kinetics of FLP and Cre
FLP and Cre, respectively). Both FLP and Cre cancatalyse excisions, inversions, integrations andtranslocations. The reaction pathway consists offour main stages (Figure 1). The ®rst step is DNAbinding, in which each half of the inverted repeattarget site is bound by a recombinase monomer(Andrews et al., 1987; Hoess & Abremski, 1984;Mack et al., 1992). The next step is synapsis, inwhich two such bound sites are brought togetherby protein-protein interactions (Beatty et al., 1986;Abremski & Hoess, 1985; Adams et al., 1992; Guoet al., 1997). Within the synaptic complex, themultiple steps of recombination take place, result-ing in the cleavage and religation of DNA (for areview, see Stark et al., 1992). The last stage inthe reaction pathway is the dissociation of thesynaptic complex into free protein and reactionproducts (Gates & Cox, 1988; Waite & Cox,1995). Although the mechanisms of individualreaction steps have been extensively studied forboth FLP and Cre, a detailed kinetic analysis ofthe pathway has not been reported for eitherenzyme.
Here, we present a comparative kinetic analysisof individual reaction steps for FLP and Cre. Onthe basis of these results we have established math-ematical models describing both the initial steps ofDNA binding, and the full reaction pathway. Ourresults demonstrate that the two enzymes havestrikingly different kinetic characteristics. How-ever, our mathematical analysis shows that a singlepathway is suf®cient to accurately describe thebehaviour of both enzymes. The results presentedhere thus comprise a quantitative kinetic compari-son of FLP and Cre, and have implications notonly for the understanding of the reaction mechan-isms of the two enzymes, but also for the optimis-ation of in vivo applications.
Results
Proposed recombination pathway of FLP andCre: design of mathematical models
The recombination pathway upon which themathematical model for recombination was based
Kinetics of FLP and Cre 365
is shown in Figure 1. The model describes an exci-sion reaction on a linear DNA substrate. The stepsof DNA binding are well characterised for FLP andCre. Both enzymes bind the inverted repeat targetsite ®rst as a monomer, which is then joined by asecond monomer to form a dimer (Andrews et al.,1987; Hoess et al., 1984; Mack et al., 1992). In themodel, we have assumed that both proteins aremonomeric in solution, based on the behaviour ofFLP and Cre in sucrose density gradients undersimilar buffer conditions to those used in thisstudy (Abremski & Hoess, 1984; Qian et al., 1990).In our scheme, the second-order association rateconstants for the binding of the ®rst and secondmonomers are named k1 and k2, respectively. Thisprocess must occur twice to occupy both targetsites of the excision substrate. In the model, allDNA binding and dissociation steps are describedby k1 and k2, and their corresponding ®rst-orderdissociation rate constants, kÿ1 and kÿ2 (Figure 1).A reduced model, describing the sequential bind-ing of recombinase monomers to a single full sitetarget comprising two half sites, in terms of thefour parameters k1, k2, kÿ1 and kÿ2 is described byequations (7) to (10) (Materials and Methods).
After DNA binding, the next step in the pathwayis synapsis. FLP synapsis occurs by random col-lision (Beatty et al., 1986). For Cre, synapsis in vitrooccurs by random collision, but may also be partlyachieved by an ordered mechanism (Adams et al.,1992). In Figure 1, synapsis of the fully occupiedexcision substrate is described by a single ®rst-order rate constant, k3. The model only allows forintramolecular synapsis, although in reality inter-molecular recombination can also occur. However,for recombination assays, we use standard exper-imental conditions under which the frequency ofintermolecular recombination is negligible. Themultiple steps of catalysis are well characterisedfor FLP and Cre (for reviews, see Stark et al., 1992;Jayaram, 1994; Sadowski, 1995), and are describedin Figure 1 by a single pair of rate constants, k4
and kÿ4, the forward and back rates of catalysis,respectively.
At present, we do not have a means of accu-rately measuring the formation of the synapticcomplex. For this reason, we have further simpli-®ed the model by combining the constants k3 andk4 to give an apparent constant, which we call k34,describing the rate of conversion of the fullybound substrate (SM4) into the excised synapticcomplex (IEP) (Figure 1). The back rate, kÿ34,describes the reverse process. The relationshipbetween k34, kÿ34 and their components k3, kÿ3, k4
and kÿ4 is given by:
k34=kÿ34 � �k3 � k4�=�kÿ3 � kÿ4�In our scheme, the dissociation of the synapse isrepresented as a reversal of its assembly: dis-sociation gives rise ®rst to two products, each ofwhich is bound by a recombinase dimer (Figure 1).This process is described by the ®rst-order rate
constant, k5. The dissociation of recombinase fromDNA is assumed to occur in a stepwise manner,and is described in the model by the rate constantskÿ1 and kÿ2 (Figure 1). This assumption is based onthe most simple and logical pathway. The dis-sociation mechanism of FLP and Cre has not beenstudied extensively, and there is disagreement inthe literature regarding the steps involved. In thecase of FLP, in experiments with synthetic Hollidayjunctions, it has been reported that the resolutionof such structures requires two (Dixon &Sadowski, 1993), three (Qian & Cox, 1995) or fourmolecules of FLP (Lee et al., 1996). Based on exper-iments using full recombination substrates, Waite& Cox (1995) proposed a mechanism for FLP dis-sociation in which one or more monomers leavethe synapse after recombination whilst othersremain bound for longer. In the absence of a con-sensus on the mechanism of dissociation, we pro-pose the mechanism shown in Figure 1, and pointout that other mechanisms could easily be incor-porated into the model by modi®cation ofequations (11) to (24) (Materials and Methods). Inthe case of Cre, support for the mechanism ofsynaptic dissociation proposed here comes fromthe recently determined crystal structure of theCre-lox synaptic complex (Guo et al., 1997). In thiscomplex, the interface between each pair of Cresubunits holding the synapse together is less exten-sive than the interface between each Cre subunitand the DNA half site to which it is bound(3450 AÊ 2 and 5000 AÊ 2 of solvent accessible surfacearea are buried per subunit, respectively). Thissuggests that the stability of the Cre-DNA complexis higher than the stability of the synaptic complex,and thus that the synaptic complex would dis-sociate more readily than its DNA-protein com-ponents.
The question to be asked by the mathematicalmodel is whether there is a unique set of rate con-stants which can describe the observed recombina-tion kinetics of FLP and Cre. If such a set ofparameters can be found, then how do they differfor the two proteins? The DNA binding rate con-stants k1, kÿ1, k2, kÿ2, and their corresponding equi-librium constants K1 and K2, can be directlymeasured using the gel mobility shift assay. If theDNA binding constants are known, this leaves twopairs of unknown rate constants: k34 and kÿ34, andk5 and kÿ5 (Figure 1).
The mathematical model describes a generalexcision recombination reaction in which four pro-tein monomers are required to reversibly recom-bine a single substrate, giving two products. Thevalues of all rate constants, and of protein and sub-strate input can be varied to represent speci®ccases.
Experimental design
To enable comparisons to be made between FLPand Cre, conditions were determined in whichboth proteins recombined optimally. The effect of

366 Kinetics of FLP and Cre
salt on puri®ed FLP and Cre was examined. Bothproteins tolerated a wide range of NaCl concen-trations without loss of recombination activity(between 75 and 250 mM tested, in the presence of2 mM MgCl2), although a relative increase of inter-molecular over intramolecular recombination wasobserved for both FLP and Cre at 250 mM NaCl(data not shown). This result is in agreement withthat of Meyer Leon et al. (1987) using FLP puri®edin the same way as the present preparation. Noevaluation of the effect of variations in monovalentcation concentration on Cre recombination activityhas been published, although MgCl2 has beenshown to be necessary for optimal recombination(Abremski & Hoess, 1984). All subsequent exper-iments were carried out at 180 mM NaCl, 2 mMMgCl2. Both recombinases were found to recom-bine at optimal levels in Taps buffer (pH 8.0).Other buffer components (PEG, glycerol, BSA; seeMaterials and Methods) have been reported toenhance the stability of puri®ed FLP over longincubation times (Gates & Cox, 1988), and wereincluded in the reaction buffers for both proteins inrecombination assays. The comparative analysis ofFLP and Cre which follows is valid for this set ofconditions, which were selected as those givingoptimum performance of both recombinases on lin-ear substrates.
PEG was omitted from the DNA binding bufferand glycerol and BSA were reduced, as these com-ponents were found to interfere with migration.However, since the gel mobility shift data wasmeasured at short time points (15 seconds to tenminutes), the effect of reduced protein stabilitydue to altered buffer components is probablyminimal.
Estimation of the fraction of active protein inpurified FLP and Cre preparations
An accurate measure of the activity of puri®edprotein preparations is crucial to any kinetic anal-ysis. The fact that both FLP and Cre are requiredin stoichiometric rather than enzymatic quantitiesfor ef®cient catalysis has raised doubts over thefraction of active monomers in puri®ed prep-arations (Gates & Cox, 1988; Abremski & Hoess,1984). In the course of the experiments presentedhere, we were able to address the issue of proteinactivity for both FLP and Cre. For Cre, gel mobilityshift titration experiments (Figure 3e, below)showed that close to 100% of the preparation isactive in DNA binding. For FLP, substrate satur-ation experiments (Figure 7, below) showed that atleast 44% of the preparation is active in recombina-tion. However, this is very likely an underestimateof the true FLP activity. For the purpose of theanalysis which follows, we assume both prep-arations to be 100% active. We point out that if100% is an overestimate of FLP activity, this wouldlead to a maximum error of approximately twofoldin the measurement of DNA binding rate con-stants.
Accuracy of the gel mobility shift assay:FLP and Cre complexes do not dissociateduring electrophoresis
The gel mobility shift assay is attractive for theanalysis of stepwise binding of FLP and Cre totheir target sites because it allows direct detectionof distinct species. However, the assumption thatthe assay accurately reports the distribution ofdifferent bound states is crucial to the kinetic anal-ysis which follows. The main source of error in thegel mobility shift assay is the dissociation of DNA-protein complexes during electrophoresis, theextent of which varies depending on the DNA-pro-tein interaction studied (Senear & Brenowitz, 1991;Hoopes et al., 1992). To determine to what extentFLP and Cre protein-DNA complexes would sur-vive electrophoresis, we designed substrates inwhich one or two monomers can be bound.
The various DNA substrates used in the bandshift assay are shown schematically in Figure 2.Non-speci®c carrier DNA was included in thebinding reactions to reduce smearing and to pre-vent loss of material due to sticking in the wells ofthe gel. The carrier DNA was present at approxi-mately 20-fold molar excess over speci®c sites, and,therefore, may have an effect on the measurementof constants due to weak non-speci®c association,thus reducing the effective concentration of freemonomer at any one time. This will principallyaffect the rate of binding and as a result, themeasurements may be underestimates of the truebinding rates.
FLP or Cre protein was incubated at differentconcentrations with either an inverted repeat tar-get, which contains two binding sites, or a mutatedtarget (FRTM, loxM) containing only one bindingsite (Figure 3). At the range of concentrations used,FLP did not show non-speci®c binding to a non-cognate target site. Cre did not show non-speci®cbinding at protein concentrations of below 3.2 nM(data not shown). At Cre concentrations of 3.2 nMand above, a faint slowly migrating band was seenon both the loxP and the loxM substrates (Figure 3eand f, last lane), which may represent non-speci®cbinding, or a speci®c or non-speci®c protein pro-tein interaction.
Figure 3a shows that FLP formed two complexeson the FRT (complexes 1 and 2). Previously, similarcomplexes have been shown by others to correspondto occupation by a FLP monomer of one or bothhalves of the target site (Andrews et al., 1987; Lee &Jayaram, 1995). On the mutated target site FRTM(Figure 3b), only one complex was formed, co-migrating with the lower complex (complex 1),which indicates that it contains a monomer bound toone half of the FRT. Similarly, Cre formed two com-plexes on loxP (complexes 1 and 2, Figure 3e). Foot-printing and stoichiometric analysis has demon-strated that both a monomer and a dimer complexare formed on the loxP target, corresponding tooccupation of one or both halves of the invertedrepeat (Hoess & Abremski, 1984; Mack et al., 1992).

Figure 2. Substrates used in thegel mobility shift assay. a, FRTinverted repeat target contains theinverted repeat from the wild-typetarget. Inverted repeat elements areshown as shaded arrows. A singlemismatch at position 2 of therepeat element is indicated by boldtype. Half site elements a and b areindicated above the sequence. Thenon-palindromic spacer is indi-cated. Cleavage points are markedby vertical arrows. b, In the FRTMtarget the b half site element of theFRT site is mutated to abolish bind-ing. Positions which are mutatedwith respect to the wild-typesequence are shown in lower case.c, The loxP inverted repeat targetcontains the inverted repeat fromthe wild-type loxP sequence.Inverted repeat elements are shownas shaded arrows. Half siteelements a and b are indicatedabove the sequence. The non-palin-dromic spacer is indicated. Clea-vage points are marked by verticalarrows. d, In the loxM target the bhalf site element of the loxP site ismutated to abolish binding. Pos-itions which are mutated withrespect to the wild-type sequence
are shown in lower case. e, Bandshift substrates. The position of the inverted repeat elements (shaded arrows) relativeto the ends of the DNA fragments used in binding assays is shown.
Kinetics of FLP and Cre 367
On the mutated target loxM, Cre formed a singlespeci®c complex which co-migrated with complex 1(Figure 3e and f), indicating that this represents amonomer bound to one half of the mutated targetsite.
In the full site binding assay for both FLP andCre, it was not possible to distinguish betweenbinding at site a or site b in complex 1. Monomercomplexes bound at site a and site b probably co-migrate, since the monomer complex formed onFRTM or loxM is indistinguishable from thatformed on the full site substrate in each case(Figure 3, and data not shown).
The method of Senear & Brenowitz (1991) fordetecting dissociation of complexes during electro-phoresis is based on separate quanti®cation ofbound and unbound DNA. If complexes dissociate,then some of the labelled DNA will form a smearahead of the main protein DNA complex, but thefree DNA band will be unaffected. Instead of treat-ing each band as a fraction of the total in the lane,the bound and free DNA are analysed as individ-ual bands. The bound and free DNA bands inFigure 3a, b, e and f were quanti®ed by Phosphor-Imager analysis and the fraction of DNA in theband relative to the DNA in lane 1 of each gel wasdetermined (shown as ``fraction bound'' in theFigure). The data were plotted against the concen-tration of free protein monomer, as shown inFigure 3c, d, g and h. The titration data are
described by the Langmuir isotherm (equation (3),Materials and Methods).
The mobility shift titration data in Figure 3 were®tted to the equation to generate the curves shown(Figure 3c, d, g and h). The curves for bound andfree DNA will be coincident only if dissociationdoes not occur. For total FLP binding (Figure 3c),and total Cre binding (Figure 3g) the ®tted curvesare almost exactly coincident, showing that therewas no detectable loss of binding during electro-phoresis. This result was con®rmed for complex 2using the method of Hoopes et al. (1992) in whichcomplexes are electrophoresed over different timesand the extent of binding compared. In theseexperiments, FLP and Cre dimer complexes didnot detectably dissociate over electrophoresis timesof up to two and a half hours (data not shown).
The dissociation of monomer complexes wasalso evaluated independently, using the data inFigure 3b and f for the substrates FRTM and loxM.Analysis of the ®tted curves for both the FLPmonomer complex (Figure 3d) and the Cre mono-mer complex (Figure 3h) indicated slightly tighterbinding predicted by the curve for the free DNAthan by the curve for the bound DNA, suggestingthat some dissociation had occurred. However, theloss of monomer complexes represents less than10% in both cases.
These results show that for both FLP and Cre,the dimer complex does not detectably dissociate

Figure 3. Gel mobility shifttitrations of FLP and Cre bindinginverted repeat and mutant targetsites. FLP was incubated for tenminutes at 30�C at various proteinconcentrations (as indicated) with0.2 nM FRT (a) or FRTM (b). Crewas incubated for ten minutes at37�C at various protein concen-trations (as indicated) with 0.2 nMloxP (e) or loxM (f). The nM totalprotein input is given above eachpanel; the log of the molar concen-tration is shown below each panel.Bands corresponding to free DNA,complexes containing one monomer(1) and 2 monomers (2) are marked.c, d, g and h, Separate analysis ofthe protein-bound and free DNAbands from a, b, e and f. c and g,The sum of bands in complexes 1and 2 in each lane of a and e wascalculated as a fraction of totalDNA in lane 1 (®lled triangles,marked bound). The free DNA wascalculated as a fraction of the DNAin lane 1 of each gel; this value wassubtracted from 1 (open circles,marked 1-free). Both values wereplotted against the log of the molarconcentration of free FLP or Cremonomer. d and h, As for c and g,except that the bound fraction rep-resents complex 1 alone. The con-tinuous lines indicate the best ®tcurves obtained according toequation (3) as described in
Materials and Methods. Using the curves in d, values for the equilibrium association constant for FLP binding to asingle site K1a � 1.06 (�0.095) � 107 Mÿ1 and K1a � 1.87 (�0.29) � 107 Mÿ1 were obtained for the bound and free DNAbands, respectively. For Cre, (h), values for the equilibrium association constant for binding to a single site K1a � 3.19(�0.40) � 108 Mÿ1 and K1a � 3.87 (�0.51) � 108 Mÿ1 were obtained for the bound and free DNA bands, respectively.
368 Kinetics of FLP and Cre
during electrophoresis, whilst for the monomercomplex, less than 10% dissociation occurs. Weconclude that the gel mobility shift assay can pro-vide data of suf®cient accuracy for quantitativeanalysis of FLP and Cre.
Table 1. Equilibrium association constants for FLP andCre binding to DNA
FLP �Ga Cre �Gb
K1a (Mÿ1) 1.06 � 107 9.87 3.19 � 108 11.82K1b (Mÿ1) 1.08 � 107 9.88 2.81 � 108 12.41K1 (Mÿ1) 2.14 � 107 10.30 6.00 � 108 12.61K2 (Mÿ1) 8.92 � 108 12.57 7.4 � 1010 15.62
K1a is the equilibrium association constant for recombinasebinding to a single element of a mutated target site and wascalculated from the data in Figure 3b and f as described inMaterials and Methods. K1 and K2 were calculated fromFigure 4 as described in Materials and Methods. K1 is the sumof equilibrium constants for recombinase binding separately toeach site in a full site substrate (K1 � K1a � K1b). K1b was calcu-lated as K1 ÿ K1a. K2 is the equilibrium constant for binding ofthe second recombinase monomer to the full site target.
a In kcal/mol at 30�C.b In kcal/mol at 37�C.
Cre has a higher DNA binding affinity andhigher cooperativity than FLP
The equilibrium constant K1a, indicating the af®-nity of a FLP or Cre monomer for a single site, wasdetermined from the FRTM and loxM titration data(Table 1). In a full site system, complexes 1a and1b (monomer binding to element a or b, respect-ively) are not distinguishable, and the macroscopicequilibrium constant K1 for the observed complex1 is equal to the sum of the microscopic constantsfor intrinsic binding to each site, K1a � K1b (Senear& Brenowitz, 1991). From the full site titration datain Figure 3a and e, the equilibrium constants K1
(complex 1) and K2 (complex 2) were obtainedusing equations (2a) to (2c) as described inMaterials and Methods. The fractions of free DNA,complex 1 and complex 2 were plotted separatelyagainst free monomer concentration (Figure 4). Thedata were ®tted to equations (2a) to (2c), to yieldvalues for K1 and K2 for FLP and Cre as shown inTable 1.
Comparison of the K2 values for FLP and Cre(Table 1; 8.92 � 108 and 7.4 � 1010 Mÿ1, respect-
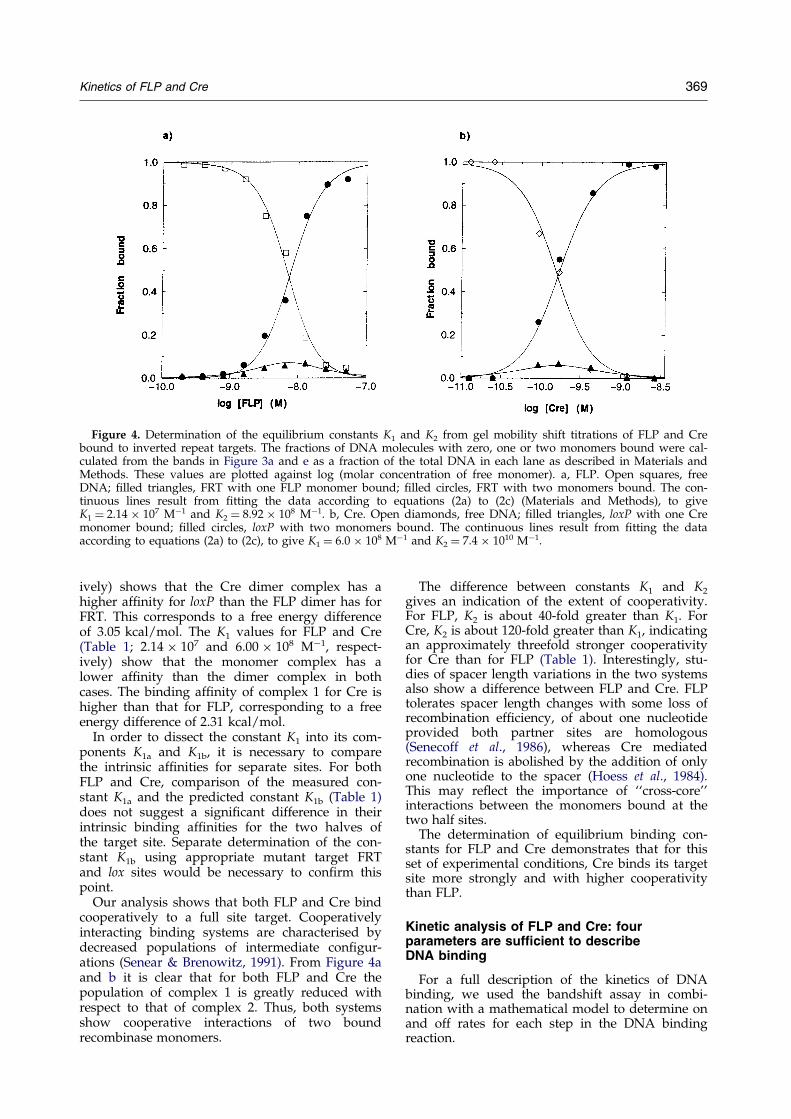
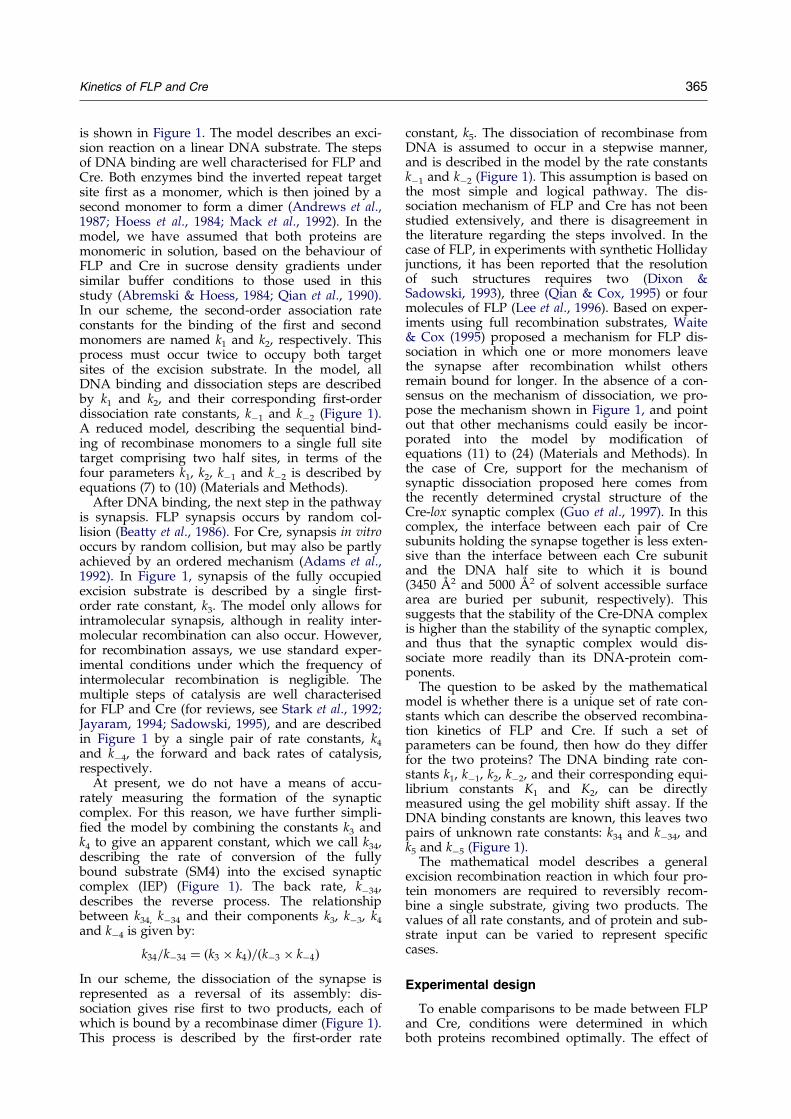
Figure 4. Determination of the equilibrium constants K1 and K2 from gel mobility shift titrations of FLP and Crebound to inverted repeat targets. The fractions of DNA molecules with zero, one or two monomers bound were cal-culated from the bands in Figure 3a and e as a fraction of the total DNA in each lane as described in Materials andMethods. These values are plotted against log (molar concentration of free monomer). a, FLP. Open squares, freeDNA; ®lled triangles, FRT with one FLP monomer bound; ®lled circles, FRT with two monomers bound. The con-tinuous lines result from ®tting the data according to equations (2a) to (2c) (Materials and Methods), to giveK1 � 2.14 � 107 Mÿ1 and K2 � 8.92 � 108 Mÿ1. b, Cre. Open diamonds, free DNA; ®lled triangles, loxP with one Cremonomer bound; ®lled circles, loxP with two monomers bound. The continuous lines result from ®tting the dataaccording to equations (2a) to (2c), to give K1 � 6.0 � 108 Mÿ1 and K2 � 7.4 � 1010 Mÿ1.
Kinetics of FLP and Cre 369
ively) shows that the Cre dimer complex has ahigher af®nity for loxP than the FLP dimer has forFRT. This corresponds to a free energy differenceof 3.05 kcal/mol. The K1 values for FLP and Cre(Table 1; 2.14 � 107 and 6.00 � 108 Mÿ1, respect-ively) show that the monomer complex has alower af®nity than the dimer complex in bothcases. The binding af®nity of complex 1 for Cre ishigher than that for FLP, corresponding to a freeenergy difference of 2.31 kcal/mol.
In order to dissect the constant K1 into its com-ponents K1a and K1b, it is necessary to comparethe intrinsic af®nities for separate sites. For bothFLP and Cre, comparison of the measured con-stant K1a and the predicted constant K1b (Table 1)does not suggest a signi®cant difference in theirintrinsic binding af®nities for the two halves ofthe target site. Separate determination of the con-stant K1b using appropriate mutant target FRTand lox sites would be necessary to con®rm thispoint.
Our analysis shows that both FLP and Cre bindcooperatively to a full site target. Cooperativelyinteracting binding systems are characterised bydecreased populations of intermediate con®gur-ations (Senear & Brenowitz, 1991). From Figure 4aand b it is clear that for both FLP and Cre thepopulation of complex 1 is greatly reduced withrespect to that of complex 2. Thus, both systemsshow cooperative interactions of two boundrecombinase monomers.
The difference between constants K1 and K2
gives an indication of the extent of cooperativity.For FLP, K2 is about 40-fold greater than K1. ForCre, K2 is about 120-fold greater than K1, indicatingan approximately threefold stronger cooperativityfor Cre than for FLP (Table 1). Interestingly, stu-dies of spacer length variations in the two systemsalso show a difference between FLP and Cre. FLPtolerates spacer length changes with some loss ofrecombination ef®ciency, of about one nucleotideprovided both partner sites are homologous(Senecoff et al., 1986), whereas Cre mediatedrecombination is abolished by the addition of onlyone nucleotide to the spacer (Hoess et al., 1984).This may re¯ect the importance of ``cross-core''interactions between the monomers bound at thetwo half sites.
The determination of equilibrium binding con-stants for FLP and Cre demonstrates that for thisset of experimental conditions, Cre binds its targetsite more strongly and with higher cooperativitythan FLP.
Kinetic analysis of FLP and Cre: fourparameters are sufficient to describeDNA binding
For a full description of the kinetics of DNAbinding, we used the bandshift assay in combi-nation with a mathematical model to determine onand off rates for each step in the DNA bindingreaction.
Fig
ure
5.
Kin
etic
so
fF
LP
and
Cre
bin
din
gto
inv
erte
dre
pea
tta
rget
sm
easu
red
by
gel
mo
bil
ity
shif
tas
say
.a
and
c,F
LP
or
Cre
pro
tein
sw
ere
incu
bat
edw
ith
0.2
nM
FR
To
rlo
xPfu
llsi
tesu
bst
rate
at30� C
or
37� C
,re
spec
tiv
ely
,in
100ml
vo
lum
eat
fou
rd
iffe
ren
tp
rote
inco
nce
ntr
atio
ns
asin
dic
ated
on
the
Fig
ure
.A
liq
uo
ts(1
5ml
)w
ere
rem
ov
edan
dlo
aded
atth
eti
me
po
ints
sho
wn
.C
om
ple
xes
con
tain
ing
on
ean
dtw
oF
LP
or
Cre
mo
no
mer
sar
em
ark
edb
esid
eth
eF
igu
reas
1an
d2,
resp
ecti
vel
y.
ban
dd
,T
he
nM
DN
Ain
each
of
the
ban
ds
ina
and
cw
ere
calc
ula
ted
asd
escr
ibed
inM
ater
ials
and
Met
ho
ds
and
plo
tted
agai
nst
tim
efo
rea
chex
per
imen
t.F
ille
dtr
ian
gle
s,co
mp
lex
1;®
lled
circ
les,
com
ple
x2;
con
tin
uo
us
lin
es,
sim
ula
ted
DN
Ab
ind
ing
curv
es®
tted
tod
ata
for
FL
Pan
dC
re.
DN
Ab
ind
ing
tim
eco
urs
ecu
rves
wer
esi
mu
late
das
des
crib
edin
the
tex
tan
dM
ater
ials
and
Met
ho
ds.
Th
ein
pu
tv
alu
esfo
rp
rote
inan
dsu
bst
rate
wer
eas
for
aan
dc.
Sim
ula
ted
curv
esfo
rth
esp
ecie
sS
M(c
om
ple
x1)
and
SM
2(c
om
ple
x2)
wer
e®
tted
toth
eex
per
imen
tal
dat
afo
rea
chp
rote
inin
pu
tin
div
idu
ally
by
sim
ult
aneo
us
op
tim
isat
ion
of
the
rate
con
stan
tsk 1
,k ÿ
1,
k 2an
dk ÿ
2u
sin
gth
eo
pti
mis
atio
np
roce
du
red
escr
ibed
inM
ater
ials
and
Met
ho
ds.
Th
eo
pti
mis
edv
alu
esfo
rth
efo
ur
par
amet
ers
are
sho
wn
inT
able
2.

Kinetics of FLP and Cre 371
The FRT and loxP inverted repeat substratesshown in Figure 2a and c were used in the kineticexperiments. These substrates enabled the bindingof complex 1 and complex 2 to be observed simul-taneously (Figure 5). The kinetic experiments werecarried out for FLP and Cre at four protein concen-trations, chosen to cover the middle range of theequilibrium titrations shown in Figure 3a and e. Inaddition, the highest concentration in each case(12.8 nM and 1.6 nM for FLP and Cre, respect-ively) gave ef®cient recombination of 0.2 nM DNAexcision substrate in vitro (not shown).
Figure 5 shows the gel mobility shift time courseexperiments for FLP (a) and Cre (c). The changingdistribution of complexes 1 and 2 (monomer anddimer) over time can be seen. For FLP, at the ear-liest time point (15 seconds), the monomer wasprevalent at all four protein concentrations. Thedimer complex was formed subsequently, and therate and extent of its formation increased withincreasing protein concentration (Figure 5a and b).Both species reached a stable equilibrium between®ve and ten minutes (not shown).
Figure 5c shows gel mobility shift time coursedata for Cre binding to loxP (c and d). At the low-est Cre concentration (0.2 nM), the monomer com-plex was prevalent at early time points, and wasprogressively replaced by the dimer complex. Athigher Cre concentrations (0.4 and 0.8 nM), themonomer was consumed more rapidly by thedimer. At 1.6 nM Cre, no monomer was detectedat 15 seconds.
Comparing the behaviour of Cre to that of FLPin this assay, it is clear that Cre shows a greatercooperativity of binding than FLP, indicated by thefact that for Cre, the monomer complex is replacedmore rapidly and more completely by the dimer.This result is consistent with the equilibrium datadescribed above.
To ®nd values for the rate constants responsiblefor the behaviour of the monomer and dimerspecies over time, we used a mathematical modelin which the time course of DNA binding can besimulated and compared to the observed data. Themodel was constructed on the basis of the differen-tial equations (7) to (10) (see Materials and
Table 2. Optimised association and dissociation rate constan
Protein input k1
A. FLP 1.6 nM 9.3 � 106
3.2 nM 7.1 � 106
6.4 nM 6.0 � 106
12.8 nM 3.9 � 106
B. Cre 0.2 nM 1.4 � 108
0.4 nM 5.3 � 108
0.8 nM 2.2 � 108
1.6 nMa 2.2 � 108
The values of k1, kÿ1, k2 and kÿ2 resulting from the optimisationtext) are shown.
a The values of k1, kÿ1, k2 and kÿ2 for Cre at 1.6 nM were not obpoints in the experiment to determine unique values of the four pa0.8 nM and were used to generate the time course curves shown in
Methods), which describe the evolution of freemonomer, free substrate, complexes SM (boundmonomer) and SM2 (bound dimer), over time. Themodel was used to simulate time course curves forDNA binding of FLP and Cre using the proteinand substrate concentrations as for the experimentsin Figure 5. To ®nd the combination of parametersk1, kÿ1, k2 and kÿ2 which best describes the DNAbinding behaviour of FLP and Cre, the computeroptimisation procedure described in Materials andMethods was used. Starting from a set of par-ameters which gave an approximate ®t, the fourparameters were varied simultaneously for eachprotein concentration individually to optimise the®t. The ®tted curves after optimisation of par-ameters are shown superimposed on the datapoints in Figure 5b and d. The parameters used togive each ®t are shown in Table 2.
Each set of rate constants shown in Table 2 cor-responds to a unique solution to equations (7) to(10), with the exception of the set for Cre at1.6 nM. (In this experiment (Figure 5d), there werenot enough data points to enable a unique solutionto be determined, and the simulated curves weregenerated using the parameters determined for0.8 nM Cre.) After the optimisation of parameters,a good ®t was obtained for all time course exper-iments for both proteins, showing that four par-ameters are suf®cient to describe the DNA bindingbehaviour of FLP and Cre. Additional parameters(for example, describing dimerisation of the proteinin solution) did not improve the ®t of the model tothe data (not shown). The four rate constants wereoptimised for each time course experiment separ-ately. Comparison of the optimised values for agiven protein at different concentrations showsthat the values are consistent with one another(Table 2). For example, each of kÿ1 and kÿ2 for FLPare almost identical for all four protein concen-trations. Small variations in k1 and k2 (up to2.4-fold) are seen, but the ratio of k1 to k2 is con-stant. The observed variation in the values of thefour parameters can be accounted for by theexpected variation between individual exper-iments. For Cre, the values of k2 and kÿ2 show two-fold or less variation at all protein concentrations.
ts for FLP and Cre binding to DNA
Rate constant (kn: Mÿ1 sÿ1 kÿn: sÿ1)kÿ1 k2 kÿ2
1.0 � 10ÿ1 4.3 � 106 1.3 � 10ÿ2
9.8 � 10ÿ2 2.9 � 106 1.2 � 10ÿ2
1.0 � 10ÿ1 3.3 � 106 1.3 � 10ÿ2
7.0 � 10ÿ2 2.3 � 106 1.0 � 10ÿ2
6.6 � 10ÿ2 1.3 � 108 4.8 � 10ÿ3
2.7 � 10ÿ1 1.6 � 108 1.0 � 10ÿ2
9.5 � 10ÿ2 2.3 � 108 9.3 � 10ÿ3
9.5 � 10ÿ2 2.3 � 108 9.3 � 10ÿ3
of curve ®tting for FLP and Cre at each protein input (see the
tained by the optimisation procedure as there were too few datarameters. The values given are those from the Cre experiment atFigure 5d. See the text for details.

372 Kinetics of FLP and Cre
The values of k1 and kÿ1 show slightly morevariation (3.8 and 2.8-fold, respectively). Again,these differences fall within the range expectedfrom individual experiments.
Comparison of the equilibrium constantsmeasured from mobility shift titrations (Table 1)with those calculated as the quotient of the associ-ation and dissociation rates shown in Table 2,shows good agreement between the two assays. Inall cases, the values of K1 and K2 calculated fromTable 2 fall within the same range as those givenin Table 1. For a given equilibrium constant, thedifference between the measured and calculatedvalues is fourfold or less, which is within the rangeexpected from experimental variation. Consistentwith the equilibrium analysis, comparison of thevalues for K1 and K2 calculated from Table 2 indi-cates a threefold higher cooperativity for Cre thanfor FLP.
We conclude that four parameters are suf®cientto describe the observed DNA binding behaviourof FLP and Cre, and that the results of kinetic anal-ysis are quantitatively consistent with those of theequilibrium analysis.
Comparison of DNA binding rate constants:mechanism of DNA binding
Comparison of the association rate constants forFLP and Cre given in Table 2 shows that both the®rst and the second Cre monomers bind their tar-get faster than FLP. The constant k1 in Table 2 isthe macroscopic association rate constant formonomer binding to site a or site b of the FRT orloxP target site, and is equal to k1a � k1b. If theintrinsic association rates for site a and site b areidentical, the microscopic rate constant for thebinding of the ®rst monomer to either side of thetarget site is given by k1/2.
Comparison of the association rates shown inTable 2 for the binding of the ®rst and second FLPmonomers (k1/2 and k2, respectively), suggests amechanism for the cooperative binding of thesecond monomer. Target site recognition by thesecond FLP monomer could be facilitated (or hin-dered) by the presence of a FLP monomer alreadybound. However, for FLP at all concentrations, theconstant k2 is very nearly equal to k1/2 (Table 2),indicating that the second FLP monomer binds itstarget site at the same rate as the ®rst. The coop-erativity of binding of the second FLP monomer is,therefore, mediated mainly by a slow dissociationrate once both monomers are bound. The dis-sociation rate constant kÿ2 is about tenfold smallerthan kÿ1 in all cases. This small value of kÿ2 maybe due to additional protein-protein interactionsand/or to increased DNA-protein contacts enabledby bending of the FRT site upon binding of thesecond monomer (Schwartz & Sadowski, 1990).
For Cre, comparison of the values for k1/2 andk2 shows that in most cases, k2 is larger than k1/2,suggesting that the binding of the second mono-mer may be facilitated by the presence of a mono-
mer already bound. The difference in theassociation rates of the ®rst and second Cre mono-mers is not suf®cient to account for the cooperativ-ity of binding. The Cre dimer complex has aslower dissociation rate than the monomer com-plex, showing that binding is stabilised by the pre-sence of both monomers, as is the case for FLP.
These results show that for both FLP and Cre,the cooperativity of binding is mainly mediated bya slow dimer dissociation rate. The fact that Crehas a higher DNA binding af®nity than FLP is dueto a faster association rate, and slower dissociationrate for both the ®rst and the second monomer.
The recombination reaction: furtherdifferences between FLP and Cre
To identify further differences between the prop-erties of FLP and Cre, we compared the twoenzymes in assays for recombination. In threedifferent types of experiments; protein titrations,recombination time courses and substrate titrationassays, FLP and Cre show striking differences.
The excision assay is shown in Figure 6a. FLPand Cre recombination substrates were made fromthe excision target plasmids pSVpaZ (FLP) andpSVpaX (Cre) (Buchholz et al., 1996). The plasmidsare identical except for the sequence of the invertedrepeat target sites. Recombination of the substrateresults in excision of the 1.1 kb between the twotargets. A 4 kb linear fragment of pSVpaZ orpSVpaX was used for in vitro recombination assays(Figure 6a). Recombination produced a linear pro-duct of 2.9 kb and a 1.1 kb circle. Only linear mol-ecules were detected (by direct end-labelling or bySouthern hybridisation). Thus, recombination wasquanti®ed on the basis of the ratio of the 4 to2.9 kb bands.
Titrations of FLP and Cre against a ®xed quan-tity of excision substrate were carried out underoptimum recombination conditions. For FLP withDNA concentrations of 0.2 nM and above, maxi-mum recombination was observed at a proteinmonomer to half site ratio of between 10:1 and 16:1(Figure 6b and d). This result is in good agreementwith previous determinations of the optimum ratiousing FLP puri®ed in the same way (Meyer-Leonet al., 1987; Gates & Cox, 1988). At DNA concen-trations below 0.2 nM, a greater excess of FLP pro-tein was necessary to achieve ef®cientrecombination (data not shown). For Cre underthese conditions, the optimum protein monomer tohalf site ratio was between 1.5:1 and 2:1 (Figure 6cand e). This is lower than the optimum ratio (6:1)reported by Abremski & Hoess (1984) for Cre puri-®ed by the same procedure. It is possible that thepresent preparation has a higher activity than thatdescribed by Abremski & Hoess (1984), or that thestabilising agents included in the buffer enhanceCre mediated recombination. In contrast to FLP,the ef®ciency of Cre mediated recombination wasnot adversely affected at DNA concentrationsbelow 0.2 nM (data not shown); however, in order

Figure 6. FLP and Cre recombi-nation. a, Recombination substratesand products. The substrate for theexcision assay is an end labelled4kb linear fragment of pSVpaZ(FLP) or pSVpaX (Cre). Invertedrepeats indicated by arrows whosedirection indicates the orientationof the non-palindromic spacer.Recombinase mediated excision ofthe DNA between the two invertedrepeat target sites gave a 2.9 kb lin-ear molecule and a 1.1 kb circle.Recombination was detected byvisualisation of linear substrate andproduct molecules. b and c, FLPand Cre protein titrations. Varyingamounts of FLP (a), or Cre (b), pro-teins were incubated with 0.4 nMof the appropriate excision sub-strate for 60 minutes at 30�C (FLP)or 37�C (Cre). The FLP and Creconcentrations used for both exper-iments (b and c) were as follows:lane 1, 0 nM; lane 2, 0.8 nM; lane 3,1.6 nM; lane 4, 3.2 nM; lane 5,6.4 nM; lane 6, 12.8 nM; lane 7,25.6 nM; lane 8, 51.2 nM. d and e,Quanti®cation of b and c. The per-centage excision was calculated foreach lane separately as (counts inrecombined band)/(sum of countsin unrecombined and recombinedbands) � 100. d, Filled circles, FLP;(e) ®lled triangles, Cre. f and g,Time course of FLP and Cre recom-bination. From protein titrationexperiments, the minimum proteinconcentration required for maxi-mum recombination of 0.4 nM exci-sion substrate was determined, anda time course of recombination wasperformed at this protein input.
25.6 nM FLP (f) or 2.4 nM Cre (g) was incubated with 0.4 nM of the appropriate excision substrate at the appropriatetemperature, and aliquots removed and terminated at 0, 3, 5, 10, 20 and 60 minutes. f, Open circles, FLP (% excision);g, open triangles, Cre (% excision).
Kinetics of FLP and Cre 373
to compare the two recombinases systematicallyunder the same conditions, the substrate concen-tration used in all experiments was 0.2 nM orabove. The effect of temperature on FLP and Crehas been characterised (Buchholz et al., 1996),showing that Cre recombines optimally in vitro at37�C, whereas the optimum temperature for FLP is30�C. Reactions were therefore incubated at 30�Cand 37�C for FLP and Cre, respectively.
Comparison of the maximum levels of recombi-nation reached by FLP and Cre (Figure 6d and e)shows a striking difference between the twoenzymes. FLP recombined 90% of the excision sub-strate in this experiment. (In other experiments,recombination approached 100%; see for example,Figure 6f.) For Cre on the other hand, the maxi-mum level of excision reached was 60%. In otherexperiments, this level varied between 50% and75%, more than 75% excision has not been
observed. This result is in agreement with themaximum level of Cre mediated excision reportedby Abremski & Hoess (1984). The maximum levelof Cre recombination was not increased by higherconcentrations of protein (Figure 6e).
From protein titration experiments, the optimumprotein monomer:substrate ratio was de®ned forFLP and Cre, and a time course of recombinationwas carried out at this ratio (Figure 6f and g). FLPreached maximum excision of 97% in 60 minutes.For Cre, the reaction reached a maximum of 55%in 60 minutes. The maximum level of Cre mediatedexcision was not increased by longer incubationtimes (data not shown). Under these conditions,the initial rate of recombination appeared faster forFLP than for Cre (60% and 30%, respectively, atthree minutes). However, earlier time points wouldbe necessary to accurately determine initial exci-sion rates.
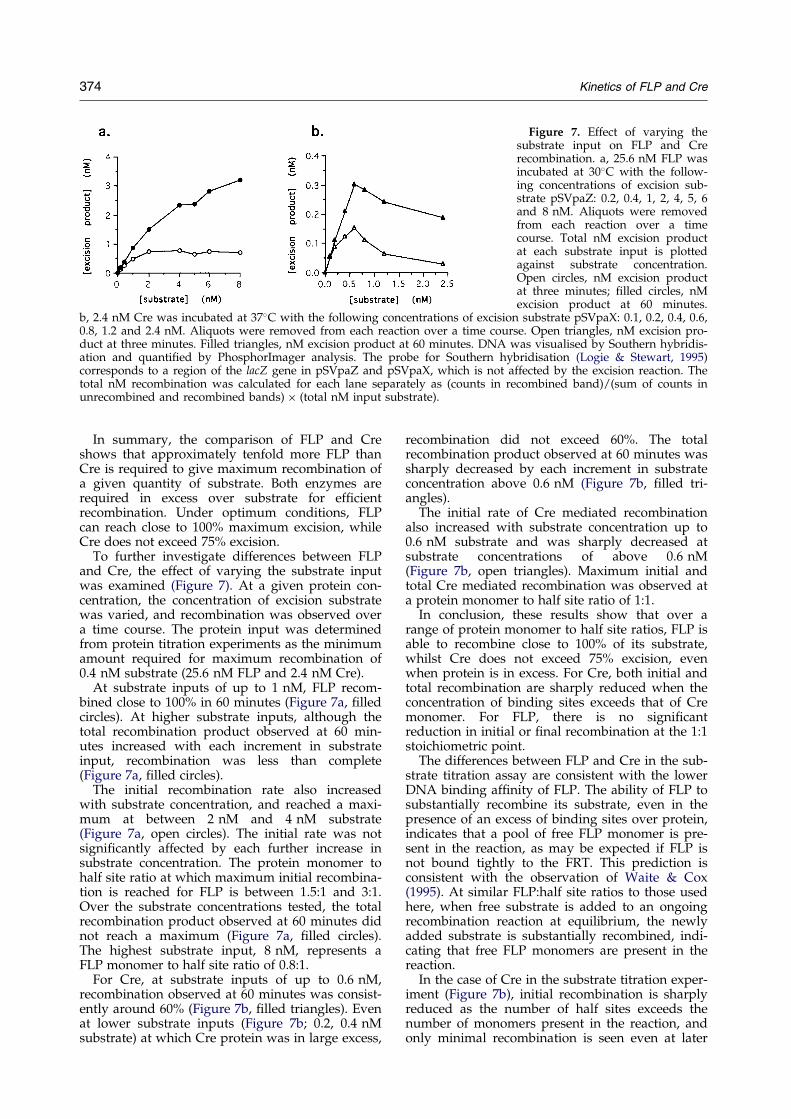
Figure 7. Effect of varying thesubstrate input on FLP and Crerecombination. a, 25.6 nM FLP wasincubated at 30�C with the follow-ing concentrations of excision sub-strate pSVpaZ: 0.2, 0.4, 1, 2, 4, 5, 6and 8 nM. Aliquots were removedfrom each reaction over a timecourse. Total nM excision productat each substrate input is plottedagainst substrate concentration.Open circles, nM excision productat three minutes; ®lled circles, nMexcision product at 60 minutes.
b, 2.4 nM Cre was incubated at 37�C with the following concentrations of excision substrate pSVpaX: 0.1, 0.2, 0.4, 0.6,0.8, 1.2 and 2.4 nM. Aliquots were removed from each reaction over a time course. Open triangles, nM excision pro-duct at three minutes. Filled triangles, nM excision product at 60 minutes. DNA was visualised by Southern hybridis-ation and quanti®ed by PhosphorImager analysis. The probe for Southern hybridisation (Logie & Stewart, 1995)corresponds to a region of the lacZ gene in pSVpaZ and pSVpaX, which is not affected by the excision reaction. Thetotal nM recombination was calculated for each lane separately as (counts in recombined band)/(sum of counts inunrecombined and recombined bands) � (total nM input substrate).
374 Kinetics of FLP and Cre
In summary, the comparison of FLP and Creshows that approximately tenfold more FLP thanCre is required to give maximum recombination ofa given quantity of substrate. Both enzymes arerequired in excess over substrate for ef®cientrecombination. Under optimum conditions, FLPcan reach close to 100% maximum excision, whileCre does not exceed 75% excision.
To further investigate differences between FLPand Cre, the effect of varying the substrate inputwas examined (Figure 7). At a given protein con-centration, the concentration of excision substratewas varied, and recombination was observed overa time course. The protein input was determinedfrom protein titration experiments as the minimumamount required for maximum recombination of0.4 nM substrate (25.6 nM FLP and 2.4 nM Cre).
At substrate inputs of up to 1 nM, FLP recom-bined close to 100% in 60 minutes (Figure 7a, ®lledcircles). At higher substrate inputs, although thetotal recombination product observed at 60 min-utes increased with each increment in substrateinput, recombination was less than complete(Figure 7a, ®lled circles).
The initial recombination rate also increasedwith substrate concentration, and reached a maxi-mum at between 2 nM and 4 nM substrate(Figure 7a, open circles). The initial rate was notsigni®cantly affected by each further increase insubstrate concentration. The protein monomer tohalf site ratio at which maximum initial recombina-tion is reached for FLP is between 1.5:1 and 3:1.Over the substrate concentrations tested, the totalrecombination product observed at 60 minutes didnot reach a maximum (Figure 7a, ®lled circles).The highest substrate input, 8 nM, represents aFLP monomer to half site ratio of 0.8:1.
For Cre, at substrate inputs of up to 0.6 nM,recombination observed at 60 minutes was consist-ently around 60% (Figure 7b, ®lled triangles). Evenat lower substrate inputs (Figure 7b; 0.2, 0.4 nMsubstrate) at which Cre protein was in large excess,
recombination did not exceed 60%. The totalrecombination product observed at 60 minutes wassharply decreased by each increment in substrateconcentration above 0.6 nM (Figure 7b, ®lled tri-angles).
The initial rate of Cre mediated recombinationalso increased with substrate concentration up to0.6 nM substrate and was sharply decreased atsubstrate concentrations of above 0.6 nM(Figure 7b, open triangles). Maximum initial andtotal Cre mediated recombination was observed ata protein monomer to half site ratio of 1:1.
In conclusion, these results show that over arange of protein monomer to half site ratios, FLP isable to recombine close to 100% of its substrate,whilst Cre does not exceed 75% excision, evenwhen protein is in excess. For Cre, both initial andtotal recombination are sharply reduced when theconcentration of binding sites exceeds that of Cremonomer. For FLP, there is no signi®cantreduction in initial or ®nal recombination at the 1:1stoichiometric point.
The differences between FLP and Cre in the sub-strate titration assay are consistent with the lowerDNA binding af®nity of FLP. The ability of FLP tosubstantially recombine its substrate, even in thepresence of an excess of binding sites over protein,indicates that a pool of free FLP monomer is pre-sent in the reaction, as may be expected if FLP isnot bound tightly to the FRT. This prediction isconsistent with the observation of Waite & Cox(1995). At similar FLP:half site ratios to those usedhere, when free substrate is added to an ongoingrecombination reaction at equilibrium, the newlyadded substrate is substantially recombined, indi-cating that free FLP monomers are present in thereaction.
In the case of Cre in the substrate titration exper-iment (Figure 7b), initial recombination is sharplyreduced as the number of half sites exceeds thenumber of monomers present in the reaction, andonly minimal recombination is seen even at later

Kinetics of FLP and Cre 375
time points. This suggests that the supply of freemonomer is exhausted by an excess of bindingsites, and that because of the high af®nity of Crefor the loxP site monomers are not freed in suf®-cient quantities to give high levels of recombina-tion at later time points. This reasoning isconsistent with the observation that the point ofCre saturation can be shifted to a higher substrateconcentration by increasing the Cre protein input.The Cre monomer to half site ratio at which theinitial and ®nal levels of recombination are satu-rated is consistently around 1:1 (data not shown).We expect that the high cooperativity of Cre bind-ing contributes to the sharp descent of the curvesin Figure 7b.
It is also possible that the difference in the beha-viour of FLP and Cre in the substrate titrationassay is caused by a difference in the non-speci®cDNA binding af®nities of FLP and Cre. Forinstance, if Cre has a higher non-speci®c af®nityfor DNA than FLP, then by increasing the totalamount of DNA in a reaction, the amount of freeCre monomer would be effectively reduced, andrecombination would be inhibited. This possibilitywas addressed by repeating the experiment withthe inclusion of carrier DNA such that the totalDNA concentration was equal in all experiments,with similar results to those shown in Figure 7(data not shown). Thus, the differences observedbetween FLP and Cre in this assay cannot beaccounted for by non-speci®c DNA binding effects.
Although the high af®nity of Cre for the loxP sitemay be suf®cient to explain its substrate saturationbehaviour, this cannot account for its ability torecombine only 50 to 75% of its substrate. In con-ditions of excess protein, all binding sites would beoccupied by protein, and a single turnover wouldbe suf®cient for all substrates to be recombined.Although the reaction is reversible, the re-inte-gration of excised circle into a linear excision pro-duct is kinetically less favourable than excisionbecause it is a bimolecular reaction. Thus, excisionproducts should accumulate and the maximumrecombination should approach 100% in conditionsof excess protein, as is the case for FLP (Figure 6band d). However, in a given experiment, weobserved no increase in the maximum levels of Cremediated excision upon increasing the protein con-centration (Figure 6c and e).
A further possible factor which could contributeto the apparent limitation in Cre recombinationcould be protein aggregation. Higher-order com-plexes of Cre on DNA have been observed at highprotein concentrations in electron micgrographs(F.B., unpublished observation) and in bandshiftassays (L.R., unpublished observation). Such aggre-gates may inhibit recombination by binding morethan two monomers per inverted repeat, thus pre-venting the formation of a productive synapse.However, we disfavour this explanation for the fol-lowing reasons. Firstly, protein aggregation wouldbe concentration dependent, and thus its effects onrecombination should depend on protein concen-
tration. At high protein concentrations, recombina-tion would be reduced to a greater extent than atlow concentrations. However, we observe noreduction in the maximum recombination levelsreached by Cre at high protein concentrations(Figure 6c and e). Secondly, under dilute con-ditions in which protein aggregation is reduced,but in which Cre protein is still present in excessover binding sites, then an increase in total recom-bination would be expected. However, no increaseabove the maximum of 75% has been observedunder such conditions (Figure 7b, and data notshown).
We thus conclude that because the maximumrecombination reached by Cre is independent ofprotein concentration, it is subject to ®rst-order kin-etic processes. Figure 1 shows that the steps in thereaction pathway which are independent of proteinconcentration are synapsis, recombination, and thedissociation of the synaptic complex. We reasonthat one or more of these steps is responsible forlimiting Cre recombination to between 50 and 75%.In order to determine whether these parametersare indeed suf®cient to describe the differentrecombination behaviours of FLP and Cre, a math-ematical model was constructed based on the path-way of Figure 1. No parameters describing non-speci®c binding, or protein aggregation wereincluded in the model.
Estimation of the fraction of active protein inpurified preparations of FLP and Cre
The substrate titration assay also enables theconcentration of active protein to be estimated,which is crucial to the comparative kinetic analysisof this work. For Cre, the issue of protein activitywas addressed by quanti®cation of the gel mobilityshift titration experiments (Figure 3e). Under con-ditions in which the concentration of Cre proteinwas low relative to the concentration of substrate,calculation based on PhosphorImager analysis ofthe total monomer bound showed that 100% of themonomer was bound to DNA as dimer or mono-mer complexes. This result suggests that the Creprotein preparation is close to 100% active in DNAbinding. The same calculation for FLP (Figure 3a)showed that the highest proportion of FLP mono-mer bound at any one time was 10%. The questionarises of whether this result re¯ects a difference inDNA binding af®nity, or a difference in the activi-ties of the FLP and Cre protein preparations.
The maximum initial rate of recombinationobserved in the substrate titration assay gives anestimate of the activities of the FLP and Cre prep-arations. For 25.6 nM FLP, the maximum initialrate of recombination observed was 0.75 nM exci-sion product in three minutes (Figure 7a, open cir-cles). For 2.4 nM Cre the maximum initial rate ofrecombination observed was 0.165 nM excisionproduct in three minutes (Figure 7b, open tri-angles). This corresponds to an initial excision rateof 0.01/minute for FLP, and 0.023/minute for Cre.
376 Kinetics of FLP and Cre
If the characteristics of the two proteins were iden-tical, and given that the Cre preparation is 100%active, then this result would indicate that 44% ofthe FLP preparation is active.
However, the properties of the two proteins arenot identical. We already show that FLP has anapproximately 100-fold lower speci®c DNA bind-ing af®nity than Cre (Table 1). Therefore, we con-clude that 44% gives a lower limit to the fraction ofactive protein in the FLP preparation, and is prob-ably an underestimate of the true activity of theFLP preparation.
Mathematical simulation of FLP and Crerecombination: determination ofunknown parameters
FLP and Cre showed signi®cant differences inthe recombination experiments presented above. Inorder to determine the parameters responsible fortheir different behaviours, a mathematical modelsimulating the full excision reaction was estab-lished.
The model was constructed on the basis ofdifferential equations (11) to (24) (Materials andMethods), to describe the reaction pathway shownin Figure 1. The DNA binding constants measuredfor FLP and Cre (Table 2) were used in the model.These rates may not accurately re¯ect the true rateof binding to full recombination substrates. Thepresence of carrier DNA in the binding reactionsmay slow down the association rate due to weaknon-speci®c protein DNA interactions. In addition,the fact that in the full recombination substratesthe speci®c sites are embedded in long pieces ofDNA, may mean that binding is even faster due to1D diffusion. Thus, the binding rates measured inthe bandshift assay may be underestimated. How-ever, since the conditions used for FLP and Cre inboth binding and recombination assays were iden-tical, and since the binding constants were sodifferent for the two enzymes, we reasoned thatthe measured binding constants could be used as avalid starting point in the model for recombina-tion.
The remaining unknown parameters k34, kÿ34, k5
and kÿ5 (see Figure 1) were varied to ®t simulatedcurves to experimental data. Upon ®tting simu-lated curves to the substrate titration data ofFigure 7, we found that although unique values ofk34 and kÿ34 could be determined, a range of k5 and
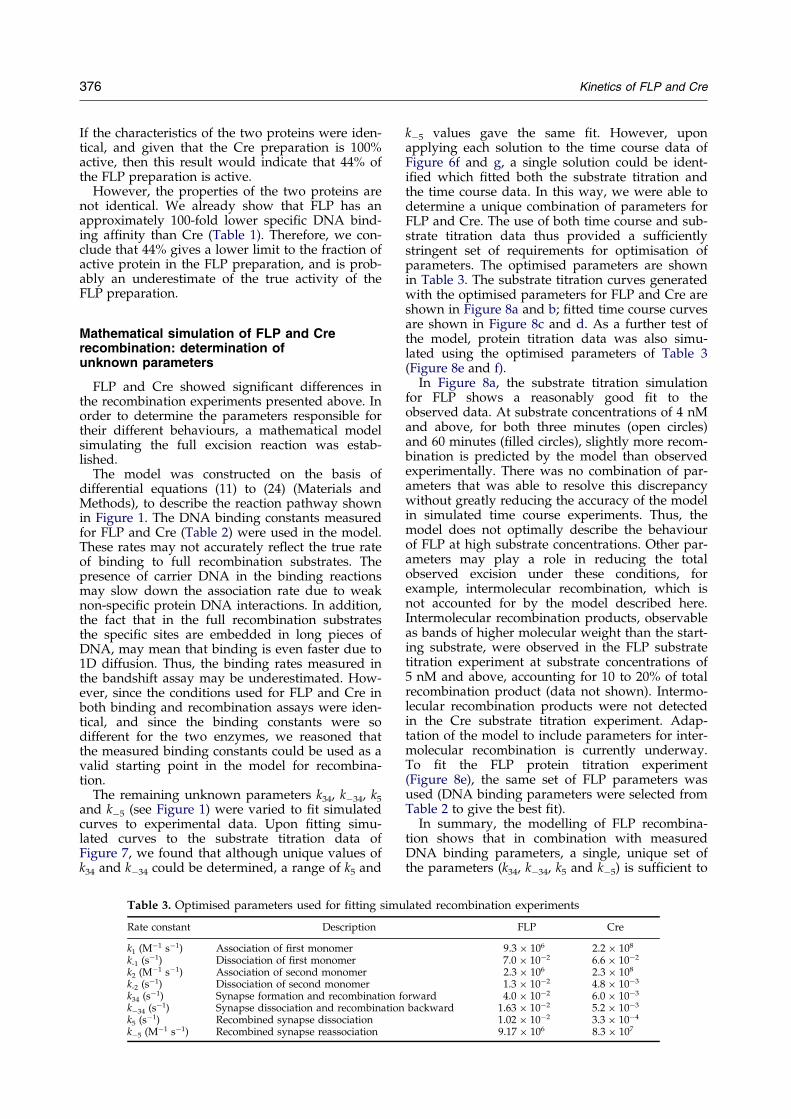
Table 3. Optimised parameters used for ®tting sim
Rate constant Description
k1 (Mÿ1 sÿ1) Association of first monomerk-1 (sÿ1) Dissociation of first monomerk2 (Mÿ1 sÿ1) Association of second monomerk-2 (sÿ1) Dissociation of second monomerk34 (sÿ1) Synapse formation and recombinationkÿ34 (sÿ1) Synapse dissociation and recombinatiok5 (sÿ1) Recombined synapse dissociationkÿ5 (Mÿ1 sÿ1) Recombined synapse reassociation
kÿ5 values gave the same ®t. However, uponapplying each solution to the time course data ofFigure 6f and g, a single solution could be ident-i®ed which ®tted both the substrate titration andthe time course data. In this way, we were able todetermine a unique combination of parameters forFLP and Cre. The use of both time course and sub-strate titration data thus provided a suf®cientlystringent set of requirements for optimisation ofparameters. The optimised parameters are shownin Table 3. The substrate titration curves generatedwith the optimised parameters for FLP and Cre areshown in Figure 8a and b; ®tted time course curvesare shown in Figure 8c and d. As a further test ofthe model, protein titration data was also simu-lated using the optimised parameters of Table 3(Figure 8e and f).
In Figure 8a, the substrate titration simulationfor FLP shows a reasonably good ®t to theobserved data. At substrate concentrations of 4 nMand above, for both three minutes (open circles)and 60 minutes (®lled circles), slightly more recom-bination is predicted by the model than observedexperimentally. There was no combination of par-ameters that was able to resolve this discrepancywithout greatly reducing the accuracy of the modelin simulated time course experiments. Thus, themodel does not optimally describe the behaviourof FLP at high substrate concentrations. Other par-ameters may play a role in reducing the totalobserved excision under these conditions, forexample, intermolecular recombination, which isnot accounted for by the model described here.Intermolecular recombination products, observableas bands of higher molecular weight than the start-ing substrate, were observed in the FLP substratetitration experiment at substrate concentrations of5 nM and above, accounting for 10 to 20% of totalrecombination product (data not shown). Intermo-lecular recombination products were not detectedin the Cre substrate titration experiment. Adap-tation of the model to include parameters for inter-molecular recombination is currently underway.To ®t the FLP protein titration experiment(Figure 8e), the same set of FLP parameters wasused (DNA binding parameters were selected fromTable 2 to give the best ®t).
In summary, the modelling of FLP recombina-tion shows that in combination with measuredDNA binding parameters, a single, unique set ofthe parameters (k34, kÿ34, k5 and kÿ5) is suf®cient to
ulated recombination experiments
FLP Cre
9.3 � 106 2.2 � 108
7.0 � 10ÿ2 6.6 � 10ÿ2
2.3 � 106 2.3 � 108
1.3 � 10ÿ2 4.8 � 10ÿ3
forward 4.0 � 10ÿ2 6.0 � 10ÿ3
n backward 1.63 � 10ÿ2 5.2 � 10ÿ3
1.02 � 10ÿ2 3.3 � 10ÿ4
9.17 � 106 8.3 � 107

Figure 8. Simulation of FLP andCre recombination. a and b, Sub-strate titration. Substrate titrationcurves were simulated as describedin Materials and Methods. Theinput values for protein and sub-strate were as in Figure 7a and b.Using appropriate input values forthe DNA binding and dissociationrate constants k1, kÿ1, k2 and kÿ2
taken from Table 2, simulatedcurves for total nM excision pro-duct at three minutes and 60 min-utes were ®tted to the experimentaldata in Figure 7a and b for FLPand Cre by simultaneous optimis-ation of the rate constants k34, kÿ34,k5 and kÿ5. The optimised valuesfor the four parameters are shownin Table 3. a, FLP substratetitration, continuous lines, simu-lated recombination at three and60 minutes; 25.6 nM FLP, 0.05 to10 nM substrate. Open circles,recombination observed at threeminutes (Figure 7a). Filled circles,recombination observed at 60 min-utes (Figure 7a). b, Cre substratetitration, continuous lines, simu-lated recombination at three and60 minutes; 2.4 nM Cre; 0.01 to2.5 nM substrate. Open triangles,recombination observed at threeminutes (Figure 7b). Filled tri-angles, recombination observed at60 minutes (Figure 7b). c and d,Time course. The optimised par-ameters of Table 3 were used tosimulate time course curves forFLP and Cre. c, FLP, continuousline, simulated recombination timecourse at 25.6 nM FLP, 0.4 nM sub-strate; ®lled circles, data from time
course experiment at 25.6 nM FLP, 0.4 nM substrate. d, Cre, continuous line, simulated recombination time course at2.4 nM Cre, 0.4 nM substrate; ®lled triangles, data from time course experiment at 2.4 nM Cre, 0.4 nM substrate.e and f, Protein titration. Recombination time course curves were simulated for FLP and Cre at various proteininputs, with 0.4 nM substrate input. The simulated recombination after 60 minutes is plotted against protein concen-tration. e, FLP, Continuous line, simulated recombination parameters as in Table 3 except k1 � 3.9 � 106 Mÿ1 sÿ1, andkÿ1 � 1.0 � 10ÿ1 sÿ1; open circles, data points from protein titration experiment (Figure 6d). f, Cre, continuous line,simulated recombination. (all parameters as in Table 3); open triangles, data points from protein titration experiment(Figure 6e).
Kinetics of FLP and Cre 377
describe reasonably accurately the behaviour ofFLP in the substrate titration, time course, and pro-tein titration experiments. In addition, this analysissuggests that the inclusion of parameters describ-ing intermolecular recombination may be necessaryfor further improvement of the ®t.
The simulated substrate titration experiment forCre (Figure 8b) shows a good ®t to the observeddata at both three minutes (open triangles) and 60minutes (®lled triangles). The optimised values ofk34, kÿ34, k5 and kÿ5 (Table 3) represent a uniquesolution for the ®ts shown. The same set of par-ameters was used to simulate time course(Figure 8d) and protein titration experiments
(Figure 8f), giving a good ®t to the observed datain both cases. Thus, for Cre, the recombinationpathway of the model is suf®cient to accuratelydescribe the observed data from substrate titration,time course and protein titration assays.
Table 3 shows the values of the parameters k34,kÿ34, k5 and kÿ5 determined from the modellingexperiments. The parameter k34 is complex, corre-sponding to the apparent ®rst-order rate constantfor the combined processes of synapsis and recom-bination. kÿ34 is the apparent rate constant for thereverse process. The values determined for both k34
and kÿ34 are larger for FLP than for Cre (Table 3).
However, further dissection of the apparent con-
378 Kinetics of FLP and Cre
stants into their separate components of synapsisand recombination is not possible on the basis ofthe present data.
The constant k5, corresponding to the dis-sociation of the recombined synapse, is approxi-mately 30-fold larger for FLP than for Cre,indicating that in the model, the FLP synapsedissociates faster than the Cre synapse after recom-bination. The constant kÿ5, describing the reassoci-ation of protein bound recombination productsinto the synaptic complex, is approximately tenfoldlarger for Cre than for FLP. Thus, the model pre-dicts a higher stability of the recombined synapticcomplex for Cre than for FLP, comprising both aslower dissociation and a faster reassociation rate.The higher stability of the synapse is the mostimportant parameter in the model for determiningthe maximum recombination level reached by Cre.In the simulation we examined individual reactionintermediates, and observed that for Cre, a largeproportion of the excision products remain in thesynaptic complex throughout the reaction and arethus re-integrated, giving the characteristic 50 to75% excision. In the FLP simulation, products arerapidly freed from the synapse and re-integrationdoes not occur ef®ciently, thus driving the reactionto close to 100% excision (data not shown).
In summary, the mathematical model indicatesthat for Cre, the 50 to 75% maximum level of exci-sion re¯ects an equilibrium between excision andintegration, which is due to the high stability ofthe synaptic complex.
We used the model to examine the hypothesis,proposed above, that the experimentally observedsubstrate saturation behaviour of FLP and Cre isdictated by the availability of free monomer. Timecourse curves were simulated for FLP and Cre atoptimal and suboptimal substrate concentrations,enabling prediction of the concentration of free pro-tein monomer over the course of the reaction (datanot shown). In this simulation for Cre, at 0.6 nMsubstrate (concentration at which maximum levelsof initial and ®nal recombination were observedexperimentally) less than 5% of the input protein isfree throughout the reaction. In contrast, for FLP,the simulation showed that at 4 nM substrate (con-centration at at which initial recombination is opti-mal), approximately 30% of the input protein is freethroughout the reaction. At higher substrate inputs,the simulated free protein concentration is reducedmore rapidly for Cre than for FLP. This analysissupports the hypothesis that the main reason forthe rapid substrate saturation observed with Cre isan exhaustion of the supply of free monomer.
Discussion
We have carried out a comparative kinetic anal-ysis of FLP and Cre. Using data from DNA bind-ing and recombination assays, mathematicalmodels describing both DNA binding and the fullrecombination reaction were established. The DNA
binding model enabled the rate constants govern-ing DNA binding to be accurately determined.Using the full recombination model, we deter-mined values for the parameters governing latersteps in the recombination pathway.
Effects of DNA binding affinity andcooperativity on DNA binding andrecombination behaviour
We measured equilibrium binding constants forFLP and Cre, demonstrating that for this set ofexperimental conditions, Cre binds its target sitemore strongly and with approximately threefoldhigher cooperativity than FLP. Kinetic analysisshowed that the fact that Cre has a higher DNAbinding af®nity than FLP is due to a faster associ-ation rate, and a slower dissociation rate for boththe ®rst and the second monomer (Figure 1, step1). For both FLP and Cre, the cooperativity of bind-ing is mainly mediated by a slow dimer dis-sociation rate.
In recombination assays, we showed thatapproximately tenfold more FLP than Cre isrequired to give maximum recombination of agiven quantity of substrate. Both enzymes arerequired in excess over substrate for ef®cientrecombination. Substrate titration assays showedthat for Cre, both initial and total recombinationare sharply reduced when the concentration ofbinding sites exceeds that of Cre monomer. ForFLP, there is no signi®cant reduction in initial or®nal recombination at the 1:1 stoichiometric point.
Both the requirement for tenfold more FLP thanCre, and the substrate saturation behaviour of thetwo enzymes, may be explained by their differ-ences in DNA binding af®nity and cooperativity.In an excision substrate, all four half sites must beoccupied simultaneously for long enough forsynapsis to take place (Figure 1, step 2). Thus, it isnot surprising that both enzymes are required inexcess over substrate, since the reaction is not ofthe ``one enzyme, one substrate'' class. The simul-taneous occupancy of all four half sites will occurmore readily for Cre than for FLP, since it hashigher af®nity and more cooperative binding.A higher concentration of free FLP monomers willincrease the probability of encounters between FLPand the FRT. Thus, more FLP is required than Crefor a given number of recombination events.
In addition, we conclude from mathematicalsimulation experiments that the high af®nity ofCre for the loxP site leads to an exhaustion of thesupply of free monomer in the substrate saturationassay, and is thus the main reason for the inhi-bition of recombination observed under conditionsof excess binding sites.
Effects of synaptic stability onrecombination behaviour
Comparison of the recombination kinetics of FLPand Cre in vitro shows that for this set of exper-

Kinetics of FLP and Cre 379
imental conditions, FLP can recombine close to100% of its target, whilst Cre does not exceed 75%.This behaviour is reproducible over a range of pro-tein:substrate ratios in each case (see for example,Figure 6b and c). A mathematical model for recom-bination was used to investigate possible reasonsfor this difference. For both FLP and Cre the modelwas ®tted to the observed data from substratetitration, time course and protein titration assays,enabling a unique set of the four unknown par-ameters (k34, kÿ34, k5 and kÿ5 ; see Figure 1) to bedetermined for each enzyme.
The model showed that the stability of thesynaptic complex is the most important parametergoverning the maximum level of excision. The par-ameters k5 and kÿ5, which describe the dissociationand reassociation of the recombined synapse(Figure 1, step 4), predict a higher synaptic stabilityfor Cre than for FLP. Simulations showed that forCre, the 50 to 75% maximum level of excisionre¯ects an equilibrium between excision and inte-gration which is due to the high stability of thesynaptic complex. The predicted high synapticstability of Cre is consistent with crystallographicdata (Guo et al., 1997), which shows that extensiveprotein-protein contacts are made between mono-mers in the Cre synapse.
A theoretical value for the equilibrium constantK5, describing the stability of the excised synapse,is given by the relationship kÿ5/k5. The predictedK5 values for FLP and Cre are 9.7 � 108 Mÿ1 and2.5 � 1011 Mÿ1, respectively.) Conversion of thetheoretical K5 values to kcal/mol for FLP and Creat their respective incubation temperatures gives12.59 and 16.38 kcal/mol for FLP and Cre, respect-ively, a difference in free energy of 3.79 kcal/mol.The effect of this theoretical difference in stabilityof the FLP and Cre synaptic complexes was exam-ined using the mathematical model. Simulation ofsynaptic survival during the time course of recom-bination predicts that for FLP, this species is shortlived, decaying to zero after 30 minutes, while forCre the excised synaptic complex is predicted toremain present throughout the reaction (data notshown).
The model thus offers a concrete set of quantitat-ive predictions which could be experimentallytested if an assay for synapsis suitable for kineticanalysis were available. It is possible to trap anintermediate that has the properties of a FLPsynaptosome using the protein cross-linking agent,glutaraldehyde (Amin et al., 1990, 1991). It is poss-ible that such an assay could be adapted for quan-titative kinetic analysis to test the predicteddifferences in the stability of the synaptic complexfor FLP and Cre.
Implications for the applied use of site-specificrecombinases in vivo
Site-speci®c recombinases are increasinglyimportant as tools for the manipulation of DNA inliving systems. Currently, the most widely used
recombinases are FLP and Cre, but other integraseclass recombinases with distinct target site speci®-cities have also been shown to function in heter-ologous systems (Onouchi et al., 1991; Ringroseet al., 1997). The range of applications possible willbe increased by the availability of both wild-typeand mutant recombinases with different properties.
The mathematical model presented here offers ageneral description of integrase class site-speci®cexcisive recombination. If the parameters used tomodel FLP and Cre recombination are validatedby experimental testing, then the model can furtherbe used to evaluate differences between the prop-erties of site-speci®c recombinases of this classwhich follow the same reaction pathway. Forexample, if the maximum level of recombinationreached at equilibrium is indeed dictated by synap-tic stability, then a simple recombination assaymay give an indication of this parameter for othermembers of this class. In the same way, the modelcould be used to predict the effect of mutationswhich change a given parameter, for example, therate of synapsis or the DNA binding af®nity. Thus,the model may be a powerful tool in the search formutant recombinases with altered properties.
The kinetic analysis presented here shows thatFLP and Cre have fundamentally different proper-ties, many of which will be important for theiroptimal use in genomic manipulation strategies.The difference in DNA binding af®nities measuredfor FLP and Cre is suf®cient to account for the factthat more FLP is required than Cre for a givenamount of recombination in vitro, since all four halfsites must be occupied simultaneously until synap-sis occurs. This ®nding has implications for thedesign of in vivo experiments, where a single pairof targets is present in the genome. Firstly, for FLPthe expression of high levels of recombinase maybe necessary in applications where ef®ciency isrequired. Secondly, in applications where recombi-nase repression is required, lower backgroundlevels of Cre than of FLP may be suf®cient to pro-duce an unwanted recombination event.
The measured differences in speci®c DNA bind-ing af®nities for FLP and Cre, in combination withthe predicted differences in synaptic stability, havefurther implications for their applied use in vivo.For example, these parameters might affect the ef®-ciency of site-speci®c integration, an applicationwhich is particularly interesting for the purposes ofgene targeting in organisms such as plants and¯ies, where homologous recombination is noteasily achieved. Site-speci®c integration is inef®-cient, because the initial integration event itself israre and because the integrated DNA is ef®cientlyre-excised. For a recombinase with higher speci®cDNA binding af®nity and a faster rate of synapsis,the initial site-speci®c integration event may beexpected to occur more ef®ciently. However, thehigher the DNA binding af®nity, and the morestable the synaptic complex, the higher the prob-ability that the integrated DNA will be re-excised.This reasoning suggests that there may be an ideal

380 Kinetics of FLP and Cre
combination of DNA af®nity and synaptic stabilityfor the purposes of site-speci®c integration, whichrepresents the best compromise between inte-gration ef®ciency and excision inef®ciency. Thisideal compromise of characteristics may not bepossessed either by FLP or by Cre, but may bereached through target site and protein design,enabling the optimisation of speci®c parameters forDNA binding af®nity and synaptic stability.
Materials and Methods
Protein preparations
The FLP and Cre preparations used in this study are>95% pure as judged by SDS-PAGE. Cre protein waspuri®ed as described (Abremski & Hoess, 1984), and thetotal protein concentration was determined using theBioRad kit. FLP protein was a generous gift fromMichael Cox, and was puri®ed as described (Meyer Leonet al., 1987). FLP concentrations were determined byextinction coef®cient as described (Waite & Cox, 1995).
DNA preparations
Substrates for the DNA binding assays were preparedfrom plasmids pBKSFRT, pBKSFRTM, pBKSloxP andpBKSloxM, which were made by ligating annealed pairsof synthetic oligonucleotides with the followingsequences into pBluescript KS� (Stratagene) cut withHindIII and BamHI.
pBKSFRT
GATCCCGGAAACGCTTTCGAAGTTCCTATTCTCT-AGAAAGTATAGGAACTTCGATCGA annealed toAGCTTCGATCGAAGTTCCTATACTTTCTAGA-GAATAGGAACTTCGAAAGCGTTTCCGG.
pBKSFRTM
GATCCCGGAAACGCTTTCGAGAGGTTTATTCTCT-AGAAAGTATAGGAACTTCGATCGA annealed toAGCTTCGATCGAAGTTCCTATACTTTCTAGAG-AATAAACCTCTCGAAAGCGTTTCCGG.
pBKSloxP
GATCCCGGAAAGTACTATAACTTCGTATAATGT-ATGCTATACGAAGTTATCGATCGA annealed toAGCTTCGATCGATAACTTCGTATAGCATACATTA-TACGAAGTTATAGTACTTTCCGG.
pBKSloxM
GATCCCGGAAAGTACTATAACTTCGTATAATGT-ATGCCACACGAGCTTATCGATCGA annealed toAGCTTCGATCGATAAGCTCGTGTGGCATACATTAT-ACGAAGTTATAGTACTTTCCGG.
All substrates for the gel mobility shift assay were pre-pared by digesting the appropriate plasmid with XhoIand SpeI, and labelled by end-®lling using Klenow poly-merase with the incorporation of [a-32P]dCTP. Substrateswere subsequently gel puri®ed on a 7% (w/v) polyacryl-amide gel, and ®nal DNA concentrations were deter-mined. A known molar quantity of DNA was labelledusing a known molar quantity of radioactive nucleotide.
Thus, the total percentage of nucleotide incorporatedinto labelled DNA (determined by thin layer chromatog-raphy) was used to calculate the percentage of labelledDNA (typically 100% of DNA was labelled). Afterrecovery of labelled DNA from the polyacrylamide gel,Cerenkov radiation was determined by scintillationcounting. The molar concentration of radioactive nucleo-tide was calculated using the following equation:1 pmol � 1.998 � 107 cpm. Thus, after correction forradioactive decay and number of radioactive nucleotidesper molecule of DNA, the molar concentration of DNAcould be calculated.
Excision substrates for the recombination assaysshown in Figure 6, consisting of a 4kb Bsu36I/NotI frag-ment of plasmids pSVpaZ (FRT targets) or pSVpaX (loxPtargets) (Buchholz et al., 1996), were radioactivelylabelled by end ®lling and quanti®ed essentially as forthe bandshift substrates. For the time course and sub-strate titration experiments shown in Figure 7, unlabelledBsu36I/NotI digested substrates were used, and recombi-nation was detected by Southern hybridisation.
Mobility shift assay
DNA protein complexes were electrophoresed on 5%(w/v) polyacrylamide gels in 1 � TBE buffer TBE7 � (90 mM Tris-HCl (pH 8.3), 90 mM boric acid, 1 mMEDTA) at 250V at 4�C. Gels were pre-run for one hourprior to loading of samples. DNA binding reactions wereincubated at 30�C (FLP) or 37�C (Cre) in 25 mM Taps (N-[Tris-(hydroxymethyl)-methyl]-3-aminopropanesulfonicacid; pH 8.0), 1 mM EDTA, 180 mM NaCl, 2 mM MgCl2,0.1 mg mlÿ1 acetylated BSA, 2% (v/v) glycerol and 2.5 ngmlÿ1 sonicated salmon sperm DNA. Reactions werestarted by the addition of protein. Proteins were dilutedprior to their addition to the reaction mix in 20% glycerol,25 mM Taps (pH 8.0), 1 mM EDTA, 1 M NaCl. The reac-tion mix buffer was adjusted so that the ®nal concen-trations of NaCl and glycerol were as given above. Forequilibrium titrations the DNA protein mixtures wereincubated for ten minutes at the appropriate temperature.For time course experiments, the binding reaction wasstarted by addition of protein, and samples were loadedat time intervals as indicated in the Figure legends. Toensure constant resident time in the well for each sample,and to ensure that complexes migrated as compact bands,samples were allowed ®ve seconds to sink into the wellbefore the gel was turned on. DNA-protein complexeswere visualised by autoradiography and quanti®ed byPhosphorImager analysis. The variation in experimentaldata was evaluated by repeating each experiment severaltimes. Comparison of time course experiments in whichsamples were taken separately but were mixed from thesame protein dilution and buffer preparations, and wereloaded on the same gel, showed variations of 5 to 10%.Comparison of protein titration experiments showed vari-ations of up to 10%. Comparison of experiments in whichdifferent protein dilutions, buffer mixtures or substratepreparations were used showed variations of 10 to 20%.
Recombination assay
Recombination reactions were typically carried outusing 0.2 nM substrate DNA in a 20 ml volume contain-ing 25 mM Taps (pH 8.0), 180 mM NaCl, 2 mM MgCl2,1 mM EDTA, 20% (v/v) glycerol, 10% (v/v) PEG8000and 2.5 mg/ml BSA. Reactions were incubated at 30�C(FLP) or 37�C (Cre) for 60 minutes. Reactions were termi-

Kinetics of FLP and Cre 381
nated by the addition of SDS to 0.05%, EDTA to 10 mMand proteinase K to 0.5 mg/ml followed by incubationat 37�C for one to 16 hours. The samples were then phe-nol/chloroform extracted and the aqueous phase wasloaded onto a 0.6% (w/v) agarose gel. For directlylabelled substrates, gels were dried and autoradio-graphed. Unlabelled substrates were detected bySouthern hybridisation. In both cases recombination wasquanti®ed by PhosphorImager analysis.
Determination of equilibrium constants
In the DNA mobility shift assay it is possible to dis-tinguish between DNA molecules with an exact number(n) of monomers bound. The observable con®gurationsfor the inverted repeat targets FRT or loxP (Figure 2),composed of two linked binding sites (half sites a and b),each of which can be bound by a recombinase monomer,are as follows:
S � free substrate �n � 0�SM � substrate with one monomer bound �n � 1�SM2 � substrate with two monomers bound �n � 2�:
The binding con®gurations and their correspondingequilibrium association constants are shown in Figure 1.
Using the mobility shift assay with an inverted repeatsubstrate it is not possible to distinguish between thespecies SMa and SMb. The observed species SM, is equalto SMa � SMb, and has the corresponding equilibriumconstant K1, where:
K1 � �K1a � K1b� �1�In Figure 1 the equilibrium constant K2 describes thebinding of a second monomer to either species SMa orSMb. Thus, in a system in which the intrinsic af®nitiesfor half sites a and b are not identical, the constant K2
will either be equal to K2a or to K2b, depending on whichsite is occupied ®rst. For the purposes of the determi-nation of DNA association equilibrium constants, theassumption was made that the intrinsic af®nities for sitesa and b are identical, thus K1a � K1b � K1/2; andK2a � K2b � K2.
The fraction, Y, of DNA molecules in each con®gurationwas calculated as: Y � (S*)/(� S*), where S* is the Phos-phorImager counts in the band of interest, and � S* is thesum of PhosphorImager counts in all bands in the lane. Inexperiments where bound DNA molecules are expressedas nM concentrations, this value is calculated as:
nM bound � Y�nM input DNA�:
In the inverted repeat target system, the bindingequations describing the fraction of total DNA in each ofthe con®gurations S, SM, and SM2 are given by:
S � 1
1� K1�M� � K1K2�M�2�2a�
SM � K1�M�1� K1�M� � K1K2�M�2
�2b�
SM2 � K1K2�M�21� K1�M� � K1K2�M�2
�2c�
(Senear & Brenowitz, 1991). S, SM and SM2 are the frac-tions of total DNA in each of the con®gurations; [M] is
the concentration of free protein monomer. Titrations ofFLP and Cre were performed against a ®xed amount offull site DNA substrate, and the fraction of DNA in eachspecies was plotted against the concentration of freemonomer. The equations (2a to c) were then simul-taneously ®tted to the data using a least-squares ®ttingprocedure to obtain values for K1 and K2.
To determine the individual constants K1a and K1b, themutated target sites of FRTM and loxM, in which onlyone half site can be bound by recombinase monomerwere used. The possible con®gurations in this system areS, and SMa. The equation for binding to a single site isgiven by the Langmuir isotherm (Brenowitz et al., 1986):
SMa � K1a�M�1� K1a�M� �3�
Where SMa is the fraction of total DNA bound, and [M]is the molar concentration of free monomer. Titrations ofFLP and Cre were performed against a ®xed amount ofFRTM or loxM DNA substrate, and the fraction of DNAin SMa was plotted against the concentration of freemonomer. Equation (3) was ®tted to the data using theKaleidagraph program (Albeck software) for the AppleMacintosh computer, to obtain the value of K1a. Thevalue of K1b is then given by equation (1).
In all cases except Cre binding to loxP inverted repeatsite, the assumption was made that [M]total � [M]free,because the concentration of bound DNA at each proteininput was low (less than 2%) relative to the total proteinconcentration. In the case of the Cre/loxP experiments,[M] free was calculated as:
�M�free � �M�total ÿ �2�SM2� � �SM�� �4�In equation (4), SM and SM2 are expressed in terms oftheir molar concentration. Accurate determination of[SM2] and [SM] using equation (4) is dependent on accu-rate determination of the substrate concentration, since[SM2] and [SM] are determined as fraction bound � totalinput DNA. It was estimated that the variation in quanti-®cation of independently prepared substrates is up to10%. Therefore, in the case of Cre/loxP, this introduces apotential source of additional error to the determinationof K1 and K2 using the loxP inverted repeat target.
Mathematical modelling I: DNA binding
Using the nomenclature of Figure 1, the binding ofrecombinase monomers (M) to a full site substrate (S) isdescribed by the kinetic equations:
S�M�k1
kÿ1
SM �5�
SM�M�k2
kÿ2
SM2 �6�
k1 and kÿ1 are the association and dissociation rate con-stants, respectively, for the species SM. k2 and kÿ2 are theassociation and dissociation rate constants for the speciesSM2. For the DNA binding model the assumption ismade that the on and off rates for each half site, a and b,are identical.
The evolution of species M, S, SM and SM2 over timeis described by the differential equations:
d�M�=dt � ÿk1�S��M� � kÿ1�SM� ÿ k2�SM��M� � kÿ2�SM2��7�

382 Kinetics of FLP and Cre
d�S�=dt � ÿk1�S��M� � kÿ1�SM� �8�
d�SM�=dt � k1�S��M� ÿ kÿ1�SM� ÿ k2�SM��M� � kÿ2�SM2��9�
d�SM2�=dt � ÿk2�SM��M� ÿ kÿ2�SM2� �10�dt is the time interval in seconds. The terms in squarebrackets refer to molar concentrations at time, t.Equations (7) to (10) were implemented in a Fortran 77code, and solved by ®nite difference numerical inte-gration.
The rate constants k1, kÿ1, k2 and kÿ2 were determinedby ®tting the computed time courses of the SM and SM2concentrations to the experimentally observed valuessimultaneously. Starting values of k1, kÿ1, k2 and kÿ2
were determined by choosing values which gave anapproximate agreement with the experimental data.Using these starting values, the model of equations (7) to(10) was integrated in time using a semi-implicit Eulerscheme (Press et al., 1992). Codes from the ODELIBC � � class library were used (http://www.zib.de/PaperWeb/abstracts/TR-93-08). The time courses were®tted to the experimental data by minimising an errorfunction using the method of Powell (1965), a derivative-free version of the conjugate gradient method. The errorfunction was constructed by summing the squared devi-ations of the experimental and computed SM and SM2concentrations. As each set of rate constants correspondsto a unique solution of equations (7) to (10), and hence agiven value of the error function, optimal values of therate constants correspond to optimal agreement betweenexperimental and modelled time courses. The optimis-ation C � � program used codes from the COOOL classlibrary (Deng et al., 1996) to minimise the error functionwhich was implemented in Perl. Source codes are avail-able on request.
Mathematical modelling II: therecombination reaction
The proposed pathway of recombination is shown inFigure 1. The names of most species and rate constantsused in the model are shown in the Figure. Additionalspecies described by the model and not shown inFigure 1 are as follows. The distinction is made in themodel between SM2A (equation (14)), which has a singlemonomer bound at each target site, and SM2B (equation(15)), which has two monomers bound at one site, leav-ing the other site unoccupied. Only SM2B is indicated inFigure 1. Either SM2A or SM2B can give rise to SM3(equation (16)), in which one site is bound by two mono-mers while the other is bound by only one monomer.Later species which are also not shown in Figure 1describe the stepwise dissociation of monomers fromDNA. EPM2 and LPM2 (Figure 1), both with two mono-mers bound, can each release a single monomer to giverise to EPM and LPM respectively (equations (21) and(22)). The release of the last bound monomer from EPMand LPM gives rise to EP and LP (equations (23) and(24); Figure 1).
Based on classical kinetic equations, the differentialequations describing the rate of change of each speciesover time (in seconds) are as follows:
d�S�=dt � ÿk1�S��M� � kÿ1�SM� �11�
d�M�=dt �ÿ k1�S��M� � kÿ1�SM� ÿ k2�SM��M�� kÿ2�SM2B� ÿ k1�SM��M� � kÿ1�SM2A�ÿ k2�SM2A��M� � kÿ2�SM3� ÿ k1�SM2B��M�� kÿ1�SM3� ÿ k2�SM3��M� � kÿ2�SM4�ÿ k2�EPM��M� � kÿ2�EPM2� ÿ k2�LPM��M�� kÿ2�LPM2� ÿ k1�EP��M� � kÿ1�EPM�ÿ k1�LP��M� � kÿ1�LPM� �12�
d�SM�=dt � k1�S��M� ÿ kÿ1�SM� � kÿ1�SM2A�ÿ k1�SM��M� � kÿ2�SM2B� ÿ k2�SM��M� �13�
d�SM2A�=dt � k1�SM��M� ÿ kÿ1�SM2A�� kÿ2�SM3� ÿ k2�SM2A��M� �14�
d�SM2B�=dt � k2�SM��M� ÿ kÿ2�SM2B�� kÿ1�SM3� ÿ k1�SM2B��M� �15�
d�SM3�=dt � k1�SM2B��M� ÿ kÿ1�SM3� � k2�SM2A��M�ÿ kÿ2�SM3� � kÿ2�SM4� ÿ k2�SM3��M� �16�
d�SM4�=dt � k2�SM3��M� ÿ kÿ2�SM4�� kÿ34�IEP� ÿ k34�SM4� �17�
d�IEP�=dt � k34�SM4� ÿ kÿ34�IEP�� kÿ5�EPM2��LPM2� ÿ k5�IEP� �18�
d�EPM2�=dt � k5�IEP� ÿ kÿ5�EPM2��LPM2�� k2�EPM��M� ÿ kÿ2�EPM2� �19�
d�LPM2�=dt � k5�IEP� ÿ kÿ5�EPM2��LPM2�� k2�LPM��M� ÿ kÿ2�LPM2� �20�
d�EPM�=dt � k1�EP��M� ÿ kÿ1�EPM�� kÿ2�EPM2� ÿ k2�EPM��M� �21�
d�LPM�=dt � k1�LP��M� ÿ kÿ1�LPM�� kÿ2�LPM2� ÿ k2�LPM��M� �22�
d�EP�=dt � kÿ1�EPM� ÿ k1�EP��M� �23�
d�LP�=dt � kÿ1�LPM� ÿ k1�LP��M� �24�
Equations (11) to (24) were implemented and solvedas described above for the DNA binding model. To ®ndvalues for the unknown rate constants k34, kÿ34, k5 andkÿ5, computed time courses were ®tted to experimentaldata by varying the input values of unknown rate con-stants. The quantity taken to represent the total excisionproduct, EPtot, is given by IEP � EPM2 � EPM � EP.This quantity is considered to describe the experimen-tally observed excision product because only the linearexcision product, and not the circle, is labelled and quan-ti®ed. In addition, because recombination reactions areterminated with proteinase K, the DNA seen as excisionproduct includes the DNA within the excised synapticcomplex (IEP in the model) and all subsequent boundand unbound forms (EPM2, EPM and EP).

Kinetics of FLP and Cre 383
Acknowledgements
We thank Michael Cox for the gift of puri®ed FLPrecombinase. We also thank S. E. Halford, A. Lane and J.Feeney for critical discussion. This work was supportedin part by the Volkswagen Stiftung Program on Con-ditional Mutagenesis.
References
Abremski, K. & Hoess, R. (1984). Bacteriophage P1 site-speci®c recombination. Puri®cation and propertiesof the Cre recombinase protein. J. Biol. Chem. 259,1509±1514.
Abremski, K. & Hoess, R. (1985). Phage P1 Cre-loxPsite-speci®c recombination. Effects of DNA super-coiling on catenation and knotting of recombinantproducts. J. Mol. Biol. 184, 211±220.
Adams, D. E., Bliska, J. B. & Cozzarelli, N. R. (1992).Cre-lox recombination in Escherichia coli cells.Mechanistic differences from the in vitro reaction.J. Mol. Biol. 226, 661±673.
Amin, A. A., Beatty, L. G. & Sadowski, P. D. (1990).Synaptic intermediates promoted by the FLP recom-binase. J. Mol. Biol. 214, 55±72.
Amin, A., Roca, H., Luetke, K. & Sadowski, P. D. (1991).Synapsis, strand scission, and strand exchangeinduced by the FLP recombinase: analysis withhalf-FRT sites. Mol. Cell. Biol. 11, 4497±4508.
Andrews, B. J., Beatty, L. G. & Sadowski, P. D. (1987).Isolation of intermediates in the binding of the FLPrecombinase of the yeast plasmid 2-micron circle toits target sequence. J. Mol. Biol. 193, 345±358.
Barinaga, M. (1994). Knockout mice: round two. Science,265, 26±28 (published erratum in Science, 265, 855).
Beatty, L. G., Babineau, Clary D., Hogrefe, C. &Sadowski, P. D. (1986). FLP site-speci®c recombi-nase of yeast 2-micron plasmid. Topological fea-tures of the reaction. J. Mol. Biol. 188, 529±544.
Brenowitz, M., Senear, D. F., Shea, M. A. & Ackers, G. K.(1986). Quantitative DNAse footprint titration: amethod for studying protein-DNA interactions.Methods Enzymol. 130, 132±181.
Buchholz, F., Ringrose, L., Angrand, P. O., Rossi, F. &Stewart, A. F. (1996). Different thermostabilities ofFLP and Cre recombinases: implications for appliedsite-speci®c recombination. Nucl. Acids Res. 24,4256±4262.
Deng, H. L., Gouveia, W. & Scales, J. (1996). Inversemethods: interdisciplinary elements of method-ology, computation and applications. In LectureNotes in Earth Sciences (Jacobsen, B. H., Moosegard,K. & Sibani, P., eds), vol. 63, pp. 320±330, SpringerVerlag, New York.
Dixon, J. E. & Sadowski, P. D. (1993). Resolution of syn-thetic chi structures by the FLP site-speci®c recom-binase. J. Mol. Biol. 234, 522±533.
Gates, C. A. & Cox, M. M. (1988). FLP recombinase isan enzyme. Proc. Natl Acad. Sci. USA, 85, 4628±4632.
Golic, M. M., Rong, Y. S., Petersen, R. B., Lindquist, S. L.& Golic, K. G. (1997). FLP-mediated DNA mobiliz-ation to speci®c target sites in Drosophila chromo-somes. Nucl. Acids Res. 25, 3665±3671.
Guo, F., Gopaul, D. M. & Van Duyne, G. D. (1997).Structure of Cre recombinase complexed with DNAin a site-speci®c recombination synapse. Nature,389, 40±46.
Hoess, R. H. & Abremski, K. (1984). Interaction of thebacteriophage P1 recombinase Cre with the recom-bining site loxP. Proc. Natl Acad. Sci. USA, 81,1026±1029.
Hoess, R., Abremski, K. & Sternberg, N. (1984). Thenature of the interaction of the P1 recombinase Crewith the recombining site loxP. Cold Spring HarborSymp. Quant. Biol. 49, 761±768.
Hoopes, B. C., LeBlanc, J. F. & Hawley, D. K. (1992).Kinetic analysis of yeast TFIID-TATA box complexformation suggests a multi-step pathway. J. Biol.Chem. 267, 11539±11547.
Jayaram, M. (1994). Phosphoryl transfer in Flp recombi-nation: a template for strand transfer mechanisms.Trends Biochem. Sci. 19, 78±82.
Kilby, N. J., Snaith, M. R. & Murray, J. A. (1993). Site-speci®c recombinases: tools for genome engineering.Trends Genet. 9, 413±421.
Lee, J. & Jayaram, M. (1995). Functional roles of individ-ual recombinase monomers in strand breakage andstrand union during site-speci®c DNA recombina-tion. J. Biol. Chem. 270, 23203±23211.
Lee, J., Whang, I. & Jayaram, M. (1996). Assembly andorientation of Flp recombinase active sites on two,three and four-armed DNA substrates: implicationsfor a recombination mechanism. J. Mol. Biol. 257,532±549.
Logie, C. & Stewart, A. F. (1995). Ligand-regulated site-speci®c recombination. Proc. Natl Acad. Sci. USA,92, 5940±5944.
Mack, A., Sauer, B., Abremski, K. & Hoess, R. (1992).Stoichiometry of the Cre recombinase bound to thelox recombining site. Nucl. Acids Res. 20, 4451±4455.
Meyer, Leon L., Gates, C. A., Attwood, J. M., Wood,E. A. & Cox, M. M. (1987). Puri®cation of the FLPsite-speci®c recombinase by af®nity chromatog-raphy and re-examination of basic properties of thesystem. Nucl. Acids Res. 15, 6469±6488.
Onouchi, H., Yokoi, K., Machida, C., Matsuzaki, H.,Oshima, Y., Matsuoka, K., Nakamura, K. &Machida, Y. (1991). Operation of an ef®cient site-speci®c recombination system of Zygosaccharomycesrouxii in tobacco cells. Nucl. Acids Res. 19, 6373±6378.
Powell, M. (1965). An ef®cient method for ®nding theminimum of a function of several variables withoutcalculating derivatives. Comp. J. 7, 155±162.
Press, W., Teukolsky, S. A., Vetterling, W. T. &Flannery, B. P. (1992). Numerical Recipes in C: TheArt of Scienti®c Computing, Cambridge UniversityPress, Cambridge.
Qian, X. H. & Cox, M. M. (1995). Asymmetry in activecomplexes of FLP recombinase. Genes Dev. 9, 2053±2064.
Qian, X. H., Inman, R. B. & Cox, M. M. (1990). Protein-based asymmetry and protein-protein interactionsin FLP recombinase-mediated site-speci®c recombi-nation. J. Biol. Chem. 265, 21779±21788.
Rajewsky, K., Gu, H., Kuhn, R., Betz, U. A., Muller, W.,Roes, J. & Schwenk, F. (1996). Conditional gene tar-geting. J. Clin. Invest. 98, S51±S53 (Suppl.).
Ringrose, L., Angrand, P. O. & Stewart, A. F. (1997).The Kw recombinase, an integrase from Kluyvero-myces waltii. Eur. J. Biochem. 248, 903±912.
Rossant, J. & Nagy, A. (1995). Genome engineering: thenew mouse genetics. Nat. Med. 1, 592±594.
Sadowski, P. D. (1995). The Flp recombinase of the2-microns plasmid of Saccharomyces cerevisiae. Prog.Nucl. Acid Res. Mol. Biol. 51, 53±91.

384 Kinetics of FLP and Cre
Schwartz, C. J. & Sadowski, P. D. (1990). FLP protein of2 mu circle plasmid of yeast induces multiple bendsin the FLP recognition target site. J. Mol. Biol. 216,289±298.
Senear, D. F. & Brenowitz, M. (1991). Determination ofbinding constants for cooperative site-speci®c pro-tein-DNA interactions using the gel mobility-shiftassay. J. Biol. Chem. 266, 13661±13671.
Senecoff, J. F. & Cox, M. M. (1986). Directionality in FLPprotein-promoted site-speci®c recombination is
mediated by DNA-DNA pairing. J. Biol. Chem. 261,7380±7386.
Stark, W. M., Boocock, M. R. & Sherratt, D. J. (1992).Catalysis by site-speci®c recombinases. TrendsGenet. 8, 432±439 (published erratum in TrendsGenet. 8, 432±439).
Waite, L. L. & Cox, M. M. (1995). A protein dissociationstep limits turnover in FLP recombinase-mediatedsite-speci®c recombination. J. Biol. Chem. 270,23409±23414.
Edited by A. R. Fersht
(Received 20 July 1998; accepted 6 August 1998)
Copyright © 2022 FDOKUMEN