Comparative Evaluation of Flax, Cattail, and Hemp Fiber ...
207
Comparative Evaluation of Flax, Cattail, and Hemp Fiber Composites by MD. SHADHIN A Thesis submitted to the Faculty of Graduate Studies of The University of Manitoba in partial fulfillment of the requirements of the degree of MASTER OF SCIENCE Biosystems Engineering University of Manitoba Winnipeg, Manitoba, Canada Copyright © 2021 by Md. Shadhin
-
Upload
khangminh22 -
Category
Documents
-
view
1 -
download
0
Transcript of Comparative Evaluation of Flax, Cattail, and Hemp Fiber ...

Comparative Evaluation of Flax, Cattail, and Hemp
Fiber Composites
by
MD. SHADHIN
A Thesis submitted to the Faculty of Graduate Studies of
The University of Manitoba
in partial fulfillment of the requirements of the degree of
MASTER OF SCIENCE
Biosystems Engineering
University of Manitoba
Winnipeg, Manitoba, Canada
Copyright © 2021 by Md. Shadhin

ii
ABSTRACT
Composite parts, used in transportation industries, are manufactured using VARTM (Vacuum
Assisted Resin Transfer Molding) and glass fiber non-woven mats that are optimized for
impregnation, fiber volume fraction (Vf), and composite properties. However, such optimized
non-woven mats are commercially not available for natural fibers such as hemp and flax.
Fahimian (2013) has developed the knowledge on the effect of areal density (weight per unit
area), needle punching used to bind the fibers together, and the pressure applied during
manufacturing, on composite properties. Similar studies on flax fibers is not available. Such
studies on Cattail fibers, with comparable properties and abundance, are lacking. Hence, the
goal of this thesis to generate this knowledge and do a comparative evaluation of flax, cattail,
and hemp fibers and their composites. The mat permeability as well as tensile strength and
modulus of needle-punched (0-72P) flax composites, manufactured using VARTM pressure
as well as compression molding pressures (subsequent to VARTM molding), were measured
and evaluated. Similar studies were repeated on 50% Flax-50% hemp fiber mat. Cattail fibers
were extracted from cattail leaf using alkali retting, characterized for properties, and used to
manufacture 0-P mat. This was subsequently used to test for permeability as well as
manufacture composites for mechanical testing. The results from these studies as well as that
for hemp fiber (generated by Fahimian (2013)) were used in comparative evaluation of the
three fibers as reinforcement in composites.
It was found that the Vf of flax mats changes with punch density that affects the
permeability. Vf in flax mat composite dictates the modulus and strength which is a function
of consolidation behavior that varies with punch density and pressure. Despite having similar
tensile strength in all three fibers, cattail fibers possess higher specific strength than flax and
hemp due to lower density values of cattail fiber; however, modulus and specific modulus
increases as follows (Eflax< Ecattail<Ehemp); it should be noted that the weight of the composite

iii
part decreases with increase in specific properties of the fiber. The transverse permeability of
cattail fiber mat is the highest, followed by hemp fiber mat and the flax fiber mat’s
permeability was the least. At VARTM pressure (101 kPa) the properties of composites with
three fibers are similar.

iv
ACKNOWLEDGEMENT
He who does not thank the people, does not thank Almighty Allah.
–Prophet Muhammad (may peace be upon him)
First and foremost, praise is to Almighty Allah (SWT) for all his blessings for giving
me patience and good health throughout my MSc degree.
I would like to express my sincere gratitude to my co-supervisor, Dr. Raghavan
Jayaraman, for giving me the opportunity to work with Composites Materials and Structures
Research Group (CMSRG) and department of Mechanical Engineering of the University of
Manitoba, who has guided me with immense knowledge and inspiration throughout this
journey.
I would also like to give my sincere thanks to my academic supervisor, Dr. Mashiur
Rahman, who supported, guided, and encouraged me during my studies. I am grateful forever
to him for providing me the opportunity to work under his supervision.
I would like to thank Mike Boskwick for his technical assistance and support during
my research.
I extend my gratitude to URGP (University Research Grant Program), NSERC, and
Dr. Danny Mann for their financial support.
I would like to thank my lab mates – Kaushal Sharma and Spence Cabel. I would also
like to thank Ikra Iftekhar Shuvo, Mostafizur Rahman, and Masud Rana for their immense
support while doing my studies at U of M. Finally, I would like to thank my parents, for all
their support and patience.

v
TABLE OF CONTENTS
Page
ABSTRACT ii
ACKNOWLEDGEMENT iv
TABLE OF CONTENTS v
LIST OF TABLES ix
LIST OF FIGURES xii
CHAPTER I INTRODUCTION
1.1 Background 1
1.2 Thesis Goals and Scope 5
1.3 Organisation of thesis 6
CHAPTER II LITERATURE REVIEW
2.1 Introduction 7
2.2 Background information 8
2.2.1 Lignocellulosic fiber 8
2.2.2 Key factors affecting natural fiber composite properties 10 2.2.3 Nonwoven mat 15 2.2.4 Needle punching 16
2.2.5 Mat permeability 18 2.2.6 Composite manufacturing 19
2.3 Review of published literature 20
2.3.1 Fiber extraction and retting techniques of bast fibers 20
2.3.2 Chemical composition of bast fibers 22 2.3.3 Mechanical properties of bast fibers 23 2.3.4 Nonwoven mat manufacturing and characterization 24
2.3.5 Mat permeability 25
2.3.6 Composite manufacturing and properties (effect of punch
density and consolidation pressure) 26
2.4 Knowledge gap and Motivation 27
2.5 Thesis Objectives 28
CHAPTER III EXPERIMENTAL DETAILS
3.1 materials 29
3.2 Manufacturing of fibers and fiber mats 30
3.2.1 Manufacturing nonwoven flax and flax-hemp hybrid mats30
3.2.2 Cattail fiber extraction 31

vi
3.2.3 Manufacturing zero punch nonwoven mat 34
3.3 Fiber characterization 36
3.3.1 Yield measurement 37 3.3.2 Moisture Regain (%) Measurement 37
3.3.3 Fiber length measurement 38 3.3.4 Fiber diameter measurement 38 3.3.5 Mechanical properties of fiber 39
3.4 Mat characterization 42
3.4.1 Areal density and thickness of nonwoven mat 42
3.4.2 Transverse permeability measurement of nonwoven mat42
3.5 Surface modification of cattail 44
3.5.1 Surface modification of cattail fiber 44 3.5.2 Surface modification of cattail mat 45 3.5.3 FT-IR analysis 45
3.6 Composite manufacturing 46
3.6.1 Manufacturing composites using VARTM (vacuum
assisted resin transfer molding) 46
3.6.2 Manufacturing composites by compression molding 47
3.7 Density measurement 49
3.8 Fiber volume fraction measurement 50
3.8.1 Fiber volume fraction in nonwoven mat 50
3.8.2 Fiber volume fraction of composite 51
3.9 Preparation of Tensile Test Coupons 51
3.9.1 Tabbing 52
3.9.2 Cutting 52 3.9.3 Polishing 52 3.9.4 Manufacturing carbon epoxy laminate tabs 53
3.10 Tensile testing of composite 57
3.11 Microscopic analysis of mats and composite 58
3.12 SEM analysis of composite 59
CHAPTER IV FLAX FIBER COMPOSITES – RESULTS AND
DISCUSSION
4.1 Physical and mechanical properties of flax fiber 61
4.2 Effect of diameter on the mechanical properties of flax fiber 65
4.3 Physical properties of nonwoven flax mat 66
4.4 Flax mat permeability 70
4.5 Density of reinforcing fibers and resin 73
4.6 Flax fiber reinforced composite properties 73

vii
4.6.1 Effect of consolidation pressure during composite
manufacturing on structure of composite 73 4.6.2 Mechanical properties of flax fiber reinforced composite77
4.7 Effect of punch density and manufacturing pressure on
mechanical properties of flax mat composite 79
4.7.1 Tensile modulus 82 4.7.2 Tensile strength 85
4.8 Image analysis of flax composite 88
4.9 Statistical analysis 89
4.9.1 Tensile strength 89
4.9.2 Tensile modulus 90
4.10 Properties of flax-hemp hybrid mat composite 92
4.10.1 Composite thickness, density, and fiber volume fraction 92 4.10.2 Mechanical properties of flax-hemp hybrid mat
composite 93
4.10.3 Tensile strength and modulus 95 4.10.4 Statistical analysis 96
CHAPTER V CATTAIL : FIBER AND COMPOSITE
CHARACTERIZATIONS – RESULTS AND DISCUSSION
5.1 Yield % of cattail fiber 98
5.2 Physical properties of cattail fiber 100
5.3 Fiber characterisation - Application of Weibull distribution to
study the effect of moisture content on the tensile properties of
cattail fiber 102
5.3.1 Relationship between relative humidity and moisture
content of cattail fiber 102 5.3.2 Effect of RH (%) on the mechanical properties of cattail
fiber 103 5.3.3 Weibull distribution and calculating Weibull parameters108
5.3.4 Weibull analysis of tensile strength of cattail fiber at
different relative humidity conditions 110
5.3.5 Weibull analysis of elastic modulus of cattail fiber at
different relative humidity conditions 113 5.3.6 Effect of fiber length on Weibull distribution (cattail
fiber) 116 5.3.7 Effect of estimator on the Weibull distribution (cattail
fiber) 119
5.4 Influence of fiber diameter on the mechanical properties of
cattail fiber 121
5.5 Effect of surface modifications 122
5.5.1 Evaluation of chemical changes 122
5.5.2 Evaluation of moisture regain of the treated samples 124

viii
5.6 Cattail Mat characterization 126
5.6.1 Density of cattail fiber 126 5.6.2 Physical properties of non-woven cattail mat 126 5.6.3 Cattail mat permeability 129
5.7 Composite Properties 131
5.7.1 Effect of consolidation pressure during manufacturing on
structure of composite 131 5.7.2 Composite thickness 134 5.7.3 Density and fiber volume fraction of composite 135
5.7.4 Stress-strain curve 138 5.7.5 Tensile modulus 140
5.7.6 Tensile strength 142 5.7.7 Image analysis of cattail composite 143 5.7.8 Scanning Electron Microscopy (SEM) 146
CHAPTER VI COMPARITIVE ANALYSIS
6.1 Fiber properties 151
6.2 Nonwoven mat properties 152
6.3 Comparison among mechanical properties of zero punched mat
composite 153
6.3.1 Stress-strain behavior 153
6.3.2 Tensile modulus and tensile strength 155
6.4 Comparison of needle punched flax and hemp mat composites 158
CHAPTER VII CONCLUSION
7.1 Summary and Conclusions 160
7.2 Recommendations for future works 163
REFERENCES 164
APPENDICES
Appendix A Cattail 179
Appendix B Flax 185
Appendix C Experimental Detail 187

ix
LIST OF TABLES
Table No. Page
Table 1.1 Comparative Analysis of Cattail, Flax, and Hemp. 4
Table 2.1. Classification of natural fibers based on their origin (Pecas et. al.,
2018; Bharath & Basavarajappa, 2016). 8
Table 2.2 World production of lignocellulosic fibers and their manufacturer.
(Ramamoorthy et. al., 2015; La Mantia & Morreale, 2011; John &
Thomas, 2008; Yan et. al., 2014). 9
Table 2.3. Chemical composition of cattail fiber (Vetayasuporn, 2007). 10
Table 2.4 The comparison among different retting process of bast fiber
(Paridah et. al., 2014). 22
Table 2.5 Chemical composition of different bast fiber (Akil et. al., 2011;
Yu, 2015; Faruk et. al., 2012; Varma et. al., 1984; Martí‐Ferrer et.
al., 2006). 23
Table 2.6 Mechanical properties of different bast fiber (Faruk et. al., 2012;
Hoareau et. al., 2004; Wang et. al., 2018; Fan & Weclawski,
2017). 24
Table 3.1 The equipment and methods used to determine the properties of
cattail and flax fiber. 36
Table 3.2 Different types of desiccants and corresponding relative humidity
(%). 40
Table 4.1 Physical properties of nonwoven flax mat. 69
Table 4.2 Physical properties of nonwoven hemp mat (Fahimian, 2015). 69
Table 4.3 Density of reinforcing fibers and Stypol resin. 73
Table 4.4 Density and fiber volume fraction percentage of flax composite at
different punch density and manufacturing pressure. 76
Table 4.5 Mechanical properties of flax fiber reinforced composite. 79
Table 4.6 Summary of two way ANOVA for tensile strength of flax
composite in respect to corresponding Vf. 90
Table 4.7 The interactions among all possible pairs of tensile strength means
for different Vf of flax composite. 90
Table 4.8 Summary of two way ANOVA for tensile modulus of flax
composite in respect to corresponding Vf. 91

x
Table 4.9 The interactions among all possible pairs of tensile modulus
means for different Vf of flax composite. 92
Table 4.10 Thickness, density, and fiber volume fraction of flax-hemp hybrid
mat composite. 93
Table 4.11 Mechanical properties of flax-hemp hybrid mat composite. 94
Table 4.12 T-test results for tensile strength and tensile modulus of flax-hemp
composite. 97
Table 5.1 Mechanical properties of cattail fiber at different relative
humidity. 104
Table 5.2 Weibull parameters of tensile strengths for cattail fiber at different
relative humidity based on Weibull distribution model. 112
Table 5.3 Comparison of Weibull parameters and elastic modulus of cattail
fiber at different relative humidity based on experimental data and
Weibull distribution model. 114
Table 5.4 Effect of fiber length on the Weibull Parameters of cattail fiber. 117
Table 5.5 Effect of different estimators on the Weibull parameters. 120
Table 5.6 Density of cattail fiber. 126
Table 5.7 Physical properties of nonwoven cattail mat. 128
Table 5.8 Physical properties of nonwoven flax, hemp, and flax-hemp
hybrid mat. 128
Table 5.9 Transverse permeability of cattail mat and corresponding Vf % of
mat prepared for manufacturing composite at different pressures.130
Table 5.10 Transverse permeability of flax and flax-hemp hybrid nonwoven
mat. 131
Table 5.11 Density and fiber volume fraction of cattail composite at different
manufacturing pressure. 136
Table 5.12 Mechanical properties of stypol resin and cattail fiber reinforced
composite (N=5). 139
Table 6.1 Physical and mechanical properties of flax, hemp, and cattail fiber.152
Table 6.2 Physical, properties of nonwoven cattail, flax, hemp, and flax-
hemp hybrid mat. 153
Table 6.3 Fiber volume fraction of flax, hemp, cattail, and flax-hemp mat
composite manufactured at different pressure. 156

xi
Table 6.4 Longitudinal tensile modulus of needle punched flax and hemp
composite. 159

xii
LIST OF FIGURES
Figure No. Page
Figure 2.1 Key factors that affect the properties of natural fiber composite. 11
Figure 2.2 Schematic diagram of variation in tensile stress (σfu) and interfacial
bond strength (τy) with different critical fiber lengths (lc) and aspect
ratios (l/d) (Chawla, 2012). 13
Figure 2.3 Schematic diagram of needle punched flax fiber mat manufacturing
process (Fahimian, 2013). 17
Figure 3.1 Manufacturing needle-punched flax mat (Courtesy – Dr. Raghavan
Jayaraman). 30
Figure 3.2 Cattail plants collected from wetlands in Winnipeg. 31
Figure 3.3 Temperature and oscillation-controlled water bath for cattail fiber
extraction. 32
Figure 3.4 (a) Cattail plant pieces before retting (b) alkali retted cattail plant in
bath after 3 hrs. 33
Figure 3.5 Cattail fiber extraction using reused KOH solution. 33
Figure 3.6 KOH retted cattail fibers after (a) washing and (b) drying. 34
Figure 3.7 Side view of a mini carding machine. 35
Figure 3.8 Preparation of nonwoven cattail mat (a) laid up fibers (b) dead
weight application (c) prepared mat. 36
Figure 3.9 Rectangular fiber attachment frame for tensile testing. 39
Figure 3.10 (a) Schematic diagram of projection microscope and camera set up
connected with Bioquant analyzer (b) microscopic view of fiber
while diameter measurement in Bioquant analyzer. 39
Figure 3.11 Cattail fiber kept in desiccators containing different relative
humidity condition. 40
Figure 3.12 Schematic diagram of mat permeability measurement using air
[Schiefer & Boyland, (1942)]. 44
Figure 3.13 NICOLET 6700 spectrometer for FT-IR analysis. 46
Figure 3.14 Vacuum Assisted Resin Transfer Molding process – (a) nonwoven
mat laid up in mold (b) VARTM setup before resin impregnation
(c) flow front of resin while impregnation. 48

xiii
Figure 3.15 (a) G50 H- 24-CLX hydraulic press machine for compression
molding (b) resin impregnated mat sandwiched among release film,
metal plate, and silicon pad (c) cured composite plate in
compression molding. 49
Figure 3.16 Helium Pycnometer for density measurement. 50
Figure 3.18 Composite specimen (127 mm X 20 mm) sandwiched between
carbon epoxy laminates for tensile testing. 51
Figure 3.18 Prepreg layup and vacuum bag assembly for manufacturing carbon-
epoxy composites (Chekurthi, 2018). 54
Figure 3.19 Autoclave plate is connected to (a) nitrogen tank and (b) vacuum
pump – while manufacturing carbon-epoxy laminates. 55
Figure 3.20 Cure cycle in autoclave processing for carbon-epoxy composite. 56
Figure 3.21 Cured carbon-epoxy laminates. 57
Figure 3.22 Tensile testing of composite specimens in MTS with extensometer.
58
Figure 3.23 VHX Digital Microscope. 59
Figure 3.24 Scanning electronic microscope (Courtesy – Manitoba Institute for
Materials, University of Manitoba). 60
Figure 3.25 Coating operation of fractured composite samples. 60
Figure 4.1 Distribution in length of fibers in needle punched flax mat. 63
Figure 4.2 Distribution in diameter of fibers in needle punched flax mat. 63
Figure 4.3 Distribution in tensile strength of fibers in nonwoven flax mat. 64
Figure 4.4 Distribution in tensile modulus of fibers in nonwoven flax mat. 64
Figure 4.5 Distribution in strain at break (%) of fibers in nonwoven flax mat.65
Figure 4.6 Variation in elastic modulus of flax fibers with diameter. 66
Figure 4.7 Microscopic image of 20-P flax mat at 20X magnification. 67
Figure 4.8 Microscopic image of 30-P flax mat at 20X magnification. 67
Figure 4.9 Microscopic image of 72-P flax mat at 20X magnification. 68
Figure 4.10 Effect of needle punch density on the transverse permeability of
flax mat. 71
Figure 4.11 Effect of void fraction on the experimental transverse permeability
of nonwoven flax mat. 71

xiv
Figure 4.12 Out of plane permeability plotted as a function of C. 72
Figure 4.13 Effect of consolidation pressure on composite thickness for various
flax mats. 74
Figure 4.14 Effect of consolidation pressure on fiber volume fraction of flax mat
composite. 76
Figure 4.15 Stress-strain curve of flax composite manufactured at 101 kPa for
different punch density. 77
Figure 4.16 Stress-strain curve of flax composite manufactured at 260 kPa for
different punch density. 78
Figure 4.17 Stress-strain curve of flax composite manufactured at 560 kPa for
different punch density. 78
Figure 4.18 Variation in tensile modulus with change in punch density of flax
mat composite at different pressures. 80
Figure 4.19 Variation in tensile modulus with change in manufacturing pressure
for various punch density flax composite. 80
Figure 4.20 Variation in tensile strength with change in punch density of flax
mat composite at different pressures. 81
Figure 4.21 Variation in tensile strength with change in manufacturing pressure
for various punch density flax composite. 81
Figure 4.22 Experimental tensile modulus of 0-P flax composite. 83
Figure 4.23 Experimental tensile modulus of 20-P flax composite. 83
Figure 4.24 Experimental tensile modulus of 30-P flax composite. 84
Figure 4.25 Experimental tensile modulus of 72-P flax composite. 84
Figure 4.26 Relationship between tensile modulus and fiber volume fraction of
flax mat composite at different punch density. 85
Figure 4.27 Experimental tensile strength of 0-P flax composite. 86
Figure 4.28 Experimental tensile strength of 20-P flax composite. 86
Figure 4.29 Experimental tensile strength of 30-P flax composite. 87
Figure 4.30 Experimental tensile strength of 72-P flax composite. 87
Figure 4.31 Relationship between tensile strength and fiber volume fraction of
flax mat composite at different punch density. 88

xv
Figure 4.32 Stress-strain curve for stypol resin and 0-P flax-hemp mat
composite manufactured at different pressure. 94
Figure 4.33 Relationship between tensile strength and fiber volume fraction of
flax-hemp composite at different pressure. 95
Figure 4.34 Relationship between tensile modulus and fiber volume fraction of
flax-hemp composite at different pressure. 96
Figure 5.1 Yield % of cattail fiber at different stage of extraction. 99
Figure 5.2 Analysis of yield of cattail fiber using Tukey chart. 99
Figure 5.3 Normal distribution in length of cattail fiber. 101
Figure 5.4 Normal distribution in diameter of cattail fiber. 101
Figure 5.5 Relationship between relative humidity and moisture content of
cattail fiber. 103
Figure 5.6 Inserted diameter and breakage point diameter at 33% RH (Canola
fiber). 106
Figure 5.7 (a) Granular/fibrillar break at 11% RH; (b) Fiber breakage with
multiple splitting at 11% RH; (c) Axial spit (75% RH); (d) Tensile
break – multiple ends (11% RH); (e) Tensile break – (b) single end
(75% RH). 107
Figure 5.8 Weibull plots of the tensile strength of cattail fiber at different
relative humidity. 112
Figure 5.9 Reliability analysis of tensile strength of cattail fiber at different
relative humidity using Weibull distribution. 113
Figure 5.10 Weibull plots of the elastic modulus of cattail fiber at different
relative humidity. 115
Figure 5.11 Reliability analysis of elastic modulus of cattail fiber at different
relative humidity using Weibull distribution. 115
Figure 5.12 Weibull analysis of tensile strength of virgin cattail fiber using
different fiber length. 118
Figure 5.13 Reliability analysis of tensile strength of cattail fiber for different
fiber length using Weibull distribution. 118
Figure 5.14 Variation of elastic modulus of cattail fiber with fiber diameter. 122
Figure 5.15 FTIR spectra of untreated cattail fiber and cattail fiber treated with
DIH and HEA at 2.5, 5, and 10% concentration for 20 minutes. 123
xvi
Figure 5.16 Proposed reactions in the DIH-HEA-treated cattail fibers and
cattail-stypol composites. 124
Figure 5.17 Moisture regain of treated cattail fiber at different DIH-HEA
concentration and immersion time. 125
Figure 5.18 Relationship between mat thickness and fiber volume fraction % of
cattail mat. 128
Figure 5.19 Individualised cattail and flax fiber for preparing zero punched
nonwoven mat. 129
Figure 5.20 Effect of void fraction content on the experimental transverse
permeability of cattail mat. 131
Figure 5.21 Cured flax composite manufactured at VARTM pressure for (a) 20-
punch density and (b) 30-punch density mat. 132
Figure 5.22 Dry spots in cured zero punched cattail mat composite
manufactured at VARTM pressure. 132
Figure 5.23 Cured cattail composite manufactured in compression molding
process at 260 kPa. 134
Figure 5.24 Effect of consolidation pressure on composite thickness during
manufacturing. 135
Figure 5.25 Effect of consolidation pressure on fiber volume fraction of cattail
mat composite. 137
Figure 5.26 Relationship between fiber volume fraction % of nonwoven mat
and composite density. 137
Figure 5.27 A representative tensile stress -strain curve for cattail fiber. 139
Figure 5.28 Stress-strain curve for stypol resin and cattail mat composite
manufactured at different pressure. 140
Figure 5.29 Relationship between fiber volume fraction and tensile modulus of
cattail composite at different pressure. 142
Figure 5.30 Effect of manufacturing pressure on tensile strength of cattail
composite. 143
Figure 5.31 Microscopic images of cattail composite – (a) 30X magnification
and (b) 100X magnification; manufactured at VARTM pressure.144
Figure 5.32 Microscopic images of cattail composite – (a) 30X magnification
and (b) 100X magnification; manufactured at 260 kPa molding
pressure. 145

xvii
Figure 5.33 Microscopic images of cattail composite – (a) 30X magnification
and (b) 100X magnification; manufactured at 260 kPa molding
pressure. 145
Figure 5.34 Scanning electron microscopy of cattail fibre (chemically extracted,
Yu and Rahman, 2020) 146
Figure 5.35 Scanning electron micrograph of fracture surface for cattail
composite (560 kPa). 147
Figure 5.36 Scanning electron micrograph of fracture surface for cattail
composite (560 kPa) showing fiber covered with resin. 147
Figure 5.37 Scanning electron micrograph of fracture surface for cattail
composite (260 kPa) showing fiber covered with resin. 148
Figure 5.38 Scanning electron micrograph of fracture surface for cattail
composite (260 kPa) showing empty fiber regions. 149
Figure 5.39 Tip end of fiber covered with resin (560 kPa). 150
Figure 5.40 Tip end of fiber covered with resin (260 kPa – treated fiber). 150
Figure 6.1 Stress-strain behavior of flax, cattail, and flax-hemp hybrid mat
composite manufactured at 260 kPa. 154
Figure 6.2 Stress-strain behavior of flax, cattail, and flax-hemp hybrid mat
composite manufactured at 560 kPa. 155
Figure 6.3 Relationship between Vf and experimental tensile modulus of zero
punched mat composite. 157
Figure 6.4 Relationship between Vf and experimental tensile strength of zero
punched mat composite. 157
Figure 6.5 Relationship between Vf and modulus of flax and hemp composites
at various punch density. 159
Figure A.1 FTIR spectra of cattail fiber treated with 2.5% DIH-HEA (10 min)179
Figure A.2 FTIR spectra of cattail fiber treated with 2.5% DIH-HEA (20 min)179
Figure A. 3 FTIR spectra of cattail fiber treated with 2.5% DIH-HEA (30 min)180
Figure A. 4 FTIR spectra of cattail fiber treated with 5% DIH-HEA (10 min).180
Figure A. 5 FTIR spectra of cattail fiber treated with 5% DIH-HEA (20 min).181
Figure A. 6 FTIR spectra of cattail fiber treated with 5% DIH-HEA (30 min).181
Figure A. 7 FTIR spectra of cattail fiber treated with 10% DIH-HEA (10 min).182

xviii
Figure A. 8 FTIR spectra of cattail fiber treated with 10% DIH-HEA (20 min).182
Figure A. 9 FTIR spectra of cattail fiber treated with 10% DIH-HEA (30 min).183
Figure A. 10 FTIR spectra of cattail fiber treated with 10% DIH-HEA (30 min –
washed with water). 183
Figure A. 11 FTIR spectra of cattail fiber treated with 10% DIH-HEA (30 min –
washed with alkali). 184
Figure B.1 Microscopic images of 0-P flax mat composite – (a) 30X
magnification and (b) 100X magnification; manufactured at 560
kPa. 185
Figure B. 2 Microscopic images of 20-P flax mat composite – (a) 30X
magnification and (b) 100X magnification; manufactured at 560
kPa. 185
Figure B. 3 Microscopic images of 30-P flax mat composite – (a) 30X
magnification and (b) 100X magnification; manufactured at 560
kPa. 186
Figure B. 4 Microscopic images of 72-P flax mat composite – (a) 30X
magnification and (b) 100X magnification; manufactured at 560
kPa. 186
Figure C. 1 Chart of flow rate calculation for permeability measurement. 187
Figure C. 2 Micro-Matic Precision Wafering Machine for composite cutting.188

xix

1
CHAPTER I
INTRODUCTION
Polymer-matrix composites (PMC) are increasingly used in structural applications. PMC
consists of a thermoset or thermoplastic matrix reinforced with reinforcing fibers. The higher
modulus of reinforcing materials, when compared to the polymer matrix, makes fibers the
main load-bearing component. The properties of polymer matrix composites can be tailored
to meet the specific needs of an application.
PMC can be categorized as a particulate composite, a discontinuous or short fiber
composite, and a continuous fiber composite. Continuous fiber composites are used in
structural applications in the aerospace industry, for example, as components of civil and
military aircraft such as box beam skins, flaps, fairings, vertical and horizontal stabilizers,
components of forward, mid and rear fuselages, fuel tanks, engine doors, drive shafts, fences,
and rotor blades for helicopters, where meeting the desired properties requirement is more
significant than the cost. However, discontinuous fiber composites are usually used in semi-
structural or non-structural applications such as doors, windows, furniture, gaskets, ceiling
tiles, and automotive interior parts, where cost is the primary consideration. The selection of
fiber as a reinforcement relies on the mechanical properties requirement of the final composite
product and manufacturing process as well as increasing focus on biodegradability.
1.1 BACKGROUND
Natural fiber reinforced composites (NFRC) are preferable because of their low density, low
manufacturing cost, flexibility, and renewability over synthetic composite products.
Consumer preference has been growing in recent times towards new products from renewable

2
sources. The concept of green composite, biodegradability, new directives on recycling, and
social influence have led the consumer towards eco-friendly products. The natural biomass
fibers (BFs), such as flax, kenaf, jute, hemp, and sisal, are increasingly investigated as
environmentally friendly alternatives to glass fibers for engineering applications (Fahimian,
2013; Nishino et. al., 2003; Karnani, 1997; Oksman, 2002; Wambua et. al., 2003; Wrobel et.
al., 2012; Yan et. al., 2014).
Natural fibers can be plant-based or animal-based according to their sources. Plant-
based fibers, commonly known as cellulosic fibers, and animal based-fibers are similar to
protein fibers. Cellulose, hemicellulose, and lignin are the main constituents of plant-based
fibers, which are usually extracted from bast (e.g. flax, hemp, jute), leaves (e.g. sisal), seed
(e.g. cotton), fruit (e.g. coir), wood (e.g. hardwood, softwood), stalk (e.g. wheat, maize), and
grass (e.g. bamboo) (Lau et. al., 2018).
The bast fibers are the most widely used natural fiber in composite applications.
Among them, published research have mostly focused on composites made from flax, hemp,
jute, kenaf, and ramie. Two other natural cellulosic fibers that have been extracted from waste
biomass and are shown to be comparable with the currently used bast fibers, are: canola fiber
from canola stems and cattail fiber from leaves whose physical and mechanical fiber properties
have recently been published (Shuvo et. al., 2019). These fibers are comparatively easier to
extract from their raw resources. The common extraction methods of bast fibers are by using
water and chemical retting (Verma et. al., 2016).
Bast fibers have a few drawbacks that hinder their performance on composite
applications. One drawback is that bast fibers are hydrophilic in nature, resulting in poor fiber-
matrix interfacial adhesion (Mohanty et. al., 2001). Surface modification is needed to improve
the fiber-matrix interfacial bond strength and to reduce the hydrophilic characteristic of bast

3
fibers. However, there have been large variations reported in the scientific literature regarding
their mechanical properties.
Bast fibers extracted from plants are discontinuous. Dry spinning them into continuous
yarns, for manufacturing continuous fiber composites, is costly. Hence, using them as
discontinuous fibers is cost effective and has been the focus of the Composites Materials and
Structures Research Group (CMSRG) at the University of Manitoba. Discontinuous glass fiber
mats have been used along with VARTM (Vacuum Assisted Resin Transfer Molding) and
thermoset resin to manufacture cost effective semi-structural applications such as panels for
buses and coaches manufactured by New Flyer Industries and Motor Coach Industries in
Winnipeg, MB. In order to successfully replace glass fiber mat in these composites with bast
fibers such as Hemp and Flax grown in Canada, non-woven mats of these fibers are required.
Currently, there are no commercial manufacturers and suppliers of these mats in North
America.
Hence, the CMSRG group of Dr. Raghavan Jayaraman at the University of Manitoba
have been studying the design of non-woven mats and their effect on manufacturability and
properties of composites manufactured using VARTM for transportation applications. They
have used the Pilot plant facility at NCSU, Raleigh, North Carolina, USA to manufacture mats
of hemp, flax, and 50% hemp-50% flax. Unlike glass fiber mats where fibers are bound
together using a binder, the hemp and flax mats are bound through needle punching. Punch
density was veried from 0 to 72 and needle punch depth from 0 mm to 8 mm in this study for
flax to identify the optimal mat manufacturing conditions.
Fahimian (2013) has correlated the effect of punch density on permeability,
consolidation, compressibility of hemp mats during manufacturing as well as properties of
manufactured composites. However, similar study of flax mats, manufactured by him, is
4
required to confirm the broader applicability of the mat design to natural fibers and hence is
one focus of this study.
Another focus of this study is to investigate the suitability of a cattail fiber in composite
application due to its many advantages over bast fibers. Unlike BFs that are grown as main
crop, cattails grow naturally in bog and fen, lacustrine marshes, prairie pothole marshes,
roadside ditches, riverine marshes, tidal marshes, and wet meadows. Total wetland in Canada
is estimated to be 1.5 million km2 and it is estimated that 23% of land in the Prairie Pothole
Region is wetland (Euliss et al., 2006; Canadian Encyclopedia, n.d.). A comparison of cattail
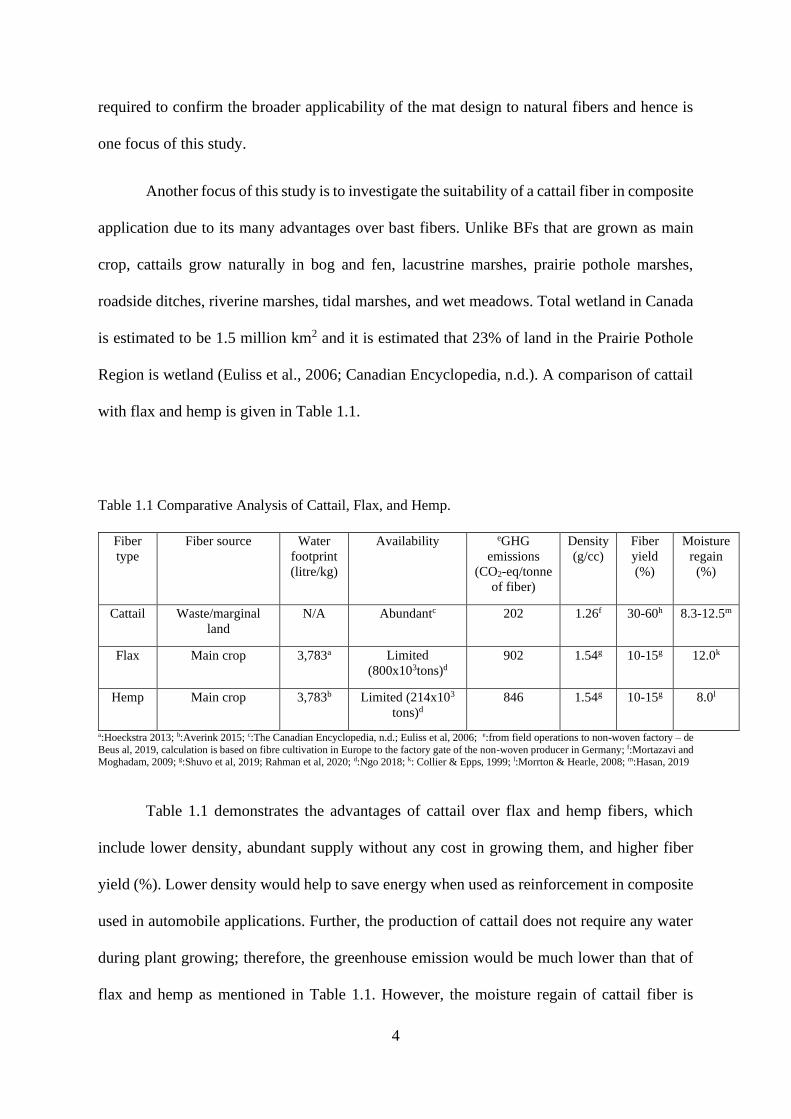
with flax and hemp is given in Table 1.1.
Table 1.1 Comparative Analysis of Cattail, Flax, and Hemp.
Fiber
type
Fiber source Water
footprint
(litre/kg)
Availability eGHG
emissions
(CO2-eq/tonne
of fiber)
Density
(g/cc)
Fiber
yield
(%)
Moisture
regain
(%)
Cattail Waste/marginal
land
N/A Abundantc 202 1.26f 30-60h 8.3-12.5m
Flax Main crop 3,783a Limited
(800x103tons)d
902 1.54g 10-15g 12.0k
Hemp Main crop 3,783b Limited (214x103
tons)d
846 1.54g 10-15g 8.0l
a:Hoeckstra 2013; b:Averink 2015; c:The Canadian Encyclopedia, n.d.; Euliss et al, 2006; e:from field operations to non-woven factory – de
Beus al, 2019, calculation is based on fibre cultivation in Europe to the factory gate of the non-woven producer in Germany; f:Mortazavi and Moghadam, 2009; g:Shuvo et al, 2019; Rahman et al, 2020; d:Ngo 2018; k: Collier & Epps, 1999; l:Morrton & Hearle, 2008; m:Hasan, 2019
Table 1.1 demonstrates the advantages of cattail over flax and hemp fibers, which
include lower density, abundant supply without any cost in growing them, and higher fiber
yield (%). Lower density would help to save energy when used as reinforcement in composite
used in automobile applications. Further, the production of cattail does not require any water
during plant growing; therefore, the greenhouse emission would be much lower than that of
flax and hemp as mentioned in Table 1.1. However, the moisture regain of cattail fiber is

5
comparable with flax and hemp and high for composite applications and requires further
surface treatment to enhance adhesion with the hydrophobic resins. Despite the advantages of
cattail fibers over flax and hemp, research on comparative evaluation with flax and hemp has
not been done yet and is a second focus of this study. Nonwoven preform is required for
manufacturing composite in VARTM and compression molding. Hence, manufacturing
nonwoven from cattail is focused on this study as published studies on the same are also
missing.
1.2 THESIS GOALS AND SCOPE
The goal of this thesis is to perform a comparative evaluation of properties of discontinuous
natural fiber composites manufactured using flax, hemp, and cattail fibers.
The effect of punch density on permeability of the non-woven mat, as well as the
effect of punch density and manufacturing pressure on properties of 100% flax and 50% flax-
50% hemp fiber composites, manufactured through VARTM, were studied in this thesis and
compared with the results generated by Fahimian (2013) for Hemp.
In order to investigate the suitability of cattail fiber for composite applications, the
effect of humidity on the properties of the fibers as well as surface modification to enhance its
suitability for impregnation by hydrophobic thermoset resin was first studied. Subsequently,
cattail composites with zero-punch mat were manufactured with untreated and DIH (1,6-
diisocyanatohexane) - HEA (2-hydroxyethyl acrylate) treated fiber, were manufactured using
VARTM and compression molding and tested. Finally, tensile properties of hemp, flax, and
cattail fiber composites are compared and evaluated.
6
1.3 ORGANISATION OF THESIS
The organisation of this thesis is arranged in the following order.
• Chapter 1: Introduction
• Chapter 2: Detailed Literature Review - In this chapter, published studies on natural
fiber structure and mechanical properties, characterisation of nonwoven mat, effect of
punch density and consolidation pressure on composite properties are presented and
discussed to establish the knowledge gaps in support of the objectives of this thesis.
• Chapter 3: Experimental details - In this chapter, experimental details and methods
involved in fiber evaluation, mat characterisation, manufacturing composite, and an
analysis of mechanical properties for 100% flax, 50% flax/50% hemp fiber matt, cattail
fiber composites are presented and discussed.
• Chapter 4: Results and discussion – Flax fiber characterization, evaluation of mat
parameters, manufacturing flax composite from zero punched and various needle
punched mat, correlation between mat manufacturing parameters and composite
properties are presented and discussed in this chapter.
• Chapter 5: Results and discussion - Cattail fiber extraction, evaluation of fiber
properties, fiber surface modification, preparing nonwoven cattail mat, manufacturing
cattail composite, and evaluation of mechanical properties evaluation of composite are
presented and discussed in this chapter
• Chapter 6 : Comparative analysis on flax, cattail, and hemp composites is presented in
this chapter.
• Chapter – 7: Conclusions.

7
CHAPTER II
LITERATURE REVIEW
2.1 INTRODUCTION
Natural lignocellulose fibers, such as flax (bast/biomass), hemp (bast/biomass) and cattail
(leaf/ biomass) are the interest of the current research for composite applications due to their
biodegradability, availability, and lower cost. A composite may be defined as a physical
mixture of two or more different materials and has properties, which are generally better than
any one of the materials used. The composites from natural fibers are manufactured by
infiltrating resin into the natural fiber non-woven preform (virgin and treated) at different
consolidation pressures. The composite manufacturing pressures as well as the mat thickness,
permeability, and fiber volume fraction determine the performance of natural fiber reinforced
composites (NFRC).
However, mat manufacturing parameters, for example, density of needle punch and
needle depth in flax and hemp mats that might affect the mat properties and NFRC
performances have been comprehensively reviewed based on the published literatures to
support the scope and objective of this research. Further, a novel biomass fiber from leaf
(cattail) has been investigated for its suitability in composite applications. Finally, cattail fiber
and composites have been investigated and compared with that of the other biomass fibers
(flax and hemp).

8
2.2 BACKGROUND INFORMATION
2.2.1 Lignocellulosic fiber
In broad sense, fibers can be categorized as natural or man-made . Based on origin, natural
fibers can be classified as plant, mineral, and animal fibers. The classification of natural fibers
is shown in Table 2.1. Plant based fibers or vegetable fibres are mainly composed of cellulose,
hemicellulose, and lignin and they are usually extracted from bast, leaf, seed, fruit, wood,
stalk, and grass/reed (Pecas et. al., 2018). Bast fibers are produced around the globe. The world
production of various lignocellulosic fibers and their geographical distribution is shown in
Table 2.2 (Bharath & Basavarajappa, 2016).
Table 2.1. Classification of natural fibers based on their origin (Pecas et. al., 2018; Bharath &
Basavarajappa, 2016).
Nat
ura
l fi
ber
s
Origin Fiber type List of fibers
Lignocellulosic
Bast Flax, Hemp, Jute, Kenaf, Ramie
Leaf Abaca, Banana, Pineapple, Sisal
Seed Cotton, Kapok
Fruit Coir
Wood Hardwood, Softwood (e.g., Eucalyptus)
Stalk Wheat, Maize, Oat, Rice
Grass / Reed Bamboo, Corn
Animal Wool / hair Cashmere, Goat hair, Horse hair, Lamb wool
Silk Mulberry
Mineral - Asbestos, Ceramic fibres, Metal fibres

9
Table 2.2 World production of lignocellulosic fibers and their manufacturer. (Ramamoorthy et. al.,
2015; La Mantia & Morreale, 2011; John & Thomas, 2008; Yan et. al., 2014).
Fiber type Fiber name World production (103 ton) Largest producers
Bast
Flax 830 Canada, France, Belgium
Hemp 214 China, France, Philippines
Jute 2300 India, China, Bangladesh
Kenaf 970 India, Bangladesh, USA
Ramie 100 China, Brazil, Philippines, India
Leaf
Abaca 70 Philippines, Ecuador, Costa Rica
Pineapple 74 Philippines, Thailand, Indonesia
Sisal 378 Tanzania, Brazil
Seed
Coir 100 India, Sri Lanka
Cotton 25000 China, India, USA
Oil palm 40 Malaysia, Indonesia
Grass Bagasse 75000 Brazil, India, China
Bamboo 30000 India, China, Indonesia
Among all the lignocellulosic fibers, bast fibers are mostly used one as a reinforcement
in discontinuous fiber composite. Flax (Linum usitatissimum) is a bast fiber mainly produced
in Canada, France, and Belgium and is predominantly grown for the fiber and the linseed oil.
Flax fibers were reported to be used for many applications well before 5000 BC in Egypt and
Georgia. High grade long fibers are usually converted into yarns for textiles and the low-grade
fibers are used as reinforcements/fillers in composites (Ramamoorthy et. al., 2015). The
structure, morphology, and properties of flax fibers are explained in previous studies (Charlet
et. al., 2007; Cristaldi et. al., 2010; Shadhin & Shuvo, 2019). Due to its high cellulosic content

10
and high specific properties, flax stands as a strong and potential candidate for the replacement
of existing synthetic fibers.
Cattail (Typha latifolia) fiber is a newly recognized bast fiber to use as a reinforcement
in discontinuous fiber composite. Cattail plant grows abundantly in swamplands and near the
edge of ponds and lakes and becoming increasingly dominant wetland plants in North America
(Shih & Finkelstein, 2008). The chemical composition of cattail is shown in Table 2.3
(Vetayasuporn, 2007). Cattail fibers are prevalent in nature and their mechanical properties
are also promising like other bast fibers such as flax, hemp, and jute. The chemical
composition of the bast fibers (flax, hemp, jute, kenaf, ramie) could be found in section 2.3.2
(Table 2.5).
Table 2.3. Chemical composition of cattail fiber (Vetayasuporn, 2007).
Fiber
Cellulose (%) Hemi- cellulose (%) Lignin (%) Wax (%) Ash (%)
Cattail 63 8.7 9.6 1.4 2
2.2.2 Key factors affecting natural fiber composite properties
The mechanical properties of Natural Fiber Reinforced Composite (NFRC) rely on the
chemical constituents of fiber, reliable fiber supply chain, and important fiber characteristics,
such as fiber geometry, fiber orientation, fiber moisture absorption, fiber porosity,
permeability, and fiber volume fraction (Lau et. al., 2018; Ho et. al., 2012). The major fiber
characteristics that affect the properties of natural fiber composite are illustrated in Figure 2.1.
It may be possible to obtain the desired mechanical properties of NFRC by controlling and
tailoring these properties.

11
Figure 2.1 Key factors that affect the properties of natural fiber composite.
a) Fiber geometry
Variability in the natural fiber diameter is the major difference between natural fibers and
synthetic fibers. The diameter of synthetic fibers can be designed to meet the end-use
requirement during fiber spinning by choosing spinnerets with desired hole size; whereas the
natural fiber diameter varies greatly (CV% can be as high as 20%) along the length of the
fiber. However, the aspect ratio (l/d, where l is the length and d is the diameter of fiber) could
be an important parameter to determine the properties of NFRC (Facca et. al., 2006).
The fiber diameter is the key to influence critical length (lc). In composites, the critical
length, lc is a parameter that indicates the amount of stress transferred to the fiber; a fiber
whose aspect ratio is greater than the critical aspect ratio would strengthen the composite while

12
a fiber whose aspect ratio is smaller than the critical aspect ratio is more likely to weaken the
material. For a given fiber diameter d and the critical fiber length lc, the fiber-matrix interfacial
bonding strength can be determined using Eq. (2.1) (Chawla, 2012).
lc
d=
σfu
2τy (2.1)
where: lc stands for the critical fiber length,
d for fiber diameter
σfu for fiber tensile strength, and
τy for fiber-matrix interfacial bond strength.
From Eq. (2.1) it can be stated that the fiber length l should be greater than the critical
length lc for the fiber to be loaded to its maximum stress, σfu. The fiber critical length is
important as it is known from the ‘Shear lag model’ (Chawla, 2012), which explains the
mechanism of load transfer from the matrix to the fiber, and that composite failure would
occur due to the fiber fracture followed by the matrix failure when l > lc while composite
failure would occur due to fiber debonding followed by matrix failure when l < lc (Chawla,
2012). Figure 2.2 illustrates the variation in tensile stress and interfacial bond strength with
different critical fiber lengths and aspect ratios.

13
Figure 2.2 Schematic diagram of variation in tensile stress (σfu) and interfacial bond strength (τy) with
different critical fiber lengths (lc) and aspect ratios (l/d) (Chawla, 2012).
b) Fiber moisture absorption
Another drawback of natural cellulosic fibers such as flax, hemp, and cattail is the
hydrophilicity, which degrades the fiber performance in PMC. Higher moisture content in the
fiber results in poor fiber-matrix interfacial adhesion while manufacturing composites
(Mohanty et. al., 2001). However, the hydrophilic properties of fiber can be reduced by
chemical treatment (Qiu et. al., 2011).
c) Permeability
The manufacturing of the composite and the subsequent mechanical properties of composites
manufactured from these fibers may vary due to permeability of the fiber preforms used while
manufacturing composite. Permeability of fiber preform would depend on the fineness of fiber
(fiber diameter), packing of fiber, and other manufacturing parameters (in case of needle
punched preform) such as needle punch density and needle depth. Small inter-fiber spacing in
case of smaller diameter fibers would result in low permeability, which in turn will affect the
manufacturing process.

14
d) Fiber volume fraction
The fiber content or fiber volume fraction plays a key role to achieve the desired mechanical
properties of PMC. The strength and stiffness of PMC will increase with the increasing fiber
content in a reinforcement. However, too high fiber content or fiber volume fraction (%) would
result in degradation of material properties due to insufficient filling of the matrix to hold the
fibers together. Thus, an optimum fiber content is needed to achieve a balanced interface
strength that is high enough to attain better mechanical properties.
e) Fiber orientation
The fiber orientation defines the orientation of the longitudinal axis of the fiber in a composite,
with respect to the loading axis. During non-woven mat production, fibers are fed onto the
conveyor belt by pneumatic pressure. Further, the fiber orientation could be changed by the
moulding pressure and resin flowing pattern while manufacturing composites. The fiber
orientation is quantified by the orientation factor (ξ). The relationship between the orientation
factor and mechanical properties of composites can be determined using Eq. (2.2) (Chawla,
2012). The higher the orientation factor, the better the mechanical properties of the
manufactured composite. ξ = 1 for aligned and continuous fiber composite and ξ < 1 for
random fiber orientation.
Ec = ξ Ef Vf + Em Vm (2.2)
where: ξ is the orientation factor.
EC, Ef, and Em denotes the modulus of composite, fiber, and matrix respectively.
Vf, and Vm denotes the fiber volume fraction of fiber and matrix respectively.

15
2.2.3 Nonwoven mat
Non-woven mats are also known as nonwoven or nonwoven fabric. Processes for converting
fibers directly into a fabric or mat without involving the spinning and weaving operations are
known as nonwoven processes. Nonwoven products have the potential to replace woven and
knit materials due to their lower cost and ease of processing as the process of spinning for
making yarn and weaving or knitting for making fabric is expensive, time consuming, and
labour oriented when compared to nonwoven mat manufacturing process. Nonwoven products
are being used in composite industries, apparel, home building, packaging, and geotextile
industries because of their higher permeability, better friction, and better conformability when
compared to woven products (Gillies, 1979; MARIENFELD, 1995).
Nonwoven mat manufacturing process consists of two major steps that include web
formation and binding. Three methods of forming a web are (1) air laying, (2) wet laying, and
(3) spun laying (MARIENFELD, 1995). Air laying technique is the focus of this study where
fibers are separated by a mechanical comb, suspended in air, and dropped on to a moving
conveyor belt to form the web of fibers. In wet laying, fibers suspended in water are collected
on a screen, drained of any entrapped water, and dried to form the web. In spun laying, hot
and continuous synthetic filaments extruded through the spinnerets are blown onto a moving
belt where they are bonded together to form the web.
The various mat binding methods (Yan et. al., 2014). include thermal, mechanical and
chemical. In thermal binding, the thermoplastic component of a mat softens upon application
of heat and binds the fibers together. The mechanical binding includes hydro-entanglement
and needle punching. Hydro-entanglement uses fine jets of highly pressurized water to
entangle and bind the fibers. In needle punching, entanglement of fibers is achieved by a set
of barbed needles punching through the web. This study has used a mat without a binding

16
material. This study has used a mat without a binding material and needle punching was used
here to bind the fibers in the mat.
2.2.4 Needle punching
Natural fibers such as cotton, jute, wool, sisal and a few synthetic fibers such as polypropylene,
polyethylene, rayon, and nylon have been used in manufacturing needle punched mats.
Needle-punched nonwovens are felt-like and very flexible, with a fibrous network and
distinctive pores that are entangled to form a complex 3D structure by random fibers. Needle
punched nonwovens are accounted for its bulky nature and a wide range of pore size
distribution.
Schematic diagram of needle punched flax fiber mat manufacturing process is
illustrated in Figure 2.3. In the needle punching process, the web of fibers is formed by air-
laying and fed into a needling press or needler using a conveyor belt. Needle board is fitted
with needles which strike the web of fibers from the top, and the needles descend through the
web by a pre-determined needle depth. During this downward stroke, the grooves in the
needles pick up in-plane fibers (parallel to the surface of the web) and reorient them in the
out-of-plane (i.e. along the thickness of the web) direction. These reoriented fibers
mechanically interlock the rest of the fibers resulting in the mat. The punch density (P) is
measured in punches per cm2 and calculated usually from Eq. (2.3) [Hearle, J. W. S. (1972].
P = NO X S
Vx (2.3)
where NO is the number of needles per unit length of the needle board (needles/cm), S
is the number of strokes per unit time (Punches/sec) of the needle board, and Vx is the speed
of the conveyor belt (cm/sec).

17
The structure of needle-punched fabric is not homogenous and structural anisotropy in
the manufactured needle punched nonwoven mat arises due to rearrangement of fibers while
processing. The shape and number of holes depends on the number of needles in the needle
board, the size of needles, advances per stroke, punching density and fiber type (Das et al.,
2012; Jinlian, 2008). Key parameters that influence the performance characteristics of a
nonwoven needle-punched mat are – properties of the fiber used in mat; needle density; depth
of penetration of needle, needling rate, and mat areal density (Venkatappa & Banerjee, 1997).
In this study, the punch density was varied from 0 and 72 to understand its effect on
the structure of the mat and manufactured composite. Needle depth is the distance travelled
by the needle beyond the bottom surface of the web. For a given areal density of the mat, the
structural parameters could be altered when depth of needle penetration is varied which
influences the subsequent properties of mat and composite. In this study, needle punching was
executed on nonwoven flax mat only and the needle depth was varied between 2 and 8 mm.
Figure 2.3 Schematic diagram of needle punched flax fiber mat manufacturing process (Fahimian,
2013).

18
2.2.5 Mat permeability
Permeability is a measure of the amount of void spaces between the fibers and how they are
connected within the mat. The resin flows through void spaces among the fibers of the mat
during mold filling with a purpose of impregnating the entire mat.
In this study, out of plane (through the thickness or transverse) permeability of the flax
fiber mats, cattail fiber mats, and mats blended with flax and hemp fiber were measured and
compared to understand the effect of mat manufacturing parameters. Manufacturing a good
composite plate in VARTM process is mostly dependent on the uniformity in permeability
across the mat. The knowledge on the permeability would allow prediction of resin flow path
in a mat of given shape which could further be used for location adjustment of resin inlets and
vacuum outlets for complete impregnation of a mat without any dry spots. In addition, the
resin filling time could be determined from mat permeability to adjust the get time of resin
matrix. As the resin stops flowing when it reaches gel point during manufacturing, the fill time
has to be less than the gel time to manufacture quality composites without any dry spots. The
resin flows through a fibrous mat could be described from Darcy’s Law as presented in Eq.
(2.4).
k = Q η L
A ∆P (2.4)
where Q is the volumetric flow rate (m3/sec), is the viscosity of the fluid (Pa.s), ΔP is
the pressure gradient in flow direction (MPa), k is the permeability of the mat (m2), A is the
cross-sectional area perpendicular to flow (m2) and L is the length of mat parallel to the flow
(m).

19
2.2.6 Composite manufacturing
Selection of appropriate manufacturing process is important for transformation of the raw
materials to the flawless final product. There are key factors that influences the selection of
composite manufacturing process that include size and geometry of final composite part,
desired properties, raw materials processing, production speed, and manufacturing cost.
Common techniques of manufacturing NFRC are hand lay-up, spray lay-up, liquid
moulding, compression moulding, and injection molding. Liquid moulding and compression
moulding are used for manufacturing the thermoset composite, and injection moulding is used
for the thermoplastic composite (Facca et. al., 2006). Manufacturing thermoset composites
from short (20<l/d<1000) and discontinuous natural fibers (e.g., 100% flax, 50% flax-50%
hemp, 100% cattail) is the focus of this study.
Manufacturing the thermoset composite includes several steps such as fiber
impregnation, lay-up of the part, consolidation, curing, and part removal, which is the removal
of the manufactured composite from the mold after curing, regardless of whether it is a
continuous fiber or a discontinuous fiber. Consolidation of the composites is the important and
complex part while manufacturing. Consolidation can be defined as the reduction in the
thickness of the composite during manufacturing. The rate of consolidation is influenced by
resin viscosity, applied pressure, and fiber permeability. The level of consolidation determines
the fiber volume fraction and void content in the laminate and thus the properties of the
composite. Good control of the resin flow (setting the optimum injection point, resin injection
strategy, e.g. point/edge/peripheral) and pressure while the manufacturing process is
happening are essential to reduce the void content and achieve the desired fiber volume
fraction.

20
Vacuum assisted resin transfer moulding (VARTM) and the compression moulding
process will be used in this study for manufacturing short NFRC. VARTM is one of the
variants of the liquid moulding process which is commonly used to manufacture short (i.e.
discontinuous) fiber thermoset polymer composites. In VARTM, a vacuum is used for both
resin injection and curing. VARTM is less expensive and it is used for manufacturing large
structural parts e.g. ship hulls.
Compression molding, another process or technique for manufacturing thermoset
composite, will be used in the study. For manufacturing a discontinuous fiber composite with
compression molding, the resin impregnated fiber preform is transferred to the hydraulic press
where release film, metal platen, and silicon pad is placed in sequence on either side of the
impregnated nonwoven preform. The platen with fiber preform is then compressed with pre-
determined pressure.
2.3 REVIEW OF PUBLISHED LITERATURE
2.3.1 Fiber extraction and retting techniques of bast fibers
Previous studies report that an increasing number of mechanical processing steps during fiber
extraction and processing results in the reduction in degree of polymerisation of the cellulose
chains, formation of kink bands, and finally degradation in mechanical properties of fiber
(Hughes, (2012). Good quality composites and high quality fibers could be obtained with
minimally-processed fibers that undergoes retting and hackling (Miao & Finn, 2008).
Retting is the very first process to obtain high-quality fibres from the plant. Retting is
a biological process that include removal of non-cellulosic materials sticking to the fibre
bundle by enzymatic activities, consequently yielding detached cellulosic fibres (Lee et. al.,
2019). Fiber retting is a complex process, and fiber properties are highly dependent on the

21
type of retting and retting conditions. Under-retted fibers result in less productive fiber
separation and over retting causes fibre weakening (Preisner et. al., 2014). Several retting
processes have been introduced for fiber extraction. Retting could be categorized as chemical
retting, enzyme retting, water retting, and dew retting (Sadrmanesh & Chen, 2019). Chemical
retting results in comparatively more controllable bast fiber within a short retting duration
whereas enzyme retting is popular for its mild process conditions, specificity, and high
selectivity (Lee et. al, 2019). A brief comparison among different retting process is listed in
Table 2.4.
Apart from these techniques, there are few other less used and non-commercial retting
process such as microwave retting process (applied on flax fiber) (Nair et. al., 2013), gel-
retting method (Pandey, 2016), and microbial retting (Ramaswamy et. al., 1994). The supply
chain for bast fibers are strong as they are annual crops. Bast fibers are extracted from the
phloem located at the stem of the fibrous plant (Lee et. al., 2019).
Chakma (2018) attempted several retting techniques to extract cattail fibers from
cattail leaf. They used water, acid, enzyme, alcohol, and alkali to find out a suitable extraction
process for cattail fibers. The use of water, acid, enzyme, and alcohol didn’t work on cattail
and alkali retting was found to be a suitable process for cattail fiber extraction as concluded
by Chakma (2018). However, no clear result was concluded in Chakma (2018) for optimum
retting conditions (e.g. concentration, time, and temperature) of cattail fiber. Hasan (2019)
further investigated the optimum retting conditions for cattail fiber extraction. Here, the
extraction parameters such as extraction time, temperature, and concentration of alkali were
optimized using desirability function analysis (DFA) for cattail fiber. 7% (w/v) concentration
of NaOH, 10 hours treatment duration, and 90°C treatment temperature was concluded by
Hasan (2019) as the optimum retting conditions for cattail fiber extraction. Both Chakma
(2018) and Hasan (2019) attempted to extract cattail fiber in a very small scale (1 – 3 gm).

22
However, large scale production of cattail fiber is required for manufacturing nonwoven cattail
preform. Hence, published studies on appropriate conditions and suitable techniques for large
scale extraction process of cattail fibers are missing.
Table 2.4 The comparison among different retting process of bast fiber (Paridah et. al., 2014).
Retting methods Description Duration of retting
Water retting Plant stems are submerged in water and checked
periodically until complete retting is done
7–14 days
Dew retting The plant stems are spread evenly onto the fields to get
enough sunlight, atmospheric air, and dew for fungal
colonisation which result in breakdown of cellular stem
tissues and adhesive substances to release the single fibre
2-3 weeks
Enzymatic retting Controllable retting conditions with higher retting
efficiency that uses enzymes to hydrolyse the gum and
pectin material in the stem
12–24 hours
Chemical retting In chemical retting, fibers are usually extracted using
hydrogen peroxide, sodium benzoate, or sodium
hydroxide.
60–75 minutes
2.3.2 Chemical composition of bast fibers
The primary chemical components of bast fibers are cellulose, hemicellulose, and lignin. The
percentage of these compounds in the extracted bast fiber varies and depends on plant age,
species, retting process, and extraction conditions. Cellulosic content determines the physical
and mechanical properties of the bast fiber. Bast fiber contains a large amount of hydroxyl
group (- OH) in its cellulosic structure providing hydrophilic nature (Shadhin & Shuvo, 2019)
to bast fiber. The waxy substances of bast fiber affect the fiber wettability and adhesion
properties (Yan et. al., 2014). Although the structure of cellulose remains same for all the bast

23
fibers, the degree of polymerization changes. The degree of polymerization was found higher
in bast fiber than any other plant fibers (Lewin & Pearce, 1985). The chemical composition
different bast fibers are listed in Table 2.5.
Table 2.5 Chemical composition of different bast fiber (Akil et. al., 2011; Yu, 2015; Faruk et. al., 2012;
Martí‐Ferrer et. al., 2006; Varma et. al., 1984).
Fiber Cellulose (%) Hemi- cellulose (%) Lignin (%) Pectin (%) Wax (%)
Flax 62 - 71 16 - 20 2.0 – 4.5 1.8 – 2.0 1.5 – 1.7
Hemp 67- 75 16 – 22.4 3.0 – 5.7 0.8 0.7 – 0.8
Jute 59 - 71 12 – 20.4 11.8 – 12.9 0.2 – 4.4 0.5
Kenaf 39 - 57 21.5 15 – 19 3.0 – 5.0 -
Ramie 68 - 76 13 0.6 – 2.0 1.9 – 2.1 0.5
2.3.3 Mechanical properties of bast fibers
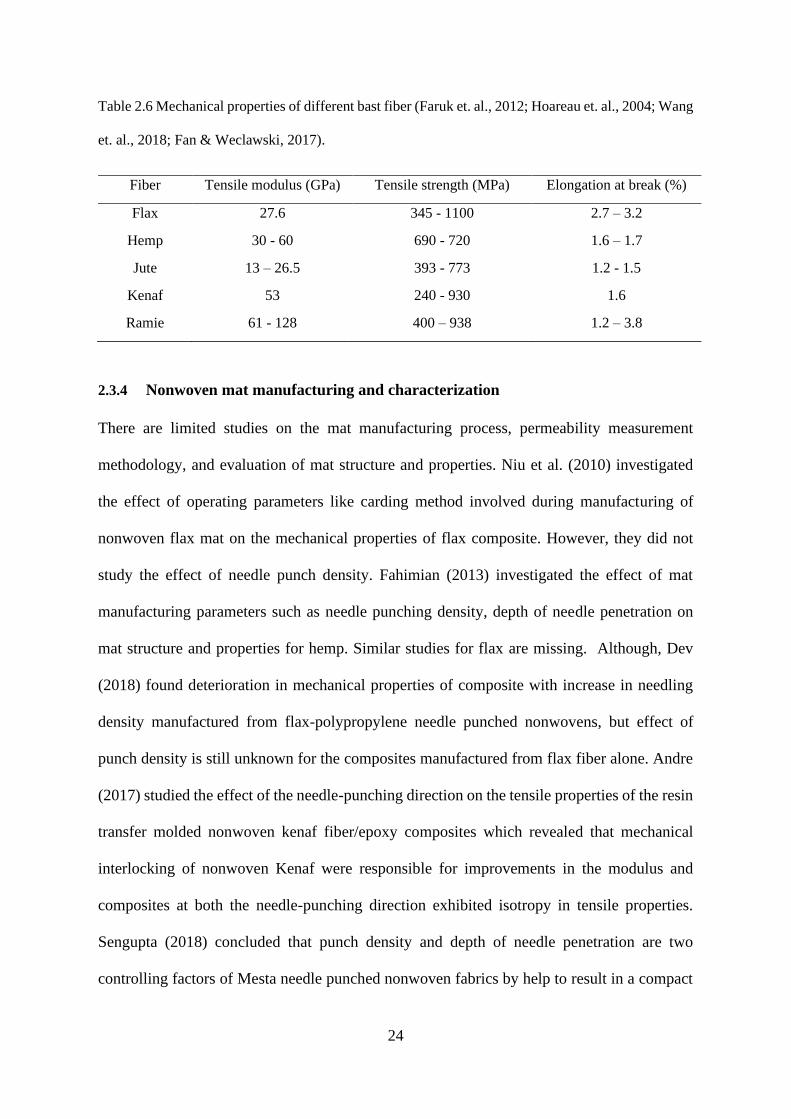
The mechanical properties of bast fibers are listed in Table 2.6. As discussed in section 2.3.2,
the chemical composition of bast fiber varies for plant age, species, retting process, and
extraction conditions. For the same reason variations in bast fiber properties are observed as
well. Each stage of processing the fiber have several influencing factors that affect the
mechanical properties of natural fiber. The percentage of cellulose content, fiber diameter,
density, and aspect ratio influence the mechanical properties of plant based natural fibers.
While evaluating the mechanical properties of natural fiber, change in natural fiber strength
and modulus with change in fiber diameter was observed in previous studies. Mwaikambo
(2006) observed increase in fiber strength and modulus with the decrease in fiber diameter
where the diameter of fibers was reported to be around 120 μm.
24
Table 2.6 Mechanical properties of different bast fiber (Faruk et. al., 2012; Hoareau et. al., 2004; Wang
et. al., 2018; Fan & Weclawski, 2017).
Fiber Tensile modulus (GPa) Tensile strength (MPa) Elongation at break (%)
Flax 27.6 345 - 1100 2.7 – 3.2
Hemp 30 - 60 690 - 720 1.6 – 1.7
Jute 13 – 26.5 393 - 773 1.2 - 1.5
Kenaf 53 240 - 930 1.6
Ramie 61 - 128 400 – 938 1.2 – 3.8
2.3.4 Nonwoven mat manufacturing and characterization
There are limited studies on the mat manufacturing process, permeability measurement
methodology, and evaluation of mat structure and properties. Niu et al. (2010) investigated
the effect of operating parameters like carding method involved during manufacturing of
nonwoven flax mat on the mechanical properties of flax composite. However, they did not
study the effect of needle punch density. Fahimian (2013) investigated the effect of mat
manufacturing parameters such as needle punching density, depth of needle penetration on
mat structure and properties for hemp. Similar studies for flax are missing. Although, Dev
(2018) found deterioration in mechanical properties of composite with increase in needling
density manufactured from flax-polypropylene needle punched nonwovens, but effect of
punch density is still unknown for the composites manufactured from flax fiber alone. Andre
(2017) studied the effect of the needle-punching direction on the tensile properties of the resin
transfer molded nonwoven kenaf fiber/epoxy composites which revealed that mechanical
interlocking of nonwoven Kenaf were responsible for improvements in the modulus and
composites at both the needle-punching direction exhibited isotropy in tensile properties.
Sengupta (2018) concluded that punch density and depth of needle penetration are two
controlling factors of Mesta needle punched nonwoven fabrics by help to result in a compact

25
and entangled nonwoven structure initially; however, decrease in compactness of Mesta mat
structure showed up after certain value of needle punching and needle depth. A detailed
investigation of needle punched flax mat structure and manufacturing parameters is missing.
Also, no previous study has been found to manufacture either zero punched or needle punched
nonwoven mat from cattail fiber.
2.3.5 Mat permeability
Xue et. al. (2011) investigated the permeability of different nonwoven flax mat structure and
found a higher overall compressibility in parallel-laid flax mats than the cross-laid flax mats
resulting in lower porosity, and lower overall permeability in parallel-laid flax mats. Merhi
(2007) studied the transverse permeability of 25 mm-long chopped glass fiber bundle bed and
found porosity content of fiber beds as a main factor that defines its permeability. Niya (2018)
investigated the statistical correlation between permeability, porosity, tortuosity and
conductance in random mat structure which concluded that permeability is a function of
porosity; however, the permeability estimation would only be reliable for a medium or mat
structure having porosities greater than 0.8. Scholz et. al. (2007) studied transverse
permeability measurements over a wide range of materials and implemented a permeability
cell which can be used both with gaseous and fluid flow. 8% deviation in the permeability
measurement result was reported in this study while using air and water for permeability
measurement.
Fahimian (2013) studied the effect of punch density on needle punched hemp mats.
Fahimian used water in the experimental setup of transverse permeability measurement where
transverse permeability of hemp mats decreased with the increase in punch density. However,
published studies to determine the effect of punch density on needle punched flax mats are

26
missing. Also, no previous studies reported the permeability results of zero punched cattail
and flax-hemp hybrid nonwoven preform.
2.3.6 Composite manufacturing and properties (effect of punch density and
consolidation pressure)
The tensile modulus increases as the fiber content increases in discontinuous fiber composites
(Ku et al., 2011). Current literatures are available for glass fiber composite and other synthetic
fiber composite. However, published literatures on discontinuous and natural fiber composites
are limited. Even a very few them studied the combined effect of needle punch density and
manufacturing pressure on composite properties.
Huang and Young (2019) studied the properties of untreated and treated bamboo epoxy
composite. This study reveals that the alkaline treated bamboo epoxy composite showed
enhanced flexural strength of 182.29 MPa when compared to untreated composite strength of
141.30 MPa. The effect of hemp fiber content and anisotropy in needle punched hemp mats
were studied by Hargitai et al., (2006 & 2008). In this study, hemp fibers were blended with
polypropylene fibers in different weight fractions (30, 40, 50, and 70%) and mats were
manufactured using carding and needle punching process. The needle punched mat composites
were manufactured using compression molding. Maximum value of tensile modulus was
reported 6.5 GPa at 50% fiber weight fraction. Composites with double-carded mats had lower
modulus. The modulus of 30% hemp fiber composite was 5 GPa for double carded mat
composites. However, the needle punch density and needle depth of mat were not reported on
this study. Fahimian (2013) studied in detail the effect of mat manufacturing parameters
(needle punch density) on hemp mat properties and manufacturing pressure on composite
properties and the relationship between mat design and composite properties. Tensile strength
and modulus of needle punched hemp mat composite increased with the increase in punch

27
density as concluded by Fahimian (2013). For a given punch density tensile strength and
modulus increased at 260 or 560 kPa when compared to VARTM pressure due to increase in
Vf at higher pressures. However, there are no previous research that studied the combined
effect of needle punch density and consolidation pressure on flax mat composite properties.
Published studies on the effect of consolidation pressure on cattail composite properties are
also missing.
2.4 KNOWLEDGE GAP AND MOTIVATION
Existing non-woven glass mats are already characterized and optimized for manufacturing the
glass fiber reinforced composite to yield good impregnation, desired permeability,
compaction, final part thickness, and fiber volume fraction. However, optimized natural fiber
non-woven mats are not available yet. Composite Materials and Structures Research Group of
Dr. Jayaraman has generated this knowledge for hemp fibers. This research is the continuation
of this study to generate such knowledge for Flax fibers and Flax-Hemp hybrid fibers. In
addition, such studies on Cattail fibers, with comparable properties and abundance, are
lacking. Also, no previous study has been focused on manufacturing nonwoven mat and fiber
reinforced composites and understanding on how mat parameters influences composite
properties from 100% cattail fiber.
Bridging the knowledge gaps, identified above, with respect to the design of flax
fiber and cattail fiber nonwovens, in order to enable comparative evaluation of the various
natural fibers as reinforcements in composites is the motivation of this thesis.

28
2.5 THESIS OBJECTIVES
Hence, the goal of this thesis to perform a comparative evaluation of properties of
discontinuous natural fiber composites manufactured using flax, hemp, and cattail fibers. In
order to realize this goal, the following objectives were identified and pursued.
1. Study the effect of punch density on permeability of the non-woven mat, as well as the
effect of punch density and manufacturing pressure on properties of 100% flax and 50% flax-
50% hemp fiber composites, manufactured through VARTM and compression molding.
2. Investigate the suitability of cattail fiber for composite applications by studying,
(i) the effect of extraction process on fiber properties,
(ii) the effect of humidity on the properties of the fibers,
(iii) the effect of surface modification to enhance its suitability for impregnation by
hydrophobic thermoset resin, and
(iv) properties of composites with Cattail fibers.
3. Comparative evaluation of properties of composites manufactured with 100% Flax, 100%
Cattail, 50%flax – 50% hemp, and 100% hemp (generated by Fahimian (2013)).
CHAPTER III
EXPERIMENTAL DETAILS
3.1 MATERIALS
Flax fiber non-woven mats and 50%Flax-50% Hemp fiber non-woven mats, used in this study
were supplied by Dr. Raghavan Jayaraman of Composites Materials and Structures Research
Group. They had used the fibers supplied by Stemergy Renewable Fiber Technology Inc. in
Ontario, Canada and the Non-woven pilot plant facility at North Carolina State University,
Raleigh, USA to manufacture the mats. Green cattail plants were collected from the roadside
ditches along the Provincial Highway 3 near Winnipeg, Canada in early October 2019 for
extracting fibers and to make nonwoven cattail mats from the extracted fiber. For cattail fiber
extraction, KOH was used for retting and acetic acid was used for the neutralization of the fiber
after retting and both were procured from Fisher Scientific, Ontario, Canada.
Unsaturated polyester resin (Stypol 8086) was used as the thermoset polymer matrix
and was purchased from Composite Envisions LLC, Wausau, USA. Stypol resin is
manufactured to be used in closed-mold processes such as RTM. It is a low-viscosity resin,
which starts reacting with the addition of a curing initiator. The curing initiator chosen for this
study was Luperox 224 (2,4-Pentanedione peroxide), purchased from Sigma Aldrich (Oakville,
Ontario, Canada). The surface modification chemicals 1,6-diisocyanatohexane (DIH), 2-
hydroxyethyl acrylate (HEA), and anhydrous ethyl acetate were purchased from Sigma Aldrich
(Oakville, Ontario, Canada). These chemicals were used for the surface modification of cattail
fiber and nonwoven mats

30
3.2 MANUFACTURING OF FIBERS AND FIBER MATS
3.2.1 Manufacturing nonwoven flax and flax-hemp hybrid mats
Flax and hybrid mats, manufactured by Composite Materials and Structures Research Group
at the University of Manitoba, were used in this study. The mats were manufactured at the pilot
plant at North Carolina State University, USA. The needle punch density varied between 0 and
72 needles per cm2 and the needle punch depth varied between 2 and 8 mm. In order to make
the needle punch non-woven mat, flax fibers were converted into a web of fibers on a moving
conveyor belt through an air lying technique. The web of fibers was further fed to a needler and
needle punched to form nonwoven mats as shown in Figure 3.1. The manufactured needle-
punched nonwoven flax mats were finally wound on a 48-inch wide take-up roller and shipped
back to the University of Manitoba.
Figure 3.1 Manufacturing needle-punched flax mat (Courtesy – Dr. Raghavan Jayaraman).

31
Manufacturing of 0 punch flax, flax-hybrid, cattail fiber mats are discussed below. First
extraction of cattail fibers from cattail leaves are presented.
3.2.2 Cattail fiber extraction
(a) Plant preparation for alkali retting
The collected cattail leaves, shown in Figure 3.2, were dried for 48 hrs at room temperature.
The dried leaves were precut to 6-10 cm in length and weighed using an electronic balance.
(b) Alkali retting in water-bath
Cattail fiber was extracted using a bath (Figure 3.3) in alkaline medium. The 12 L bath is
equipped with the temperature and oscillation control systems as shown in Figure 3.3. The
following list indicates the optimum condition for alkali retting of cattail fiber.
• Chemical – 5 % (w/v) KOH solution
• Temperature – 90 °C
• Time – 4 hrs
• M : L – 1 : 25 (plant and KOH ratio)
Figure 3.2 Cattail plants collected from wetlands in Winnipeg.

32
Figure 3.3 Temperature and oscillation-controlled water bath for cattail fiber extraction.
A stock solution of 5 % (w/v) KOH was prepared and the required amount was added
into the bath. The temperature of the bath was set and raised to 90°C. 250 gm of dried and cut
(6-8 cm) cattail leaves or plants (Figure 3.4 a) were added to the 10 L KOH (M:L = 1:25)
solution in the bath and closed with a cover as shown in Figure 3.3. The oscillation speed of the
bath was set at 100 rpm. A thermometer was used to check the temperature of the bath at
regular intervals and stirring was done every hour to maintain uniform retting of the cattail
plants. Figure 3.4(b) indicates the alkali retted cattail plant in the bath after 3 hours. After 4
hours, once the retting was completed, the bath was turned off. The left-over KOH solution was
reused for the next retting of cattails as shown in Figure 3.5.
It is worth mentioning here that at the beginning of the cattail fiber extraction, retting with
5 % (w/v) KOH solution was conducted at 70, 80 and 90°C for 2, 3 and 4 hrs. However, 90°C
retting temperature and 4 hrs retting time were picked as optimum conditions for cattail fiber
extraction.
(c) Neutralization

33
The retted cattail plant was rinsed in cold distilled water and neutralized in 2 % (v/v) acetic acid
solution for 30 minutes.
(d) Washing and drying
The retted and neutralized cattail fibers were washed progressively in cold, hot and cold
distilled water and left for drying at room temperature. The washed and dried cattail fibers are
illustrated in Figure 3.6.
(a) (b)
Figure 3.4 (a) Cattail plant pieces before retting (b) alkali retted cattail plant in bath after 3 hrs.
Figure 3.5 Cattail fiber extraction using reused KOH solution.

34
(a) (b)
Figure 3.6 KOH retted cattail fibers after (a) washing and (b) drying.
3.2.3 Manufacturing zero punch nonwoven mat
I. Fiber individualization
Cattail fibers extracted from cattail plants using alkali retting were further individualised,
parallelised, and oriented using a modified laboratory carding machine as shown in Figure 3.7.
During carding, cattail fibers were passed through a pair of spiked rollers of the carding
machine while a combing operation was conducted during the passing by each spiked roller.
The spike roller also helps to individualize the entangled fibers obtained from extraction and
the combing operation helps to orient the individual cattail fibers parallel to one another.

35
Figure 3.7 Side view of a mini carding machine.
II. Mat preparation
Although the needle punched flax non-woven mat was manufactured at the North Carolina
State University, the zero punched non-woven mat was prepared in the lab. In order to do so, a
template was designed with a metal plate having a dimension of 8.5”x8.5” for laying up the
individualized fibers. The sides of the metal plate were covered by a paper board for the ease
of thickness control of the mat. Desired volume fraction and thickness of the mat was obtained
by laying up different layers of fibers in the template as illustrated in Figure 3.8 (a). Once the
fiber lay-ups were done, a metal plate with same dimensions was placed on the top layer of the
mat and a dead weight of 3 kg was applied to compress the mat layers as shown in Figure 3.8
(b). Finally, the zero punched nonwoven cattail mat was removed from the mold as shown in
Figure 3.8 (c).
Similarly, the zero punched flax mat and zero punched flax-hemp hybrid mats were
prepared by repeating the above procedure.

36
(a) (b) (c)
Figure 3.8 Preparation of nonwoven cattail mat (a) laid up fibers (b) dead weight application (c) prepared
mat.
3.3 FIBER CHARACTERIZATION
The equipment and methods used in determining the cattail and flax fiber properties such as
fiber length, diameter, yield percentage, and mechanical properties are listed in Table 3.1.
Table 3.1 The equipment and methods used to determine the properties of cattail and flax fiber.
Fiber properties Equipment/Method Standard test method Fiber type
Yield (%) Thermo scientific oven and
weighting machine
(Gravimetric
method)
standard: NF G 08-
001
Cattail
Length
Forceps, precision scale
ASTM D5130
Cattail and flax
Diameter (μm) Bioquant life science image
analyzer
France standard NF
G 07- 004 (1983)
Cattail and flax
Mechanical properties
of cattail fiber
Instron Tensile Tester
ASTM D3822
Cattail and flax
Moisture regain (%)
Humidity chamber and
Thermofisher scientific oven
ASTM D2564
Cattail

37
3.3.1 Yield measurement
The yield (%) of the fibers is the ratio of the oven dried mass of the fibers extracted after
chemical treatment (Ma) and the oven dried mass of the cattail plants before chemical treatment
(Mb). Yield (%) is calculated using Eq. (3.1).
Yield (%) = Ma
Mb X 100 (3.1)
3.3.2 Moisture Regain (%) Measurement
The moisture regain of the cattail fibers was measured using the constant weight principle. In
this method, fibers in an aluminum pan were dried in the oven, maintained at 100⁰C for 12
hours. At the end of 12 hours the oven dry weight of the samples was measured (M0). The
complete drying of fiber samples was deemed reached when the difference in weights was
obtained less than 0.05% of the weight in a sample between the two successive weighing within
a 15-minute interval. The weighing was carried out using an electronic balance.
Subsequently, the fibers were conditioned according to ASTM D 1776- 4 (2008) in the
desiccators at the Textile lab of the University of Manitoba. The relative humidity of the
desiccator or humidity chambers will rely on the desiccants used. The detail on different
desiccants and their corresponding relative humidity (%) [R.H%] is discussed in section 3.3.5.
The moisture regain (%) was calculated as a percentage of the ratio of the weight of moisture
absorbed by the sample to the oven dry weight of the sample as expressed in Eq. (3.2).
Moisture regain (%) = Mw -M0
M0 X 100 (3.2)
Where, Mw is the weight of the samples after conditioning and M0 is the oven dry weight of the
samples.

38
3.3.3 Fiber length measurement
Individual cattail and flax fibers were separated from the extracted fiber bundle and needle-
punched mat respectively, and the fiber length was measured using ASTM D 5130 method.
Both ends of the fiber were gripped with forceps perpendicular to the axis of the fiber keeping
the fiber ends in line with the tips of the forceps. The tip of the forceps was placed at a reference
point on the measuring scale. The other gripping end of the forceps was moved to full extension
without stretching the fiber to remove the crimp. The fiber length was observed and recorded
through a measuring scale.
3.3.4 Fiber diameter measurement
A rectangular paper frame (25 mm in length) was made for measuring the fiber diameter and
preparing the sample for tensile testing as illustrated in Figure 3.9. 400 cattail fibers and 100
flax fibers were selected randomly for diameter measurement and tensile testing. The fibers
whose length was already measured were marked with individual identifications and attached
to the middle of this rectangular frame using an adhesive. The inside length of the frame was
25 mm. Then the frame along with the fiber was placed on a glass slide and the fiber was
observed using 10x magnification using Bioquant life science image analyzer (Bioquant life
science - Motic, BA310l, 2010), which was connected with a projection microscope and
camera. The schematic diagram of the projection microscope and camera set-up attached with
Bioquant analyzer is shown in Figure 3.10 (a). The diameter of the single fiber attached inside
the frame was measured following France standard NF G 07- 004 (1983) and the unit of
measurement was in micrometer (μm). The diameter was measured in five different places
across the length of the cattail fiber as shown in Figure 3.10 (b) and the average diameter was
recorded.

39
Figure 3.9 Rectangular fiber attachment frame for tensile testing.
(a) (b)
Figure 3.10 (a) Schematic diagram of projection microscope and camera set up connected with Bioquant
analyzer (b) microscopic view of fiber while diameter measurement in Bioquant analyzer.
3.3.5 Mechanical properties of fiber
I. Humidity Conditioning (cattail fiber)
Tensile testing of cattail fibers was carried out at different relative humidity conditions.
Desiccators were used as a humidity chamber and different types of salt and water were used

40
as desiccants to create different environmental conditions for the cattail fibers. Prior to testing,
the rectangular frames holding the single fibers were dried in an oven at 50°C for 12 h, which
was necessary to avoid any hysteresis effect After drying, the fiber containing frames was kept
together in a glass plate and suspended in desiccators as shown in Figure 3.11. Fifty fibers were
tested at each relative humidity condition. The name of chemicals used as desiccant and their
corresponding relative humidity (%) are listed in Table 3.2.
Figure 3.11 Cattail fiber kept in desiccators containing different relative humidity condition.
Table 3.2 Different types of desiccants and corresponding relative humidity (%).
Name of chemical Relative Humidity (%)
Lithium Chloride [LiCl. H2O] 11
Magnesium Chloride [MgCl2.6H2O] 33
Magnesium Nitrate [Mg(NO3)2] 55
Sodium Chloride [NaCl] 75
Potassium Chloride [KCl] 84
Potassium Nitrate [KNO3] 93
Water [H2O] 100

41
II. Single fiber tensile testing (flax and cattail)
The mechanical properties, i.e. tensile strength, modulus of elasticity, and strain at break (%),
were evaluated using the Instron Tensile Tester (Model# 5965, Sl#VS02075661, manufactured
by INSTRON, Norwood, USA) following the ASTM D3822 method. The desiccant container
with the rectangular frames, holding the fibers, were brought to Instron Tensile Tester before
tensile testing. The frames were taken from the desiccators one by one just before testing to
prevent change in the moisture level in the fiber. The length of the fiber inside the frame (i.e.
25 mm) acted as a gage length. After the clamping the frame with the fibers between the clamps
of the Instron tester, the paper frame was cut in the center so that the tension was applied only
on the fiber.
‘Pretest’ and ‘Auto-balance’ functions in the ‘Instron Bluehill 3’ software were selected
to remove any crimp in the fiber acquired during extraction process. The ‘Pretest’ function
allows the machine to extend the fiber, but no data is reported until a small amount of load is
experienced by the load cell, which was chosen as 0.3 N for this experiment. When the load
cell experiences the specified amount of load (0.3 n), the extension up to this point is considered
due to the crimp and the ‘Auto-balance’ function adds this length with the initial length of the
fiber and then the actual test begins. All the 400 fiber samples were tested using this procedure.
The crosshead was moved at a speed of 20 mm/min, and a 1 KN load cell was used to conduct
the tensile testing. The raw data, stress-strain curve, and summary of tensile testing were
directly obtained from the ‘Instron Bluehill 3’ software and the tensile strength, elastic modulus,
and strain at break of the cattail were calculated.

42
Flax fiber samples were conditioned at 21°C temperature and 50% relative humidity for
48 hours. Once the conditioning was done, single fiber tensile testing was executed by repeating
the above procedure.
3.4 MAT CHARACTERIZATION
3.4.1 Areal density and thickness of nonwoven mat
As the area of the prepared zero punched nonwoven mat is fixed (8.5 x 8.5 inch), the weight of
the mat is measured using a weighing balance and the weight per unit area or areal density of
the mat is calculated. The thickness of each nonwoven mat was measured using a caliper. For
the needle punched mat, circular mat samples of 14 cm diameter were cut at different locations
using cutter and the weight of the sample was recorded to determine areal density (gsm – gram
per square meter).
3.4.2 Transverse permeability measurement of nonwoven mat
Frazier Permeability Tester manufactured by Fraizer Precision Instrument Co. Inc. Hagerstown,
MD. U.S.A was used in this study to determine the volumetric flow rate in nonwoven mat
following the ASTM D-737 method. In this method, the rate of airflow passing perpendicularly
through a known area of nonwoven mat is adjusted to obtain a prescribed air pressure
differential between the two mat surfaces. The transverse mat permeability is then determined
using Darcy’s law from the recorded rate of air flow.

43
A schematic diagram of the Frazier Permeability Tester is shown in Figure 3.12
indicating the essential parts of the machine (Schiefer & Boyland, 1942). The clamp for holding
the nonwoven mat as shown in Figure 3.12 against the orifice is pivoted in its supporting frame
so that it can press uniformly against the upper surface of the orifice. The inclined manometer
filled with oil indicates the pressure drop across the nonwoven mat and the vertical manometer
indicates the pressure drop across the orifice for measuring the rate of air flow. A set of nine
orifices has orifice diameters from 1 mm to 16 mm that covers the range of flow rate from 1 to
700 cubic feet per minute per square foot of fabric. The volumetric flow rate table for different
orifices and corresponding vertical manometer reading is provided in Appendix.
For permeability measurement, the rate of air flow was determined in this study for a
pressure drop (across the mat) of 0.5 inch of water according to ASTM D-737. Finally, the mat
permeability was calculated using Darcy’s law in Eq. (3.3). Fahimian (2013) investigated the
out-of-plane permeability of hemp mats using water. Hence, it is expected to have difference
in permebaility results while using two different media (Scholz et al., 2007). For comparison,
the transverse permeability of zero punched hemp mat was also investigated in this study which
is tabulated in Table 6.2.
k = Q η L
A ∆P (3.3)
Where, k = Out of plane or transverse permeability,
Q = volumetric flow rate
η = viscosity of air = 1.81 x 10⁻⁵ Pa s
A = Area of the specimen perpendicular to flow direction = 0.003788 m2
∆P = Pressure difference and L = length of mat parallel to the flow direction.

44
Figure 3.12 Schematic diagram of mat permeability measurement using air (Schiefer & Boyland, 1942).
3.5 SURFACE MODIFICATION OF CATTAIL
3.5.1 Surface modification of cattail fiber
Solution preparation: 2.5 ml of DIH and 2.5 ml of HEA were added to 95 ml of ethyl
acetate solution to prepare 2.5% DIH+HEA solution for the surface modification of cattail.
Similarly, 5 ml and 10 ml of DIH and HEA were added to 90 ml and 80 ml of ethyl acetate
solution respectively, to prepare 5% and 10% DIH+HEA solution.

45
Pad-dry-cure: For cattail fiber treatment with DIH and HEA, oven dried (100⁰C for 12
hrs) fibers were immersed in 2, 5, and 10% solution of DIH and HEA (dissolved in ethyl
acetate) for 20 min. After that, excess chemicals were squeezed out from the treated fibers using
a padding machine (Model# D394, manufactured by SDL ATLAS USA). with 4 padding cycle
and 2 kg force applied on it. Once the padding was done, cattail fibers were then dried in an
oven at 50⁰C for 5 hrs. The FTIR-ATR analysis of the chemically treated cattail fiber was done.
In addition, the change in moisture regain % in treated cattail fiber was evaluated using the
procedure as described in section 3.3.2.
3.5.2 Surface modification of cattail mat
Cattail fibers were individualized using a carding machine and a nonwoven cattail mat was
manufactured following section 3.2.3. The prepared mat was dried in an oven at 1000C for 12
hrs. 5 % (v/v) of 1,6-diisocyanatohexane (DIH), 5 % (v/v) of 2-hydroxyethyl acrylate (HEA)
were prepared by dissolving them in anhydrous ethyl acetate solution. The resulting solution
was evenly sprayed on the cattail mat. The nonwoven cattail mat coated with DIH-HEA was
then dried in an oven at 500C for 5 hrs.
3.5.3 FT-IR analysis
The surface modification of cattail fibers, caused by treating them with DIH and HEA was
investigated through Fourier-transform infrared (FT-IR) analysis using NICOLET 6700
spectrometer manufactured by Thermo Fisher Scientific, Inc. USA. The machine was
synchronised with OMNIC software for analysing the spectral data and equipped with a single
reflection Diamond ATR cell as shown in Figure 3.13. A spectral resolution of 4 cm-1 in the
mid-infrared range (500–4000 cm-1) with 120 scans was used in the analysis.

46
Figure 3.13 NICOLET 6700 spectrometer for FT-IR analysis.
3.6 COMPOSITE MANUFACTURING
Composite manufacturing was facilitated by Dr. Raghavan Jayaraman in the advanced
composite processing laboratory of Mechanical Engineering department at the University of
Manitoba. Fahimian (2013) investigated hemp composites using three different pressures (101,
260, and 560 kPa). Same consolidation pressures are also used in this study so that the results
can be compared. 101 kPa pressure (VARTM) was used to manufacture composite without any
additional compaction and 560 kPa has been chosen to achieve a much higher Vf in
manufactured composite without bleeding a lot of resins from mat and 260 kPa has been chosen
as a middle value between 101 kPa and 560 kPa.
3.6.1 Manufacturing composites using VARTM (vacuum assisted resin transfer
molding)
The needle punched nonwoven flax mat, hybrid flax-hemp mat, and prepared nonwoven cattail
fiber mat (8.5” X 8.5”) were placed on the mold surface that was already coated with a mold
release agent. The mold release agent helps for the easy removal of the cured composite part

47
from the mold. A chopped glass mat was placed at the opposite edge of the mat connecting the
mat to the vacuum port. The glass mat provides the path for the air to flow from the mat to the
vacuum port. Tacky tape was placed along the longitudinal edge of the mat to prevent race
tracking and dry spots. A re-usable silicon pad was placed over the mat to cover it and sealed
along the edges to the bottom mold using appropriate seals as illustrated in Figure 3.14 (a, b).
This silicon pad isolates the mat from the surrounding atmosphere creating a bag containing the
mat, to which vacuum could be applied. Vacuum is applied at one end of the mat and the
thermoset resin is introduced at the opposite end. STYPOL 8086 thermoset resin was prepared
in a beaker and mixed with the LUPEROX 224 curing initiator, degassed, and injected into the
mat under the action of vacuum. When the flow front, as shown in Figure 3.14 (c), traverses
the entire mat and impregnates it, the resin inlet was closed and the impregnated mat was
maintained under vacuum until the resin gelled (2 hours). Subsequently, the vacuum port as
closed and the composite was allowed to cure at room temperature overnight (24 hours).
3.6.2 Manufacturing composites by compression molding
The pressure used in VARTM is ~101 kPa. In order to study the effect of pressure, additional
mats were cured under various compression pressures. The mats impregnated using the
VARTM set-up, were removed from the mold, right after resin impregnation, and were
compression molded in a hydraulic press using different pressures. The impregnated mat
sample from VARTM was sandwiched between two release films, which were subsequently
sandwiched between two metal plates and two silicone pads and subjected to pressures of 260
and 560 kPa, using a G50 H- 24-CLX hydraulic press manufactured by WABASH MPI, IN,
USA as shown in Figure 3.15 (a). After gelation (2-3 hours) the sandwiched samples were left
inside the press for 8-10 hours to cure at room temperature (Figure 3.15 b). The cured composite
is shown in Figure 3.15 (c).

48
(a) (b)
(c)
Figure 3.14 Vacuum Assisted Resin Transfer Molding process – (a) nonwoven mat laid up in mold (b)
VARTM setup before resin impregnation (c) flow front of resin while impregnation.

49
(a) (b) (c)
Figure 3.15 (a) G50 H- 24-CLX hydraulic press machine for compression molding (b) resin impregnated
mat sandwiched among release film, metal plate, and silicon pad (c) cured composite plate in
compression molding.
3.7 DENSITY MEASUREMENT
The density of the cattail fiber, flax fiber, hemp fiber, Stypol resin, and the manufactured
composites were measured in the grain storage lab of the University of Manitoba, using Helium
Pycnometer (Model#UPY-32, UPY-32T; v-5.04 manufactured by Quantachrome
INSTRUMENTS) according to ASTM D4892-89. The Helium Pycnometer used in this study
for density measurement is shown in Figure 3.16. The calibration of Helium Pycnometer is
needed prior starting the density measurement trials. Initially, composite samples were weighed
using a very precise balance and placed further in the pycnometer using the smallest cell.
Various run parameters (target pressure, Equilibrium time, purge mode, and run mode) and
sample parameters (weight) were selected before starting the test. Three different trials were
done for each experiment and the final results were shown in pycnometer display that include
average volume, average density of composite, and standard deviation.
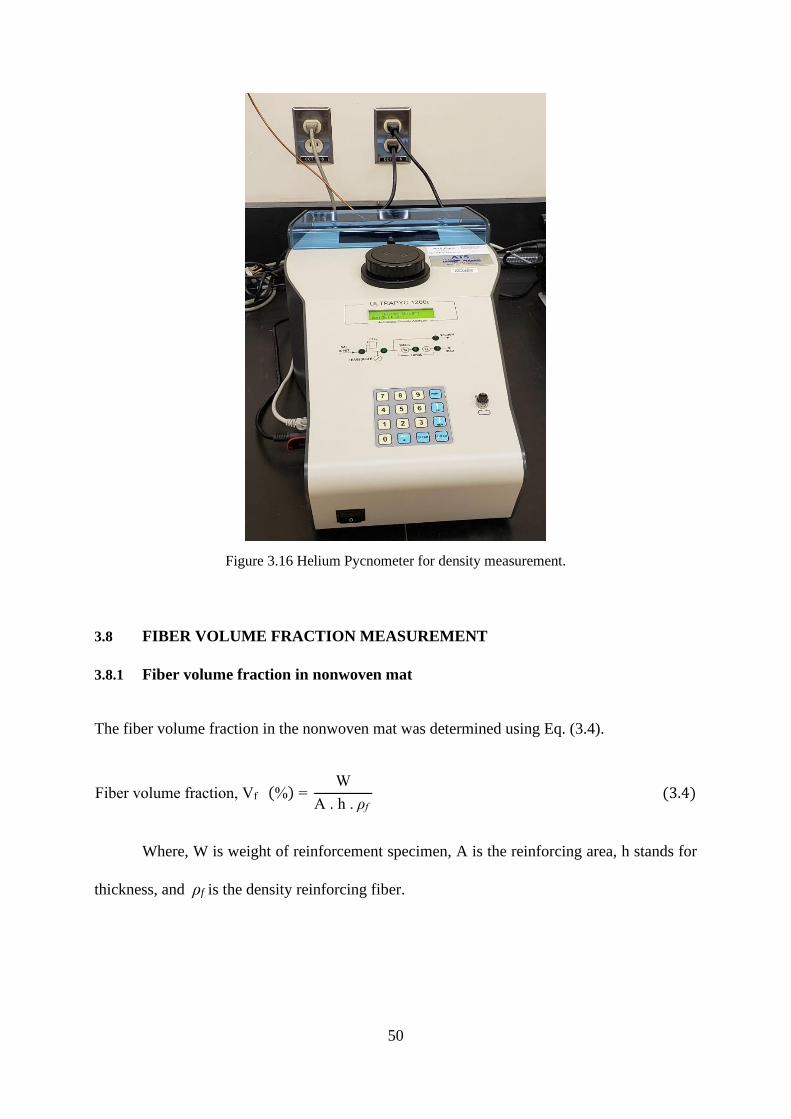
50
Figure 3.16 Helium Pycnometer for density measurement.
3.8 FIBER VOLUME FRACTION MEASUREMENT
3.8.1 Fiber volume fraction in nonwoven mat
The fiber volume fraction in the nonwoven mat was determined using Eq. (3.4).
Fiber volume fraction, Vf (%) = W
A . h . ρf (3.4)
Where, W is weight of reinforcement specimen, A is the reinforcing area, h stands for
thickness, and ρf is the density reinforcing fiber.

51
3.8.2 Fiber volume fraction of composite
The volume fraction of fibers (Vf %) in composite can be calculated using the density of
composite measured following the procedure described in section 3.9. Vf % is calculated using
Eq. (3.5), assuming 100% dense composite.
Fiber volume fraction, Vf (%) = ρc - ρm
ρf - ρm X 100 (3.5)
Where, ρf, ρm, ρc are the density of the fiber, resin, and composite respectively.
3.9 PREPARATION OF TENSILE TEST COUPONS
Composite test specimens, 127 mm in length and 20 mm in width were cut from the
manufactured panels which were tabbed, and polished before tensile testing. Prepared
composite specimens ready for tensile testing are shown in Figure 3.17.
Figure 3.17 Composite specimen (127 mm X 20 mm) sandwiched between carbon epoxy laminates for
tensile testing.

52
3.9.1 Tabbing
The composite panels manufactured in VARTM and the compression molding was bonded to
the gripped ends to avoid crushing the gripping ends while tensile testing. Tabs cut from carbon
fiber epoxy composite laminates were bonded to the edges of the composites using a room
temperature curing adhesive. Marine Epoxy (made by Lepage) glue was used in this case as it
has the capacity to endure maximum shear stress while tensile testing. The adhesive was applied
on both the carbon epoxy and composite specimen and they were allowed to cure under 15 psi
pressure for 24 hrs in G50 H-24-CLX hydraulic press.
3.9.2 Cutting
127 mm long and 20 mm wide composite test specimens were cut from the panels with bonded
tabs using Micro-Matic Precision Wafering Machine manufactured by Micromech Mfg. Corp.
The bonded panels were attached to the cutting bed using double-sided tape during the cutting
process. A slow feed rate of 10 mm/min was used to prevent excessive heat formation in the
saw and damaging of the edges of test specimens.
3.9.3 Polishing
Edges of the prepared testing coupons were ground progressively using 80, 180, 240, 320, and
400 grit silicon carbide papers and polished further using alumina powder to remove all adhered
particles. The polished test coupons were stored in lab atmosphere until testing.

53
3.9.4 Manufacturing carbon epoxy laminate tabs
The manufacturing process of carbon-epoxy composite tabs includes following steps.
I. Cutting prepreg
The carbon fiber epoxy composite laminates were fabricated using 4 plies of woven carbon
epoxy prepregs (supplied by SAE International). The woven carbon-epoxy prepreg roll was
removed from a freezer, just before use, and allowed to warm up at room temperature for 3-4
hrs. 12” X 12” prepreg layers were cut from the prepreg roll using a template.
II. Prepreg lay-up process and vacuum bag assembly
After cutting, the woven prepregs were laid up manually on an Aluminum plate. Release film,
peel ply, bleeder (Supplied by Airtech), and breather were cut to size (12” X 12”) and placed
on either side of stacked prepreg layup as shown in Figure 3.18. Before the lay-up procedure,
the tool part was coated with non-stick coating 5-6 times with a 5-minute drying interval
between each coat. The peel plies provide texture to the cured laminate surface and the bleeder
layer enables excess resin to bleed-out. The lay-up mold was then taken in the autoclave plate,
covered by a silicon pad and then placed in the G50 H- 24-CLX hydraulic press (manufactured
by WABASH MPI, IN, USA). The lower autoclave platen was connected to a vacuum pump
and the upper platen was connected to a nitrogen tank as shown in Figure 3.19.

54
Figure 3.18 Prepreg layup and vacuum bag assembly for manufacturing carbon-epoxy composites
(Chekurthi, 2018).

55
(a) (b)
Figure 3.19 Autoclave plate is connected to (a) nitrogen tank and (b) vacuum pump – while
manufacturing carbon-epoxy laminates.
III. Autoclave curing
The laid-up carbon-epoxy composite lay-up was cured using a mold simulating the autoclave
and a one-step cure cycle shown in Figure 3.20. The press was clamped down and the clamp
force was set to 23 Ton-force. The valve of the nitrogen tank was turned on and adjusted to 85
psi. The Nitrogen tank valve was turned off once the adjustment was made. The vacuum pump
was now turned on and the temperature was set to 1800C. When temperature of platens reached
80oC, the vacuum pump was turned off, the lower half was vented to atmosphere, and the
pressurized nitrogen gas was channeled into the upper part of autoclave mold to maintain a
constant pressure of 85 Psi. The epoxy resin or matrix system started flowing at 800C. The mold
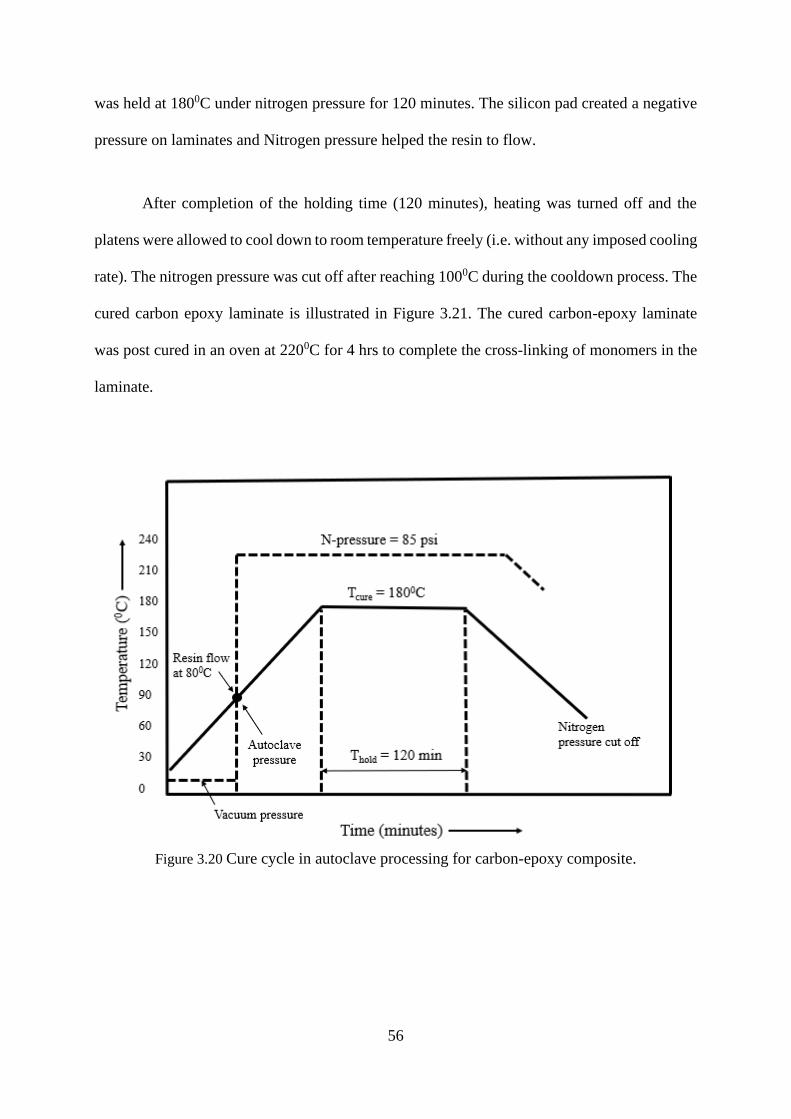
56
was held at 1800C under nitrogen pressure for 120 minutes. The silicon pad created a negative
pressure on laminates and Nitrogen pressure helped the resin to flow.
After completion of the holding time (120 minutes), heating was turned off and the
platens were allowed to cool down to room temperature freely (i.e. without any imposed cooling
rate). The nitrogen pressure was cut off after reaching 1000C during the cooldown process. The
cured carbon epoxy laminate is illustrated in Figure 3.21. The cured carbon-epoxy laminate
was post cured in an oven at 2200C for 4 hrs to complete the cross-linking of monomers in the
laminate.
Figure 3.20 Cure cycle in autoclave processing for carbon-epoxy composite.

57
Figure 3.21 Cured carbon-epoxy laminates.
3.10 TENSILE TESTING OF COMPOSITE
The mechanical properties of manufactured composite were determined using an MTS tensile
testing machine with 30 KN Load cell and 2-inch extensometer, following the ASTM D3039
method. The machine set-up for tensile testing of composite specimens in MTS with
extensometer is shown in Figure 3.22. All samples were stored in the lab atmosphere after
preparation until testing. The testing was done at a crosshead speed of 2 mm/min. Five samples
were tested for each consolidation pressure. The tensile modulus of the manufactured mat
composite was calculated from the slope of the stress-strain curve in the strain range of 0.1%.
It is to be noted that only longitudinal modulus of composite was measured in this study
as samples prepared were cut along the length of the mats. Also, the modulus of the samples
cut along the width of the mats is referred as transverse modulus. Fahimian (2013) observed
difference in experimental results between longitudinal modulus and transverse modulus for
hemp mat composite where transverse strength was more than longitudinal strength confirming
the bias in fiber orientation distribution. Hence, it is expected to get such difference for the
discontinuous fiber composites investigated on this study. Also, evaluation of modulus in each
direction is important to find out the lowest modulus value which is the key to design a material.

58
Therefore, measurement for transverse mechanical properties of flax, cattail, and flax-hemp
hybrid mat composite is recommended for future research of this study.
Figure 3.22 Tensile testing of composite specimens in MTS with extensometer.
3.11 MICROSCOPIC ANALYSIS OF MATS AND COMPOSITE
The manufactured composite surface was analysed in a microscope to understand and examine
the fiber geometry, fiber orientation, and any voids. In this study, the needle punched flax mat
and composite surface were analysed using VHX Digital Microscope - VHX-S770E
(manufactured by KEYENCE CORPORATION, Osaka, Japan) as shown in Figure 3.23.

59
Figure 3.23 VHX Digital Microscope.
3.12 SEM ANALYSIS OF COMPOSITE
The fractured surfaces of the composite specimens from the tensile test were examined in a
SEM at an accelerating voltage of 10.0 kV. A scanning electron microscope (SEM) in the
Manitoba Institute for Materials (MIM), at the University of Manitoba, was used in this study
to analyse the cross-section of the fractured surface of composite specimens. The scanning
electron microscope used in this study was FEI Quanta 650 FEG ESEM from Thermo Fisher
Company, USA as shown in Figure 3.24.
Prior to the SEM analysis, the fractured composite specimens were coated with a thin
layer of gold-palladium film (20 nm) using DESK II COLD SPUTTER ETCH UNIT under the
chamber pressure of 30 mTorr. Figure 3.25 shows that the coating operation is in progress while
depositing the Au-Pd film on the fractured surface of the composite samples.
After coating, the samples were mounted on the SEM stub for examination. The image
was collected with ETD (Everhart-Thornley detector) in HiVac at low pressure for coated

60
(100% cattail, 100% flax, and 50% flax-50% hemp fiber reinforced) composite samples. The
SEM was used for imaging at different magnifications from low to high (40x - 1000x) for the
morphological analysis of fractured surface.
Figure 3.24 Scanning electronic microscope (Courtesy – Manitoba Institute for Materials, University of
Manitoba).
Figure 3.25 Coating operation of fractured composite samples.

61
CHAPTER IV
FLAX FIBER COMPOSITES – RESULTS AND DISCUSSION
In this chapter, the experimental results for flax fiber properties, characterisation of needle
punched flax mat, properties of flax mat composite, and properties of flax-hemp hybrid mat
composite are presented. The effect of mat manufacturing parameters on flax mat structure and
evaluation of mat properties such as the areal density (GSM), thickness, fiber volume fraction,
permeability are discussed by analysing the experimental results. Subsequently, the
experimental results for the tensile modulus and the tensile strength of flax mat composite and
flax-hemp hybrid mat composite are presented and relationship between mat design and
composite properties are highlighted.
4.1 PHYSICAL AND MECHANICAL PROPERTIES OF FLAX FIBER
Random flax fibers were pulled out from different needle punched mats and physical and
mechanical properties were determined experimentally. Figure 4.1 and Figure 4.2 illustrate the
frequency distribution of fiber length and diameter respectively. Similarly, frequency
distribution for experimental tensile strength, modulus, and strain at break (%) of flax fiber are
shown in Figure 4.3, 4.4, and 4.5, respectively.
The normal frequency distribution model can be used to determine the mean value of
corresponding fiber properties (fiber length, diameter, tensile strength, modulus, and strain at
break) using Eq. (4.1), (4.2), (4.3), (4.4), and (4.5); where nf is the frequency of fibers for a
given fiber properties. The mean values of fiber length, diameter, tensile strength, modulus, and

62
strain at break (%) determined from these equations are shown in Figure (4.1), (4.2), (4.3),
(4.4), and (4.5), respectively and it could be used further for predicting properties of flax-
polyester composite.
The length of the flax fiber pulled out from nonwoven flax mat varied from 2.25 to
12.77 cm and the diameter of flax fiber varied from 20 to 192 μm. The experimental tensile
strength of flax fiber varied from 16 MPa to 597 MPa, modulus of elasticity from 1 GPa to 26
GPa, and strain at break (%) from 0.9 to 8 %. The calculated mean tensile strength and tensile
modulus value of flax fiber using normal frequency distribution is 201.54 MPa and 11.72 GPa,
respectively.
𝐴𝑣𝑔. 𝑓𝑖𝑏𝑒𝑟 𝑙𝑒𝑛𝑔𝑡ℎ, �̅� = ∑ 𝑛𝑓 𝐿𝑓
∑ 𝑛𝑓 (4.1)
𝐴𝑣𝑔. 𝑓𝑖𝑏𝑒𝑟 𝑑𝑖𝑎𝑚𝑒𝑡𝑒𝑟, �̅� = ∑ 𝑛𝑓 𝐷𝑓
∑ 𝑛𝑓 (4.2)
𝐴𝑣𝑔. 𝑡𝑒𝑛𝑠𝑖𝑙𝑒 𝑠𝑡𝑟𝑒𝑛𝑔𝑡ℎ, �̅� = ∑ 𝑛𝑓 𝜎𝑓
∑ 𝑛𝑓 (4.3)
𝐴𝑣𝑔. 𝑡𝑒𝑛𝑠𝑖𝑙𝑒 𝑚𝑜𝑑𝑢𝑙𝑢𝑠, �̅� = ∑ 𝑛𝑓 𝐸𝑓
∑ 𝑛𝑓 (4.4)
𝐴𝑣𝑔. 𝑠𝑡𝑟𝑎𝑖𝑛 𝑎𝑡 𝑏𝑟𝑒𝑎𝑘 (%), �̅� = ∑ 𝑛𝑓 𝜀𝑓
∑ 𝑛𝑓 (4.5)

63
Figure 4.1 Distribution in length of fibers in needle punched flax mat.
Figure 4.2 Distribution in diameter of fibers in needle punched flax mat.
0
2
4
6
8
10
12
14
16
18
0 1 2 3 4 5 6 7 8 9 10 11
Fre
qu
ency
Fiber length (cm)
0
5
10
15
20
25
30
0 20 40 60 80 100 120 140 160 180 200
Fre
qu
ency
Diameter (µm)

64
Figure 4.3 Distribution in tensile strength of fibers in nonwoven flax mat.
Figure 4.4 Distribution in tensile modulus of fibers in nonwoven flax mat.
0
2
4
6
8
10
12
14
0 50 100 150 200 250 300 350 400 450 500 500 600
Fre
qu
ency
Tensile Strength (MPa)
0
2
4
6
8
10
12
14
16
0 2.5 5 7.5 10 12.5 15 17.5 20 22.5 25 27.5
Fre
qu
ency
Tensile Modulus (GPa)
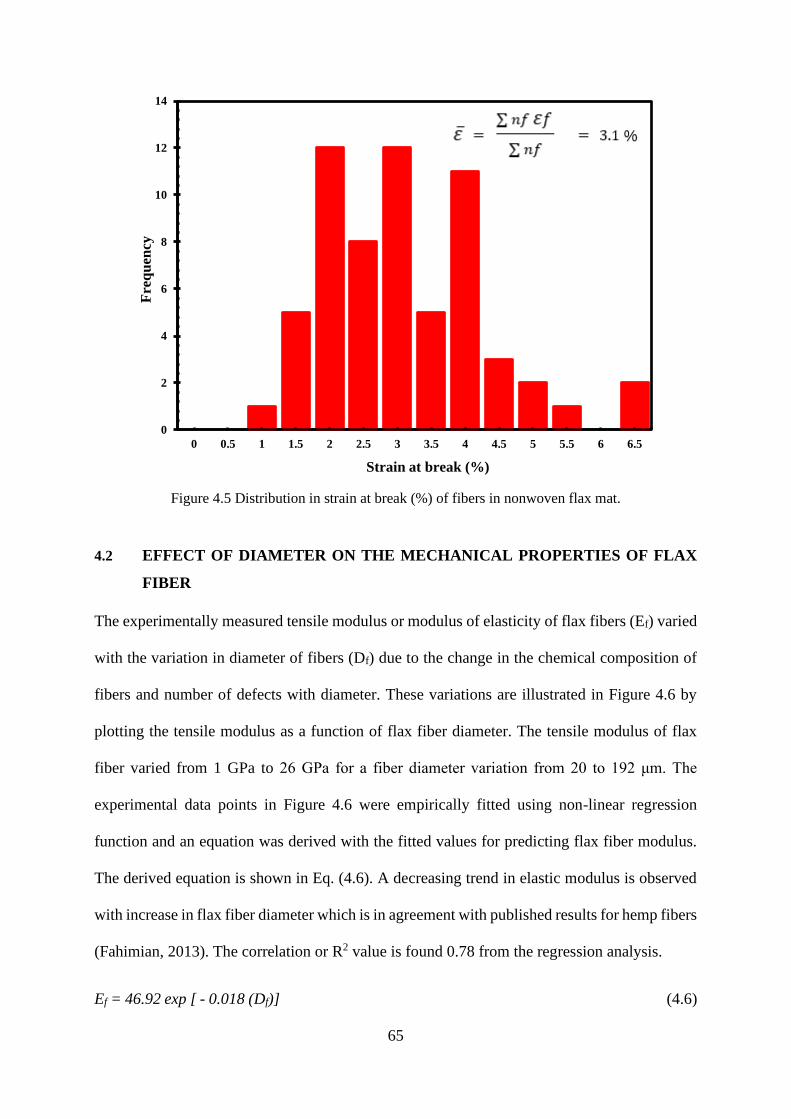
65
Figure 4.5 Distribution in strain at break (%) of fibers in nonwoven flax mat.
4.2 EFFECT OF DIAMETER ON THE MECHANICAL PROPERTIES OF FLAX
FIBER
The experimentally measured tensile modulus or modulus of elasticity of flax fibers (Ef) varied
with the variation in diameter of fibers (Df) due to the change in the chemical composition of
fibers and number of defects with diameter. These variations are illustrated in Figure 4.6 by
plotting the tensile modulus as a function of flax fiber diameter. The tensile modulus of flax
fiber varied from 1 GPa to 26 GPa for a fiber diameter variation from 20 to 192 μm. The
experimental data points in Figure 4.6 were empirically fitted using non-linear regression
function and an equation was derived with the fitted values for predicting flax fiber modulus.
The derived equation is shown in Eq. (4.6). A decreasing trend in elastic modulus is observed
with increase in flax fiber diameter which is in agreement with published results for hemp fibers
(Fahimian, 2013). The correlation or R2 value is found 0.78 from the regression analysis.
Ef = 46.92 exp [ - 0.018 (Df)] (4.6)
0
2
4
6
8
10
12
14
0 0.5 1 1.5 2 2.5 3 3.5 4 4.5 5 5.5 6 6.5
Fre
qu
ency
Strain at break (%)
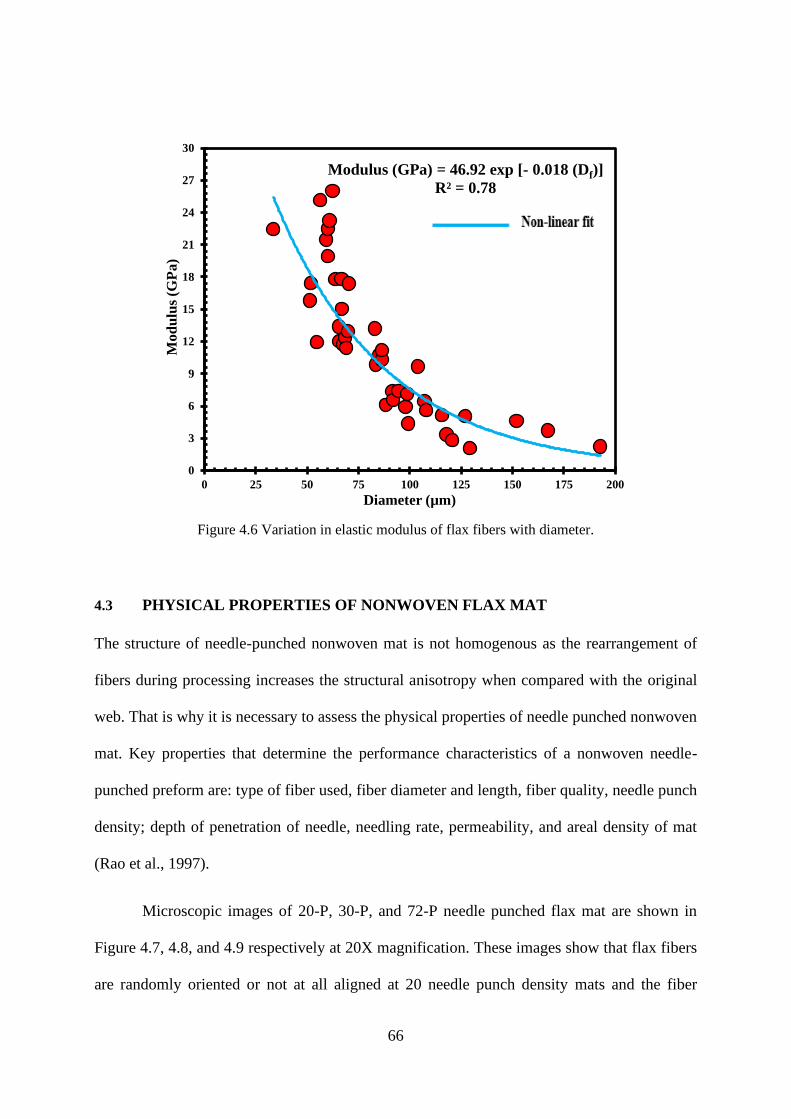
66
Figure 4.6 Variation in elastic modulus of flax fibers with diameter.
4.3 PHYSICAL PROPERTIES OF NONWOVEN FLAX MAT
The structure of needle-punched nonwoven mat is not homogenous as the rearrangement of
fibers during processing increases the structural anisotropy when compared with the original
web. That is why it is necessary to assess the physical properties of needle punched nonwoven
mat. Key properties that determine the performance characteristics of a nonwoven needle-
punched preform are: type of fiber used, fiber diameter and length, fiber quality, needle punch
density; depth of penetration of needle, needling rate, permeability, and areal density of mat
(Rao et al., 1997).
Microscopic images of 20-P, 30-P, and 72-P needle punched flax mat are shown in
Figure 4.7, 4.8, and 4.9 respectively at 20X magnification. These images show that flax fibers
are randomly oriented or not at all aligned at 20 needle punch density mats and the fiber
Modulus (GPa) = 46.92 exp [- 0.018 (Df)]
R² = 0.78
0
3
6
9
12
15
18
21
24
27
30
0 25 50 75 100 125 150 175 200
Mo
du
lus
(GP
a)
Diameter (µm)

67
orientation changes when punch density increased from 20 to 72. Theoretically, 72-P flax mat
should pick more number of in-plane fibers and re-orient them in the out-of-plane direction
while manufacturing mat. Change in fiber orientation with the change in needle punch density
could change the mechanical properties of manufactured composite. Effect of fiber orientation
on the composite properties is already discussed in section 2.2.2.
Figure 4.7 Microscopic image of 20-P flax mat at 20X magnification.
Figure 4.8 Microscopic image of 30-P flax mat at 20X magnification.

68
Figure 4.9 Microscopic image of 72-P flax mat at 20X magnification.
The physical properties of needle punched nonwoven flax mat are tabulated in Table
4.1. Areal density and thickness of mat varies for different punch density and needle depth and
the fiber volume fraction and mat permeability changes with the alteration in areal density and
mat thickness. Fahimian (2019) studied and evaluated the same properties for nonwoven hemp
mat where depth of needle penetration while needle punching process was kept constant to 8
mm. To compare these properties between nonwoven flax mat and hemp mat, the physical
properties of nonwoven hemp mat are also tabulated in Table 4.2.
The large standard deviation in the areal density of the mat points to large variation in
the areal density from one location to another location of the mat. Given the similar areal
density with large standard deviation, increasing the punch density from 20 to 30 did not change
the mat thickness. Initially flax mat thickness was higher when manufactured at zero punch
density and thickness decreased with increase in punch density observed in 20P and 30P needle
punched mat. So, it is clear that needle punching process reduces the thickness of the mats.
However, the higher flax mat thickness for 72-P mat (Table 4.1) when compared to 20 and 30

69
is believed to be due to higher starting areal density of the flax fiber web (before needle
punching) and smaller needle depth.
The fiber volume fraction of the flax mat certainly increases with needle punching when
compared with zero punched flax mat (Table 4.1), due to packing of fibers as indicated by the
lower mat thickness. However, among the needle punched flax mat, instead of increasing, the
fiber volume fraction in the mat decreases with the increase in punch density as seen in Table
4.1. For a given punch density, fiber volume fraction varied in flax mat and hemp mat as Vf %
of mat depends on the mat thickness and starting areal density.
Table 4.1 Physical properties of nonwoven flax mat.
Mat
Content
Punch
density
(p/cm2)
Depth of needle
penetration
(mm)
Areal density
of mat (g/m2),
(SD)*
Mat thickness
before
consolidation
(mm), (SD)*
Fiber volume
fraction in mat, Vf
%, (SD)*
100% Flax 0 0 931.1 (67.1) 16.3 (0.7) 3.8 (0.2)
100% Flax 20 8 814.7 (88.3) 4.6 (0.3) 11.6 (0.7)
100% Flax 30 8 823.6 (97.4) 4.7 (0.5) 11.4 (1.4)
100% Flax 72 2 885.2 (108.5) 6.8 (0.4) 8.7 (1.4)
(SD)* - Standard deviation, N = 9
Table 4.2 Physical properties of nonwoven hemp mat (Fahimian, 2015).
Mat Content Punch
density
(p/cm2)
Depth of needle
penetration
(mm)
Areal density
of mat (g/m2)
Mat thickness
before
consolidation (mm)
Fiber volume
fraction in mat,
Vf %
100% Hemp 0 8 941.3 (17.9) 12.5 (3.1) 6.6 (1.6)
100% Hemp 2.6 8 1021.6 (7) 8.1 (1.5) 8.7 (1.6)
100% Hemp 20 8 1014.8 (7) 5.75 (0.93) 11 (3.5)
100% Hemp 30 8 1113.9 (6.6) 5.39 (1.24) 15 (1.1)
100% Hemp 70 8 1241.3 (11.2) 6.8 (1.40) 12 (1.5)

70
4.4 FLAX MAT PERMEABILITY
Zero-punched and needle punched nonwoven flax mat structures are porous in nature and
hence, they are permeable. Characterization of mat permeability is necessary to understand their
effect on composite properties. The transverse permeability of the flax mat decreased initially
when punch density increased from 0 to 20 as shown in Figure 4.10. However, permeability
increased again when punch density increased further from 20 to 72. No clear trend was
observed with needle punch density and hence, the data has to be analyzed in terms of change
in void fraction with needle punching.
The experimental permeability values calculated at different punch density are plotted
as a function of corresponding mat void fraction as shown in Figure 4.11. From Figure 4.11, a
linear relationship observed in transverse permeability with the void fraction content of flax
mat indicating an increase in permeability with increase in void fraction of mat. So, out of plane
permeability investigated on this study is a function of fiber volume fraction or void fraction of
nonwoven flax mat. Since the latter is a function of punch density, the out-of-plane permeability
is a function of punch density; for a given areal density, an increase in punch density will
decrease in out-of-plane permeability. This trend was observed by Fahimian (2013) in hemp
mats. The experimental data in this figure was empirically fitted using linear regression
function. The equation of the best fitted line is shown in Eq. (4.7). The correlation or R² value
of this equation is 0.98. For a given fiber volume fraction (Vf %) of flax mat, transverse
permeability can be predicted using Eq. (4.7).
Transverse permeability, Kz = 0.27 x (1 - Vf) - 23.08 (4.7)

71
Figure 4.10 Effect of needle punch density on the transverse permeability of flax mat.
Figure 4.11 Effect of void fraction on the experimental transverse permeability of nonwoven flax mat.
0
0.3
0.6
0.9
1.2
1.5
1.8
2.1
2.4
2.7
3
0 10 20 30 40 50 60 70 80
kz
(x1
0-1
1m
2)
Punch density (punches/cm2)
Transverse permeability, Kz = 0.265 x (1 - Vf) - 23.077
R² = 0.98
0
0.5
1
1.5
2
2.5
3
88 89 90 91 92 93 94 95 96 97
Kz
(x10
-11
m2)
(1 - Vf) %

72
The out-of-plane permeability of nonwoven flax mat can be analysed using well-known
Kozney-Carman model. From well-known Kozney-Carman model, the value of C can be
determined using Eq. (4.8) (Karaki et al., 2019).
C = 0.2 x Carmen - Kozeny constant (4.8)
However, the value of C an also be determined using Eq. (4.9).
C = rf
2 (1 - Vf)3
4 Vf2 (4.9)
Where, rf is the radius of fiber and Vf is the volume fraction of fiber. The experimentally
measured permeability values of different flax mats were plotted as a function of C as shown
in Figure 4.12. The value of C was determined using the data for 0-P, 20-P, 30-P, and 72-P
mats with different fiber volume fraction. Although the fiber diameter in the mat exhibited a
distribution, the lowest diameter value reported in Figure 4.2 was used in determining the value
of “C” plotted in Figure 4.12. The relationship is smilar to that for void content.
Figure 4.12 Out of plane permeability plotted as a function of C.
0
0.5
1
1.5
2
2.5
3
0 5 10 15 20 25 30 35 40 45
Kz
(x10
-11
m2)
C (x10-9 m2)
73
4.5 DENSITY OF REINFORCING FIBERS AND RESIN
The experimentally measured density of flax fiber, hemp fiber, and stypol resin are presented
in Table 4.3. The density value of reinforcing fibers and resin matrix is required to determine
the fiber volume fraction of nonwoven mat and manufactured composite. Apparently, the
density of hemp fiber is higher than flax. Also, the recorded density value of Stypol resin in this
study is lesser than previously reported density value (1.3 gm/cm3) of stypol resin investigated
by Fahimian (2013) which is believed to be due to different formulation of polyester and styrene
unit while manufacturing.
Table 4.3 Density of reinforcing fibers and Stypol resin.
Content Density (gm/cm3) S.D (N = 3)
100% Flax 1.49 0.004
100% Hemp 1.57 0.003
Stypol 8086 1.16 0.001
4.6 FLAX FIBER REINFORCED COMPOSITE PROPERTIES
4.6.1 Effect of consolidation pressure during composite manufacturing on structure of
composite
I. Composite thickness
The consolidation pressure used in VARTM and compression molding had significant
influence on the final part thickness and fiber volume fraction of composites manufactured
using various flax mats. The measured thickness of cured plates is plotted as a function of
molding pressures in Figure 4.13. The increase in consolidation, indicated by the decrease in

74
thickness, is highest when the pressure was increased from 101 kPa to 260 kPa and the increase
was relatively gradual when the pressure was increased to 560 kPa.
Moreover, the consolidation level in cured composite varied with mat punch density as
well. Maximum consolidation was observed for zero punched flax mat composite because of
the loosely bound flax fibers in mat and decrease in consolidation observed until punch density
increased to 30 punches/cm2. However, 72-P flax mat composite exhibited higher consolidation
than those of 20-P and 30-P composite which is believed to be due to higher starting areal
density and shorter needle depth. The consolidation in 20-P and 30-P composites were found
similar.
Figure 4.13 Effect of consolidation pressure on composite thickness for various flax mats.
0
2
4
6
8
10
12
14
16
18
0 50 100 150 200 250 300 350 400 450 500 550 600
Th
ick
nes
s (m
m)
Pressure (kPa)
0-P 20-P 30-P 72-P

75
II. Density and fiber volume fraction
The density results of flax mat composite manufactured at different molding pressures are
tabulated in Table 4.4 along with their corresponding fiber volume fraction % values. The
experimentally measured fiber volume fraction of the flax mat composites is plotted in Figure
4.14 as a function of consolidation pressure. The fiber volume fraction value at zero pressure
here corresponds to Vf in zero punched dry mats before resin infiltration.
Vf of composite depends on the composite density, which in turn depends on the level
of consolidation. Hence, Vf % also varied significantly with punch density and pressure. The
fiber volume fraction increased with consolidation pressure. The rate of increase was higher
until 260 kPa compared to the increase when the pressure was increased from 260 to 560 kPa.
This is to be expected since the pressure required to compress the fiber bed would increase as
the compaction increases. Due to relatively loose binding of fibers in 0-P and 72-P flax mats,
the increase in fiber volume fraction from 0 to 560 kPa is linear and it is more than that with
20-P and 30-P flax composites. For 20-P and 30-P flax composites, maximum Vf is recorded at
260 kPa and after which didn’t compress the mat further when pressure increased to 560 kPa
resulting in no increase or decrease in Vf % 20-P and 30-P composites. At any consolidation
pressure, the fiber volume fraction differed with punch density due to differences in starting
fiber volume fraction percentage in the mat and in the consolidation behavior during
manufacturing.

76
Table 4.4 Density and fiber volume fraction percentage of flax composite at different punch density and
manufacturing pressure.
Mat content Punch density
(p/cm2)
Consolidation
pressure (kPa)
Density
(gm/cm3) (SD)*
Fiber volume fraction,
Vf %
100% Flax 0 101 1.19 (0.004) 11.2
100% Flax 0 260 1.25 (0.005) 26.9
100% Flax 0 560 1.27 (0.005) 32.6
100% Flax 20 101 1.18 (0.005) 15.6
100% Flax 20 260 1.25 (0.004) 25.8
100% Flax 20 560 1.23 (0.004) 22.5
100% Flax 30 101 1.23 (0.004) 20.9
100% Flax 30 260 1.24 (0.002) 25
100% Flax 30 560 1.24 (0.004) 23.6
100% Flax 72 101 1.22 (0.006) 18.1
100% Flax 72 260 1.24 (0.004) 24.7
100% Flax 72 560 1.26 (0.001) 31.5
(SD)* - Standard deviation, N = 5
Figure 4.14 Effect of consolidation pressure on fiber volume fraction of flax mat composite.
0
3
6
9
12
15
18
21
24
27
30
33
0 50 100 150 200 250 300 350 400 450 500 550 600
Fib
er v
olu
me f
ract
ion
, V
f%
Pressure (kPa)
0-P 20-P 30-P 72-P
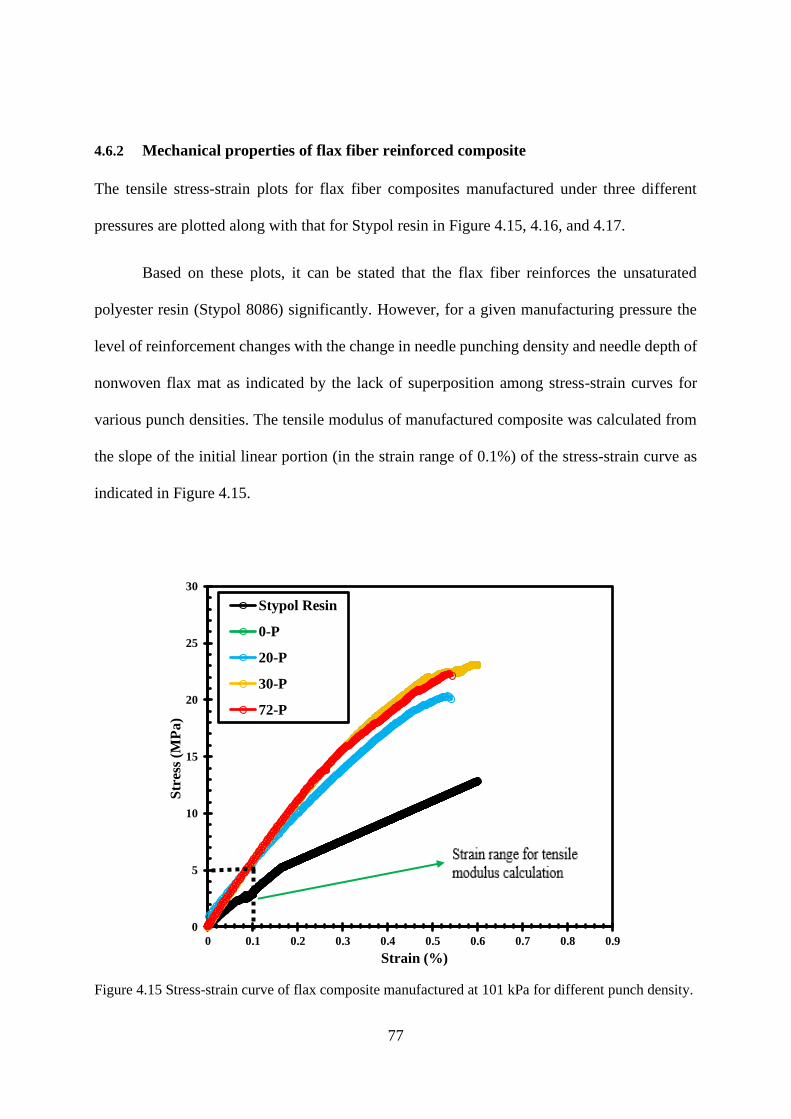
77
4.6.2 Mechanical properties of flax fiber reinforced composite
The tensile stress-strain plots for flax fiber composites manufactured under three different
pressures are plotted along with that for Stypol resin in Figure 4.15, 4.16, and 4.17.
Based on these plots, it can be stated that the flax fiber reinforces the unsaturated
polyester resin (Stypol 8086) significantly. However, for a given manufacturing pressure the
level of reinforcement changes with the change in needle punching density and needle depth of
nonwoven flax mat as indicated by the lack of superposition among stress-strain curves for
various punch densities. The tensile modulus of manufactured composite was calculated from
the slope of the initial linear portion (in the strain range of 0.1%) of the stress-strain curve as
indicated in Figure 4.15.
Figure 4.15 Stress-strain curve of flax composite manufactured at 101 kPa for different punch density.
0
5
10
15
20
25
30
0 0.1 0.2 0.3 0.4 0.5 0.6 0.7 0.8 0.9
Str
ess
(MP
a)
Strain (%)
Stypol Resin
0-P
20-P
30-P
72-P

78
Figure 4.16 Stress-strain curve of flax composite manufactured at 260 kPa for different punch density.
Figure 4.17 Stress-strain curve of flax composite manufactured at 560 kPa for different punch density.
0
5
10
15
20
25
30
35
40
45
0 0.2 0.4 0.6 0.8 1 1.2 1.4 1.6 1.8
Str
ess
(MP
a)
Strain (%)
Stypol
0-P
20-P
30-P
72-P
0
5
10
15
20
25
30
35
40
45
50
0 0.25 0.5 0.75 1 1.25 1.5 1.75 2 2.25
Str
ess
(MP
a)
Strain (%)
Stypol
0-P
20-P
30-P
72-P

79
The mechanical properties of flax fiber reinforced composite, obtained from these plots, are
tabulated in Table 4.5.
Table 4.5 Mechanical properties of flax fiber reinforced composite.
Mat
content
Needle Punch
density
(p/cm2)
Consolidation
pressure
(kPa)
Longitudinal
modulus (GPa)
(SD)*
Tensile
strength (MPa)
Strain at
break (%)
100% Flax 0 101 4.6 (0.3) 18.6 (2.8) 0.6 (0.04)
100% Flax 0 260 6 (0.3) 40.4 (3.3) 2.1 (0.3)
100% Flax 0 560 7.1 (0.5) 42.5 (2.6) 1.9 (0.2)
100% Flax 20 101 4.9 (0.2) 23.2 (2.3) 0.6 (0.1)
100% Flax 20 260 6.1 (0.8) 27.4 (2.8) 0.5 (0.03)
100% Flax 20 560 5.6 (0.5) 26.2 (2.7) 0.9 (0.2)
100% Flax 30 101 5.9 (0.5) 22.7 (0.8) 0.6 (0.04)
100% Flax 30 260 6.9 (0.5) 33.8 (3.0) 1.1 (0.2)
100% Flax 30 560 6 (0.4) 26.2 (2.8) 0.9 (0.2)
100% Flax 72 101 5.9 (0.3) 23.9 (1.1) 0.5 (0.2)
100% Flax 72 260 6.2 (0.2) 33.3 (0.8) 1.4 (0.1)
100% Flax 72 560 8 (0.7) 41.4 (2.7) 1.0 (0.2)
(SD)* - Standard deviation, N = 5
4.7 EFFECT OF PUNCH DENSITY AND MANUFACTURING PRESSURE ON
MECHANICAL PROPERTIES OF FLAX MAT COMPOSITE
In order to understand the effect of punch density and manufacturing pressure on the
mechanical properties of flax mat composite, tensile modulus is plotted as a function of punch
density in Figure 4.18 and as a function of manufacturing pressure in Figure 4.19. Similarly,
tensile strength is plotted as a function of punch density in Figure 4.20 and as a function of
manufacturing pressure in Figure 4.21. From these figures, it appears that it is difficult to

80
interpret the trend since the Vf changes with both punch density and consolidation pressure. So,
in order to interpret the data, tensile modulus and tensile strength are plotted as a function of Vf
and presented in section 4.7.1 and 4.7.2.
Figure 4.18 Variation in tensile modulus with change in punch density of flax mat composite at different
pressures.
Figure 4.19 Variation in tensile modulus with change in manufacturing pressure for various punch
density flax composite.
3
4
5
6
7
8
9
10
0 10 20 30 40 50 60 70 80
Ten
sile
Mo
du
lus
(GP
a)
Punch Density (Punches/cm2)
101 kPa 260 kPa 560 kPa
4
5
6
7
8
9
10
0 50 100 150 200 250 300 350 400 450 500 550 600
Ten
sile
Mo
du
lus
(GP
a)
Manufacturing Pressure (kPa)
0-P
20-P
30-P
72-P

81
Figure 4.20 Variation in tensile strength with change in punch density of flax mat composite at
different pressures.
Figure 4.21 Variation in tensile strength with change in manufacturing pressure for various punch
density flax composite.
0
5
10
15
20
25
30
35
40
45
50
0 10 20 30 40 50 60 70 80
Ten
sile
Str
eng
th (
MP
a)
Punch Density (punches/cm2)
101 kPa 260 kPa 560 kPa
10
15
20
25
30
35
40
45
50
0 50 100 150 200 250 300 350 400 450 500 550 600
Ten
sile
Str
ength
(M
Pa)
Manufacturing Pressure (kPa)
0-P
20-P
30-P
72-P

82
4.7.1 Tensile modulus
Since Vf varies with punch density, the experimental tensile modulus is plotted in Figure 4.22,
4.23, 4.24, and 4.25 as a function of measured fiber volume fraction of flax composite. The
data for tested each sample instead of plotting the average value for each pressure since the Vf
varied from sample to sample. As discussed in section 4.6.1 (Table 4.4), the Vf increased
monotonically with increase in pressure for 0-P and 72-P flax composite as shown in Figure
4.26; however, for 20-P and 30-P, Vf increased until the 260 kPa pressure and decreased when
the consolidation pressure further increased from 260 to 560 kPa. The tensile modulus of flax
composite followed the observed trend in Vf. For each consolidation pressure, the modulus of
tested samples for a given punch density increased with Vf, as expected. The variation in
modulus and Vf for samples manufactured and tested from the same manufactured plate, attests
to inhomogeneity in fiber distribution within the non-woven mat.
These results demonstrate that the Vf in the composite, which dictates the modulus, is a
function of consolidation behavior during manufacturing and the latter is a function of punch
density and pressure. The trend in the presented results is complicated by the variation in the
areal weight of the mat as well as heterogeneity in fiber distribution. However, for a given areal
density, increasing the punch density and the manufacturing pressure results in increase in
modulus.

83
Figure 4.22 Experimental tensile modulus of 0-P flax composite.
Figure 4.23 Experimental tensile modulus of 20-P flax composite.
4
4.5
5
5.5
6
6.5
7
7.5
8
8.5
9
0 2.5 5 7.5 10 12.5 15 17.5 20 22.5 25 27.5 30 32.5 35
Ten
sile
Mo
du
lus
(GP
a)
Vf (%)
101 kPa 260 kPa 560 kPa
0
1
2
3
4
5
6
7
8
9
0 2.5 5 7.5 10 12.5 15 17.5 20 22.5 25 27.5 30
Mod
ulu
s (G
Pa)
Vf (%)
101 kPa 260 kPa 560 kPa

84
Figure 4.24 Experimental tensile modulus of 30-P flax composite.
Figure 4.25 Experimental tensile modulus of 72-P flax composite.
0
1
2
3
4
5
6
7
8
9
10 12.5 15 17.5 20 22.5 25 27.5 30
Mod
ulu
s (G
Pa)
Vf (%)
101 kPa 260 kPa 560 kPa
0
1
2
3
4
5
6
7
8
9
10
10 12.5 15 17.5 20 22.5 25 27.5 30 32.5 35
Mod
ulu
s (G
Pa)
Vf (%)
101 kPa 260 kPa 560 kPa

85
Figure 4.26 Relationship between tensile modulus and fiber volume fraction of flax mat composite at
different punch density.
4.7.2 Tensile strength
The experimental tensile strength for each punch density and pressure is plotted in Figure 4.27,
4.28, 4.29, and 4.30 as a function of measured Vf of flax composite. The data for tested each
sample are plotted here since the Vf varied from sample to sample for each punch density and
pressure.
The trend in the effect of punch density and consolidation pressure on tensile strength
are similar to that observed for the tensile modulus of flax composite. The tensile strength of
tested samples varied by the following trend of Vf for each consolidation pressure and punch
density. The 0-P flax mat composite showed lowest and highest tensile strength at VARTM and
560 kPa pressure, respectively as shown in Figure 4.31; since 0-P composite achieved minimum
consolidation at VARTM pressure due to lower Vf of corresponding mat used while
manufacturing and achieved maximum consolidation at higher pressure (560 kPa) due to
loosely bound fibers in mat. Tested samples of 72-P flax mat composite exhibited a nearly
4
4.5
5
5.5
6
6.5
7
7.5
8
8.5
9
0 2.5 5 7.5 10 12.5 15 17.5 20 22.5 25 27.5 30 32.5 35
Mod
ulu
s (G
Pa)
Fiber Volume Fraction, Vf (%)
0-P 20-P 30-P 72-P

86
linear relationship between Vf and tensile strength while the manufacturing pressure advances
as shown in Figure 4.30. From these results, it can be seen that tensile strength is a function of
Vf which is the case for modulus as well, where Vf varied with punch density and pressure
caused by the difference in consolidation behavior.
Figure 4.27 Experimental tensile strength of 0-P flax composite.
Figure 4.28 Experimental tensile strength of 20-P flax composite.
0
5
10
15
20
25
30
35
40
45
50
55
0 2.5 5 7.5 10 12.5 15 17.5 20 22.5 25 27.5 30 32.5 35
Ten
sile
Str
eng
th (
MP
a)
Vf (%)
101 kPa 260 kPa 560 kPa
0
5
10
15
20
25
30
35
0 2.5 5 7.5 10 12.5 15 17.5 20 22.5 25 27.5
Ten
sile
Str
eng
th (
MP
a)
Vf (%)
101 kPa 260 kPa 560 kPa

87
Figure 4.29 Experimental tensile strength of 30-P flax composite.
Figure 4.30 Experimental tensile strength of 72-P flax composite.
0
5
10
15
20
25
30
35
40
45
10 12.5 15 17.5 20 22.5 25 27.5 30
Ten
sile
Mo
du
lus
(GP
a)
Vf (%)
101 kPa 260 kPa 560 kPa
10
15
20
25
30
35
40
45
50
55
0 2.5 5 7.5 10 12.5 15 17.5 20 22.5 25 27.5 30 32.5 35
Ten
sile
Str
ength
(M
Pa)
Vf (%)
101 kPa 260 kPa 560 kPa

88
Figure 4.31 Relationship between tensile strength and fiber volume fraction of flax mat composite at
different punch density.
4.8 IMAGE ANALYSIS OF FLAX COMPOSITE
Microscopic images of flax composite captured using VHX Digital Microscope at different
punch density for a given pressure (560 kPa) are provided in Appendix (Figure B.1, B.2, B.3,
and B.4). These images show a thin coat of resin at the top which exhibits a large variation in
the diameter of flax fibers within a punch density or different. Also, these images are showing
that more fibers are in-plane which increasingly orient perpendicular to plane of the image with
increase in punch density. Also, the length of the fibers is reduced as the punch density is
increased. The reduction in fiber length with increase in punch density as revealed in composite
image analysis resulted in comparatively shorter fibers in 72-P flax mat which is one of the
reasons of higher consolidation in 72-P composite than 20-P and 30-P flax composite as
discussed in section 4.6.1.
10
15
20
25
30
35
40
45
50
0 2.5 5 7.5 10 12.5 15 17.5 20 22.5 25 27.5 30 32.5 35
Ten
sile
str
eng
th (
MP
a)
Fiber volume fraction, Vf (%)
0-P 20-P 30-P 72-P

89
4.9 STATISTICAL ANALYSIS
A two way ANOVA was performed to determine the significance of variation in tensile
strength and tensile modulus of flax composite, manufactured using different punch density
mats and pressure, with fiber volume fraction (Vf). The test of significance for two way
ANOVA was carried out in SAS® University Edition software using Tukey’s LS (Least
Squares) means comparison. In this analysis, the tensile strength and tensile modulus were
considered as dependent variables and Vf of flax composite was considered as independent
variables. For pairwise comparison of the tensile strength or tensile modulus means, Tukey-
Kramer GLM procedure (LS-means) was followed at α = 0.05.
4.9.1 Tensile strength
The summary of two way ANOVA for variation of tensile strength of flax composite with Vf
is tabulated in Table 4.6. From Table 4.6, F value is equal to 33.51 and P value is less than
0.001 (<0.05). So, the results of two way ANOVA for tensile strength of flax composite reject
the null hypothesis and the variances are unequal which indicates that the effect of different Vf
or fiber content % on tensile strength is significant. The interactions among all possible pairs
of tensile strength means for different Vf is investigated and listed in Table 4.7 where Vf = 11.2
stands for 1, Vf = 15.6 for 2, Vf = 18.1 for 3, Vf = 20.9 for 4, Vf = 22.5 for 5, Vf = 23.6 for 6, Vf
= 24.7 for 7, Vf = 25 for 8, Vf = 25.8 for 9, Vf = 26.9 for 10, Vf = 31.5 for 11, Vf = 32.6 for 12
in this table. The numerical values listed in Table 4.7 indicates the P value of corresponding
pairs, respectively. For a given pair in Table 4.7, P < 0.05 indicates the tensile strength means
are Significant, P < 0.001 indicates they are highly Significant, and P > 0.05 indicates they are
not Significant. It appears that tensile strength means are significant or highly significant for
higher Vf % of flax fiber composite or when Vf is 26.9 (0-P, 260 kPa), 31.5 (72-P, 560 kPa),
and 32.6 (0-P, 560 kPa) as seen in Table 4.7.

90
Table 4.6 Summary of two way ANOVA for tensile strength of flax composite in respect to
corresponding Vf.
Source DF Sum of
Squares
Mean Square F
Value
Pr > F
Model 11 3096.58 281.51 33.51 <.0001a
Error 42 352.83 8.40
Corrected Total 53 3449.42
a P < 0.05 = Significant, P < 0.001 = Highly Significant, P > 0.05 = Not Significant (NS).
Table 4.7 The interactions among all possible pairs of tensile strength means for different Vf of
flax composite.
4.9.2 Tensile modulus
The summary of two way ANOVA for tensile modulus of flax composite in respect to
corresponding Vf is tabulated in Table 4.8. From Table 4.8, F value is equal to 12.21 and P
value is less than 0.001 (<0.05). Similar to that of tensile strength, the results of two way
ANOVA for tensile modulus of flax composite reject the null hypothesis and the variances are
Least Squares Means for effect Sample
Pr > |t| for H0: LSMean(i)=LSMean(j)
Dependent Variable: TS (Tensile Strength) i/j 1 2 3 4 5 6 7 8 9 10 11 12
1 0.4106 0.2387 0.3934 0.0317 0.2222 <.0001 <.0001 0.1896 <.0001 <.0001 <.0001
2 0.4106 1.0000 1.0000 0.9333 1.0000 0.0001 <.0001 1.0000 <.0001 <.0001 <.0001
3 0.2387 1.0000 1.0000 0.9903 1.0000 0.0004 0.0002 1.0000 <.0001 <.0001 <.0001
4 0.3934 1.0000 1.0000 0.9417 1.0000 0.0001 <.0001 1.0000 <.0001 <.0001 <.0001
5 0.0317 0.9333 0.9903 0.9417 0.9928 0.0300 0.0134 0.9994 <.0001 <.0001 <.0001
6 0.2222 1.0000 1.0000 1.0000 0.9928 0.0005 0.0002 1.0000 <.0001 <.0001 <.0001
7 <.0001 0.0001 0.0004 0.0001 0.0300 0.0005 1.0000 0.0025 0.0158 0.0320 0.0015
8 <.0001 <.0001 0.0002 <.0001 0.0134 0.0002 1.0000 0.0010 0.0368 0.0706 0.0035
9 0.1896 1.0000 1.0000 1.0000 0.9994 1.0000 0.0025 0.0010 <.0001 <.0001 <.0001
10 <.0001 <.0001 <.0001 <.0001 <.0001 <.0001 0.0158 0.0368 <.0001 1.0000 0.9712
11 <.0001 <.0001 <.0001 <.0001 <.0001 <.0001 0.0320 0.0706 <.0001 1.0000 0.9171
12 <.0001 <.0001 <.0001 <.0001 <.0001 <.0001 0.0015 0.0035 <.0001 0.9712 0.9171

91
unequal which indicates that the effect of different Vf or fiber content % on tensile modulus is
significant. Likewise tensile strength, the interactions among all possible pairs of tensile
modulus means for different Vf is investigated and listed in Table 4.9 where Vf = 11.2 stands
for 1, Vf = 15.6 for 2, Vf = 18.1 for 3, Vf = 20.9 for 4, Vf = 22.5 for 5, Vf = 23.6 for 6, Vf = 24.7
for 7, Vf = 25 for 8, Vf = 25.8 for 9, Vf = 26.9 for 10, Vf = 31.5 for 11, Vf = 32.6 for 12 in this
table. The numerical values listed in Table 4.9 indicates the P value of corresponding pairs,
respectively. For a given pair in Table 4.9, P < 0.05 indicates the tensile strength means are
Significant, P < 0.001 indicates they are highly Significant, and P > 0.05 indicates they are not
Significant. It appears that tensile modulus means are significant or highly significant for higher
Vf % of flax fiber composite or when Vf is 31.5 (72-P, 560 kPa) and 32.6 (0-P, 560 kPa) as
seen in Table 4.9. However, Vf = 31.5 (72-P, 560 kPa) exhibited significant variations in tensile
modulus means with more number of pairs than that of Vf = 32.6 (0-P, 560 kPa).
Table 4.8 Summary of two way ANOVA for tensile modulus of flax composite in respect to
corresponding Vf.
Source DF Sum of
Squares
Mean Square F Value Pr > F
Model 11 37.96 3.45 12.21 <.0001a
Error 39 11.02 0.28
Corrected Total 50 48.98
a P < 0.05 = Significant, P < 0.001 = Highly Significant, P > 0.05 = Not Significant (NS).
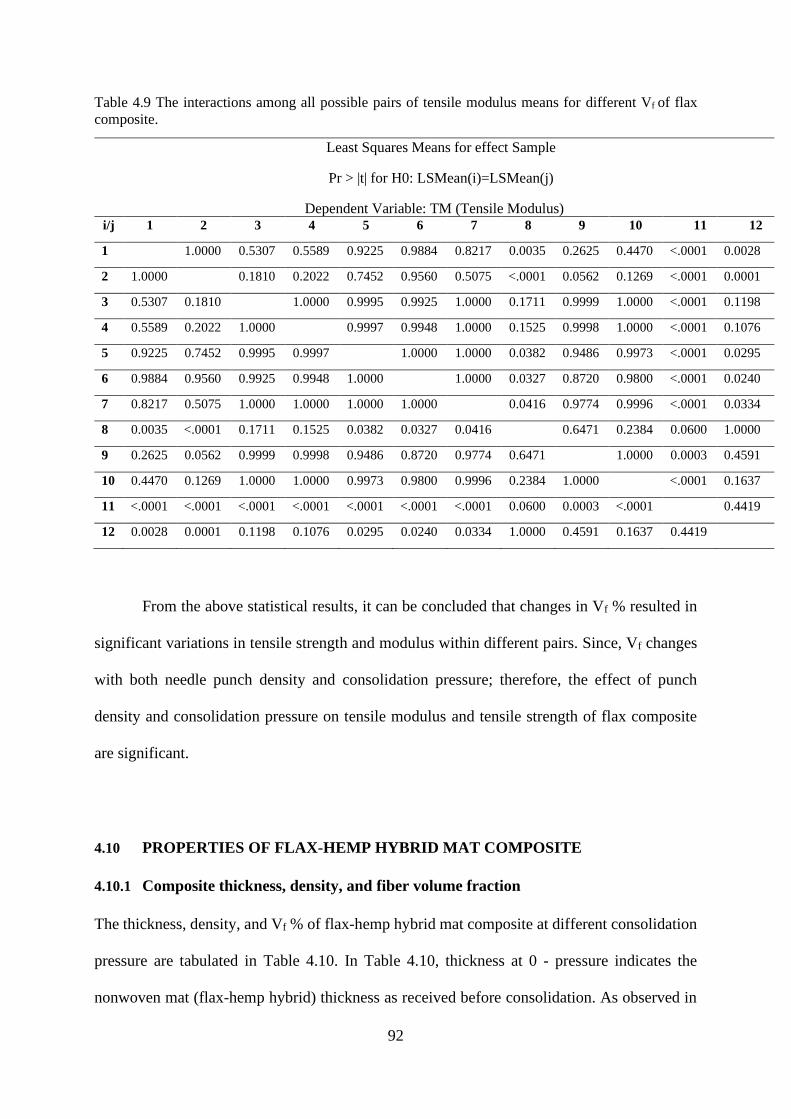
92
Table 4.9 The interactions among all possible pairs of tensile modulus means for different Vf of flax
composite.
Least Squares Means for effect Sample
Pr > |t| for H0: LSMean(i)=LSMean(j)
Dependent Variable: TM (Tensile Modulus) i/j 1 2 3 4 5 6 7 8 9 10 11 12
1 1.0000 0.5307 0.5589 0.9225 0.9884 0.8217 0.0035 0.2625 0.4470 <.0001 0.0028
2 1.0000 0.1810 0.2022 0.7452 0.9560 0.5075 <.0001 0.0562 0.1269 <.0001 0.0001
3 0.5307 0.1810 1.0000 0.9995 0.9925 1.0000 0.1711 0.9999 1.0000 <.0001 0.1198
4 0.5589 0.2022 1.0000 0.9997 0.9948 1.0000 0.1525 0.9998 1.0000 <.0001 0.1076
5 0.9225 0.7452 0.9995 0.9997 1.0000 1.0000 0.0382 0.9486 0.9973 <.0001 0.0295
6 0.9884 0.9560 0.9925 0.9948 1.0000 1.0000 0.0327 0.8720 0.9800 <.0001 0.0240
7 0.8217 0.5075 1.0000 1.0000 1.0000 1.0000 0.0416 0.9774 0.9996 <.0001 0.0334
8 0.0035 <.0001 0.1711 0.1525 0.0382 0.0327 0.0416 0.6471 0.2384 0.0600 1.0000
9 0.2625 0.0562 0.9999 0.9998 0.9486 0.8720 0.9774 0.6471 1.0000 0.0003 0.4591
10 0.4470 0.1269 1.0000 1.0000 0.9973 0.9800 0.9996 0.2384 1.0000 <.0001 0.1637
11 <.0001 <.0001 <.0001 <.0001 <.0001 <.0001 <.0001 0.0600 0.0003 <.0001 0.4419
12 0.0028 0.0001 0.1198 0.1076 0.0295 0.0240 0.0334 1.0000 0.4591 0.1637 0.4419
From the above statistical results, it can be concluded that changes in Vf % resulted in
significant variations in tensile strength and modulus within different pairs. Since, Vf changes
with both needle punch density and consolidation pressure; therefore, the effect of punch
density and consolidation pressure on tensile modulus and tensile strength of flax composite
are significant.
4.10 PROPERTIES OF FLAX-HEMP HYBRID MAT COMPOSITE
4.10.1 Composite thickness, density, and fiber volume fraction
The thickness, density, and Vf % of flax-hemp hybrid mat composite at different consolidation
pressure are tabulated in Table 4.10. In Table 4.10, thickness at 0 - pressure indicates the
nonwoven mat (flax-hemp hybrid) thickness as received before consolidation. As observed in

93
flax composite (Figure 4.13), similar trend found in flax-hemp mat composite as the decrease
in thickness is highest when the pressure was increased from 101 kPa to 260 kPa and the
decrease was relatively gradual when the pressure was increased to 560 kPa. However,
maximum consolidation for flax-hemp mat composite achieved at 560 kPa, indicated by the
lowest thickness value of composite thickness resulting in highest composite density and fiber
volume fraction recorded at 560 kPa. Thus, the change in consolidation behavior at different
pressure would affect the mechanical properties of manufactured composite as discussed in
section 4.7.
Table 4.10 Thickness, density, and fiber volume fraction of flax-hemp hybrid mat composite.
Mat content Needle
Punch
density
Consolidation
pressure
(kPa)
Composite
thickness
(mm), (SD)1
Density
(gm/cm3),
(SD)1
Fiber volume
fraction, Vf %,
(SD)1
50% Flax - 50% Hemp 0-P 0 a13.9 (0.5) -
a4.7 (0.2)
50% Flax - 50% Hemp 0-P 101 5.8 (0.2) 1.20 (0.004) 11.7
50% Flax - 50% Hemp 0-P 260 2.4 (0.07) 1.24 (0.006) 23.5
50% Flax - 50% Hemp 0-P 560 2 (0.05) 1.27 (0.007) 32.1
(SD)1 – Standard deviation, N = 5
aMat (as received) thickness and Vf %
4.10.2 Mechanical properties of flax-hemp hybrid mat composite
Figure 4.32 shows the stress-strain curve of stypol resin and the flax-hemp composites
manufactured at 101, 260, and 560 kPa. The level of reinforcement in flax-hemp composite
increases with the increase in pressure. Each stress-strain curve of flax-hemp composite was
identical as no superposition was observed among the lines at different pressures. Maximum

94
consolidation achieved and highest tensile strength of flax-hemp composite was recorded (41-
50 MPa) at 560 kPa.
Figure 4.32 Stress-strain curve for stypol resin and 0-P flax-hemp mat composite manufactured at
different pressure.
The mechanical properties of 0-P flax-hemp hybrid mat composite, obtained from these plots,
are tabulated in Table 4.11.
Table 4.11 Mechanical properties of flax-hemp hybrid mat composite.
Mat content Needle
Punch
density
Consolidation
pressure
(kPa)
Tensile
modulus
(GPa), (SD)*
Tensile
strength
(MPa), (SD)*
Strain at break
(%), (SD)*
50% Flax - 50% Hemp 0-P 101 4.8 (0.8) 19.2 (2.1) 0.5 (0.1)
50% Flax - 50% Hemp 0-P 260 6.8 (0.3) 39.5 (1.0) 1.5 (0.2)
50% Flax - 50% Hemp 0-P 560 7.8 (0.7) 47.2 (2.0) 1.7 (0.3)
(SD)* - Standard deviation, N = 5
0
10
20
30
40
50
60
0 0.2 0.4 0.6 0.8 1 1.2 1.4 1.6 1.8 2
Str
ess
(MP
a)
Strain (%)
Stypol Resin
101 kPa
260 kPa
560 kPa

95
4.10.3 Tensile strength and modulus
The experimental tensile strength and tensile modulus of flax-hemp hybrid mat composite is
plotted as a function of measured Vf % in Figure 4.33 and 4.34, respectively. An increase in
tensile strength and tensile modulus observed with increase in fiber volume fraction %
percentage of manufactured composite. A nearly linear relationship exists both in tensile
strength and tensile modulus with Vf %. Also, the change in tensile strength and tensile modulus
appears to be nearly linear with change in consolidation pressure as indicated in Figure 4.33
and 4.34, respectively. Hence, the tensile strength and tensile modulus of zero punched flax-
hemp hybrid mat composite is found to be a function of both Vf and consolidation pressure.
Figure 4.33 Relationship between tensile strength and fiber volume fraction of flax-hemp composite at
different pressure.

96
Figure 4.34 Relationship between tensile modulus and fiber volume fraction of flax-hemp composite
at different pressure.
4.10.4 Statistical analysis
A statistical test was carried out to measure the significant difference of the tensile strength and
tensile modulus in terms of fiber volume fraction of flax-hemp mat composite. Two tailed t-
test was conducted to compare the values of tensile strength and tensile of composite in terms
of fiber volume fraction measured at different consolidation pressure. T-test result for tensile
strength and tensile modulus of flax-hemp composite is summarized in Table 4.12. As seen
from the P-values among different groups containing different Vf % in Table 4.10, they all seem
to be statistically significant due to lower P-values (<0.05) at all cases which indicates change
in Vf % and change in consolidation pressure has changed the mechanical properties of
composite significantly.

97
Table 4.12 T-test results for tensile strength and tensile modulus of flax-hemp composite.
Vf % of composite Tensile strength Tensile Modulus
Group-1 Group-2 P - value tstat Result P - value tstat Result
11.7 23.5 < 0.0001 19.5 Extremely statistically
significant
0.0008 5.2 Very statistically
significant
11.7 32.1 < 0.0001 21.6 Extremely statistically
significant
0.0002 6.3 Extremely statistically
significant
23.5 32.1 < 0.0001 7.7 Extremely statistically
significant
0.0188 2.9 Statistically significant

98
CHAPTER V
CATTAIL : FIBER AND COMPOSITE CHARACTERIZATIONS – RESULTS AND
DISCUSSION
5.1 YIELD PERCENTAGE OF CATTAIL FIBER
Yield percentage of cattail fiber was recorded for different extraction processes. However, as
mentioned in section 3.2.2, 90oC temperature and 4 hrs time was considered as optimum
condition for cattail fiber yield (%), which is presented in this chapter. Cattail fiber yield %
extracted using optimum condition varied at different days or extraction number ranging from
18-30% as shown in Figure 5.1. This fibre yield (%) is less than the previously reported cattail
fibre yield by Hasan (2019), which is due to the use of green plant for the current study, whereas
Hasan (2019) used dried plants.
Extraction 1-5 and extraction 18 exhibited higher fiber yield % than that of other
extractions as shown in Figure 5.1. A test of significance was carried out in SAS using Tukey’s
mean comparison. Day to day fiber yield % values were fitted in Tukey’s mean comparison
chart to understand the significant difference. The Figure 5.2 shows the Tukey’s LS means test
of significance. The vertical bar of same color represents fiber yield % having no significant
difference. Different color bars represent that there are slight differences in the values of the
fiber yield % at different extraction stages; however, the changes are not statistically significant.
Extraction number 3 in both Figure 5.1 and Figure 5.2 showed the highest yield value which is
significantly higher than the other extraction processes. There are no significant changes
observed in extraction trial 12,13,16,6,11. Though Extraction trial 8, 10, 9, 7, 17, 14, 15, 18
showed a slight deviation in mean value but the changes were not found to be statistically
significant.

99
Figure 5.1 Yield % of cattail fiber at different stage of extraction.
Figure 5.2 Analysis of yield of cattail fiber using Tukey chart.
15%
17%
19%
21%
23%
25%
27%
29%
31%
33%
0 1 2 3 4 5 6 7 8 9 10 11 12 13 14 15 16 17 18 19
Fib
er Y
ield
(%
)
Extraction Number

100
5.2 PHYSICAL PROPERTIES OF CATTAIL FIBER
The length of the extracted cattail fiber varied between 4 to 10 cm while the diameter varied
between 13 to 53 μm. The measured value of fiber length and diameter were used to determine
the normal frequency distribution histogram. The frequency distribution was plotted as a
function of fiber length and fiber diameter as shown in Figures 5.3 and 5.4, respectively. Length
and diameter of cattail fiber were normally distributed. A normal curve was fitted through the
experimental data points using Analyse-it software in the distribution of both length and
diameter.
The average fiber length and diameter of a normal frequency distribution model were
calculated using Eq. (5.1) and (5.2) respectively, where nf is the frequency of fibers for a given
fiber length and diameter. The calculated average fiber length of cattail fiber using normal
frequency distribution is 6.98 cm and average fiber diameter is 32.1 µm. These values are close
to the mean fiber length (6.83 cm) and mean fiber diameter (30.6 µm) values of experimental
results.
�̅� = ∑ 𝑛𝑓 𝐿𝑓
∑ 𝑛𝑓 (5.1)
�̅� = ∑ 𝑛𝑓 𝐷𝑓
∑ 𝑛𝑓 (5.2)

101
Figure 5.3 Normal distribution in length of cattail fiber.
Figure 5.4 Normal distribution in diameter of cattail fiber.
0
10
20
30
40
50
60
3 3.5 4 4.5 5 5.5 6 6.5 7 7.5 8 8.5 9 9.5 10 10.5
Fre
qu
ency
Length (cm)
Normal distribution
0
10
20
30
40
50
60
70
0 5 10 15 20 25 30 35 40 45 50 55 60
Fre
qu
ency
Diameter (μm)
Normal distribution

102
5.3 FIBER CHARACTERISATION - APPLICATION OF WEIBULL
DISTRIBUTION TO STUDY THE EFFECT OF MOISTURE CONTENT ON
THE TENSILE PROPERTIES OF CATTAIL FIBER
5.3.1 Relationship between relative humidity and moisture content of cattail fiber
The moisture content value of cattail fiber at different relative humidity is measured on this
study and the relationship between MC and relative humidity (%) for cattail fiber is shown in
Figure 5.5. The moisture content of WBFs increases as the relative humidity increases, which
is in agreement with the published data for other natural cellulosic fibres (for example, flax),
where the MC is increased with the increasing RH (%) reaching a maximum value at 95% RH
(Moudood et al., 2019). It can be seen from the figure that the equilibrium moisture content
increased approximately linearly with the RH (%) up till about 70% RH and then accelerated
rapidly. This relationship can be explained using the Peirce’s two phase model where in phase
one, water molecules associated with the glucose unit in the cellulose chain [(C6H7O(OH)3]n
and in phase two, the water molecules fill the spaces available under attractive forces (Peirce,
1929). Further, the relationship appears to follow the type II sorption isotherm similar to other
cellulosic natural fibers (cotton, flax, hemp, jute, and sisal) [Xie et al., 2011].

103
Figure 5.5 Relationship between relative humidity and moisture content of cattail fiber.
5.3.2 Effect of RH (%) on the mechanical properties of cattail fiber
The mechanical properties of cattail fiber is shown in Table 5.1. For cattail fibre, with the
increase in relative humidity both tensile stress and modulus increase up to the relative humidity
of 75% and at above this point of RH% these two properties decrease. There is a slight trend of
increasing strain (%) with the increase in relative humidity. No relationship data between
relative humidity and tensile stress values was found for cattail fiber. Generally, the value of
tensile properties is increased with the increases in relative humidity conditions for bast and
cotton fibers. For cotton, the ratio of tenacity value at 100% and 65% RH is 1.11 (Morton &
Hearle, 2008) while for flax, the tensile strength is increased with the increase in relative
humidity up to 95% (Nilsson, 2006). Further analysis of the data for other bast fibres revealed
that for hemp, the highest modulus value was obtained at 80% RH while the tensile stress was
found to be at 50% RH condition (Placet et al., 2012). For flax, the optimum value is found to
be 66% RH (Stamboulis et al, 2001) while others reported the reduction in modulus at rate of
0.39 GPa/RH% when measured using the constant rate of loading principle (Davies & Bruce,
1998).
0
3
6
9
12
15
18
21
24
27
30
0 10 20 30 40 50 60 70 80 90 100
Mo
istu
re C
on
ten
t (%
)
Relative humidity (%)
M.C (%), Cattail

104
Table 5.1 Mechanical properties of cattail fiber at different relative humidity.
Relative
Humidity (%)
Tensile strength
(MPa) (S.D)*
Modulus of elasticity
(GPa)
Strain at break
(%)
11.3 486 (281) 54.9 (28.3) 1.81 (1.34)
33 833 (453) 64.4 (30.3) 1.97 (1.39)
55 963 (500) 69.2 (35.3) 1.93 (0.54)
75.5 1106 (565) 74.7 (34.4) 1.88 (0.51)
84.3 720 (495) 57.9 (40.2) 1.92 (0.69)
93.6 830 (411) 57.0 (30.1) 2.37 (0.78)
100 600 (335) 48.7 (39.6) 2.14 (0.98)
(S.D)* = Standard deviation
The large standard deviation in the mechanical properties of the cattail fiber at different
relative humidity points to a wide variation of strength and modulus from one fiber to another
(Table 5.2). This is common for all bast fibres; for example, the Young’s modulus (GPa) of
flax, ramie, hemp and kenaf fibre is reported between 27.6-80 (Li et al., 2007) and 25-160
(Joffea et al., 2003), 44-128 (Ali, 2013), 20–70 (Ali, 2013) and 75-175 (Ibrahim et al., 2018),
respectively. The wide dispersion in the mechanical properties of cattail and other natural fibers
obtained from the same stem is the result of a number of factors that include fiber extraction
and retting parameters (Foulk et al., 2003), differential fiber cross-section along the single fiber
length (Thomason et al., 2011), fiber defects like knots, thick and thin places (Sparnins, 2006)
and drying conditions prior to tensile properties measurement. Most of the factors that affect
the tensile properties can be controlled except fibre cross-section variation and defects. In this
study, it was noticed that during tensile properties measurement, the majority of the fiber did
not break at the average inserted diameter. This point is discussed later in this section.
While the tensile stress data for cattail falls within the range from previous research
group (Hasan, 2019) of Biosystems Engineering department, the modulus values are much

105
higher in this research than the previously studied modulus value. For this research, we had to
oven dry the samples at 105°C for 24 hours to measure the moisture content before tensile
properties measurement. It was noticed that the fiber samples became stiff when removed from
the oven, which might be responsible for the higher modulus values for cattail. This is supported
by the work of Hart and Summerscales (2017), who found that the modulus was doubled for
jute fiber from 650 MPa at room temperature to 1250 MPa at 180°C when the heating was
conducted for 15 minutes. Similarly, an increase in strength and modulus for thermally treated
(140°C and 190°C) flax fiber was also found by Gourier et al., (2014). Also, the high modulus
value for hemp (70 GPa, Ku at al., 2011) and kenaf (175 GPa – Ibrahim et al., 2018) was also
obtained for oven dried samples. It is possible that due to heating for such a long time, some of
the microfibrils (theoretical modulus for 100% microfibrils is 70 GPa) converted into
crystallites (theoretical modulus for 100% crystallites is 250 GPa), which is almost 3.5 times
stiffer than the microfibrils (Bledzki & Gassan, 1999). This behaviour can be further explained
by the ‘stiffening effect’ by the fringed micelle theory where due to the heat the ‘fringe’ in the
amorphous regions is found to be increased (Levine & Slade, 1988).
One of the sources of variation in mechanical properties for cattail is the diameter, as
the methodology is being used to measure the tensile properties i.e., the single fiber method
according to ASTM D 3822 (ASTM, 2020), and it is used widely to determine the modulus and
stress of natural fibrers (Li et al., 2009; Park et al., 2006; Beckermann et al., 2009; Xia et al.,
2009; Baley, 2002; Lamy & Baley, 2000; Symington et al., 2009; Virk et al., 2010). The
methodology calculates the tensile properties based on the inserted fiber diameter – this is the
point at which the fiber is theoretically predicted to break. In order to determine the exact
location of the breaking point, the two broken parts of the fiber was joined together and diameter
of these broken ends were measured. Our results showed that around 80% of fibers broke at a
point that was different from the predicted point of breakage as shown in Figure 5.6. Measuring

106
the diameter of the breakage point was also a challenge due to the irregular breakage pattern.
While most of the samples had tensile failures (fibrillary/granular/brittle nature – Figure 5.7(a)),
few samples broke with multiple splitting (Figure 5.7(b)), axial split (Figure 5.7(c)), or tensile
break with single and multiple steps at the end (Figure 5.7(d, e)). It was not possible to calculate
the accurate cross-sectional area, as cattail fibers are not exactly circular. The cross section of
the cattail fiber consists of numerous small elliptical (polygonal) cells, each about 4.5 – 6.0 µm
(Rahman et al, 2020). A similar polygonal shape in the cross-section exists in flax and hemp
fibres (Hatch, 2006). However, when we check the variation for the strain at the break (%)
which is not dependent on the fibre cross-section, it was found that the standard deviations are
also very large as shown in Table 5.1.
With this large variation in tensile properties in the cattail and since the complete
variation sources are unknown, it is essential that probability analysis be carried out. The two-
parameter Weibull distribution was conducted which is reported to have good agreement with
single fiber strength data for other natural cellulosic fibers (Joffe et al., 2003; Pan et al., 1997).
Figure 5.6 Inserted diameter and breakage point diameter at 33% RH (Canola fiber).
0
20
40
60
80
100
120
140
160
180
200
1 2 3 4 5 6 7 8 9 10 11 12 13 14 15 16 17 19 20 21 22 23 24 25 26 27 28 29 30 31 32 33 34 35 36 37 38 39 40
Dia
met
er (
µm
)
Sample number
Inserted dia
Broken point dia

107
(a) (b)
(c) (d)
(e)
Figure 5.7 (a) Granular/fibrillar break at 11% RH; (b) Fiber breakage with multiple splitting at 11% RH;
(c) Axial spit (75% RH); (d) Tensile break – multiple ends (11% RH); (e) Tensile break – (b) single end
(75% RH).
108
5.3.3 Weibull distribution and calculating Weibull parameters
Weibull distribution, which characterize an entire strength distribution rather than simply
estimate a mean strength value, widely used for modelling failure behaviour and reliability
analysis of a tested subject. The probability of failure for a random stress state can be predicted
using Weibull statistical theory when the failure statistics are known for a given stress state
(Roy et al., 2012). The cumulative distribution function of the two-parameter Weibull
distribution used in this study can be stated using eq. (5.3) (Quinn & Quinn, 2010; Barsoum,
2019).
F(x) = 1 – exp (- x/β) ɑ (5.3)
Where, F(x) is the cumulative probability of failure (Pf) of a fibre at an applied stress x, β is the
scale parameter and ɑ is the shape parameter or Weibull modulus. Considering double
logarithm of eq. (5.3), it can be simplified to eq. (5.4).
ln [ ln 1
1 - F(x) ] = ɑ ln (x) - ɑ ln (β) (5.4)
The reason for using double logarithm in the Weibull equation for strength and modulus
analysis is the ease of accessing information. The eqn. (5.4) can be compared with the straight-
line equation using linear regression (LR) and represented in the form of eq. (5.5).
Y = mX + c (5.5)
Where, Y = ln [ln (1/(1-F(x))]
X = ln (x)
c = - ɑ ln (β)
To determine the probability of failure, experimental values of tensile strength and tensile
modulus were ranked in ascending order, i=1, 2, 3, . . ., N, where N is the total number of test

109
specimens and i is the ith datum. Thus, the lowest strength or modulus for each configuration
represents the first value (i = 1), the next lowest stress value is the second datum (i = 2), etc.,
and the highest stress is represented by the Nth value. In this study the probability of failure or
F(x) is calculated based on the median rank position of the data points [19] using eq. (5.6). This
median rank estimator (we called it as Estimator 1) is the most widely used for Weibull
distribution than other probability estimators (Zafeiropoulos & Balillie, 2007).
F(x) = i -0.3
N + 0.4 (5.6)
To determine the shape parameter or Weibull modulus and scale parameter or
characteristic strength, ln [ln (1/(1-F(x))] is plotted in graph as a function of ln (strength) or ln
(modulus) of cattail fibre. Finally, a line is fitted through the plotted data points. Linear
regression analysis is used on this research to determine the Weibull parameters.
In Weibull statistical modelling, the tensile strength value would be equal to average
Weibull tensile strength (σavg) when the probability of failure is 50% (Quinn & Quinn, 2010).
Using this condition, average Weibull strength can be calculated from Weibull distribution
model. Therefore, x = σavg, when F(x) = 0.5. Putting these values in eq. (5.4) would result in
eq. (5.7)
ln [ ln 1
1 - 0.5 ] = ɑ ln (σavg) - ɑ ln (β) (5.7)
Now, eqn. (5.7) can be simplified further and for a given shape parameter (ɑ) and scale
parameter (β) average Weibull tensile strength, σavg can be determined using eq. (5.8).
Similarly, the average Weibull tensile modulus of cattail fibre, Eavg is determined.
σavg = exp [ɑ ln (β) - 0.3665]
ɑ (5.8)

110
Reliability analysis can also be evaluated using Weibull statistical model. For a given
shape parameter or Weibull modulus (ɑ), and scale parameter (β), the probability of survival
can be determined by Benard's approximation using eq. (5.9).
R(x) = 1 – F(x) = 1- i - 0.3
N + 0.4 = exp (- x/β)ɑ (5.9)
Where, R(x) is the reliability or the probability of survival of the variable x.
5.3.4 Weibull analysis of tensile strength of cattail fiber at different relative humidity
conditions
The plot between ln [ln (1/(1-F(x))] and ln (Tensile strength) is represented in Figures 5.8. The
Weibull shape parameter (ɑ), scale parameter (β), average Weibull tensile strength (σavg) and
coefficient of determination of tensile strength (R2σ) of the Weibull distribution of cattail fiber
at different relative humidity conditions are given in Table 5.2.
The Weibull tensile strength (σavg) closely follows experimental tensile strength of
cattail fiber (Tables 5.2) at different R.H. The correlation coefficient (R2σ) is greater than 0.90
in all conditions. This R2σ is used to determine whether the tensile properties data for cattail
fiber follow Weibull distribution by calculating the critical value of R2 with a 95% significant
level (R20.05) using eq. (5.10) (Tiryakioglu et al., 2009).
R20.05 = 1.0637 –
0.4174
n0.3 (5.10)
Where R20.05 is the critical value for R2 and n is the number of samples for each relative
humidity condition. The value for R20.05 is also given in Table 5.2. All except one of the
calculated R2 values from the Weibull plot is larger than the critical R20.05 for cattail fiber.
Further, in order for data to follow the Weibull distribution, the Weibull shape parameter should
be greater than 0.5 (Monterio et al., 2013; NCSS Statistical Software, nd) and all the shape

111
parameter data are higher than this threshold value (Table 5.2), which is discussed further in
the following section. Therefore, it was determined that the tensile properties come from the
Weibull distribution.
The Weibull shape parameter (ɑ) for cattail ranged from 1.67 to 1.99. The shape
parameter was the highest at 93.6% R.H. Higher shape parameter values are preferable in the
Weibull distribution model as a lower shape parameter value indicates higher scattering in
tensile strength whereas a higher value designates lower variability in the tensile strength [30].
The values of (ɑ) when measuring tensile strength are found to be 1.19 for jute (gauge length:
20 mm) (Xia et al., 2009), 2.48 for kenaf (gauge length: 20 mm) (Ibrahim et al., 2018), 3.7 for
sisal (gauge length: 20 mm) (Silva et al., 2008), and 2.6 for flax (gauge length: 10 mm, 140°C
treated) (Gourier et al., 2014). One of the reasons for slightly higher shape parameter for other
bast fibers, is that the authors used lower gauge length (10 to 20 mm) than the used in the current
study (25 mm).
The probability of survival calculated using eq. (5.9) was plotted as a function of
experimental tensile strength values to understand the reliability of tested specimen as shown
in Figures 5.8 for cattail fibers. The experimental tensile strength values of cattail fiber
corresponding to 50% probability of survival ranges between 500 – 1000 MPa (Figure 5.9).
These range values lie within the average tensile strength values at different R.H (Table 5.2).
The differences in tensile strength at different humidity conditions seem to be reduced to a great
extent when the probability of survival increases. The survival probability in terms of tensile
strength is the highest at 75% relative humidity for cattail fiber. However, for engineering
applications, the higher strength values from these conditions should be counter institutive.

112
Table 5.2 Weibull parameters of tensile strengths for cattail fiber at different relative humidity based on
Weibull distribution model.
R.H (%) ɑ β (MPa) σavg (MPa) R2σ
aR0.05
11 1.67 551 443 0.99 0.92 (38)
33 1.87 953 783 0.98 0.92 (39)
55 1.93 1098 908 0.98 0.93 (41)
75 1.94 1259 1043 0.97 0.93 (42)
84 1.76 804 653 0.97 0.93 (40)
93 1.99 948 789 0.97 0.93 (41)
100 1.85 677 556 0.99 0.93 (40)
a:number of samples in the parentheses;
Figure 5.8 Weibull plots of the tensile strength of cattail fiber at different relative humidity.
-4.5
-3.5
-2.5
-1.5
-0.5
0.5
1.5
2.5
4 4.5 5 5.5 6 6.5 7 7.5 8 8.5
ln[l
n (
1/1
-F)]
ln (Tensile strength)

113
Figure 5.9 Reliability analysis of tensile strength of cattail fiber at different relative humidity using
Weibull distribution.
5.3.5 Weibull analysis of elastic modulus of cattail fiber at different relative humidity
conditions
The values of the Weibull parameters (ɑ and β), and average Weibull elastic modulus (Eavg)
obtained from ln[ln(1/1-F)] versus ln(elastic modus) for cattail fiber are shown in Figure 5.10.
These parameters are listed in Table 5.3. The predicted average elastic modulus (Eavg) follows
closely with the experimental modulus with the R2E being 0.95 or higher.
The shape parameter (ɑ) for the elastic modulus of cattail fibre ranges between 1.73 to
2.49 with the top two values (2.49 and 2.38) belonging to 33.0 and 75% R.H. The Weibull
shape parameter (ɑ) for cattail falls within the values for flax (1.64-2.14, Ahmed, 2017) and
Curaua fiber (1.59 – 2.23, Monteiro et al., 2013). The lower Weibull shape parameters for
WBFs and BFs indicated larger variability in the modulus than the synthetic fibers as a much
higher value was recorded for Nextel 312 (4.6) and Nextel 610 (10.5) (Chawlaw & Kerr, 2005).

114
The reliability analysis for the elastic modulus of cattail fiber using Weibull distribution
is presented in Figures 5.11 and is determined by plotting the probability of survival and
experimental elastic modulus. The elastic modulus corresponding to a 50% probability of
survival lies within the mean values listed in Table 5.3. The survival probability in terms of the
elastic modulus was found to be the highest at 75% relative humidity for cattail and canola
fibers.
Table 5.3 Comparison of Weibull parameters and elastic modulus of cattail fiber at different relative
humidity based on experimental data and Weibull distribution model.
RH (%) ɑ β (GPa) Eavg (GPa) R2σ
aR0.05
11 2.18 62.23 52.58 0.96 0.92(38)
33 2.49 72.37 62.44 0.96 0.92(37)
55 1.95 79.1 65.56 0.98 0.93(41)
75 2.38 84.41 72.35 0.97 0.93(41)
84 1.79 62.69 51.09 0.99 0.93(40)
93 1.99 64.32 53.51 0.98 0.93(44)
100 1.73 51.07 41.34 0.95 0.93(41)
a:number of samples in the parentheses;

115
Figure 5.10 Weibull plots of the elastic modulus of cattail fiber at different relative humidity.
Figure 5.11 Reliability analysis of elastic modulus of cattail fiber at different relative humidity using
Weibull distribution.
-4.5
-3.5
-2.5
-1.5
-0.5
0.5
1.5
2.25 2.75 3.25 3.75 4.25 4.75 5.25
ln[l
n (
1/1
-F)]
ln(Tensile modulus)

116
5.3.6 Effect of fiber length on Weibull distribution (cattail fiber)
Three different cattail fiber lengths (25 mm, 35 mm, and 45 mm) were chosen to determine the
length effect on the Weibull distribution. The mechanical properties and Weibull parameters
are shown in Table 5.4. The Weibull parameters calculated from the ln(ln(1/1-F)) versus
ln(Tensile strength) plot are given in Figure 5.12. The Weibull modulus is slightly better for 35
mm and 45 mm lengths compared to 25 mm, however, the R2σ is better for 25 mm length data.
The effect of length result on the Weibull Modulus in the current study is in agreement with
other published results that used similar fiber length (Naik & Fronk, 2016; Pan et al., 1997).
This is because the effect of defect beyond a specific gage length and larger strain rate (100
mm-1) does not follow the Weakest Link Theory. However, others found an increase in the
Weibull modulus and tensile strength with the increasing gage length. For example, Xia et al.
(2009) reported a Weibull Modulus of 2.18 and 1.19 for 5 mm and 20 mm gage length jute
fiber.
Using such a shorter fiber length to predict the performance of natural fiber composites,
particularly those that are made from needle punched non-woven fabric, would be inaccurate.
During needle punched non-woven fabrication, the fibers must reach the bottom of the fabric
with the needle to make the pillar structure, which is formed when the needle is capable of
bridging the fibers that makes a stich structure (Ishikawa et al, 2019). These stich structures are
essential because they absorb the external force applied to the fabric. Usually, 40 to 80 mm
long fibres are required to make needle punched non-woven fabrics as the longer fibers increase
the fabric grab strength (Ghosh et al., 1994), fiber to fiber cohesion and fiber interlock (Hearle
& Sultan, 1968) and decrease air permeability (Luenenschloss, 1972). Most importantly, it was
found that about 33% of the fiber strength is utilized in a needle-bonded fabric (Hearle & Sultan,
1968).

117
Although the Weibull modulus (shape of the slope) is the lowest for the shorter gage
length test, for all (Table 5.4), the characteristics strength (distribution location) is increased
with the increasing fiber length (Figure 5.13). Usually, a lower Weibull modulus demonstrate
that the samples are more likely to break at lower stress, however, this is not the case as the
experimental tensile strength and Weibull characteristics strength decreased with the increasing
gage length (Table 5.4). This indicates the flaws present in all three specimen sets; however,
the types of flaw may be different as can be seen from their breakage pattern (Figures 5.7).
These multiple flaws might contribute to the breakage as well as cause the wriggle effects in
the survival graph (Figure 5.13). Further, the characteristics strength for the shorter length
samples is high due to these specimens being highly stressed. While this behaviour is more
pronounced at the higher strength data points, at the lower strength data points and at 98%
reliability the values are almost similar (≈155 MPa) (Figure 5.13). This is due to the use of the
LR method that ‘chases’ the lower strength data points (Quin & Quin, 2010).
Table 5.4 Effect of fiber length on the Weibull Parameters of cattail fiber.
Fibre
length
(mm)
Mechanical Properties Weibull Parameters
Tensile
strength
(MPa)
Tensile
modulus
(GPa)
Strain at
break
(%)
Shape
parameter
(ɑ)
Scale
parameter
(β, MPa)
Weibull tensile
strength (σavg,
MPa)
R2σ R2
0.05
25 787.3 (386.9) 61.9 (19.4) 3.1 (2.6) 1.5 1906 1493 0.98 0.87
35 737.4 (254.3) 67.1 (19.8) 1.8 (0.5) 1.77 1626 1321 0.86 0.87
45 600.2 (274.9) 56.4 (23.6) 2.2 (1.7) 1.66 998 800 0.96 0.87

118
Figure 5.12 Weibull analysis of tensile strength of virgin cattail fiber using different fiber length.
Figure 5.13 Reliability analysis of tensile strength of cattail fiber for different fiber length using Weibull
distribution.
-4
-3.5
-3
-2.5
-2
-1.5
-1
-0.5
0
0.5
4.5 5 5.5 6 6.5 7 7.5 8
ln(l
n (
1/1
-F))
ln(Tensile strength)
0.4
0.5
0.6
0.7
0.8
0.9
1
100 300 500 700 900 1100 1300 1500
PR
OB
AB
ILIT
Y O
F S
UR
VIV
AL
TENSILE STRENGTH, MPa
25 mm
35 mm
45 mm

119
5.3.7 Effect of estimator on the Weibull distribution (cattail fiber)
The probability index was also calculated by three other estimators given in eq. 5.11 (Hazen’-
Estimator 2), eq. 5.12 (Mean Rank – Estimator 2) and eq. 5.13 (Small Sample – Estimator 4)
and the Weibull parameters calculated are given in Table 5.5. Probability estimators 1, 2 and 4
produced an almost similar ɑ as well as R2σ while E3 revealed larger variation (lower ɑ) in the
samples, particularly at 33% and 84% relative humidity samples. Also, R2σ values for these
two RH (%) samples are lower than for other relative humidity samples. The predicted values
for strength (σavg) are almost close to each other for all four estimators, however, the most
conservative estimation (lowest) was obtained from the probability estimator E3 and the
predicted strength value is the lowest at the 11% RH condition. Conservative strength estimates
are preferred for engineering applications. Also, the goodness-of-fit value for cattail fibre at
11% relative humidity is the highest (0.99) of any other RH conditions for all four estimators
that is obtained from LR analysis of ln [ln (1/(1-F(x))] and ln (Tensile strength).
Estimator 2 (Hazen’s):
𝑃(𝜎) =𝑖 − 0.5
𝑛 (5.11)
Estimator 3 (Mean Rank):
𝑃(𝜎) =𝑖
𝑛 + 1 (5.12)
Estimator 4 (Small Sample):
𝑃(𝜎) = 𝑖 −
38
𝑛 + 0.25 (5.13)

120
Table 5.5 Effect of different estimators on the Weibull parameters.
RH
(%)
Estimator 2 Estimator 3 Estimator 4
ɑ β σavg R2σ ɑ β σavg R2
σ ɑ β σavg R2σ
11 1.74 547.9 443.8 0.99 1.59 555.3 441 0.99 1.69 549.8 442.9 0.99
33 1.92 948.8 783.2 0.98 1.32 1004 759.6 0.91 1.41 988.7 762.6 0.92
55 1.96 1093 906.9 0.98 1.8 1106 902.6 0.98 1.92 1097 905.9 0.98
75 2.01 1254 1045 0.96 1.86 1266 1039.6 0.97 1.97 1258 1044 0.97
84 1.8 801.2 653.8 0.97 1.15 886.2 644.2 0.83 1.78 803.4 653.5 0.97
93 1.63 980.6 782.6 0.91 1.93 951.7 787.1 0.97 2.01 946.9 788.9 0.97
100 1.92 674.9 557.5 0.98 1.77 681.2 553.6 0.99 1.87 676.2 556.1 0.99
This study examined the effects of pre-moistened cattail fiber on their breaking strength
and Young’s modulus. Both tensile strength and modulus data were successfully described with
a 2-parameter Weibull distribution for cattail using the widely used Bernard’s median rank
approximation estimator (E1). The tensile stress data was further validated using three other
estimators. The Weibull modulus of cattail fiber is similar to those of flax and hemp when
compared with the similar test length. The predicted tensile strength (σavg) and modulus (Eavg)
closely follow the experimental values for all relative humidity conditions. However, the
predicted values at 11% relative humidity is the most conservative for cattail fiber, the
goodness-of fit is the highest for cattail fiber for four estimators. At this relative humidity, the
value of strength at 50% reliability is 442 MPa and 245 MPa while the value of the modulus is
52.9 GPa and 25.9 GPa for cattail fiber. At 90% reliability, the value for strength and modulus
is reduced to 155 MPa and 20 GPa respectively. The 90% reliability values for strength and
modulus for cattail fibre is within the strength range of hemp when compared with the similar
diameter fiber and measurement technique (Shahzad, 2013) and hemp as quoted by
(Gurunathan et al., 2015).

121
The Weibull modulus was lower for shorter gage length (25 mm), although the
experimental strength, modulus and characteristics strength are higher as the gage length
increased. Taking the results of the gage length, future research should be conducted by using
the appropriate (40 to 80 mm) fiber length that is used to make needle punch non-woven fabric
for composite applications. Finally, the variation and survival probability of cattail fiber are
comparable with the bast fibers.
5.4 INFLUENCE OF FIBER DIAMETER ON THE MECHANICAL PROPERTIES
OF CATTAIL FIBER
A dependence between the mechanical properties and fiber diameter has been found in previous
studies for natural fibers which indicated an inverse relationship between mechanical properties
(e.g. elastic modulus and tensile strength) and fiber diameter (Baley, 2002; Charlet et al., 2007).
The increase in fiber diameter results in a decrease in tensile strength for flax fiber stated by
Andersons et al., (2005) in terms of Weibull statistics because the larger fibers of flax fall more
prematurely than the smaller fibers as the probability of containing a defect is higher in larger
fibers.
For cattail, the experimentally measured tensile modulus or modulus of elasticity (Ef)
varied with the variation in diameter of cattail fibers (Df). These variations are illustrated in
Figure 5.14 by plotting the tensile modulus as a function of cattail fiber diameter. The tensile
modulus of cattail fiber exhibits a larger variation as mentioned in Table 5.1. The experimental
data points in Figure 5.2 were empirically fitted using the non-linear regression function and an
equation was derived with the fitted values for predicting the cattail fiber modulus using fiber
diameter. The derived equation is shown in eq. (5.12). From Figure 5.14, a decreasing trend in
modulus is observed with the increase in cattail fiber diameter which is in agreement with the
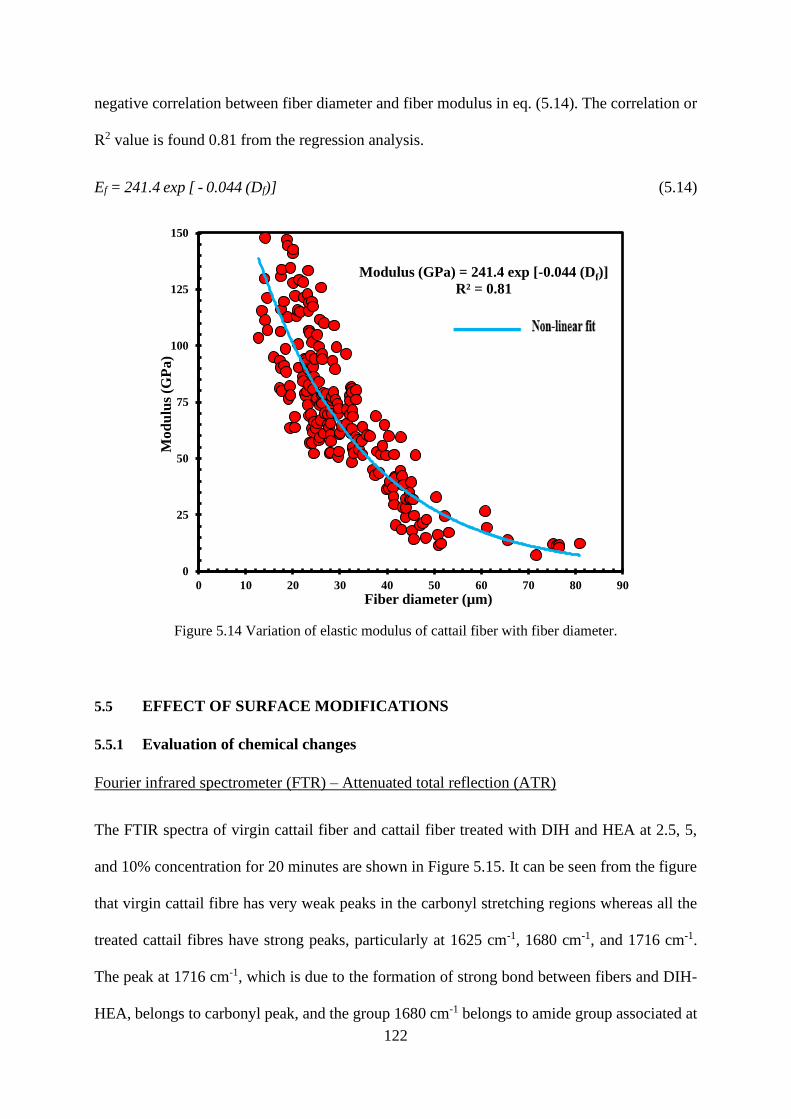
122
negative correlation between fiber diameter and fiber modulus in eq. (5.14). The correlation or
R2 value is found 0.81 from the regression analysis.
Ef = 241.4 exp [ - 0.044 (Df)] (5.14)
Figure 5.14 Variation of elastic modulus of cattail fiber with fiber diameter.
5.5 EFFECT OF SURFACE MODIFICATIONS
5.5.1 Evaluation of chemical changes
Fourier infrared spectrometer (FTR) – Attenuated total reflection (ATR)
The FTIR spectra of virgin cattail fiber and cattail fiber treated with DIH and HEA at 2.5, 5,
and 10% concentration for 20 minutes are shown in Figure 5.15. It can be seen from the figure
that virgin cattail fibre has very weak peaks in the carbonyl stretching regions whereas all the
treated cattail fibres have strong peaks, particularly at 1625 cm-1, 1680 cm-1, and 1716 cm-1.
The peak at 1716 cm-1, which is due to the formation of strong bond between fibers and DIH-
HEA, belongs to carbonyl peak, and the group 1680 cm-1 belongs to amide group associated at
Modulus (GPa) = 241.4 exp [-0.044 (Df)]
R² = 0.81
0
25
50
75
100
125
150
0 10 20 30 40 50 60 70 80 90
Mo
du
lus
(GP
a)
Fiber diameter (µm)
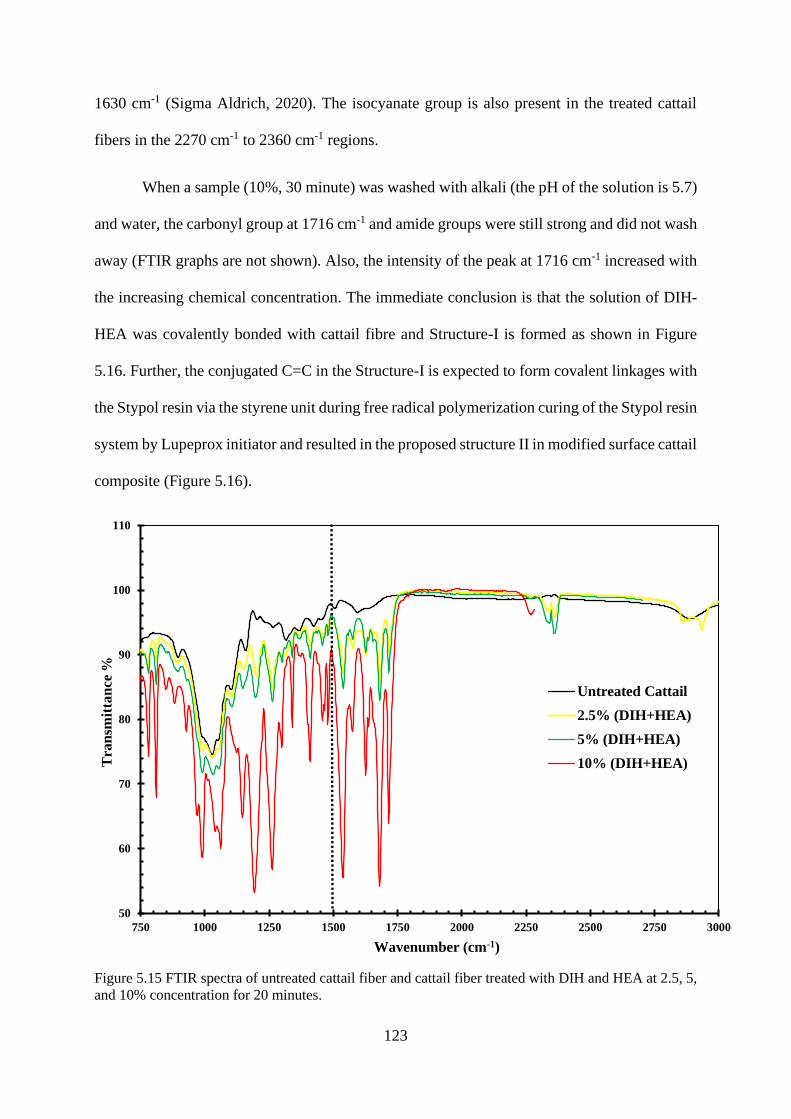
123
1630 cm-1 (Sigma Aldrich, 2020). The isocyanate group is also present in the treated cattail
fibers in the 2270 cm-1 to 2360 cm-1 regions.
When a sample (10%, 30 minute) was washed with alkali (the pH of the solution is 5.7)
and water, the carbonyl group at 1716 cm-1 and amide groups were still strong and did not wash
away (FTIR graphs are not shown). Also, the intensity of the peak at 1716 cm-1 increased with
the increasing chemical concentration. The immediate conclusion is that the solution of DIH-
HEA was covalently bonded with cattail fibre and Structure-I is formed as shown in Figure
5.16. Further, the conjugated C=C in the Structure-I is expected to form covalent linkages with
the Stypol resin via the styrene unit during free radical polymerization curing of the Stypol resin
system by Lupeprox initiator and resulted in the proposed structure II in modified surface cattail
composite (Figure 5.16).
Figure 5.15 FTIR spectra of untreated cattail fiber and cattail fiber treated with DIH and HEA at 2.5, 5,
and 10% concentration for 20 minutes.
50
60
70
80
90
100
110
750 1000 1250 1500 1750 2000 2250 2500 2750 3000
Tra
nsm
itta
nce
%
Wavenumber (cm-1)
Untreated Cattail
2.5% (DIH+HEA)
5% (DIH+HEA)
10% (DIH+HEA)

124
Figure 5.16 Proposed reactions in the DIH-HEA-treated cattail fibers and cattail-stypol composites.
5.5.2 Evaluation of moisture regain of the treated samples
Hydrophilic or hydrophobic characteristics of treated cattail fiber can be examined by
understanding their behaviour when exposed to different moisten conditions. For the moisture
regain measurement, nine different samples were prepared that included three different
concentrations (2.5, 5, and 10%) of DIH-HEA and three different immersion times (10, 20, and
30 min) at each concentration condition. Treated cattail fiber along with a virgin cattail fiber
sample were dried in an oven at 105 °C for 24 hrs and kept in a desiccator having 11% relative
humidity. The 11% relative humidity was chosen because this condition should be used for the
fiber condition before any mechanical test for composite application as discussed in Section
5.13. The moisture regain value of virgin and treated cattail fiber was recorded after 24 hrs
desiccation at 11% RH. The moisture regain values of treated cattail fiber were plotted as a
function of concentration % in Figure 5.17 for the different immersion time. For treated fibers,
the maximum recorded moisture regain value is 1.8 % and the lowest value is 0.93 %, which
are lower than the moisture regain of virgin cattail fiber (2.3 %) in this experiment. HEA is a
long chain carbonyl compound, which is hydrophobic in nature (Stavber & Stavber, 2010). The

125
incorporation of carbonyl groups in cattail fiber while under chemical treatment improves the
hydrophobic nature of cattail fiber, which resulted in a decrease in the moisture regain value of
the treated cattail fiber. The rate of decrease in moisture regain of the treated fiber increases
when the concentration of DIH-HEA increased from 2.5 to 10 % as seen in Figure 5.17. Also,
for a given concentration, the moisture regain value of the treated cattail fiber decreases with
the increase in immersion time. However, differences of regain value at different immersion
times become less prominent at 10 % concentration. Overall, the water behaviour of DIH-HEA
treated cattail fiber follows the behaviour of treated hemp (Qiu et al., 2011), bamboo (Liu et
al., 2014), and flax (Arbelaiz et al., 2005).
Figure 5.17 Moisture regain of treated cattail fiber at different DIH-HEA concentration and immersion
time.
0
0.2
0.4
0.6
0.8
1
1.2
1.4
1.6
1.8
2
0 1 2 3 4 5 6 7 8 9 10 11 12
Mois
ture
Reg
ain
(%
)
Concentration (%)
10 min
20 min
30 min

126
5.6 CATTAIL MAT CHARACTERIZATION
5.6.1 Density of cattail fiber
The experimental density value of cattail fiber measured from helium Pycnometer is found to
be 1.39 gm/cc (Table 5.6). Looking at the density values, it appears that cattail fiber is lighter
than flax (1.49 g/cc, Table 4.5 ) and hemp (1.57 g/cc, Table 4.5) fiber which could be because
of the hollow fiber structure of cattail (Rahman et al, 2020). This phenomenon also can be seen
in the SEM micrographs (Figures 5.35-5.39).
Table 5.6 Density of cattail fiber.
Content Density (gm/cc) S.D (N=3)
100% Cattail 1.39 0.005
5.6.2 Physical properties of non-woven cattail mat
The areal density, mat thickness, permeability, and fiber volume fraction percentage of
nonwoven mats are the key parameters that determines the mat design and influences the
mechanical properties of manufactured composites. The physical properties of nonwoven
cattail mats are listed in Table 5.7. Table 5.8 shows a comparison of properties among flax,
hemp, and flax hemp mats.
The large standard deviation in areal density in cattail mats is due to the uneven fiber
distribution that occurred while laying up the fibers manually during mat preparation before
making zero punched nonwoven. Comparing the mat properties of zero punched 100% flax,
100% hemp and 50%flax+50% hemp (Table 5.8) with the 100% cattail mat (Table 5.7), it can
be stated that the areal density of all four fibers and fiber combination are nearly the same. The
thickness of the nonwoven mat is higher for cattail when compared to flax, hemp, and flax-

127
hemp blended mats. Since, all these mats were subjected to a similar dead-weight force, the
higher thickness of cattail mat indicates low compaction achieved after dead-weight
application. This is believed to be due to the higher length of cattail fibers used in making mats
compared to that of flax and hemp mats. A bundle of individualized cattail and flax fibers is
illustrated in Figure 5.19. This could be also due to the nature of cattail fiber as cattail is slightly
less flexible when compared to flax and hemp fiber. Regardless of fiber content, all these mats
are thicker than the 20, 30, and 72 punch density flax mats despite having similar areal density
which indicates that the needle punching process reduces the thickness of mats (discussed in
Chapter 4).
Cattail fiber had the least fiber volume fraction among all these mats. The fiber volume
fraction percentage (Vf) in the manufactured nonwoven mat depends on the mat thickness, areal
density, and density of fiber content. For a given areal density, the cattail fiber could result in a
higher fiber volume fraction % where all the mats are manufactured in similar thickness as the
density of cattail is low compared to flax and hemp fiber. For the fibers with a similar density,
a higher starting areal density and lower thickness of mat would result in higher Vf (%). The
fiber volume fraction percentage of the nonwoven cattail mat was plotted as a function of
corresponding mat thickness in Figure 5.18. Instead of the mean values with standard deviations
(N=3), the raw data of thickness and permeability for various cattail mats are plotted in Figure
5.18 which showed a nearly inverse relationship between them although the neat Vf (%) of mat
as a whole would depend on other factors as well as those discussed above.
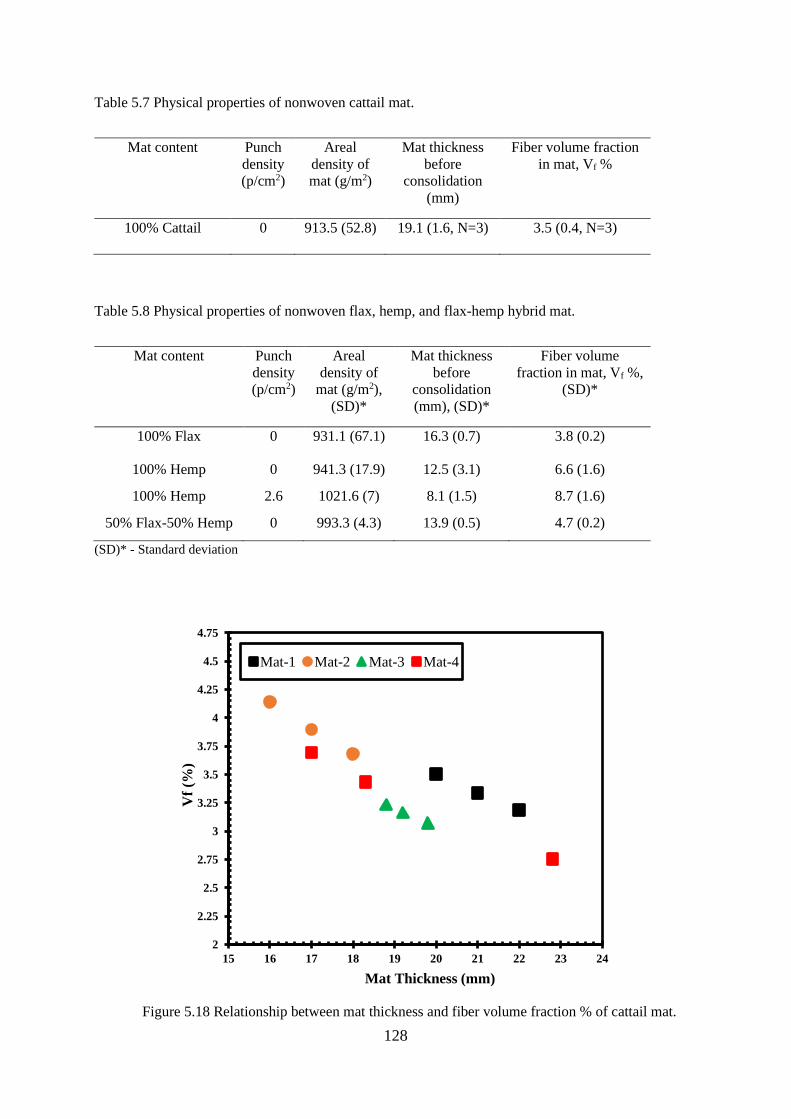
128
Table 5.7 Physical properties of nonwoven cattail mat.
Mat content Punch
density
(p/cm2)
Areal
density of
mat (g/m2)
Mat thickness
before
consolidation
(mm)
Fiber volume fraction
in mat, Vf %
100% Cattail 0 913.5 (52.8) 19.1 (1.6, N=3) 3.5 (0.4, N=3)
Table 5.8 Physical properties of nonwoven flax, hemp, and flax-hemp hybrid mat.
Mat content Punch
density
(p/cm2)
Areal
density of
mat (g/m2),
(SD)*
Mat thickness
before
consolidation
(mm), (SD)*
Fiber volume
fraction in mat, Vf %,
(SD)*
100% Flax 0 931.1 (67.1) 16.3 (0.7) 3.8 (0.2)
100% Hemp 0 941.3 (17.9) 12.5 (3.1) 6.6 (1.6)
100% Hemp 2.6 1021.6 (7) 8.1 (1.5) 8.7 (1.6)
50% Flax-50% Hemp 0 993.3 (4.3) 13.9 (0.5) 4.7 (0.2)
(SD)* - Standard deviation
Figure 5.18 Relationship between mat thickness and fiber volume fraction % of cattail mat.
2
2.25
2.5
2.75
3
3.25
3.5
3.75
4
4.25
4.5
4.75
15 16 17 18 19 20 21 22 23 24
Vf
(%)
Mat Thickness (mm)
Mat-1 Mat-2 Mat-3 Mat-4

129
Figure 5.19 Individualised cattail and flax fiber for preparing zero punched nonwoven mat.
5.6.3 Cattail mat permeability
Mat permeability (transverse permeability or out of plane permeability or through-the-thickness
permeability) is one of the most significant properties of nonwoven materials for the application
in dry filtration. The permeability in a nonwoven cattail mat determines the rate of flow of resin,
the amount of resin impregnated, and the mold filling time during resin transfer molding. The
higher permeability in the mat helps to reduce the mold filling time and increase the rate of
flow during VARTM process. The transverse permeability of each cattail mat was recorded at
three different locations prepared for manufacturing composite at different pressures. The mean
values of transverse mat permeability for each cattail mat and corresponding Vf % of the mat
is listed in Table 5.9.
The transverse permeability of the zero punched cattail mat (Table 5.9) is higher than
those of zero punched flax and flax-hemp hybrid mats (Table 5.10). The transverse permeability
or out of plane permeability depends on several factors, for example – thickness of mat, fiber
volume fraction, and area of reinforcement specimen. The higher permeability values of the

130
cattail mat compared to those of flax and flax-hemp hybrid mats (Table - 5.9, 5.10) is believed
to be due to the higher thickness and lower Vf of the cattail mat as shown in Tables 5.7- 5.8).
Further comparison among these three fibers is given in Chapter – 6 (Section – 6.2).
To understand the effect of Vf and void fraction content of mats on the transverse
permeability, the experimental permeability values are plotted as a function of corresponding
mat void fraction content as shown in Figure 5.20, which exhibits a non-linear increase of mat
permeability with the increase of void fraction and it would be the opposite when plotted against
the Vf % of the mat. So, the out of plane permeability of the cattail mat is a function of Vf and
void fraction content of cattail mat. However, the error in the experimental values of the cattail
mat permeability appears to be very much less at the void fraction content indicating a higher
permeability-void fraction correlation. So, it could be stated that mat permeability increases
with the decrease in Vf % of the mat which is the possible reason for the higher out of plane or
transverse permeability value of the cattail mat compared to those of flax and flax-hemp mats
(Tables - 5.9, 5.10) despite having a smaller diameter in the cattail fiber when compared to flax
and hemp (Table 6.1).
Table 5.9 Transverse permeability of cattail mat and corresponding Vf % of mat prepared for
manufacturing composite at different pressures.
Mat content Pressure
(kPa)
Fiber volume
fraction in mat, Vf
(%),(SD)1
Transverse permeability,
k x (10-11) (m2), (SD)1
100% Cattail 101 3.2 (0.06) 5.9 (0.03)
100% Cattail 260 3.9 (0.1) 4.7 (0.2)
100% Cattail 560 3.3 (0.1) 4.9 (0.3)
(SD)1 – Standard deviation, N = 3

131
Table 5.10 Transverse permeability of flax and flax-hemp hybrid nonwoven mat.
Mat content Punch density
(p/cm2)
Transverse permeability,
kz x (10-11) (m2), (SD)1
100% Flax 0 2.5 (0.04)
50% Flax-50% Hemp 0 2.3 (0.1)
(SD)1 – Standard deviation, N = 3
Figure 5.20 Effect of void fraction content on the experimental transverse permeability of cattail mat.
5.7 COMPOSITE PROPERTIES
5.7.1 Effect of consolidation pressure during manufacturing on structure of composite
Since the cattail non-woven mat was prepared with a zero needle punch, numerous problems
were faced to make a homogeneous cattail-resin composite structure, particularly in the
VARTM pressure. The zero punched nonwoven cattail mats used in this study were prepared
in a lab where the fiber distribution was uneven across the mat when compared to needle
4
4.25
4.5
4.75
5
5.25
5.5
5.75
6
6.25
96 96.1 96.2 96.3 96.4 96.5 96.6 96.7 96.8 96.9
kz
(10
-11
m2)
(1-Vf) %

132
punched non-woven flax mats that are manufactured by the needle loom technique. For the zero
punched cattail mat at VARTM pressure (101 kPa), resin quickly flew through the higher
porous regions and filled the mold immediately leaving the less porous region of the mat not
infiltrated with resin. As a result, it caused dry spots in the cured composite as shown in Figure
5.22. Such problem was not observed for the needle punched (20-P, 30-P and 72-P) flax mat at
VARTM pressure (Figure 5.21).
(a) (b)
Figure 5.21 Cured flax composite manufactured at VARTM pressure for (a) 20-punch density and (b)
30-punch density mat.
Figure 5.22 Dry spots in cured zero punched cattail mat composite manufactured at VARTM pressure.

133
However, the cured composite didn’t show up any dry spots in the compression
molding process when manufactured from the same zero punched nonwoven mat at 260 and
560 kPa pressures. The uniformity of the uneven resin impregnated mat from VARTM
improved when sandwiched between a silicon pad, metal plate, and release film in the
compression molding process, therefore more uniform cured composites developed as the
silicon pad and metal plate usually compensate on the thickness non-uniformity of cured
composite (figure not shown here). Moreover, the higher pressure used in the compression
molding made the excess resin to be squeezed out thus filling the dry spots and voids in the
mat. A cured cattail composite manufactured in compression molding process at 260 kPa is
shown in Figure 5.23.
To overcome this problem in the VARTM process, a good control over resin flow and
mold filling time while manufacturing is required. This was obtained by using the vertical glass
strand that connects the vacuum pump in the VARTM setup to control the rate of resin flow.
Further, a thinner (22.5 mm) glass strand mat in vertical direction was used instead of 45 mm
which prolong the mold filling time by reducing the speed of resin flow. Also, the vacuum
pump was allowed to run at least for 10 minutes before resin impregnation to exhaust all the air
trapped inside and to identify any leakage in the VARTM set up.

134
Figure 5.23 Cured cattail composite manufactured in compression molding process at 260 kPa.
5.7.2 Composite thickness
The consolidation pressure used in VARTM and compression molding had a significant
influence on the final part thickness of cattail-reinforced composites manufactured using
various mats. The thickness of the nonwoven cattail mat at zero consolidation pressure and the
thickness of cured cattail composite plates at different consolidation pressures are plotted as a
function of molding pressures as illustrated in Figure 5.24. The increase in consolidation,
indicated by the decrease in thickness, is highest when the pressure was increased from 101
kPa to 260 kPa. However, the rate of increase was relatively gradual when the pressure was
increased from 260 to 560 kPa. Higher variation in thickness was observed before consolidation
(virgin mat) (standard deviation: 1.6, Table 5.7) which was reduced to a significantly lower
value in the final cured composite at 260 (standard deviation: 0.04 mm, Figure 5.24) and 560
kPa pressure (standard deviation: 0.04 mm, Figure 5.24).

135
Figure 5.24 Effect of consolidation pressure on composite thickness during manufacturing.
5.7.3 Density and fiber volume fraction of composite
The density results of the cattail mat composite (obtained from helium Pycnometer)
manufactured at different molding pressures are tabulated in Table 5.11 along with their
corresponding fiber volume fraction % values. The experimentally measured fiber volume
fraction of the cattail mat composites is plotted in Figure 5.25 as a function of consolidation
pressure. In this figure, the fiber volume fraction value at zero pressure corresponds to the fiber
volume fraction in zero punched dry mats before resin infiltration. Although the Vf (%)
increased with the consolidation pressure as expected, the rate of increase varied with the
change in manufacturing pressure. The maximum fiber volume fraction value is observed for
the cattail mat composite when the manufacturing pressure increased from 101 to 260 kPa. It
appears that the maximum compaction achieved at 260 kPa for the cattail mat composite and
Vf % decreased at 560 kPa as seen in Figure 5.25.
Although the cattail mat composite with a modified surface (DIH-HEA treated fibers)
was manufactured at 260 kPa, the fiber volume fraction of the untreated composite (Vf %: 30.4)
0
3
6
9
12
15
18
21
0 50 100 150 200 250 300 350 400 450 500 550 600
Th
ick
nes
s (m
m)
Consolidation pressure (kPa)
19.1 mm, SD:1.6
6.0 mm, SD:0.8
2.74 mm, SD: 0.04
2.22 mm,
SD:0.04

136
that was also manufactured at 260 kPa, is higher than that of the treated composite (Vf %: 26.1).
This could be due to the lower starting areal density (shown in Table 5.11) of the treated mat
composite. The fiber volume fraction % of the manufactured cattail composite truly depends
on the density of the composite. The higher density value would result in a higher fiber content
in the composite. On the other hand, the mat design or properties of the nonwoven mat, such as
the areal density, and the fiber content highly influence these density values. The
experimentally measured density values of composites are plotted in Figure 5.26 as a function
of their corresponding mat fiber volume fraction % respectively which exhibits a linear
relationship between Vf % of nonwoven mat and composite density. From Figure 5.26, it is
seen that an untreated cattail mat composite was manufactured from a mat had 3.91 % fiber
content in it whereas the treated one from a mat had 3.3 % fiber content in it which is the
possible reason for the low density value and low Vf % of the treated cattail mat composite
manufactured at 260 kPa.
Table 5.11 Density and fiber volume fraction of cattail composite at different manufacturing pressure.
Mat content Needle
Punch
density
(p/cm2)
Consolidation
pressure (kPa)
Starting areal
density of Mat
(gm/m2)
Composite
density
(gm/cm3)
Fiber volume
fraction in
composite (Vf %)
100% Cattail 0-P 101 845.3 1.19 (0.002) 11.2
100% Cattail 0-P 260 921.2 1.23 (0.005) 30.4
100% Cattail 0-P 560 974 1.22 (0.002) 26.1
100% Cattail
(Modified surface)
0-P 260 873.2 1.22 (0.005) 26.1

137
Figure 5.25 Effect of consolidation pressure on fiber volume fraction of cattail mat composite.
Figure 5.26 Relationship between fiber volume fraction % of nonwoven mat and composite density.
0
5
10
15
20
25
30
35
0 50 100 150 200 250 300 350 400 450 500 550 600
Vf%
Consolidation pressure (kPa)
Untreated mat composite
Treated mat composite
1.18
1.19
1.2
1.21
1.22
1.23
1.24
3 3.1 3.2 3.3 3.4 3.5 3.6 3.7 3.8 3.9 4
Com
posi
te D
esn
ity (
gm
/cm
3)
Vf % (cattail mat)
Untreated Cattail mat
Treated cattail mat

138
5.7.4 Stress-strain curve
The mechanical properties of the composites would mostly depend on the nonwoven design,
composite manufacturing parameters, fiber content and interfacial bonding strength between
the matrix and fiber. The unsaturated polyester resin used with the cattail reinforcing system
influences the characteristics of the composite as well. The mechanical properties of the
unsaturated polyester resin depend on the type of crosslinking monomer used during synthesis,
their chemical structure, and molecular weight (Chabros, 2019). The modulus of the unsaturated
polyester resin varied from 1 to 2.6 GPa (Chabros, 2019; Davallo, 2010).
The mechanical properties of the manufactured cattail composite are tabulated in Table
5.12. The corresponding stress value of the cattail fiber reinforced composite manufactured at
different molding pressures and the stress value of stypol resin obtained from experimental
tensile testing results is plotted as a function of strain to fit the stress-strain curve (Figure 5.28).
Also, a representative tensile stress-strain curve for cattail fiber is shown in Figure 5.27.
Comparing the stress-strain curve of pure polyester resin (Stypol) with the cattail fiber
reinforced composite curve, it can be stated that the cattail fiber reinforced the neat resin
significantly, however, the level of reinforcement or stress-strain behavior of the cattail fiber
reinforced composite varied with the manufacturing pressure.
The level of reinforcement was less for 101 kPa when compared to 260 kPa and 560
kPa. As mentioned in section 5.4.3, the maximum compaction was achieved at 260 kPa for the
cattail mat composite which could be understood from the stress-strain curve at 260 and 560
kPa. The cattail composite exhibited a similar level of reinforcement at 260 and 560 kPa as the
curves at both pressures superposed and they could barely be distinguished from each other.
However, the line fitted for the cattail composite with a treated surface was slightly steeper than
those of the untreated composite indicating an increase in the reinforcement level for the treated
composite.
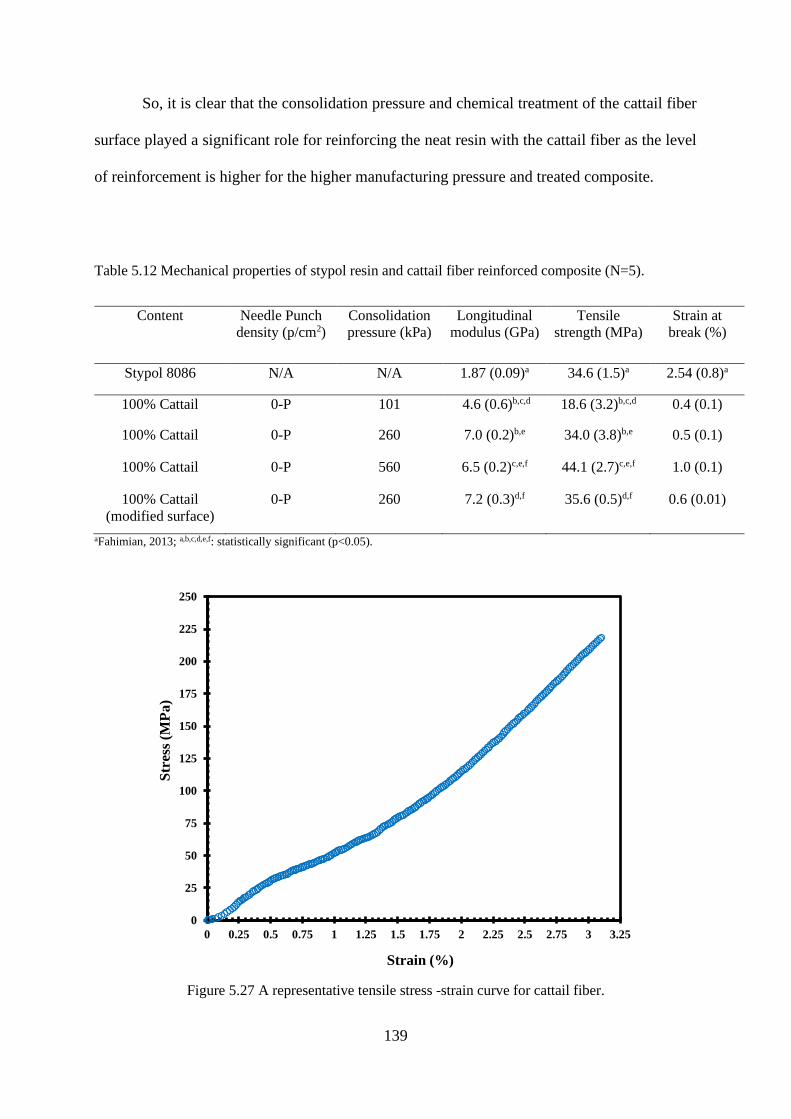
139
So, it is clear that the consolidation pressure and chemical treatment of the cattail fiber
surface played a significant role for reinforcing the neat resin with the cattail fiber as the level
of reinforcement is higher for the higher manufacturing pressure and treated composite.
Table 5.12 Mechanical properties of stypol resin and cattail fiber reinforced composite (N=5).
Content Needle Punch
density (p/cm2)
Consolidation
pressure (kPa)
Longitudinal
modulus (GPa)
Tensile
strength (MPa)
Strain at
break (%)
Stypol 8086 N/A N/A 1.87 (0.09)a 34.6 (1.5)a 2.54 (0.8)a
100% Cattail 0-P 101 4.6 (0.6)b,c,d 18.6 (3.2)b,c,d 0.4 (0.1)
100% Cattail 0-P 260 7.0 (0.2)b,e 34.0 (3.8)b,e 0.5 (0.1)
100% Cattail 0-P 560 6.5 (0.2)c,e,f 44.1 (2.7)c,e,f 1.0 (0.1)
100% Cattail
(modified surface)
0-P 260 7.2 (0.3)d,f 35.6 (0.5)d,f 0.6 (0.01)
aFahimian, 2013; a,b,c,d,e,f: statistically significant (p<0.05).
Figure 5.27 A representative tensile stress -strain curve for cattail fiber.
0
25
50
75
100
125
150
175
200
225
250
0 0.25 0.5 0.75 1 1.25 1.5 1.75 2 2.25 2.5 2.75 3 3.25
Str
ess
(MP
a)
Strain (%)

140
Figure 5.28 Stress-strain curve for stypol resin and cattail mat composite manufactured at different
pressure.
5.7.5 Tensile modulus
The stress-strain graphs from the tensile test results show a non-linear relationship (Figure
5.28). The tensile modulus of manufactured composite was calculated from the slope of the
stress-strain curve from the initial linear portion (in the strain range of 0.1%) as indicated in
Figure 5.28. In order to verify the modulus calculation, a line was fitted to data points up to
0.1% strain using the linear regression function. The correlation (R2) values between the fitted
lines and experimental data points for up to 0.1% strain range is found to be 0.999 for all four
cattail composites.
The experimentally determined longitudinal modulus of cattail composites
manufactured at different manufacturing pressures are plotted in Figure 5.29 as a function of
corresponding fiber volume fraction (Vf %) values which were tabulated in Table 5.11. The
0
5
10
15
20
25
30
35
40
45
0 0.1 0.2 0.3 0.4 0.5 0.6 0.7 0.8 0.9 1
Str
ess
(MP
a)
Strain (%)
Stypol Resin
101 kPa
260 kPa
560 kPa
Treated - 260 kPa

141
measured fiber volume fraction in each of the tested samples for a single compaction pressure
varied. The Vf of cattail composites increased with the consolidation pressure, however, the
increase was linear until pressure increased to 260 kPa and it followed a decreasing trend when
the pressure was further increased to 560 kPa. The difference in Vf observed at 260 and 560
kPa pressure depends on the fiber length, fiber distribution, orientation, starting areal density,
and fiber fraction of the corresponding nonwoven mats that were manufactured. The maximum
Vf % for the cattail composite (30.4%) was observed at 260 kPa pressure. Despite having a
lower volume fraction value for treated composite than those of the untreated cattail composite
at 260 kPa, the treated composite exhibited a higher modulus value as shown in Figure 5.29.
This indicates the enhancement of cattail composite mechanical properties due to chemical
treatment on the cattail mat (a proposed mechanism is given in Figure 5.16).
Apparently, the tensile modulus of the cattail mat composite is a function of Vf. A line
was fitted through the experimental tensile modulus data points of the untreated cattail
composite in Figure 5.29 using a linear regression function. The equation of the best fitted line
is shown in Eq. (5.13). The correlation or R² value of this equation is 0.997. For a given fiber
volume fraction (Vf %), the tensile modulus of cattail composite can be predicted using eq.
(5.15).
Tensile Modulus, Ec = 0.1274 x Vf % + 3.1918 (5.15)
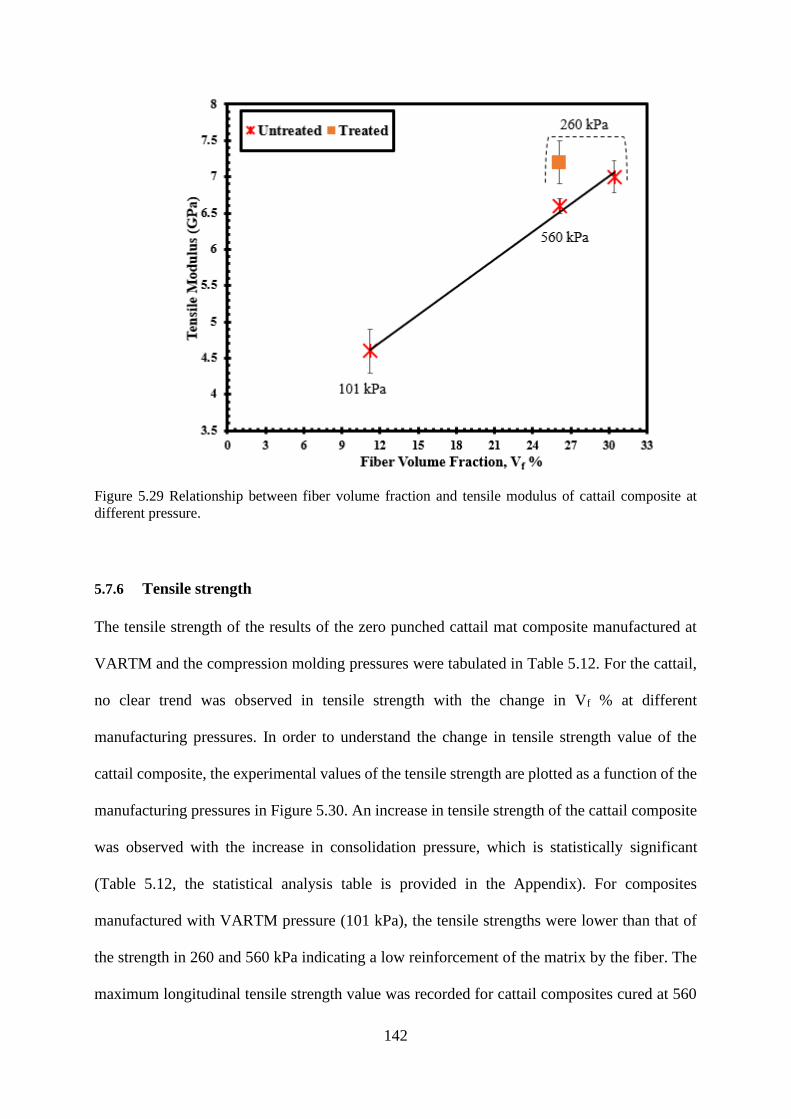
142
Figure 5.29 Relationship between fiber volume fraction and tensile modulus of cattail composite at
different pressure.
5.7.6 Tensile strength
The tensile strength of the results of the zero punched cattail mat composite manufactured at
VARTM and the compression molding pressures were tabulated in Table 5.12. For the cattail,
no clear trend was observed in tensile strength with the change in Vf % at different
manufacturing pressures. In order to understand the change in tensile strength value of the
cattail composite, the experimental values of the tensile strength are plotted as a function of the
manufacturing pressures in Figure 5.30. An increase in tensile strength of the cattail composite
was observed with the increase in consolidation pressure, which is statistically significant
(Table 5.12, the statistical analysis table is provided in the Appendix). For composites
manufactured with VARTM pressure (101 kPa), the tensile strengths were lower than that of
the strength in 260 and 560 kPa indicating a low reinforcement of the matrix by the fiber. The
maximum longitudinal tensile strength value was recorded for cattail composites cured at 560

143
kPa, in the range of 41–48 MPa, which is in the comparable range of both flax and hemp
composites (Table 4.6; Fahimian, 2013).
The tensile strength value of treated and untreated cattail composites manufactured at
260 kPa reveals that chemical treatment on the cattail mat marginally increased the strength
value of the composite as the mean strength value increased from 34.0 to 35.6 MPa. However,
it is found that the composites that were prepared from the treated cattail mat (tensile strength:
35.6±0.5 kPa) exhibited larger homogeneity, based on the standard deviation, in tensile strength
than the untreated composite (tensile strength: 34.0±3.8 kPa) as shown in Table 5.12.
Figure 5.30 Effect of manufacturing pressure on tensile strength of cattail composite.
5.7.7 Image analysis of cattail composite
Microscopic images of the cattail composite captured from VHX Digital Microscope for
VARTM pressure (101 kPa), 260 kPa, and 560 kPa are shown in Figure 5.31, 5.32, and 5.33,
respectively. The x30 image shows that VARTM samples have a resin rich top layer as
10
15
20
25
30
35
40
45
50
0 50 100 150 200 250 300 350 400 450 500 550 600
Ten
sile
Str
ength
(M
Pa)
Manufacturing Pressure (kPa)
Untreated
Treated

144
compared to 260 and 560 kPa as more resin was squeezed out at the higher consolidation
pressure. It appears that cattail fibers are more soaked in resin in the composite manufactured
at 560 kPa (x100) – Figure 5.33 than those of VARTM pressure (x100) – Figure 5.31. From
these images, it is also apparent that variation in the cattail fiber diameter is less compared to
the flax mat composite (Appendix - Figure B1, B2, B3, B4).
Also, these images show that a higher number of fibers are present in a given area at
pressure 260 and 560 kPa than VARTM pressure due to the higher consolidation achieved at
260 and 560 kPa. Also, there are variations in fiber length in these images from one pressure to
another. Apparently, the cattail composite manufactured at 560 kPa contains longer cattail
fibers than that of 260 kPa as revealed in these images, which could be one of the reasons for
less compaction achieved at 560 kPa pressure and a lower fiber volume fraction value.
(a) (b)
Figure 5.31 Microscopic images of cattail composite – (a) 30X magnification and (b) 100X
magnification; manufactured at VARTM pressure.

145
(a) (b)
Figure 5.32 Microscopic images of cattail composite – (a) 30X magnification and (b) 100X
magnification; manufactured at 260 kPa molding pressure.
(a) (b)
Figure 5.33 Microscopic images of cattail composite – (a) 30X magnification and (b) 100X
magnification; manufactured at 260 kPa molding pressure.

146
5.7.8 Scanning Electron Microscopy (SEM)
The scanning electron microscopy of cattail fiber is shown in Figure 5.34. The rectangular
calcium oxalate plates and pit areas (without oxalate plates) can be seen all over the fiber surface
(Witztum & Wayne, 2014, 2015; Yu & Rahman, 2020. These plates lie in the longitudinal
direction and their length and width are different.
Since cattail is a novel fiber, the major objective of conducting the SEM is to find out
the adhesion between fiber and resin in a composite structure. The cattail fibers from the
composite fracture surface show that the fibers are covered by the resin (Figure 5.35) as no
oxalate plates can be seen as in the virgin cattail fiber in Figure 5.34. The adhesion between the
fiber and resin is clearly shown in Figure 5.36 and 5.37 as well as the fiber hollowness in the
centre. Due to this hollowness, the density of the cattail fiber (Table 5.6) is much lower than
that of other bast fibers.
Figure 5.34 Scanning electron microscopy of cattail fibre (chemically extracted, Yu and Rahman, 2020)
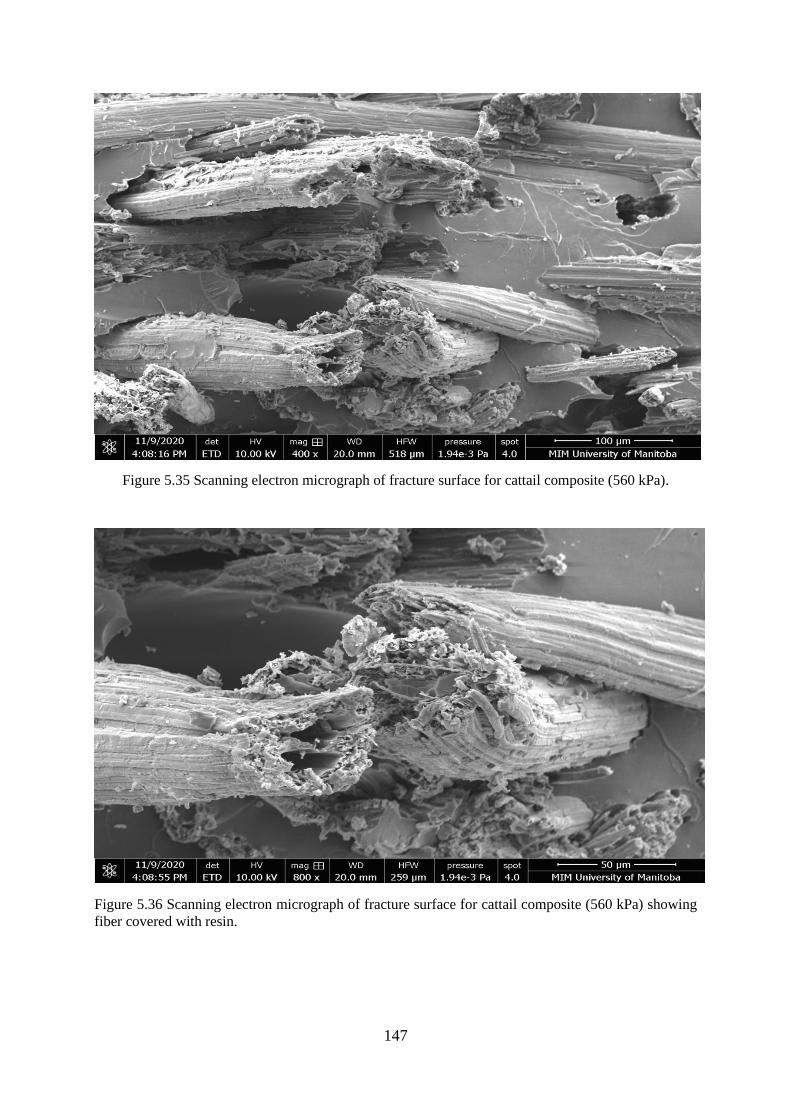
147
Figure 5.35 Scanning electron micrograph of fracture surface for cattail composite (560 kPa).
Figure 5.36 Scanning electron micrograph of fracture surface for cattail composite (560 kPa) showing
fiber covered with resin.

148
Figure 5.37 Scanning electron micrograph of fracture surface for cattail composite (260 kPa) showing
fiber covered with resin.
The fracture surface of the cattail composites shows numerous empty fiber regions with
different dimensions due to the tension loading (Figure 5.38). The different sizes of the empty
fiber regions indicate the presence of fiber with different which has already been reported
(Rahman, et al, 2020). The serrated structure of the empty fiber regions (Figure 5.36) is due to
the fiber adhesion with the matrix, particularly of the calcium oxalate plates. The pull out fibres
with different dimensions can also be seen in this micrograph. The fracture surface of the pull
out fibers is fibrillar in nature (Figure 5.37) and the debonding distance (crack between matrix
and pull out fiber) is less than 1.23 µm (Figure 5.36).
While most of the pull out fibers show a fibrillar nature and hollowness in the centre,
the tip of the few pull out fibres is covered with resin which is more common in the treated
fiber composite (Figure 5.40) than in the untreated fiber composite (Figure 5.39). This is due
to the fiber pulling out of the composite structure instead of breakage. The matrix surface in all

149
composites shows a ‘wrinkly effect’ and since the strength of fibre along the length is variable,
the fiber is able to break some distance from the ‘wrinkly matrix’ and after composite breakage
the fibers show pull out effect. It is worth mentioning here that no such wrinkle effect was
observed when the surface of the cattail composites was observed (Figures 5.31-5.32).
Figure 5.38 Scanning electron micrograph of fracture surface for cattail composite (260 kPa) showing
empty fiber regions.
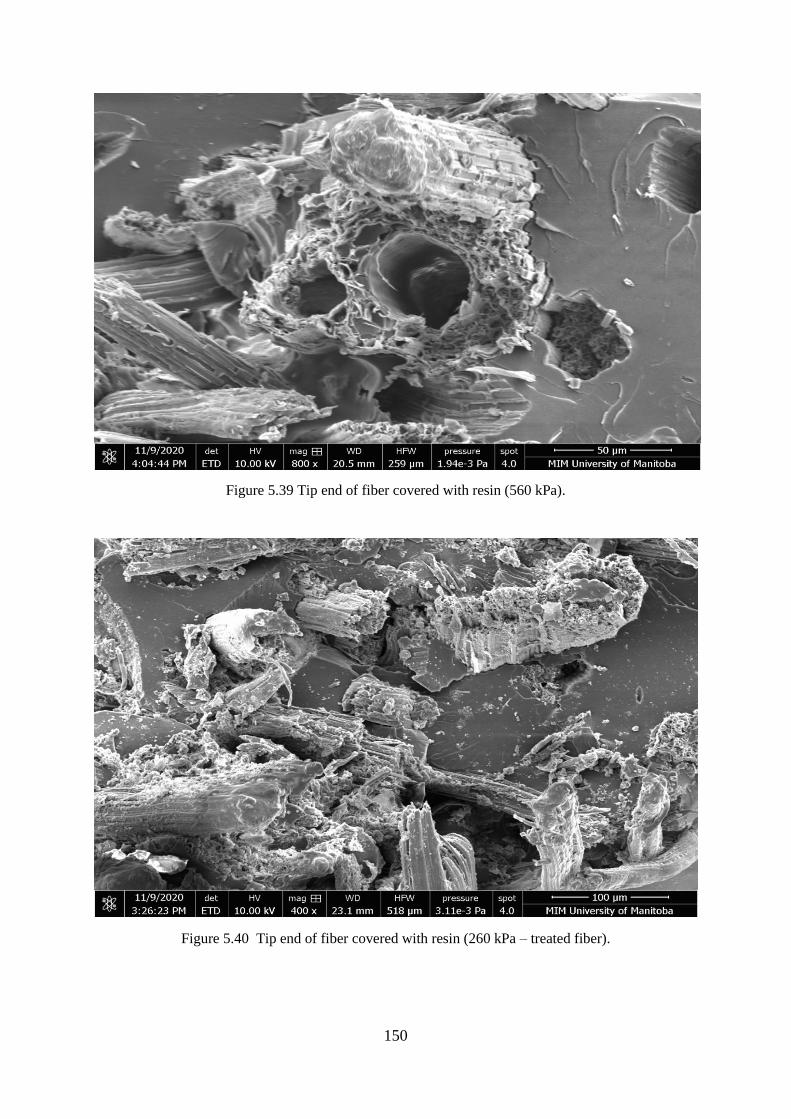
150
Figure 5.39 Tip end of fiber covered with resin (560 kPa).
Figure 5.40 Tip end of fiber covered with resin (260 kPa – treated fiber).

151
CHAPTER VI
COMPARITIVE ANALYSIS
This chapter has three sections. A brief comparison of properties of cattail, flax, and hemp
fibers that were used to make nonwoven mats. Effect of mat manufacturing parameters on the
mat properties is analysed for mats with three different fibers. Mechanical properties of flax,
cattail, flax-hemp, and hemp composite manufactured using zero punched mat is compared.
Finally, a brief comparison was caried out between flax and hemp composite manufactured
from needle punched mat. The properties of hemp fiber, needle punched hemp mat, and hemp
composite is taken from Fahimian (2013) for comparison.
6.1 FIBER PROPERTIES
Table 6.1 summarizes the physical and mechanical properties of flax, hemp, and cattail fibers.
The properties for cattail and flax have been measured during the current study while the hemp
fiber properties obtained from Fahimian (2013). The tensile strength of cattail fiber is similar
to flax and hemp fiber. However, tensile modulus of hemp fiber is higher than that of flax and
cattail fiber and strain at break percentage of cattail is less than that of flax fiber. A similar trend
of modulus and strain is also observed in the mechanical properties of flax, hemp, and cattail
composite. Cattail fiber is finer and lighter than the flax and hemp. Further, cattail fiber can be
obtained from waste sources and fiber yield percentage is much higher than the flax and hemp.
Perhaps the most important advantage of cattail fiber is the much less greenhouse gas emission
than that of flax and hemp if the fiber can be obtained from the naturally growing areas. Despite
having similar tensile strength in all three fibers, cattail fibers possess higher specific strength
than flax and hemp due to lower density values of cattail fiber; however, specific modulus

152
followed the same trend observed for tensile modulus (Eflax< Ecattail<Ehemp); it should be noted
that the weight of the composite part decreases with increase in specific properties of the fiber.
Table 6.1 Physical and mechanical properties of flax, hemp, and cattail fiber.
Parameters Flax Hemp Cattail
Length (cm) 6.64 (2.3) 0.4 - 21 a 6.98 (1.2)
Diameter (µm) 80.2 (32.7) 138.3 (31.9) a 32.1 (8.6)
Density (gm/cm3) 1.49 (0.004) 1.57 (0.003) 1.39 (0.005)
Tensile strength (MPa) 180.1 (126.1) 172.1 a 172.3 (99.3)
E - Modulus (GPa) 11.3 (10.7) 28.5 a 18.1 (9.7)
Specific strength 120.87 110.32 123.96
Specific modulus 7.58 18.27 13.02
Strain at break (%) 3.1 (1.5) - 1.8 (1.4)
a Fahimian, 2013
6.2 NONWOVEN MAT PROPERTIES
The physical properties of all nonwoven mats investigated on this study is summarised in Table
6.2. These include flax, cattail, and flax-hemp hybrid mat. Fahimian (2013) studied the
properties of zero punched and needle punched hemp mat. However, Fahimian (2013)
measured the transverse permeability of hemp mat using water whereas transverse permeability
of flax, cattail, and flax-hemp mat was evaluated using air in this study. Hence, the difference
in permeability results are expected while using two different media. So, to compare the results
flax, cattail, and flax-hemp mat, the transverse permeability of zero punched hemp mat was
also investigated in this study (Table 6.2).

153
Needle punched flax mat exhibited much higher deviation in areal density than that of
any other zero punched nonwoven mat manufactured in this study. Highest mat thickness was
observed in zero punched cattail mat thus resulting in lower Vf when compared to zero punched
flax, hemp, and flax-hemp mat (Table 6.2), which is believed to be due to longer fiber length.
Transverse permeability of cattail mat was found higher than that of flax mat with similar Vf
and higher than that of hemp mat with slightly higher Vf.
Table 6.2 Physical, properties of nonwoven cattail, flax, hemp, and flax-hemp hybrid mat.
Mat content Needle
punch
density
(p/cm2)
Areal density
of mat (g/m2)
Mat
thickness
before
consolidation
(mm)
Fiber volume
fraction in
mat, Vf %
Transverse
Permeability x
10-11 (m2)
100% Cattail 0 913.5 (52.8) 19.1 (1.6) 3.5 (0.4) 5.2 (0.5)
100% Hemp 0 941.3 (17.9)a 12.5 (3.1) a 6.6 (1.6) a 2.8 (0.07)b
50% Flax-50% Hemp 0 993.3 (14.3) 13.9 (0.5) 4.7 (0.2) 2.3 (0.2)
100% Flax 0 931.1 (67.1) 16.3 (0.7) 3.8 (0.2) 2.5 (0.04)
100% Flax 20 814.7 (88.3) 4.6 (0.3) 11.6 (0.7) 0.4 (0.05)
100% Flax 30 823.6 (97.4) 4.7 (0.5) 11.4 (1.4) 0.5 (0.01)
100% Flax 72 885.2 (108.5) 6.8 (0.4) 8.7 (1.4) 0.9 (0.3)
a Fahimian, 2013; b Transverse permeability of hemp mat measured using air flow.
6.3 COMPARISON AMONG MECHANICAL PROPERTIES OF ZERO PUNCHED
MAT COMPOSITE
6.3.1 Stress-strain behavior
Figure 6.1 and Figure 6.2 shows the stress – strain behaviour of zero punched flax, cattail, and
flax-hemp hybrid mat composite manufactured at 260 kPa and 560 kPa respectively. Cattail,
flax, and flax-hemp fibers reinforce the pure resin significantly. At both 260 and 560 kPa

154
manufacturing pressure, cattail and treated cattail mat composite exhibited steeper stress-strain
curve than flax and flax-hemp hybrid mat composite indicating higher stiffness and higher
degree of reinforcement. However, cattail mat exhibited a poor strain to failure than flax and
flax-hemp hybrid mat composite. Zero punched flax composite exhibited highest strain at
fracture value at all consolidation pressure.
Figure 6.1 Stress-strain behavior of flax, cattail, and flax-hemp hybrid mat composite manufactured at
260 kPa.
0
5
10
15
20
25
30
35
40
45
50
0 0.2 0.4 0.6 0.8 1 1.2 1.4 1.6 1.8 2
Str
ess
(MP
a)
Strain (%)
Stypol Resin
100% Flax
100% Cattail
100% Cattail-Treated
50% Flax - 50% Hemp

155
Figure 6.2 Stress-strain behavior of flax, cattail, and flax-hemp hybrid mat composite manufactured at
560 kPa.
6.3.2 Tensile modulus and tensile strength
The measured fiber volume fraction of various (flax, cattail, hemp, flax-hemp) zero punched
mat composite at different consolidation pressure is tabulated in Table 6.3. Also, the percentage
of Vf is plotted as a function of average experimental tensile modulus value of each composite
in Figure 6.3. The experimental values of zero punched hemp mat composite have been taken
from Fahimian (2013) for comparison.
Zero punched hemp composite achieved much higher Vf % (Table 6.3) at 260 and 560
kPa than that of zero punched flax, cattail, and flax-hemp mat composite. For a given fiber
volume fraction, composites manufactured using the three fibers exhibited similar modulus at
101 kPa. With increased in compaction pressure, the consolidation level differs with fiber type,
resulting in differing Vf and modulus. At 260 and 560 kPa, the modulus of cattail fiber
composites is higher than that of flax but less than that of flax-hemp fiber composites due to
higher modulus of 100% hemp fiber composites.
0
10
20
30
40
50
60
0 0.25 0.5 0.75 1 1.25 1.5 1.75 2 2.25
Str
ess
(MP
a)
Strain (%)
Stypol Resin
100% Flax
100% Cattail
50% Flax - 50% Hemp

156
The tensile strength of flax and flax-hemp composite increased with the increase in Vf
(%) as shown in Figure 6.4. At 101 kPa, the tensile strength of composites manufactured with
three fibers are similar. With increased in compaction pressure, the consolidation level differs
with fiber type, resulting in differing Vf and strength. At 260 kPa, the hemp fiber composites
exhibited the highest strength due to higher Vf. The other composites had similar Vf, with cattail
fiber composites exhibiting the higher strength. At 560 kPa, the strength of cattail and hemp
fiber composites decreased (when compared to the values at 260 kPa), the reason for which is
not known at this time. The strength of flax and flax-hemp fiber composites increased when the
pressure was increased from 260 to 560 kPa due to marginal increase in Vf.
Table 6.3 Fiber volume fraction of flax, hemp, cattail, and flax-hemp mat composite manufactured at
different pressure.
Mat content Consolidation
pressure (kPa)
Vf (%) of composite
100% Flax 101 11.2
100% Flax 260 26.9
100% Flax 560 32.6
100% Cattail 101 10.9
100% Cattail 260 30.4
100% Cattail 560 26.1
50% Flax - 50% Hemp 101 11.7
50% Flax - 50% Hemp 260 23.5
50% Flax - 50% Hemp 560 32.1
100% Hemp 101 12.5 a
100% Hemp 260 42.5 a
100% Hemp 560 47 a
a Fahimian, 2013

157
Figure 6.3 Relationship between Vf and experimental tensile modulus of zero punched mat composite.
Figure 6.4 Relationship between Vf and experimental tensile strength of zero punched mat composite.

158
6.4 COMPARISON OF NEEDLE PUNCHED FLAX AND HEMP MAT
COMPOSITES
The experimental longitudinal tensile modulus value of flax composite manufactured from
needle punched mat having 20, 30, and 72 punches/cm2 needle punching density are listed in
Table 6.4 along with the corresponding experimental longitudinal tensile modulus value of 7-
P, 30-P, and 70-P needle punched hemp composite for comparison. Experimental longitudinal
tensile modulus value of needle punched hemp composite were taken from Fahimian (2013).
The Table 6.4 appears difficult to read for comparison as Vf is varying at all pressure
and punch density for both flax and hemp; hence, tensile modulus of needle punched flax and
hemp mat composite is plotted as a function of Vf and presented in Figure 6.5 for comparison.
Longitudinal modulus of needle punched flax and hemp fiber composites at VARTM pressure
(101 kPa) increased with the increase in punch density from 0 to 30 P/cm2. Hemp composite
exhibited much higher longitudinal modulus value at VARTM pressure for 7-P and 30-P than
that of 20-P and 30-P flax composite despite having lower Vf % for 7-P hemp composite. At
260 kPa and 560 kPa manufacturing pressure, both Vf and longitudinal modulus of 30-P and
70-P hemp composite was higher than that of 30-P and 72-P flax composite respectively.
Although gradual increase in Vf was observed in 7-P hemp composite when pressure increased
from 101 to 260 and 560 kPa; surprisingly modulus of 7-P hemp composite was less both in
260 and 560 kPa pressure compared to VARTM pressure. However, longitudinal modulus of
20-P flax composite increased or decreased followed by an increase or decrease in Vf % with
the change in consolidation pressure.

159
Table 6.4 Longitudinal tensile modulus of needle punched flax and hemp composite.
100% Flax 100% Hemp
Needle
Punch
density
Pressure
(kPa)
Vf (%) Longitudinal
modulus
(GPa)
Needle
Punch
density
Pressure
(kPa)
Vf (%) Longitudinal
modulus
(GPa)
20 101 15.6 4.9 (0.2) 7 101 13.9 6.8 (0.2) a
20 260 25.8 6.1 (0.8) 7 260 22.5 4.3 (0.5) a
20 560 22.5 5.6 (0.5) 7 560 35.5 5 (0.4) a
30 101 20.9 5.9 (0.5) 30 101 25 8.2 (0.2) a
30 260 25 6.9 (0.5) 30 260 31 7.5 (0.4)
30 560 23.6 6 (0.4) 30 560 39 9.4 (0.5) a
72 101 18.1 5.9 (0.3) 70 101 20 4.9 (0.3) a
72 260 24.7 6.2 (0.2) 70 260 32.5 9.5 (2.5) a
72 560 31.5 8 (0.7) 70 560 39 9.7 (0.4) a
a Fahimian, 2013
Figure 6.5 Relationship between Vf and modulus of flax and hemp composites at various punch density.
3
4
5
6
7
8
9
10
11
12
13
10 15 20 25 30 35 40 45
Mod
ulu
s (G
Pa
)
Vf %
Flax-20P
Hemp-7P
Flax-30P
Hemp-30P
Flax-72P
Hemp-70P

160
CHAPTER VII
CONCLUSION
The goal of this thesis was to perform a comparative evaluation of properties of discontinuous
natural fiber composites manufactured using flax, hemp, and cattail fibers. The three objectives
identified in Chapter 2 to realize this goal have been successfully executed.
In this study, flax fibers were bound by needle punching process to manufacture
nonwoven mats. The needle punching density, depth of needle penetration, and areal density of
flax mat were varied that resulted in different mat structure with different thickness, fiber
volume fraction, and permeability. The effect of these variations on the composite properties
was studied. Cattail fiber were extracted from leaves, tested for mechanical properties, and
surface treated to improve the bonding with the polymer matrix. Similar to flax, cattail mat
composite was manufactured using VARTM and compression molding pressures; nonwoven
cattail mat was restricted to zero punch. Zero punch cattail mat was prepared in the laboratory
using a mini carding machine and a customized fiber lay-up mold. Same method was followed
to manufacture zero punch flax, and zero punch flax-hemp hybrid mat. Effect of consolidation
pressure on composite properties such as fiber volume fraction, tensile strength, and tensile
modulus was investigated. Finally, a detailed comparison of fiber, mat, and composite
properties was made for flax, cattail, and hemp fibers.
7.1 SUMMARY AND CONCLUSIONS
A summary of results and conclusion based on these results are presented below.

161
1. Conclusions based on tasks completed to realize Objective 1:
• Flax fiber mechanical properties increased with decrease in diameter and the length and
diameter of fibers in the mat showed a distribution.
• Increase in needle punch density decreased the thickness of the flax mat and increased the
Vf in the mat.
• The out-of-plane permeability of flax mat decreased with increase in punch density, for a
given needle depth, due to decrease in percenatge of void fraction. While the magnitude of
consolidation during composite manufacturing decreased with increase in punch density
due to the increase in Vf of the mat with punch density. This along with the variation of Vf
in the starting mat, resulted in complex variation in the Vf in the final composite. For
example, at 101 kPa, the Vf in the composite increased with punch density while the
opposite trend was observed at 260 kPa. Only mats with loosely bound fibers, such as 0-P
and 72-P, exhibited a higher Vf at 560 kPa when compared to that at 260 kPa.
• Higher needle punch density resulted in higher modulus and strength in flax fiber
composites at pressures < 260 kPa and lower needle punch densities resulted in higher
strength and modulus at pressures > 260 kPa.
• The modulus and strength of composites manufactured using the 0-P 50% Flax-50% Hemp
fiber mat, increased with increase in consolidation pressure due to increase in Vf.
2. Conclusions based on tasks completed to realize Objective 2:
• Cattail fiber exhibited higher yield percentage than that of conventional bast fibers used in
composite applications. Similar to flax fibers, the modulus and strength varied with fiber
diameter and length. The modulus increased with decrease in fiber diameter. Despite large
SD, the average modulus and strength increased with relative humidity until 75% beyond
which they decreased, a trend observed in other natural fibers too.

162
• Similar to that of flax, transverse (out-of-plane) permeability of cattail mat decreased with
increase in percentage of void fraction in the mat.
• Similar to flax fiber composites, the modulus and the strength of cattail fiber composite
increased with compaction pressure (up to 260 kPa) due to increase in Vf. With further
increase in pressure to 560 kPa, the Vf decreased, the modulus decreased slightly and the
strength increased. The reason for decrease in Vf is not known at this time.
• Treating the surface of cattail fiber with 5% DIH-HEA resulted in higher modulus and
strength than untreated fiber composite, manufactured at 260 kPa, despite having lower Vf.
Further optimization on chemical treatment is required in future studies.
3. Conclusions based on tasks completed to realize Objective 3:
• The cattail fibers have a lower density than flax fibers, which in turn have a lower density
than hemp fibers.
• While strength of the three fibers are similar, the modulus increases as follows: Eflax<
Ecattail<Ehemp.
• The specific strength and modulus increases in this order σhemp<σflax<σcattail and Eflax<
Ecattail<Ehemp; it should be noted that the weight of the composite part decreases with increase
in specific properties of the fiber.
1. The transverse permeability of cattail fiber mat is the highest, followed by hemp fiber mat
and the flax fiber mat’s permeability was the least.
2. At VARTM pressure (101 kPa) the properties of composites with three fibers are similar.

163
7.2 RECOMMENDATIONS FOR FUTURE WORKS
1. Since the effect of needle punching on the mechanical properties (longitudinal) of flax and
flax/hemp composites was established, future work should be conducted on developing a
model that could predict the modulus and the strength of needle-punched mat composites.
Further, both longitudinal and transverse modulus of elasticity influences the total stiffness
of manufactured composite; the transverse mechanical properties of composites should be
measured.
2. It was found that the variations in the areal density of the needle punched mats were high
that might have contributed to the composite properties. Studies should be conducted to
minimize the variation in areal density while manufacturing needle punched non-woven
mat.
3. For cattail, only zero punched mat was used to make composites. This would help the
researchers explore this novel fiber further for composites and other industrial applications.
However, research in this area should be conducted further by using different needle
punched non-woven mat.
4. Although DIH-HEA treatment improved the hydrophobicity of fiber, however, this has not
contributed to the mechanical properties of cattail composites, perhaps, the increased
hydrophobicity was not enough to have a significant impact on the mechanical properties.
Therefore, future work should be carried out to optimize the chemical modification that
would increase the mechanical properties of cattail composites.

164
REFERENCES
Ahmed, S. (2017) Mechanical and Surface Properties of Technical and Single Flax Fiber in
Micro and Nano Scale, M.Sc. thesis, North Dakota State University, USA).
Akil, H., Omar, M. F., Mazuki, A. A. M., Safiee, S. Z. A. M., Ishak, Z. M., & Bakar, A. A.
(2011). Kenaf fiber reinforced composites: A review. Materials & Design, 32(8-9), 4107-4121.
Ali, A. (2013). Surface Modification of Hemp Fiber to Improve Spinning Properties. M.Sc.
thesis, University of Manitoba.
Alzeer, M., & MacKenzie, K. (2013). Synthesis and mechanical properties of novel composites
of inorganic polymers (geopolymers) with unidirectional natural flax fibres (phormium tenax).
Applied Clay Science, 75, 148-152.
Andersons, J., Sparniņs, E., Joffe, R., & Wallstrom, L. (2005). Strength distribution of
elementary flax fibres. Composites science and technology, 65(3-4), 693-702.
Andre, N.G., Ariawan, D., & Mohd Ishak, Z. A. (2017). Mechanical properties and
micromechanical analysis of nonwoven kenaf fibre/epoxy composites produced by resin
transfer moulding. Journal of Composite Materials, 51(13), 1875-1885.
Arbelaiz, A., Fernandez, B., Ramos, J. A., Retegi, A., Llano-Ponte, R., & Mondragon, I. (2005).
Mechanical properties of short flax fibre bundle/polypropylene composites: Influence of
matrix/fibre modification, fibre content, water uptake and recycling. Composites science and
technology, 65(10), 1582-1592.
ASTM (2020). ASTM D 3822: Standard Test Method for Tensile Properties of Single Textile
Fibers, ASTM International, West Conshohocken, PA 19428-2959. United States.
Averink, J. 2015. Global Water Footprint of Industrial Hemp Textile, Water Engineering and
Management, University of Twente, Enschede, Nederland,
https://essay.utwente.nl/68219/1/Averink,%20J.%200198501%20openbaar.pdf (accessed
through internet, August 13, 2020).
Baley, C. (2002). Analysis of the flax fibers tensile behaviour and analysis of the tensile
stiffness increase. Composites Part A: Applied Science and Manufacturing, 33(7), 939-948.
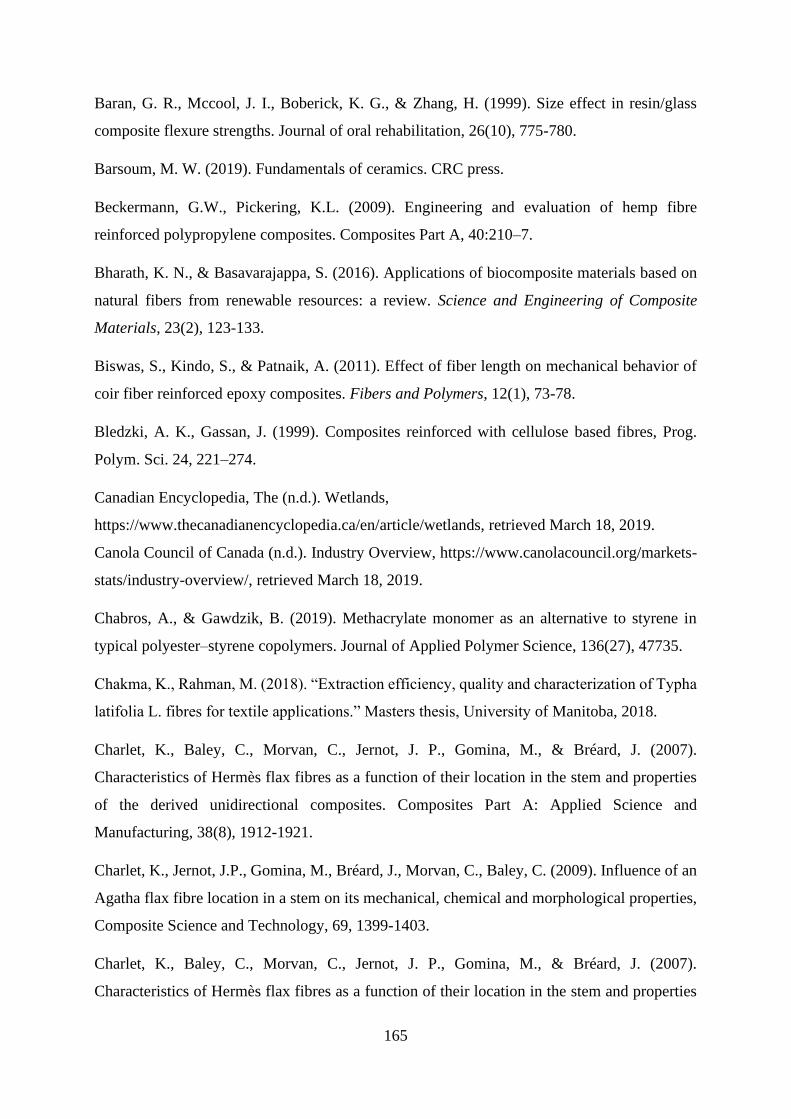
165
Baran, G. R., Mccool, J. I., Boberick, K. G., & Zhang, H. (1999). Size effect in resin/glass
composite flexure strengths. Journal of oral rehabilitation, 26(10), 775-780.
Barsoum, M. W. (2019). Fundamentals of ceramics. CRC press.
Beckermann, G.W., Pickering, K.L. (2009). Engineering and evaluation of hemp fibre
reinforced polypropylene composites. Composites Part A, 40:210–7.
Bharath, K. N., & Basavarajappa, S. (2016). Applications of biocomposite materials based on
natural fibers from renewable resources: a review. Science and Engineering of Composite
Materials, 23(2), 123-133.
Biswas, S., Kindo, S., & Patnaik, A. (2011). Effect of fiber length on mechanical behavior of
coir fiber reinforced epoxy composites. Fibers and Polymers, 12(1), 73-78.
Bledzki, A. K., Gassan, J. (1999). Composites reinforced with cellulose based fibres, Prog.
Polym. Sci. 24, 221–274.
Canadian Encyclopedia, The (n.d.). Wetlands,
https://www.thecanadianencyclopedia.ca/en/article/wetlands, retrieved March 18, 2019.
Canola Council of Canada (n.d.). Industry Overview, https://www.canolacouncil.org/markets-
stats/industry-overview/, retrieved March 18, 2019.
Chabros, A., & Gawdzik, B. (2019). Methacrylate monomer as an alternative to styrene in
typical polyester–styrene copolymers. Journal of Applied Polymer Science, 136(27), 47735.
Chakma, K., Rahman, M. (2018). “Extraction efficiency, quality and characterization of Typha
latifolia L. fibres for textile applications.” Masters thesis, University of Manitoba, 2018.
Charlet, K., Baley, C., Morvan, C., Jernot, J. P., Gomina, M., & Bréard, J. (2007).
Characteristics of Hermès flax fibres as a function of their location in the stem and properties
of the derived unidirectional composites. Composites Part A: Applied Science and
Manufacturing, 38(8), 1912-1921.
Charlet, K., Jernot, J.P., Gomina, M., Bréard, J., Morvan, C., Baley, C. (2009). Influence of an
Agatha flax fibre location in a stem on its mechanical, chemical and morphological properties,
Composite Science and Technology, 69, 1399-1403.
Charlet, K., Baley, C., Morvan, C., Jernot, J. P., Gomina, M., & Bréard, J. (2007).
Characteristics of Hermès flax fibres as a function of their location in the stem and properties

166
of the derived unidirectional composites. Composites Part A: Applied Science and
Manufacturing, 38(8), 1912-1921.
Chawla, K. K. (2012). Composite materials: science and engineering. Springer Science &
Business Media. p. 378-381.
Chawlaw, N and Kerr, M. (2005). Monotonic and Cyclic Fatigue Behavior of High-
Performance Ceramic Fibers, Journal of American Chemical Society, 88 (1), 101-108.
Chekurthi, S. (2018). “Fracture criterion to predict strain-rate dependent failure of
unidirectional carbon fiber composites under multi-axial state of stress.” Masters thesis,
University of Manitoba, Winnipeg, Canada. http://hdl.handle.net/1993/32961
Cristaldi, G., Latteri, A., Recca, G., & Cicala, G. (2010). Composites based on natural fibre
fabrics. Woven fabric engineering, 17, 317-342.
Cook JG. (1984). Handbook of textile fibers. Shildon: Merow, 1984. p. 35-73.
Collier, B.J., Epps, H.H. (1999). Textile Testing and Analysis, Prentice Hall Inc, New Jersey,
USA.
Dao M and Asaro R., (1999). A study on the failure prediction and design criteria for fibre
composites under fire degradation. Compos A: Appl, 30: 123–131.
Davallo, M., Pasdar, H., & Mohseni, M. (2010). Mechanical properties of unsaturated polyester
resin. International Journal of ChemTech Research, 2(4), 2113-2117.
Davis, G.C., and Bruce, D.M. (1998). Effect of Environmental Relative Humidity and Damage
on the Tensile Properties of Flax and Nettle Fibers, Textile Research Journal, 68(9), 623-629.
de Beus, N., Carus, M., Barth, M (2019).”Carbon Footprint and Sustainability
of Different Natural Fibres for Biocomposites and Insulation Material.” MSc Thesis, Nova
Institute, accessed through internet at http://eiha.org/media/2019/03/19-03-13-Study-Natural-
Fibre-Sustainability-Carbon-Footprint.pdf.
Dev, V. G., & Dhanakodi, A. K. P. (2018). Studies on mechanical properties of thermoplastic
composites prepared from flax-polypropylene needle punched nonwovens. Science and
Engineering of Composite Materials, 25(3), 489-499.

167
Djeghader, D., Redjel, B. (2019). Effect of water absorption on the Weibull distribution of
fatigue test in jute-reinforced polyester composite materials, Advanced Composites Letters, 28:
1–11.
Duval, A., Bourmaud, A., Augier, L., & Baley, C. (2011). Influence of the sampling area of the
stem on the mechanical properties of hemp fibers. Materials Letters, 65(4), 797-800.
Ebskamp, M. J. M. 2002. Engineering flax and hemp for an alternative to cotton. Trends in
Biotechnology 20: 229–230. doi:10.1016/S0167-7799(02)01953-4.
Euliss, N. H., Gleason, R. A., Olness, A. et al. (2006). North American prairie wetlands are
important nonforested land-based carbon storage sites. Science of the Total Environment,
361(1-3): 179-188. https://doi.org/10.1016/j.scitotenv.2005.06.007.
Facca, A. G., Kortschot, M. T., & Yan, N. (2006). Predicting the elastic modulus of natural
fibre reinforced thermoplastics. Composites Part A: Applied Science and Manufacturing,
37(10), 1660-1671.
Fahimian, M. (2013). “Processing-Structure-Property Relationship in Needle-Punched
Nonwoven Natural Fibre Mat Composites.” PhD diss., University of Manitoba, Winnipeg,
Canada. http://hdl.handle.net/1993/22207
Fan, M., & Weclawski, B. (2017). Long natural fibre composites. In Advanced High Strength
Natural Fibre Composites in Construction (pp. 141-177). Woodhead Publishing.
Faruk, O., Bledzki, A. K., Fink, H. P., & Sain, M. (2012). Biocomposites reinforced with natural
fibers: 2000–2010. Progress in polymer science, 37(11), 1552-1596.
Foulk, J., Akin, D., Dodd, R. (2003). Influence of pectinolytic enzymes on retting effectiveness
and resultant fibre properties, BioResources, 3(1), 155-169.
Gassan, J., Chate, A., and Bledzki, A. (2001). Calculation of elastic properties of natural fibers,
Journal of Materials Science, 36, 3715 – 3720.
Ghosh, A., Dever, M., Thomas, H., Tewksbury, C. (1994). Effects of selected fibre properties
and needle punch density on thermally-treated nonwoven fabrics, Indian Journal of Fibre and
Textile Research, 19, 203-208.
Gillies, M. (1979). “Nonwoven Materials: Recent Developments”, Noyes Data Corporation
Park Ridge, NJ, USA.

168
Gourier, C., Le Duigou, A., Bourmaud, A., Baley, C. (2014). Mechanical analysis of elementary
flax fibre tensile properties after different thermal cycles, Composites: Part A, 159-166.
Gurunathan, T., Mohanty, S., Nayak, S. (2015). A review of recent developments in
biocomposites based on natural fibres and their application perspectives, Composites: Part A,
77, 1-25.
Hargitai, H., Racz, I., & Anandjiwala, R. (2006, June). Development of hemp fibre–PP
nonwoven composites. In Macromolecular symposia (Vol. 239, No. 1, pp. 201-208).
Weinheim: WILEY‐VCH Verlag.
Hargitai, H., Rácz, I., & Anandjiwala, R. D. (2008). Development of hemp fiber reinforced
polypropylene composites. Journal of Thermoplastic Composite Materials, 21(2), 165-174.
Hart, A., Summerscales, J. (2017). Effect of time at temperature for natural fibre, Procedia
Engineering, 200, 269 – 275.
Hasan, M. (2019). Optimization of Typha fibre extraction and properties for composite
applications using desirability function analysis. University of Manitoba, 2019.
http://hdl.handle.net/1993/34381
Hasan, M., Ying, C., Cicek, N. (2019). Desirability Analysis for Optimization of Typha Fibre
Extraction and Properties for Composite Applications, CSBE/SCGAB Conference, Vancouver,
July 14-17.
Hasan, M. (2019). Optimization of Typha Fibre Extraction and Properties for Composite
Applications Using Desirability Function Analysis, M.Sc. thesis, University of Manitoba,
Winnipeg, Canada.
Hearle, J.W.S. & Sultan, M.A.I. (1968) A Study of Needled Fabrics. Part V: The Approach to
Theoretical Understanding, Journal of the Textile Institute, 59:4, 183-201
Hearle, J. W. S. (1972). A theory of the mechanics of needled fabrics. Needle-felted Fabrics,
Textile Trade Press, Manchester, 51.
Hoa, S. V. (2009). Principles of the manufacturing of composite materials. DEStech
Publications, Inc.

169
Hoareau, W., Trindade, W. G., Siegmund, B., Castellan, A., & Frollini, E. (2004). Sugar cane
bagasse and curaua lignins oxidized by chlorine dioxide and reacted with furfuryl alcohol:
characterization and stability. Polymer Degradation and Stability, 86(3), 567-576.
Ho, M. P., Wang, H., Lee, J. H., Ho, C. K., Lau, K. T., Leng, J., & Hui, D. (2012). Critical
factors on manufacturing processes of natural fibre composites. Composites Part B:
Engineering, 43(8), 3549-3562.
Hoekstra, A. Y. (2013). The water footprint of modern consumer society. London, UK:
Routledge.
Hughes, M. (2012). Defects in natural fibres: their origin, characteristics and implications for
natural fibre-reinforced composites. Journal of materials science, 47(2), 599-609.
Ishikawa, T., Ishii, Y., Nakasone, K., Ohkoshi, Y. and Kim, K.H. (2019). Structure analysis of
needle-punched nonwoven fabrics by X-ray computed tomography, Textile Research Journal,
89, 20-31.
Jawaid, M., & Khalil, A. (2011). Cellulosic/synthetic fibre reinforced polymer hybrid
composites: A review. Carbohydrate polymers, 86(1), 1-18.
Joffea, R., Andersons, J., Wallstro¨m, L. (2003). Strength and adhesion characteristics of
elementary flax fibres with different surface treatments, Composites: Part A, 34, 603-612.
John, M. J., & Thomas, S. (2008). Biofibres and biocomposites. Carbohydrate polymers, 71(3),
343-364.
Kanade, P.S. (2016). Role of Instrumental Parameters on Yarn Properties, IJIRSET, 5(3), 3202-
3207.
Karaki, M., Younes, R., Trochu, F., & Lafon, P. (2019). Progress in Experimental and
Theoretical Evaluation Methods for Textile Permeability. Journal of Composites Science, 3(3),
73.
Karnani, R., Mohan, K. & Ramani, N. (1997). “Biofibre‐reinforced polypropylene
composites.” Polymer Engineering & Science, 2, 476-483. doi:10.1002/pen.11691.
Keller T, Tracy C and Zhou A. (2006). Structural response of liquid-cooled GFRP slabs
subjected to fire. Part I: Material and post-fire modeling. Compos A: Appl, 37: 1286–1296.

170
Keller T, Tracy C and Zhou A., (2006) Structural response of liquid-cooled GFRP slabs
subjected to fire. Part II: Thermo-chemical and thermo-mechanical modeling. Compos A: Appl
2006; 37: 1296–1308.
Kingdom. 2014. Fibre Flax. Retrieve from http://www.kingdom-
china.com/en/products1.php#:~:text=Because%20flax%20is%20thin%20and,period%2C%20
30%2D40%20days.
Kittl, P., & Diaz, G. (1988). Weibull's fracture statistics, or probabilistic strength of materials:
State of the art. Res Mechanica, 24(2), 99-207.
Koronis, G., Silva, A., & Fontul, M. (2013). Green composites: A review of adequate materials
for automotive applications. Composites Part B: Engineering, 44(1), 120-127.
Krishisewa. 2013. Jute the golden fibre-an overview. Retrieve from
https://www.krishisewa.com/production-technology/327-jute.html
Ku, H., Wang, H., Pattarachaiyakoop, N., & Trada, M. (2011). A review on the tensile
properties of natural fiber reinforced polymer composites. Composites Part B: Engineering,
42(4), 856–873.
Ibrahim, I., Sarip, S., Bani, N.A., Ibrahim, M. H., M. Z. Hassan, M. Z. (2018). The Weibull
probabilities analysis on the single kenaf fiber, AIP Conference Proceedings 1958, 020009,
https://doi.org/10.1063/1.5034540.
Lamy B., Baley, C. (2000). Stiffness prediction of flax fibres–epoxy composite materials. J
Mater Sci Lett: 19: 979–80.
La Mantia, F. P., & Morreale, M. (2011). Green composites: A brief review. Composites Part
A: Applied Science and Manufacturing, 42(6), 579-588.
Lau, K. T., Hung, P. Y., Zhu, M. H., & Hui, D. (2018). Properties of natural fibre composites
for structural engineering applications. Composites Part B: Engineering, 136, 222-233.
Lee, C. H., Abdan, K., Lee, S. H., & Liu, M. (2019). A Comprehensive Review on Bast Fiber
Retting Process for Optimal Performance in Fibers Reinforced Polymer Composites.
Advances in Materials Science and Engineering, vol. 2020, Article ID 6074063, 27 pages,
2020. https://doi.org/10.1155/2020/6074063

171
Lefeuvre, A., Bourmaud, A., Lebrun, L., Morvan, C., Baley, C. (2013). A study of the yearly
reproducibility of flax fiber tensile properties, Industrial Crops and Products, 50, 400-407.
Lewin, M., & Pearce, E. M. (1985). Handbook of fiber science and technology: volume 4-fiber
chemistry.
Levine, H., & Slade, L. (1988). In Water Science Reviews, 3, Felix Franks (ed),Chapter 2:
Water Dynamics, Water as a plasticizer: physio-chemical aspects of low-moisture polymeric
systems, 79-185. CAM BRIDGE UNIVERSITY –PRESS CAMBRIDGE NEW YORK, USA.
DOI: 10.1017/CBO9780511552083.002
Li, Y. Pickering, K.L., Farrell. R.L. (2009). Determination of interfacial shear strength of hemp
fibre reinforced polypropylene. Composites science and technology, 69:1165–71.
Li, X., Tabil, L.P., Panigrahi, S. (2007). Chemical Treatment of Natural Fibre for Use in Natural
Fibre Composites: A Review, J Polym Environ, 15: 25-33.
Liu, W., Qiu, R., Li, K. (2014). Effects of Fiber Extraction, Morphology, and Surface
Modification on the Mechanical Properties and Water Absorption of Bamboo Fibers-
Unsaturated Polyester Composites, 37 (5), 1612-1619.
Liu, M., Fernando, D., Daniel, G., Madsen, B., Meyer, A.S., Ale, M. T., Thygesen, A. (2015).
Effect of harvest time and field retting duration on the chemical composition, morphology and
mechanical properties of hemp fibers, Industrial Crops and Products, 69, 29-39.
Luenenschloss, J., (1972), “The Effect of Fiber Length, Fiber Fineness, Crimp, and Matting on
the Needling Process and the Properties of Needled Non-woven”, Melliand Textil., 53, 144.
Magdalena, W-K., Magdalena, C., Anna, K., Magdalena, Ż., Jacek, K., Lucyna, D., Jerzy, H.,
Maciej, P., Jan, S. (2012). “New biocomposites based on bioplastic flax fibres and
biodegradable polymers.” Biotechnology progress, 5, 1336-1346. doi:10.1002/btpr.1599.
MARIENFELD, M. (1995). Geotextile trends and developments. Tappi Journal, 78(9), 143-
146.
Marru P, Latane V, Puja C, et al. (2014). Lifetime estimation of glass reinforced epoxy pipes
in acidic and alkaline environment using accelerated test methodology. Fibre Polym, 15: 1935–
1940.

172
Martin, N.; Mouret, N.; Davies, P.; Baley, C. (2013). Influence of the degree of retting of flax
fibers on the tensile properties of single fibers and short fiber/polypropylene composites. Ind.
Crops Prod. 49, 755–767.
Martí‐Ferrer, F., Vilaplana, F., Ribes‐Greus, A., Benedito‐Borrás, A., & Sanz‐Box, C. (2006).
Flour rice husk as filler in block copolymer polypropylene: Effect of different coupling
agents. Journal of Applied Polymer Science, 99(4), 1823-1831.
Mazian, B., Bergeret, A., Benezet, J-C., Malhautier, L. (2019). A Comparative Study of the
Effect of Field Retting Time on the Properties of Hemp Fibres Harvested at Different Growth
Stages, Fibers, 7, 108; doi:10.3390/fib7120108
Merhi, D., Michaud, V., Kämpfer, L., Vuilliomenet, P., & Månson, J. A. (2007). Transverse
permeability of chopped fibre bundle beds. Composites Part A: Applied science and
manufacturing, 38(3), 739-746.
Miao, M., & Finn, N. (2008). Conversion of natural fibres into structural composites. Journal
of textile engineering, 54(6), 165-177.
Mohanty, A. K., Misra, M., & Drzal, L. T. (2001). Surface modifications of natural fibers and
performance of the resulting bio composites: an overview. Composite interfaces, 8(5), 313-343.
Monteiro, S.N., Lopes, F.P.D., Ferreira, A.S. (2013). Weibull analysis for the diameter
dependence of the elastic modulus of curaua fibers, Revista Matéria, 18(46–54).
Mortazavi, S.M., and Moghadam, M.K. (2009). Introduction of a New Vegetable Fibre for
Textile Application, J Appl Polym Sci, 113, 3307-3312. DOI 10.1002/app.30301.
Morotn, W.E., Hearle, J.W.S. (2008). Physical properties of textile fibres, 4th edition,
Woodhouse Publishing Limited and CRC Press, Cornwall, England.
Moudood, A., Hall, W., Ochsner, A., Li, H., Rahman, A., Francucci, G. (2019). Effect of
Moisture in Flax Fibres on the Quality of their Composites. Journal of Natural Fibers,
https://doi.org/10.1080/15440478.2017.1414651.
Mukhopadhyay, S., Srikanta, R. (2008). Effect of ageing of sisal fibres on properties of sisal –
Polypropylene composites, Polymer Degradation and Stability, 93, 2048-2051.
Mwaikambo, L. A., & Ansell, M. P. (2006). Mechanical properties of alkali treated plant fibres
and their potential as reinforcement materials. I. Hemp fibres. Journal of materials
science, 41(8), 2483-2496.

173
NCSS Statistical Software (nd). Chapter 550. Distribution (Weibull Fitting). https://ncss-
wpengine.netdna-ssl.com/wp-content/themes/ncss/pdf/Procedures/NCSS/Distribution-
Weibull-Fitting.pdf
Naik, D., Fronk, T. (2016). Weibull Distribution Analysis of the Tensile Strength of the Kenaf
Bast Fiber, Fibers and Polymers, 17, 1696-1701.
Nair, G. R., Rho, D., Yaylayan, V., & Raghavan, V. (2013). Microwave assisted retting–A
novel method of processing of flax stems. Biosystems engineering, 116(4), 427-435.
Ngo, T.D. (2018). Chapter 7: Natural Fibres for Sustainable Bio-composites. In book: Natural
and Artificial Fiber-Reinforced Composites as Renewable Sources, Gunay, E. (ed.),
IntechOpen Limited, London, UK.
Nilsson, T. (2006). Micromechanical Modelling of Natural Fibres for Composite Materials,
Master’s thesis, Lund University, Lund, Sweden.
Nishino, T., Koichi, H., Masaru, K., Katsuhiko, N., & Hiroshi, I. (2003). Kenaf reinforced
biodegradable composite. Composites science and technology, 9, 1281-1286.
doi:10.1016/S0266-3538(03)00099-X.
Niu, H., Jiao, X., Wang, R., & Zhou, H. (2010). Direct manufacturing of flax fibers reinforced
low melting point PET composites from nonwoven mats. Fibers and polymers, 11(2), 218-222.
Niya, S. R., & Selvadurai, A. P. S. (2018). A statistical correlation between permeability,
porosity, tortuosity and conductance. Transport in Porous Media, 121(3), 741-752.
Morotn, W.E., Hearle, J.W.S. (2008). Physical properties of textile fibres, 4th edition,
Woodhouse Publishing Limited and CRC Press, Cornwall, England.
Oksman, K., Lennart, W., Lars, A. B., Romildo, D. T. F. (2002). “Morphology and mechanical
properties of unidirectional sisal–epoxy composites.” Journal of Applied Polymer Science, 13,
2358-2365. doi.org/10.1002/app.10475
Pan, N., Chen, H.C., Thompson, J., Inglesby, M. K., KHATUA, S., ZHANG, X.S., Zeronian,
S. H. (1997). The size effects on the mechanical behaviour of fibres, Journal of Materials
Science, 32, 2677-2685.
Pandey, R. (2016). Fiber extraction from dual-purpose flax. Journal of Natural Fibers, 13(5),
565-577.

174
Park, J.M., Quang, S.T., Hwang, B.S., DeVries, K.L. (2006). Interfacial evaluation of modified
Jute and Hemp fibers/polypropylene composites using micromechanical technique and
nondestructive acoustic emission. Compos Sci Technol, 66:2686–99.
Paridah, M. T., Basher, A. B., SaifulAzry, S., & Ahmed, Z. (2011). Retting process of some
bast plant fibres and its effect on fibre quality: a review. BioResources, 6(4), 5260-5281.
Peças, P., Carvalho, H., Salman, H., & Leite, M. (2018). Natural fibre composites and their
applications: a review. Journal of Composites Science, 2(4), 66.
Peirce, F.T. (1929). A Two-Phase Theory of the Absorption of Water Vapour by Cotton
Cellulose, Journal of the Textile Institute Transactions, 20:6, T133-T150,
DOI: 10.1080/19447022908661486.
Placet, V., Cisse, O., Boubakar, M. L. (2012). Influence of environmental relative humidity on
the tensile and rotational behaviour of hemp fibres. Journal of Materials Science, 47(7), 3435-
3446.
Preisner, M., Kulma, A., Zebrowski, J., Dymińska, L., Hanuza, J., Arendt, M., & Szopa, J.
(2014). Manipulating cinnamyl alcohol dehydrogenase (CAD) expression in flax affects fibre
composition and properties. BMC plant biology, 14(1), 50.
Qiu, R., Ren, X., Fifield, L. S., Simmons, K. L., & Li, K. (2011). Hemp‐fiber‐reinforced
unsaturated polyester composites: Optimization of processing and improvement of interfacial
adhesion. Journal of Applied Polymer Science, 121(2), 862-868.
Quin, J., Quin, G. (2010). A practical and systematic review of Weibull statistics for reporting
strengths of dental materials, Dental Materials, 26, 135-147.
Rahman, M., Cicek, N., Chakma, K., (2020). The Optimum Parameters for Fibre Yield (%) and
Characterization of Typha latifolia L. Fibres for Textile Applications, Fibres and Polymers. In
press.
Ramamoorthy, S. K., Skrifvars, M., & Persson, A. (2015). A review of natural fibers used in
biocomposites: plant, animal and regenerated cellulose fibers. Polymer reviews, 55(1), 107-
162.
Ramaswamy, G. N., Ruff, C. G., & Boyd, C. R. (1994). Effect of bacterial and chemical retting
on kenaf fiber quality. Textile research journal, 64(5), 305-308.

175
Rao, G. V., & Banerjee, P. K. (1997). Geosynthetics: Recent developments.
Roy, A., Chakraborty, S., Kundu, S. P., Basak, R. K., Majumder, S. B., Adhikari, B. (2012).
Improvement in mechanical properties of jute fibres through mild alkali treatment as
demonstrated by utilisation of the Weibull distribution model. Bioresource technology, 107,
222-228.
Sadrmanesh, V., Chen, Y., Rahman, M., AL-Oqla, F. (2019). Developing a decision making
model to identify the most influential parameters affecting mechanical extraction of bast fibers,
J. Clean. Prod., 238, https://doi.org/10.1016/j.jclepro.2019.117891.
Sadrmanesh, V., & Chen, Y. (2019). Bast fibres: structure, processing, properties, and
applications. International Materials Reviews, 64(7), 381-406.
Sayeed, M. A., & Paharia, A. (2019). Optimisation of the surface treatment of jute fibres for
natural fibre reinforced polymer composites using Weibull analysis. The Journal of The Textile
Institute, 110(11), 1588-1595.
Schiefer, H. F., & Boyland, P. M. (1942). Improved instrument for measuring the air
permeability of fabrics. Journal of Research of the National Bureau of Standards, 29.
Scholz, S., Gillespie Jr, J. W., & Heider, D. (2007). Measurement of transverse permeability
using gaseous and liquid flow. Composites Part A: Applied Science and Manufacturing, 38(9),
2034-2040.
Sengupta, S. (2018). Study on some functional properties of mesta needle punched nonwoven
fabrics using central composite rotatable design. Journal of Natural Fibers, 15(1), 131-145.
Sevenhuysen, G.P. and Rahman, M. (2016). U.S. Patent, WO2015039243.
Shadhin, M., & Shuvo, I. I. (2019). Biopolymer flax (Linum Usitatissimum L.) and its prospects
in biodegradable composite fabrication-a short review. J Textile Eng Fashion Technol, 5(5),
267-274. DOI: 10.15406/jteft.2019.05.00212
Shahzad, A. (2013). A Study of Physical and Mechanical Properties of Hemp Fibres, Advances
in Materials Science and Engineering, vol. 2013, Article ID 325085, 9 pages.
https://doi.org/10.1155/2013/325085.

176
Shamsuyeva, M.; Chang, B.P.; Vellguth, N.; Misra, M.; Mohanty, A.; Endres, H.-J. (2020).
Surface Modification of Flax Fibers for Manufacture of Engineering Thermoplastic
Biocomposites. J. Compos. Sci., 4, 64, doi:10.3390/jcs4020064
Shevidi, A.H., Taghiabadi, R., Razaghian, A. (2018). Weibull analysis of effect of T6 heat
treatment on fracture strength of AM60B magnesium alloy, Trans. Nonferrous Met. Soc. China
28, 20−29.
Shih, J. G., & Finkelstein, S. A. (2008). Range dynamics and invasive tendencies in Typha
latifolia and Typha angustifolia in eastern North America derived from herbarium and pollen
records. Wetlands, 28(1), 1-16.
Shuvo, I. I., Rahman, M., Vahora, T., Morrison, J., DuCharme, S., & Choo-Smith, L. P. I.
(2019). Producing light-weight bast fibers from canola biomass for technical textiles. Textile
Research Journal, doi.org/10.1177/0040517519886636.
Sparnins, E. (2006). Mechanical properties of flax fibers and their composites, Master’s thesis,
Luleå University of Technology, Sweden.
Stamboulis, A., Baillie, C. A., & Peijs, T. (2001). Effects of environmental conditions on
mechanical and physical properties of flax fibres. Composites Part A: Applied Science and
Manufacturing, 32(8), 1105-1115.
Stavber, G., & Stavber, S. (2010). Towards Greener Fluorine Organic Chemistry: Direct
Electrophilic Fluorination of Carbonyl Compounds in Water and Under Solvent‐Free Reaction
Conditions. Advanced Synthesis & Catalysis, 352(16), 2838-2846.
Symington, M.C., Banks, W.M., West, O.D., Pethrick, R.A. (2009). Tensile testing of natural
fibers for composite applications. J Compos Mater, 43(9):1083–108.
Thoman, D. R., Bain, L. J., & Antle, C. E. (1969). Inferences on the parameters of the Weibull
distribution. Technometrics, 11(3), 445-460.
Thomason, J.L., Carruthers, J., Kelly, J., Johnson, G. (2011). Fibre cross-section determination
and variability in sisal and flax and its effects on fibre performance characterisation,
Composites Science and Technology, 71, 1008-1015.
Tiryakioglu, M., Hudak, D., Öktenc, G. (2009). Rapid communication On evaluating Weibull
fits to mechanical testing data; Materials Science and Engineering A, 527: 397–399.

177
Van den Oever, M. J. A., Bos, H. L., & Molenveld, K. (1999). Flax fibre physical structure and
its effect on composite properties: Impact strength and thermo‐mechanical properties. Die
Angewandte Makromolekulare Chemie, 272(1), 71-76.
Van den Oever, M. J. A., Bos, H. L., & Van Kemenade, M. J. J. M. (2000). Influence of the
physical structure of flax fibres on the mechanical properties of flax fibre reinforced
polypropylene composites. Applied Composite Materials, 7(5-6), 387-402.
Van der Werf, H.M.G.; Wijlhuizen, M.; de Schutter, J.A.A. (1995). Plant density and self-
thinning affect yield and quality of fibre hemp (Cannabis sativa L.). Fields Crops Res. 40, 153–
164.
Varma, D. S., Varma, M., & Varma, I. K. (1984). Coir fibers: Part I: Effect of physical and
chemical treatments on properties. Textile Research Journal, 54(12), 827-832.
Verma, D., Jain, S., Zhang, X., & Gope, P. C. (Eds.). (2016). Green approaches to biocomposite
materials science and engineering. IGI Global.
Vetayasuporn, S. (2007). Using Cattails (Typha latifolia as a substrate for Pleurotus ostreatus
(Fr.) Kummer cultivation. J Biol Sci, 7, 218-221
Virk, A.S., Hall, W., Summerscales, J. (2010). Failure strain as the key design criterion for
fracture of natural fibre composites. Composites science and technology, 70:995–9.
Wambua, P., Jan, I. & Ignaas, V. (2003). “Natural fibres: can they replace glass in fibre
reinforced plastics?” Composites science and technology, 9, 1259-1264. doi:10.1016/S0266-
3538(03)00096-4.
Wang, C., Ren, Z., Li, S., & Yi, X. (2018). Effect of Ramie Fabric Chemical Treatments on the
Physical Properties of Thermoset Polylactic Acid (PLA) Composites. Aerospace, 5(3), 93.
Wang, J., GangaRao, H., Liang, R., Liu, W. (2015). Durability and prediction models of fibre-
reinforced polymer composites under various environmental conditions: A critical review,
Journal of Reinforced Plastics and Composites, DOI: 10.1177/0731684415610920. Wróbel,
K.,
Warner, S. B. (1995). Fiber science. New Jersey: Prentice Hall, 1995. p. 134-40.
Witztum, A., & Wayne, R. (2014). Fibre cables in the lacunae of Typha leaves contribute to a
tensegrity structure. Annals of botany, 113(5), 789-797.
178
Witztum, A., & Wayne, R. (2015). Variation in fiber cables in the lacunae of leaves in hybrid
swarms of Typha × glauca. Aquatic botany, 124, 39-44.
Wróbel, K., Magdalena, Magdalena, C., Anna, K., Magdalena, Ż., Jacek, K., Lucyna, D., Jerzy,
H., Maciej, P. & Jan, S. “New biocomposites based on bioplastic flax fibers and biodegradable
polymers.” Biotechnology progress, 5(2012): 1336-1346. doi:10.1002/btpr.1599.
Xia, Z.P., Yu, J.Y., Cheng, L.D., Liu, L.F., Wang, W.M. (2009). Study on the breaking strength
of jute fibres using modified Weibull distribution. Composites Part A, 40:54–9.
Xie, Y., Hill, C. A., Jalaludin, Z., Curling, S. F., Anandjiwala, R. D., Norton, A. J., & Newman,
G. (2011). The dynamic water vapour sorption behaviour of natural fibres and kinetic analysis
using the parallel exponential kinetics model. Journal of Materials Science, 46(2), 479-489.
Xue, D., Miao, M., & Hu, H. (2011). Permeability anisotropy of flax nonwoven mats in
vacuum‐assisted resin transfer molding. The Journal of The Textile Institute, 102(7), 612-620.
Yan, L., Chouw, N., and Jayaraman, K. (2014). Flax fibre and its composites – A review,
Composites: Part B, 56, 296-317.
Yan, L., Nawawi, C. & Krishnan, J. “Flax fibre and its composites–A review.” Composites Part
B: Engineering 56(2014): 296-317. doi.org/10.1016/j.compositesb.2013.08.014
Yu, C. H., Rahman, M. (2020). Working paper, Department of Biosystems Engineering,
University of Manitoba, Winnipeg, Canada.
Akil, H., Omar, M. F., Mazuki, A. A. M., Safiee, S. Z. A. M., Ishak, Z. M., & Bakar, A. A.
(2011). Kenaf fiber reinforced composites: A review. Materials & Design, 32(8-9), 4107-4121.
Zafeiropouls, N. E., Baillie, C. A. (2007). A study of the effect of surface treatments on the
tensile strength of flax fibres: Part II. Application of Weibull statistics, Composites: Part A, 38,
629-638.
APPENDICES

179
APPENDIX A
CATTAIL
Figure A.1 FTIR spectra of cattail fiber treated with 2.5% DIH-HEA (10 min)
Figure A.2 FTIR spectra of cattail fiber treated with 2.5% DIH-HEA (20 min)

180
Figure A. 3 FTIR spectra of cattail fiber treated with 2.5% DIH-HEA (30 min)
Figure A. 4 FTIR spectra of cattail fiber treated with 5% DIH-HEA (10 min).

181
Figure A. 5 FTIR spectra of cattail fiber treated with 5% DIH-HEA (20 min).
Figure A. 6 FTIR spectra of cattail fiber treated with 5% DIH-HEA (30 min).

182
Figure A. 7 FTIR spectra of cattail fiber treated with 10% DIH-HEA (10 min).
Figure A. 8 FTIR spectra of cattail fiber treated with 10% DIH-HEA (20 min).

183
Figure A. 9 FTIR spectra of cattail fiber treated with 10% DIH-HEA (30 min).
Figure A. 10 FTIR spectra of cattail fiber treated with 10% DIH-HEA (30 min – washed with water).

184
Figure A. 11 FTIR spectra of cattail fiber treated with 10% DIH-HEA (30 min – washed with alkali).
Table A.1 T-test results for tensile strength and tensile modulus of cattail composite.
Vf % of composite Tensile strength Tensile Modulus
Group-1 Group-2 P - value tstat Result P - value tstat Result
10.9 30.4 0.0003 6.2 Extremely statistically
significant
<0.0001 8.5 Extremely statistically
significant
10.9 26.1 (560) <0.0001 12.7 Extremely statistically
significant
<0.0001 6.7 Extremely statistically
significant
10.9 26.1
(treated)
<0.0001 10.6 Extremely statistically
significant
<0.0001 8.7 Extremely statistically
significant
26.1 (560) 30.4 0.0013 4.8 Very statistically
significant
0.0042 3.9 Very statistically
significant
26.1
(treated)
30.4 0.3779 0.9 Not statistically
significant
0.25 1.2 Not statistically
significant
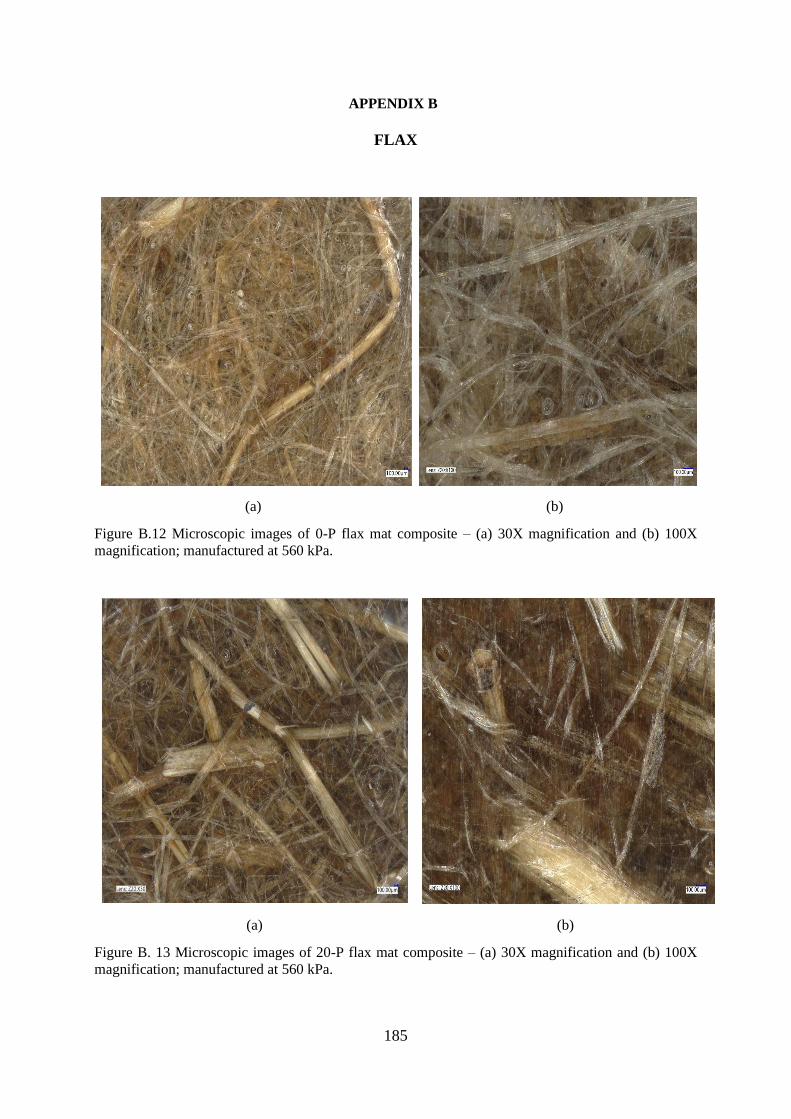
185
APPENDIX B
FLAX
(a) (b)
Figure B.12 Microscopic images of 0-P flax mat composite – (a) 30X magnification and (b) 100X
magnification; manufactured at 560 kPa.
(a) (b)
Figure B. 13 Microscopic images of 20-P flax mat composite – (a) 30X magnification and (b) 100X
magnification; manufactured at 560 kPa.

186
(a) (b)
Figure B. 14 Microscopic images of 30-P flax mat composite – (a) 30X magnification and (b) 100X
magnification; manufactured at 560 kPa.
(a) (b)
Figure B. 15 Microscopic images of 72-P flax mat composite – (a) 30X magnification and (b) 100X
magnification; manufactured at 560 kPa.

187
APPENDIX C
EXPERIMENTAL DETAIL
Figure C. 16 Chart of flow rate calculation for permeability measurement.

188
Figure C. 17 Micro-Matic Precision Wafering Machine for composite cutting.