
Comparative effects of eicosapentaenoic acid and docosahexaenoic acid on proliferation, cytokine...
9
Comparative effects of eicosapentaenoic acid and docosahexaenoic acid on proliferation, cytokine production, and pleiotropic gene expression in Jurkat cells Rozangela Verlengia b, *, Renata Gorja ˜o a , Carla Cristine Kanunfre c , Silvana Bordin a , Thais Martins De Lima a , Edgair Fernandes Martins d , Rui Curi a a Department of Physiology and Biophysics, Institute of Biomedical Sciences, University of Sa ˜o Paulo, Sa ˜o Paulo, SP, Brazil b Methodist University of Piracicaba, Faculty of Physical Education—Faculdade de Educac ¸a ˜o Fisica, Sa ˜o Paulo, Brazil c University of Ponta Grossa, Sa ˜o Paulo, Brazil d Centre of Biological Sciences and Health, Cruzeiro do Sul University, Sa ˜o Paulo, Brazil Received 3 October 2003; received in revised form 3 April 2004; accepted 22 April 2004 Abstract Comparative effects of eicosapentaenoic acid (EPA) and docosahexaenoic acid (DHA) acid on Jurkat T cells were investigated. The following parameters were evaluated: concanavalin A (Con A) induced proliferation, production of interleukin-2 (IL-2), IL-4, IL-10, and interferon- (INF-), and expression of pleiotropic genes by macroarray technique (83 genes in total). DHA inhibiting effect on Con A–induced proliferation was more pronounced than that of EPA. The decrease in IL-2 and INF- production was observed for both fatty acids, whereas the production of IL-10 was decreased by EPA only. The expression of a significant proportion of genes was altered by the fatty acids; 30% for DHA (25 genes) and 26.5% for EPA (22 genes). DHA and EPA markedly affected the expression of genes clustered as cytokines and related receptors, signal transduction pathways, transcription factors, cell cycle, defense and repair, apoptosis, DNA synthesis, cell adhesion, cytoskeleton, and hormone receptors. Therefore, the effect of fatty acids on T-lymphocyte function involves regulation of expression of important genes. Marked differences were observed between the effects of EPA and DHA, indicating that it is an over-simplification to generalize the effects of n-3 fatty acids. © 2004 Elsevier Inc. All rights reserved. Keywords: Jurkat cells; Macroarray; Eicosapentaenoic acid; Docosahexaenoic acid; Cytokines; Cell proliferation 1. Introduction T lymphocytes play a critical role in defining the type and magnitude of the immune response. The cytokines that T cells produce regulate immune function. The mechanism leading to the propagation of T lymphocyte involves their activation, which leads to IL-2 production and subsequent proliferation, referred to as clonal expansion. Depending on the mode of activation, T lymphocytes differentiate into either a helper Th-1 or Th-2 cells (CD4 T lymphocytes), or become cytotoxic T lymphocytes (CD8 cells). The Th-1 cell produces primarily IL-2, INF-, and tumor necro- sis factor– (TNF-), resulting in enhanced cell-mediated or cytotoxic responses. The Th-2 cell produces IL-4, IL-5, IL-6, and IL-10, generating a humoral or antibody-mediated immune response. Several studies have demonstrated that nonesterified fatty acids inhibit T lymphocyte proliferation in response to cytokines in vitro [1]. The long chain n-3 polyunsatured fatty acids (PUFA), eicosapentaenoic acid (20:5 n-3) (EPA), and docosahexaenoic acid (22:6 n-3) (DHA) appear to be particularly potent inhibitors of lymphocyte proliferation. These fatty acids can also modulate inflammatory response, being used in the treatment of clinical conditions such as autoimmune diseases [2]. n-3 PUFA decrease IL-2 produc- tion [3], an effect associated with lowered expression of IL-2 receptor [2,4]. n-3 Fatty acids, either given in the diet or added to culture medium, can also induce apoptosis in lymphocytes [5–7]. * Corresponding author. Address correspondence to Departamento de Fisiologia e Biofı ´sica, Instituto de Cie ˆncias Biome ´dicas, Universidade de Sa ˜o Paulo, Av. Prof. Lineu Prestes, 1524, 05508-900, Butanta ˜, Sa ˜o Paulo, SP, Brasil. Tel.: 55-11-3091-7245; fax: 55-11-3091-7285. E-mail address: [email protected] (R. Verlengia). Journal of Nutritional Biochemistry 15 (2004) 657– 665 0955-2863/04/$ – see front matter © 2004 Elsevier Inc. All rights reserved. doi:10.1016/j.jnutbio.2004.04.008
-
Upload
independent -
Category
Documents
-
view
0 -
download
0
Transcript of Comparative effects of eicosapentaenoic acid and docosahexaenoic acid on proliferation, cytokine...
A
fiAafasra
K
1
aTlapteoT
FSS
Journal of Nutritional Biochemistry 15 (2004) 657–665
0d
Comparative effects of eicosapentaenoic acid and docosahexaenoic acidon proliferation, cytokine production, and pleiotropic gene expression
in Jurkat cells
Rozangela Verlengiab,*, Renata Gorjaoa, Carla Cristine Kanunfrec, Silvana Bordina,Thais Martins De Limaa, Edgair Fernandes Martinsd, Rui Curia
aDepartment of Physiology and Biophysics, Institute of Biomedical Sciences, University of Sao Paulo, Sao Paulo, SP, BrazilbMethodist University of Piracicaba, Faculty of Physical Education—Faculdade de Educacao Fisica, Sao Paulo, Brazil
cUniversity of Ponta Grossa, Sao Paulo, BrazildCentre of Biological Sciences and Health, Cruzeiro do Sul University, Sao Paulo, Brazil
Received 3 October 2003; received in revised form 3 April 2004; accepted 22 April 2004
bstract
Comparative effects of eicosapentaenoic acid (EPA) and docosahexaenoic acid (DHA) acid on Jurkat T cells were investigated. Theollowing parameters were evaluated: concanavalin A (Con A) induced proliferation, production of interleukin-2 (IL-2), IL-4, IL-10, andnterferon-� (INF-�), and expression of pleiotropic genes by macroarray technique (83 genes in total). DHA inhibiting effect on Con–induced proliferation was more pronounced than that of EPA. The decrease in IL-2 and INF-� production was observed for both fatty
cids, whereas the production of IL-10 was decreased by EPA only. The expression of a significant proportion of genes was altered by theatty acids; 30% for DHA (25 genes) and 26.5% for EPA (22 genes). DHA and EPA markedly affected the expression of genes clustereds cytokines and related receptors, signal transduction pathways, transcription factors, cell cycle, defense and repair, apoptosis, DNAynthesis, cell adhesion, cytoskeleton, and hormone receptors. Therefore, the effect of fatty acids on T-lymphocyte function involvesegulation of expression of important genes. Marked differences were observed between the effects of EPA and DHA, indicating that it isn over-simplification to generalize the effects of n-3 fatty acids. © 2004 Elsevier Inc. All rights reserved.
eywords: Jurkat cells; Macroarray; Eicosapentaenoic acid; Docosahexaenoic acid; Cytokines; Cell proliferation
soIi
fcfapTbatIo
. Introduction
T lymphocytes play a critical role in defining the typend magnitude of the immune response. The cytokines thatcells produce regulate immune function. The mechanism
eading to the propagation of T lymphocyte involves theirctivation, which leads to IL-2 production and subsequentroliferation, referred to as clonal expansion. Depending onhe mode of activation, T lymphocytes differentiate intoither a helper Th-1 or Th-2 cells (CD4� T lymphocytes),r become cytotoxic T lymphocytes (CD8� cells). Theh-1 cell produces primarily IL-2, INF-�, and tumor necro-
* Corresponding author. Address correspondence to Departamento deisiologia e Biofısica, Instituto de Ciencias Biomedicas, Universidade deao Paulo, Av. Prof. Lineu Prestes, 1524, 05508-900, Butanta, Sao Paulo,P, Brasil. Tel.: 55-11-3091-7245; fax: 55-11-3091-7285.
lE-mail address: [email protected] (R. Verlengia).
955-2863/04/$ – see front matter © 2004 Elsevier Inc. All rights reserved.oi:10.1016/j.jnutbio.2004.04.008
is factor–� (TNF-�), resulting in enhanced cell-mediatedr cytotoxic responses. The Th-2 cell produces IL-4, IL-5,L-6, and IL-10, generating a humoral or antibody-mediatedmmune response.
Several studies have demonstrated that nonesterifiedatty acids inhibit T lymphocyte proliferation in response toytokines in vitro [1]. The long chain n-3 polyunsaturedatty acids (PUFA), eicosapentaenoic acid (20:5 n-3) (EPA),nd docosahexaenoic acid (22:6 n-3) (DHA) appear to bearticularly potent inhibitors of lymphocyte proliferation.hese fatty acids can also modulate inflammatory response,eing used in the treatment of clinical conditions such asutoimmune diseases [2]. n-3 PUFA decrease IL-2 produc-ion [3], an effect associated with lowered expression ofL-2 receptor [2,4]. n-3 Fatty acids, either given in the dietr added to culture medium, can also induce apoptosis in
ymphocytes [5–7].
TAeeutm[olaadrEa[ecCE
acFsmreDca
wdIErm
2
2
PtctmcJei
oeS
2b
f1wmcuNwtepwtmpooba(Lriwtcc
2
9aTbhCtact
2
p�
658 R. Verlengia et al. / Journal of Nutritional Biochemistry 15 (2004) 657–665
The mechanisms involved in the effects of fatty acids oncell function still remain to be fully elucidated [3,8].
lthough n-3 fatty acids modulate the amount and types oficosanoids produced [9], some of their effects occur byicosanoid-independent mechanisms, including actionspon receptors [10], intracellular signaling pathways, andranscription factors activity [11,12]. These fatty acids also
odulate calcium signaling [13,14], ceramide production15], phospholipase C activation, and subsequent generationf inositol-1,4,5-triphosphate and diacylglicerol [16–18] inymphocytes. These fatty acids influence the production ofrange of lipid-derived second messengers in lymphocytes
nd other leukocytes [14,19]. In addition to the mechanismsescribed above, the n-3 fatty acids have been shown toegulate gene expression in lymphocytes [20]. DHA andPA can reduce the expression of adhesion molecules suchs L-selectin and leukocyte function-associated antigen–121]. These fatty acids have been shown to suppress thexpression of IL-2 receptor � mRNA in splenic T lympho-ytes [19]. DHA has been shown to alter the expression ofD8 [22]. These data demonstrate the selective effects ofPA and DHA on genes expression.
To determine precisely the effects and the mechanism ofction of fish oil–derived n-3 fatty acids, it is imperative toarry out experiments with EPA and DHA separately.owler et al. [23] found that low dose, short term dietaryupplementation with highly purified EPA or DHA canodulate select functional and signaling responses in mu-
ine splenic lymphocytes. Hung et al. [24] compared theffect of two fish oil preparations with different EPA andHA contents on immunoglobulin productivity by lympho-
ytes. They found that EPA in relation to DHA has higherntiallergic activity.
The comparative effects of EPA and DHA on Jurkat cellsere investigated in this study. Jurkat cells proliferation wasetermined by [14C]-thymidine incorporation. Production ofL-2, IL-4, IL-10, and INF-� was determined by ELISA.xpression of pleiotropic genes was analysed by macroar-
ay technique and confirmed by reverse transcriptase–poly-erase chain reaction (RT-PCR).
. Methods and materials
.1. Culture conditions and fatty acids treatment
Jurkat cells were obtained from the Dunn School ofathology, Oxford University, England. The cells were cul-
ured in RPMI 1640 medium supplemented with 10% fetalalf serum. EPA and DHA did not show any sign of toxicityo Jurkat cells up to 50 �mol/L, as indicated by loss of
embrane integrity and DNA fragmentation using flowytometric analysis (FACS-Calibur, Becton Dickinson, Sanose, CA) [25]. The fatty acids were first dissolved inthanol before emulsification in the serum proteins contain-
ng medium. The percentage of ethanol was always �0.05% rf the total volume of culture medium. This concentration ofthanol was not toxic to the cells, as also observed byiddiqui et al. [26].
.2. Lipid extration and determination of DHA and EPAy HPLC
The lipids were extracted as previously described [27]rom Jurkat cells cultured for 24 hours in the presence of2.5 �mol/L DHA or EPA. The control cells were treatedith ethanol in a concentration of 0.025% of the cultureedium. This concentration was the same of that used in the
ells treated with the fatty acids. The lipids were saponifiedsing 2 mL of an alkaline methanol solution (1 mol per mLaOH in 90% methanol) at 37°C for 2 hours in a shakingater bath. Afterwards, the alkaline solution was acidified
o pH 3 with HCl solution (1 mol/mL). Fatty acids were thenxtracted three times with 2 mL hexane. After the extractionrocedure and saponification [28,29,30], the fatty acidsere derivatized with 4-bromomethyl-7 coumarim [31] and
he analysis performed in a liquid chromatograph (Shi-adzu model LC-10A, Shimadzu, Kyoto, Japan). The sam-
les were eluted using a C8 column (25 cm � 4.6 i.d., 5 �mf particles) with pre-column C8 (2.5 cm � 4.6 i.d., 5 �mf particles), 1 mL per minute of acetonitrile/water (77:23y vol) flow and fluorescence detector (325 nm excitationnd 395 emission) [30]. The EPA, DHA, and margaricC17:0) acid were obtained from Sigma Chemical (St.ouis, MO). This latter fatty acid was used to calculate
ecovery. The capacity factor (K�), elution sequence, linear-ty, recovery, precision, interference, and limit of detectionere determined. The minimum limit of quantification of
he fatty acids ranged from 1 to 10 ng. One curve ofalibration for each standard, determining coefficients oforrelation and regression, was obtained.
.3. Proliferation assay
Jurkat cells (3.3 � 105 cells per mL) were plated in6-well microtiter plates and treated for 48 hours with EPAnd DHA at 12.5, 25, 50, 75, and 100 �mol/L. [14C]-hymidine (1 �Ci per mL) was added to the medium at theeginning of the experiment. The plates were incubated in aumidified atmosphere of 5% CO2 and 95% air at 37°C.ells were harvested and the radioactivity of the [14C]-
hymidine incorporated into DNA was determined by usingliquid scintillation counter (Packard TRI-CARB 2100 TR
ounters; Downers Grove, IL). The incorporation of [14C]-hymidine is expressed as total counts per minute.
.4. Measurement of cytokines
The cells (2 � 105 cells per mL) were plated in 24 wellslate and treated for 24 hours with DHA and EPA at 12.5mol/L. This concentration is in the plasma physiological
ange [32] and it was the same as that used to study pleio-
tac[ts
eudaf
2e
iE
2
Ttnttt(pDtsass
2
RrB(AGdr0(agalb
(rfi
2
tm(1mdbcwfeSr
2
auCwa1cbipscbcu
2
fitcscC
bsak
659R. Verlengia et al. / Journal of Nutritional Biochemistry 15 (2004) 657–665
ropic gene expression. The cells were then cultured fornother 24 hours in the presence of 25 �g per mL ofoncanavalin A (Con A), which is a T lymphocyte mitogen33], and the fatty acids. Afterwards, cell culture superna-ant fluid was harvested to carry out the determination ofecreted cytokines.
The production of IL-2, IL-10, IL-4, and INF-� wasvaluated by enzyme-linked immunosorbent assay (ELISA)sing Kit OptEIA from Pharmingen (San Diego, CA). Theetection limit of IL-2, IL-10, and IL-4 was 7.8 pg per mLnd of INF-� was 4.7 pg per mL according to the manu-acturer.
.5. Treatment of Jurkat cells with the fatty acids tovaluate pleitropic genes expression
Cells were resuspended at a density of 2 � 105 per mLn 25-cm3 flasks and treated for 24 hours with DHA andPA at 12.5 �mol/L concentration.
.6. Total RNA extraction
Total RNA was obtained from 0.5–1 � 107 cells usingrizol reagent (Life Technologies, Rockville, MD). Briefly,
he cells were lysed using 1 mL Trizol reagent (Life Tech-ologies). After 5 minutes of incubation at room tempera-ure, 200 �L chloroform were added to the tubes and cen-rifuged at 12,000 � g. The aqueous phase was transferredo another tube and the RNA was pelleted by centrifugation12,000 � g) with cold ethanol and dryed in air. RNAellets were eluated in RNase-free water and treated withNase I. After, RNAs were stored at �70°C until to the
ime of the experiment. The RNA was quantified by mea-uring absorbance at 260 nm. The purity of the RNAs wasssessed by the 260/280 nm ratio and on a 1% agarose geltained with ethidium bromide at 5 �g per mL [34]. Theseamples were used for macroarray and RT-PCR analysis.
.7. Synthesis of cDNA probes
The cDNA probes were synthesized using the pure totalNA labeling system Atlas Kit according to manufacturer’s
ecommendations (Clontech Laboratories, New Jersey).riefly, 10 �g of total RNA and 2 �L primers mix “CDs”
a mixture of primers specific for each different type oftlas Array) were heated at 70°C for 5 minutes in a Techne-enius Thermal cycler (Oxford, UK). The temperature wasecreased to 50°C and 13.5 �L of the mix of the followingeagents were added: 4 �L reaction buffer 5x concentrated,.5 �L 100 mmol/L DTT, 2 �L 10x concentrated dNTP mixdCTP, dGTP, dTTP), 5 �L of [�-33P] ATP (at 10 �Ci/�L),nd 2 �L of reverse transcriptase enzyme (Life Technolo-ies). The reaction was incubated for 25 minutes at 50°Cnd stopped by using 2 �L Termination Mix. The 33P-abeled probe was purified from unincorporated nucleotides
y passing the reaction mixture through a push column sNucleoSpin Extraction Spin Column, Clontech Laborato-ies). Experiments using 20 �g total RNA were also per-ormed and the results indicated saturation of the hybrid-zation reactions (data not shown).
.8. Macroarray hybridization
All solutions for hybridization were obtained from Clon-ech Laboratories. The listing of genes represented on theacroarray membranes is available on the Clontech website
www.bdbiosciences.com/clontech/atlas/genelists/k1840-_HuTrial.pdf). The membrane was pre-hybridized for 30inutes at 68°C in Express Hyb containing 50 �g freshly
enaturated salmon sperm DNA. Subsequently the mem-rane was hybridized during 18 hours at 68°C with 2 � 106
pm per mL 33P-labeled denaturated probe. The membraneas washed twice at 68°C with 1 � SSC, 0.1% SDS;
ollowed by two washings in 1 � SSC, 1% SDS, thenxposed to phosphor screen for 48 hours and scanned in thetorm 840 (Molecular Dynamics, Sunnyvale, CA). Theesults were obtained from two membranes used just once.
.9. Analysis of macroarray results
Changes in the genes expression induced by the fattycids were analyzed by comparison with untreated cellssing the software Array-Pro Analyzer, version 4 (Mediaybernetics, Silver Spring, MD). Local ring backgroundas subtracted from the density value of each spot to obtain“net” value. Spots with a mean intensity of greater than
.2 times the mean local background intensity were furtheronsidered as “measurable spots.” Normalization was doney calculating total intensity ratios and using the housekeep-ng gene �-actin (the same used for RT-PCR analysis)resent in the membrane. Duplicate hybridizations usingeparate sets of nylon membranes were performed for allonditions. Only those signals that differed from the controly at least 2-fold in the two independent experiments wereonsidered as significant. The procedure was similar to thatsed by Yamazaki et al. [35].
.10. RT-PCR
RT-PCR using specific primers was performed to con-rm the differential expression of the mRNAs detected with
he macroarray analysis. This technique has been used toonfirm the results of macroarray analysis [36–39]. Theequences of the primers were designed using informationontained public database in GeneBank of the Nationalenter for Biotechnology Information (NCBI).
The RT-PCR was performed using parameters describedy Innis and Gelfand [40]. The number of cycles used waselected to allow quantitative comparison of the samples inlinear way. For semi-quantitative PCR analysis, the house-eeping �-actin gene was used as reference. The primer
equences and their respective PCR fragment lengths are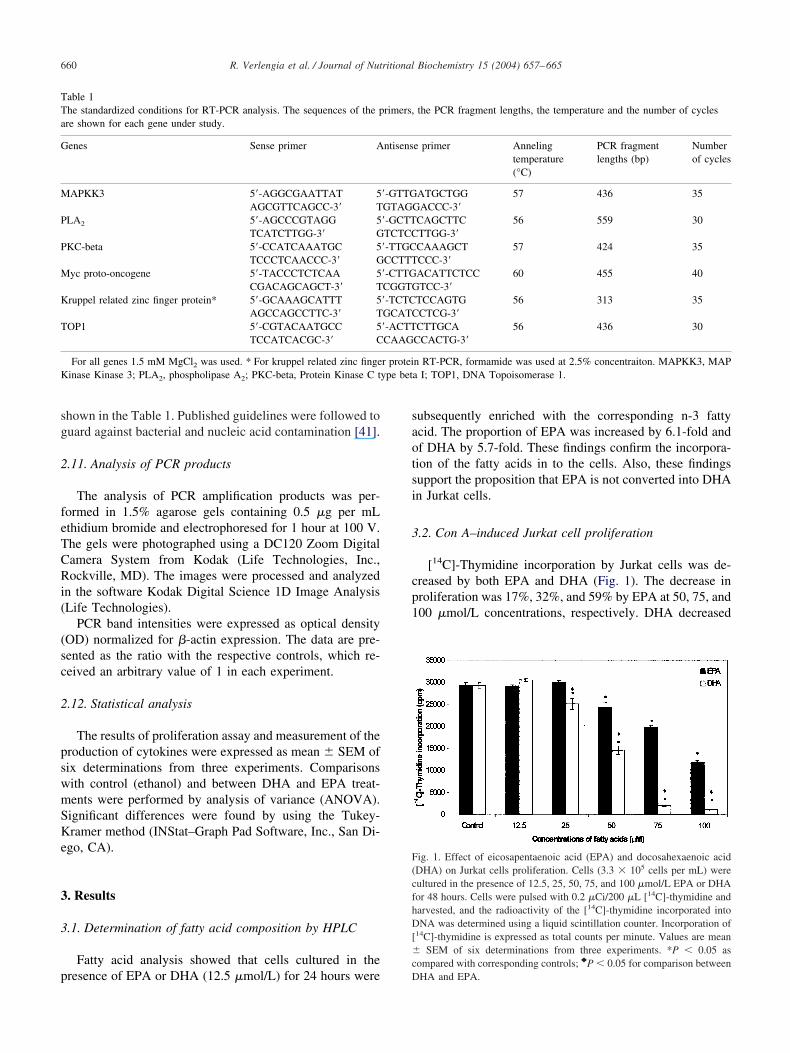
sg
2
feTCRi(
(sc
2
pswmSKe
3
3
p
saotsi
3
cp1
TTa
G
M
P
P
M
K
T
K ype bet
F(cfhD[�c
660 R. Verlengia et al. / Journal of Nutritional Biochemistry 15 (2004) 657–665
hown in the Table 1. Published guidelines were followed touard against bacterial and nucleic acid contamination [41].
.11. Analysis of PCR products
The analysis of PCR amplification products was per-ormed in 1.5% agarose gels containing 0.5 �g per mLthidium bromide and electrophoresed for 1 hour at 100 V.he gels were photographed using a DC120 Zoom Digitalamera System from Kodak (Life Technologies, Inc.,ockville, MD). The images were processed and analyzed
n the software Kodak Digital Science 1D Image AnalysisLife Technologies).
PCR band intensities were expressed as optical densityOD) normalized for �-actin expression. The data are pre-ented as the ratio with the respective controls, which re-eived an arbitrary value of 1 in each experiment.
.12. Statistical analysis
The results of proliferation assay and measurement of theroduction of cytokines were expressed as mean � SEM ofix determinations from three experiments. Comparisonsith control (ethanol) and between DHA and EPA treat-ents were performed by analysis of variance (ANOVA).ignificant differences were found by using the Tukey-ramer method (INStat–Graph Pad Software, Inc., San Di-
go, CA).
. Results
.1. Determination of fatty acid composition by HPLC
Fatty acid analysis showed that cells cultured in the
able 1he standardized conditions for RT-PCR analysis. The sequences of the pre shown for each gene under study.
enes Sense primer A
APKK3 5�-AGGCGAATTATAGCGTTCAGCC-3�
5T
LA2 5�-AGCCCGTAGGTCATCTTGG-3�
5G
KC-beta 5�-CCATCAAATGCTCCCTCAACCC-3�
5G
yc proto-oncogene 5�-TACCCTCTCAACGACAGCAGCT-3�
5T
ruppel related zinc finger protein* 5�-GCAAAGCATTTAGCCAGCCTTC-3�
5T
OP1 5�-CGTACAATGCCTCCATCACGC-3�
5C
For all genes 1.5 mM MgCl2 was used. * For kruppel related zinc fingeinase Kinase 3; PLA2, phospholipase A2; PKC-beta, Protein Kinase C t
resence of EPA or DHA (12.5 �mol/L) for 24 hours were D
ubsequently enriched with the corresponding n-3 fattycid. The proportion of EPA was increased by 6.1-fold andf DHA by 5.7-fold. These findings confirm the incorpora-ion of the fatty acids in to the cells. Also, these findingsupport the proposition that EPA is not converted into DHAn Jurkat cells.
.2. Con A–induced Jurkat cell proliferation
[14C]-Thymidine incorporation by Jurkat cells was de-reased by both EPA and DHA (Fig. 1). The decrease inroliferation was 17%, 32%, and 59% by EPA at 50, 75, and00 �mol/L concentrations, respectively. DHA decreased
the PCR fragment lengths, the temperature and the number of cycles
e primer Annelingtemperature(°C)
PCR fragmentlengths (bp)
Numberof cycles
ATGCTGGGACCC-3�
57 436 35
CAGCTTCTTGG-3�
56 559 30
CAAAGCTCCC-3�
57 424 35
ACATTCTCCTCC-3�
60 455 40
TCCAGTGCTCG-3�
56 313 35
CTTGCACCACTG-3�
56 436 30
n RT-PCR, formamide was used at 2.5% concentraiton. MAPKK3, MAPa I; TOP1, DNA Topoisomerase 1.
ig. 1. Effect of eicosapentaenoic acid (EPA) and docosahexaenoic acidDHA) on Jurkat cells proliferation. Cells (3.3 � 105 cells per mL) wereultured in the presence of 12.5, 25, 50, 75, and 100 �mol/L EPA or DHAor 48 hours. Cells were pulsed with 0.2 �Ci/200 �L [14C]-thymidine andarvested, and the radioactivity of the [14C]-thymidine incorporated intoNA was determined using a liquid scintillation counter. Incorporation of
14C]-thymidine is expressed as total counts per minute. Values are meanSEM of six determinations from three experiments. *P � 0.05 as
ompared with corresponding controls; }P � 0.05 for comparison between
rimers,
ntisens
�-GTTGGTAG�-GCTTTCTCC�-TTGCCCTTT�-CTTGCGGTG�-TCTCGCATC�-ACTTCAAG
r protei
HA and EPA.
[aticDt
3
kcIpatp
3
ofc3gAd
brtb
ag2rocgr(bCbmf1
3
tmtptpo
4
far[ipptFdark
Ctitt
FwscAtVcE
661R. Verlengia et al. / Journal of Nutritional Biochemistry 15 (2004) 657–665
14C]-thymidine incorporation by 14%, 51%, 93%, and 96%t concentrations of 25, 50, 75, and 100 �mol/L, respec-ively. The values of radioactivity incorporated were lowern cells treated with DHA (��mol/L concentrations) asompared to EPA treatment. Thus, the inhibiting effect ofHA on Jurkat cells proliferation was more intense than
hat of EPA.
.3. Production of cytokines
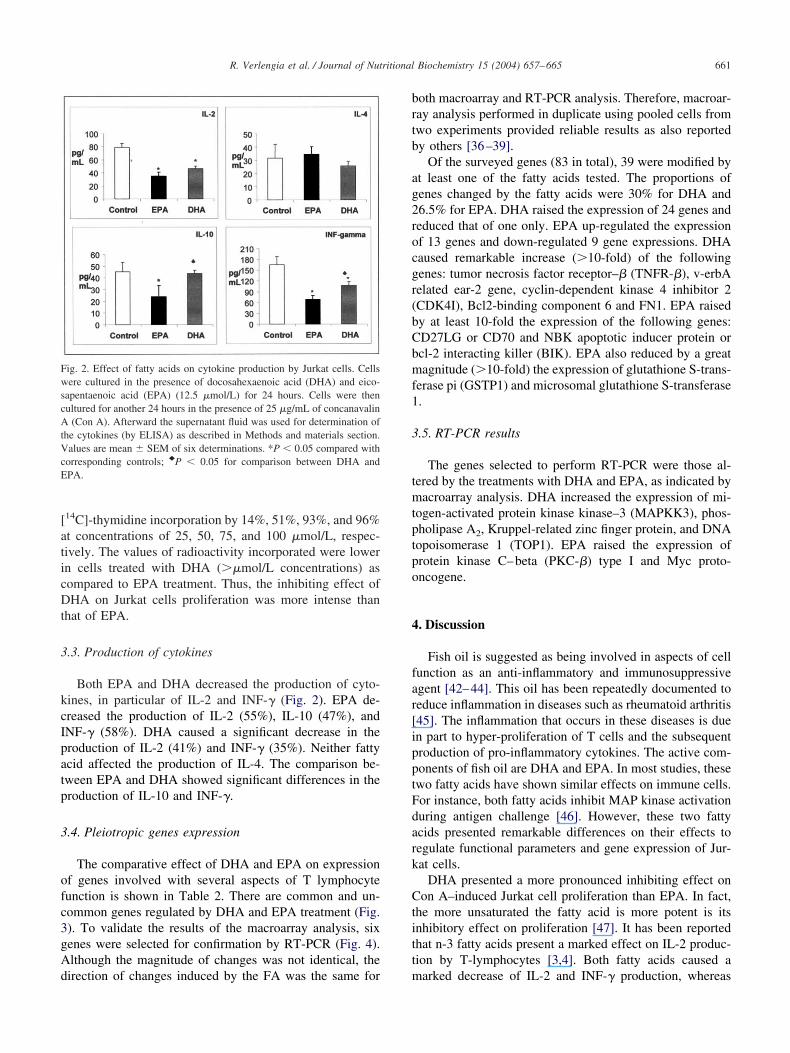
Both EPA and DHA decreased the production of cyto-ines, in particular of IL-2 and INF-� (Fig. 2). EPA de-reased the production of IL-2 (55%), IL-10 (47%), andNF-� (58%). DHA caused a significant decrease in theroduction of IL-2 (41%) and INF-� (35%). Neither fattycid affected the production of IL-4. The comparison be-ween EPA and DHA showed significant differences in theroduction of IL-10 and INF-�.
.4. Pleiotropic genes expression
The comparative effect of DHA and EPA on expressionf genes involved with several aspects of T lymphocyteunction is shown in Table 2. There are common and un-ommon genes regulated by DHA and EPA treatment (Fig.). To validate the results of the macroarray analysis, sixenes were selected for confirmation by RT-PCR (Fig. 4).lthough the magnitude of changes was not identical, the
ig. 2. Effect of fatty acids on cytokine production by Jurkat cells. Cellsere cultured in the presence of docosahexaenoic acid (DHA) and eico-
apentaenoic acid (EPA) (12.5 �mol/L) for 24 hours. Cells were thenultured for another 24 hours in the presence of 25 �g/mL of concanavalin
(Con A). Afterward the supernatant fluid was used for determination ofhe cytokines (by ELISA) as described in Methods and materials section.alues are mean � SEM of six determinations. *P � 0.05 compared with
orresponding controls; }P � 0.05 for comparison between DHA andPA.
irection of changes induced by the FA was the same for m
oth macroarray and RT-PCR analysis. Therefore, macroar-ay analysis performed in duplicate using pooled cells fromwo experiments provided reliable results as also reportedy others [36–39].
Of the surveyed genes (83 in total), 39 were modified byt least one of the fatty acids tested. The proportions ofenes changed by the fatty acids were 30% for DHA and6.5% for EPA. DHA raised the expression of 24 genes andeduced that of one only. EPA up-regulated the expressionf 13 genes and down-regulated 9 gene expressions. DHAaused remarkable increase (�10-fold) of the followingenes: tumor necrosis factor receptor–� (TNFR-�), v-erbAelated ear-2 gene, cyclin-dependent kinase 4 inhibitor 2CDK4I), Bcl2-binding component 6 and FN1. EPA raisedy at least 10-fold the expression of the following genes:D27LG or CD70 and NBK apoptotic inducer protein orcl-2 interacting killer (BIK). EPA also reduced by a greatagnitude (�10-fold) the expression of glutathione S-trans-
erase pi (GSTP1) and microsomal glutathione S-transferase.
.5. RT-PCR results
The genes selected to perform RT-PCR were those al-ered by the treatments with DHA and EPA, as indicated byacroarray analysis. DHA increased the expression of mi-
ogen-activated protein kinase kinase–3 (MAPKK3), phos-holipase A2, Kruppel-related zinc finger protein, and DNAopoisomerase 1 (TOP1). EPA raised the expression ofrotein kinase C–beta (PKC-�) type I and Myc proto-ncogene.
. Discussion
Fish oil is suggested as being involved in aspects of cellunction as an anti-inflammatory and immunosuppressivegent [42–44]. This oil has been repeatedly documented toeduce inflammation in diseases such as rheumatoid arthritis45]. The inflammation that occurs in these diseases is duen part to hyper-proliferation of T cells and the subsequentroduction of pro-inflammatory cytokines. The active com-onents of fish oil are DHA and EPA. In most studies, thesewo fatty acids have shown similar effects on immune cells.or instance, both fatty acids inhibit MAP kinase activationuring antigen challenge [46]. However, these two fattycids presented remarkable differences on their effects toegulate functional parameters and gene expression of Jur-at cells.
DHA presented a more pronounced inhibiting effect onon A–induced Jurkat cell proliferation than EPA. In fact,
he more unsaturated the fatty acid is more potent is itsnhibitory effect on proliferation [47]. It has been reportedhat n-3 fatty acids present a marked effect on IL-2 produc-ion by T-lymphocytes [3,4]. Both fatty acids caused a
arked decrease of IL-2 and INF-� production, whereas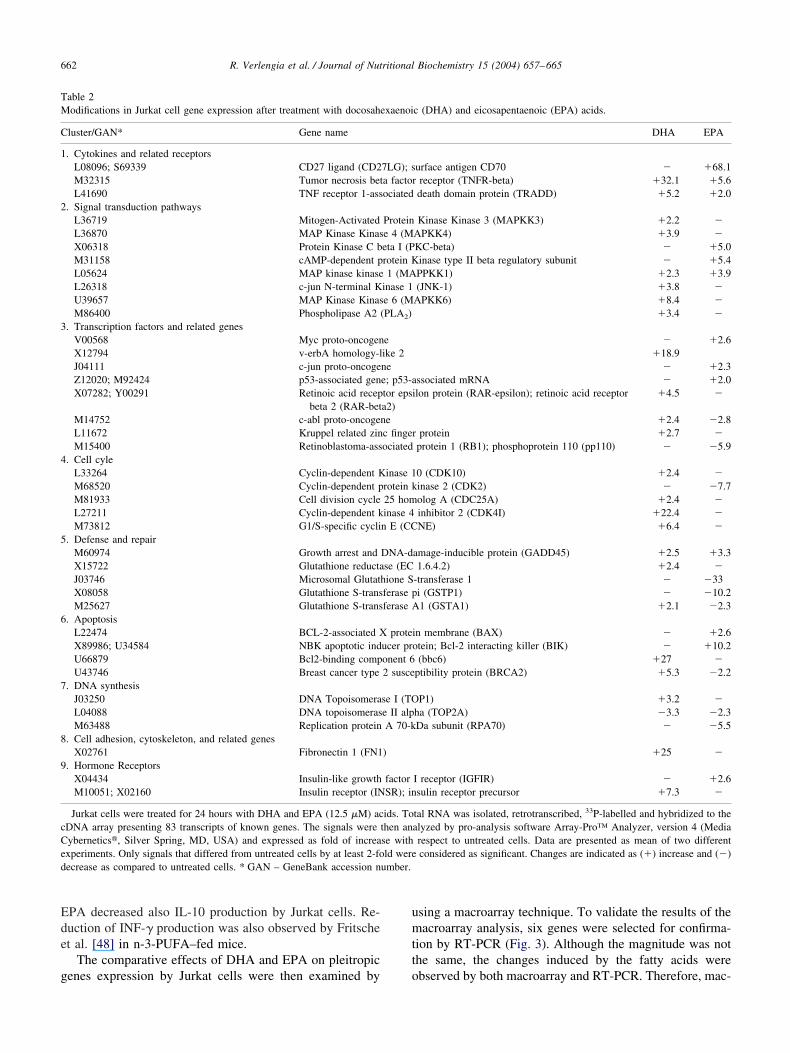
Ede
g
umtt
TM
C
1
2
3
4
5
6
7
8
9
cCed umber.
662 R. Verlengia et al. / Journal of Nutritional Biochemistry 15 (2004) 657–665
PA decreased also IL-10 production by Jurkat cells. Re-uction of INF-� production was also observed by Fritschet al. [48] in n-3-PUFA–fed mice.
The comparative effects of DHA and EPA on pleitropic
able 2odifications in Jurkat cell gene expression after treatment with docosah
luster/GAN* Gene name
. Cytokines and related receptorsL08096; S69339 CD27 ligand (CD2M32315 Tumor necrosis betL41690 TNF receptor 1-ass
. Signal transduction pathwaysL36719 Mitogen-ActivatedL36870 MAP Kinase KinasX06318 Protein Kinase C bM31158 cAMP-dependent pL05624 MAP kinase kinaseL26318 c-jun N-terminal KU39657 MAP Kinase KinasM86400 Phospholipase A2
. Transcription factors and related genesV00568 Myc proto-oncogenX12794 v-erbA homology-lJ04111 c-jun proto-oncogeZ12020; M92424 p53-associated genX07282; Y00291 Retinoic acid recep
beta 2 (RAR-betM14752 c-abl proto-oncogeL11672 Kruppel related zinM15400 Retinoblastoma-ass
. Cell cyleL33264 Cyclin-dependent KM68520 Cyclin-dependent pM81933 Cell division cycleL27211 Cyclin-dependent kM73812 G1/S-specific cycli
. Defense and repairM60974 Growth arrest andX15722 Glutathione reductaJ03746 Microsomal GlutatX08058 Glutathione S-transM25627 Glutathione S-trans
. ApoptosisL22474 BCL-2-associated XX89986; U34584 NBK apoptotic indU66879 Bcl2-binding compU43746 Breast cancer type
. DNA synthesisJ03250 DNA TopoisomeraL04088 DNA topoisomerasM63488 Replication protein
. Cell adhesion, cytoskeleton, and related genesX02761 Fibronectin 1 (FN1
. Hormone ReceptorsX04434 Insulin-like growthM10051; X02160 Insulin receptor (IN
Jurkat cells were treated for 24 hours with DHA and EPA (12.5 �M) acDNA array presenting 83 transcripts of known genes. The signals wereybernetics�, Silver Spring, MD, USA) and expressed as fold of increaxperiments. Only signals that differed from untreated cells by at least 2-foecrease as compared to untreated cells. * GAN – GeneBank accession n
enes expression by Jurkat cells were then examined by o
sing a macroarray technique. To validate the results of theacroarray analysis, six genes were selected for confirma-
ion by RT-PCR (Fig. 3). Although the magnitude was nothe same, the changes induced by the fatty acids were
c (DHA) and eicosapentaenoic (EPA) acids.
DHA EPA
urface antigen CD70 � �68.1r receptor (TNFR-beta) �32.1 �5.6death domain protein (TRADD) �5.2 �2.0
Kinase Kinase 3 (MAPKK3) �2.2 �APKK4) �3.9 �KC-beta) � �5.0inase type II beta regulatory subunit � �5.4PPKK1) �2.3 �3.9(JNK-1) �3.8 �
APKK6) �8.4 ��3.4 �
� �2.6�18.9
� �2.3ssociated mRNA � �2.0
ilon protein (RAR-epsilon); retinoic acid receptor �4.5 �
�2.4 �2.8r protein �2.7 �protein 1 (RB1); phosphoprotein 110 (pp110) � �5.9
0 (CDK10) �2.4 �inase 2 (CDK2) � �7.7olog A (CDC25A) �2.4 �inhibitor 2 (CDK4I) �22.4 �NE) �6.4 �
amage-inducible protein (GADD45) �2.5 �3.31.6.4.2) �2.4 �
-transferase 1 � �33i (GSTP1) � �10.21 (GSTA1) �2.1 �2.3
in membrane (BAX) � �2.6otein; Bcl-2 interacting killer (BIK) � �10.2
(bbc6) �27 �ptibility protein (BRCA2) �5.3 �2.2
P1) �3.2 �ha (TOP2A) �3.3 �2.3Da subunit (RPA70) � �5.5
�25 �
I receptor (IGFIR) � �2.6sulin receptor precursor �7.3 �
tal RNA was isolated, retrotranscribed, 33P-labelled and hybridized to thealyzed by pro-analysis software Array-Pro™ Analyzer, version 4 (Mediarespect to untreated cells. Data are presented as mean of two differentconsidered as significant. Changes are indicated as (�) increase and (�)
exaenoi
7LG); sa factoociated
Proteine 4 (Meta I (Protein K1 (MA
inase 1e 6 (M
(PLA2)
eike 2nee; p53-ator epsa2)nec fingeociated
inase 1rotein k25 hominase 4n E (CC
DNA-dse (EC
hione Sferase pferase A
proteucer pronent 62 susce
se I (TOe II alpA 70-k
)
factorSR); in
ids. Tothen anse withld were
bserved by both macroarray and RT-PCR. Therefore, mac-
rcs
ipgtfcotaemsamcod2C
couattca
gGtecaaflt
FsGoismkpckcGgTrpaBpar
F(rea(perikep
663R. Verlengia et al. / Journal of Nutritional Biochemistry 15 (2004) 657–665
oarray analysis performed in duplicate using two pools ofells from two different experiments provides reliable ob-ervations.
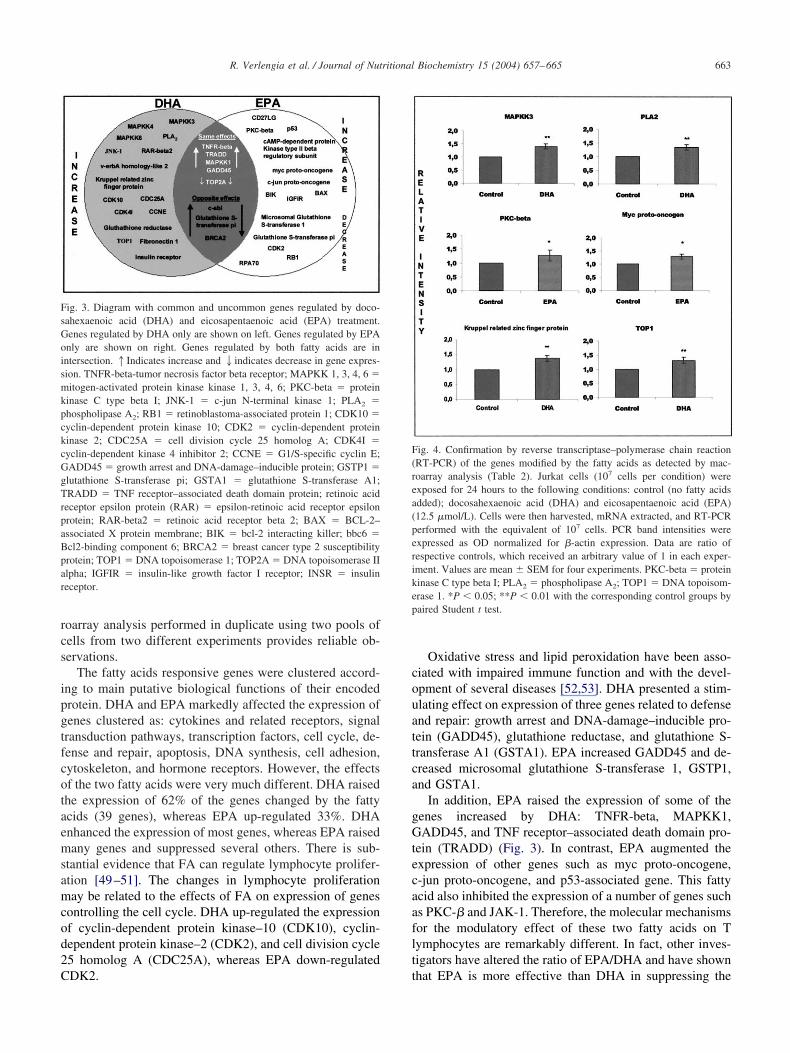
The fatty acids responsive genes were clustered accord-ng to main putative biological functions of their encodedrotein. DHA and EPA markedly affected the expression ofenes clustered as: cytokines and related receptors, signalransduction pathways, transcription factors, cell cycle, de-ense and repair, apoptosis, DNA synthesis, cell adhesion,ytoskeleton, and hormone receptors. However, the effectsf the two fatty acids were very much different. DHA raisedhe expression of 62% of the genes changed by the fattycids (39 genes), whereas EPA up-regulated 33%. DHAnhanced the expression of most genes, whereas EPA raisedany genes and suppressed several others. There is sub-
tantial evidence that FA can regulate lymphocyte prolifer-tion [49–51]. The changes in lymphocyte proliferationay be related to the effects of FA on expression of genes
ontrolling the cell cycle. DHA up-regulated the expressionf cyclin-dependent protein kinase–10 (CDK10), cyclin-ependent protein kinase–2 (CDK2), and cell division cycle5 homolog A (CDC25A), whereas EPA down-regulated
ig. 3. Diagram with common and uncommon genes regulated by doco-ahexaenoic acid (DHA) and eicosapentaenoic acid (EPA) treatment.enes regulated by DHA only are shown on left. Genes regulated by EPAnly are shown on right. Genes regulated by both fatty acids are inntersection.1Indicates increase and2indicates decrease in gene expres-ion. TNFR-beta-tumor necrosis factor beta receptor; MAPKK 1, 3, 4, 6 �itogen-activated protein kinase kinase 1, 3, 4, 6; PKC-beta � protein
inase C type beta I; JNK-1 � c-jun N-terminal kinase 1; PLA2 �hospholipase A2; RB1 � retinoblastoma-associated protein 1; CDK10 �yclin-dependent protein kinase 10; CDK2 � cyclin-dependent proteininase 2; CDC25A � cell division cycle 25 homolog A; CDK4I �yclin-dependent kinase 4 inhibitor 2; CCNE � G1/S-specific cyclin E;ADD45 � growth arrest and DNA-damage–inducible protein; GSTP1 �lutathione S-transferase pi; GSTA1 � glutathione S-transferase A1;RADD � TNF receptor–associated death domain protein; retinoic acid
eceptor epsilon protein (RAR) � epsilon-retinoic acid receptor epsilonrotein; RAR-beta2 � retinoic acid receptor beta 2; BAX � BCL-2–ssociated X protein membrane; BIK � bcl-2 interacting killer; bbc6 �cl2-binding component 6; BRCA2 � breast cancer type 2 susceptibilityrotein; TOP1 � DNA topoisomerase 1; TOP2A � DNA topoisomerase IIlpha; IGFIR � insulin-like growth factor I receptor; INSR � insulineceptor.
DK2. t
Oxidative stress and lipid peroxidation have been asso-iated with impaired immune function and with the devel-pment of several diseases [52,53]. DHA presented a stim-lating effect on expression of three genes related to defensend repair: growth arrest and DNA-damage–inducible pro-ein (GADD45), glutathione reductase, and glutathione S-ransferase A1 (GSTA1). EPA increased GADD45 and de-reased microsomal glutathione S-transferase 1, GSTP1,nd GSTA1.
In addition, EPA raised the expression of some of theenes increased by DHA: TNFR-beta, MAPKK1,ADD45, and TNF receptor–associated death domain pro-
ein (TRADD) (Fig. 3). In contrast, EPA augmented thexpression of other genes such as myc proto-oncogene,-jun proto-oncogene, and p53-associated gene. This fattycid also inhibited the expression of a number of genes suchs PKC-� and JAK-1. Therefore, the molecular mechanismsor the modulatory effect of these two fatty acids on Tymphocytes are remarkably different. In fact, other inves-igators have altered the ratio of EPA/DHA and have shown
ig. 4. Confirmation by reverse transcriptase–polymerase chain reactionRT-PCR) of the genes modified by the fatty acids as detected by mac-oarray analysis (Table 2). Jurkat cells (107 cells per condition) werexposed for 24 hours to the following conditions: control (no fatty acidsdded); docosahexaenoic acid (DHA) and eicosapentaenoic acid (EPA)12.5 �mol/L). Cells were then harvested, mRNA extracted, and RT-PCRerformed with the equivalent of 107 cells. PCR band intensities werexpressed as OD normalized for �-actin expression. Data are ratio ofespective controls, which received an arbitrary value of 1 in each exper-ment. Values are mean � SEM for four experiments. PKC-beta � proteininase C type beta I; PLA2 � phospholipase A2; TOP1 � DNA topoisom-rase 1. *P � 0.05; **P � 0.01 with the corresponding control groups byaired Student t test.
hat EPA is more effective than DHA in suppressing the

isD
eosaImtpahIt
pgDEIdiEETfgffi
A
JDbaNP
R
[
[
[
[
[
[
[
[
[
[
[
[
[
[
664 R. Verlengia et al. / Journal of Nutritional Biochemistry 15 (2004) 657–665
nflammatory response [54,55]. Systematic clinical studieshould be carried out to examine separately the effect ofHA and EPA on T lymphocyte function.It is noteworthy that DHA and EPA also affected the
xpression of hormone receptors. EPA raised the expressionf IGF1 receptor and DHA increased insulin receptor. In-ulin is known to have a potent immunomodulatory effect,nd diabetic patients show impaired immune function [56].GF-1 plays an important role in the maintenance, develop-ent, and proliferation of T-lymphocytes and protects ac-
ivated T-cells from apoptosis [57,58]. The observationsresented here indicate that the administration of n-3 fattycids could be used to potentiate or suppress the action oformones on immune function as also shown by others [59].n fact, dietary fish oil has shown to reduce insulin resis-ance in rats [60].
Our study findings led us to conclude that EPA and DHAresent remarkable differences in functional parameters andenes expression of Jurkat cells. The inhibiting effect ofHA on proliferation was more pronounced than that ofPA. Both DHA and EPA markedly reduced IL-2 and
NF-� production. However, the production of IL-10 wasecreased by EPA only. The changes in genes expressionnduced by DHA were much different from those caused byPA. DHA increased the expression of most genes, whereasPA raised many genes and suppressed several others.herefore, the effect of n-3 fatty acids on T-lymphocyte
unction involves regulation of expression of importantenes. Marked differences were observed between the ef-ects of EPA and DHA, indicating that it is an over-simpli-cation to generalize the effects of n-3 fatty acids.
cknowledgments
The authors are grateful for the technical assistance of.R. Mendonca, G. de Souza, and E. Portioli, as well as tor. C. K. Miyasaka. Support for this research was providedy Fundacao de Amparo a Pesquisa do Estado de Sao Paulo,nd Programa de Apoio a Nucleos de Excelencia/Conselhoacional de Pesquisa/Coordenacao de Aperfeicoamento deessoal de Nivel Superior, and The British Council.
eferences
[1] Rotondo D, Earl CR, Laing KJ, Kaimakamis D. Inhibition of cyto-kine-stimulated thymic lymphocyte proliferation by fatty acids: therole of eicosanoids. Biochim Biophys Acta 1994;1223:185–94.
[2] Venkatraman J, Meksawan K. Effects of dietary omega 3 and omega6 lipids and vitamin E on chemokine levels in autoimmune-proneMRL/MpJ-Ipr/Ipr mice. J Nutr Biochem 2002;13:479.
[3] Arrington JL, McMurray DN, Switzer KC, Fan Y-Y, Chapkin RS.Docosahexaenoic acid suppresses function of the CD28 costimulatorymembrane receptor in primary murine and Jurkat T cells. J Nutr2001;131:1147–53.
[4] Purasiri P, Mckechnie A, Heys S. D, Eremin O. Modulation in vitro
of human natural cytotoxicity, lymphocyte proliferative response tomitognes and cytokine prodution by essential fatty acids. Immunol-ogy 1997;92:166–72.
[5] Fernandes G, Chandrasekar B, Luan X, Troyer DA. Modulation ofantioxidant enzymes and programmed cell death by n-3 fatty acids.Lipids 1996;31:S91–6.
[6] Avula CP, Zaman AK, Lawrence R, Fernandes G. Induction ofapoptosis and apoptotic mediators in Balb/C splenic lymphocytes bydietary n-3 and n-6 fatty acids. Lipids 1999;34:921–7.
[7] Terada S, Takizawa M, Yamamoto S, Ezaki O, Itakura H, AkagawaKS. Suppressive mechanisms of EPA on human T cell proliferation.Microbiol Immunol 2001;45:473–81.
[8] Kliewer SA, Sundseth SS, Jones SA, Brown PJ, Wisely GB, KobleCS, Devchand P, Wahli W, Willson TM, Lenhard JM, Lehmann JM.Fatty acids and eicosanoids regulate gene expression through directinteractions with peroxisome proliferator-activated receptors alphaand gamma. Proc Natl Acad Sci USA 1997;94:4318–23.
[9] Chapkin RS, Akoh CC, Miller CC. Influence of dietary n-3 fatty acidson macrophage glycerophospholipid molecular species and peptido-leukotriene synthesis. J Lipid Res 1991;32:1205–13.
10] McMurray DN, Jolly CA, Chapkin RS. Effects of dietary n-3 fattyacids on T cell activation and T cell receptor-mediated signaling in amurine model. J Infect Dis 2000;182:S103–7.
11] Maldonado EN, Furland NE, Pennacchiotti GL, Aveldano MI. Re-versibility of the changes induced by n-3 fatty acids in mouse plasma,liver and blood cell lipids. J Nutr Biochem 2002;13:36–46.
12] Hwang D, Rhee SH. Receptor-mediated signaling pathways: potentialtargets of modulation by dietary fatty acids. Am J Clin Nutr 1999;70:545–56.
13] Bonin A, Khan NA. Regulation of calcium signalling by docosa-hexaenoic acid in human T-cells: implication of CRAC channels. JLipid Res 2000;41:277–84.
14] Honen BN, Saint DA. Polyunsatured dietary fats change the proper-ties of calcium sparks in adult rat atrial myocytes. J Nutr Biochem2002;13:322–9.
15] Jolly CA, Jiang YH, Chapkin RS, McMurray DN. Dietary (n-3)polyunsaturated fatty acids suppress murine lymphoproliferantion,interleukin-2 secretion, and the formation of diacylglycerol and cer-amide. J Nutr 1997;127:37–43.
16] Zeisel SH. Choline phospholipids: signal transduction and carcino-genesis. FASEB J 1993;7:551–7.
17] Nair SS, Leitch J, Garg ML. N-3 polyunsaturated fatty acid supple-mentation alters inositol phosphate metabolism and protein kinase Cactivity in adult porcine cardiac myocytes. J Nutr Biochem 2001;12:7–13.
18] Sperling RI, Benincaso AI, Knoell CT, Larkin JK, Austen KF, Rob-inson DR. Dietary �-3 polyunsaturated fatty acids inhibit phospho-inositide formation and chemotaxis in neutrophils. J Clin Invest1993;91:651–60.
19] Jolly CA, McMurray DN, Chapkin RS. Effect of dietary n-3 fattyacids on interleukin-2 and interleukin-2 receptor alpha expression inactivated murine lymphocytes. Prostaglandins Leukot Essent FattyAcids 1998;58:289–93.
20] Otton R, Graziola F, Hirata MH, Curi R, Williams JF. Dietary fatsalter the activity and expression of glucose-6-phosphate dehydroge-nase in rat lymphoid cells and tissues. Biochem Mol Biol Int 1998;46:529–36.
21] Khalfoun B, Thibault G, Bardos P, Lebranchu Y. Docosahexaenoicand eicosapentaenoic acids inhibit in vitro human lymphocyte-endo-thelial cell adhesion. Transplantation 1996;62:1649–57.
22] Jenski LJ, Bowker GM, Johnson MA, Ehringer WD, Fetterhoff T,Stillwell W. Docosahexaenoic acid-induced alteration of Thy-1 andCD8 expression on murine splenocytes. Biochim Biophys Acta 1995;1236:39–50.
23] Fowler KH, Chapkin RS, McMurray DN. Effects of purified dietaryn-3 ethyl esters on murine T lymphocyte function. J Immunol 1993;
151:5186–97.
[
[
[
[
[
[
[
[
[
[
[
[
[
[
[
[
[
[
[
[
[
[
[
[
[
[
[
[
[
[
[
[
[
[
[
[
[
665R. Verlengia et al. / Journal of Nutritional Biochemistry 15 (2004) 657–665
24] Hung P, Kaku S, Yunoki S-I, Ohkura K-I, Gu J-Y, Iked I, Sugano M,Yazawa K, Yamada K. Dietary effect of EPA-rich and DHA-rich fishoils on the immune function of Sprague-Dawley rats. Biosci Biotech-nol Biochem 1999;63:135–40.
25] Lima TM, Kanunfre CC, Pompeia C, Verlengia R, Curi R. Rankingthe toxicity of fatty acids on Jurkat and Raji cells by flow cytometricanalysis. Toxicol in Vitro 2002;16:741–7.
26] Siddiqui RA, Jenski LJ, Neff K, Harvey K, Kovacs RJ, Stillwell W.Docosahexaenoic acid induces apoptosis in Jurkat cells by a proteinphosphatase-mediated process. Biochim Biophys Acta 2001;1499:265–75.
27] J Folch, Lee M, Stanley GHA. A simple method for isolation puri-fication of total lipid from animal tissue. J Biol Chem 1957;226:497–503.
28] Beyer ES, Jensen LN. Overestimation of the cholesterol content ofegg. Agric Food Chem 1989;37:917.
29] Hamilton S, Hamilton RJ, Sewell PA. Extration of lipids and derivateformation. In: Hamilton RJ, Hamilton S, editors. Lipid Analysis—APractical Approach, 1st ed. [Chapter 2]. Oxford: IRL Press at OxfordUniversity Press, 1992.
30] Nishiyama-Naruke A, de Sousa JAA, Carnelos Filho M, Curi R.HPLC determination of underivatized fatty acid saponified at lowtemperature analysis of fatty acids in oils and tissues. Anal Lett1998;31:2565–76.
31] Abushufa R, Reed P, Weinkove C. Fatty acids in erythrocytes mea-sured by isocratic HPLC. Clin Chem 1994;40:1707–12.
32] Painter PC, Cope JY, Smith JL. Appendix. In: Burtis CA, AshwoodER, editors. Tietz Textbook of Clinical Chemistry. Philadelphia: WBSaunders, 1994. pp. 2116–7.
33] Boyum A. Isolation of mononuclear cells and granulocytes fromhuman blood. Isolation of monuclear cells by one centrifugation, andof granulocytes by combining centrifugation and sedimentation at 1 g.Scand J Clin Lab Invest 1968;97:77–89.
34] Sambrook J, Russell DW. Molecular cloning: a laboratory manual.3th ed. Cold Spring Harbor, NY: Cold Spring Harbor LaboratoryPress, 2001, pp. A8.21.
35] Yamazaki K, Kuromitsu J, Tanaka I. Microarray analysis of geneexpression changes in mouse liver induced by peroxisome prolifera-tor activated receptor alpha agonists. Biochem Biophys Res Commun2002;290:1114–22.
36] Cardozo AK, Kruhøffer M, Leeman R, Ørntoft T, Eizirik DL. Iden-tification of novel cytokine-induced genes in pancreatic �-cells byhigh-density oligonucleotide arrays. Diabetes 2001;50:909–20.
37] Delghingaro-Augusto V, Ferreira F, Bordin S, do Amaral ME,Toyama MH, Boschero AC, Carneiro EM. A low protein diet altersgene expression in rat pancreatic islets. J Nutr 2004;134:321–7.
38] Espinoza LA, Smulson ME. Macroarray analysis of the effects ofJP-8 jet fuel on gene expression in Jurkat cells. Toxicology 2003;189:181–90.
39] Marionnet C, Bernerd F, Dumas A, Verrecchia F, Mollier K, CompanD, Bernard B, Lahfa M, Leclaire J, Medaisko C, Mehul B, Seite S,Mauviel A, Dubertret L. Modulation of gene expression induced inhuman epidermis by environmentals strees in vivo. J Invest Dermatol2003;121:1447–58.
40] Innis MA, Gelfand DH. Optimization of PCRs. In: Innis MA, GelfandDH, Sninsky JJ, White TJ, editors. PCR Protocols: A Guide toMethods and Applications, 1st ed. San Diego: Academic Press, 1990.
pp. 3–12.41] Kwok S, Higuchi R. Avoiding false positives with PCR. Nature1989;339:237–38.
42] Harris WS. n-3 Fatty acids and serum lipoproteins. Human studies.Am J Clin Nutr 1997;65:1645S–54S.
43] Robinson DR, Xu LL, Tateno S, Guo M, Colvin RB. Suppression ofautoimmune disease by dietary n-3 fatty acids. J Lipid Res 1993;34:1435–44.
44] Xi S, Cohen D, Chen LH. Effects of fish oil on cytokines and immunefunctions of mice with murine AIDS. J Lipid Res 1998;39:1677–87.
45] Kremer JM. Clinical studies of omega-3 fatty acid supplementation inpatients who have rheumatoid arthritis. Rheum Dis Clin North Am1991;17:391–402.
46] Denys A, Hichami A, Khan NA. Eicosapentaenoic acid and docosa-hexaenoic acid modulate MAP kinase (ERK1/ERK2) signaling inhuman T cells. J Lipid Res 2001;42:2015–20.
47] Pompeia C, Lopes LR, Miyasaka CK, Procopio J, Sannomiya P, CuriR. Effect of fatty acids on leukocyte function. Braz J Med Biol Res2000;33:1255–68.
48] Fritsche KL, Anderson M, Feng C. Consumption of eicosapentaenoicacid and docosahexaenoic acid impair murine interleukin-12 andinterferon-gamma production in vivo. J Infect Dis 2000;182:S54–61.
49] Sasaki T, Kake Y, Kudoh K, Misawa Y, Shimizu J, Takita T. Effectsof dietary docosahexaenoic acid on surface molecules involved in Tcell proliferation. Biochim Biophys Acta 1999;1436:519–30.
50] Volker DH, FitzGerald PE, Garg ML. The eicosapentaenoic to do-cosahexaenoic acid ratio of diets affects the pathogenesis of arthritisin Lew/SSN rats. J Nutr 2000;130:559–65.
51] Opara EC, Hubbard VS. Essential fatty acids (EFA): role in pancre-atic hormone release and concomitant metabolic effect. J Nutr Bio-chem 1993;4:498–509.
52] Calder PC, Costa-Rosa LF, Curi R. Effects of feeding lipids ofdifferent fatty acid compositions upon rat lymphocyte proliferation.Life Sci 1995;56:455–63.
53] Otton R, Graziola F, Souza JA, Curi TC, Hirata MH, Curi R. Effectof dietary fat on lymphocyte proliferation and metabolism. Cell Bio-chem Funct 1998;16:253–9.
54] Egami MI, Guimaraes AR, Nascimento-Curi CM, Curi R. Effect offatty acids-rich diets on thymocyte proliferation and thymus involu-tion during growing. Physiol Behav 1993;53:531–4.
55] Lopes LR, Laurindo FR, Mancini-Filho J, Curi R, Sannomiya PN.NADPH-oxidase activity and lipid peroxidation in neutrophilis fromrats fed fat-rich diets. Cell Biochem Funct 1999;17:57–64.
56] Nourooz-Zadeh J, Liu EH, Anggard E, Halliwell B. F4-isoprostanes: anovel class of prostanoids formed during peroxidation of docosahexae-noic acid (DHA). Biochem Biophys Res Commun 1998;242:338–44.
57] Walsh PT, O’Connor R. The insulin-like growth factor-I receptor isregulated by CD28 and protects activated T cells from apoptosis. EurJ Immunol 2000;30:1010–8.
58] Cross RJ, Elliott LH, Morford LA, Roszman TL, McGillis JP. Func-tional characterization of the insulin-like growth factor I receptor onJurkat T cells. Cell Immunol 1995;160:205–10.
59] Bhathena SJ, Berlin E, McClure D, Peters RC. Effects of dietaryfats on red blood cell membrane insulin receptor in normo- andhypercholesterolemic miniature swine. J Nutr Biochem 2001;12:529 –35.
60] Soria A, Chicco A, Eugenia D’ Alessandro M, Rossi A, LombardoYB. Dietary fish oil reverse epididymal tissue adiposity, cell hyper-trophy and insulin resistance in dyslipemic sucrose fed rat model
small star, filled. J Nutr Biochem 2002;13:209–18.